

HP Omen 17 (2024) review: RTX 4070 and Ryzen 7 show their size in the gaming laptop
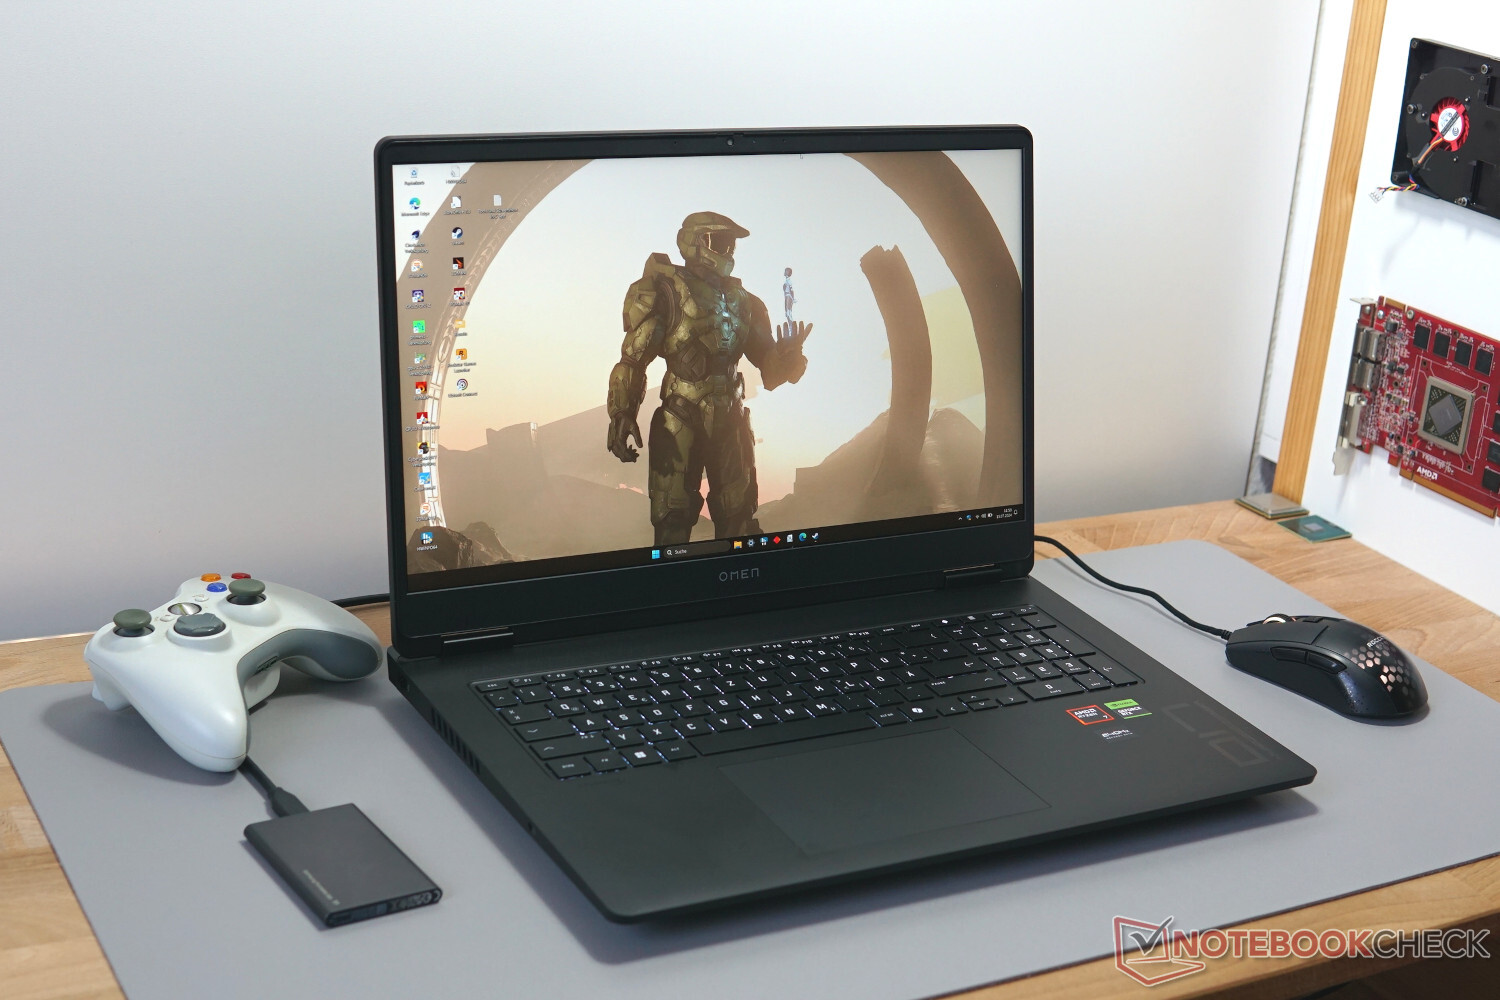
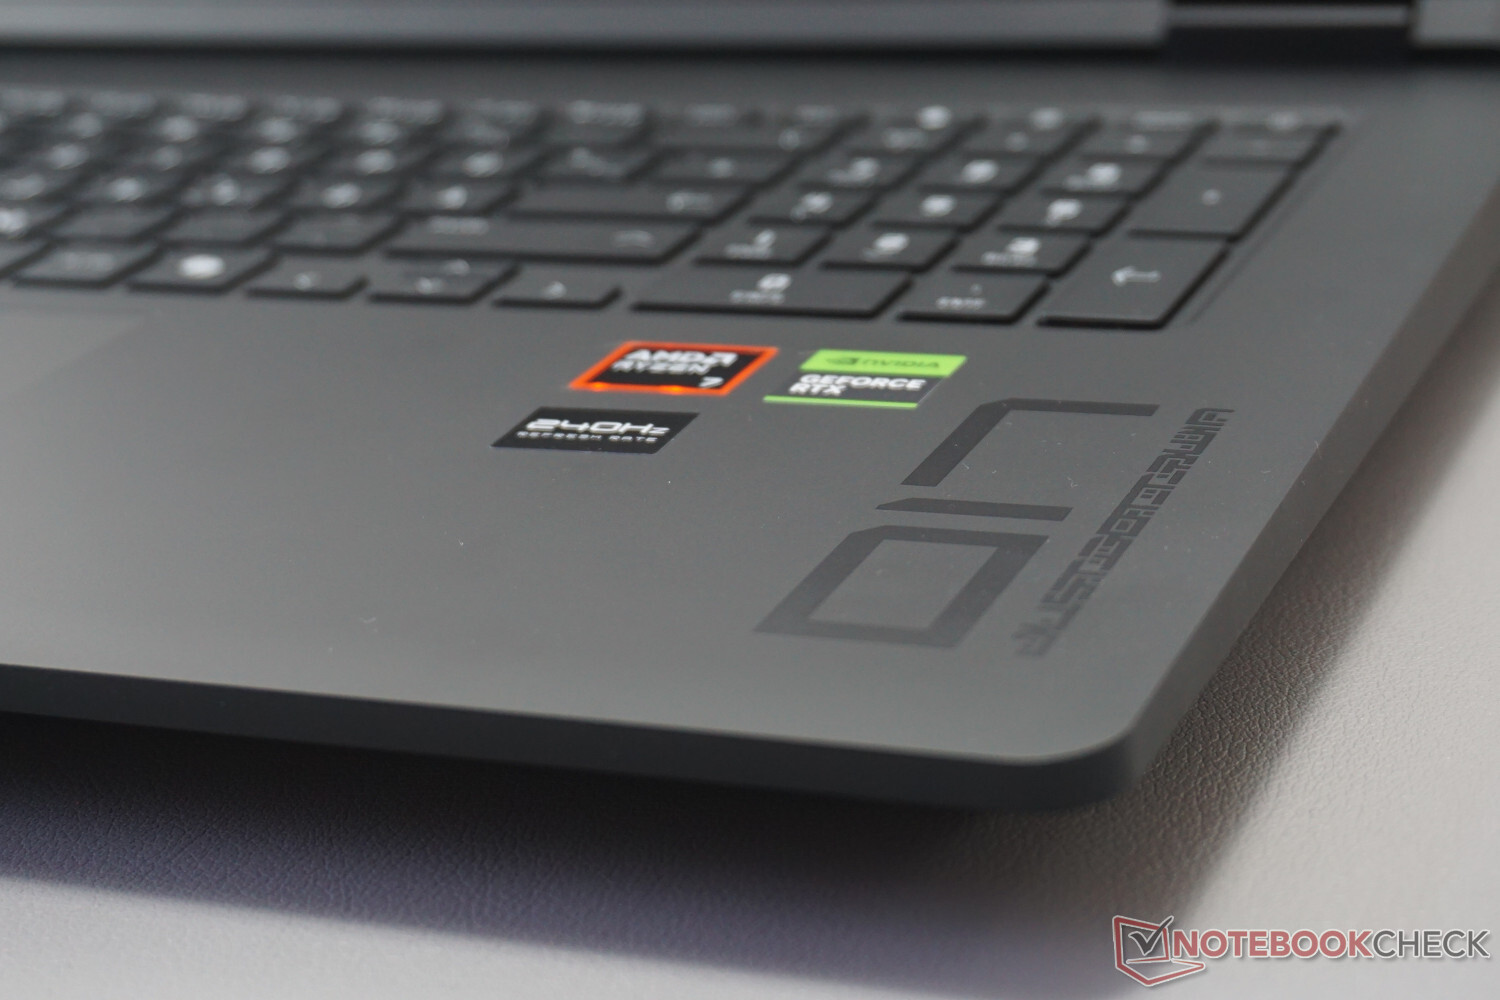
Well-equipped for all the current games at a high level with an RTX 4070 and AMD Ryzen 7 8845HS, the HP Omen 17 (2024) is at the starting blocks into the elevated midrange. In addition, there is a QHD display with a suitable resolution that also offers a 240 Hertz refresh rate. With this, all the basics for a good gaming laptop are covered.
With so much space, particularly inside, we can also expect some stable performance values that should turn out better compared to those of smaller laptops. We evaluate this in numerous benchmarks and gaming tests.
The fact that our test unit remains below the 2,000 Euro (~$2,172) price mark despite its elevated equipment level is not a given anymore at this point. To achieve that, you also have to accept several compromises, some of which are unnecessary. Our test will show whether it is still sufficient to stay ahead of the competitors such as the Acer Predator Helios Neo 16 with an Intel processor or the Asus TUF Gaming A17 with the previous generation of the AMD Ryzen 9.
Possible Competitors in Comparison
Rating | Version | Date | Model | Weight | Height | Size | Resolution | Price |
|---|---|---|---|---|---|---|---|---|
| 80.4 % | v8 | 07 / 2024 | HP Omen 17-db0079ng R7 8845HS, NVIDIA GeForce RTX 4070 Laptop GPU | 2.8 kg | 30.1 mm | 17.30" | 2560x1440 | |
| 80.3 % | v8 | 07 / 2024 | Asus TUF Gaming A15 FA507UV R9 8945H, NVIDIA GeForce RTX 4060 Laptop GPU | 2.1 kg | 22.4 mm | 15.60" | 1920x1080 | |
| 90.2 % v7 (old) | v7 (old) | 03 / 2024 | Alienware m16 R2 Ultra 7 155H, NVIDIA GeForce RTX 4070 Laptop GPU | 2.5 kg | 23.5 mm | 16.00" | 2560x1600 | |
| 87.6 % v7 (old) | v7 (old) | 04 / 2024 | Asus ROG Strix Scar 16 G634JZR i9-14900HX, NVIDIA GeForce RTX 4080 Laptop GPU | 2.7 kg | 30.4 mm | 16.00" | 2560x1600 | |
| 86.8 % v7 (old) | v7 (old) | 05 / 2024 | Acer Predator Helios Neo 16 (2024) i7-14700HX, NVIDIA GeForce RTX 4070 Laptop GPU | 2.6 kg | 25.95 mm | 16.00" | 2560x1600 | |
| 85.6 % v7 (old) | v7 (old) | 01 / 2024 | Asus TUF Gaming A17 FA707XI-NS94 R9 7940HS, NVIDIA GeForce RTX 4070 Laptop GPU | 2.5 kg | 25.4 mm | 17.30" | 1920x1080 |
Note that we recently updated our rating system and that the results of version 8 are not comparable anymore with those of version 7. You can find additional information on this here.
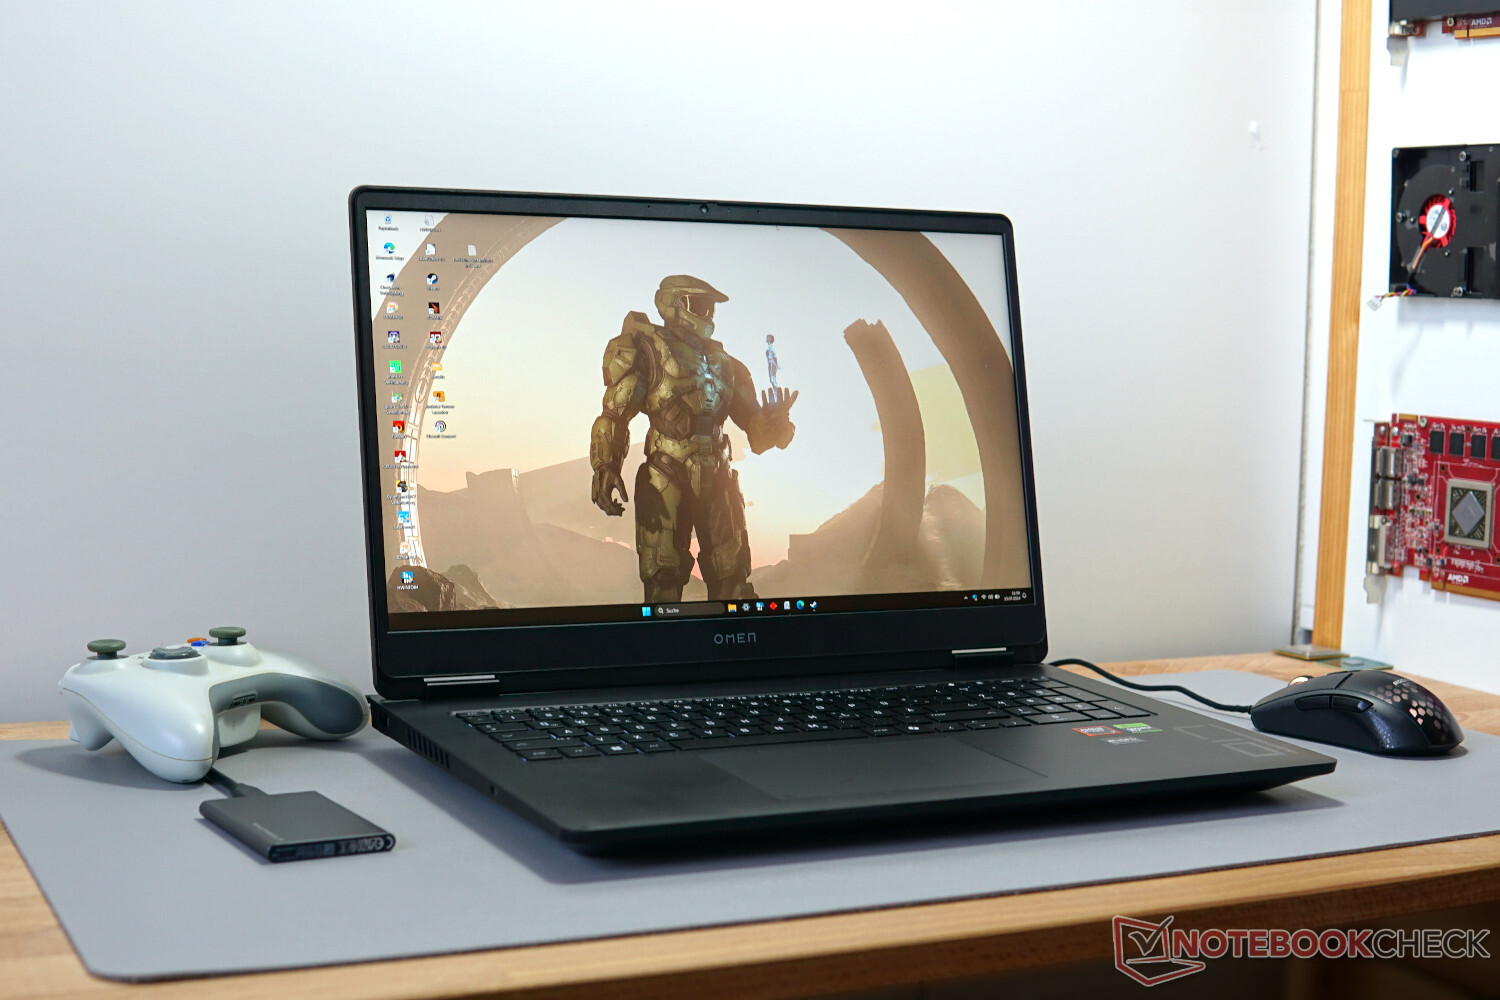
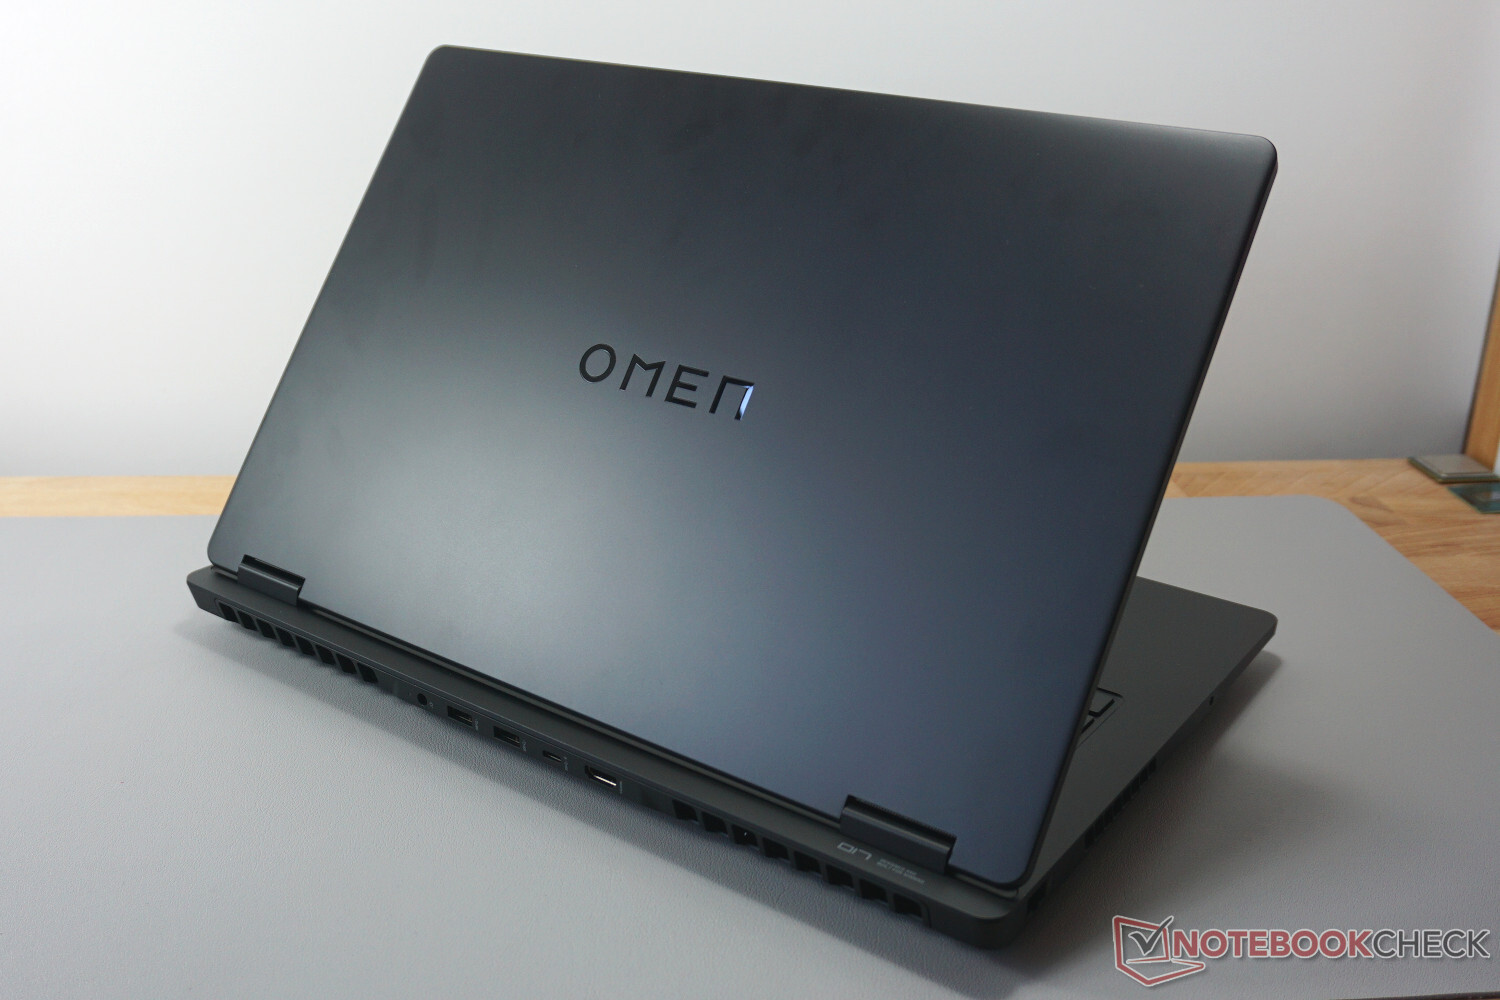
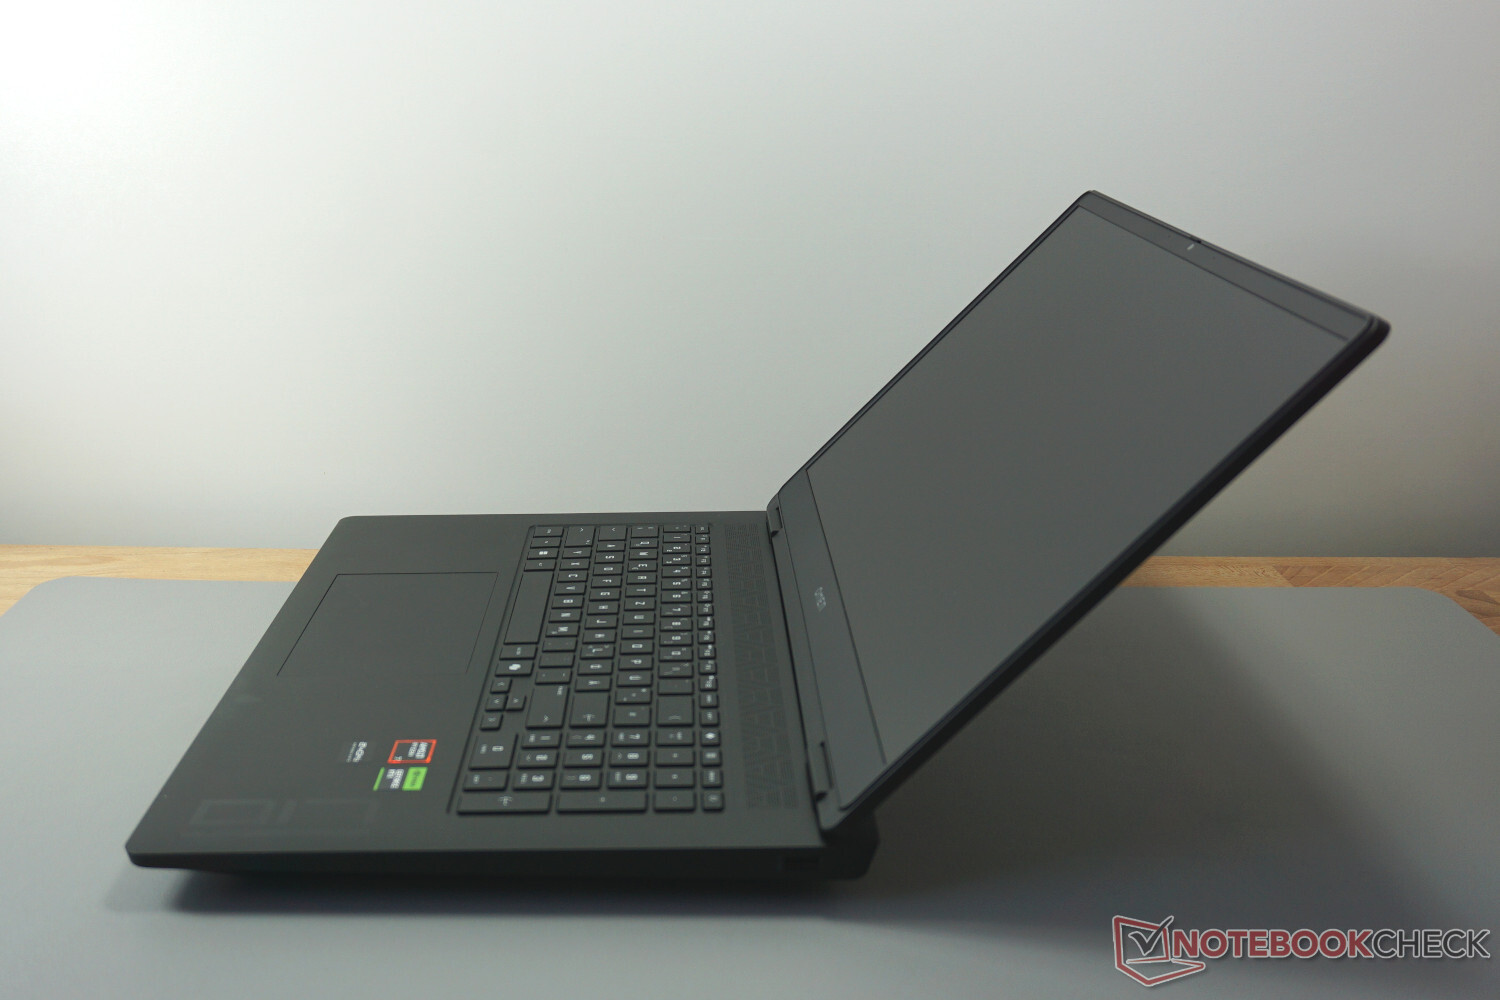
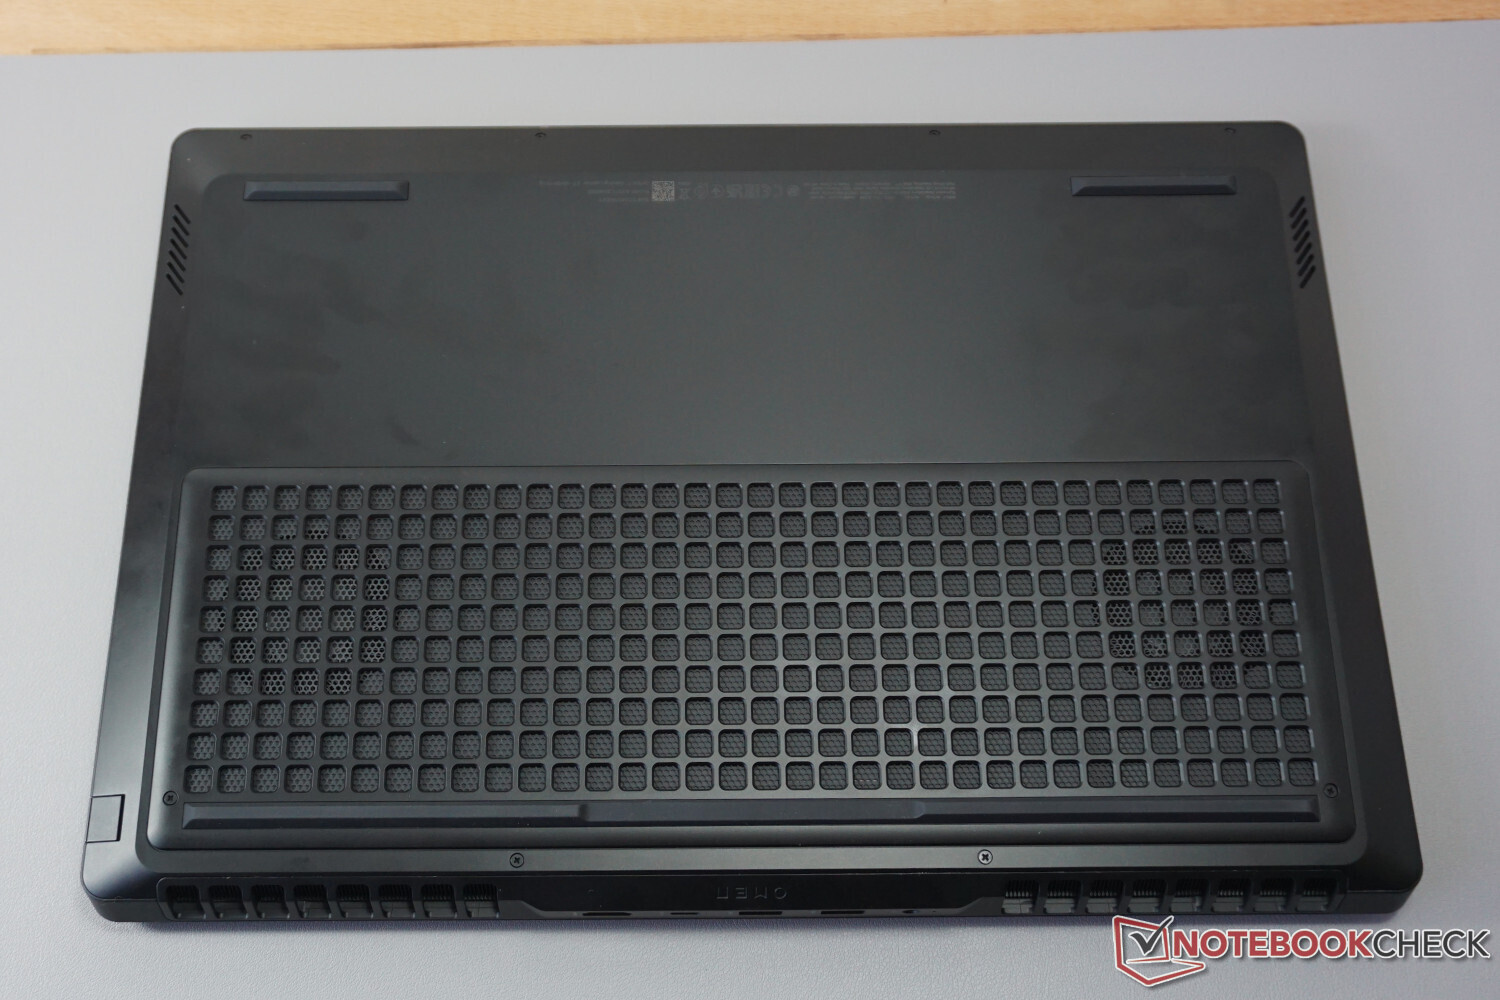
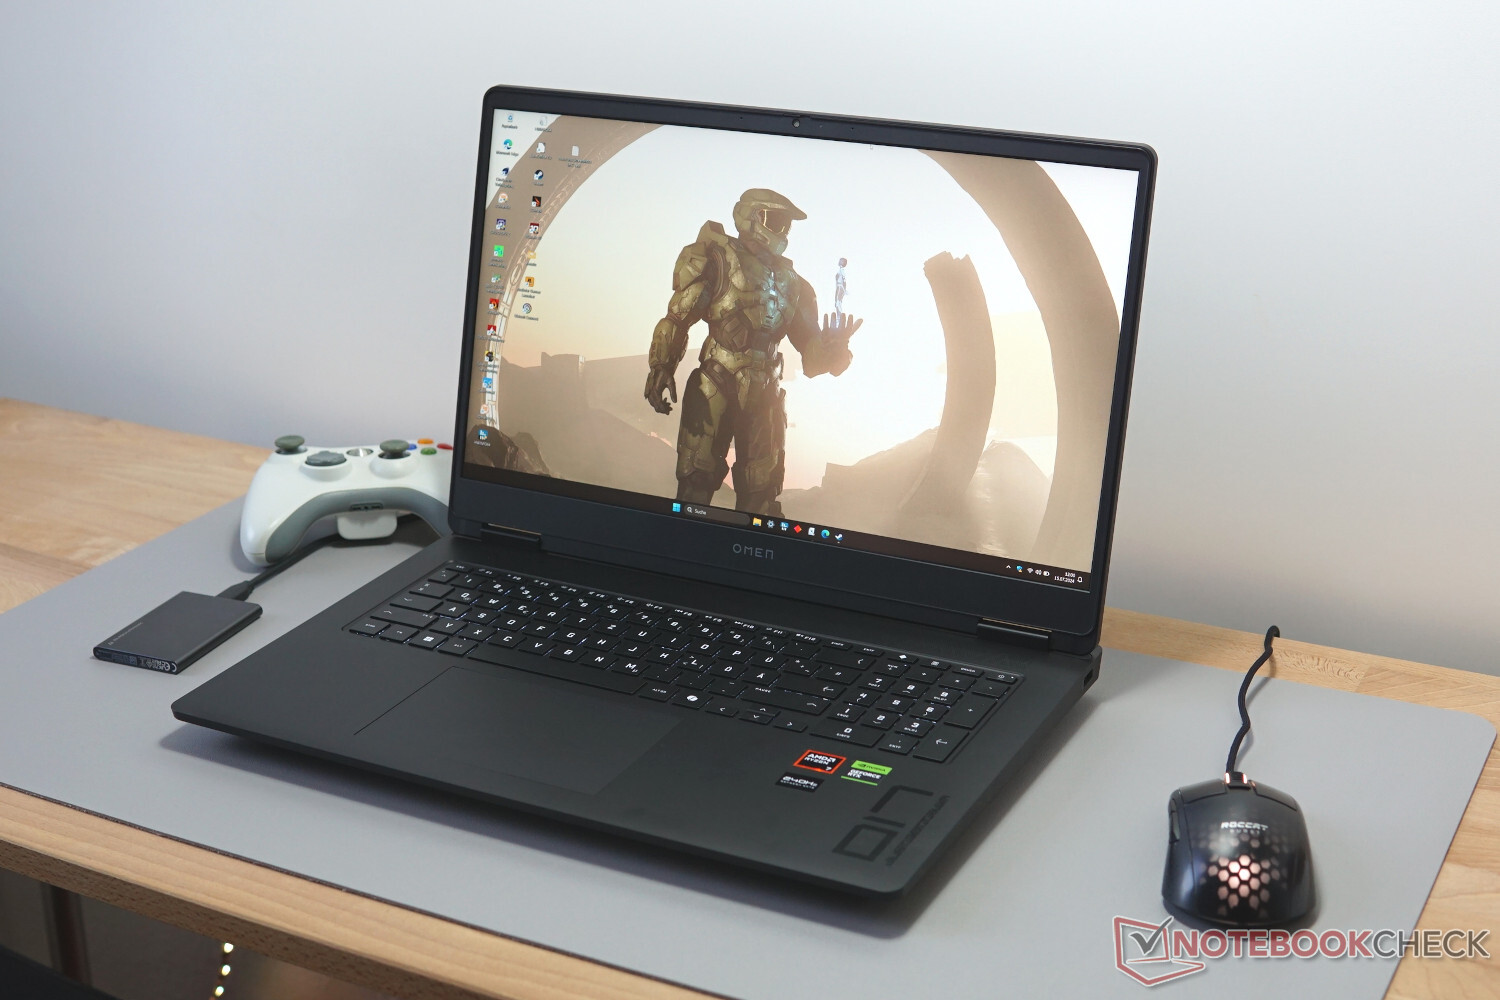
Case - A large and heavy gamer
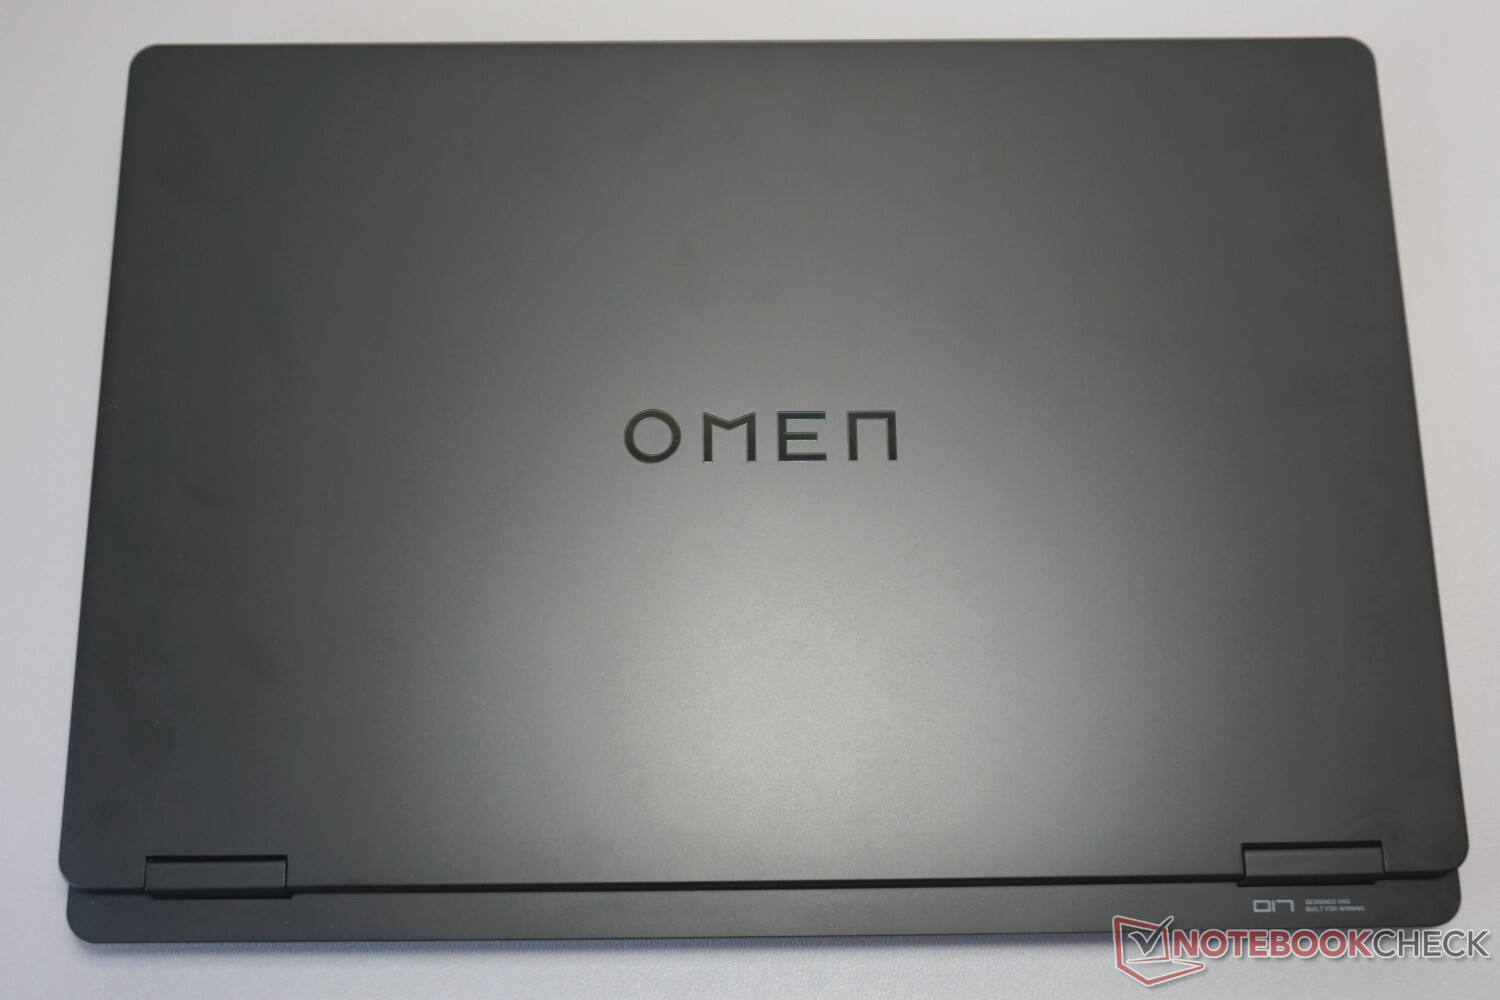
The case looks almost nondescript. Black plastic, which also feels like it, dominates all around. There are no visual highlights, small details, or even light effects to admire.
But once you try to lift the laptop - or when you take it directly out of the box in our case - it becomes clear that HP definitely didn't save on using massive components inside. The weight isn't far from the 3-kg mark (~6.6 lb), although the base remains unaffected if you lift it on only a single front corner. Everything remains stiff and tight.
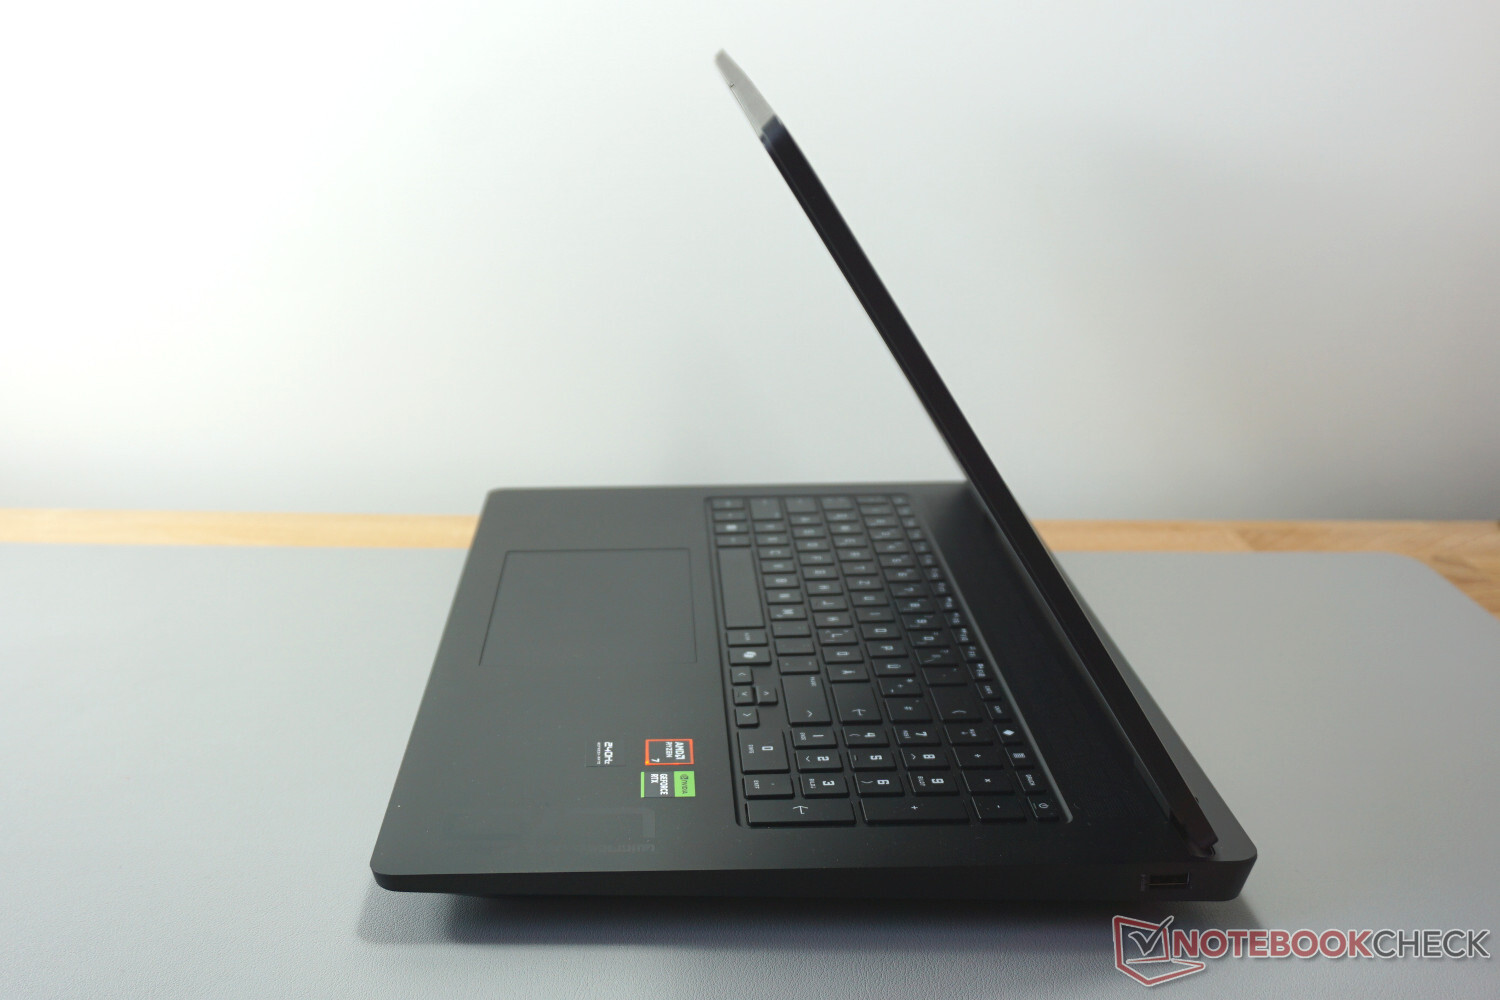
The display hinges offer a similar impression, but the display lid could have used a little more stability, remaining fairly bendable without any additional metal frame.
In terms of overall size, there only few models that are even larger. A 40-cm (~15.7 in) width and 3-cm (~1.2 in) height even without the feet really don't sound like a lot of mobility. On the other hand, this ensures plenty of space for hardware and cooling, although it might turn out too large for some laptop bags or backpacks.
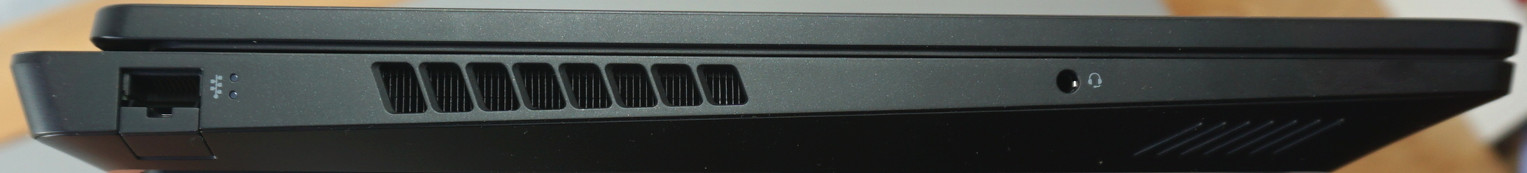
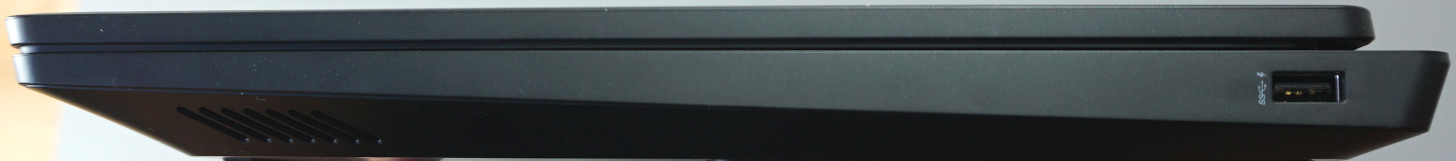
Connection Equipment - Omen 17 with few areas to shine
Even though there would have been plenty of space, the connection ports are limited. And not only that, but they are also the slower versions. All the USB connections in the back only reach 10 Gbit/s and the one on the side even only 5 Gbit/s. USB4 or TB4 would have been four or eight times as fast. But at least the ports in the back should still allow you to play many games from an external SSD.
Likewise, the LAN port also only reaches 1 Gbit/s, while the better equipped competitors such as the Acer Predator Helios Neo go more with the times offering 2.5 Gbit/s. The position of the port on the left side is also less than optimal and would have been better in the back. In addition, there is neither a third video port nor a card reader.
At least, the HDMI and USB-C video outputs support displaying 4K@120Hz, allowing those who have a suitable TV to make good use of it.

Communication
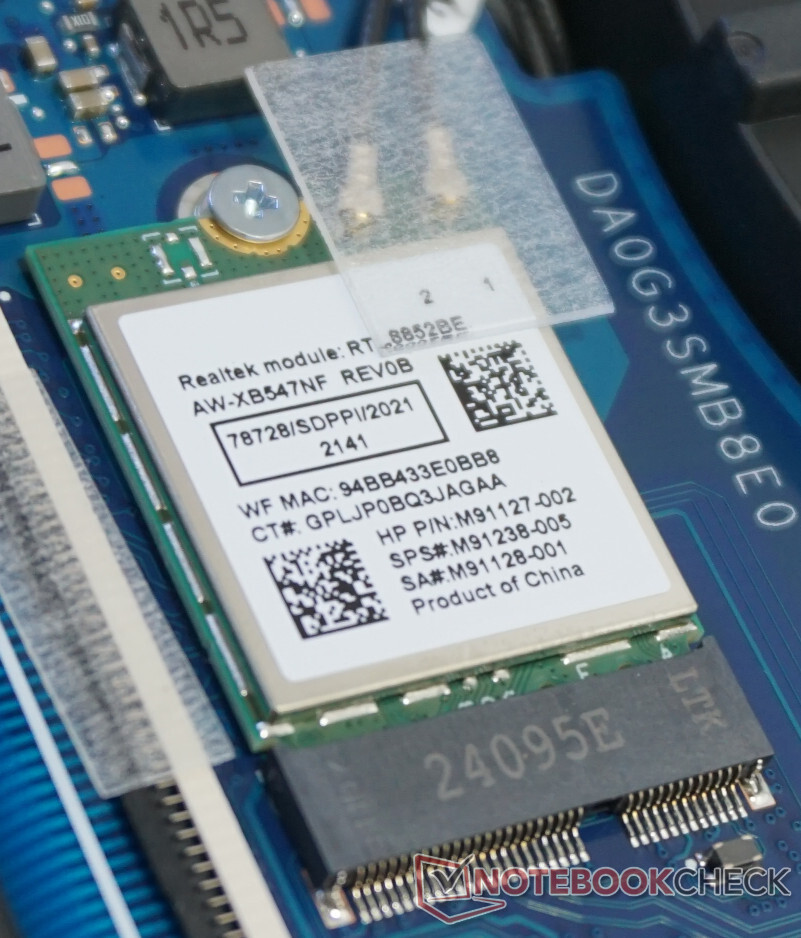
The WLAN module works fine to the extent of its capabilities. At almost 1 Gbit/s under ideal conditions, it is almost as good as a wired connection. There were no drops worth mention during our test.
While the Wi-Fi 6 module ensures a stable and reliable connection, it is hardly suited for the transfer of larger amounts of data.
Webcam
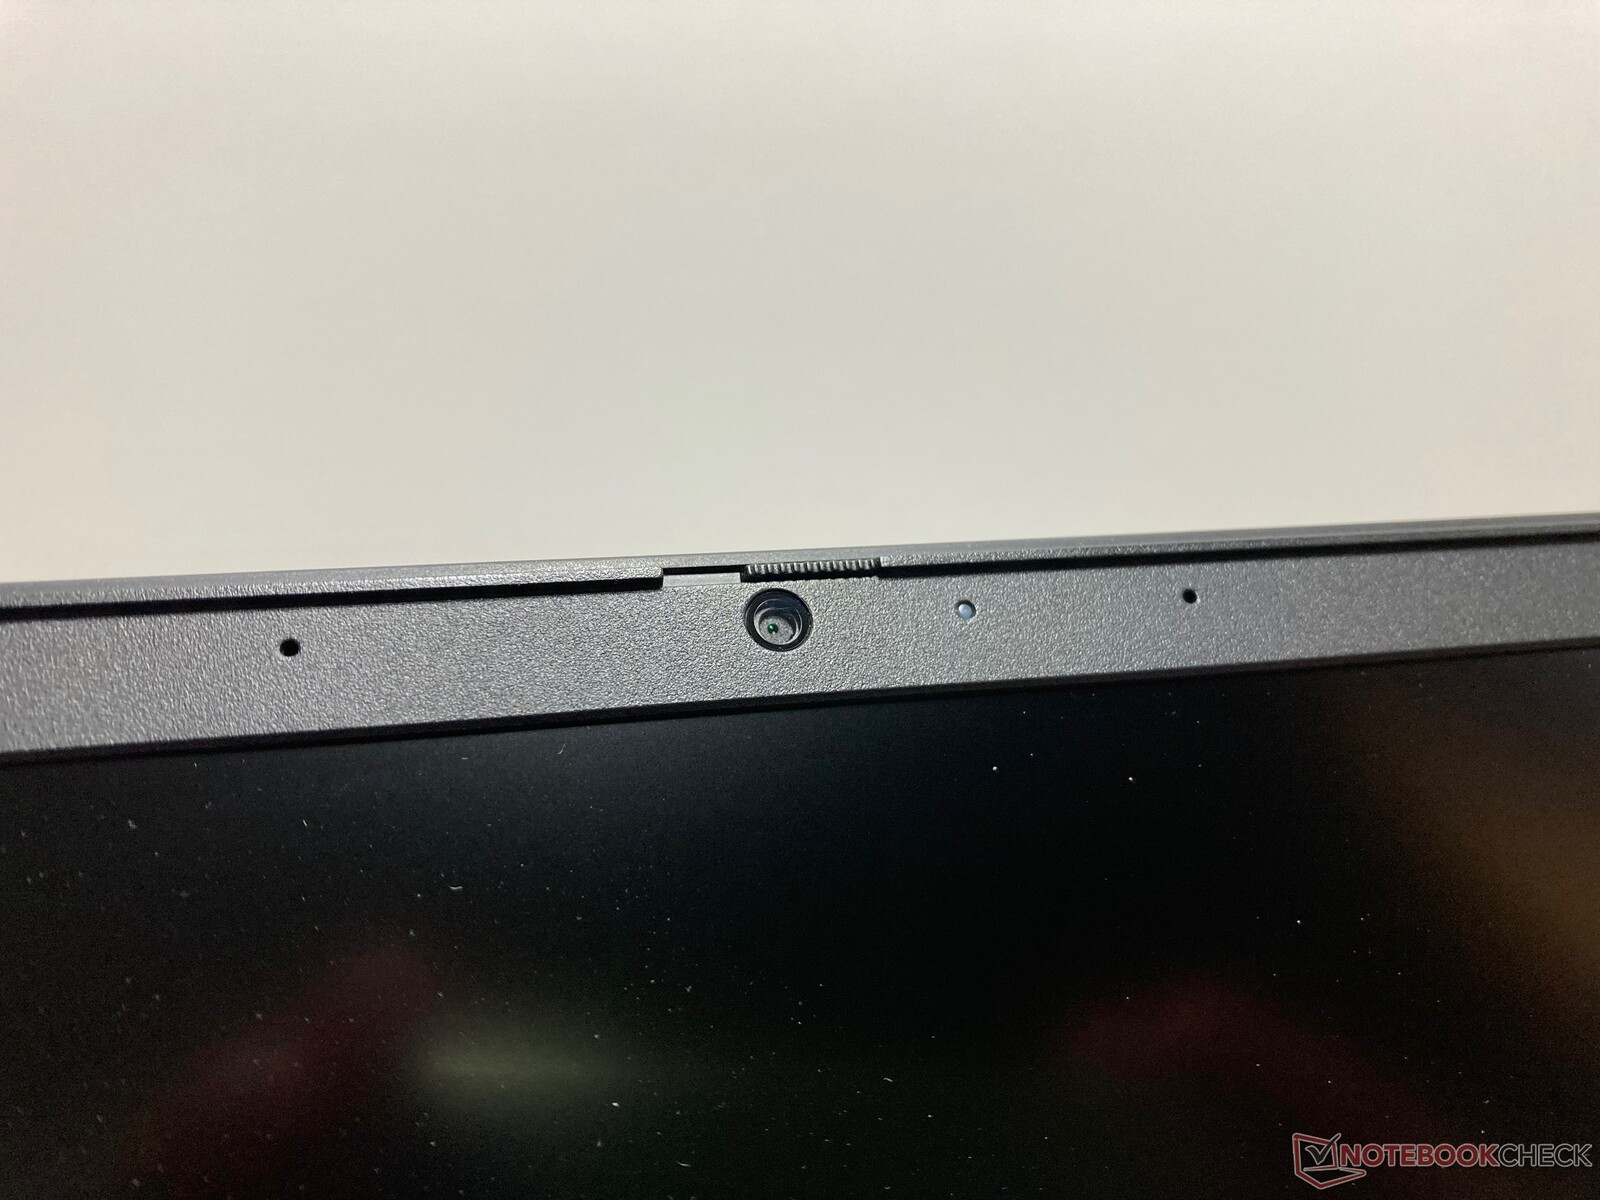
A decent Full-HD resolution results in detailed images. But this only goes for sufficiently bright light in the room. Even a ceiling light that isn't very bright results in a drop of the image quality. The camera is hardly able to handle weak light conditions. Details get lost and the color reproduction suffers considerably. The color accuracy is only convincing for a camera housed in the display frame if the surrounding light is bright. So we cannot recommend using the camera for more than a few video calls.
This is unfortunate, because the microphone does have some potential. Although its recordings sound slightly tinny, they are always recorded at the same volume and sound very clear. You can even easily hear the voices from outside the room.


Maintenance
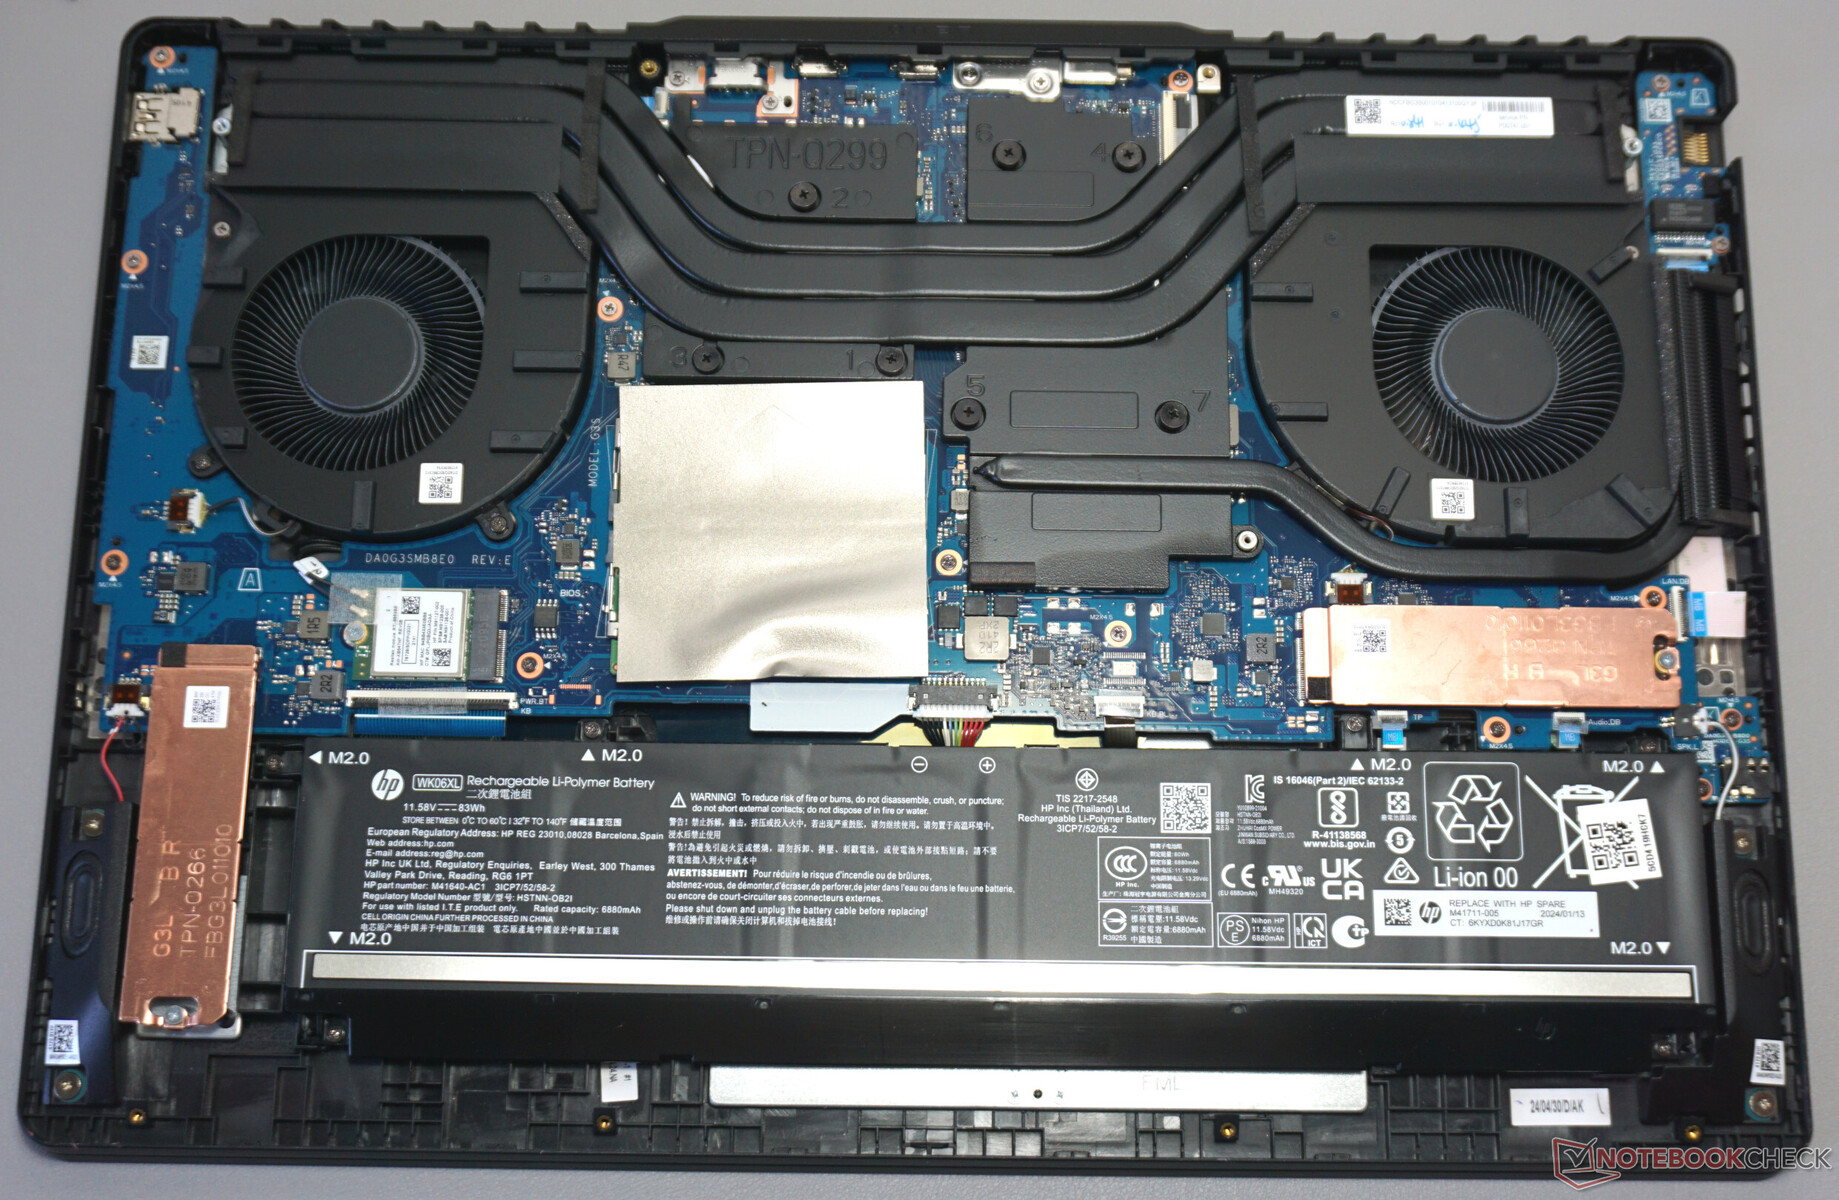
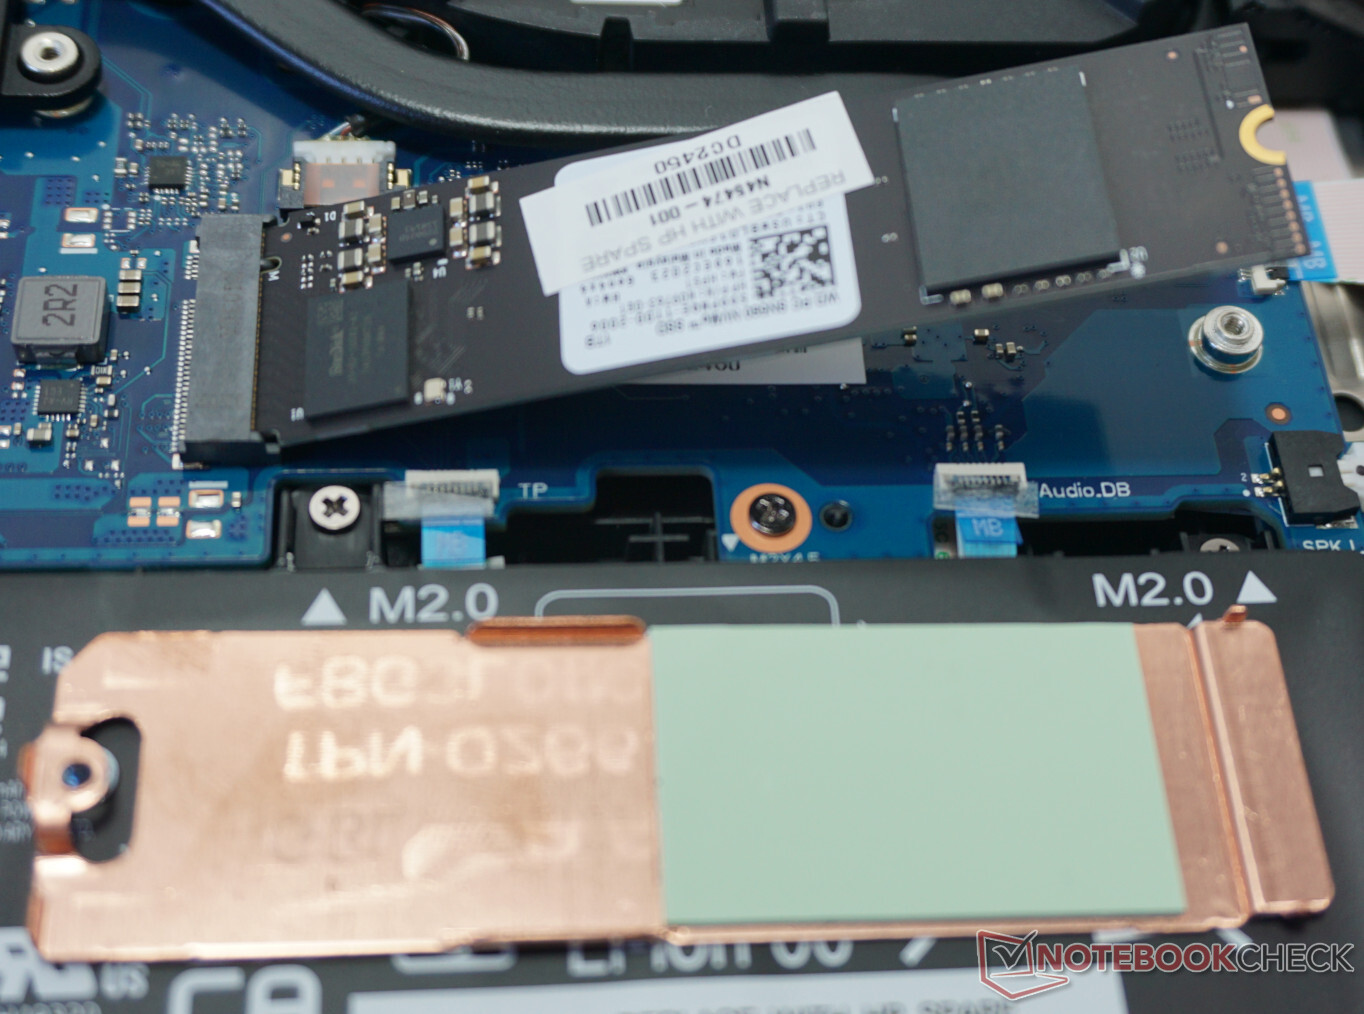
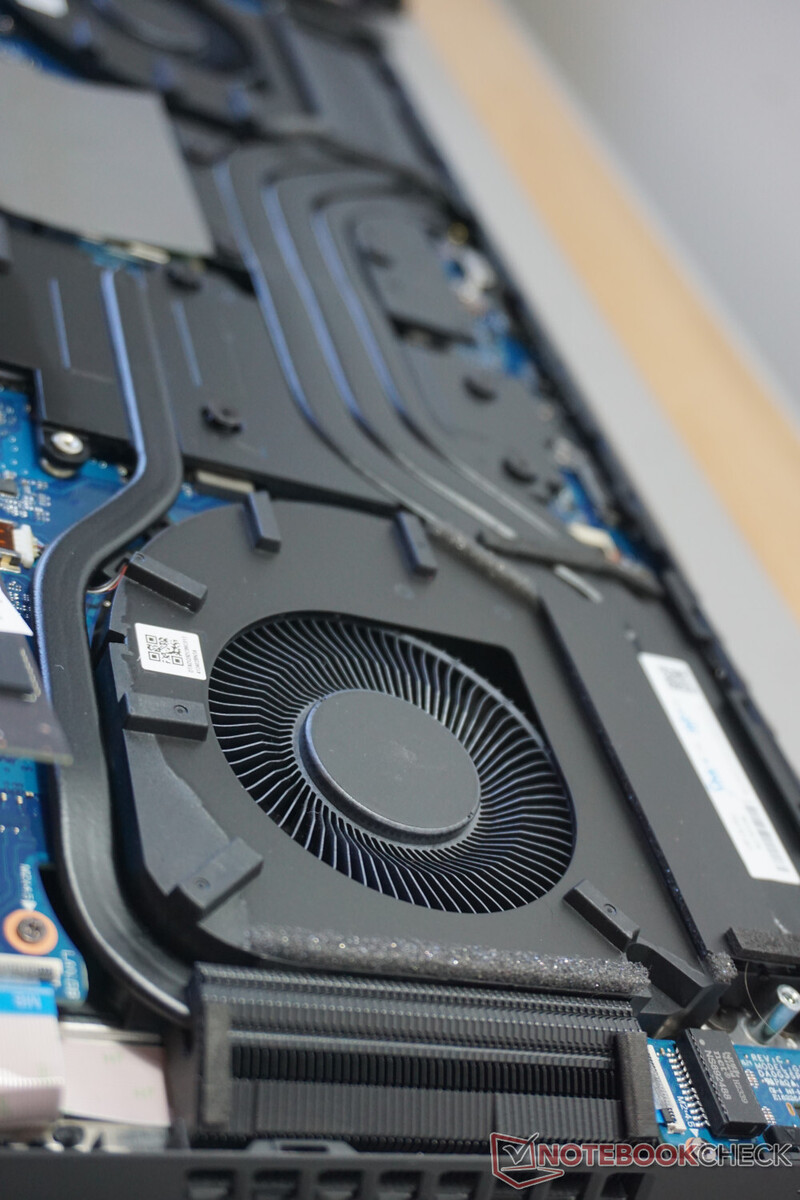
The HP Omen 17 collects a few positive points with its ease of opening the case bottom. Once you have removed the eight regular Philips screws, the case cover doesn't offer any resistance and can be easily removed without any use of force.
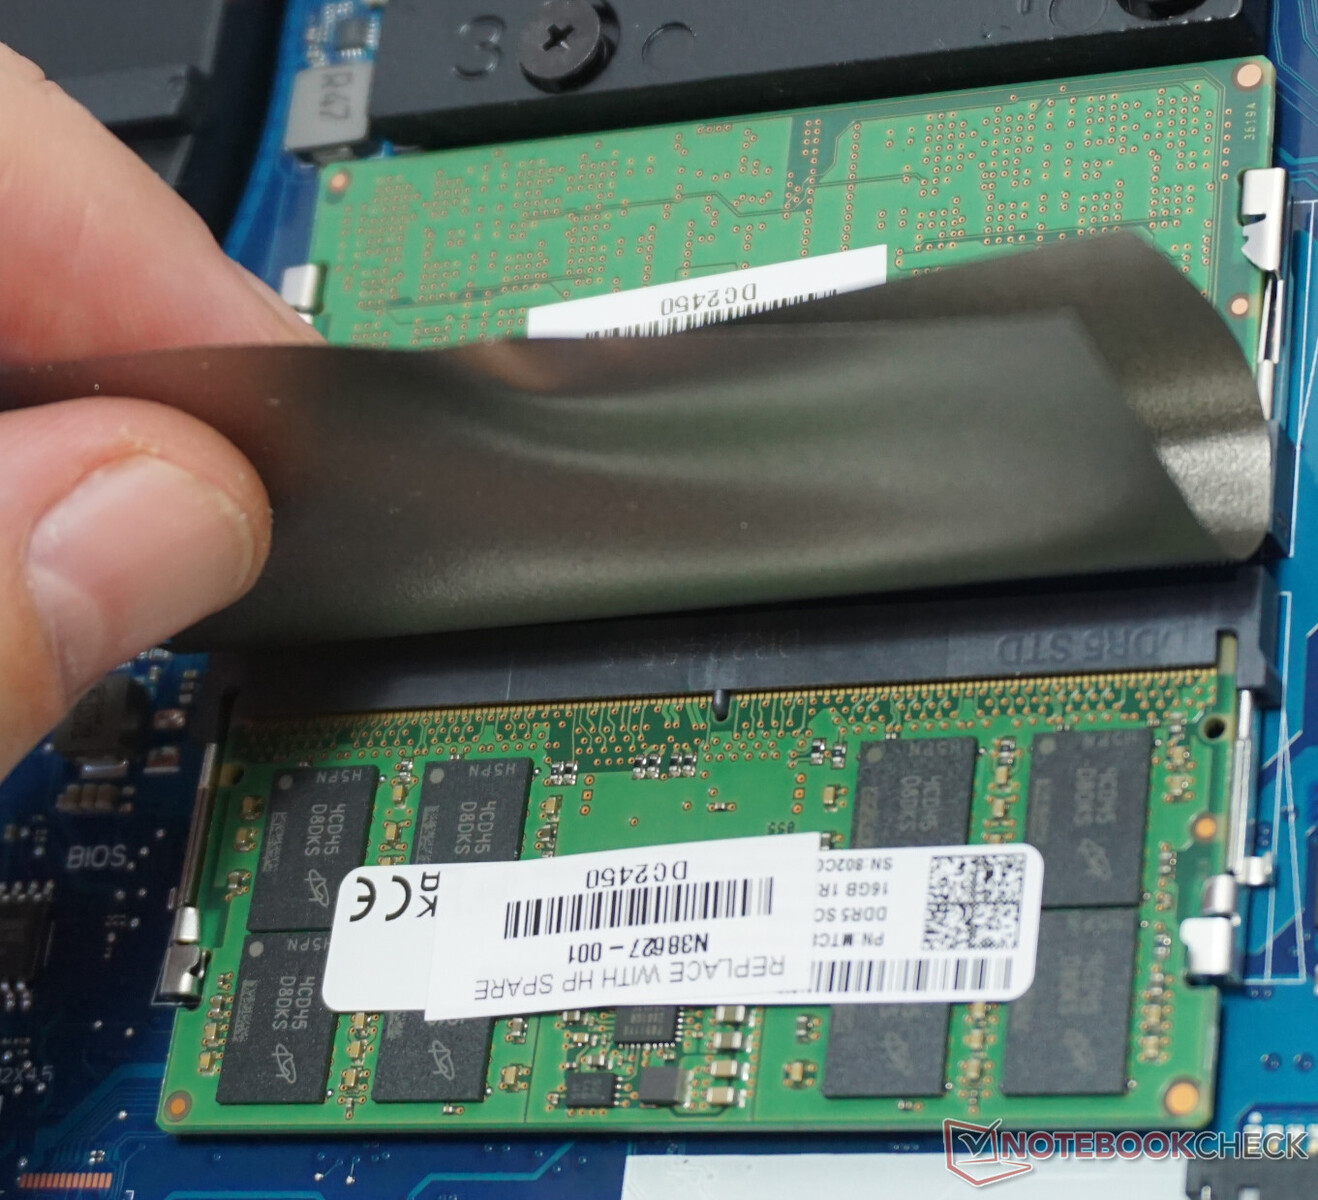
This gives you access to clean the fans and replace all the important components. Two RAM slots, a WLAN module with easily accessible antenna plugs, two SSD slots, and a battery that can be easily removed are not things that many of the more compact laptops are able to offer, at least not in this complete combination.
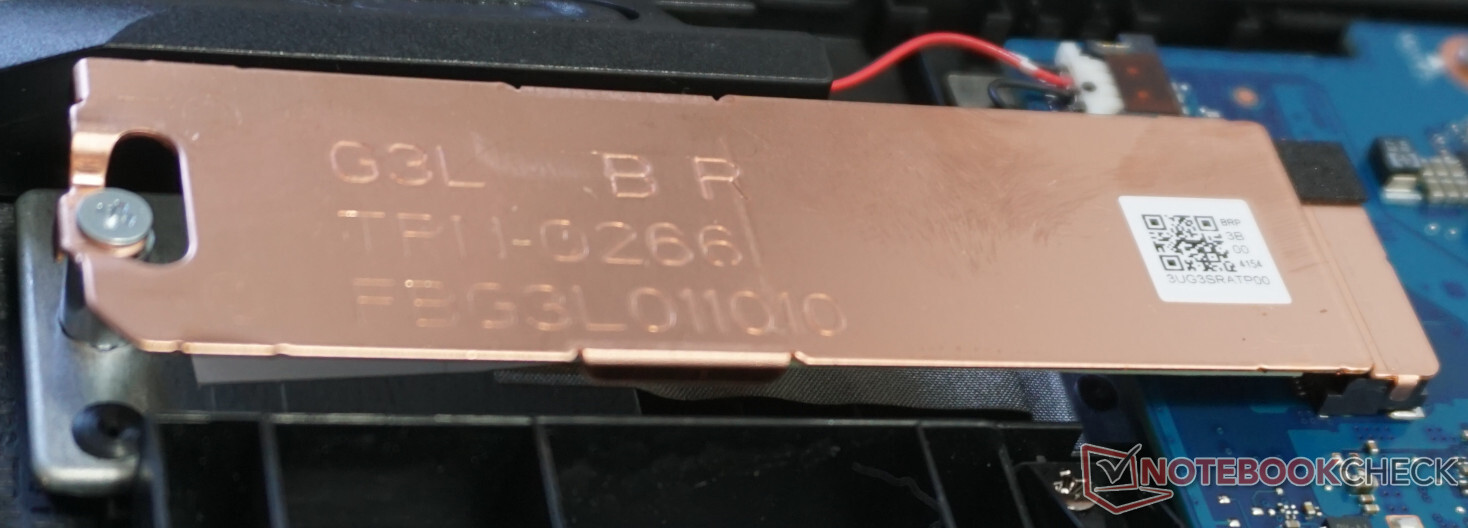
In addition, there are copper covers for the M.2 SSD slots that apparently also have an effect, as we will find out later in the test. One of the slots is still available, making a later addition of storage space easily accomplishable.
Sustainability
The packaging consists mostly of cardboard and paper. Even the protective cover of the laptop and keyboard are made of paper. Only charger is wrapped in a protective plastic foil. In addition, there is also the easy maintenance of the laptop, which will surely benefit the longevity of the Omen 17. From the working memory up to the battery, everything can be replaced.
Then there is the moderate power consumption with everyday tasks that is mostly ranging below 10 watts. A typical desktop PC clearly has a disadvantage here.
And finally, HP publishes a yearly sustainability report that shows the initiatives by the manufacturer, which start from power generation from renewable sources and go up to the goal of equal treatment of all employees across all levels of the company structure. You can find out about the details here.
Warranty
While HP grants a two-year warranty, it doesn't offer any extras such as onsite repair. Depending on the vendor, you might also be able to book some additional warranty options there.
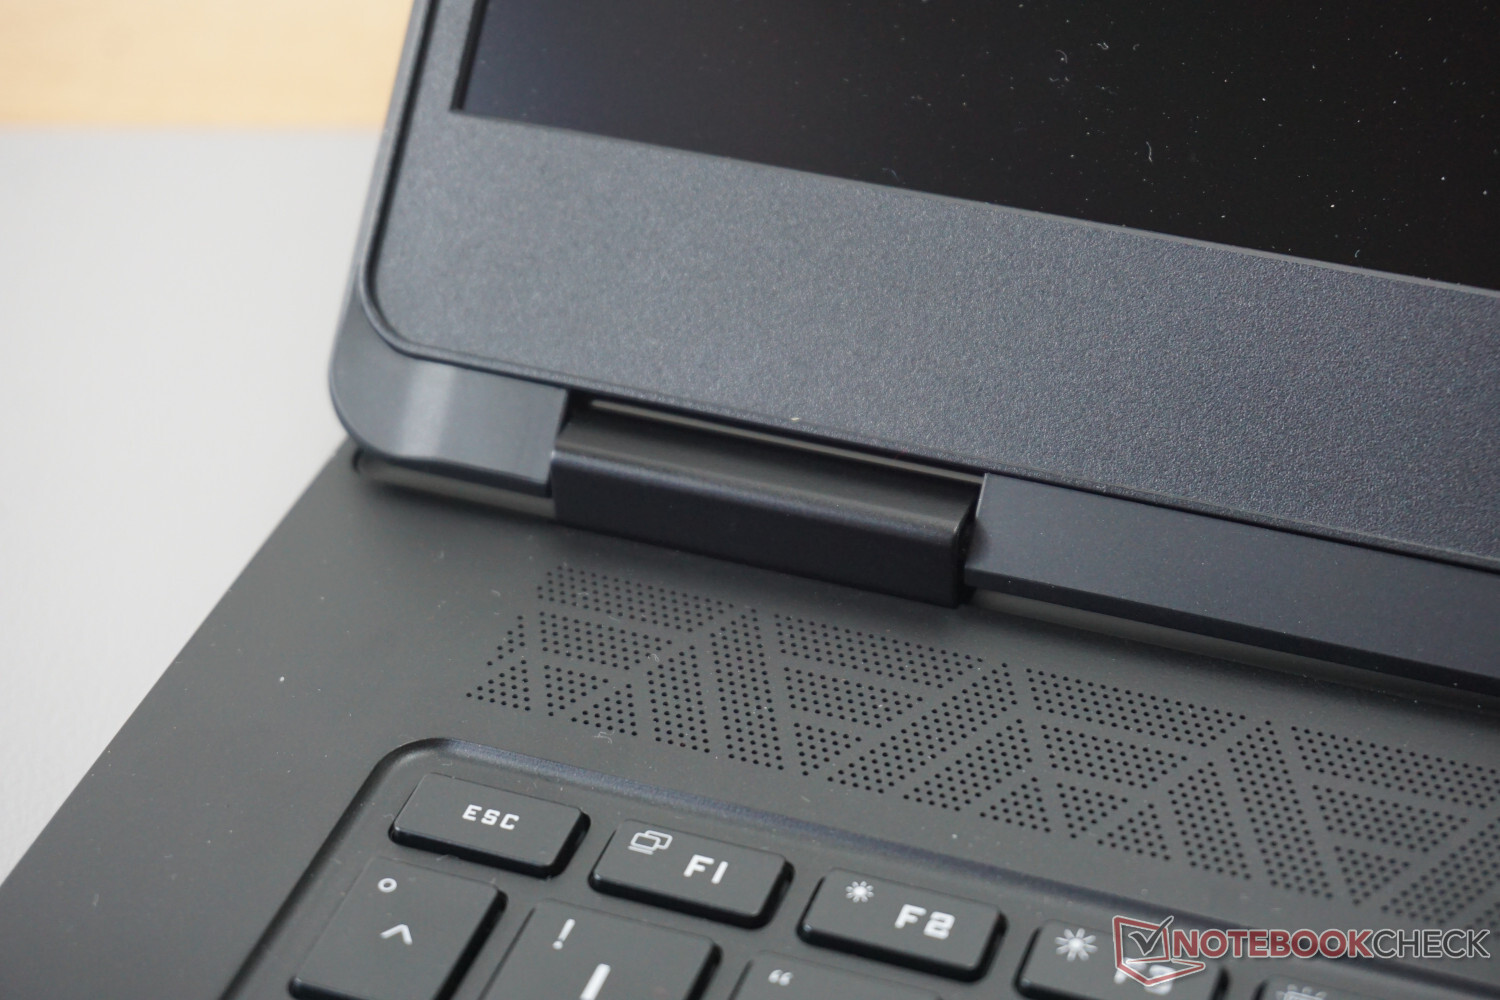
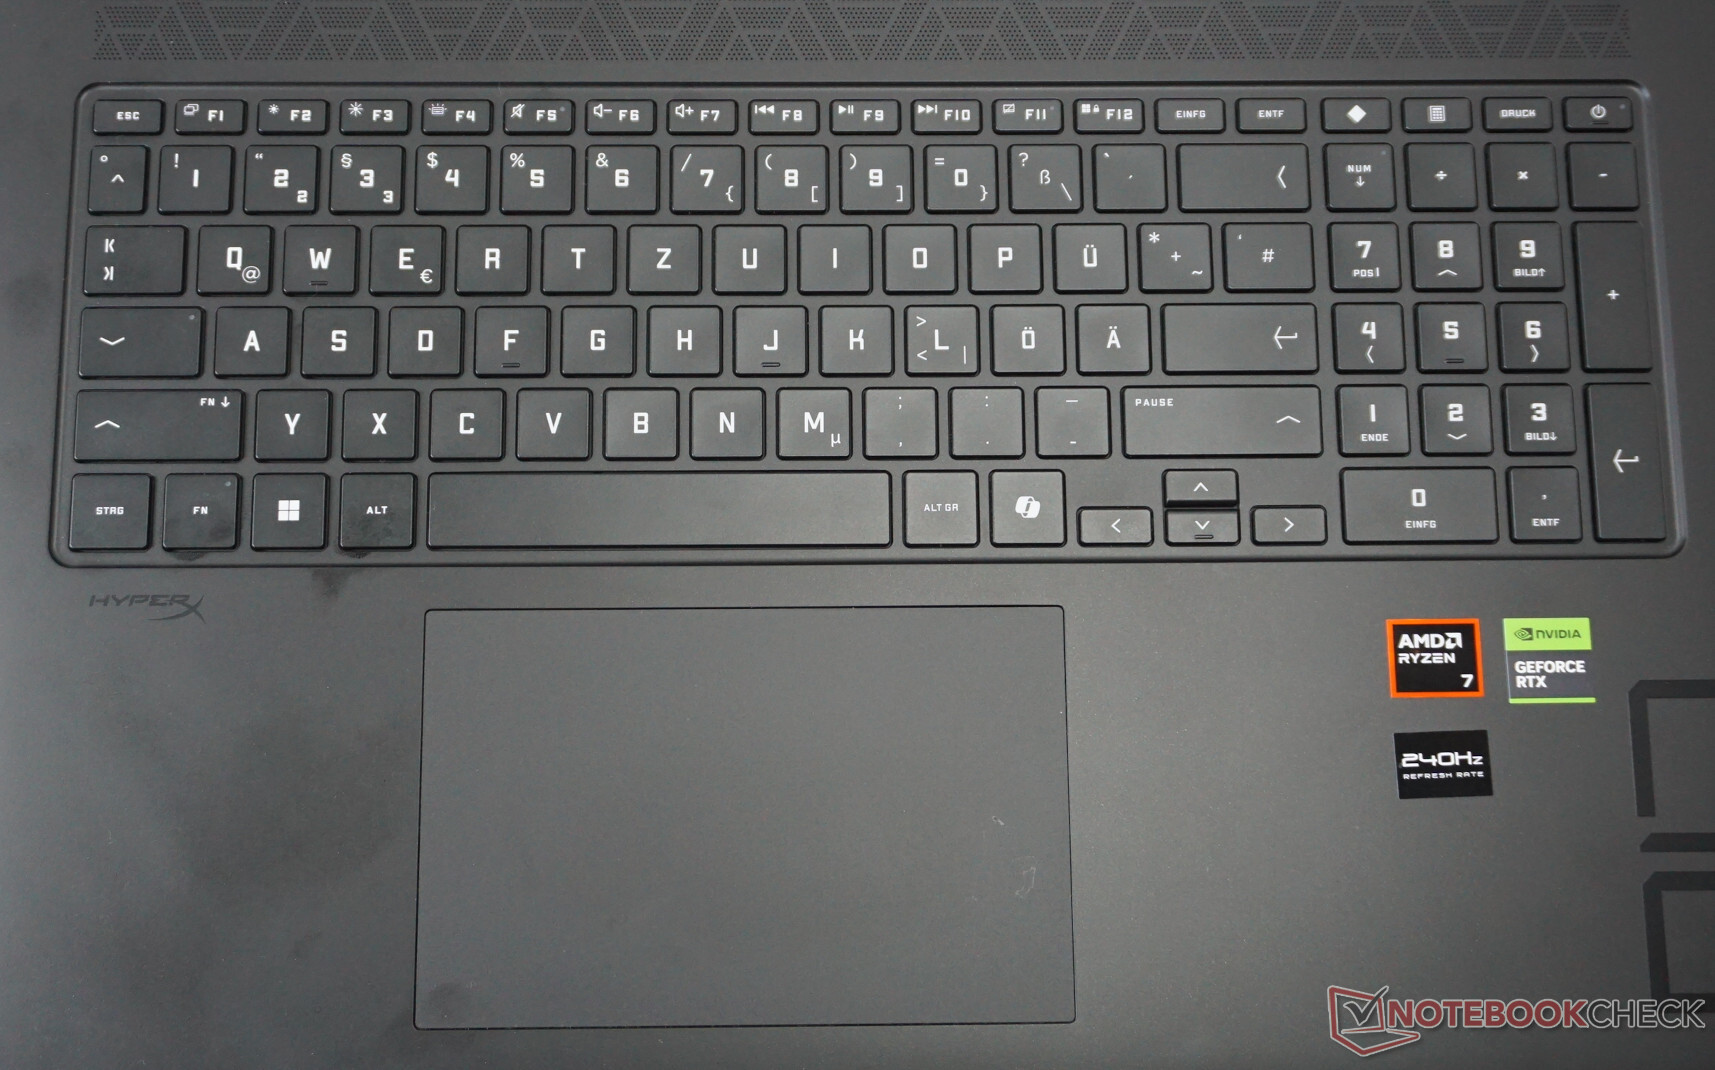
Input Devices - HP Omen 17 only offers standard fare
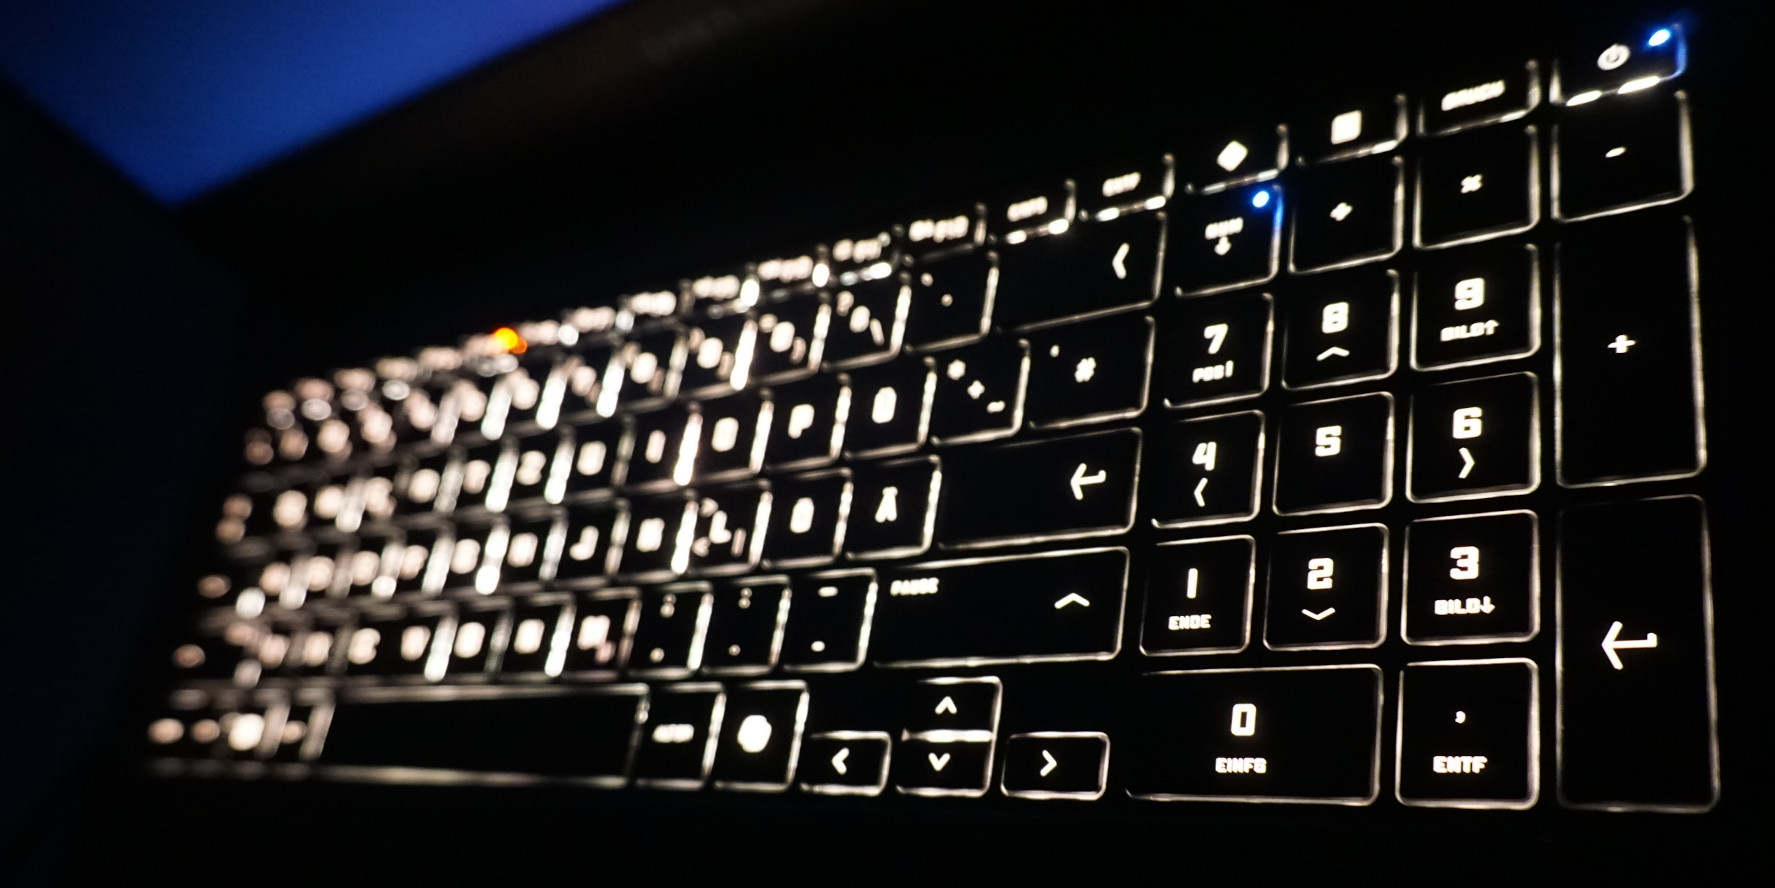
The keyboard doesn't look quite fitting for a gaming laptop. There is short key stroke, and the key resistance is hardly noticeable. In addition, the keyboard lacks the individually adjustable illumination. Even though you can select almost any color with fine adjustments of the brightness, all the keys are then illuminated in the same color. At least, the arrow keys should have been full-sized.
The touchpad shows a similar picture. Even though at 13 x 8 cm (5.1 x 3.15 in), it is comfortably sized and also responds very accurately, the key press appears less well-adjusted. More powerful pressure results in some noticeable clattering. While it is sufficient overall for everyday tasks - the keyboard also offers a tight frame and good typing experience - those who want to get into some more intense gaming are almost forced to use additional input devices.
Display - Well adjusted to the offered gaming performance

If you think about what a good gaming display in a laptop has to be able to do, you would get the QHD display of the HP Omen 17 fairly accurately. Combined with a 17-inch diagonal, the resolution ensures a sharp and detailed image.
In addition to gaming, the 16:9 format is also well-suited for streaming. The colors on the IPS panel look fairly natural, and the matte surface also prevents annoying reflections.
The 240 Hertz refresh rate and sufficiently large color space ensure that the various game genres are displayed as desired. The response times in our measurements are also able to keep up with those of the better models, reaching a considerably higher level than those of the Asus TUF Gaming 17, for example.
What is less impressive is the contrast and black value. Even for an IPS panel, where we don't expect a perfect black anyways, the image looks too bright with absolute darkness. On the other hand, we are unable to detect any screen bleeding with our bare eyes at all, or only very little with long exposure. We also don't see any flickering from Pulse Width Modulation in our test.
In addition, HP also offers a Full-HD version with 144 Hertz, which might be a sensible option in combination with an RTX 4060.
| |||||||||||||||||||||||||
Brightness Distribution: 84 %
Center on Battery: 363 cd/m²
Contrast: 955:1 (Black: 0.38 cd/m²)
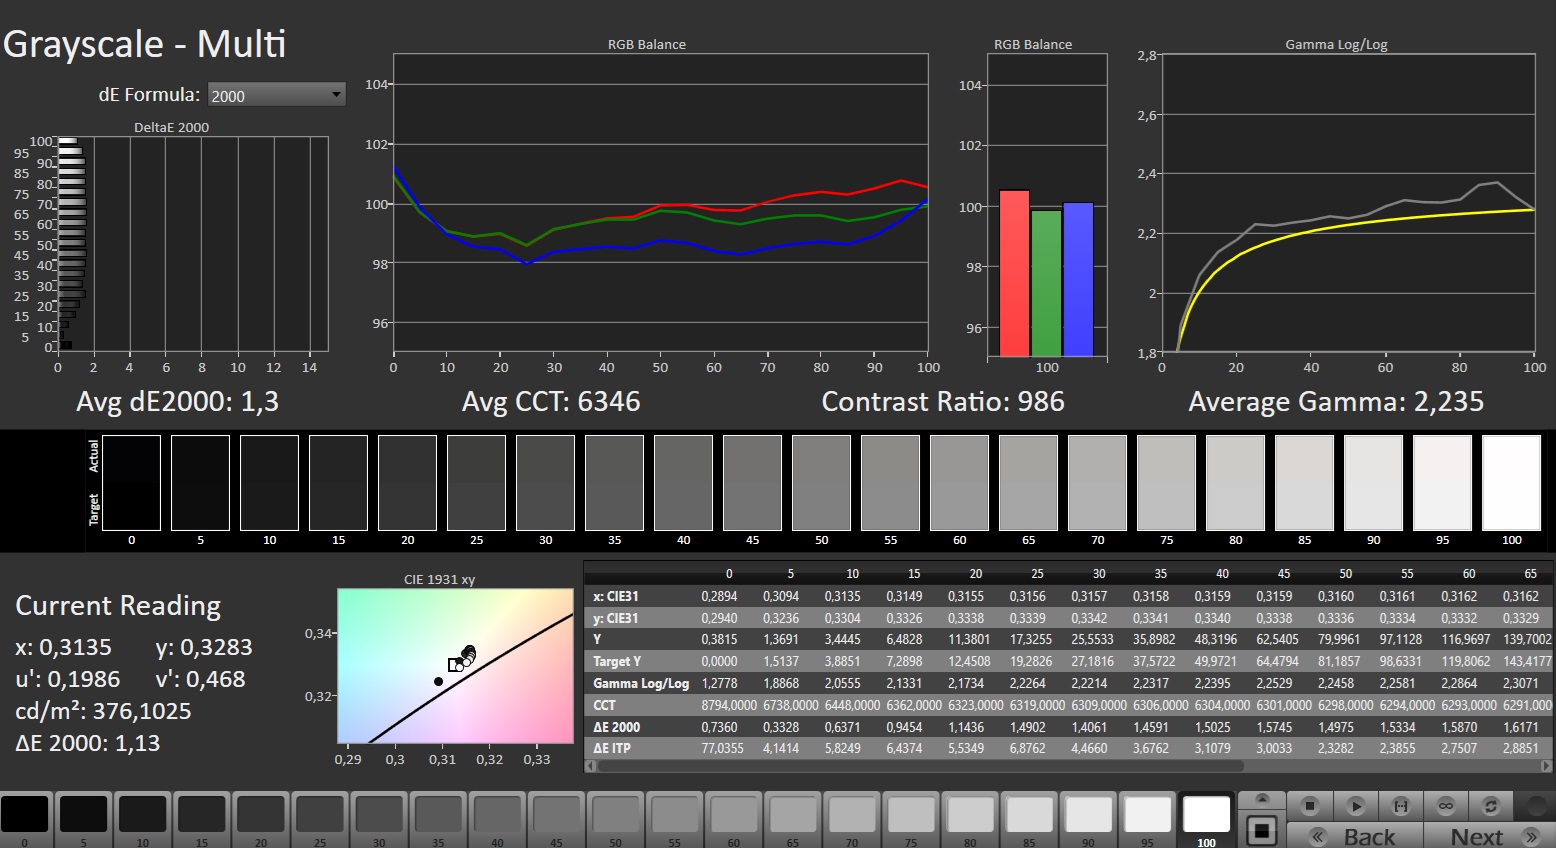
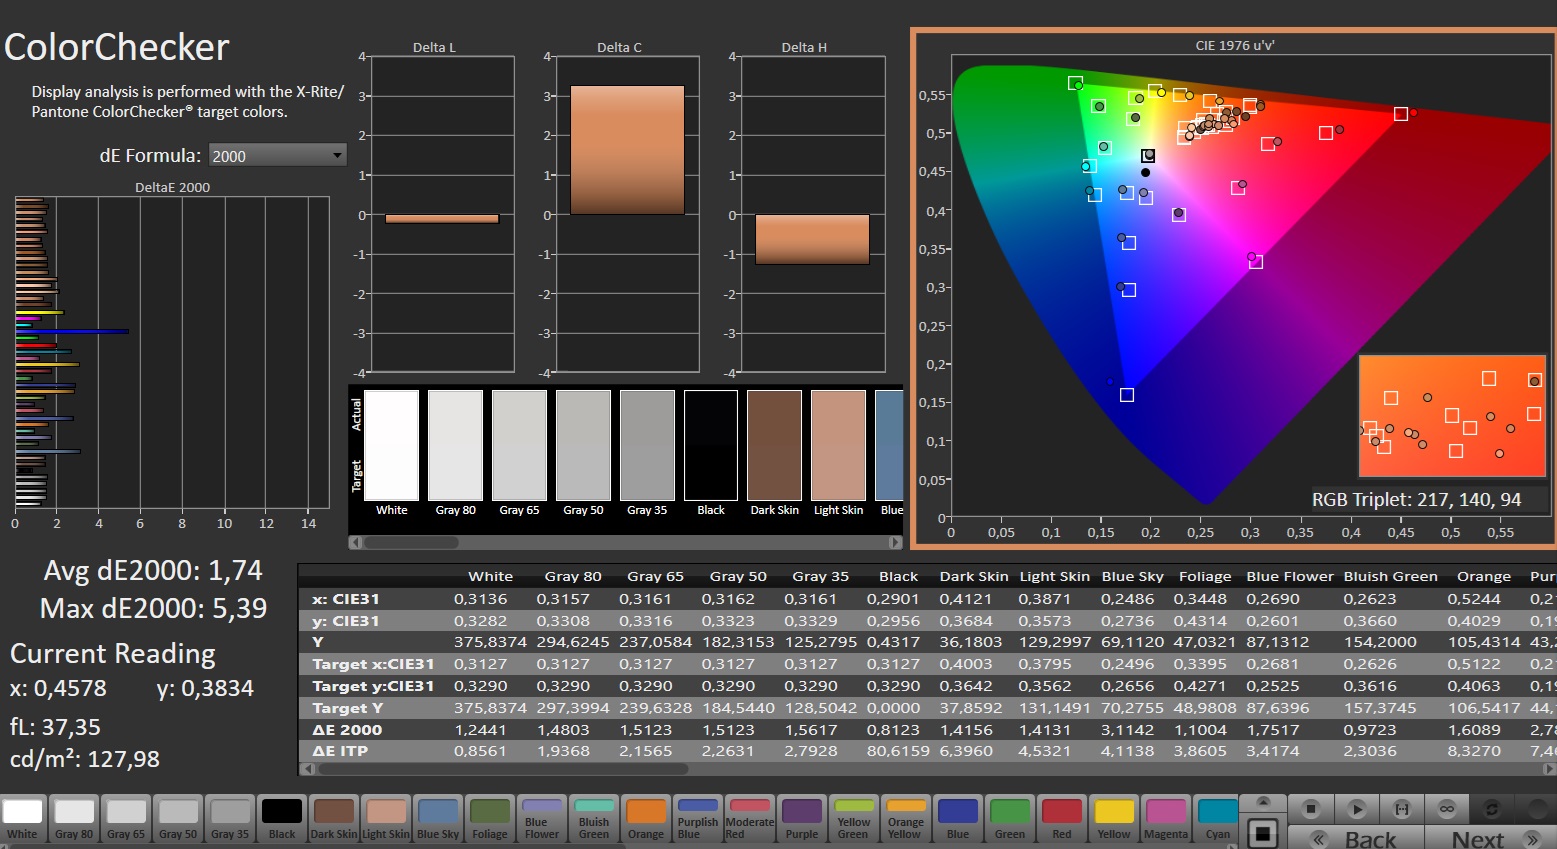
ΔE Color 1.74 | 0.5-29.43 Ø4.84, calibrated: 1.43
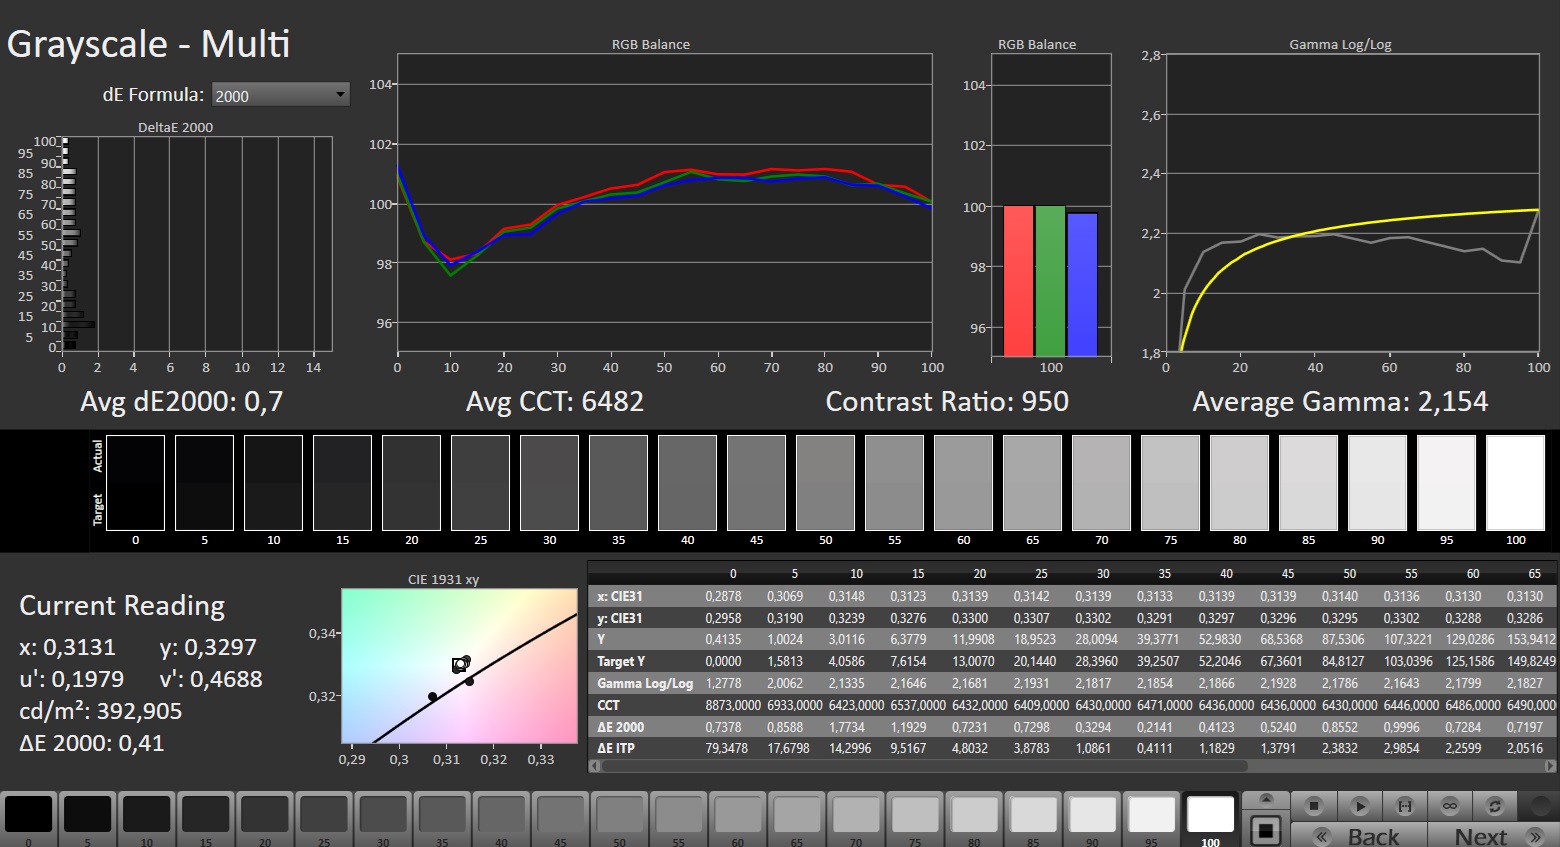
ΔE Greyscale 1.3 | 0.09-98 Ø5.1
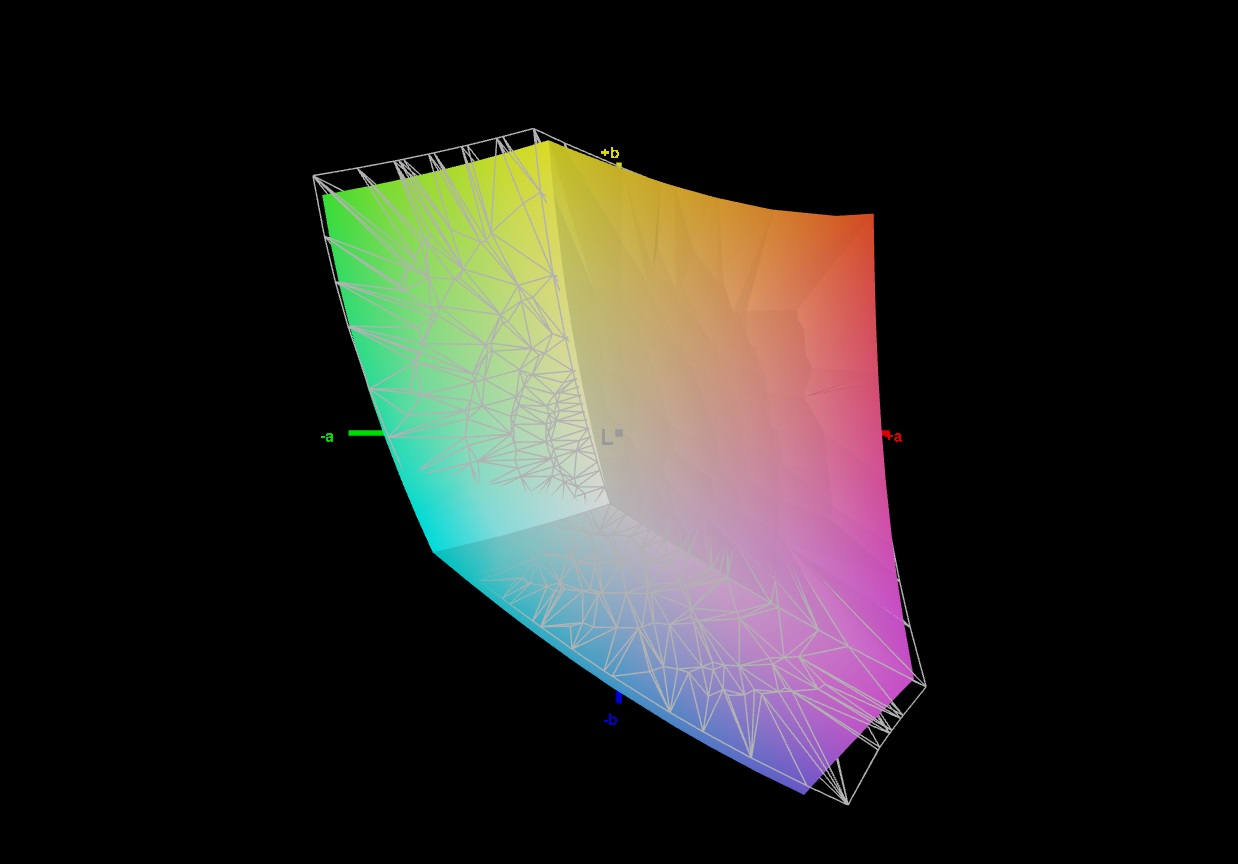
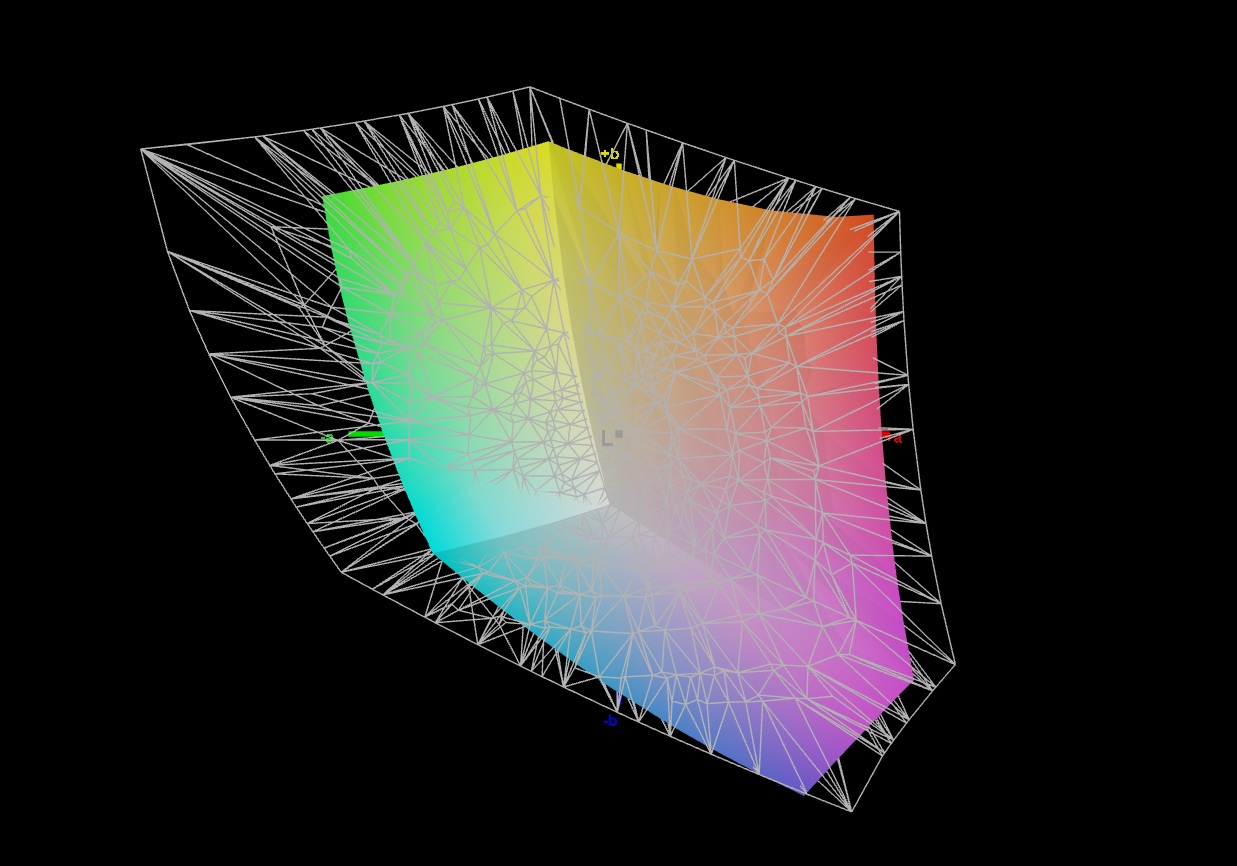
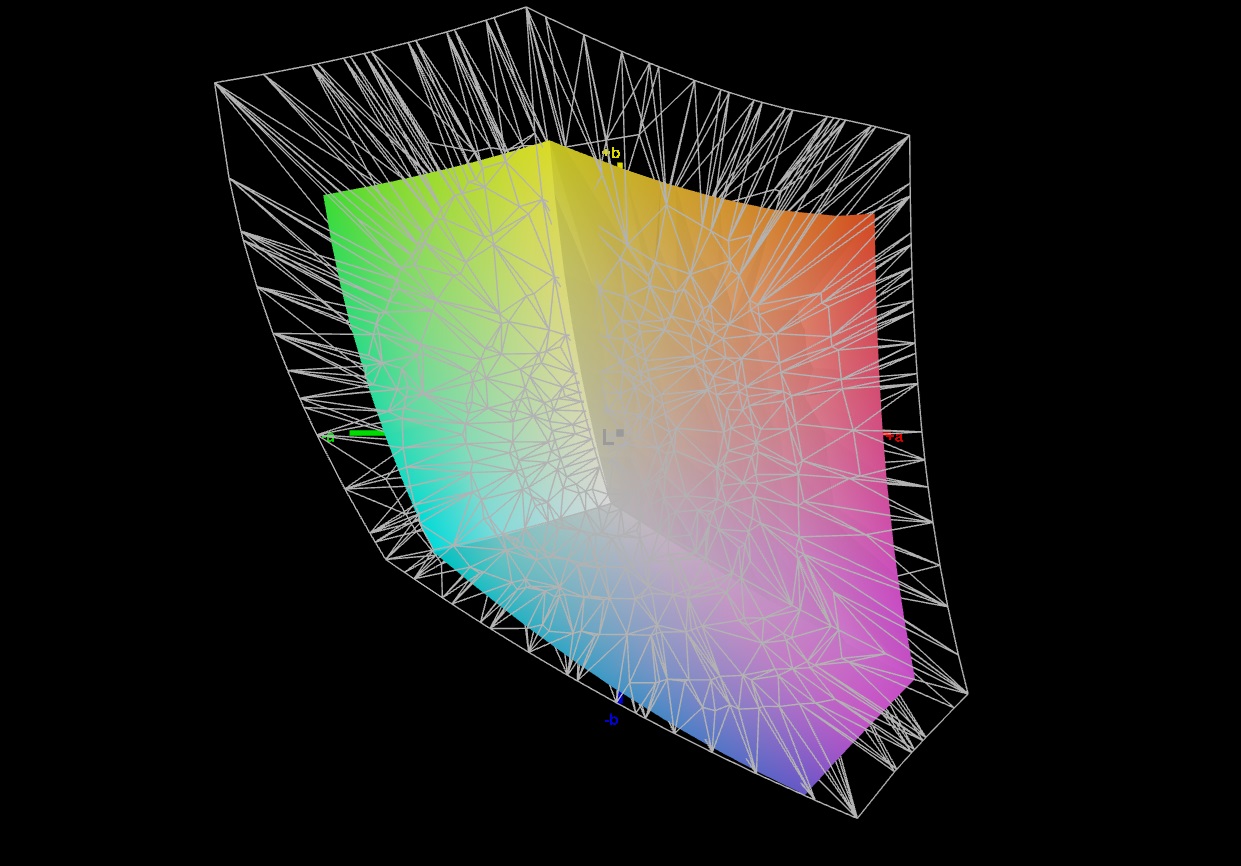
68.1% AdobeRGB 1998 (Argyll 2.2.0 3D)
95.5% sRGB (Argyll 2.2.0 3D)
66.2% Display P3 (Argyll 2.2.0 3D)
Gamma: 2.235
| HP Omen 17-db0079ng BOE0B67, IPS, 2560x1440, 17.3" | Alienware m16 R2 BOE NE16NYH, IPS, 2560x1600, 16" | Asus ROG Strix Scar 16 G634JZR BOE NE160QDM-NM7, Mini LED, 2560x1600, 16" | Acer Predator Helios Neo 16 (2024) Chi Mei N160GME-GTB, LED, 2560x1600, 16" | Asus TUF Gaming A17 FA707XI-NS94 AU Optronics B173HAN04.9, IPS, 1920x1080, 17.3" | Asus TUF Gaming A15 FA507UV AU Optronics B156HAN15.H, IPS, 1920x1080, 15.6" | |
|---|---|---|---|---|---|---|
| Display | 6% | 30% | 26% | -39% | 5% | |
| Display P3 Coverage | 66.2 | 71 7% | 99.8 51% | 95.9 45% | 39.7 -40% | 70.5 6% |
| sRGB Coverage | 95.5 | 100 5% | 100 5% | 99.8 5% | 59.1 -38% | 98.5 3% |
| AdobeRGB 1998 Coverage | 68.1 | 71.4 5% | 90.8 33% | 86.4 27% | 41 -40% | 72.7 7% |
| Response Times | 28% | 20% | 30% | -198% | -148% | |
| Response Time Grey 50% / Grey 80% * | 14.4 ? | 5.7 ? 60% | 5 ? 65% | 5 ? 65% | 39 ? -171% | 31.7 ? -120% |
| Response Time Black / White * | 8.3 ? | 8.7 ? -5% | 10.4 ? -25% | 8.8 ? -6% | 26.9 ? -224% | 22.9 ? -176% |
| PWM Frequency | 2040 ? | |||||
| Screen | 6% | 29% | 7% | -66% | -22% | |
| Brightness middle | 363 | 345.8 -5% | 490 35% | 521 44% | 255.9 -30% | 315 -13% |
| Brightness | 341 | 337 -1% | 487 43% | 506 48% | 248 -27% | 303 -11% |
| Brightness Distribution | 84 | 87 4% | 94 12% | 85 1% | 91 8% | 90 7% |
| Black Level * | 0.38 | 0.3 21% | 0.4 -5% | 0.44 -16% | 0.21 45% | 0.25 34% |
| Contrast | 955 | 1153 21% | 1225 28% | 1184 24% | 1219 28% | 1260 32% |
| Colorchecker dE 2000 * | 1.74 | 1.99 -14% | 1.08 38% | 1.74 -0% | 4.51 -159% | 2.26 -30% |
| Colorchecker dE 2000 max. * | 5.39 | 3.52 35% | 2.38 56% | 3.88 28% | 20.77 -285% | 7.37 -37% |
| Colorchecker dE 2000 calibrated * | 1.43 | 0.62 57% | 0.9 37% | 0.52 64% | 1.82 -27% | 1.03 28% |
| Greyscale dE 2000 * | 1.3 | 2.1 -62% | 1.1 15% | 3 -131% | 3.2 -146% | 4 -208% |
| Gamma | 2.235 98% | 2.32 95% | 2.13 103% | 2.164 102% | 2.08 106% | 2.116 104% |
| CCT | 6346 102% | 6369 102% | 6724 97% | 6816 95% | 6054 107% | 7570 86% |
| Total Average (Program / Settings) | 13% /
9% | 26% /
28% | 21% /
14% | -101% /
-79% | -55% /
-34% |
* ... smaller is better
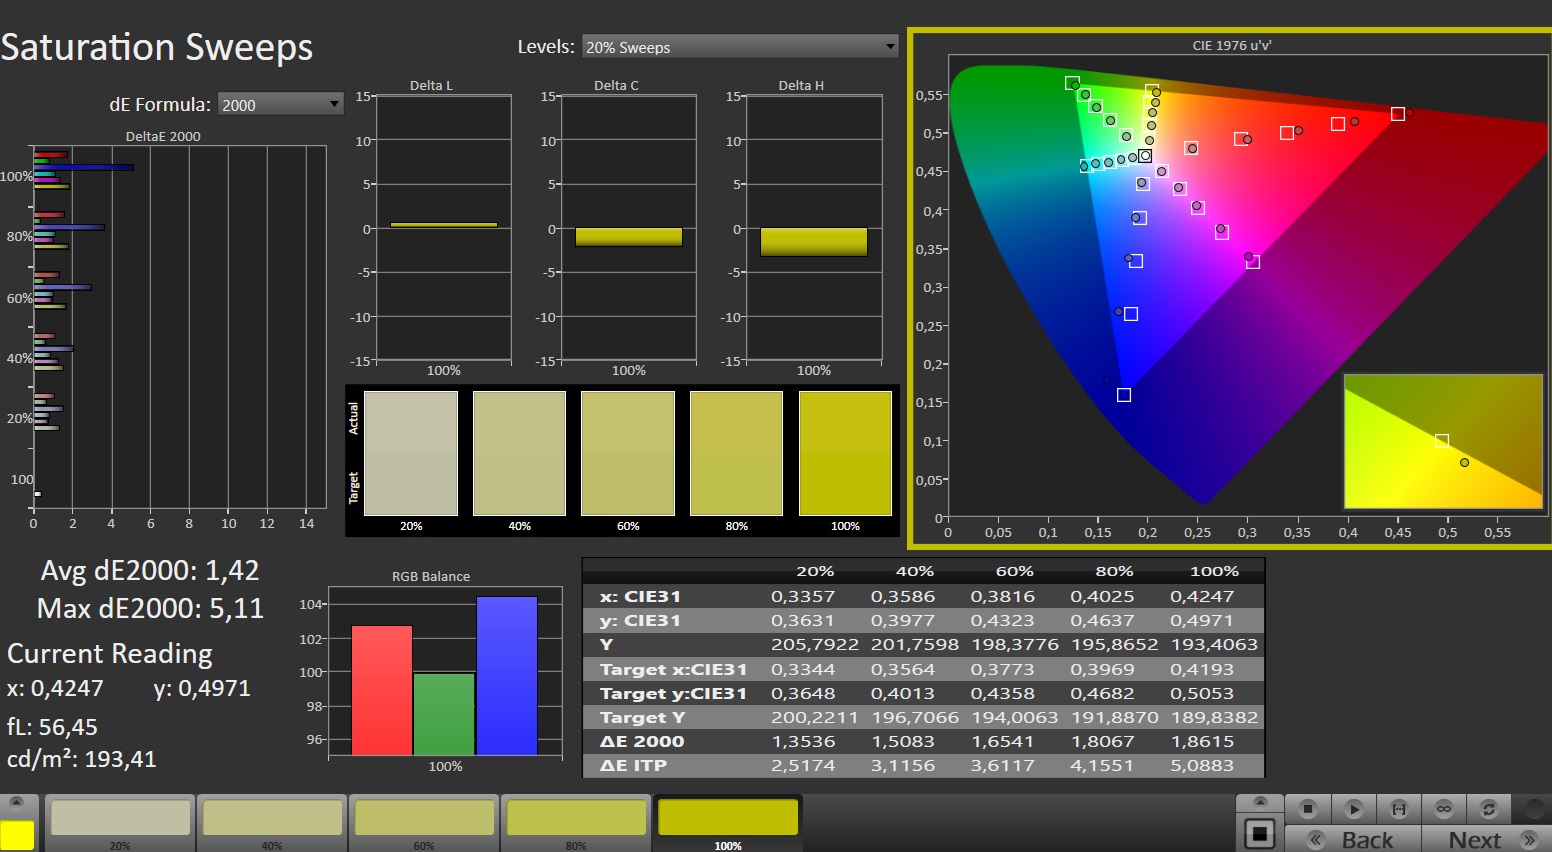
The color reproduction is okay even without an additional calibration. We only measure a higher deviation with blue color that could also be noticeable with the bare eye. In the other color areas including the grayscale, the color reproduction is almost perfect in the state of delivery.
After the calibration, there are no outliers anymore and the color accuracy is at a high level throughout.
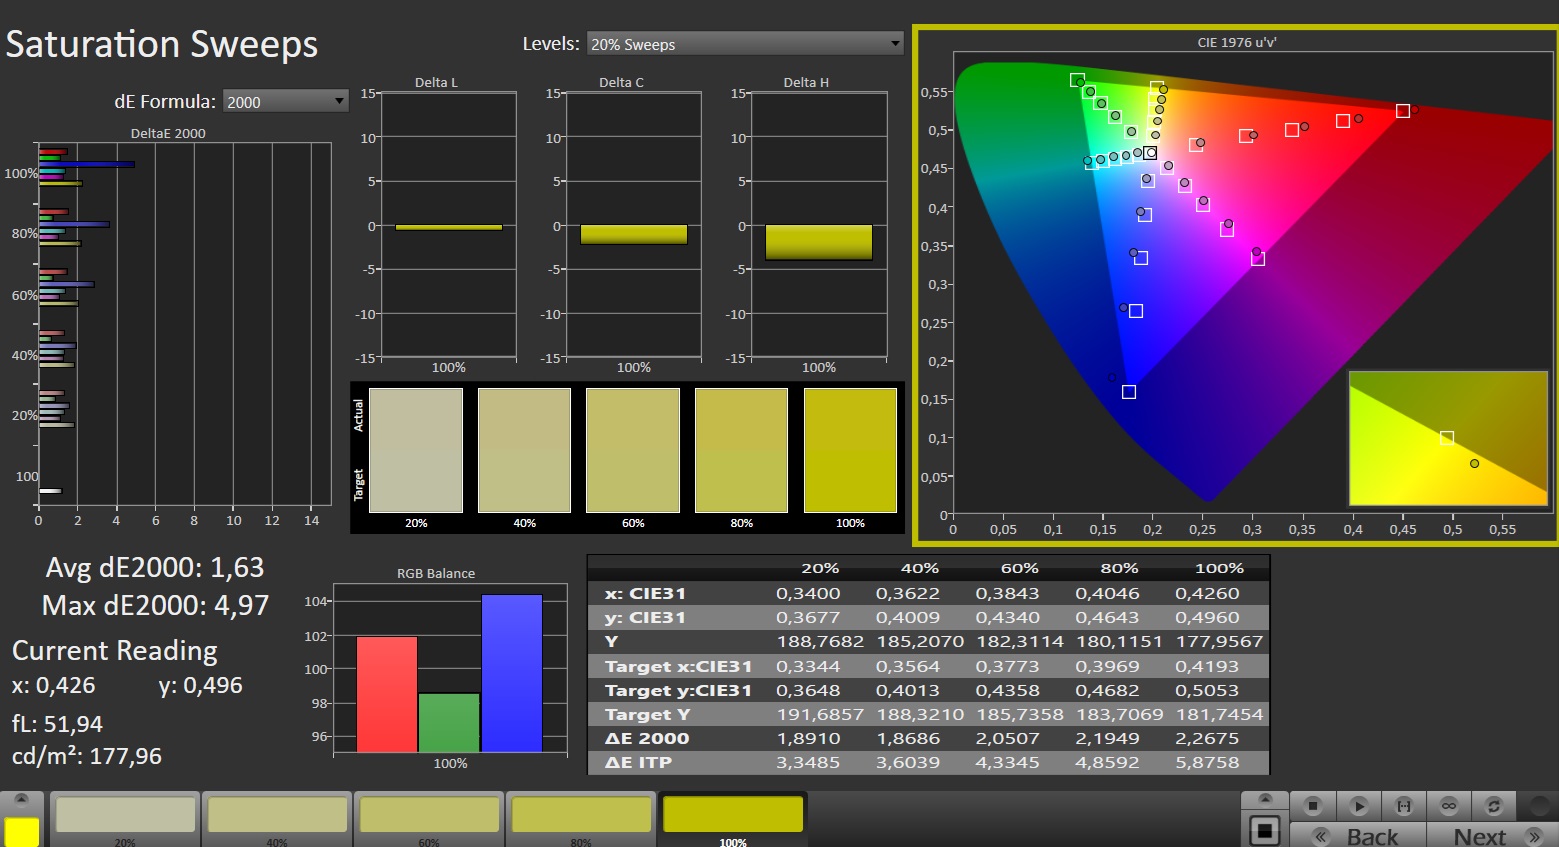
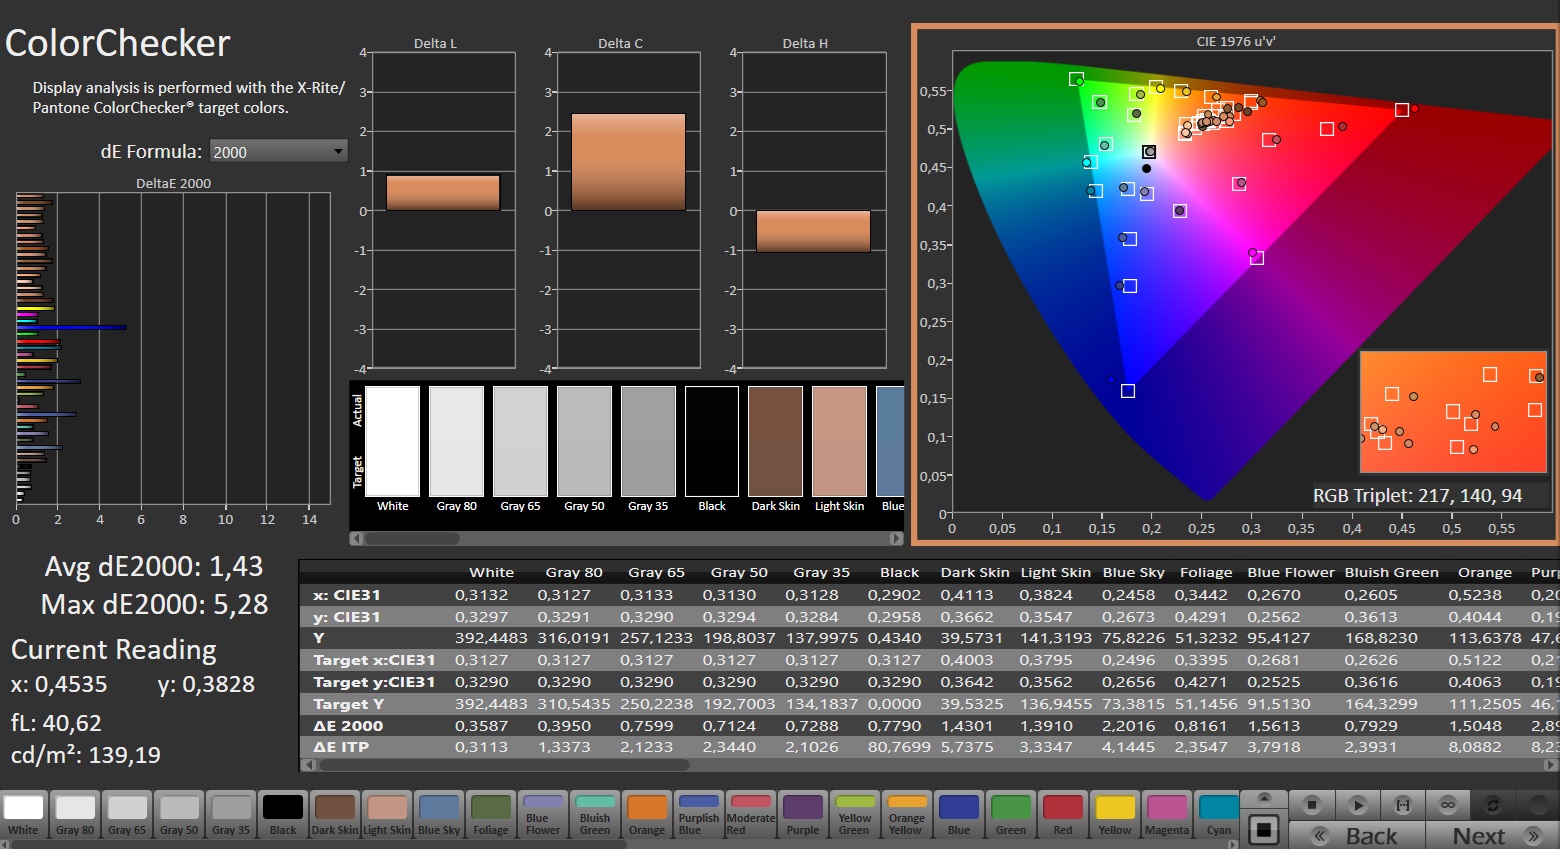
The sRGB color space, which is recommended for gaming, isn't covered completely. But that should hardly be noticeable in practice, and simpler displays show a third less colors. However, some competitors such as the Alienware m16 R2 are able to reach a full 100% with the same panel technology. If you want to do image and video processing on the side, such a display would be the better choice.
Display Response Times
| ↔ Response Time Black to White | ||
|---|---|---|
| 8.3 ms ... rise ↗ and fall ↘ combined | ↗ 3.5 ms rise | 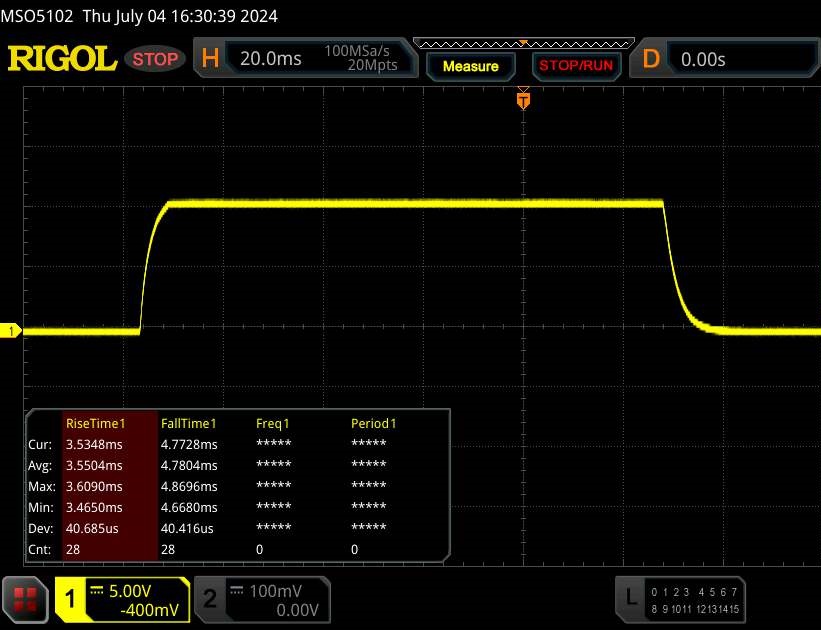 |
| ↘ 4.8 ms fall | ||
| The screen shows fast response rates in our tests and should be suited for gaming. In comparison, all tested devices range from 0.1 (minimum) to 240 (maximum) ms. » 21 % of all devices are better. This means that the measured response time is better than the average of all tested devices (20.5 ms). | ||
| ↔ Response Time 50% Grey to 80% Grey | ||
| 14.4 ms ... rise ↗ and fall ↘ combined | ↗ 6.8 ms rise | 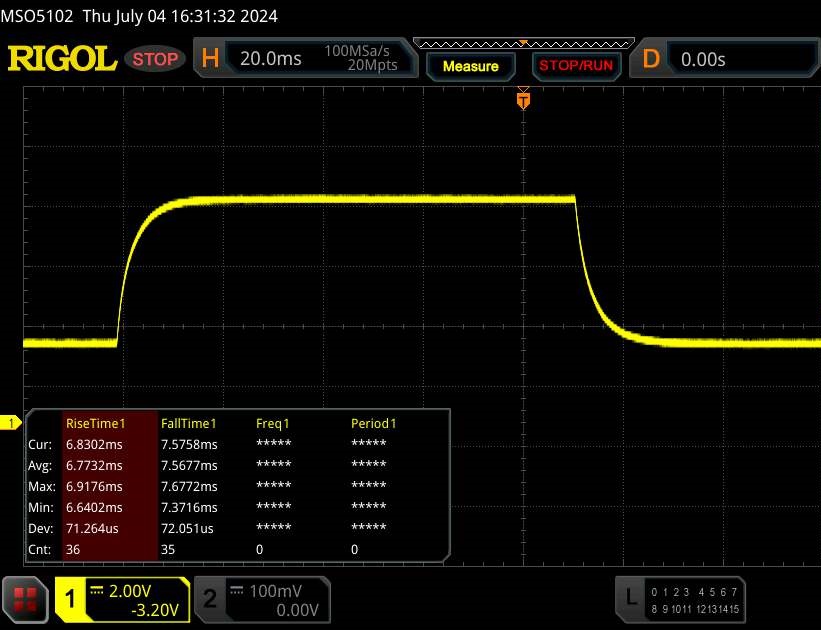 |
| ↘ 7.6 ms fall | ||
| The screen shows good response rates in our tests, but may be too slow for competitive gamers. In comparison, all tested devices range from 0.165 (minimum) to 636 (maximum) ms. » 26 % of all devices are better. This means that the measured response time is better than the average of all tested devices (32.1 ms). | ||
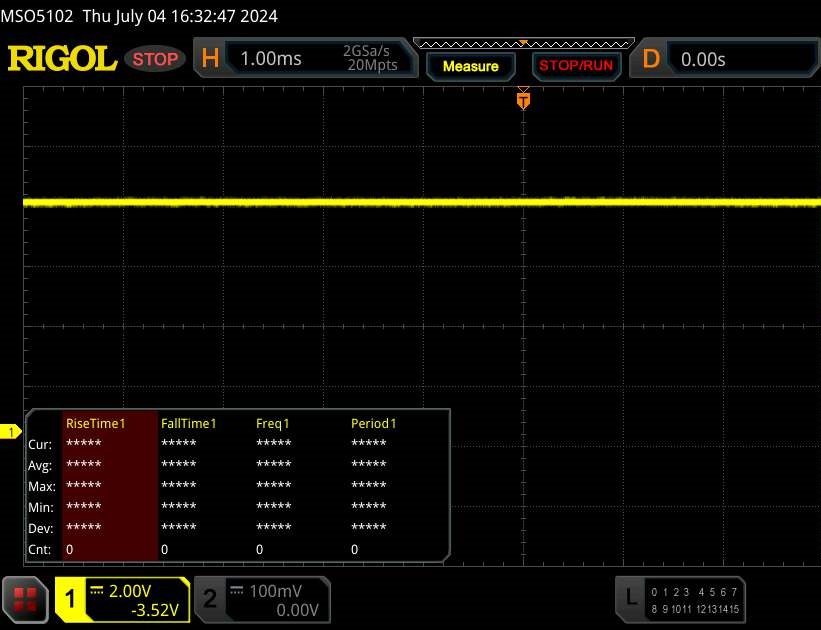
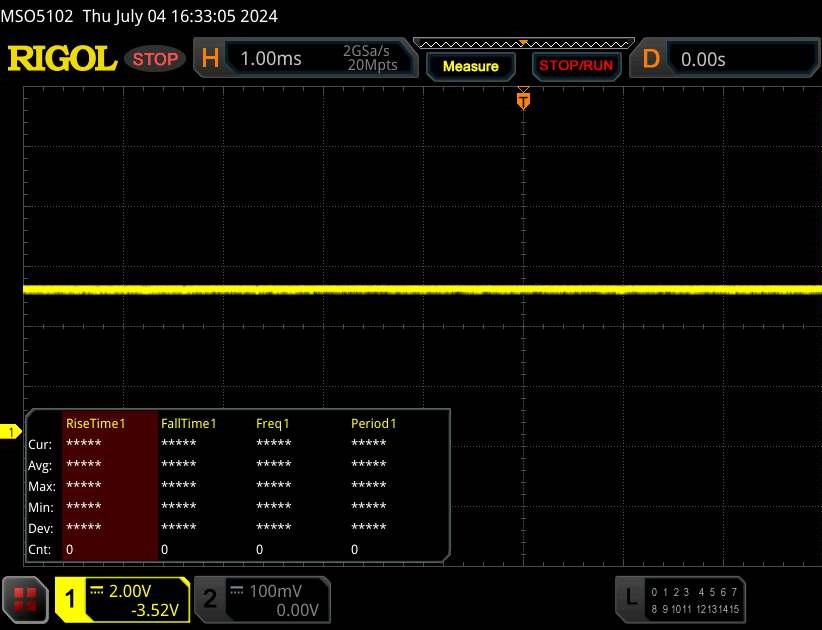
Screen Flickering / PWM (Pulse-Width Modulation)
| Screen flickering / PWM not detected | 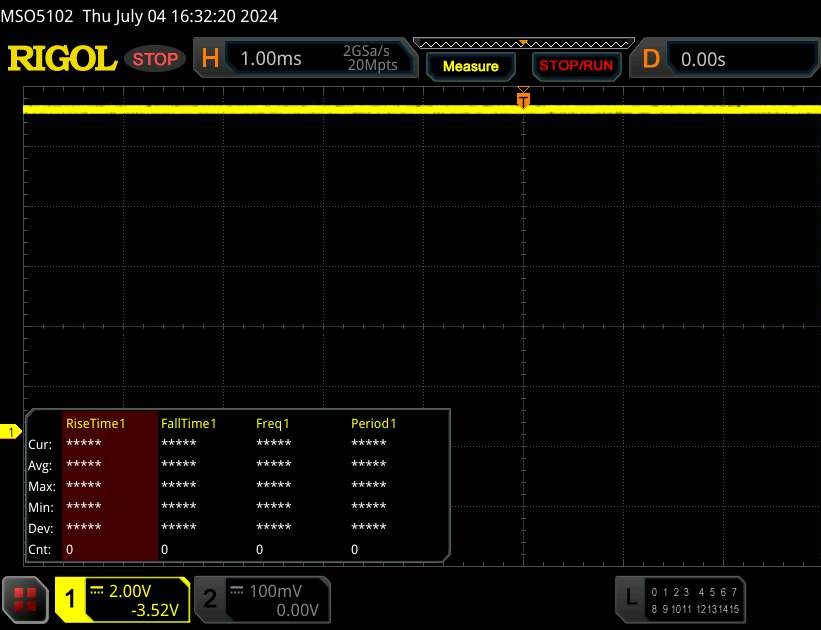 | ||
In comparison: 53 % of all tested devices do not use PWM to dim the display. If PWM was detected, an average of 8363 (minimum: 5 - maximum: 343500) Hz was measured. | |||
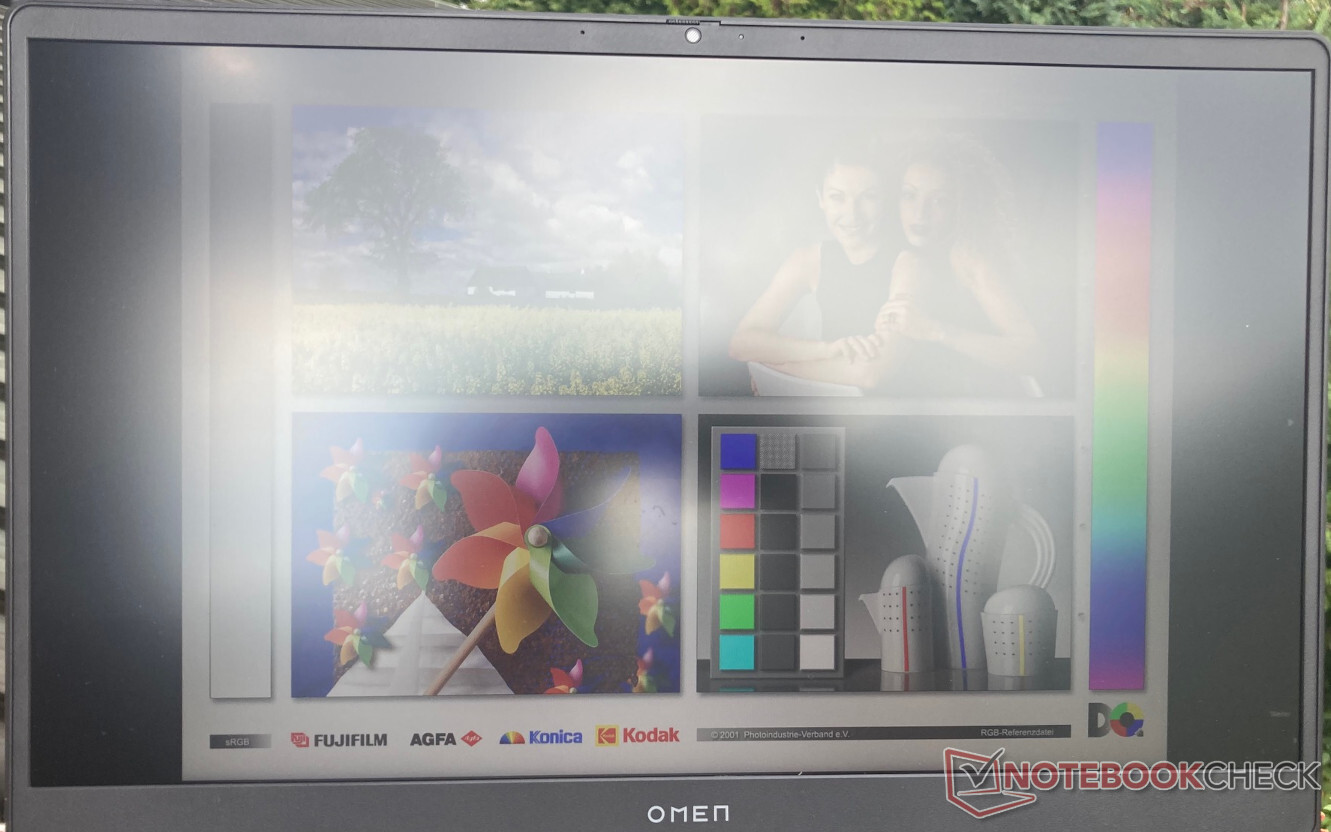
Outdoors, you should definitely sit in the shade if you still want to recognize anything on the screen. The limited brightness of the Omen 17 means that even the brightness of a slightly overcast sky can limit your ability to see anything on the display.
But the image looks pale even so. The colors have no vibrancy outdoors and are covered by a gray veil. If you want to enjoy gaming in colorful splendor, you have to play indoors.

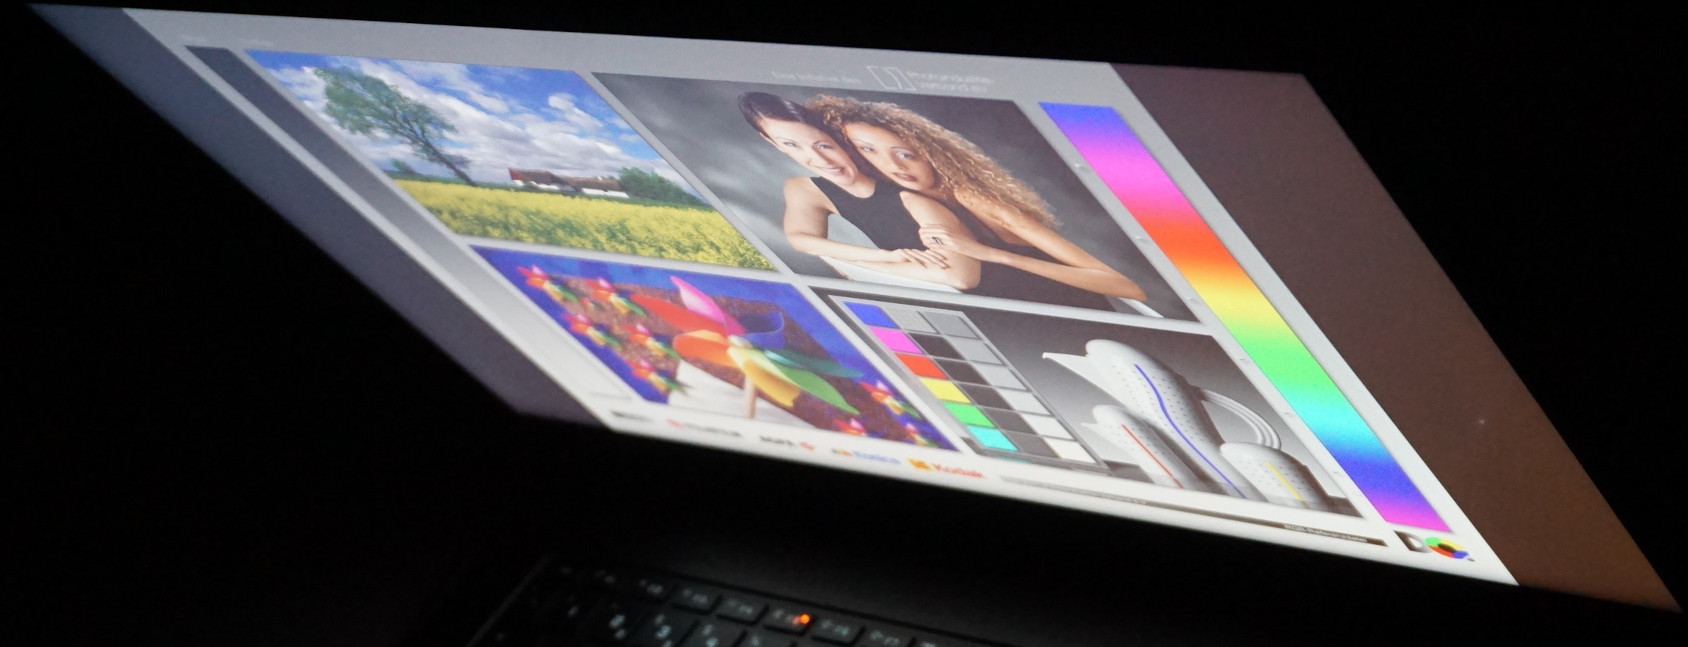
In contrast to what we usually see in an IPS panel, the HP Omen with QHD resolution shows some clearly noticeable color changes starting from viewing angles of about 45 degrees. Until then, the image remains easily recognizable, and we also don't notice any decrease in brightness before that point. Beyond 45 degrees all the colors show a slight yellow tint.


Performance - The Omen 17 is a balanced gaming laptop
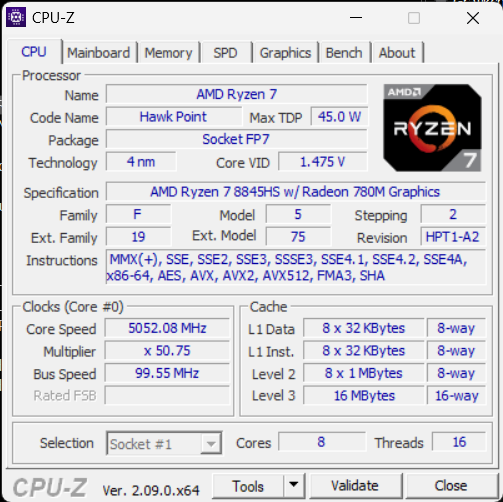
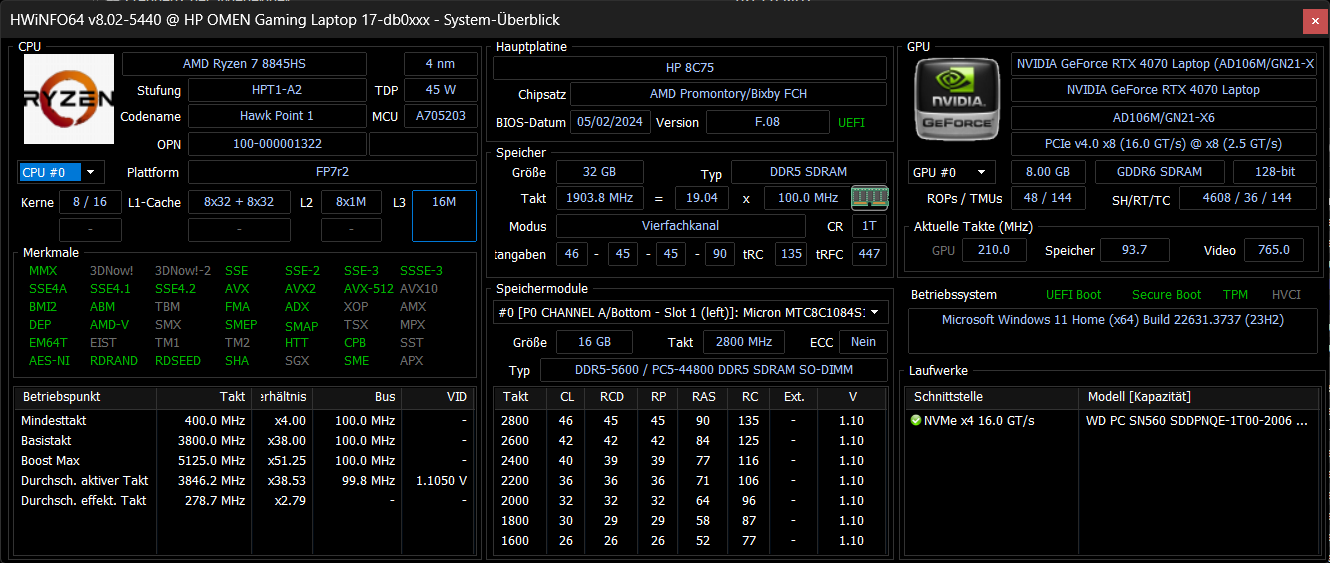
In terms of performance capabilities, our test unit with the AMD Ryzen 7 8845HS and Nvidia GeForce RTX 4070 places in the middle of the field of our comparison devices. However, both the CPU and GPU perform slightly below their maximum potential.
The Ryzen 7 runs constantly at 65 watts instead of 70 or even 80 watts as in the Schenker XMG Core 15, for example. The GPU is also slightly throttled and is only able to use 120 instead of the maximum possible 140 watts. Comparable gaming laptops such as the Asus TUF Gaming A17 FA707 are able to get a slightly higher performance from the graphics card, although that not only has advantages and won't necessarily lead to noticeably higher framerates.
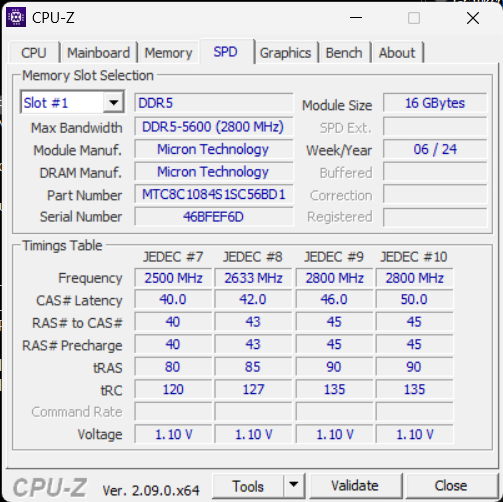
With 32 Gigabytes of DDR5-5600, the RAM equipment is also solid. Since the memory can be replaced easily, it is also possible to expand it later. At this level, we don't expect a limiting effect from the fact that it is only 5,600 MHz.
A smaller version of the HP Omen 17 with the RTX 4060 is also available.
Test Conditions
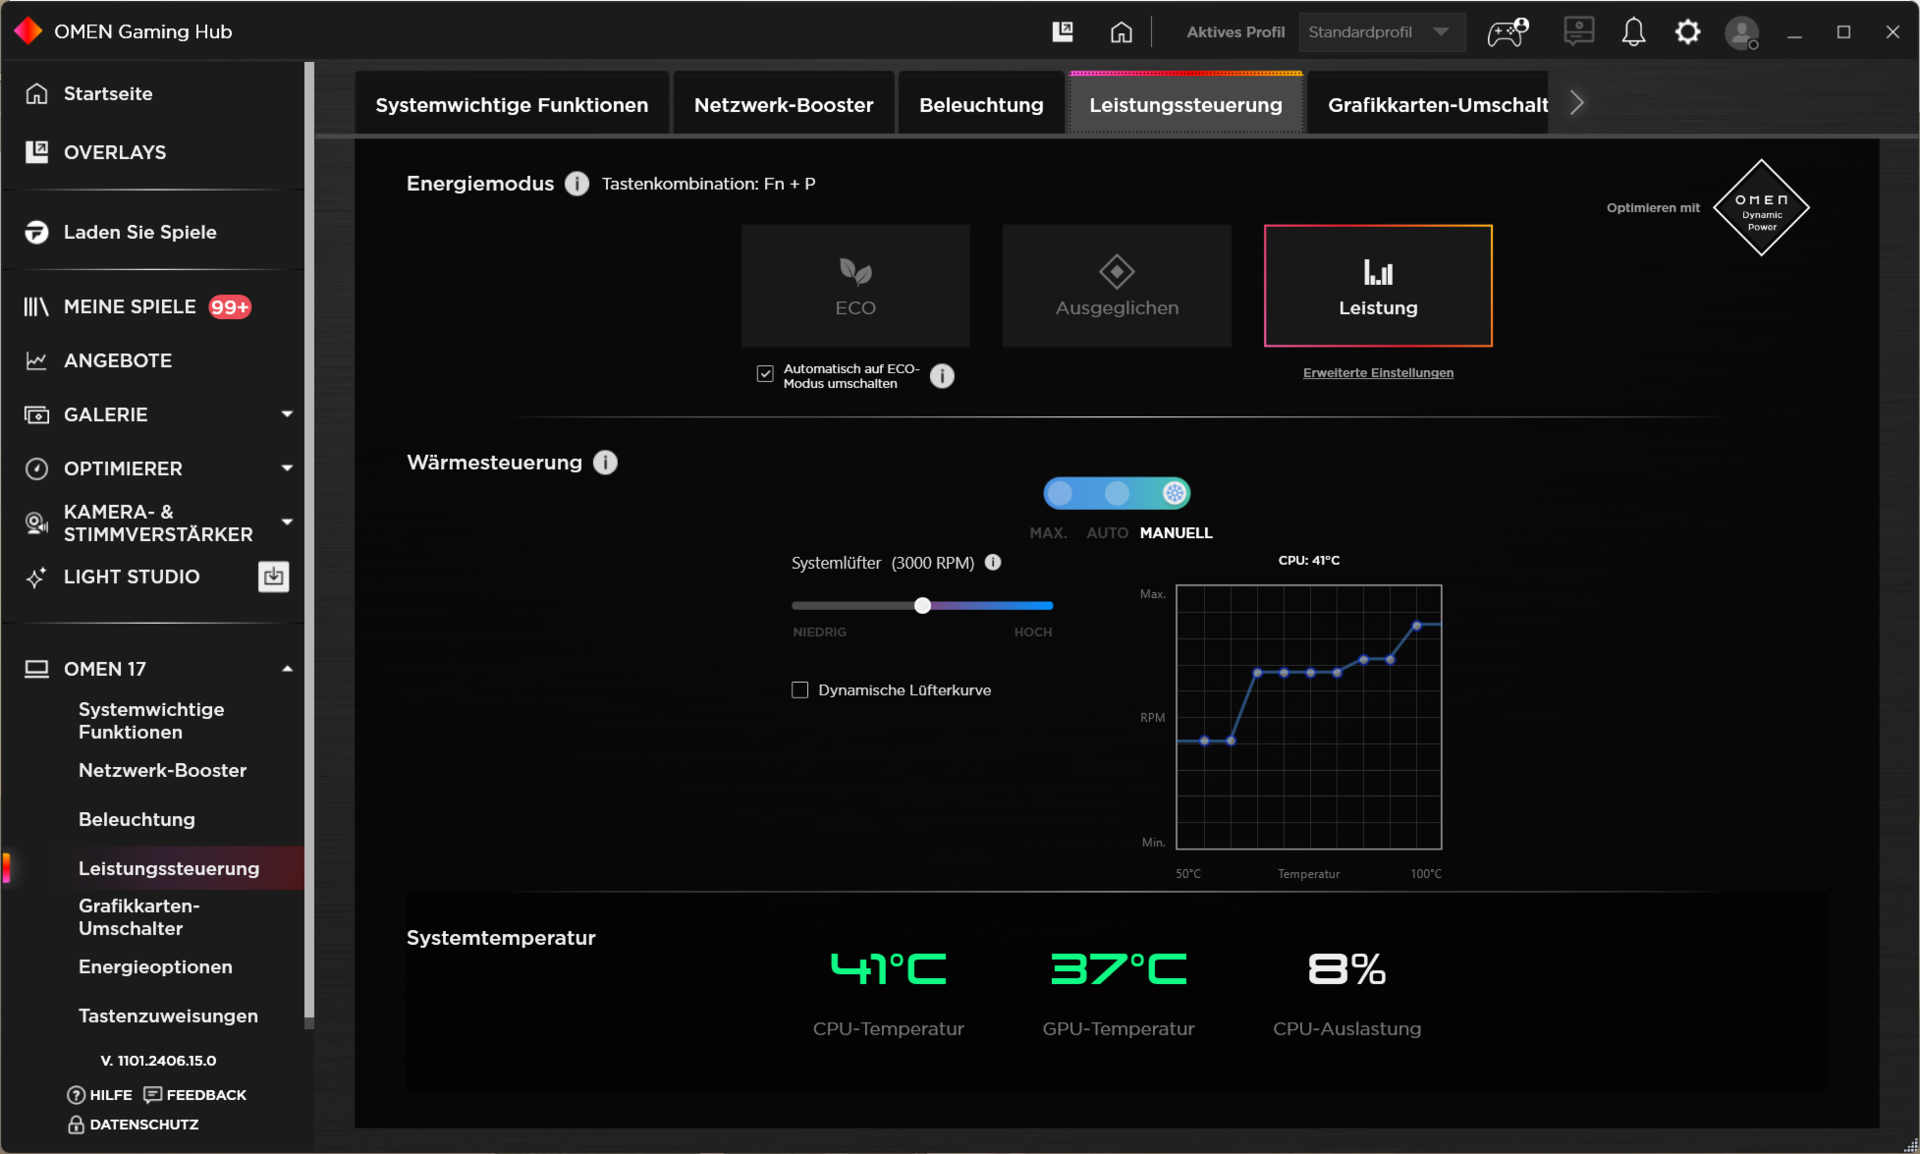
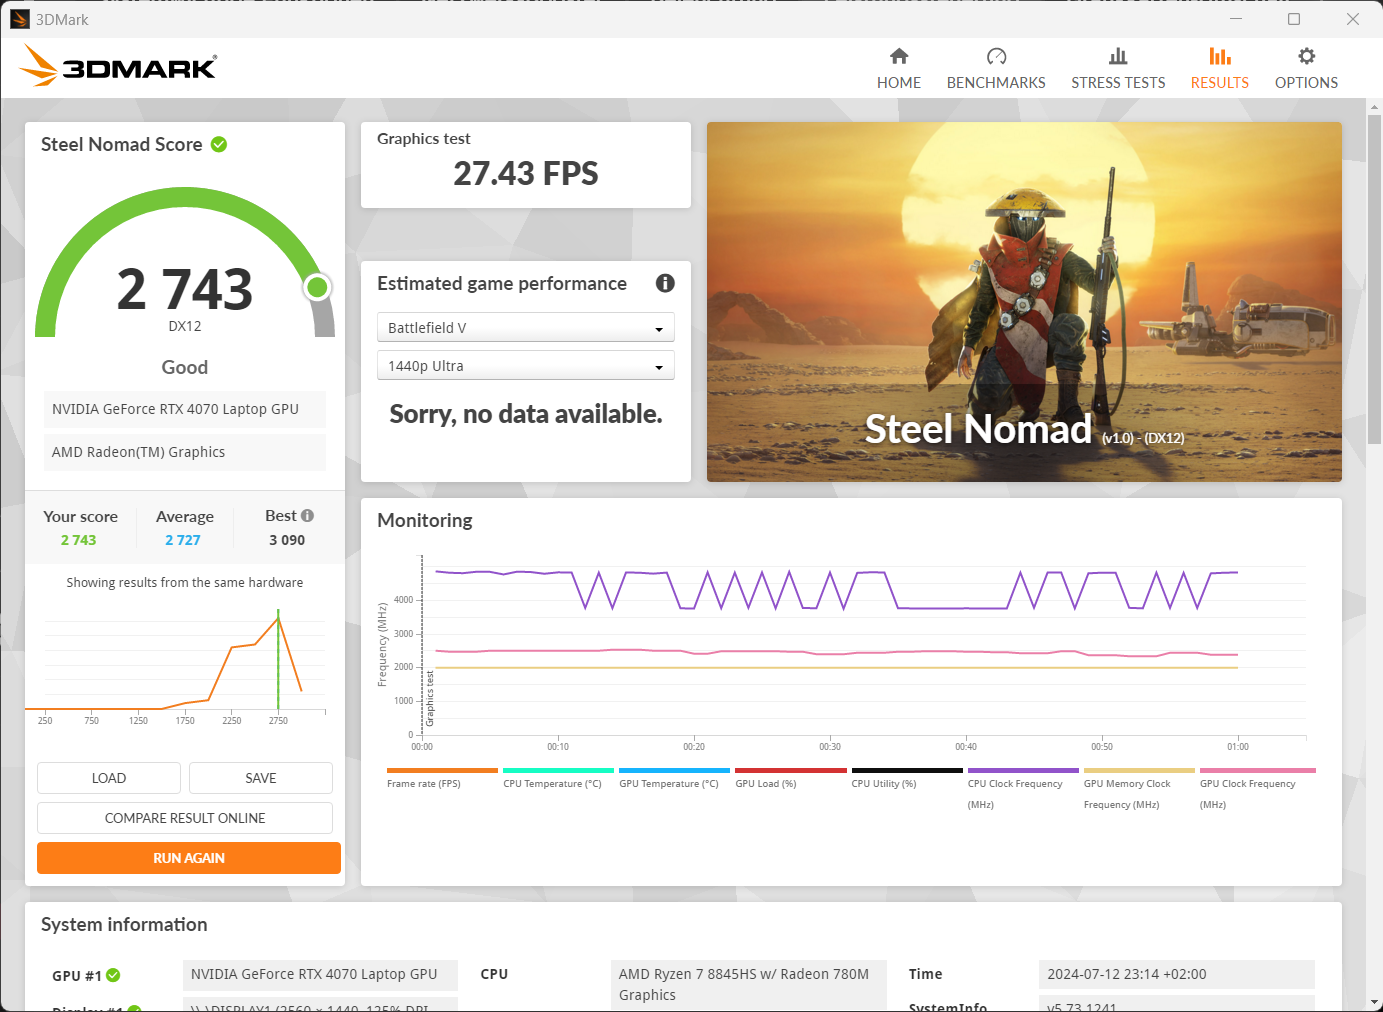
Three power profiles allow you to adjust the Omen 17 to most of the typical scenarios. You can find out the exact effect on the power consumption, fan behavior, and gaming performance from the table below.
We use the "Performance" profile for our benchmarks. In addition, you can make numerous adjustments that have a strong influence on the fan behavior. For example, the fan levels can be adjusted to be more powerful, or they could be reduced significantly even at the highest performance level, which would have an effect on the maximum performance.
| Power Profile | CPU load | GPU load (including 15 Watt boost) | Steel Nomad | Cyberpunk 2077 QHD Ultra | max. fan noise |
|---|---|---|---|---|---|
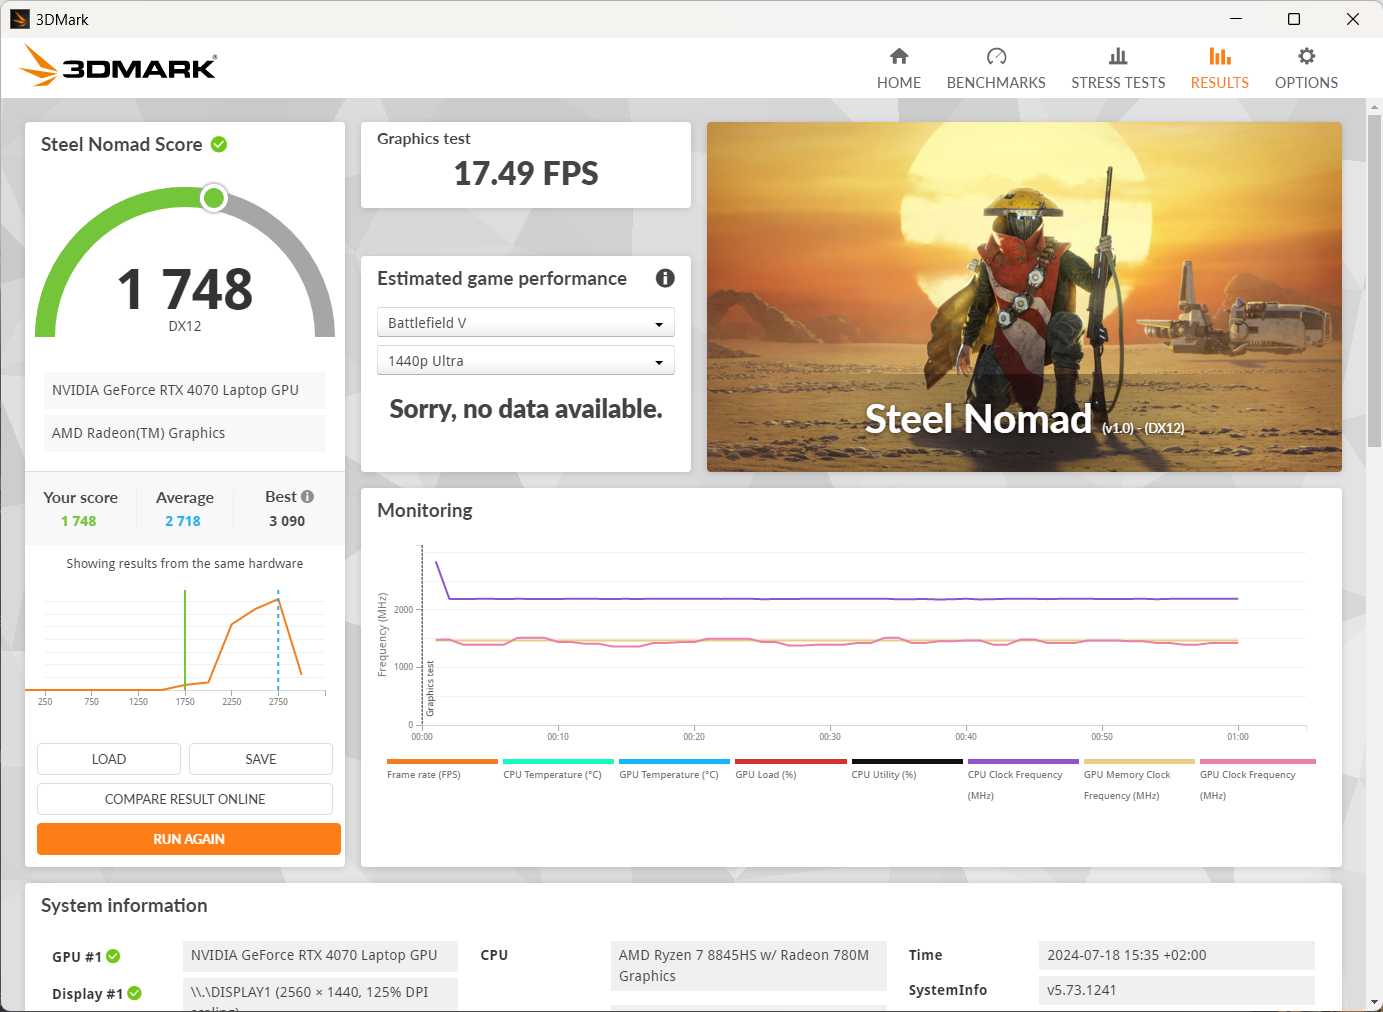
| Eco | 65->35 Watt | 40 Watt | 24.37 FPS | 60 FPS (Lock) | 41 dB(A) |
| Balanced | 65->35 Watt | 90 Watt | 25.23 FPS | 75 FPS | 43 dB(A) |
| Performance | 100->65 Watt | 120 Watt | 27.43 FPS | 80 FPS | 48 dB(A) |
Processor
The AMD Ryzen 7 8845HS is a fast processor from the Hawk Point series that uses the Zen 4 architecture and almost reaches the performance of the AMD Ryzen 9 7940HS of the previous generation. It also performs at about eye level with the Intel Core i7-13700H.
However, the eight identical cores in the Ryzen 7 are repeatedly able to gain a small advantage ahead of the six performance cores in the i7-13700H, particularly while gaming.
While we can almost always observe a slight drop in the constant performance with the competitors, the CPU is able to perform constantly at a good level here.
You can find additional measurements and test results of various processors in our CPU benchmark list.
Cinebench R15 Multi Constant Load Test
Cinebench R23: Multi Core | Single Core
Cinebench R20: CPU (Multi Core) | CPU (Single Core)
Cinebench R15: CPU Multi 64Bit | CPU Single 64Bit
Blender: v2.79 BMW27 CPU
7-Zip 18.03: 7z b 4 | 7z b 4 -mmt1
Geekbench 6.4: Multi-Core | Single-Core
Geekbench 5.5: Multi-Core | Single-Core
HWBOT x265 Benchmark v2.2: 4k Preset
LibreOffice : 20 Documents To PDF
R Benchmark 2.5: Overall mean
| CPU Performance Rating | |
| Asus ROG Strix Scar 16 G634JZR | |
| Acer Predator Helios Neo 16 (2024) | |
| Average of class Gaming | |
| Asus TUF Gaming A17 FA707XI-NS94 | |
| Asus TUF Gaming A15 FA507UV | |
| Alienware m16 R2 -1! | |
| Average AMD Ryzen 7 8845HS | |
| Tulpar T7 V20.6 | |
| HP Omen 17-db0079ng | |
| Cinebench R23 / Multi Core | |
| Asus ROG Strix Scar 16 G634JZR | |
| Average of class Gaming (5668 - 40970, n=148, last 2 years) | |
| Acer Predator Helios Neo 16 (2024) | |
| Alienware m16 R2 | |
| Tulpar T7 V20.6 | |
| Asus TUF Gaming A17 FA707XI-NS94 | |
| Asus TUF Gaming A15 FA507UV | |
| HP Omen 17-db0079ng | |
| Average AMD Ryzen 7 8845HS (14895 - 18037, n=13) | |
| Cinebench R23 / Single Core | |
| Asus ROG Strix Scar 16 G634JZR | |
| Acer Predator Helios Neo 16 (2024) | |
| Average of class Gaming (1136 - 2267, n=148, last 2 years) | |
| Tulpar T7 V20.6 | |
| Asus TUF Gaming A17 FA707XI-NS94 | |
| Asus TUF Gaming A15 FA507UV | |
| Average AMD Ryzen 7 8845HS (1623 - 1783, n=13) | |
| Alienware m16 R2 | |
| HP Omen 17-db0079ng | |
| Cinebench R20 / CPU (Multi Core) | |
| Asus ROG Strix Scar 16 G634JZR | |
| Average of class Gaming (2179 - 16108, n=148, last 2 years) | |
| Acer Predator Helios Neo 16 (2024) | |
| Alienware m16 R2 | |
| Tulpar T7 V20.6 | |
| Asus TUF Gaming A17 FA707XI-NS94 | |
| Asus TUF Gaming A15 FA507UV | |
| HP Omen 17-db0079ng | |
| Average AMD Ryzen 7 8845HS (5808 - 7026, n=13) | |
| Cinebench R20 / CPU (Single Core) | |
| Asus ROG Strix Scar 16 G634JZR | |
| Acer Predator Helios Neo 16 (2024) | |
| Average of class Gaming (439 - 870, n=148, last 2 years) | |
| Tulpar T7 V20.6 | |
| Asus TUF Gaming A17 FA707XI-NS94 | |
| Average AMD Ryzen 7 8845HS (673 - 698, n=13) | |
| HP Omen 17-db0079ng | |
| Alienware m16 R2 | |
| Asus TUF Gaming A15 FA507UV | |
| Cinebench R15 / CPU Multi 64Bit | |
| Asus ROG Strix Scar 16 G634JZR | |
| Average of class Gaming (1537 - 6271, n=150, last 2 years) | |
| Acer Predator Helios Neo 16 (2024) | |
| Alienware m16 R2 | |
| Asus TUF Gaming A17 FA707XI-NS94 | |
| Asus TUF Gaming A15 FA507UV | |
| Tulpar T7 V20.6 | |
| HP Omen 17-db0079ng | |
| Average AMD Ryzen 7 8845HS (2342 - 2908, n=13) | |
| Cinebench R15 / CPU Single 64Bit | |
| Asus ROG Strix Scar 16 G634JZR | |
| Acer Predator Helios Neo 16 (2024) | |
| Asus TUF Gaming A17 FA707XI-NS94 | |
| Average of class Gaming (191.9 - 343, n=148, last 2 years) | |
| Asus TUF Gaming A15 FA507UV | |
| Tulpar T7 V20.6 | |
| Average AMD Ryzen 7 8845HS (269 - 283, n=13) | |
| HP Omen 17-db0079ng | |
| Alienware m16 R2 | |
| Blender / v2.79 BMW27 CPU | |
| Average AMD Ryzen 7 8845HS (179 - 216, n=13) | |
| HP Omen 17-db0079ng | |
| Asus TUF Gaming A17 FA707XI-NS94 | |
| Asus TUF Gaming A15 FA507UV | |
| Tulpar T7 V20.6 | |
| Average of class Gaming (80 - 517, n=143, last 2 years) | |
| Acer Predator Helios Neo 16 (2024) | |
| Asus ROG Strix Scar 16 G634JZR | |
| 7-Zip 18.03 / 7z b 4 | |
| Asus ROG Strix Scar 16 G634JZR | |
| Acer Predator Helios Neo 16 (2024) | |
| Average of class Gaming (23795 - 148086, n=146, last 2 years) | |
| Asus TUF Gaming A15 FA507UV | |
| Asus TUF Gaming A17 FA707XI-NS94 | |
| Average AMD Ryzen 7 8845HS (62669 - 74664, n=13) | |
| Alienware m16 R2 | |
| HP Omen 17-db0079ng | |
| Tulpar T7 V20.6 | |
| 7-Zip 18.03 / 7z b 4 -mmt1 | |
| Asus ROG Strix Scar 16 G634JZR | |
| Acer Predator Helios Neo 16 (2024) | |
| Asus TUF Gaming A17 FA707XI-NS94 | |
| Asus TUF Gaming A15 FA507UV | |
| Average of class Gaming (4199 - 7573, n=146, last 2 years) | |
| Average AMD Ryzen 7 8845HS (5197 - 6714, n=13) | |
| Tulpar T7 V20.6 | |
| HP Omen 17-db0079ng | |
| Alienware m16 R2 | |
| Geekbench 6.4 / Multi-Core | |
| Asus ROG Strix Scar 16 G634JZR | |
| Acer Predator Helios Neo 16 (2024) | |
| Average of class Gaming (5340 - 22104, n=140, last 2 years) | |
| Average AMD Ryzen 7 8845HS (11073 - 14014, n=18) | |
| HP Omen 17-db0079ng | |
| Alienware m16 R2 | |
| Asus TUF Gaming A15 FA507UV | |
| Asus TUF Gaming A17 FA707XI-NS94 | |
| Tulpar T7 V20.6 | |
| Geekbench 6.4 / Single-Core | |
| Asus ROG Strix Scar 16 G634JZR | |
| Acer Predator Helios Neo 16 (2024) | |
| Average of class Gaming (1490 - 3219, n=140, last 2 years) | |
| Asus TUF Gaming A17 FA707XI-NS94 | |
| Asus TUF Gaming A15 FA507UV | |
| Average AMD Ryzen 7 8845HS (2510 - 2698, n=16) | |
| Tulpar T7 V20.6 | |
| HP Omen 17-db0079ng | |
| Alienware m16 R2 | |
| Geekbench 5.5 / Multi-Core | |
| Asus ROG Strix Scar 16 G634JZR | |
| Acer Predator Helios Neo 16 (2024) | |
| Average of class Gaming (4557 - 27010, n=145, last 2 years) | |
| Alienware m16 R2 | |
| Asus TUF Gaming A15 FA507UV | |
| Average AMD Ryzen 7 8845HS (11256 - 12726, n=15) | |
| HP Omen 17-db0079ng | |
| Asus TUF Gaming A17 FA707XI-NS94 | |
| Tulpar T7 V20.6 | |
| Geekbench 5.5 / Single-Core | |
| Asus ROG Strix Scar 16 G634JZR | |
| Acer Predator Helios Neo 16 (2024) | |
| Asus TUF Gaming A17 FA707XI-NS94 | |
| Asus TUF Gaming A15 FA507UV | |
| Average of class Gaming (986 - 2423, n=145, last 2 years) | |
| Average AMD Ryzen 7 8845HS (1765 - 2004, n=15) | |
| Tulpar T7 V20.6 | |
| HP Omen 17-db0079ng | |
| Alienware m16 R2 | |
| HWBOT x265 Benchmark v2.2 / 4k Preset | |
| Asus ROG Strix Scar 16 G634JZR | |
| Average of class Gaming (7.7 - 44.3, n=146, last 2 years) | |
| Acer Predator Helios Neo 16 (2024) | |
| Asus TUF Gaming A15 FA507UV | |
| Asus TUF Gaming A17 FA707XI-NS94 | |
| Alienware m16 R2 | |
| Average AMD Ryzen 7 8845HS (18.6 - 22.7, n=13) | |
| HP Omen 17-db0079ng | |
| Tulpar T7 V20.6 | |
| LibreOffice / 20 Documents To PDF | |
| HP Omen 17-db0079ng | |
| Tulpar T7 V20.6 | |
| Average AMD Ryzen 7 8845HS (44.4 - 77, n=13) | |
| Alienware m16 R2 | |
| Asus TUF Gaming A17 FA707XI-NS94 | |
| Asus ROG Strix Scar 16 G634JZR | |
| Average of class Gaming (19 - 96.6, n=144, last 2 years) | |
| Asus TUF Gaming A15 FA507UV | |
| Acer Predator Helios Neo 16 (2024) | |
| R Benchmark 2.5 / Overall mean | |
| HP Omen 17-db0079ng | |
| Alienware m16 R2 | |
| Average AMD Ryzen 7 8845HS (0.4304 - 0.4935, n=13) | |
| Tulpar T7 V20.6 | |
| Average of class Gaming (0.3551 - 0.759, n=147, last 2 years) | |
| Asus TUF Gaming A15 FA507UV | |
| Asus TUF Gaming A17 FA707XI-NS94 | |
| Acer Predator Helios Neo 16 (2024) | |
| Asus ROG Strix Scar 16 G634JZR | |
* ... smaller is better
AIDA64: FP32 Ray-Trace | FPU Julia | CPU SHA3 | CPU Queen | FPU SinJulia | FPU Mandel | CPU AES | CPU ZLib | FP64 Ray-Trace | CPU PhotoWorxx
| Performance Rating | |
| Asus ROG Strix Scar 16 G634JZR | |
| Average of class Gaming | |
| Asus TUF Gaming A15 FA507UV | |
| Asus TUF Gaming A17 FA707XI-NS94 | |
| Acer Predator Helios Neo 16 (2024) | |
| HP Omen 17-db0079ng | |
| Average AMD Ryzen 7 8845HS | |
| Alienware m16 R2 | |
| Tulpar T7 V20.6 | |
| AIDA64 / FP32 Ray-Trace | |
| Asus TUF Gaming A17 FA707XI-NS94 | |
| Asus TUF Gaming A15 FA507UV | |
| HP Omen 17-db0079ng | |
| Asus ROG Strix Scar 16 G634JZR | |
| Average of class Gaming (7192 - 85542, n=145, last 2 years) | |
| Average AMD Ryzen 7 8845HS (23708 - 29544, n=13) | |
| Acer Predator Helios Neo 16 (2024) | |
| Alienware m16 R2 | |
| Tulpar T7 V20.6 | |
| AIDA64 / FPU Julia | |
| Asus ROG Strix Scar 16 G634JZR | |
| Asus TUF Gaming A17 FA707XI-NS94 | |
| Asus TUF Gaming A15 FA507UV | |
| Average of class Gaming (35040 - 252486, n=145, last 2 years) | |
| HP Omen 17-db0079ng | |
| Average AMD Ryzen 7 8845HS (99659 - 125873, n=13) | |
| Acer Predator Helios Neo 16 (2024) | |
| Alienware m16 R2 | |
| Tulpar T7 V20.6 | |
| AIDA64 / CPU SHA3 | |
| Asus ROG Strix Scar 16 G634JZR | |
| Average of class Gaming (1728 - 10389, n=145, last 2 years) | |
| Asus TUF Gaming A17 FA707XI-NS94 | |
| Asus TUF Gaming A15 FA507UV | |
| Acer Predator Helios Neo 16 (2024) | |
| HP Omen 17-db0079ng | |
| Average AMD Ryzen 7 8845HS (4332 - 5180, n=13) | |
| Alienware m16 R2 | |
| Tulpar T7 V20.6 | |
| AIDA64 / CPU Queen | |
| Acer Predator Helios Neo 16 (2024) | |
| Asus ROG Strix Scar 16 G634JZR | |
| Asus TUF Gaming A15 FA507UV | |
| Asus TUF Gaming A17 FA707XI-NS94 | |
| Average of class Gaming (50699 - 200651, n=145, last 2 years) | |
| Average AMD Ryzen 7 8845HS (109458 - 124695, n=13) | |
| HP Omen 17-db0079ng | |
| Tulpar T7 V20.6 | |
| Alienware m16 R2 | |
| AIDA64 / FPU SinJulia | |
| Asus ROG Strix Scar 16 G634JZR | |
| Asus TUF Gaming A15 FA507UV | |
| Asus TUF Gaming A17 FA707XI-NS94 | |
| HP Omen 17-db0079ng | |
| Average AMD Ryzen 7 8845HS (14062 - 15519, n=13) | |
| Average of class Gaming (5020 - 33636, n=145, last 2 years) | |
| Acer Predator Helios Neo 16 (2024) | |
| Tulpar T7 V20.6 | |
| Alienware m16 R2 | |
| AIDA64 / FPU Mandel | |
| Asus TUF Gaming A17 FA707XI-NS94 | |
| Asus TUF Gaming A15 FA507UV | |
| Asus ROG Strix Scar 16 G634JZR | |
| Average of class Gaming (17585 - 134044, n=145, last 2 years) | |
| HP Omen 17-db0079ng | |
| Average AMD Ryzen 7 8845HS (53436 - 67367, n=13) | |
| Acer Predator Helios Neo 16 (2024) | |
| Alienware m16 R2 | |
| Tulpar T7 V20.6 | |
| AIDA64 / CPU AES | |
| Asus ROG Strix Scar 16 G634JZR | |
| Average of class Gaming (19065 - 328679, n=145, last 2 years) | |
| Acer Predator Helios Neo 16 (2024) | |
| Average AMD Ryzen 7 8845HS (64515 - 172642, n=13) | |
| Asus TUF Gaming A17 FA707XI-NS94 | |
| Asus TUF Gaming A15 FA507UV | |
| HP Omen 17-db0079ng | |
| Alienware m16 R2 | |
| Tulpar T7 V20.6 | |
| AIDA64 / CPU ZLib | |
| Asus ROG Strix Scar 16 G634JZR | |
| Acer Predator Helios Neo 16 (2024) | |
| Average of class Gaming (373 - 2531, n=145, last 2 years) | |
| Alienware m16 R2 | |
| Tulpar T7 V20.6 | |
| Asus TUF Gaming A17 FA707XI-NS94 | |
| Asus TUF Gaming A15 FA507UV | |
| HP Omen 17-db0079ng | |
| Average AMD Ryzen 7 8845HS (627 - 1080, n=13) | |
| AIDA64 / FP64 Ray-Trace | |
| Asus TUF Gaming A17 FA707XI-NS94 | |
| Asus TUF Gaming A15 FA507UV | |
| HP Omen 17-db0079ng | |
| Asus ROG Strix Scar 16 G634JZR | |
| Average of class Gaming (3856 - 45446, n=145, last 2 years) | |
| Average AMD Ryzen 7 8845HS (12361 - 15911, n=13) | |
| Acer Predator Helios Neo 16 (2024) | |
| Alienware m16 R2 | |
| Tulpar T7 V20.6 | |
| AIDA64 / CPU PhotoWorxx | |
| Asus ROG Strix Scar 16 G634JZR | |
| Acer Predator Helios Neo 16 (2024) | |
| Average of class Gaming (10805 - 62916, n=145, last 2 years) | |
| HP Omen 17-db0079ng | |
| Alienware m16 R2 | |
| Average AMD Ryzen 7 8845HS (33192 - 41668, n=13) | |
| Asus TUF Gaming A15 FA507UV | |
| Asus TUF Gaming A17 FA707XI-NS94 | |
| Tulpar T7 V20.6 | |
System Performance
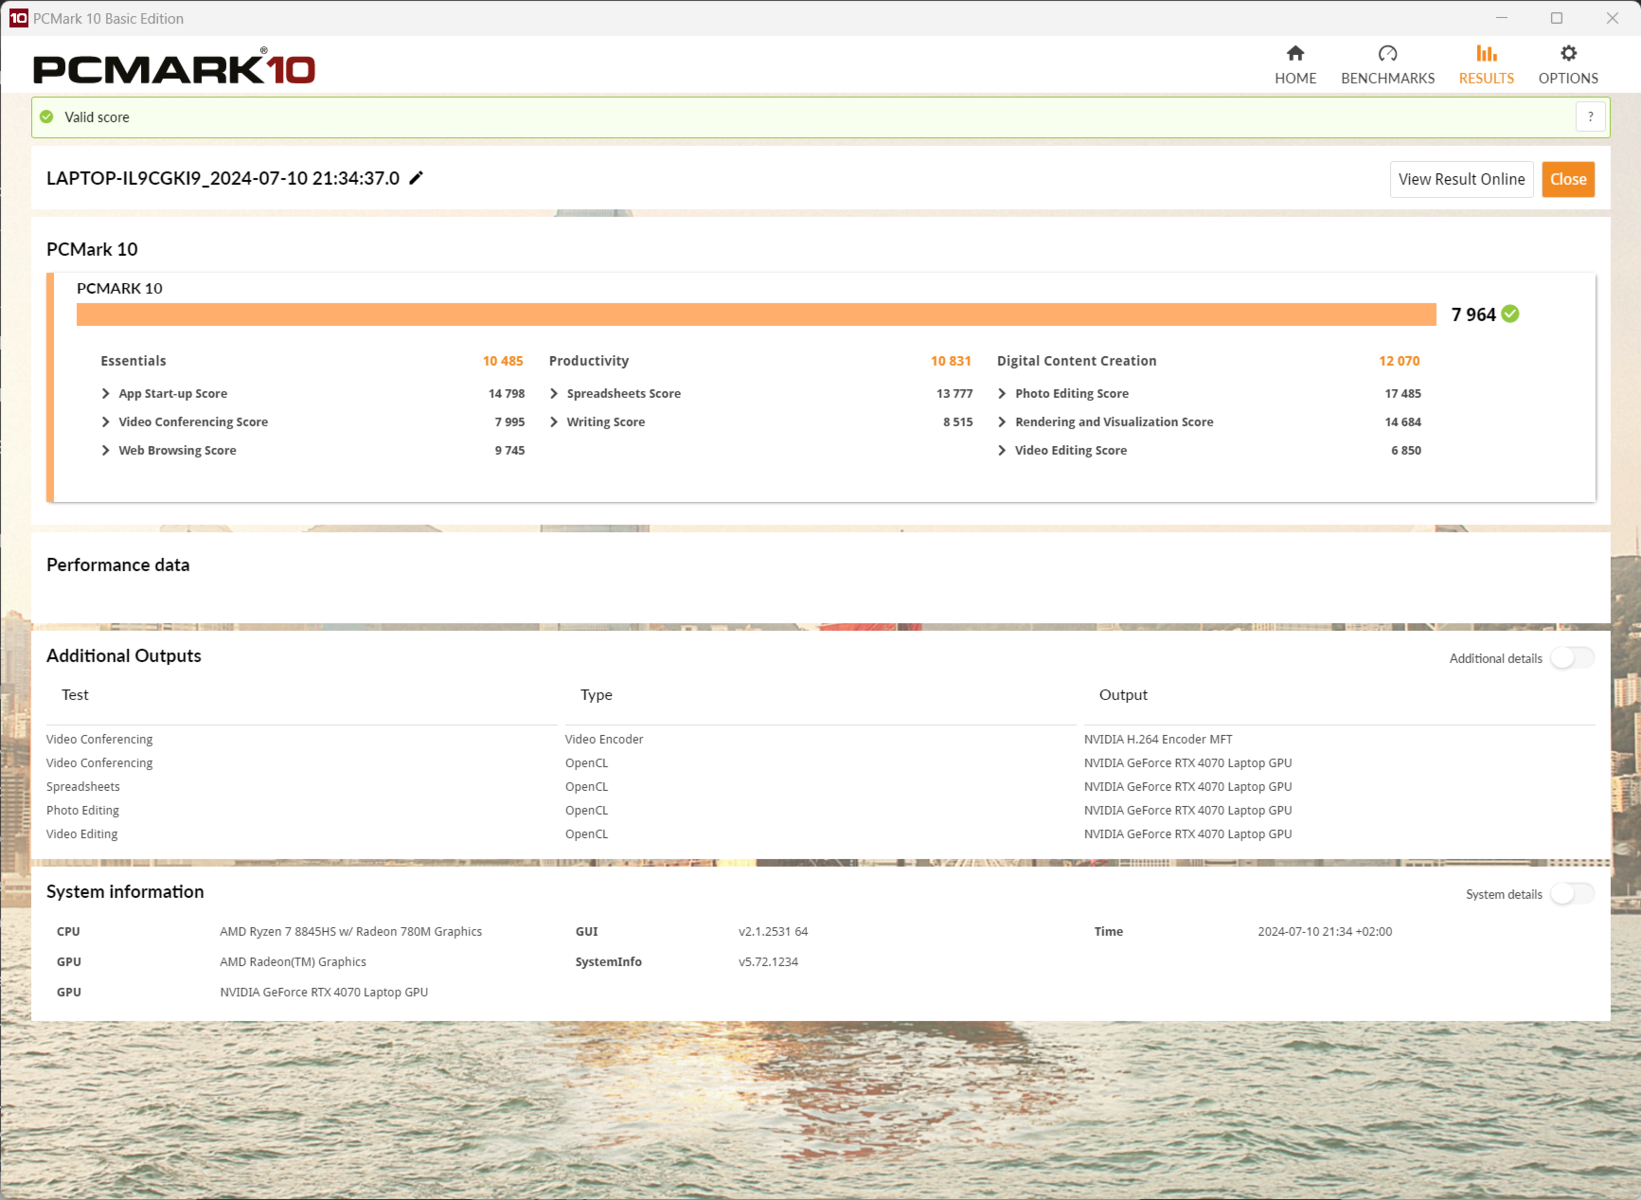
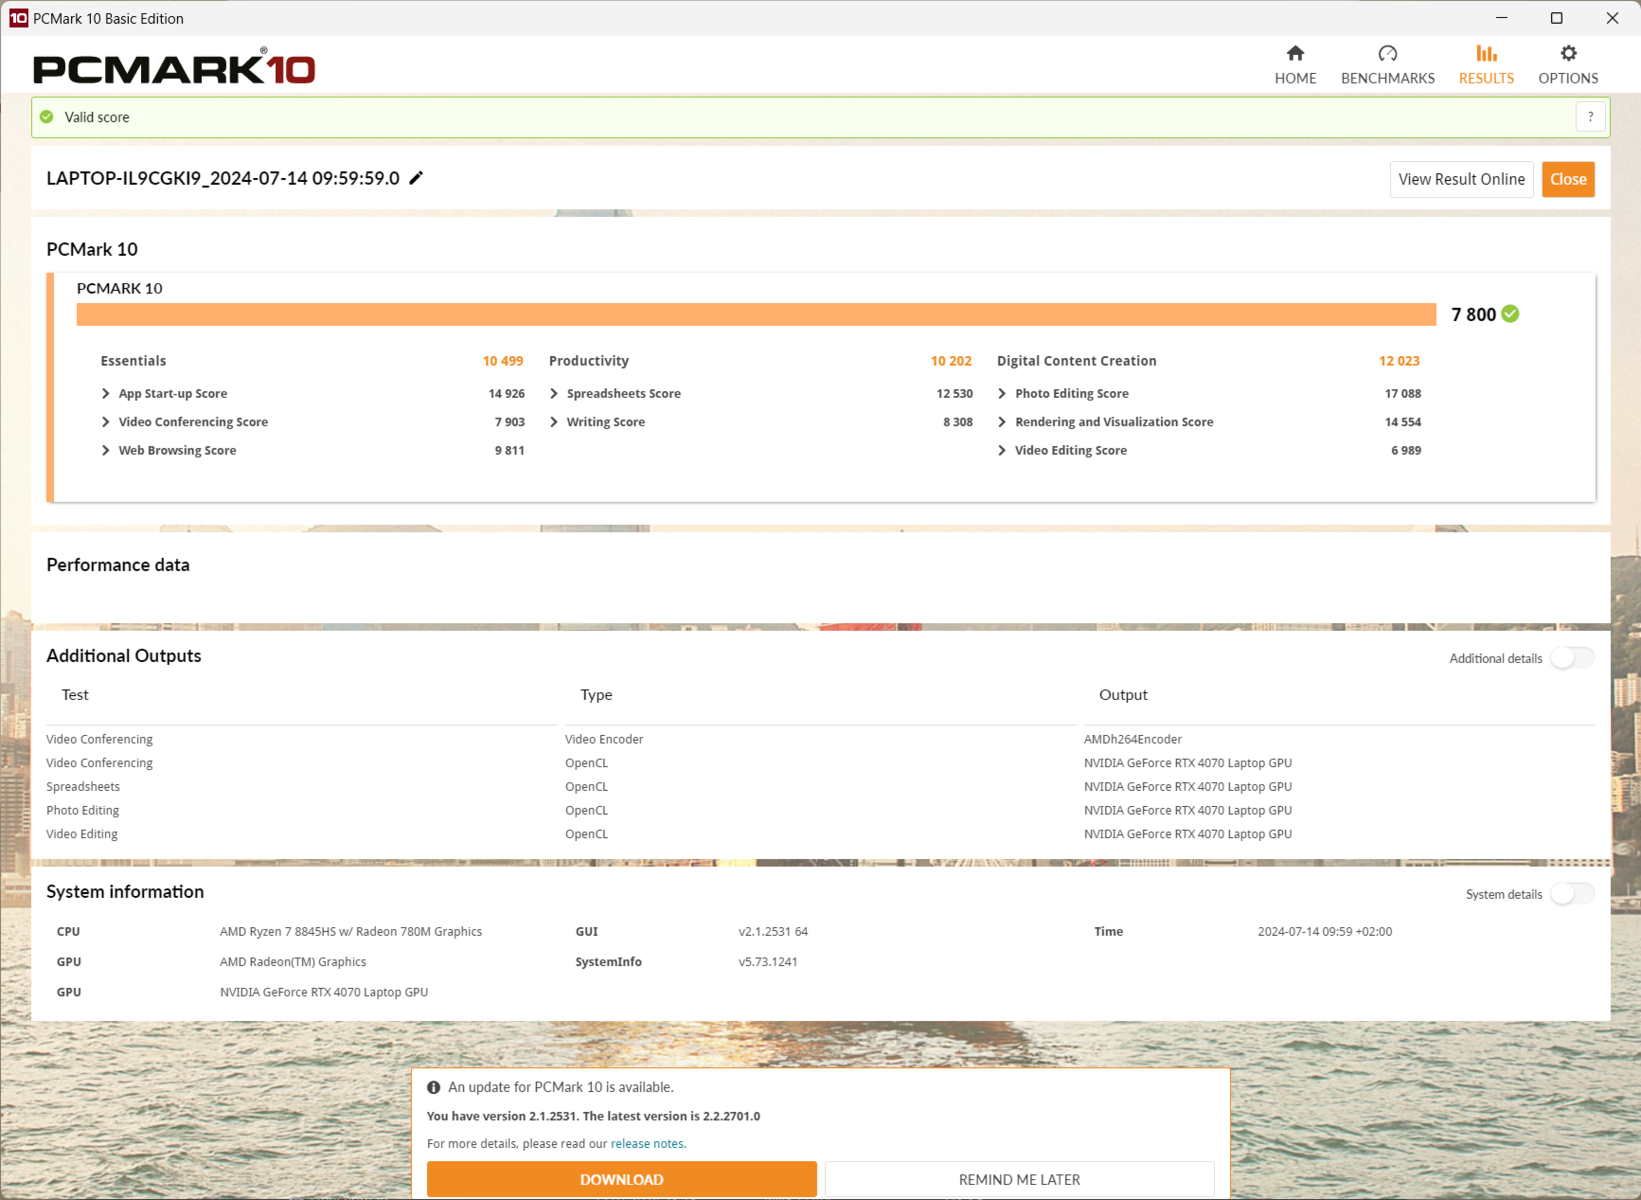
During everyday tasks that we evaluated with PCMark 10 and some other similar benchmarks, there is basically no noticeable difference to comparable systems. The values are at the level of a more powerfully configured Ryzen 7 8845HS and in the middle of the field of competitors, although there is just barely a 10% difference between the highest and lowest value in the table.
The laptop is responsive at all times and doesn't show any wait times during installation processes or when numerous programs are open simultaneously. Even while playing a demanding game, it continues to be possible to switch to another application, although this is rarely recommended.

CrossMark: Overall | Productivity | Creativity | Responsiveness
WebXPRT 3: Overall
WebXPRT 4: Overall
Mozilla Kraken 1.1: Total
| PCMark 10 / Score | |
| Acer Predator Helios Neo 16 (2024) | |
| Asus TUF Gaming A17 FA707XI-NS94 | |
| Average of class Gaming (5776 - 9852, n=132, last 2 years) | |
| Asus TUF Gaming A15 FA507UV | |
| Average AMD Ryzen 7 8845HS, NVIDIA GeForce RTX 4070 Laptop GPU (7800 - 8070, n=2) | |
| HP Omen 17-db0079ng | |
| Alienware m16 R2 | |
| Asus ROG Strix Scar 16 G634JZR | |
| Tulpar T7 V20.6 | |
| PCMark 10 / Essentials | |
| Acer Predator Helios Neo 16 (2024) | |
| Asus ROG Strix Scar 16 G634JZR | |
| Tulpar T7 V20.6 | |
| Asus TUF Gaming A17 FA707XI-NS94 | |
| Asus TUF Gaming A15 FA507UV | |
| Average of class Gaming (9057 - 12600, n=132, last 2 years) | |
| Average AMD Ryzen 7 8845HS, NVIDIA GeForce RTX 4070 Laptop GPU (10499 - 10664, n=2) | |
| HP Omen 17-db0079ng | |
| Alienware m16 R2 | |
| PCMark 10 / Productivity | |
| Acer Predator Helios Neo 16 (2024) | |
| Asus TUF Gaming A15 FA507UV | |
| HP Omen 17-db0079ng | |
| Average AMD Ryzen 7 8845HS, NVIDIA GeForce RTX 4070 Laptop GPU (9887 - 10202, n=2) | |
| Average of class Gaming (6662 - 14612, n=132, last 2 years) | |
| Tulpar T7 V20.6 | |
| Asus TUF Gaming A17 FA707XI-NS94 | |
| Alienware m16 R2 | |
| Asus ROG Strix Scar 16 G634JZR | |
| PCMark 10 / Digital Content Creation | |
| Asus ROG Strix Scar 16 G634JZR | |
| Asus TUF Gaming A17 FA707XI-NS94 | |
| Average of class Gaming (7440 - 19351, n=132, last 2 years) | |
| Alienware m16 R2 | |
| Acer Predator Helios Neo 16 (2024) | |
| Average AMD Ryzen 7 8845HS, NVIDIA GeForce RTX 4070 Laptop GPU (12023 - 13528, n=2) | |
| Asus TUF Gaming A15 FA507UV | |
| HP Omen 17-db0079ng | |
| Tulpar T7 V20.6 | |
| CrossMark / Overall | |
| Acer Predator Helios Neo 16 (2024) | |
| Asus ROG Strix Scar 16 G634JZR | |
| Average of class Gaming (1247 - 2344, n=113, last 2 years) | |
| Asus TUF Gaming A15 FA507UV | |
| Asus TUF Gaming A17 FA707XI-NS94 | |
| Alienware m16 R2 | |
| Tulpar T7 V20.6 | |
| Average AMD Ryzen 7 8845HS, NVIDIA GeForce RTX 4070 Laptop GPU (1531 - 1790, n=2) | |
| HP Omen 17-db0079ng | |
| CrossMark / Productivity | |
| Acer Predator Helios Neo 16 (2024) | |
| Asus ROG Strix Scar 16 G634JZR | |
| Average of class Gaming (1299 - 2211, n=113, last 2 years) | |
| Asus TUF Gaming A15 FA507UV | |
| Asus TUF Gaming A17 FA707XI-NS94 | |
| Tulpar T7 V20.6 | |
| Alienware m16 R2 | |
| Average AMD Ryzen 7 8845HS, NVIDIA GeForce RTX 4070 Laptop GPU (1488 - 1720, n=2) | |
| HP Omen 17-db0079ng | |
| CrossMark / Creativity | |
| Acer Predator Helios Neo 16 (2024) | |
| Asus ROG Strix Scar 16 G634JZR | |
| Average of class Gaming (1275 - 2729, n=113, last 2 years) | |
| Asus TUF Gaming A17 FA707XI-NS94 | |
| Asus TUF Gaming A15 FA507UV | |
| Alienware m16 R2 | |
| Tulpar T7 V20.6 | |
| Average AMD Ryzen 7 8845HS, NVIDIA GeForce RTX 4070 Laptop GPU (1683 - 1932, n=2) | |
| HP Omen 17-db0079ng | |
| CrossMark / Responsiveness | |
| Acer Predator Helios Neo 16 (2024) | |
| Asus ROG Strix Scar 16 G634JZR | |
| Average of class Gaming (1030 - 2330, n=113, last 2 years) | |
| Asus TUF Gaming A15 FA507UV | |
| Alienware m16 R2 | |
| Tulpar T7 V20.6 | |
| Asus TUF Gaming A17 FA707XI-NS94 | |
| Average AMD Ryzen 7 8845HS, NVIDIA GeForce RTX 4070 Laptop GPU (1255 - 1603, n=2) | |
| HP Omen 17-db0079ng | |
| WebXPRT 3 / Overall | |
| Acer Predator Helios Neo 16 (2024) | |
| Asus TUF Gaming A17 FA707XI-NS94 | |
| Average of class Gaming (235 - 532, n=126, last 2 years) | |
| Asus ROG Strix Scar 16 G634JZR | |
| Asus TUF Gaming A15 FA507UV | |
| Alienware m16 R2 | |
| Tulpar T7 V20.6 | |
| Average AMD Ryzen 7 8845HS, NVIDIA GeForce RTX 4070 Laptop GPU (275 - 312, n=2) | |
| HP Omen 17-db0079ng | |
| WebXPRT 4 / Overall | |
| Asus ROG Strix Scar 16 G634JZR | |
| Acer Predator Helios Neo 16 (2024) | |
| Average of class Gaming (176.4 - 341, n=114, last 2 years) | |
| Tulpar T7 V20.6 | |
| Asus TUF Gaming A17 FA707XI-NS94 | |
| Average AMD Ryzen 7 8845HS, NVIDIA GeForce RTX 4070 Laptop GPU (n=1) | |
| Asus TUF Gaming A15 FA507UV | |
| Alienware m16 R2 | |
| Mozilla Kraken 1.1 / Total | |
| HP Omen 17-db0079ng | |
| Alienware m16 R2 | |
| Average AMD Ryzen 7 8845HS, NVIDIA GeForce RTX 4070 Laptop GPU (500 - 564, n=2) | |
| Asus TUF Gaming A15 FA507UV | |
| Tulpar T7 V20.6 | |
| Average of class Gaming (397 - 674, n=137, last 2 years) | |
| Asus TUF Gaming A17 FA707XI-NS94 | |
| Acer Predator Helios Neo 16 (2024) | |
| Asus ROG Strix Scar 16 G634JZR | |
* ... smaller is better
| PCMark 10 Score | 7800 points | |
Help | ||
| AIDA64 / Memory Copy | |
| Asus ROG Strix Scar 16 G634JZR | |
| Acer Predator Helios Neo 16 (2024) | |
| Average of class Gaming (21750 - 97515, n=145, last 2 years) | |
| HP Omen 17-db0079ng | |
| Average AMD Ryzen 7 8845HS (61459 - 71873, n=13) | |
| Alienware m16 R2 | |
| Asus TUF Gaming A15 FA507UV | |
| Asus TUF Gaming A17 FA707XI-NS94 | |
| Tulpar T7 V20.6 | |
| AIDA64 / Memory Read | |
| Asus ROG Strix Scar 16 G634JZR | |
| Acer Predator Helios Neo 16 (2024) | |
| Alienware m16 R2 | |
| Average of class Gaming (22956 - 104349, n=145, last 2 years) | |
| Asus TUF Gaming A15 FA507UV | |
| Asus TUF Gaming A17 FA707XI-NS94 | |
| HP Omen 17-db0079ng | |
| Average AMD Ryzen 7 8845HS (49866 - 61976, n=13) | |
| Tulpar T7 V20.6 | |
| AIDA64 / Memory Write | |
| HP Omen 17-db0079ng | |
| Average AMD Ryzen 7 8845HS (68425 - 93239, n=13) | |
| Asus TUF Gaming A15 FA507UV | |
| Asus ROG Strix Scar 16 G634JZR | |
| Asus TUF Gaming A17 FA707XI-NS94 | |
| Average of class Gaming (22297 - 133486, n=145, last 2 years) | |
| Acer Predator Helios Neo 16 (2024) | |
| Alienware m16 R2 | |
| Tulpar T7 V20.6 | |
| AIDA64 / Memory Latency | |
| Alienware m16 R2 | |
| HP Omen 17-db0079ng | |
| Average of class Gaming (59.5 - 259, n=145, last 2 years) | |
| Average AMD Ryzen 7 8845HS (82.5 - 117, n=13) | |
| Asus TUF Gaming A15 FA507UV | |
| Asus TUF Gaming A17 FA707XI-NS94 | |
| Acer Predator Helios Neo 16 (2024) | |
| Tulpar T7 V20.6 | |
| Asus ROG Strix Scar 16 G634JZR | |
* ... smaller is better
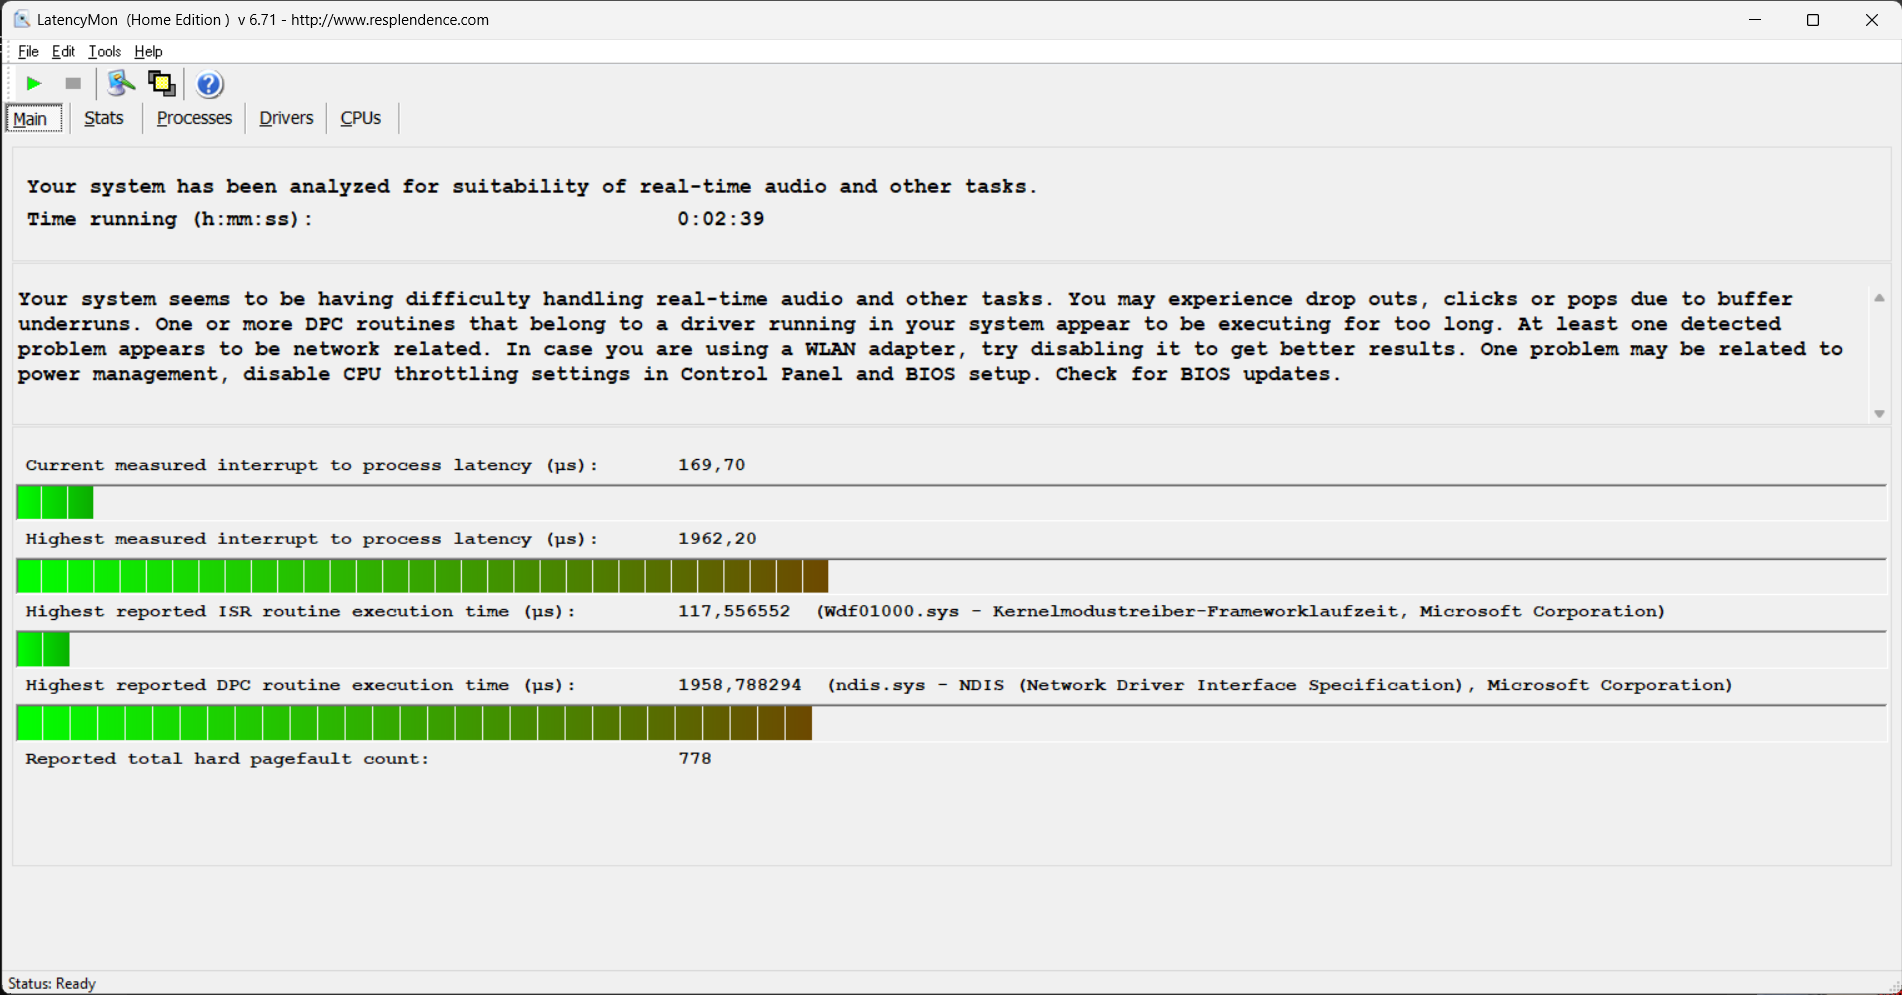
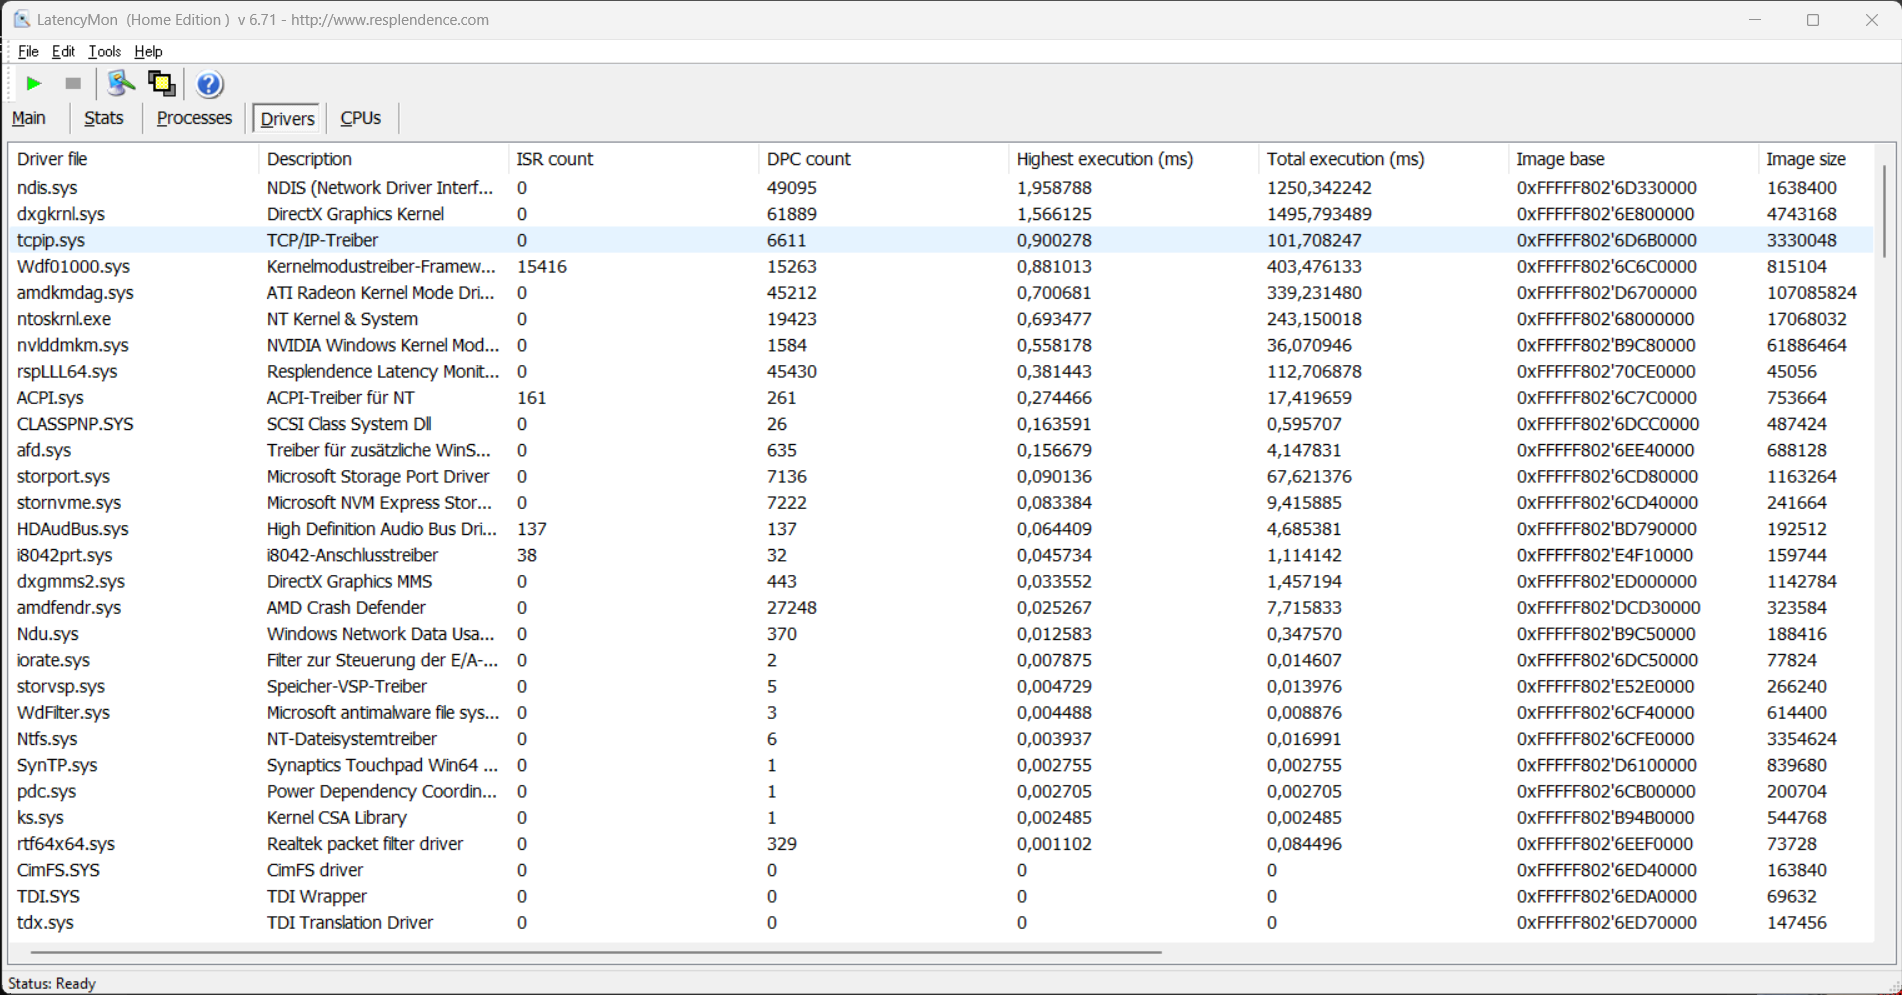
DPC Latencies
Our test unit in its current configuration isn't necessarily suited for real-time audio and video processing, since you have to expect some small stutters. The network drivers and DirectX graphics kernel prevent a better result. With some changed drivers or a later software update, this situation might improve or even get worse.
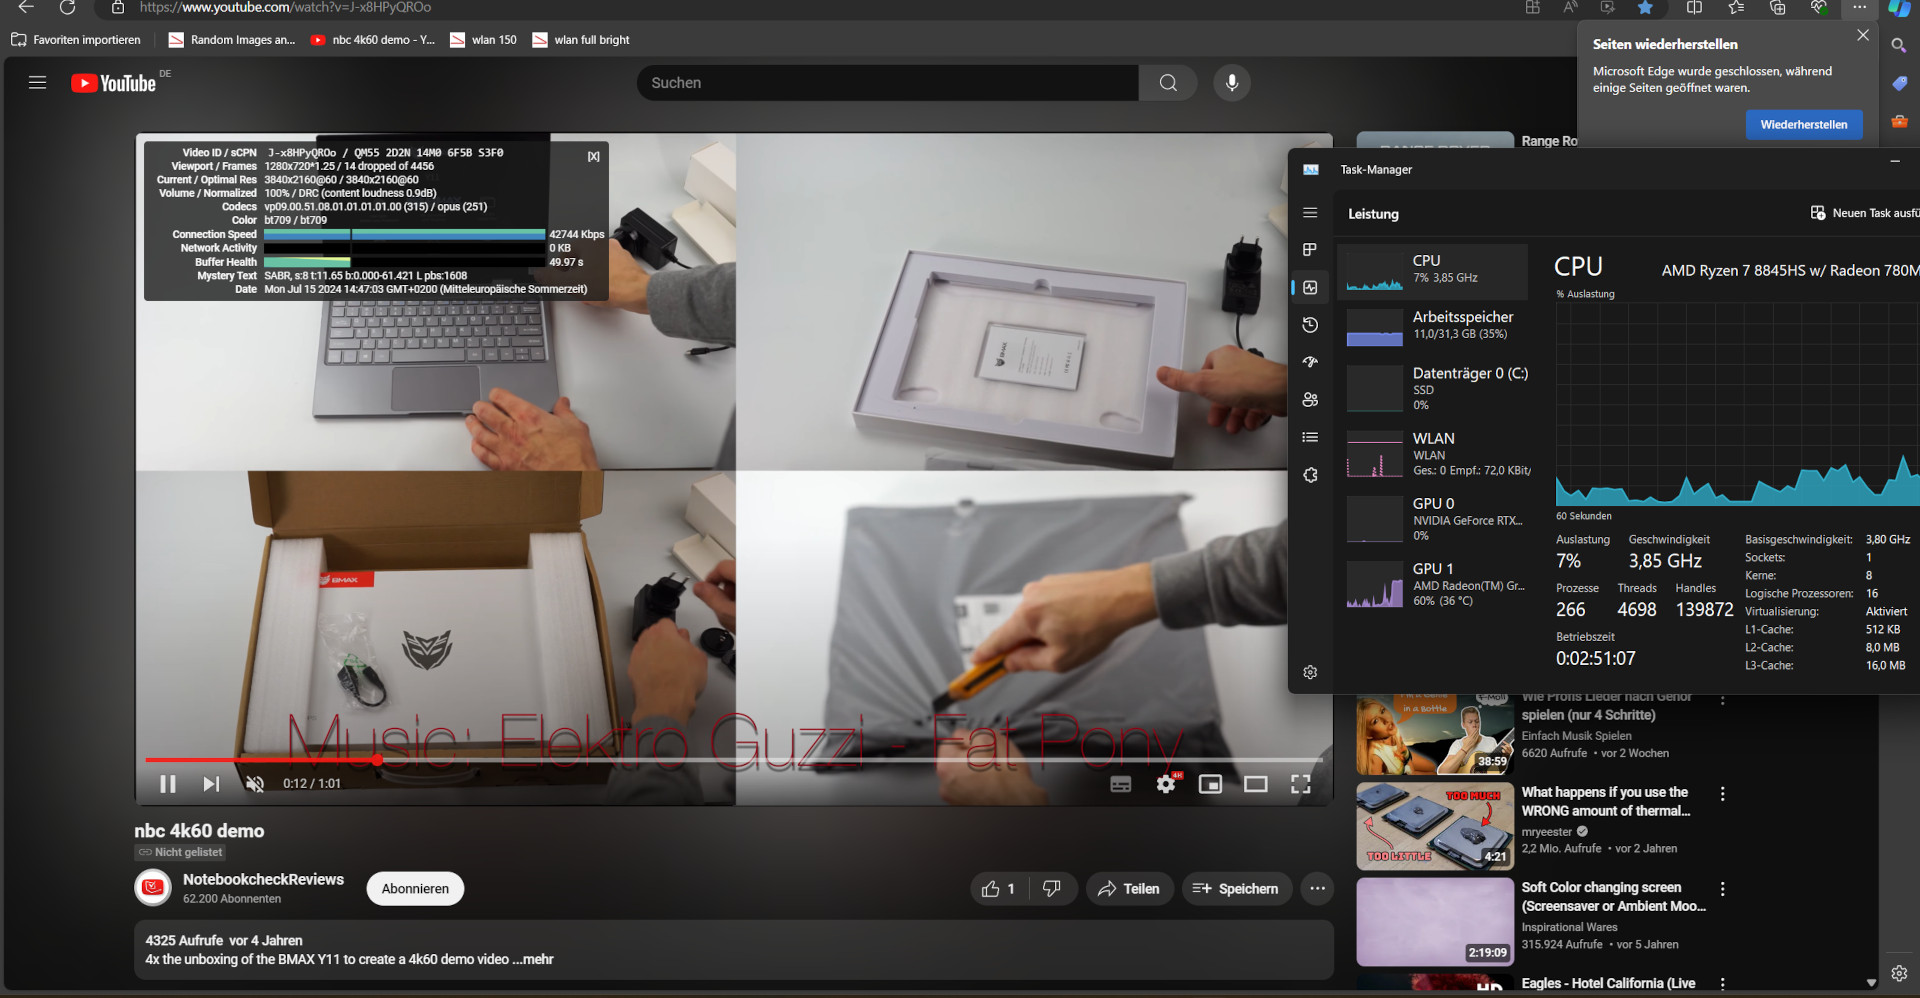
What stands out is the high utilization of the iGPU while playing a 4K video. While a 60% utilization is still defendable, this is almost twice that of the integrated graphics solution from Intel. And 13 dropped frames within a timespan of one minute are not an optimal result either.
| DPC Latencies / LatencyMon - interrupt to process latency (max), Web, Youtube, Prime95 | |
| Asus ROG Strix Scar 16 G634JZR | |
| Alienware m16 R2 | |
| HP Omen 17-db0079ng | |
| Asus TUF Gaming A17 FA707XI-NS94 | |
| Acer Predator Helios Neo 16 (2024) | |
| Asus TUF Gaming A15 FA507UV | |
* ... smaller is better
Storage Solution
The SSD used here definitely doesn't reach absolute top speeds. For example, the storage solution in the Asus ROG Strix Scar 16 is able to perform 30% better in terms of sequential access. But this only rarely contributes to an increase in the frame rates while gaming. We might only observe a minimal, if any, improvement during intense multitasking with many parallel access tasks.
On the other hand, the Omen 17 shows how good cooling of the SSD should look like. In contrast to many similarly constructed competitors including the ROG Strix Scar, the constant performance remains permanently at a good, even if not outstanding, level.
The second slot for an M.2-NVMe SSD also has a cooler that is already preinstalled. So if you like, you can add a faster or at least larger drive here.

* ... smaller is better
Disk Throttling: DiskSpd Read Loop, Queue Depth 8
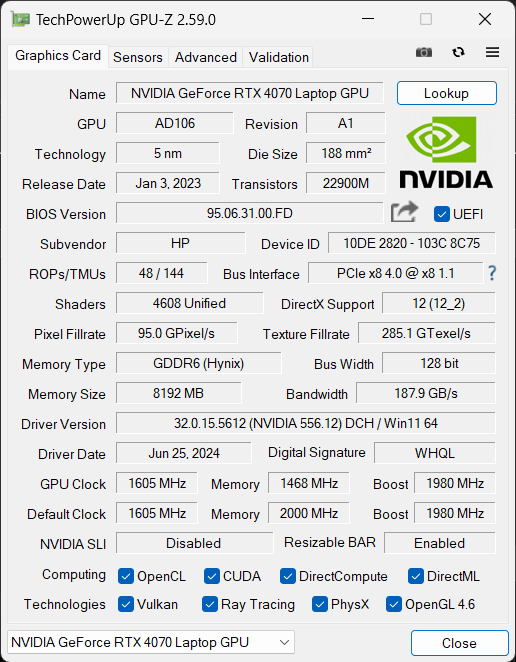
Graphics Card
The HP Omen 17 uses the Nvidia GeForce RTX 4070 graphics card. Alternatively, you can also purchase a smaller version with the RTX 4060. The larger of the two is well-suited for the QHD display. We only had to forgo the maximum detail settings with the newest games if we still wanted to get more than 60 FPS.
The RTX 4070 is able to consume a maximum of 120 watts here, which is below its allowed maximum value of 140 watts. But this isn't very noticeable, particularly in the synthetic benchmarks of 3DMark, and at times we even observe the opposite. For example, the Asus TUF Gaming A17, which is better equipped on paper with an RTX 4070 with 140 watts, falls behind 9% overall. However, the distance is smaller in the gaming performance. We probably see the effect of the HP Omen 17 not needing to throttle here.
The power values are further reduced in the other power modes. In "Balanced" mode, it is still 90 watts, which reduces the performance by 10% at most. The drop in power becomes more pronounced in "Eco" mode and during battery operation, where the graphics card is only allowed to consume 40 watts. Although games that aren't quite as complex remain playable, you have to expect a frame rate that is reduced by one third.
You can find additional benchmarks and games tests in our GPU benchmark list.
| 3DMark 11 Performance | 35016 points | |
| 3DMark Cloud Gate Standard Score | 65355 points | |
| 3DMark Fire Strike Score | 27594 points | |
| 3DMark Time Spy Score | 12346 points | |
| 3DMark Steel Nomad Score | 2743 points | |
Help | ||
* ... smaller is better
Gaming Performance
With merely high instead of maximum detail settings, the HP Omen 17 is reliably able to surpass the 100 FPS mark in Full-HD resolution. This also goes for current games. With several games, the differences to other gaming laptops with the RTX 4070 are only a few percentage points. The advantage to the Asus TUF Gaming A15 with a faster CPU but only an RTX 4060 is barely 4%. But graphically demanding games such as Cyberpunk 2077 2.1 are much more playable with the Omen 17. The smaller GPU is still able to master older games at eye level, though.
The difference between the quieter "Balanced" mode and maximum performance remains small. Often 100 FPS are reached even then. So we can say overall, that the decision for a lower TGP didn't bring any serious disadvantages worth mention in gaming. Since the available computing performance remains stable, the Omen 17 even has an advantage at times under constant load.


| GTA V - 1920x1080 Highest Settings possible AA:4xMSAA + FX AF:16x | |
| Asus ROG Strix Scar 16 G634JZR | |
| Acer Predator Helios Neo 16 (2024) | |
| Average of class Gaming (12.1 - 186.9, n=124, last 2 years) | |
| HP Omen 16 (2024) | |
| Asus ROG Zephyrus M16 GU603Z | |
| Asus TUF Gaming A15 FA507UV | |
| HP Omen 17-db0079ng | |
| HP Omen 16-b0085ng | |
| Cyberpunk 2077 2.2 Phantom Liberty - 1920x1080 Ultra Preset (FSR off) | |
| Asus ROG Strix Scar 16 G634JZR | |
| Average of class Gaming (6.76 - 166.5, n=116, last 2 years) | |
| HP Omen 17-db0079ng | |
| Asus TUF Gaming A17 FA707XI-NS94 | |
| HP Omen 16 (2024) | |
| Acer Predator Helios Neo 16 (2024) | |
| Alienware m16 R2 | |
| Asus TUF Gaming A15 FA507UV | |
| F1 23 | |
| 1920x1080 Ultra High Preset AA:T AF:16x | |
| Asus ROG Strix Scar 16 G634JZR | |
| Average of class Gaming (12.9 - 149.2, n=36, last 2 years) | |
| Average NVIDIA GeForce RTX 4070 Laptop GPU (49.5 - 100, n=14) | |
| 2560x1440 Ultra High Preset AA:T AF:16x | |
| Asus ROG Strix Scar 16 G634JZR | |
| Average of class Gaming (17 - 144.6, n=29, last 2 years) | |
| Average NVIDIA GeForce RTX 4070 Laptop GPU (35.2 - 49, n=13) | |
| F1 24 | |
| 1920x1080 Ultra High Preset AA:T AF:16x | |
| Average of class Gaming (54.1 - 157.8, n=39, last 2 years) | |
| HP Omen 17-db0079ng | |
| Average NVIDIA GeForce RTX 4070 Laptop GPU (58.4 - 81.2, n=11) | |
| Asus TUF Gaming A15 FA507UV | |
| 2560x1440 Ultra High Preset AA:T AF:16x | |
| Average of class Gaming (36.7 - 106.4, n=37, last 2 years) | |
| HP Omen 17-db0079ng | |
| Average NVIDIA GeForce RTX 4070 Laptop GPU (36.8 - 51.3, n=11) | |
The constant load test with Cyberpunk 2077 2.1 also shows the stability of the laptop's performance, resulting in an almost perfectly straight line from beginning to end. With the reduced power consumption, the Omen 17 does not need to throttle at any time.
Cyberpunk 2077 Ultra FPS Chart
| low | med. | high | ultra | QHD | |
|---|---|---|---|---|---|
| GTA V (2015) | 178.9 | 175.5 | 163.1 | 103.9 | 90.2 |
| Dota 2 Reborn (2015) | 152.5 | 138.8 | 137.3 | 126.3 | |
| Final Fantasy XV Benchmark (2018) | 201 | 155.7 | 117.2 | 88.2 | |
| X-Plane 11.11 (2018) | 128.8 | 115.7 | 89.5 | ||
| Far Cry 5 (2018) | 137 | 123 | 115 | 110 | 108 |
| Strange Brigade (2018) | 318 | 276 | 240 | 213 | 138.3 |
| God of War (2022) | 149 | 129 | 105 | 74 | 60 |
| Hogwarts Legacy (2023) | 103 | 92 | 87 | 76 | 52 |
| Cyberpunk 2077 2.2 Phantom Liberty (2023) | 135.3 | 122 | 102.6 | 88.9 | 54.5 |
| F1 24 (2024) | 205 | 210 | 196.6 | 74.1 | 48.4 |
Emissions - Not a jet plane
Noise Levels
The fan control under load shows a successful cooling implementation. Even in moments of the highest performance, the noise never gets annoying, even though it is then clearly audible. In contrast to competitors such as the Alienware m16 R2, headphones won't be absolutely necessary at those times, although they'd still be recommended.
The Omen 17 does even better in "Balanced" mode, which only brings some small limitations in the performance. As long as the game is only half-way interesting, you should hardly notice the fan noise anymore. In addition, the included software will allow you to easily make further adjustments to the fan speed in order to lower the noise level some more.
Unfortunately, the gaming laptop never really remains absolutely quiet, though. Even without any load, the fans rev up from time to time, and although they don't go up to maximum speed levels, it is still very audible. The Omen 17 remains far from reaching any critical temperatures.
Noise Level
| Idle |
| 25 / 29 / 33 dB(A) |
| Load |
| 45 / 52 dB(A) |
 | ||
30 dB silent 40 dB(A) audible 50 dB(A) loud |
||
min: | ||
| HP Omen 17-db0079ng NVIDIA GeForce RTX 4070 Laptop GPU, R7 8845HS, WD PC SN560 SDDPNQE-1T00 | Alienware m16 R2 NVIDIA GeForce RTX 4070 Laptop GPU, Ultra 7 155H, Samsung PM9A1 MZVL21T0HCLR | Asus ROG Strix Scar 16 G634JZR NVIDIA GeForce RTX 4080 Laptop GPU, i9-14900HX, SK hynix PC801 HFS002TEJ9X101N | Acer Predator Helios Neo 16 (2024) NVIDIA GeForce RTX 4070 Laptop GPU, i7-14700HX, Samsung PM9A1a MZVL21T0HDLU | Asus TUF Gaming A17 FA707XI-NS94 NVIDIA GeForce RTX 4070 Laptop GPU, R9 7940HS, WD PC SN560 SDDPNQE-1T00 | Asus TUF Gaming A15 FA507UV NVIDIA GeForce RTX 4060 Laptop GPU, R9 8945H, WD PC SN560 SDDPNQE-1T00 | |
|---|---|---|---|---|---|---|
| Noise | 8% | -5% | -3% | -1% | 5% | |
| off / environment * | 25 | 24.7 1% | 21.07 16% | 25.2 -1% | 27.9 -12% | 25 -0% |
| Idle Minimum * | 25 | 25.3 -1% | 29.75 -19% | 27.8 -11% | 28.5 -14% | 25 -0% |
| Idle Average * | 29 | 25.3 13% | 29.75 -3% | 32 -10% | 29.8 -3% | 27 7% |
| Idle Maximum * | 33 | 25.3 23% | 29.75 10% | 29.6 10% | 29.8 10% | 33 -0% |
| Load Average * | 45 | 31.7 30% | 54.85 -22% | 45.2 -0% | 34.8 23% | 40 11% |
| Cyberpunk 2077 ultra * | 48 | 45 6% | ||||
| Load Maximum * | 52 | 62 -19% | 58 -12% | 55.8 -7% | 57.3 -10% | 46 12% |
| Witcher 3 ultra * | 53.8 | 57.8 | 57.1 |
* ... smaller is better
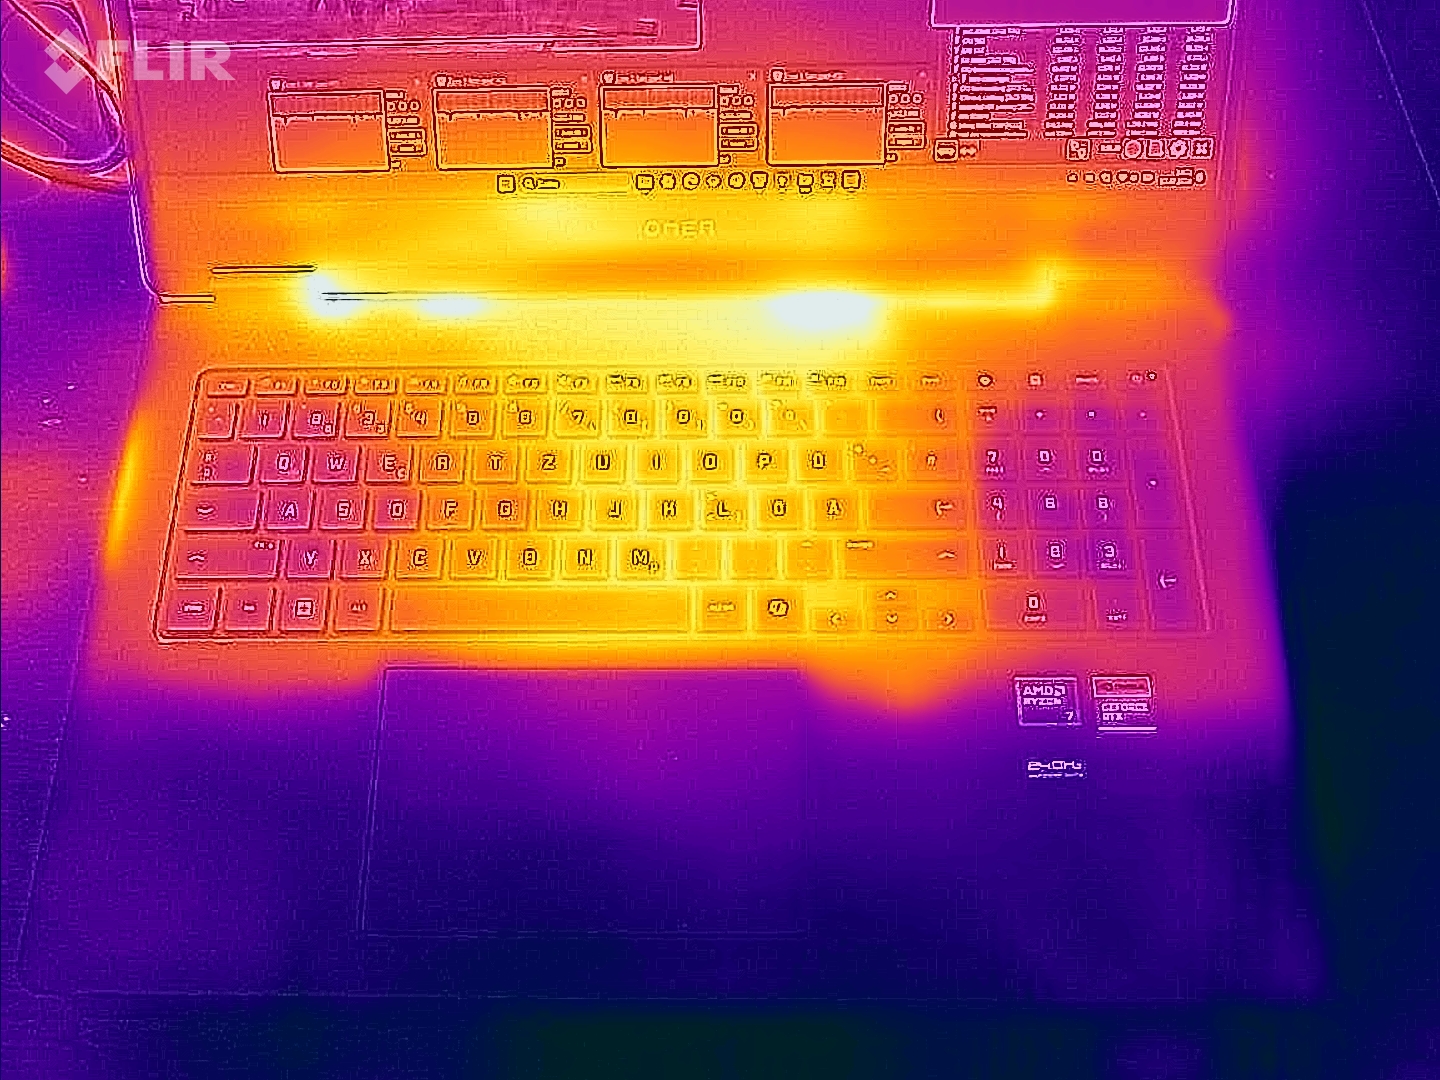
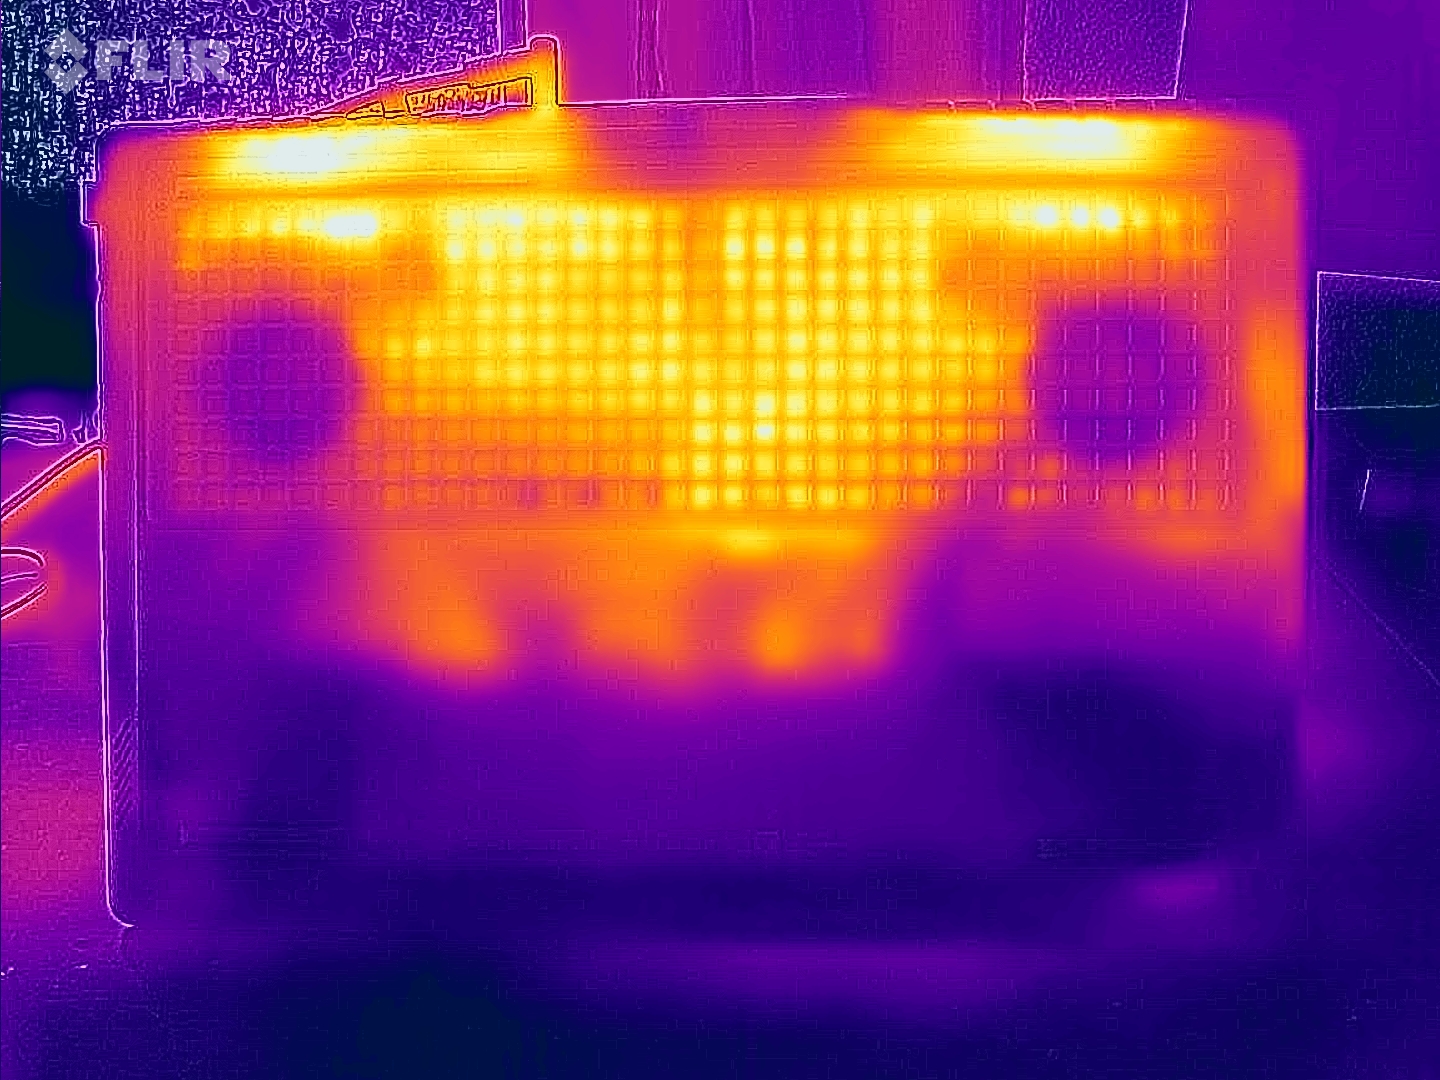
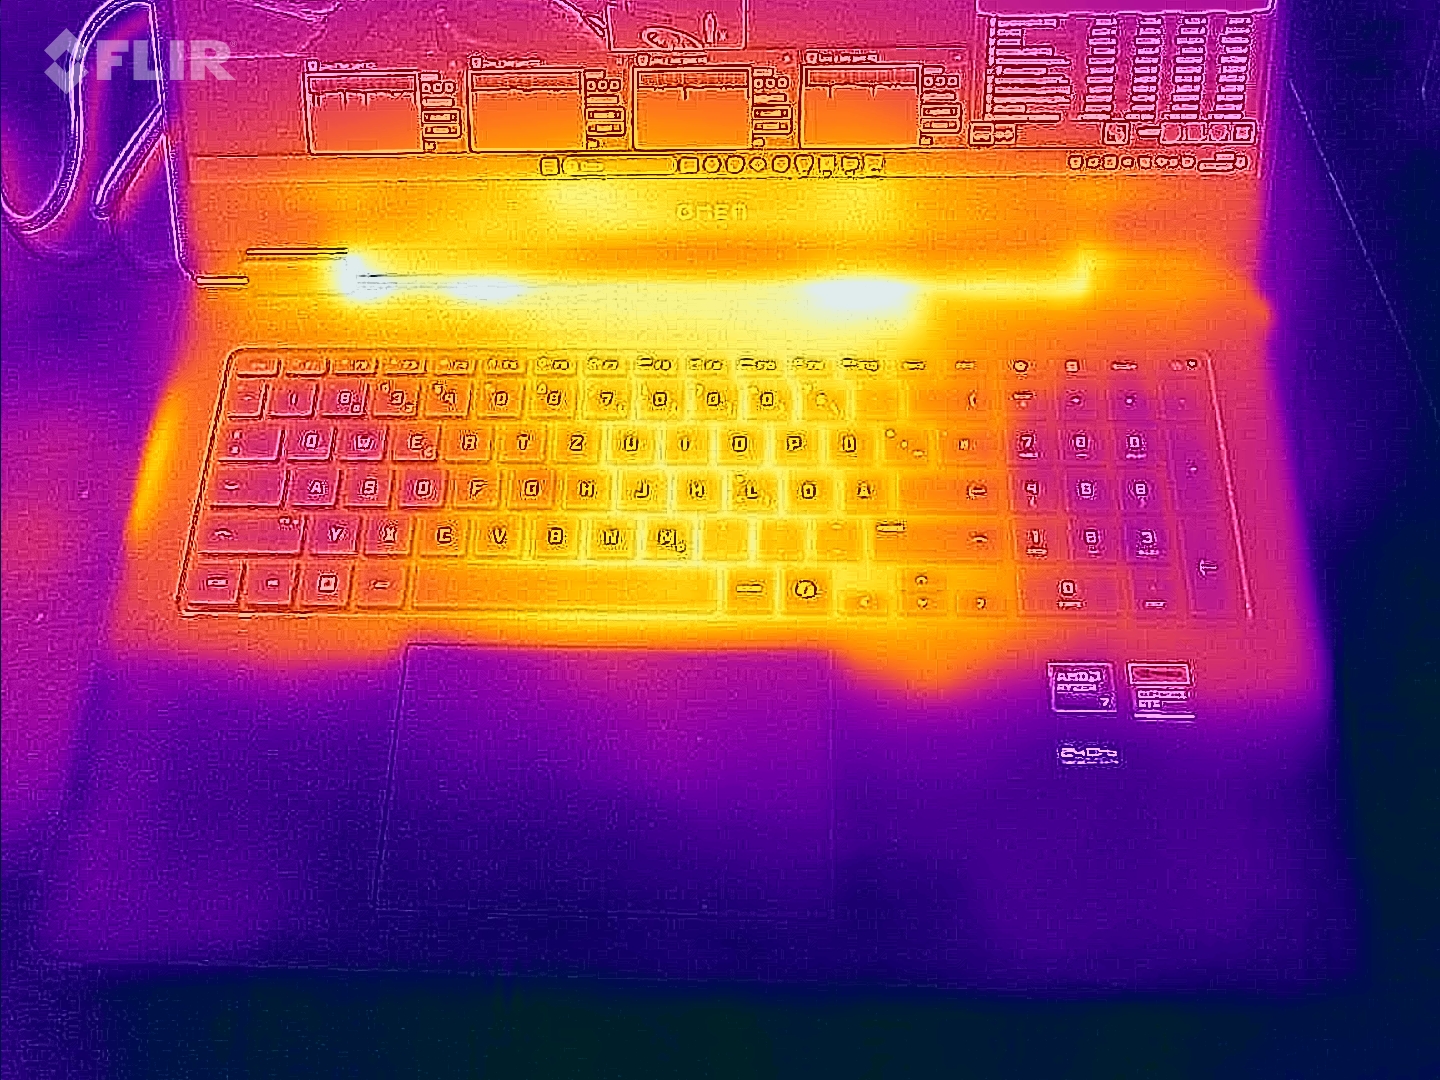
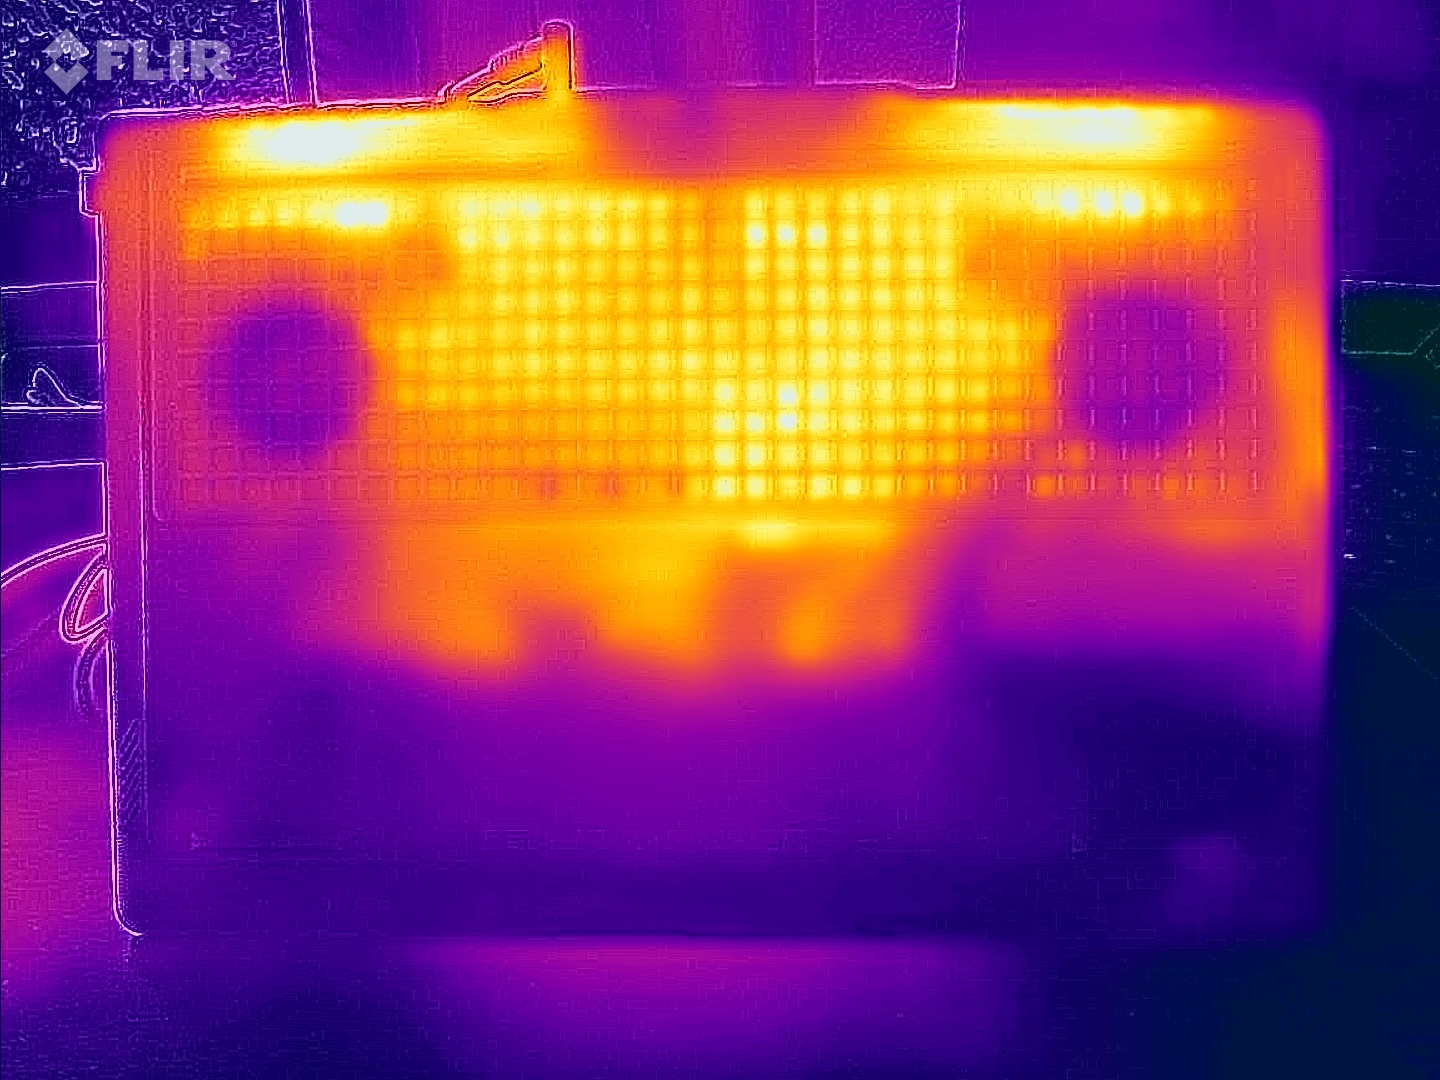
Temperatures
Both during idle operation as well as under high load, the Omen 17 remains cooler than many of its competitors. Particularly the palm rests hardly get warm. In the keyboard area, on the other hand, the temperature increase is clearly noticeable during gaming. An external solution is recommended here, particularly since the built-in keyboard isn't very impressive anyways. During simple tasks such as surfing the Internet or working on office tasks, the whole device remains cool and comfortable to operate. You can also use it comfortably on your lap.
(±) The maximum temperature on the upper side is 44 °C / 111 F, compared to the average of 40.5 °C / 105 F, ranging from 21.2 to 68.8 °C for the class Gaming.
(±) The bottom heats up to a maximum of 45 °C / 113 F, compared to the average of 43.3 °C / 110 F
(+) In idle usage, the average temperature for the upper side is 25.7 °C / 78 F, compared to the device average of 33.9 °C / 93 F.
(±) 3: The average temperature for the upper side is 36.1 °C / 97 F, compared to the average of 33.9 °C / 93 F for the class Gaming.
(+) The palmrests and touchpad are cooler than skin temperature with a maximum of 28 °C / 82.4 F and are therefore cool to the touch.
(±) The average temperature of the palmrest area of similar devices was 28.9 °C / 84 F (+0.9 °C / 1.6 F).
| HP Omen 17-db0079ng AMD Ryzen 7 8845HS, NVIDIA GeForce RTX 4070 Laptop GPU | Alienware m16 R2 Intel Core Ultra 7 155H, NVIDIA GeForce RTX 4070 Laptop GPU | Asus ROG Strix Scar 16 G634JZR Intel Core i9-14900HX, NVIDIA GeForce RTX 4080 Laptop GPU | Acer Predator Helios Neo 16 (2024) Intel Core i7-14700HX, NVIDIA GeForce RTX 4070 Laptop GPU | Asus TUF Gaming A17 FA707XI-NS94 AMD Ryzen 9 7940HS, NVIDIA GeForce RTX 4070 Laptop GPU | Asus TUF Gaming A15 FA507UV AMD Ryzen 9 8945H, NVIDIA GeForce RTX 4060 Laptop GPU | |
|---|---|---|---|---|---|---|
| Heat | -27% | -18% | -23% | 11% | -18% | |
| Maximum Upper Side * | 44 | 44.8 -2% | 47.8 -9% | 58 -32% | 40 9% | 53 -20% |
| Maximum Bottom * | 45 | 48 -7% | 52.2 -16% | 45.2 -0% | 33.6 25% | 46 -2% |
| Idle Upper Side * | 26 | 37.2 -43% | 32.4 -25% | 31.1 -20% | 26.6 -2% | 32 -23% |
| Idle Bottom * | 27 | 42 -56% | 33 -22% | 37.2 -38% | 24.4 10% | 34 -26% |
* ... smaller is better
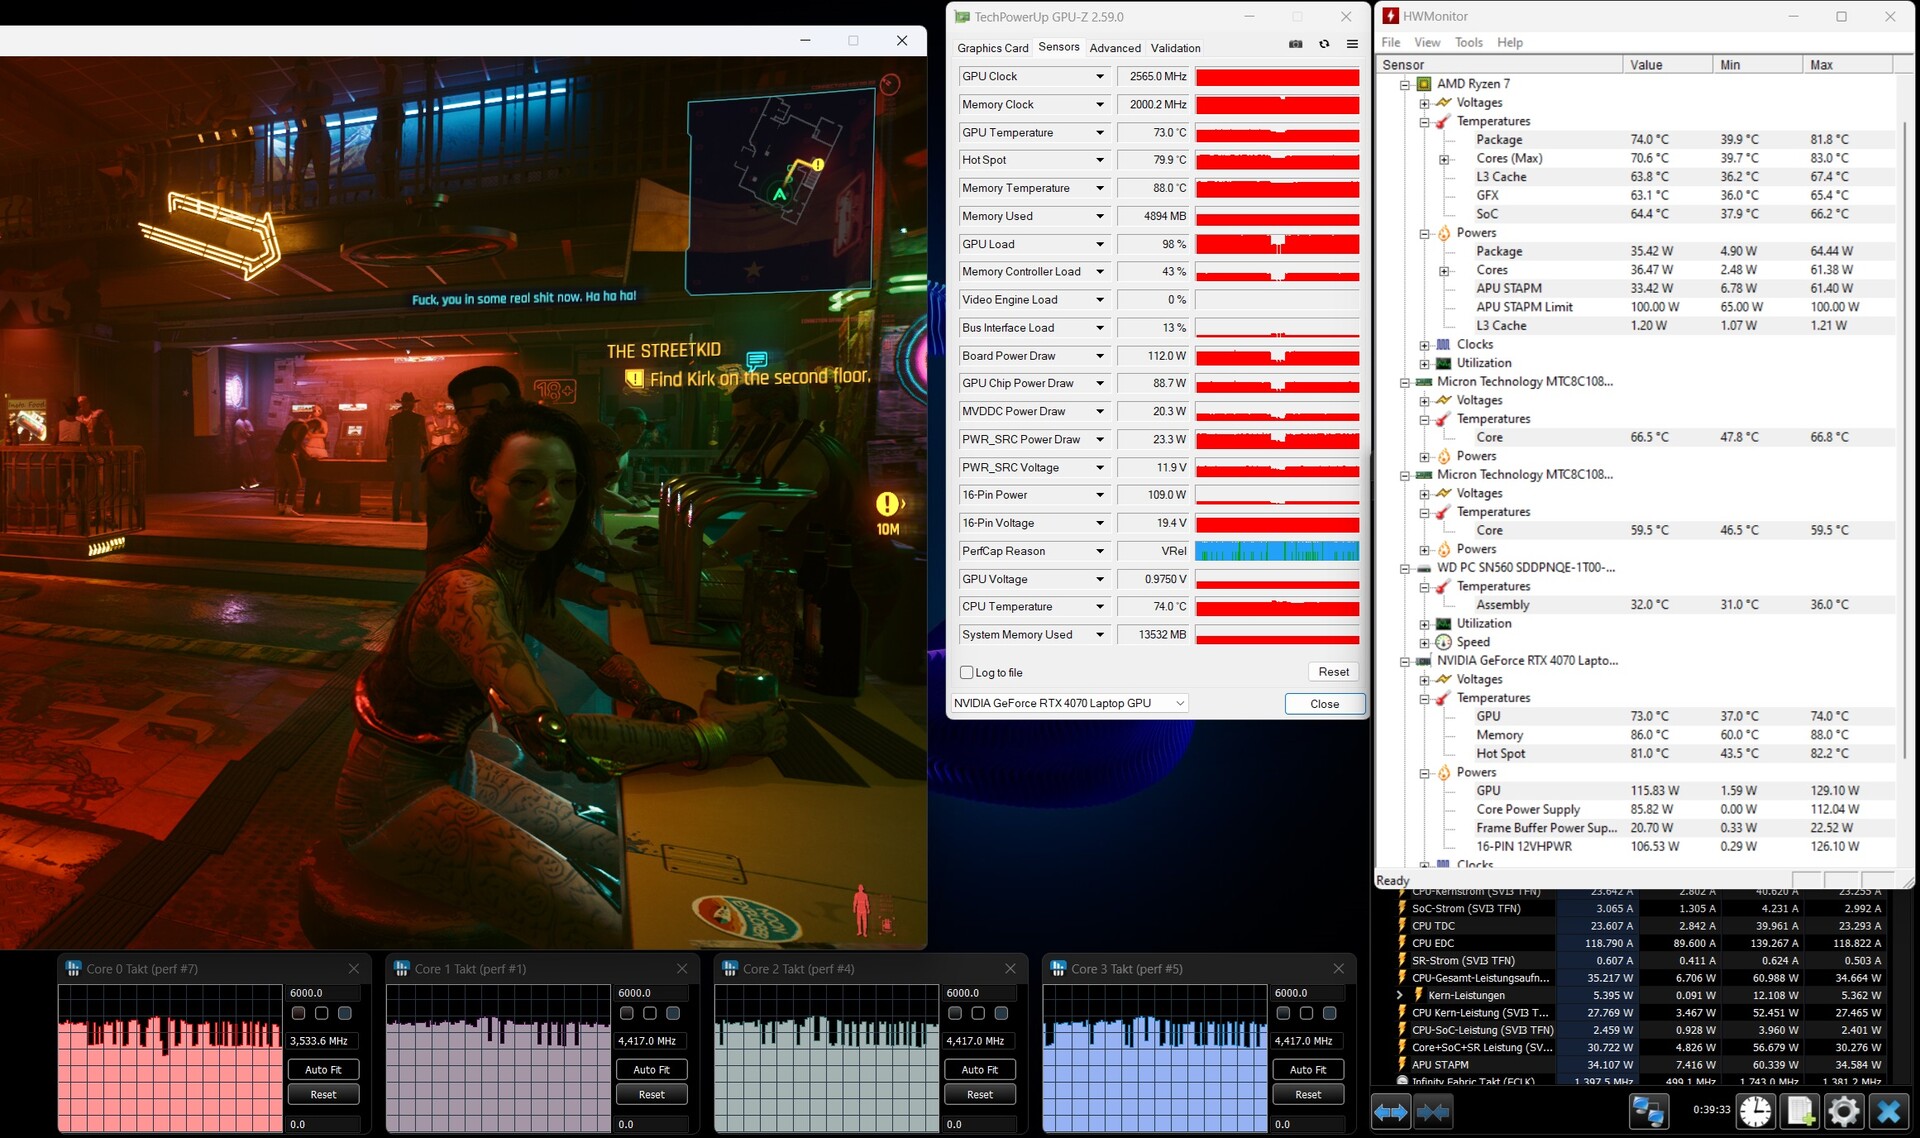
Stress Test
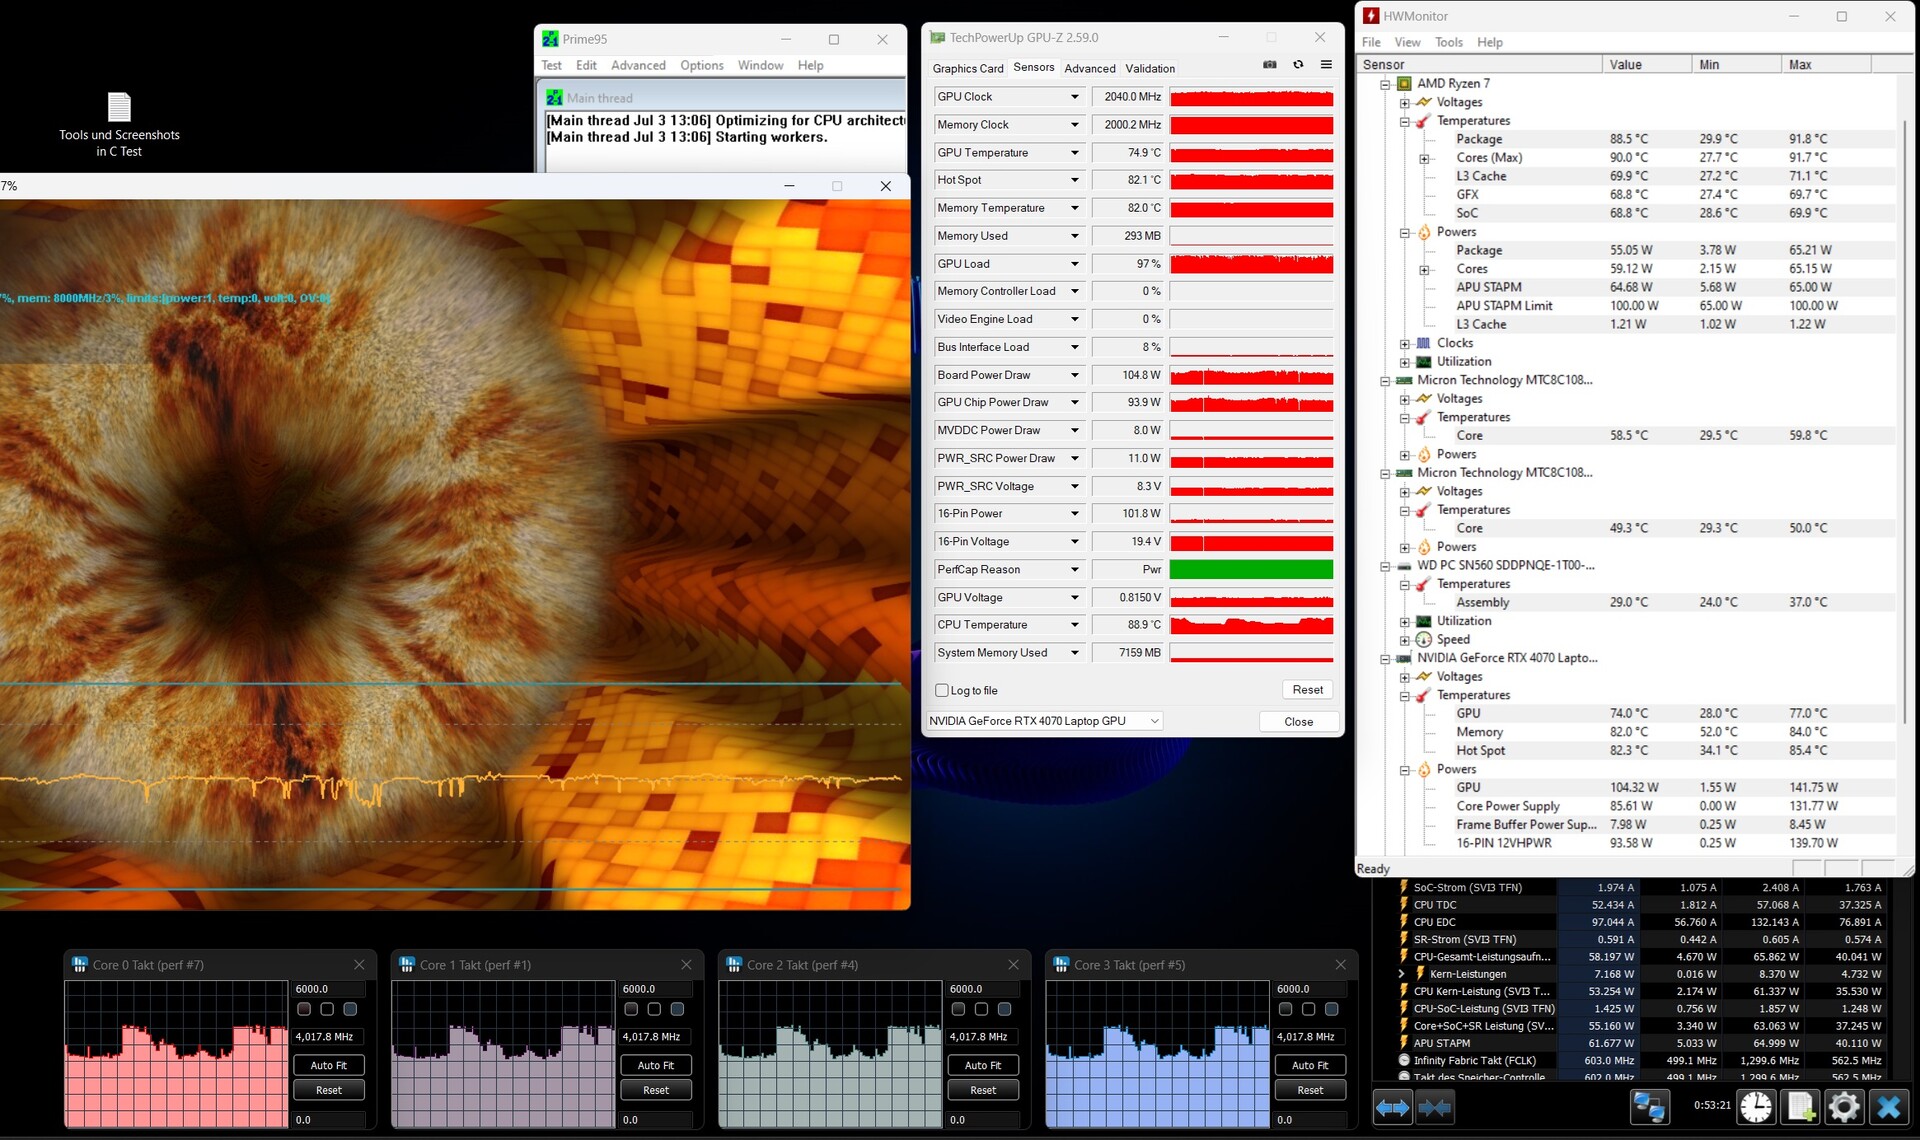
When the CPU is put under full load with Prime95, it constantly consumes the allowed 65 watts. Although this is a smaller value than that of some competitors with the same CPU, it remains constant over longer time periods. The temperature of the core remains at an acceptable 80 °C (176 °F) or lower.
Only under additional load on the graphics card does the HP Omen 17 reach its limits. When both components run at full performance, the power consumption remains at its maximum values of 50 watts for the CPU (minus the dynamic boost for the GPU) and 120 watts for the graphics card. The temperatures will then increase to almost 90 °C (194 °F) for the CPU and 75 °C (167 °F) for the GPU.
During the stress test, the clock speed of the CPU remains at around 4,500 MHz, dropping to about 4,000 MHz when the graphics chip is added.
Speakers
The speakers leave a very mixed impression. The mid bass, which is mostly also used in action games, sounds surprisingly good and powerful. Voices also sound natural and include a certain depth in detail.
Deep bass is not present at all, and the lower mids, the range of guitars or drums, turn out weak. It is also noticeable that voices can easily get lost in the background behind other noises. The speakers are okay for games, but neither video streaming nor listening to music should be included in the recommended usage scenarios for the overall only mediocre speakers.
HP Omen 17-db0079ng audio analysis
(±) | speaker loudness is average but good (80 dB)
Bass 100 - 315 Hz
(-) | nearly no bass - on average 19.1% lower than median
(±) | linearity of bass is average (10.3% delta to prev. frequency)
Mids 400 - 2000 Hz
(+) | balanced mids - only 1.9% away from median
(+) | mids are linear (4.4% delta to prev. frequency)
Highs 2 - 16 kHz
(+) | balanced highs - only 3.8% away from median
(±) | linearity of highs is average (7.8% delta to prev. frequency)
Overall 100 - 16.000 Hz
(+) | overall sound is linear (14.3% difference to median)
Compared to same class
» 26% of all tested devices in this class were better, 7% similar, 68% worse
» The best had a delta of 6%, average was 18%, worst was 132%
Compared to all devices tested
» 16% of all tested devices were better, 4% similar, 80% worse
» The best had a delta of 4%, average was 24%, worst was 134%
Apple MacBook Pro 16 2021 M1 Pro audio analysis
(+) | speakers can play relatively loud (84.7 dB)
Bass 100 - 315 Hz
(+) | good bass - only 3.8% away from median
(+) | bass is linear (5.2% delta to prev. frequency)
Mids 400 - 2000 Hz
(+) | balanced mids - only 1.3% away from median
(+) | mids are linear (2.1% delta to prev. frequency)
Highs 2 - 16 kHz
(+) | balanced highs - only 1.9% away from median
(+) | highs are linear (2.7% delta to prev. frequency)
Overall 100 - 16.000 Hz
(+) | overall sound is linear (4.6% difference to median)
Compared to same class
» 0% of all tested devices in this class were better, 0% similar, 100% worse
» The best had a delta of 5%, average was 18%, worst was 45%
Compared to all devices tested
» 0% of all tested devices were better, 0% similar, 100% worse
» The best had a delta of 4%, average was 24%, worst was 134%
Power Management - Efficient for a gaming laptop
Power Consumption
The limited maximum power consumption isn't very surprising, since both the CPU and GPU are throttled slightly. We measure a maximum value of 230 watts, which is almost 10% less than the consumption of other models with this graphics card.
What is really remarkable, on the other hand, is our consumption measurements when there is no load worth mention. At times, the Omen 17 only consumes 50% of what the competitors use. This also explains the lack of warming, which hardly registers, and the good battery life.
| Off / Standby | |
| Idle | |
| Load |
|
Key:
min: | |
| HP Omen 17-db0079ng R7 8845HS, NVIDIA GeForce RTX 4070 Laptop GPU | Alienware m16 R2 Ultra 7 155H, NVIDIA GeForce RTX 4070 Laptop GPU | Asus ROG Strix Scar 16 G634JZR i9-14900HX, NVIDIA GeForce RTX 4080 Laptop GPU | Acer Predator Helios Neo 16 (2024) i7-14700HX, NVIDIA GeForce RTX 4070 Laptop GPU | Asus TUF Gaming A17 FA707XI-NS94 R9 7940HS, NVIDIA GeForce RTX 4070 Laptop GPU | Asus TUF Gaming A15 FA507UV R9 8945H, NVIDIA GeForce RTX 4060 Laptop GPU | Average NVIDIA GeForce RTX 4070 Laptop GPU | Average of class Gaming | |
|---|---|---|---|---|---|---|---|---|
| Power Consumption | -38% | -59% | -122% | -20% | 6% | -49% | -64% | |
| Idle Minimum * | 6 | 8.1 -35% | 10.71 -79% | 26.7 -345% | 6.2 -3% | 7 -17% | 13.2 ? -120% | 14.2 ? -137% |
| Idle Average * | 12 | 13 -8% | 14.75 -23% | 24.4 -103% | 21.8 -82% | 12 -0% | 18.2 ? -52% | 20.1 ? -68% |
| Idle Maximum * | 18 | 40.3 -124% | 30 -67% | 32.7 -82% | 22 -22% | 18 -0% | 24.6 ? -37% | 27.3 ? -52% |
| Load Average * | 71 | 79 -11% | 135 -90% | 122.1 -72% | 59.2 17% | 70 1% | 97 ? -37% | 107.5 ? -51% |
| Cyberpunk 2077 ultra * | 197 | 146.8 25% | ||||||
| Cyberpunk 2077 ultra external monitor * | 191.8 | 146.2 24% | ||||||
| Load Maximum * | 228 | 254.9 -12% | 307 -35% | 241 -6% | 247.8 -9% | 206 10% | 221 ? 3% | 257 ? -13% |
| Witcher 3 ultra * | 188.1 | 286 | 190.6 | 189.7 |
* ... smaller is better
Power Consumption Cyberpunk / Stress Test
Power Consumption With External Monitor
Battery Life
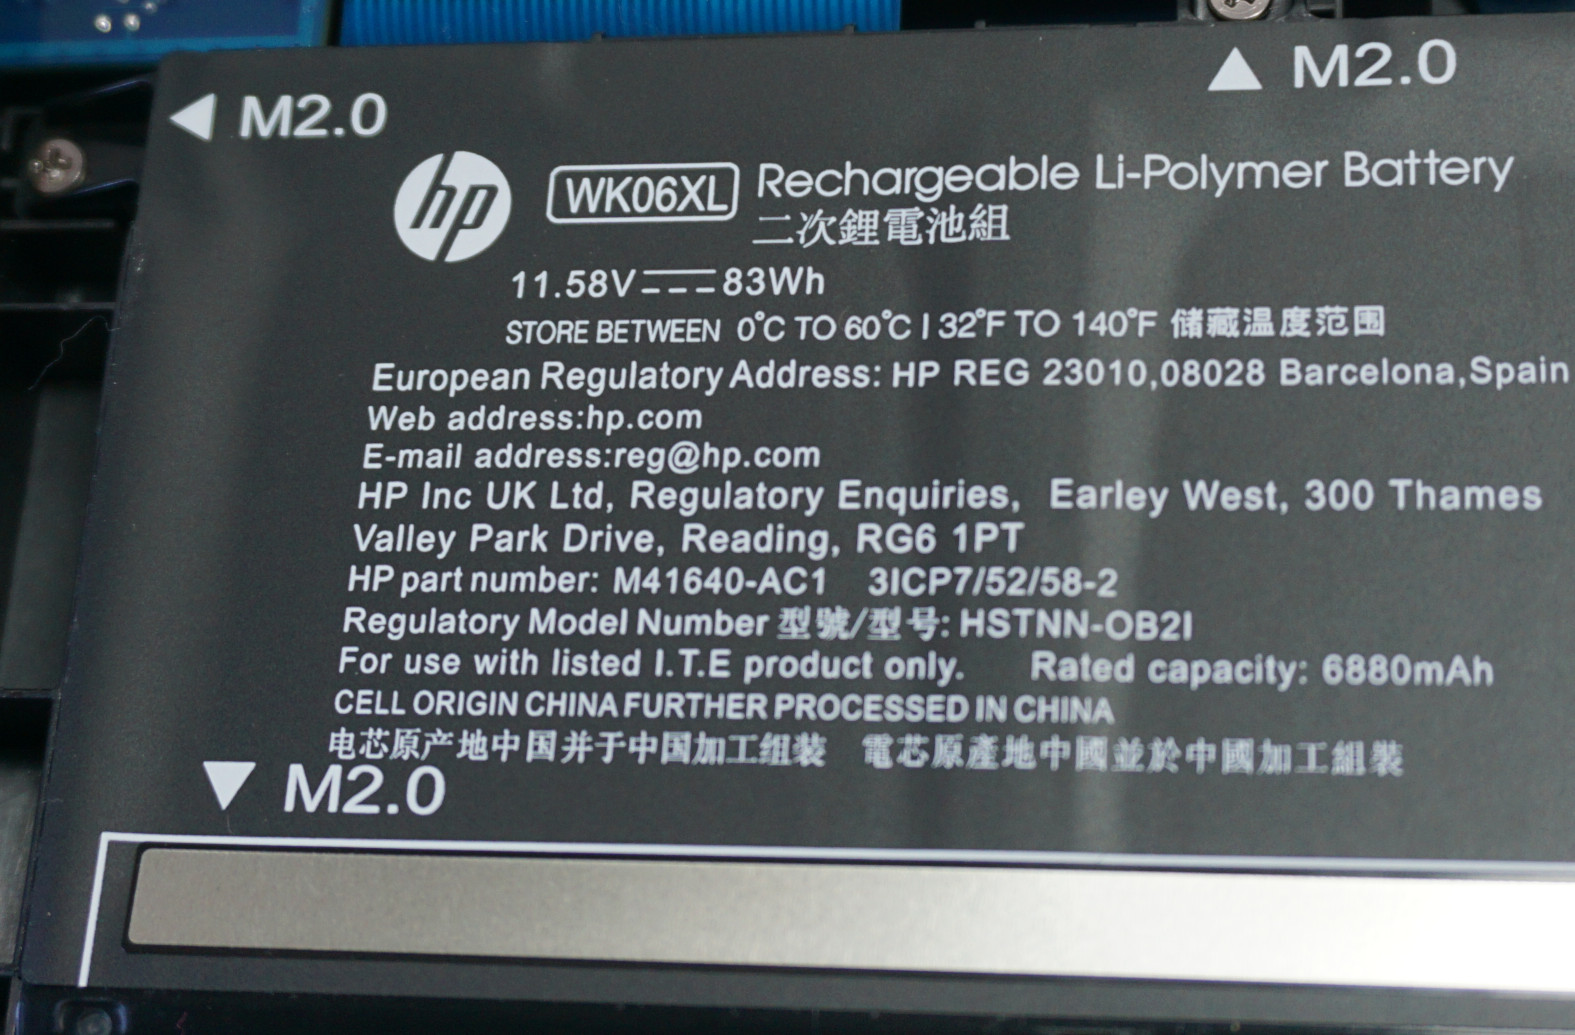
As we expected in light of the moderate power consumption, the battery life is at a high level considering the computing performance. Although with a 83-Wh capacity, the battery is smaller than those in other midrange gaming laptops, the runtime in our web surfing test is slightly longer than 9 hours. During this test, the display brightness is reduced to 150 cd/m², which should usually also be sufficient for deskwork and generally during the evening hours.
At maximum brightness, the Omen 17 isn't quite as efficient. The large display demands its due, resulting in the battery life almost halving to barely 5 hours. Playing videos is also less efficient. As is also becoming apparent during video streaming, the integrated graphics are used to a fairly full extent. But at least the battery life then almost reaches the 8-hour mark.
While the battery life might not be outstanding overall, it is at a good level for a gaming laptop.
| HP Omen 17-db0079ng R7 8845HS, NVIDIA GeForce RTX 4070 Laptop GPU, 83 Wh | Alienware m16 R2 Ultra 7 155H, NVIDIA GeForce RTX 4070 Laptop GPU, 90 Wh | Asus ROG Strix Scar 16 G634JZR i9-14900HX, NVIDIA GeForce RTX 4080 Laptop GPU, 90 Wh | Acer Predator Helios Neo 16 (2024) i7-14700HX, NVIDIA GeForce RTX 4070 Laptop GPU, 90.61 Wh | Asus TUF Gaming A17 FA707XI-NS94 R9 7940HS, NVIDIA GeForce RTX 4070 Laptop GPU, 90 Wh | Asus TUF Gaming A15 FA507UV R9 8945H, NVIDIA GeForce RTX 4060 Laptop GPU, 90 Wh | Average of class Gaming | |
|---|---|---|---|---|---|---|---|
| Battery Runtime | -11% | -11% | -53% | 1% | 29% | -15% | |
| H.264 | 462 | 451 -2% | 242 -48% | 456 ? -1% | |||
| WiFi v1.3 | 544 | 483 -11% | 434 -20% | 227 -58% | 548 1% | 702 29% | 384 ? -29% |
| Cyberpunk 2077 ultra 150cd | 59 | ||||||
| Witcher 3 ultra | 57 | 65 ? |
Pros
Cons
Verdict - The focus on gaming requires some compromises
The HP Omen 17 (2024) is a pure gaming laptop that doesn't offer more than the necessary equipment anywhere. This results in a combination of elevated computing performance for demanding games and an acceptable price.
The RTX 4070 and AMD Ryzen 7 of the eighth generation go well together with the QHD display, even if its 240 Hertz refresh rate is almost impossible to reach with current games. Unfortunately, the rest of the display characteristics are insufficient to also be able to handle tasks such as image processing at a high level.
Fast gaming with a subdued fan noise, but the Omen 17 doesn't offer much more than that.
What is also successful is the implementation of the cooling system. HP configures the CPU and GPU to run below their maximum capabilities and makes good use of the space inside a 17-inch laptop. Even under the highest load, the fan noise still remains bearable. In "Balanced" mode, it even disappears into the background.
In all the remaining areas, there are some hefty compromises. The connections are limited and those that are available are relatively slow. The webcam and speakers fulfill only the lowest demands at best. And finally, the input devices are only suitable for gaming to a limited extent, so that you should not only add the customary gaming mouse but also a suitable keyboard.
While the competitors with a comparable gaming performance are often able to offer the better overall package, they are also more expensive. An alternative that is hardly better equipped and even has a weaker display while at least offering a solid keyboard is the Asus TUF Gaming A17 F707. And with two Thunderbolt 4 connections and an excellent display, the Acer Predator Helios Neo 16 is clearly a better laptop. But if we only consider the pure gaming performance, neither of those two laptops is significantly faster - but only much louder.
Price and Availability
The HP Omen 17 (2024) is available directly from HP starting from $999. You can configure the components and our tested configuration with an RTX 4070 and QHD display costs ~$1660. Amazon offers a model with the same processor but the RTX 4050 for ~$1500.
Note that we recently updated our rating system and that the results of version 8 are not comparable anymore with those of version 7. You can find additional information on this here.
HP Omen 17-db0079ng
- 07/22/2024 v8
Mario Petzold
 Total Sustainability Score:


Transparency
The selection of devices to be reviewed is made by our editorial team. The test sample was provided to the author as a loan by the manufacturer or retailer for the purpose of this review. The lender had no influence on this review, nor did the manufacturer receive a copy of this review before publication. There was no obligation to publish this review. We never accept compensation or payment in return for our reviews. As an independent media company, Notebookcheck is not subjected to the authority of manufacturers, retailers or publishers.
This is how Notebookcheck is testing
Every year, Notebookcheck independently reviews hundreds of laptops and smartphones using standardized procedures to ensure that all results are comparable. We have continuously developed our test methods for around 20 years and set industry standards in the process. In our test labs, high-quality measuring equipment is utilized by experienced technicians and editors. These tests involve a multi-stage validation process. Our complex rating system is based on hundreds of well-founded measurements and benchmarks, which maintains objectivity. Further information on our test methods can be found here.
Price comparison

