Notebookcheck Logo

Intel Core Ultra 5 226V vs Intel Core Ultra 5 225H vs Intel Core Ultra 7 265H

Intel Core Ultra 5 226V

► remove from comparison Intel Core Ultra 5 226V

The Intel Core Ultra 5 226V is one of the 2 slowest Lunar Lake family processors as of Nov 2024. This is an SoC for use in tablets and laptops of the slimmer kind that was unveiled in Autumn 2024. It features 4 new Skymont E-cores and 4 new Lion Cove P-cores running at up to 3.5 GHz and 4.5 GHz respectively, along with the new Arc 130V iGPU and 16 GB of on-package LPDDR5x-8533 RAM. A new 40 TOPS neural engine, Thunderbolt 4 and PCIe 5 SSD support are included as well.

The only difference between this chip and the Ultra 5 228V is the amount of on-package, non-replaceable RAM: 16 GB vs 32 GB respectively.

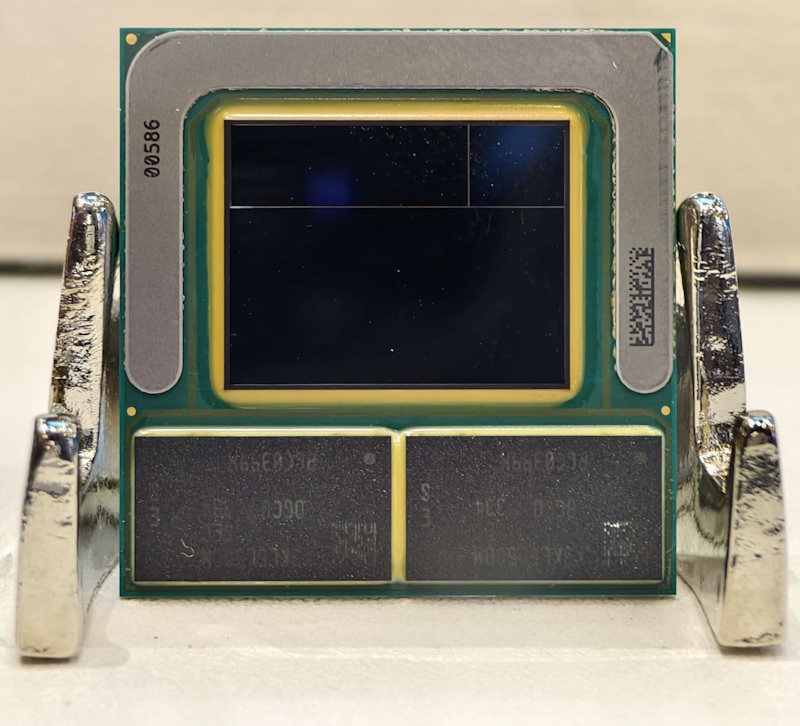
Architecture and Features

Lunar Lake is built using the Foveros technology (stacking several dies on top of each other and next to each other), just like Meteor Lake was. The new chips make use of the enormous BGA2833 socket interface. Of the 8 cores, not a single one is Hyper-Threading-enabled which is the opposite of what AMD currently does with its Zen 5/5c chips.

Intel claims Lion Cove cores bring a 14% IPC improvement over Redwood Cove. For Skymont and Crestmont, the difference is a staggering 68%. Several tweaks and improvements are present here, such as the Low Latency Fabric that is supposed to make small data transfers between cores/caches a lot faster. The 226V's level 3 cache is pretty small as compared to more expensive Ultra 7 2xxV and Ultra 9 2xxV chips at 8 MB vs 12 MB. Elsewhere, the 226V has 4 PCIe 5 and 4 PCIe 4 lanes for connecting various kinds of devices, including NVMe SSDs at up to 15.75 GB/s. Thunderbolt 4 support is onboard by default, as is support for CNVi WiFi 7 + BT 5.4 cards from Intel. The 40 TOPS "AI Boost" neural engine is present along with technologies such as Threat Detection to make AI-enabled applications such as the Windows Defender more powerful.

Intel is predicted to get short of on-package RAM in subsequent CPU generations.

Performance

Our in-house testing of an Acer laptop powered by the Ultra 5 chip revealed the latter to be about as fast as the Ryzen 7 7730U and the Ryzen 7 7735U in multi-threaded tasks which is OK but not mind-blowing for late 2024. It is worth noting that the laptop in question does not use the Intel-recommended 17 W long-term power target; instead, the processor gets 30 W to eat which affects its benchmark scores significantly.

Generally speaking, the 226V, 228V, 236V and 238V are slower than the 256V, 258V, 266V, 268V, 288V due to the difference in their last-level cache size as well as clock speeds. However, the difference in performance between the slowest Lunar Lake chip, the 226V, and the fastest chip, the 288V is fairly small at around 10% to 15%. Exact figures depend on the TDP values of the laptops being pitted against each other more than on anything else.

Graphics

The Arc Graphics 130V has 7 Xe² architecture "cores" running at up to 1,850 MHz, as well as 7 ray tracing units at its disposal. This is a direct successor to the Arc 7 iGPU; it is DirectX 12 Ultimate-enabled and able to HW-decode a long list of video codecs such as h.266 VVC, h.265 HEVC, h.264 AVC, AV1 and VP9. Three SUHD 4320p monitors can be used simultaneously with this iGPU.

Its performance can be vastly different depending on which benchmarks and games one runs. Oftentimes, it isn't much faster than its direct predecessor, the Arc 7. It is clear the 130V isn't fast enough to run most triple-A 2024 games at 1080p. However, it's still more than good enough for an occasional gaming session.

Power consumption

While this 2nd generation Core Ultra processor is supposed to consume 17 W when under long-term workloads, the only laptop powered by this chip that we have tested as of early Nov 2024 has a much higher value than that at 30 W.

The Intel-recommended short-term power limit for the chip sits at 37 W.

Intel Core Ultra 5 225H

► remove from comparison Intel Ultra 5 225H

The Intel Core Ultra 5 225H is a mobile high-end CPU for larger notebooks based on the Arrow Lake architecture. It offers 14 cores consisting of 4 fast performance cores (Lion Cove) with up to 4.9 GHz and 8 smaller efficiency cores (Skymont) with up to 4.3 GHz clock speed and two additional "low power" efficiency cores with up to 2.5 GHz (Skymont). The CPU has access to 24 MB of cache and is specified with a TDP of 28 watts (PL1, 115W PL2).

The SoC integrates a small dedicated NPU called AI Boost with 13 TOPS (Int8) and optionally supports vPro Essentials. The integrated memory controller supports up to 192 GB LPDDR5/x-8400 or DDR5-6400 (dual channel). The integrated GPU (iGPU) is an Intel Arc 130T graphics card which offers eight Xe cores with up to 2.2 GHz.

Performance - High End

Compared to the more powerful variants (such as the top model Core Ultra 9 285H) due to the lack of two P-cores. However, thanks to the improved IPC of the cores (especially the efficiency cores), the CPU should be able to hold its own against its Raptor Lake predecessors. As a result, the CPU is also very suitable for demanding tasks such as gaming and content creation.

Chiplet design

Like the desktop and HX chips, the Arrow Lake-H chips are based on individual chiplets that are placed on a 22nm base tile using Foveros 3D packaging. The CPU part comes from TSMC using the modern N3B (3nm) process. As with HX, the GPU also comes from TSMC and is manufactured using the N5P process. SoC and I/O Tile also from TSMC but in the older N6 process.

Intel Core Ultra 7 265H

► remove from comparison Intel Ultra 7 265H

The Intel Core Ultra 7 265H is a mobile high-end CPU for larger notebooks based on the Arrow Lake architecture. It offers 16 cores consisting of 6 fast performance cores (Lion Cove) with up to 5.3 GHz and 8 smaller efficiency cores (Skymont) with up to 4.5 GHz clock speed and two additional "low power" efficiency cores with up to 2.5 GHz (Skymont). The CPU has access to 24 MB of cache and is specified with a TDP of 28 watt (PL1, 115W PL2).

The SoC integrates a small dedicated NPU called AI Boost with 13 TOPS (Int8) and optionally supports vPro Enterprise. The integrated memory controller supports up to 192 GB LPDDR5/x-8400 or DDR5-6400 (dual channel). The integrated GPU (iGPU) is an Intel Arc 140T graphics card which offers eight Xe cores with up to 2.3 GHz.

Performance - High End

Compared to the fastest model of the Arrow Lake-H series (Core Ultra 9 285H), the Core Ultra 7 as only slightly slower due to a reduced maximum Turbo frequency of 100 MHz. Thanks to the improved IPC of the cores (especially the efficiency cores), the CPU should reach the level of the old Raptor Lake Core Core 9 270H (6 + 8 cores, max 5.8 / 4.1 GHz). This makes the CPU ideal for very demanding tasks such as high-end gaming and content creation.

Chiplet design

Like the desktop and HX chips, the Arrow Lake-H chips are based on individual chiplets that are placed on a 22nm base tile from Intel using Foveros 3D packaging. The CPU part comes from TSMC using the modern N3B (3nm) process. As with HX, the GPU also is produced at TSMC and is manufactured using the N5P process. SoC and I/O Tile are also from TSMC but in the older N6 process.

ModelIntel Core Ultra 5 226VIntel Core Ultra 5 225HIntel Core Ultra 7 265H
CodenameLunar LakeArrow Lake-HArrow Lake-H
SeriesIntel Lunar LakeIntel Arrow LakeIntel Arrow Lake
Series: Arrow Lake Arrow Lake-H
Intel Core Ultra 9 288V3.3 - 5.1 GHz8 / 8 cores12 MB L3
Intel Core Ultra 7 268V2.2 - 5 GHz8 / 8 cores12 MB L3
Intel Core Ultra 7 266V2.2 - 5 GHz8 / 8 cores12 MB L3
Intel Core Ultra 7 258V2.2 - 4.8 GHz8 / 8 cores12 MB L3
Intel Core Ultra 7 256V2.2 - 4.8 GHz8 / 8 cores12 MB L3
Intel Core Ultra 5 238V2.1 - 4.7 GHz8 / 8 cores8 MB L3
Intel Core Ultra 5 236V2.1 - 4.7 GHz8 / 8 cores8 MB L3
Intel Core Ultra 5 228V2.1 - 4.5 GHz8 / 8 cores8 MB L3
Intel Core Ultra 5 226V « 2.1 - 4.5 GHz8 / 8 cores8 MB L3
Intel Core Ultra 9 285H4.5 - 5.4 GHz16 / 16 cores24 MB L3
Intel Core Ultra 7 265H4.5 - 5.3 GHz16 / 16 cores24 MB L3
Intel Core Ultra 7 255H4.4 - 5.1 GHz16 / 16 cores24 MB L3
Intel Core Ultra 5 235H4.4 - 5.1 GHz14 / 14 cores18 MB L3
Intel Core Ultra 5 225H « 4.3 - 4.9 GHz14 / 14 cores18 MB L3
Intel Core Ultra 9 285H4.5 - 5.4 GHz16 / 16 cores24 MB L3
Intel Core Ultra 7 265H « 4.5 - 5.3 GHz16 / 16 cores24 MB L3
Intel Core Ultra 7 255H4.4 - 5.1 GHz16 / 16 cores24 MB L3
Intel Core Ultra 5 235H4.4 - 5.1 GHz14 / 14 cores18 MB L3
Intel Core Ultra 5 225H4.3 - 4.9 GHz14 / 14 cores18 MB L3
Clock2100 - 4500 MHz4300 - 4900 MHz4500 - 5300 MHz
L1 Cache1.4 MB
L2 Cache14 MB20 MB26 MB
L3 Cache8 MB18 MB24 MB
Cores / Threads8 / 8
4 x 4.5 GHz Intel Lion Cove P-Core
4 x 3.5 GHz Intel Skymont E-Core
14 / 14
4 x 4.9 GHz Intel Lion Cove P-Core
8 x 4.3 GHz Intel Skymont E-Core
2 x 2.3 GHz Intel Crestmont E-Core
16 / 16
6 x 5.3 GHz Intel Lion Cove P-Core
8 x 4.5 GHz Intel Skymont E-Core
2 x 2.5 GHz Intel Crestmont E-Core
TDP17 Watt28 Watt28 Watt
TDP Turbo PL237 Watt115 Watt115 Watt
Technology3 nm3 nm3 nm
max. Temp.100 °C110 °C110 °C
SocketBGA2833
FeaturesLPDDR5x-8533 RAM, PCIe 5 + PCIe 4, USB 4, AI Boost NPU (40 TOPS), Thread Director, PSE, Threat Detection, MMX, SSE, SSE2, SSE3, SSSE3, SSE4.1, SSE4.2, AES, AVX, AVX2, AVX-VNNi, FMA3, SHA
iGPUIntel Arc Graphics 130V (300 - 1850 MHz)Intel Arc Graphics 130T ( - 2200 MHz)Intel Arc Graphics 140T ( - 2300 MHz)
NPU / AI40 TOPS INT813 TOPS INT813 TOPS INT8
Chip AI97 TOPS INT883 TOPS INT897 TOPS INT8
Architecturex86x86x86
Announced
Manufacturerark.intel.comwww.intel.comark.intel.com
$385 U.S.$471 U.S.

Benchmarks

Performance Rating - CB R15 + R20 + 7-Zip + X265 + Blender + 3DM11 CPU - Core Ultra 5 226V
36.4 pt (61%)
Restrict / Search: Model: Max. age: years
Performance Rating - CB R15 + R20 + 7-Zip + X265 + Blender + 3DM11 CPU - Ultra 5 225H
40.6 pt (68%)
Restrict / Search: Model: Max. age: years
Performance Rating - CB R15 + R20 + 7-Zip + X265 + Blender + 3DM11 CPU - Ultra 7 265H
42.6 pt (71%)
Restrict / Search: Model: Max. age: years
Cinebench 2024 - Cinebench 2024 CPU Single Core
min: 111     avg: 112.3     median: 112 (56%)     max: 114.1 Points
119.8 Points (60%)
125.8 Points (63%)
Cinebench 2024 - Cinebench 2024 CPU Multi Core
min: 530     avg: 572     median: 584 (11%)     max: 609 Points
859 Points (16%)
1150 Points (21%)
Cinebench R23 - Cinebench R23 Multi Core
min: 9827     avg: 9870     median: 9857.5 (9%)     max: 9940 Points
16466 Points (15%)
min: 19421     avg: 20243     median: 19940 (19%)     max: 21369 Points
Cinebench R23 - Cinebench R23 Single Core
min: 1699     avg: 1742     median: 1732 (70%)     max: 1821 Points
1992 Points (81%)
min: 2011     avg: 2057     median: 2080 (85%)     max: 2081 Points
Cinebench R20 - Cinebench R20 CPU (Single Core)
min: 653     avg: 670     median: 666.5 (73%)     max: 703 Points
763 Points (83%)
min: 776     avg: 787     median: 791 (86%)     max: 793 Points
Cinebench R20 - Cinebench R20 CPU (Multi Core)
min: 3826     avg: 3856     median: 3849 (9%)     max: 3889 Points
6399 Points (16%)
min: 7532     avg: 7912     median: 7805 (19%)     max: 8400 Points
Cinebench R15 - Cinebench R15 CPU Multi 64 Bit
min: 1483     avg: 1504     median: 1505.5 (10%)     max: 1531 Points
2626 Points (17%)
min: 2851     avg: 3093     median: 2989 (19%)     max: 3440 Points
Cinebench R15 - Cinebench R15 CPU Single 64 Bit
min: 261     avg: 267.5     median: 266.5 (74%)     max: 278 Points
296 Points (82%)
min: 305     avg: 308     median: 307 (85%)     max: 312 Points
Cinebench R11.5 - Cinebench R11.5 CPU Multi 64 Bit
19.1 Points (25%)
31.5 Points (41%)
Cinebench R11.5 - Cinebench R11.5 CPU Single 64 Bit
3.1 Points (75%)
3.6 Points (85%)
Cinebench R10 - Cinebench R10 Rend. Single (32bit)
9738 Points (59%)
10817 Points (65%)
Cinebench R10 - Cinebench R10 Rend. Multi (32bit)
42086 Points (30%)
60850 Points (44%)
wPrime 1.55 - wPrime 1.55 1024m *
506 s (2%)
wPrime 1.55 - wPrime 1.55 32m *
9.1 s (5%)
WinRAR - WinRAR 4.0
4824 Points (8%)
13090 Points (21%)
7-Zip 18.03 - 7-Zip 18.03 Multi Thread 4 runs
min: 32929     avg: 33177     median: 33110 (19%)     max: 33446 MIPS
51720 MIPS (30%)
min: 60489     avg: 64781     median: 64940 (37%)     max: 68913 MIPS
7-Zip 18.03 - 7-Zip 18.03 Single Thread 4 runs
min: 5240     avg: 5299     median: 5305 (63%)     max: 5341 MIPS
5695 MIPS (67%)
min: 5777     avg: 6080     median: 6160 (73%)     max: 6304 MIPS
X264 HD Benchmark 4.0 - x264 Pass 2
93.6 fps (2%)
X264 HD Benchmark 4.0 - x264 Pass 1
305.4 fps (8%)
HWBOT x265 Benchmark v2.2 - HWBOT x265 4k Preset
min: 12.2     avg: 12.5     median: 12.6 (22%)     max: 12.8 fps
18.5 fps (33%)
min: 22.9     avg: 23.8     median: 23.1 (41%)     max: 25.3 fps
TrueCrypt - TrueCrypt Serpent
0.6 GB/s (19%)
1 GB/s (29%)
TrueCrypt - TrueCrypt Twofish
1.1 GB/s (19%)
1.8 GB/s (31%)
TrueCrypt - TrueCrypt AES
7.1 GB/s (18%)
7.6 GB/s (20%)
Blender - Blender 3.3 Classroom CPU *
min: 550     avg: 579     median: 572 (7%)     max: 624 Seconds
358 Seconds (5%)
min: 266     avg: 281     median: 280 (4%)     max: 297 Seconds
Blender - Blender 2.79 BMW27 CPU *
min: 346     avg: 351.8     median: 352.5 (2%)     max: 357 Seconds
216 Seconds (2%)
min: 164     avg: 172     median: 172 (1%)     max: 180 Seconds
R Benchmark 2.5 - R Benchmark 2.5 *
min: 0.4719     avg: 0.5     median: 0.5 (10%)     max: 0.4896 sec
0.5 sec (10%)
min: 0.4241     avg: 0.4     median: 0.4 (9%)     max: 0.4696 sec
3DMark 06 - CPU - 3DMark 06 - CPU
10506 Points (22%)
14676 Points (31%)
15477 Points (33%)
Super Pi mod 1.5 XS 1M - Super Pi mod 1.5 XS 1M *
8.8 s (2%)
7.9 s (2%)
Super Pi mod 1.5 XS 2M - Super Pi mod 1.5 XS 2M *
19.2 s (1%)
17.3 s (1%)
Super Pi Mod 1.5 XS 32M - Super Pi mod 1.5 XS 32M *
458.3 s (2%)
704 s (3%)
3DMark Vantage - 3DM Vant. Perf. CPU no Physx
48122 Points (37%)
81609 Points (63%)
94058 Points (72%)
3DMark 11 - 3DM11 Performance Physics
min: 13908     avg: 14264     median: 14291 (35%)     max: 14451 Points
19195 Points (47%)
min: 20887     avg: 22570     median: 21652 (53%)     max: 25172 Points
3DMark - 3DMark Ice Storm Physics
min: 76606     avg: 82379     median: 82379 (67%)     max: 88152 Points
107420 Points (87%)
3DMark - 3DMark Ice Storm Extreme Physics
104953 Points (85%)
3DMark - 3DMark Cloud Gate Physics
min: 13013     avg: 13232     median: 13330 (34%)     max: 13354 Points
19866 Points (50%)
min: 17390     avg: 20373     median: 21194 (54%)     max: 22536 Points
3DMark - 3DMark Fire Strike Standard Physics
min: 19392     avg: 19786     median: 19827.5 (35%)     max: 20013 Points
30932 Points (55%)
min: 30080     avg: 32315     median: 33006 (59%)     max: 33858 Points
3DMark - 3DMark Time Spy CPU
min: 6638     avg: 7187     median: 7298.5 (31%)     max: 7639 Points
8886 Points (37%)
min: 10908     avg: 12202     median: 11639 (49%)     max: 14059 Points
Geekbench 6.5 - Geekbench 6.5 Single-Core
min: 2527     avg: 2590     median: 2582 (60%)     max: 2697 Points
min: 2678     avg: 2724     median: 2724 (63%)     max: 2770 Points
min: 2822     avg: 2886     median: 2906 (67%)     max: 2911 Points
Geekbench 6.5 - Geekbench 6.5 Multi-Core
min: 9850     avg: 10001     median: 10010.5 (39%)     max: 10151 Points
min: 12099     avg: 12767     median: 12766.5 (50%)     max: 13434 Points
min: 14502     avg: 15746     median: 15669.5 (61%)     max: 17144 Points
Geekbench 5.5 - Geekbench 5.1 - 5.5 64 Bit Single-Core
min: 1852     avg: 1878     median: 1877.5 (63%)     max: 1912 Points
1987 Points (67%)
min: 2037     avg: 2075     median: 2079 (70%)     max: 2110 Points
Geekbench 5.5 - Geekbench 5.1 - 5.5 64 Bit Multi-Core
min: 8704     avg: 8891     median: 8920 (16%)     max: 8995 Points
11570 Points (21%)
min: 14714     avg: 15371     median: 14945 (27%)     max: 16453 Points
Geekbench 4.4 - Geekbench 4.1 - 4.4 64 Bit Single-Core
7753 Points (77%)
Geekbench 4.4 - Geekbench 4.1 - 4.4 64 Bit Multi-Core
31261 Points (31%)
Mozilla Kraken 1.1 - Kraken 1.1 Total Score *
min: 503     avg: 518     median: 510 (1%)     max: 543 ms
458 ms (1%)
min: 449     avg: 455.3     median: 458 (1%)     max: 459 ms
Octane V2 - Octane V2 Total Score
min: 93103     avg: 96298     median: 97354 (64%)     max: 98436 Points
116620 Points (77%)
WebXPRT 4 - WebXPRT 4 Score
min: 248     avg: 256.2     median: 255.3 (66%)     max: 266 Points
294 Points (77%)
min: 302     avg: 303     median: 302 (79%)     max: 305 Points
WebXPRT 3 - WebXPRT 3 Score
min: 272     avg: 281     median: 282 (51%)     max: 286 Points
309 Points (55%)
min: 321     avg: 324.3     median: 323 (58%)     max: 329 Points
CrossMark - CrossMark Overall
min: 1522     avg: 1568     median: 1560 (58%)     max: 1620 Points
1754 Points (66%)
min: 1812     avg: 1893     median: 1888 (71%)     max: 1978 Points
Power Consumption - Prime95 Power Consumption - external Monitor *
min: 29.4     avg: 46.6     median: 47.9 (8%)     max: 55.5 Watt
60.6 Watt (10%)
min: 75.6     avg: 93.2     median: 91.9 (16%)     max: 112 Watt
Power Consumption - Cinebench R15 Multi Power Consumption - external Monitor *
min: 50.5     avg: 53     median: 52.8 (10%)     max: 56.1 Watt
69.5 Watt (13%)
min: 95.6     avg: 122.1     median: 122.1 (22%)     max: 148.5 Watt
Power Consumption - Idle Power Consumption - external Monitor *
min: 2.89     avg: 4.8     median: 5 (3%)     max: 6.42 Watt
4.4 Watt (3%)
min: 4.52     avg: 7.9     median: 8.4 (6%)     max: 10.9 Watt
Power Consumption - Idle Power Consumption 150cd 1min *
min: 4.27     avg: 5.5     median: 5.5 (4%)     max: 6.69 Watt
5.8 Watt (4%)
min: 5.12     avg: 6.1     median: 5.5 (4%)     max: 7.64 Watt
Power Consumption - Power Efficiency - Cinebench R15 Multi external Monitor
min: 27.3     avg: 28.5     median: 28.3 (21%)     max: 30 Points per Watt
37.8 Points per Watt (28%)
min: 23.2     avg: 26.5     median: 26.5 (20%)     max: 29.8 Points per Watt

Average Benchmarks Intel Core Ultra 5 226V → 100% n=28

Average Benchmarks Intel Core Ultra 5 225H → 133% n=28

Average Benchmarks Intel Core Ultra 7 265H → 153% n=28

- Range of benchmark values for this graphics card
red legend - Average benchmark values for this graphics card
* Smaller numbers mean a higher performance
1 This benchmark is not used for the average calculation

v1.35
log 19. 03:33:21

#0 ran 0s before starting gpusingle class +0s ... 0s

#1 checking url part for id 18000 +0s ... 0s

#2 checking url part for id 18910 +0s ... 0s

#3 checking url part for id 18901 +0s ... 0s

#4 redirected to Ajax server, took 1766111600s time from redirect:0 +0s ... 0s

#5 did not recreate cache, as it is less than 5 days old! Created at Tue, 16 Dec 2025 05:18:30 +0100 +0s ... 0s

#6 composed specs +0.01s ... 0.01s

#7 did output specs +0s ... 0.01s

#8 getting avg benchmarks for device 18000 +0.004s ... 0.013s

#9 got single benchmarks 18000 +0.011s ... 0.025s

#10 getting avg benchmarks for device 18910 +0.003s ... 0.028s

#11 got single benchmarks 18910 +0.005s ... 0.033s

#12 getting avg benchmarks for device 18901 +0.003s ... 0.036s

#13 got single benchmarks 18901 +0.007s ... 0.043s

#14 got avg benchmarks for devices +0s ... 0.043s

#15 min, max, avg, median took s +0.057s ... 0.101s

#16 return log +0s ... 0.101s

Please share our article, every link counts!
Mail Logo
Google Logo Add as a preferred
source on Google
> Expert Reviews and News on Laptops, Smartphones and Tech Innovations > Benchmarks / Tech > Processor Comparison - Head 2 Head
Redaktion, 2017-09- 8 (Update: 2023-07- 1)