Notebookcheck Logo

Qualcomm Adreno 640 vs Intel Iris Plus Graphics 645 vs Qualcomm Adreno 642L

Qualcomm Adreno 640

► remove from comparison Qualcomm Adreno 640

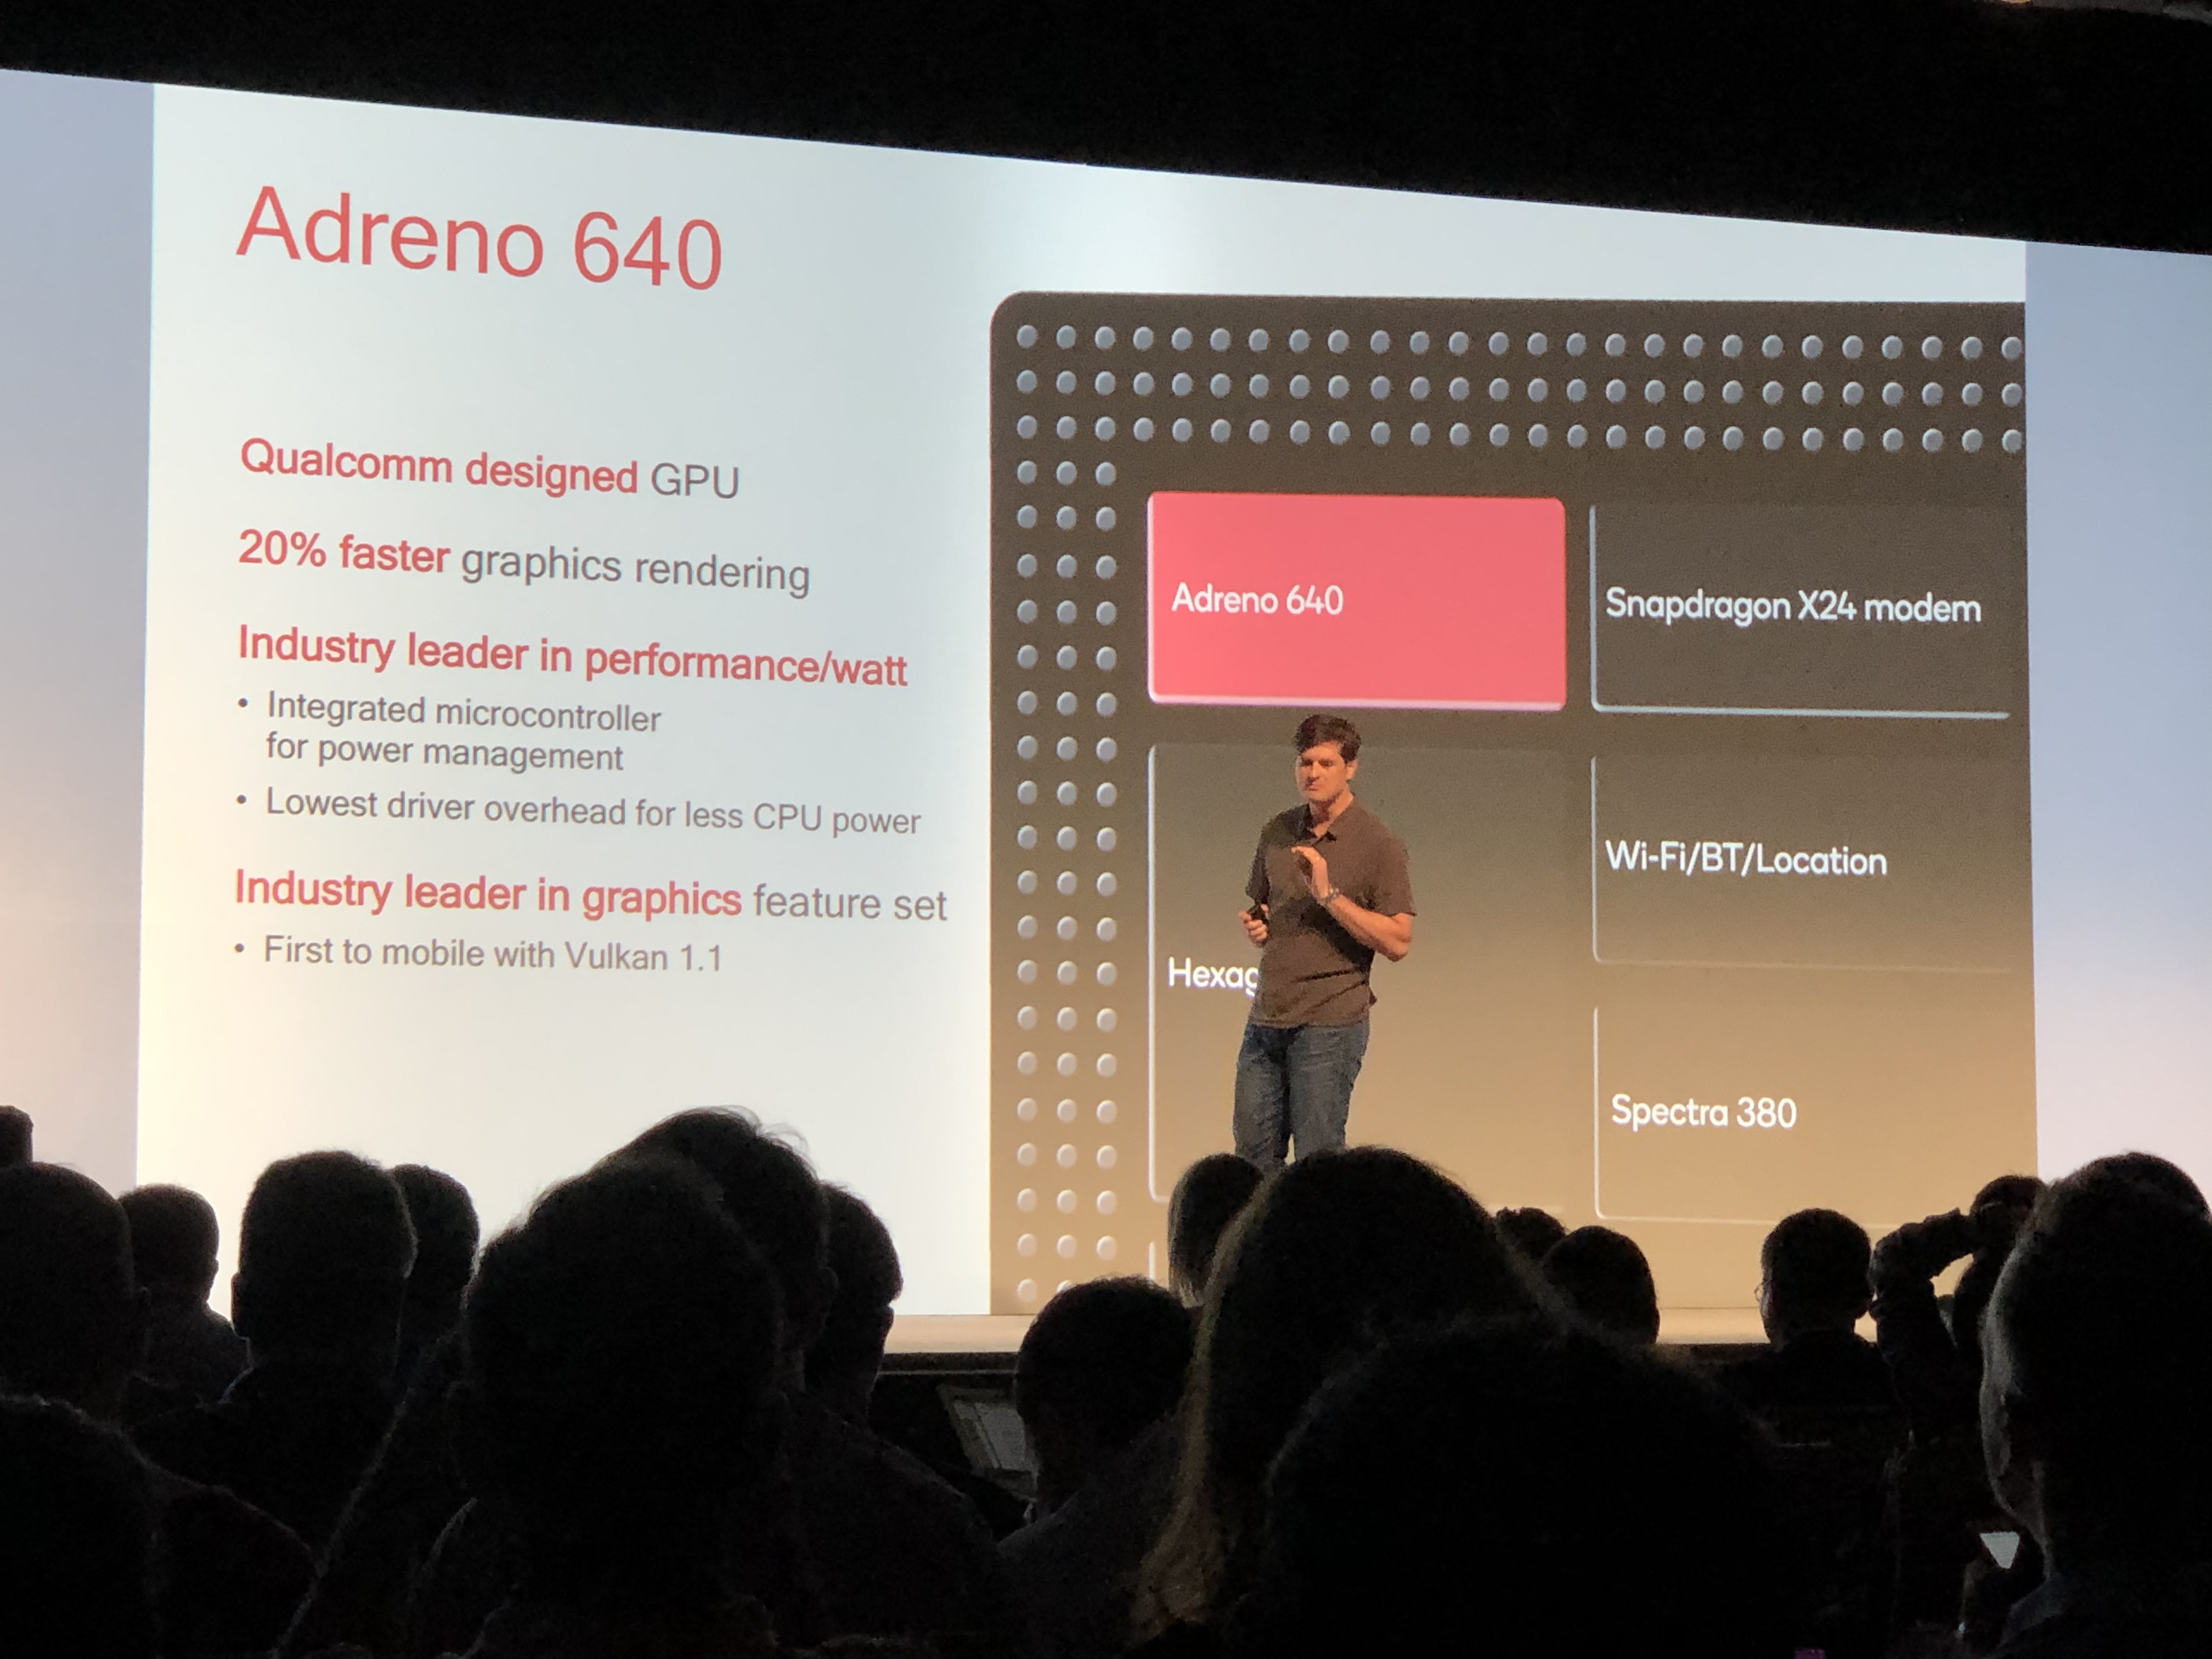
The Qualcomm Adreno 640 is a smartphone and tablet GPU that is integrated within the Qualcomm Snapdragon 855 SoC. The chip will be available from early 2019 and will be used mainly in high-end Android devices.

According to Qualcomm, the Adreno 640 GPU offers a 20% improved performance over the Adreno 630, its predecessor, which is integrated in the Snapdragon 845 SoC. The enhanced performance is achieved by the Adreno 640 having 50% more FP16 and FP32 compute units (ALUs) than the Adreno 630, while its 7 nm FinFET manufacturing process makes it 20% more efficient too.

The Adreno 640 will also support the Vulkan 1.1 API, something which is possible for other Adreno 600 series GPUs too.

Intel Iris Plus Graphics 645

► remove from comparison Intel Iris Plus Graphics 645

The Intel Iris Plus Graphics 645 (GT3e) is a processor graphics card that was first seen in the Apple MacBook Pro 13 (Entry, 2019) in mid 2019. It is similar to the Iris Plus Graphics 655 in the 28 Watt CPUs.

The so called GT3e version of the Coffee-Lake GPU still has 48 Execution Units (EUs), which can reach up to 1150 MHz depending on the model. Besides eDRAM cache, the Iris 645 can also access the system memory (2x 64 Bit DDR3L-2133/DDR4-2400) via processor interface.

Performance

The exact performance of the Iris Plus Graphics 645 depends on the CPU model, because maximum clock as well as the size of the L3 cache can differ a bit. The system memory (DDR3/DDR4) will influence the performance as well.

The fastest chips are high-clocked Core i7 models like the Core i7-8557U. Depending on the game, the Iris Plus 655 will probably be on par with a dedicated GeForce 930M or GeForce 940MX and can handle smooth gameplay in modern titles in low up to medium settings.

Features

The reworked video engine now fully supports hardware decoding of H.265/HEVC videos. Contrary to Skylake, however, Kaby Lake can now also decode H.265/HEVC Main 10 with a 10-bit color depth as well as Google's VP9 codec. The video output is possible via DP 1.2/eDP 1.3 (up to 3840 x 2160 @60 Hz), whereas HDMI is also supported in the older 1.4a standard. An HDMI 2.0 output can be added via converter from DisplayPort. The GPU can drive up to three displays simultaneously.

Power Consumption

The Iris Plus Graphics 645 is used for 15-Watt processor and therefore small-sized notebooks.

Qualcomm Adreno 642L

► remove from comparison Qualcomm Adreno 642L

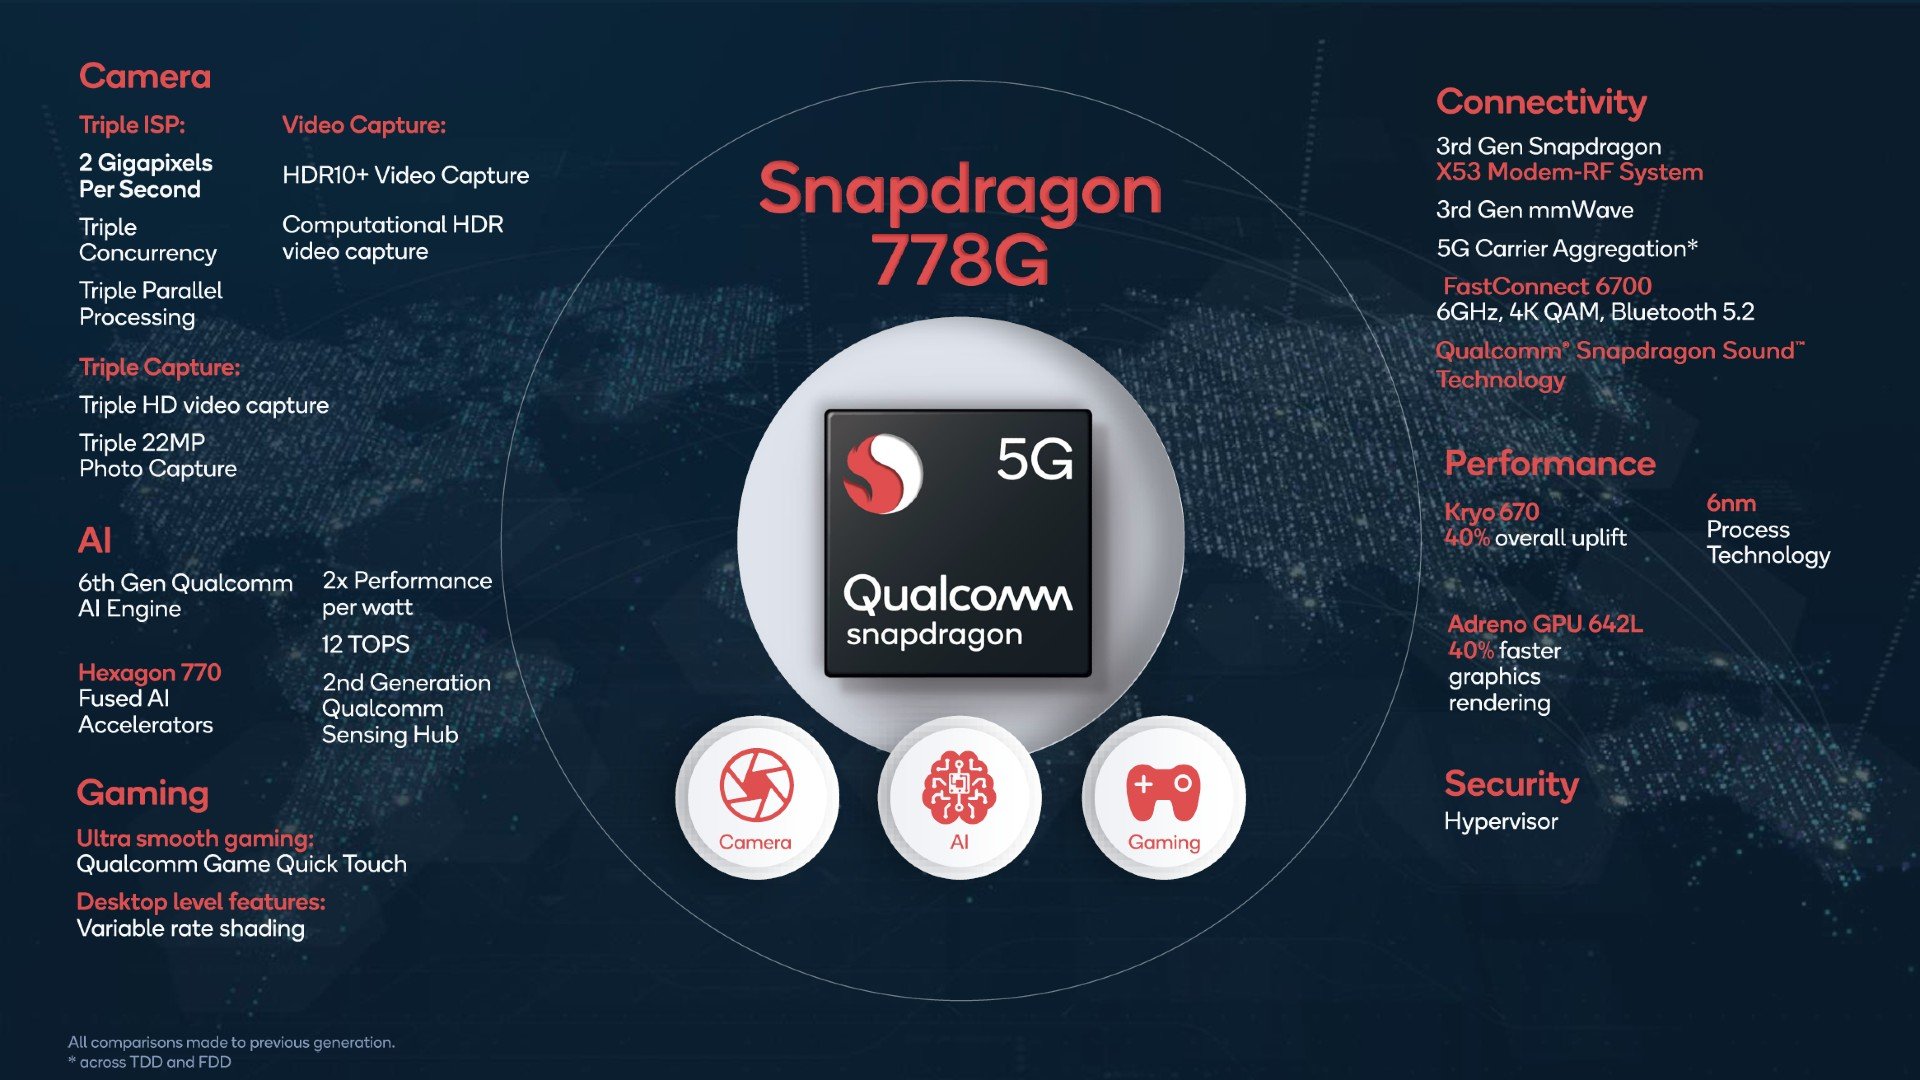
The Qualcomm Adreno 642L is a smartphone and tablet GPU that is integrated within the Qualcomm Snapdragon 778G SoC. The chip will be available from mid 2021 and will be used mainly in upper mid-range Android devices.

According to Qualcomm, the Adreno 642L GPU offers a 40% improved performance over the Adreno 620 (compared to the specified +50% of the 642 in the SD 780G), its predecessor, which is integrated in the Snapdragon 768G SoC. This is also thanks to the fast LPDDR4X-4200 memory support of the SoC.

The Adreno 642L supports OpenCL 2.0 FP, OpenGL ES 3.2 and Vulkan 1.1.

The Snapdragon 778G and therefore also the 642L is manufactured in the modern 6nm UEV process at TSMC that should provide a good power efficiency.

Qualcomm Adreno 640Intel Iris Plus Graphics 645Qualcomm Adreno 642L
Adreno 600 Series
Adreno 660
Adreno 650 @ 0.25 - 0.67 GHz
Adreno 690
Adreno 685
Adreno 680
Adreno 644
Adreno 643 @ 0.81 GHz
Adreno 642
Adreno 642L
Adreno 640
Adreno 630
Adreno 620
Adreno 619
Adreno 619L
Adreno 618
Adreno 616
Adreno 612
Adreno 610
Iris Plus Graphics 655 48 @ 0.3 - 1.2 GHz
Iris Plus Graphics 650 48 @ 0.3 - 1.1 GHz64/128 Bit
Iris Plus Graphics 645 48 @ 0.3 - 1.15 GHz
Iris Plus Graphics 640 48 @ 0.3 - 1.05 GHz64/128 Bit
UHD Graphics 630 24 @ 0.3 - 1.15 GHz64/128 Bit
UHD Graphics P630 24 @ 0.3 - 1.2 GHz64/128 Bit
HD Graphics 630 24 @ 0.3 - 1.15 GHz64/128 Bit
HD Graphics P630 24 64/128 Bit
UHD Graphics 620 24 @ 0.3 - 1.15 GHz
HD Graphics 620 24 @ 0.3 - 1.05 GHz64/128 Bit
UHD Graphics 617 24 @ 0.3 - 1.15 GHz64/128 Bit
UHD Graphics 615 24 @ 0.3 - 1 GHz64/128 Bit
HD Graphics 615 24 @ 0.3 - 1.05 GHz64/128 Bit
Adreno 660
Adreno 650 @ 0.25 - 0.67 GHz
Adreno 690
Adreno 685
Adreno 680
Adreno 644
Adreno 643 @ 0.81 GHz
Adreno 642
Adreno 642L
Adreno 640
Adreno 630
Adreno 620
Adreno 619
Adreno 619L
Adreno 618
Adreno 616
Adreno 612
Adreno 610
Shared Memoryyesyesyes
APIDirectX 12, OpenGL ES 3.2DirectX 12_1, OpenGL 4.5OpenGL ES 3.2
technology10 nm14 nm6 nm
FeaturesOpenGL ES 3.2, OpenCL 2.0, DirectX 12, Vulkan 1.1QuickSyncOpenGL ES 3.2, OpenCL 2.0, DirectX 12, Vulkan 1.1
Date of Announcement12.02.2018 10.07.2019 07.05.2021
CodenameKaby Lake GT3e
ArchitectureGen. 9.5 Coffee Lake
Pipelines48 - unified
Core Speed300 - 1150 (Boost) MHz
Memory TypeDDR3, DDR4
CPU in Adreno 640GPU Base SpeedGPU Boost / Turbo
Qualcomm Snapdragon 8608 x ? MHz, 5 W250 MHz675 MHz
Qualcomm Snapdragon 855+ / 855 Plus8 x ? MHz, 5 W250 MHz675 MHz
Qualcomm Snapdragon 8558 x 2840 MHz, 5 W? MHz585 MHz
min. - max.? - 250 MHz585 - 675 MHz
CPU in Iris Plus Graphics 645GPU Base SpeedGPU Boost / Turbo
Intel Core i7-8557U4 x 1700 MHz, 28 W300 MHz1150 MHz
Intel Core i5-8257U4 x 1400 MHz, 15 W300 MHz1050 MHz
min. - max.300 MHz585 - 1150 MHz
CPU in Adreno 642LGPU Base SpeedGPU Boost / Turbo
Qualcomm Snapdragon 778G+ 5G8 x 1900 MHz? MHz? MHz
Qualcomm Snapdragon 778G 5G8 x 1800 MHz? MHz? MHz
Qualcomm Snapdragon 778G 4G8 x 1800 MHz? MHz? MHz
min. - max.? - 300 MHz? - 1150 MHz

Benchmarks

3DMark - 3DMark Time Spy Score
624 Points (2%)
3DMark - 3DMark Time Spy Graphics
550 Points (1%)
min: 88482     avg: 89308     median: 89307.5 (10%)     max: 90133 Points
3DMark - 3DMark Fire Strike Standard Score
1736 Points (3%)
3DMark - 3DMark Fire Strike Standard Graphics
1893 Points (2%)
3DMark - 3DMark Wild Life Unlimited
min: 3079     avg: 3323     median: 3436 (2%)     max: 3455 Points
3DMark - 3DMark Wild Life Extreme Unlimited
min: 864     avg: 936     median: 970 (1%)     max: 974 Points
3DMark 11 - 3DM11 Performance Score
3238 Points (4%)
3DMark 11 - 3DM11 Performance GPU
2985 Points (3%)
Cinebench R15
Cinebench R15 OpenGL 64 Bit + Intel Iris Plus Graphics 645
Cinebench R15 - Cinebench R15 OpenGL 64 Bit
min: 55.3     avg: 67.1     median: 67.1 (4%)     max: 78.9 fps
Cinebench R15 OpenGL Ref. Match 64 Bit + Intel Iris Plus Graphics 645
Cinebench R15 - Cinebench R15 OpenGL Ref. Match 64 Bit
min: 97.8     avg: 98.6     median: 98.6 (99%)     max: 99.3 %
GFXBench - GFXBench 5.0 4K Aztec Ruins High Tier Offscreen
6.6 fps (3%)
20.2 fps (4%)
53.4 fps (4%)
69.6 fps (1%)
101.8 fps (6%)
GFXBench (DX / GLBenchmark) 2.7
GFXBench T-Rex HD Offscreen C24Z16 + Qualcomm Adreno 640
GFXBench T-Rex HD Offscreen C24Z16 + Intel Iris Plus Graphics 645
198.3 fps (2%)
GFXBench T-Rex HD Offscreen C24Z16 + Qualcomm Adreno 642L
Antutu v9 - AnTuTu v9 GPU
min: 204205     avg: 204715     median: 204715 (26%)     max: 205225 Points
Basemark GPU 1.2 - Basemark GPU 1.2 Vulkan Official Medium Offscreen 1080
64.9 fps (0%)
min: 45.96     avg: 49.6     median: 46.9 (0%)     max: 54.4 fps
Geekbench 6.2 - Geekbench 6.2 GPU OpenCL
2968 Points (1%)
Geekbench 6.2 - Geekbench 6.2 GPU Vulkan
2419 Points (1%)
PassMark PerformanceTest Mobile V1 - PerformanceTest Mobile V1 2D Graphics Tests
min: 10504     avg: 18251     median: 14922.5 (15%)     max: 40654 Points
min: 23666     avg: 31803     median: 30994 (31%)     max: 38436 Points
PassMark PerformanceTest Mobile V1 - PerformanceTest Mobile V1 3D Graphics Tests
min: 4244     avg: 11804     median: 5422.5 (9%)     max: 44840 Points
min: 26134     avg: 36660     median: 40236 (70%)     max: 43000 Points
Power Consumption - GFXBench Aztec Ruins Normal Tier Offscreen Power Consumption 150cd *
7.8 Watt (3%)

Average Benchmarks Qualcomm Adreno 640 → 100% n=5

Average Benchmarks Intel Iris Plus Graphics 645 → 114% n=5

Average Benchmarks Qualcomm Adreno 642L → 81% n=5

- Range of benchmark values for this graphics card
- Average benchmark values for this graphics card
* Smaller numbers mean a higher performance
1 This benchmark is not used for the average calculation

Game Benchmarks

The following benchmarks stem from our benchmarks of review laptops. The performance depends on the used graphics memory, clock rate, processor, system settings, drivers, and operating systems. So the results don't have to be representative for all laptops with this GPU. For detailed information on the benchmark results, click on the fps number.

Diablo Immortal

Diablo Immortal

2022
low Medium
Adreno 642L:
59 59 ~ 59 fps
ultra Ultra
Adreno 642L:
51 60 ~ 56 fps
League of Legends: Wild Rift

League of Legends: Wild Rift

2020
ultra
Adreno 642L:
61  fps
Armajet

Armajet

2020
high
100%
Adreno 640:
30 30 ~ 30 fps
297%
Adreno 642L:
60 60 60 60 89 99 103 119 120 121 ~ 89 fps
PUBG Mobile

PUBG Mobile

2018
low
Adreno 642L:
40 60 60 60 60 60 60 60 60 60 60 60 ~ 58 fps
med.
Adreno 642L:
40 40 ~ 40 fps
high
100%
Adreno 640:
30 30 30 40 40 40 59 60 60 ~ 43 fps
88%
Adreno 642L:
30 30 39 40 40 40 40 40 40 40 40 40 40 ~ 38 fps
World of Tanks Blitz

World of Tanks Blitz

2018
high
100%
Adreno 640:
60  fps
Arena of Valor

Arena of Valor

2018
low
100%
Adreno 640:
59 60 60 60 60 60 60 ~ 60 fps
ultra
100%
Adreno 640:
30 59 60 60 60 60 60 60 61 62 ~ 57 fps
Shadow Fight 3

Shadow Fight 3

2018
low
100%
Adreno 640:
59 60 60 60 ~ 60 fps
high
100%
Adreno 640:
59 60 60 60 ~ 60 fps
Battle Bay

Battle Bay

2018
high
100%
Adreno 640:
60  fps
low 1280x720
Iris Plus Graphics 645:
37.4  fps
med. 1920x1080
Iris Plus Graphics 645:
26.1  fps
high 1920x1080
Iris Plus Graphics 645:
22.5  fps
low 1280x720
Iris Plus Graphics 645:
76.5  fps
med. 1366x768
Iris Plus Graphics 645:
57.3  fps
high 1920x1080
Iris Plus Graphics 645:
29  fps
ultra 1920x1080
Iris Plus Graphics 645:
26.9  fps
Dead Trigger 2

Dead Trigger 2

2013
high
100%
Adreno 640:
60 120 ~ 90 fps
67%
Adreno 642L:
60  fps
Asphalt 9: Legends

Asphalt 9: Legends

2013
low
100%
Adreno 640:
28 30 30 30 30 30 30 30 60 60 ~ 36 fps
83%
Adreno 642L:
30 30 ~ 30 fps
high
100%
Adreno 640:
28 29 30 30 30 30 30 30 60 ~ 33 fps
91%
Adreno 642L:
30 30 ~ 30 fps
low 1280x720
Iris Plus Graphics 645:
104.6  fps
med. 1366x768
Iris Plus Graphics 645:
60  fps
high 1366x768
Iris Plus Graphics 645:
51.6  fps
ultra 1920x1080
Iris Plus Graphics 645:
22.1  fps
Temple Run 2

Temple Run 2

2013
high
100%
Adreno 640:
120  fps
Subway Surfers

Subway Surfers

2012
high
100%
Adreno 640:
60 120 ~ 90 fps
100%
Adreno 642L:
90  fps

Average Gaming Qualcomm Adreno 640 → 100%

Average Gaming 30-70 fps → 100%

Average Gaming Qualcomm Adreno 642L → 121%

Average Gaming 30-70 fps → 78%

Qualcomm Adreno 642Llowmed.highultraQHD4K
Diablo Immortal5956
League of Legends: Wild Rift61
Armajet89
PUBG Mobile584038
Dead Trigger 260
Asphalt 9: Legends3030
Subway Surfers90
< 30 fps
< 60 fps
< 120 fps
≥ 120 fps

3


1


2
3

1
1


Qualcomm Adreno 640lowmed.highultraQHD4K
Armajet30
PUBG Mobile43
World of Tanks Blitz60
Arena of Valor6057
Shadow Fight 36060
Battle Bay60
Dead Trigger 290
Asphalt 9: Legends3633
Temple Run 2120
Subway Surfers90
< 30 fps
< 60 fps
< 120 fps
≥ 120 fps

1
2


3
5
1

1


Intel Iris Plus Graphics 645lowmed.highultraQHD4K
X-Plane 11.1137.426.122.5
Dota 2 Reborn76.557.32926.9
BioShock Infinite104.66051.622.1
< 30 fps
< 60 fps
< 120 fps
≥ 120 fps

1
2
1
1
1
2
1

2


For more games that might be playable and a list of all games and graphics cards visit our Gaming List

v1.27
log 11. 03:50:10

#0 checking url part for id 9446 +0s ... 0s

#1 checking url part for id 9902 +0s ... 0s

#2 checking url part for id 10945 +0s ... 0s

#3 not redirecting to Ajax server +0s ... 0s

#4 did not recreate cache, as it is less than 5 days old! Created at Mon, 10 Jun 2024 05:39:56 +0200 +0.001s ... 0.001s

#5 composed specs +0.145s ... 0.146s

#6 did output specs +0s ... 0.146s

#7 start showIntegratedCPUs +0s ... 0.146s

#8 getting avg benchmarks for device 9446 +0.039s ... 0.186s

#9 got single benchmarks 9446 +0.073s ... 0.259s

#10 getting avg benchmarks for device 9902 +0.002s ... 0.261s

#11 got single benchmarks 9902 +0.009s ... 0.27s

#12 getting avg benchmarks for device 10945 +0.002s ... 0.272s

#13 got single benchmarks 10945 +0.05s ... 0.323s

#14 got avg benchmarks for devices +0s ... 0.323s

#15 min, max, avg, median took s +0.194s ... 0.517s

#16 before gaming benchmark output +0s ... 0.517s

#17 Got 127 rows for game benchmarks. +0.042s ... 0.559s

#18 composed SQL query for gamebenchmarks +0s ... 0.559s

#19 got data and put it in $dataArray +0.007s ... 0.566s

#20 benchmarks composed for output. +0.033s ... 0.599s

#21 calculated avg scores. +0s ... 0.599s

#22 return log +0.002s ... 0.601s

Please share our article, every link counts!
> Expert Reviews and News on Laptops, Smartphones and Tech Innovations > Benchmarks / Tech > Graphics Card Comparison - Head 2 Head
Redaktion, 2017-09- 8 (Update: 2023-07- 1)