Notebookcheck Logo

Intel Core i7-2600K vs Intel Core i5-10300H

Intel Core i7-2600K

► remove from comparison Intel 2600K

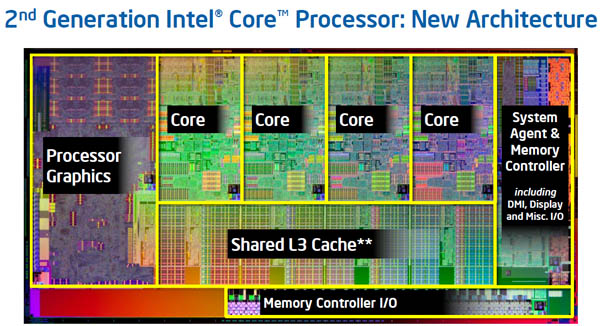
The Intel Core i7-2600K is a high-end quad-core desktop processor of the Sandy Bridge generation. It was announced at the beginning of 2011 and was the fastest CPU of this series at that time. However it does not offer all Sandy Bridge features, as vPro, VT-d and Trusted-Execution features are deactivated.

The four processor cores are able to handle 8 threads in parallel (due to Hyperthreading) and offer a base clock rate of 3.4 GHz. Under load, the cores can be overclocked automatically to up to 3.8 GHz with sufficient cooling:

  • 3.8 GHz - 1 core load
  • 3.7 GHz - 2 cores load
  • 3.6 GHz - 3 cores load
  • 3.5 GHz - 4 cores load

As a member of the "K-familiy" the i7-2600K is easily overclockable due to the open multiplicator.

The Die also includes an graphics card called Intel HD Graphics 3000 that clocks with 850 to 1350 MHz (also due to Turbo Boost). Furthermore, an integrated dual channel memory controller is able to handle up to 32 GB of DDR3-1333.

Intel Core i5-10300H

► remove from comparison Intel i5-10300H

The Intel Core i5-10300H is a fast processor for laptops with four cores based on the Comet Lake-H series (4th generation of Skylake architecture). The processor clocks at between 2.5 and 4.5 GHz (up to 4.2 with 4 cores) and can execute up to eight threads simultaneously thanks to Hyper-Threading. According to Intel, the CPU is manufactured in 14nm (14nm++) process. Compared to the predecessor, the Core i5-9300H from 2019, the 10300H is clocked slightly higher (+100 MHz Base, +400 MHz Boost) and supports faster DDR4-2933 RAM.

The Comet Lake architecture is similar to Coffee Lake and offers the same features and is produced in the same 14nm process. Other than the improved clock rates, the memory controller now also supports faster DDR4-2933 RAM. More information on Comet Lake and all the models and articles on it can be found here.

The Core i5-10300H supports no vPro, TXT or SIPP. These business features are available in the faster Core i5-10400H (2.6 - 4.6 GHz) that was released at a later date.

Performance

The average 10300H in our database matches the AMD Ryzen 5 3550H in multi-thread performance. While not a poor result per se, it is indicative of an entry-level H-class CPU that is unlikely to meet the needs of hardcore gamers, professional videographers and similar clientele.

Your mileage may vary depending on how high the CPU power limits are and how competent the cooling solution of your system is.

Graphics

The integrated Intel UHD Graphics 630 iGPU is supposed to offer a similar performance as the UHD630 in the Core i5-9300H. As a low-end solution it will probably only run current games smoothly at reduced details - if at all.

Power consumption

The Core i5 has a default TDP (also known as the long-term power limit) of 45 W, a value that laptop makers are free to reduce slightly, 35 W being the lowest Intel-recommended value. Doing so would result in lower clock speeds and lower performance. Either way, a proper cooling solution is a must for a CPU like this.

The i5-10300H is manufactured on one of the old 14 nm Intel processes for lower-than-average, as of late 2022, energy efficiency.

ModelIntel Core i7-2600KIntel Core i5-10300H
CodenameSandy BridgeComet Lake-H
SeriesIntel Core i7 (Desktop)Intel Comet Lake
Series: Comet Lake Comet Lake-H
Intel Core i7-2700K compare3.5 - 3.9 GHz4 / 8 cores8 MB L3
Intel Core i7-2600K « 3.4 - 3.8 GHz4 / 8 cores8 MB L3
Intel Core i9-10980HK compare2.4 - 5.3 GHz8 / 16 cores16 MB L3
Intel Xeon W-10885M compare2.4 - 5.3 GHz8 / 16 cores16 MB L3
Intel Core i9-10885H compare2.4 - 5.3 GHz8 / 16 cores16 MB L3
Intel Core i9-10880H compare2.3 - 5.1 GHz8 / 16 cores16 MB L3
Intel Core i7-10875H compare2.3 - 5.1 GHz8 / 16 cores16 MB L3
Intel Core i7-10870H compare2.2 - 5 GHz8 / 16 cores16 MB L3
Intel Core i7-10850H compare2.7 - 5.1 GHz6 / 12 cores12 MB L3
Intel Xeon W-10855M compare2.8 - 5.1 GHz6 / 12 cores12 MB L3
Intel Core i7-10750H compare2.6 - 5 GHz6 / 12 cores12 MB L3
Intel Core i5-10500H compare2.5 - 4.5 GHz6 / 12 cores12 MB L3
Intel Core i5-10400H compare2.6 - 4.6 GHz4 / 8 cores8 MB L3
Intel Core i5-10300H « 2.5 - 4.5 GHz4 / 8 cores8 MB L3
Intel Core i5-10200H compare2.4 - 4.1 GHz4 / 8 cores8 MB L3
Clock3400 - 3800 MHz2500 - 4500 MHz
L2 Cache1 MB1 MB
L3 Cache8 MB8 MB
Cores / Threads4 / 84 / 8
TDP95 Watt45 Watt
Transistors995 Million
Technology32 nm14 nm
Die Size216 mm2
max. Temp.72.6 °C100 °C
SocketLGA1155BGA1440
FeaturesSSE4.1, SSE4.2, AVX, Turbo Boost (3.80GHz), Hyper-Threading, VT-x, AES-NI, Intel 64, Idle States, EIST, Thermal Monitoring Technologies, Intel Fast Memory Access, Intel Flex Memory Access, XD bit, open MultiplicatorDDR4-2933 RAM, PCIe 3, 8 GT/s, MMX, BMI2, AES-NI, SSE4.1, ABM, VMX, EIST, RDRAND, SSE4.2, TM1, RDSEED, SSE, AVX, FMA, SMEP, TM2, SSE2, AVX2, ADX, SMAP, Hyper-Threading, SGX, SSE3, Turbo, SSSE3, MPX, SST
iGPUIntel HD Graphics 3000 (850 - 1350 MHz)Intel UHD Graphics 630 (350 - 1050 MHz)
Architecturex86x86
$317 U.S.
Announced
Manufacturerark.intel.comark.intel.com
L1 Cache256 KB

Benchmarks

Performance Rating - CB R15 + R20 + 7-Zip + X265 + Blender + 3DM11 CPU - i5-10300H
29.7 pt (49%)
Restrict / Search: Model: Max. age: years
Cinebench 2024 - Cinebench 2024 CPU Single Core
68.2 Points (38%)
Cinebench 2024 - Cinebench 2024 CPU Multi Core
331 Points (6%)
Cinebench R23 - Cinebench R23 Multi Core
min: 4621     avg: 5132     median: 5106 (5%)     max: 5668 Points
Cinebench R23 - Cinebench R23 Single Core
min: 1095     avg: 1126     median: 1136 (48%)     max: 1147 Points
Cinebench R20 - Cinebench R20 CPU (Single Core)
min: 312     avg: 443.2     median: 454 (49%)     max: 470 Points
Cinebench R20 - Cinebench R20 CPU (Multi Core)
min: 1397     avg: 2046     median: 2117 (5%)     max: 2240 Points
Cinebench R15 - Cinebench R15 CPU Multi 64 Bit
min: 613     avg: 614     median: 613.5 (4%)     max: 614 Points
min: 536     avg: 825     median: 892 (6%)     max: 921 Points
Cinebench R15 - Cinebench R15 CPU Single 64 Bit
129 Points (36%)
min: 108     avg: 174     median: 186 (52%)     max: 194 Points
Cinebench R11.5 - Cinebench R11.5 CPU Multi 64 Bit
6.8 Points (9%)
min: 9.87     avg: 10     median: 10.1 (13%)     max: 10.06 Points
Cinebench R11.5 - Cinebench R11.5 CPU Single 64 Bit
1.5 Points (36%)
min: 2.05     avg: 2.1     median: 2.2 (51%)     max: 2.17 Points
Cinebench R10 - Cinebench R10 Rend. Single (32bit)
4809 Points (29%)
min: 6867     avg: 7056     median: 7130 (43%)     max: 7170 Points
Cinebench R10 - Cinebench R10 Rend. Multi (32bit)
18608 Points (13%)
min: 26994     avg: 27496     median: 27692 (20%)     max: 27801 Points
Cinebench R10 - Cinebench R10 Rend. Multi (64bit)
22897 Points (15%)
min: 35899     avg: 36042     median: 36042 (23%)     max: 36185 Points
Cinebench R10 - Cinebench R10 Rend. Single (64bit)
6001 Points (7%)
min: 9326     avg: 9339     median: 9338.5 (11%)     max: 9351 Points
wPrime 2.10 - wPrime 2.0 1024m *
328 s (4%)
215.2 s (3%)
wPrime 2.10 - wPrime 2.0 32m *
10.5 s (2%)
7.1 s (1%)
wPrime 1.55 - wPrime 1.55 1024m *
100%
1 2600K +
234 s (1%)
wPrime 1.55 - wPrime 1.55 32m *
100%
1 2600K +
7.1 s (4%)
WinRAR - WinRAR 4.0
3486 Points (6%)
4825 Points (8%)
7-Zip 18.03 - 7-Zip 18.03 Multi Thread 4 runs
min: 15146     avg: 23295     median: 24158 (14%)     max: 24841 MIPS
7-Zip 18.03 - 7-Zip 18.03 Single Thread 4 runs
min: 2945     avg: 4704     median: 4896 (58%)     max: 4956 MIPS
X264 HD Benchmark 4.0 - x264 Pass 2
36.5 fps (12%)
53.3 fps (18%)
X264 HD Benchmark 4.0 - x264 Pass 1
145 fps (33%)
190.2 fps (44%)
HWBOT x265 Benchmark v2.2 - HWBOT x265 4k Preset
min: 6.13     avg: 7.1     median: 7.3 (13%)     max: 7.78 fps
TrueCrypt - TrueCrypt Serpent
0.3 GB/s (9%)
0.4 GB/s (11%)
TrueCrypt - TrueCrypt Twofish
0.6 GB/s (10%)
0.7 GB/s (12%)
TrueCrypt - TrueCrypt AES
3.3 GB/s (9%)
3.1 GB/s (8%)
Blender - Blender 3.3 Classroom CPU *
962 Seconds (12%)
Blender - Blender 2.79 BMW27 CPU *
min: 478.9     avg: 515     median: 515.5 (4%)     max: 555 Seconds
R Benchmark 2.5 - R Benchmark 2.5 *
min: 0.625     avg: 0.7     median: 0.6 (14%)     max: 1.088 sec
3DMark 06 - CPU - 3DMark 06 - CPU
min: 6358     avg: 6649     median: 6669 (14%)     max: 6791 Points
min: 9731     avg: 9744     median: 9744 (21%)     max: 9757 Points
Super Pi mod 1.5 XS 1M - Super Pi mod 1.5 XS 1M *
10.2 s (2%)
8.7 s (2%)
Super Pi mod 1.5 XS 2M - Super Pi mod 1.5 XS 2M *
22.4 s (1%)
19.8 s (1%)
Super Pi Mod 1.5 XS 32M - Super Pi mod 1.5 XS 32M *
560 s (2%)
516 s (2%)
SiSoft Sandra Dhrystone (MIPS) - SiSoft Sandra Dhrystone (MIPS)
100%
1 2600K +
118000 MIPS (56%)
SiSoft Sandra Whetstone (MFLOPS) - SiSoft Sandra Whetstone (MFLOPS)
100%
1 2600K +
82400 MFLOPS (63%)
Windows 7 Experience Index - Win7 CPU
100%
1 2600K +
7.6 Points (97%)
3DMark Vantage - 3DM Vant. Perf. CPU no Physx
100%
1 2600K +
min: 22530     avg: 23608     median: 23731 (18%)     max: 24019 Points
3DMark 11 - 3DM11 Performance Physics
min: 7865     avg: 8579     median: 8527 (21%)     max: 9487 Points
min: 8554     avg: 9719     median: 9884.5 (24%)     max: 10909 Points
3DMark - 3DMark Ice Storm Physics
min: 40698     avg: 43628     median: 44325 (36%)     max: 44752 Points
min: 58736     avg: 60992     median: 61113 (50%)     max: 62933 Points
3DMark - 3DMark Ice Storm Extreme Physics
min: 42348     avg: 44674     median: 44674 (36%)     max: 47000 Points
min: 58462     avg: 61155     median: 61387 (50%)     max: 62548 Points
3DMark - 3DMark Ice Storm Unlimited Physics
min: 44250     avg: 44554     median: 44553.5 (37%)     max: 44857 Points
min: 38284     avg: 60059     median: 63707 (53%)     max: 63995 Points
3DMark - 3DMark Cloud Gate Physics
min: 6298     avg: 6359     median: 6360.5 (16%)     max: 6434 Points
min: 8220     avg: 8936     median: 9017.5 (23%)     max: 9305 Points
3DMark - 3DMark Fire Strike Standard Physics
min: 8740     avg: 8789     median: 8798 (16%)     max: 8832 Points
min: 12298     avg: 12919     median: 13016 (23%)     max: 13267 Points
3DMark - 3DMark Time Spy CPU
min: 3772     avg: 4678     median: 4684 (20%)     max: 5600 Points
Geekbench 6.4 - Geekbench 6.4 Single-Core
1599 Points (40%)
Geekbench 6.4 - Geekbench 6.4 Multi-Core
5340 Points (21%)
Geekbench 6.0 - Geekbench 6.0 Single-Core
1518 Points (48%)
Geekbench 6.0 - Geekbench 6.0 Multi-Core
5152 Points (21%)
Geekbench 5.5 - Geekbench 5.1 - 5.5 64 Bit Single-Core
min: 703     avg: 1166     median: 1203.5 (47%)     max: 1241 Points
Geekbench 5.5 - Geekbench 5.1 - 5.5 64 Bit Multi-Core
min: 2783     avg: 4351     median: 4478 (8%)     max: 4728 Points
Geekbench 5.0 - Geekbench 5.0 64 Bit Single-Core
min: 1121     avg: 1175     median: 1172.5 (5%)     max: 1234 Points
Geekbench 5.0 - Geekbench 5.0 64 Bit Multi-Core
min: 3887     avg: 4333     median: 4365 (14%)     max: 4713 Points
Geekbench 4.4 - Geekbench 4.1 - 4.4 64 Bit Single-Core
min: 4844     avg: 5198     median: 5199 (52%)     max: 5549 Points
Geekbench 4.4 - Geekbench 4.1 - 4.4 64 Bit Multi-Core
min: 15448     avg: 17203     median: 17278 (17%)     max: 18807 Points
Geekbench 3 - Geekbench 3 32 Bit Multi-Core
100%
1 2600K +
min: 11506     avg: 11547     median: 11546.5 (20%)     max: 11587 Points
Geekbench 3 - Geekbench 3 32 Bit Single-Core
100%
1 2600K +
min: 2975     avg: 3015     median: 3015 (59%)     max: 3055 Points
Geekbench 3 - Geekbench 3 64 Bit Multi-Core
100%
1 2600K +
12009 Points (19%)
Geekbench 3 - Geekbench 3 64 Bit Single-Core
100%
1 2600K +
3189 Points (48%)
Geekbench 2 - 32 Bit - Geekbench Stream
100%
1 2600K +
2537 Points (20%)
Geekbench 2 - 32 Bit - Geekbench Memory
100%
1 2600K +
5074 Points (46%)
Geekbench 2 - 32 Bit - Geekbench Floating Point
100%
1 2600K +
9088 Points (18%)
Geekbench 2 - 32 Bit - Geekbench Integer
100%
1 2600K +
9443 Points (19%)
Geekbench 2 - 32 Bit - Geekbench Total Score
100%
1 2600K +
7754 Points (20%)
PassMark PerformanceTest 9 - PerformanceTest 9.0 CPU Mark
12111 Points (63%)
Mozilla Kraken 1.1 - Kraken 1.1 Total Score *
1297 ms (2%)
min: 812     avg: 872     median: 824 (1%)     max: 1366 ms
Sunspider - Sunspider 1.0 Total Score *
100%
1 2600K +
min: 150.6     avg: 157.3     median: 157.3 (2%)     max: 164 ms
Octane V2 - Octane V2 Total Score
min: 7883     avg: 15417     median: 15416.5 (12%)     max: 22950 Points
min: 36854     avg: 47282     median: 48896 (37%)     max: 51952 Points
WebXPRT 3 - WebXPRT 3 Score
min: 134     avg: 206.2     median: 210.5 (38%)     max: 231 Points
Power Consumption - Prime95 Power Consumption - external Monitor *
min: 76.8     avg: 95.8     median: 95.3 (16%)     max: 112 Watt
Power Consumption - Cinebench R15 Multi Power Consumption - external Monitor *
min: 75.3     avg: 85.7     median: 85.8 (16%)     max: 93 Watt
Power Consumption - Power Efficiency - Cinebench R15 Multi external Monitor
min: 9.51     avg: 10.4     median: 10.5 (8%)     max: 11.1 Points per Watt

Average Benchmarks Intel Core i7-2600K → 100% n=28

Average Benchmarks Intel Core i5-10300H → 144% n=28

- Range of benchmark values for this graphics card
red legend - Average benchmark values for this graphics card
* Smaller numbers mean a higher performance
1 This benchmark is not used for the average calculation

Add one or more devices and compare

In the following list you can select (and also search for) devices that should be added to the comparison. You can select more than one device.

restrict list:
v1.33
log 28. 19:47:26

#0 ran 0s before starting gpusingle class +0s ... 0s

#1 checking url part for id 1574 +0s ... 0s

#2 checking url part for id 11706 +0s ... 0s

#3 redirected to Ajax server, took 1753724846s time from redirect:0 +0s ... 0s

#4 did not recreate cache, as it is less than 5 days old! Created at Mon, 28 Jul 2025 05:17:35 +0200 +0s ... 0s

#5 composed specs +0.005s ... 0.005s

#6 did output specs +0s ... 0.005s

#7 getting avg benchmarks for device 1574 +0.001s ... 0.006s

#8 got single benchmarks 1574 +0.023s ... 0.03s

#9 getting avg benchmarks for device 11706 +0.006s ... 0.036s

#10 got single benchmarks 11706 +0.023s ... 0.059s

#11 got avg benchmarks for devices +0s ... 0.059s

#12 min, max, avg, median took s +0.047s ... 0.106s

#13 return log +0.002s ... 0.108s

Please share our article, every link counts!
Mail Logo
> Expert Reviews and News on Laptops, Smartphones and Tech Innovations > Benchmarks / Tech > Processor Comparison - Head 2 Head
Redaktion, 2017-09- 8 (Update: 2023-07- 1)