HP Spectre x360 13 11th Gen Intel Convertible Review: Proof That OLED Isn't Everything
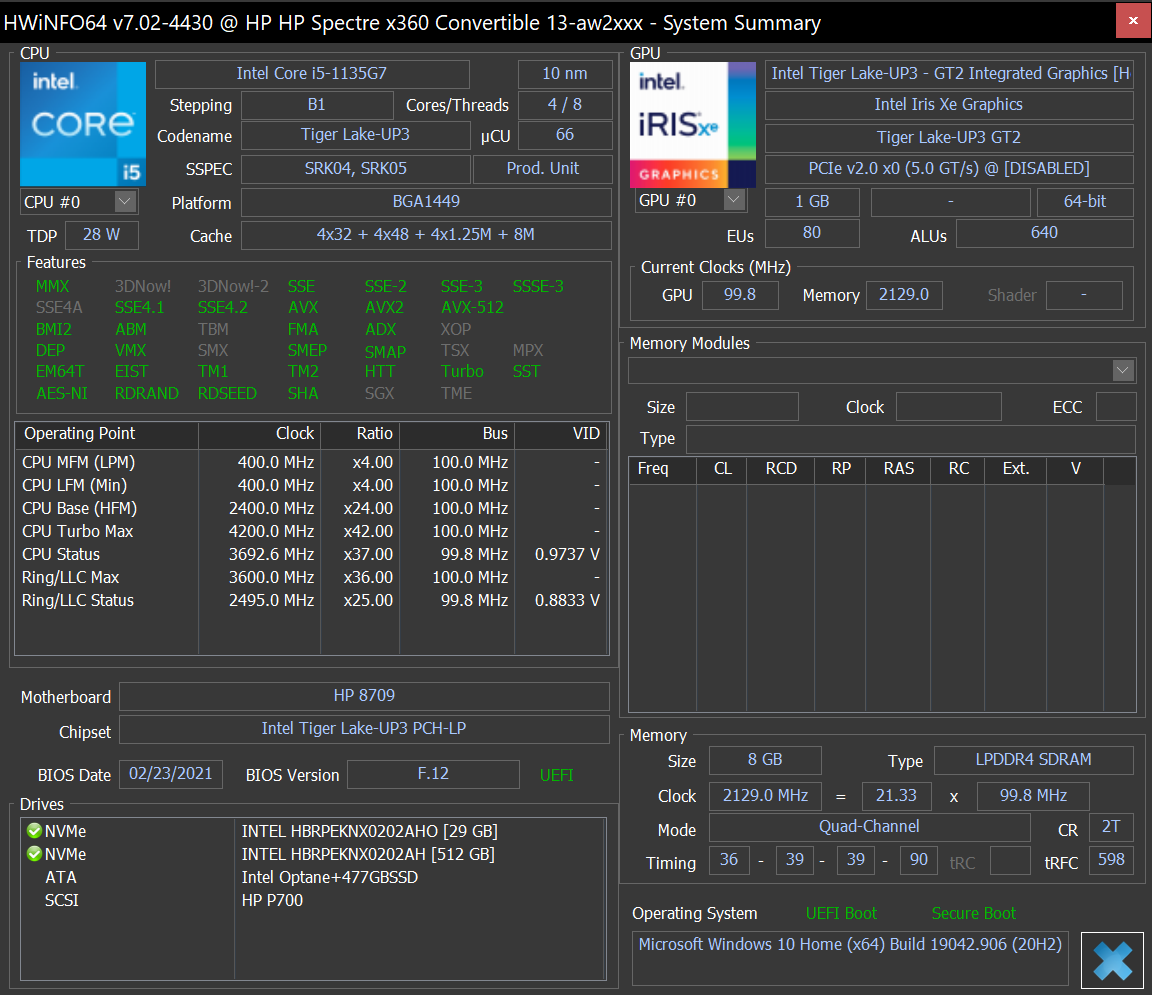
It's been almost two years since we last checked out the Spectre x360 13 and the series has been updated with newer CPUs and display options ever sense. The system we'll be looking at today is the early 2021 model equipped with the 11th gen Core i5-1135G7 CPU, integrated Iris Xe 80 EUs graphics, 8 GB of RAM, 512 GB SSD, and 4K OLED touchscreen for about $1300 USD retail. Other configurations are available with double the RAM and the faster Core i7-1165G7 CPU
Competitors include other 13-inch and 14-inch subnotebook convertibles like the Dell XPS 13 2-in-1, Asus ZenBook Flip, Lenovo Yoga 9i, LG Gram 14, or MSI Summit 13 Flip. We'll also be comparing our 2021 Spectre x360 13 to the 13.5-inch HP Spectre x360 14 and older 2019 10th gen Ice Lake Spectre x360 13 so readers can have a better idea of the differences between them.
More HP reviews:
potential competitors in comparison
Rating | Date | Model | Weight | Height | Size | Resolution | Price |
|---|---|---|---|---|---|---|---|
| 87.8 % v7 (old) | 05 / 2021 | HP Spectre x360 13-aw2003dx i5-1135G7, Iris Xe G7 80EUs | 1.2 kg | 16.9 mm | 13.30" | 3840x2160 | |
| 89.4 % v7 (old) | 12 / 2020 | HP Spectre x360 14t-ea000 i7-1165G7, Iris Xe G7 96EUs | 1.3 kg | 17.2 mm | 13.50" | 1920x1280 | |
| 88.4 % v7 (old) | 12 / 2019 | HP Spectre x360 13-aw0013dx i7-1065G7, Iris Plus Graphics G7 (Ice Lake 64 EU) | 1.2 kg | 16.9 mm | 13.30" | 1920x1080 | |
| 85.9 % v7 (old) | 11 / 2019 | Dell XPS 13 7390 Core i7-10710U i7-10710U, UHD Graphics 620 | 1.2 kg | 11.6 mm | 13.30" | 3840x2160 | |
| 86.9 % v7 (old) | 04 / 2021 | MSI Summit E13 Flip Evo A11MT i7-1185G7, Iris Xe G7 96EUs | 1.4 kg | 14.9 mm | 13.40" | 1920x1200 | |
| 87.1 % v7 (old) | 11 / 2020 | Lenovo Yoga Duet 7 13IML05-82AS000WGE i5-10210U, UHD Graphics 620 | 1.2 kg | 9.2 mm | 13.00" | 2160x1350 |
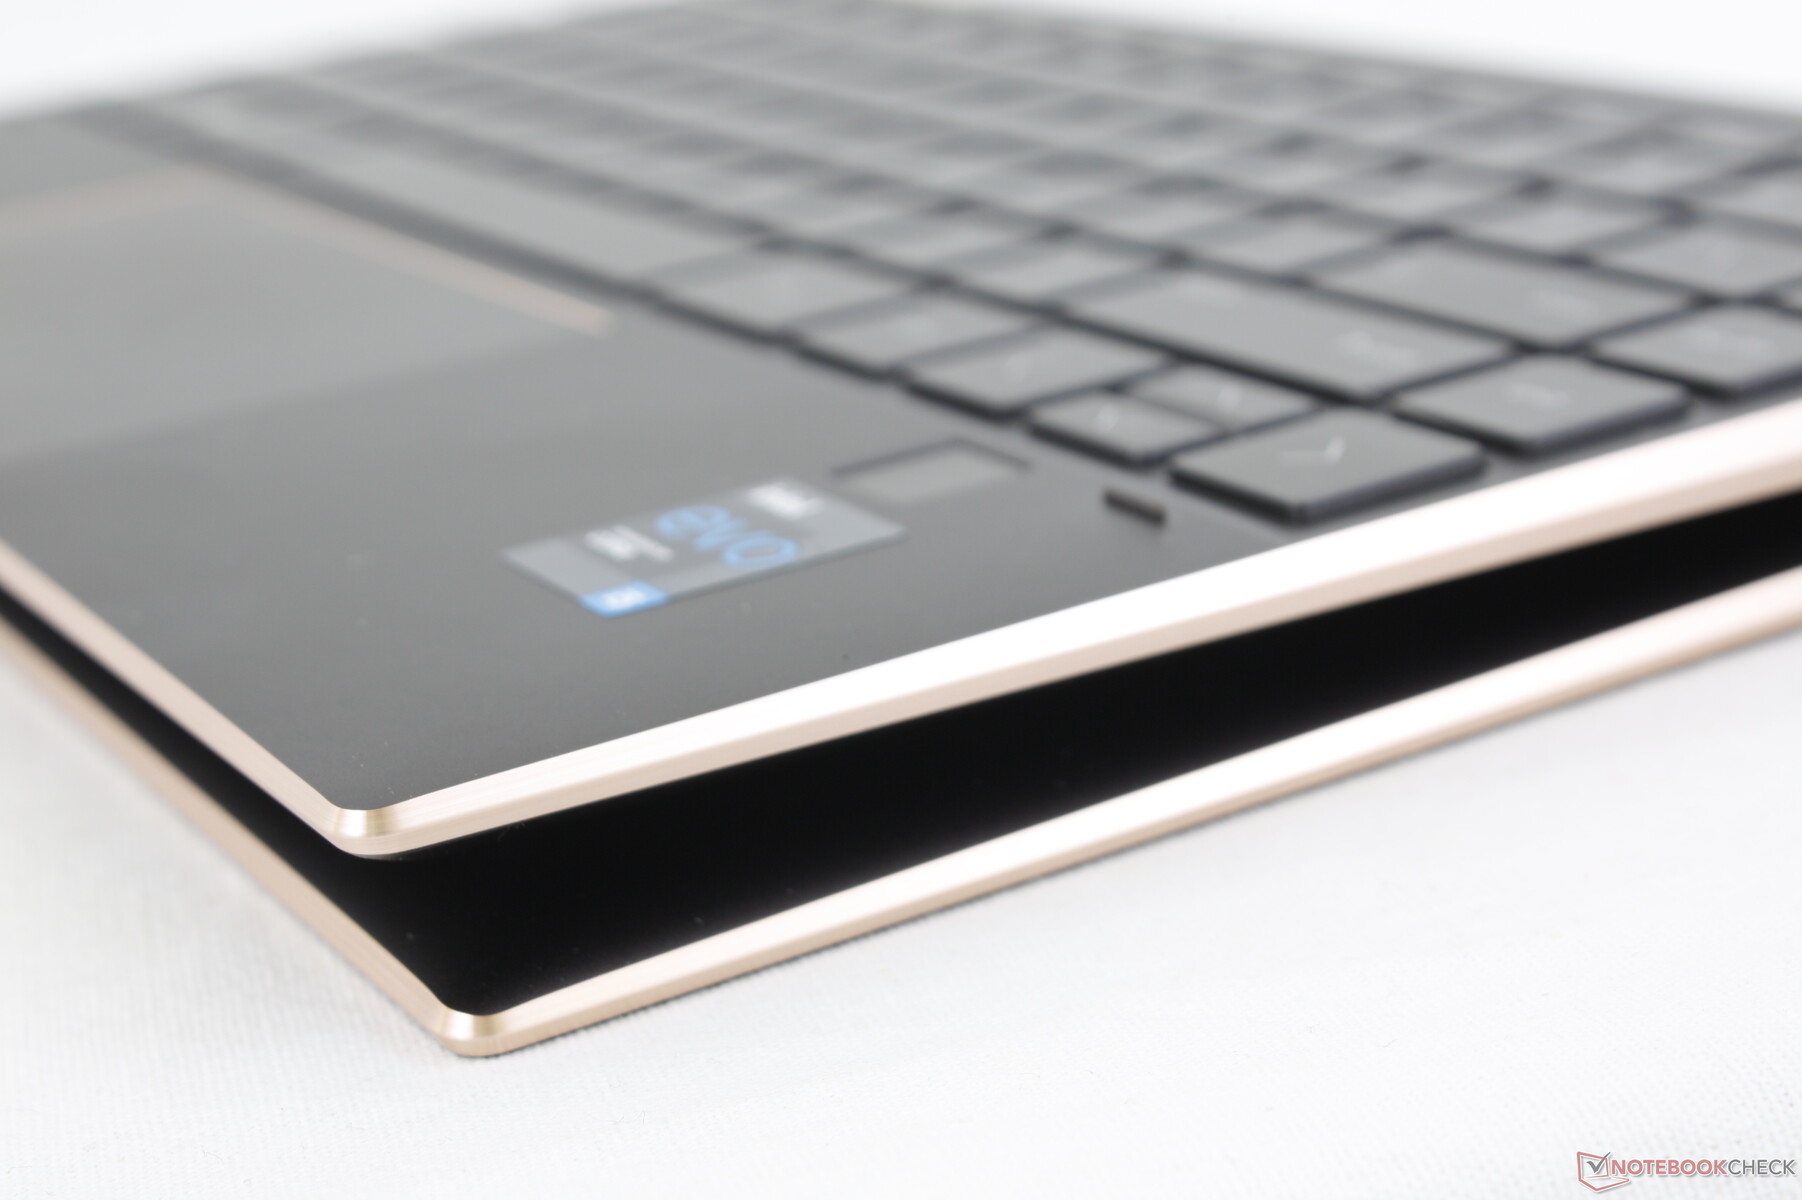
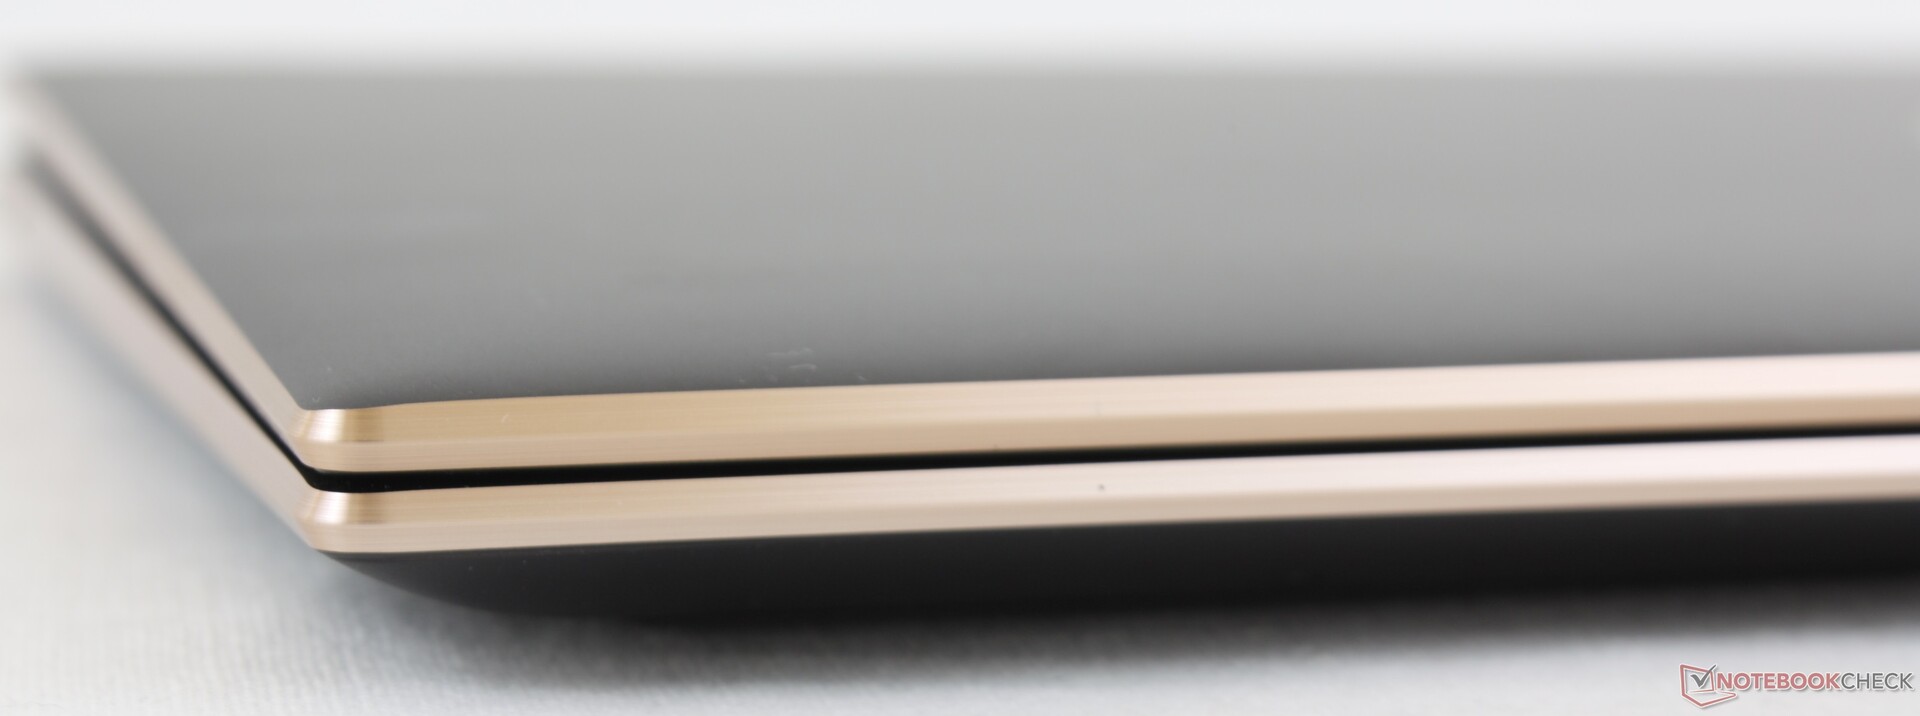
Case
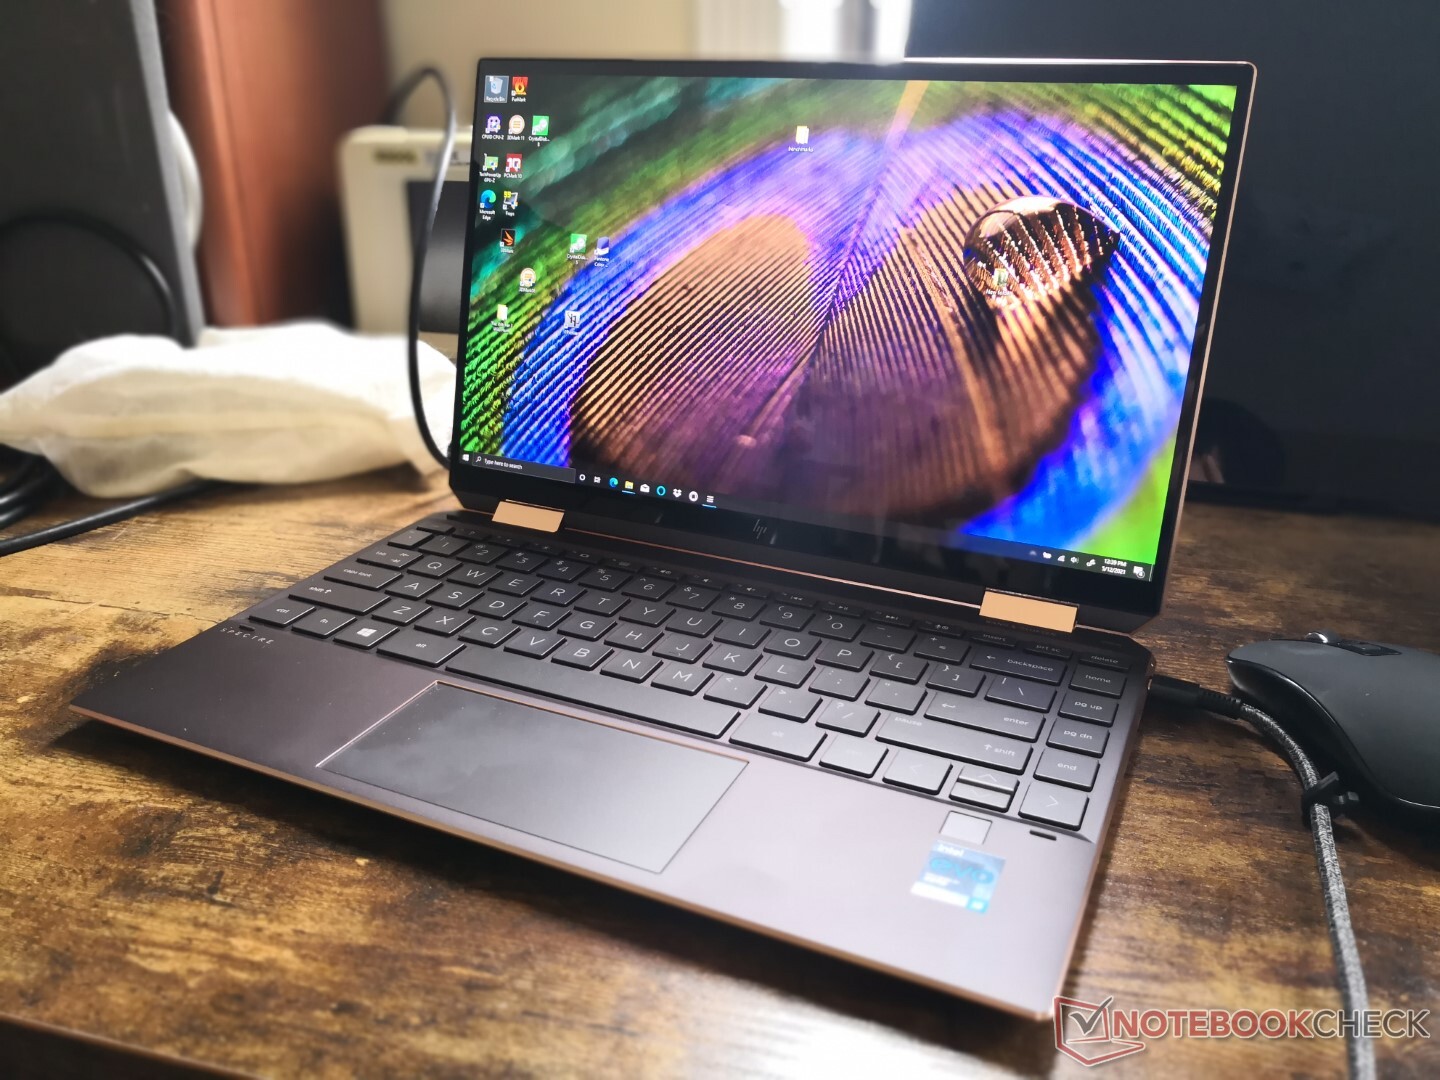
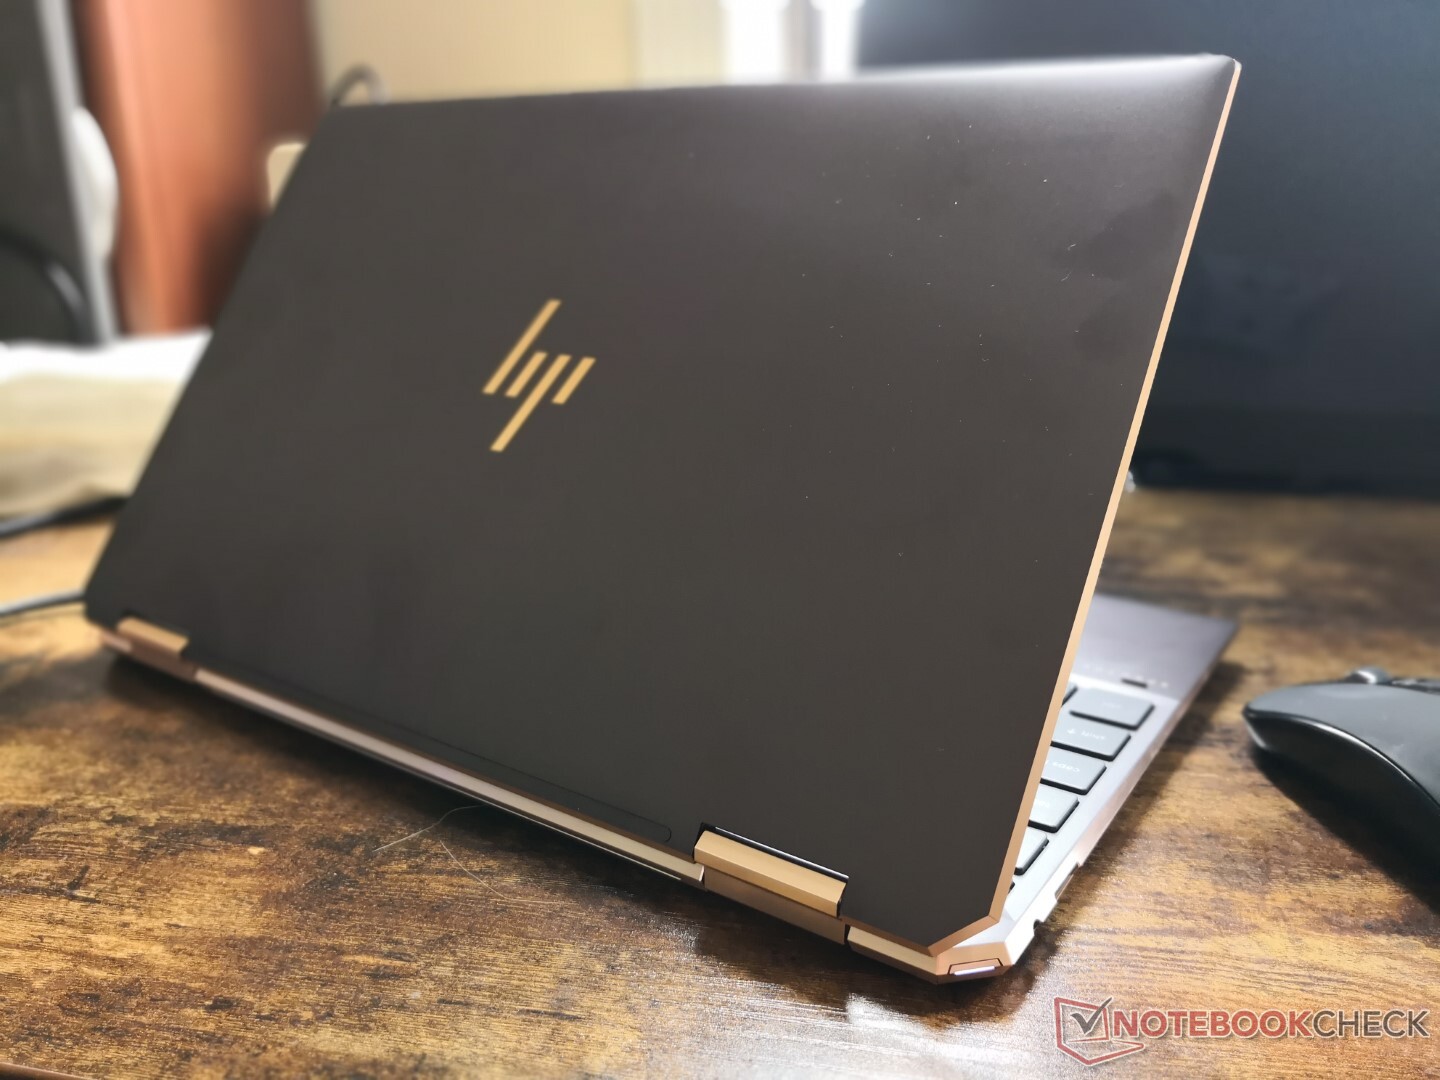
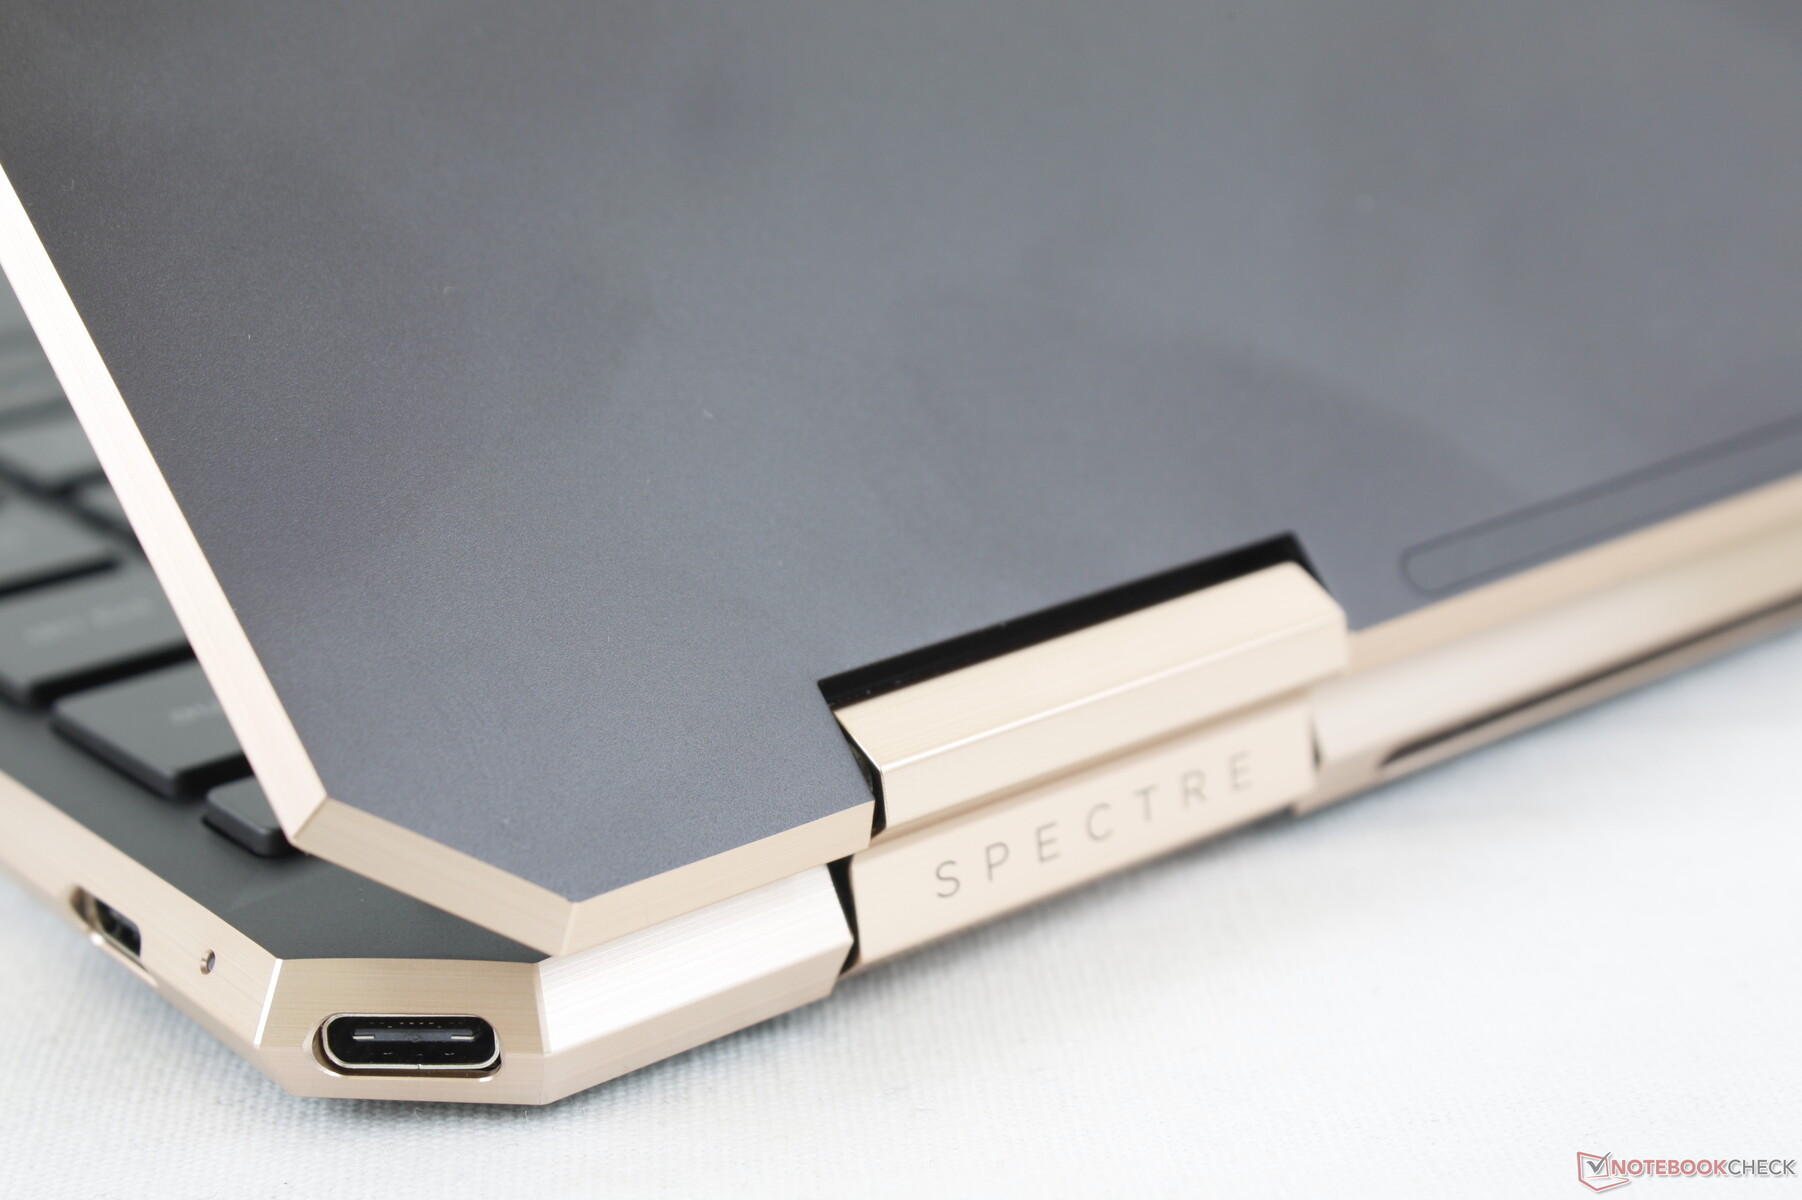
The chassis remains identical to the 2019 Ice Lake model. The XPS 13 2-in-1 is still the smaller and lighter option, but the more rigid HP system manages to include a few more features as a result of its thicker profile. The Spectre x360 14 is slightly heavier and significantly longer due to its 3:2 aspect ratio.
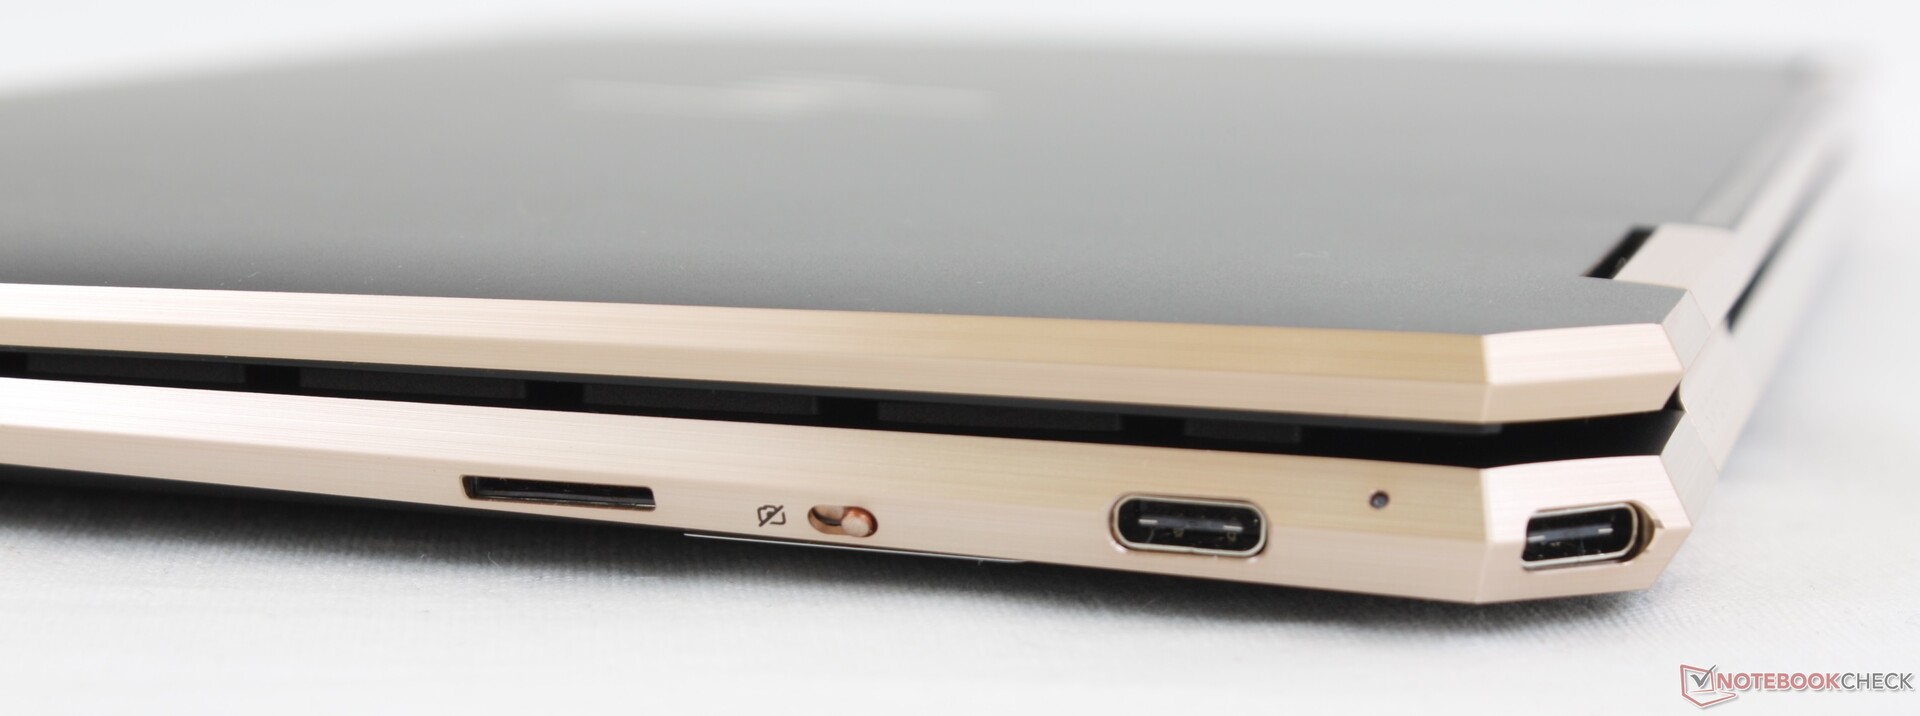
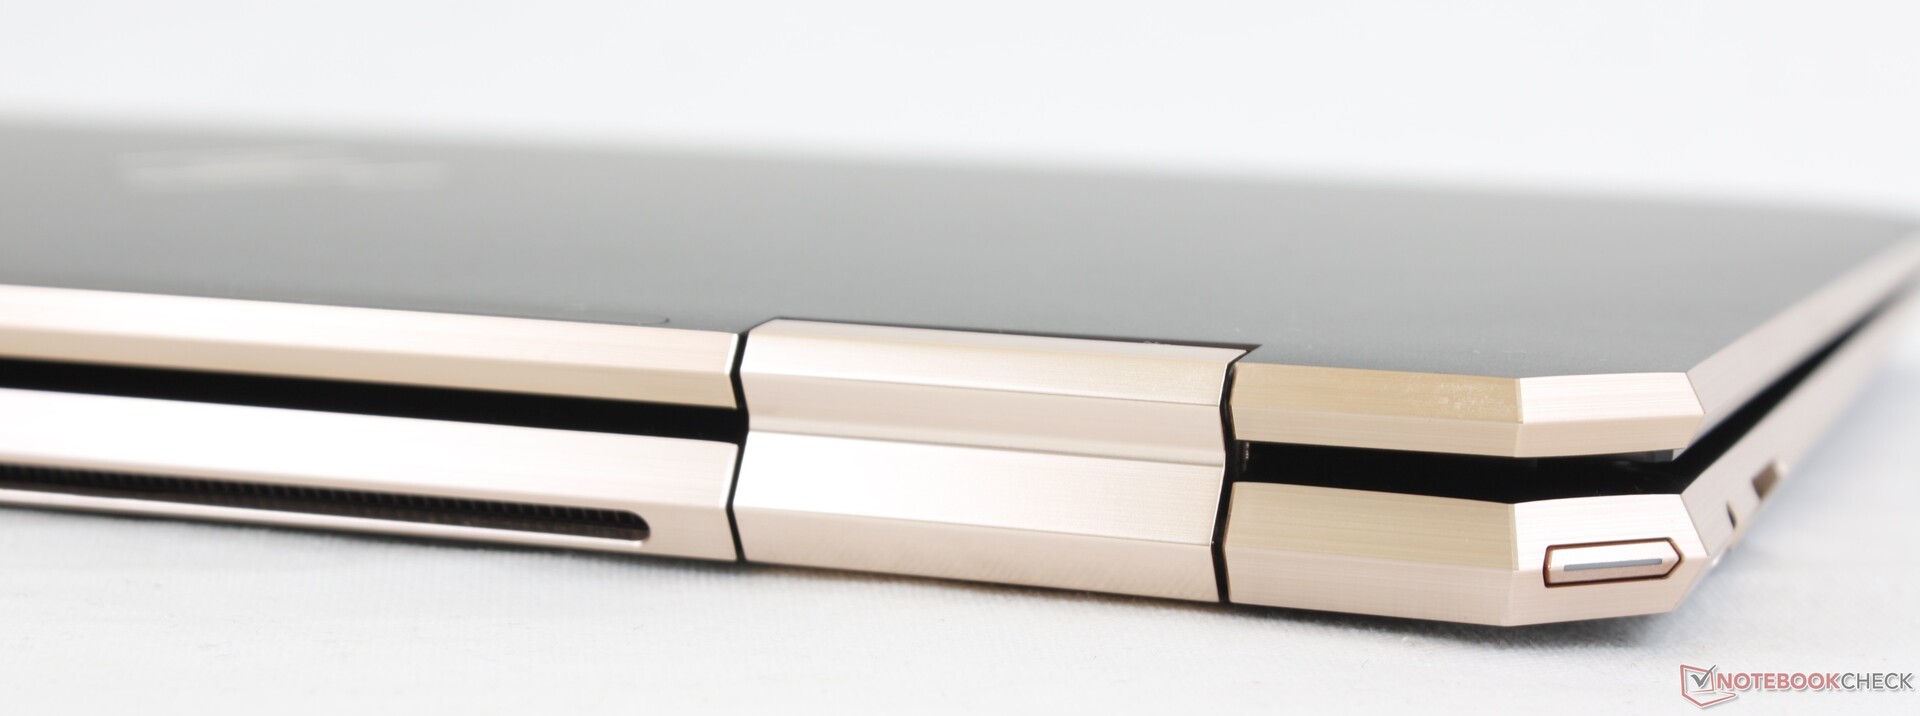
Connectivity
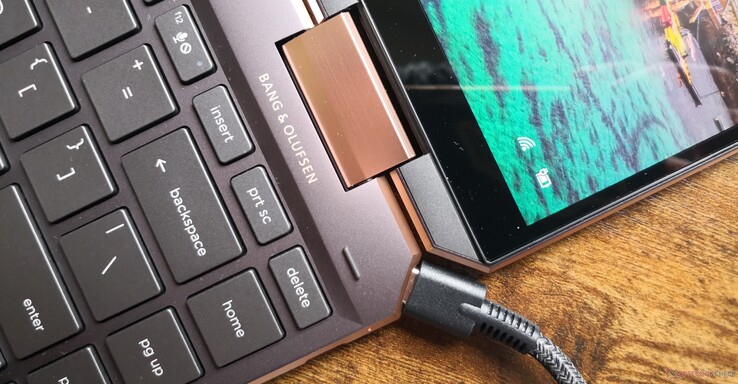
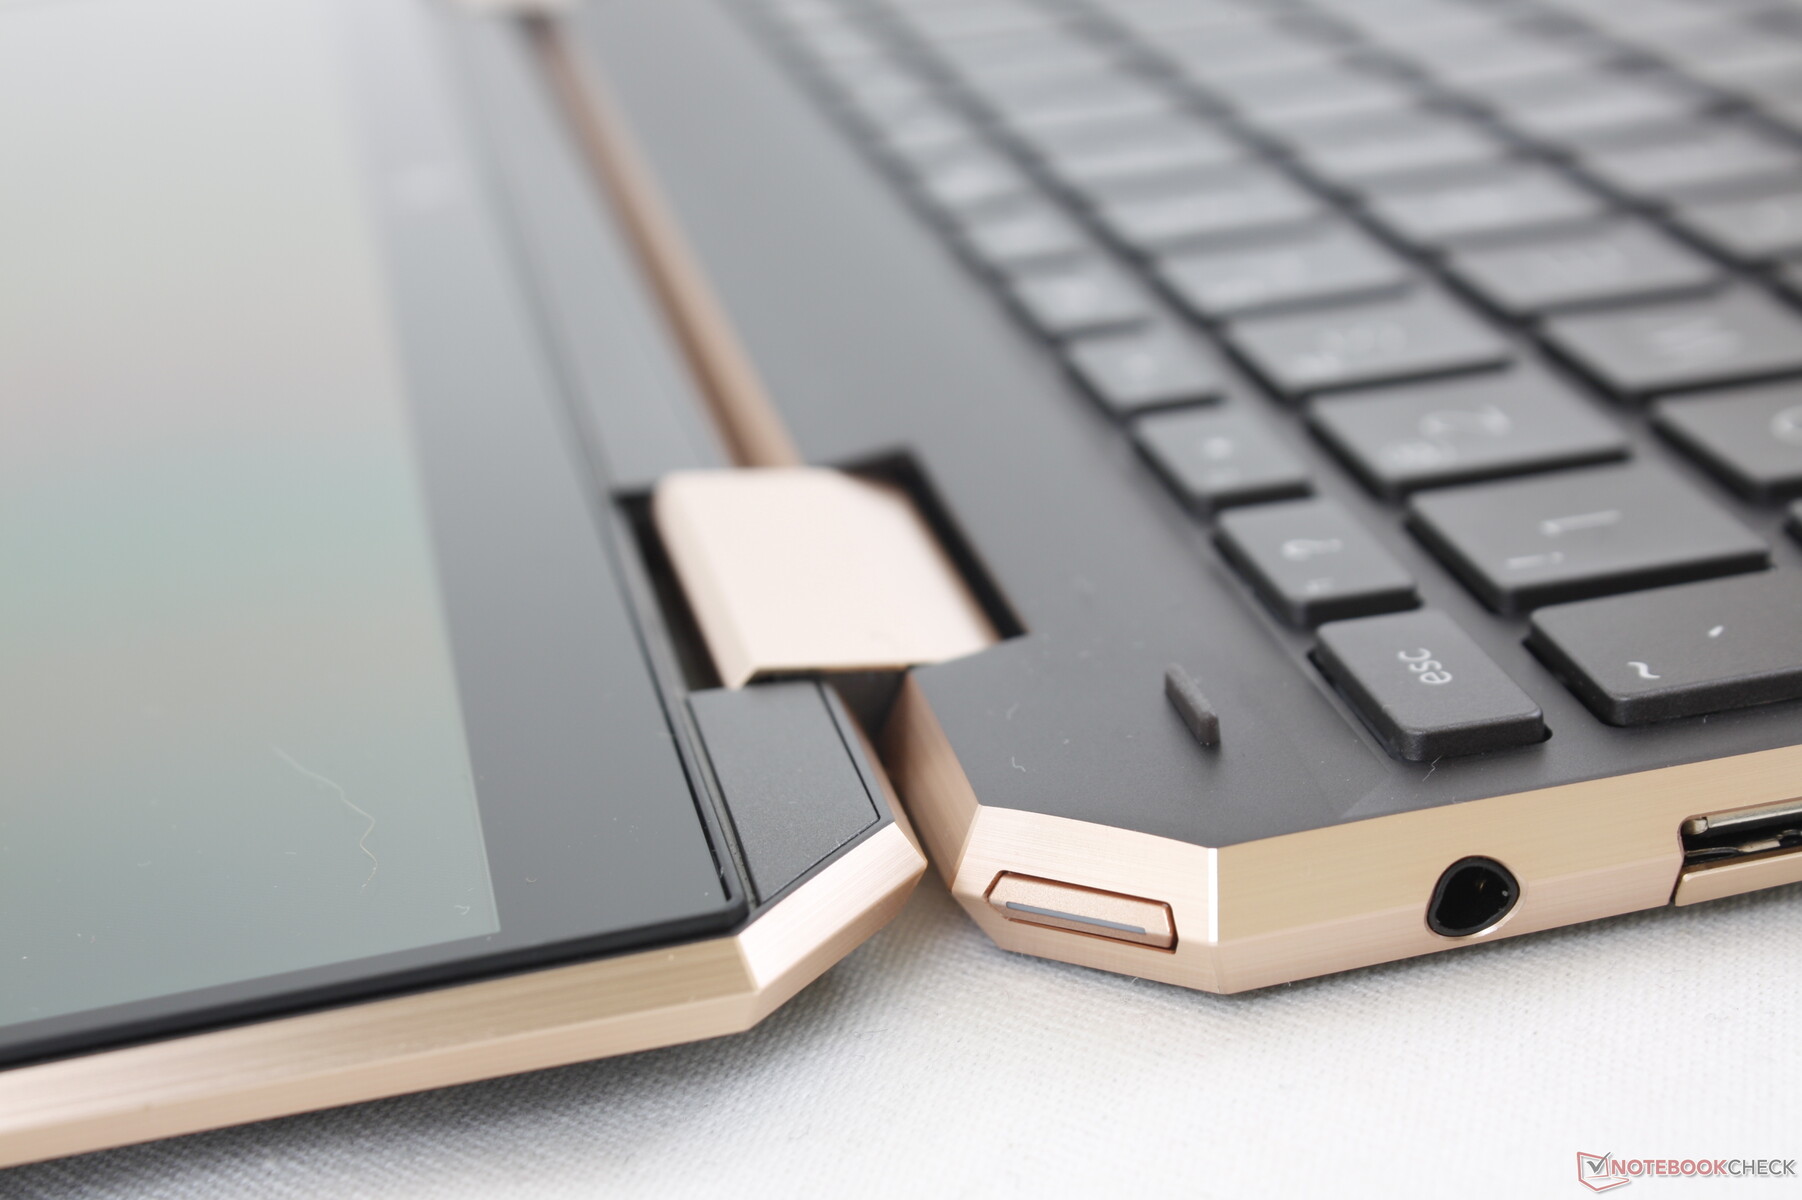
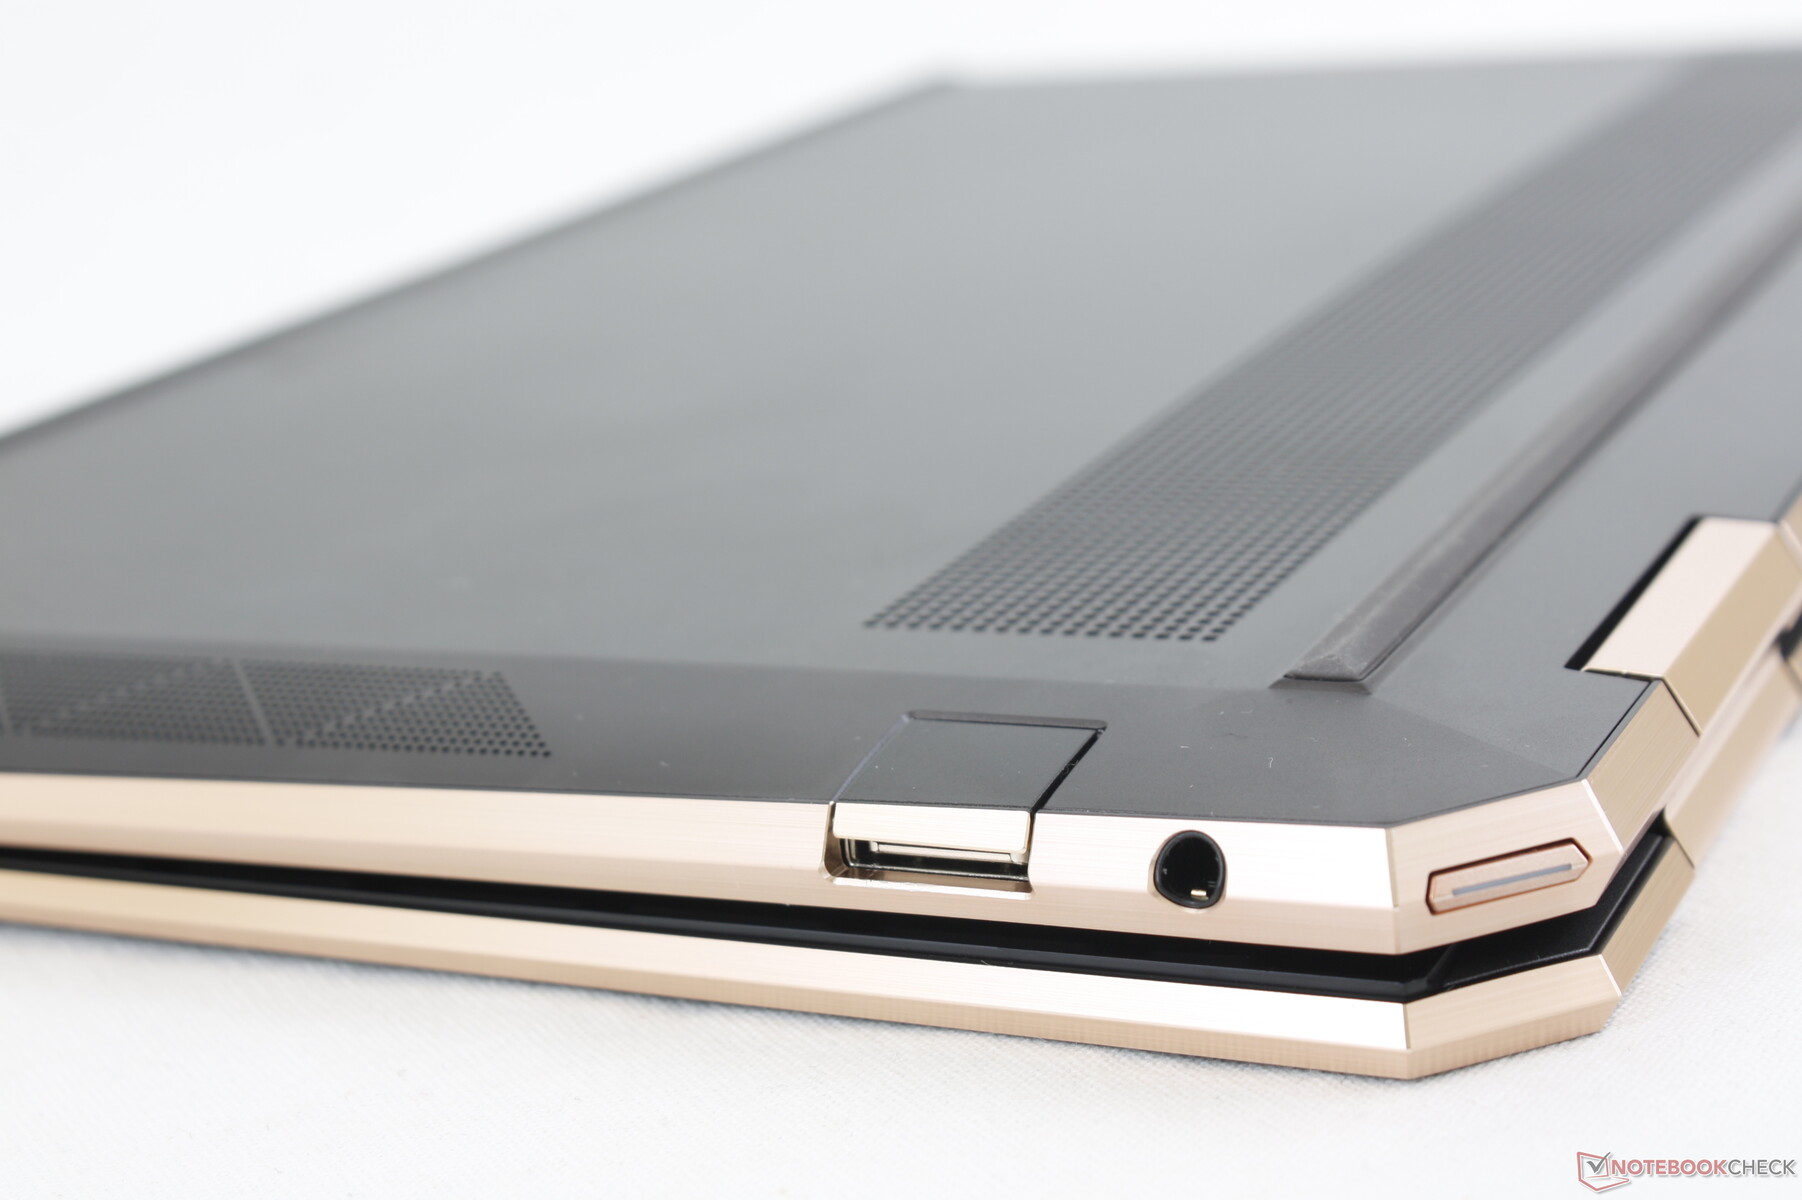
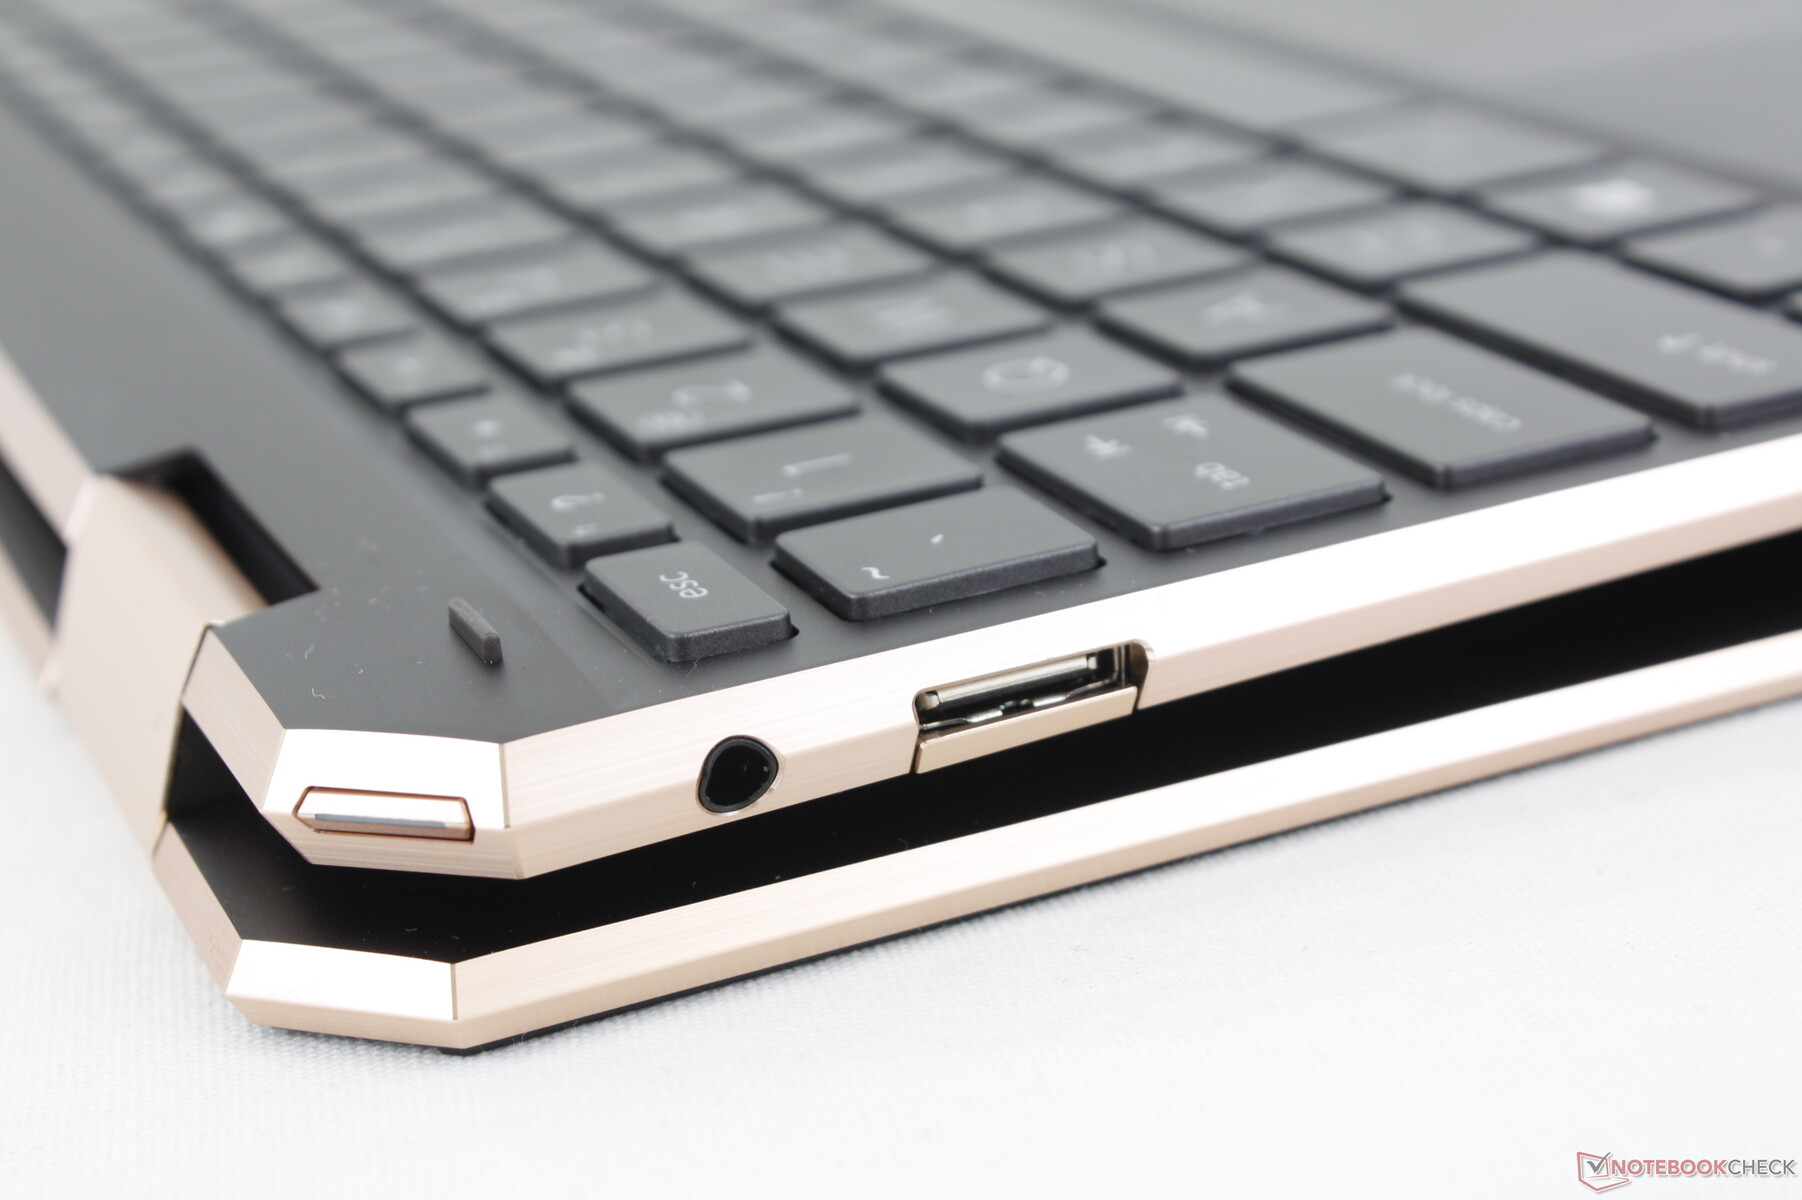
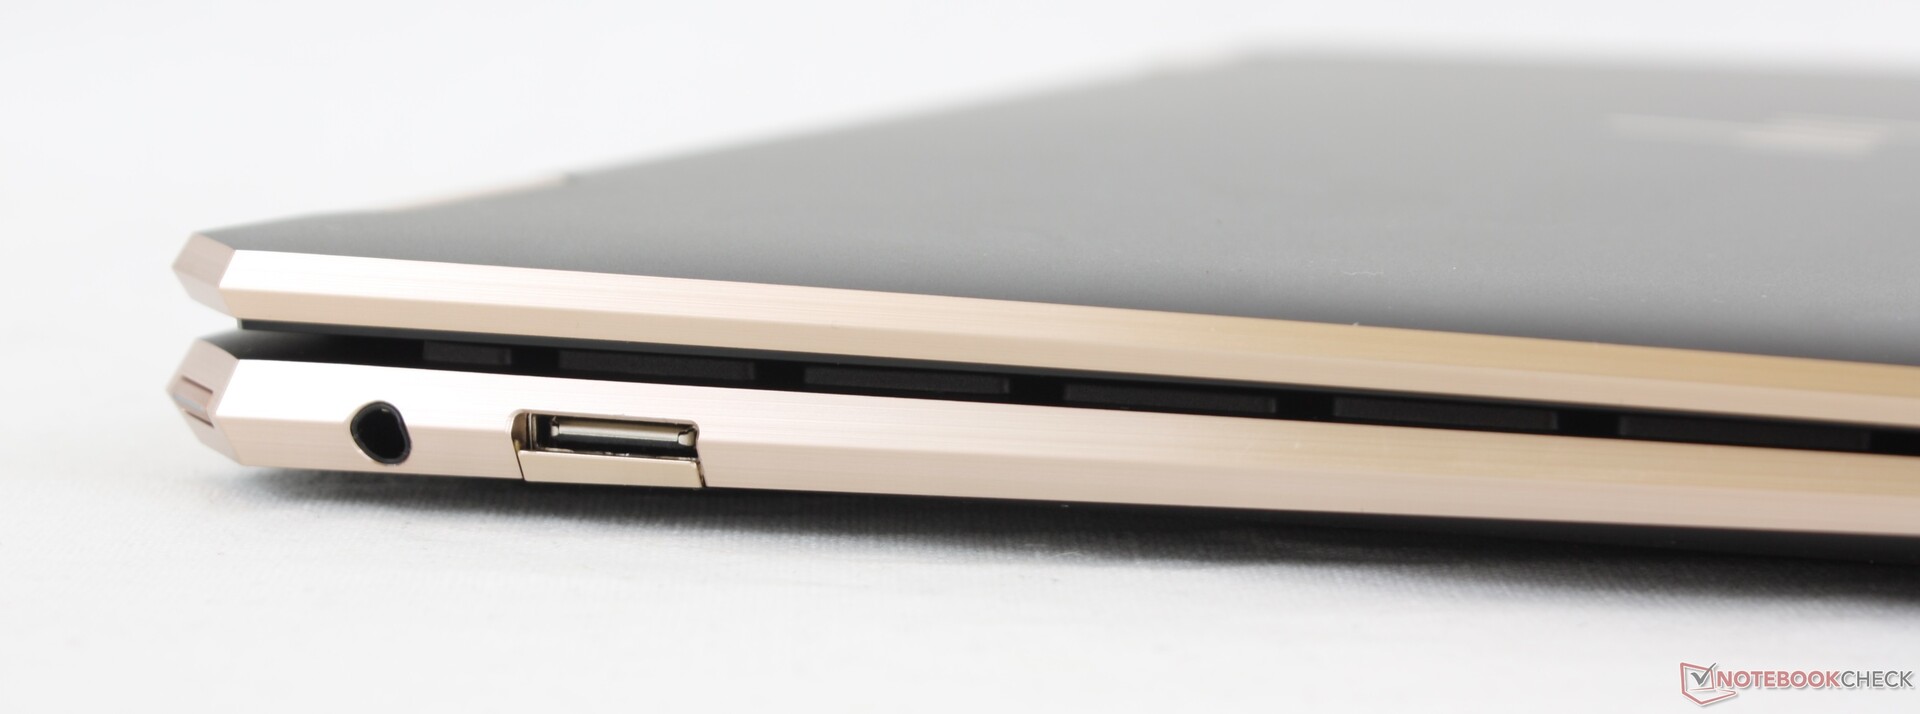
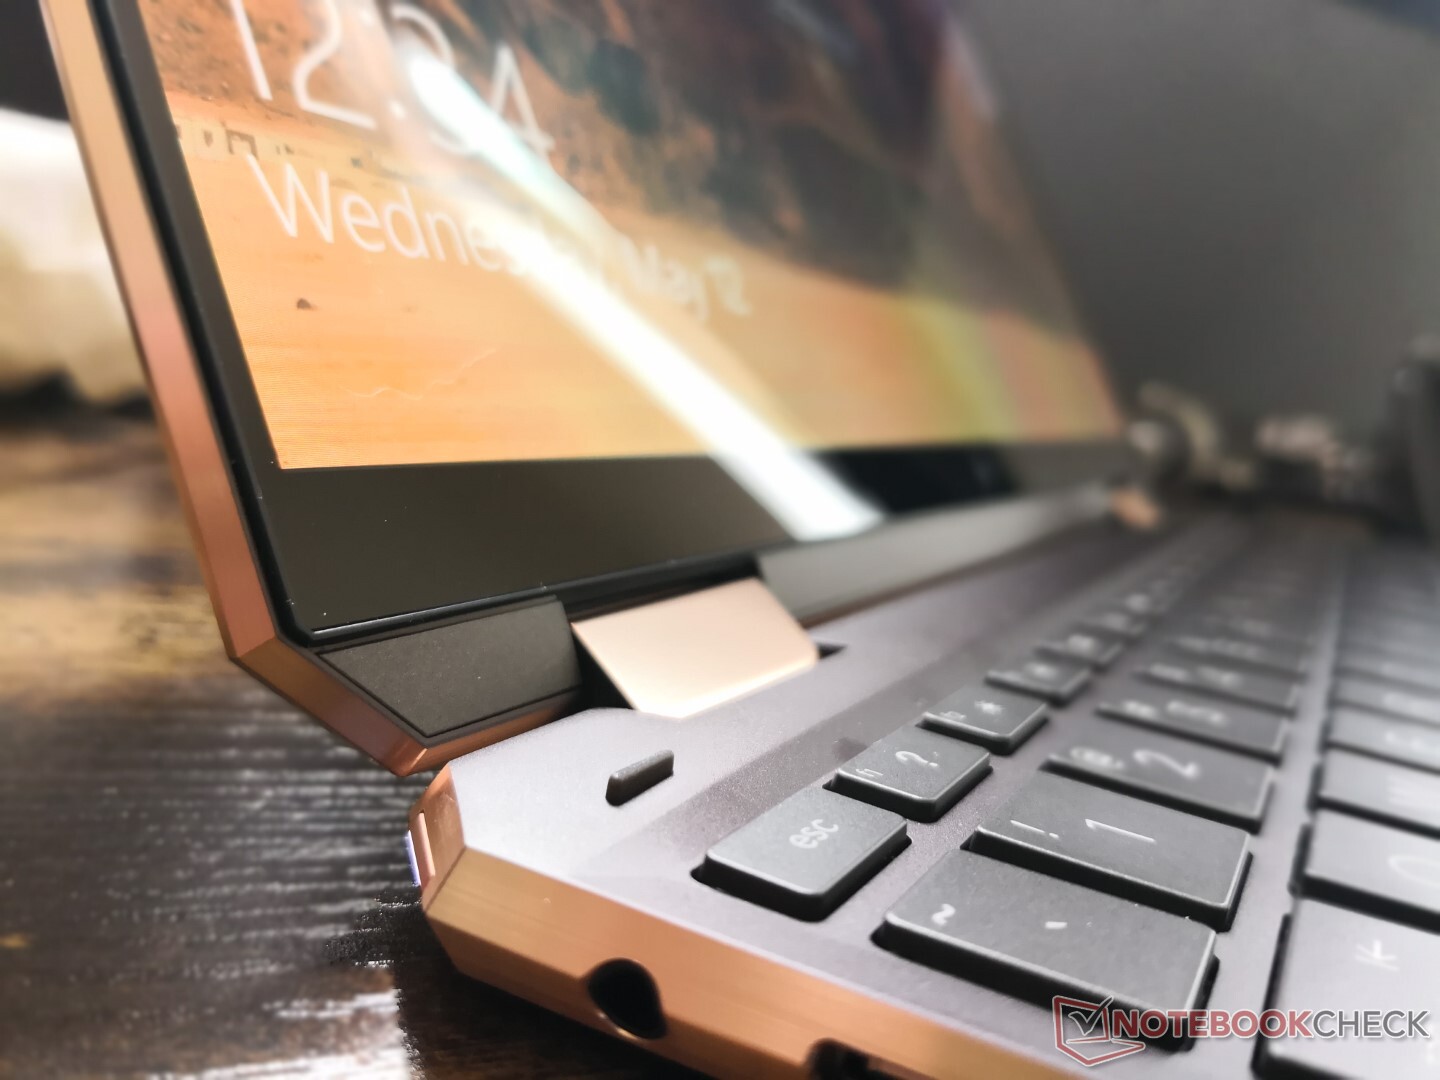
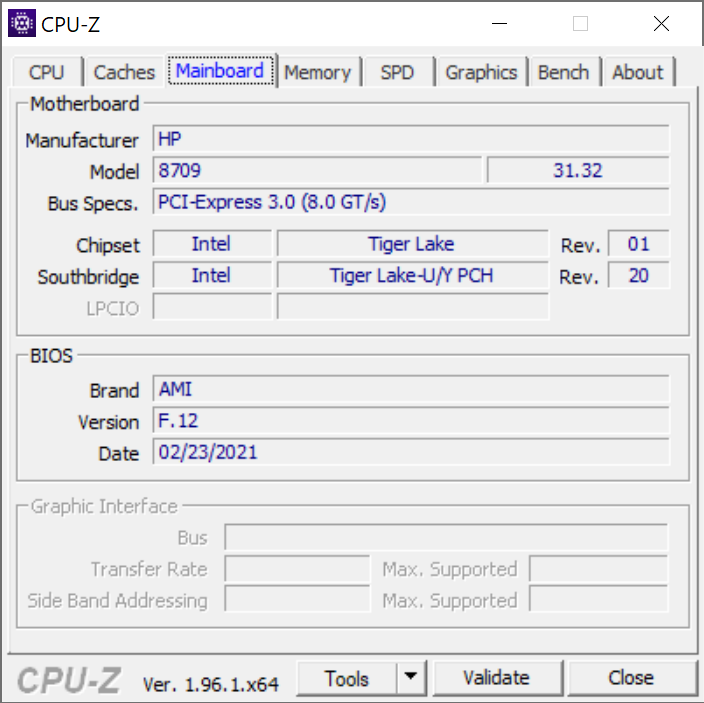
Port options and positioning are the same as on the 2019 Spectre x360 13 including the dual Thunderbolt 3 ports. It's somewhat disappointing that the USB-C ports have not been upgraded to Thunderbolt 4, but HP is promising 40 Gbps per port regardless. The integrated USB-A port is appreciated since certain convertibles lack the option.
A SIM slot is available along the left edge if configured with 4G LTE.
SD Card Reader
The spring-loaded MicroSD reader is just as speedy as before with transfer rates of over 180 MB/s on our AV PRO microSD 128 GB V60 test card.
| SD Card Reader | |
| average JPG Copy Test (av. of 3 runs) | |
| HP Spectre x360 14t-ea000 (Toshiba Exceria Pro M501 microSDXC 32GB) | |
| HP Spectre x360 13-aw2003dx (AV PRO microSD 128 GB V60) | |
| Dell XPS 13 7390 Core i7-10710U (Toshiba Exceria Pro M501 64 GB UHS-II) | |
| HP Spectre x360 13-aw0013dx (Toshiba Exceria Pro M501 microSDXC 64GB) | |
| Lenovo Yoga Duet 7 13IML05-82AS000WGE (Toshiba Exceria Pro M501 microSDXC 64GB) | |
| MSI Summit E13 Flip Evo A11MT (AV PRO microSD 128 GB V60) | |
| maximum AS SSD Seq Read Test (1GB) | |
| HP Spectre x360 14t-ea000 (Toshiba Exceria Pro M501 microSDXC 32GB) | |
| Dell XPS 13 7390 Core i7-10710U (Toshiba Exceria Pro M501 64 GB UHS-II) | |
| HP Spectre x360 13-aw0013dx (Toshiba Exceria Pro M501 microSDXC 64GB) | |
| HP Spectre x360 13-aw2003dx (AV PRO microSD 128 GB V60) | |
| MSI Summit E13 Flip Evo A11MT (AV PRO microSD 128 GB V60) | |
| Lenovo Yoga Duet 7 13IML05-82AS000WGE (Toshiba Exceria Pro M501 microSDXC 64GB) | |
Communication
The Intel AX201 comes standard with integrated Bluetooth 5.1 much like on the 2019 Ice Lake model. We experienced no issues when paired to our Netgear RAX200 Wi-Fi 6 router.
Webcam

")
")
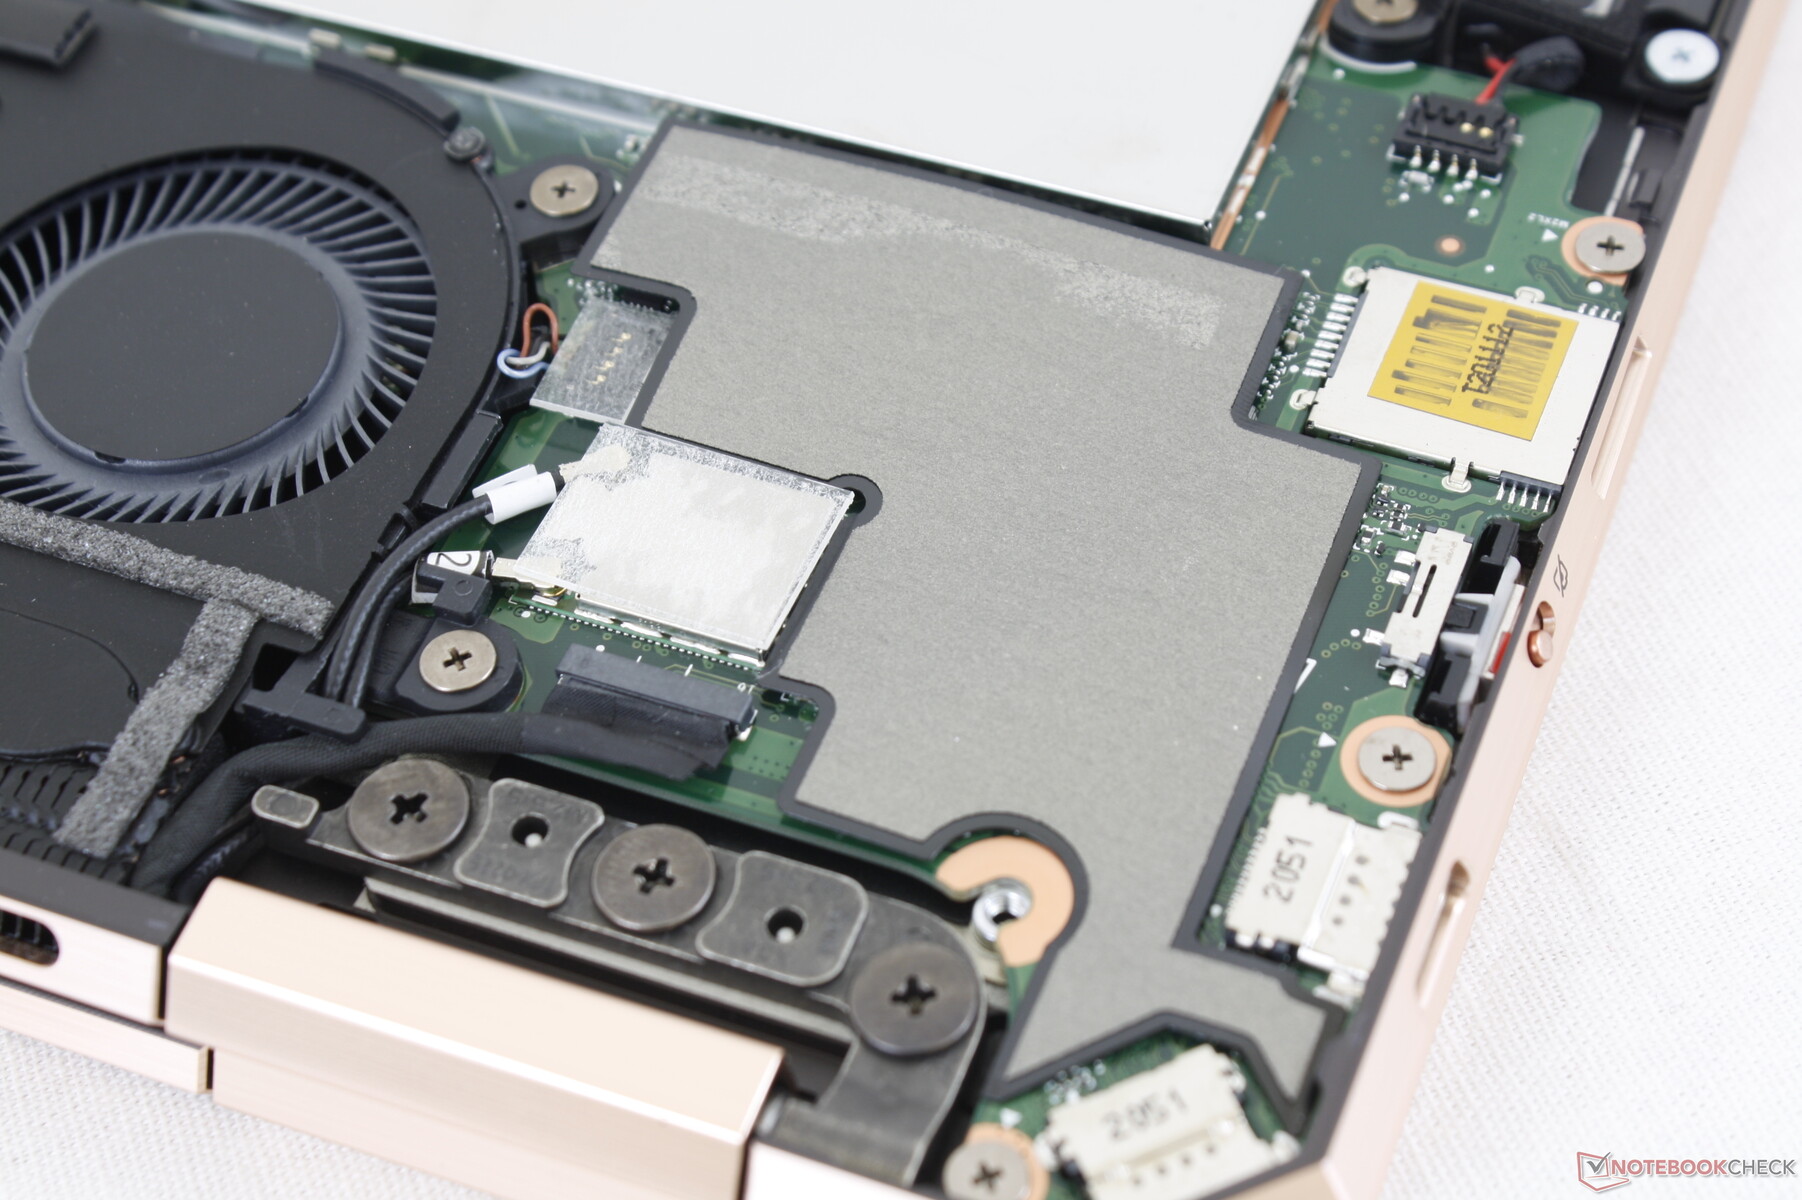
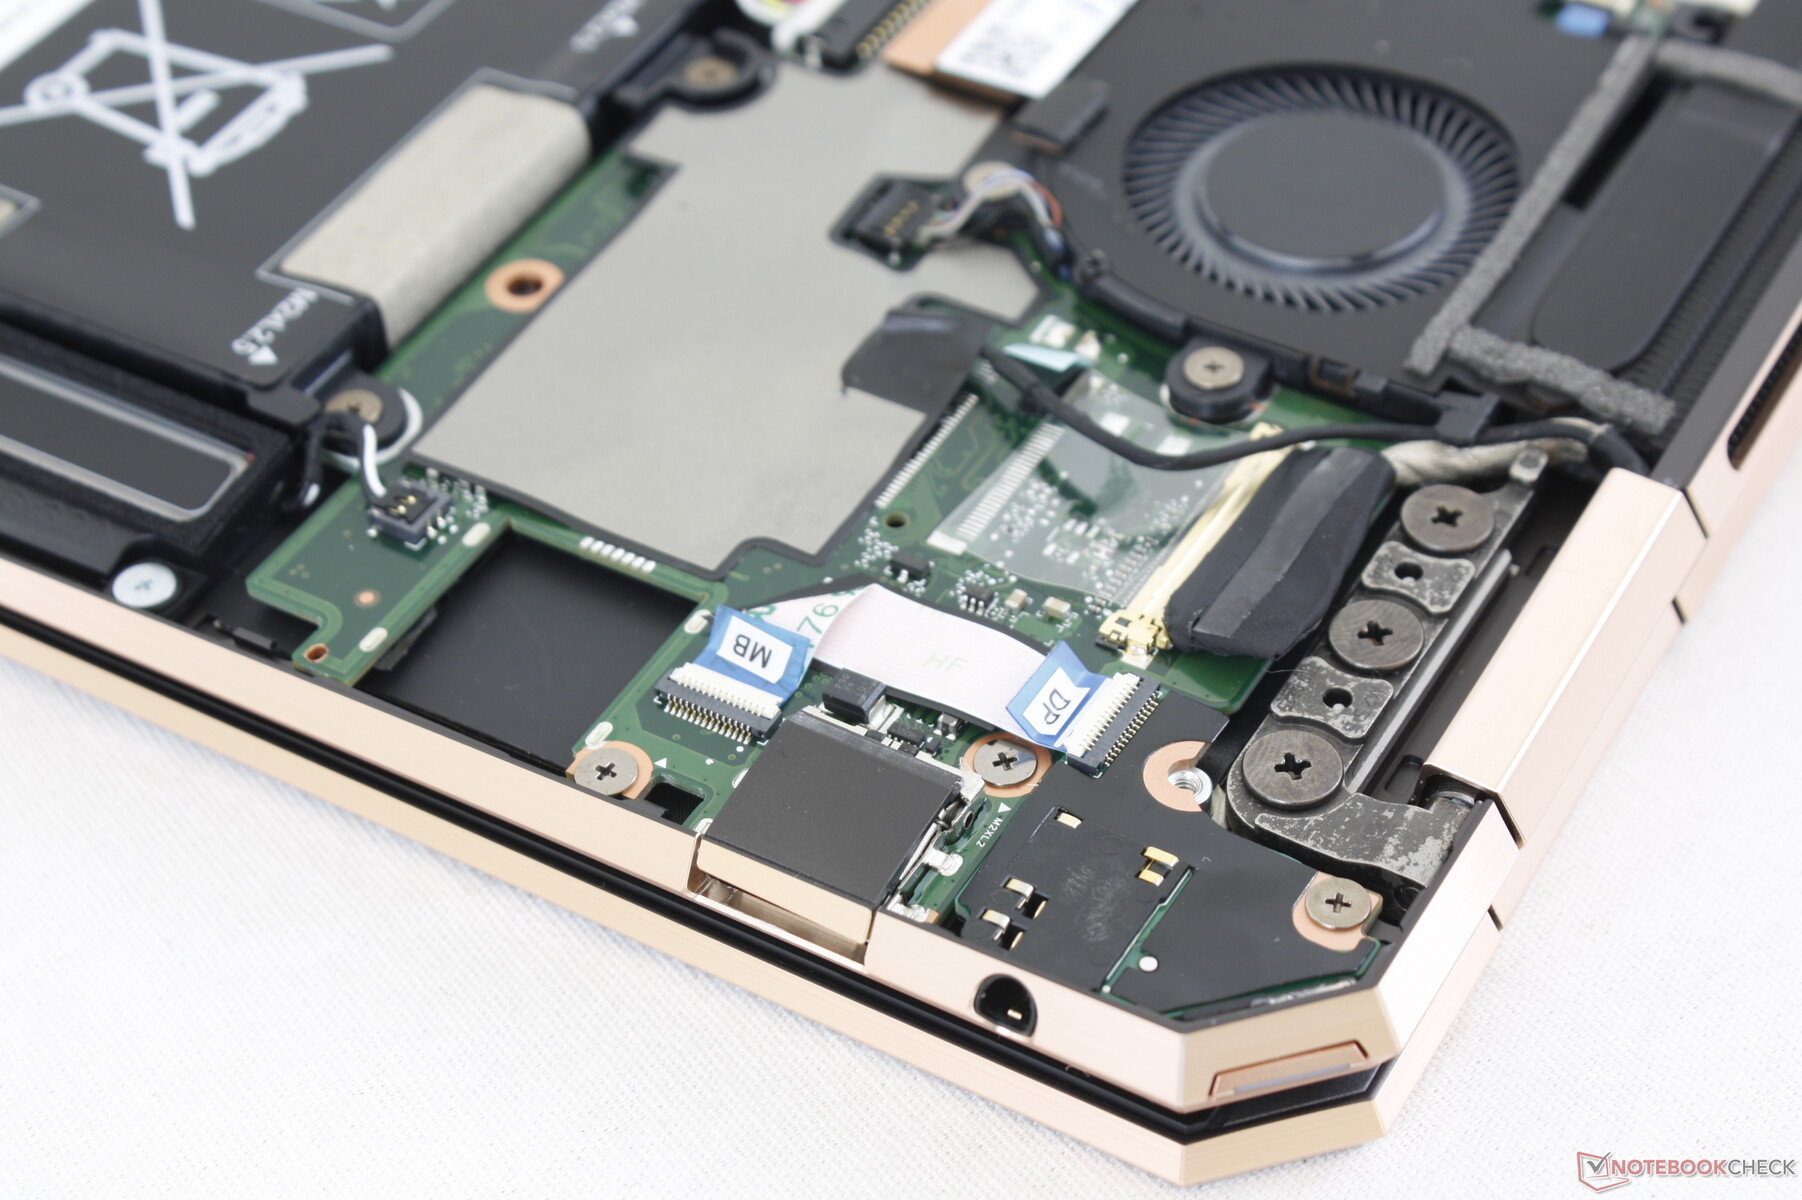
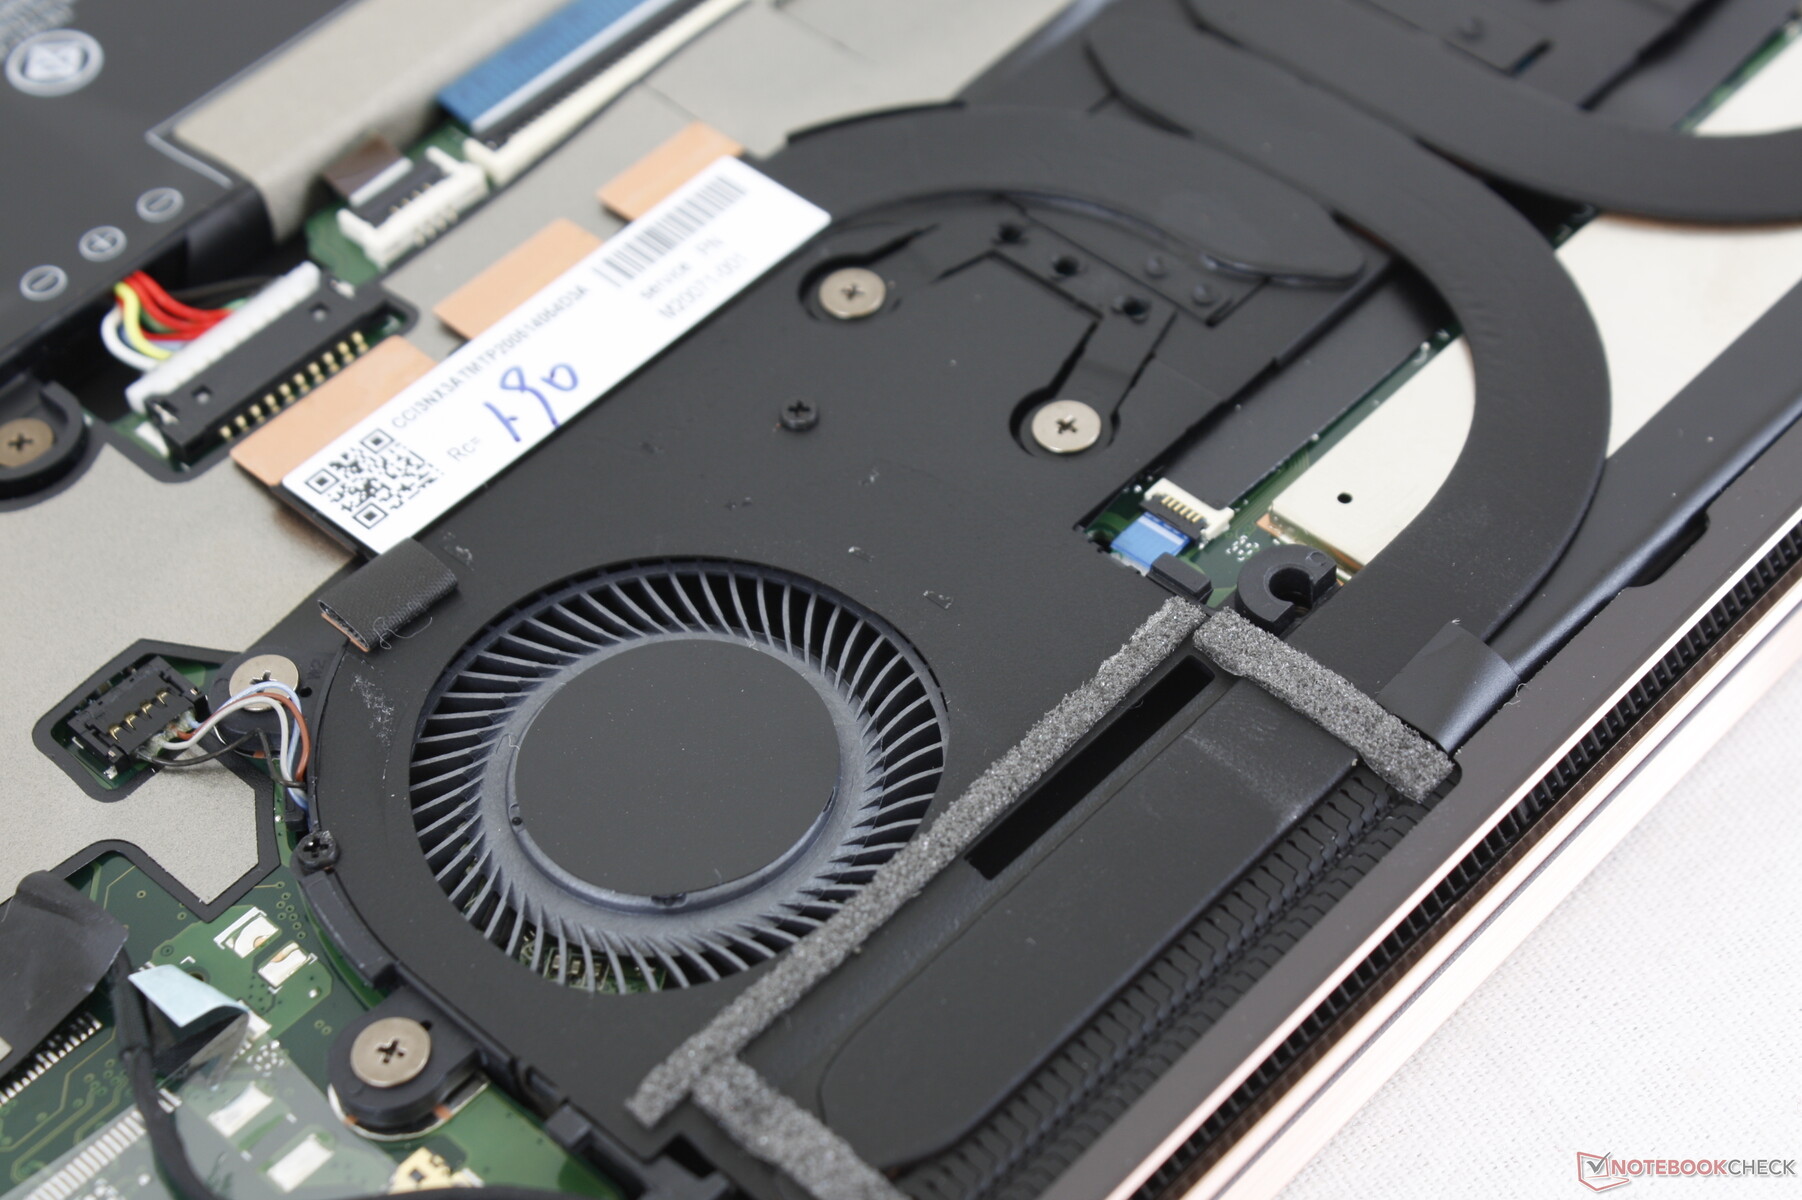
Maintenance
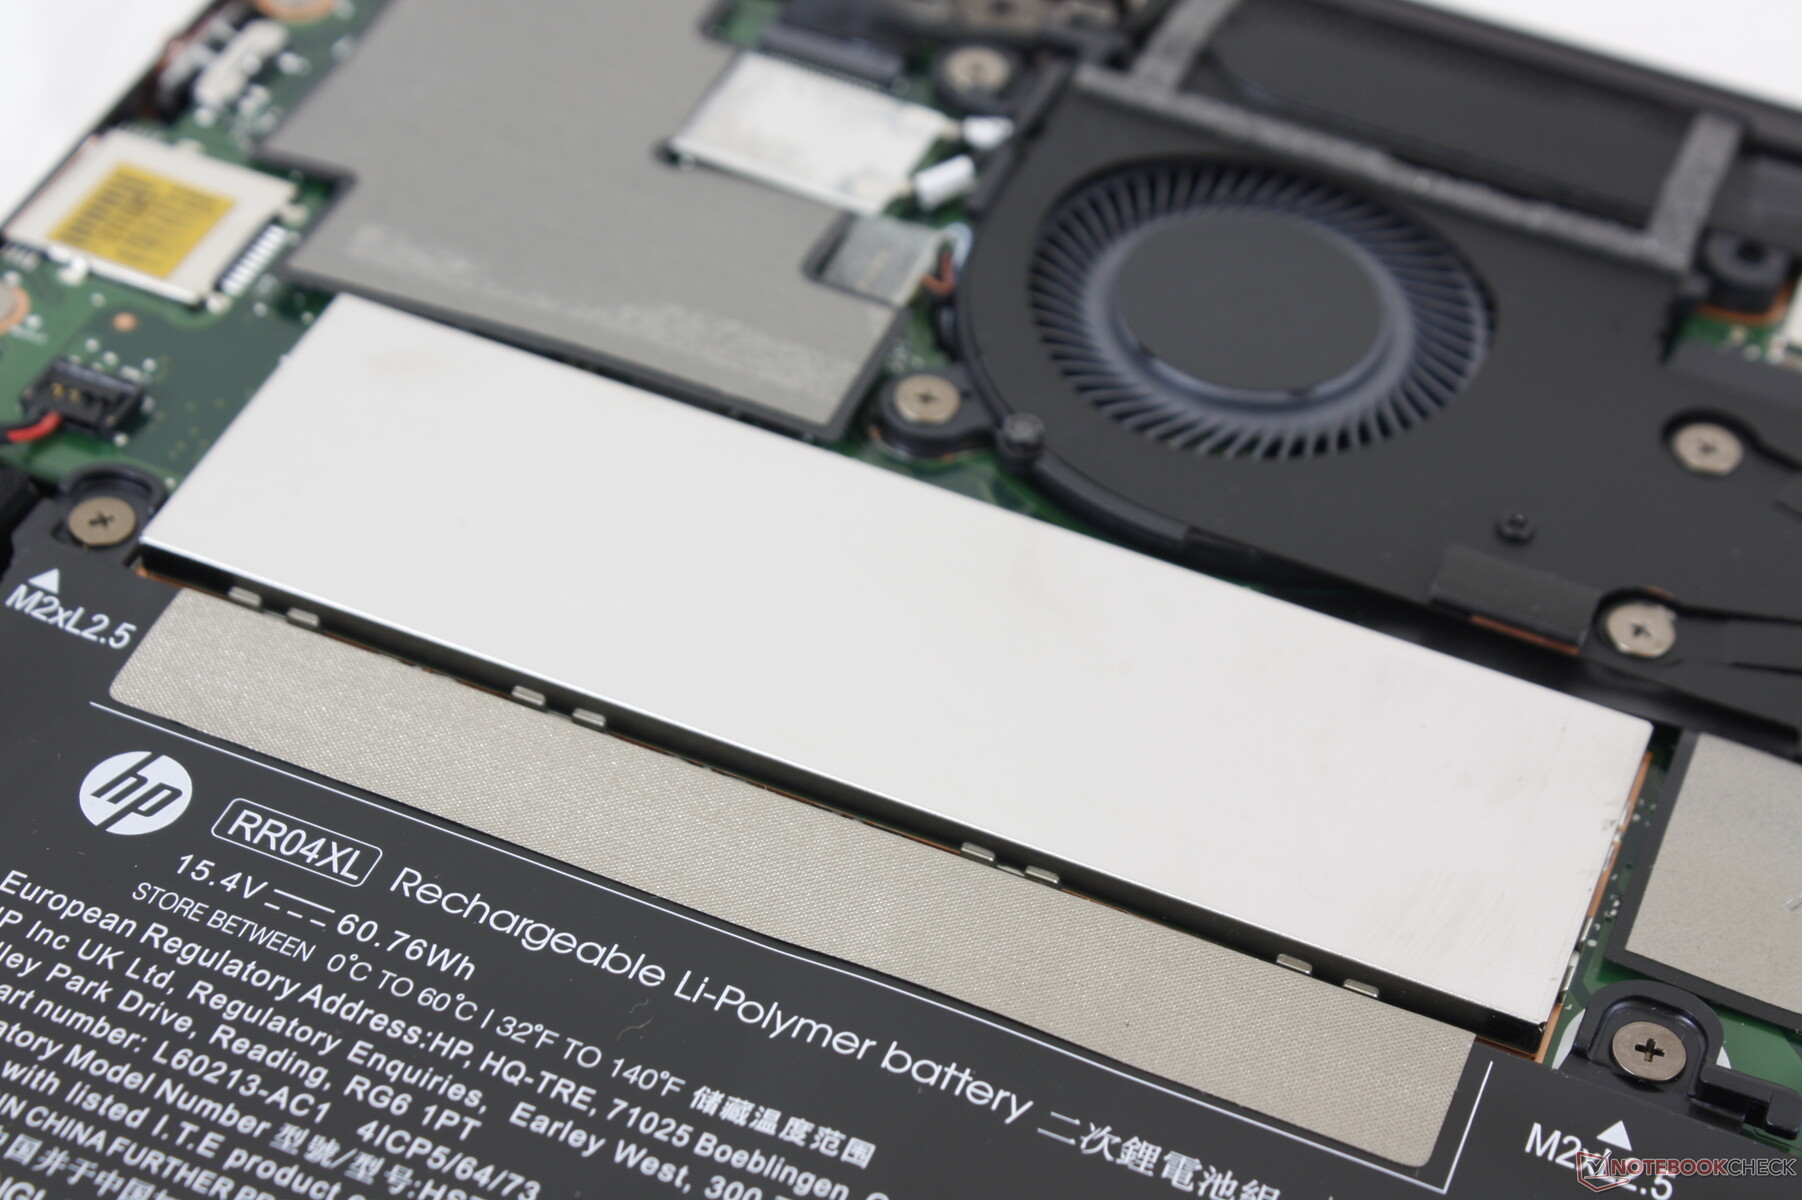
The bottom panel is secured by two T5 Torx screws plus four Philips screws hidden underneath the rubber feet. Users can only upgrade the M.2 SSD (and potentially the WAN module) since the WLAN and RAM modules are soldered.

Accessories and Warranty
The retail box includes an HP Tilt Pen stylus (HP P/N: M23864-001) alongside a faux leather carrying sleeve, USB-C AC adapter, and paperwork. A cleaning cloth is not included.
The standard one-year limited manufacturer warranty applies with extensive options. Larger makers like HP, Lenovo, or Dell tend to have more warranty options than other manufacturers.
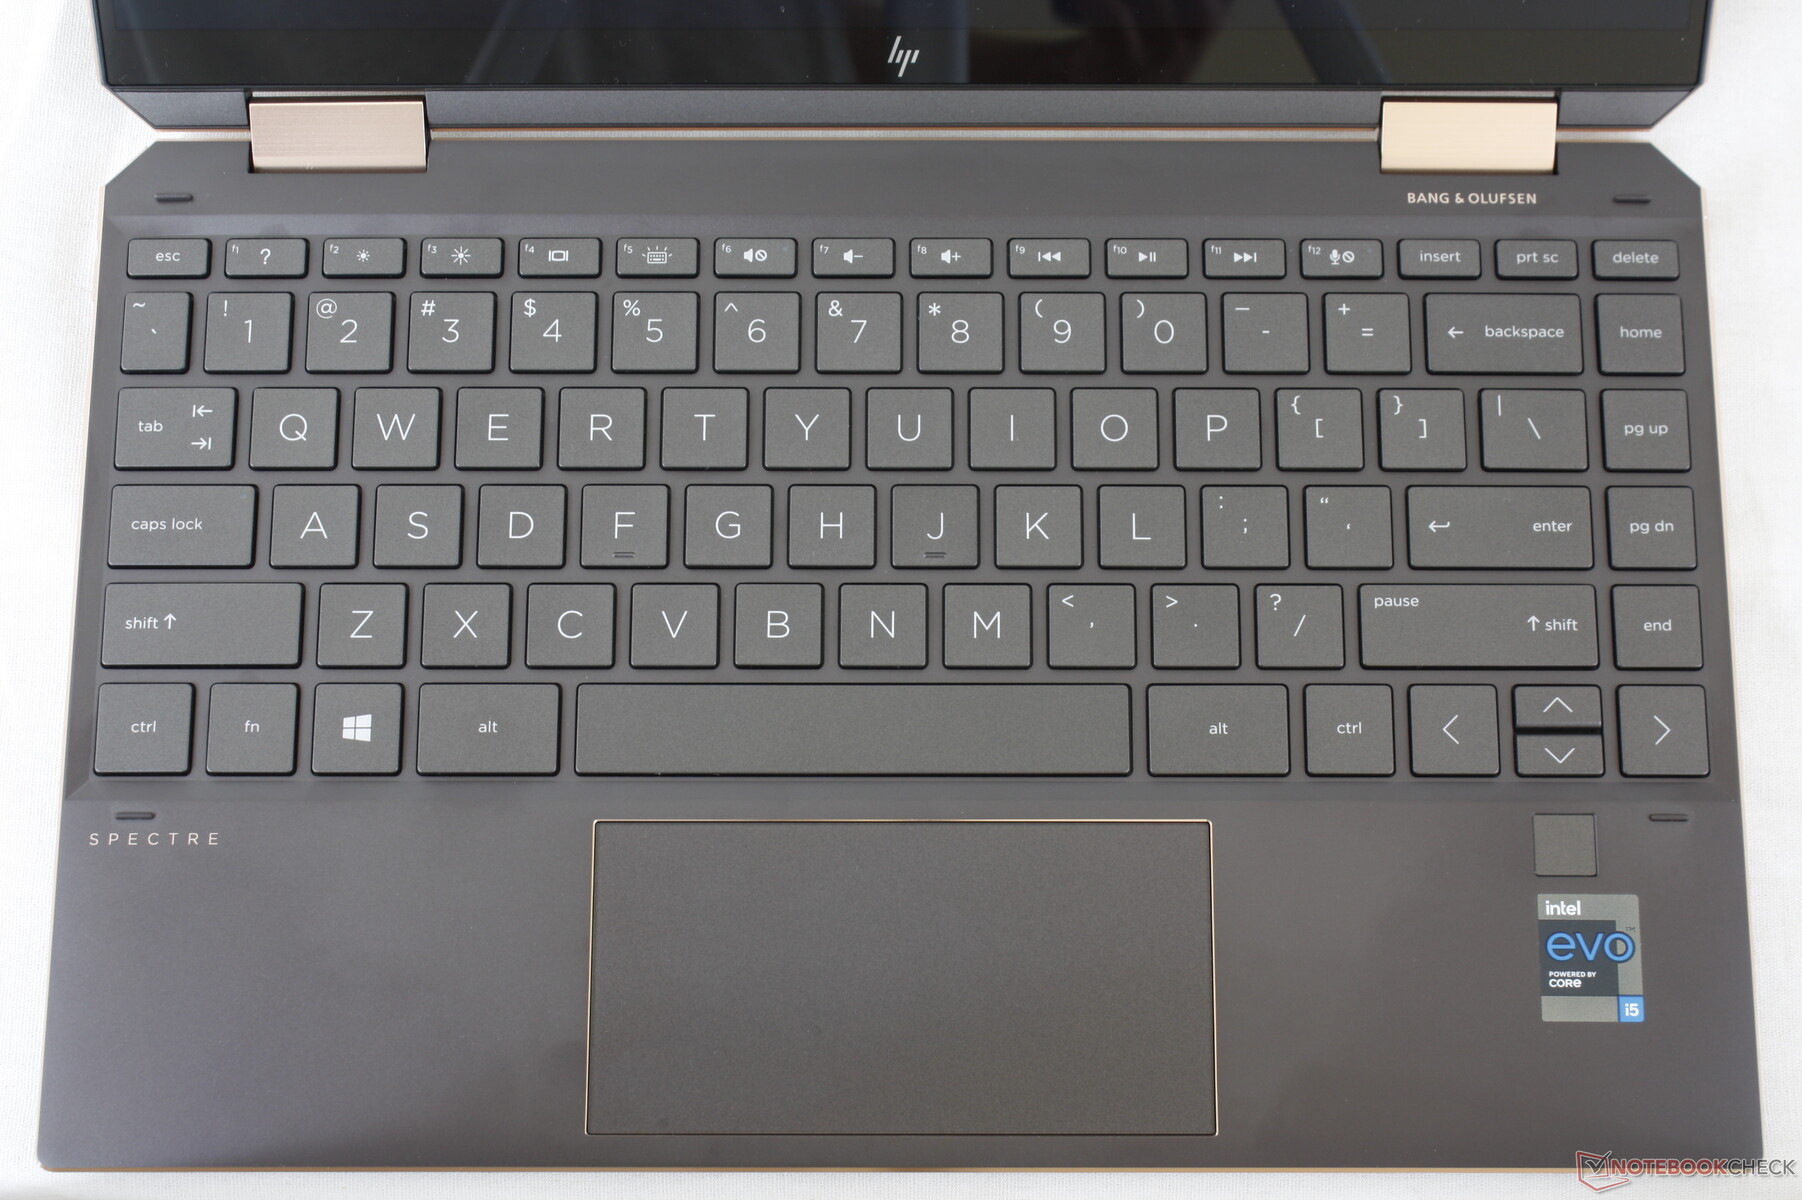
Input Devices
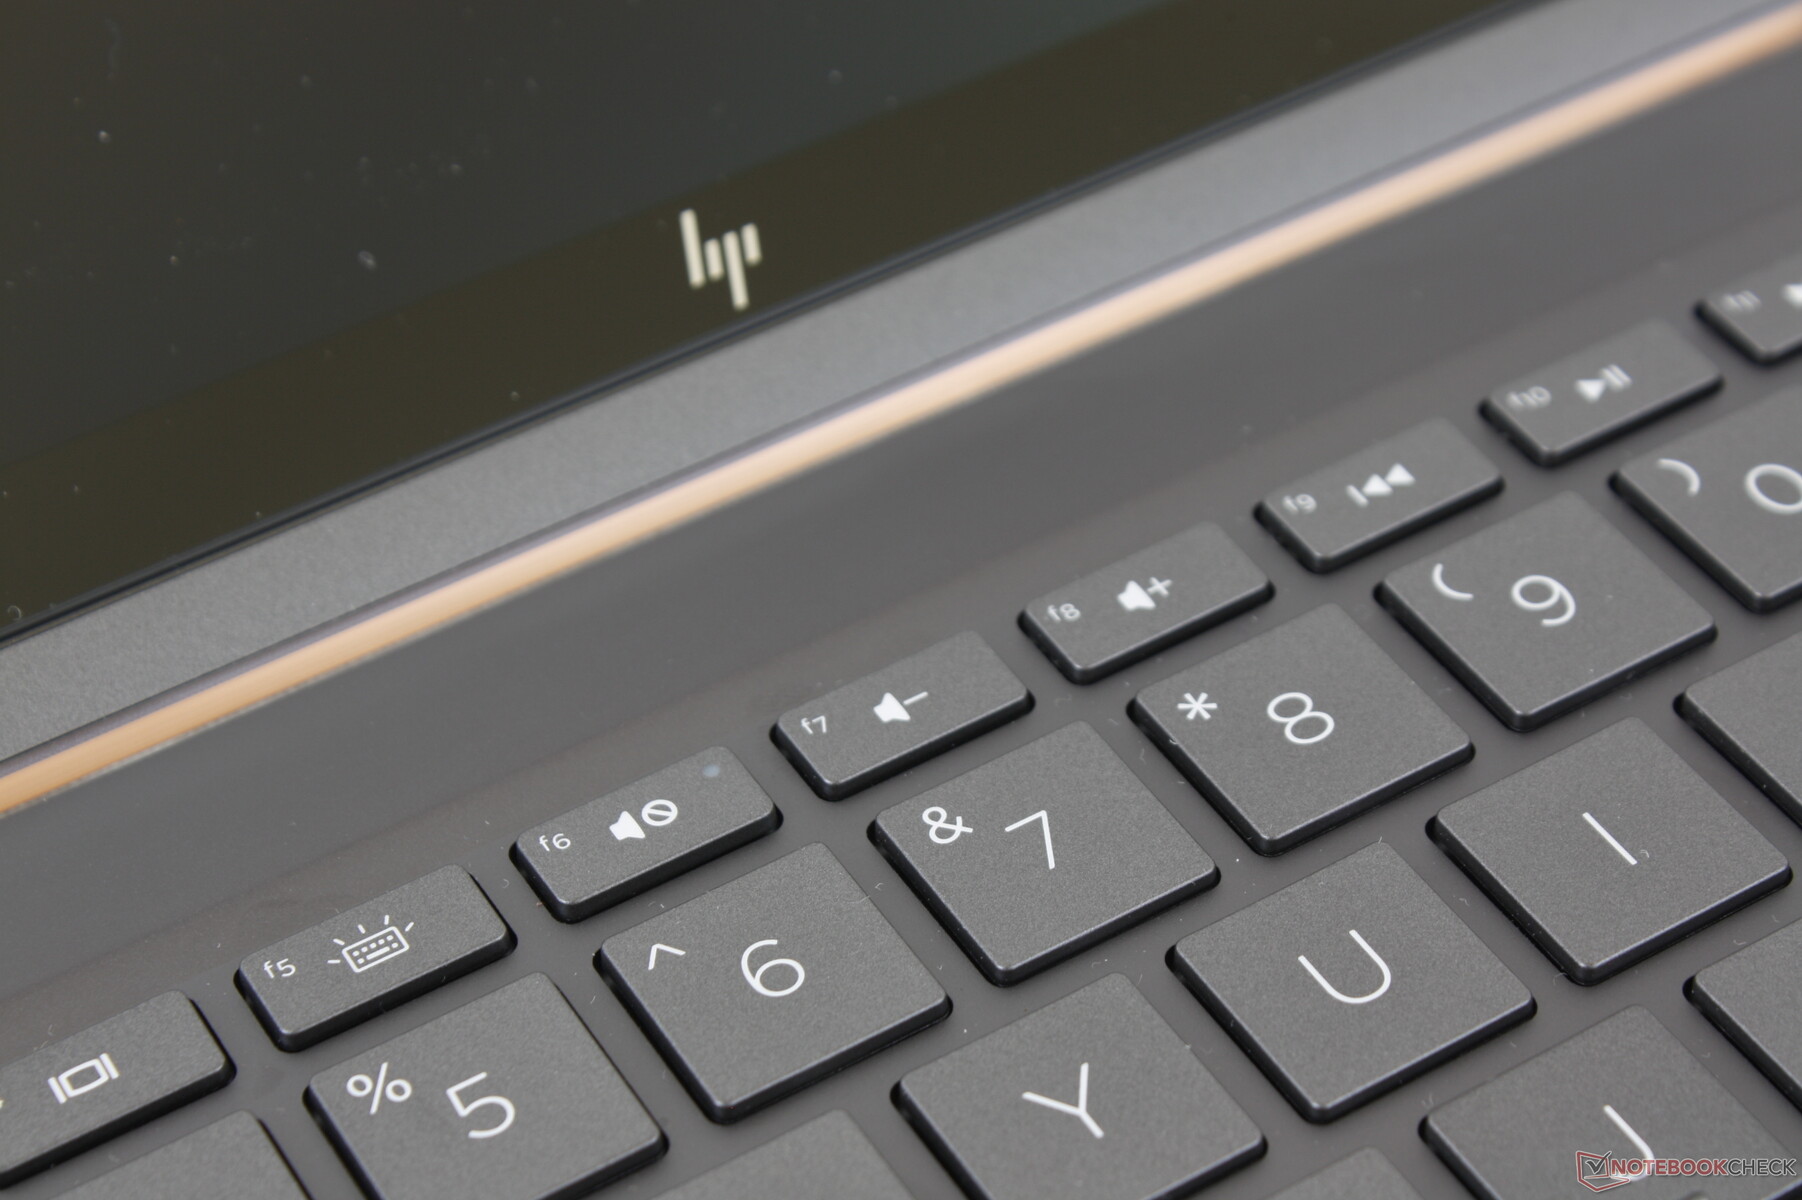
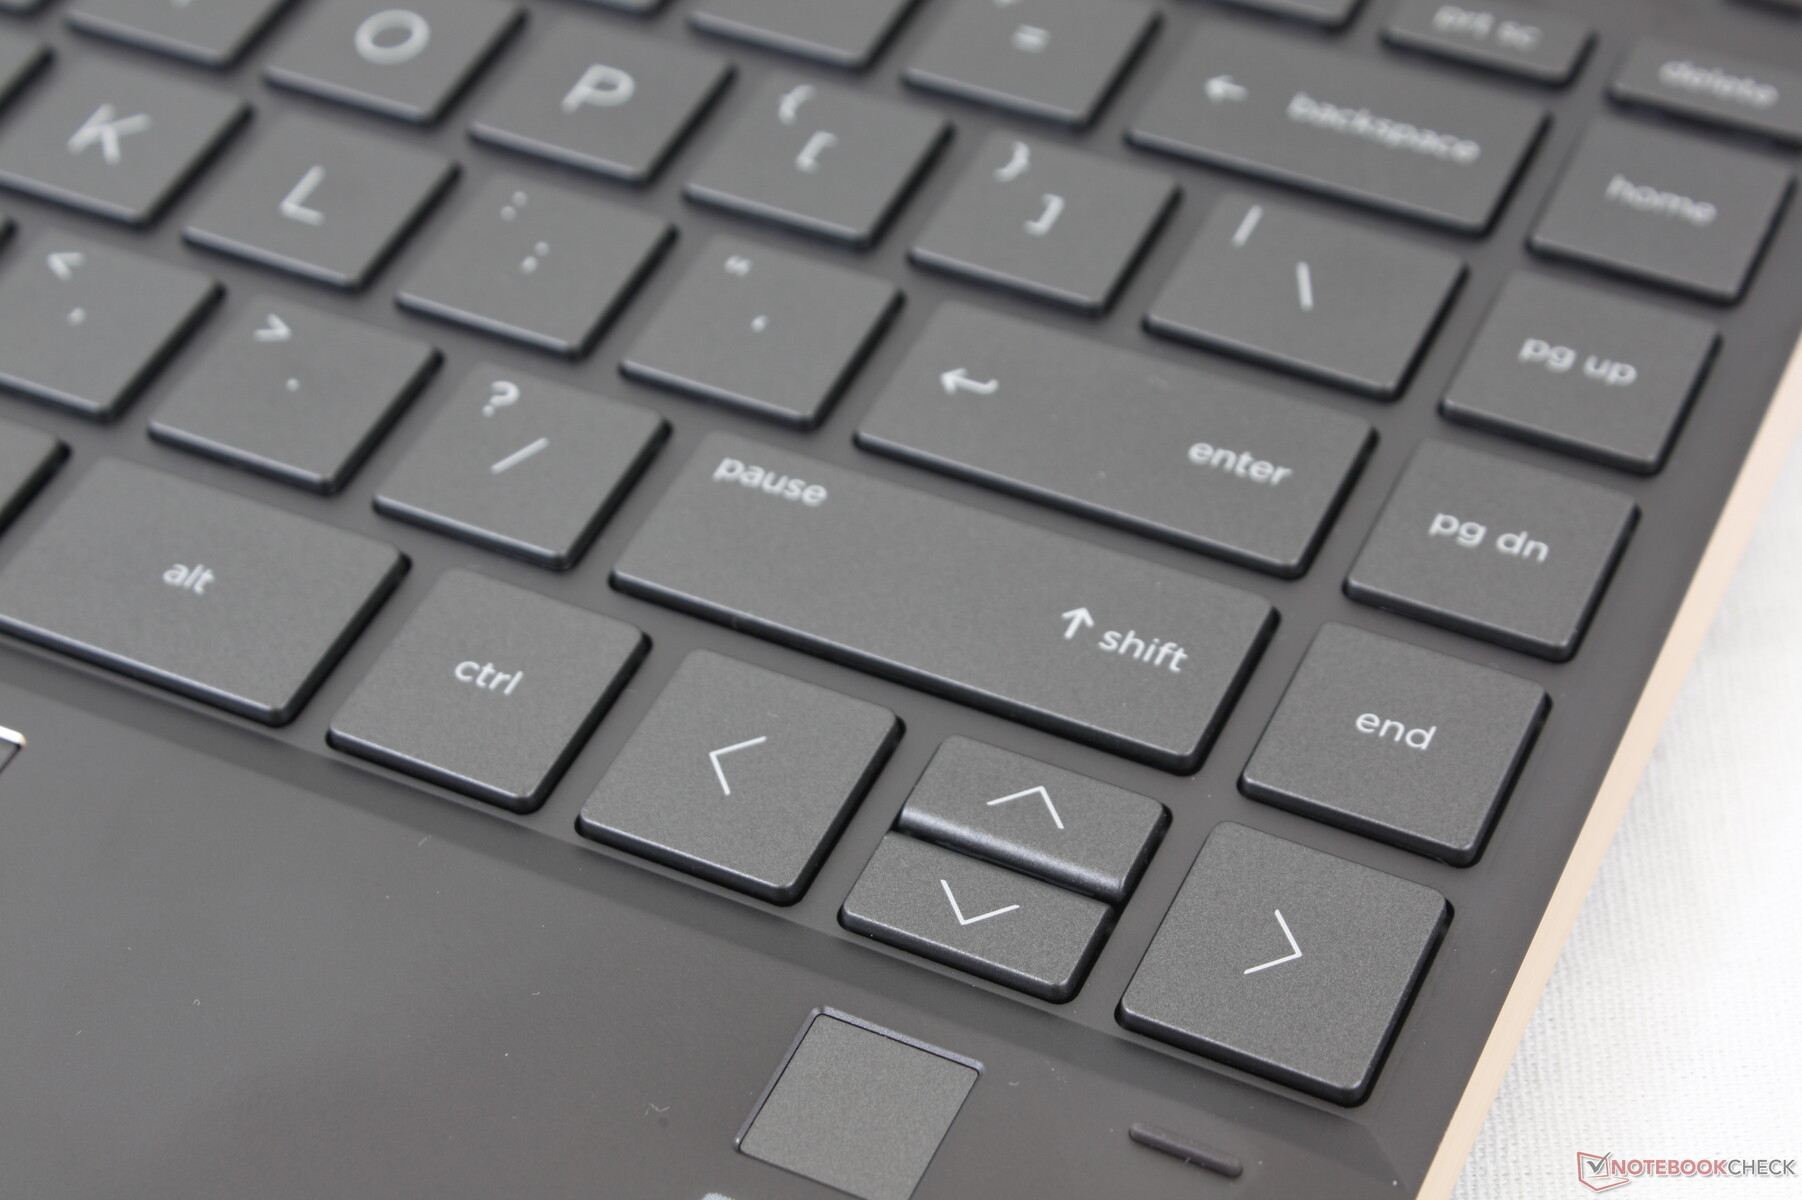
Keyboard
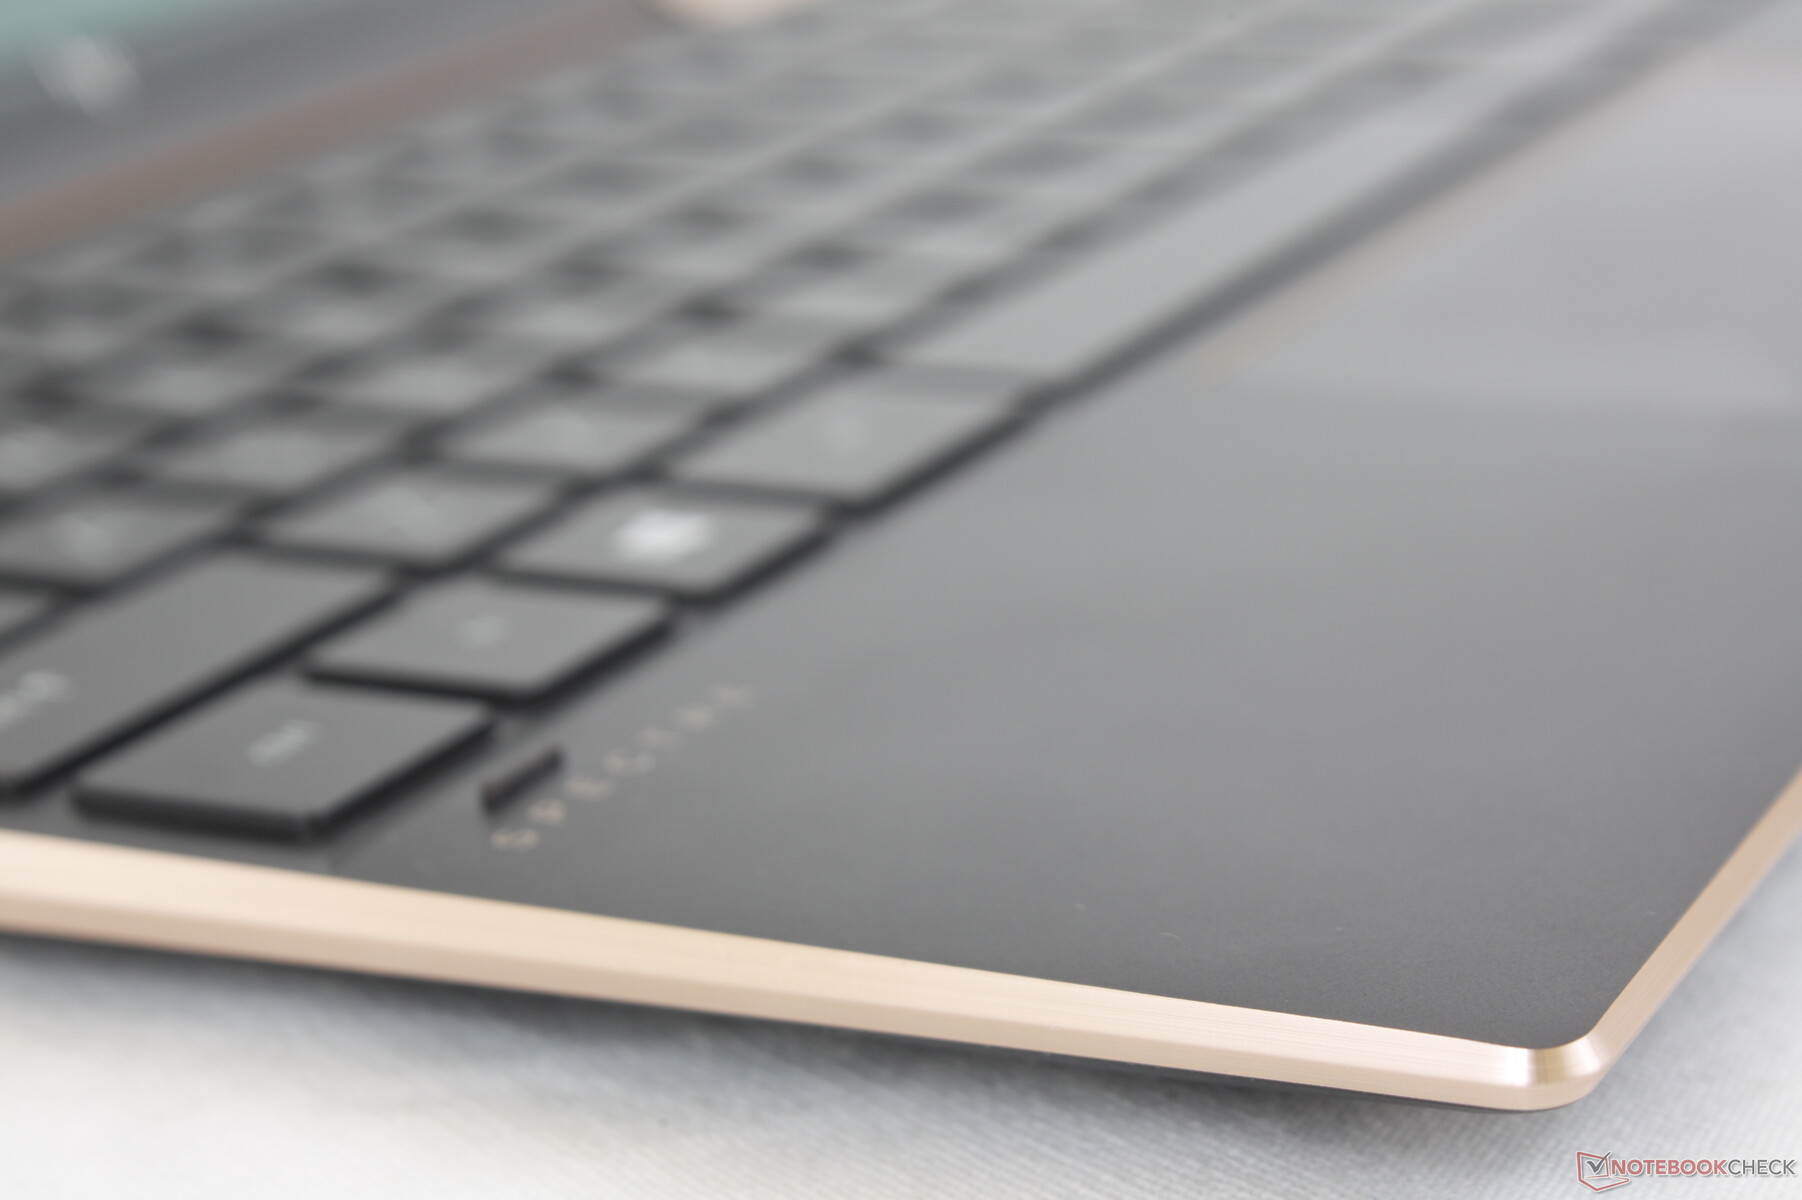
The keyboard remains identical to the 2019 Spectre x360 13 including even the symbols on each key. The Spectre and EliteBook series are home to some of our favorite laptop keyboards and so the lack of any gen-to-gen changes here isn't necessarily a bad thing. Feedback, travel, and clatter still feel crisper, deeper, and quieter than on most other Ultrabooks for a satisfying typing experience
On future models, we would love to see an HP Programmable Key much like on the latest Envy laptops to improve user customization.
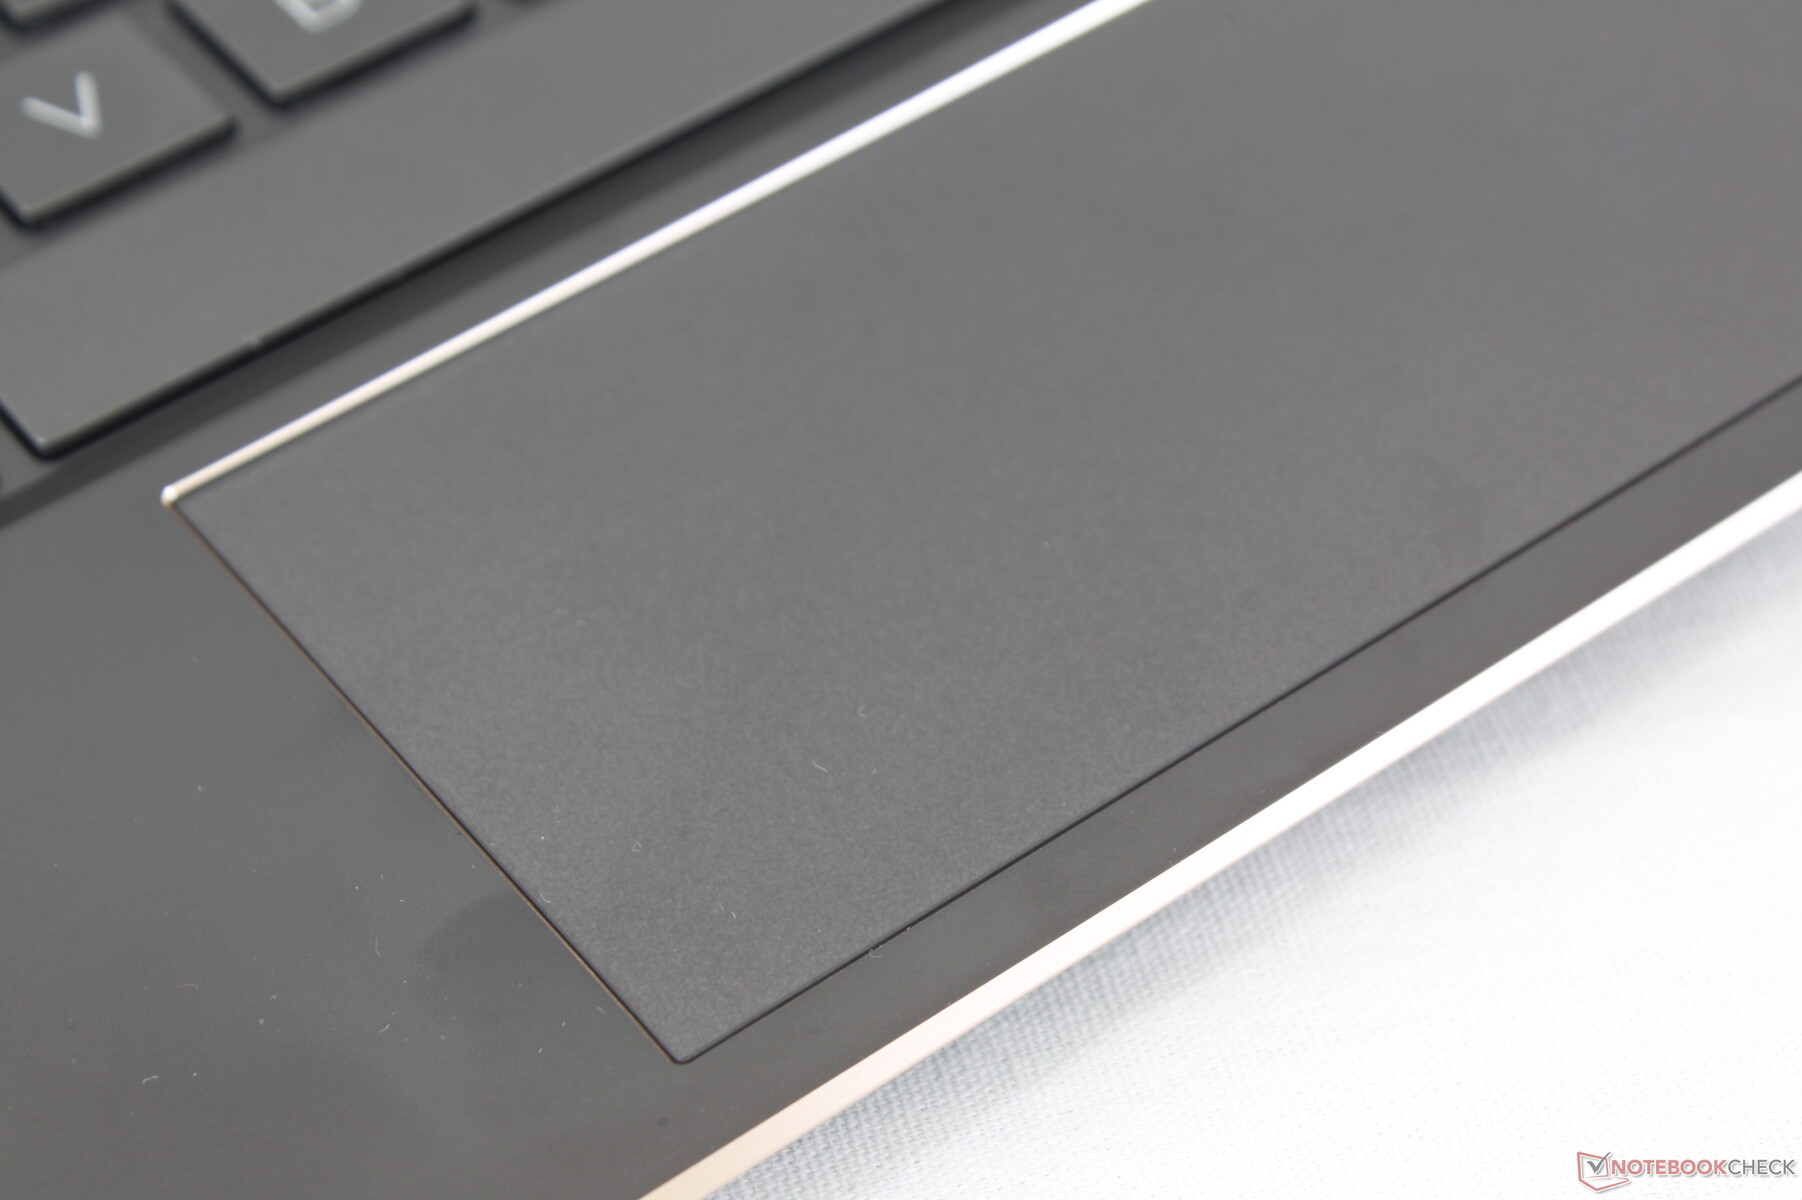
Touchpad
The clickpad also remains identical to the 2019 version in both feedback and dimensions (~11.1 x 5.6 cm). Its smooth surface is firm when pressed and with loud but satisfying clatter. Our main issue with the clickpad is that clicking requires a bit more force than usual meaning it can get tiring to use if you don't have an external mouse.
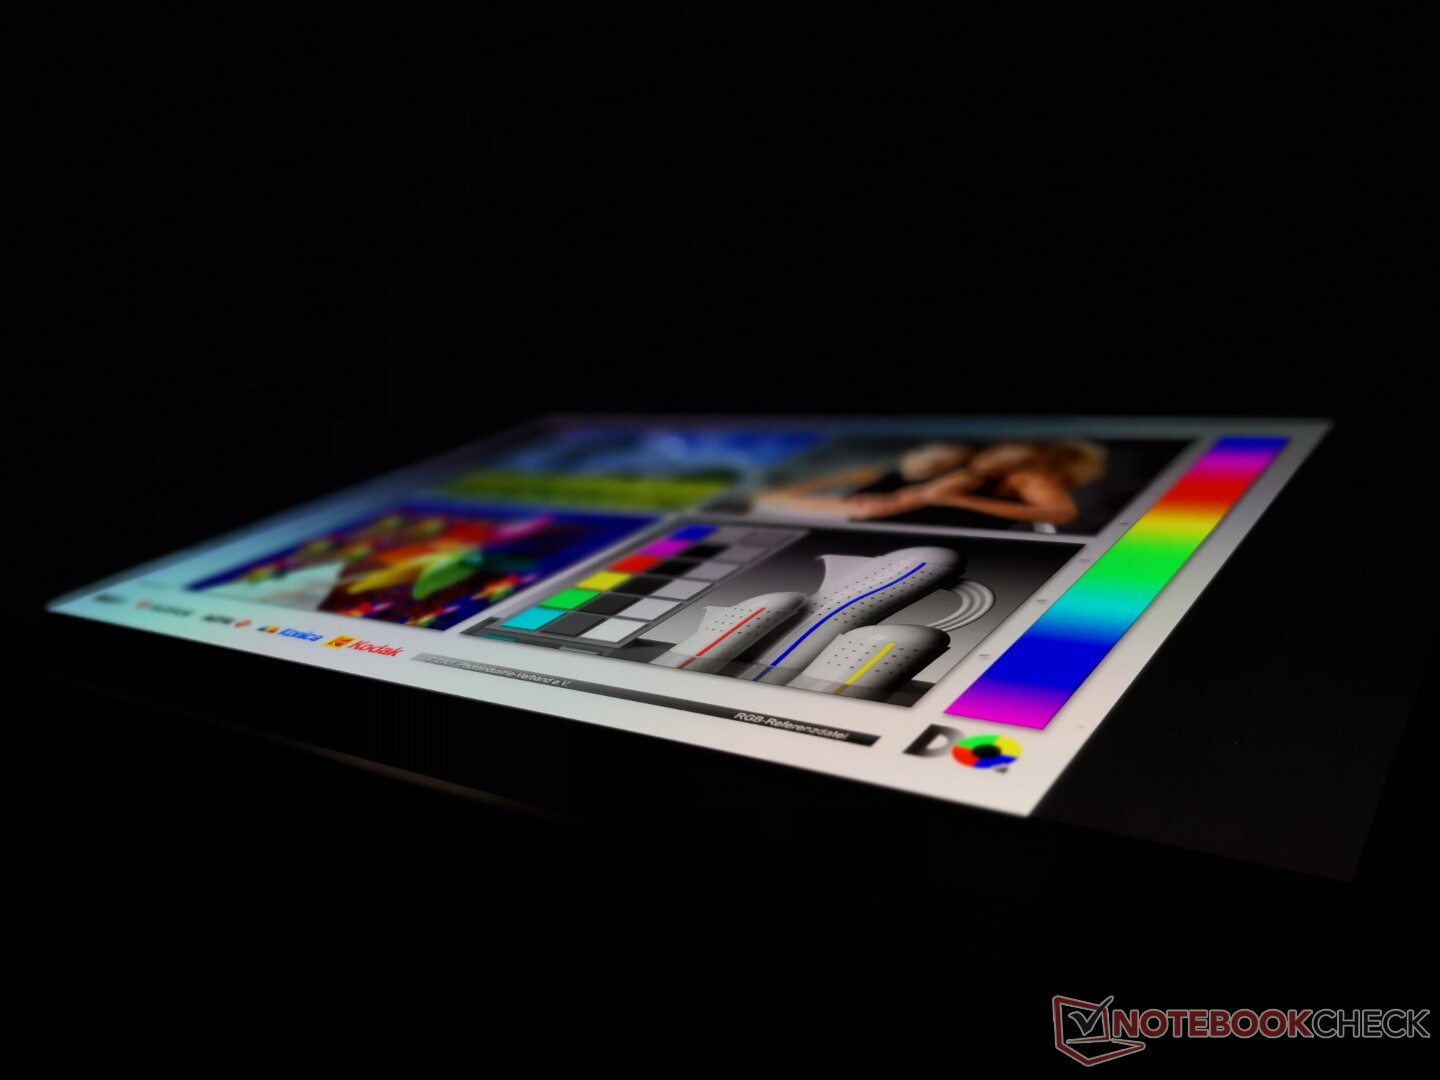
Display
OLED offers deeper colors, higher contrast, and significantly faster black-white and gray-gray response times than IPS to minimize ghosting. Unfortunately, this seems to come at the cost of brightness as the OLED display maxes out at around 350 nits compared to 400 on the IPS configuration.
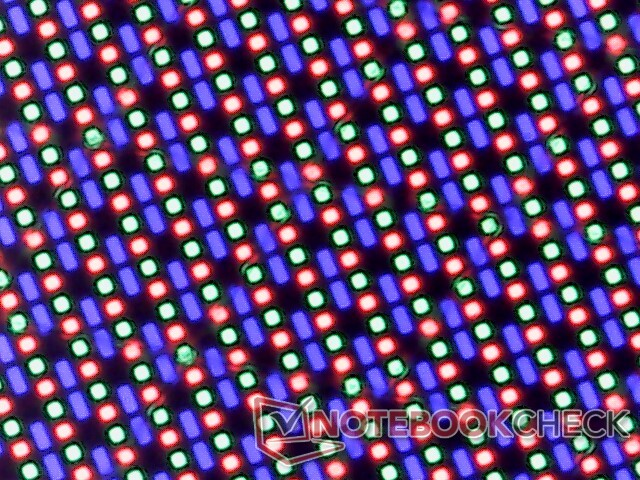
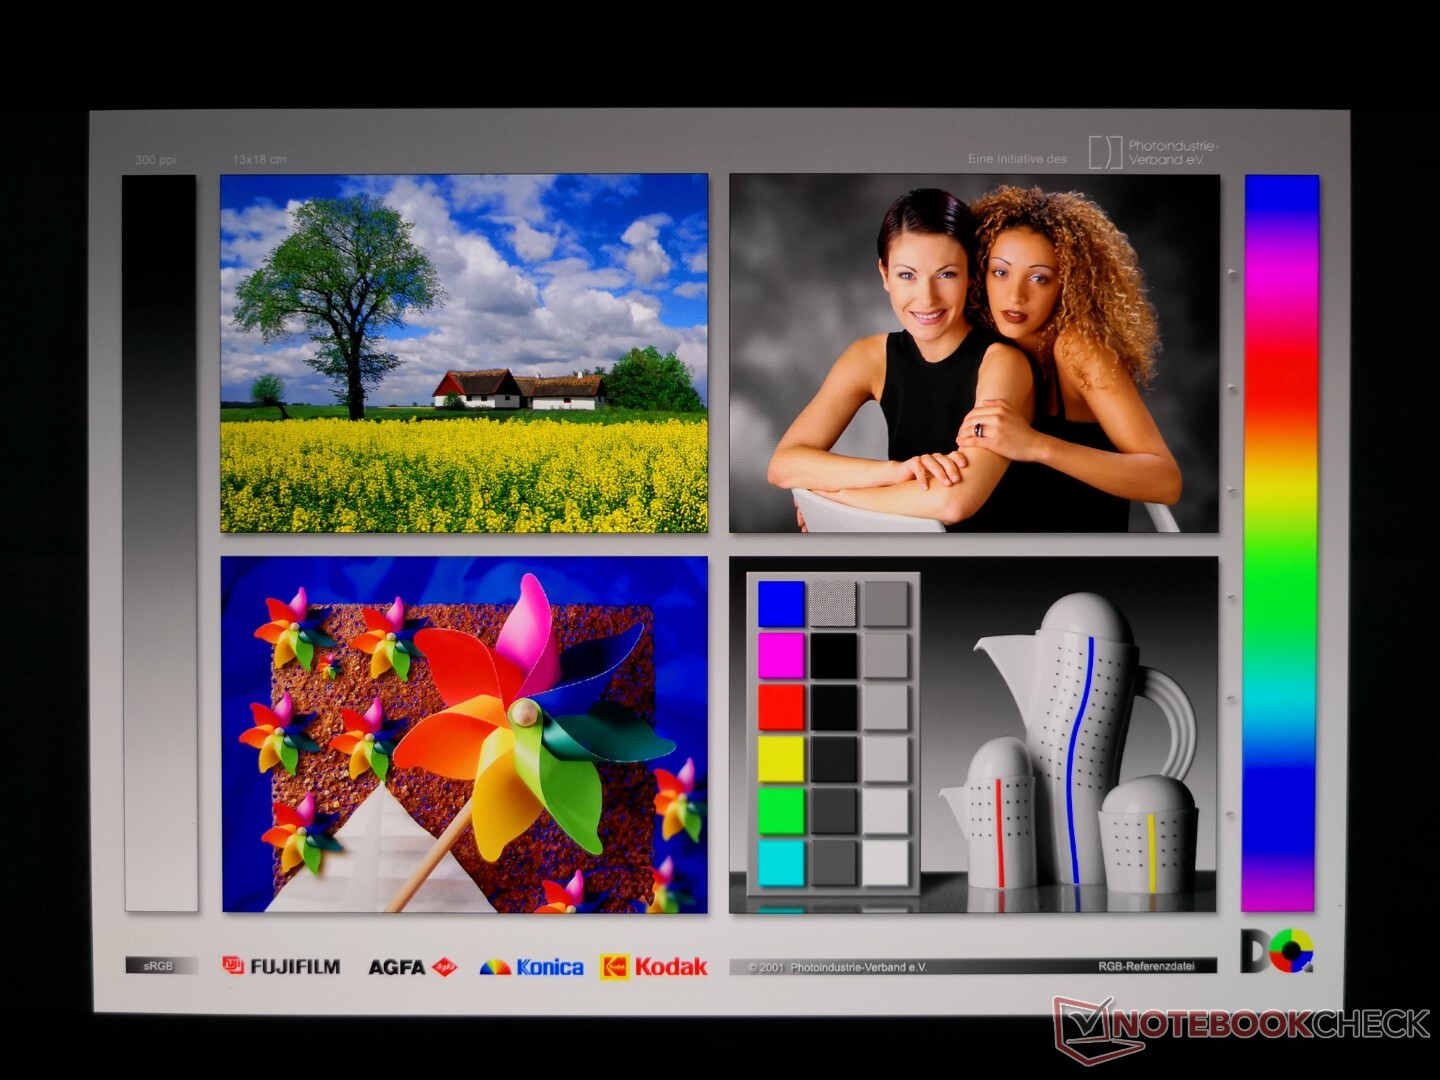
Picture quality is good, but we think it could have been better. When displaying an all-white image, there is some graininess to the picture likely due to the overlying glass touchscreen layer. Black texts against white backgrounds subsequently don't appear as crisp as they could have been especially for a native 4K display.
Pulse-width modulation is present on all brightness levels similar to what we observed on the Dell XPS 15 OLED and Razer Blade 15 OLED. In particular, we're able to measure a modulation frequency of 242.7 Hz and 59.5 Hz from 0 to 40 percent brightness and 41 to 100 percent brightness, respectively.


| |||||||||||||||||||||||||
Brightness Distribution: 93 %
Center on Battery: 355 cd/m²
Contrast: ∞:1 (Black: 0 cd/m²)
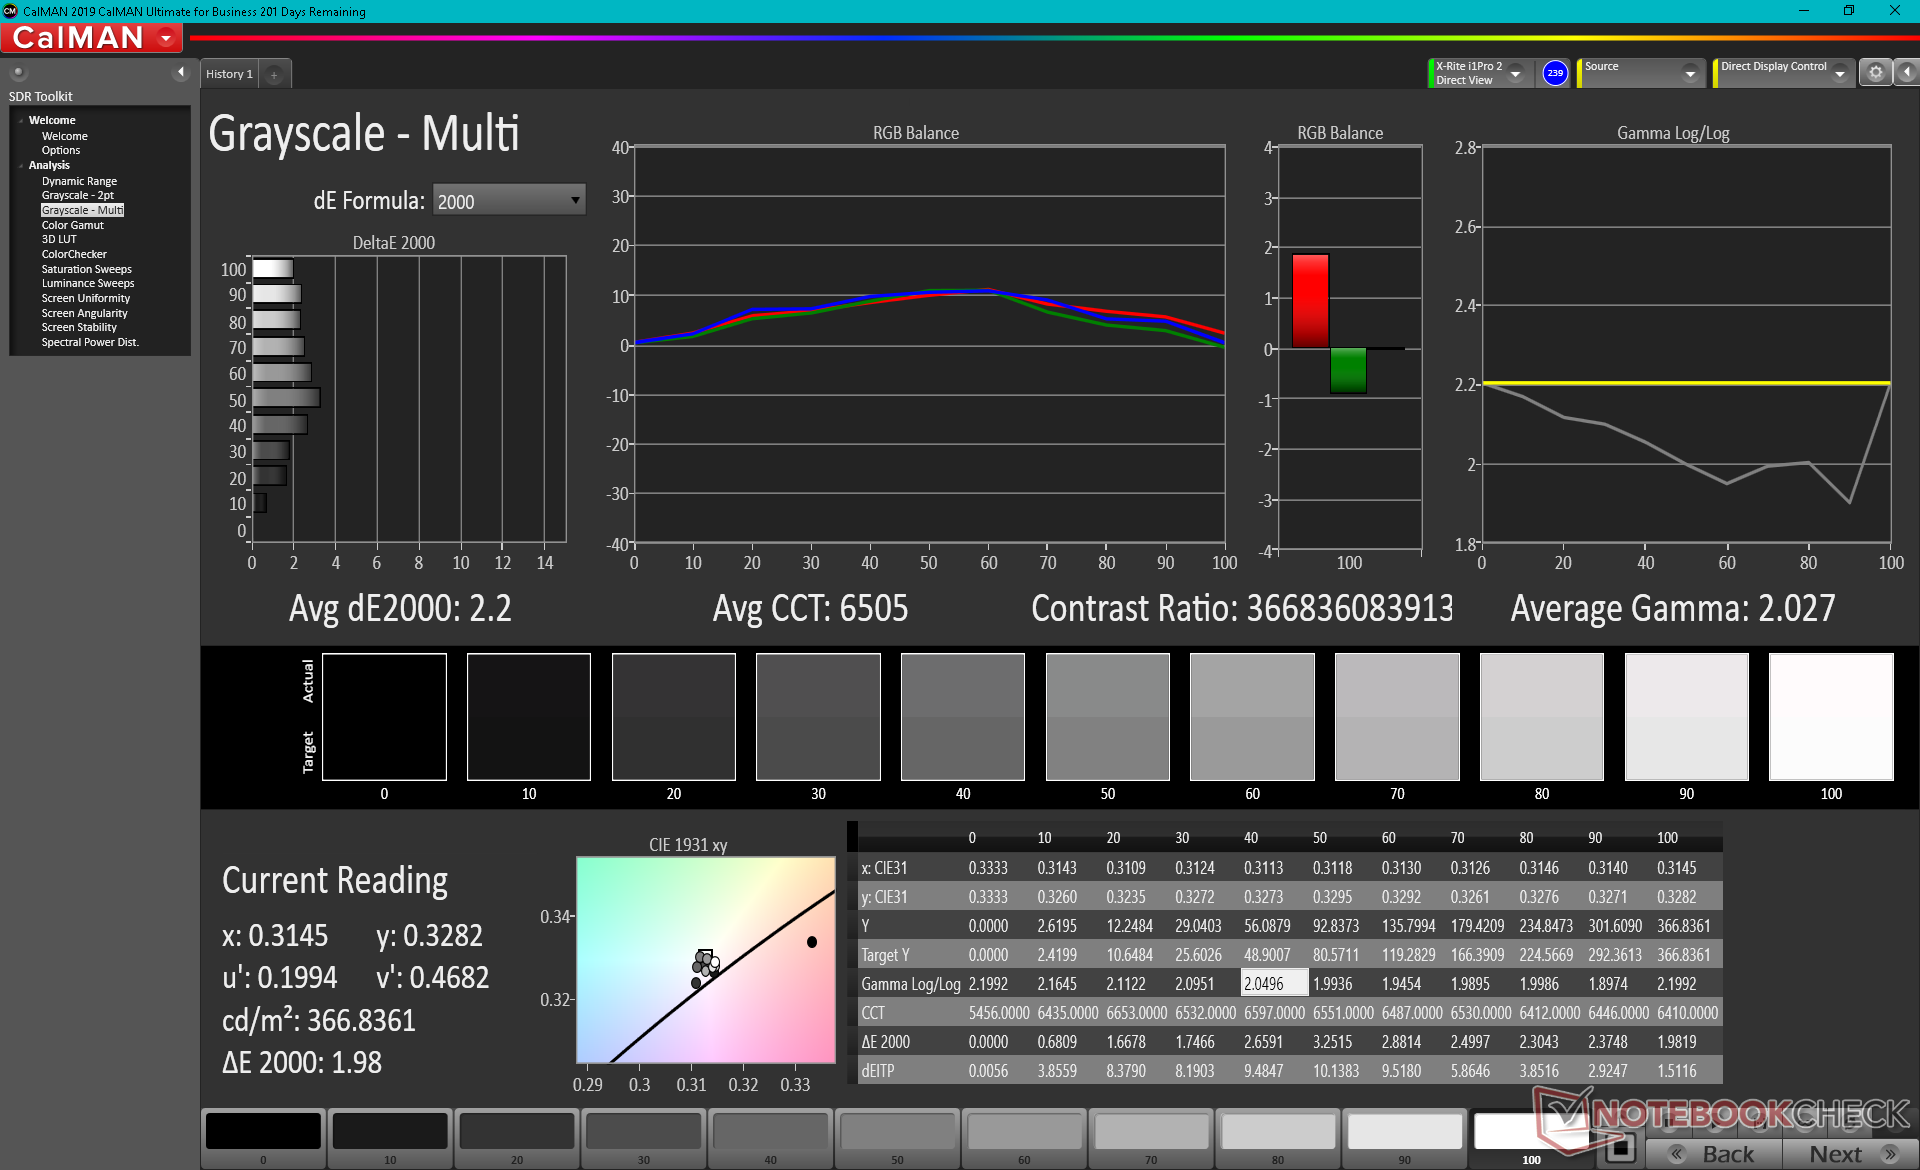
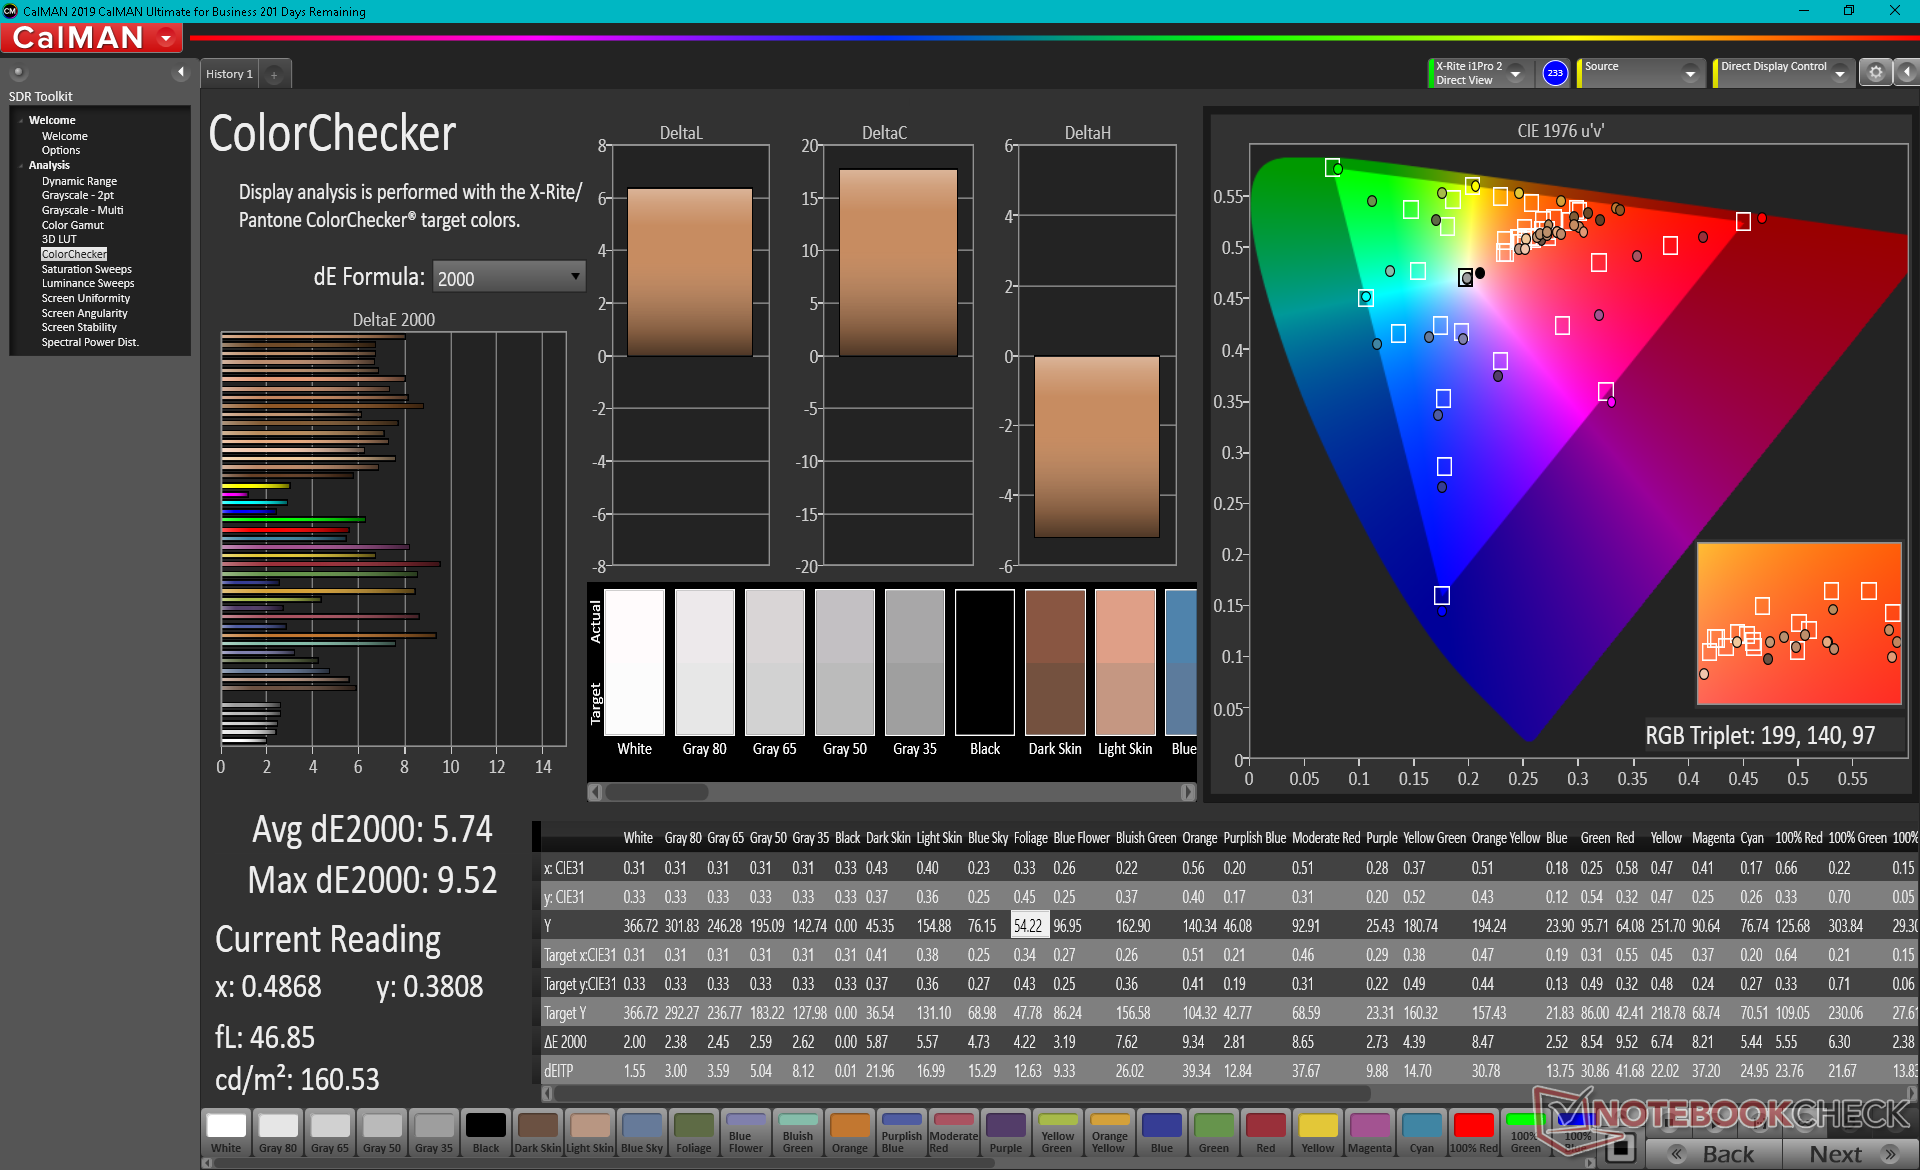
ΔE ColorChecker Calman: 5.74 | ∀{0.5-29.43 Ø4.76}
calibrated: 6.69
ΔE Greyscale Calman: 2.2 | ∀{0.09-98 Ø5}
88.6% sRGB (Argyll 1.6.3 3D)
73.6% AdobeRGB 1998 (Argyll 1.6.3 3D)
81.2% AdobeRGB 1998 (Argyll 3D)
88.5% sRGB (Argyll 3D)
70% Display P3 (Argyll 3D)
Gamma: 2.03
CCT: 6505 K
| HP Spectre x360 13-aw2003dx Samsung SDC4149, OLED, 13.3", 3840x2160 | HP Spectre x360 14t-ea000 LG Philips LGD0663, IPS, 13.5", 1920x1280 | HP Spectre x360 13-aw0013dx AU Optronics AUO5E2D, IPS, 13.3", 1920x1080 | Dell XPS 13 7390 Core i7-10710U AU Optronics B133ZAN, Dell P/N: 90NTH, IPS, 13.3", 3840x2160 | MSI Summit E13 Flip Evo A11MT Sharp LQ134N1JW53, IPS, 13.4", 1920x1200 | Lenovo Yoga Duet 7 13IML05-82AS000WGE CSOT T3 LEN8290, IPS, 13", 2160x1350 | |
|---|---|---|---|---|---|---|
| Display | -4% | -0% | -8% | -0% | -1% | |
| Display P3 Coverage (%) | 70 | 65.8 -6% | 69.6 -1% | 63.4 -9% | 69.8 0% | 68.9 -2% |
| sRGB Coverage (%) | 88.5 | 98.2 11% | 98.9 12% | 93.7 6% | 98.8 12% | 98.2 11% |
| AdobeRGB 1998 Coverage (%) | 81.2 | 67.9 -16% | 71.5 -12% | 64.3 -21% | 70.6 -13% | 71.1 -12% |
| Response Times | -1714% | -1643% | -1422% | -1829% | -1400% | |
| Response Time Grey 50% / Grey 80% * (ms) | 2.8 ? | 62 ? -2114% | 60.8 ? -2071% | 51.6 ? -1743% | 64 ? -2186% | 58 ? -1971% |
| Response Time Black / White * (ms) | 2.8 ? | 39.6 ? -1314% | 36.8 ? -1214% | 33.6 ? -1100% | 44 ? -1471% | 26 ? -829% |
| PWM Frequency (Hz) | 242.7 ? | |||||
| Screen | 14% | -4% | -19% | 39% | -9% | |
| Brightness middle (cd/m²) | 355 | 443.5 25% | 447.4 26% | 408.2 15% | 551.3 55% | 450 27% |
| Brightness (cd/m²) | 368 | 394 7% | 420 14% | 399 8% | 517 40% | 411 12% |
| Brightness Distribution (%) | 93 | 78 -16% | 85 -9% | 89 -4% | 91 -2% | 83 -11% |
| Black Level * (cd/m²) | 0.17 | 0.31 | 0.39 | 0.37 | 0.22 | |
| Colorchecker dE 2000 * | 5.74 | 2.7 53% | 4.23 26% | 4.6 20% | 1.45 75% | 4.15 28% |
| Colorchecker dE 2000 max. * | 9.52 | 4.36 54% | 9.34 2% | 11.84 -24% | 2.86 70% | 11.49 -21% |
| Colorchecker dE 2000 calibrated * | 6.69 | 2.61 61% | 1.32 80% | 2.03 70% | 1.7 75% | 1.09 84% |
| Greyscale dE 2000 * | 2.2 | 3.4 -55% | 6.1 -177% | 7.5 -241% | 1.3 41% | 6.66 -203% |
| Gamma | 2.03 108% | 2.09 105% | 2.11 104% | 2.12 104% | 2.14 103% | 2.42 91% |
| CCT | 6505 100% | 6144 106% | 6136 106% | 7966 82% | 6580 99% | 6043 108% |
| Color Space (Percent of AdobeRGB 1998) (%) | 73.6 | 62.1 -16% | 64.8 -12% | 59.5 -19% | 65 -12% | 65 -12% |
| Color Space (Percent of sRGB) (%) | 88.6 | 98.5 11% | 98.9 12% | 93.5 6% | 99 12% | 98 11% |
| Contrast (:1) | 2609 | 1443 | 1047 | 1490 | 2045 | |
| Total Average (Program / Settings) | -568% /
-237% | -549% /
-237% | -483% /
-217% | -597% /
-236% | -470% /
-206% |
* ... smaller is better
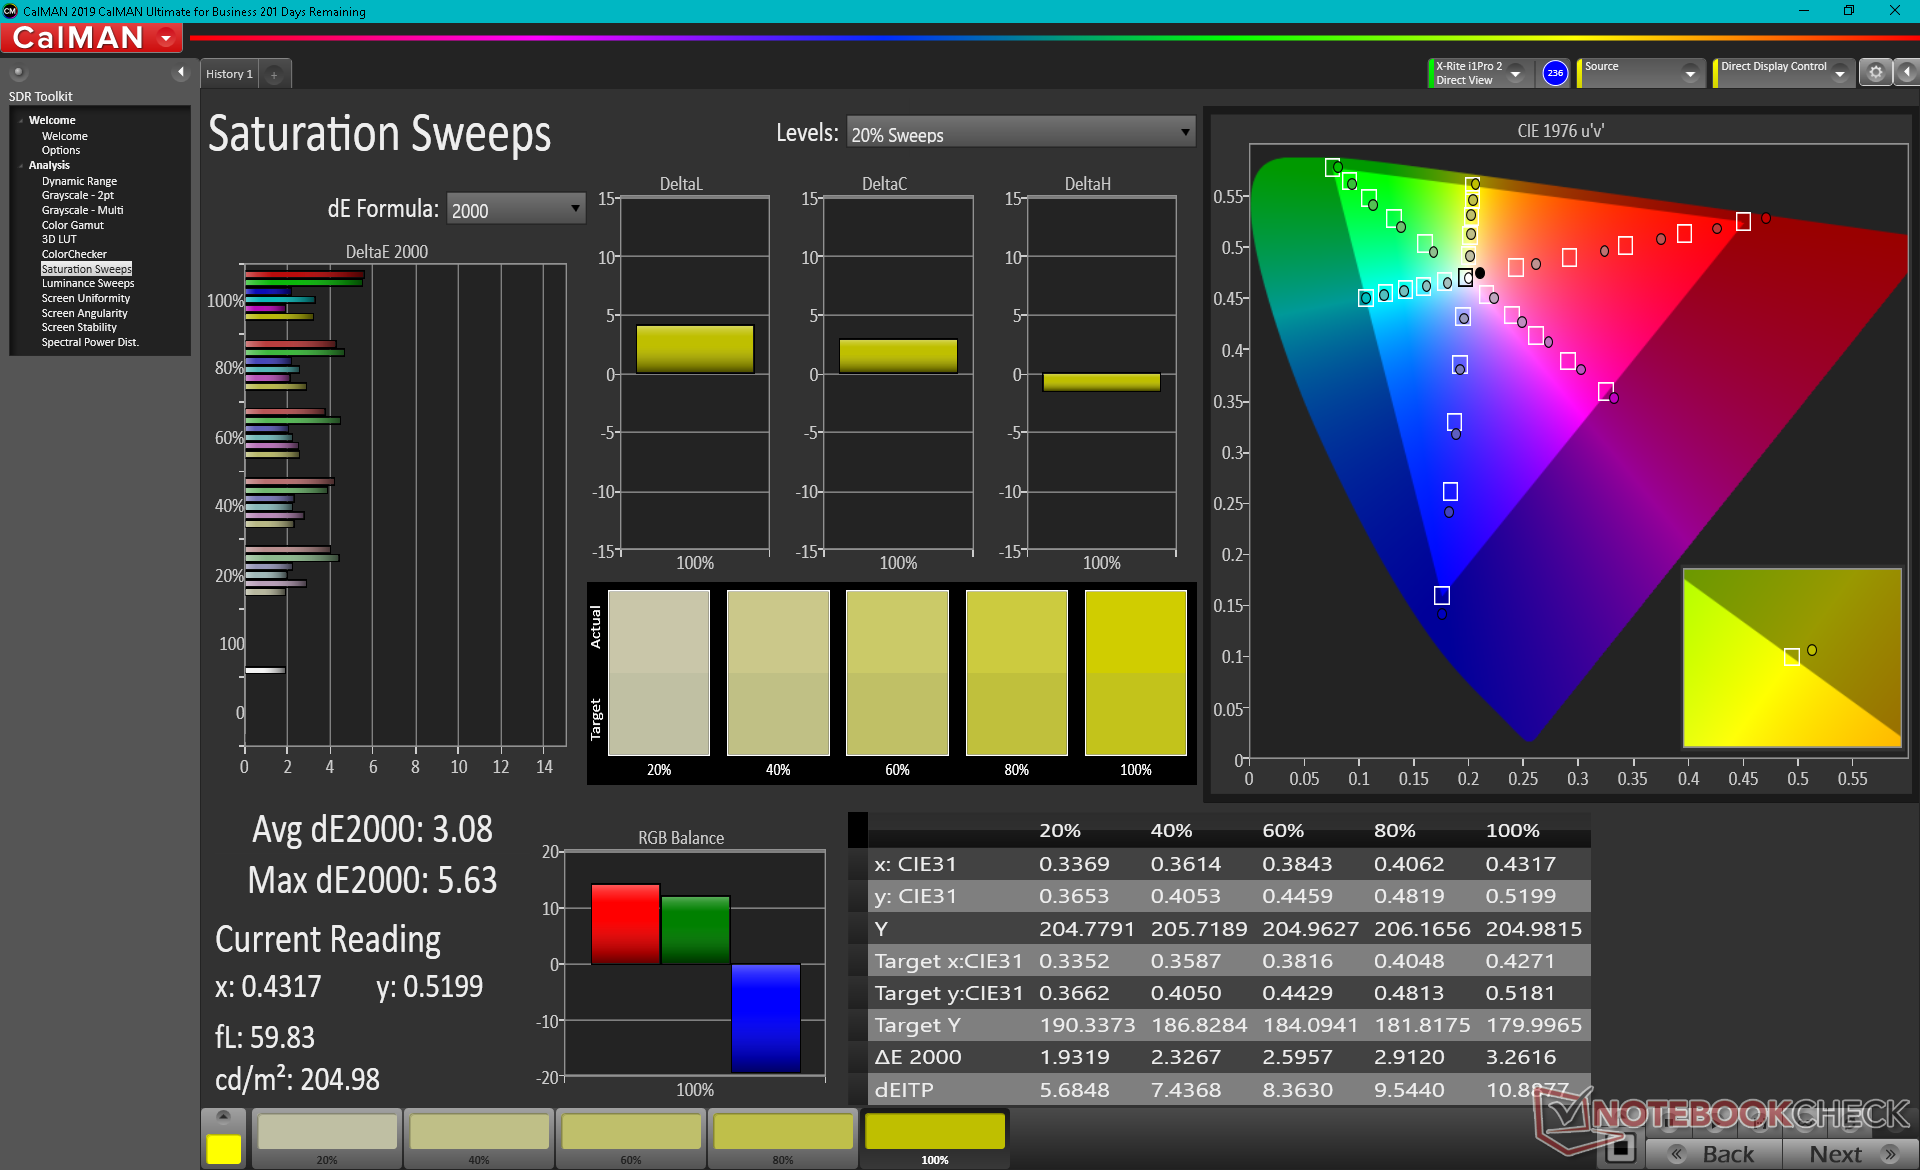
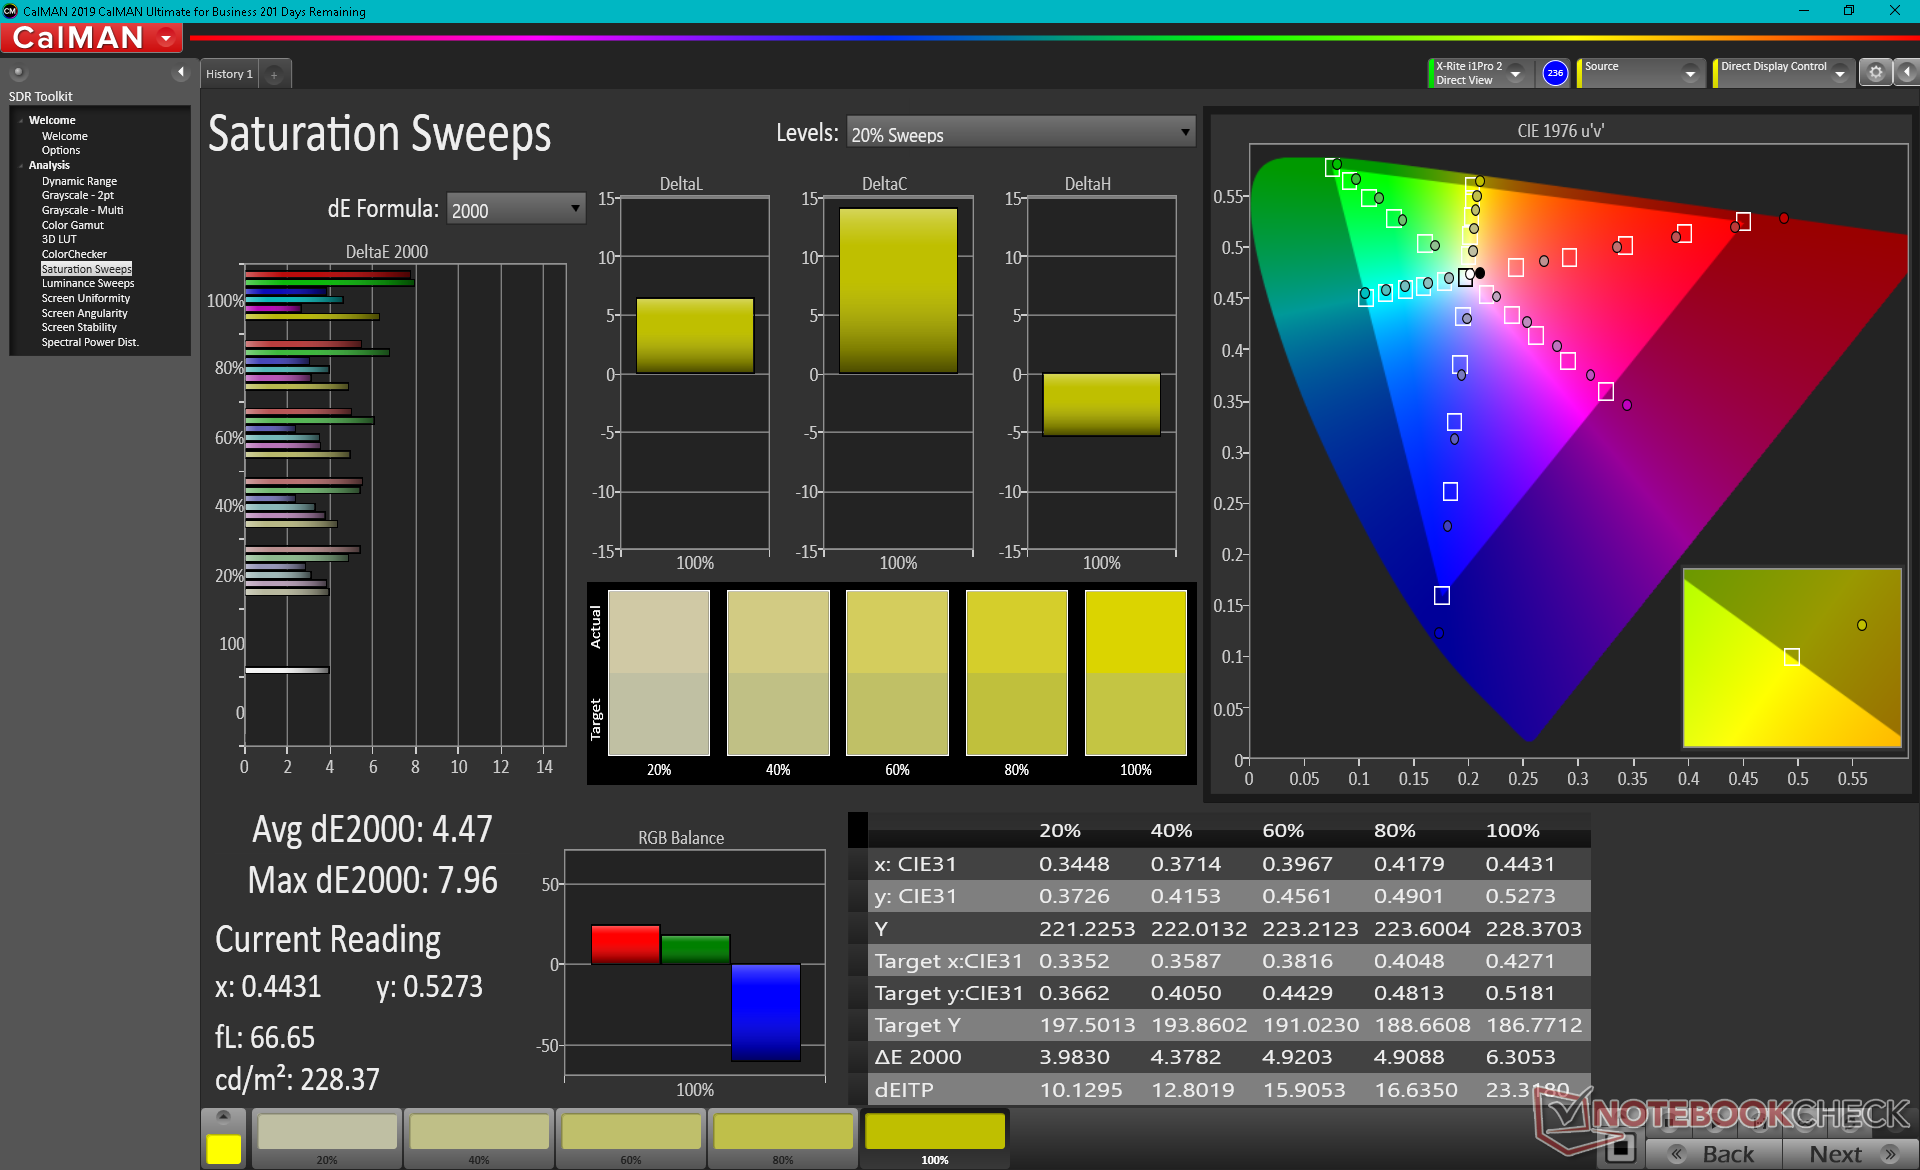
HP advertises full DCI-P3 coverage while our own independent measurements show 74 percent AdobeRGB coverage when set to the AdobeRGB color profile. Users can quickly switch between sRGB, AdobeRGB, DCI-P3, and Native color profiles with a simple right click on desktop.
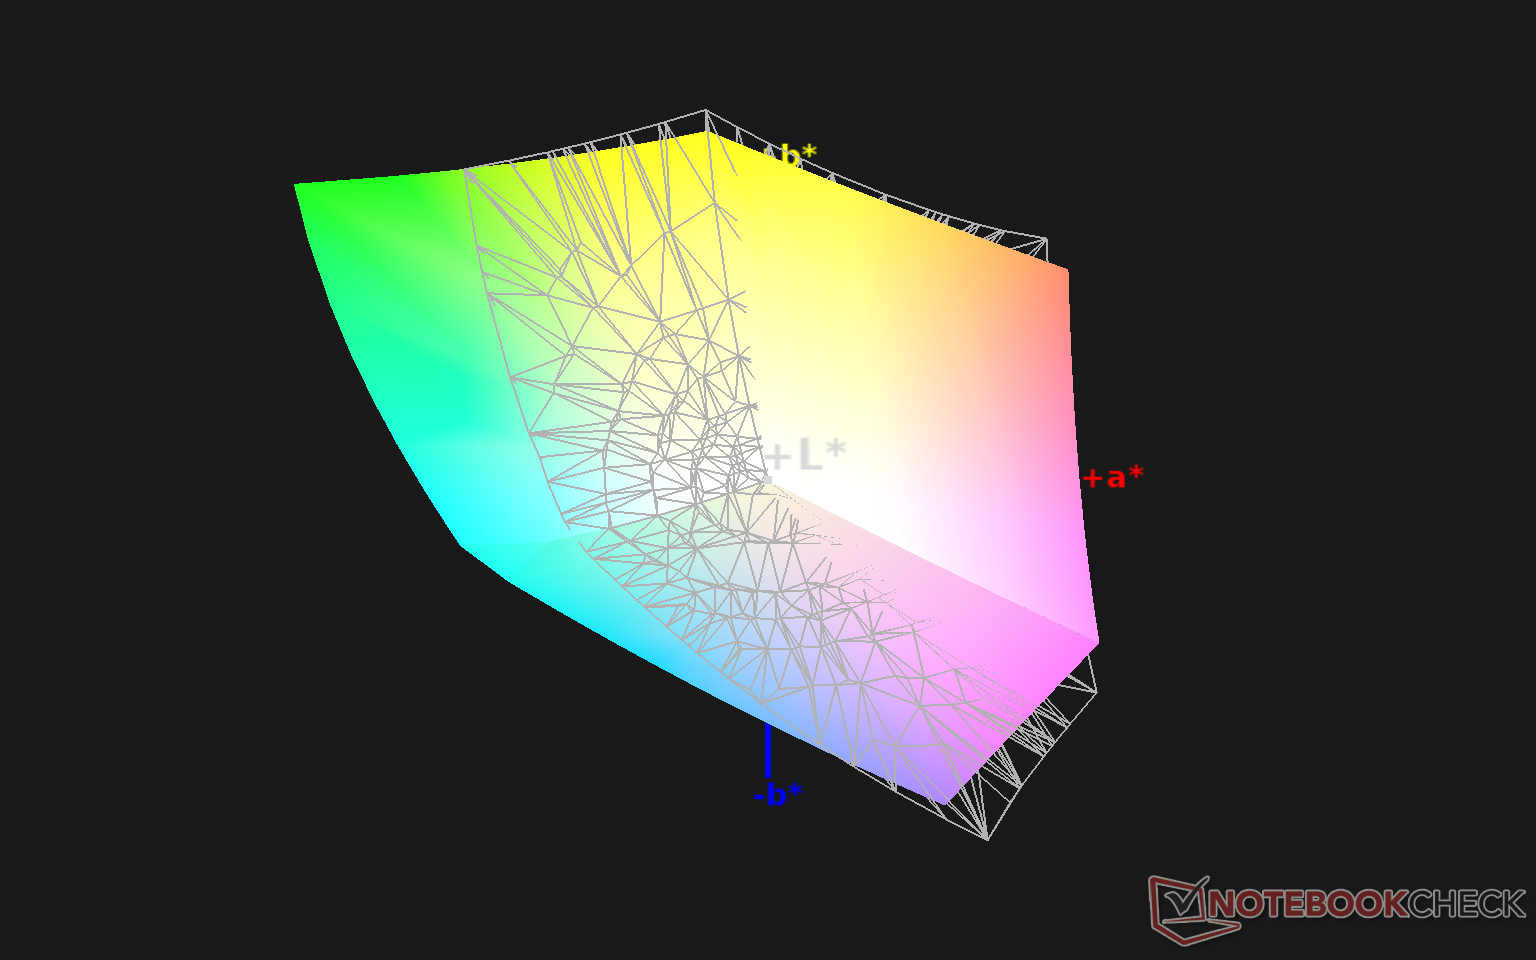
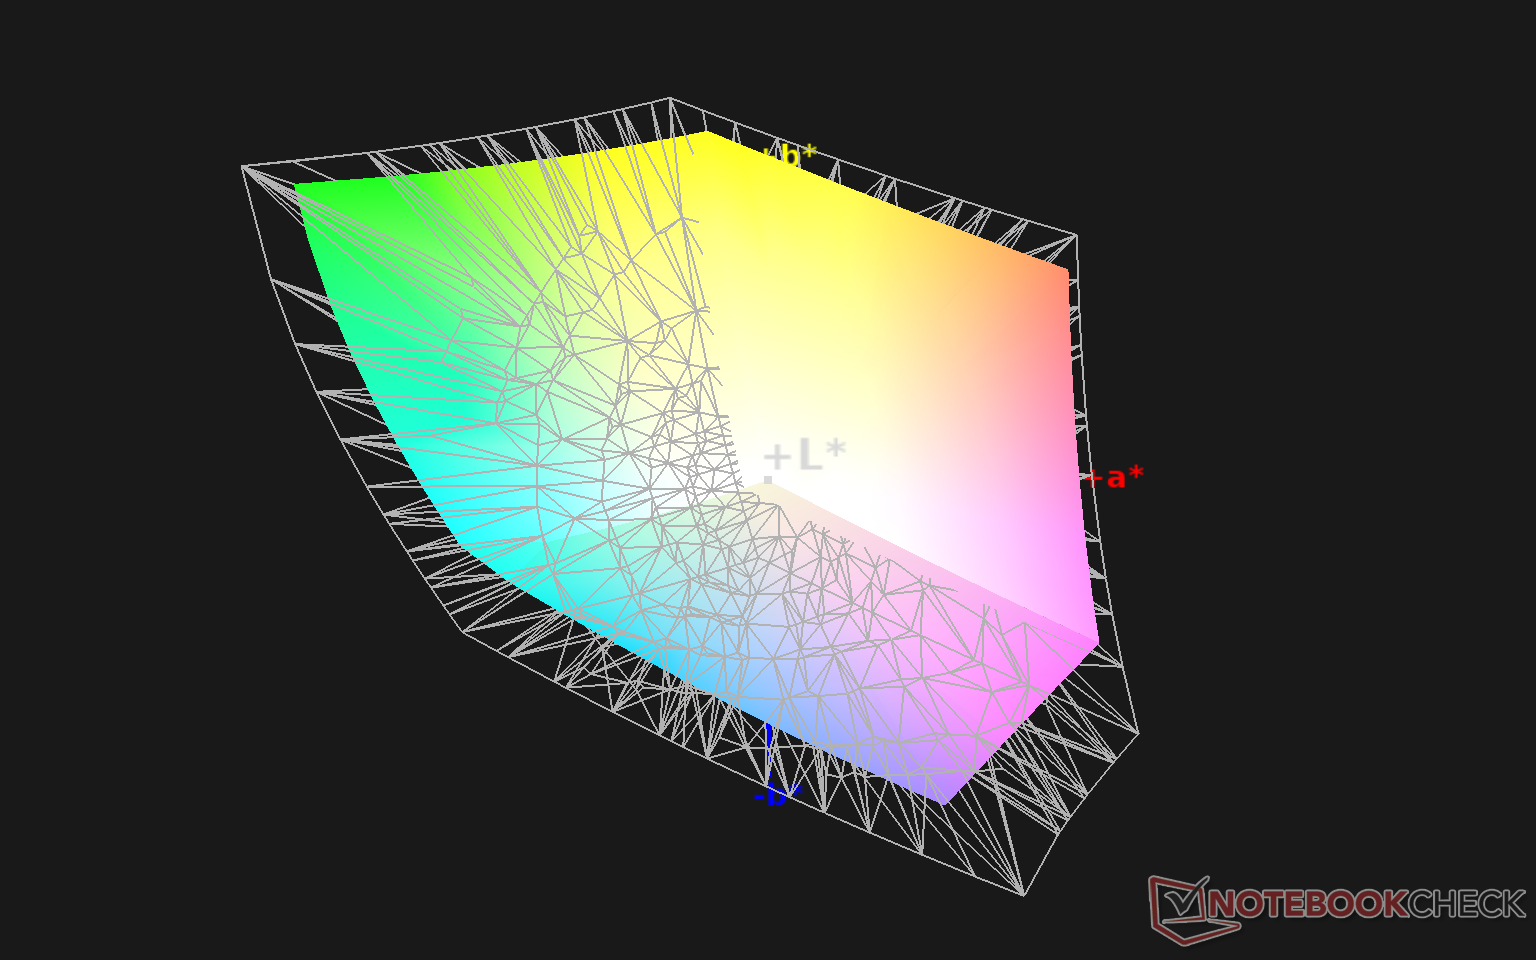
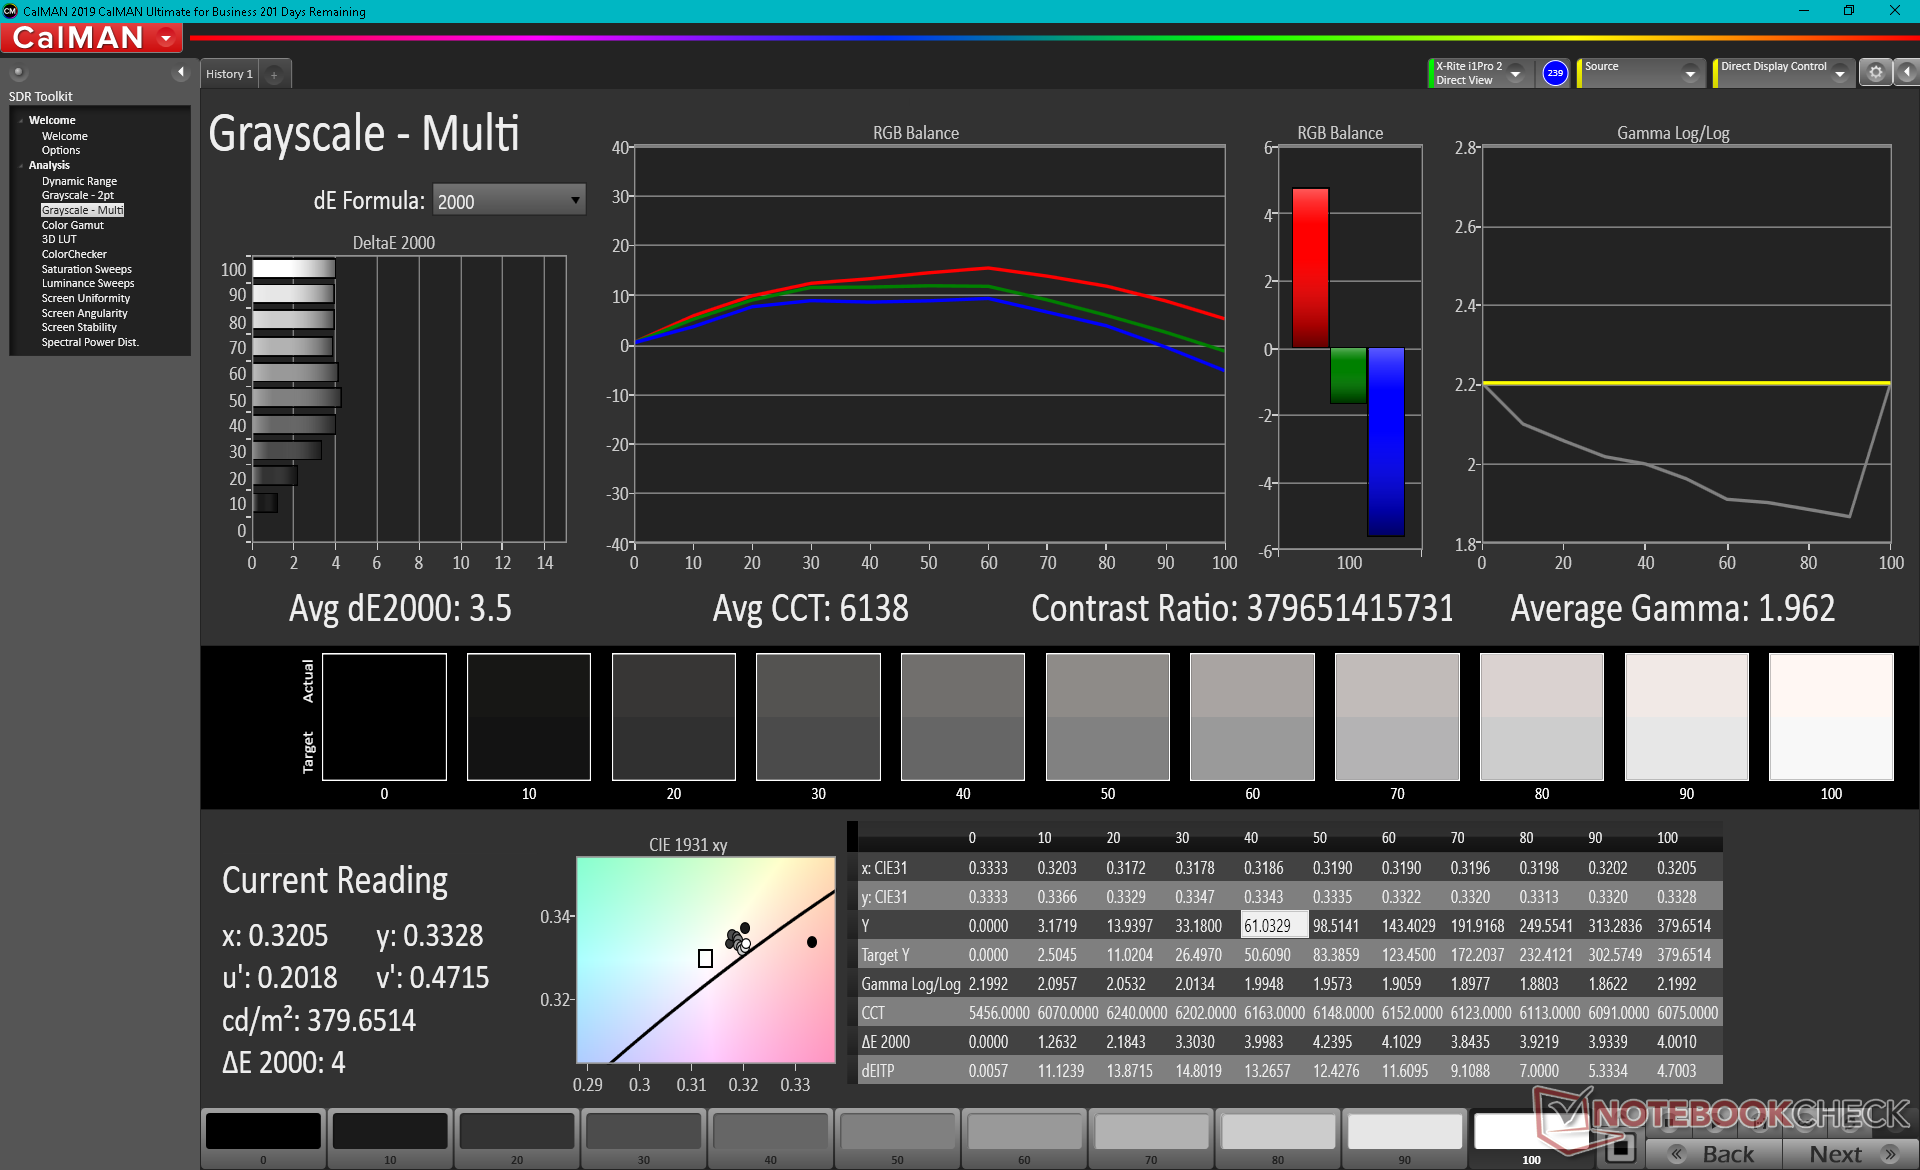
X-Rite colorimeter measurements on AdobeRGB mode show an excellent average grayscale DeltaE of just 2.2, but colors are not as accurate as they could have been. Colors would become more inaccurate after trying to calibrate the OLED display ourselves meaning any end-user attempts may be a bit tricky.

Display Response Times
| ↔ Response Time Black to White | ||
|---|---|---|
| 2.8 ms ... rise ↗ and fall ↘ combined | ↗ 1.3 ms rise | 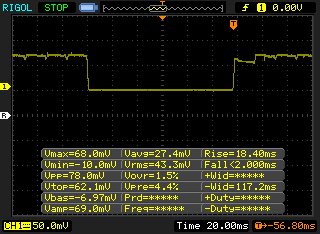 |
| ↘ 1.5 ms fall | ||
| The screen shows very fast response rates in our tests and should be very well suited for fast-paced gaming. In comparison, all tested devices range from 0.1 (minimum) to 240 (maximum) ms. » 13 % of all devices are better. This means that the measured response time is better than the average of all tested devices (20.1 ms). | ||
| ↔ Response Time 50% Grey to 80% Grey | ||
| 2.8 ms ... rise ↗ and fall ↘ combined | ↗ 1.4 ms rise | 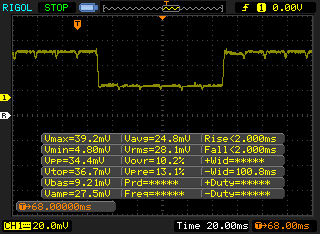 |
| ↘ 1.4 ms fall | ||
| The screen shows very fast response rates in our tests and should be very well suited for fast-paced gaming. In comparison, all tested devices range from 0.165 (minimum) to 636 (maximum) ms. » 11 % of all devices are better. This means that the measured response time is better than the average of all tested devices (31.5 ms). | ||
Screen Flickering / PWM (Pulse-Width Modulation)
| Screen flickering / PWM detected | 242.7 Hz | ≤ 40 % brightness setting | 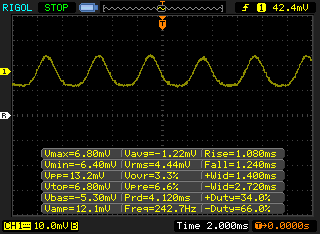 |
The display backlight flickers at 242.7 Hz (worst case, e.g., utilizing PWM) Flickering detected at a brightness setting of 40 % and below. There should be no flickering or PWM above this brightness setting. The frequency of 242.7 Hz is relatively low, so sensitive users will likely notice flickering and experience eyestrain at the stated brightness setting and below. In comparison: 53 % of all tested devices do not use PWM to dim the display. If PWM was detected, an average of 8036 (minimum: 5 - maximum: 343500) Hz was measured. | |||
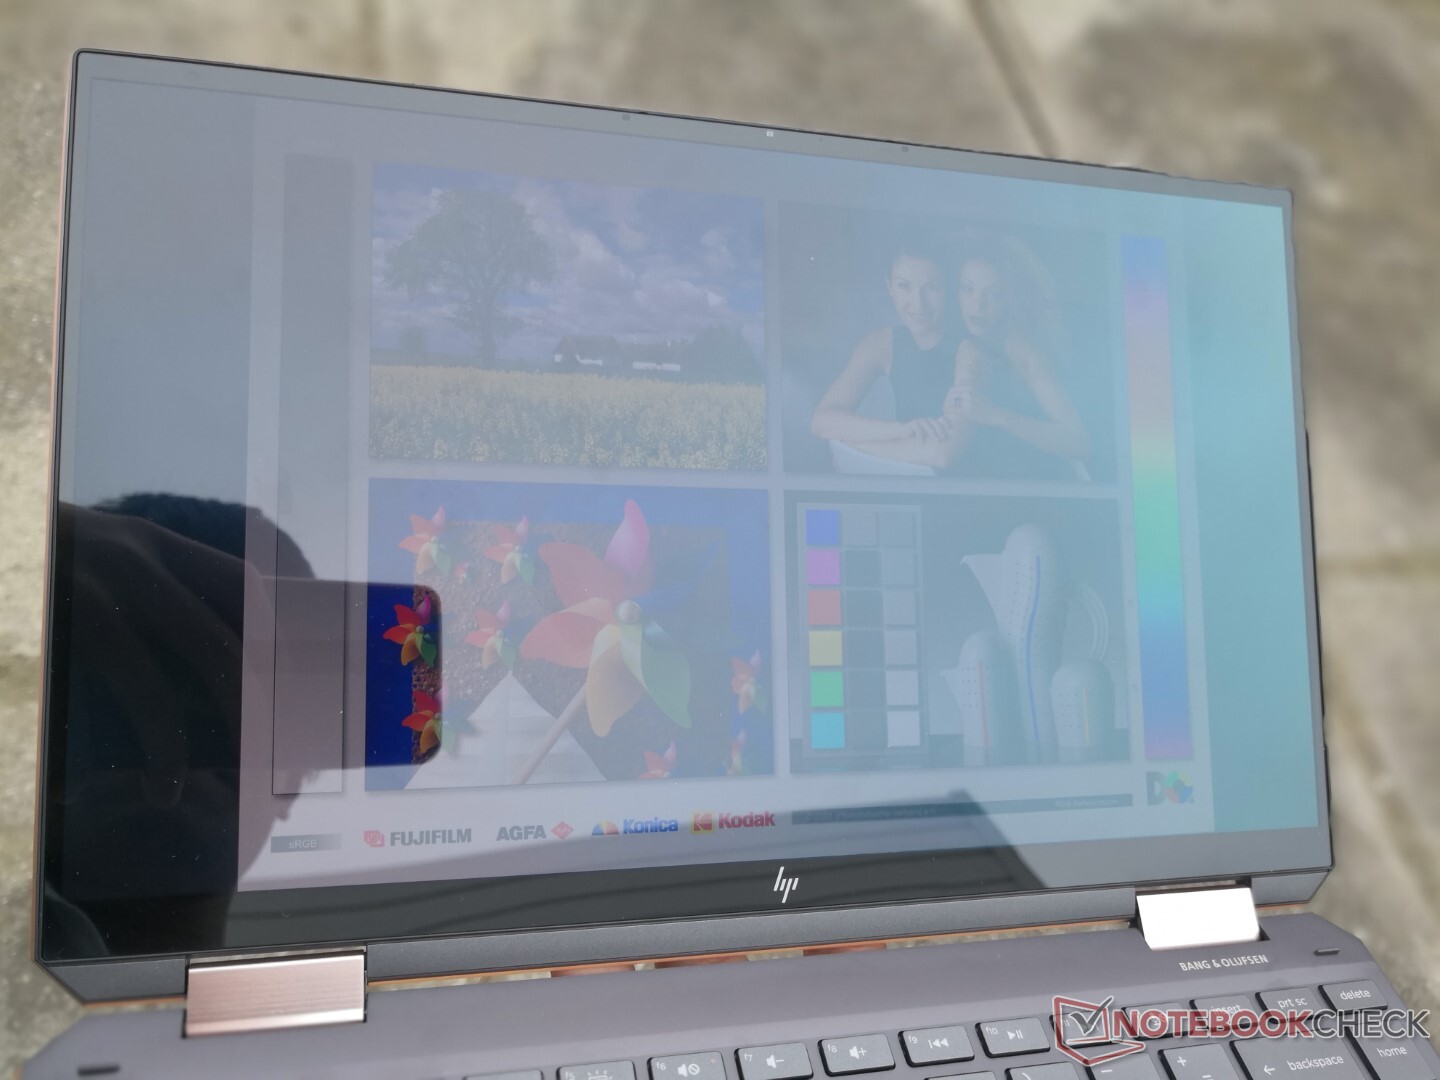
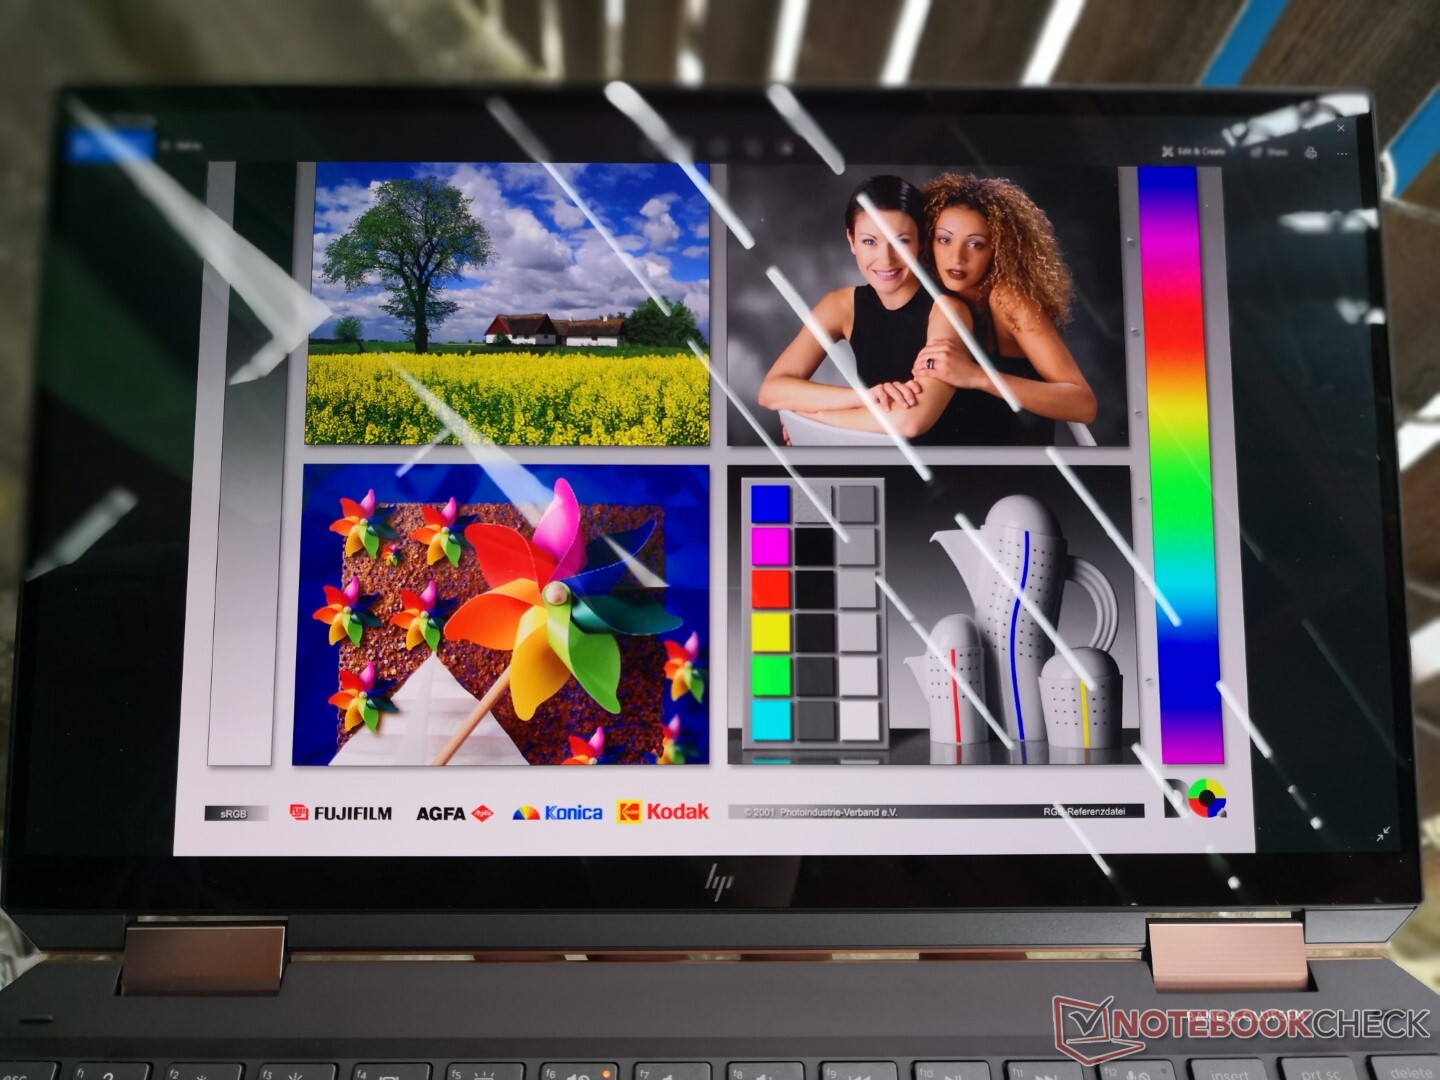
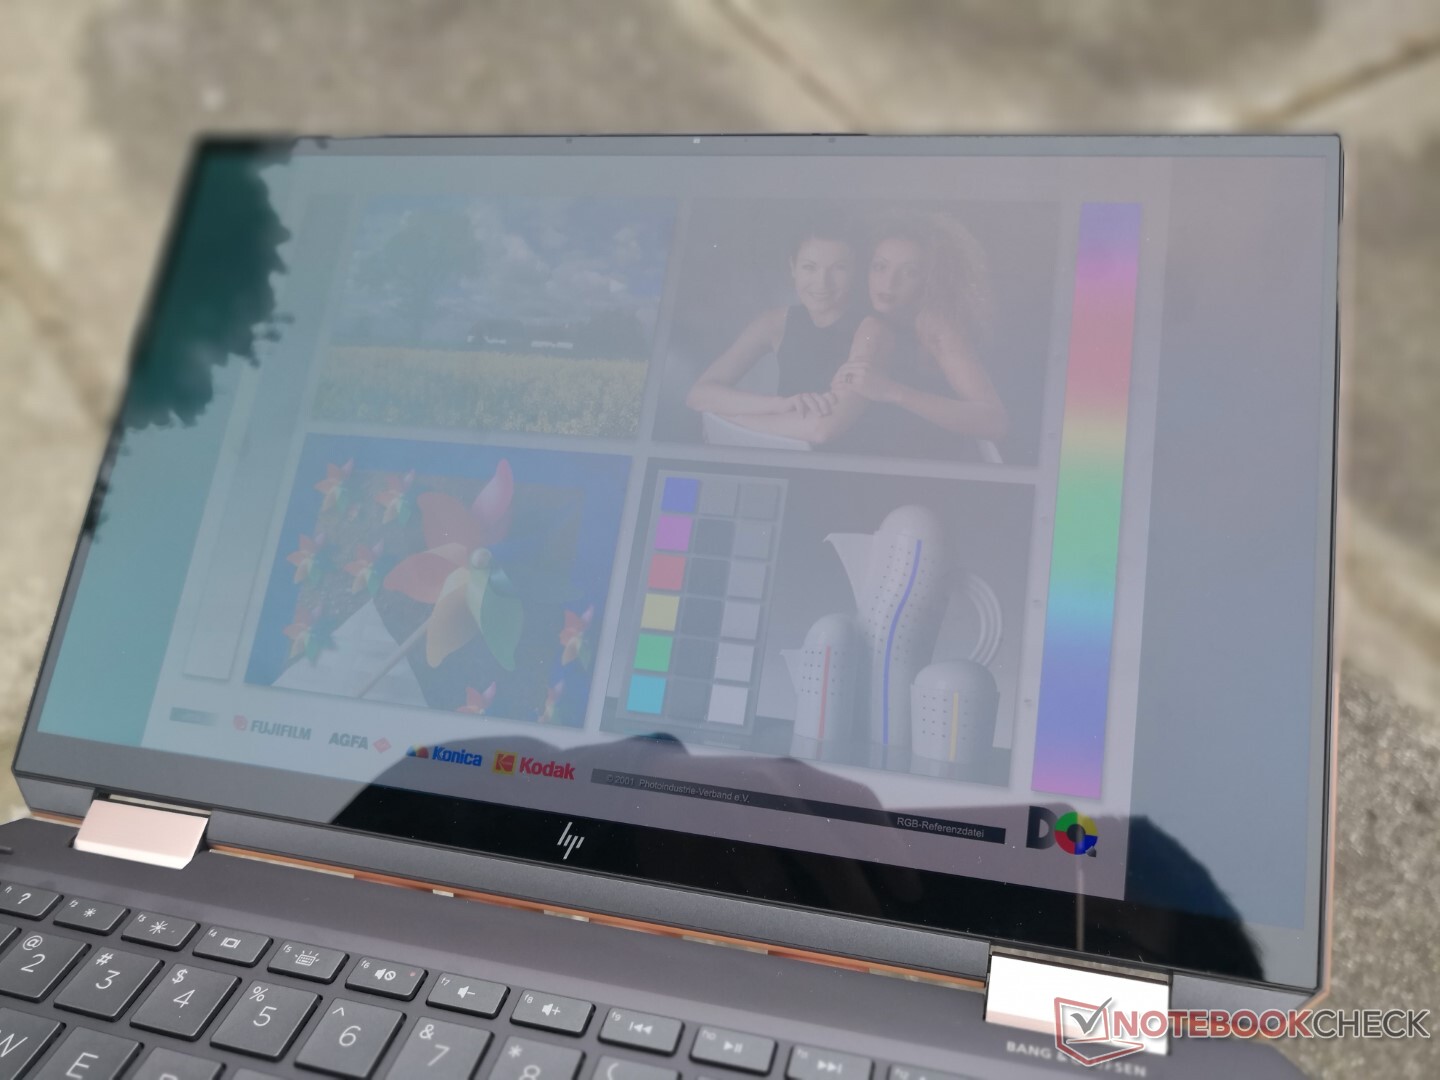
Outdoor visibility is excellent when under shade due in part to the pitch perfect black level of OLED. Onscreen colors don't wash out or become gray as easily as on most IPS displays. Nonetheless, glare is ever present and even a bit worse than on the IPS Spectre x360 13 SKU since maximum brightness is a bit lower on OLED.

Performance
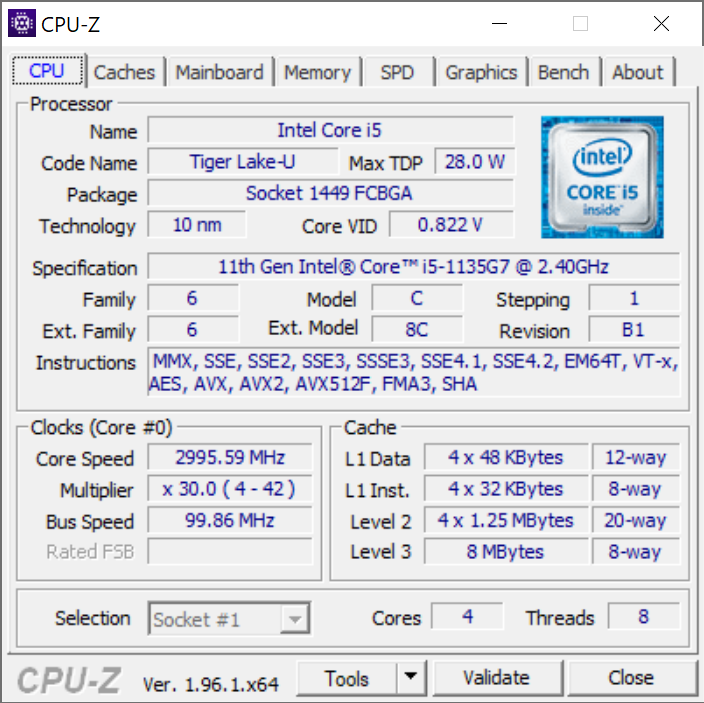
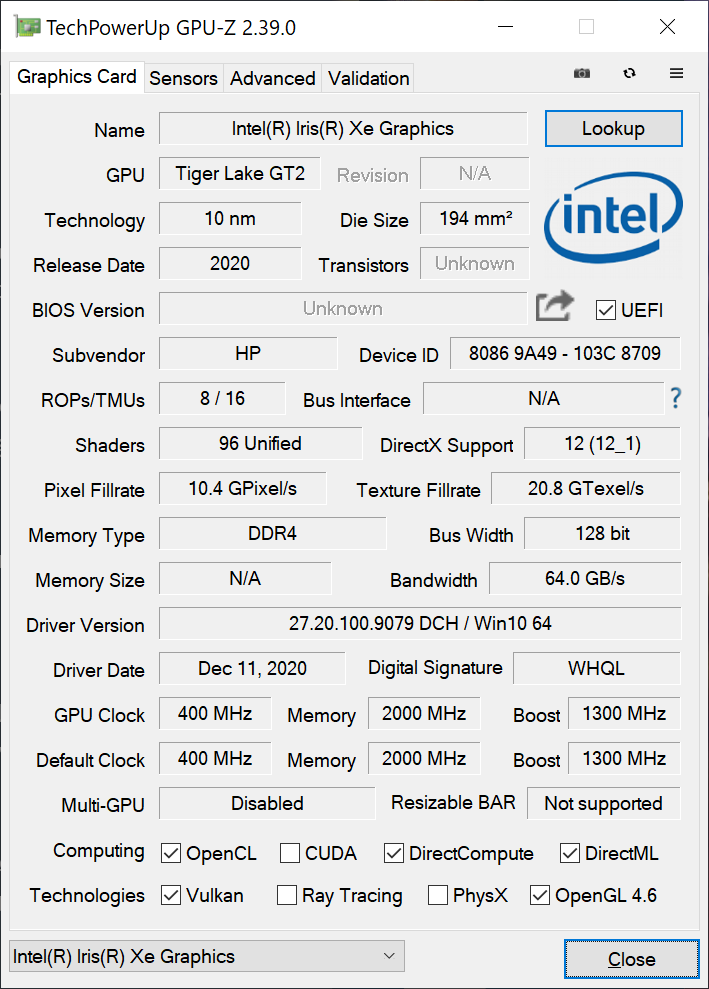
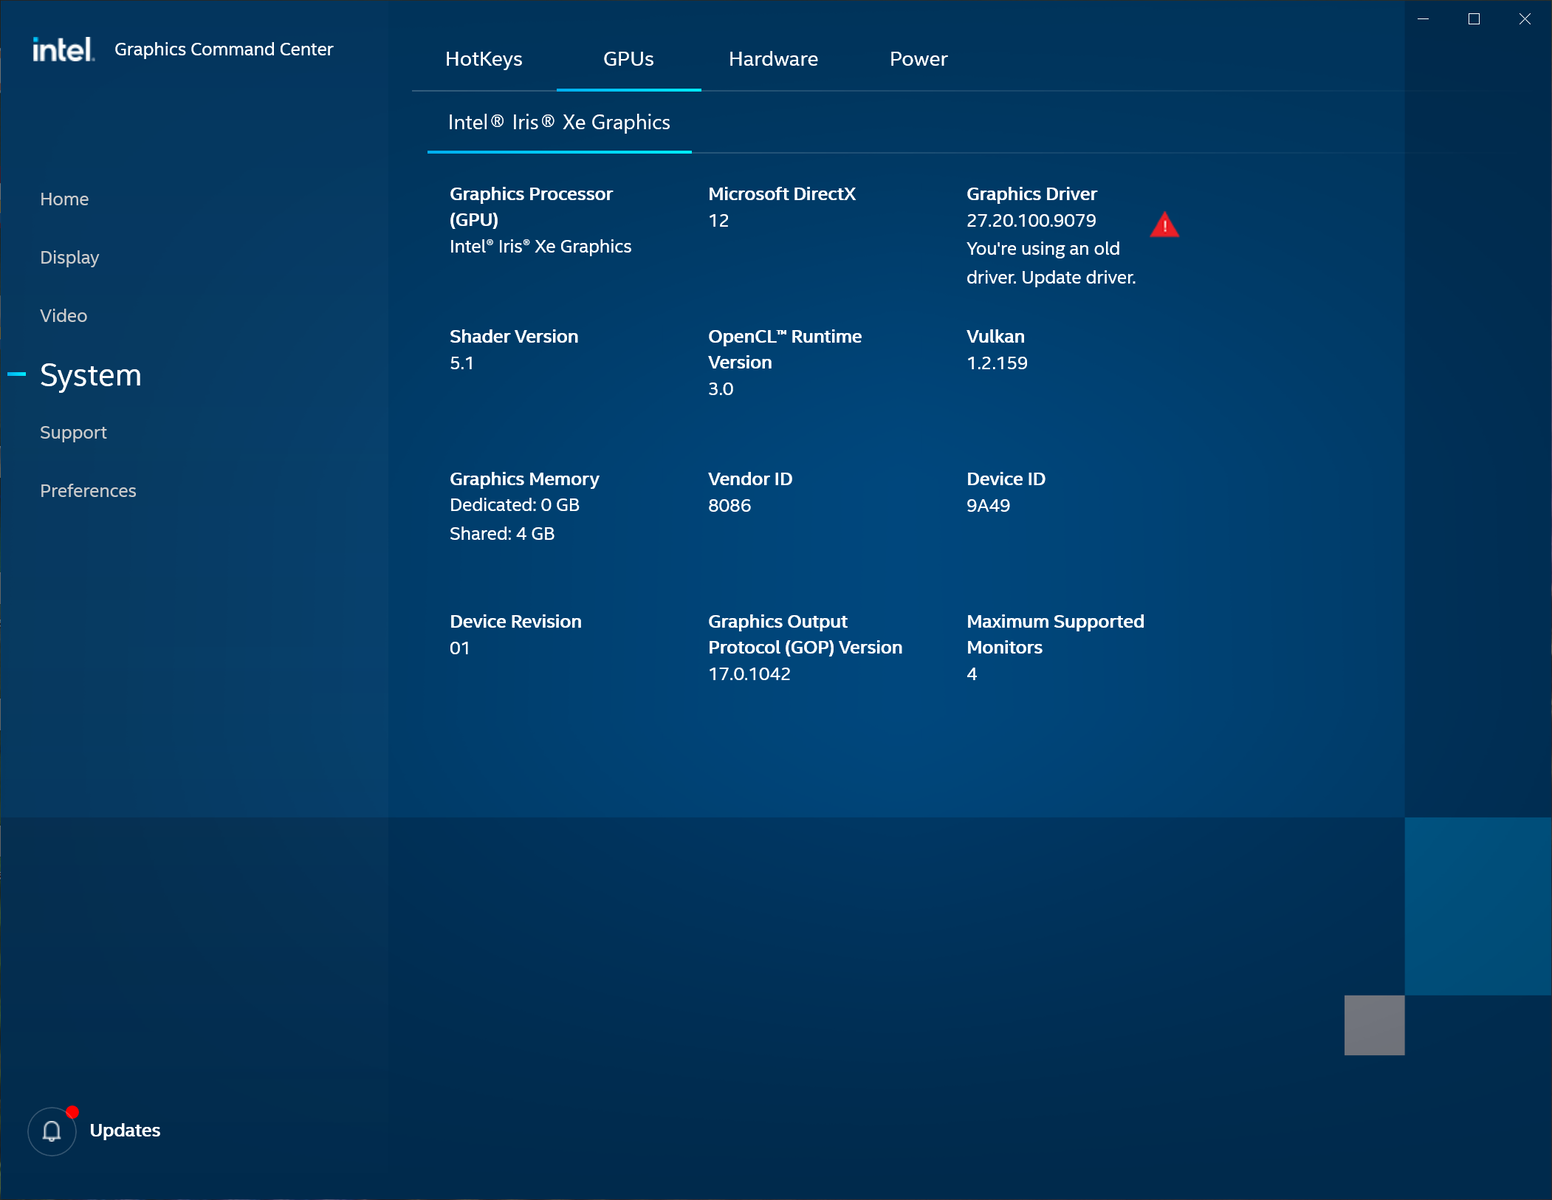
Unlike the larger and more powerful Spectre x360 15 series, the Spectre x360 13 has always focused only on ULV U-class CPUs with no dedicated graphics options. In this case, users can select between the 10th gen Tiger Lake Core i5-1135G7 or Core i7-1165G7 with integrated Iris Xe graphics to replace last year's 10th gen Ice Lake and Iris Plus options.
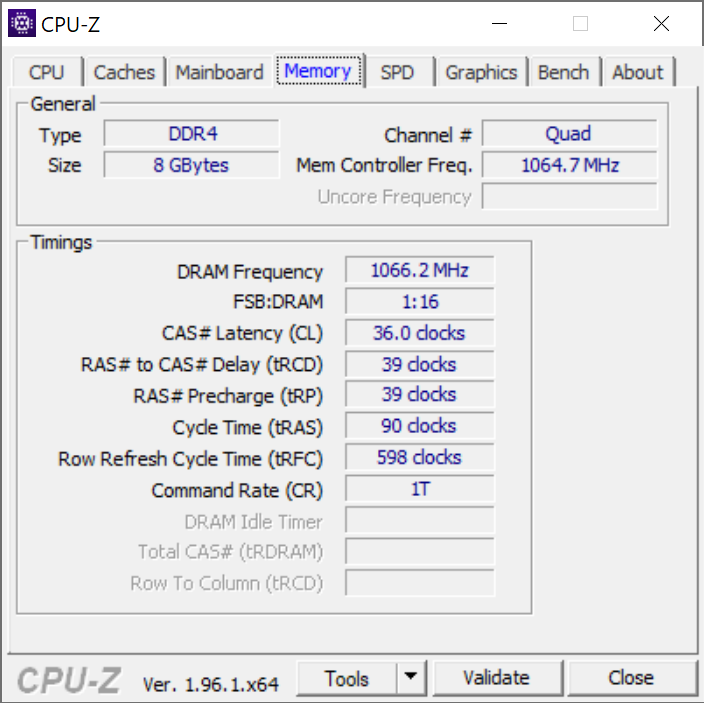
Users should select RAM carefully since the modules are soldered. However, we do appreciate the fact that the low-end 8 GB option is dual-channel and not single-channel to aid in integrated graphics performance.
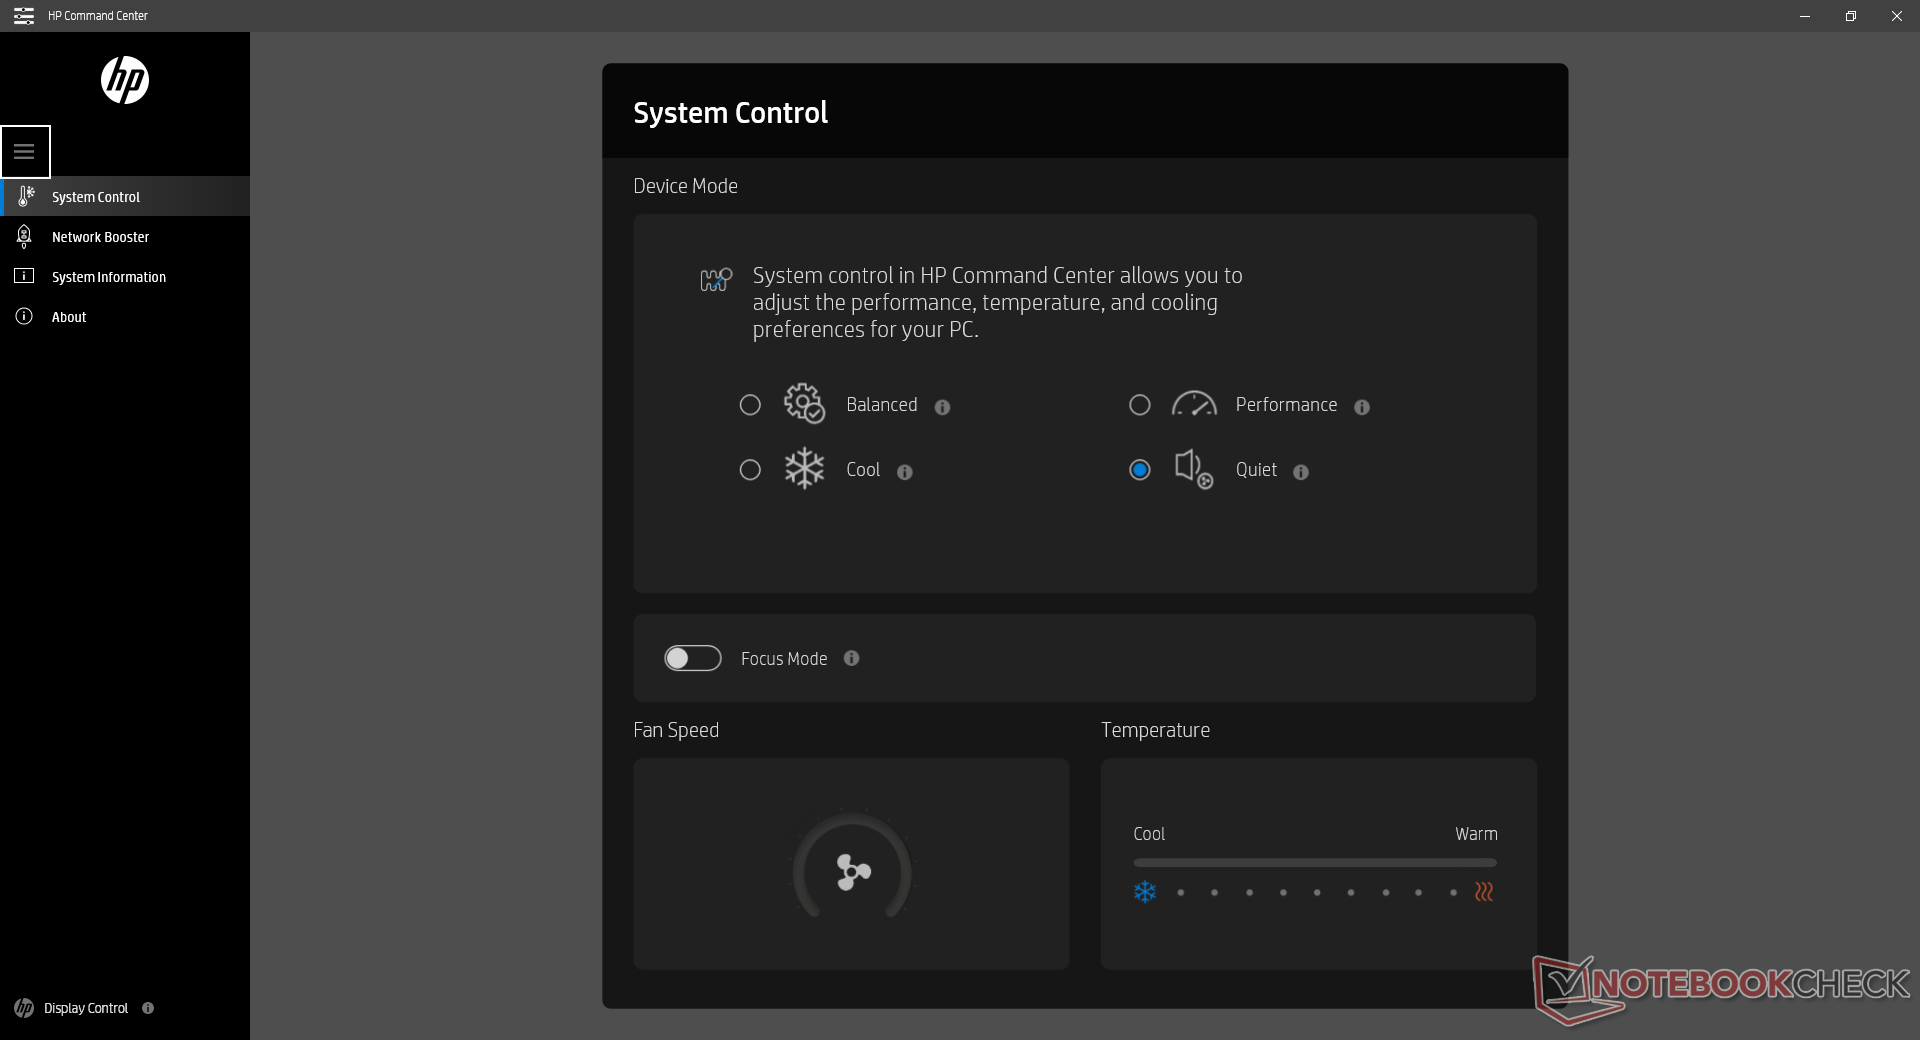
Our unit was set to Performance mode via HP Command Center to get the highest scores possible. We recommend owners become familiar with Command Center as system performance is tied closely to the application.
Processor
Raw multi-thread performance is within single-digit percentages of the average Core i5-1135G7 in our database. Opting for the higher-end Core i7-1165G7 SKU should offer up to 30 percent faster CPU performance assuming the cooling solution can keep up. Users upgrading from an older Core i5-1035G4 or Core i5-8265U will see roughly 50 to 60 percent faster multi-thread performance each.
CPU clock rates are not steady, however, as exemplified by our CineBench R15 xT loop results below. Scores would fluctuate between 680 and 800 points whereas the exact same CPU in the Intel NUC11 mini PC would return more stable scores throughout the same loop test. Our Stress Test section below explores the cycling clock rates of the Spectre even further.
Cinebench R23: Multi Core | Single Core
Cinebench R15: CPU Multi 64Bit | CPU Single 64Bit
Blender: v2.79 BMW27 CPU
7-Zip 18.03: 7z b 4 -mmt1 | 7z b 4
Geekbench 5.5: Single-Core | Multi-Core
HWBOT x265 Benchmark v2.2: 4k Preset
LibreOffice : 20 Documents To PDF
R Benchmark 2.5: Overall mean
| Cinebench R23 / Multi Core | |
| Lenovo IdeaPad Flex 5 14ALC05 82HU002YUS | |
| Lenovo Yoga Slim 7-14ARE | |
| Lenovo Yoga Slim 7 14ARE05 82A20008GE | |
| Razer Book 13 FHD | |
| MSI Summit E13 Flip Evo A11MT | |
| HP Spectre x360 13-aw2003dx | |
| Average Intel Core i5-1135G7 (2786 - 6136, n=55) | |
| Cinebench R23 / Single Core | |
| MSI Summit E13 Flip Evo A11MT | |
| HP Spectre x360 13-aw2003dx | |
| Average Intel Core i5-1135G7 (1062 - 1373, n=53) | |
| Lenovo IdeaPad Flex 5 14ALC05 82HU002YUS | |
| Lenovo Yoga Slim 7-14ARE | |
| Lenovo Yoga Slim 7 14ARE05 82A20008GE | |
Cinebench R23: Multi Core | Single Core
Cinebench R15: CPU Multi 64Bit | CPU Single 64Bit
Blender: v2.79 BMW27 CPU
7-Zip 18.03: 7z b 4 -mmt1 | 7z b 4
Geekbench 5.5: Single-Core | Multi-Core
HWBOT x265 Benchmark v2.2: 4k Preset
LibreOffice : 20 Documents To PDF
R Benchmark 2.5: Overall mean
* ... smaller is better
System Performance
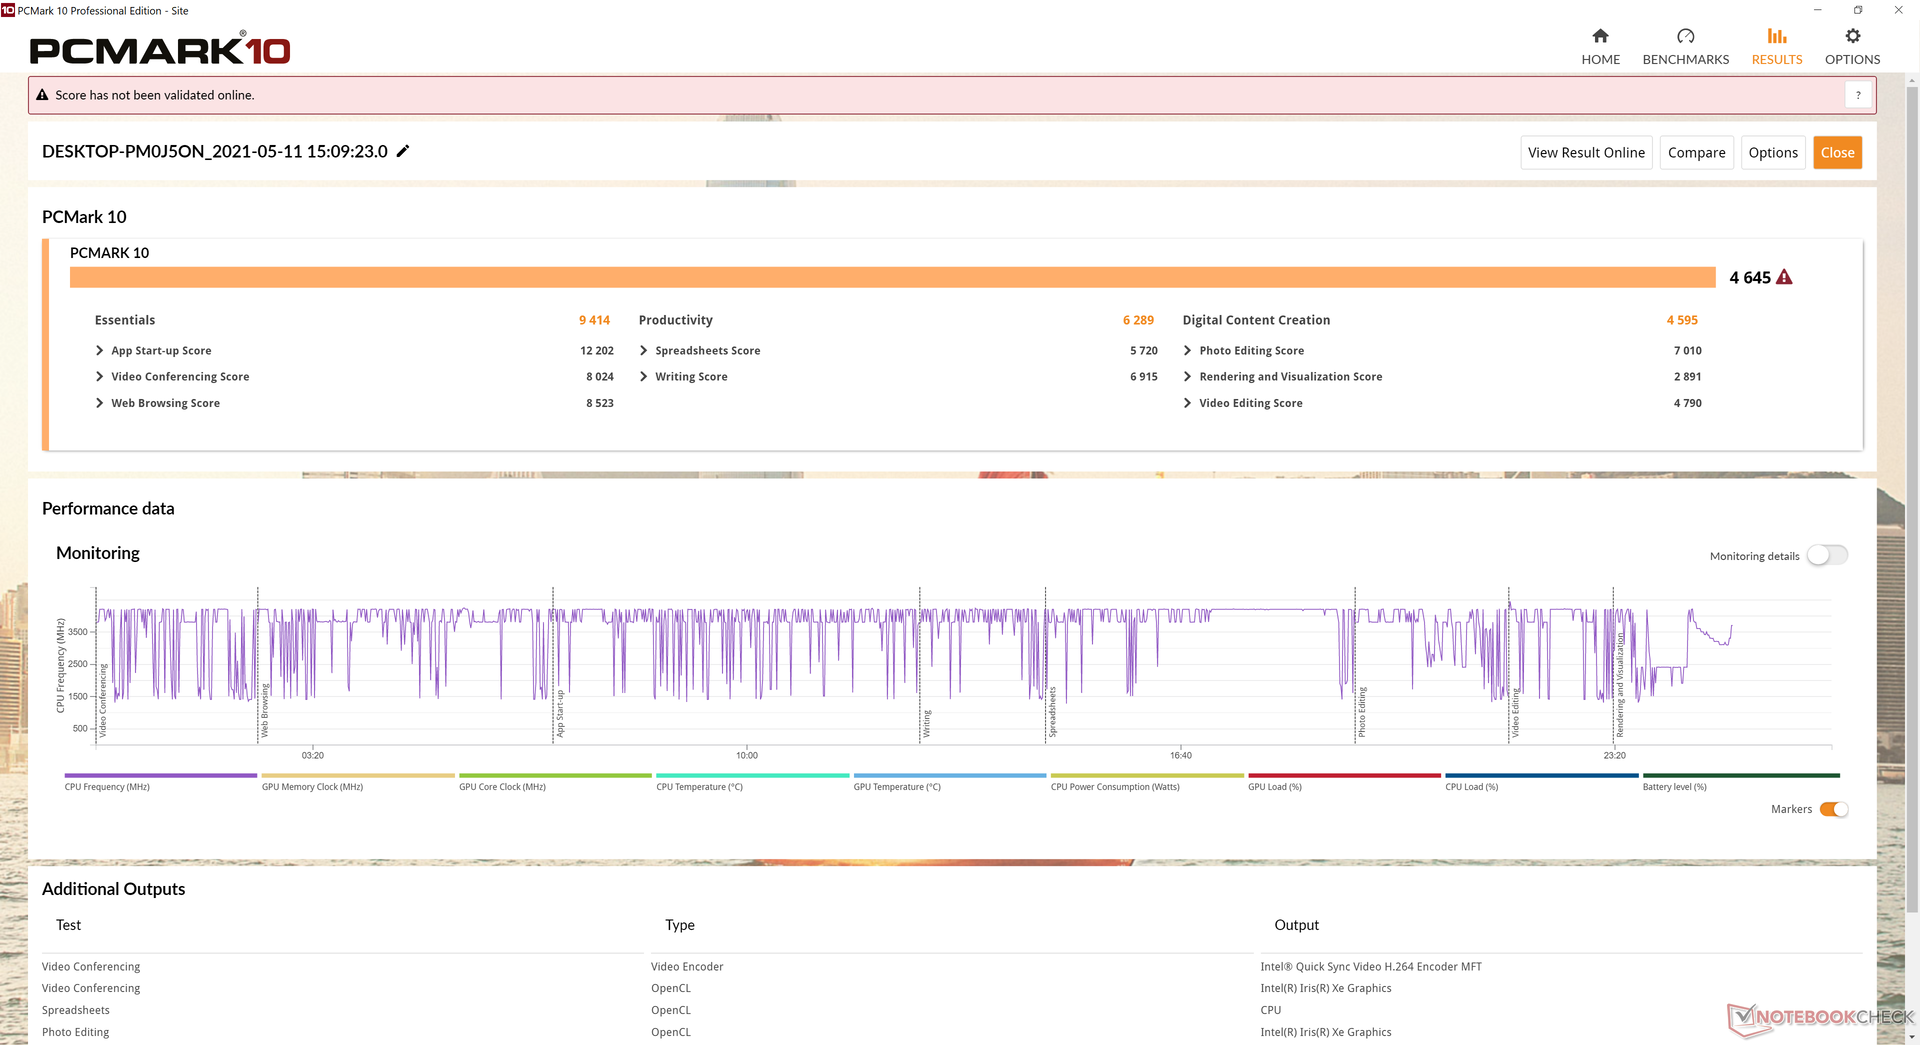
| PCMark 10 Score | 4645 points | |
Help | ||
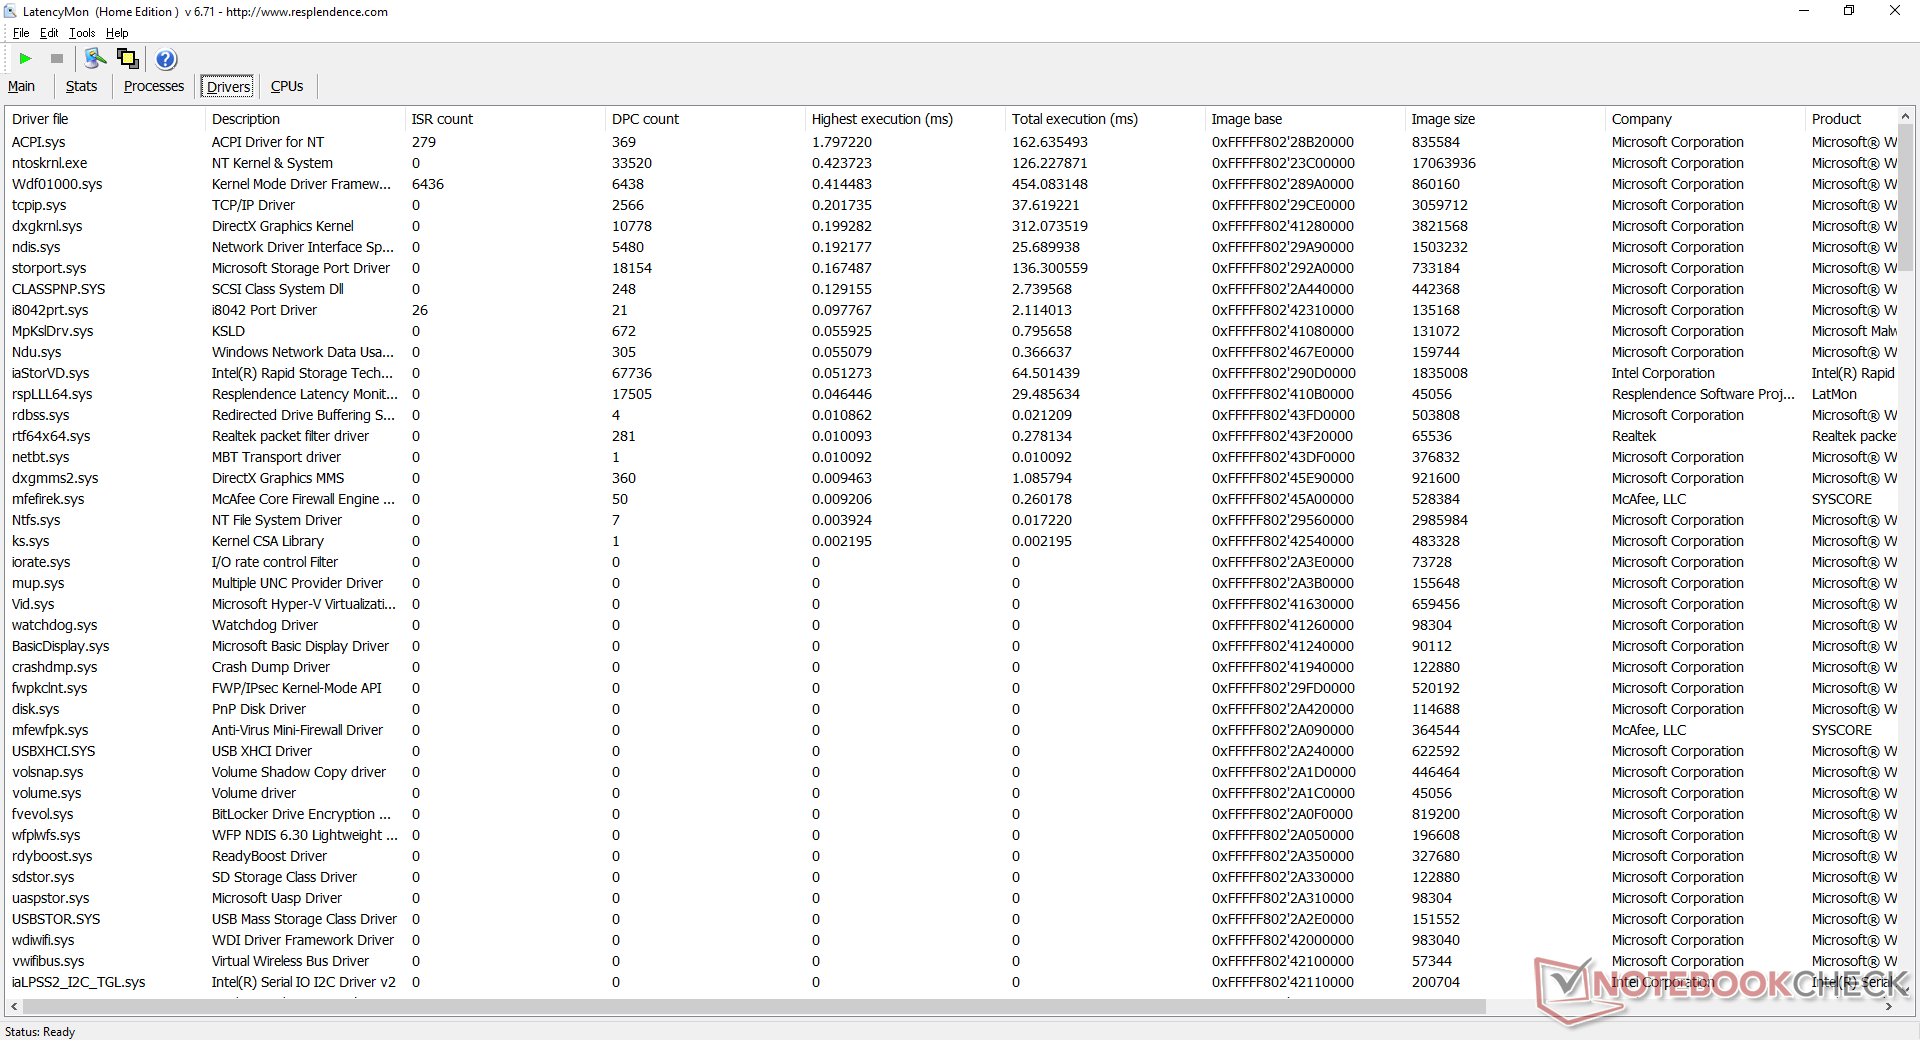
DPC Latency
LatencyMon reveals DPC latency issues when opening multiple browser tabs on our homepage. Thankfully, 4K video playback at 60 FPS remains smooth with no dropped frames.
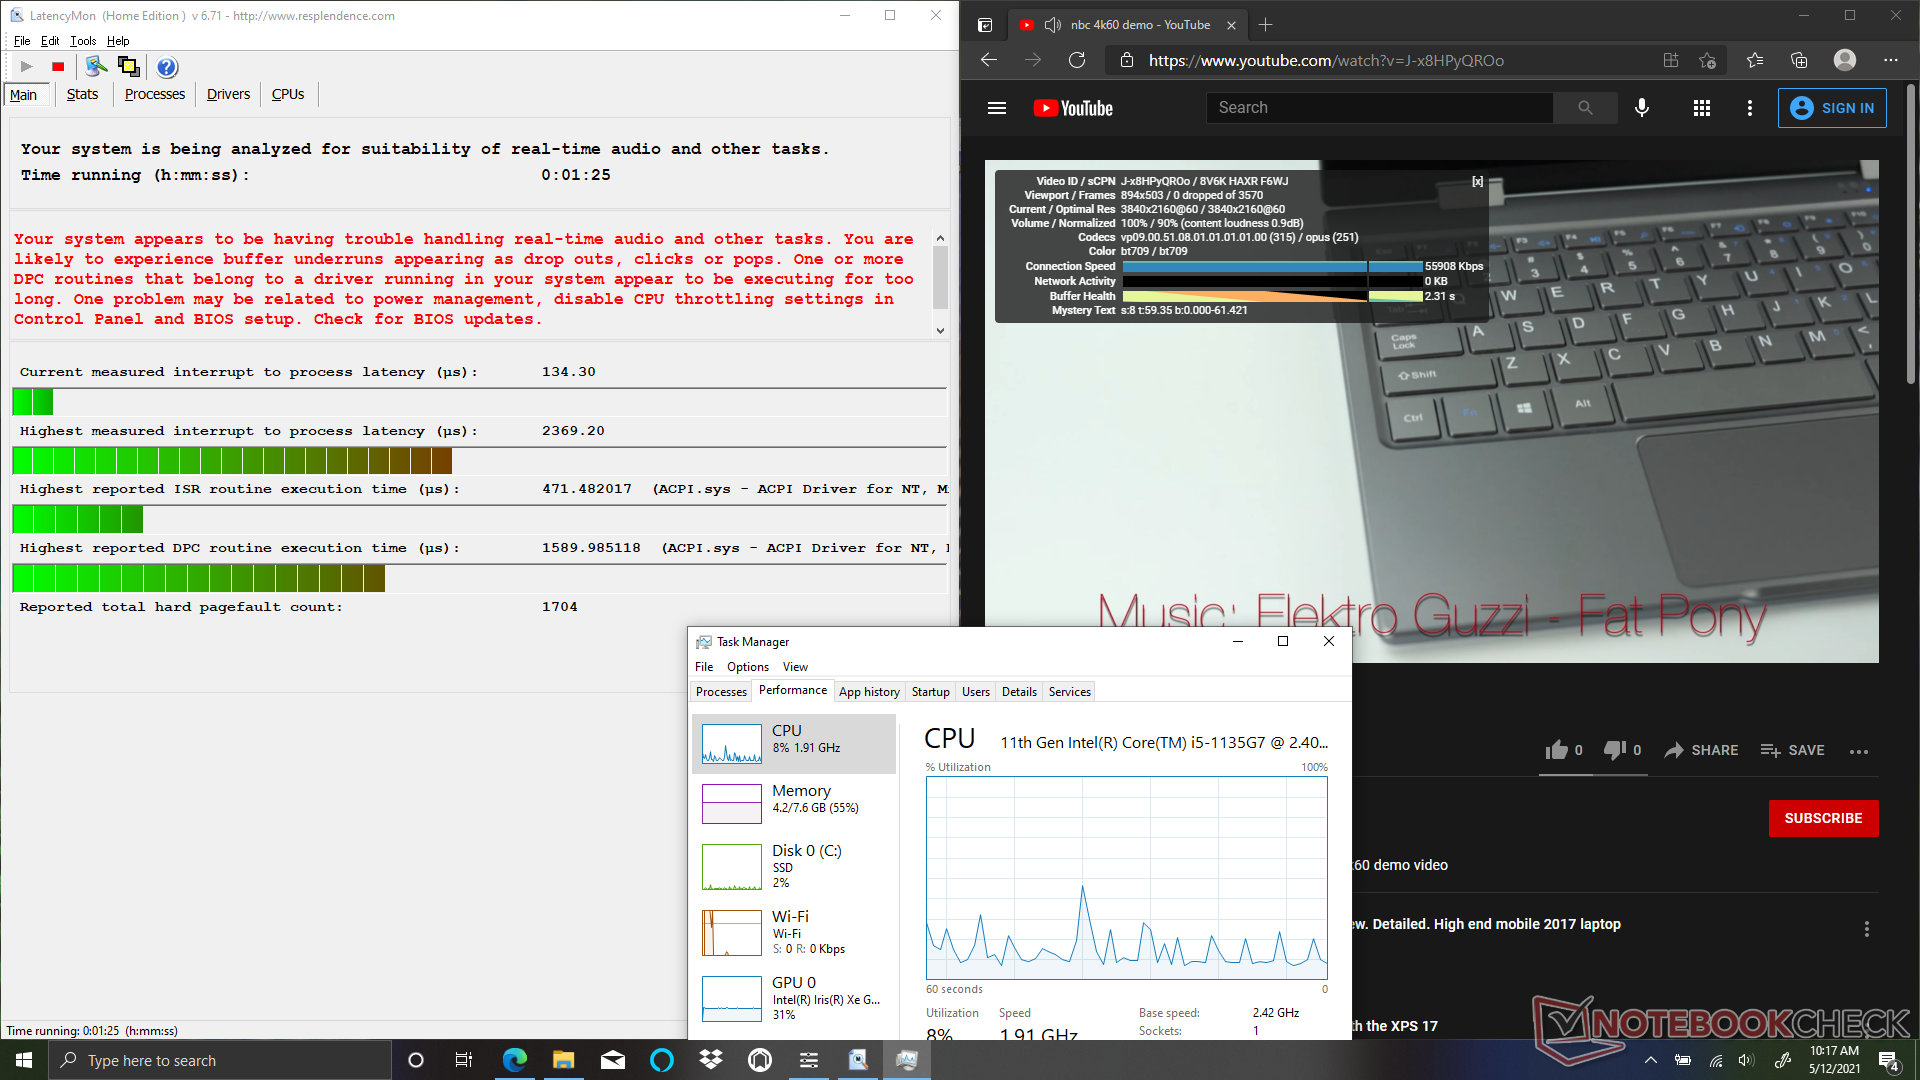
| DPC Latencies / LatencyMon - interrupt to process latency (max), Web, Youtube, Prime95 | |
| Lenovo Yoga Duet 7 13IML05-82AS000WGE | |
| MSI Summit E13 Flip Evo A11MT | |
| HP Spectre x360 13-aw2003dx | |
| HP Spectre x360 14t-ea000 | |
* ... smaller is better
Storage Devices
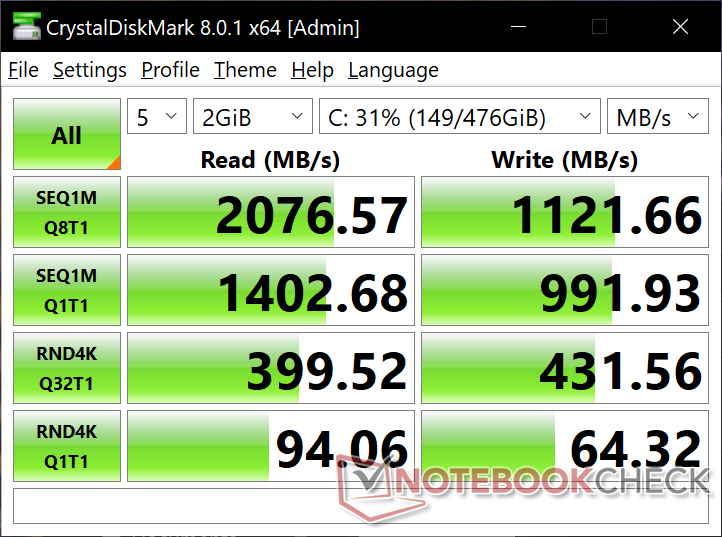
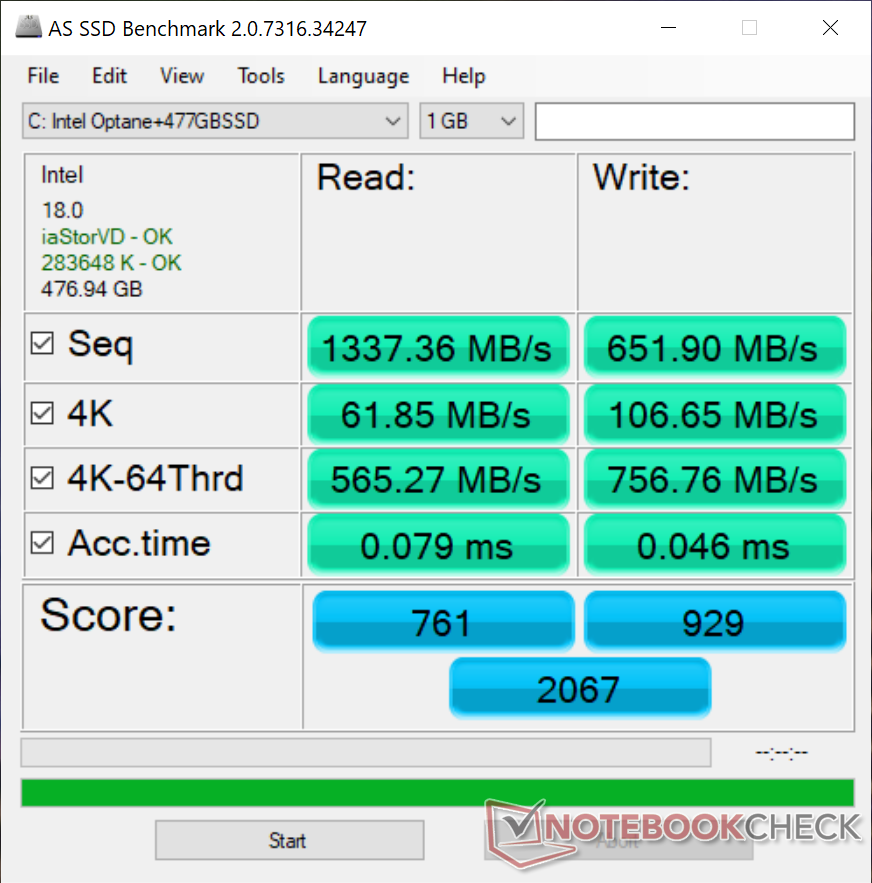
Our unit comes with the same 512 GB Intel PCIe 3.0 NVMe SSD and 32 GB of Optane memory as on the 2019 model. For most users, a standard Samsung PM981a or newer PCIe 4.0 SSD like on most other Ultrabooks would have been preferable.
| HP Spectre x360 13-aw2003dx Intel Optane Memory H10 with Solid State Storage 32GB + 512GB HBRPEKNX0202A(L/H) | HP Spectre x360 14t-ea000 Samsung SSD PM981a MZVLB512HBJQ | Dell XPS 13 7390 Core i7-10710U SK Hynix PC601 NVMe 512 GB | MSI Summit E13 Flip Evo A11MT Phison 1TB SM2801T24GKBB4S-E162 | |
|---|---|---|---|---|
| AS SSD | 59% | 14% | 98% | |
| Seq Read (MB/s) | 1337 | 2188 64% | 1804 35% | 3789 183% |
| Seq Write (MB/s) | 652 | 1320 102% | 1000 53% | 2257 246% |
| 4K Read (MB/s) | 61.8 | 53.5 -13% | 45.1 -27% | 54.2 -12% |
| 4K Write (MB/s) | 106.7 | 123.7 16% | 115 8% | 78.7 -26% |
| 4K-64 Read (MB/s) | 565 | 1010 79% | 893 58% | 1330 135% |
| 4K-64 Write (MB/s) | 757 | 1808 139% | 732 -3% | 2038 169% |
| Access Time Read * (ms) | 0.079 | 0.055 30% | 0.044 44% | 0.042 47% |
| Access Time Write * (ms) | 0.046 | 0.076 -65% | 0.095 -107% | 0.04 13% |
| Score Read (Points) | 761 | 1282 68% | 1119 47% | 1763 132% |
| Score Write (Points) | 929 | 2063 122% | 947 2% | 2343 152% |
| Score Total (Points) | 2067 | 3970 92% | 2608 26% | 4938 139% |
| Copy ISO MB/s (MB/s) | 912 | 1644 80% | 1515 66% | 2270 149% |
| Copy Program MB/s (MB/s) | 696 | 920 32% | 535 -23% | 670 -4% |
| Copy Game MB/s (MB/s) | 994 | 1725 74% | 1211 22% | 1525 53% |
| CrystalDiskMark 5.2 / 6 | 37% | 32% | 115% | |
| Write 4K (MB/s) | 64.8 | 82.2 27% | 134 107% | 311.1 380% |
| Read 4K (MB/s) | 98 | 45.7 -53% | 42.91 -56% | 56.6 -42% |
| Write Seq (MB/s) | 994 | 2000 101% | 1841 85% | 2397 141% |
| Read Seq (MB/s) | 1440 | 2206 53% | 1707 19% | 2277 58% |
| Write 4K Q32T1 (MB/s) | 444.5 | 451.2 2% | 394.7 -11% | 803 81% |
| Read 4K Q32T1 (MB/s) | 397.1 | 351 -12% | 398.5 0% | 849 114% |
| Write Seq Q32T1 (MB/s) | 1265 | 2982 136% | 2250 78% | 2410 91% |
| Read Seq Q32T1 (MB/s) | 2501 | 3529 41% | 3265 31% | 4954 98% |
| Total Average (Program / Settings) | 48% /
51% | 23% /
21% | 107% /
104% |
* ... smaller is better

Disk Throttling: DiskSpd Read Loop, Queue Depth 8
GPU Performance
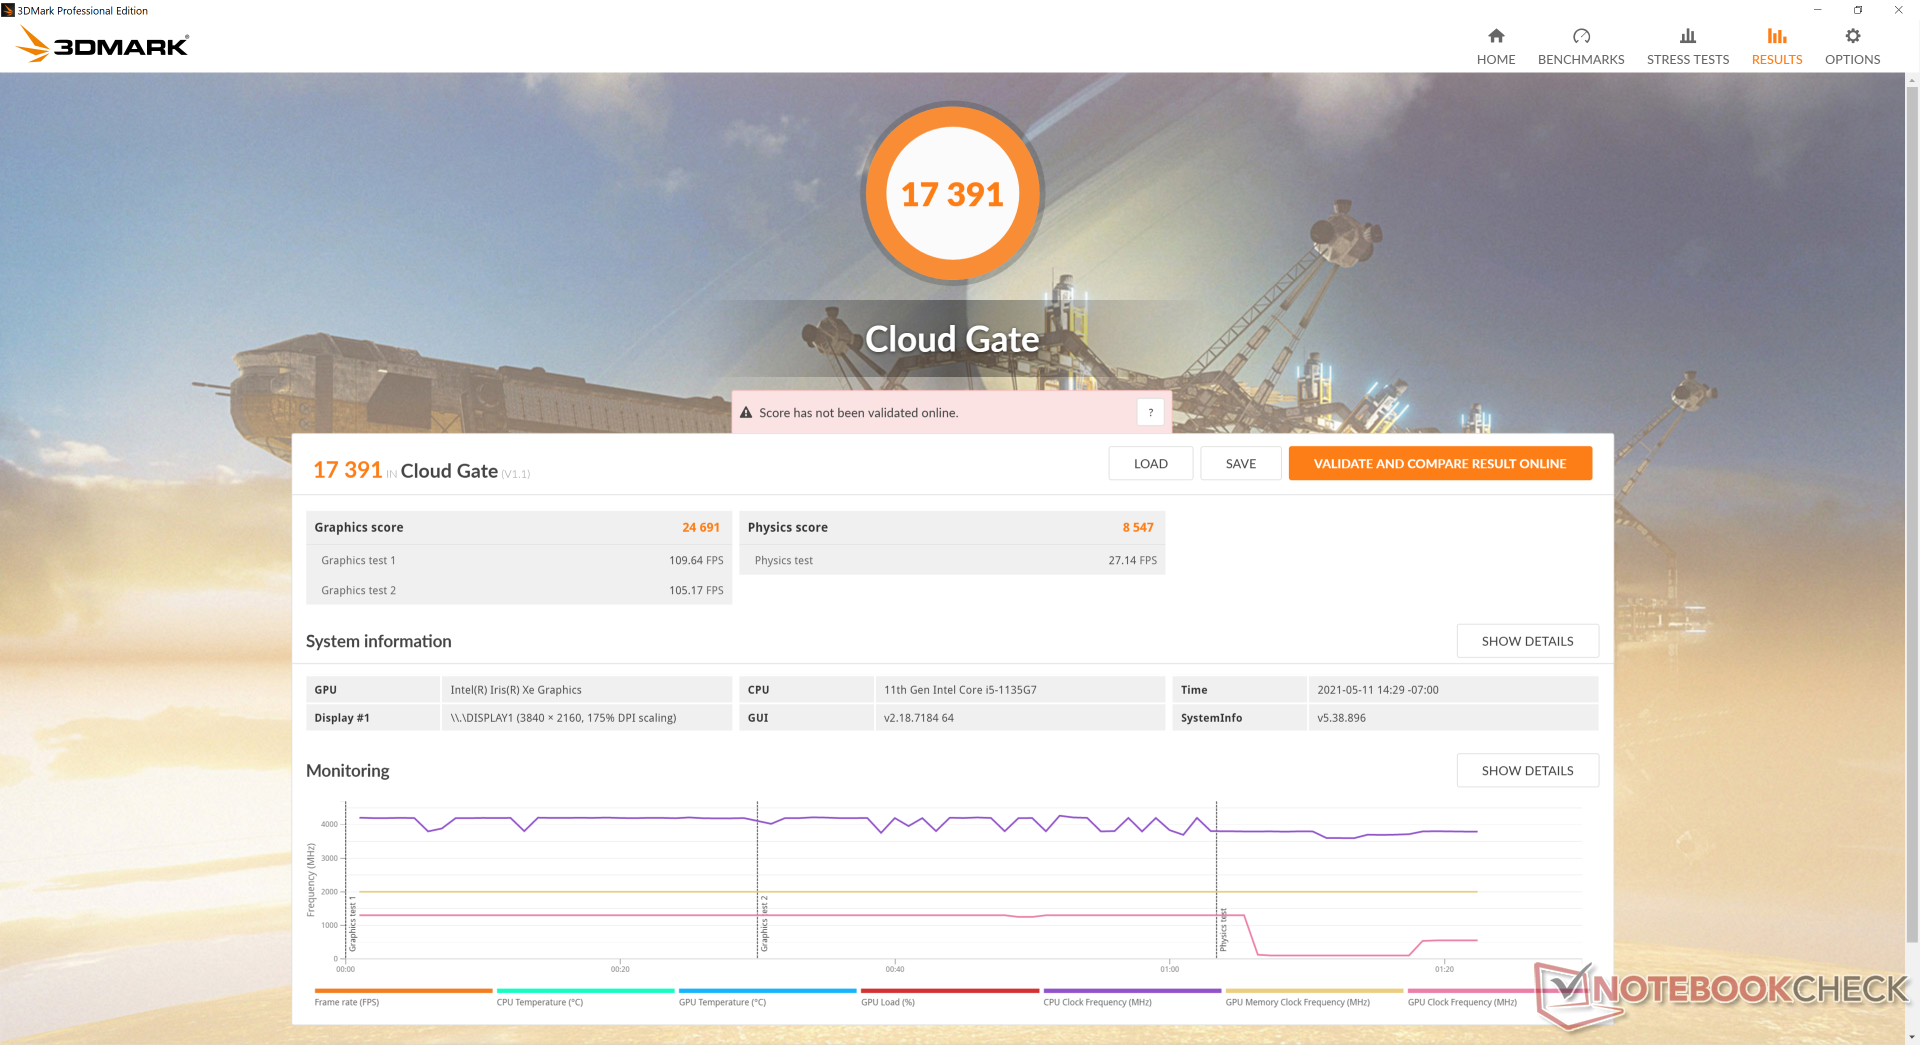
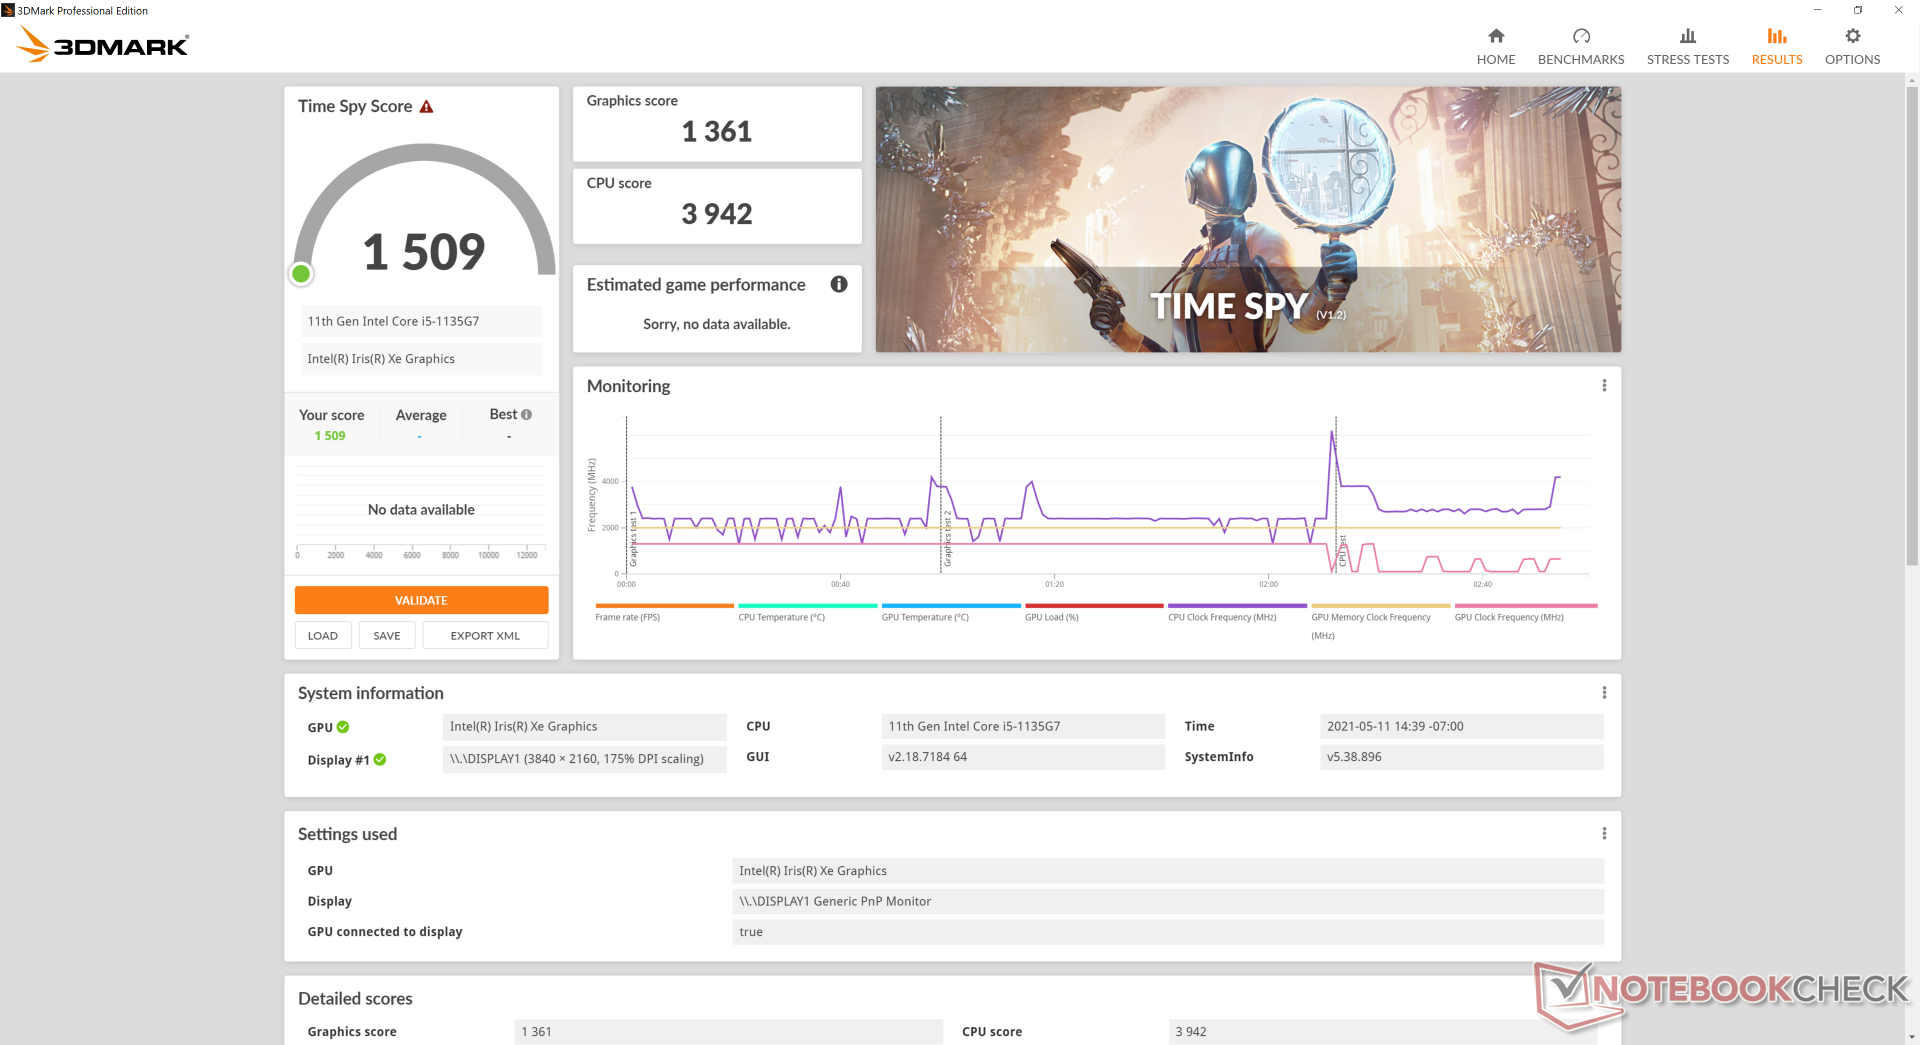
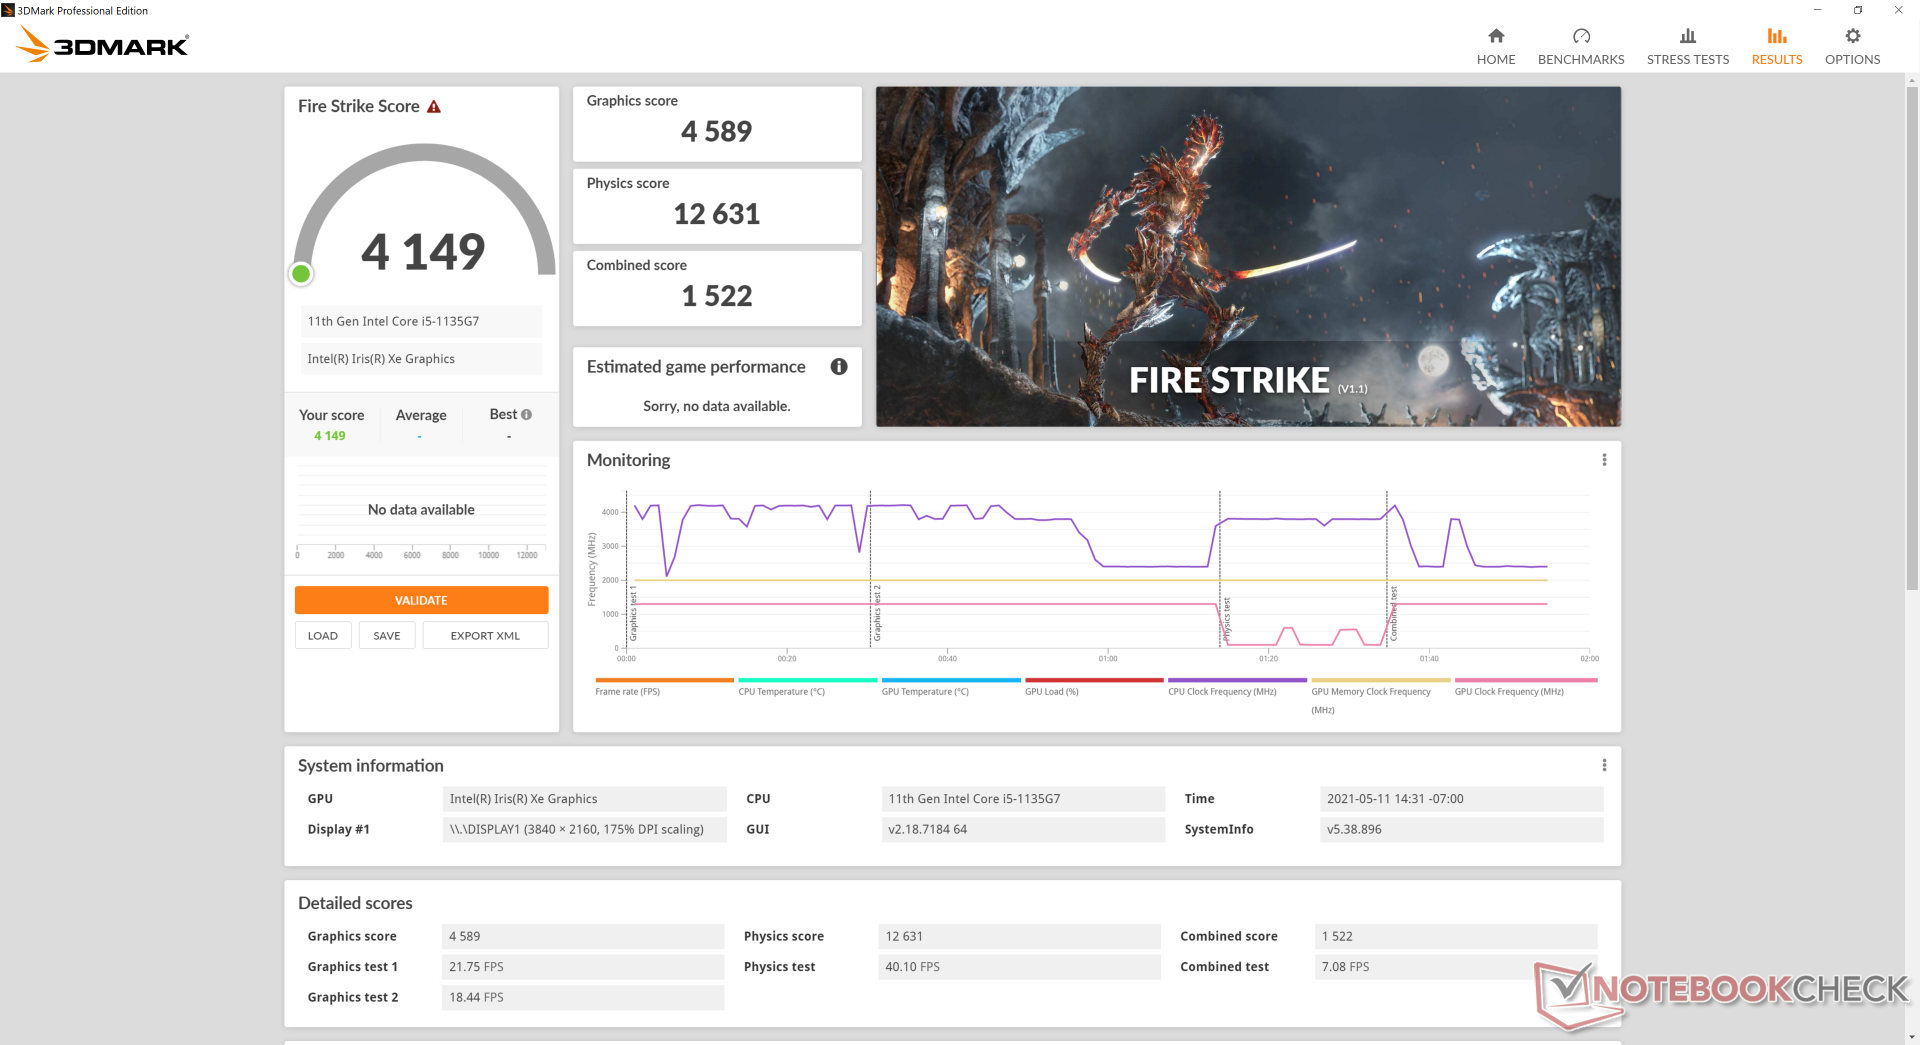
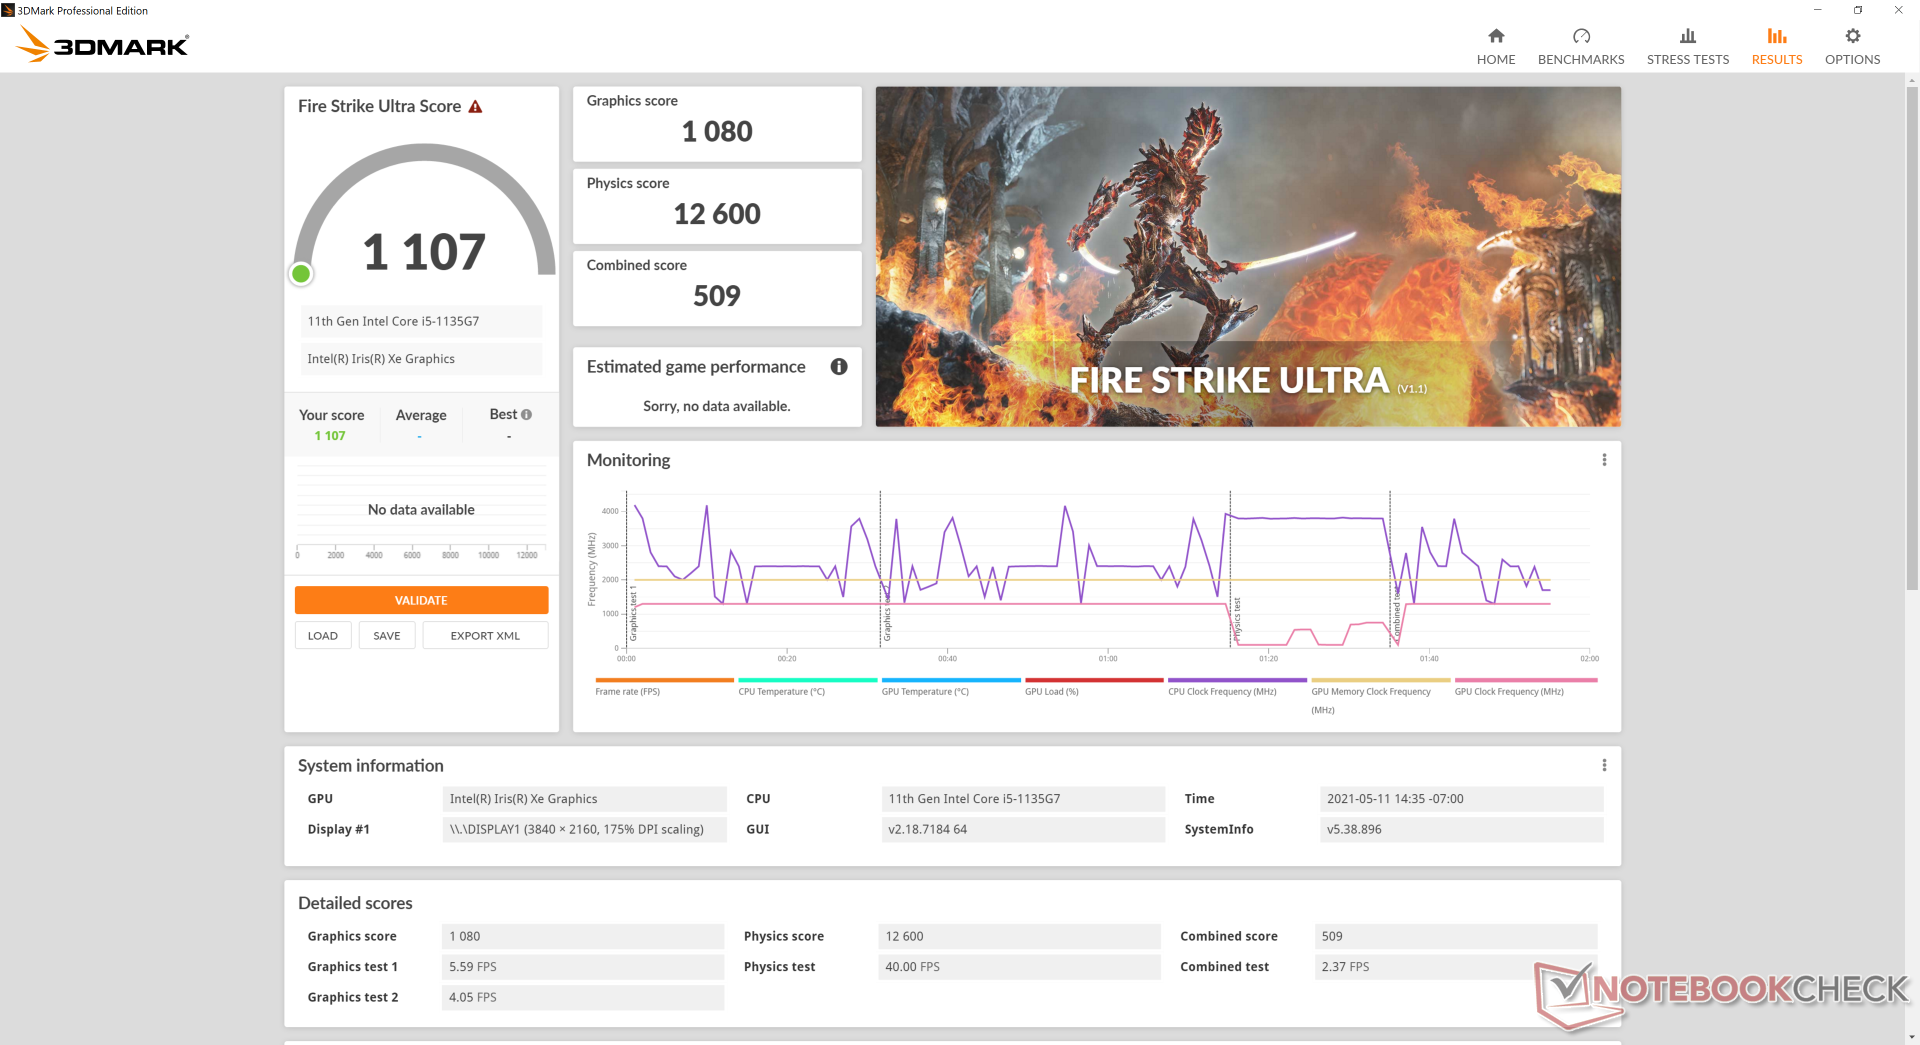
Graphics performance is excellent with 3DMark results that are about 20 percent faster than the average Iris Xe 80 EUs in other laptops. Synthetic benchmarks don't tell the whole story, however, as performance in real-world games will fluctuate wildly. Our graph below shows frame rates over time when idling on Witcher 3 at the lowest graphical settings. Frame rates would cycle consistently between the low 70s and high 80s even after setting our unit to Performance mode. This same phenomenon was observed on the Spectre x360 14 and 2019 Spectre x360 13 as well meaning HP has done nothing to address this.
Users can still get around the uneven frame rates by limiting them or enabling v-sync. It's too bad that the display doesn't support variable refresh rate unlike on many AMD-powered Ultrabooks.
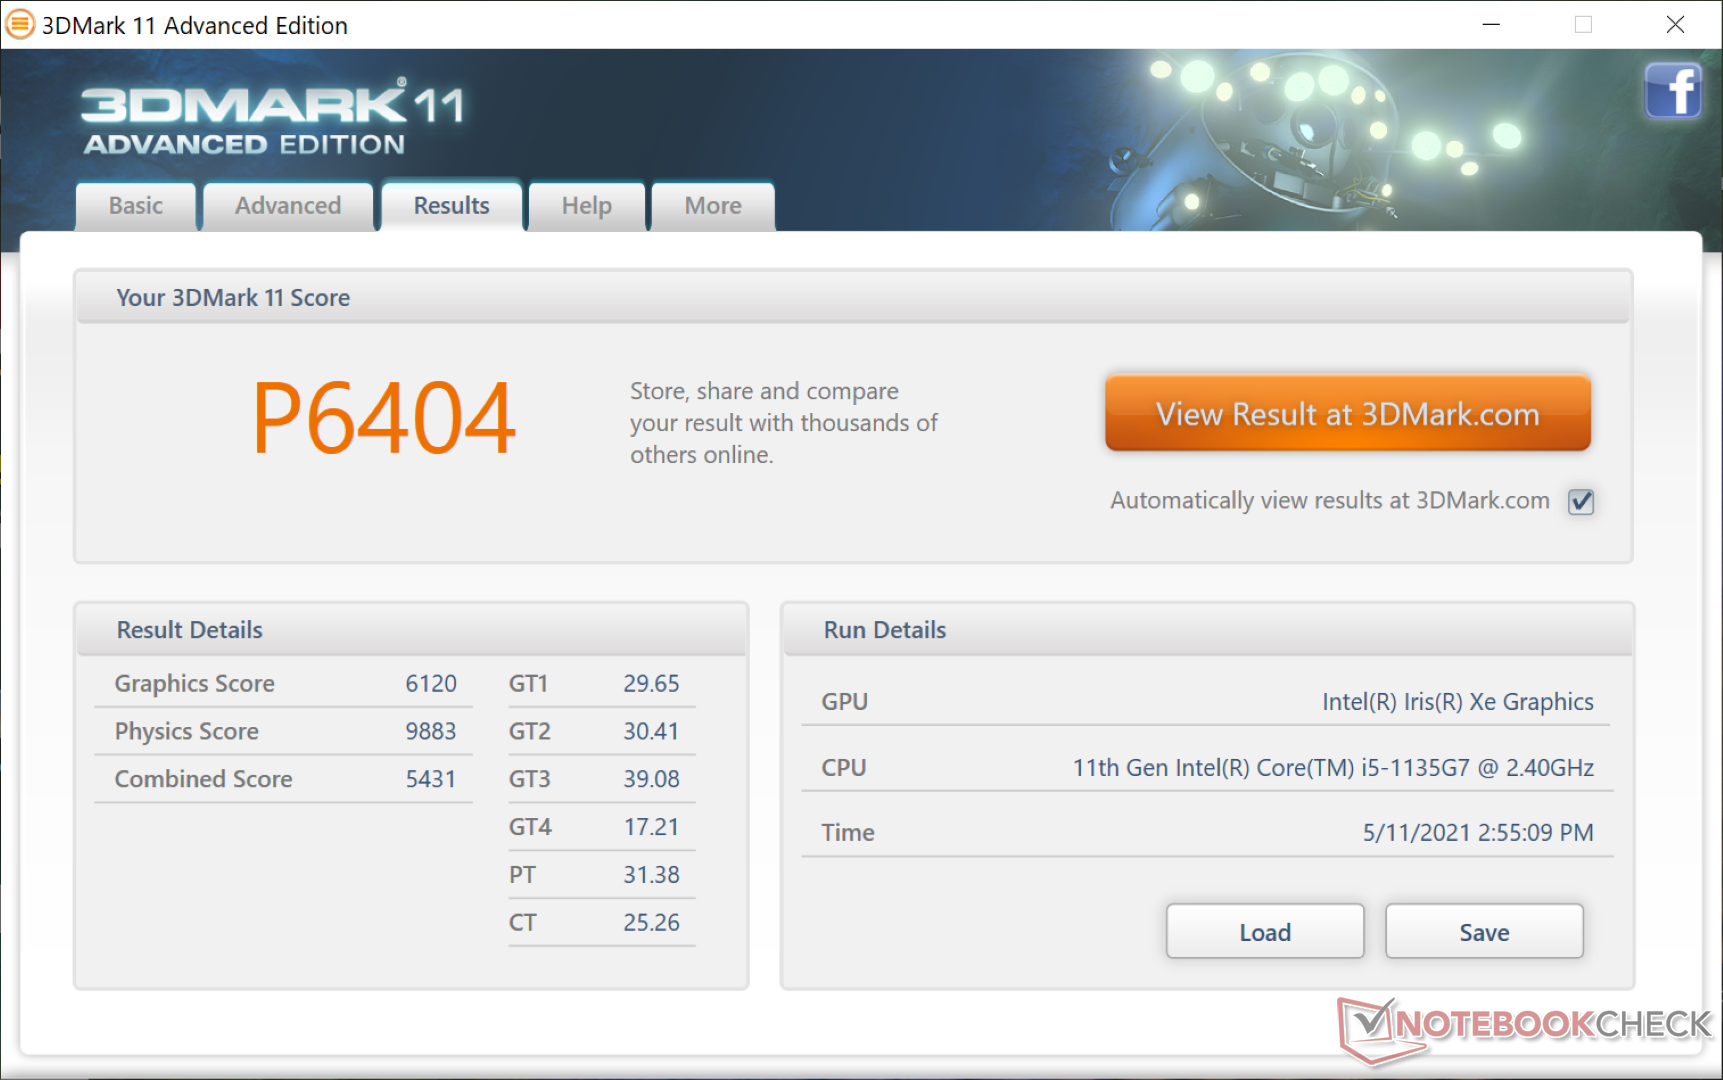
| 3DMark 11 Performance | 6404 points | |
| 3DMark Cloud Gate Standard Score | 17391 points | |
| 3DMark Fire Strike Score | 4149 points | |
| 3DMark Time Spy Score | 1509 points | |
Help | ||
| low | med. | high | ultra | |
|---|---|---|---|---|
| The Witcher 3 (2015) | 84.5 | 46.2 | 29.5 | 13.5 |
| Dota 2 Reborn (2015) | 83.4 | 68.3 | 49.8 | 48 |
| Final Fantasy XV Benchmark (2018) | 38.4 | 20.8 | 20.8 | |
| X-Plane 11.11 (2018) | 24.1 | 33.8 | 19.6 |
Emissions
System Noise
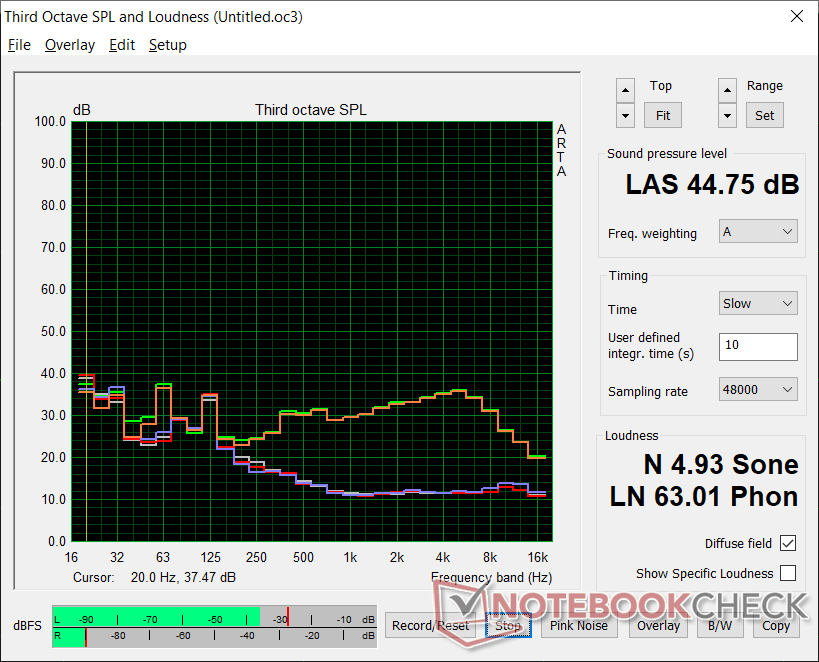
Fan noise is surprisingly quiet for most activities. For example, we had to run the first benchmark scene of 3DMark 06 twice before the fans would even begin to kick in. Users can therefore run light applications like video streaming without any distracting fan noise at all.
Unfortunately, the fans tend to pulse when running games whereas the fans in most other laptops would be fixed at a certain RPM. Running Witcher 3 causes the fans to cycle between 36.6 dB(A) and 44.6 dB(A) when set to Performance mode. A fixed 44.6 dB(A) would have been preferable as pulsing fans can be more noticeable or annoying. This cycling behavior correlates with the cycling processor clock rates and temperatures as noted in our Stress Test section below.
| HP Spectre x360 13-aw2003dx Iris Xe G7 80EUs, i5-1135G7, Intel Optane Memory H10 with Solid State Storage 32GB + 512GB HBRPEKNX0202A(L/H) | HP Spectre x360 14t-ea000 Iris Xe G7 96EUs, i7-1165G7, Samsung SSD PM981a MZVLB512HBJQ | Dell XPS 13 7390 Core i7-10710U UHD Graphics 620, i7-10710U, SK Hynix PC601 NVMe 512 GB | MSI Summit E13 Flip Evo A11MT Iris Xe G7 96EUs, i7-1185G7, Phison 1TB SM2801T24GKBB4S-E162 | |
|---|---|---|---|---|
| Noise | 2% | -13% | -7% | |
| off / environment * (dB) | 25.3 | 25.8 -2% | 28 -11% | 24.5 3% |
| Idle Minimum * (dB) | 25.4 | 25.9 -2% | 28 -10% | 24.7 3% |
| Idle Average * (dB) | 25.4 | 25.9 -2% | 28 -10% | 24.7 3% |
| Idle Maximum * (dB) | 25.4 | 25.9 -2% | 28 -10% | 26.4 -4% |
| Load Average * (dB) | 25.4 | 26.4 -4% | 33.7 -33% | 37.8 -49% |
| Witcher 3 ultra * (dB) | 44.6 | 36.9 17% | 41.4 7% | |
| Load Maximum * (dB) | 44.8 | 41.5 7% | 46.5 -4% | 48.8 -9% |
* ... smaller is better
Noise level
| Idle |
| 25.4 / 25.4 / 25.4 dB(A) |
| Load |
| 25.4 / 44.8 dB(A) |
 | ||
30 dB silent 40 dB(A) audible 50 dB(A) loud |
||
min: | ||
Temperature
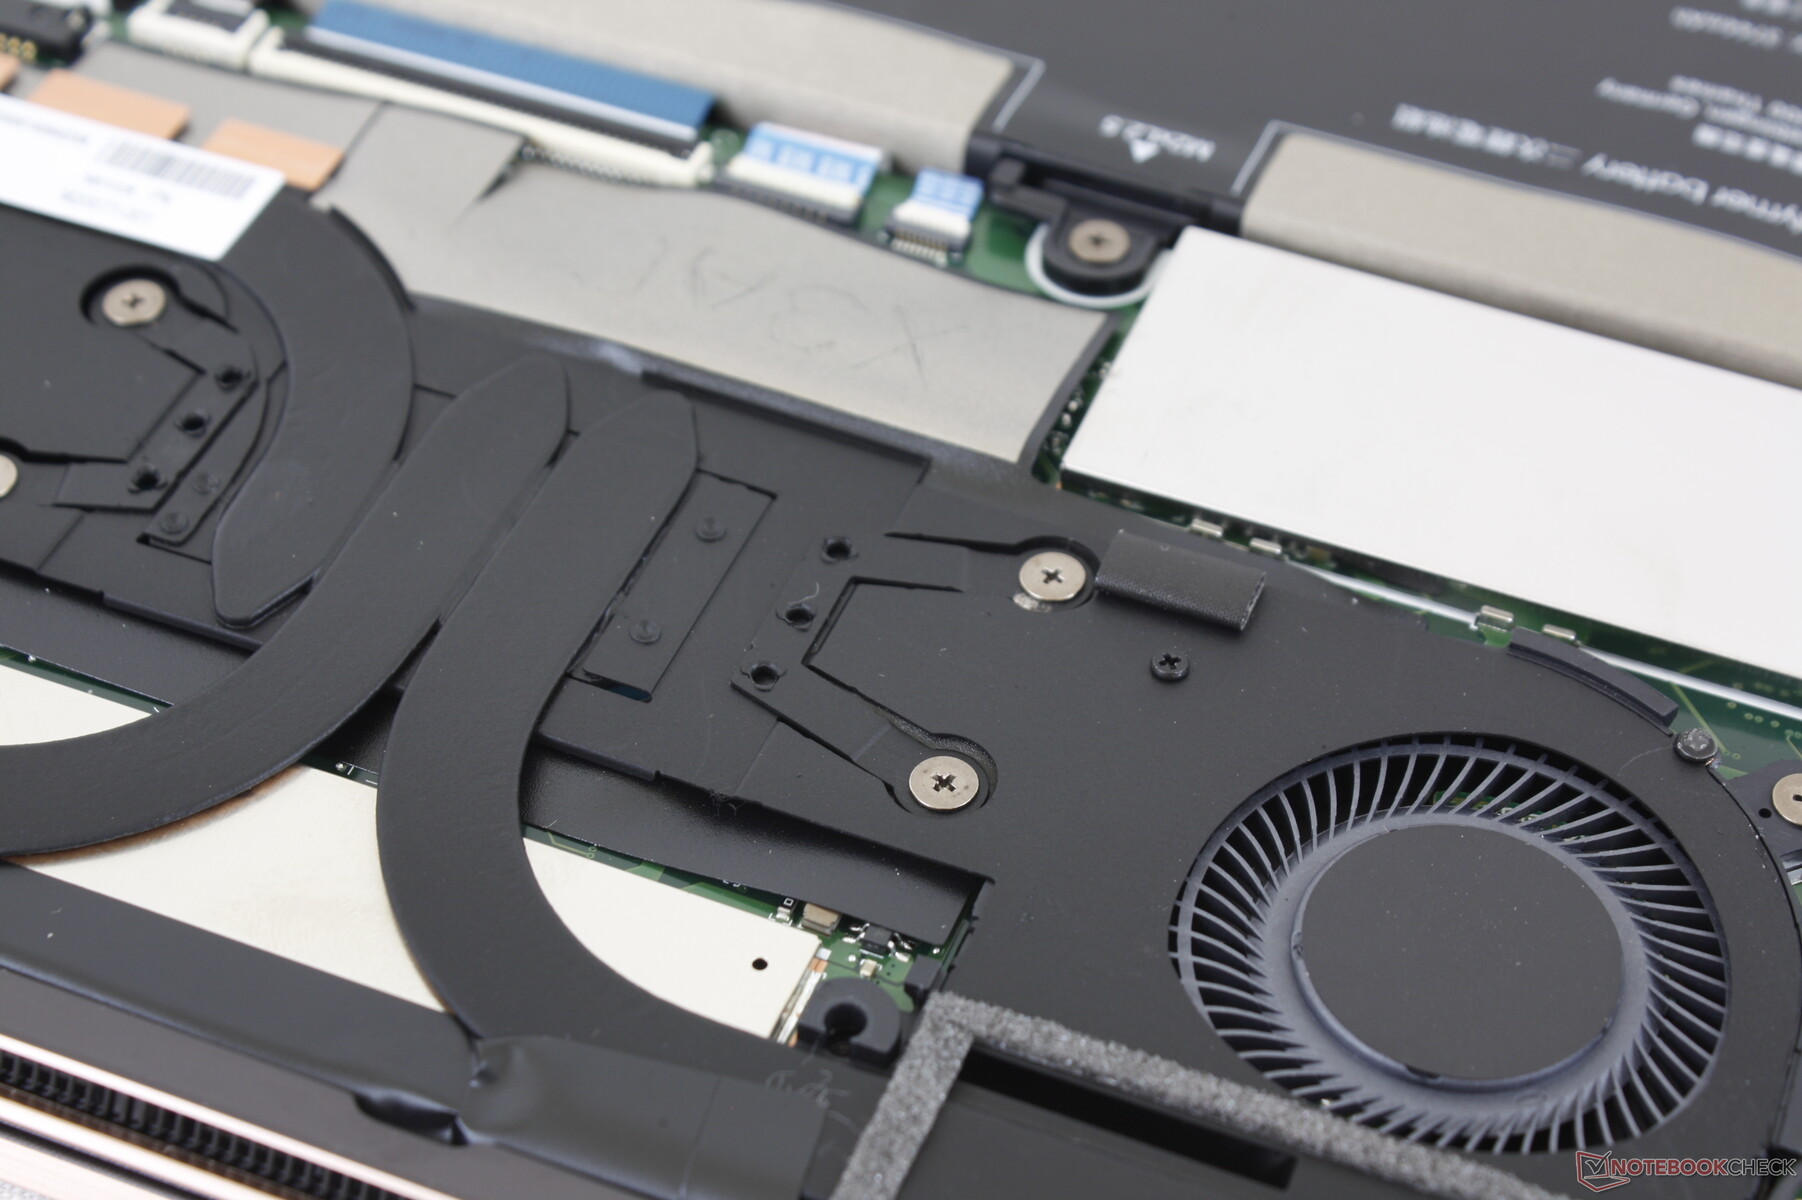
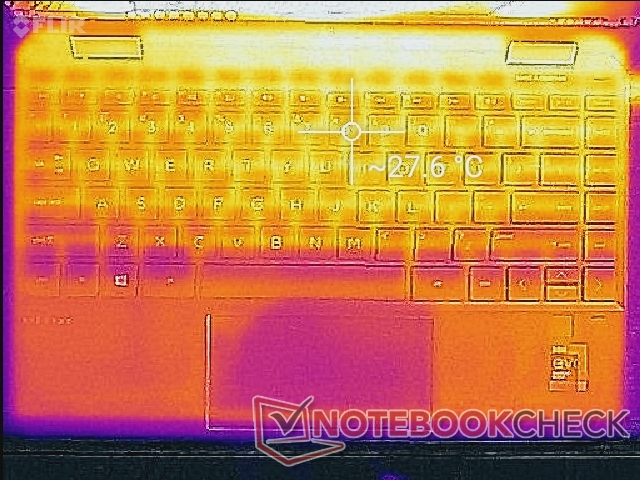
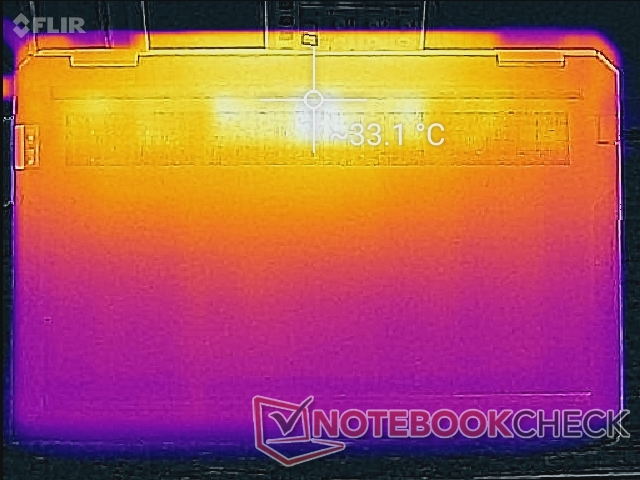
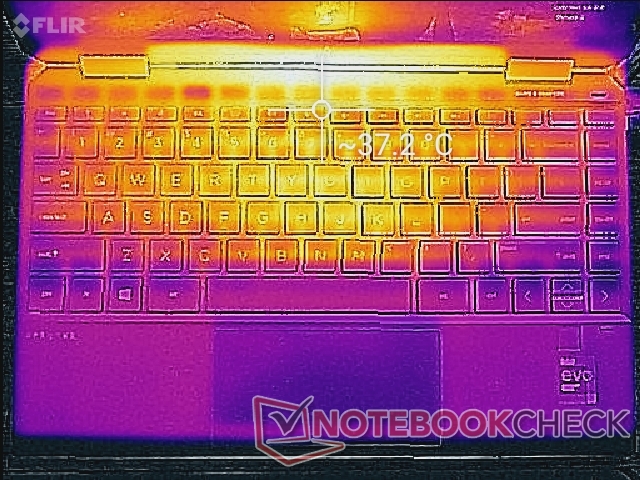
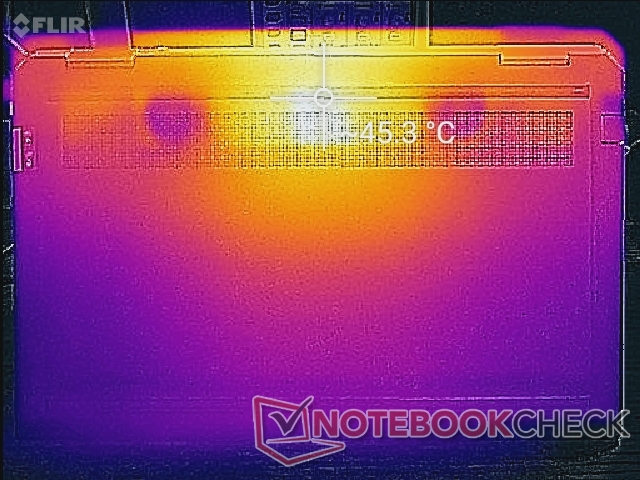
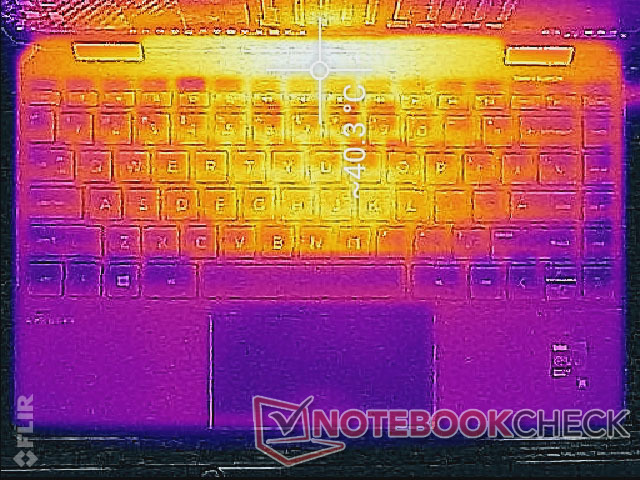
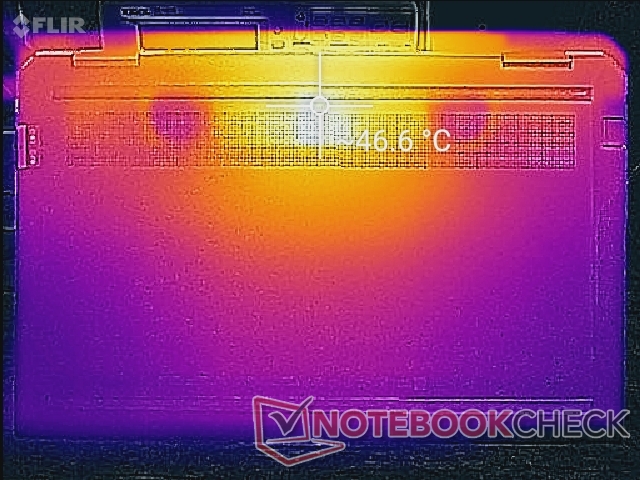
Surface temperature development is largely symmetrical because of the symmetrical positioning of the dual fans and heat pipes inside. Hot spots are therefore toward the rear of the unit far away from the palm rests and most keys in contrast to the keys of the Asus ZenBook 14 UX435 which can be as warm as 46 C.
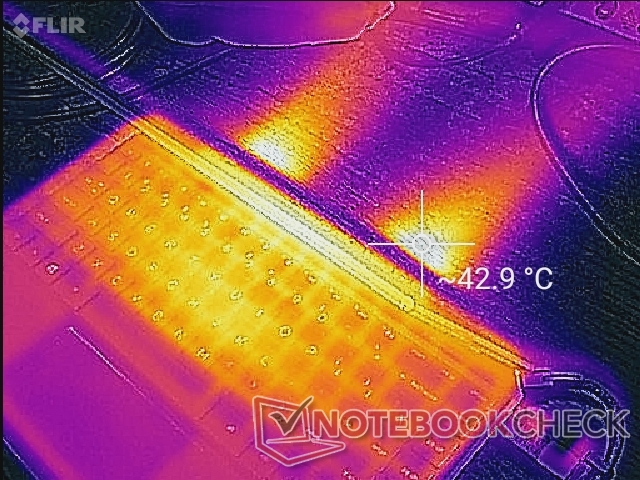
(±) The maximum temperature on the upper side is 40 °C / 104 F, compared to the average of 35.3 °C / 96 F, ranging from 19.6 to 60 °C for the class Convertible.
(-) The bottom heats up to a maximum of 47 °C / 117 F, compared to the average of 36.8 °C / 98 F
(+) In idle usage, the average temperature for the upper side is 26.7 °C / 80 F, compared to the device average of 30.3 °C / 87 F.
(+) Playing The Witcher 3, the average temperature for the upper side is 30.9 °C / 88 F, compared to the device average of 30.3 °C / 87 F.
(+) The palmrests and touchpad are cooler than skin temperature with a maximum of 28.4 °C / 83.1 F and are therefore cool to the touch.
(±) The average temperature of the palmrest area of similar devices was 27.9 °C / 82.2 F (-0.5 °C / -0.9 F).
Stress Test
Looking more closely at the CPU and GPU clock rates when running demanding loads shows us exactly why both our CineBench loop test results and Witcher 3 frame rates are always fluctuating. As shown by our screenshots below, clock rates are generally unsteady when running such loads even when set to Performance mode with HP Command Center. Note that we observed this same phenomenon on both the Spectre x360 14 and 2019 Spectre x360 13 as well to show that these findings are consistent across the Spectre family.
The cycling clock rates are purposeful in order to boost average CPU and GPU performance over time but at the obvious cost of unsteady results. CPUs in most other Ultrabooks like the Asus ZenBook UX425 tend to remain flat at fixed clock rates for steadier performance.
Running on batteries will not greatly impact performance. A 3DMark 11 run on battery power would return Physics and Graphics scores of 10393 and 5996 points, respectively, compared to 9883 and 6120 points when on mains.
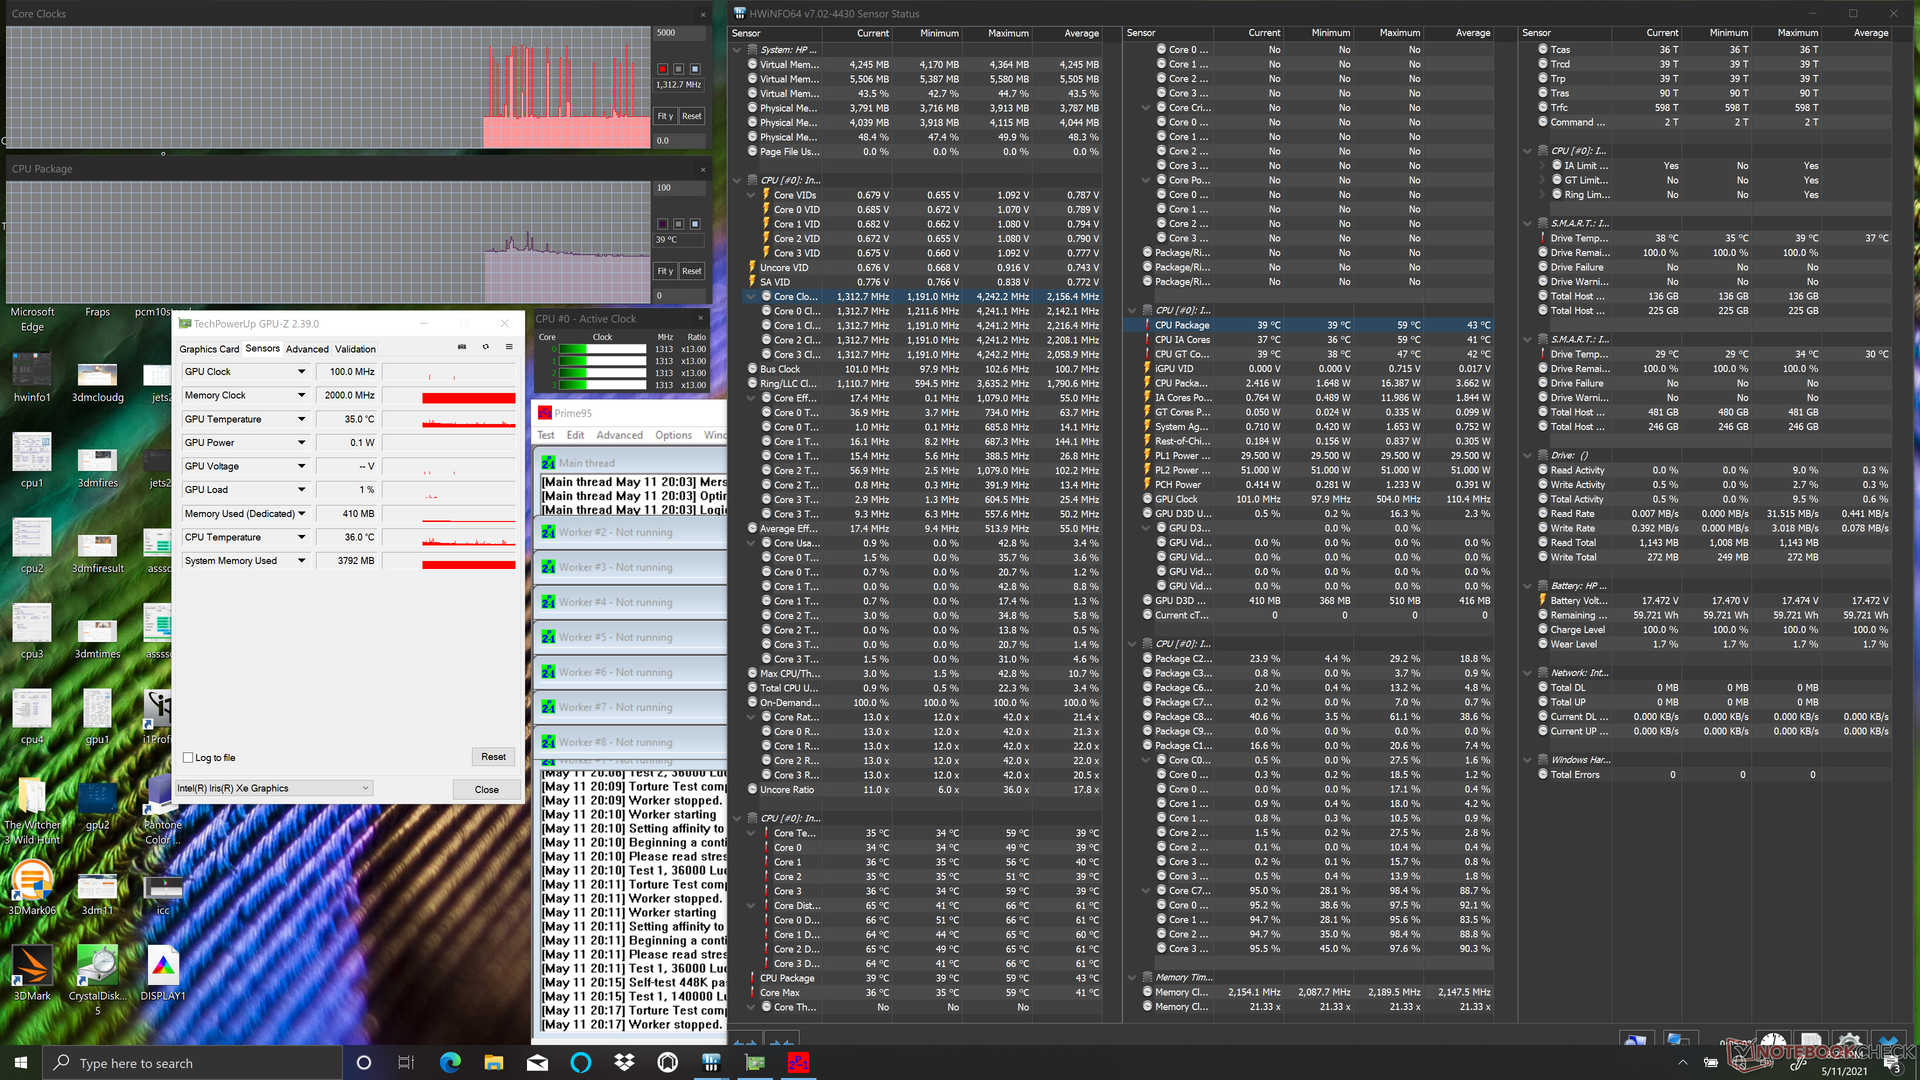
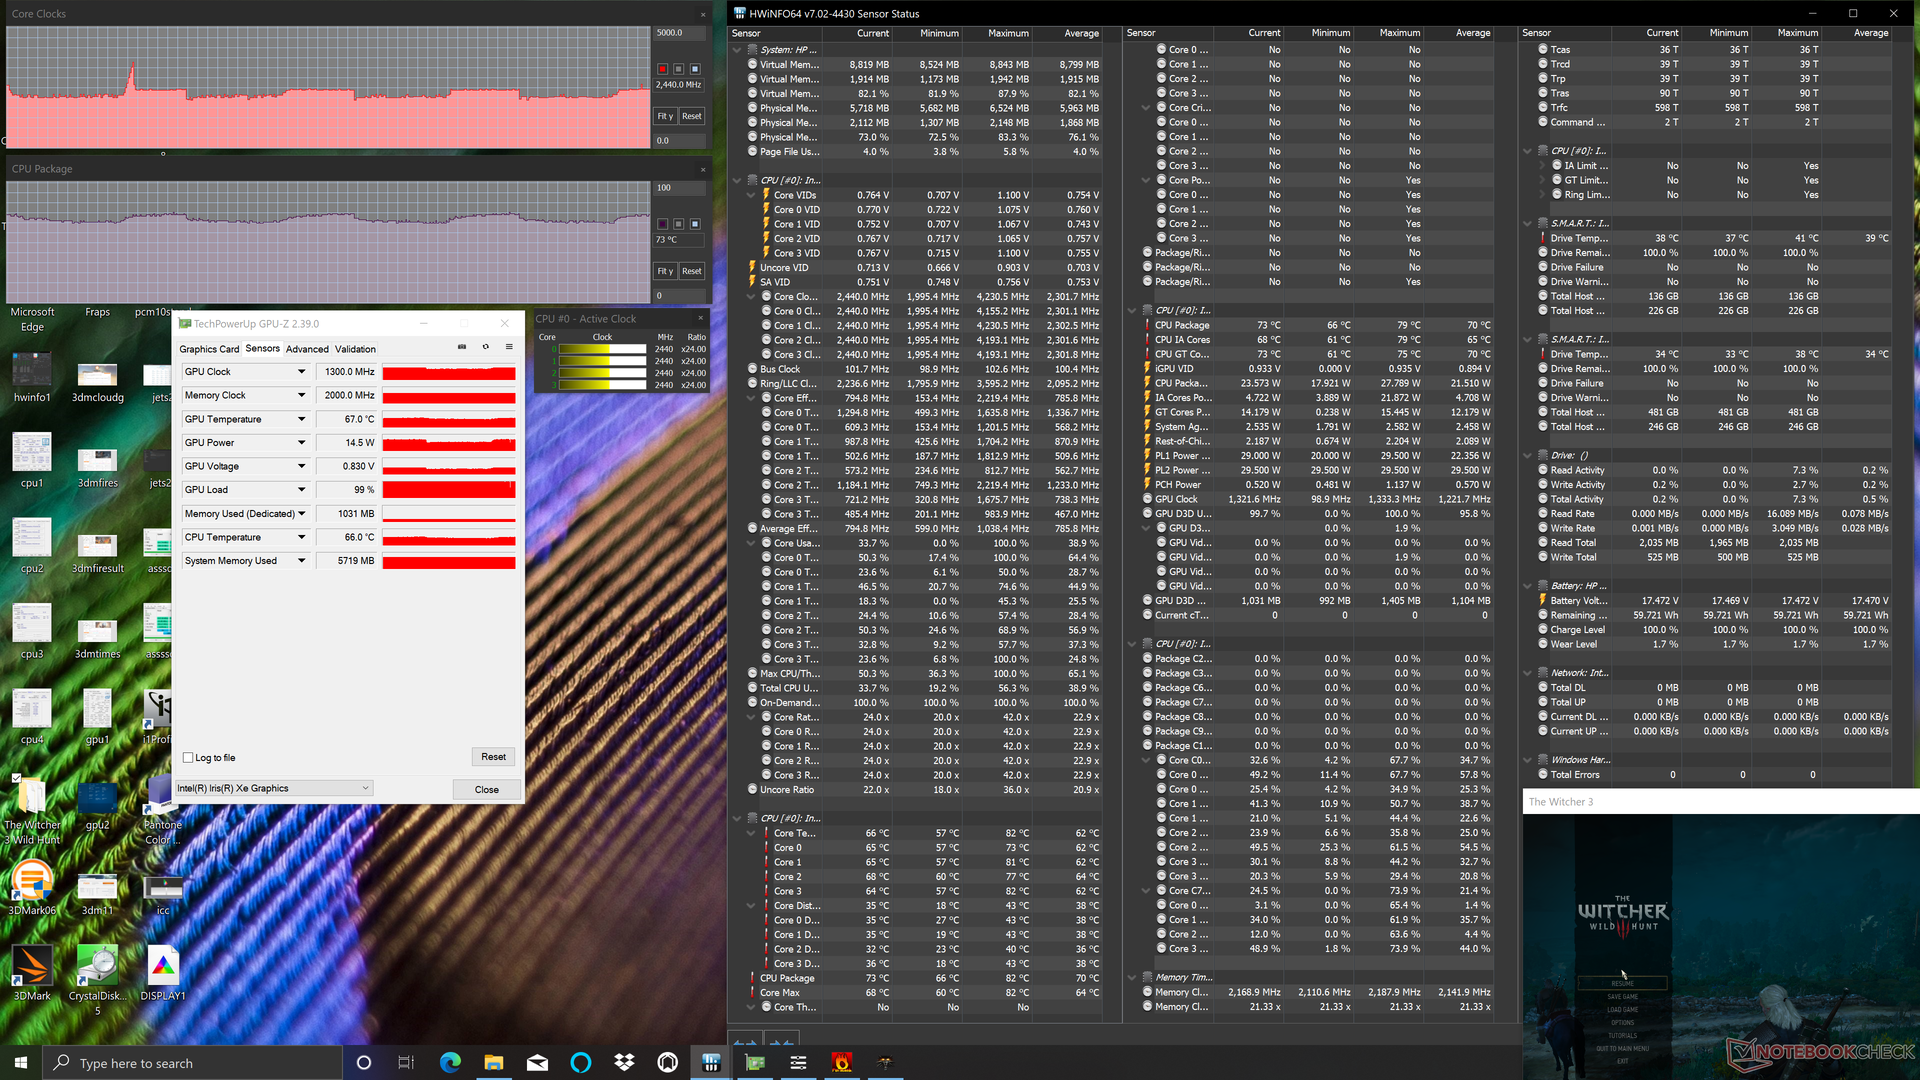
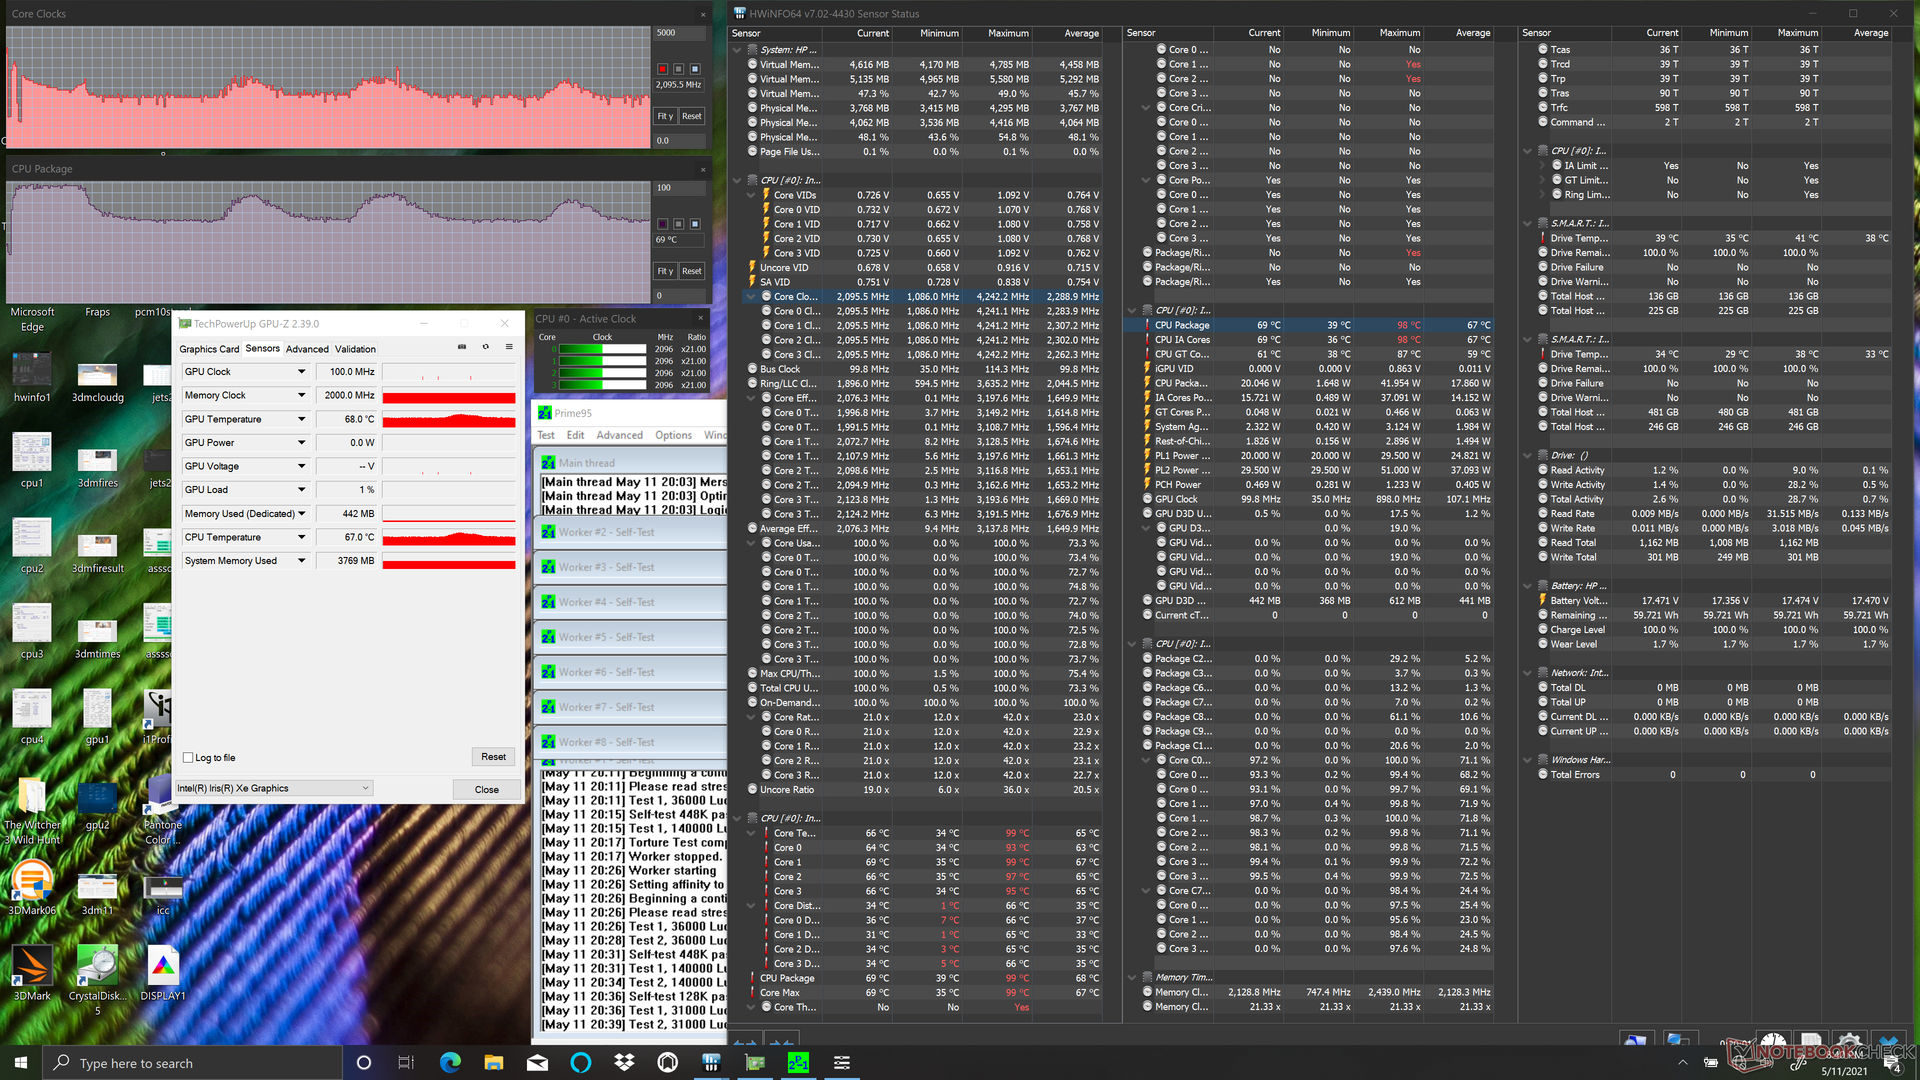
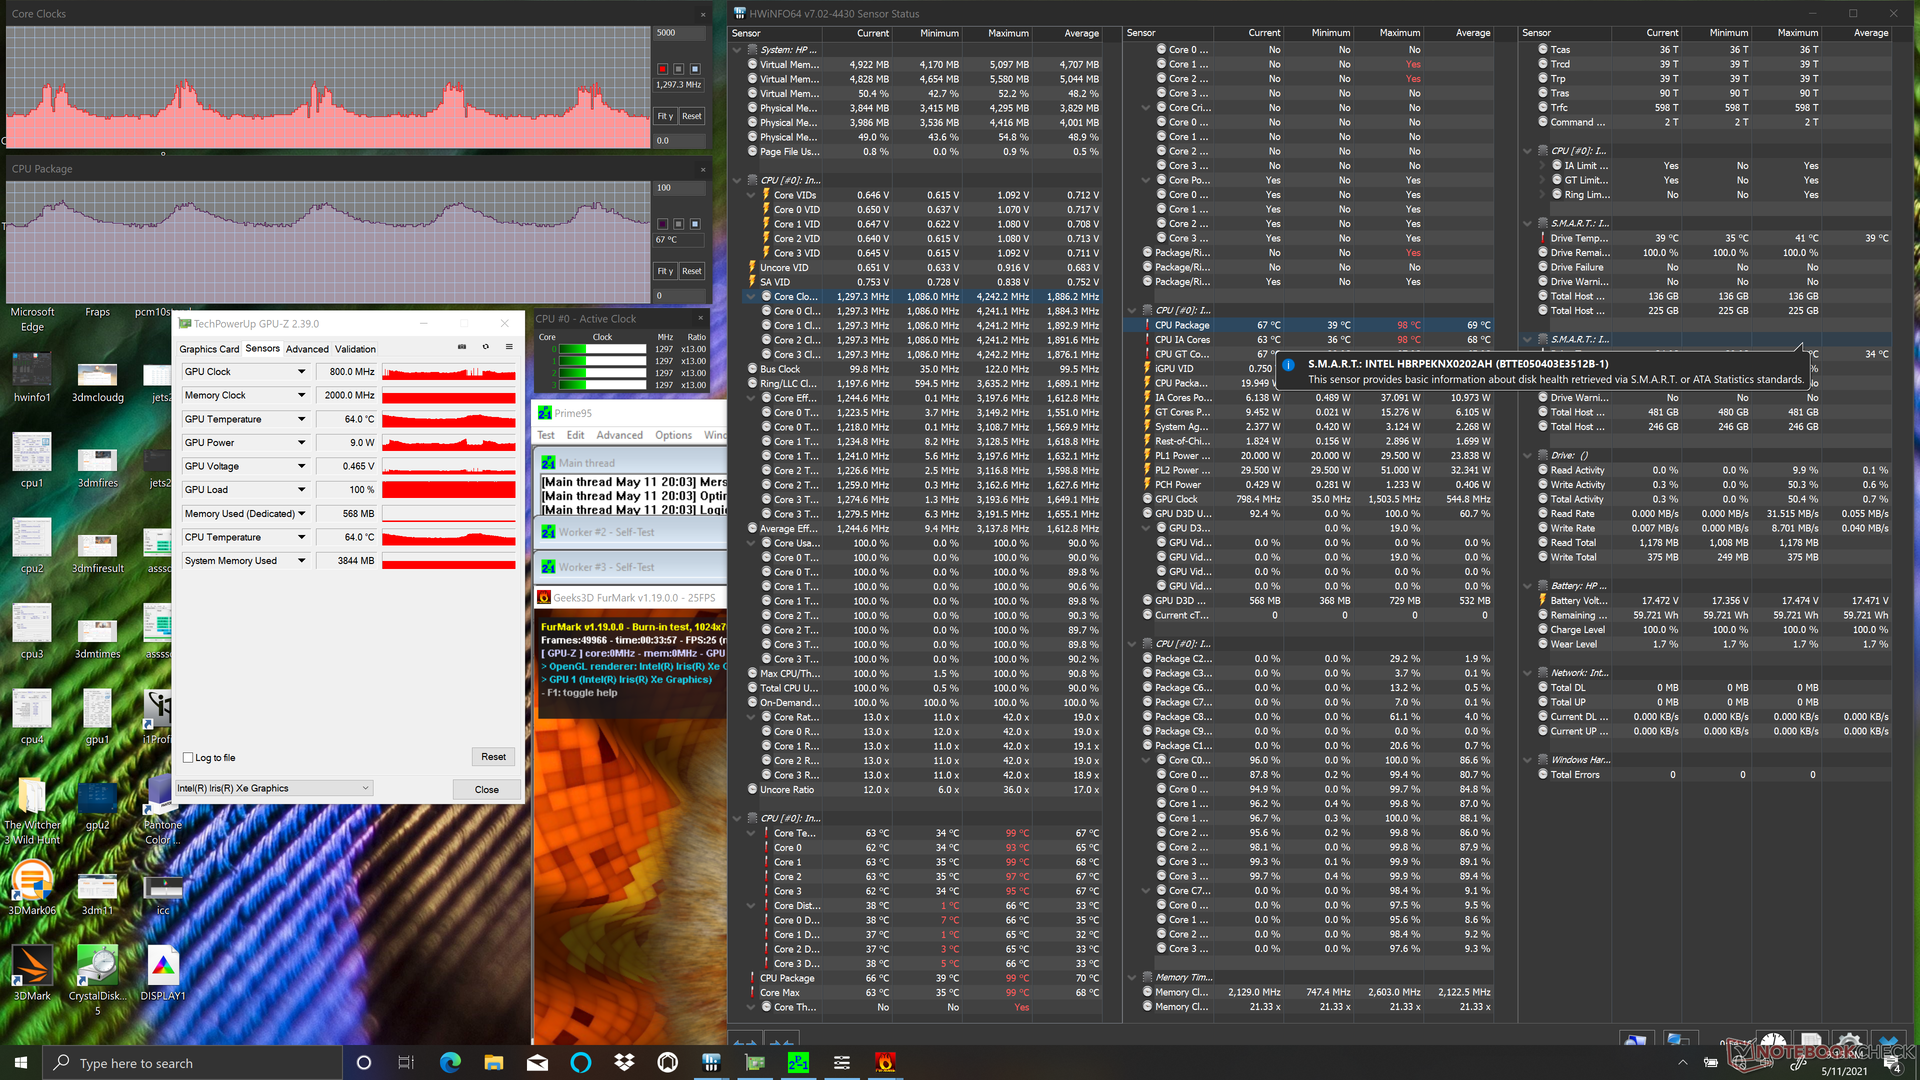
| CPU Clock (GHz) | GPU Clock (MHz) | Average CPU Temperature (°C) | |
| System Idle | -- | -- | 39 |
| Prime95 Stress | 1.9 - 3.0 cycle | -- | 72 - 89 cycle |
| Prime95 + FurMark Stress | 1.2 - 2.7 cycle | 550 - 1000 cycle | 63 - 85 cycle |
| Witcher 3 Stress | 2.1 - 2.4 cycle | 1100 - 1300 cycle | 66 - 74 cycle |
Speakers


HP Spectre x360 13-aw2003dx audio analysis
(±) | speaker loudness is average but good (80.1 dB)
Bass 100 - 315 Hz
(±) | reduced bass - on average 12.5% lower than median
(±) | linearity of bass is average (8.7% delta to prev. frequency)
Mids 400 - 2000 Hz
(±) | higher mids - on average 5.1% higher than median
(+) | mids are linear (6.6% delta to prev. frequency)
Highs 2 - 16 kHz
(±) | higher highs - on average 6.2% higher than median
(+) | highs are linear (4.9% delta to prev. frequency)
Overall 100 - 16.000 Hz
(±) | linearity of overall sound is average (16.6% difference to median)
Compared to same class
» 30% of all tested devices in this class were better, 4% similar, 66% worse
» The best had a delta of 6%, average was 20%, worst was 57%
Compared to all devices tested
» 28% of all tested devices were better, 6% similar, 66% worse
» The best had a delta of 4%, average was 24%, worst was 134%
Apple MacBook 12 (Early 2016) 1.1 GHz audio analysis
(+) | speakers can play relatively loud (83.6 dB)
Bass 100 - 315 Hz
(±) | reduced bass - on average 11.3% lower than median
(±) | linearity of bass is average (14.2% delta to prev. frequency)
Mids 400 - 2000 Hz
(+) | balanced mids - only 2.4% away from median
(+) | mids are linear (5.5% delta to prev. frequency)
Highs 2 - 16 kHz
(+) | balanced highs - only 2% away from median
(+) | highs are linear (4.5% delta to prev. frequency)
Overall 100 - 16.000 Hz
(+) | overall sound is linear (10.2% difference to median)
Compared to same class
» 7% of all tested devices in this class were better, 2% similar, 91% worse
» The best had a delta of 5%, average was 18%, worst was 53%
Compared to all devices tested
» 4% of all tested devices were better, 1% similar, 94% worse
» The best had a delta of 4%, average was 24%, worst was 134%
Energy Management
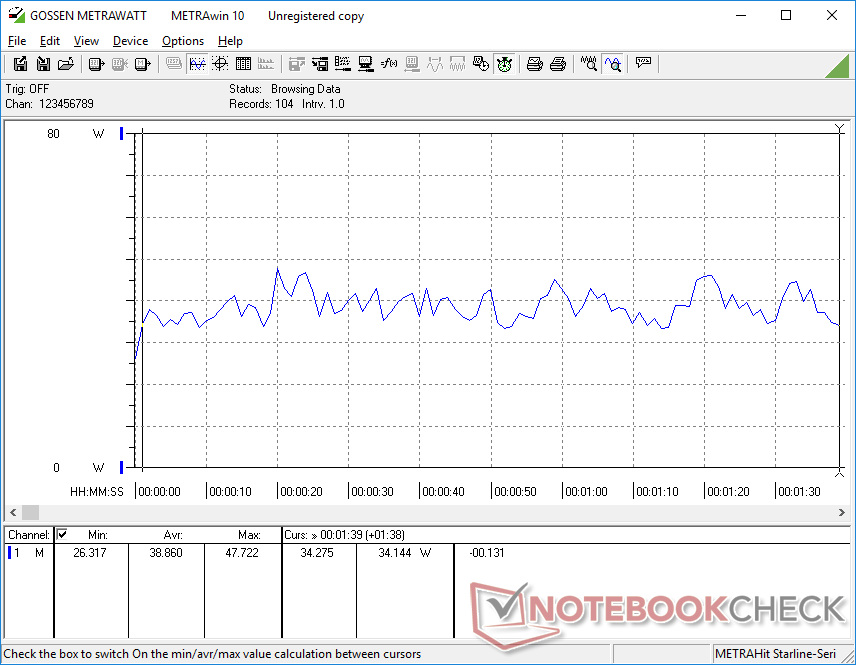
Power Consumption
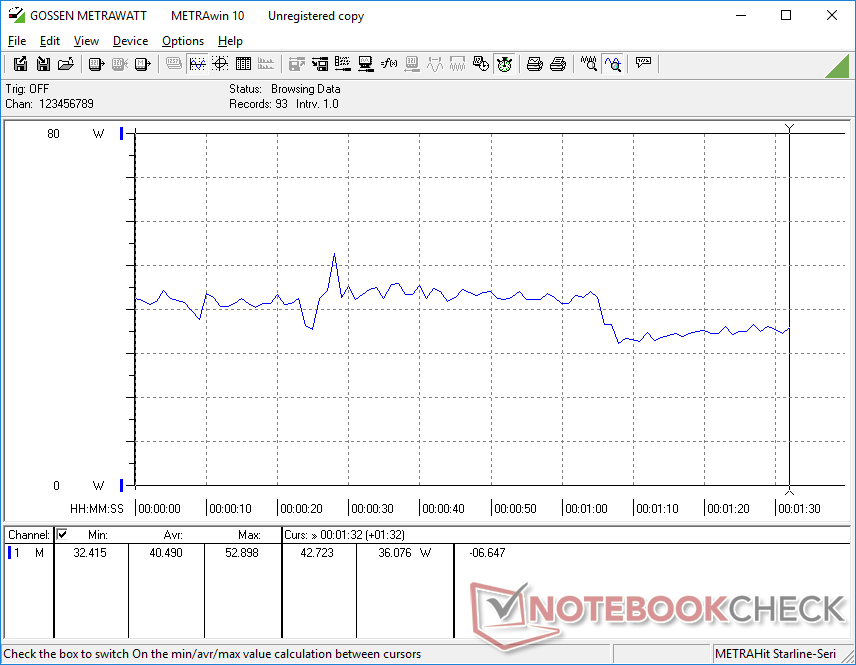
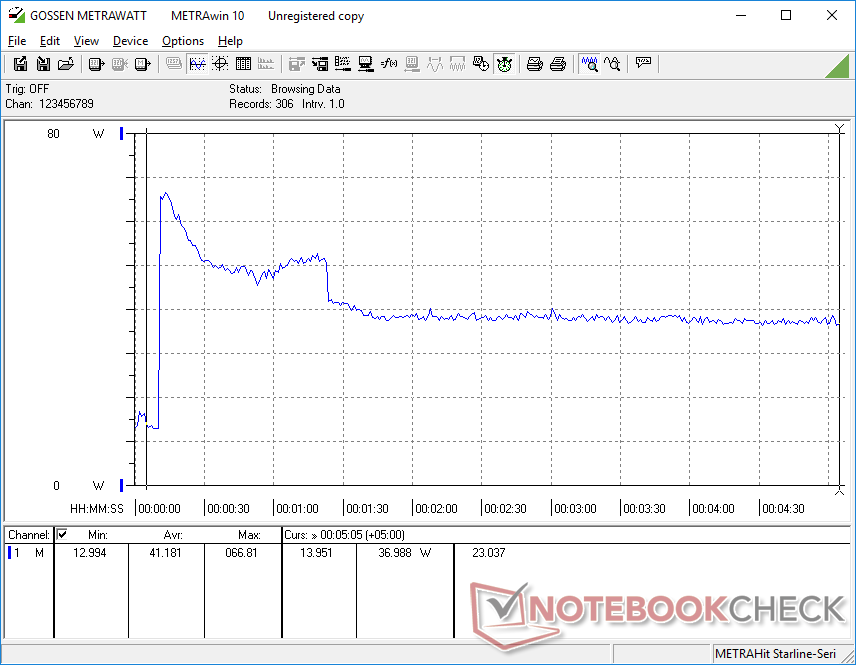
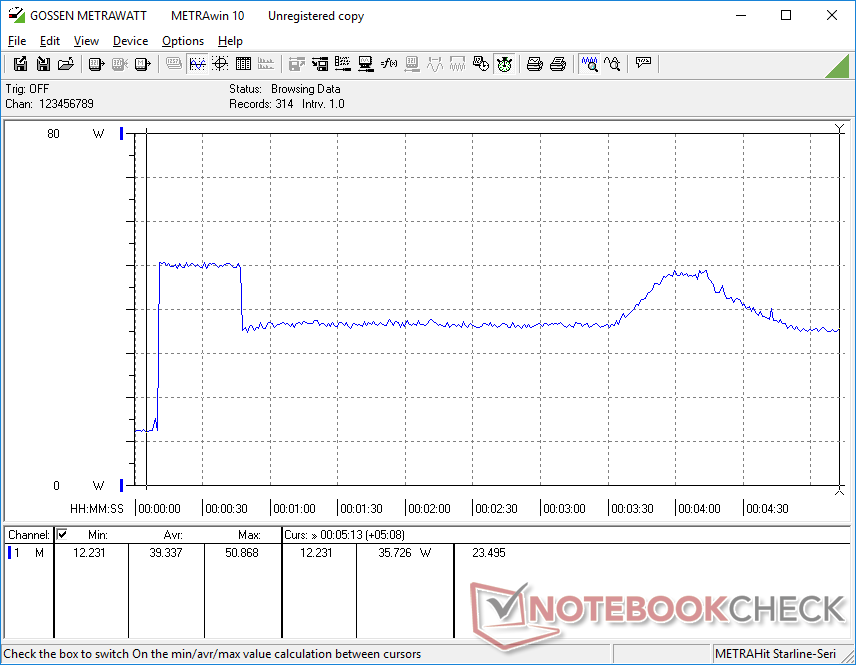
Idling on desktop consumes between 5 W and 9 W to be more than what we recorded on the Spectre x360 14 or 2019 Spectre x360 13 due to the more demanding 4K OLED panel on our 2021 version. We've already proven that laptops with OLED will typically consume more than their IPS counterparts especially when their displays are set to bright white colors and this Spectre is no exception. If you want to extend battery life, then we recommend using darker color themes. In fact, the system comes pre-configured to run Windows 10 on dark mode for this exact reason.
Power consumption is otherwise close to the Spectre x360 14 at about 40 W on average when running higher loads like games. The 2019 Spectre x360 13 would consume even less lower, but it also throttled more heavily in the process.
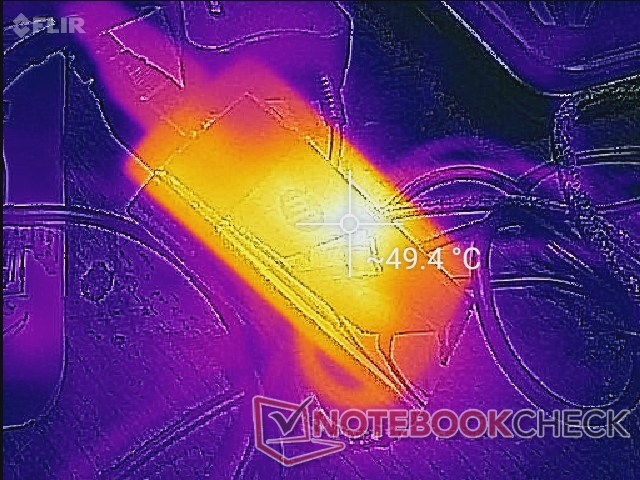
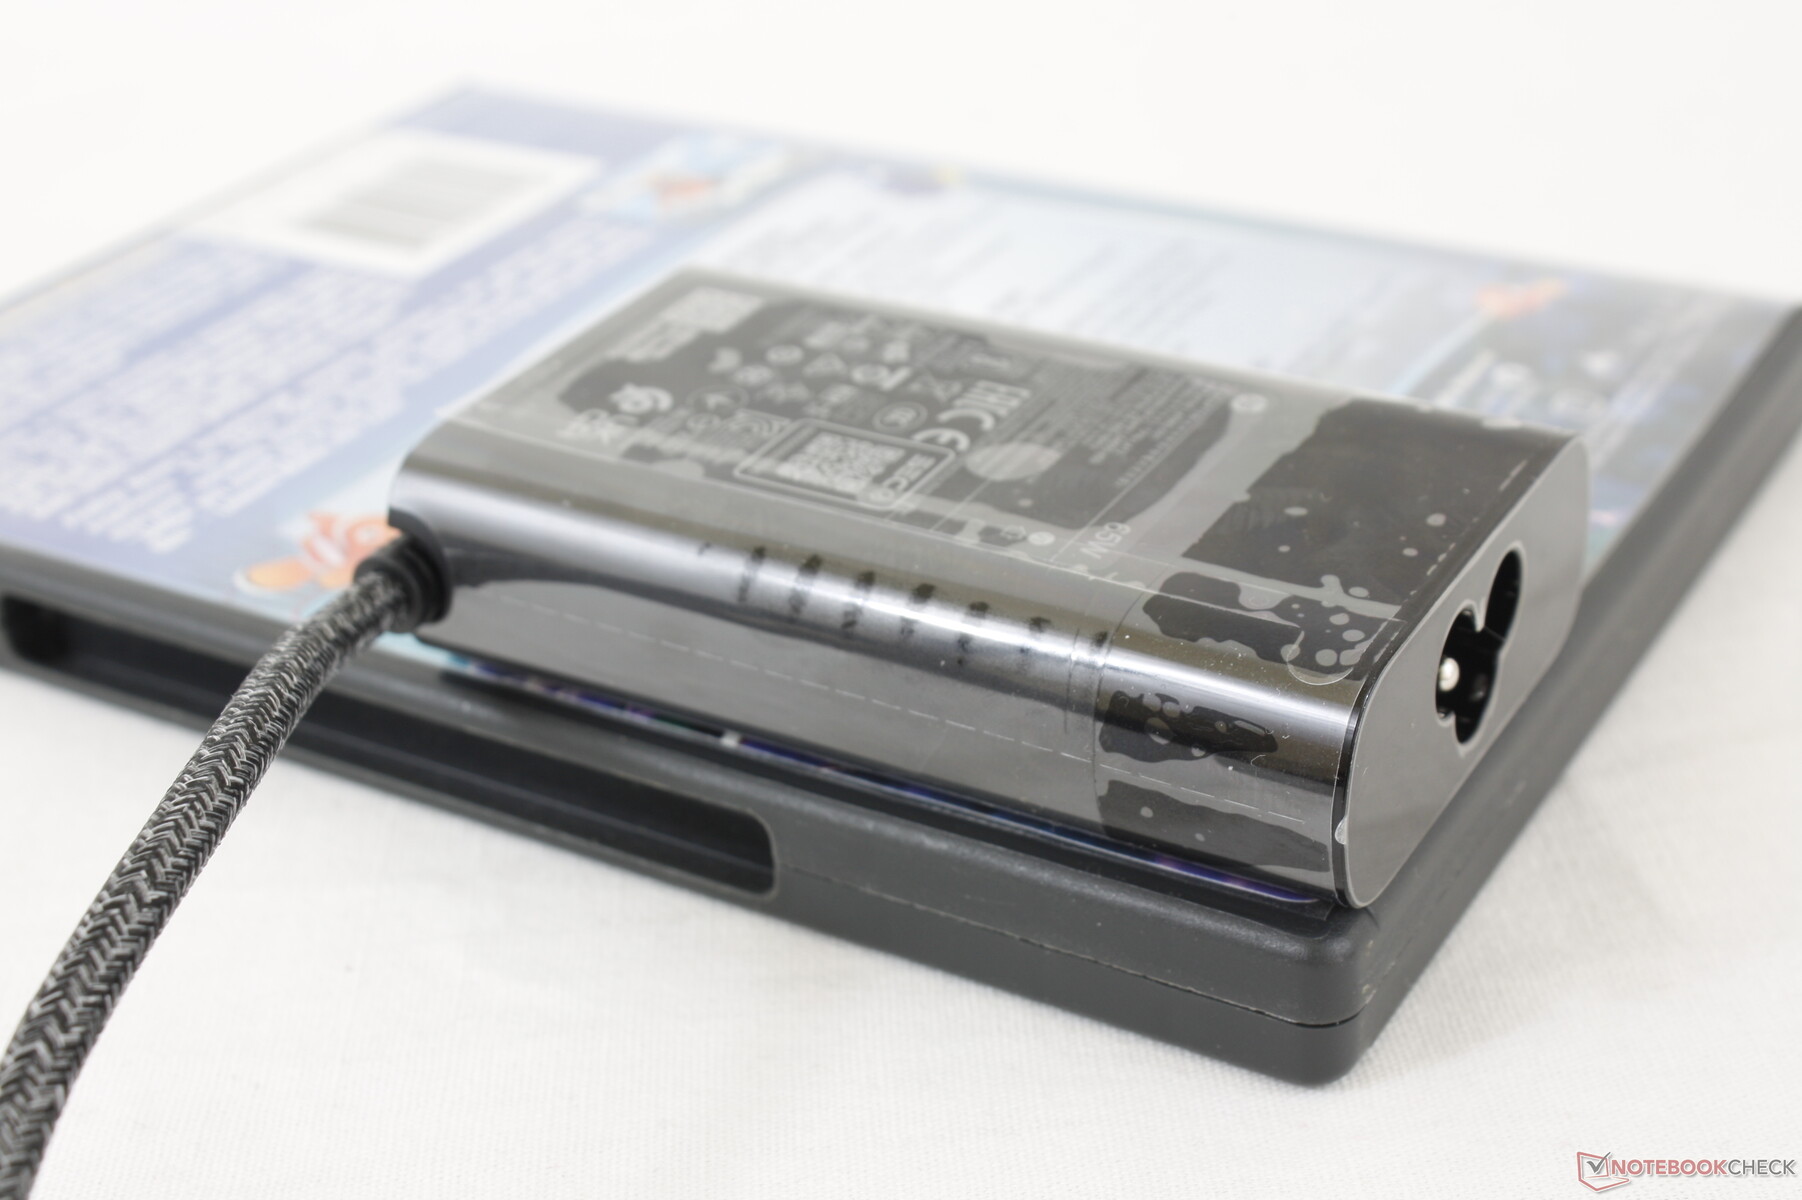
We're able to record a maximum draw of 66.9 W from the small (~8.8 x 5.4 x 2.2 cm) 65 W AC adapter. This rate is only temporary due to the limited Turbo Boost potential of the system.
| Off / Standby | |
| Idle | |
| Load |
|
Key:
min: | |
| HP Spectre x360 13-aw2003dx i5-1135G7, Iris Xe G7 80EUs, Intel Optane Memory H10 with Solid State Storage 32GB + 512GB HBRPEKNX0202A(L/H), OLED, 3840x2160, 13.3" | HP Spectre x360 14t-ea000 i7-1165G7, Iris Xe G7 96EUs, Samsung SSD PM981a MZVLB512HBJQ, IPS, 1920x1280, 13.5" | HP Spectre x360 13-aw0013dx i7-1065G7, Iris Plus Graphics G7 (Ice Lake 64 EU), Intel Optane Memory H10 with Solid State Storage 32GB + 512GB HBRPEKNX0202A(L/H), IPS, 1920x1080, 13.3" | Dell XPS 13 7390 Core i7-10710U i7-10710U, UHD Graphics 620, SK Hynix PC601 NVMe 512 GB, IPS, 3840x2160, 13.3" | MSI Summit E13 Flip Evo A11MT i7-1185G7, Iris Xe G7 96EUs, Phison 1TB SM2801T24GKBB4S-E162, IPS, 1920x1200, 13.4" | Lenovo Yoga Duet 7 13IML05-82AS000WGE i5-10210U, UHD Graphics 620, Lenovo UMIS RPJTJ256MEE1OWX, IPS, 2160x1350, 13" | |
|---|---|---|---|---|---|---|
| Power Consumption | 22% | 24% | 7% | -5% | 38% | |
| Idle Minimum * (Watt) | 5.7 | 3 47% | 3.9 32% | 4.7 18% | 4.8 16% | 3.1 46% |
| Idle Average * (Watt) | 8.4 | 5.1 39% | 6.3 25% | 8.3 1% | 8.4 -0% | 5.7 32% |
| Idle Maximum * (Watt) | 8.8 | 6.4 27% | 6.8 23% | 9 -2% | 8.6 2% | 8.7 1% |
| Load Average * (Watt) | 38.9 | 39.6 -2% | 32.6 16% | 42 -8% | 47.1 -21% | 20.5 47% |
| Witcher 3 ultra * (Watt) | 40.5 | 39.6 2% | 25.6 37% | 51.6 -27% | ||
| Load Maximum * (Watt) | 66.9 | 56.2 16% | 59 12% | 49 27% | 65.9 1% | 22.6 66% |
* ... smaller is better
Battery Life
Runtimes are significantly shorter than we recorded on the 2019 IPS model. Idling on Power Saver mode at the minimum brightness setting would last just 12 hours compared to 36 hours on the older model. Similarly, browsing the web on Balanced mode at 150 nit brightness would last for just 6 hours and 10 hours on the 2021 model and 2019 model, respectively. The price to pay for 4K OLED can be quite high if you don't have frequent access to electrical outlets.
Charging from empty to full capacity takes about 1.5 to 2 hours. Note that this same USB-C charger can also be used to recharge most other laptops with USB-C Power Delivery.
| HP Spectre x360 13-aw2003dx i5-1135G7, Iris Xe G7 80EUs, 60 Wh | HP Spectre x360 14t-ea000 i7-1165G7, Iris Xe G7 96EUs, 66 Wh | HP Spectre x360 13-aw0013dx i7-1065G7, Iris Plus Graphics G7 (Ice Lake 64 EU), 60 Wh | Dell XPS 13 7390 Core i7-10710U i7-10710U, UHD Graphics 620, 52 Wh | MSI Summit E13 Flip Evo A11MT i7-1185G7, Iris Xe G7 96EUs, 70 Wh | Lenovo Yoga Duet 7 13IML05-82AS000WGE i5-10210U, UHD Graphics 620, 39 Wh | |
|---|---|---|---|---|---|---|
| Battery runtime | 111% | 108% | 38% | 54% | 13% | |
| Reader / Idle (h) | 11.9 | 36.4 206% | 37.1 212% | 21.1 77% | 12.8 8% | |
| WiFi v1.3 (h) | 6.1 | 11.8 93% | 9.9 62% | 8.4 38% | 11.2 84% | 8.7 43% |
| Load (h) | 1.8 | 2.4 33% | 2.7 50% | 1.8 0% | 1.6 -11% |
Pros
Cons
Verdict
The biggest reason for choosing the Spectre x360 13 with 11th gen Intel instead of the older Spectre x360 13 with 10th gen Intel is its increase in graphics performance. The 60 to 100 percent jump over the Iris Plus G7 in the 2019 Spectre x360 13 is significant enough to be noticeable for editors and light gamers.
Users not interested in the benefits of Iris Xe may want to consider the Spectre x360 13 with 10th gen Intel instead. The money saved can go towards more RAM and storage rather than 4K OLED.
If your daily tasks involve mostly 4K video streaming, browsing, and the occasional editing, then the 11th gen model will offer very little over the 10th gen model as practically everything else about the two laptops remain identical. Disappointingly, the 11th gen model comes with Wi-Fi 6 instead of Wi-Fi 6E, PCIe 3.0 instead of PCIe 4.0, Thunderbolt 3 instead of Thunderbolt 4, and no changes to RAM performance over last year's model.
The OLED panel is also somewhat disappointing when compared to the typical 1080p or 4K IPS panels on other Spectre models. Battery life is shorter, the display is dimmer, image quality appears grainier, and pulse-width modulation (or flickering) is present. Users get deeper colors, higher contrast, higher native resolution, and faster response times in return, of course, but the notable disadvantages stick out like a sore thumb.
Price and availability
HP Spectre x360 13-aw2003dx
- 08/31/2022 v7 (old)
Allen Ngo
Price comparison
