 Deutsch
 English
 Español
 Français
 Italiano
 Nederlands
 Polski
 Português
 Русский
 Türkçe
 Svenska
 Chinese
 Magyar
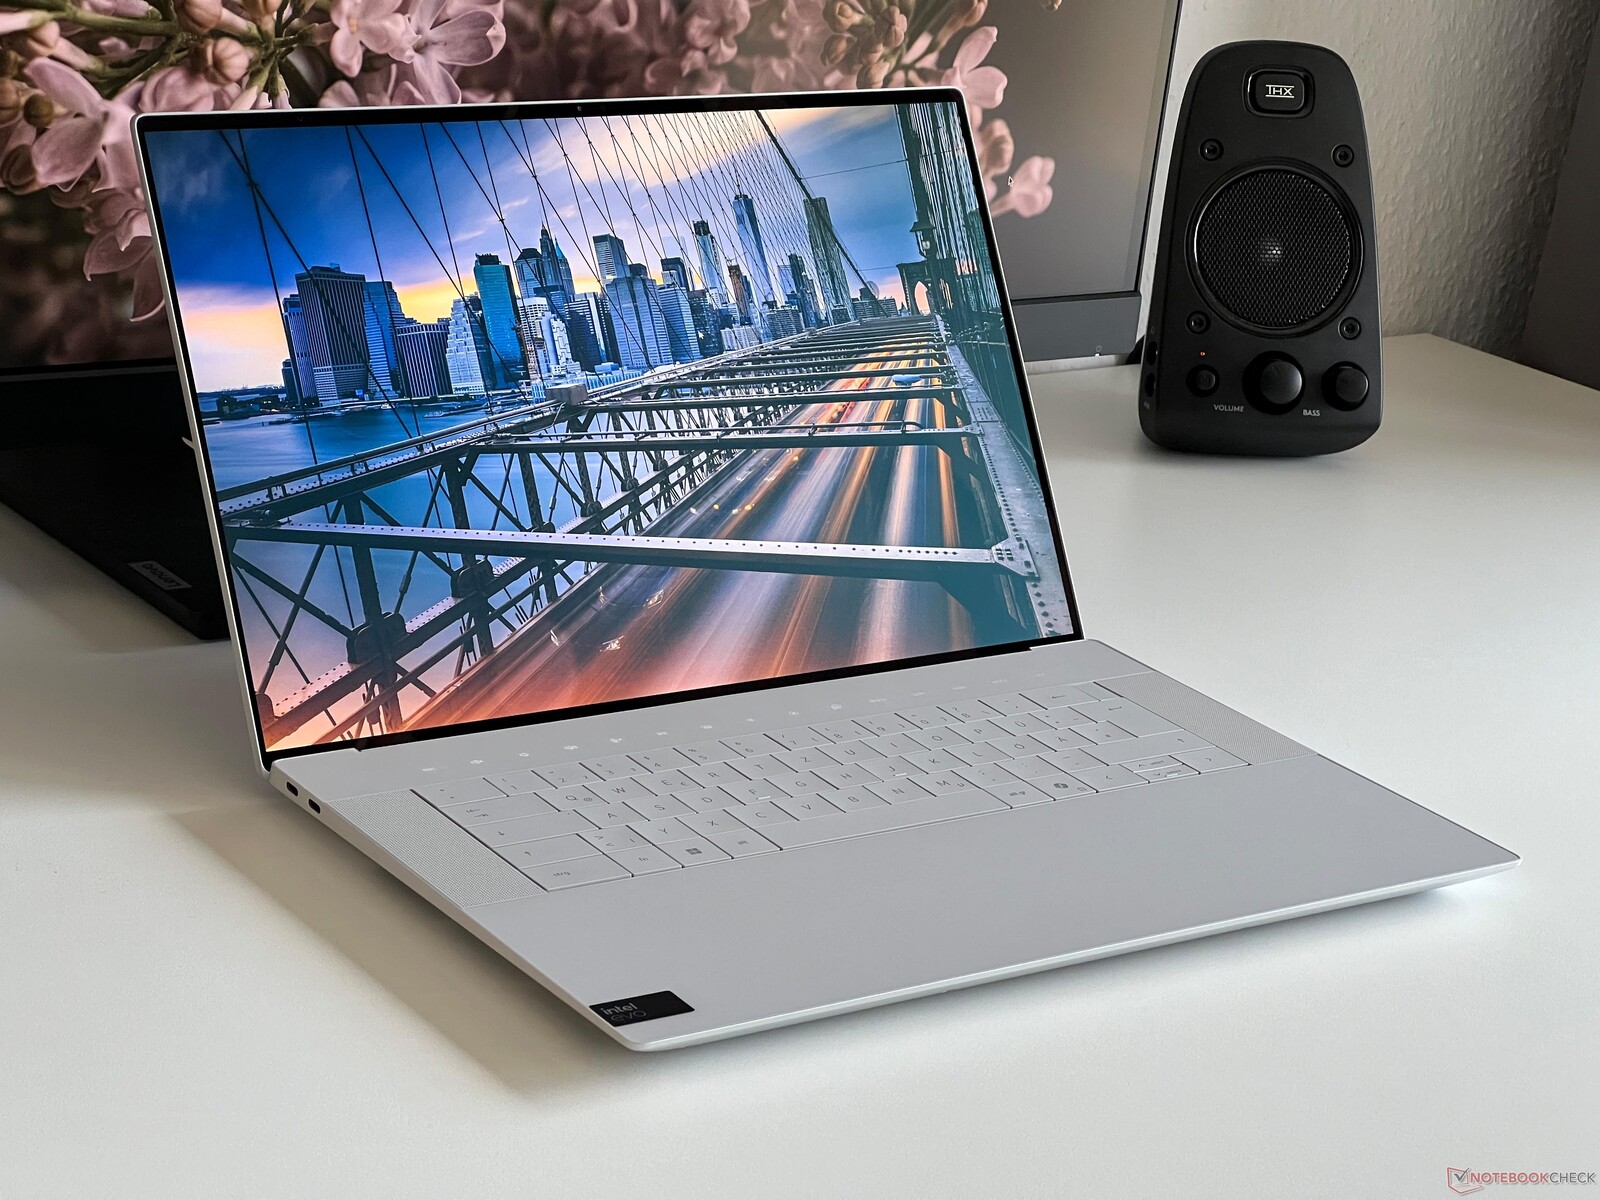
Dell XPS 16 9640 review - The multimedia laptop with 4K OLED and an annoying touch bar
Dell has replaced its well-known multimedia laptop, the XPS 15, with two new models: Firstly, the more compact XPS 14 which we already tested thoroughly—and its concept revealed quite a few questions for us. Today, we will be taking a look at the larger 16-inch model, namely the XPS 16. In general, its recipe is identical and aside from the new Meteor Lake processors from Intel, it makes use of dedicated graphics cards from Nvidia—but this time also the more powerful models up to the RTX 4070 Laptop. There are some additional differences, all of which we will be discussing in more detail during the course of this review.
Our test device is a well-equipped configuration featuring the Core Ultra 7 155H, the RTX 4070 Laptop, 32 GB RAM, a 1-TB SSD as well as a high-resolution OLED touchscreen for US$2,899. As a result, the XPS 16 competes with other high-quality multimedia laptops and gaming/multimedia hybrids such as the ROG Zephyrus G16.
Possible competitors compared
Rating | Date | Model | Weight | Height | Size | Resolution | Best Price |
|---|---|---|---|---|---|---|---|
| 88.6 % | 04/2024 | Dell XPS 16 9640 Ultra 7 155H, NVIDIA GeForce RTX 4070 Laptop GPU | 2.3 kg | 18.7 mm | 16.30" | 3840x2400 | |
| 90.4 % | 03/2024 | Samsung Galaxy Book4 Ultra Ultra 7 155H, NVIDIA GeForce RTX 4050 Laptop GPU | 1.8 kg | 17 mm | 16.00" | 2880x1800 | |
| 90 % | 03/2024 | Honor MagicBook Pro 16 2024 Ultra 7 155H, NVIDIA GeForce RTX 4060 Laptop GPU | 1.9 kg | 17.9 mm | 16.00" | 3072x1920 | |
| 92.3 % | 02/2024 | Asus ROG Zephyrus G16 2024 GU605M Ultra 7 155H, NVIDIA GeForce RTX 4070 Laptop GPU | 1.8 kg | 16.4 mm | 16.00" | 2560x1600 | |
| 88.4 % | 08/2023 | Lenovo Yoga Pro 9 16-IRP G8 i7-13705H, NVIDIA GeForce RTX 4060 Laptop GPU | 2.2 kg | 18.2 mm | 16.00" | 3200x2000 | |
| 88.6 % | 07/2023 | SCHENKER VISION 16 Pro (M23) i7-13700H, NVIDIA GeForce RTX 4070 Laptop GPU | 1.6 kg | 17.1 mm | 16.00" | 2560x1600 | |
| 90.3 % | 04/2023 | Dell XPS 15 9530 RTX 4070 i7-13700H, NVIDIA GeForce RTX 4070 Laptop GPU | 1.9 kg | 18 mm | 15.60" | 3456x2160 |
Case - Stable aluminum case
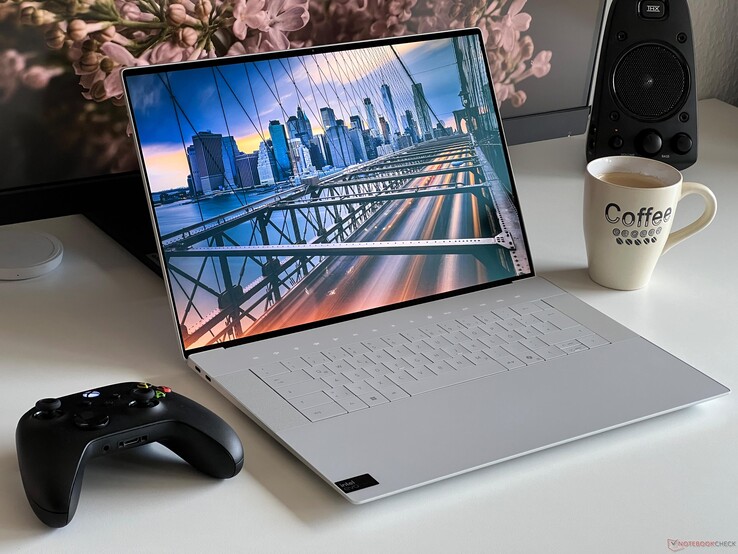
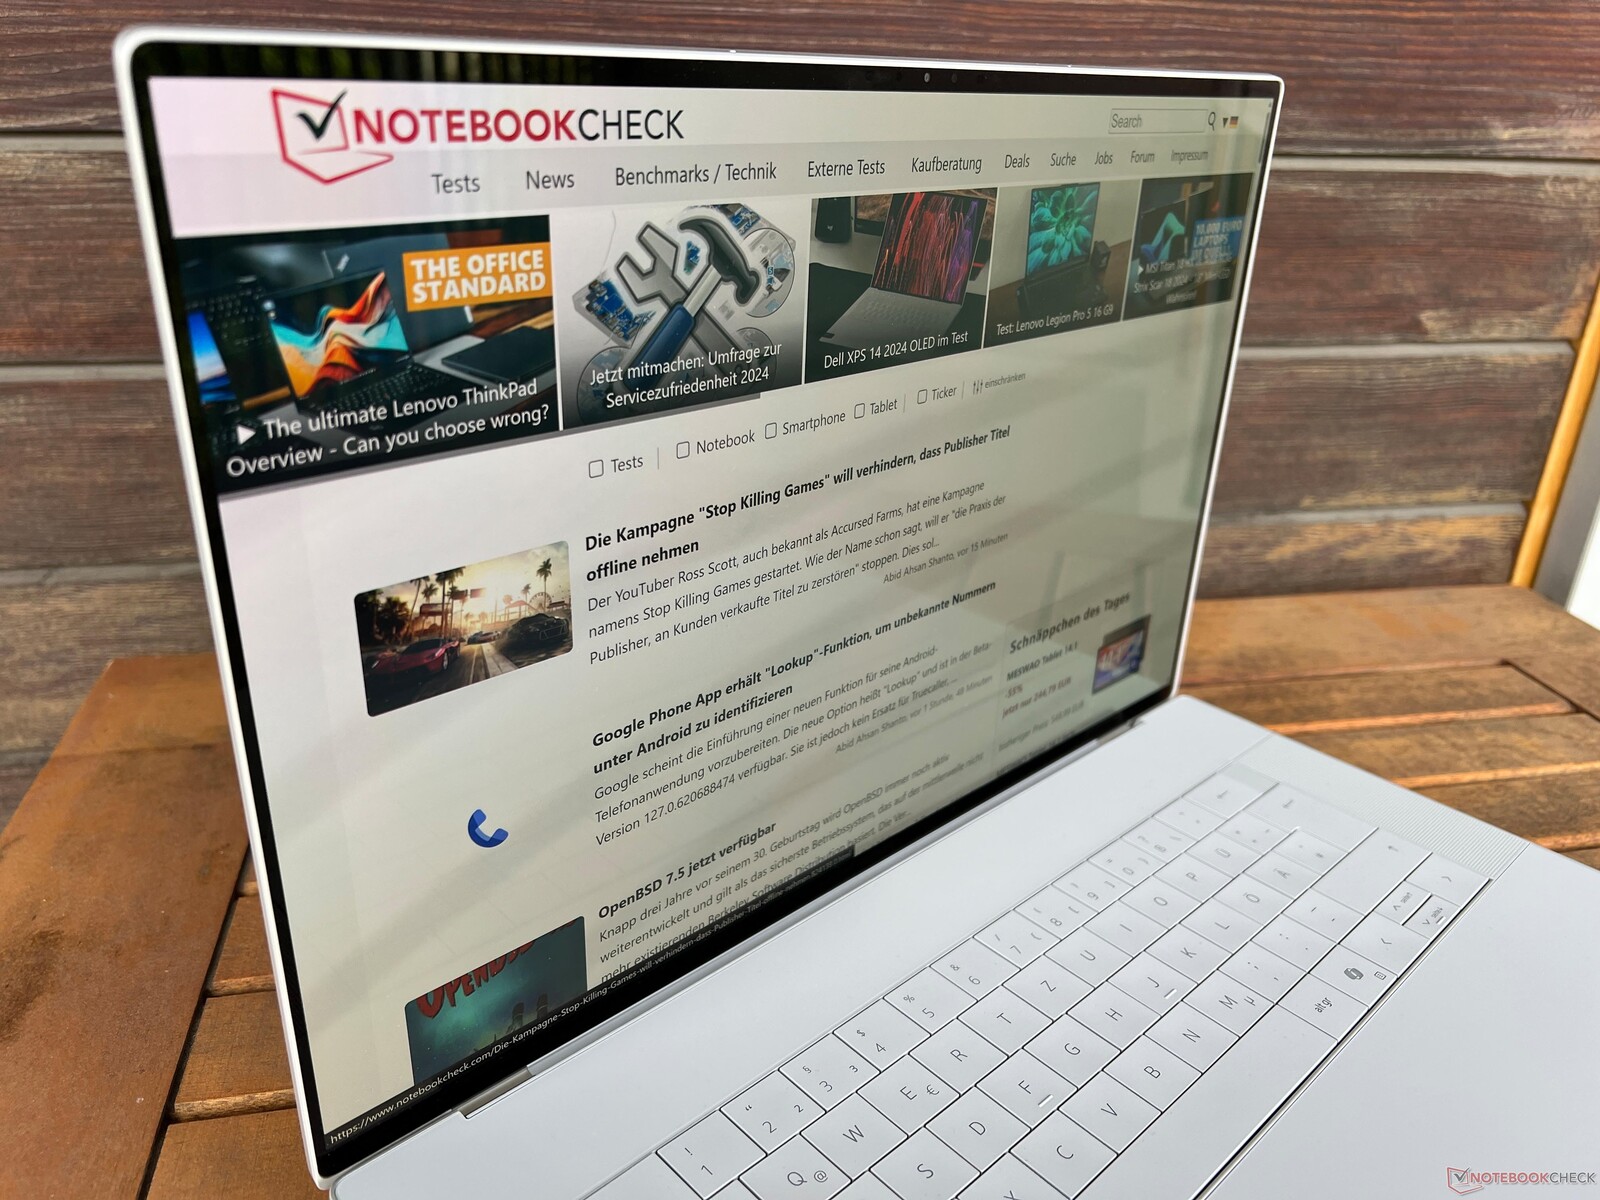
Dell has used the same basic design for all three variants of the current XPS series, with it taking inspiration from the XPS 13 Plus and its large, continuous glass palm rest and unusual keyboard including a touch bar. The design is attractive and aside from our light version, Dell also offers a dark-gray version of the laptop. Its bezels are slim on all four sides, resulting in a modern appearance. Due to its larger footprint, the XPS 16 doesn't look nearly as bulky as the smaller XPS 14.

The case is very sturdy and it is generally built very well, however, we noted a small defect between the two USB-C ports on the left-hand side of our test device. The screen is also very stable and the lid only bounces slightly when the opening angle is adjusted (max. 135 degrees). However, due to the shape of the front edge, it is difficult to open the lid with just one hand.

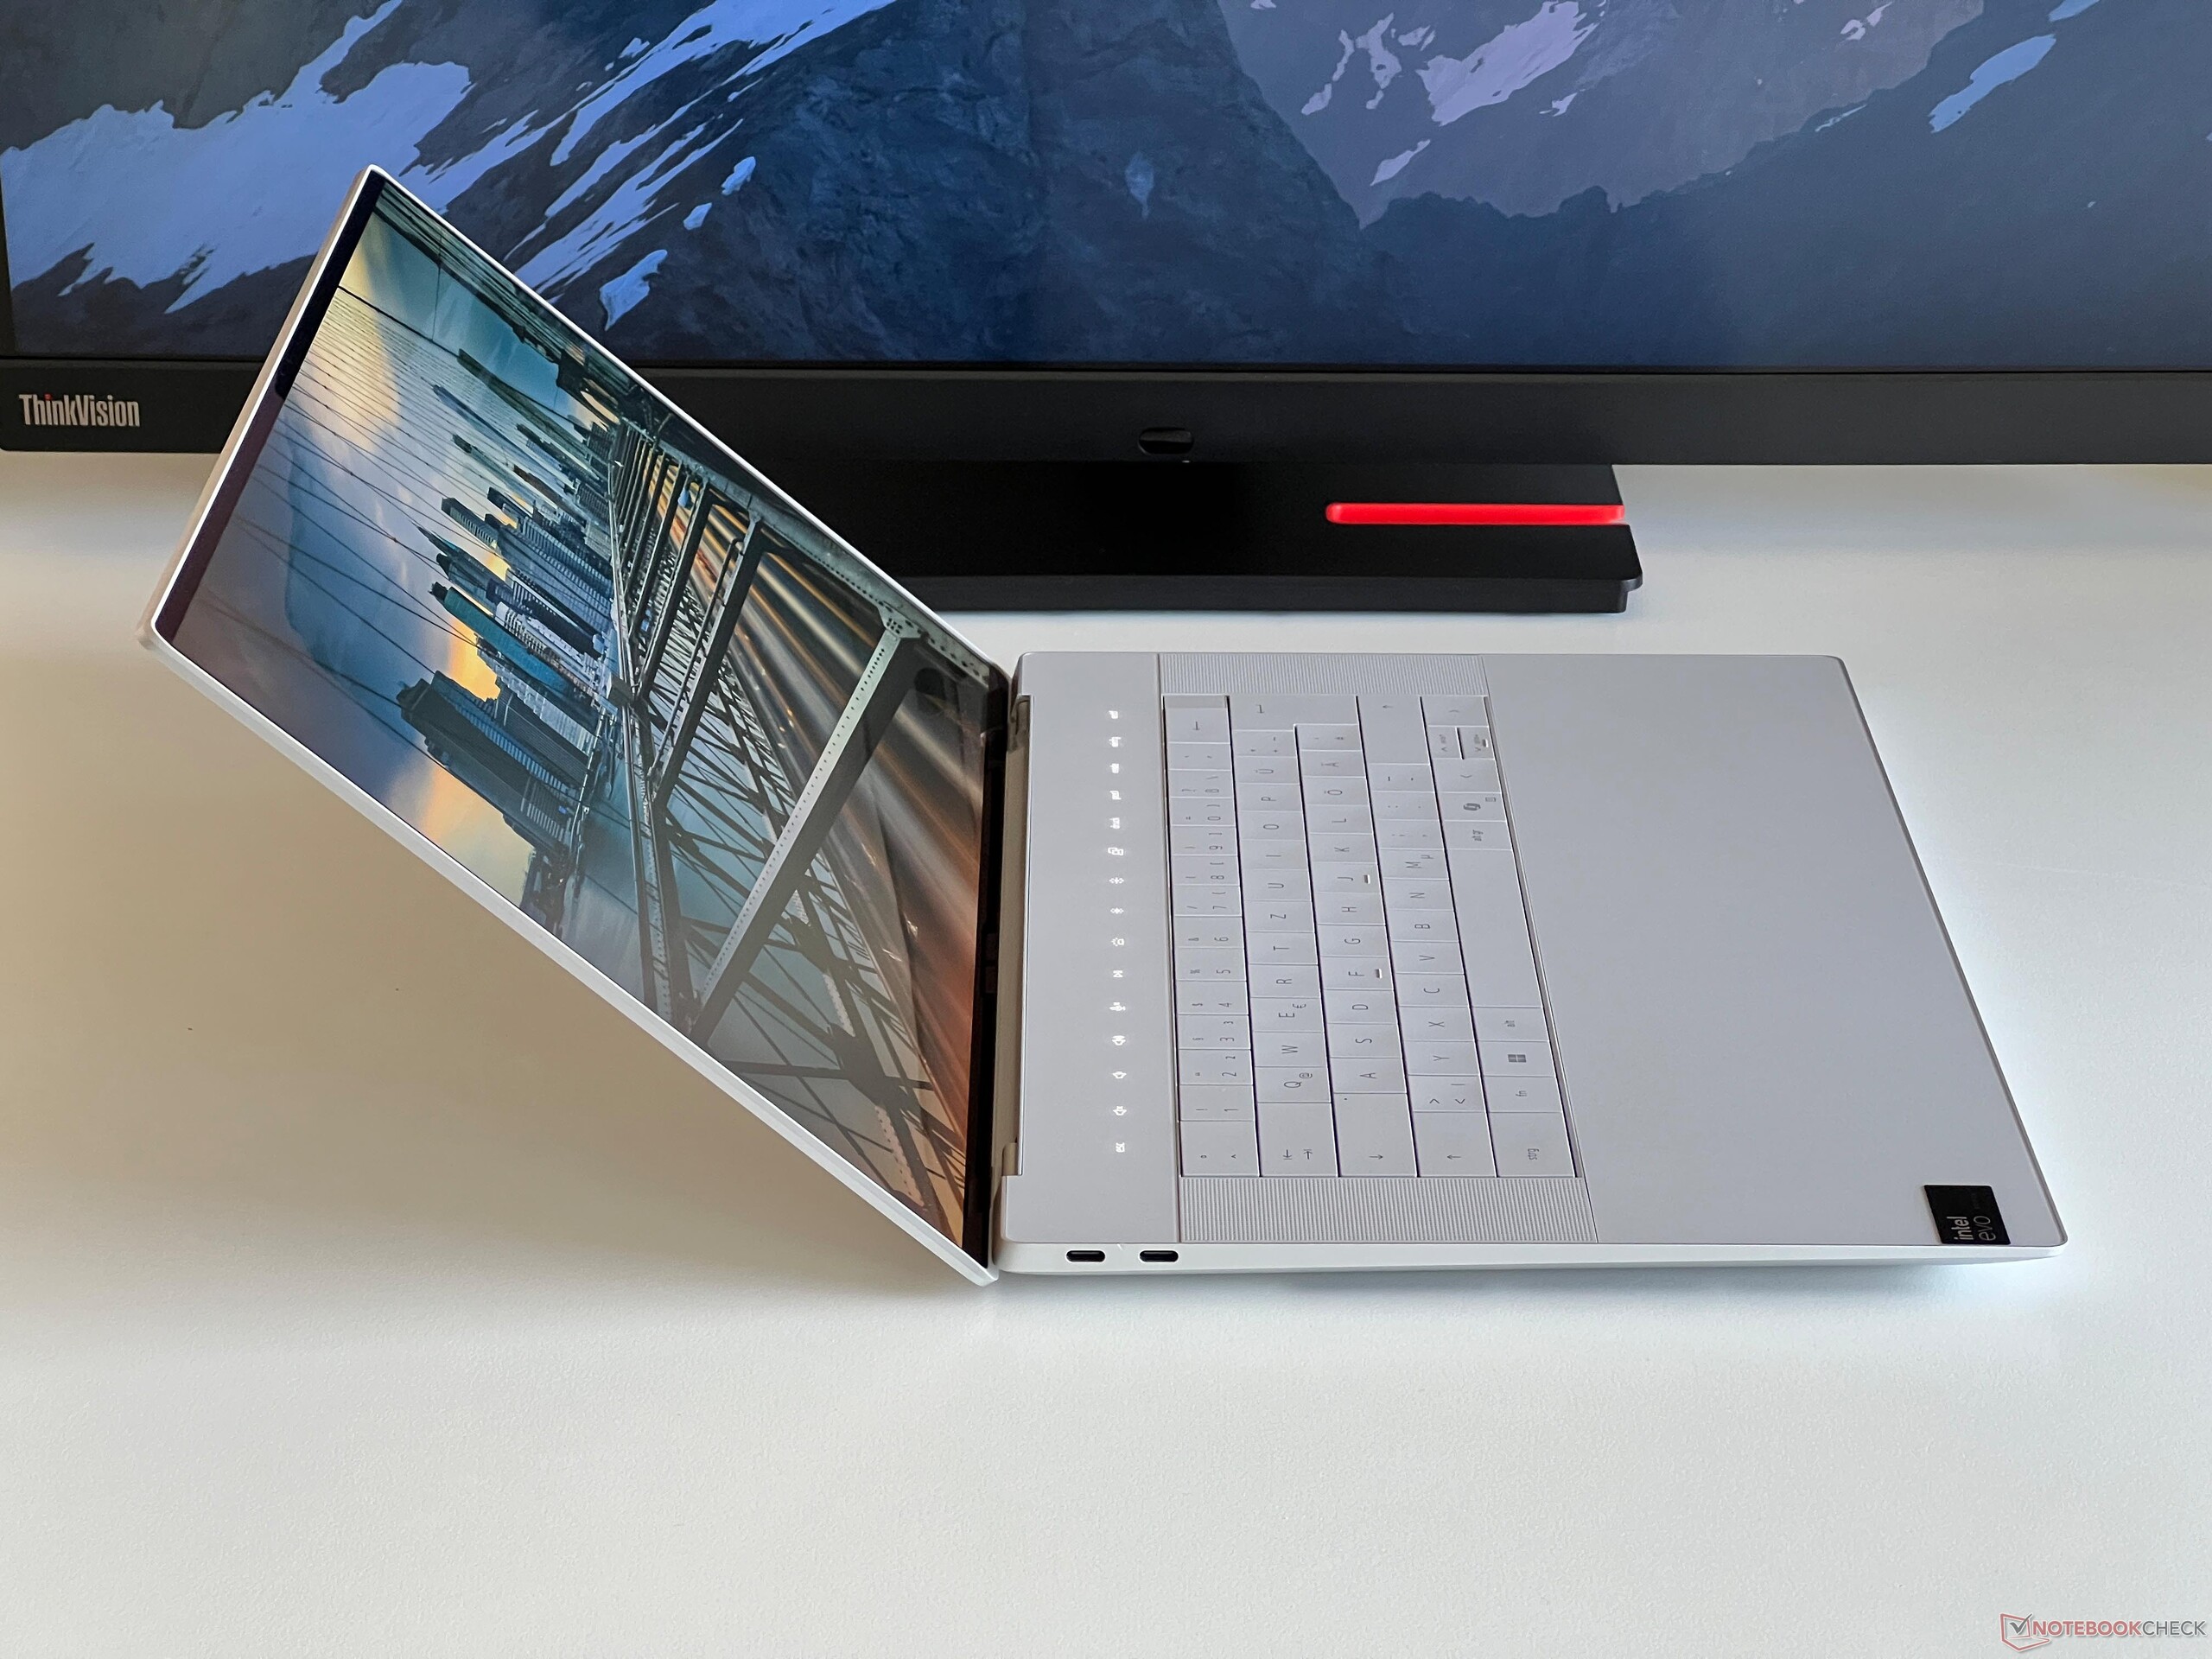


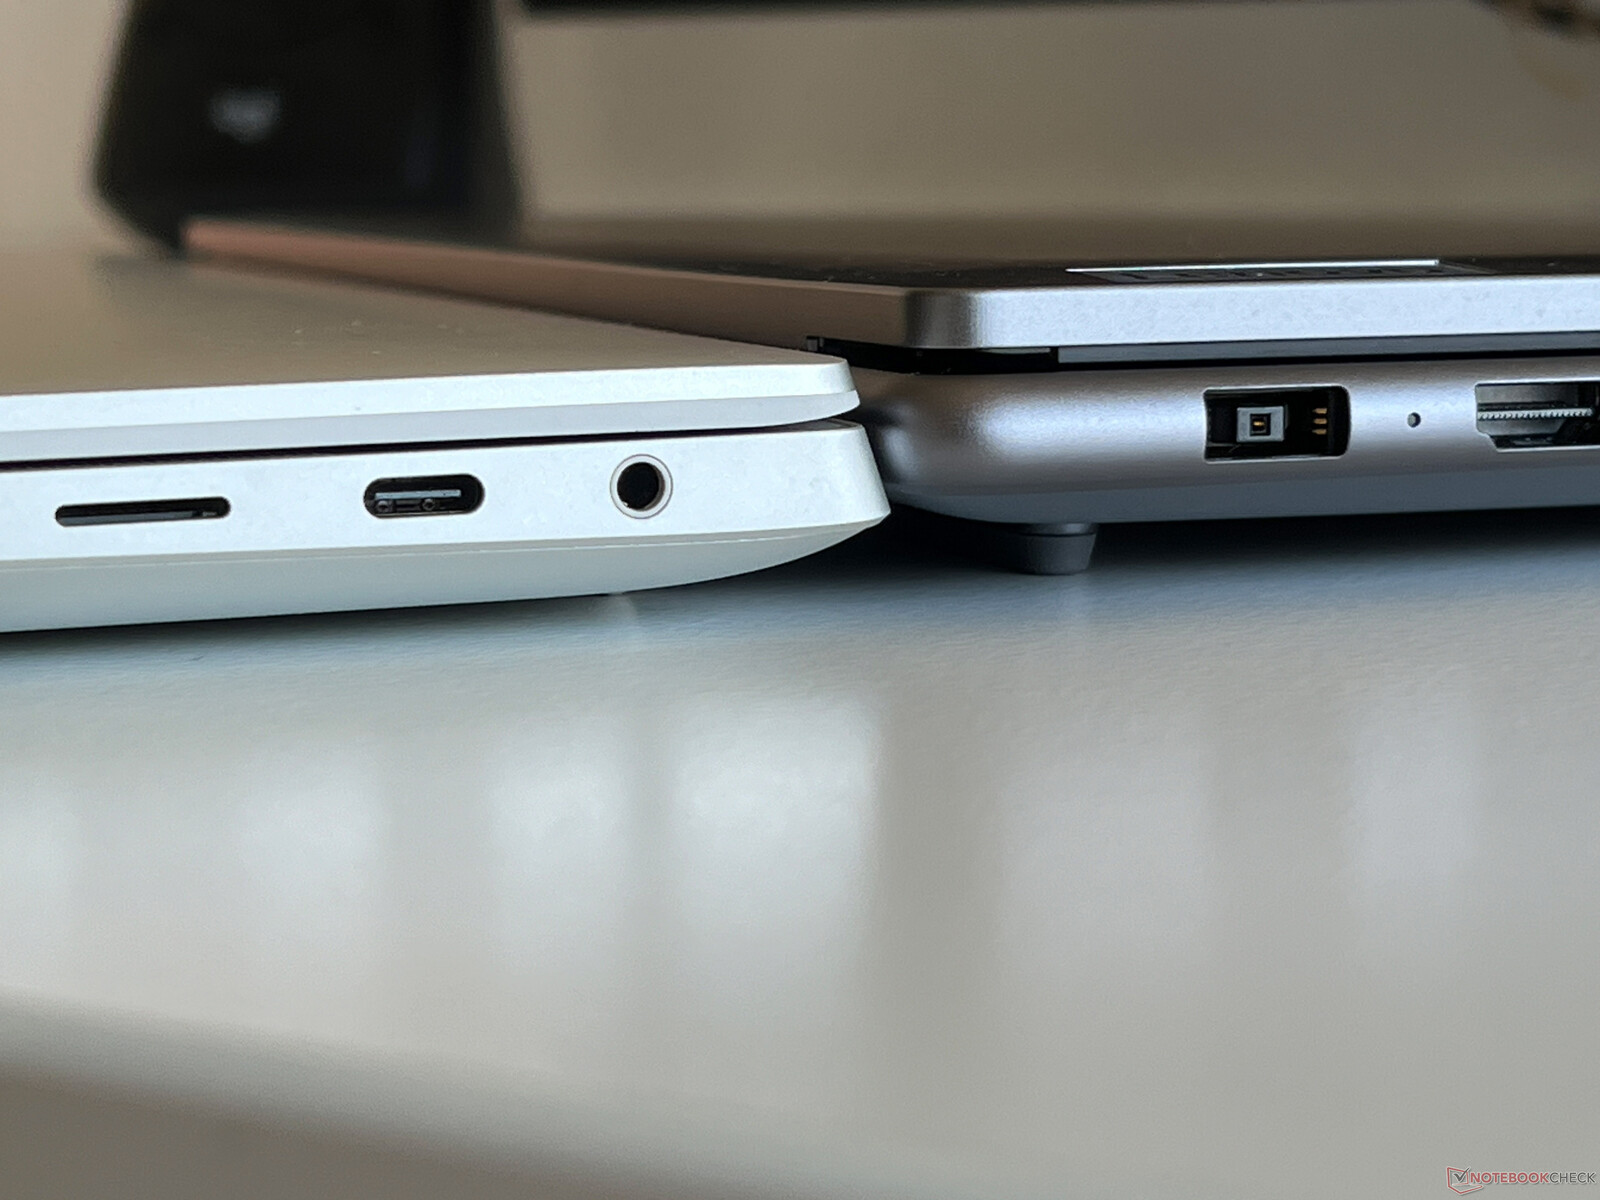
As already mentioned, the new design of the 16-inch model looks nicer than the XPS 14 and there are no major differences compared to the competition, especially in terms of its footprint and the thickness of its case. Compared to the current Yoga Pro 9 16 2024 (see comparison pictures below), the XPS benefits from slimmer bezels. However, at 2.313 kg, the XPS 16 is still the heaviest device in our comparison group.


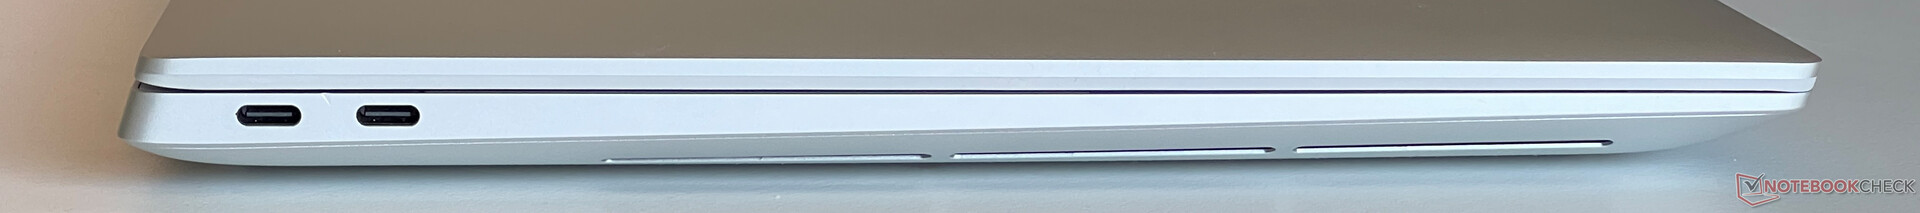
Connectivity - The fastest XPS 16 only with 2x Thunderbolt 4
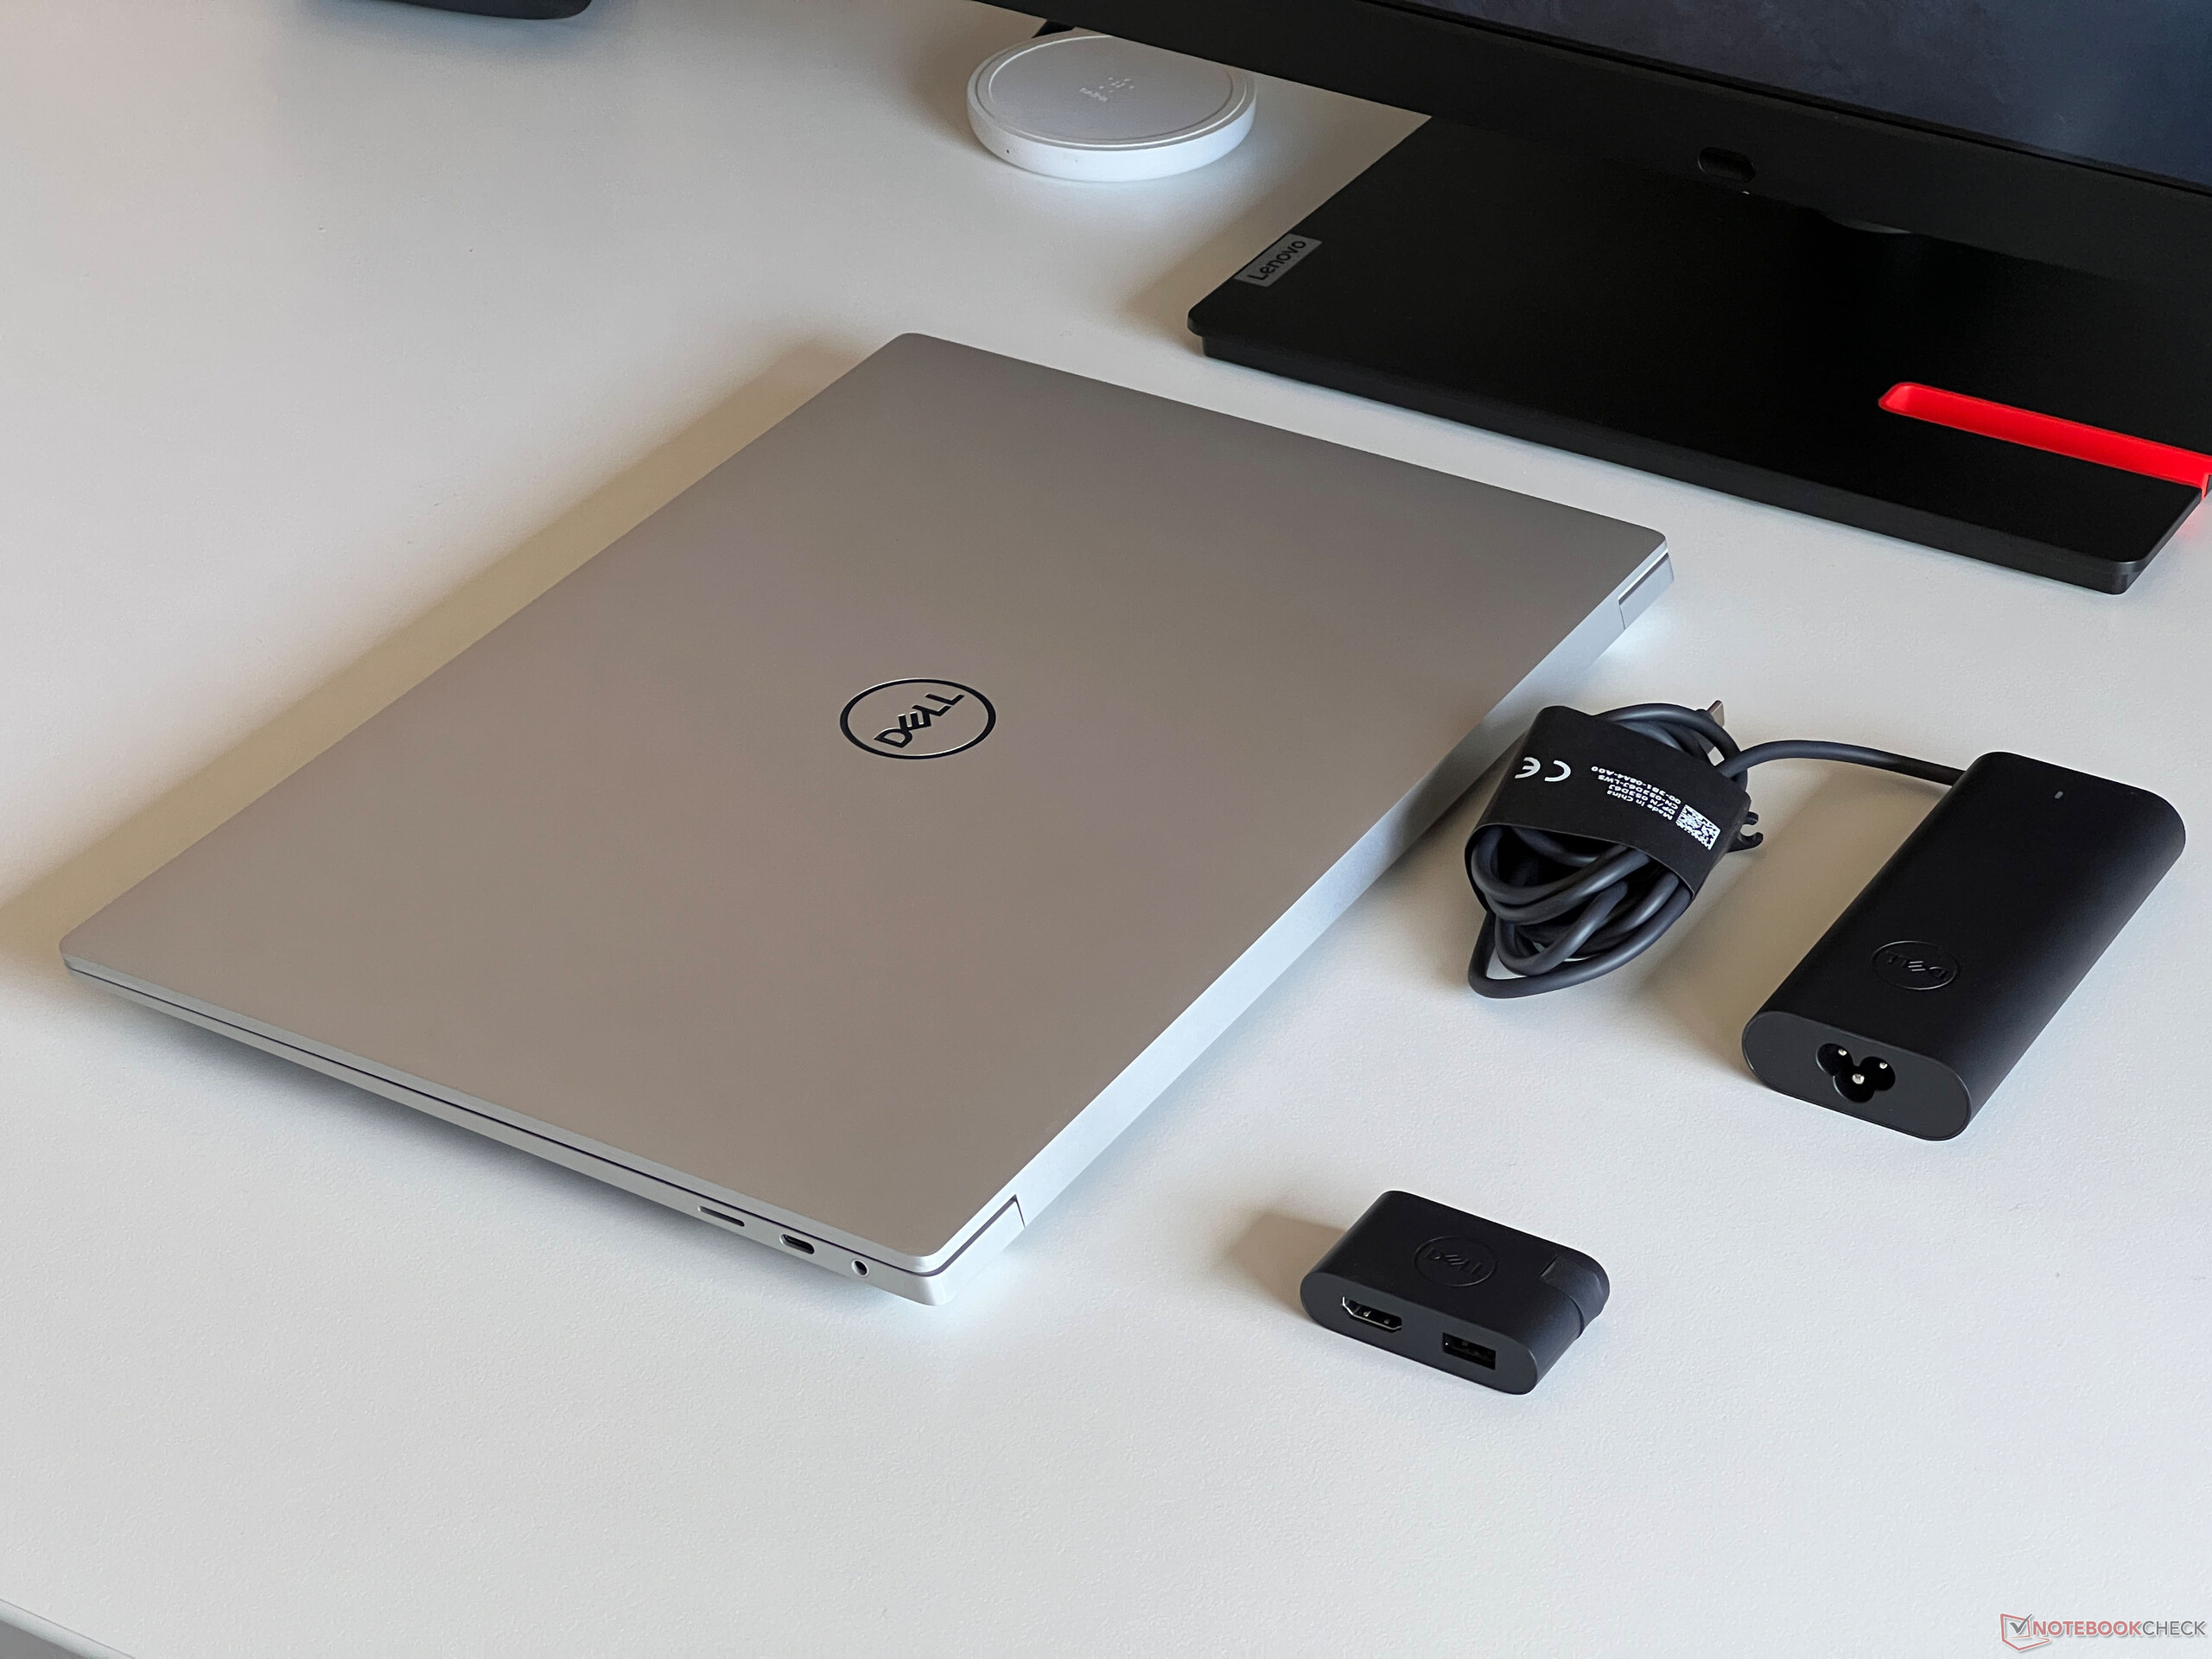
The XPS 16 features the same connectivity options as the smaller XPS 14, with Dell leaving the additional space unused. There are a total of 3x USB-C ports and a card reader—and that's it. To make matters worse, only the two ports on the left-hand side of models featuring the fast RTX 4070 laptop support Thunderbolt 4, while only USB-C 3.2 Gen 2 is supported on the right-hand side. In contrast, all three ports on the slower variants support Thunderbolt 4. Additionally, all USB-C outputs are connected via the iGPU. The scope of delivery also includes a small docking station with a USB-A port and an HDMI output.
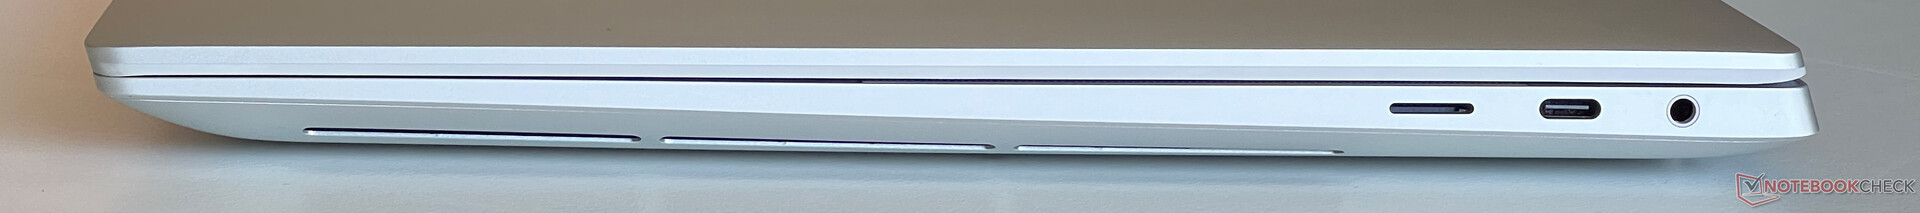
SD card reader
The microSD card reader (spring mechanism) is located on the right-hand side of the device and it takes in the compact memory cards almost completely. In conjunction with our reference card (Angelbird AV Pro V60), its transfer rates reached a maximum of around 204 MB/s and when copying image files, we measured a good 148 MB/s.
| SD Card Reader | |
| average JPG Copy Test (av. of 3 runs) | |
| Dell XPS 15 9530 RTX 4070 (Toshiba Exceria Pro SDXC 64 GB UHS-II) | |
| Dell XPS 16 9640 (Angelbird AV Pro V60) | |
| Average of class Multimedia (17.6 - 205, n=65, last 2 years) | |
| Samsung Galaxy Book4 Ultra (Angelbird AV Pro V60) | |
| Asus ROG Zephyrus G16 2024 GU605M | |
| Lenovo Yoga Pro 9 16-IRP G8 (Angelibird AV Pro V60) | |
| SCHENKER VISION 16 Pro (M23) (Angelbird AV Pro V60) | |
| maximum AS SSD Seq Read Test (1GB) | |
| Dell XPS 16 9640 (Angelbird AV Pro V60) | |
| Dell XPS 15 9530 RTX 4070 (Toshiba Exceria Pro SDXC 64 GB UHS-II) | |
| Average of class Multimedia (16.8 - 266, n=61, last 2 years) | |
| Asus ROG Zephyrus G16 2024 GU605M | |
| Samsung Galaxy Book4 Ultra (Angelbird AV Pro V60) | |
| Lenovo Yoga Pro 9 16-IRP G8 (Angelibird AV Pro V60) | |
| SCHENKER VISION 16 Pro (M23) (Angelbird AV Pro V60) | |
Communication
In contrast to the smaller XPS 14, Dell has installed a Wi-Fi-7 module from Intel into the XPS 16. It also supports Bluetooth 5.4. We cannot yet test its Wi-Fi 7 performance, but in combination with our reference router from Asus, its performance was a little worse than, for example, the XPS 14 with its Wi-Fi 6E module. Even so, you shouldn't notice any limitations and during the course of our test, we noted no connection issues whatsoever.
| Networking | |
| Dell XPS 16 9640 | |
| iperf3 transmit AXE11000 |
|
| iperf3 receive AXE11000 |
|
| Samsung Galaxy Book4 Ultra | |
| iperf3 transmit AXE11000 |
|
| iperf3 receive AXE11000 |
|
| Honor MagicBook Pro 16 2024 | |
| iperf3 transmit AXE11000 |
|
| iperf3 receive AXE11000 |
|
| Asus ROG Zephyrus G16 2024 GU605M | |
| iperf3 transmit AXE11000 |
|
| iperf3 receive AXE11000 |
|
| Lenovo Yoga Pro 9 16-IRP G8 | |
| iperf3 transmit AXE11000 |
|
| iperf3 receive AXE11000 |
|
| SCHENKER VISION 16 Pro (M23) | |
| iperf3 transmit AXE11000 |
|
| iperf3 receive AXE11000 |
|
| Dell XPS 15 9530 RTX 4070 | |
| iperf3 transmit AXE11000 |
|
| iperf3 receive AXE11000 |
|
Webcam
Dell has installed a 1080p webcam into the top display frame, plus an IR camera for facial recognition via Windows Hello. The webcam's quality is fine in good lighting conditions. In addition, the camera supports studio effects (background soft focus, eye tracking, auto framing) as part of the operating system, meaning it works irrespective of what application is currently being used.


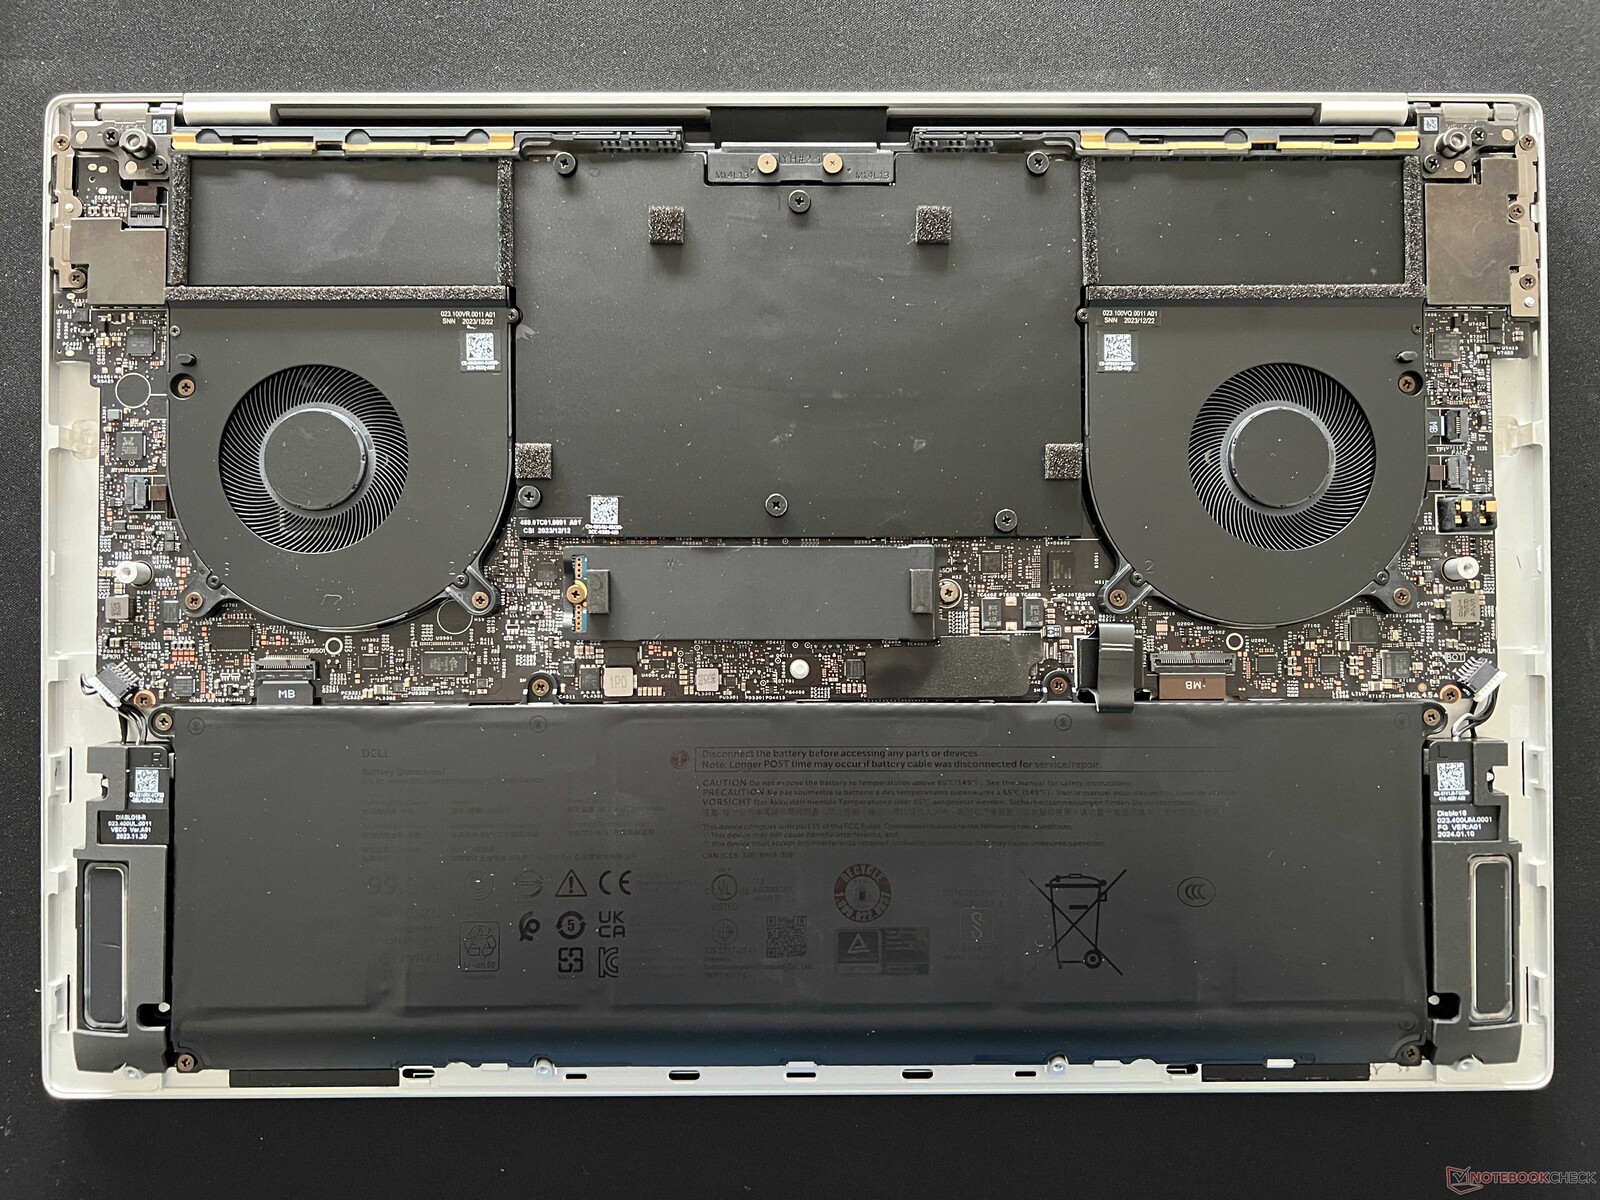
Maintenance
The bottom case cover is secured via Torx screws (T5) and can be removed easily. The internal build is dominated by the cooling unit and the battery. You can only perform maintenance on the M.2-2280 SSD and clean the laptop's fans—plus, you can swap out the battery if required. All other components, including the WLAN module and RAM, are soldered on.
Input devices - Keyboard takes some getting used to and annoying function keys
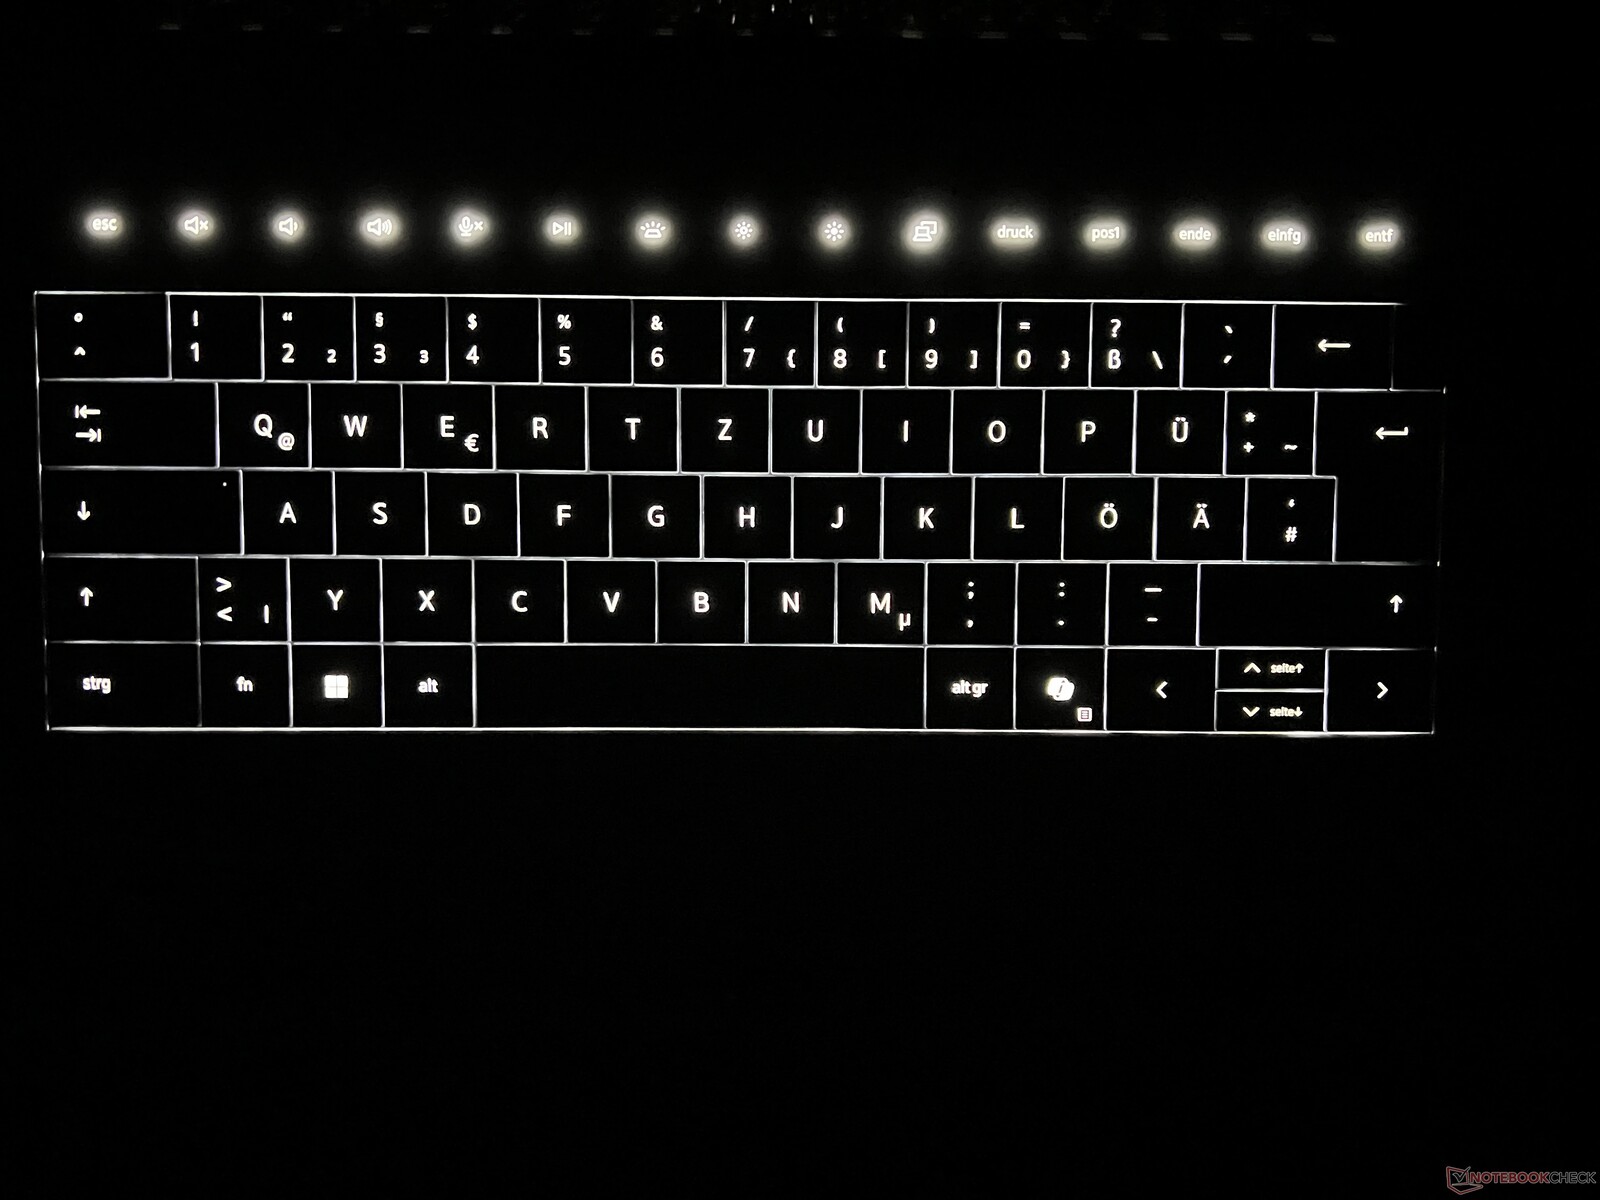
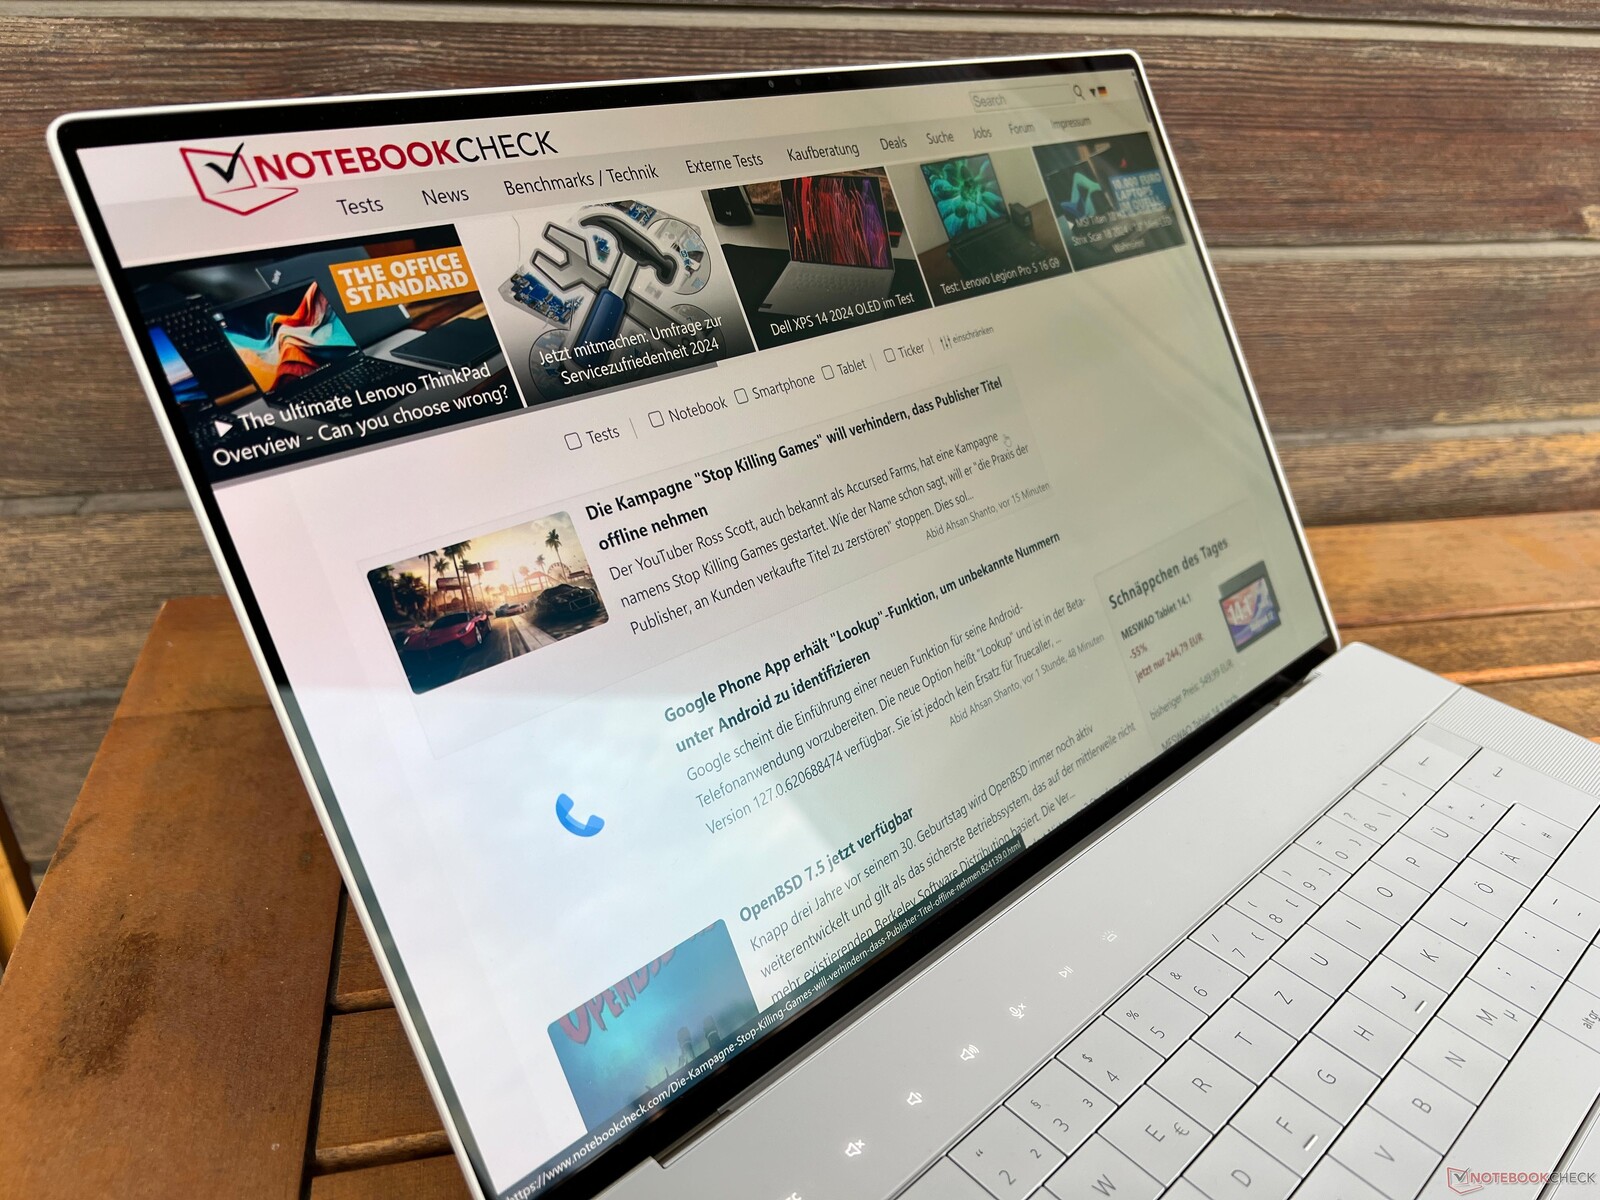
As already noted on the XPS 14, Dell also uses the same keyboard design as the old XPS 13 Plus for its larger XPS 16 model, which features no spaces between the individual keys. It doesn't have a numeric keypad—instead, the space next to the keyboard is used for the laptop's speakers. The keys themselves are slightly concave and it feels very comfortable to type on them, as the keystrokes are precise. However, we did note the occasional issue, as we often hit the wrong key by accident, so you definitely need some time to get used to this keyboard. We also found the tiny vertical arrow keys annoying to hit with larger fingers, and the larger keys' keystroke noise is much louder (space bar, enter key). The power button sits on the top right (including a fingerprint scanner) where you would usually expect the delete key to be—this brings us to the next problem.
The function keys are installed as a touch bar which not only doesn't add any additional value to the device for users, but it is also rather annoying. As a result, you can't even hit the delete key blindly and you always have to look at the keys. Its backlighting is just as much of a nuisance, as it switches off during periods of inactivity but not when watching video for hours on end—even if you don't touch a single key. Furthermore, when the backlighting is deactivated, you don't know where to press, meaning you might hit the wrong keys until the lighting is reactivated. The white backlighting itself is adapted constantly via a sensor and you can't influence the intensity at all—or at least we couldn't find the option to. The sensor also isn't interested in whether you previously deactivated the backlighting manually and as soon as the lighting conditions change, it is reactivated.

The touchpad is fully integrated into the palm rest and there are no visible boundaries. The touchpad uses the full height of the palm rest and its width extends from the centre of the left Fn key to the centre of the left arrow key. In general, it works well and it is nice and smooth with an even click, but we occasionally encountered some problems if you left the area or started movements slightly off the actual touchpad area. In contrast to the touch bar, however, this is only a minor point of criticism. The optional OLED panel is also equipped with a capacitive touchscreen and this works perfectly.
Display - 90-Hz 4K OLED

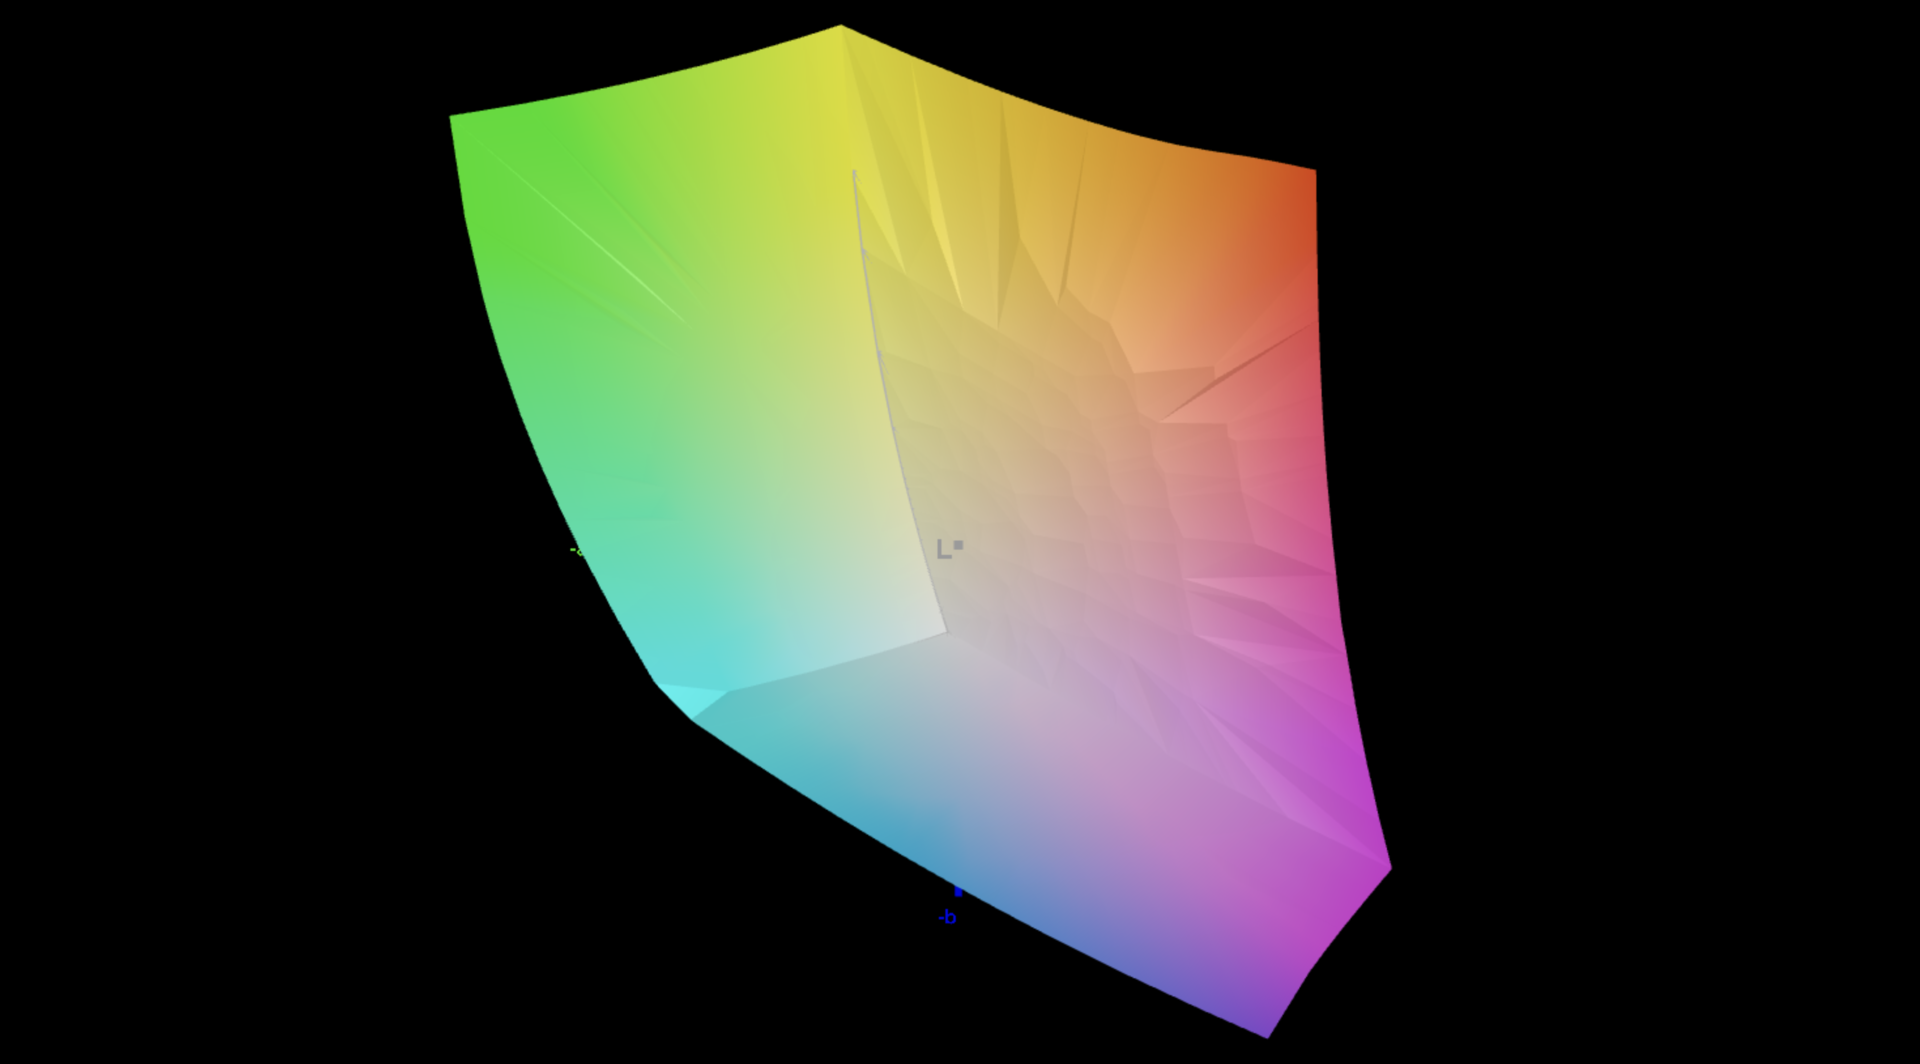
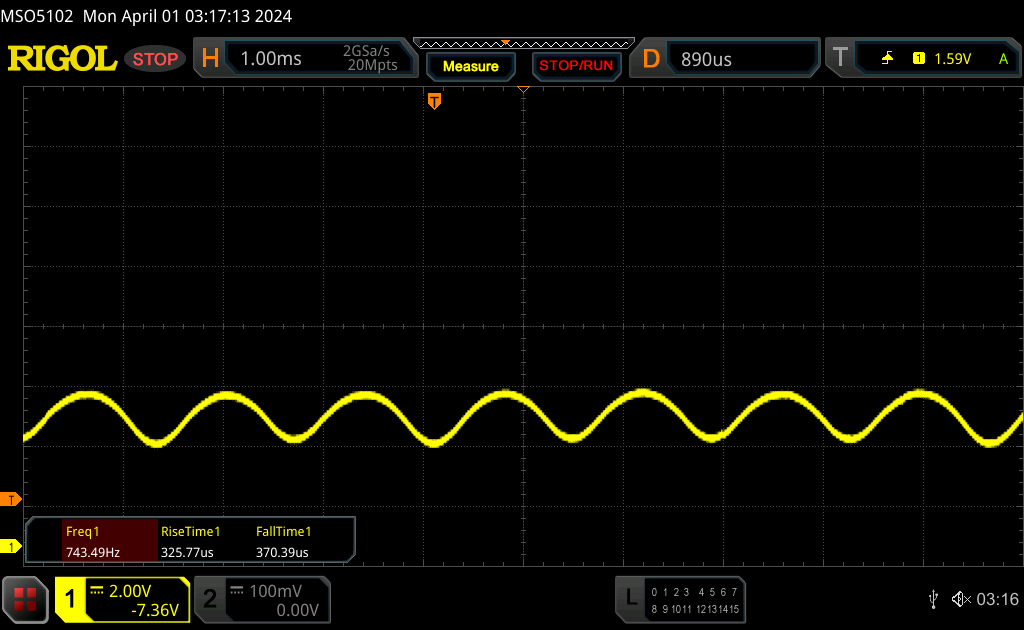
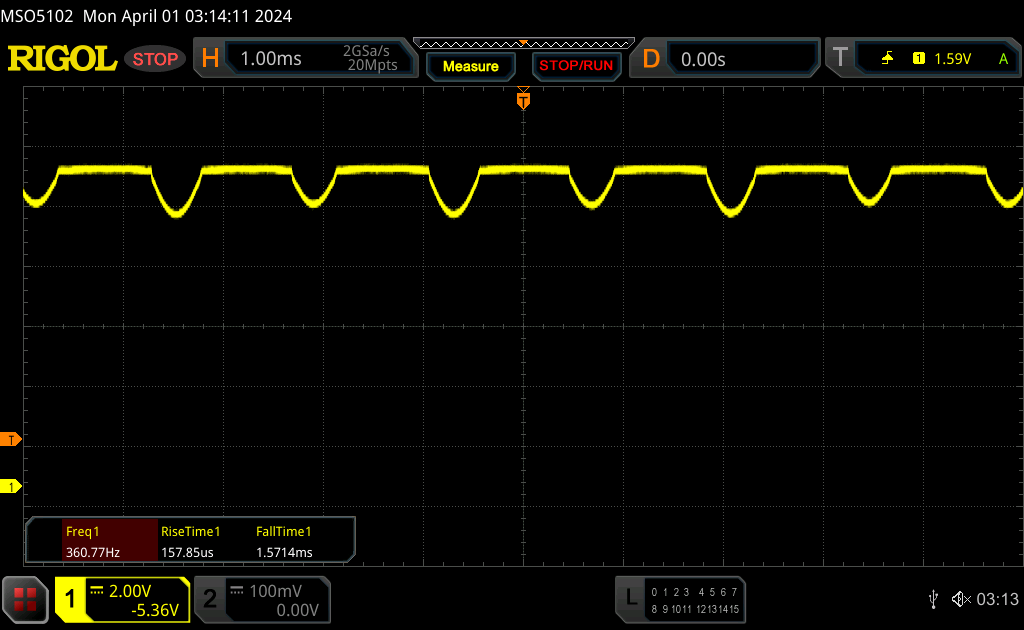
Dell offers two different 16.3-inch panels with a reflective surface for its new XPS 16. A 1080p model (500 cd/m²) without a touchscreen is installed as standard, but for an additional US$300, you can get an OLED touchscreen from Samsung with a resolution of 3,840 x 2,400 pixels, which is also the one that's installed in our test device. Despite its good subjective picture quality, the panel in the XPS 16 shows some disadvantages compared to the latest OLED generation from Samsung (which is installed in the Galaxy Book4 Ultra, for example), despite its higher resolution. First of all, its refresh rate is only 90 Hz instead of 120 Hz and a raster effect can be seen on closer inspection when bright content is displayed. The Dell XPS 16 also falls slightly behind when it comes to its maximum SDR brightness with an average of ~367 cd/m². Its black value is 0, which leads to an extremely high contrast ratio. We noted a maximum of 580 cd/m² in HDR mode (which has to be activated manually). We were able to detect PWM with a frequency of 360 Hz across all brightness levels from 0-90%.
| |||||||||||||||||||||||||
Brightness Distribution: 96 %
Center on Battery: 366 cd/m²
Contrast: ∞:1 (Black: 0 cd/m²)
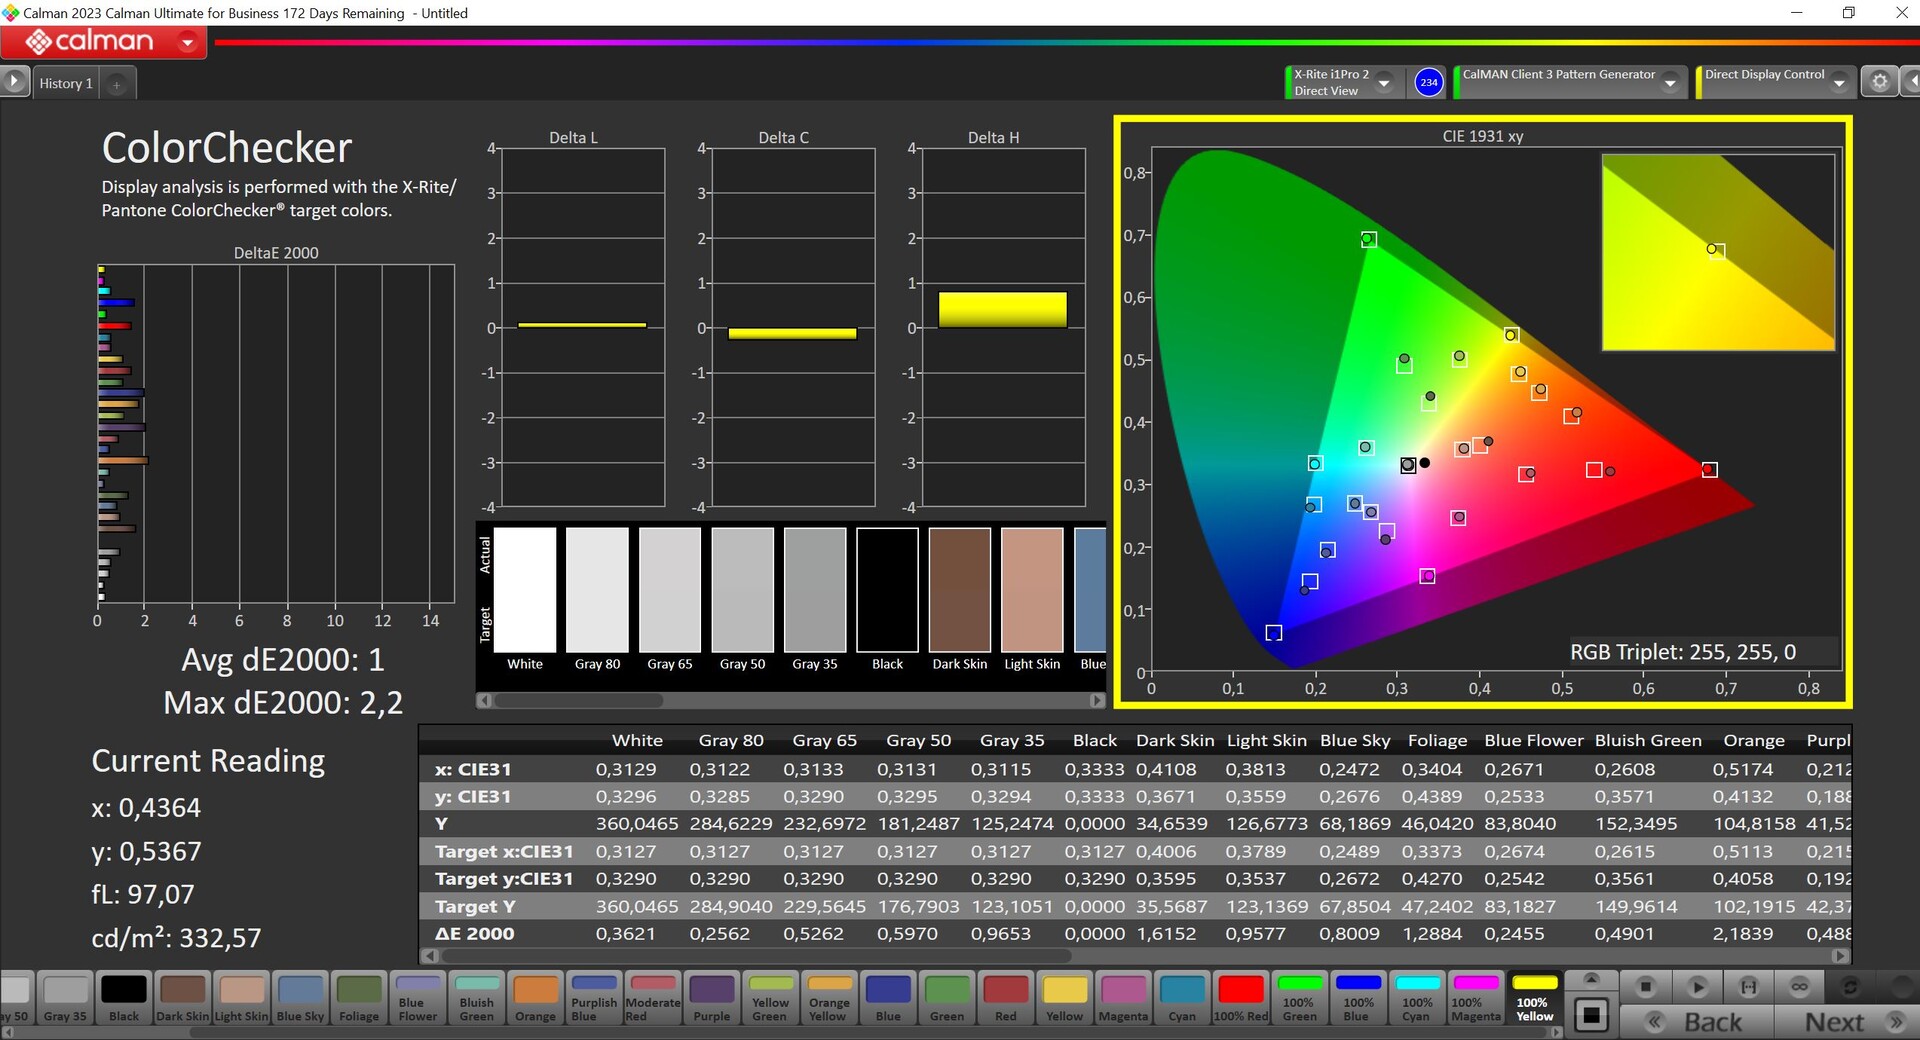
ΔE Color 1.3 | 0.5-29.43 Ø5, calibrated: 1
ΔE Greyscale 2.2 | 0.57-98 Ø5.3
87.8% AdobeRGB 1998 (Argyll 2.2.0 3D)
100% sRGB (Argyll 2.2.0 3D)
98.3% Display P3 (Argyll 2.2.0 3D)
Gamma: 2.14
| Dell XPS 16 9640 SDC4196, OLED, 3840x2400, 16.30 | Samsung Galaxy Book4 Ultra ATNA60CL07-0, OLED, 2880x1800, 16.00 | Honor MagicBook Pro 16 2024 TL160MDMP01, IPS, 3072x1920, 16.00 | Asus ROG Zephyrus G16 2024 GU605M ATNA60DL01-0, OLED, 2560x1600, 16.00 | Lenovo Yoga Pro 9 16-IRP G8 LEN160-3.2K, Mini-LED, 3200x2000, 16.00 | SCHENKER VISION 16 Pro (M23) NE160QDM-NZ1, IPS, 2560x1600, 16.00 | Dell XPS 15 9530 RTX 4070 Samsung 156XG01, OLED, 3456x2160, 15.60 | |
|---|---|---|---|---|---|---|---|
| Display | 0% | 1% | 4% | 2% | -17% | 5% | |
| Display P3 Coverage | 98.3 | 98.6 0% | 98.8 1% | 99.9 2% | 97 -1% | 68.8 -30% | 99.8 2% |
| sRGB Coverage | 100 | 99.9 0% | 100 0% | 100 0% | 99.8 0% | 98.8 -1% | 100 0% |
| AdobeRGB 1998 Coverage | 87.8 | 88.5 1% | 89.1 1% | 96.9 10% | 95.1 8% | 70 -20% | 98.4 12% |
| Response Times | 7% | -614% | 104% | -359% | -1212% | -89% | |
| Response Time Grey 50% / Grey 80% * | 0.82 ? | 0.54 ? 34% | 6.3 ? -668% | 0.22 ? 73% | 14 ? -1607% | 13.7 ? -1571% | 1.68 ? -105% |
| Response Time Black / White * | 0.85 ? | 0.69 ? 19% | 5.6 ? -559% | 0.25 ? 71% | 9.2 ? -982% | 8.1 ? -853% | 1.94 ? -128% |
| PWM Frequency | 360 ? | 240 ? -33% | 960 ? 167% | 5800 ? 1511% | 239 -34% | ||
| Screen | 6% | 5% | 4% | 22% | -58% | -64% | |
| Brightness middle | 366 | 390 7% | 551 51% | 416 14% | 539 47% | 384 5% | 389.5 6% |
| Brightness | 367 | 393 7% | 524 43% | 418 14% | 546 49% | 371 1% | 392 7% |
| Brightness Distribution | 96 | 98 2% | 91 -5% | 96 0% | 96 0% | 88 -8% | 98 2% |
| Black Level * | 0.52 | 0.18 | 0.3 | ||||
| Colorchecker dE 2000 * | 1.3 | 1.4 -8% | 1.7 -31% | 1.6 -23% | 1.4 -8% | 3.4 -162% | 4.95 -281% |
| Colorchecker dE 2000 max. * | 3.6 | 2.7 25% | 4.1 -14% | 2.1 42% | 2.1 42% | 9.2 -156% | 8.65 -140% |
| Colorchecker dE 2000 calibrated * | 1 | 1 -0% | 1.3 -30% | 1.53 -53% | |||
| Greyscale dE 2000 * | 2.2 | 2.1 5% | 2.4 -9% | 2.7 -23% | 2.2 -0% | 3.4 -55% | 2 9% |
| Gamma | 2.14 103% | 2.27 97% | 2.2 100% | 2.16 102% | 2.19 100% | 2.16 102% | 2.27 97% |
| CCT | 6680 97% | 6431 101% | 6842 95% | 6331 103% | 6479 100% | 7462 87% | 6265 104% |
| Contrast | 1060 | 2994 | 1280 | ||||
| Total Average (Program / Settings) | 4% /
5% | -203% /
-99% | 37% /
29% | -112% /
-78% | -429% /
-240% | -49% /
-54% |
* ... smaller is better
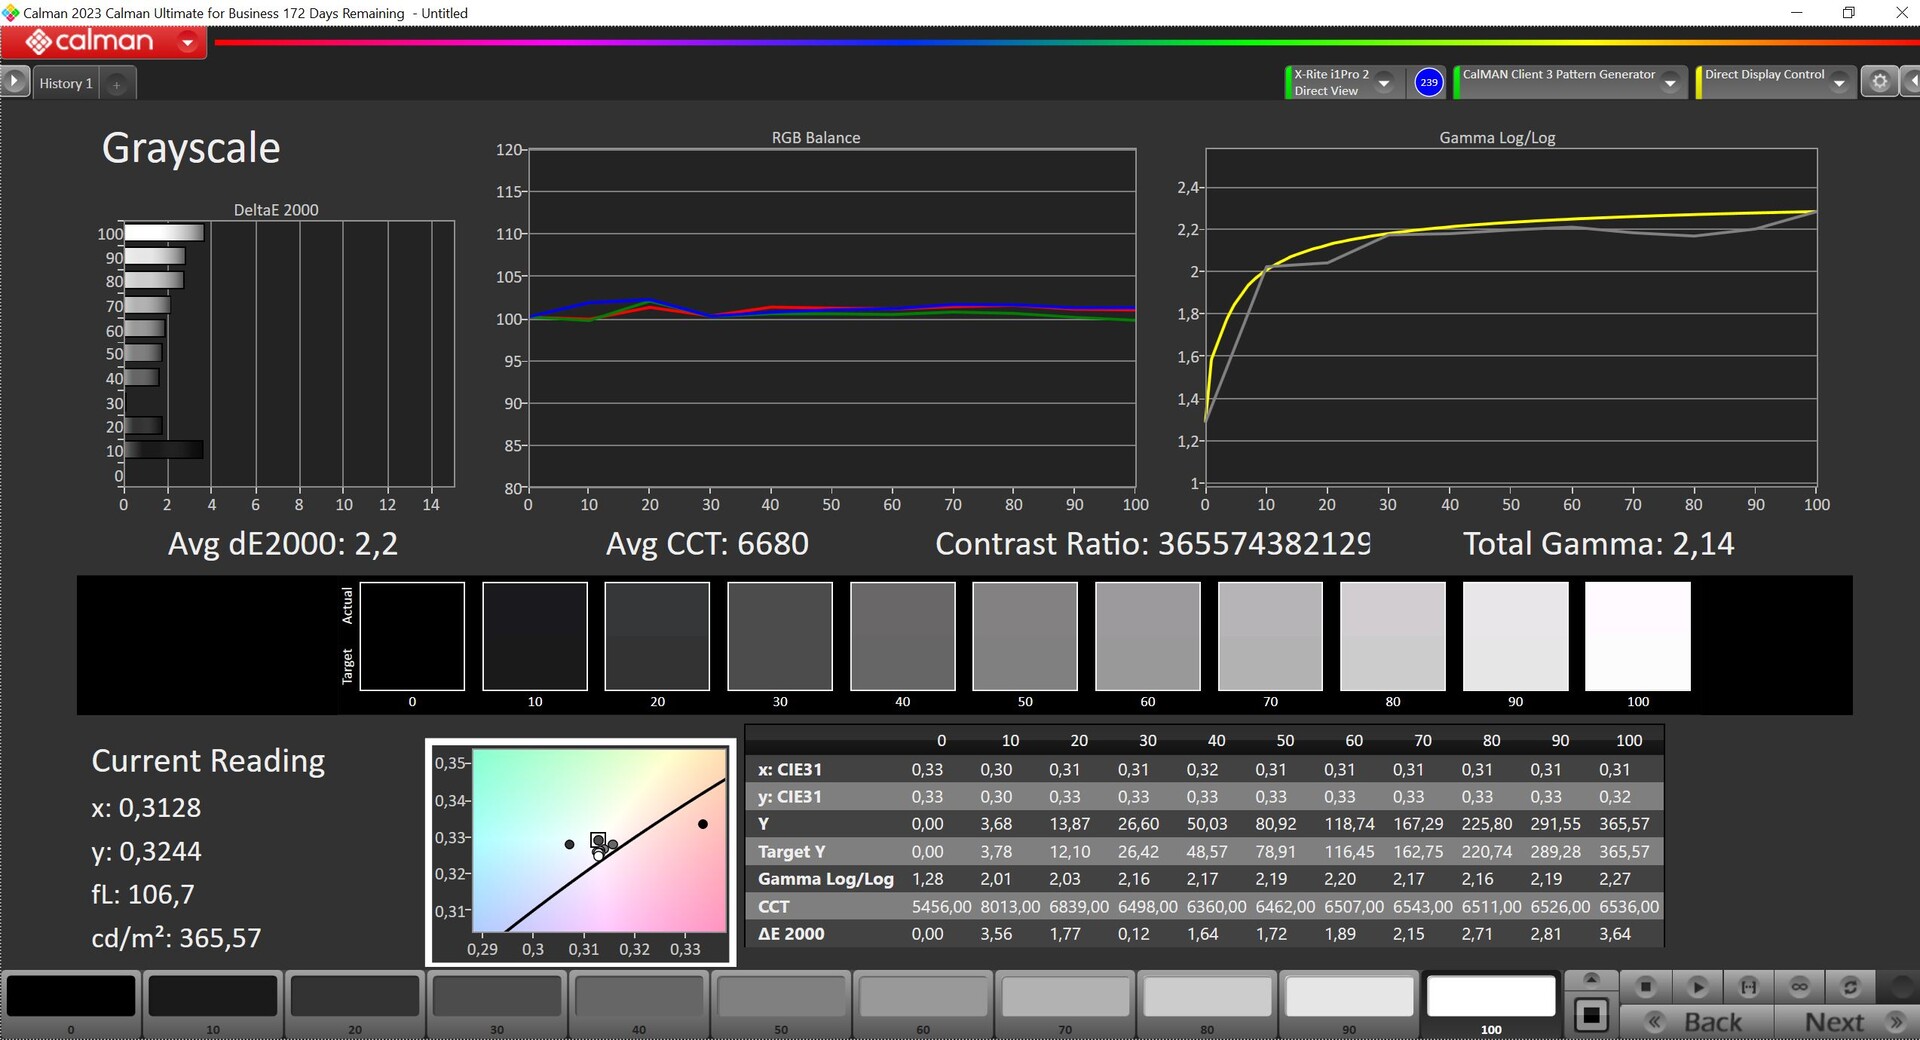
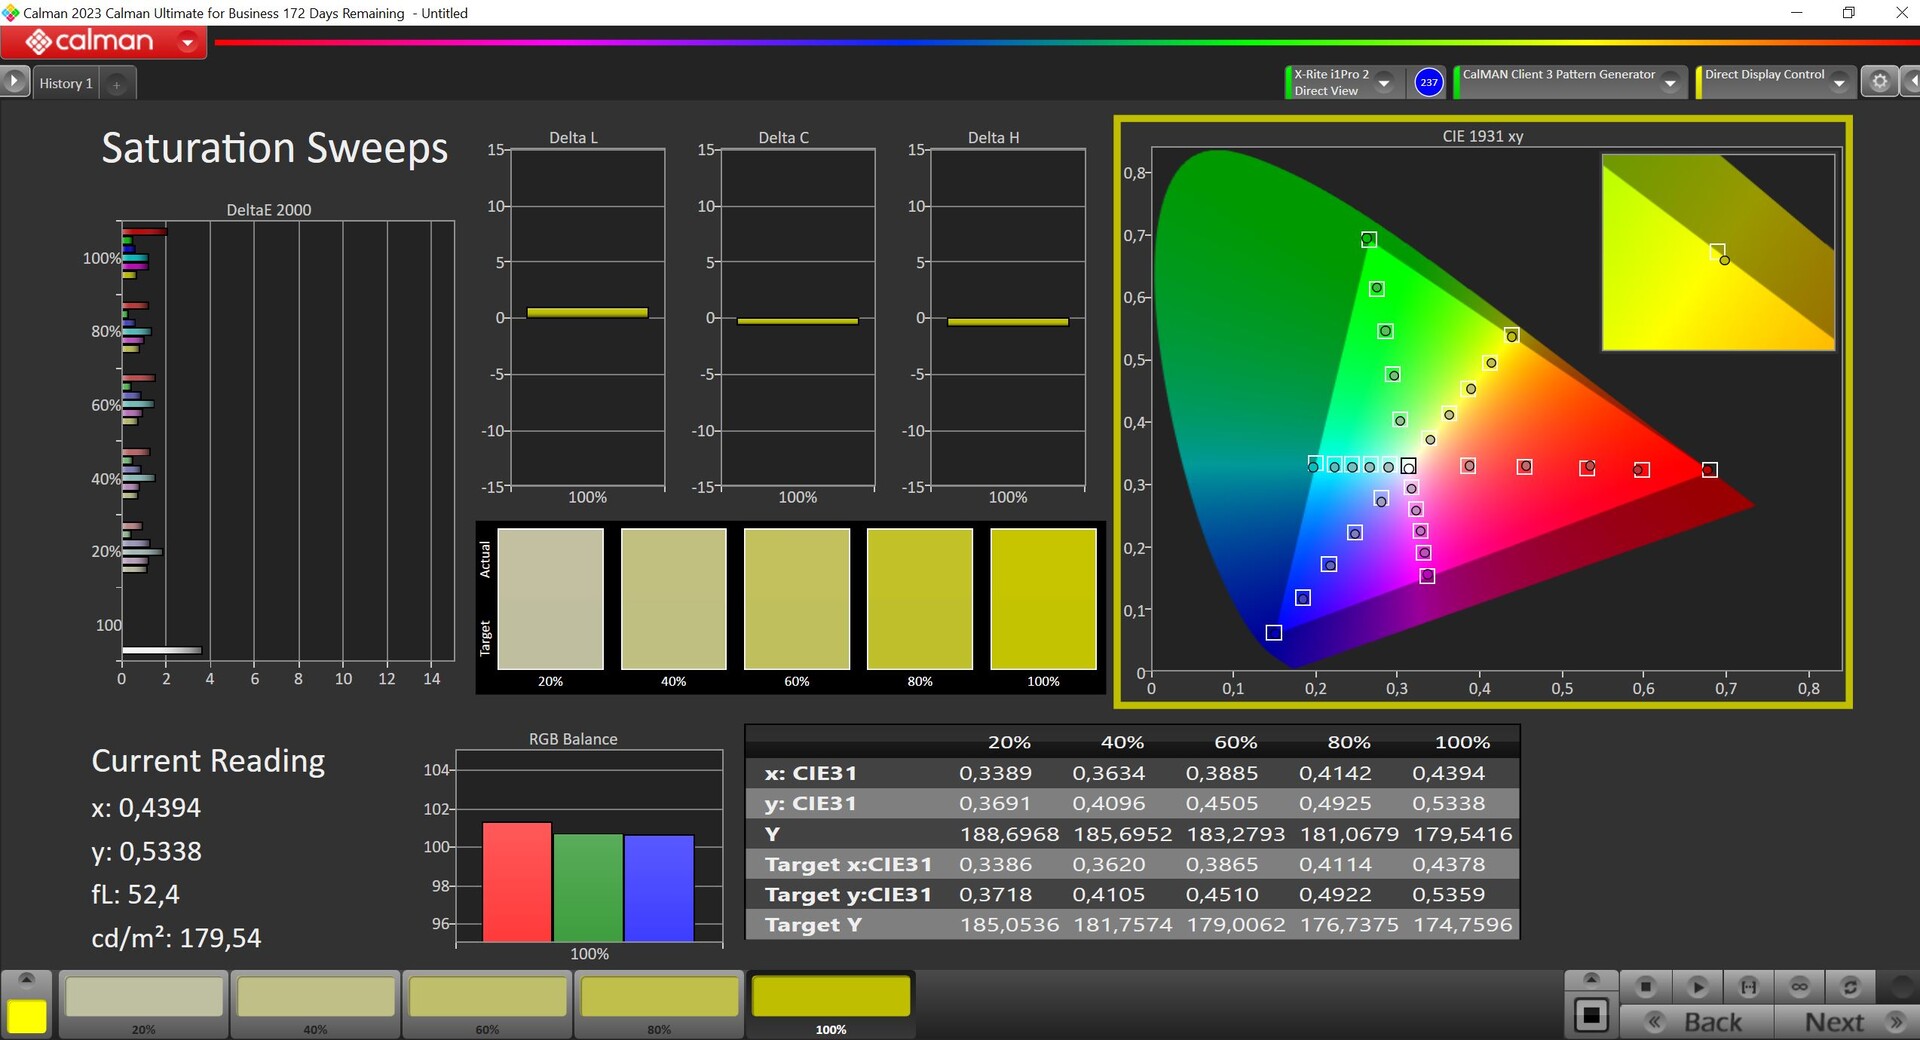
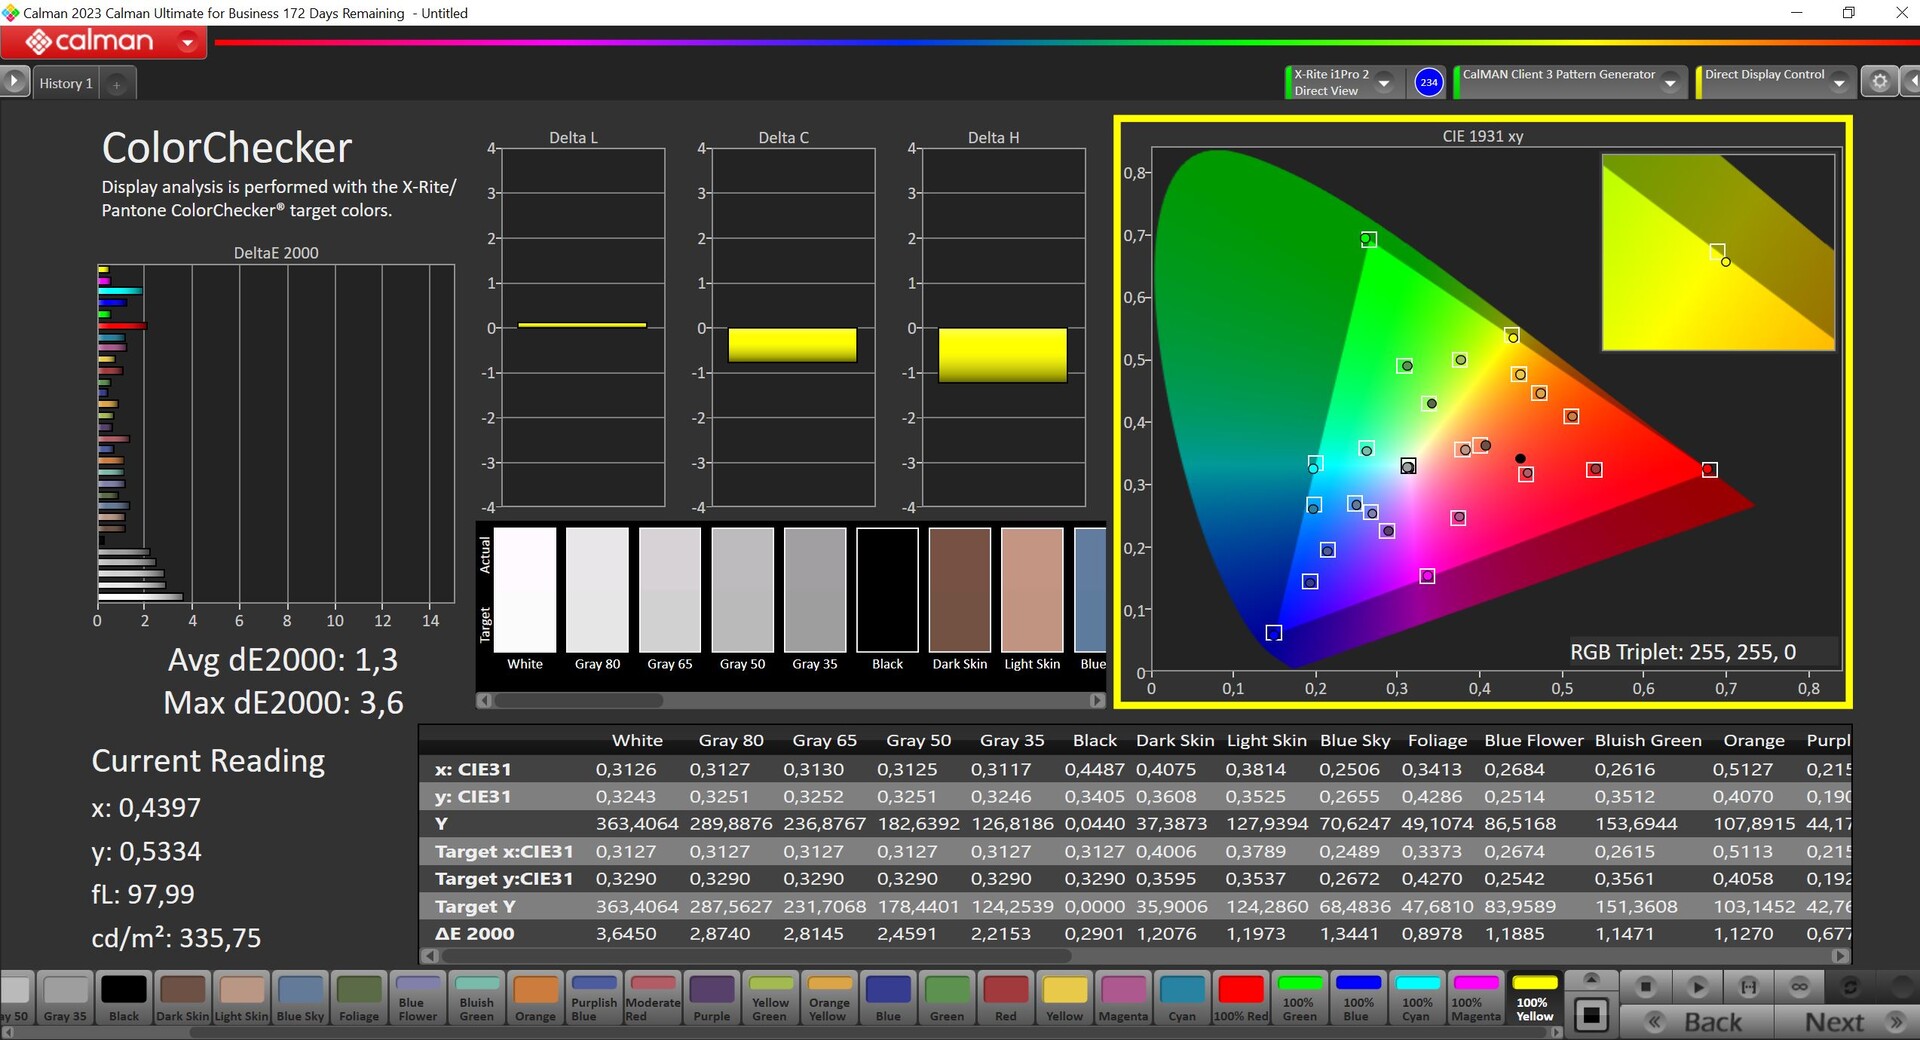
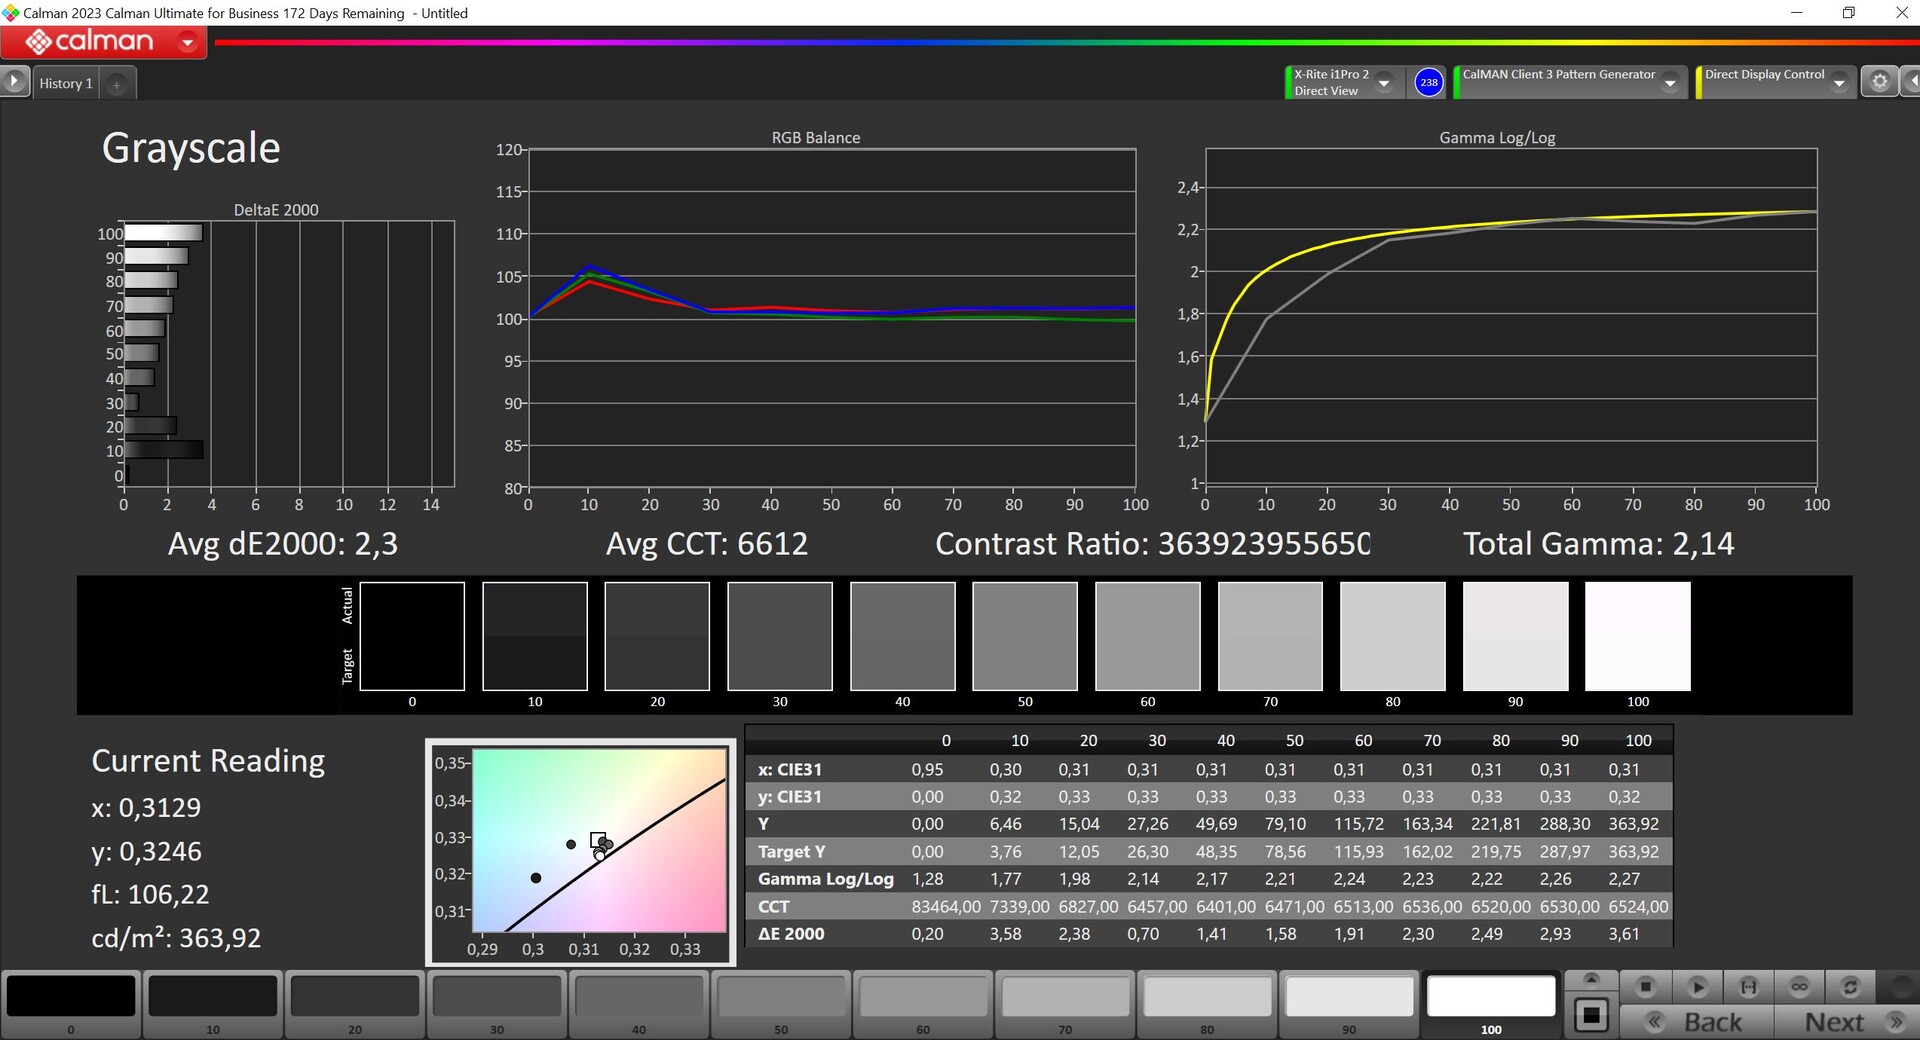
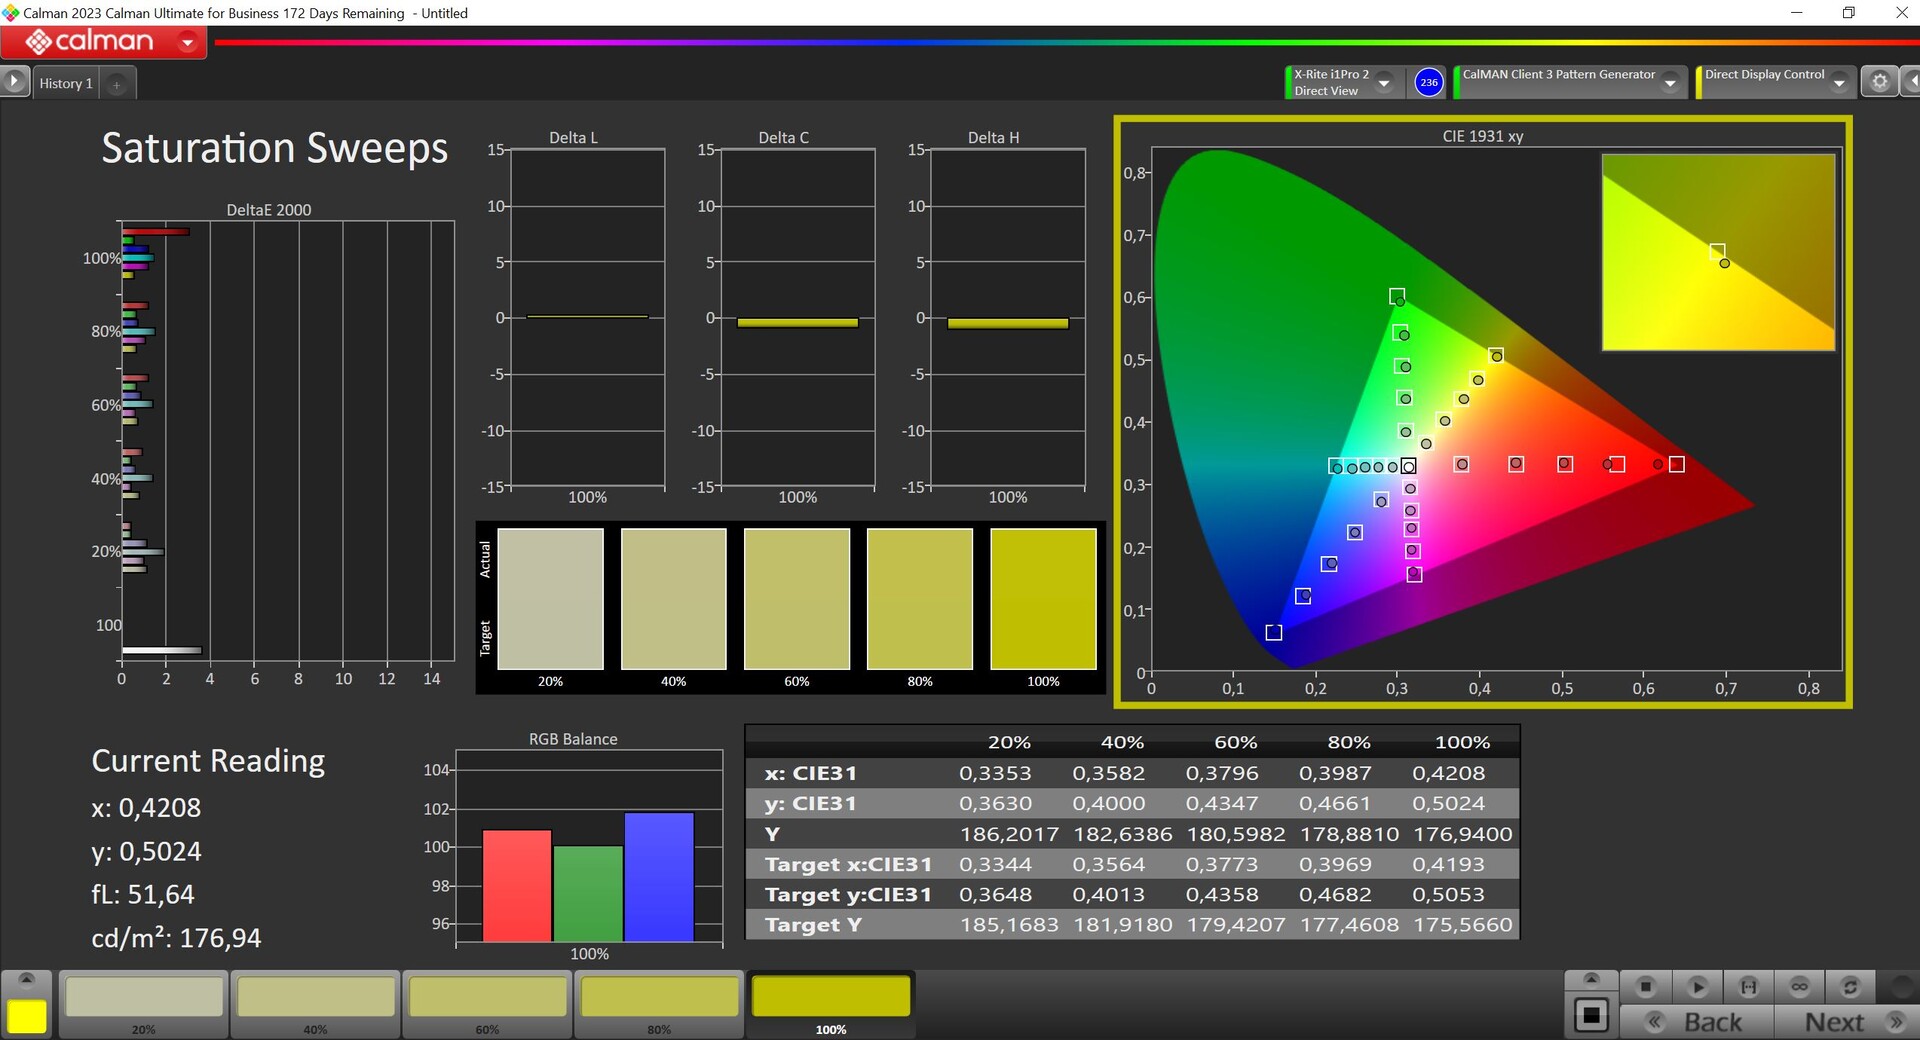

We analyzed the panel using the professional CalMAN software (X-Rite i1 Pro 2). Dell offers different color profiles and the pre-selected profile Vivid already delivers very accurate colors—only gray tones still show some slight deviations. Using our own calibration (you can download the corresponding profile for free above), we were able to improve depiction even further. If you like to edit photos, then you'll enjoy the accurate profile Internet, which limits the color space to sRGB.


Display Response Times
| ↔ Response Time Black to White | ||
|---|---|---|
| 0.85 ms ... rise ↗ and fall ↘ combined | ↗ 0.46 ms rise | 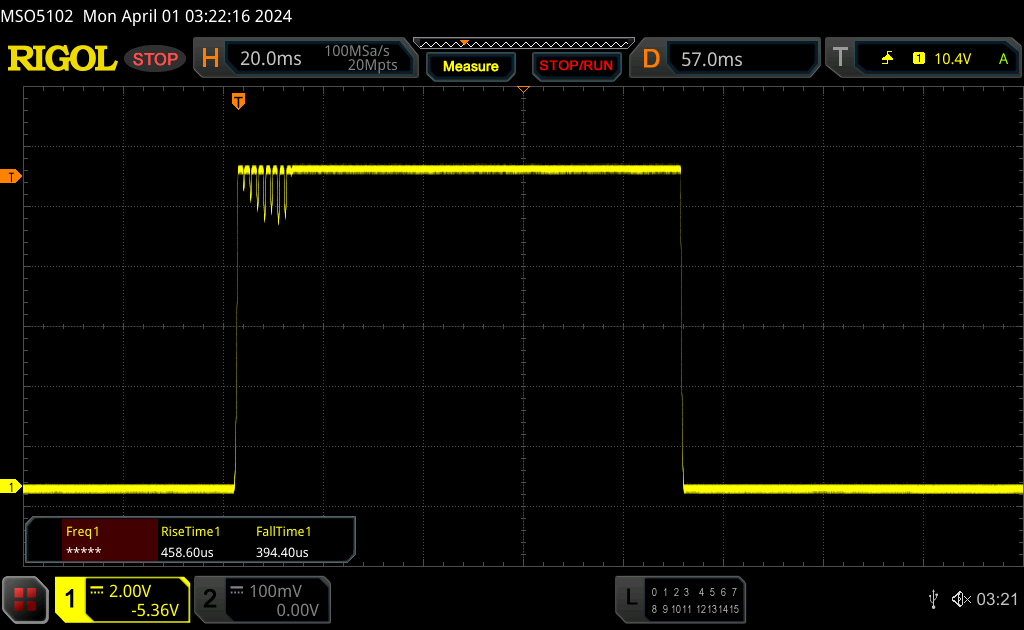 |
| ↘ 0.39 ms fall | ||
| The screen shows very fast response rates in our tests and should be very well suited for fast-paced gaming. In comparison, all tested devices range from 0.1 (minimum) to 240 (maximum) ms. » 1 % of all devices are better. This means that the measured response time is better than the average of all tested devices (21.4 ms). | ||
| ↔ Response Time 50% Grey to 80% Grey | ||
| 0.82 ms ... rise ↗ and fall ↘ combined | ↗ 0.43 ms rise |  |
| ↘ 0.39 ms fall | ||
| The screen shows very fast response rates in our tests and should be very well suited for fast-paced gaming. In comparison, all tested devices range from 0.2 (minimum) to 636 (maximum) ms. » 1 % of all devices are better. This means that the measured response time is better than the average of all tested devices (33.7 ms). | ||
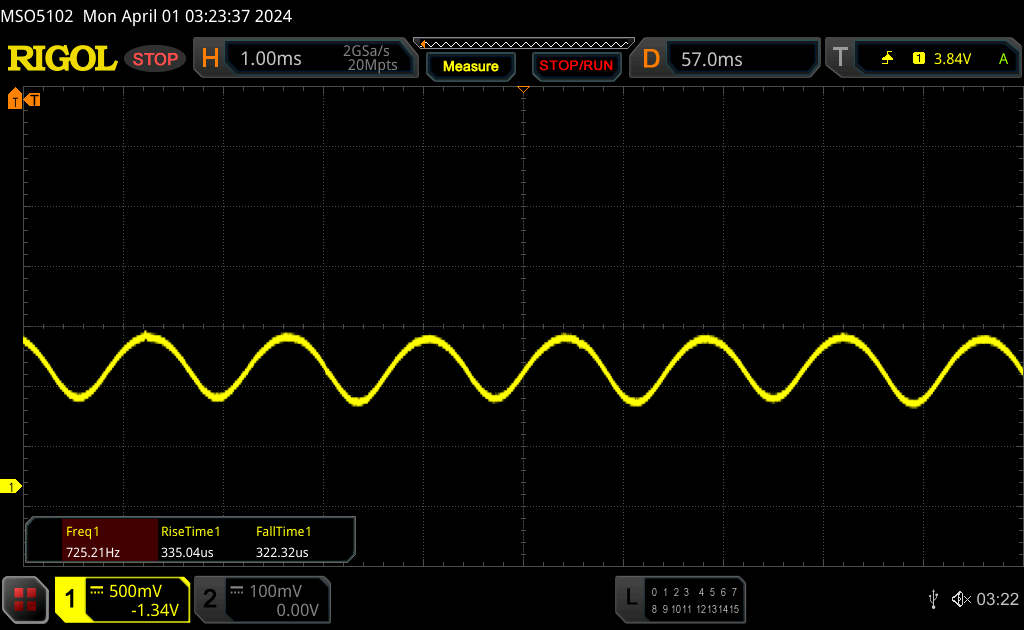
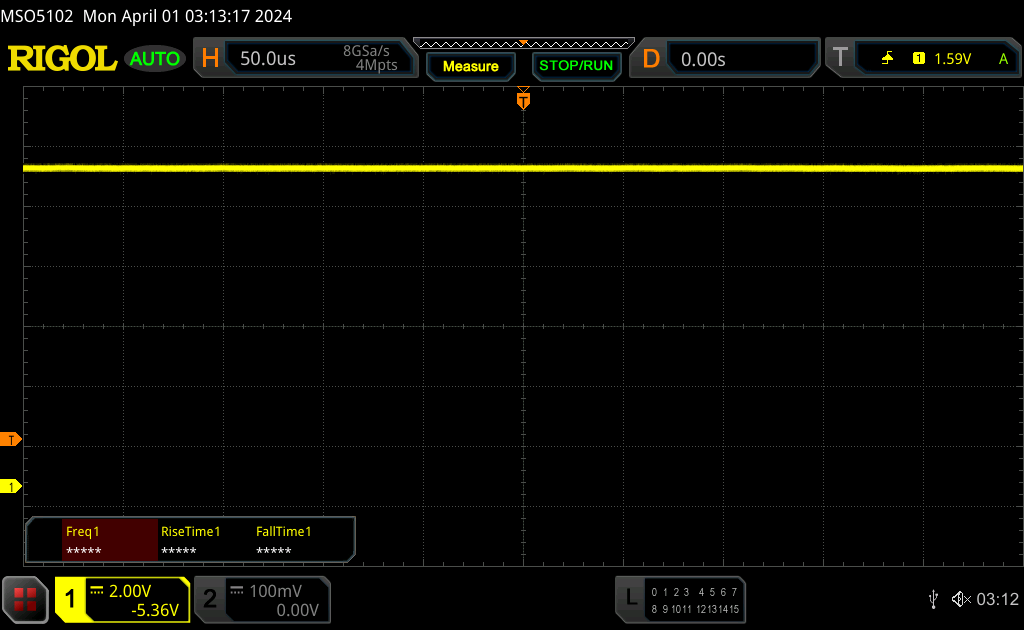
Screen Flickering / PWM (Pulse-Width Modulation)
| Screen flickering / PWM detected | 360 Hz | ≤ 90 % brightness setting | 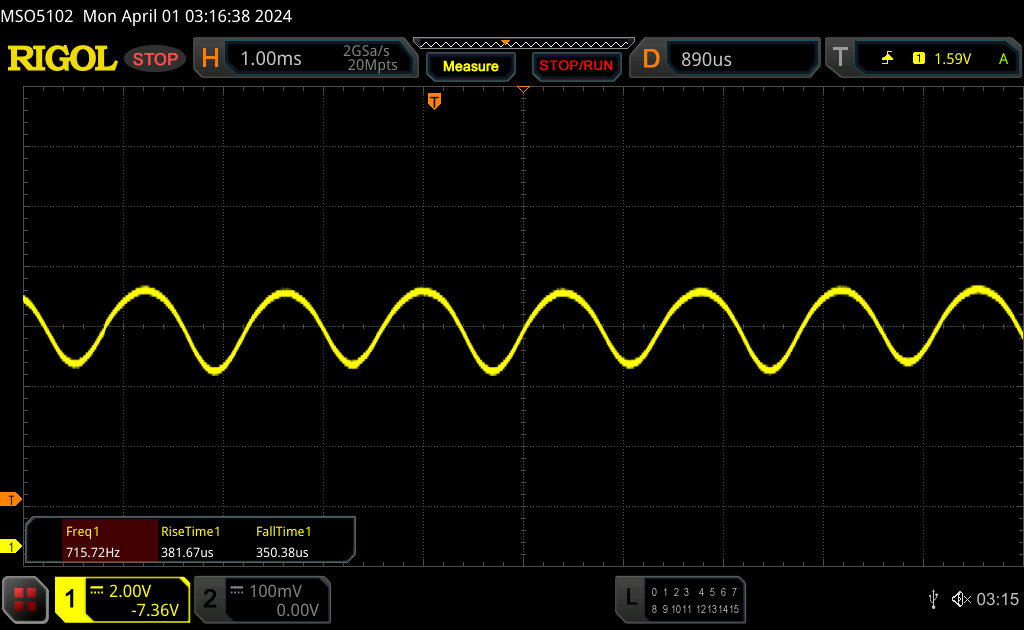 |
The display backlight flickers at 360 Hz (worst case, e.g., utilizing PWM) Flickering detected at a brightness setting of 90 % and below. There should be no flickering or PWM above this brightness setting. The frequency of 360 Hz is relatively high, so most users sensitive to PWM should not notice any flickering. However, there are reports that some users are still sensitive to PWM at 500 Hz and above, so be aware. In comparison: 53 % of all tested devices do not use PWM to dim the display. If PWM was detected, an average of 17812 (minimum: 5 - maximum: 3846000) Hz was measured. | |||


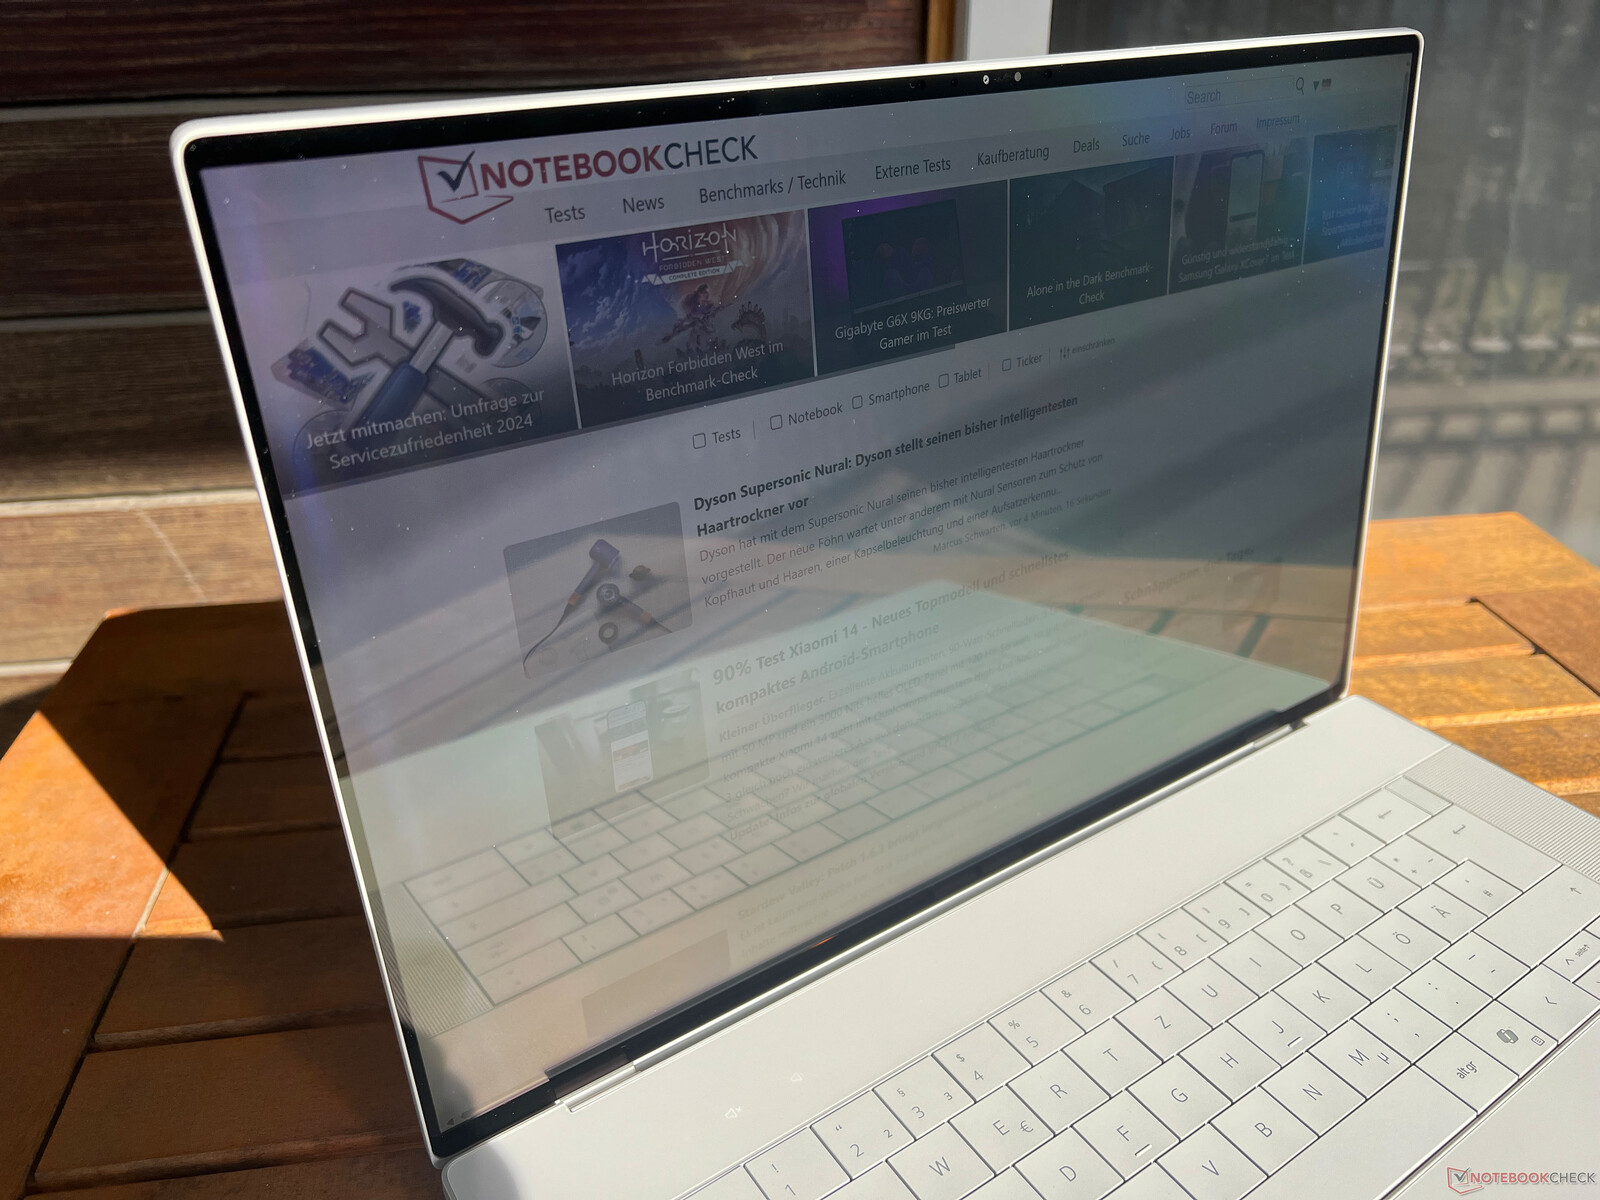
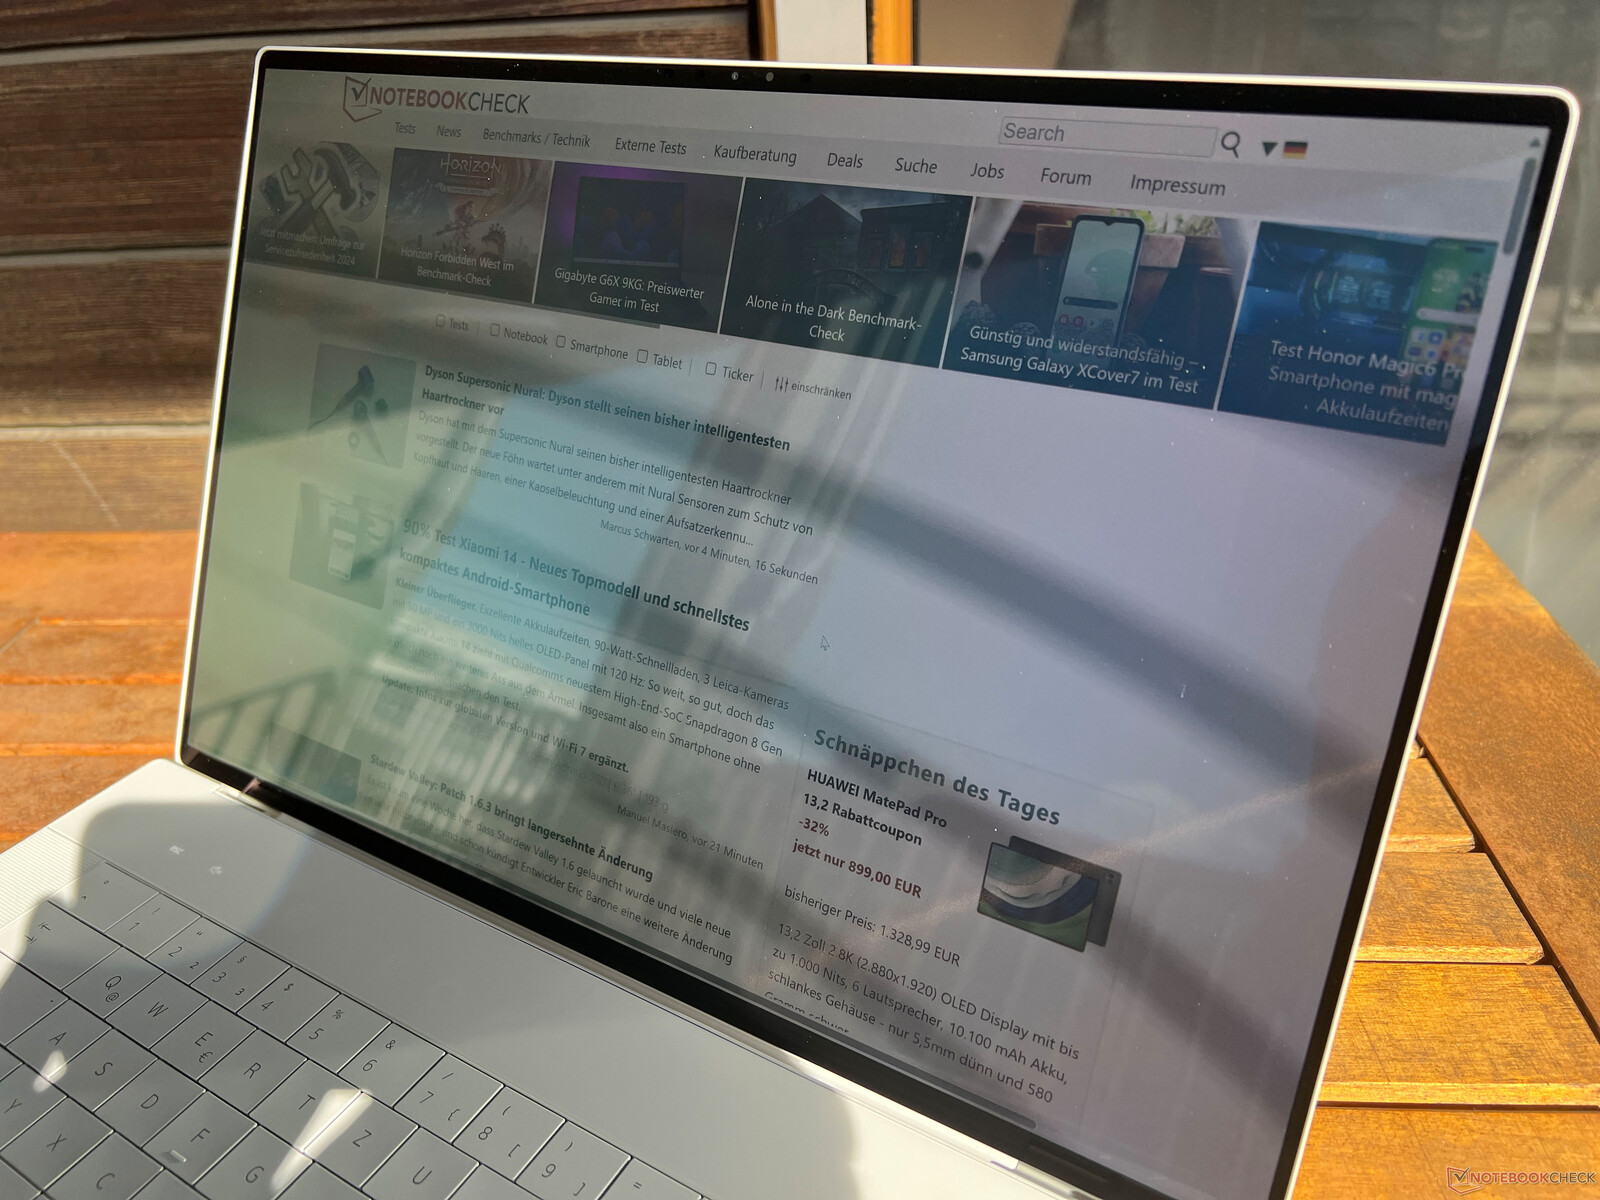
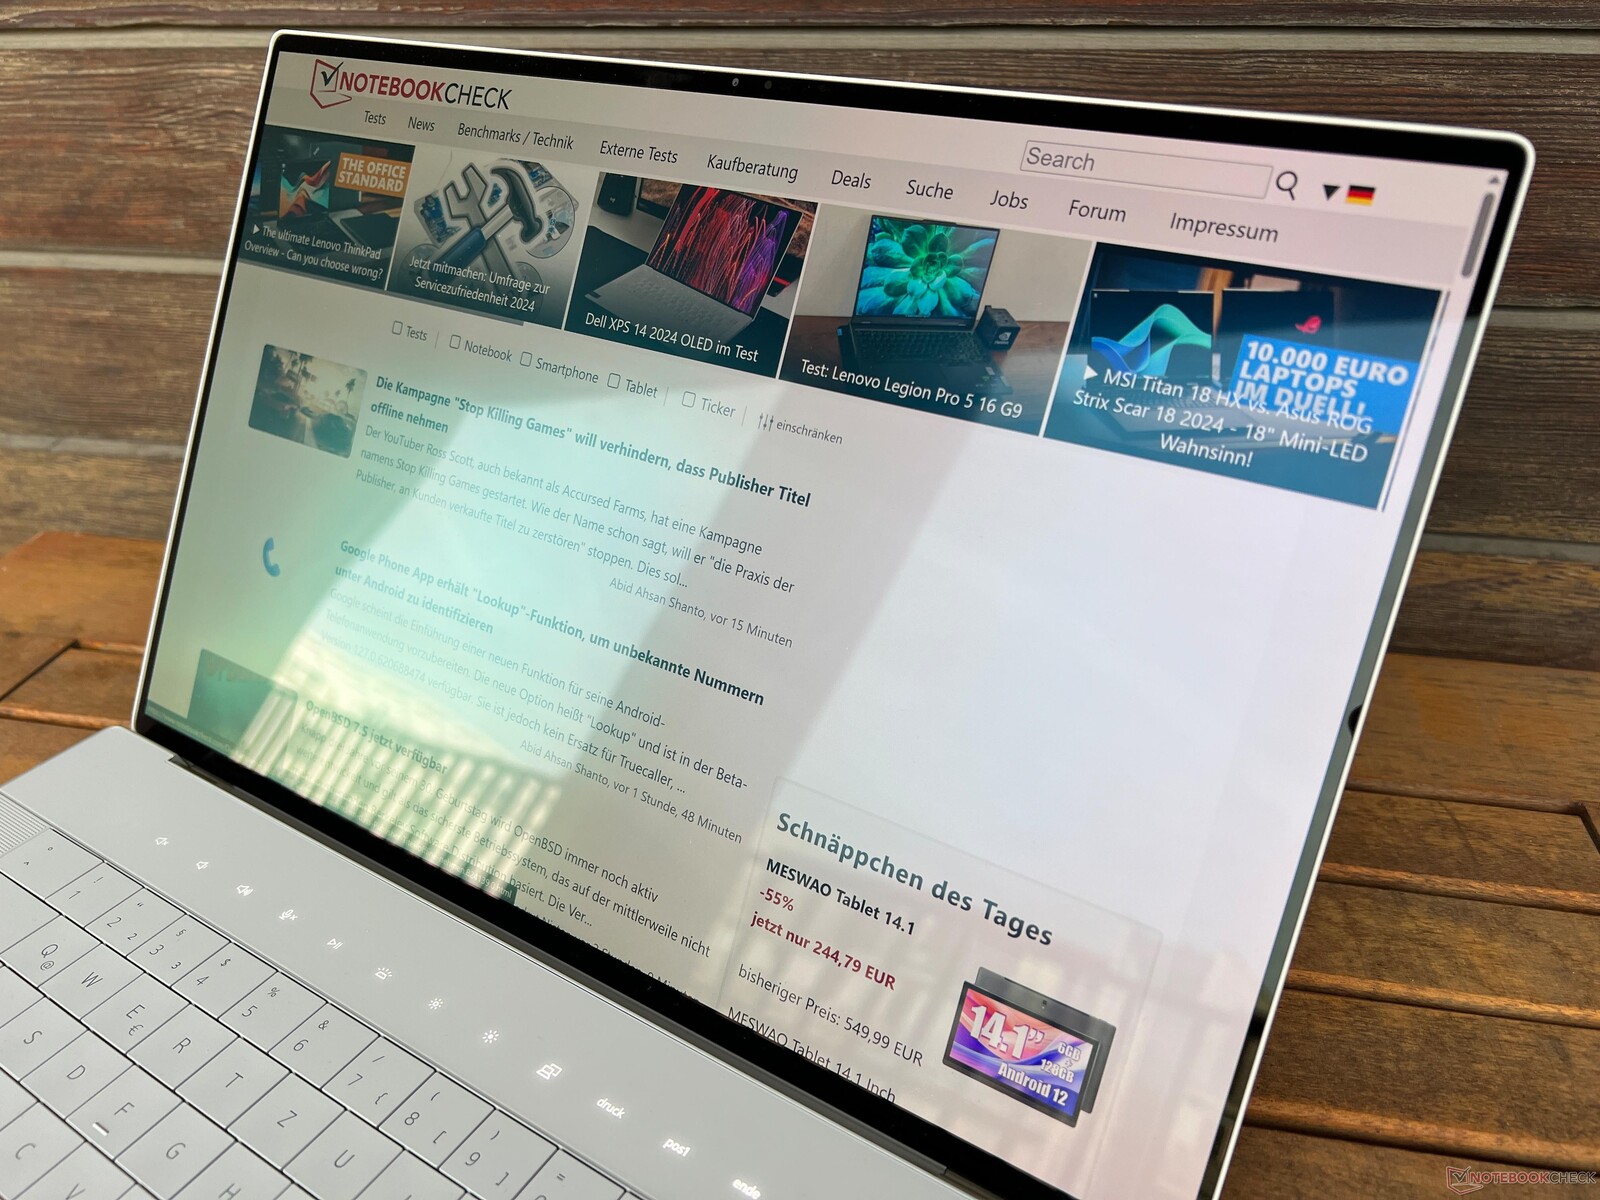
The touchscreen is very reflective and reflections may also be an issue indoors. Outdoors, you will also have to try to avoid reflections from light sources or bright surfaces. It is possible to use the laptop on cloudy days, but it can get problematic on bright days with lots of sunlight. Its viewing-angle stability is generally very good, but if there are large deviations from the centre of the screen, the typical OLED blue shimmer can be seen.

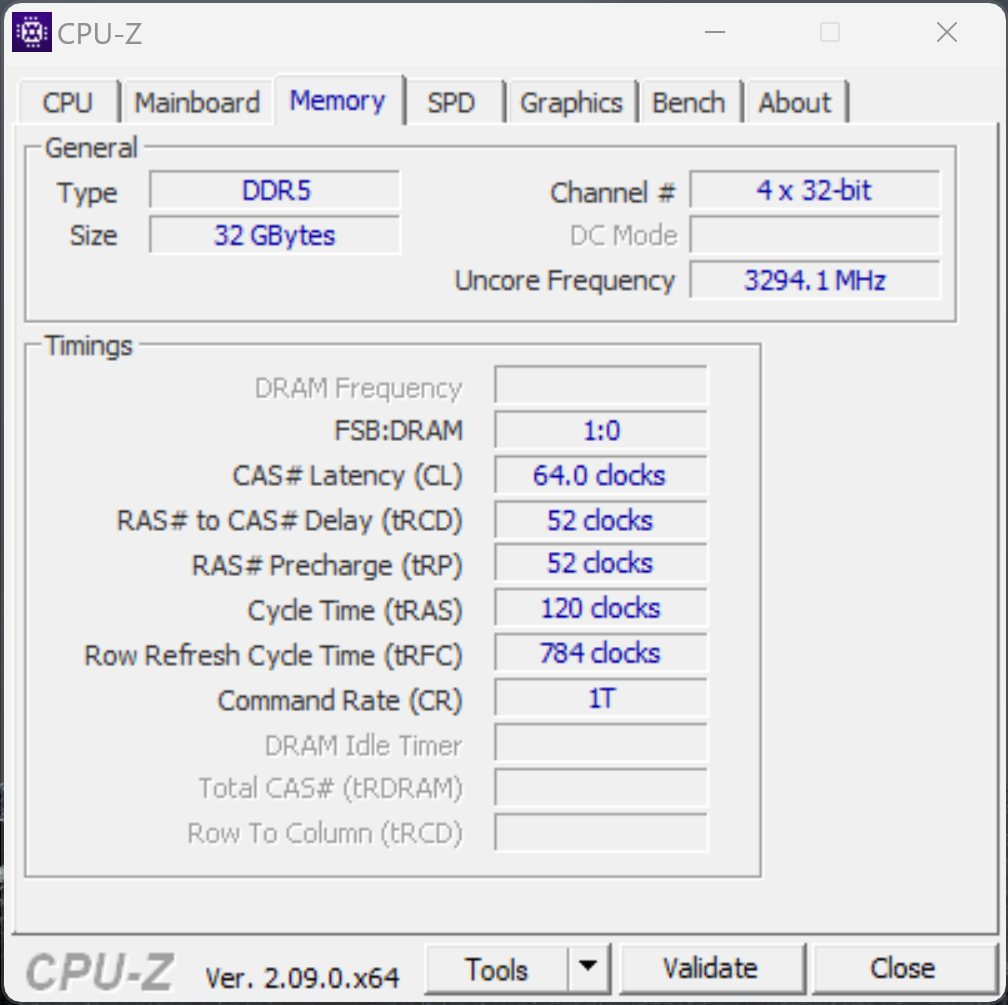
Performance - The XPS 16 with Advanced Optimus and up to 64 GB RAM
As with the smaller XPS 14, the new XPS 16 can be configured without a dedicated graphics card—but only in conjunction with 16 GB of RAM (LPDDR5x-6400). 32 GB RAM is only available in conjunction with dedicated GPUs, and faster LPDDR5x-7467 RAM can only be selected in conjunction with the RTX 4070 Laptop. If you want 64 GB of RAM, you'll also have to choose the Core Ultra 9 185H and at least the RTX 4060 Laptop. The XPS 16 is equipped with a MUX switch and Advanced Optimus graphics switching.


Testing conditions
Dell lets users select various energy profiles that can also be combined with the Windows performance settings. The default profile is Optimized, but the graphics card's full performance is only available using Ultra Performance mode. Since the fan noise emissions are very similar using these two profiles, we selected the Ultra Performance mode for our benchmarks and measurements.
| Energy profile | CPU load | CB R23 Multi | GPU load | Time Spy graphics | Cyberpunk 2077 QHD Ultra |
max. fan noise emissions |
|---|---|---|---|---|---|---|
| Quiet | 80 -> 75 watts | 18,296 points | 50 watts | 8,186 points | 30.8fps | 43.3 dB(A) |
| Optimized | 80 -> 75 watts | 18,248 points | 50 watts | 8,532 points | 37.4fps | 48.1 dB(A) |
| Ultra Performance | 100 -> 85 watts | 18,518 points | 60 watts | 9,638 points | 39.6fps | 49.7 dB(A) |
During our test, we came across a bug during the graphics switching process, as V-Sync was always active in full-screen mode. In windowed mode and when manually selecting the Nvidia GPU in the graphics driver, the problem did not occur. When connecting an external monitor, normal Optimus switching is active (as all Thunderbolt ports run via the Intel GPU) and the problem can also be found here.
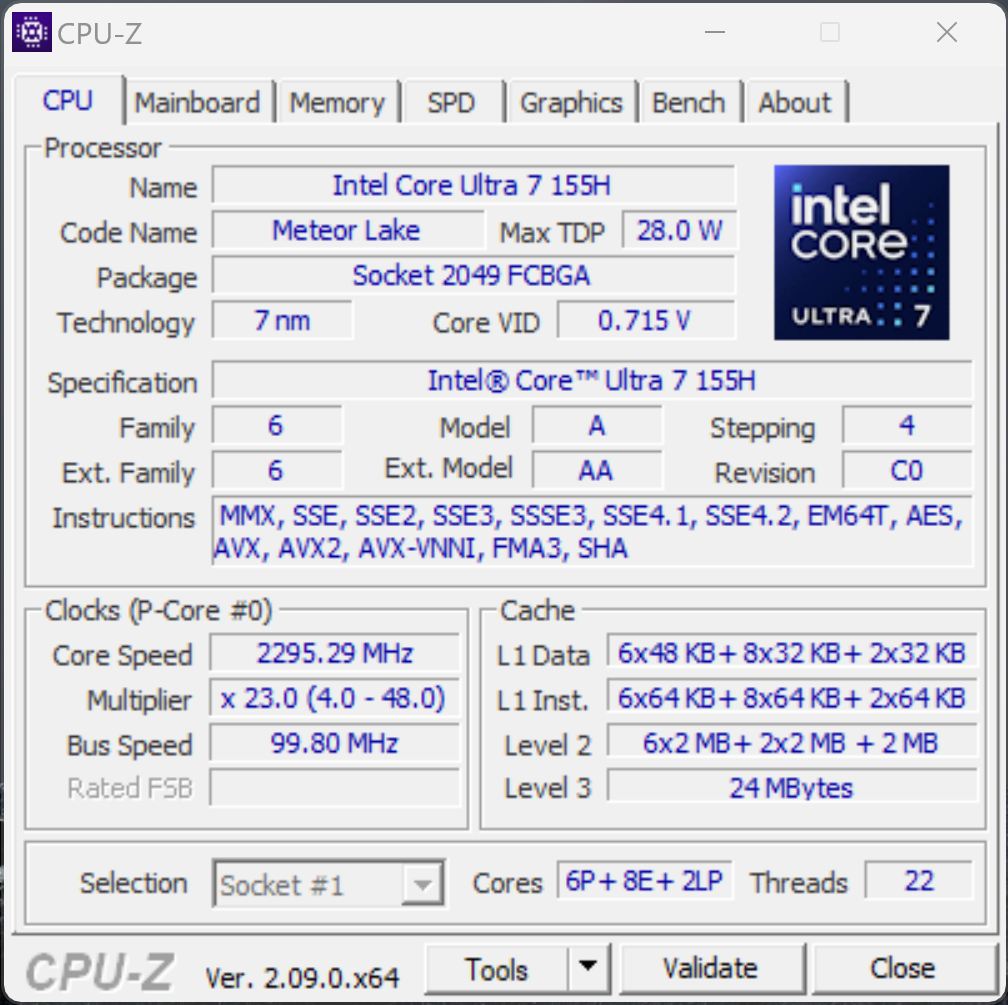
Processor - Core Ultra 7 155H
The Core Ultra 7 155H is part of Intel's current Meteor Lake generation, replacing the old Core i7-13700H. It has 16 cores (22 threads) and achieves a maximum core clock rate of 4.8 GHz. In addition, its overall multi-core performance is great, too, thanks to its high power limits (100/85 watts). However, there is practically no performance advantage over the old Raptor Lake chips and the differences between the individual devices come as a result of different power limits. When it comes to single-core performance, on the other hand, the new Meteor Lake chips have a slight disadvantage over the old Raptor Lake models such as the 13700H. In battery use, the processor is allowed to consume 75/45 watts (whereby the 75 watts can be held for quite a while) and its multi-core performance only drops by around 4 %. In turn, the differences are larger under longer periods of load. Further CPU benchmarks can be found in our tech section.
Cinebench R15 Multi continuous test
Cinebench R23: Multi Core | Single Core
Cinebench R20: CPU (Multi Core) | CPU (Single Core)
Cinebench R15: CPU Multi 64Bit | CPU Single 64Bit
Blender: v2.79 BMW27 CPU
7-Zip 18.03: 7z b 4 | 7z b 4 -mmt1
Geekbench 6.2: Multi-Core | Single-Core
Geekbench 5.5: Multi-Core | Single-Core
HWBOT x265 Benchmark v2.2: 4k Preset
LibreOffice : 20 Documents To PDF
R Benchmark 2.5: Overall mean
| CPU Performance Rating | |
| Lenovo Yoga Pro 9 16-IRP G8 | |
| Honor MagicBook Pro 16 2024 | |
| Dell XPS 16 9640 | |
| Asus ROG Zephyrus G16 2024 GU605M | |
| Dell XPS 15 9530 RTX 4070 -2! | |
| Samsung Galaxy Book4 Ultra | |
| SCHENKER VISION 16 Pro (M23) -2! | |
| Average Intel Core Ultra 7 155H | |
| Average of class Multimedia | |
| Cinebench R23 / Multi Core | |
| Lenovo Yoga Pro 9 16-IRP G8 | |
| Honor MagicBook Pro 16 2024 | |
| Dell XPS 16 9640 | |
| Asus ROG Zephyrus G16 2024 GU605M | |
| Samsung Galaxy Book4 Ultra | |
| Dell XPS 15 9530 RTX 4070 | |
| Average Intel Core Ultra 7 155H (9769 - 19007, n=29) | |
| SCHENKER VISION 16 Pro (M23) | |
| Average of class Multimedia (4624 - 30789, n=100, last 2 years) | |
| Cinebench R23 / Single Core | |
| SCHENKER VISION 16 Pro (M23) | |
| Lenovo Yoga Pro 9 16-IRP G8 | |
| Dell XPS 15 9530 RTX 4070 | |
| Dell XPS 16 9640 | |
| Samsung Galaxy Book4 Ultra | |
| Honor MagicBook Pro 16 2024 | |
| Average Intel Core Ultra 7 155H (1496 - 1801, n=29) | |
| Average of class Multimedia (878 - 2110, n=98, last 2 years) | |
| Asus ROG Zephyrus G16 2024 GU605M | |
| Cinebench R20 / CPU (Multi Core) | |
| Lenovo Yoga Pro 9 16-IRP G8 | |
| Honor MagicBook Pro 16 2024 | |
| Dell XPS 16 9640 | |
| Asus ROG Zephyrus G16 2024 GU605M | |
| Samsung Galaxy Book4 Ultra | |
| Dell XPS 15 9530 RTX 4070 | |
| Average Intel Core Ultra 7 155H (3798 - 7409, n=27) | |
| SCHENKER VISION 16 Pro (M23) | |
| Average of class Multimedia (1783 - 11768, n=96, last 2 years) | |
| Cinebench R20 / CPU (Single Core) | |
| Lenovo Yoga Pro 9 16-IRP G8 | |
| SCHENKER VISION 16 Pro (M23) | |
| Dell XPS 15 9530 RTX 4070 | |
| Asus ROG Zephyrus G16 2024 GU605M | |
| Samsung Galaxy Book4 Ultra | |
| Honor MagicBook Pro 16 2024 | |
| Dell XPS 16 9640 | |
| Average Intel Core Ultra 7 155H (620 - 693, n=27) | |
| Average of class Multimedia (341 - 812, n=96, last 2 years) | |
| Cinebench R15 / CPU Multi 64Bit | |
| Lenovo Yoga Pro 9 16-IRP G8 | |
| Honor MagicBook Pro 16 2024 | |
| Dell XPS 16 9640 | |
| Asus ROG Zephyrus G16 2024 GU605M | |
| Dell XPS 15 9530 RTX 4070 | |
| Samsung Galaxy Book4 Ultra | |
| Average Intel Core Ultra 7 155H (1988 - 2858, n=31) | |
| Average of class Multimedia (785 - 4703, n=104, last 2 years) | |
| SCHENKER VISION 16 Pro (M23) | |
| Cinebench R15 / CPU Single 64Bit | |
| SCHENKER VISION 16 Pro (M23) | |
| Lenovo Yoga Pro 9 16-IRP G8 | |
| Dell XPS 15 9530 RTX 4070 | |
| Honor MagicBook Pro 16 2024 | |
| Asus ROG Zephyrus G16 2024 GU605M | |
| Dell XPS 16 9640 | |
| Samsung Galaxy Book4 Ultra | |
| Average Intel Core Ultra 7 155H (230 - 268, n=28) | |
| Average of class Multimedia (142.6 - 308, n=98, last 2 years) | |
| Blender / v2.79 BMW27 CPU | |
| Average of class Multimedia (107 - 662, n=94, last 2 years) | |
| Average Intel Core Ultra 7 155H (178 - 349, n=25) | |
| SCHENKER VISION 16 Pro (M23) | |
| Samsung Galaxy Book4 Ultra | |
| Dell XPS 15 9530 RTX 4070 | |
| Asus ROG Zephyrus G16 2024 GU605M | |
| Honor MagicBook Pro 16 2024 | |
| Dell XPS 16 9640 | |
| Lenovo Yoga Pro 9 16-IRP G8 | |
| 7-Zip 18.03 / 7z b 4 | |
| Lenovo Yoga Pro 9 16-IRP G8 | |
| Dell XPS 16 9640 | |
| Honor MagicBook Pro 16 2024 | |
| Asus ROG Zephyrus G16 2024 GU605M | |
| Samsung Galaxy Book4 Ultra | |
| SCHENKER VISION 16 Pro (M23) | |
| Dell XPS 15 9530 RTX 4070 | |
| Average Intel Core Ultra 7 155H (42601 - 70074, n=27) | |
| Average of class Multimedia (20166 - 119900, n=89, last 2 years) | |
| 7-Zip 18.03 / 7z b 4 -mmt1 | |
| SCHENKER VISION 16 Pro (M23) | |
| Dell XPS 15 9530 RTX 4070 | |
| Lenovo Yoga Pro 9 16-IRP G8 | |
| Average of class Multimedia (3398 - 7163, n=89, last 2 years) | |
| Samsung Galaxy Book4 Ultra | |
| Honor MagicBook Pro 16 2024 | |
| Dell XPS 16 9640 | |
| Asus ROG Zephyrus G16 2024 GU605M | |
| Average Intel Core Ultra 7 155H (5037 - 5540, n=27) | |
| Geekbench 6.2 / Multi-Core | |
| Lenovo Yoga Pro 9 16-IRP G8 | |
| Dell XPS 16 9640 | |
| Average of class Multimedia (8656 - 21264, n=31, last 2 years) | |
| Asus ROG Zephyrus G16 2024 GU605M | |
| Honor MagicBook Pro 16 2024 | |
| Average Intel Core Ultra 7 155H (10696 - 13656, n=29) | |
| Samsung Galaxy Book4 Ultra | |
| Geekbench 6.2 / Single-Core | |
| Average of class Multimedia (2320 - 3157, n=31, last 2 years) | |
| Lenovo Yoga Pro 9 16-IRP G8 | |
| Honor MagicBook Pro 16 2024 | |
| Samsung Galaxy Book4 Ultra | |
| Dell XPS 16 9640 | |
| Asus ROG Zephyrus G16 2024 GU605M | |
| Average Intel Core Ultra 7 155H (2287 - 2459, n=29) | |
| Geekbench 5.5 / Multi-Core | |
| Lenovo Yoga Pro 9 16-IRP G8 | |
| Dell XPS 16 9640 | |
| Dell XPS 15 9530 RTX 4070 | |
| Honor MagicBook Pro 16 2024 | |
| Asus ROG Zephyrus G16 2024 GU605M | |
| Samsung Galaxy Book4 Ultra | |
| Average Intel Core Ultra 7 155H (10017 - 13556, n=29) | |
| SCHENKER VISION 16 Pro (M23) | |
| Average of class Multimedia (3828 - 23059, n=99, last 2 years) | |
| Geekbench 5.5 / Single-Core | |
| Dell XPS 15 9530 RTX 4070 | |
| SCHENKER VISION 16 Pro (M23) | |
| Samsung Galaxy Book4 Ultra | |
| Honor MagicBook Pro 16 2024 | |
| Lenovo Yoga Pro 9 16-IRP G8 | |
| Dell XPS 16 9640 | |
| Average Intel Core Ultra 7 155H (1689 - 1824, n=29) | |
| Average of class Multimedia (926 - 2342, n=99, last 2 years) | |
| Asus ROG Zephyrus G16 2024 GU605M | |
| HWBOT x265 Benchmark v2.2 / 4k Preset | |
| Lenovo Yoga Pro 9 16-IRP G8 | |
| Dell XPS 16 9640 | |
| Honor MagicBook Pro 16 2024 | |
| Asus ROG Zephyrus G16 2024 GU605M | |
| Dell XPS 15 9530 RTX 4070 | |
| Samsung Galaxy Book4 Ultra | |
| SCHENKER VISION 16 Pro (M23) | |
| Average Intel Core Ultra 7 155H (9.93 - 21.2, n=27) | |
| Average of class Multimedia (4.99 - 30.5, n=87, last 2 years) | |
| LibreOffice / 20 Documents To PDF | |
| Asus ROG Zephyrus G16 2024 GU605M | |
| Average of class Multimedia (6.7 - 84.9, n=91, last 2 years) | |
| Lenovo Yoga Pro 9 16-IRP G8 | |
| SCHENKER VISION 16 Pro (M23) | |
| Average Intel Core Ultra 7 155H (40.9 - 58.9, n=27) | |
| Honor MagicBook Pro 16 2024 | |
| Samsung Galaxy Book4 Ultra | |
| Dell XPS 16 9640 | |
| Dell XPS 15 9530 RTX 4070 | |
| R Benchmark 2.5 / Overall mean | |
| Dell XPS 16 9640 | |
| Average of class Multimedia (0.3826 - 0.723, n=89, last 2 years) | |
| Average Intel Core Ultra 7 155H (0.4609 - 0.516, n=27) | |
| Samsung Galaxy Book4 Ultra | |
| Asus ROG Zephyrus G16 2024 GU605M | |
| Honor MagicBook Pro 16 2024 | |
| Lenovo Yoga Pro 9 16-IRP G8 | |
| Dell XPS 15 9530 RTX 4070 | |
| SCHENKER VISION 16 Pro (M23) | |
* ... smaller is better
AIDA64: FP32 Ray-Trace | FPU Julia | CPU SHA3 | CPU Queen | FPU SinJulia | FPU Mandel | CPU AES | CPU ZLib | FP64 Ray-Trace | CPU PhotoWorxx
| Performance Rating | |
| Honor MagicBook Pro 16 2024 | |
| Lenovo Yoga Pro 9 16-IRP G8 | |
| Dell XPS 16 9640 | |
| Asus ROG Zephyrus G16 2024 GU605M | |
| Samsung Galaxy Book4 Ultra | |
| SCHENKER VISION 16 Pro (M23) | |
| Dell XPS 15 9530 RTX 4070 | |
| Average Intel Core Ultra 7 155H | |
| Average of class Multimedia | |
| AIDA64 / FP32 Ray-Trace | |
| Lenovo Yoga Pro 9 16-IRP G8 | |
| Honor MagicBook Pro 16 2024 | |
| Dell XPS 16 9640 | |
| Asus ROG Zephyrus G16 2024 GU605M | |
| Dell XPS 15 9530 RTX 4070 | |
| Samsung Galaxy Book4 Ultra | |
| SCHENKER VISION 16 Pro (M23) | |
| Average Intel Core Ultra 7 155H (6670 - 18470, n=27) | |
| Average of class Multimedia (3804 - 27411, n=87, last 2 years) | |
| AIDA64 / FPU Julia | |
| Honor MagicBook Pro 16 2024 | |
| Lenovo Yoga Pro 9 16-IRP G8 | |
| Dell XPS 16 9640 | |
| Asus ROG Zephyrus G16 2024 GU605M | |
| Samsung Galaxy Book4 Ultra | |
| SCHENKER VISION 16 Pro (M23) | |
| Average Intel Core Ultra 7 155H (43630 - 93181, n=27) | |
| Dell XPS 15 9530 RTX 4070 | |
| Average of class Multimedia (16379 - 136048, n=87, last 2 years) | |
| AIDA64 / CPU SHA3 | |
| Honor MagicBook Pro 16 2024 | |
| Lenovo Yoga Pro 9 16-IRP G8 | |
| Dell XPS 16 9640 | |
| Asus ROG Zephyrus G16 2024 GU605M | |
| Samsung Galaxy Book4 Ultra | |
| Average Intel Core Ultra 7 155H (1940 - 4436, n=27) | |
| SCHENKER VISION 16 Pro (M23) | |
| Dell XPS 15 9530 RTX 4070 | |
| Average of class Multimedia (1099 - 6681, n=87, last 2 years) | |
| AIDA64 / CPU Queen | |
| Lenovo Yoga Pro 9 16-IRP G8 | |
| Dell XPS 15 9530 RTX 4070 | |
| SCHENKER VISION 16 Pro (M23) | |
| Average of class Multimedia (21547 - 134321, n=87, last 2 years) | |
| Asus ROG Zephyrus G16 2024 GU605M | |
| Dell XPS 16 9640 | |
| Samsung Galaxy Book4 Ultra | |
| Honor MagicBook Pro 16 2024 | |
| Average Intel Core Ultra 7 155H (64698 - 93266, n=27) | |
| AIDA64 / FPU SinJulia | |
| Lenovo Yoga Pro 9 16-IRP G8 | |
| Asus ROG Zephyrus G16 2024 GU605M | |
| Honor MagicBook Pro 16 2024 | |
| Dell XPS 16 9640 | |
| Samsung Galaxy Book4 Ultra | |
| Average Intel Core Ultra 7 155H (5639 - 10647, n=27) | |
| Average of class Multimedia (3099 - 15484, n=87, last 2 years) | |
| SCHENKER VISION 16 Pro (M23) | |
| Dell XPS 15 9530 RTX 4070 | |
| AIDA64 / FPU Mandel | |
| Dell XPS 16 9640 | |
| Honor MagicBook Pro 16 2024 | |
| Lenovo Yoga Pro 9 16-IRP G8 | |
| Asus ROG Zephyrus G16 2024 GU605M | |
| Samsung Galaxy Book4 Ultra | |
| Average Intel Core Ultra 7 155H (21052 - 47685, n=27) | |
| Dell XPS 15 9530 RTX 4070 | |
| Average of class Multimedia (9602 - 68591, n=87, last 2 years) | |
| SCHENKER VISION 16 Pro (M23) | |
| AIDA64 / CPU AES | |
| Honor MagicBook Pro 16 2024 | |
| Lenovo Yoga Pro 9 16-IRP G8 | |
| Dell XPS 16 9640 | |
| Asus ROG Zephyrus G16 2024 GU605M | |
| Average of class Multimedia (23702 - 169946, n=87, last 2 years) | |
| Average Intel Core Ultra 7 155H (45713 - 152179, n=27) | |
| Samsung Galaxy Book4 Ultra | |
| SCHENKER VISION 16 Pro (M23) | |
| Dell XPS 15 9530 RTX 4070 | |
| AIDA64 / CPU ZLib | |
| Honor MagicBook Pro 16 2024 | |
| Lenovo Yoga Pro 9 16-IRP G8 | |
| Dell XPS 16 9640 | |
| Asus ROG Zephyrus G16 2024 GU605M | |
| Samsung Galaxy Book4 Ultra | |
| Average Intel Core Ultra 7 155H (557 - 1250, n=27) | |
| SCHENKER VISION 16 Pro (M23) | |
| Dell XPS 15 9530 RTX 4070 | |
| Average of class Multimedia (302 - 1901, n=87, last 2 years) | |
| AIDA64 / FP64 Ray-Trace | |
| Lenovo Yoga Pro 9 16-IRP G8 | |
| Dell XPS 16 9640 | |
| Honor MagicBook Pro 16 2024 | |
| Asus ROG Zephyrus G16 2024 GU605M | |
| Dell XPS 15 9530 RTX 4070 | |
| SCHENKER VISION 16 Pro (M23) | |
| Samsung Galaxy Book4 Ultra | |
| Average Intel Core Ultra 7 155H (3569 - 9802, n=27) | |
| Average of class Multimedia (1996 - 14590, n=87, last 2 years) | |
| AIDA64 / CPU PhotoWorxx | |
| Lenovo Yoga Pro 9 16-IRP G8 | |
| Dell XPS 16 9640 | |
| Samsung Galaxy Book4 Ultra | |
| Asus ROG Zephyrus G16 2024 GU605M | |
| Average Intel Core Ultra 7 155H (32719 - 54223, n=27) | |
| Honor MagicBook Pro 16 2024 | |
| SCHENKER VISION 16 Pro (M23) | |
| Dell XPS 15 9530 RTX 4070 | |
| Average of class Multimedia (7419 - 53918, n=87, last 2 years) | |
System performance
In everyday use, the new XPS 16 9640 is a very responsive device and we noted no abnormalities in the synthetic benchmarks either. We had no problems with the laptop during our test.
CrossMark: Overall | Productivity | Creativity | Responsiveness
WebXPRT 3: Overall
WebXPRT 4: Overall
Mozilla Kraken 1.1: Total
| PCMark 10 / Score | |
| SCHENKER VISION 16 Pro (M23) | |
| Average Intel Core Ultra 7 155H, NVIDIA GeForce RTX 4070 Laptop GPU (7084 - 7761, n=3) | |
| Lenovo Yoga Pro 9 16-IRP G8 | |
| Dell XPS 15 9530 RTX 4070 | |
| Asus ROG Zephyrus G16 2024 GU605M | |
| Dell XPS 16 9640 | |
| Samsung Galaxy Book4 Ultra | |
| Honor MagicBook Pro 16 2024 | |
| Average of class Multimedia (4635 - 8670, n=84, last 2 years) | |
| PCMark 10 / Essentials | |
| Dell XPS 15 9530 RTX 4070 | |
| Lenovo Yoga Pro 9 16-IRP G8 | |
| SCHENKER VISION 16 Pro (M23) | |
| Average of class Multimedia (8480 - 12420, n=84, last 2 years) | |
| Samsung Galaxy Book4 Ultra | |
| Dell XPS 16 9640 | |
| Average Intel Core Ultra 7 155H, NVIDIA GeForce RTX 4070 Laptop GPU (10038 - 10393, n=3) | |
| Asus ROG Zephyrus G16 2024 GU605M | |
| Honor MagicBook Pro 16 2024 | |
| PCMark 10 / Productivity | |
| SCHENKER VISION 16 Pro (M23) | |
| Average Intel Core Ultra 7 155H, NVIDIA GeForce RTX 4070 Laptop GPU (9192 - 9422, n=3) | |
| Asus ROG Zephyrus G16 2024 GU605M | |
| Dell XPS 16 9640 | |
| Samsung Galaxy Book4 Ultra | |
| Lenovo Yoga Pro 9 16-IRP G8 | |
| Average of class Multimedia (5845 - 11186, n=84, last 2 years) | |
| Dell XPS 15 9530 RTX 4070 | |
| Honor MagicBook Pro 16 2024 | |
| PCMark 10 / Digital Content Creation | |
| Average Intel Core Ultra 7 155H, NVIDIA GeForce RTX 4070 Laptop GPU (10100 - 13035, n=3) | |
| Lenovo Yoga Pro 9 16-IRP G8 | |
| SCHENKER VISION 16 Pro (M23) | |
| Honor MagicBook Pro 16 2024 | |
| Dell XPS 15 9530 RTX 4070 | |
| Asus ROG Zephyrus G16 2024 GU605M | |
| Dell XPS 16 9640 | |
| Samsung Galaxy Book4 Ultra | |
| Average of class Multimedia (4688 - 13548, n=84, last 2 years) | |
| CrossMark / Overall | |
| SCHENKER VISION 16 Pro (M23) | |
| Dell XPS 15 9530 RTX 4070 | |
| Dell XPS 16 9640 | |
| Lenovo Yoga Pro 9 16-IRP G8 | |
| Average Intel Core Ultra 7 155H, NVIDIA GeForce RTX 4070 Laptop GPU (1721 - 1848, n=3) | |
| Samsung Galaxy Book4 Ultra | |
| Honor MagicBook Pro 16 2024 | |
| Asus ROG Zephyrus G16 2024 GU605M | |
| Average of class Multimedia (1009 - 2146, n=90, last 2 years) | |
| CrossMark / Productivity | |
| SCHENKER VISION 16 Pro (M23) | |
| Dell XPS 15 9530 RTX 4070 | |
| Dell XPS 16 9640 | |
| Lenovo Yoga Pro 9 16-IRP G8 | |
| Average Intel Core Ultra 7 155H, NVIDIA GeForce RTX 4070 Laptop GPU (1624 - 1750, n=3) | |
| Honor MagicBook Pro 16 2024 | |
| Samsung Galaxy Book4 Ultra | |
| Asus ROG Zephyrus G16 2024 GU605M | |
| Average of class Multimedia (971 - 2064, n=90, last 2 years) | |
| CrossMark / Creativity | |
| Dell XPS 15 9530 RTX 4070 | |
| Lenovo Yoga Pro 9 16-IRP G8 | |
| Dell XPS 16 9640 | |
| SCHENKER VISION 16 Pro (M23) | |
| Average Intel Core Ultra 7 155H, NVIDIA GeForce RTX 4070 Laptop GPU (1913 - 2014, n=3) | |
| Asus ROG Zephyrus G16 2024 GU605M | |
| Samsung Galaxy Book4 Ultra | |
| Average of class Multimedia (1054 - 2865, n=90, last 2 years) | |
| Honor MagicBook Pro 16 2024 | |
| CrossMark / Responsiveness | |
| SCHENKER VISION 16 Pro (M23) | |
| Dell XPS 16 9640 | |
| Dell XPS 15 9530 RTX 4070 | |
| Honor MagicBook Pro 16 2024 | |
| Average Intel Core Ultra 7 155H, NVIDIA GeForce RTX 4070 Laptop GPU (1424 - 1683, n=3) | |
| Lenovo Yoga Pro 9 16-IRP G8 | |
| Samsung Galaxy Book4 Ultra | |
| Average of class Multimedia (926 - 2171, n=90, last 2 years) | |
| Asus ROG Zephyrus G16 2024 GU605M | |
| WebXPRT 3 / Overall | |
| Dell XPS 15 9530 RTX 4070 | |
| SCHENKER VISION 16 Pro (M23) | |
| Lenovo Yoga Pro 9 16-IRP G8 | |
| Average of class Multimedia (171.4 - 432, n=92, last 2 years) | |
| Honor MagicBook Pro 16 2024 | |
| Average Intel Core Ultra 7 155H, NVIDIA GeForce RTX 4070 Laptop GPU (283 - 294, n=3) | |
| Asus ROG Zephyrus G16 2024 GU605M | |
| Dell XPS 16 9640 | |
| Samsung Galaxy Book4 Ultra | |
| WebXPRT 4 / Overall | |
| Dell XPS 15 9530 RTX 4070 | |
| SCHENKER VISION 16 Pro (M23) | |
| Lenovo Yoga Pro 9 16-IRP G8 | |
| Honor MagicBook Pro 16 2024 | |
| Samsung Galaxy Book4 Ultra | |
| Asus ROG Zephyrus G16 2024 GU605M | |
| Average Intel Core Ultra 7 155H, NVIDIA GeForce RTX 4070 Laptop GPU (254 - 257, n=3) | |
| Dell XPS 16 9640 | |
| Average of class Multimedia (133.2 - 348, n=71, last 2 years) | |
| Mozilla Kraken 1.1 / Total | |
| Asus ROG Zephyrus G16 2024 GU605M | |
| Average Intel Core Ultra 7 155H, NVIDIA GeForce RTX 4070 Laptop GPU (546 - 548, n=2) | |
| Average of class Multimedia (363 - 1016, n=94, last 2 years) | |
| Honor MagicBook Pro 16 2024 | |
| Lenovo Yoga Pro 9 16-IRP G8 | |
| Dell XPS 15 9530 RTX 4070 | |
| SCHENKER VISION 16 Pro (M23) | |
| Samsung Galaxy Book4 Ultra | |
* ... smaller is better
| PCMark 10 Score | 7084 points | |
Help | ||
| AIDA64 / Memory Copy | |
| Dell XPS 16 9640 | |
| Samsung Galaxy Book4 Ultra | |
| Asus ROG Zephyrus G16 2024 GU605M | |
| Average Intel Core Ultra 7 155H (62397 - 96791, n=27) | |
| Honor MagicBook Pro 16 2024 | |
| Lenovo Yoga Pro 9 16-IRP G8 | |
| Dell XPS 15 9530 RTX 4070 | |
| SCHENKER VISION 16 Pro (M23) | |
| Average of class Multimedia (20513 - 94254, n=87, last 2 years) | |
| AIDA64 / Memory Read | |
| Samsung Galaxy Book4 Ultra | |
| Asus ROG Zephyrus G16 2024 GU605M | |
| Dell XPS 16 9640 | |
| Average Intel Core Ultra 7 155H (60544 - 90647, n=27) | |
| Lenovo Yoga Pro 9 16-IRP G8 | |
| Honor MagicBook Pro 16 2024 | |
| SCHENKER VISION 16 Pro (M23) | |
| Dell XPS 15 9530 RTX 4070 | |
| Average of class Multimedia (22917 - 90142, n=87, last 2 years) | |
| AIDA64 / Memory Write | |
| Lenovo Yoga Pro 9 16-IRP G8 | |
| Honor MagicBook Pro 16 2024 | |
| Samsung Galaxy Book4 Ultra | |
| Average Intel Core Ultra 7 155H (64852 - 93451, n=27) | |
| Dell XPS 16 9640 | |
| Asus ROG Zephyrus G16 2024 GU605M | |
| Dell XPS 15 9530 RTX 4070 | |
| SCHENKER VISION 16 Pro (M23) | |
| Average of class Multimedia (20226 - 95196, n=87, last 2 years) | |
| AIDA64 / Memory Latency | |
| Average Intel Core Ultra 7 155H (125.8 - 173, n=27) | |
| Honor MagicBook Pro 16 2024 | |
| Samsung Galaxy Book4 Ultra | |
| Asus ROG Zephyrus G16 2024 GU605M | |
| Dell XPS 16 9640 | |
| Lenovo Yoga Pro 9 16-IRP G8 | |
| Average of class Multimedia (75 - 346, n=86, last 2 years) | |
| Dell XPS 15 9530 RTX 4070 | |
| SCHENKER VISION 16 Pro (M23) | |
* ... smaller is better
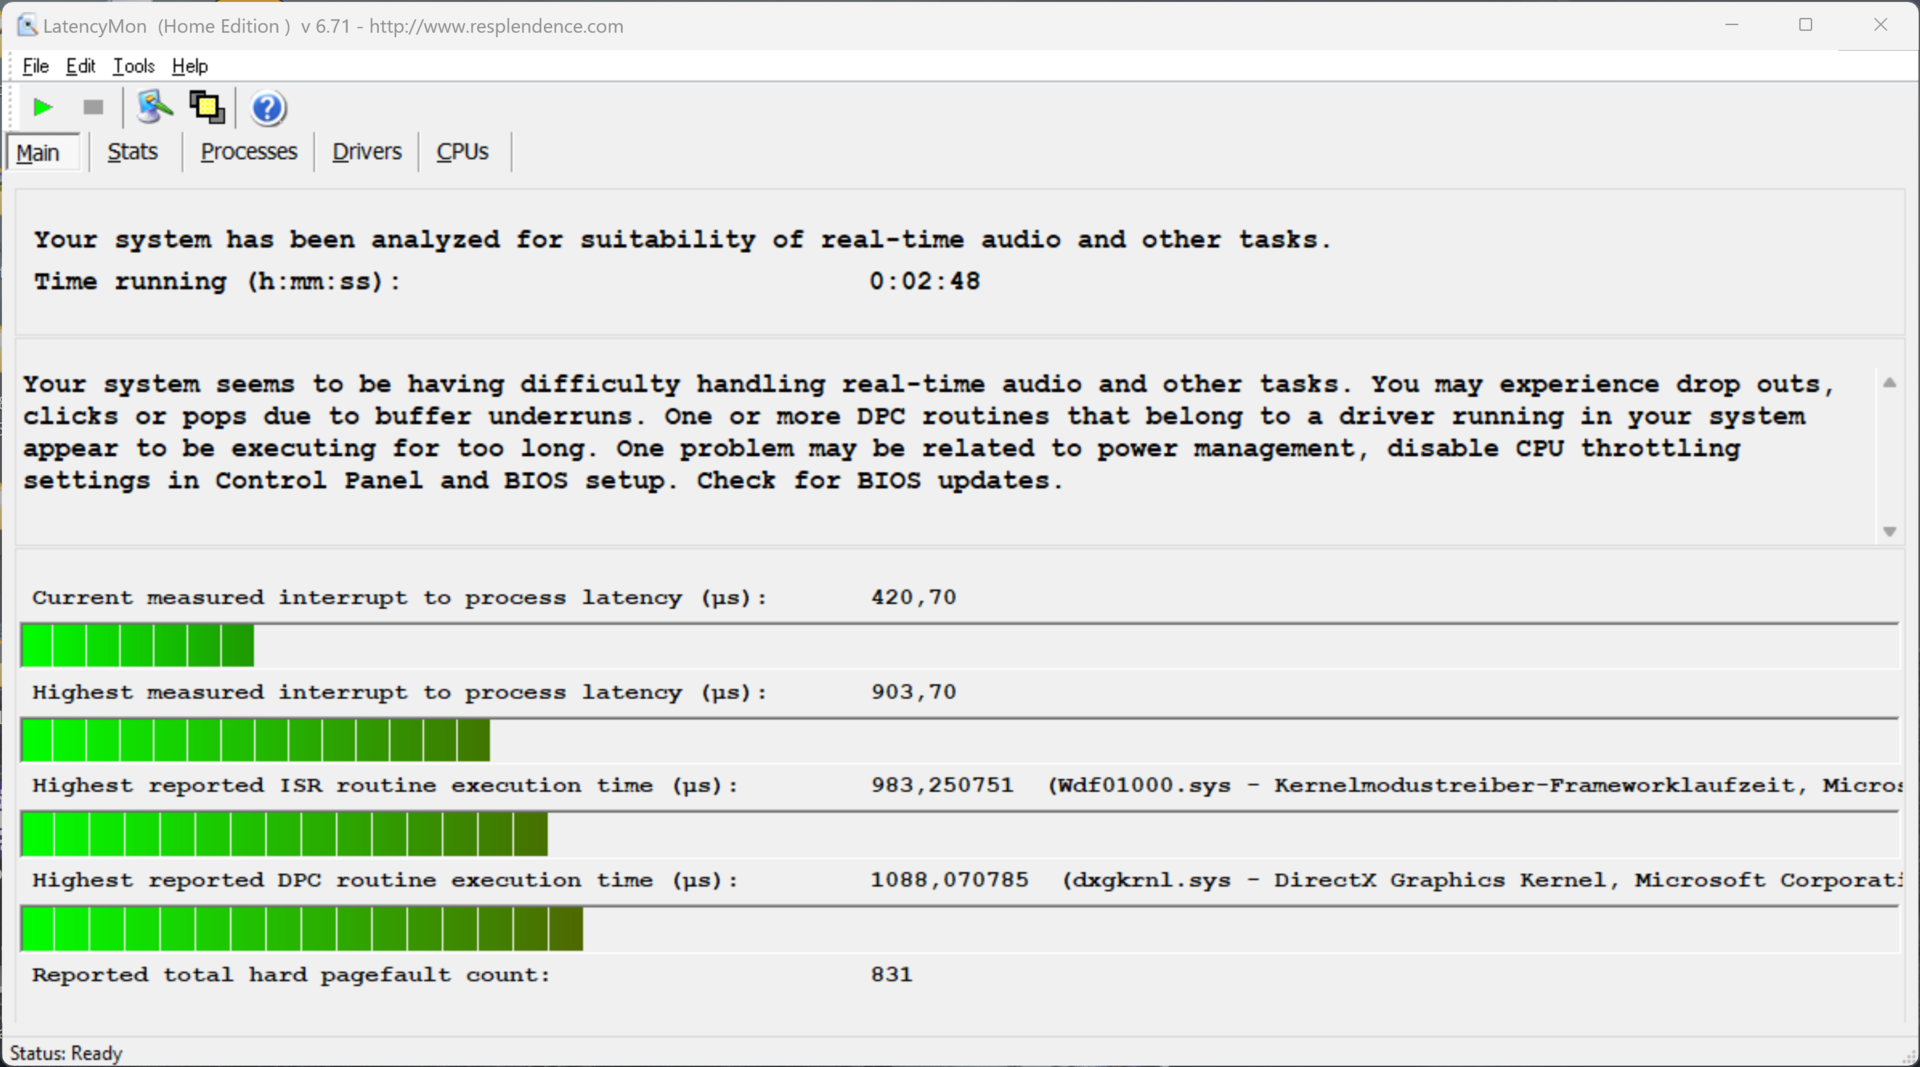
DPC latency
In our standardized latency test (surfing the web, 4K YouTube playback, CPU load), our test device with the current BIOS version only showed slight limitations when using real-time audio applications.

| DPC Latencies / LatencyMon - interrupt to process latency (max), Web, Youtube, Prime95 | |
| Lenovo Yoga Pro 9 16-IRP G8 | |
| Asus ROG Zephyrus G16 2024 GU605M | |
| Honor MagicBook Pro 16 2024 | |
| Dell XPS 15 9530 RTX 4070 | |
| Dell XPS 16 9640 | |
| SCHENKER VISION 16 Pro (M23) | |
| Samsung Galaxy Book4 Ultra | |
* ... smaller is better
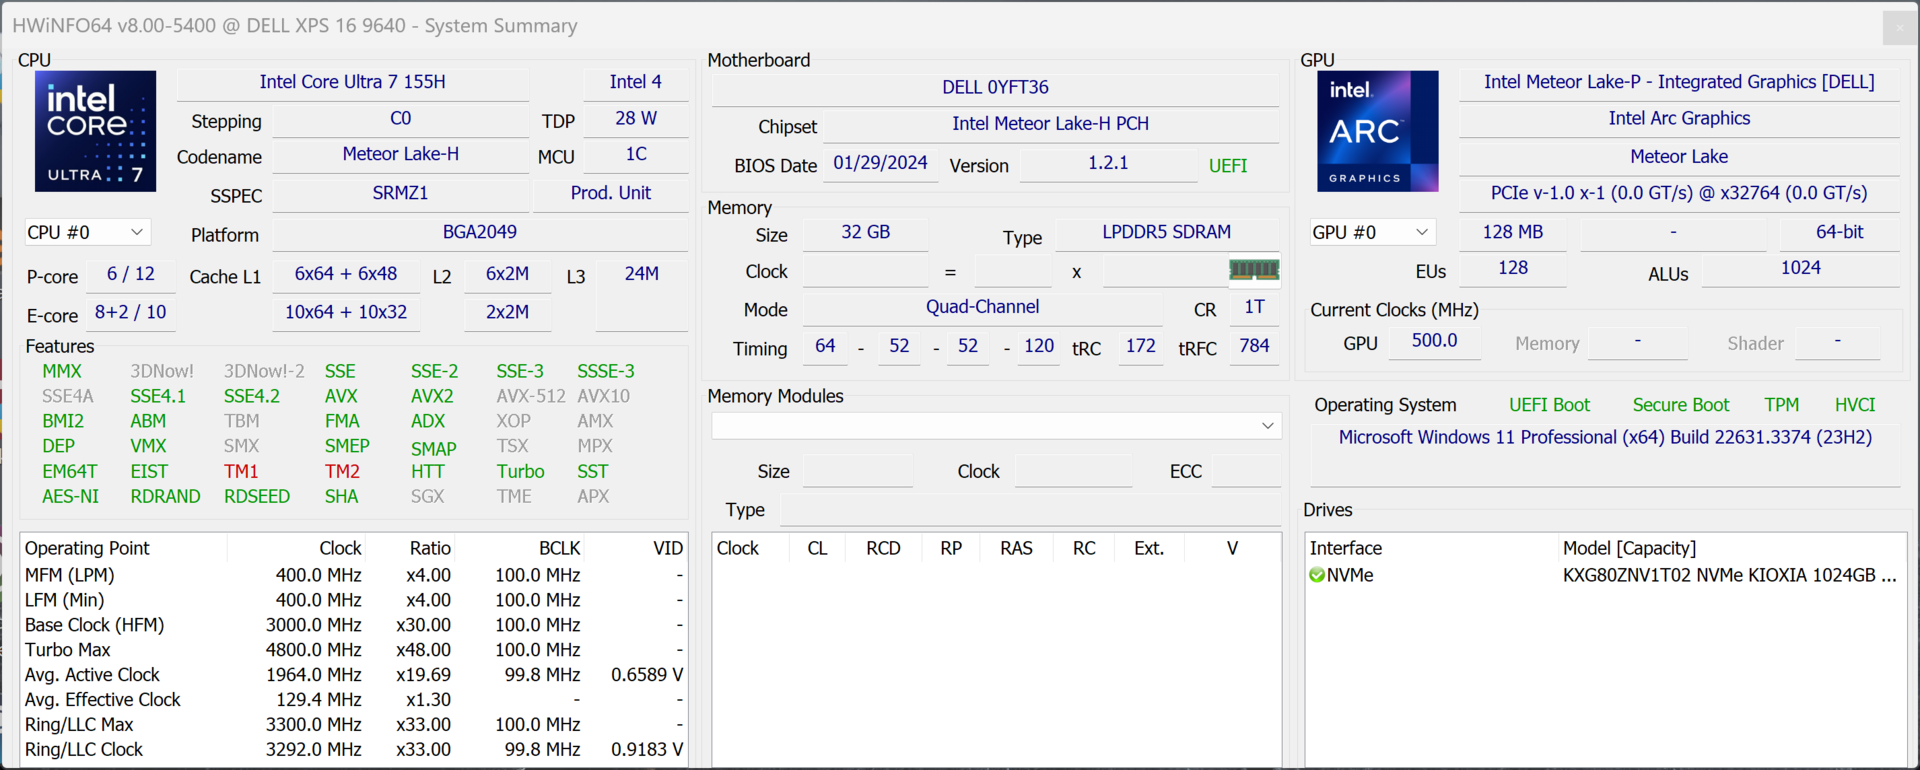
Storage device
A 1-TB version of the Kioxia XG8 is installed into our test device, with 834 GB available to users after first booting up the laptop. The PCIe-4.0 SSD's performance is very good and, above all, very stable. There is no slot for an additional SSD. Further SSD benchmarks are listed here.

* ... smaller is better
Reading continuous performance: DiskSpd Read Loop, Queue Depth 8
Graphics card
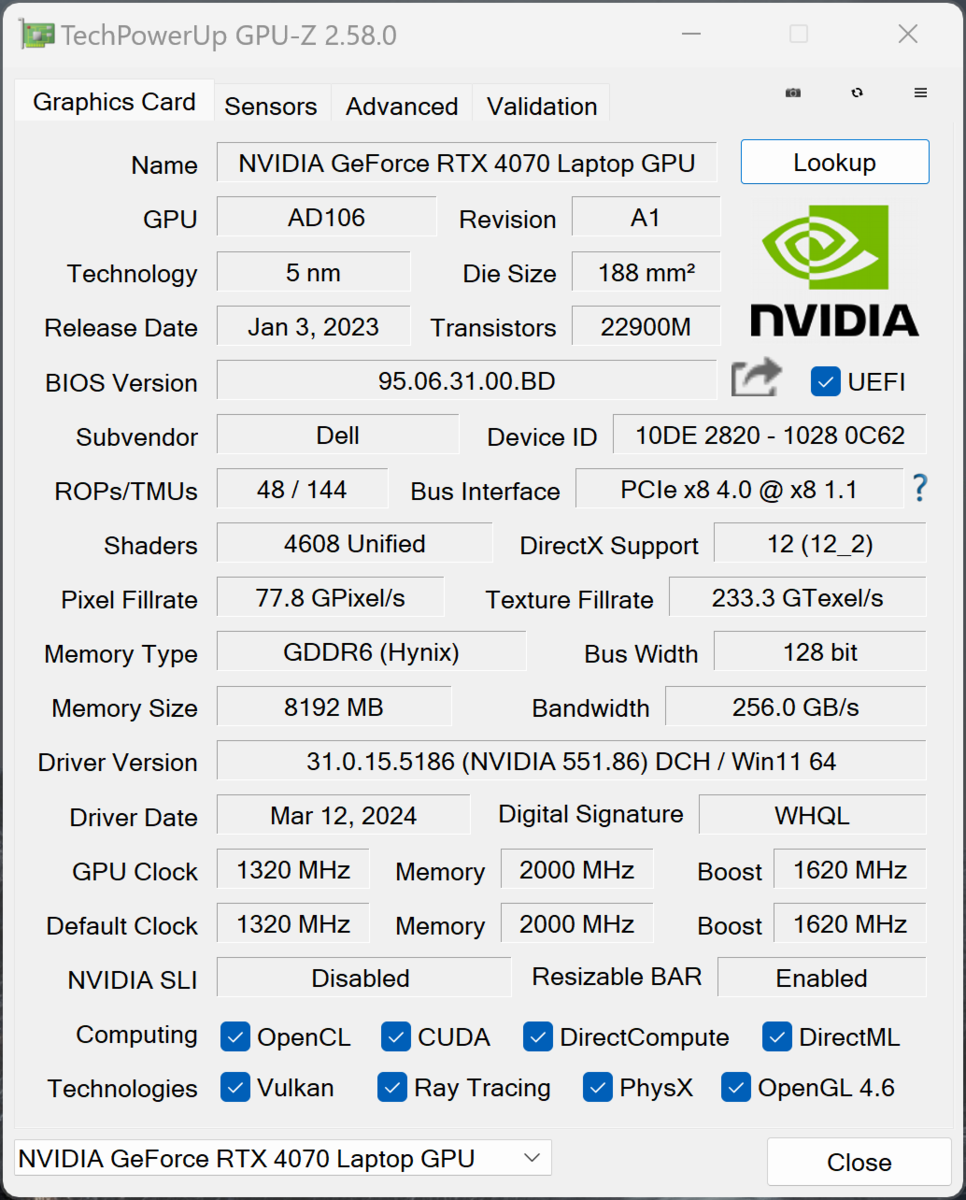
Our test device is equipped with the GeForce RTX 4070 Laptop with 8 GB VRAM, whereby its TGP is 50-60 watts depending on the selected energy profile. The XPS 16 has a MUX switch and supports graphics switching via Advanced Optimus— simple graphics calculations are handled by the integrated Intel Arc Graphics.
As a result, its performance is better than the old XPS 15 featuring the 50-watt version of the RTX 4070 Laptop, but the competitors within this segment offer faster models and, as a result, also more GPU performance. Last year's Yoga Pro 9 16 with the 100-watt version of the RTX 4060 Laptop, for example, is not much slower. In this aspect, a lot more could've been possible.
Its graphics performance remains stable under continuous load, but the GPU is allowed to consume a maximum of 50 watts in battery mode, leading to a performance reduction of just under 10 %. Further GPU benchmarks can be found here.
| 3DMark 11 Performance | 29315 points | |
| 3DMark Fire Strike Score | 21848 points | |
| 3DMark Time Spy Score | 9774 points | |
Help | ||
| Blender / v3.3 Classroom OPTIX/RTX | |
| Average of class Multimedia (19 - 99, n=45, last 2 years) | |
| Samsung Galaxy Book4 Ultra | |
| Dell XPS 15 9530 RTX 4070 | |
| Lenovo Yoga Pro 9 16-IRP G8 | |
| SCHENKER VISION 16 Pro (M23) | |
| Honor MagicBook Pro 16 2024 | |
| Asus ROG Zephyrus G16 2024 GU605M | |
| Average NVIDIA GeForce RTX 4070 Laptop GPU (18 - 28, n=49) | |
| Dell XPS 16 9640 | |
| Blender / v3.3 Classroom CUDA | |
| Average of class Multimedia (32 - 152, n=47, last 2 years) | |
| Samsung Galaxy Book4 Ultra | |
| Dell XPS 15 9530 RTX 4070 | |
| Lenovo Yoga Pro 9 16-IRP G8 | |
| Honor MagicBook Pro 16 2024 | |
| Average NVIDIA GeForce RTX 4070 Laptop GPU (32 - 142, n=52) | |
| Dell XPS 16 9640 | |
| SCHENKER VISION 16 Pro (M23) | |
| Asus ROG Zephyrus G16 2024 GU605M | |
| Blender / v3.3 Classroom CPU | |
| Average of class Multimedia (190 - 1374, n=84, last 2 years) | |
| SCHENKER VISION 16 Pro (M23) | |
| Samsung Galaxy Book4 Ultra | |
| Dell XPS 15 9530 RTX 4070 | |
| Asus ROG Zephyrus G16 2024 GU605M | |
| Honor MagicBook Pro 16 2024 | |
| Lenovo Yoga Pro 9 16-IRP G8 | |
| Dell XPS 16 9640 | |
| Average NVIDIA GeForce RTX 4070 Laptop GPU (158 - 428, n=49) | |
* ... smaller is better
Gaming performance
With the RTX 4070 Laptop, the XPS 16 9640's gaming performance isn't too shabby—all the games we tested could be played smoothly in QHD resolution with maximum details. For the screen's native resolution of 3,840 x 2,400 pixels, however, you either have to reduce the details or make use of upscaling technologies such as Nvidia's DLSS. Compared to the competition, the XPS is once again inferior to the models fitted with the RTX 4070 Laptop and fast versions of the RTX 4060 Laptop (Honor MagicBook Pro, Lenovo Yoga Pro 9 16). Its gaming performance remains stable even during longer sessions.
| The Witcher 3 - 1920x1080 Ultra Graphics & Postprocessing (HBAO+) | |
| SCHENKER VISION 16 Pro (M23) | |
| Asus ROG Zephyrus G16 2024 GU605M | |
| Lenovo Yoga Pro 9 16-IRP G8 | |
| Dell XPS 16 9640 | |
| Honor MagicBook Pro 16 2024 | |
| Dell XPS 15 9530 RTX 4070 | |
| Samsung Galaxy Book4 Ultra | |
| Average of class Multimedia (8 - 143.2, n=98, last 2 years) | |
| GTA V - 1920x1080 Highest Settings possible AA:4xMSAA + FX AF:16x | |
| Lenovo Yoga Pro 9 16-IRP G8 | |
| Dell XPS 16 9640 | |
| Honor MagicBook Pro 16 2024 | |
| Asus ROG Zephyrus G16 2024 GU605M | |
| SCHENKER VISION 16 Pro (M23) | |
| Samsung Galaxy Book4 Ultra | |
| Dell XPS 15 9530 RTX 4070 | |
| Average of class Multimedia (4.24 - 123, n=87, last 2 years) | |
| Cyberpunk 2077 2.0 Phantom Liberty | |
| 1920x1080 Ultra Preset (FSR off) | |
| Average NVIDIA GeForce RTX 4070 Laptop GPU (64.3 - 90.7, n=18) | |
| Asus ROG Zephyrus G16 2024 GU605M | |
| Dell XPS 16 9640 | |
| Honor MagicBook Pro 16 2024 | |
| Average of class Multimedia (18.1 - 76.9, n=21, last 2 years) | |
| Samsung Galaxy Book4 Ultra | |
| 2560x1440 Ultra Preset (FSR off) | |
| Average NVIDIA GeForce RTX 4070 Laptop GPU (39.6 - 57.1, n=18) | |
| Asus ROG Zephyrus G16 2024 GU605M | |
| Dell XPS 16 9640 | |
| Honor MagicBook Pro 16 2024 | |
| Average of class Multimedia (17.3 - 47.8, n=11, last 2 years) | |
| Samsung Galaxy Book4 Ultra | |
| Baldur's Gate 3 | |
| 1920x1080 Ultra Preset | |
| Average NVIDIA GeForce RTX 4070 Laptop GPU (71.3 - 128.5, n=13) | |
| Dell XPS 16 9640 | |
| Average of class Multimedia (14.8 - 117.7, n=13, last 2 years) | |
| 2560x1440 Ultra Preset | |
| Average NVIDIA GeForce RTX 4070 Laptop GPU (54.4 - 89.6, n=12) | |
| Dell XPS 16 9640 | |
| Average of class Multimedia (29 - 79.8, n=6, last 2 years) | |
| Horizon Forbidden West | |
| 1920x1080 Very High Preset AA:T | |
| Average NVIDIA GeForce RTX 4070 Laptop GPU (53.2 - 76.7, n=6) | |
| Average of class Multimedia (53.2 - 65.4, n=2, last 2 years) | |
| Dell XPS 16 9640 | |
| 2560x1440 Very High Preset AA:T | |
| Average NVIDIA GeForce RTX 4070 Laptop GPU (40.3 - 59.1, n=6) | |
| Average of class Multimedia (40.3 - 56.1, n=2, last 2 years) | |
| Dell XPS 16 9640 | |
Witcher 3 FPS diagram
| low | med. | high | ultra | QHD | 4K | |
| GTA V (2015) | 177 | 170.7 | 103.6 | 81.3 | ||
| The Witcher 3 (2015) | 399 | 327 | 195 | 87.8 | 73 | |
| Dota 2 Reborn (2015) | 89.8 | 89.6 | 89.5 | 89.7 | 115.7 | |
| Final Fantasy XV Benchmark (2018) | 150.2 | 123.2 | 93.1 | 70 | ||
| X-Plane 11.11 (2018) | 125.1 | 108.5 | 84.7 | 68.9 | ||
| Far Cry 5 (2018) | 140 | 126 | 122 | 115 | 94 | |
| Strange Brigade (2018) | 423 | 258 | 202 | 175 | 116 | |
| F1 23 (2023) | 214 | 189.7 | 175.1 | 55.5 | 35.2 | |
| Baldur's Gate 3 (2023) | 135.7 | 107.1 | 93.5 | 91.8 | 63.8 | |
| Cyberpunk 2077 2.0 Phantom Liberty (2023) | 112 | 87.6 | 74.7 | 64.3 | 39.6 | |
| Horizon Forbidden West (2024) | 96.6 | 83.7 | 58.5 | 53.2 | 40.3 |
Emissions - Dell has installed a Vapor Chamber into the XPS 16
Noise emissions
In contrast to the smaller XPS 14's conventional cooler, Dell has installed a Vapor Chamber cooling unit with two fans into the larger XPS 16. Especially under low load, the fans often remain deactivated or simply very quiet—but under higher load, it still gets loud pretty quickly. We were particularly surprised by the small difference between the profiles Optimized (max. 48.1 dB(A)) and Ultra Performance (max. 49.7 dB(A)), with both being too loud to be able to play games without the need for headphones. At a maximum of 43.3 dB(A), the Quiet profile isn't really very quiet at all. Quite a few competitors, such as the MagicBook Pro or the Zephyrus G16, deliver better performance with lower noise emissions. We didn't note any additional electronic noises coming from our test sample.
Noise Level
| Idle |
| 24.5 / 24.5 / 27.5 dB(A) |
| Load |
| 39.6 / 49.7 dB(A) |
 | ||
30 dB silent 40 dB(A) audible 50 dB(A) loud |
||
min: | ||
| Dell XPS 16 9640 NVIDIA GeForce RTX 4070 Laptop GPU, Ultra 7 155H, Kioxia XG8 KXG80ZNV1T02 | Samsung Galaxy Book4 Ultra NVIDIA GeForce RTX 4050 Laptop GPU, Ultra 7 155H, Samsung PM9A1 MZVL2512HCJQ | Honor MagicBook Pro 16 2024 NVIDIA GeForce RTX 4060 Laptop GPU, Ultra 7 155H, WD PC SN740 SDDPNQD-1T00 | Asus ROG Zephyrus G16 2024 GU605M NVIDIA GeForce RTX 4070 Laptop GPU, Ultra 7 155H, WD PC SN560 SDDPNQE-1T00 | Lenovo Yoga Pro 9 16-IRP G8 NVIDIA GeForce RTX 4060 Laptop GPU, i7-13705H, Samsung PM9A1 MZVL21T0HCLR | SCHENKER VISION 16 Pro (M23) NVIDIA GeForce RTX 4070 Laptop GPU, i7-13700H, Samsung 990 Pro 1 TB | Dell XPS 15 9530 RTX 4070 NVIDIA GeForce RTX 4070 Laptop GPU, i7-13700H, SK hynix PC801 HFS001TEJ9X101N | |
|---|---|---|---|---|---|---|---|
| Noise | 7% | 8% | 1% | -3% | -10% | 13% | |
| off / environment * | 24.5 | 24.2 1% | 24 2% | 23.9 2% | 24.7 -1% | 25.9 -6% | 23.1 6% |
| Idle Minimum * | 24.5 | 24.2 1% | 24 2% | 23.9 2% | 24.7 -1% | 25.9 -6% | 23.1 6% |
| Idle Average * | 24.5 | 24.2 1% | 24 2% | 27.8 -13% | 26.2 -7% | 25.9 -6% | 23.1 6% |
| Idle Maximum * | 27.5 | 24.2 12% | 27.2 1% | 30.1 -9% | 26.2 5% | 32 -16% | 24.2 12% |
| Load Average * | 39.6 | 37.9 4% | 29 27% | 34.2 14% | 39.7 -0% | 47.2 -19% | 27.1 32% |
| Witcher 3 ultra * | 49.7 | 41.7 16% | 42.1 15% | 46.4 7% | 53.2 -7% | 53.1 -7% | 40.1 19% |
| Load Maximum * | 49.7 | 41.7 16% | 45 9% | 46.4 7% | 53.2 -7% | 53.1 -7% | 44.6 10% |
* ... smaller is better
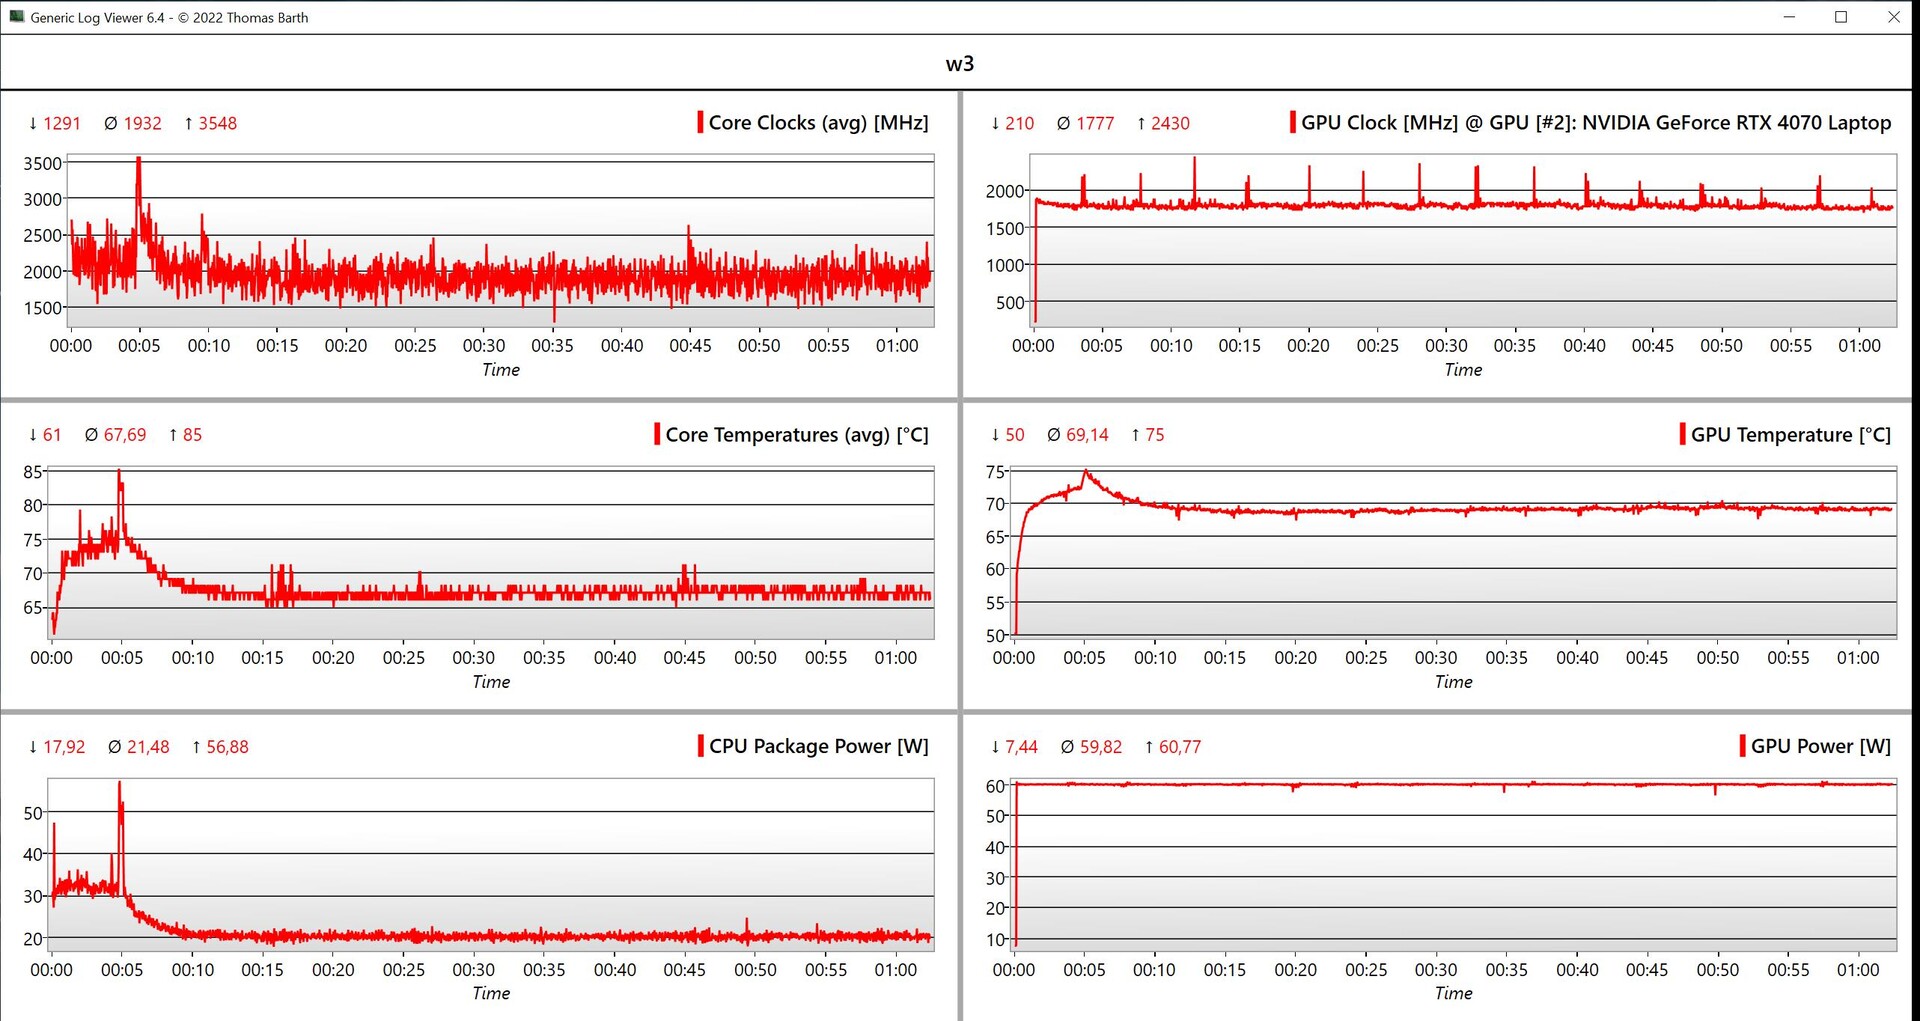
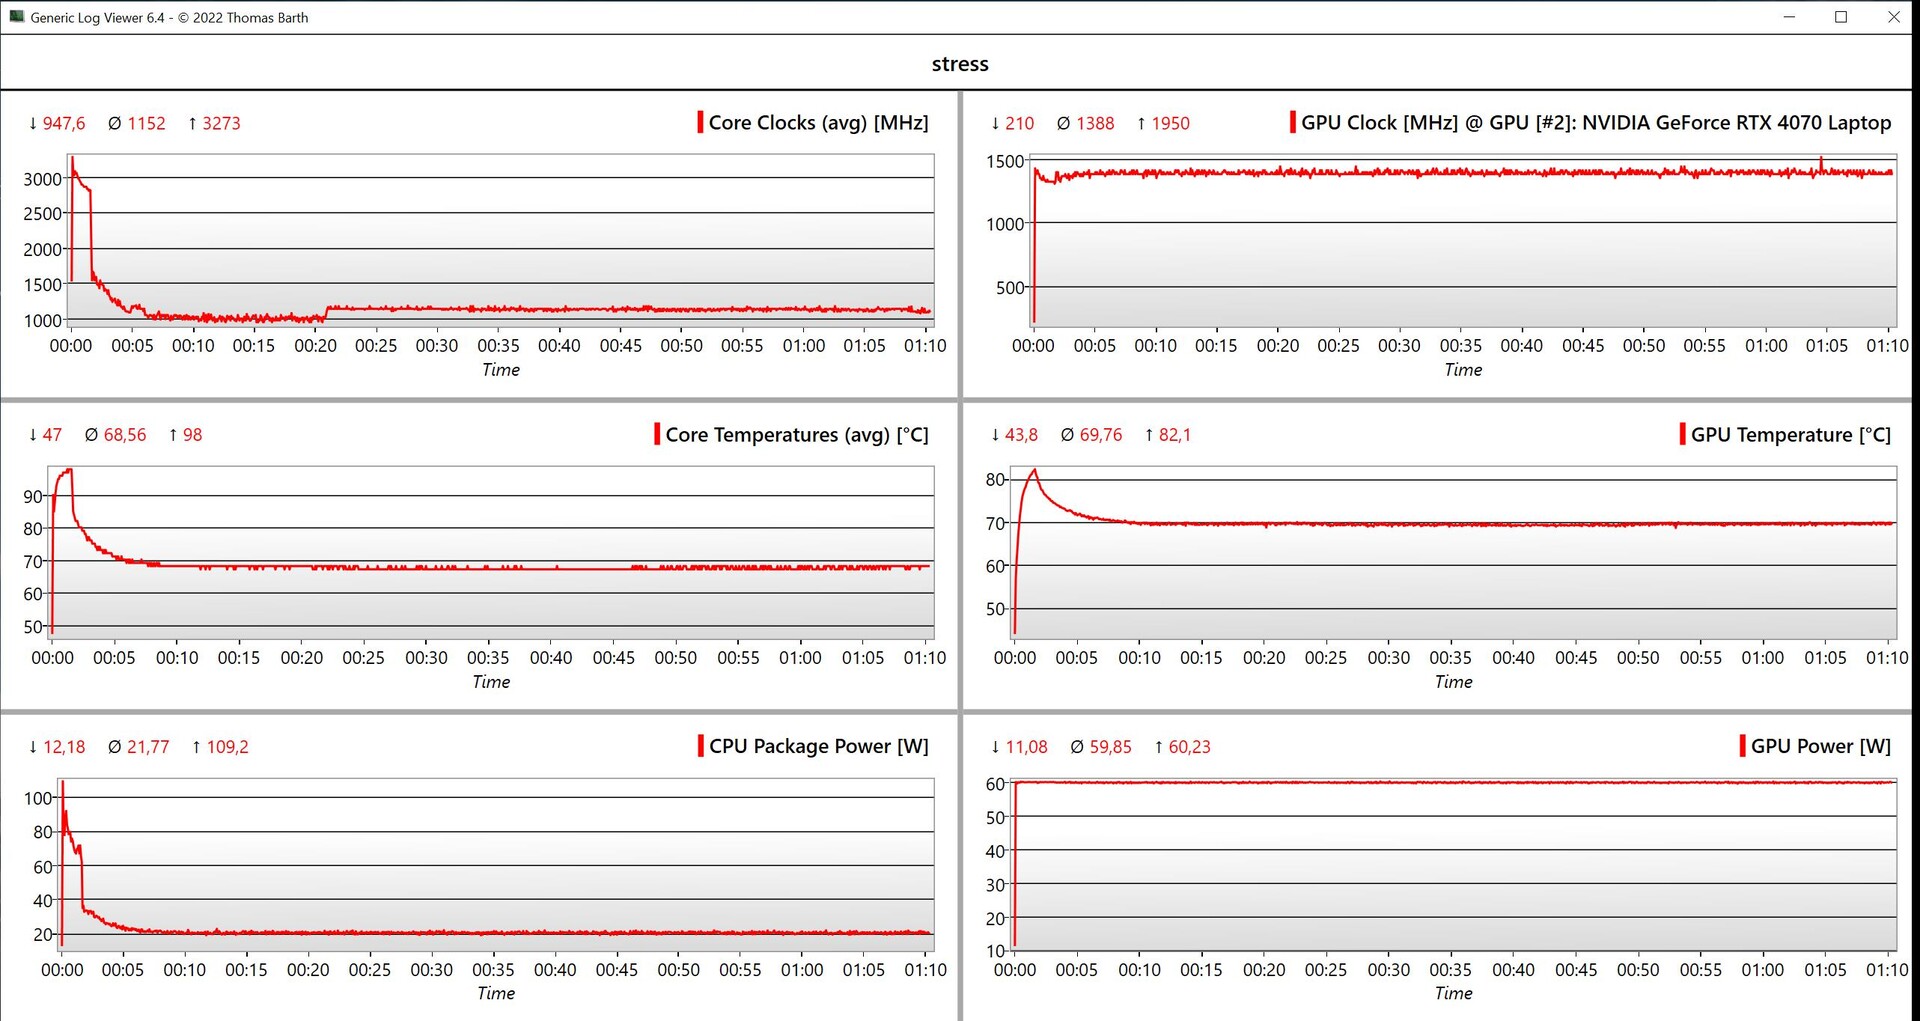
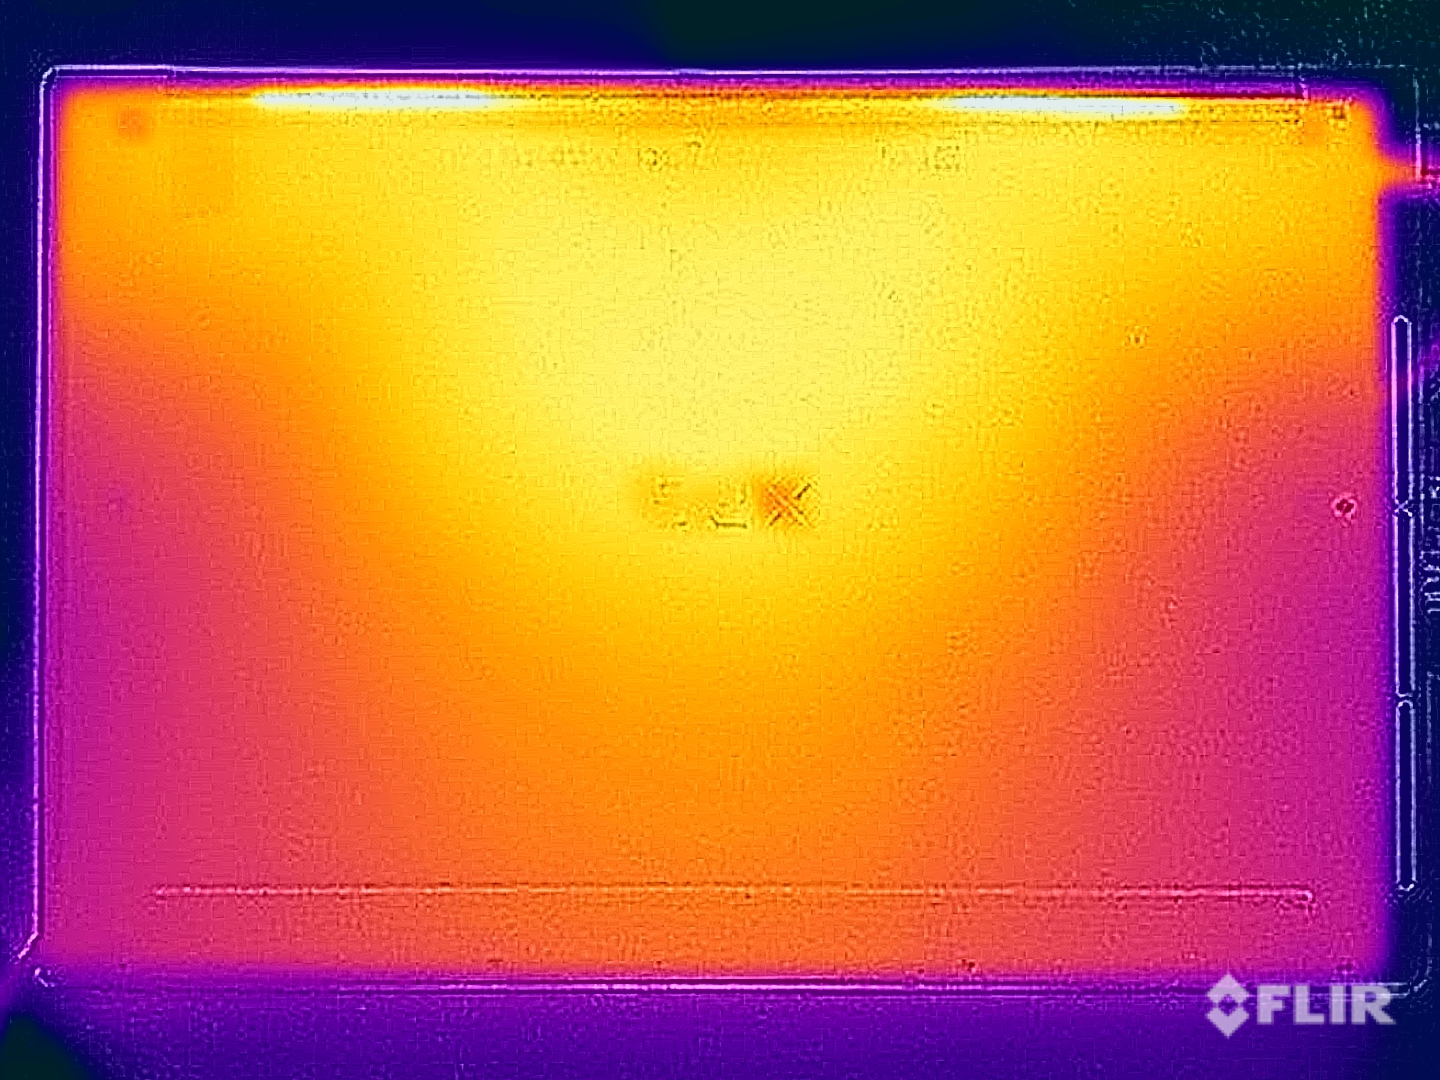
Temperature
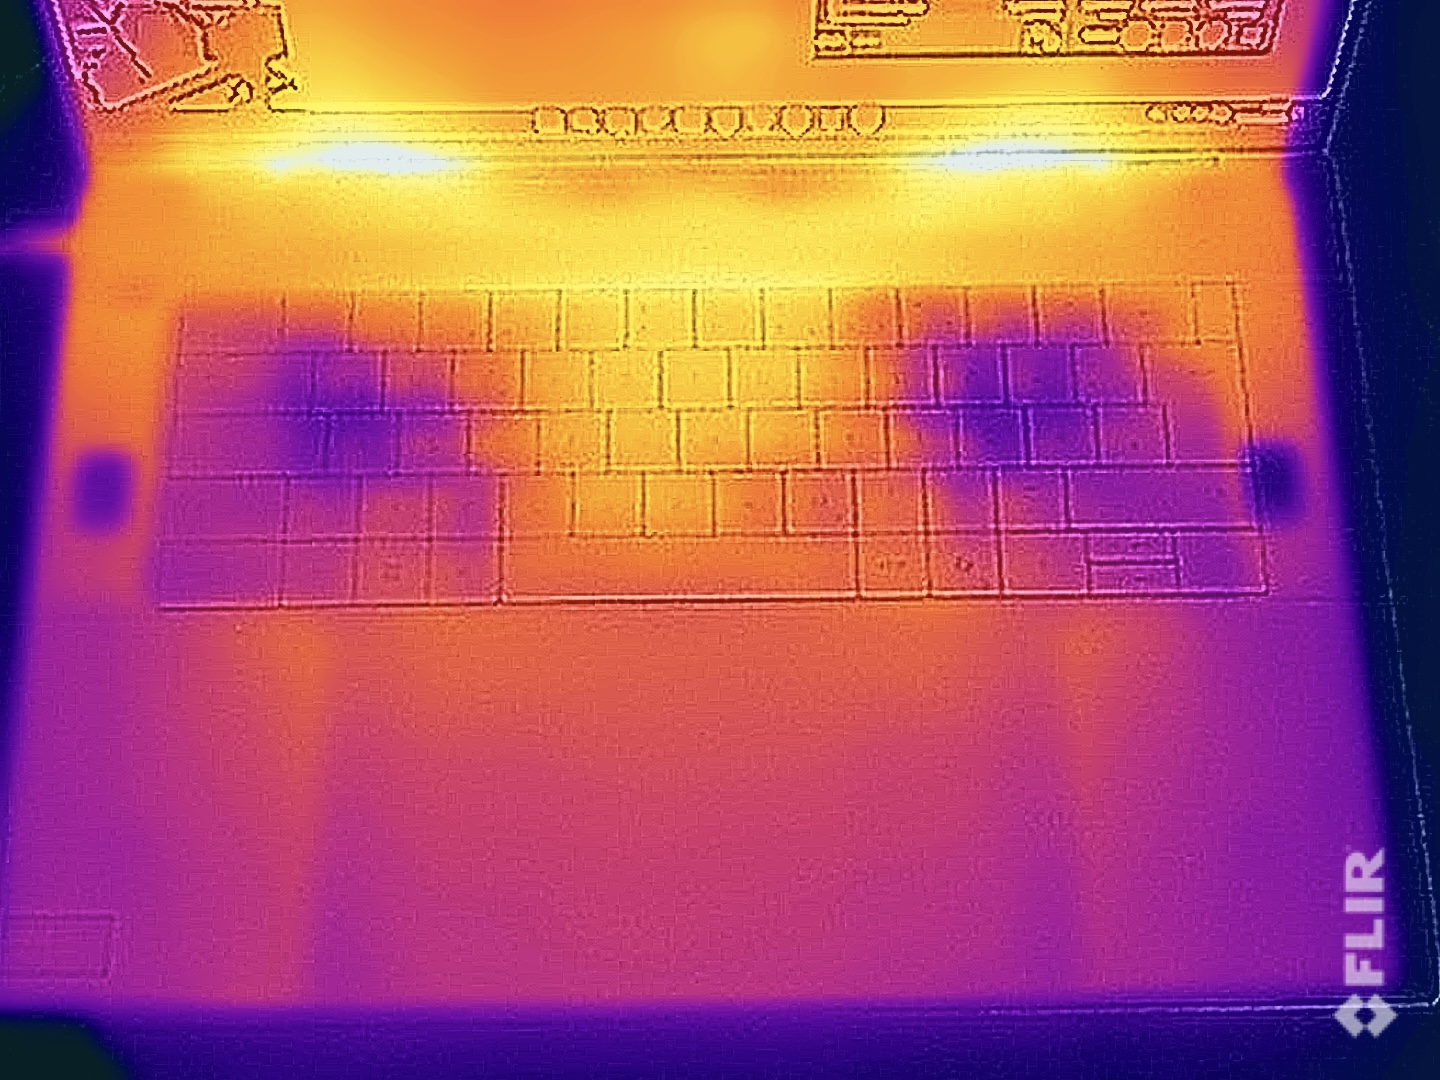
The laptop's surface temperatures show that Dell could either increase the components' performance or reduce the fans' speed, as even during the stress test, we never measured more than 40 °C. The aluminum case hardly warms up at all during simple tasks and when idling. In the stress test using combined CPU/GPU load, the graphics card remained stable at 60 watts, while the processor had to make do with just 20 watts.
(+) The maximum temperature on the upper side is 39.4 °C / 103 F, compared to the average of 36.9 °C / 98 F, ranging from 21.1 to 71 °C for the class Multimedia.
(+) The bottom heats up to a maximum of 36.9 °C / 98 F, compared to the average of 39.1 °C / 102 F
(+) In idle usage, the average temperature for the upper side is 26.3 °C / 79 F, compared to the device average of 31.2 °C / 88 F.
(±) Playing The Witcher 3, the average temperature for the upper side is 34 °C / 93 F, compared to the device average of 31.2 °C / 88 F.
(+) The palmrests and touchpad are cooler than skin temperature with a maximum of 30.2 °C / 86.4 F and are therefore cool to the touch.
(±) The average temperature of the palmrest area of similar devices was 28.8 °C / 83.8 F (-1.4 °C / -2.6 F).
| Dell XPS 16 9640 Intel Core Ultra 7 155H, NVIDIA GeForce RTX 4070 Laptop GPU | Samsung Galaxy Book4 Ultra Intel Core Ultra 7 155H, NVIDIA GeForce RTX 4050 Laptop GPU | Honor MagicBook Pro 16 2024 Intel Core Ultra 7 155H, NVIDIA GeForce RTX 4060 Laptop GPU | Asus ROG Zephyrus G16 2024 GU605M Intel Core Ultra 7 155H, NVIDIA GeForce RTX 4070 Laptop GPU | Lenovo Yoga Pro 9 16-IRP G8 Intel Core i7-13705H, NVIDIA GeForce RTX 4060 Laptop GPU | SCHENKER VISION 16 Pro (M23) Intel Core i7-13700H, NVIDIA GeForce RTX 4070 Laptop GPU | Dell XPS 15 9530 RTX 4070 Intel Core i7-13700H, NVIDIA GeForce RTX 4070 Laptop GPU | |
|---|---|---|---|---|---|---|---|
| Heat | 5% | 3% | -17% | -10% | -15% | -18% | |
| Maximum Upper Side * | 39.4 | 38.5 2% | 39.7 -1% | 50.3 -28% | 41.6 -6% | 46.7 -19% | 45.6 -16% |
| Maximum Bottom * | 36.9 | 41.2 -12% | 42.9 -16% | 48 -30% | 50 -36% | 54.1 -47% | 42 -14% |
| Idle Upper Side * | 28.2 | 23.5 17% | 23.7 16% | 28.8 -2% | 26.8 5% | 26.5 6% | 34.4 -22% |
| Idle Bottom * | 27.4 | 24.1 12% | 23.5 14% | 29.8 -9% | 27.9 -2% | 26.8 2% | 33.2 -21% |
* ... smaller is better
Speakers
The XPS 16's sound system consists of four speakers with a total output of 10 watts. The resulting sound is good and you will hardly be disappointed, but competitors like the ROG Zephyrus G16 show that it could be even better. According to our analysis, the new XPS 16 also falls slightly behind the old XPS 15.
Dell XPS 16 9640 audio analysis
(+) | speakers can play relatively loud (83.4 dB)
Bass 100 - 315 Hz
(±) | reduced bass - on average 11.2% lower than median
(±) | linearity of bass is average (8.9% delta to prev. frequency)
Mids 400 - 2000 Hz
(+) | balanced mids - only 4.5% away from median
(+) | mids are linear (3% delta to prev. frequency)
Highs 2 - 16 kHz
(+) | balanced highs - only 1.4% away from median
(+) | highs are linear (2% delta to prev. frequency)
Overall 100 - 16.000 Hz
(+) | overall sound is linear (10% difference to median)
Compared to same class
» 8% of all tested devices in this class were better, 1% similar, 91% worse
» The best had a delta of 5%, average was 18%, worst was 45%
Compared to all devices tested
» 3% of all tested devices were better, 1% similar, 96% worse
» The best had a delta of 4%, average was 25%, worst was 134%
Asus ROG Zephyrus G16 2024 GU605M audio analysis
(+) | speakers can play relatively loud (83.3 dB)
Bass 100 - 315 Hz
(+) | good bass - only 3.8% away from median
(±) | linearity of bass is average (8.1% delta to prev. frequency)
Mids 400 - 2000 Hz
(+) | balanced mids - only 3.5% away from median
(+) | mids are linear (2.4% delta to prev. frequency)
Highs 2 - 16 kHz
(+) | balanced highs - only 2.2% away from median
(+) | highs are linear (3.7% delta to prev. frequency)
Overall 100 - 16.000 Hz
(+) | overall sound is linear (7.3% difference to median)
Compared to same class
» 0% of all tested devices in this class were better, 0% similar, 100% worse
» The best had a delta of 6%, average was 18%, worst was 132%
Compared to all devices tested
» 1% of all tested devices were better, 0% similar, 99% worse
» The best had a delta of 4%, average was 25%, worst was 134%
Lenovo Yoga Pro 9 16-IRP G8 audio analysis
(±) | speaker loudness is average but good (80.5 dB)
Bass 100 - 315 Hz
(+) | good bass - only 4.9% away from median
(±) | linearity of bass is average (9.1% delta to prev. frequency)
Mids 400 - 2000 Hz
(+) | balanced mids - only 3.2% away from median
(+) | mids are linear (6.5% delta to prev. frequency)
Highs 2 - 16 kHz
(+) | balanced highs - only 2.9% away from median
(+) | highs are linear (3% delta to prev. frequency)
Overall 100 - 16.000 Hz
(+) | overall sound is linear (8.4% difference to median)
Compared to same class
» 5% of all tested devices in this class were better, 1% similar, 93% worse
» The best had a delta of 5%, average was 18%, worst was 45%
Compared to all devices tested
» 1% of all tested devices were better, 0% similar, 98% worse
» The best had a delta of 4%, average was 25%, worst was 134%
Dell XPS 15 9530 RTX 4070 audio analysis
(+) | speakers can play relatively loud (83.4 dB)
Bass 100 - 315 Hz
(+) | good bass - only 3.9% away from median
(+) | bass is linear (6.8% delta to prev. frequency)
Mids 400 - 2000 Hz
(+) | balanced mids - only 4.4% away from median
(+) | mids are linear (4.1% delta to prev. frequency)
Highs 2 - 16 kHz
(+) | balanced highs - only 1.1% away from median
(+) | highs are linear (3.3% delta to prev. frequency)
Overall 100 - 16.000 Hz
(+) | overall sound is linear (6.4% difference to median)
Compared to same class
» 2% of all tested devices in this class were better, 1% similar, 97% worse
» The best had a delta of 5%, average was 18%, worst was 45%
Compared to all devices tested
» 0% of all tested devices were better, 0% similar, 99% worse
» The best had a delta of 4%, average was 25%, worst was 134%
Power management - Lots of stamina thanks to a 99.5-Wh battery
Power consumption
In our consumption measurements, the high-resolution OLED touchscreen proved to be surprisingly frugal, because despite the dark standard background image, a maximum consumption of 10.6 watts is not much for a 16.3-inch screen. We noted no surprises under load. During the stress test, its consumption briefly hit around 138 watts but then stabilized at 125 watts after 1.5 minutes and later at 115 watts. There may not be much leeway but overall, the compact 130-watt power supply is sufficiently sized.
| Off / Standby | |
| Idle | |
| Load |
|
| Dell XPS 16 9640 Ultra 7 155H, NVIDIA GeForce RTX 4070 Laptop GPU, Kioxia XG8 KXG80ZNV1T02, OLED, 3840x2400, 16.30 | Samsung Galaxy Book4 Ultra Ultra 7 155H, NVIDIA GeForce RTX 4050 Laptop GPU, Samsung PM9A1 MZVL2512HCJQ, OLED, 2880x1800, 16.00 | Honor MagicBook Pro 16 2024 Ultra 7 155H, NVIDIA GeForce RTX 4060 Laptop GPU, WD PC SN740 SDDPNQD-1T00, IPS, 3072x1920, 16.00 | Asus ROG Zephyrus G16 2024 GU605M Ultra 7 155H, NVIDIA GeForce RTX 4070 Laptop GPU, WD PC SN560 SDDPNQE-1T00, OLED, 2560x1600, 16.00 | Lenovo Yoga Pro 9 16-IRP G8 i7-13705H, NVIDIA GeForce RTX 4060 Laptop GPU, Samsung PM9A1 MZVL21T0HCLR, Mini-LED, 3200x2000, 16.00 | SCHENKER VISION 16 Pro (M23) i7-13700H, NVIDIA GeForce RTX 4070 Laptop GPU, Samsung 990 Pro 1 TB, IPS, 2560x1600, 16.00 | Dell XPS 15 9530 RTX 4070 i7-13700H, NVIDIA GeForce RTX 4070 Laptop GPU, SK hynix PC801 HFS001TEJ9X101N, OLED, 3456x2160, 15.60 | Average NVIDIA GeForce RTX 4070 Laptop GPU | Average of class Multimedia | |
|---|---|---|---|---|---|---|---|---|---|
| Power Consumption | 22% | -20% | -11% | -58% | -16% | -57% | -67% | -7% | |
| Idle Minimum * | 7.7 | 4.8 38% | 5.2 32% | 8.3 -8% | 10.9 -42% | 8.6 -12% | 20 -160% | 12.1 ? -57% | 7.25 ? 6% |
| Idle Average * | 10.3 | 7.5 27% | 14.4 -40% | 12.5 -21% | 22.6 -119% | 12 -17% | 20.7 -101% | 16.9 ? -64% | 11.8 ? -15% |
| Idle Maximum * | 10.6 | 7.9 25% | 15.4 -45% | 12.8 -21% | 23.5 -122% | 12.4 -17% | 22.4 -111% | 24.1 ? -127% | 14.5 ? -37% |
| Load Average * | 76.5 | 79.3 -4% | 105.4 -38% | 71.3 7% | 84.6 -11% | 80 -5% | 77.1 -1% | 99.5 ? -30% | 77.6 ? -1% |
| Witcher 3 ultra * | 126.4 | 79.2 37% | 107.6 15% | 127.5 -1% | 159.5 -26% | 147.7 -17% | 95.4 25% | ||
| Load Maximum * | 138.5 | 125 10% | 195.2 -41% | 169.1 -22% | 177.3 -28% | 173.1 -25% | 133.4 4% | 220 ? -59% | 121 ? 13% |
* ... smaller is better
Power consumption Witcher 3 / stress test
Power consumption with external monitor
Runtimes
Dell has installed the largest possible battery into the new XPS 16, which has a capacity of 99.5 Wh and in total, its runtimes are very good. In our WLAN test at 150 cd/m² (corresponds to 57 % of the test device's maximum SDR brightness), we measured 10:29 hours at 60 Hz (09:56 hours at 90 Hz) and just over 8 hours at full brightness and 60 Hz (~07:20 hours at 90 Hz). During the video test at 150 cd/m², we noted a very good 16.5 hours and here, the Meteor Lake processor benefits from its two low-power efficiency cores. An HDR video at full brightness could be played for just over 6.5 hours and under full load, the test ended after just under 1.5 hours.
The XPS 16 offers two charging speeds: In normal mode, it takes 151 minutes (80 % after 93 minutes) before the battery is fully charged when the device is switched on; in express mode, it takes 97 minutes (80 % after 50 minutes).
| Dell XPS 16 9640 Ultra 7 155H, NVIDIA GeForce RTX 4070 Laptop GPU, 99.5 Wh | Samsung Galaxy Book4 Ultra Ultra 7 155H, NVIDIA GeForce RTX 4050 Laptop GPU, 76 Wh | Honor MagicBook Pro 16 2024 Ultra 7 155H, NVIDIA GeForce RTX 4060 Laptop GPU, 75 Wh | Asus ROG Zephyrus G16 2024 GU605M Ultra 7 155H, NVIDIA GeForce RTX 4070 Laptop GPU, 90 Wh | Lenovo Yoga Pro 9 16-IRP G8 i7-13705H, NVIDIA GeForce RTX 4060 Laptop GPU, 75 Wh | SCHENKER VISION 16 Pro (M23) i7-13700H, NVIDIA GeForce RTX 4070 Laptop GPU, 80 Wh | Dell XPS 15 9530 RTX 4070 i7-13700H, NVIDIA GeForce RTX 4070 Laptop GPU, 86 Wh | Average of class Multimedia | |
|---|---|---|---|---|---|---|---|---|
| Battery Runtime | 1% | -12% | -27% | -48% | -30% | -11% | -9% | |
| H.264 | 988 | 1076 9% | 784 -21% | 671 -32% | 449 -55% | 470 -52% | 720 ? -27% | |
| WiFi v1.3 | 629 | 656 4% | 734 17% | 435 -31% | 385 -39% | 467 -26% | 481 -24% | 574 ? -9% |
| Load | 87 | 78 -10% | 58 -33% | 71 -18% | 44 -49% | 77 -11% | 89 2% | 95.7 ? 10% |
Pros
Cons
Verdict - The new XPS design works better as a 16-inch device
In total, the new Dell XPS 16 makes a better impression than the smaller 14-inch model. Despite its heavy weight, the laptop's design doesn't feel terribly bulky and its footprint benefits compared to the competition thanks to its slim bezels, too. Even so, you do have to note that this model also places design at the forefront, leading in particular to the 60-watt RTX 4070 Laptop's graphics performance only being average. In turn, its CPU performance is good, even if the Meteor Lake processors don't offer any advantages over the old Raptor-Lake models.
The device's 4K OLED touchscreen shows good picture quality with accurate colors but in comparison to the most current OLED panels, you can notice a clear raster effect when viewing light content—plus, its 90-Hz refresh rate is no longer totally up-to-date. Its new input devices also aren't the greatest, as its keyboard takes some getting used to and the touch bar in particular is rather an inconvenience in everyday use. When it comes to connectivity, you'll have to make do with three USB-C ports—like on the smaller XPS 14—whereby the more expensive XPS 16 with the RTX 4070 Laptop only seems to have 2x Thunderbolt and both of the weaker models feature 3x Thunderbolt 4.
The Dell XPS 16 places its focus on design while also delivering good CPU performance, however, its input device ergonomics and GPU performance suffer as a result. In addition, at US$2,899, it is extremely expensive.
We have nothing negative to say about the laptop's speakers and runtimes and in general, its build and case stability is good—although our test sample showed a small build flaw in between the two USB-C ports. Its surface temperatures remain very low even under load, however, the fans are very loud and we noted no big differences between all of the energy profiles. The configuration options show quite a few limitations, especially when it comes to RAM. You can select a maximum of 64 GB RAM, but only in combination with the Core Ultra 9 185H.
You just have to be clear about one thing, namely that performance isn't the XPS 16's unique selling point—the competition offers a lot more performance, especially when it comes to the field of GPUs. At the same time, at US$2,899, the Dell XPS 16's price is extremely high and a lot of its competitors offer better price-to-performance ratios.
Price and availability
The new XPS 16 9640 can currently be ordered directly from Dell, with prices starting at US$1,699.
Dell XPS 16 9640
-
04/09/2024 v7
Andreas Osthoff


Transparency
The present review sample was made available to the author as a loan by the manufacturer or a shop for the purposes of review. The lender had no influence on this review, nor did the manufacturer receive a copy of this review before publication. There was no obligation to publish this review.
Pricecompare

