 Deutsch
 English
 Español
 Français
 Italiano
 Nederlands
 Polski
 Português
 Русский
 Türkçe
 Svenska
 Chinese
 Magyar
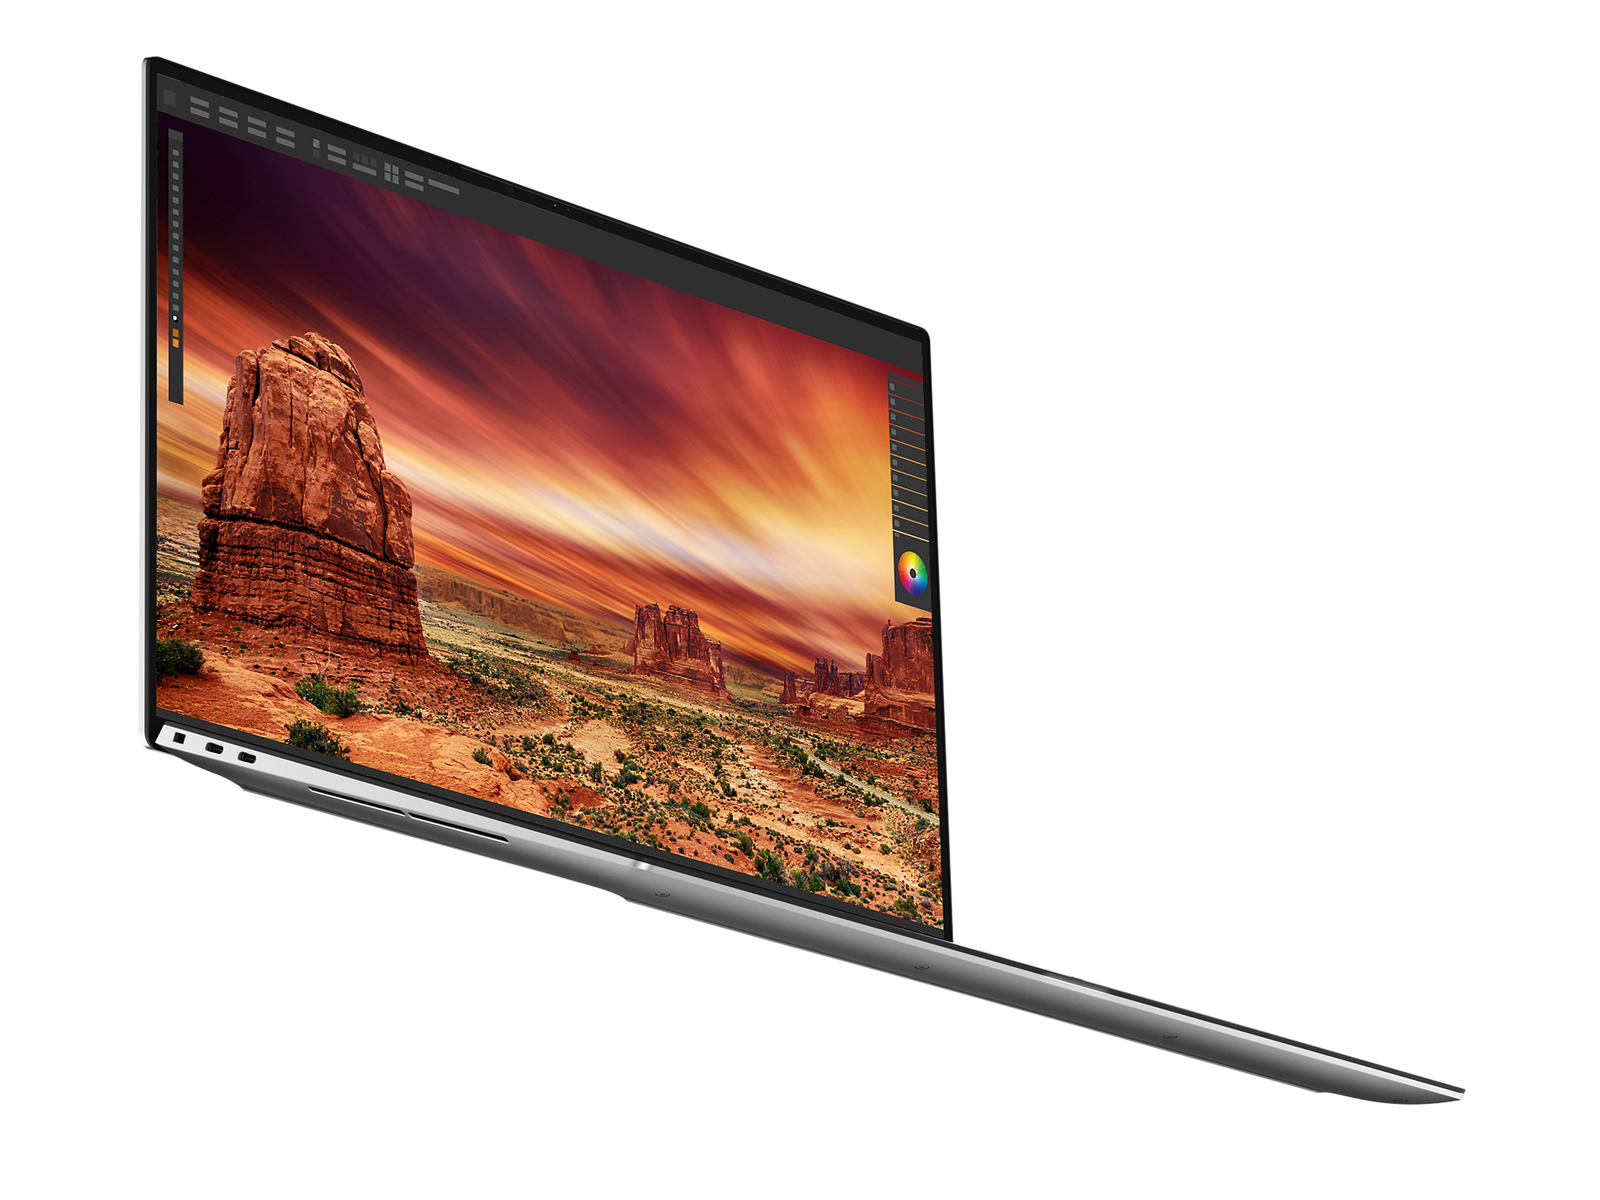
Dell XPS 15 9530 RTX 4070 laptop review: Both impressive and underwhelming

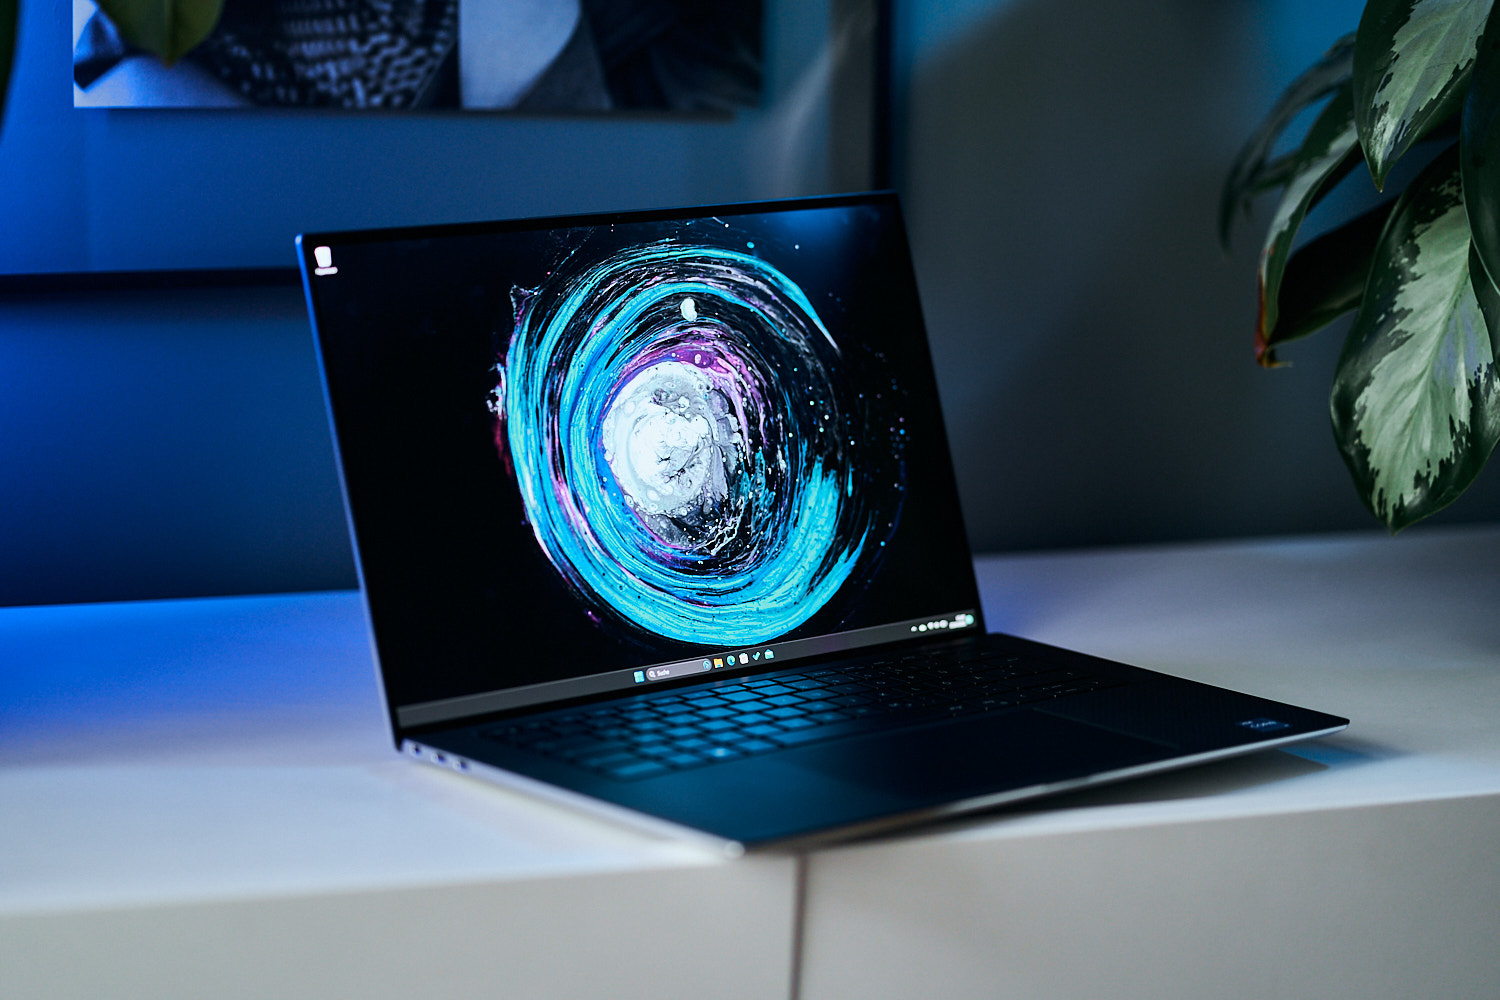
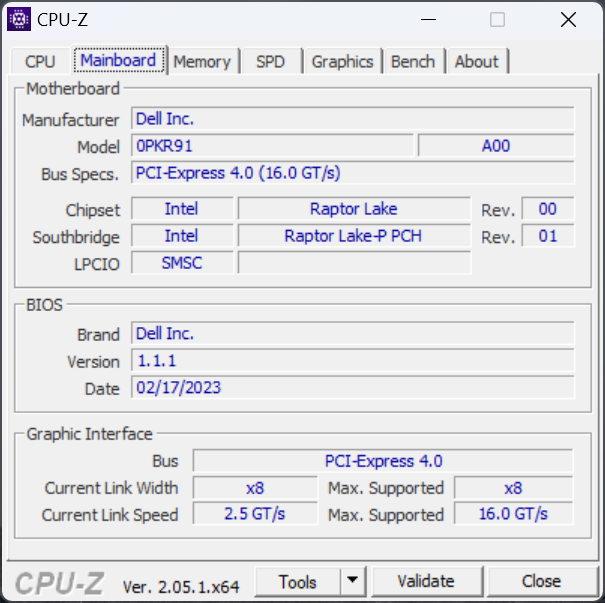
The XPS 15 9530 is an internal update over the 2022 XPS 15 9520. The 12th gen Alder Lake-H CPUs and Nvidia Ampere GPUs on last year's model have been upgraded to 13th gen Raptor Lake-H and Ada Lovelace options, respectively. Otherwise, the chassis and display options remain identical year-over-year and so we recommend checking out our existing reviews on the XPS 15 9520, 9510, and 9500 to learn more about the physical features of the model.
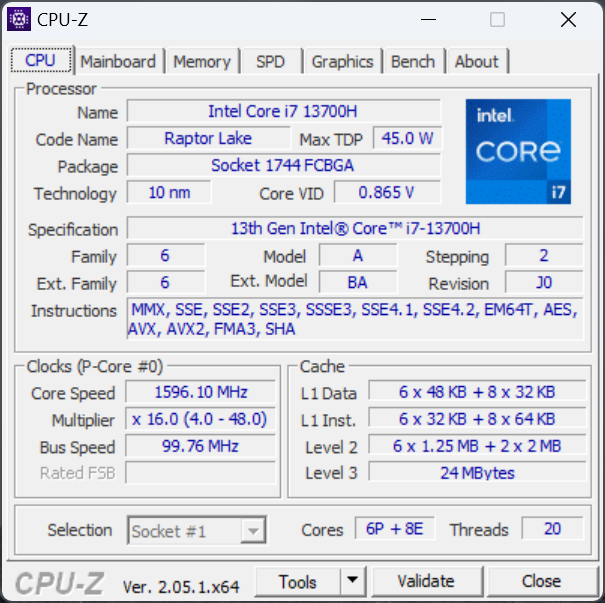
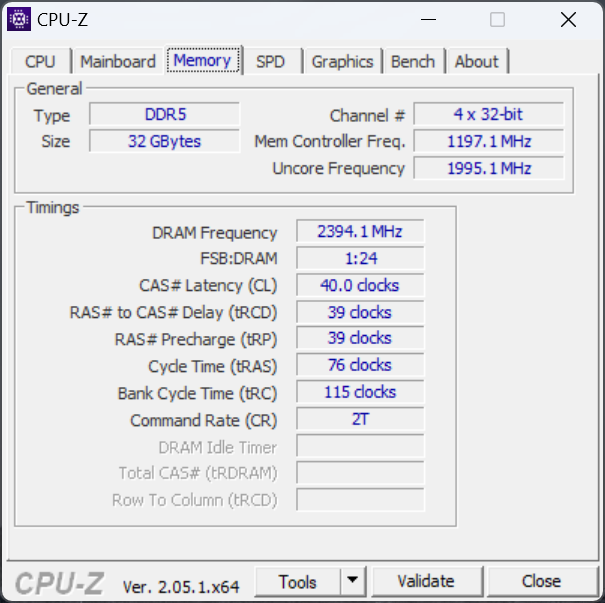
Our specific review unit is a higher-end configuration with the Core i7-13700H, RTX 4070, 32 GB RAM, 1 TB SSD, and glossy 3.5K OLED touchscreen for approximately $2800 USD. Other SKUs are available with the faster Core i9-13900H, slower RTX 4060, or lower resolution matte FHD+ panel. Note that this is one of the very few laptops with a 50 W GeForce RTX 4070 compared to 100 W or more on most other laptops with the same GPU.
Competitors include other high-end 15-inch multimedia laptops like the Asus Zenbook Pro 15, MSI Summit E15, Gigabyte Aero 15, or the Razer Blade 15 Studio.
More Dell reviews:
Potential Competitors in Comparison
Rating | Date | Model | Weight | Height | Size | Resolution | Best Price |
|---|---|---|---|---|---|---|---|
| 90.3 % | 04/2023 | Dell XPS 15 9530 RTX 4070 i7-13700H, NVIDIA GeForce RTX 4070 Laptop GPU | 1.9 kg | 18 mm | 15.60" | 3456x2160 | |
| 89.5 % | 05/2022 | Dell XPS 15 9520 RTX 3050 Ti i7-12700H, GeForce RTX 3050 Ti Laptop GPU | 1.9 kg | 18 mm | 15.60" | 3456x2160 | |
| 90.1 % | 06/2020 | Dell XPS 15 9500 Core i7 4K UHD i7-10875H, GeForce GTX 1650 Ti Mobile | 2 kg | 18 mm | 15.60" | 3840x2400 | |
| 87.7 % | 05/2022 | Asus Zenbook Pro 15 OLED UM535Q R9 5900HX, GeForce RTX 3050 Ti Laptop GPU | 1.9 kg | 18 mm | 15.60" | 1920x1080 | |
| 85.4 % | 12/2022 | MSI Prestige 15 A12UD-093 i7-1280P, GeForce RTX 3050 Ti Laptop GPU | 1.8 kg | 20.1 mm | 15.60" | 3840x2160 | |
| 85.6 % | 08/2021 | Gigabyte Aero 15 OLED XD i7-11800H, GeForce RTX 3070 Laptop GPU | 2.2 kg | 20 mm | 15.60" | 3840x2160 |
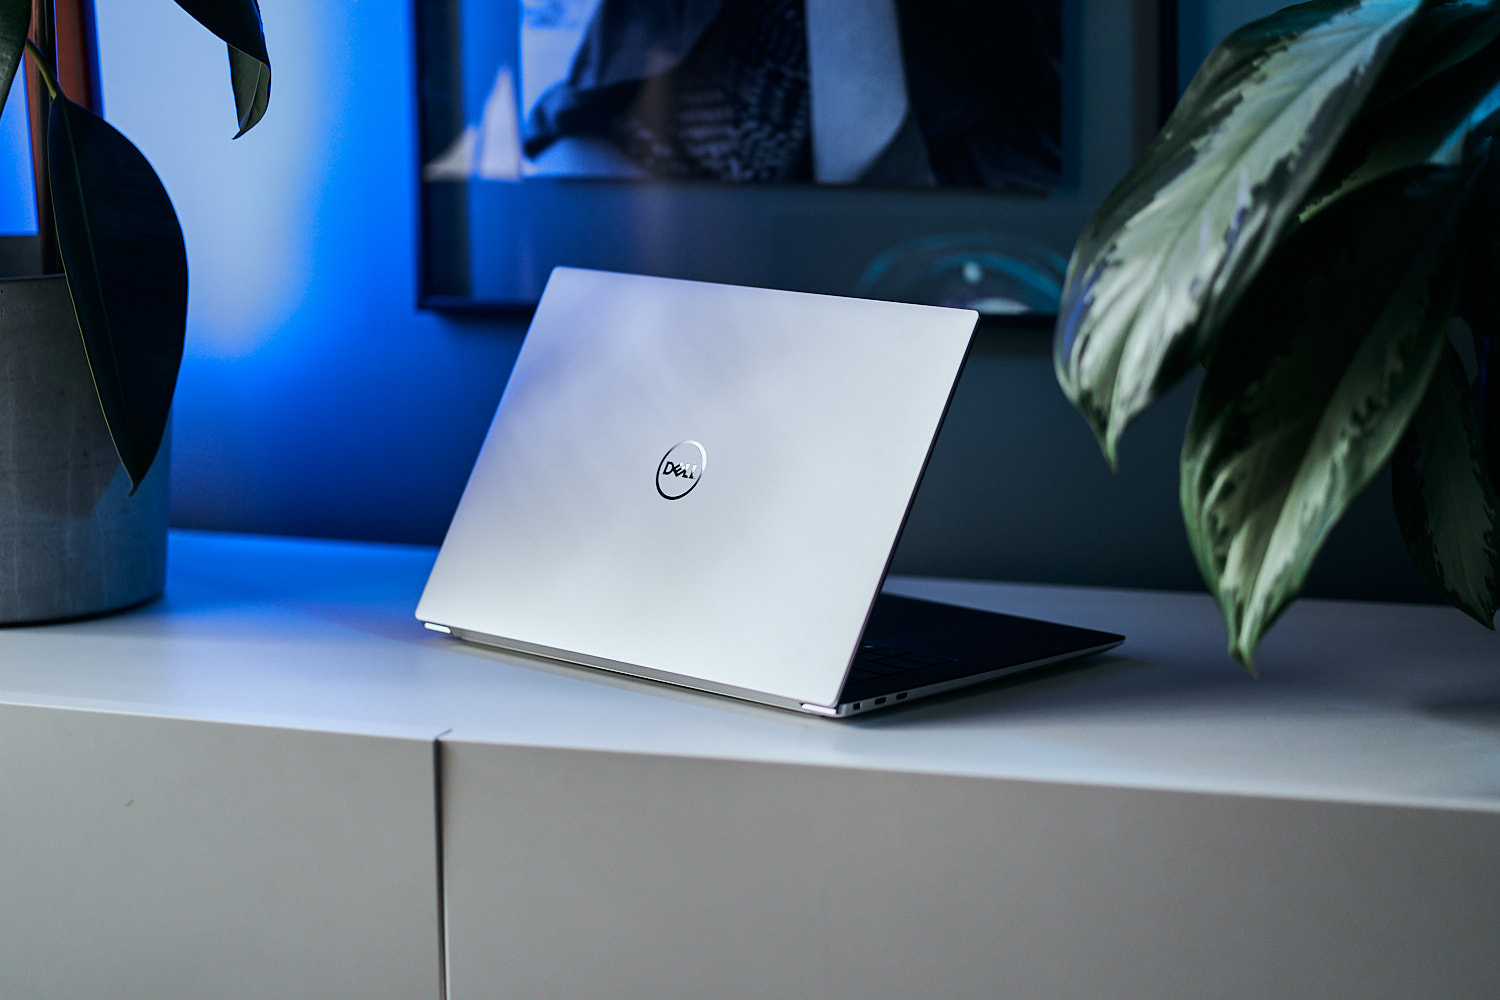
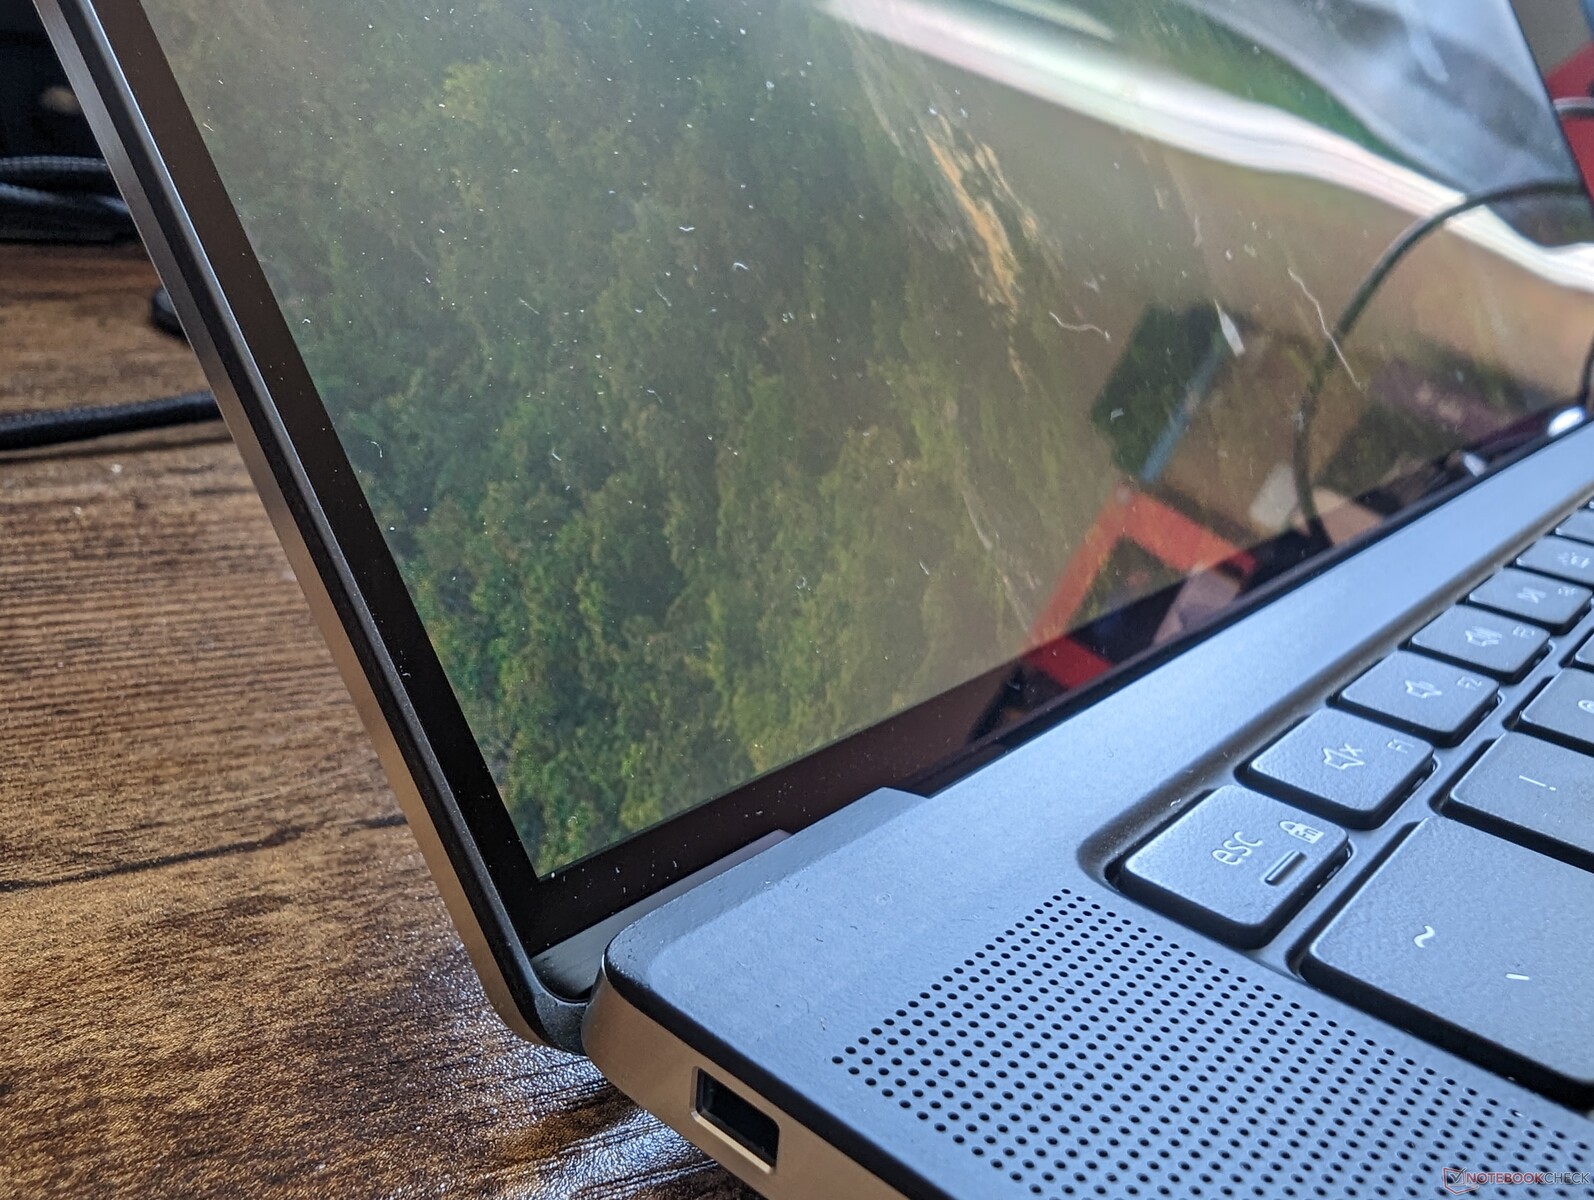
Case — No Major Changes Since The XPS 15 9500


SD Card Reader
| SD Card Reader | |
| average JPG Copy Test (av. of 3 runs) | |
| Dell XPS 15 9500 Core i7 4K UHD (Toshiba Exceria Pro SDXC 64 GB UHS-II) | |
| Gigabyte Aero 15 OLED XD (AV PRO microSD 128 GB V60) | |
| Dell XPS 15 9520 RTX 3050 Ti (Toshiba Exceria Pro SDXC 64 GB UHS-II) | |
| Dell XPS 15 9530 RTX 4070 (Toshiba Exceria Pro SDXC 64 GB UHS-II) | |
| Asus Zenbook Pro 15 OLED UM535Q (Toshiba Exceria Pro SDXC 64 GB UHS-II) | |
| MSI Prestige 15 A12UD-093 (AV Pro SD microSD 128 GB V60) | |
| maximum AS SSD Seq Read Test (1GB) | |
| Dell XPS 15 9500 Core i7 4K UHD (Toshiba Exceria Pro SDXC 64 GB UHS-II) | |
| Gigabyte Aero 15 OLED XD (AV PRO microSD 128 GB V60) | |
| Dell XPS 15 9530 RTX 4070 (Toshiba Exceria Pro SDXC 64 GB UHS-II) | |
| Dell XPS 15 9520 RTX 3050 Ti (Toshiba Exceria Pro SDXC 64 GB UHS-II) | |
| MSI Prestige 15 A12UD-093 (AV Pro SD microSD 128 GB V60) | |
| Asus Zenbook Pro 15 OLED UM535Q (Toshiba Exceria Pro SDXC 64 GB UHS-II) | |
Communication
An Intel AX211 comes standard for Wi-Fi 6E and Bluetooth 5.2 support. We're able to connect to our Asus AXE11000 Wi-Fi 6 network without issues, but the laptop would strangely not recognize or connect to our 6 GHz Wi-Fi 6E network. Other Wi-Fi 6E-enabled devices like the Pixel 7 Pro could recognize and connect to our 6 GHz network without any problems.
| Networking | |
| iperf3 transmit AX12 | |
| Gigabyte Aero 15 OLED XD | |
| Dell XPS 15 9500 Core i7 4K UHD | |
| Asus Zenbook Pro 15 OLED UM535Q | |
| iperf3 receive AX12 | |
| Dell XPS 15 9500 Core i7 4K UHD | |
| Gigabyte Aero 15 OLED XD | |
| Asus Zenbook Pro 15 OLED UM535Q | |
| iperf3 transmit AXE11000 | |
| Dell XPS 15 9530 RTX 4070 | |
| Dell XPS 15 9520 RTX 3050 Ti | |
| MSI Prestige 15 A12UD-093 | |
| iperf3 receive AXE11000 | |
| Dell XPS 15 9520 RTX 3050 Ti | |
| Dell XPS 15 9530 RTX 4070 | |
| MSI Prestige 15 A12UD-093 | |
| iperf3 transmit AXE11000 6GHz | |
| MSI Prestige 15 A12UD-093 | |
| iperf3 receive AXE11000 6GHz | |
| MSI Prestige 15 A12UD-093 | |
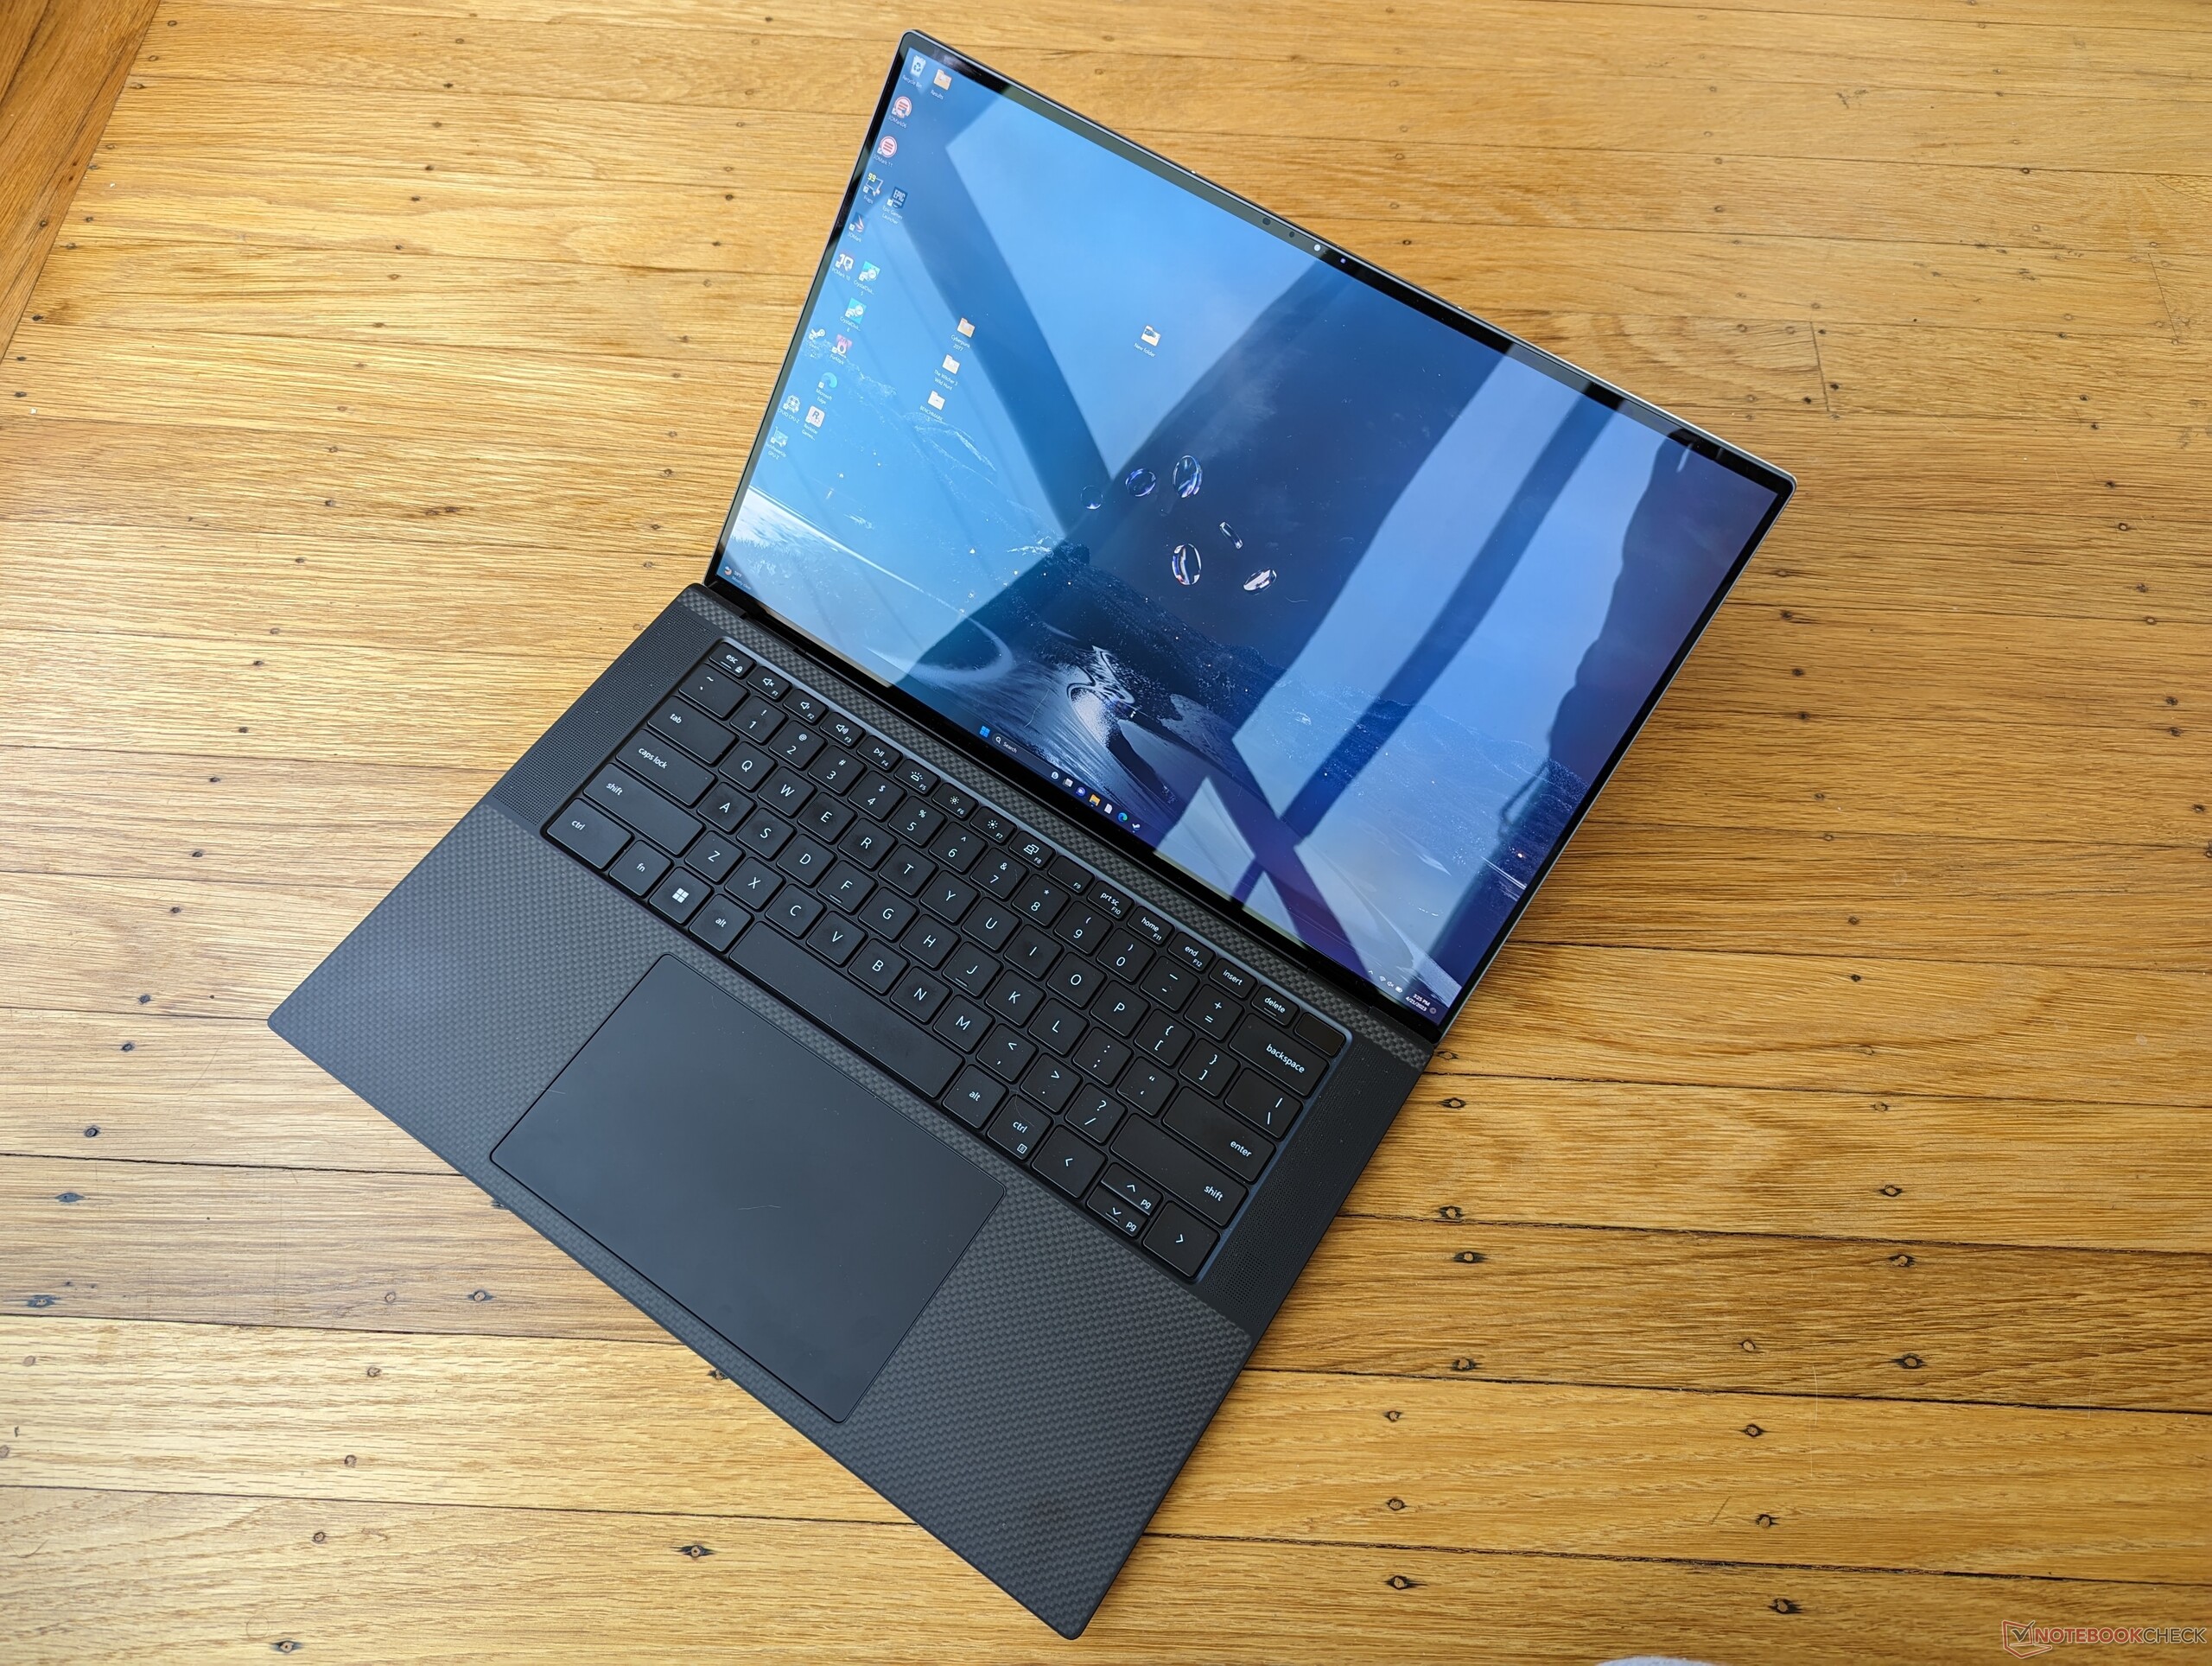
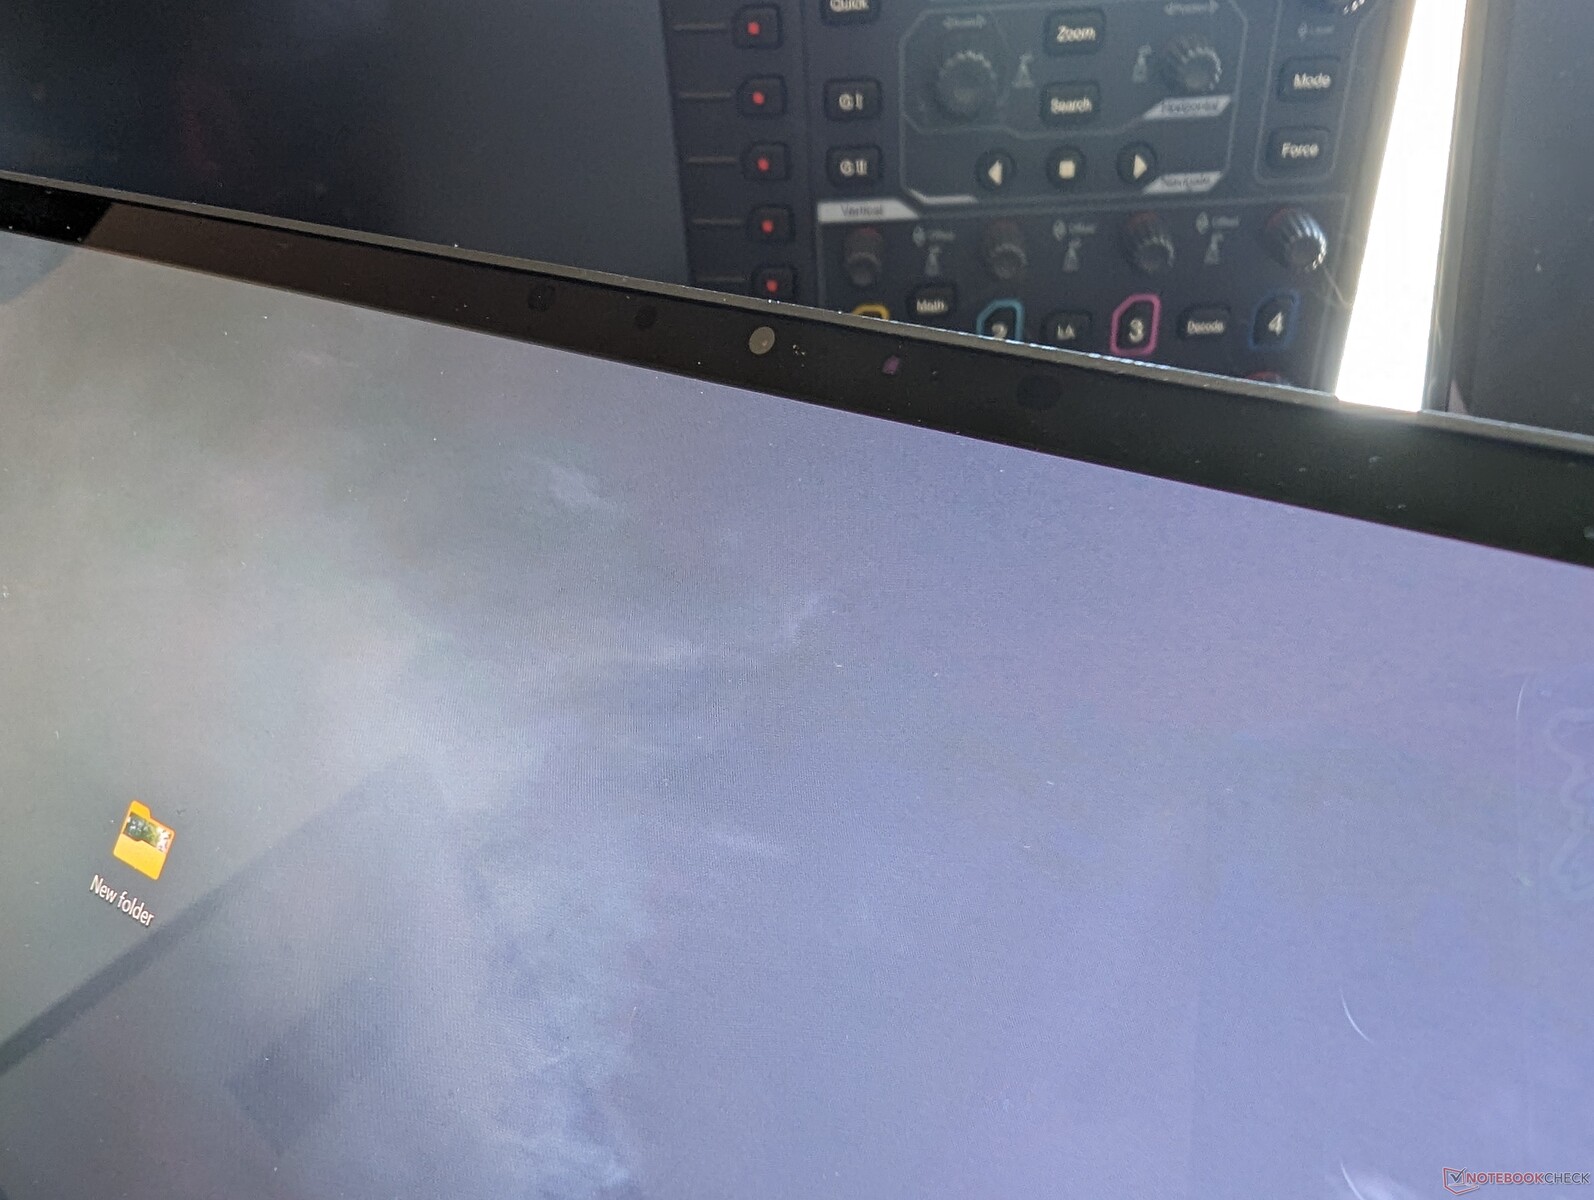
Webcam — 1 MP Resolution Is Getting Embarassing
The latest XPS 15 *still* relies on a low resolution 1 MP/720p webcam with no privacy shutter despite its >$2000 USD asking price. Competing models like the HP Spectre x360 16 or Razer Blade series have already moved on to 2 MP or even 5 MP sensors. Needless to say, picture quality is very blurry on an otherwise beautiful OLED display. At least IR is supported.
Dell says the low resolution webcam is a consequence of having one of the narrowest bezels on a laptop. A higher resolution webcam would purportedly thicken the bezel.


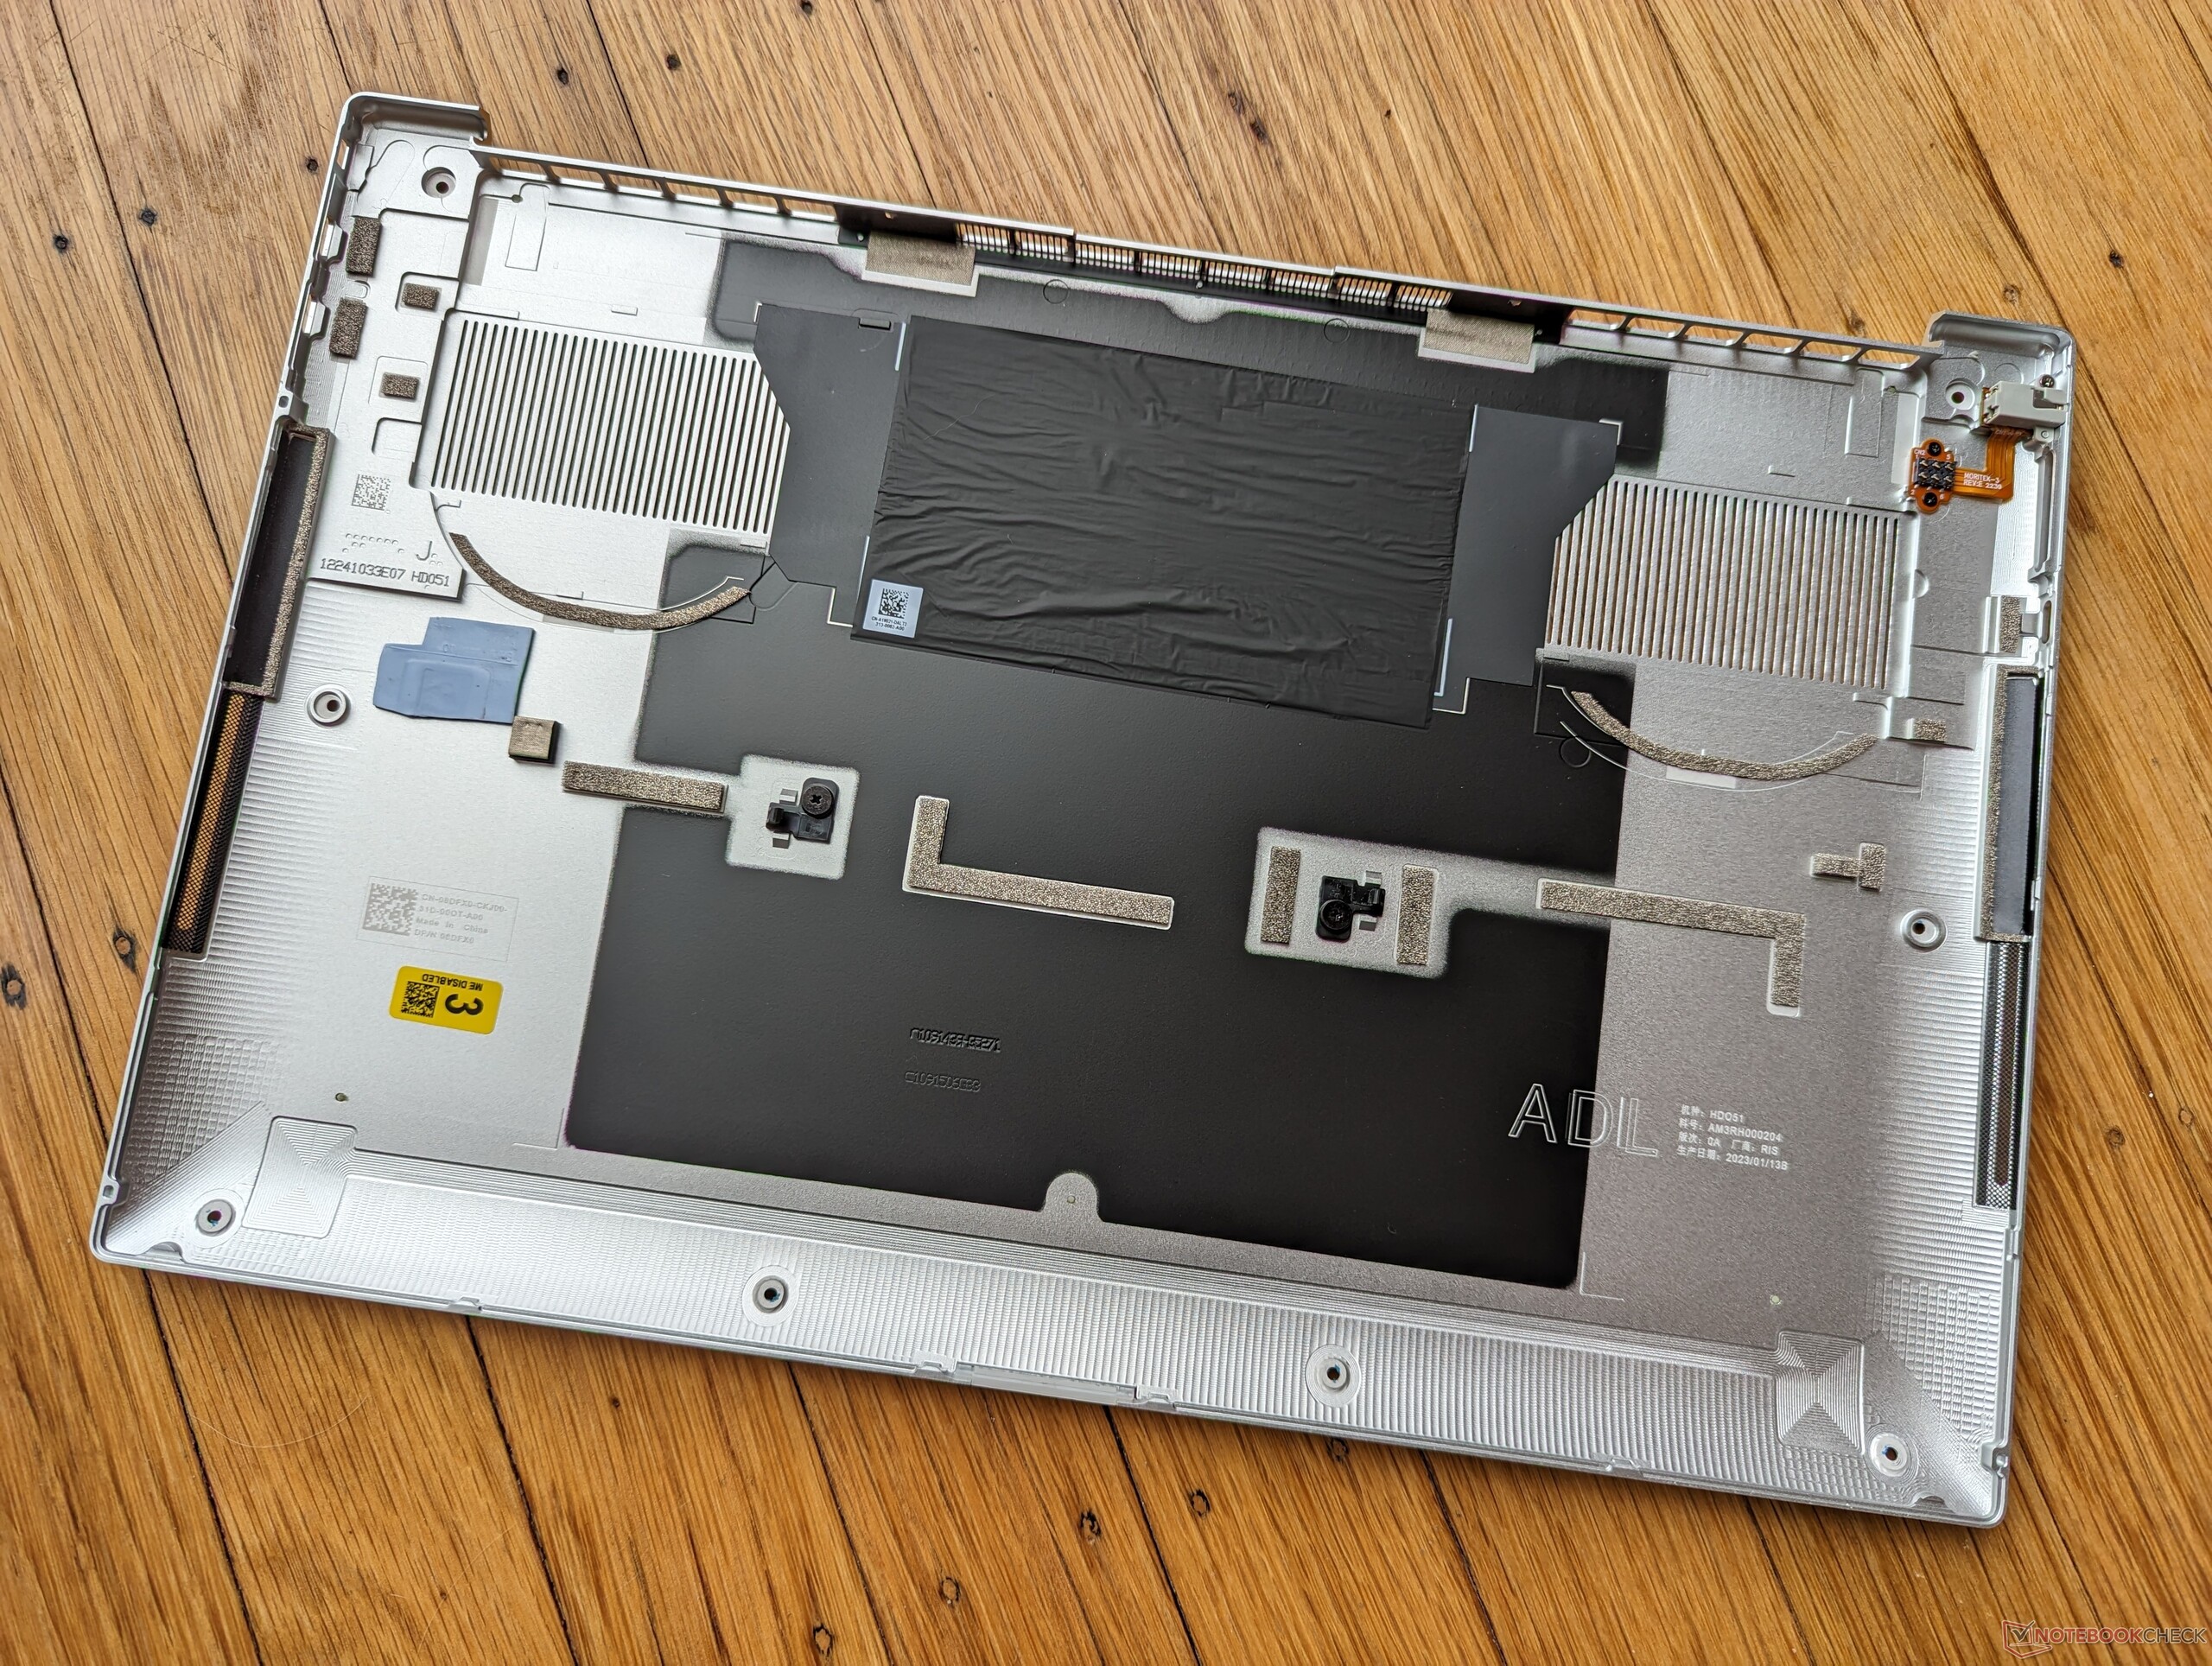
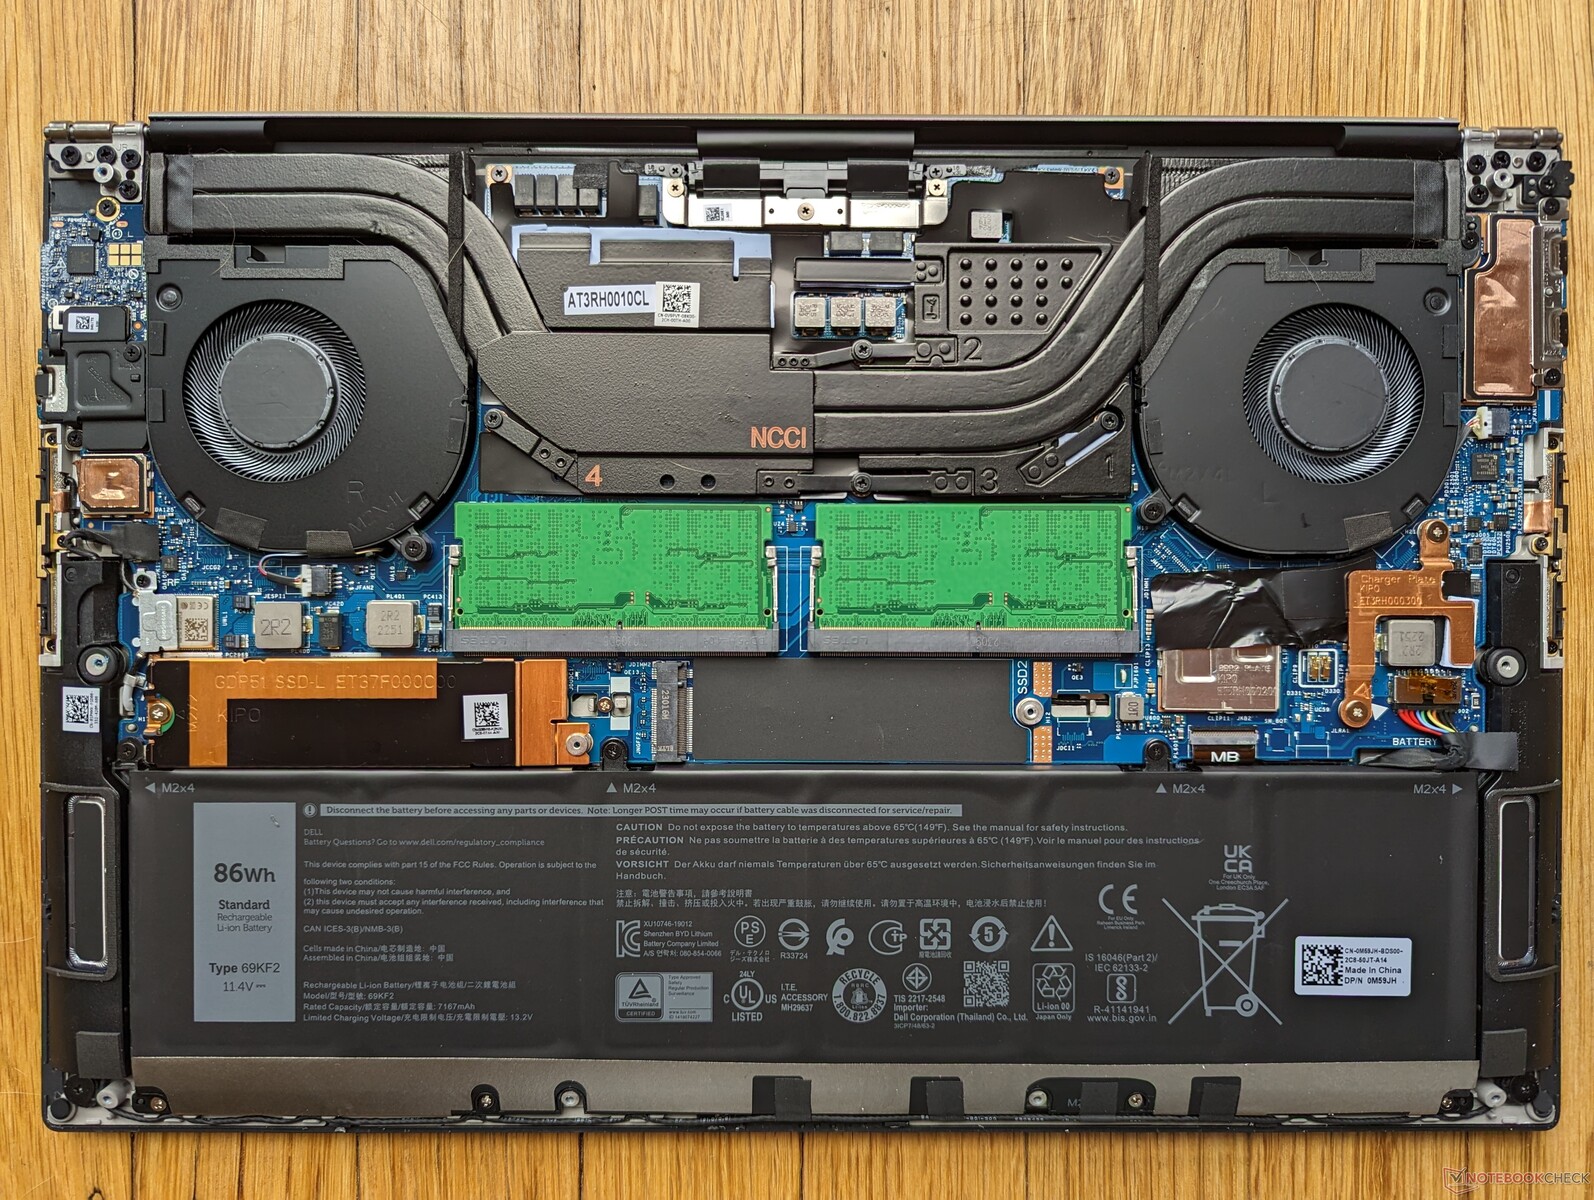
Maintenance
Accessories and Warranty
Dell still includes in a handy USB-C to USB-A and HDMI adapter inside every retail box which we appreciate. The usual one-year limited manufacturer warranty applies.
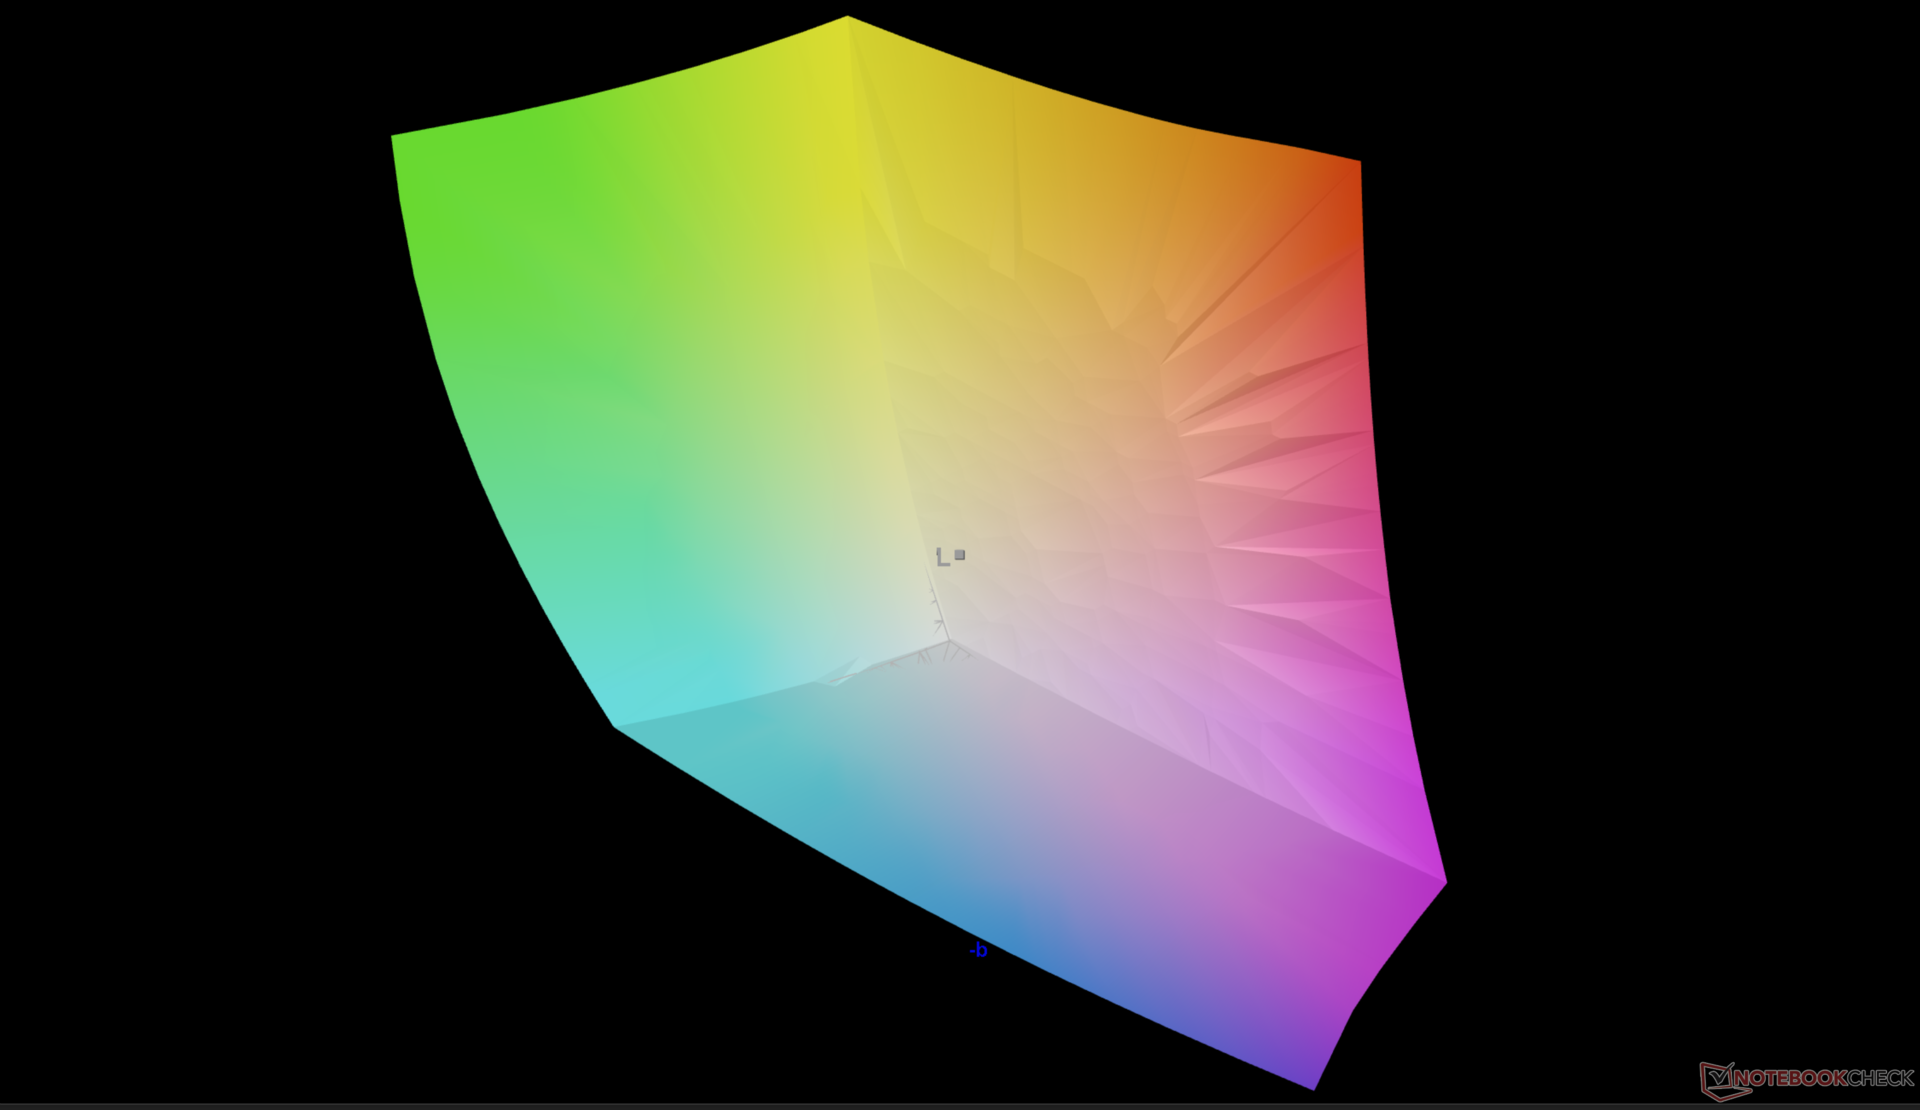
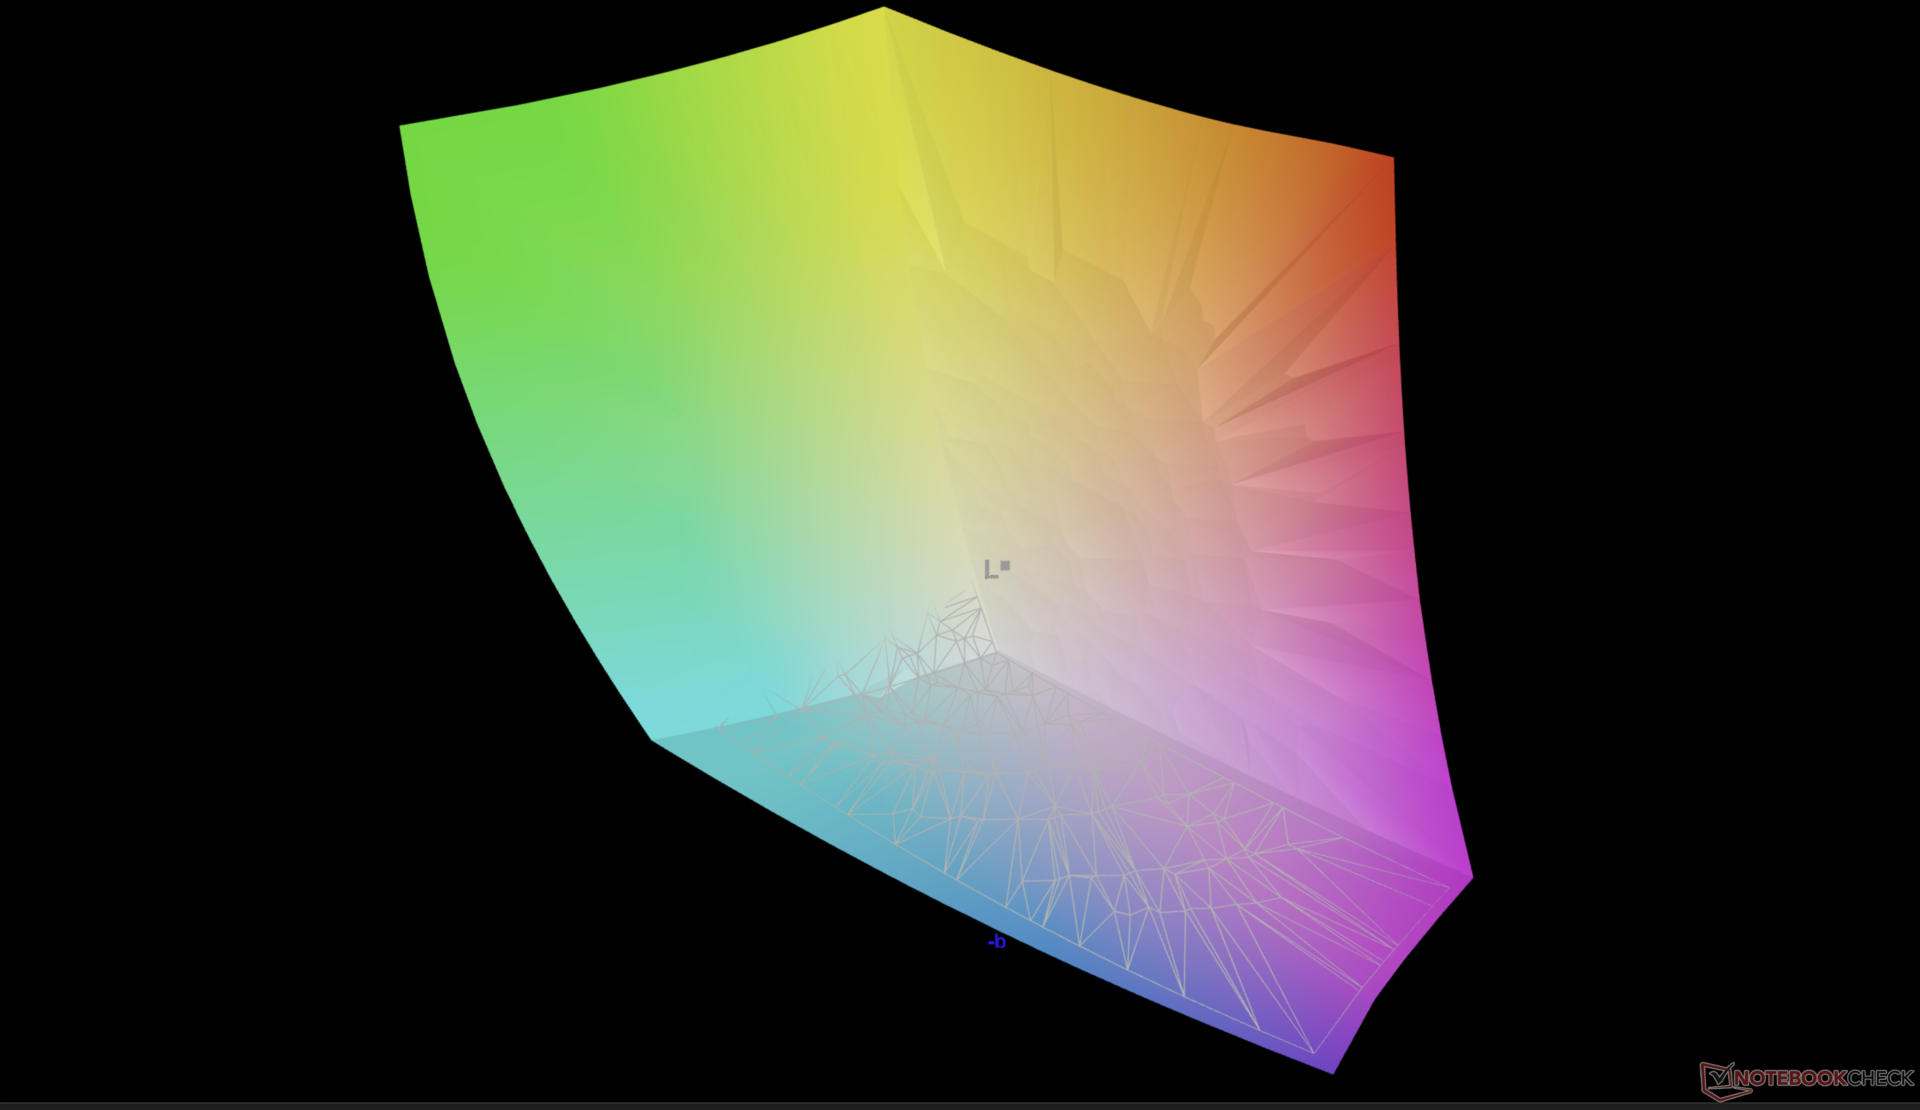
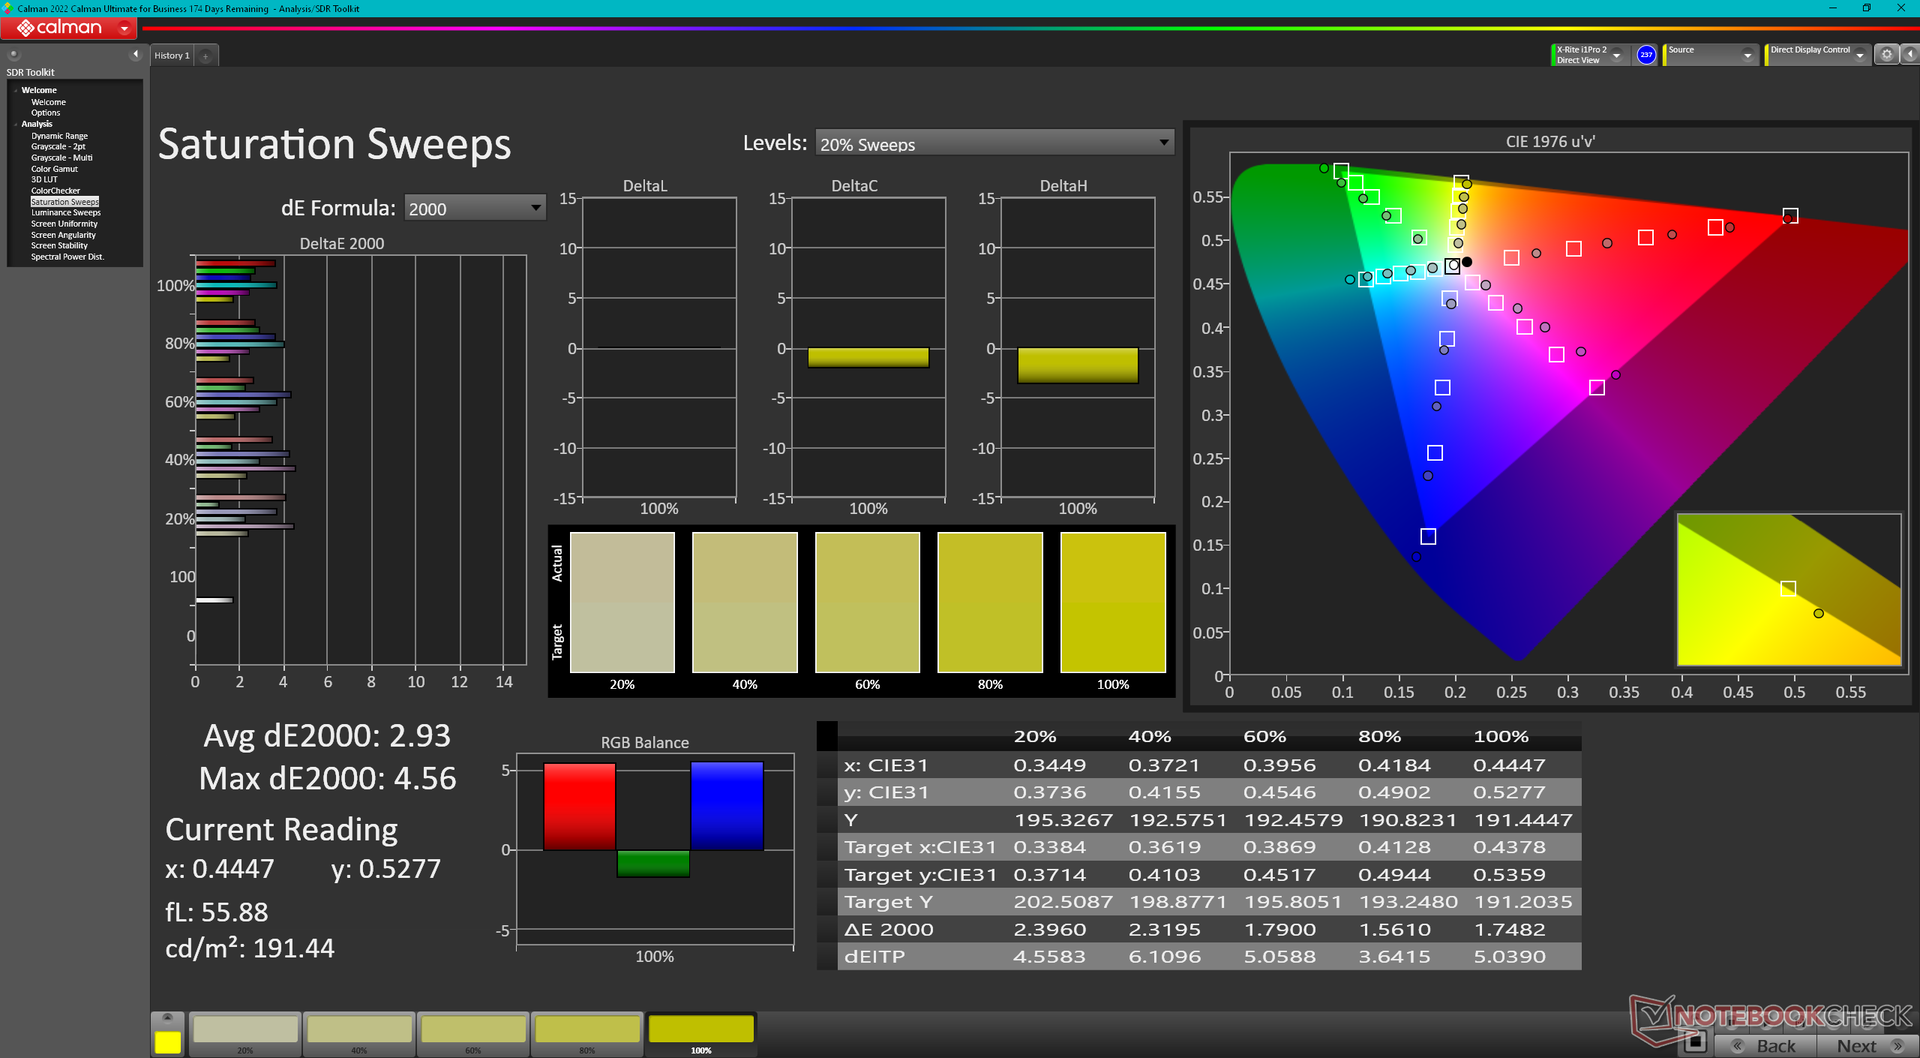
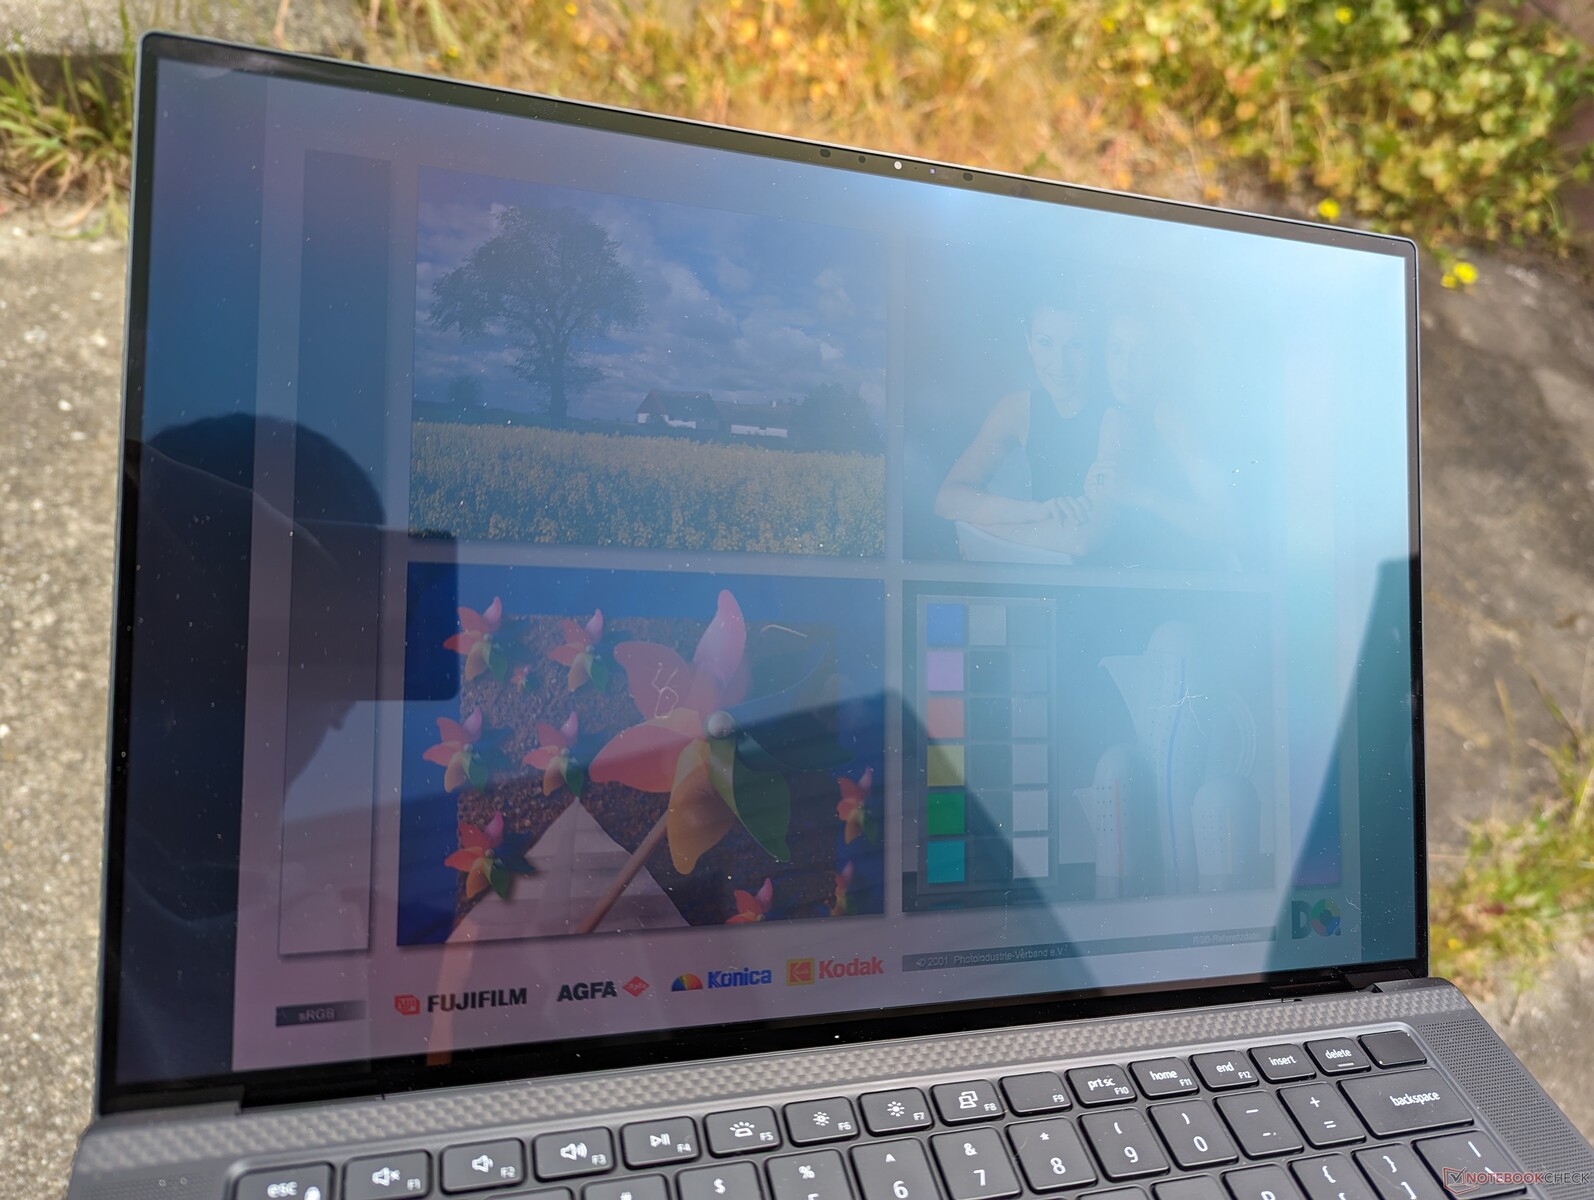
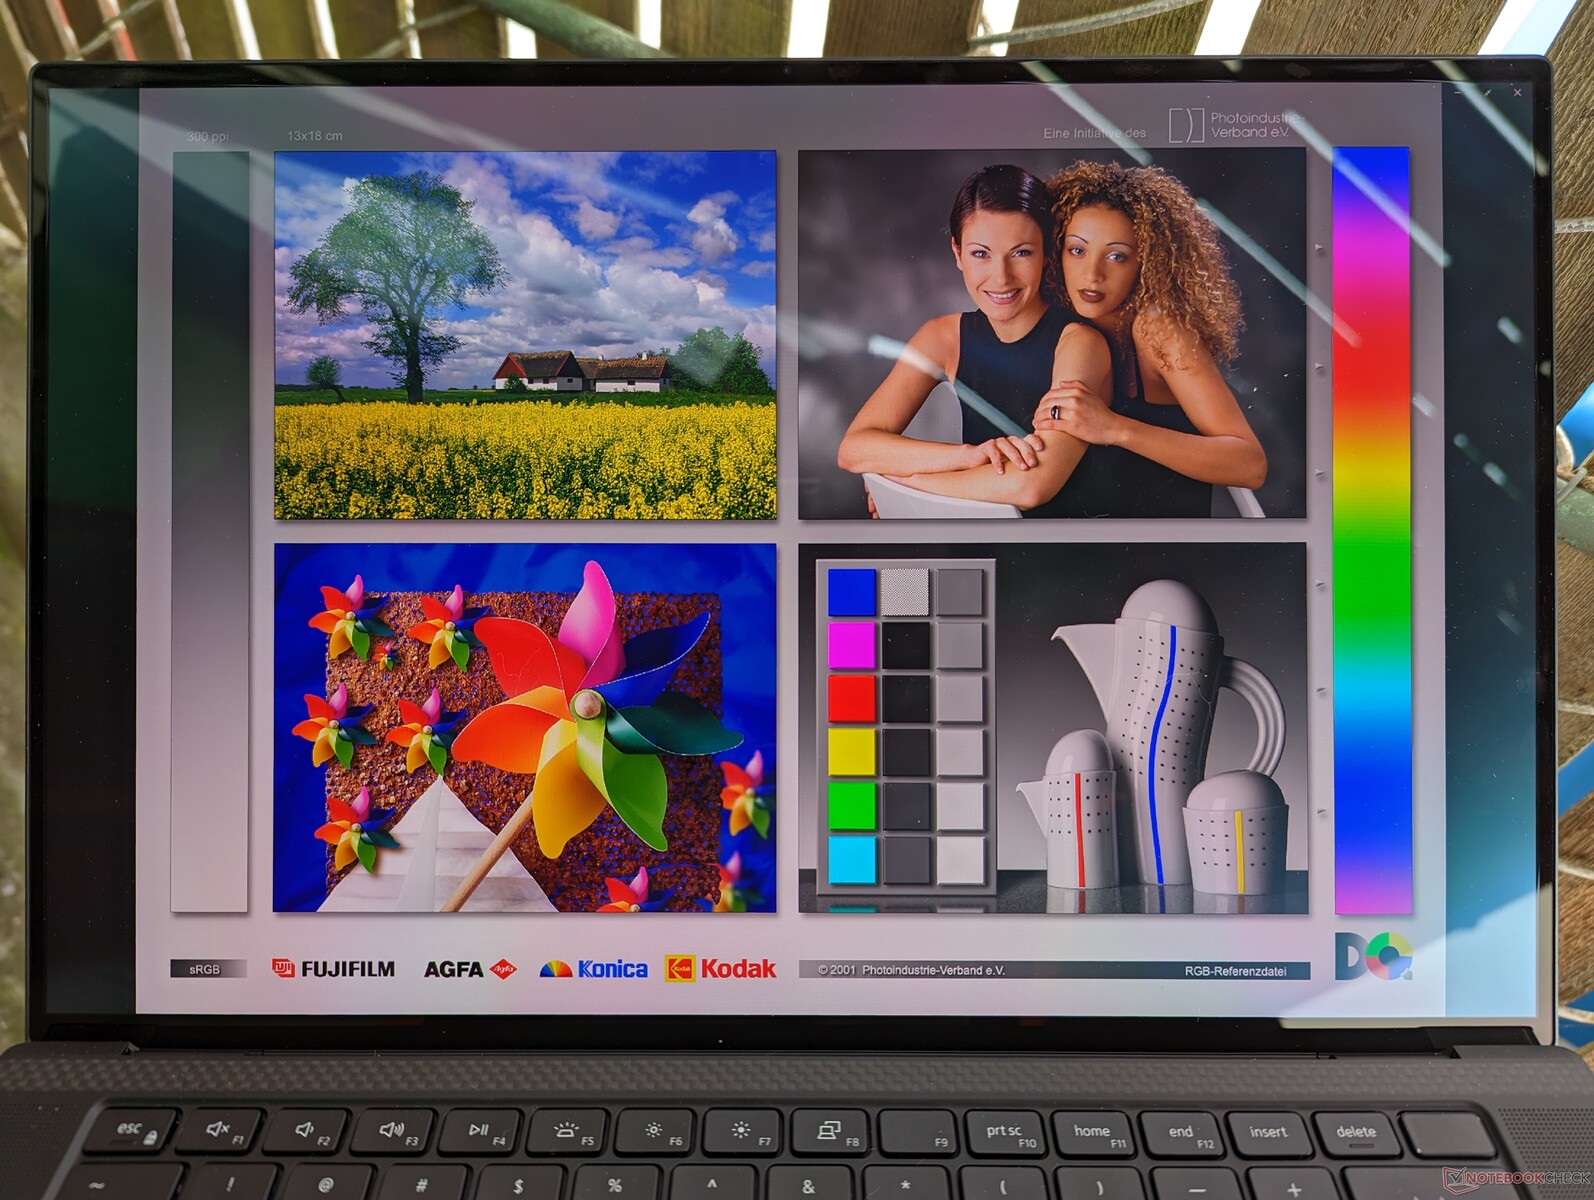
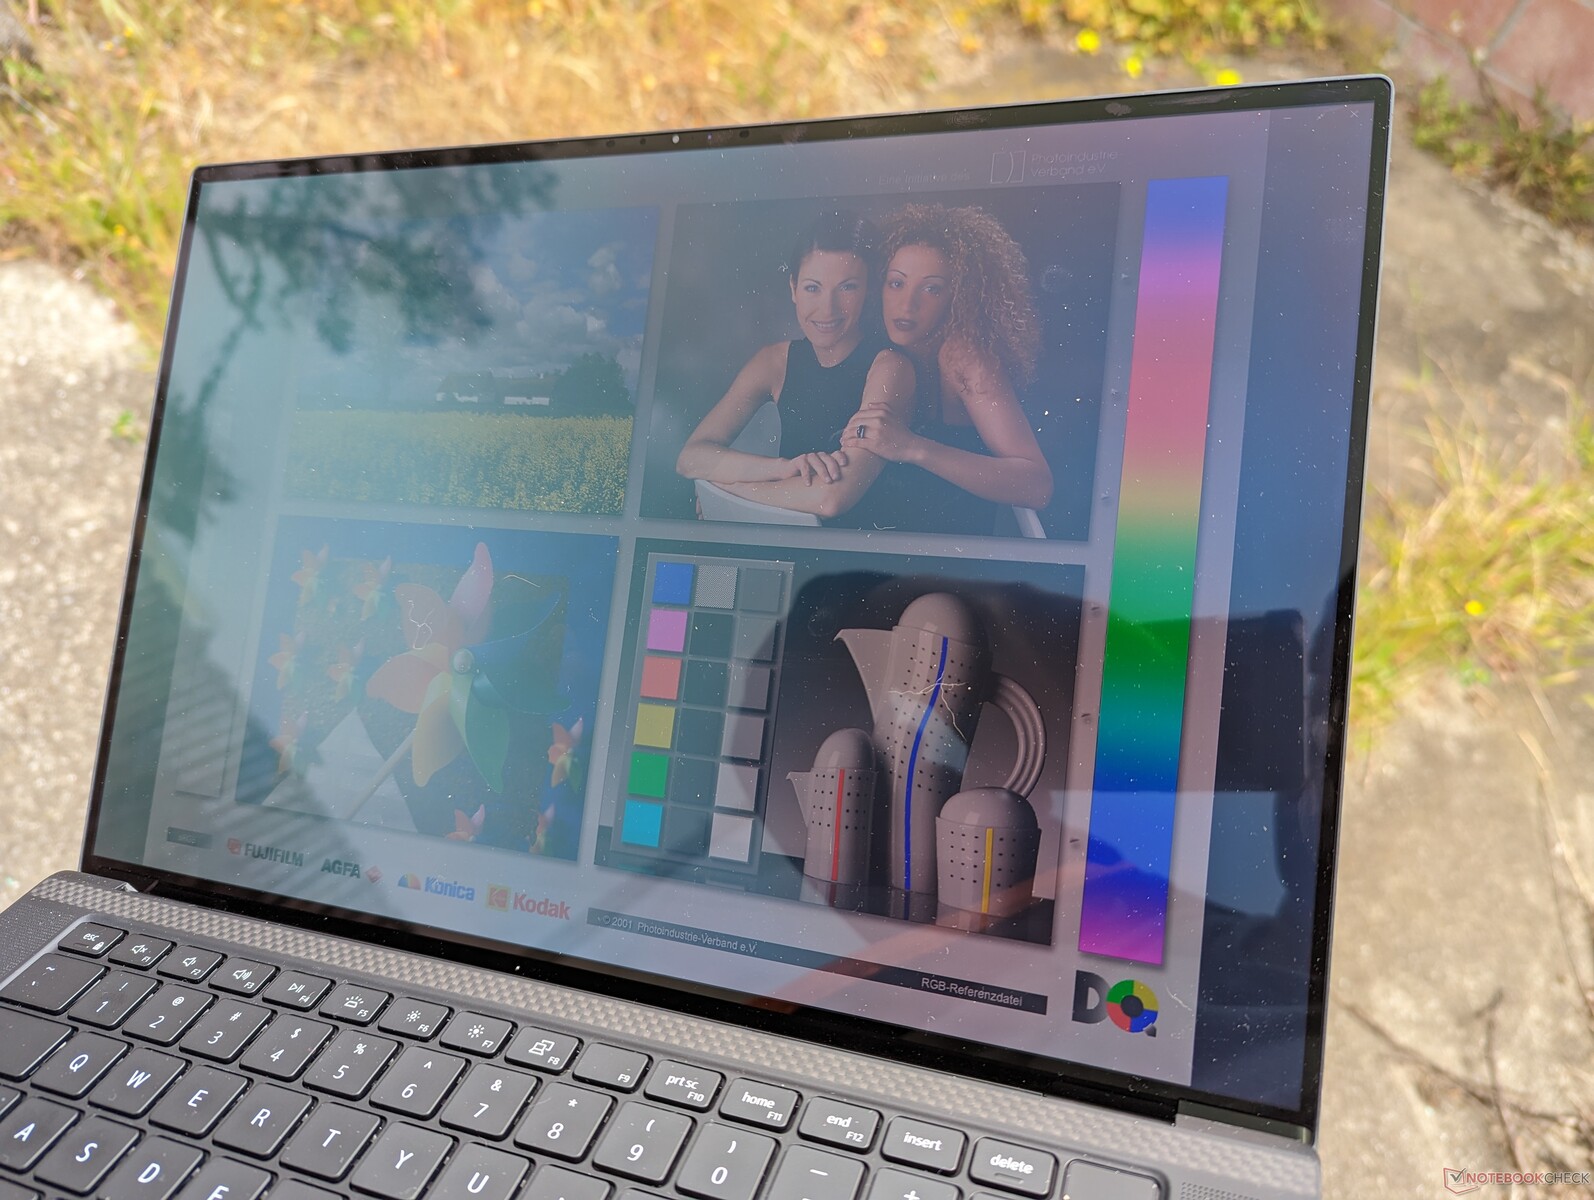
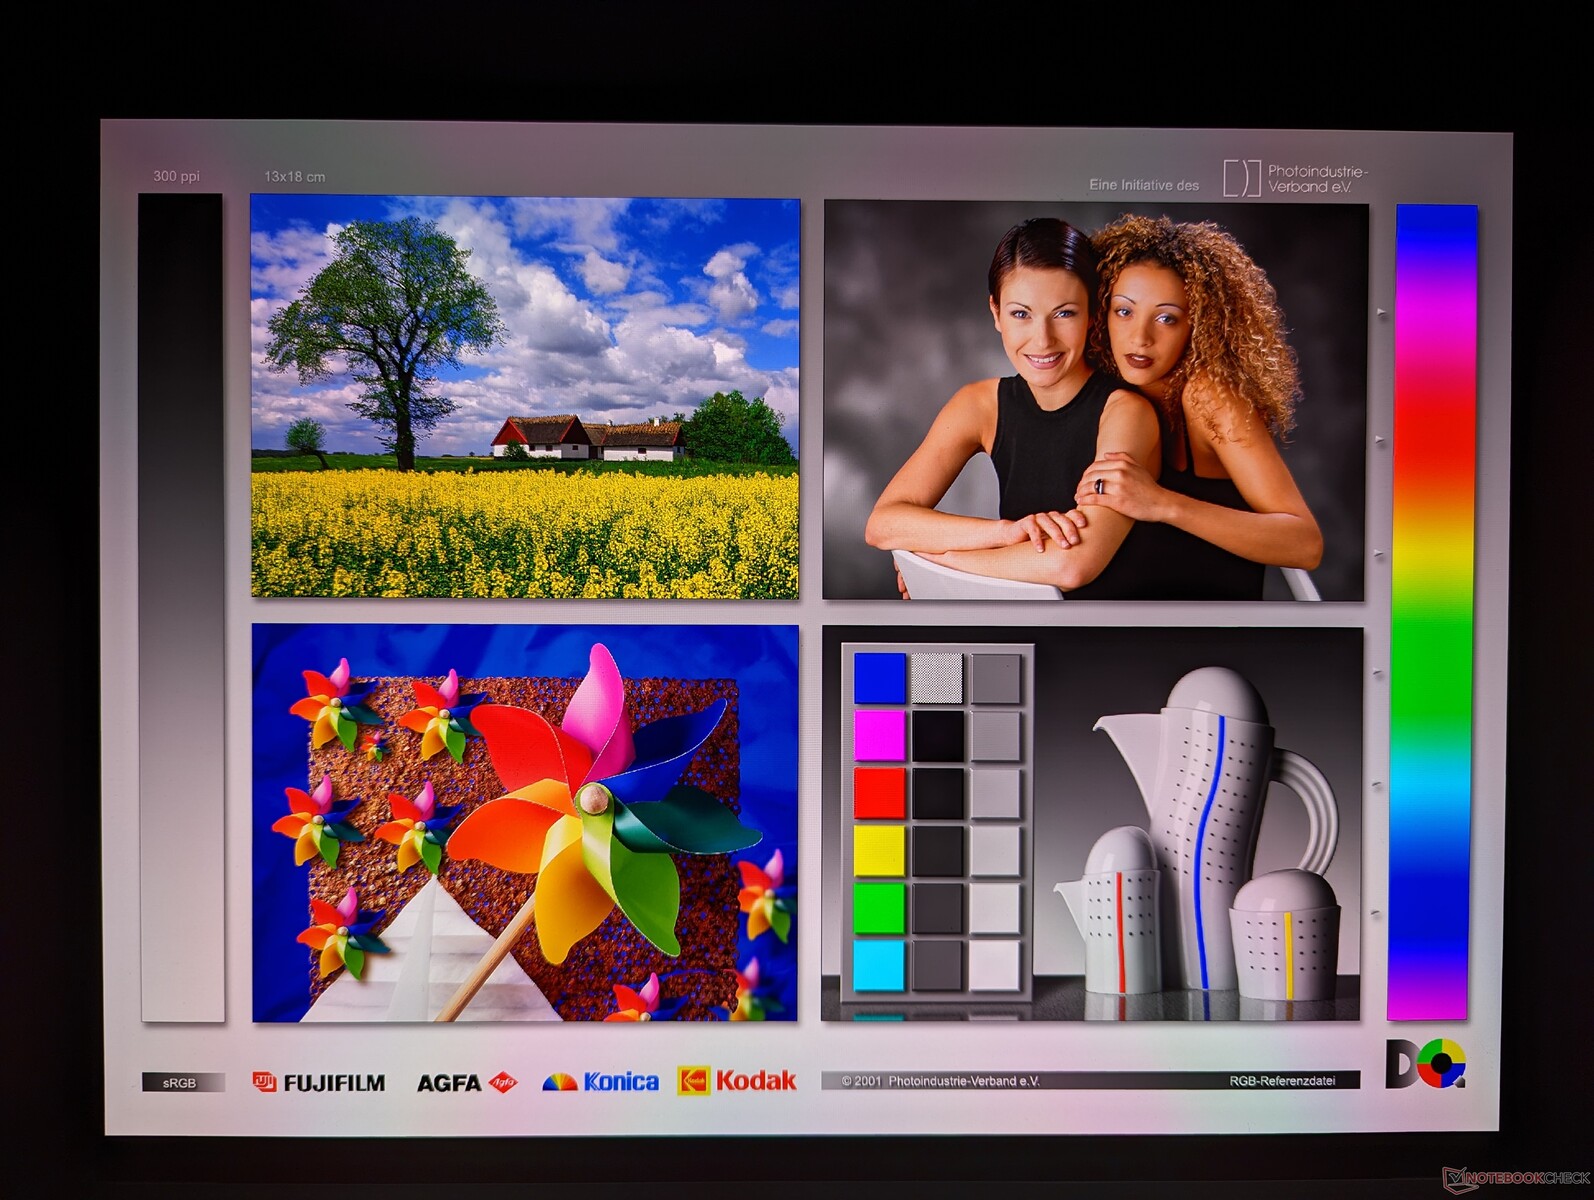
Display — 3.5K Samsung OLED Still Looks Amazing

Dell utilizes the same Samsung 156XG01 OLED panel on its 2023 and 2022 XPS 15 models for a similar viewing experience between them. This isn't necessarily a bad thing as the Samsung panel still offers both full DCI-P3 colors and a sharp picture, but we would love to see 90 Hz or faster panel options in the future. Certain Asus VivoBook models, for example, ship with 120 Hz OLED panels for a much smoother visual experience.
| |||||||||||||||||||||||||
Brightness Distribution: 98 %
Center on Battery: 389.5 cd/m²
Contrast: ∞:1 (Black: 0 cd/m²)
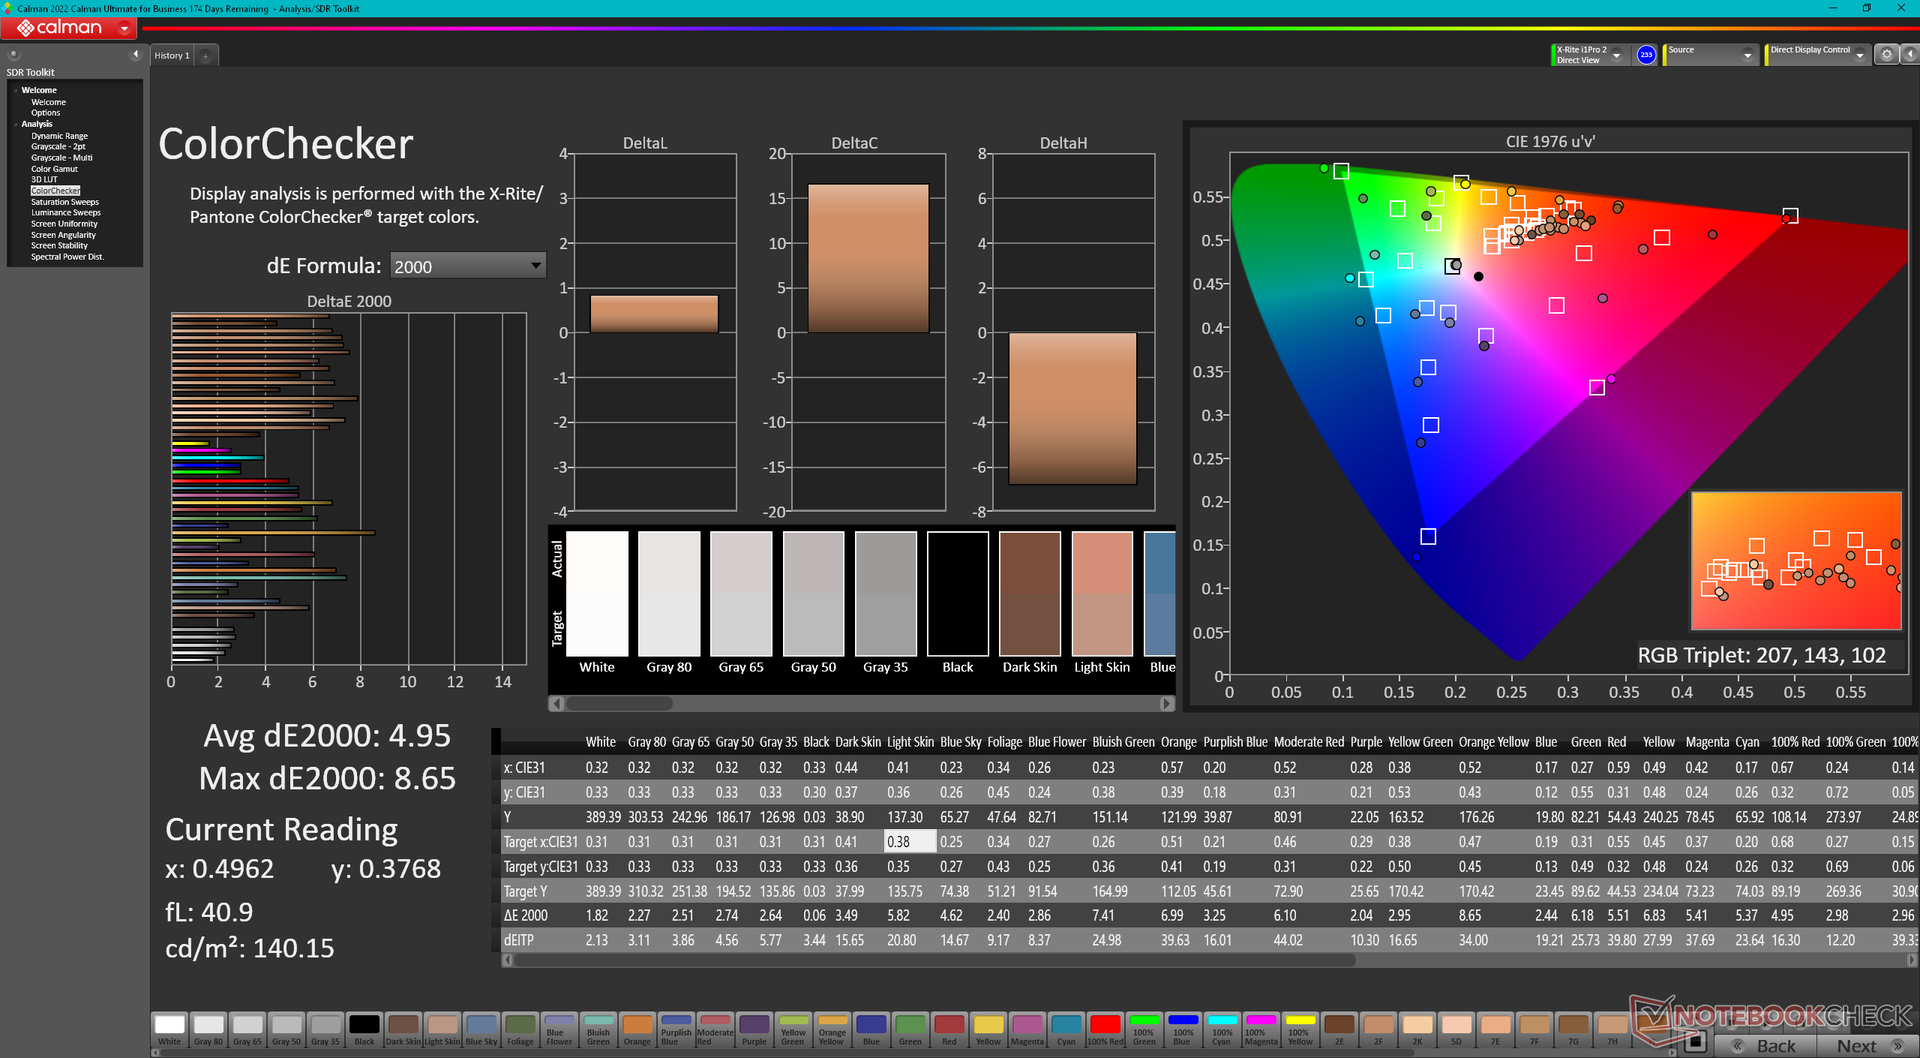
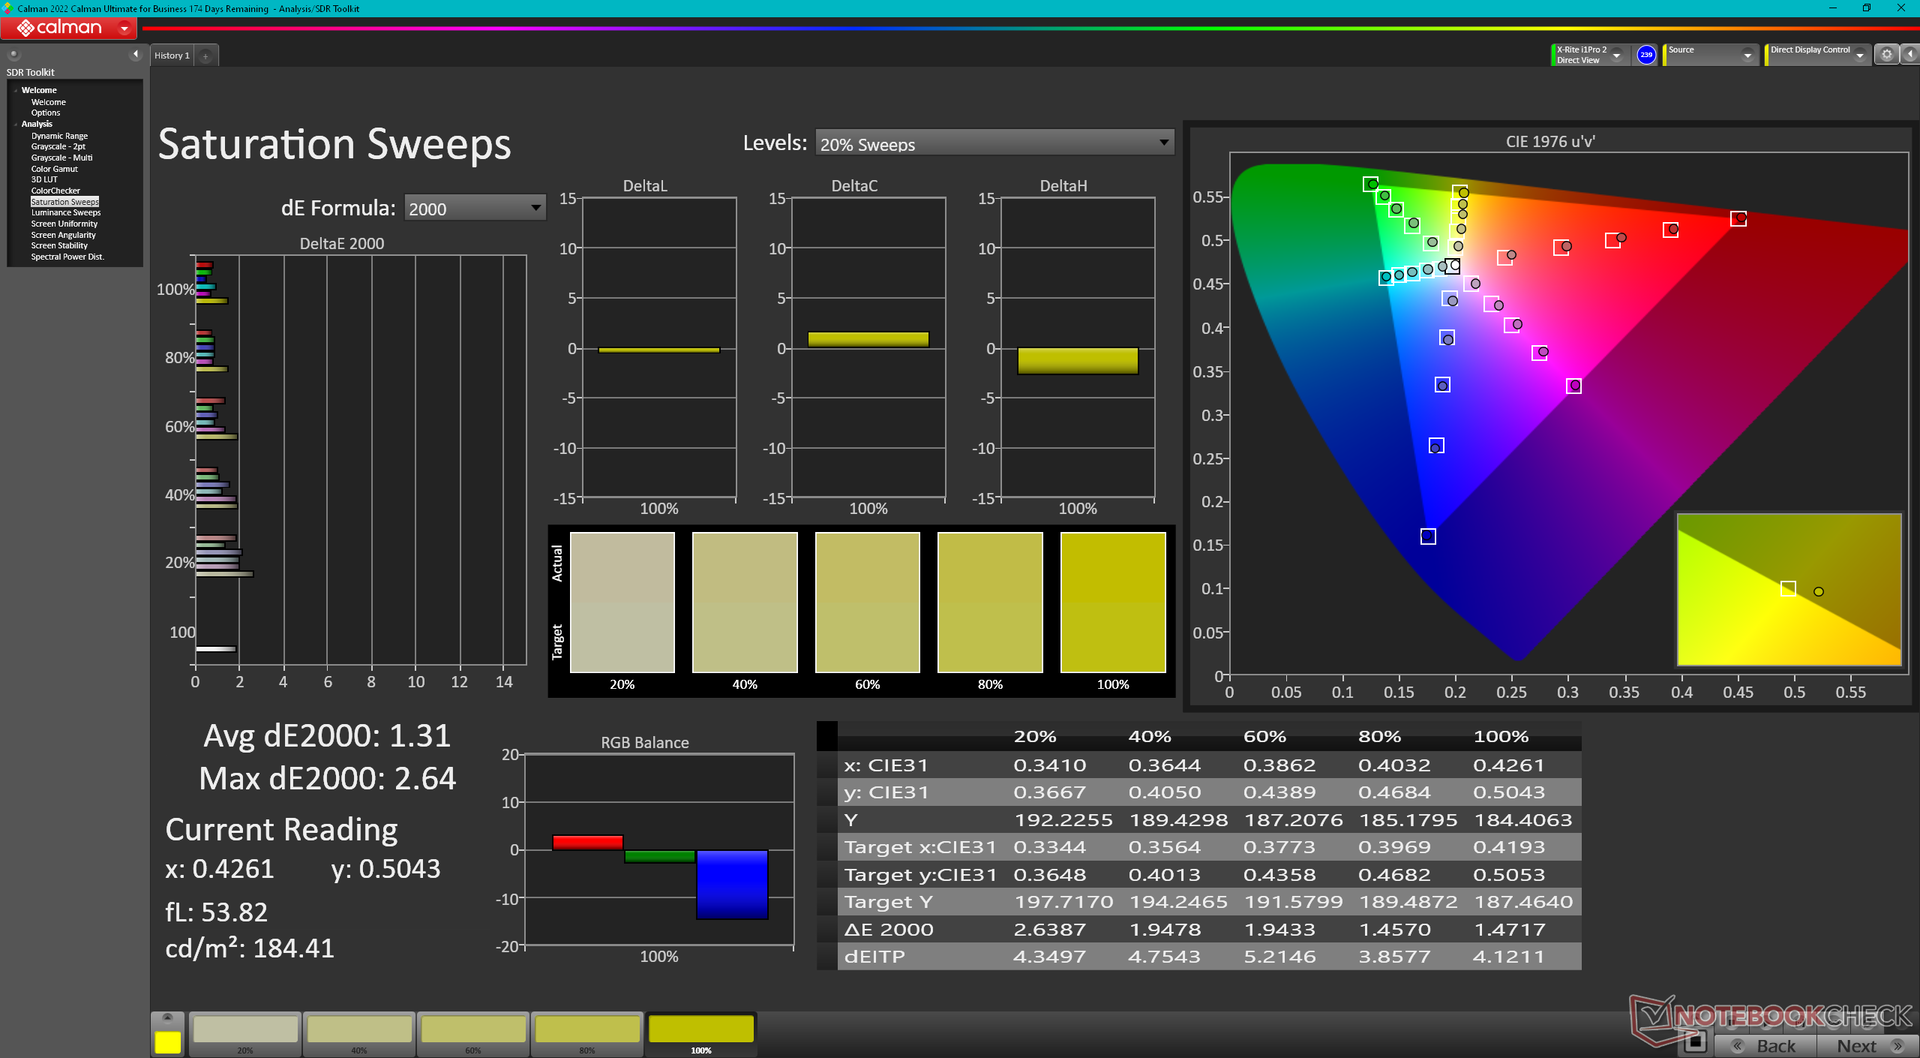
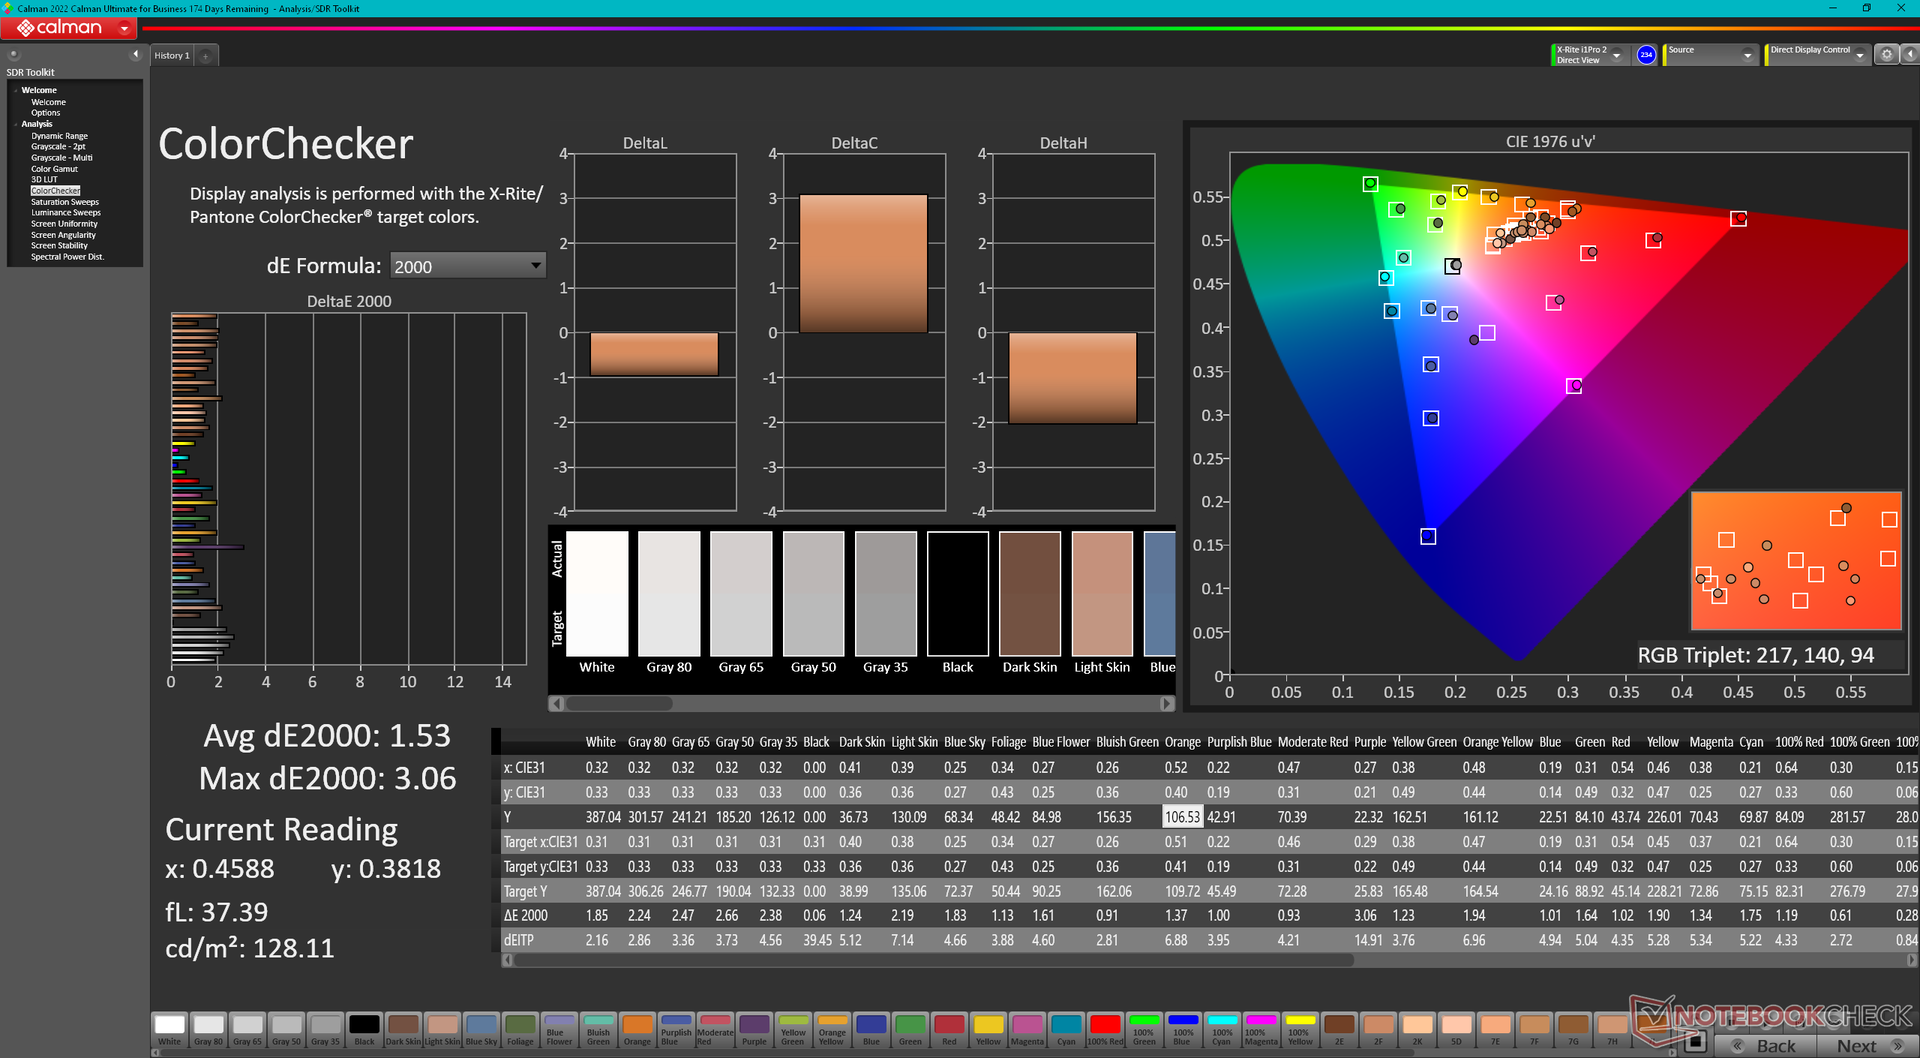
ΔE Color 4.95 | 0.5-29.43 Ø5, calibrated: 1.53
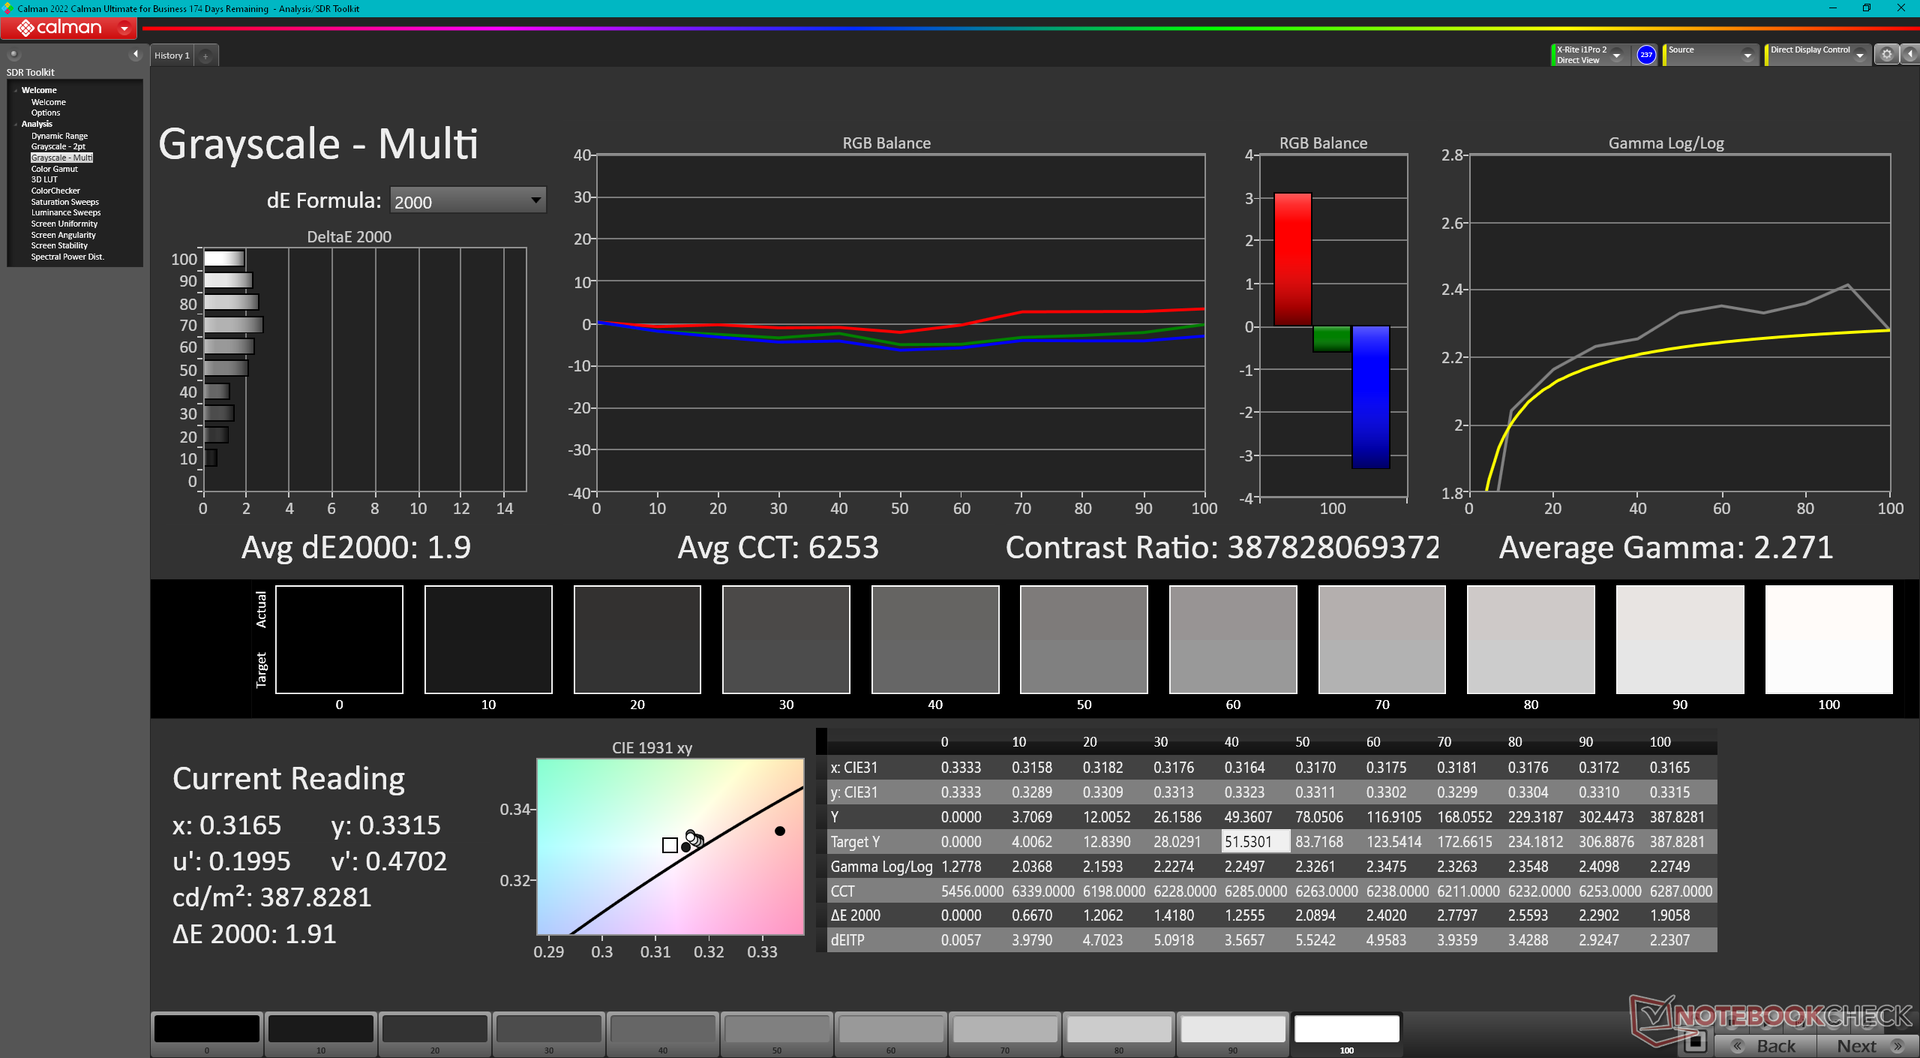
ΔE Greyscale 2 | 0.57-98 Ø5.3
98.4% AdobeRGB 1998 (Argyll 2.2.0 3D)
100% sRGB (Argyll 2.2.0 3D)
99.8% Display P3 (Argyll 2.2.0 3D)
Gamma: 2.27
| Dell XPS 15 9530 RTX 4070 Samsung 156XG01, OLED, 3456x2160, 15.60 | Dell XPS 15 9520 RTX 3050 Ti Samsung 156XG01, OLED, 3456x2160, 15.60 | Dell XPS 15 9500 Core i7 4K UHD Sharp LQ156R1, IPS, 3840x2400, 15.60 | Asus Zenbook Pro 15 OLED UM535Q Samsung ATNA56YX03-0, OLED, 1920x1080, 15.60 | MSI Prestige 15 A12UD-093 Sharp LQ156D1JW42, IPS, 3840x2160, 15.60 | Gigabyte Aero 15 OLED XD Samsung SDC4143, OLED, 3840x2160, 15.60 | |
|---|---|---|---|---|---|---|
| Display | -5% | -3% | -12% | -9% | 0% | |
| Display P3 Coverage | 99.8 | 97.8 -2% | 89.7 -10% | 79.3 -21% | 80.48 -19% | 99.9 0% |
| sRGB Coverage | 100 | 99.9 0% | 100 0% | 95.6 -4% | 96.95 -3% | 100 0% |
| AdobeRGB 1998 Coverage | 98.4 | 86 -13% | 99.8 1% | 87.3 -11% | 94.02 -4% | 99.5 1% |
| Response Times | -29% | -2363% | -40% | -2088% | -23% | |
| Response Time Grey 50% / Grey 80% * | 1.68 ? | 1.9 ? -13% | 54 ? -3114% | 2.1 ? -25% | 51 ? -2936% | 2.8 ? -67% |
| Response Time Black / White * | 1.94 ? | 1.9 ? 2% | 33.2 ? -1611% | 2.3 ? -19% | 26 ? -1240% | 2 ? -3% |
| PWM Frequency | 239 | 59.52 ? -75% | 60.2 -75% | 240 ? 0% | ||
| Screen | -0% | -17% | 13% | 18% | 7% | |
| Brightness middle | 389.5 | 381.4 -2% | 557.9 43% | 342.9 -12% | 441 13% | 440 13% |
| Brightness | 392 | 384 -2% | 541 38% | 346 -12% | 416 6% | 446 14% |
| Brightness Distribution | 98 | 95 -3% | 91 -7% | 98 0% | 85 -13% | 92 -6% |
| Black Level * | 0.39 | 0.155 | 0.04 | |||
| Colorchecker dE 2000 * | 4.95 | 4.34 12% | 4.54 8% | 2.42 51% | 1.51 69% | 2.53 49% |
| Colorchecker dE 2000 max. * | 8.65 | 9.24 -7% | 7.92 8% | 4.05 53% | 3.56 59% | 7.82 10% |
| Colorchecker dE 2000 calibrated * | 1.53 | 3.82 -150% | 2.57 -68% | |||
| Greyscale dE 2000 * | 2 | 2 -0% | 3.2 -60% | 2.1 -5% | 2.49 -25% | 1.2 40% |
| Gamma | 2.27 97% | 2.13 103% | 1.99 111% | 2.21 100% | 2.17 101% | 2.206 100% |
| CCT | 6265 104% | 6210 105% | 6451 101% | 6364 102% | 6292 103% | 6371 102% |
| Contrast | 1431 | 2845 | 11000 | |||
| Color Space (Percent of AdobeRGB 1998) | 89.5 | |||||
| Color Space (Percent of sRGB) | 100 | |||||
| Total Average (Program / Settings) | -11% /
-9% | -794% /
-405% | -13% /
-7% | -693% /
-372% | -5% /
-1% |
* ... smaller is better
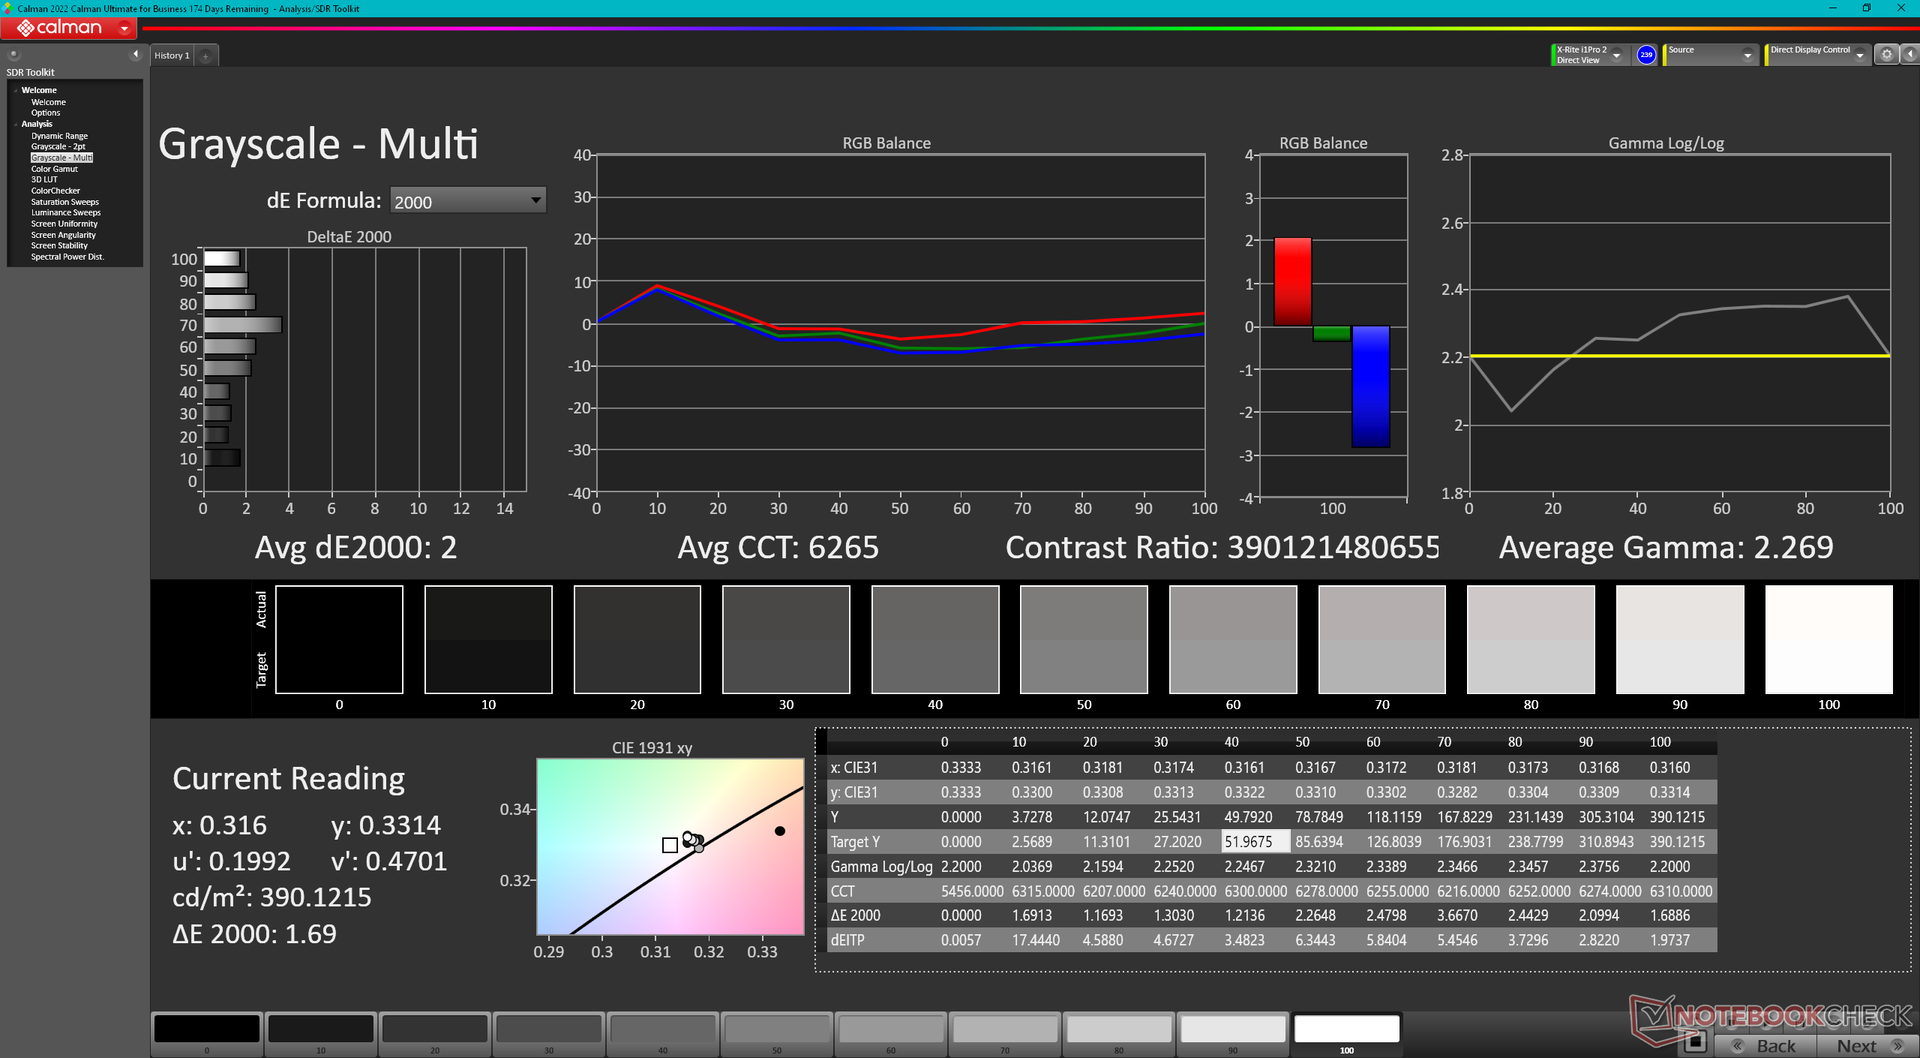
The panel is decently calibrated out of the box, but users can still apply our calibrated ICM profile above to improve color accuracy slightly. Dell has finally integrated the various color profiles like sRGB, AdobeRGB, DCI-P3, and others onto the Windows Display menu for easier profile switching.
Display Response Times
| ↔ Response Time Black to White | ||
|---|---|---|
| 1.94 ms ... rise ↗ and fall ↘ combined | ↗ 0.97 ms rise | 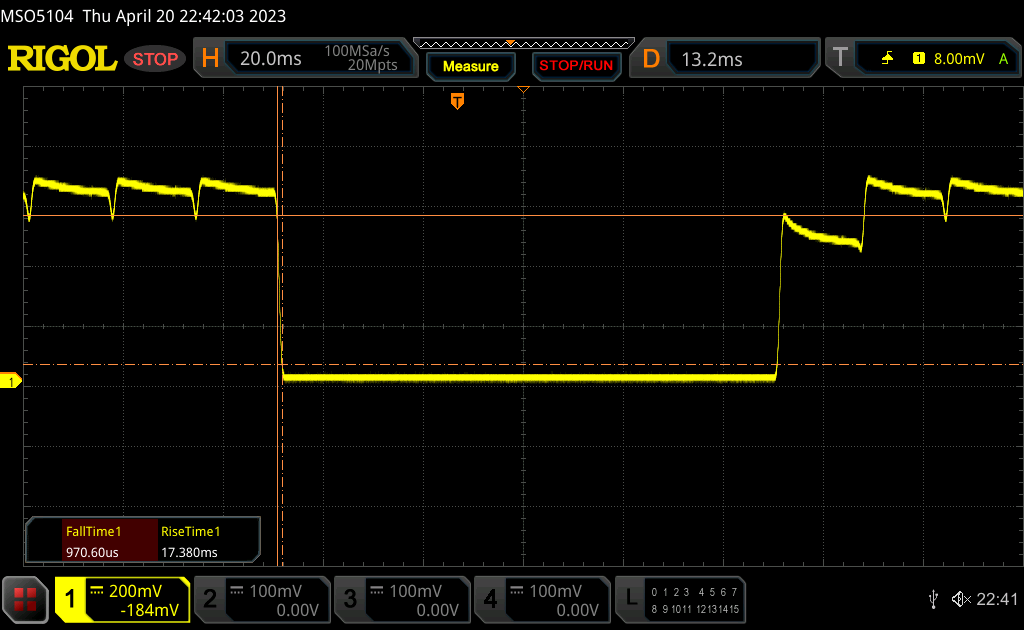 |
| ↘ 0.97 ms fall | ||
| The screen shows very fast response rates in our tests and should be very well suited for fast-paced gaming. In comparison, all tested devices range from 0.1 (minimum) to 240 (maximum) ms. » 6 % of all devices are better. This means that the measured response time is better than the average of all tested devices (21.5 ms). | ||
| ↔ Response Time 50% Grey to 80% Grey | ||
| 1.68 ms ... rise ↗ and fall ↘ combined | ↗ 0.8 ms rise | 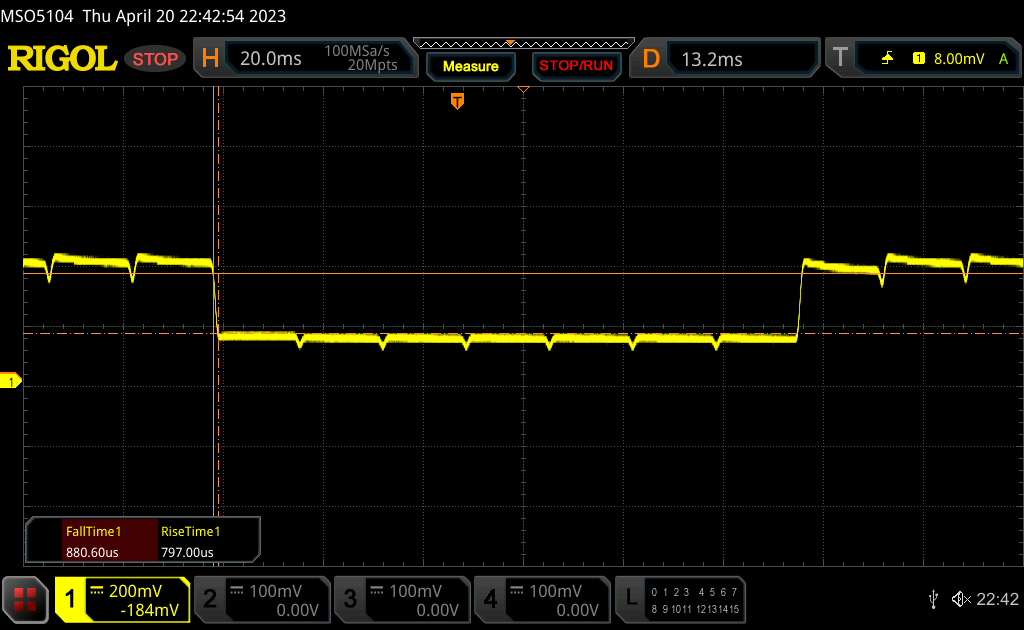 |
| ↘ 0.88 ms fall | ||
| The screen shows very fast response rates in our tests and should be very well suited for fast-paced gaming. In comparison, all tested devices range from 0.2 (minimum) to 636 (maximum) ms. » 4 % of all devices are better. This means that the measured response time is better than the average of all tested devices (33.8 ms). | ||
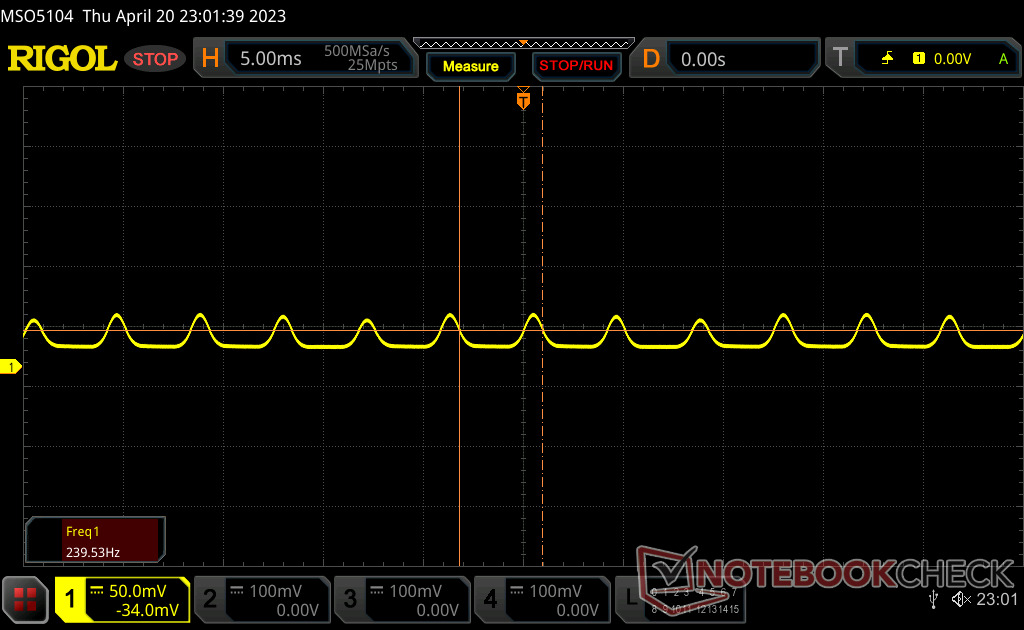
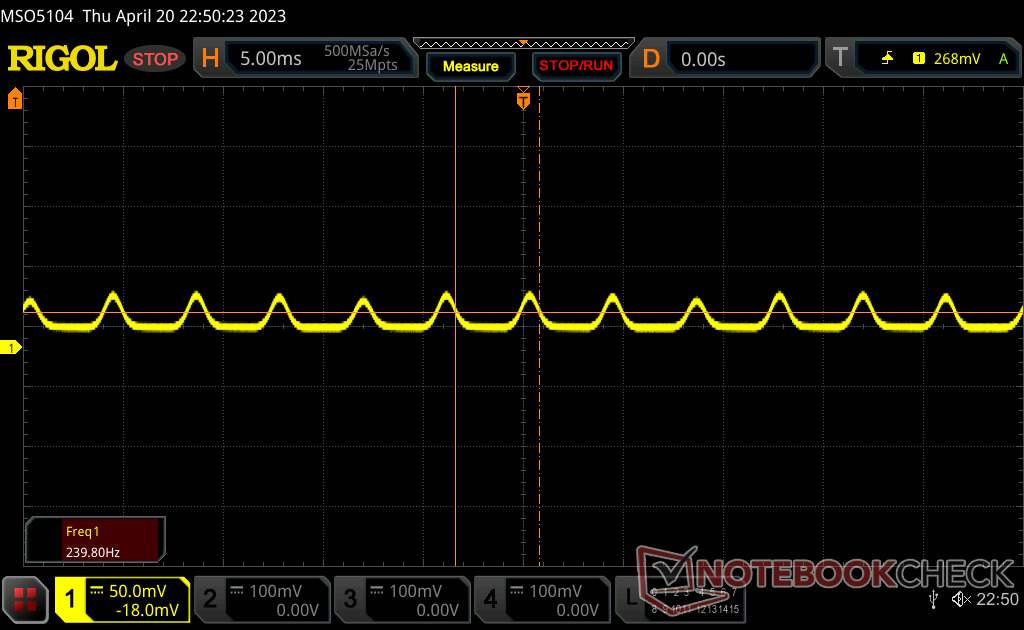
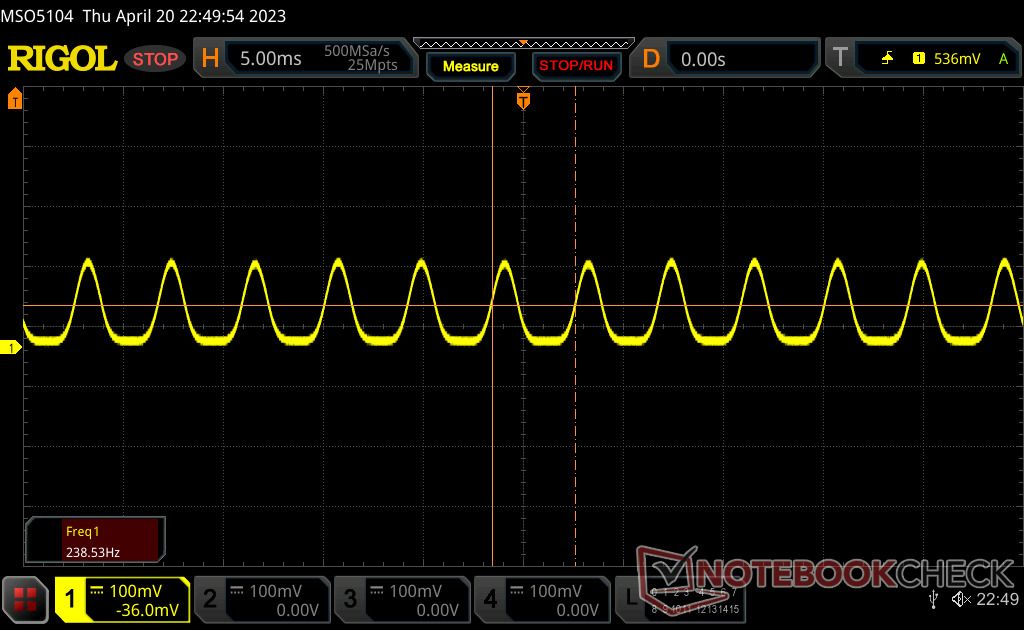
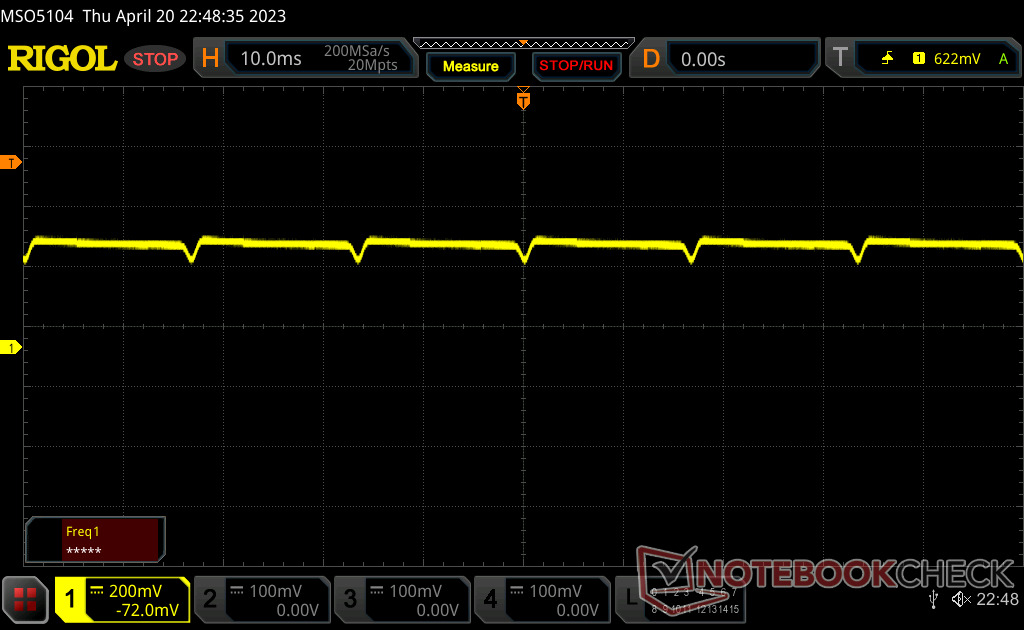
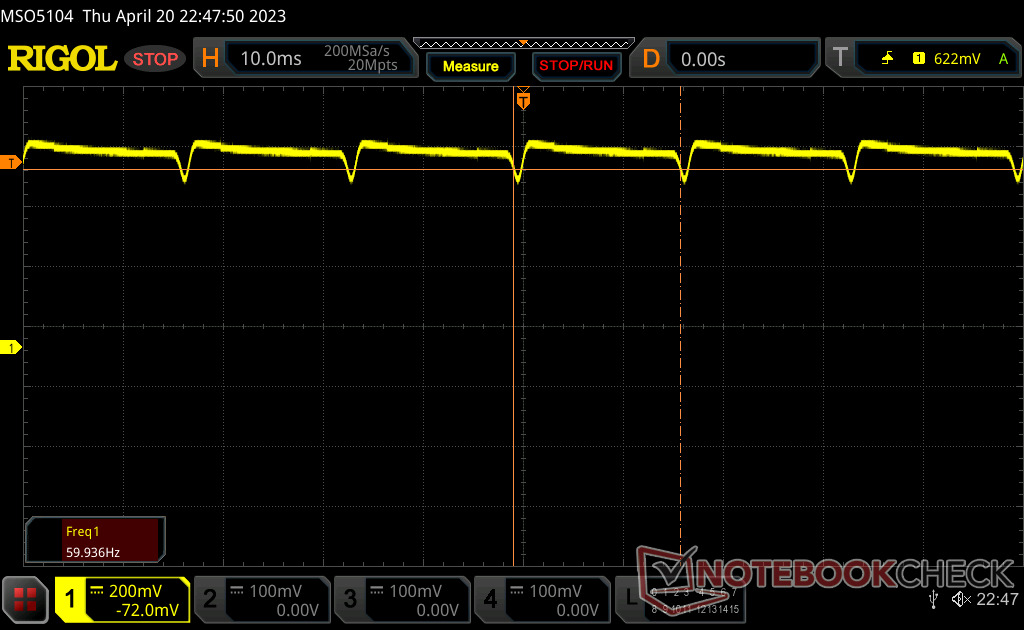
Screen Flickering / PWM (Pulse-Width Modulation)
| Screen flickering / PWM detected | 239 Hz | 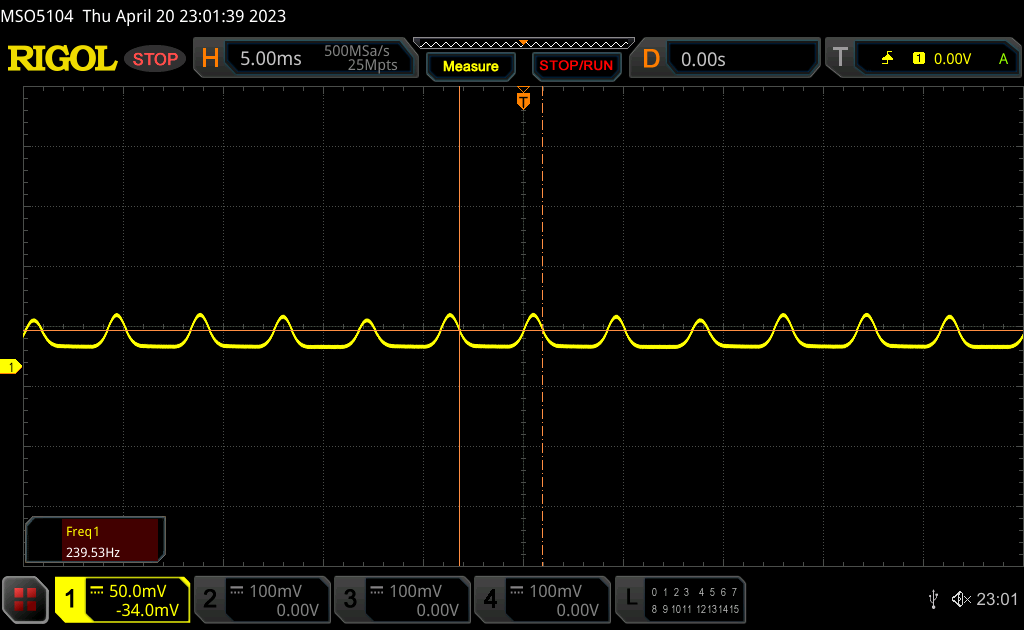 | |
The display backlight flickers at 239 Hz (worst case, e.g., utilizing PWM) . The frequency of 239 Hz is relatively low, so sensitive users will likely notice flickering and experience eyestrain at the stated brightness setting and below. In comparison: 53 % of all tested devices do not use PWM to dim the display. If PWM was detected, an average of 17933 (minimum: 5 - maximum: 3846000) Hz was measured. | |||
Flickering is present on all brightness levels much like the OLED panels on other laptops. We're able to record frequencies of 240 Hz from 0 to 52 percent brightness and 60 Hz from 53 percent to 100 percent brightness.


Performance — 13th Gen Intel + GeForce RTX 4070 Graphics
Testing Conditions
We set our unit to Performance and dGPU modes prior to running the benchmarks below. Advanced Optimus or MUX is not supported.
Processor
CPU performance is a mixed bag due to the limited Turbo Boost potential of the system. For example, our Core i7-13700H CineBench R15 xT score would be 19 percent higher than the i7-12700H in last year's XPS 15 9520. After several benchmark loops, however, the performance gap would narrow and come much closer to last year's processor. The smaller MSI Stealth 14 Studio, which utilizes the same Core i7-13700H CPU as our XPS 15 9530, would exhibit similar throttling behavior.
Upgrading to the Core i9-13900H configuration is expected to boost performance by 15 to 25 percent. However, the benefits might be more minimal as Core i9 CPUs tend to throttle more sharply on thin multimedia laptops like the XPS 15.
Cinebench R15 Multi Loop
Cinebench R23: Multi Core | Single Core
Cinebench R20: CPU (Multi Core) | CPU (Single Core)
Cinebench R15: CPU Multi 64Bit | CPU Single 64Bit
Blender: v2.79 BMW27 CPU
7-Zip 18.03: 7z b 4 | 7z b 4 -mmt1
Geekbench 5.5: Multi-Core | Single-Core
HWBOT x265 Benchmark v2.2: 4k Preset
LibreOffice : 20 Documents To PDF
R Benchmark 2.5: Overall mean
| CPU Performance Rating | |
| Asus Zephyrus Duo 16 GX650PY-NM006W | |
| Uniwill GM6PX7X RTX 4070 | |
| Asus ROG Zephyrus M16 GU604VY-NM042X | |
| Alienware x15 R2 P111F | |
| Dell XPS 15 9530 RTX 4070 | |
| Average Intel Core i7-13700H | |
| Dell XPS 15 9520 RTX 3050 Ti | |
| MSI Prestige 15 A12UD-093 -1! | |
| Asus ROG Strix G15 G513RW | |
| Asus Zenbook Pro 15 OLED UM535Q | |
| Gigabyte Aero 15 OLED XD | |
| Dell XPS 15 9500 Core i7 4K UHD -2! | |
| Cinebench R23 / Multi Core | |
| Asus Zephyrus Duo 16 GX650PY-NM006W | |
| Uniwill GM6PX7X RTX 4070 | |
| Asus ROG Zephyrus M16 GU604VY-NM042X | |
| Alienware x15 R2 P111F | |
| Dell XPS 15 9530 RTX 4070 | |
| Average Intel Core i7-13700H (5890 - 20034, n=27) | |
| Dell XPS 15 9520 RTX 3050 Ti | |
| Asus ROG Strix G15 G513RW | |
| Asus Zenbook Pro 15 OLED UM535Q | |
| MSI Prestige 15 A12UD-093 | |
| Gigabyte Aero 15 OLED XD | |
| Cinebench R23 / Single Core | |
| Asus ROG Zephyrus M16 GU604VY-NM042X | |
| Asus Zephyrus Duo 16 GX650PY-NM006W | |
| Alienware x15 R2 P111F | |
| Dell XPS 15 9530 RTX 4070 | |
| Uniwill GM6PX7X RTX 4070 | |
| Average Intel Core i7-13700H (1323 - 1914, n=27) | |
| Dell XPS 15 9520 RTX 3050 Ti | |
| MSI Prestige 15 A12UD-093 | |
| Asus ROG Strix G15 G513RW | |
| Asus Zenbook Pro 15 OLED UM535Q | |
| Gigabyte Aero 15 OLED XD | |
| Cinebench R20 / CPU (Multi Core) | |
| Asus Zephyrus Duo 16 GX650PY-NM006W | |
| Uniwill GM6PX7X RTX 4070 | |
| Asus ROG Zephyrus M16 GU604VY-NM042X | |
| Alienware x15 R2 P111F | |
| Dell XPS 15 9530 RTX 4070 | |
| Average Intel Core i7-13700H (2322 - 7674, n=27) | |
| Dell XPS 15 9520 RTX 3050 Ti | |
| Asus ROG Strix G15 G513RW | |
| Asus Zenbook Pro 15 OLED UM535Q | |
| MSI Prestige 15 A12UD-093 | |
| Gigabyte Aero 15 OLED XD | |
| Dell XPS 15 9500 Core i7 4K UHD | |
| Cinebench R20 / CPU (Single Core) | |
| Asus Zephyrus Duo 16 GX650PY-NM006W | |
| Asus ROG Zephyrus M16 GU604VY-NM042X | |
| Alienware x15 R2 P111F | |
| Uniwill GM6PX7X RTX 4070 | |
| Dell XPS 15 9530 RTX 4070 | |
| Average Intel Core i7-13700H (508 - 741, n=27) | |
| Dell XPS 15 9520 RTX 3050 Ti | |
| MSI Prestige 15 A12UD-093 | |
| Asus ROG Strix G15 G513RW | |
| Asus Zenbook Pro 15 OLED UM535Q | |
| Gigabyte Aero 15 OLED XD | |
| Dell XPS 15 9500 Core i7 4K UHD | |
| Cinebench R15 / CPU Multi 64Bit | |
| Asus Zephyrus Duo 16 GX650PY-NM006W | |
| Uniwill GM6PX7X RTX 4070 | |
| Asus ROG Zephyrus M16 GU604VY-NM042X | |
| Alienware x15 R2 P111F | |
| Dell XPS 15 9530 RTX 4070 | |
| Average Intel Core i7-13700H (905 - 2982, n=27) | |
| MSI Prestige 15 A12UD-093 | |
| Dell XPS 15 9520 RTX 3050 Ti | |
| Asus ROG Strix G15 G513RW | |
| Asus Zenbook Pro 15 OLED UM535Q | |
| Gigabyte Aero 15 OLED XD | |
| Dell XPS 15 9500 Core i7 4K UHD | |
| Cinebench R15 / CPU Single 64Bit | |
| Asus Zephyrus Duo 16 GX650PY-NM006W | |
| Asus ROG Zephyrus M16 GU604VY-NM042X | |
| Alienware x15 R2 P111F | |
| Dell XPS 15 9530 RTX 4070 | |
| Uniwill GM6PX7X RTX 4070 | |
| Average Intel Core i7-13700H (213 - 276, n=27) | |
| Dell XPS 15 9520 RTX 3050 Ti | |
| Asus ROG Strix G15 G513RW | |
| Asus Zenbook Pro 15 OLED UM535Q | |
| Dell XPS 15 9500 Core i7 4K UHD | |
| Gigabyte Aero 15 OLED XD | |
| MSI Prestige 15 A12UD-093 | |
| Blender / v2.79 BMW27 CPU | |
| Dell XPS 15 9500 Core i7 4K UHD | |
| Gigabyte Aero 15 OLED XD | |
| MSI Prestige 15 A12UD-093 | |
| Asus Zenbook Pro 15 OLED UM535Q | |
| Asus ROG Strix G15 G513RW | |
| Average Intel Core i7-13700H (169 - 555, n=27) | |
| Dell XPS 15 9520 RTX 3050 Ti | |
| Dell XPS 15 9530 RTX 4070 | |
| Alienware x15 R2 P111F | |
| Asus ROG Zephyrus M16 GU604VY-NM042X | |
| Uniwill GM6PX7X RTX 4070 | |
| Asus Zephyrus Duo 16 GX650PY-NM006W | |
| 7-Zip 18.03 / 7z b 4 | |
| Asus Zephyrus Duo 16 GX650PY-NM006W | |
| Uniwill GM6PX7X RTX 4070 | |
| Asus ROG Zephyrus M16 GU604VY-NM042X | |
| Alienware x15 R2 P111F | |
| Dell XPS 15 9520 RTX 3050 Ti | |
| Average Intel Core i7-13700H (27322 - 76344, n=27) | |
| Dell XPS 15 9530 RTX 4070 | |
| Asus ROG Strix G15 G513RW | |
| Asus Zenbook Pro 15 OLED UM535Q | |
| MSI Prestige 15 A12UD-093 | |
| Gigabyte Aero 15 OLED XD | |
| Dell XPS 15 9500 Core i7 4K UHD | |
| 7-Zip 18.03 / 7z b 4 -mmt1 | |
| Asus Zephyrus Duo 16 GX650PY-NM006W | |
| Asus ROG Zephyrus M16 GU604VY-NM042X | |
| Dell XPS 15 9530 RTX 4070 | |
| Uniwill GM6PX7X RTX 4070 | |
| Average Intel Core i7-13700H (4825 - 6238, n=27) | |
| Alienware x15 R2 P111F | |
| Asus ROG Strix G15 G513RW | |
| Dell XPS 15 9520 RTX 3050 Ti | |
| Asus Zenbook Pro 15 OLED UM535Q | |
| MSI Prestige 15 A12UD-093 | |
| Gigabyte Aero 15 OLED XD | |
| Dell XPS 15 9500 Core i7 4K UHD | |
| Geekbench 5.5 / Multi-Core | |
| Asus Zephyrus Duo 16 GX650PY-NM006W | |
| Uniwill GM6PX7X RTX 4070 | |
| Asus ROG Zephyrus M16 GU604VY-NM042X | |
| Alienware x15 R2 P111F | |
| Dell XPS 15 9530 RTX 4070 | |
| Average Intel Core i7-13700H (6165 - 14215, n=27) | |
| Dell XPS 15 9520 RTX 3050 Ti | |
| MSI Prestige 15 A12UD-093 | |
| Asus ROG Strix G15 G513RW | |
| Gigabyte Aero 15 OLED XD | |
| Asus Zenbook Pro 15 OLED UM535Q | |
| Dell XPS 15 9500 Core i7 4K UHD | |
| Geekbench 5.5 / Single-Core | |
| Asus Zephyrus Duo 16 GX650PY-NM006W | |
| Asus ROG Zephyrus M16 GU604VY-NM042X | |
| Dell XPS 15 9530 RTX 4070 | |
| Alienware x15 R2 P111F | |
| Uniwill GM6PX7X RTX 4070 | |
| Average Intel Core i7-13700H (1362 - 1919, n=27) | |
| Dell XPS 15 9520 RTX 3050 Ti | |
| Asus ROG Strix G15 G513RW | |
| MSI Prestige 15 A12UD-093 | |
| Asus Zenbook Pro 15 OLED UM535Q | |
| Gigabyte Aero 15 OLED XD | |
| Dell XPS 15 9500 Core i7 4K UHD | |
| HWBOT x265 Benchmark v2.2 / 4k Preset | |
| Asus Zephyrus Duo 16 GX650PY-NM006W | |
| Uniwill GM6PX7X RTX 4070 | |
| Asus ROG Zephyrus M16 GU604VY-NM042X | |
| Alienware x15 R2 P111F | |
| Dell XPS 15 9530 RTX 4070 | |
| Average Intel Core i7-13700H (6.72 - 21.2, n=27) | |
| Asus ROG Strix G15 G513RW | |
| Asus Zenbook Pro 15 OLED UM535Q | |
| Dell XPS 15 9520 RTX 3050 Ti | |
| Gigabyte Aero 15 OLED XD | |
| Dell XPS 15 9500 Core i7 4K UHD | |
| LibreOffice / 20 Documents To PDF | |
| Asus ROG Strix G15 G513RW | |
| MSI Prestige 15 A12UD-093 | |
| MSI Prestige 15 A12UD-093 | |
| Asus Zephyrus Duo 16 GX650PY-NM006W | |
| Dell XPS 15 9500 Core i7 4K UHD | |
| Asus ROG Zephyrus M16 GU604VY-NM042X | |
| Asus Zenbook Pro 15 OLED UM535Q | |
| Average Intel Core i7-13700H (31.3 - 62.4, n=27) | |
| Gigabyte Aero 15 OLED XD | |
| Alienware x15 R2 P111F | |
| Dell XPS 15 9530 RTX 4070 | |
| Dell XPS 15 9520 RTX 3050 Ti | |
| Uniwill GM6PX7X RTX 4070 | |
| R Benchmark 2.5 / Overall mean | |
| Gigabyte Aero 15 OLED XD | |
| Dell XPS 15 9500 Core i7 4K UHD | |
| Asus Zenbook Pro 15 OLED UM535Q | |
| Asus ROG Strix G15 G513RW | |
| Average Intel Core i7-13700H (0.4308 - 0.607, n=27) | |
| Uniwill GM6PX7X RTX 4070 | |
| Dell XPS 15 9520 RTX 3050 Ti | |
| MSI Prestige 15 A12UD-093 | |
| Dell XPS 15 9530 RTX 4070 | |
| Alienware x15 R2 P111F | |
| Asus ROG Zephyrus M16 GU604VY-NM042X | |
| Asus Zephyrus Duo 16 GX650PY-NM006W | |
* ... smaller is better
AIDA64: FP32 Ray-Trace | FPU Julia | CPU SHA3 | CPU Queen | FPU SinJulia | FPU Mandel | CPU AES | CPU ZLib | FP64 Ray-Trace | CPU PhotoWorxx
| Performance Rating | |
| Asus Zenbook Pro 15 OLED UM535Q | |
| Average Intel Core i7-13700H | |
| Dell XPS 15 9530 RTX 4070 | |
| MSI Prestige 15 A12UD-093 | |
| Dell XPS 15 9520 RTX 3050 Ti | |
| Dell XPS 15 9500 Core i7 4K UHD | |
| Gigabyte Aero 15 OLED XD -9! | |
| AIDA64 / FP32 Ray-Trace | |
| Asus Zenbook Pro 15 OLED UM535Q | |
| Average Intel Core i7-13700H (4986 - 18908, n=27) | |
| Dell XPS 15 9530 RTX 4070 | |
| MSI Prestige 15 A12UD-093 | |
| Dell XPS 15 9500 Core i7 4K UHD | |
| Dell XPS 15 9520 RTX 3050 Ti | |
| AIDA64 / FPU Julia | |
| Asus Zenbook Pro 15 OLED UM535Q | |
| Average Intel Core i7-13700H (25360 - 92359, n=27) | |
| Dell XPS 15 9530 RTX 4070 | |
| Dell XPS 15 9500 Core i7 4K UHD | |
| MSI Prestige 15 A12UD-093 | |
| Dell XPS 15 9520 RTX 3050 Ti | |
| AIDA64 / CPU SHA3 | |
| Asus Zenbook Pro 15 OLED UM535Q | |
| Average Intel Core i7-13700H (1339 - 4224, n=27) | |
| Dell XPS 15 9530 RTX 4070 | |
| Dell XPS 15 9500 Core i7 4K UHD | |
| Dell XPS 15 9520 RTX 3050 Ti | |
| MSI Prestige 15 A12UD-093 | |
| AIDA64 / CPU Queen | |
| Dell XPS 15 9530 RTX 4070 | |
| Asus Zenbook Pro 15 OLED UM535Q | |
| Dell XPS 15 9520 RTX 3050 Ti | |
| Average Intel Core i7-13700H (68763 - 107159, n=27) | |
| Dell XPS 15 9500 Core i7 4K UHD | |
| MSI Prestige 15 A12UD-093 | |
| AIDA64 / FPU SinJulia | |
| Asus Zenbook Pro 15 OLED UM535Q | |
| Dell XPS 15 9500 Core i7 4K UHD | |
| Average Intel Core i7-13700H (4800 - 11050, n=27) | |
| Dell XPS 15 9530 RTX 4070 | |
| Dell XPS 15 9520 RTX 3050 Ti | |
| MSI Prestige 15 A12UD-093 | |
| AIDA64 / FPU Mandel | |
| Asus Zenbook Pro 15 OLED UM535Q | |
| Average Intel Core i7-13700H (12321 - 45118, n=27) | |
| Dell XPS 15 9530 RTX 4070 | |
| Dell XPS 15 9500 Core i7 4K UHD | |
| MSI Prestige 15 A12UD-093 | |
| Dell XPS 15 9520 RTX 3050 Ti | |
| AIDA64 / CPU AES | |
| Asus Zenbook Pro 15 OLED UM535Q | |
| MSI Prestige 15 A12UD-093 | |
| Dell XPS 15 9520 RTX 3050 Ti | |
| Average Intel Core i7-13700H (28769 - 151254, n=27) | |
| Dell XPS 15 9530 RTX 4070 | |
| Dell XPS 15 9500 Core i7 4K UHD | |
| AIDA64 / CPU ZLib | |
| Average Intel Core i7-13700H (389 - 1215, n=27) | |
| Dell XPS 15 9530 RTX 4070 | |
| Dell XPS 15 9520 RTX 3050 Ti | |
| Asus Zenbook Pro 15 OLED UM535Q | |
| MSI Prestige 15 A12UD-093 | |
| Dell XPS 15 9500 Core i7 4K UHD | |
| Gigabyte Aero 15 OLED XD | |
| AIDA64 / FP64 Ray-Trace | |
| Asus Zenbook Pro 15 OLED UM535Q | |
| Dell XPS 15 9530 RTX 4070 | |
| Average Intel Core i7-13700H (2540 - 10135, n=27) | |
| MSI Prestige 15 A12UD-093 | |
| Dell XPS 15 9520 RTX 3050 Ti | |
| Dell XPS 15 9500 Core i7 4K UHD | |
| AIDA64 / CPU PhotoWorxx | |
| Dell XPS 15 9530 RTX 4070 | |
| MSI Prestige 15 A12UD-093 | |
| Average Intel Core i7-13700H (19552 - 52727, n=27) | |
| Dell XPS 15 9520 RTX 3050 Ti | |
| Dell XPS 15 9500 Core i7 4K UHD | |
| Asus Zenbook Pro 15 OLED UM535Q | |
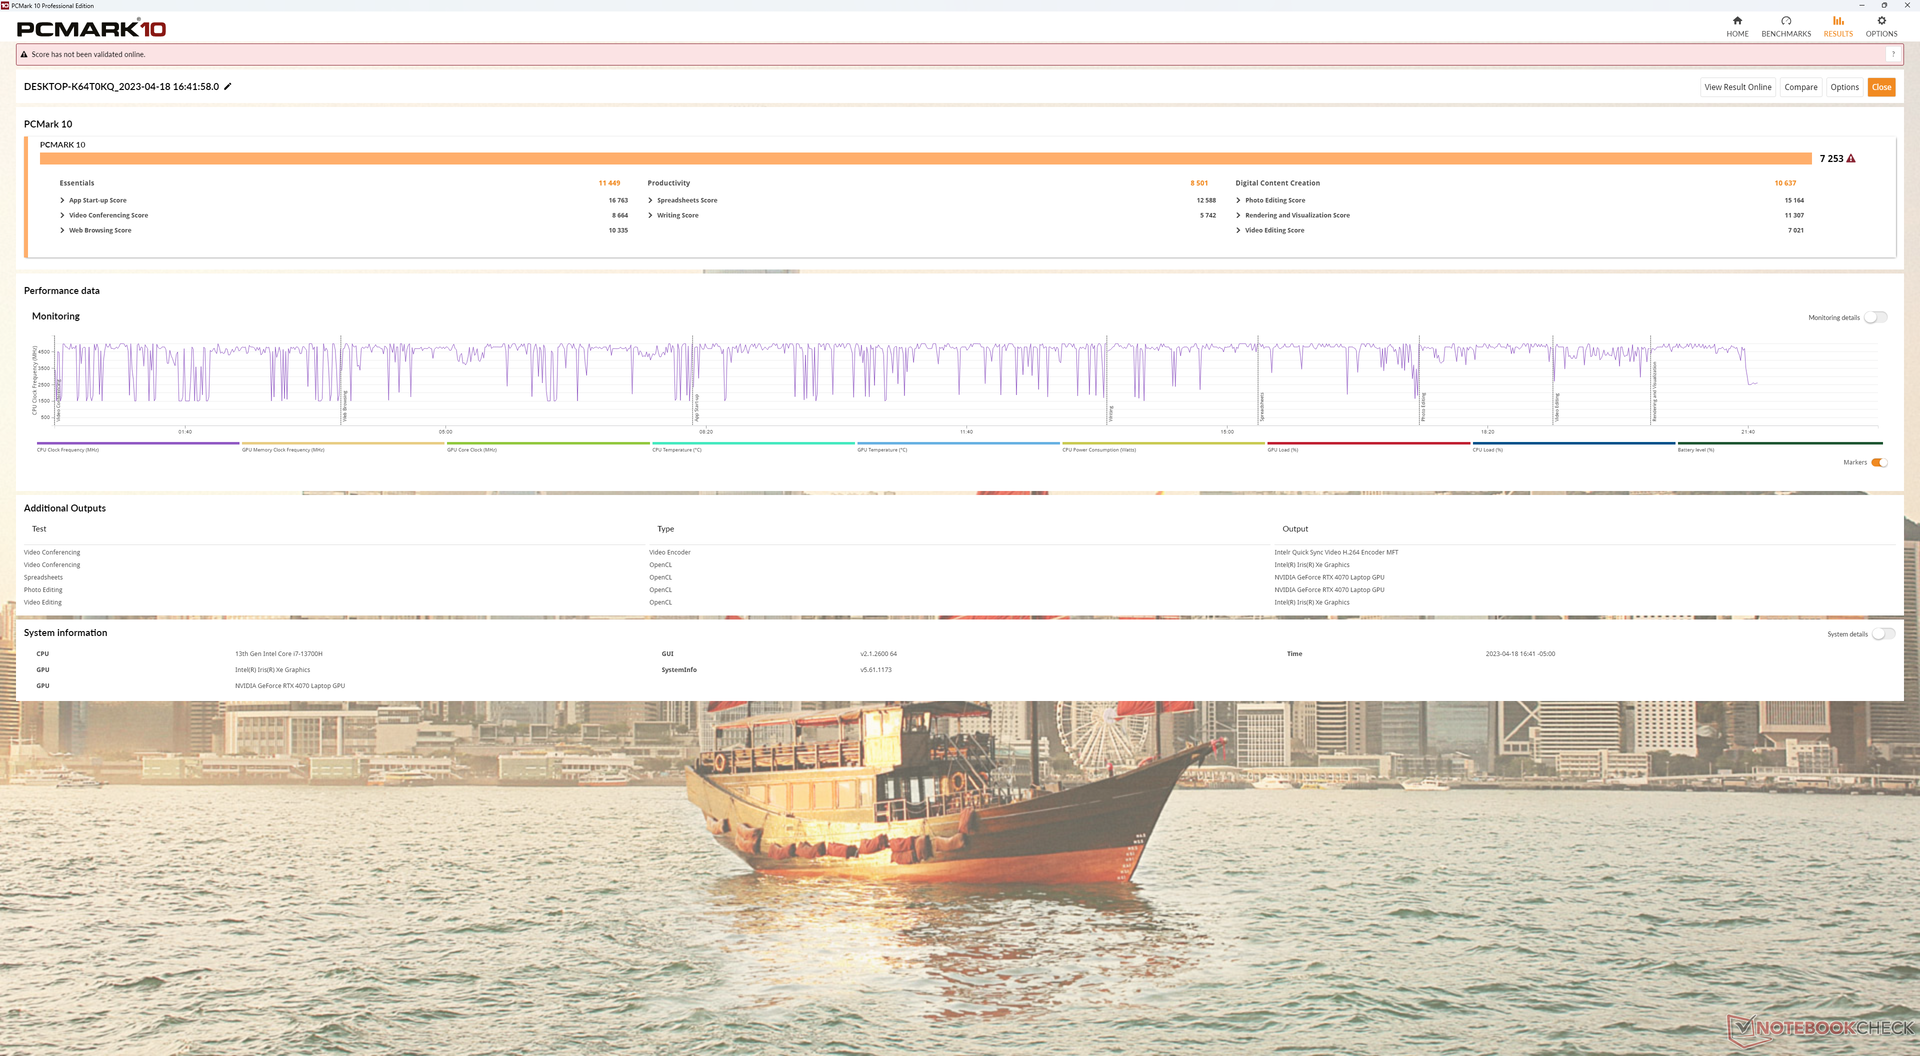
System Performance
CrossMark: Overall | Productivity | Creativity | Responsiveness
| PCMark 10 / Score | |
| Average Intel Core i7-13700H, NVIDIA GeForce RTX 4070 Laptop GPU (7158 - 7956, n=8) | |
| Dell XPS 15 9530 RTX 4070 | |
| Dell XPS 15 9520 RTX 3050 Ti | |
| Gigabyte Aero 15 OLED XD | |
| Asus Zenbook Pro 15 OLED UM535Q | |
| MSI Prestige 15 A12UD-093 | |
| Dell XPS 15 9500 Core i7 4K UHD | |
| PCMark 10 / Essentials | |
| Dell XPS 15 9530 RTX 4070 | |
| Dell XPS 15 9520 RTX 3050 Ti | |
| Average Intel Core i7-13700H, NVIDIA GeForce RTX 4070 Laptop GPU (10252 - 11449, n=8) | |
| Asus Zenbook Pro 15 OLED UM535Q | |
| MSI Prestige 15 A12UD-093 | |
| Gigabyte Aero 15 OLED XD | |
| Dell XPS 15 9500 Core i7 4K UHD | |
| PCMark 10 / Productivity | |
| Gigabyte Aero 15 OLED XD | |
| Asus Zenbook Pro 15 OLED UM535Q | |
| Dell XPS 15 9520 RTX 3050 Ti | |
| Average Intel Core i7-13700H, NVIDIA GeForce RTX 4070 Laptop GPU (8501 - 10769, n=8) | |
| MSI Prestige 15 A12UD-093 | |
| Dell XPS 15 9530 RTX 4070 | |
| Dell XPS 15 9500 Core i7 4K UHD | |
| PCMark 10 / Digital Content Creation | |
| Average Intel Core i7-13700H, NVIDIA GeForce RTX 4070 Laptop GPU (10358 - 12908, n=8) | |
| Dell XPS 15 9530 RTX 4070 | |
| Gigabyte Aero 15 OLED XD | |
| Dell XPS 15 9520 RTX 3050 Ti | |
| Asus Zenbook Pro 15 OLED UM535Q | |
| MSI Prestige 15 A12UD-093 | |
| Dell XPS 15 9500 Core i7 4K UHD | |
| CrossMark / Overall | |
| Dell XPS 15 9530 RTX 4070 | |
| Average Intel Core i7-13700H, NVIDIA GeForce RTX 4070 Laptop GPU (1768 - 2073, n=6) | |
| Dell XPS 15 9520 RTX 3050 Ti | |
| MSI Prestige 15 A12UD-093 | |
| Asus Zenbook Pro 15 OLED UM535Q | |
| CrossMark / Productivity | |
| Dell XPS 15 9520 RTX 3050 Ti | |
| Average Intel Core i7-13700H, NVIDIA GeForce RTX 4070 Laptop GPU (1645 - 2006, n=6) | |
| Dell XPS 15 9530 RTX 4070 | |
| MSI Prestige 15 A12UD-093 | |
| Asus Zenbook Pro 15 OLED UM535Q | |
| CrossMark / Creativity | |
| Dell XPS 15 9530 RTX 4070 | |
| Average Intel Core i7-13700H, NVIDIA GeForce RTX 4070 Laptop GPU (1936 - 2137, n=6) | |
| Dell XPS 15 9520 RTX 3050 Ti | |
| MSI Prestige 15 A12UD-093 | |
| Asus Zenbook Pro 15 OLED UM535Q | |
| CrossMark / Responsiveness | |
| Dell XPS 15 9520 RTX 3050 Ti | |
| Average Intel Core i7-13700H, NVIDIA GeForce RTX 4070 Laptop GPU (1451 - 2202, n=6) | |
| Dell XPS 15 9530 RTX 4070 | |
| MSI Prestige 15 A12UD-093 | |
| Asus Zenbook Pro 15 OLED UM535Q | |
| PCMark 10 Score | 7253 points | |
Help | ||
| AIDA64 / Memory Copy | |
| Dell XPS 15 9530 RTX 4070 | |
| MSI Prestige 15 A12UD-093 | |
| Average Intel Core i7-13700H (40018 - 78081, n=27) | |
| Dell XPS 15 9520 RTX 3050 Ti | |
| Asus Zenbook Pro 15 OLED UM535Q | |
| Dell XPS 15 9500 Core i7 4K UHD | |
| AIDA64 / Memory Read | |
| Dell XPS 15 9530 RTX 4070 | |
| Average Intel Core i7-13700H (44583 - 79656, n=27) | |
| MSI Prestige 15 A12UD-093 | |
| Dell XPS 15 9520 RTX 3050 Ti | |
| Asus Zenbook Pro 15 OLED UM535Q | |
| Dell XPS 15 9500 Core i7 4K UHD | |
| AIDA64 / Memory Write | |
| Average Intel Core i7-13700H (42710 - 99898, n=27) | |
| Dell XPS 15 9530 RTX 4070 | |
| MSI Prestige 15 A12UD-093 | |
| Dell XPS 15 9520 RTX 3050 Ti | |
| Asus Zenbook Pro 15 OLED UM535Q | |
| Dell XPS 15 9500 Core i7 4K UHD | |
| AIDA64 / Memory Latency | |
| Dell XPS 15 9520 RTX 3050 Ti | |
| MSI Prestige 15 A12UD-093 | |
| Asus Zenbook Pro 15 OLED UM535Q | |
| Average Intel Core i7-13700H (82.4 - 136.8, n=27) | |
| Dell XPS 15 9530 RTX 4070 | |
| Dell XPS 15 9500 Core i7 4K UHD | |
| Gigabyte Aero 15 OLED XD | |
* ... smaller is better
DPC Latency
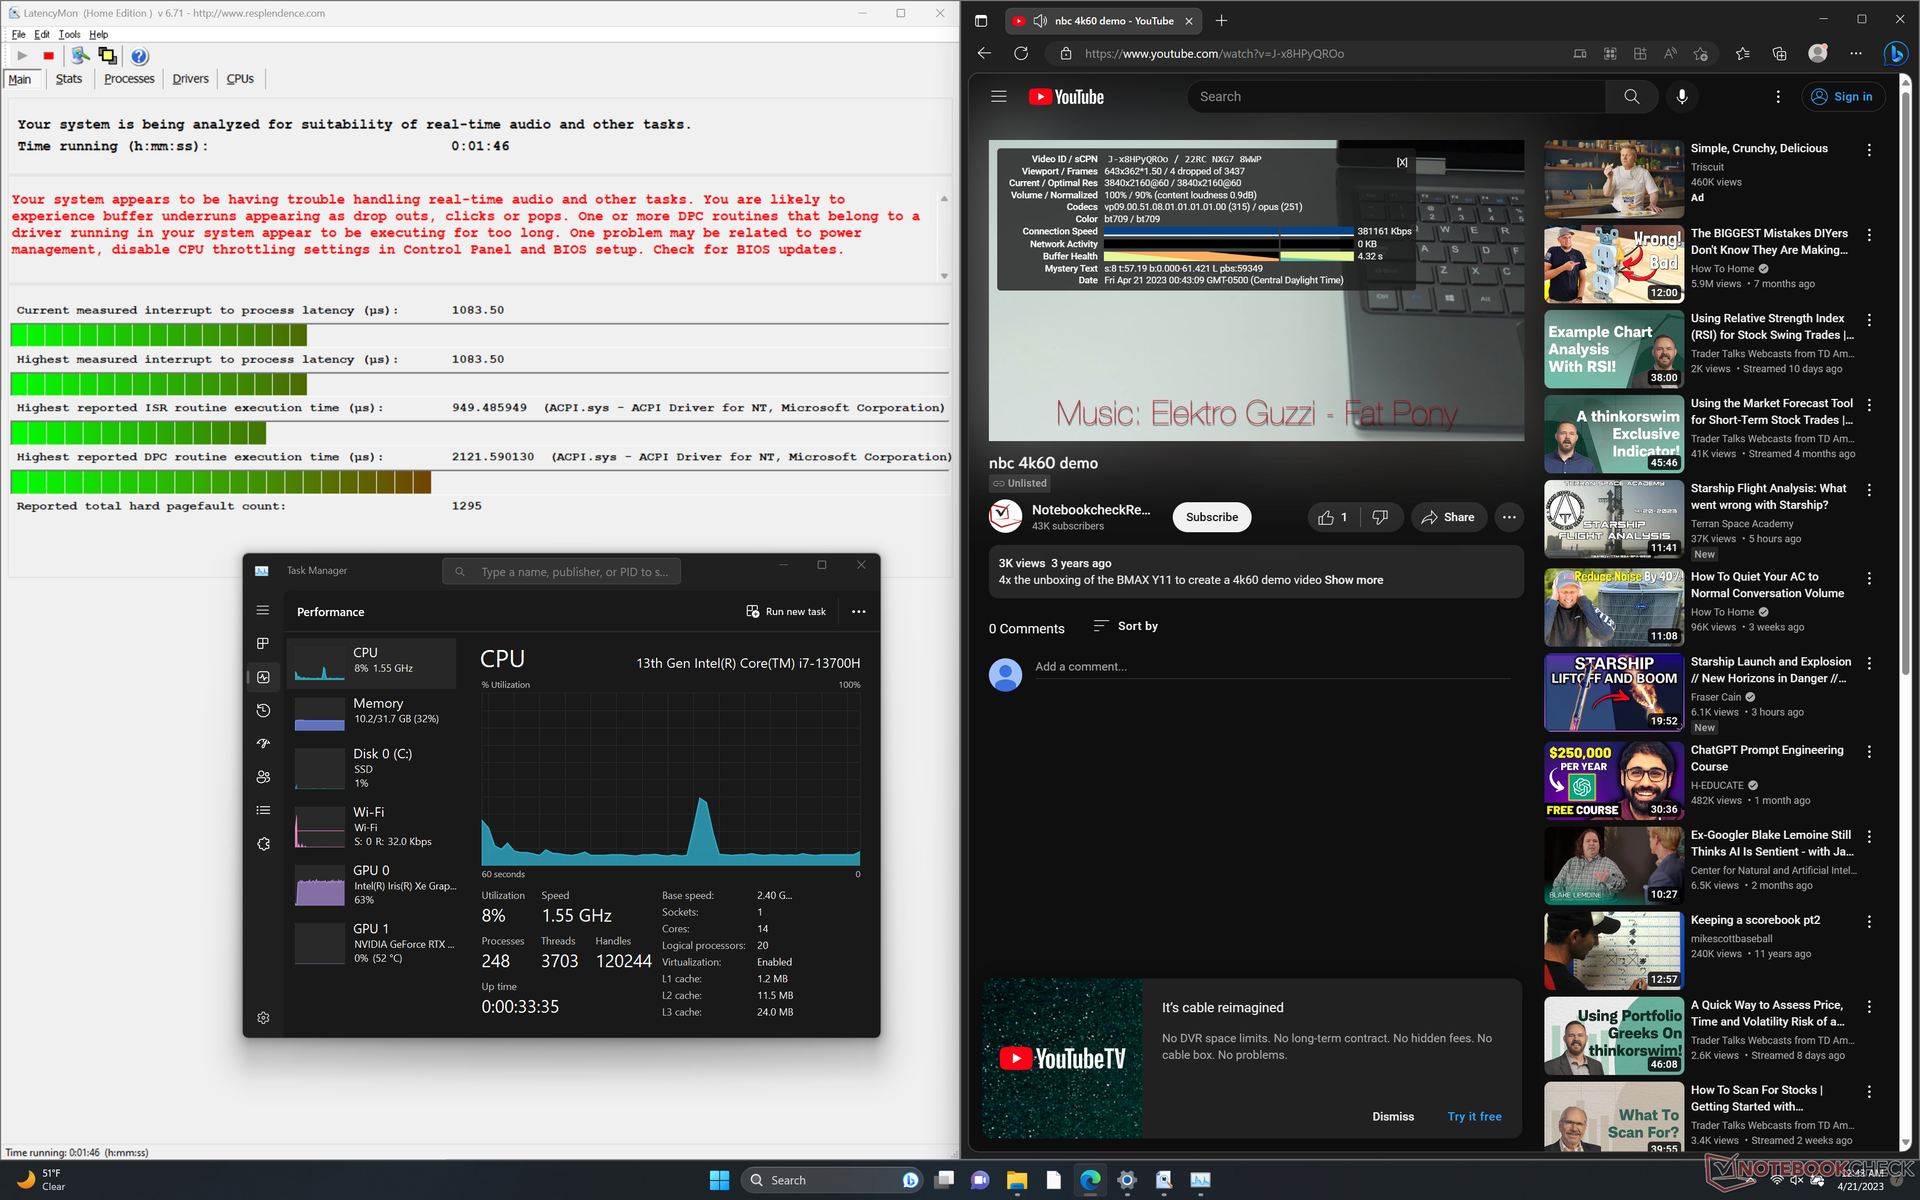
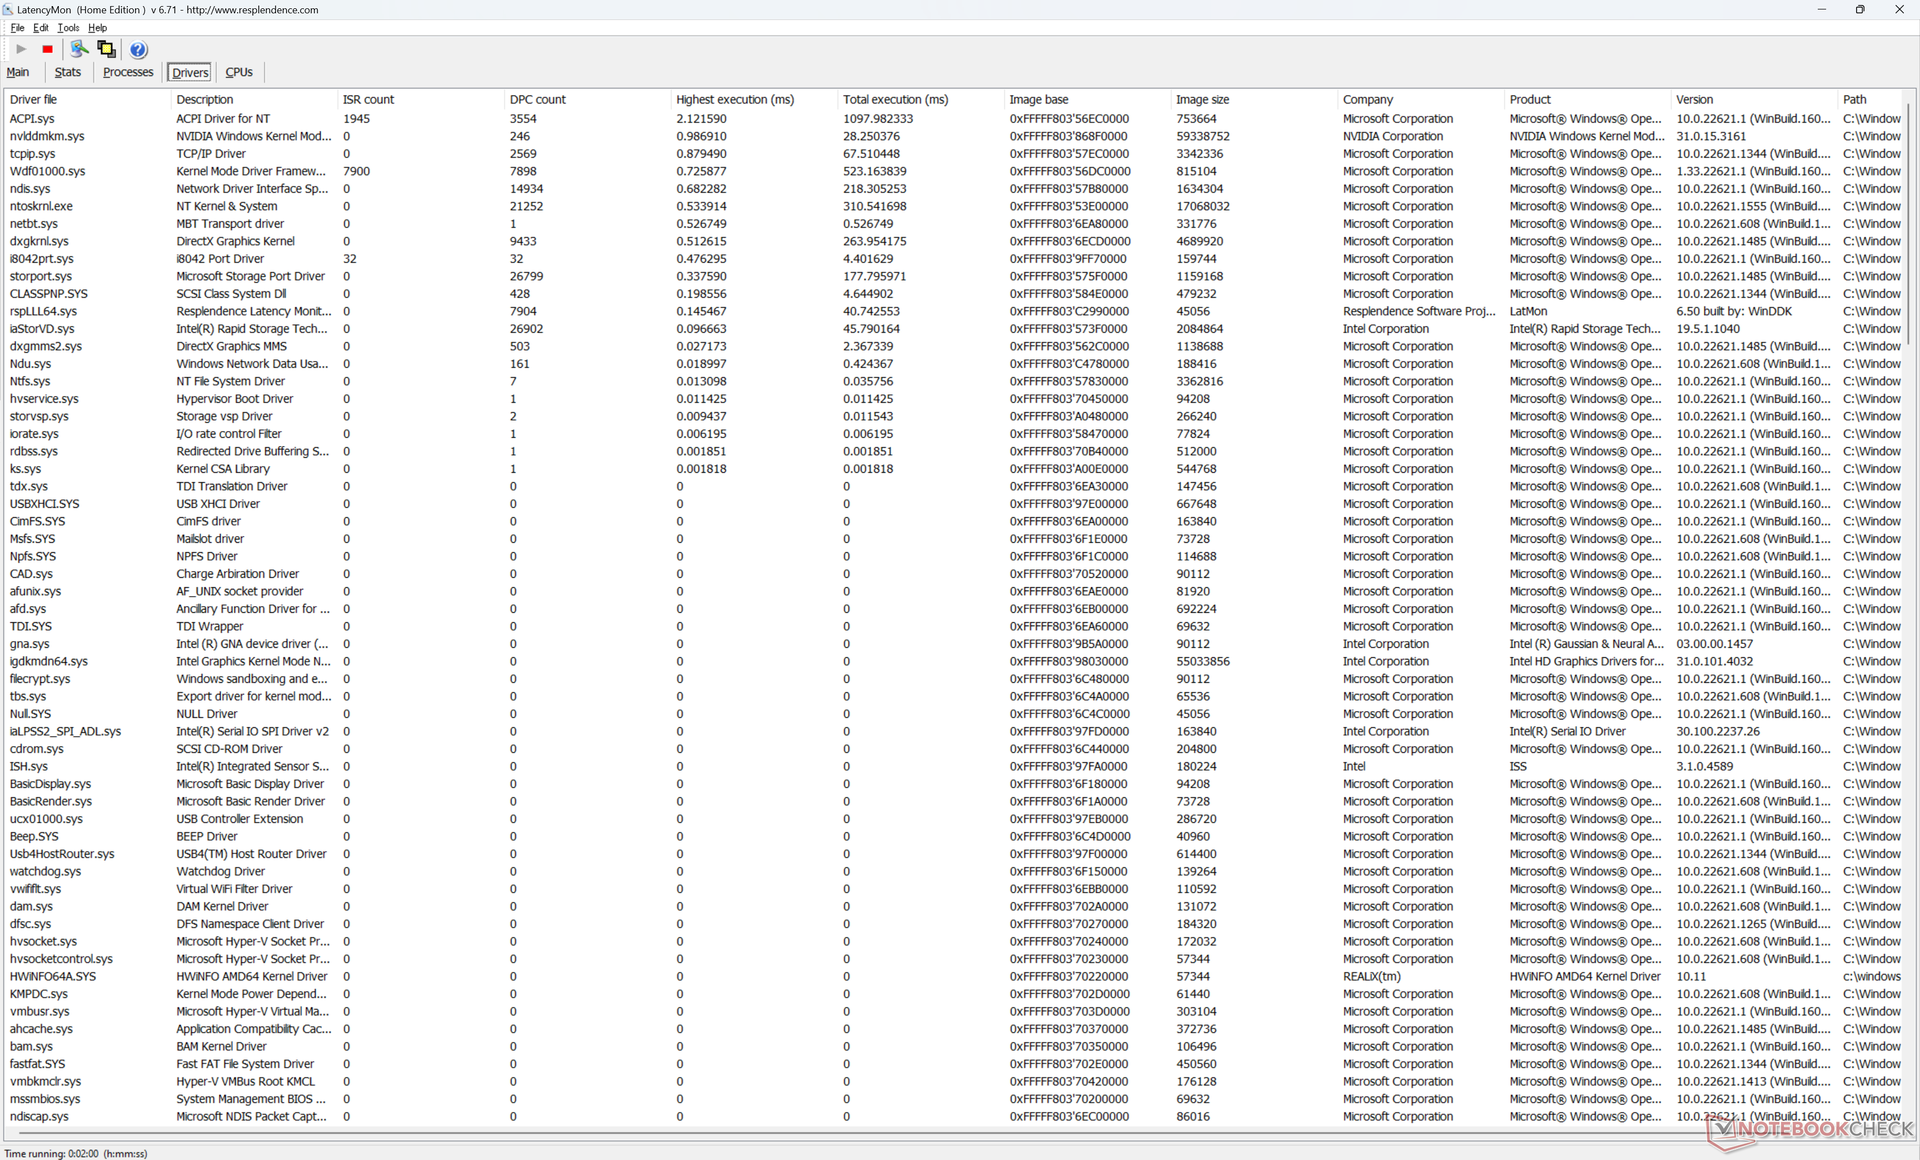
LatencyMon reveals DPC issues when opening multiple browser tabs of our homepage. 4K60 video playback is imperfect as well with 4 dropped frames during our minute-long test video.
| DPC Latencies / LatencyMon - interrupt to process latency (max), Web, Youtube, Prime95 | |
| Dell XPS 15 9500 Core i7 4K UHD | |
| MSI Prestige 15 A12UD-093 | |
| Dell XPS 15 9530 RTX 4070 | |
| Dell XPS 15 9520 RTX 3050 Ti | |
| Gigabyte Aero 15 OLED XD | |
| Asus Zenbook Pro 15 OLED UM535Q | |
* ... smaller is better
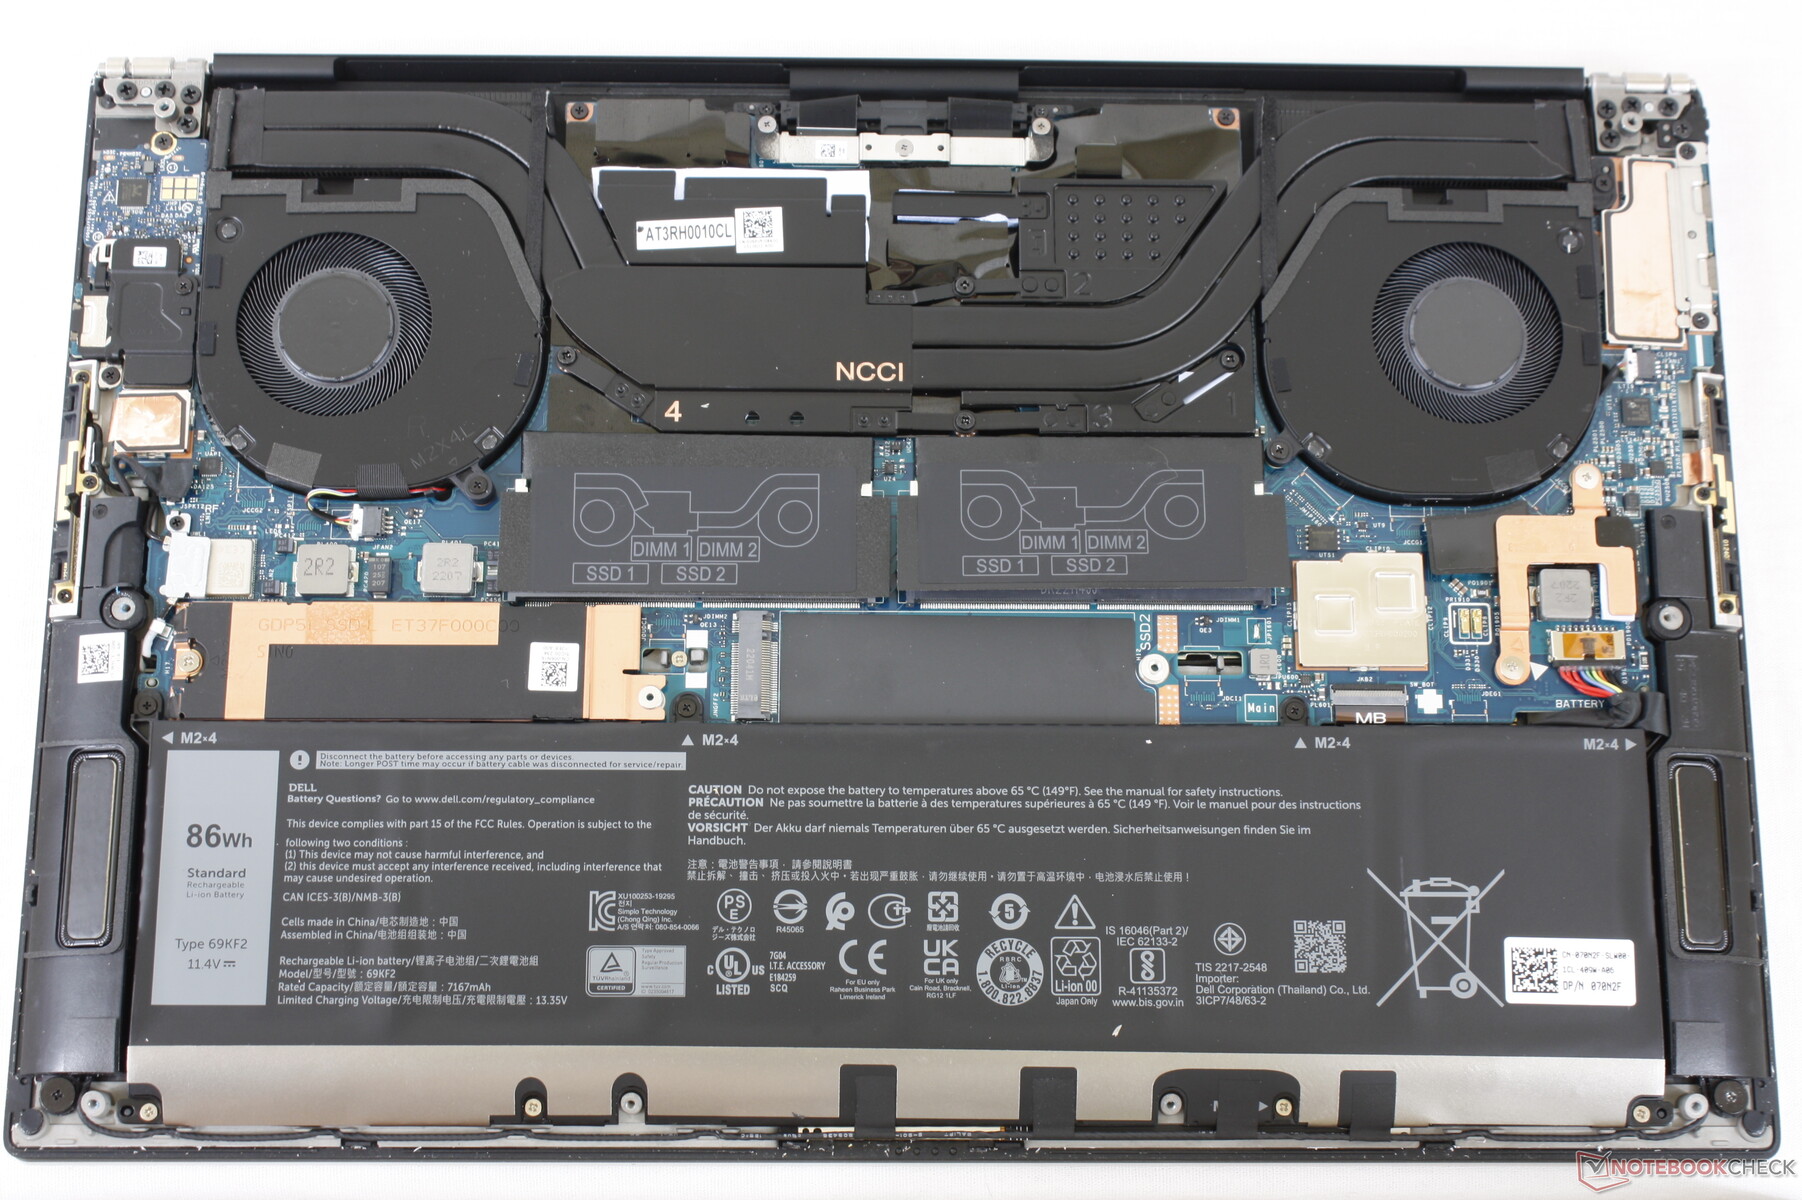
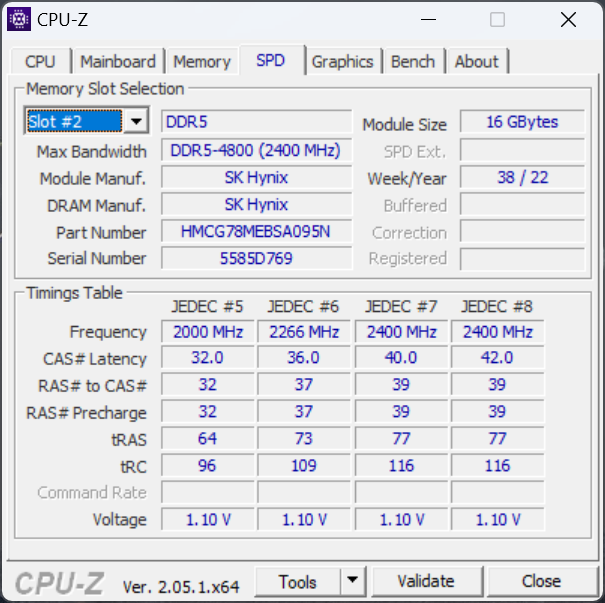
Storage Devices — Up To Two PCIe4 Drives
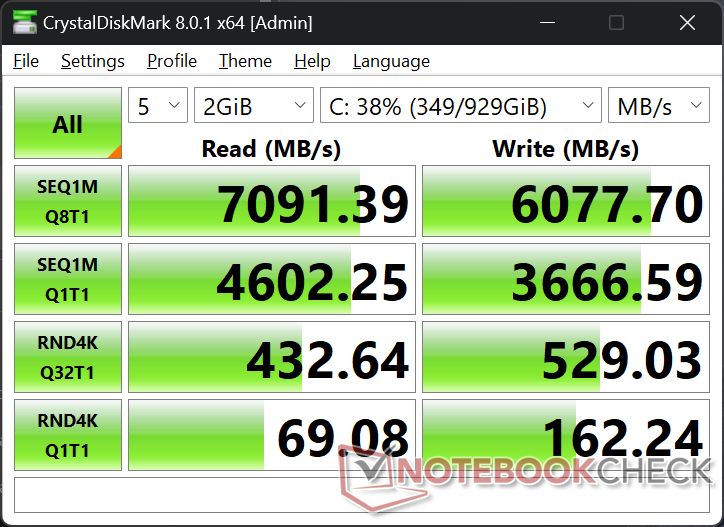
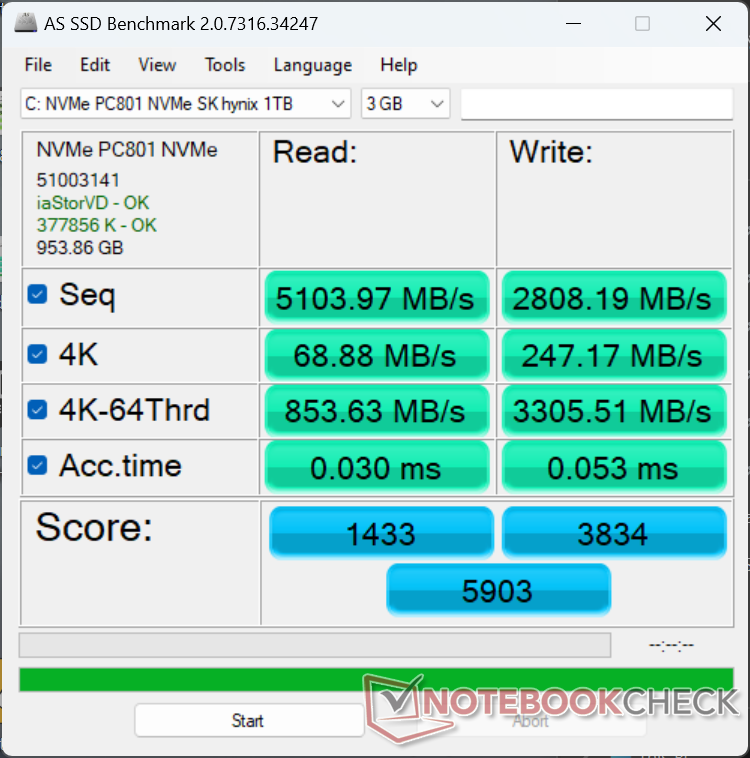
Our review unit sports an SK Hynix PC801 PCIe4 x4 NVMe SSD instead of the WD SN810 on our older XPS 15 9510 test unit. Performance is generally comparable between the two SSDs, but they fall behind the popular Samsung PM9A1.
Performance sustainability is excellent with no throttling when under stress. It's too bad that PCIe5 SSDs are not offered at checkout.

| Drive Performance Rating - Percent | |
| Gigabyte Aero 15 OLED XD | |
| Dell XPS 15 9530 RTX 4070 | |
| Dell XPS 15 9520 RTX 3050 Ti | |
| MSI Prestige 15 A12UD-093 | |
| Asus Zenbook Pro 15 OLED UM535Q | |
| Dell XPS 15 9500 Core i7 4K UHD | |
* ... smaller is better
Disk Throttling: DiskSpd Read Loop, Queue Depth 8
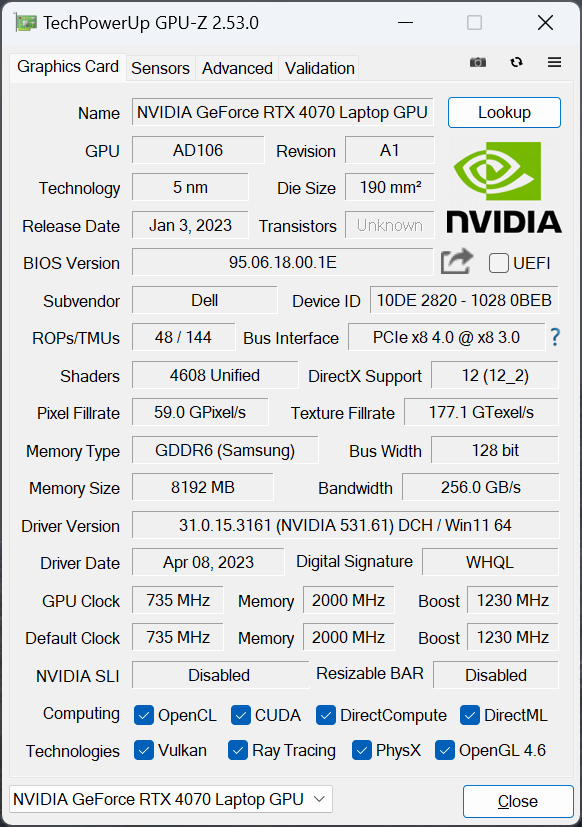
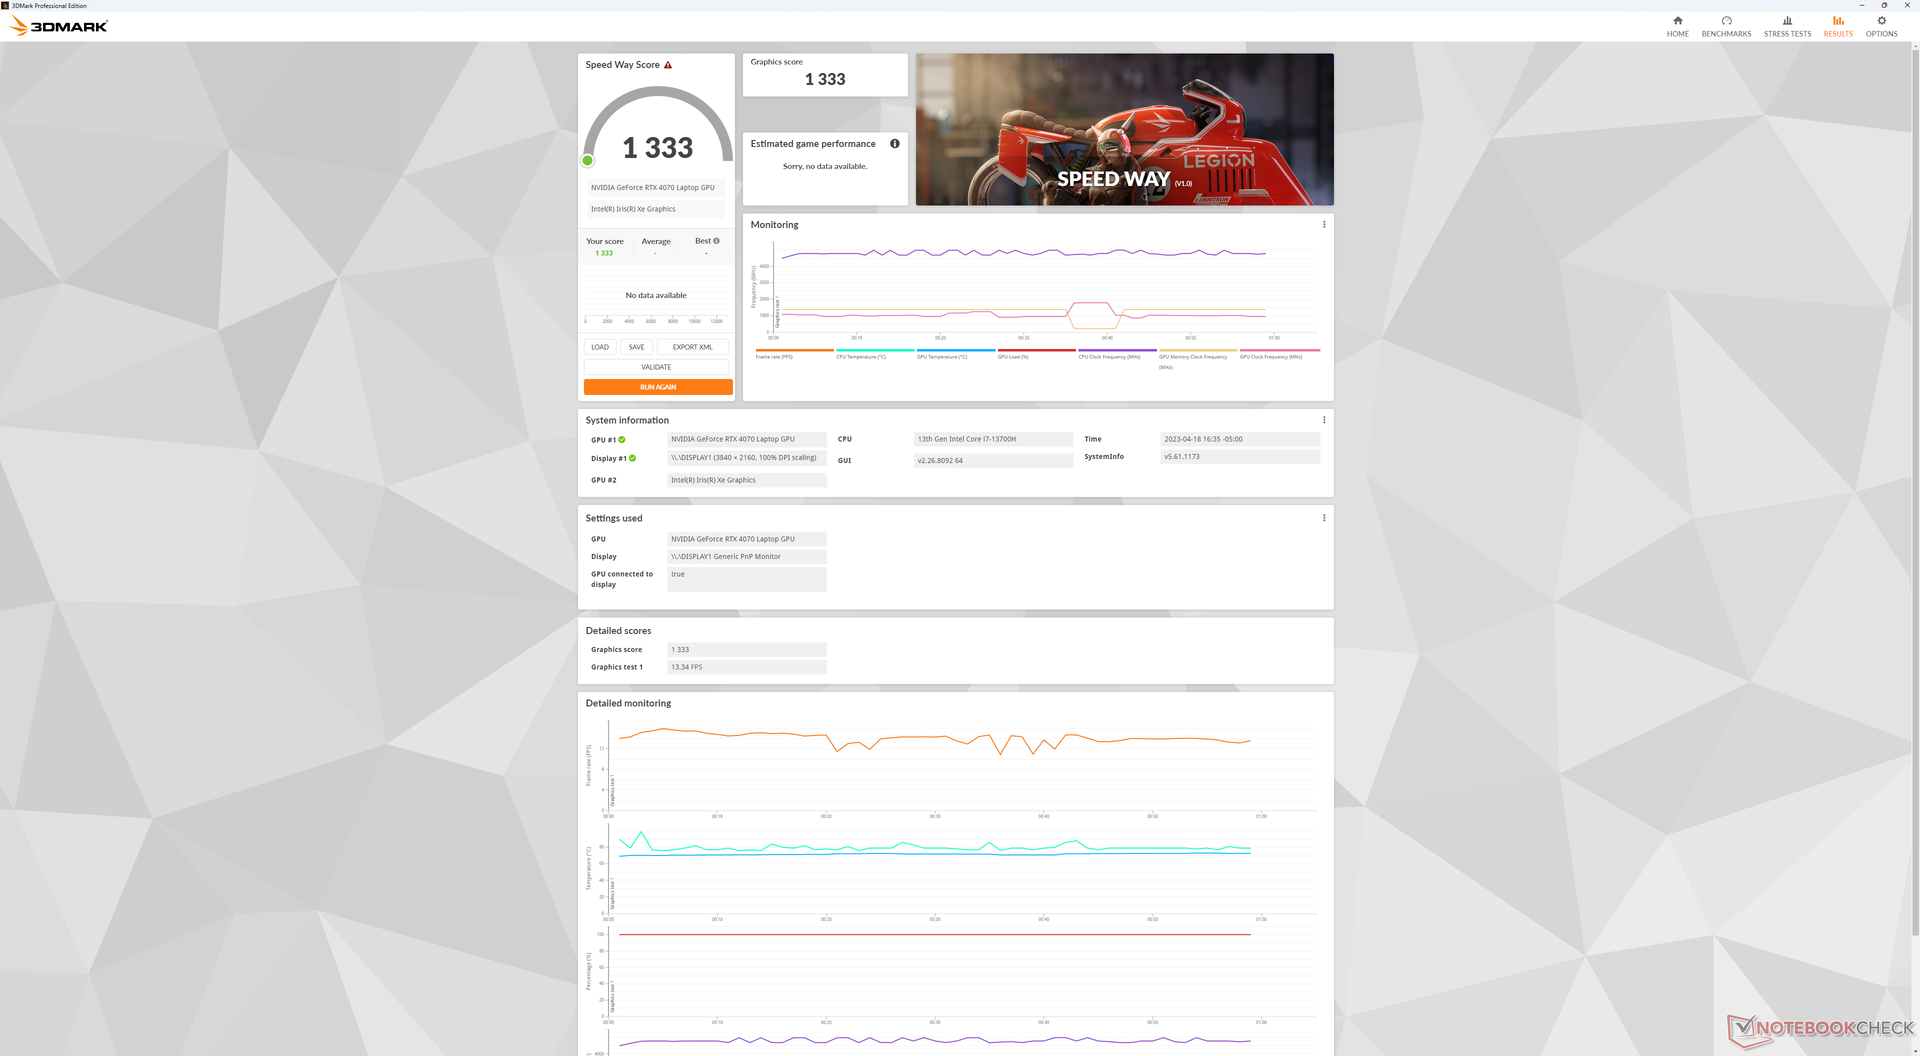
GPU Performance — Half The TGP Equals Half The Power
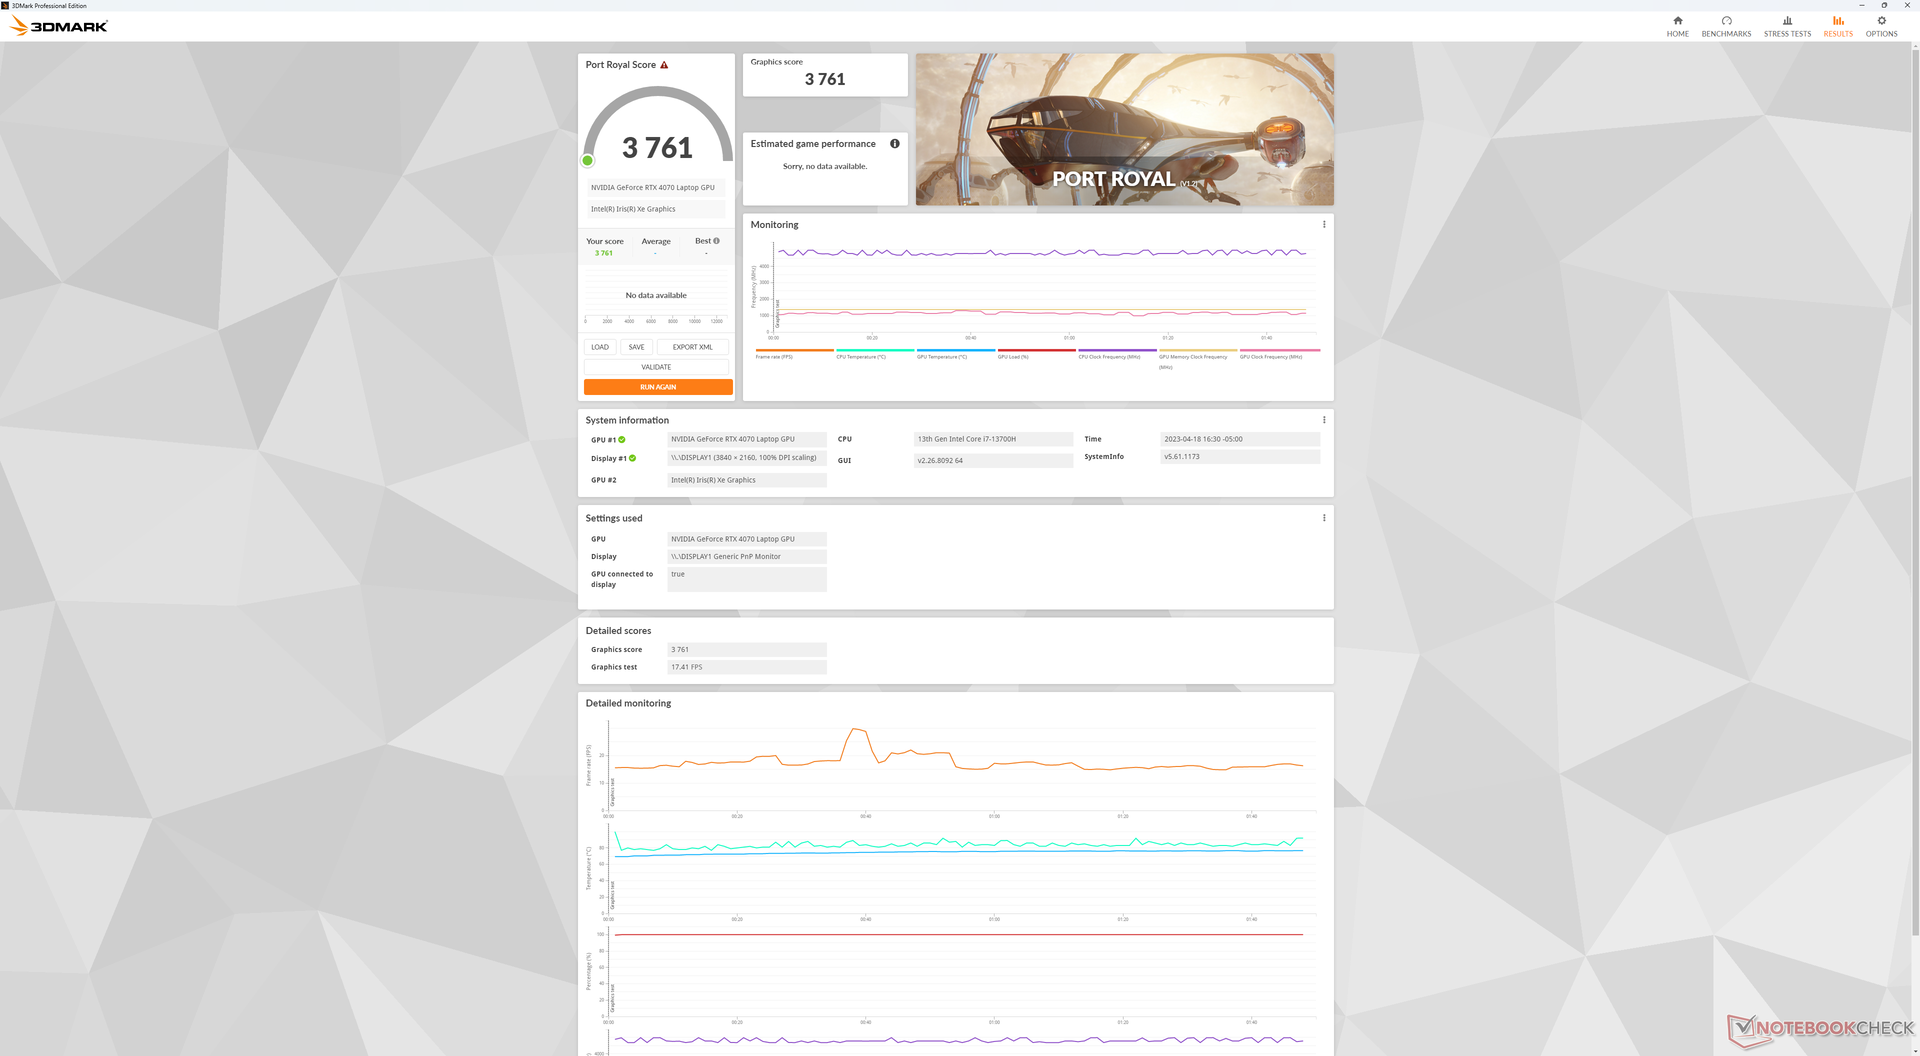
Obviously, graphics performance should be slower than the "average" GeForce RTX 4070 laptop because of the low 50 W TGP target of the XPS 15, but we had no idea by how much. Now that we have a test unit in hand, the deficit can be pretty striking at up to 40 to 50 percent slower than the average our database according to 3DMark benchmarks. It's so bad that even a four year-old RTX 2070 laptop like the HP Omen 15 can perform about the same as our more expensive RTX 4070 XPS 15. If you intend to play a lot of games, then the XPS 15 becomes a poor value proposition.
The good news is that graphics performance is still faster than the RTX 3050 Ti in last year's XPS 15 9520 by about 30 to 35 percent. Thus, there is an appreciable year-over-year boost even though this is easily one of the slowest iterations of the mobile RTX 4070 we've seen.
Interestingly, graphics acceleration when running 3D software tools is much faster than expected relative to the 50 W TGP. Blender Classroom with CUDA acceleration, for example, would complete in just 46 seconds which is only about 25 percent slower than the average RTX 4070 laptop where 100 W or higher TGPs are typical. The older RTX 3050 Ti would take almost 2.5x longer on the same benchmark. Content creators will therefore benefit the most when choosing the 2023 XPS 15 over older models.
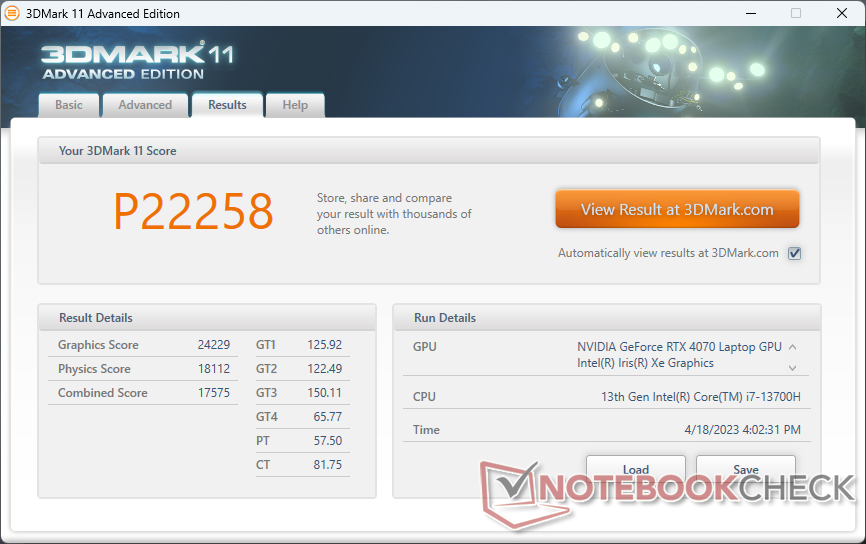
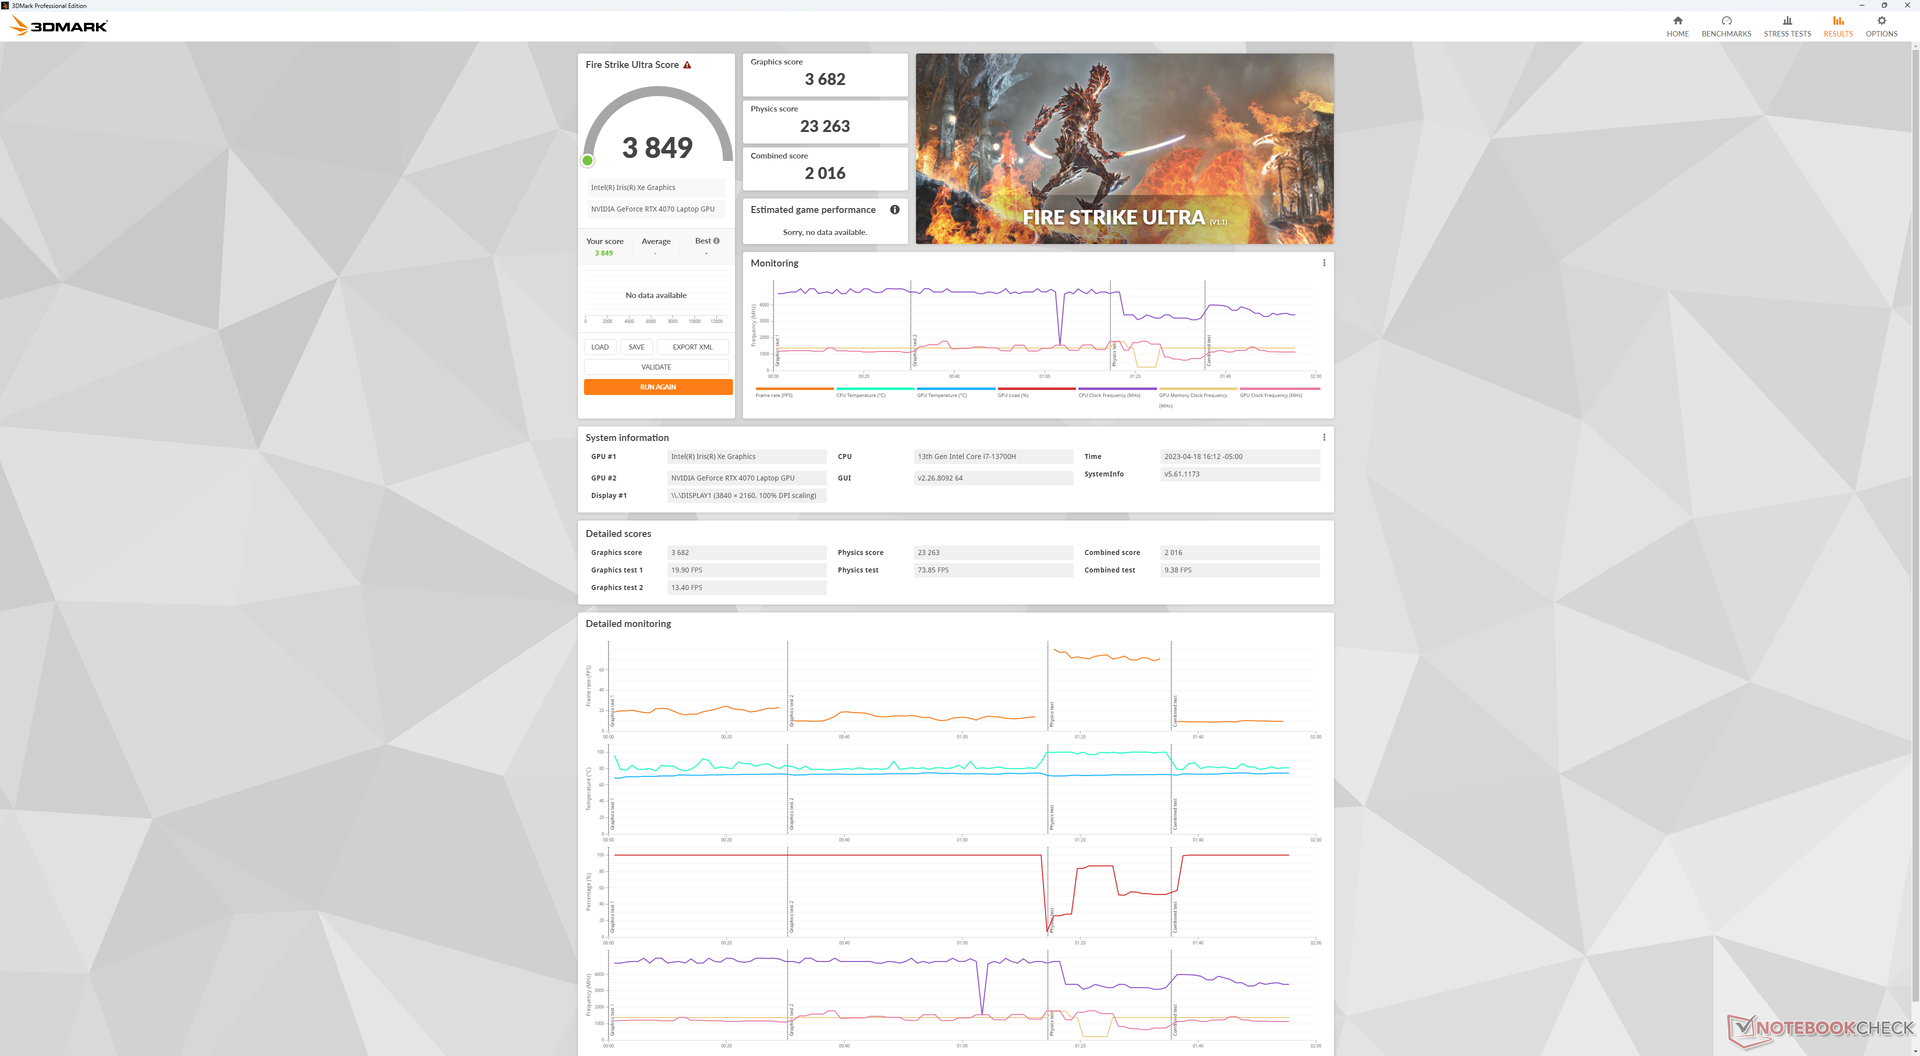
| 3DMark 11 Performance | 22258 points | |
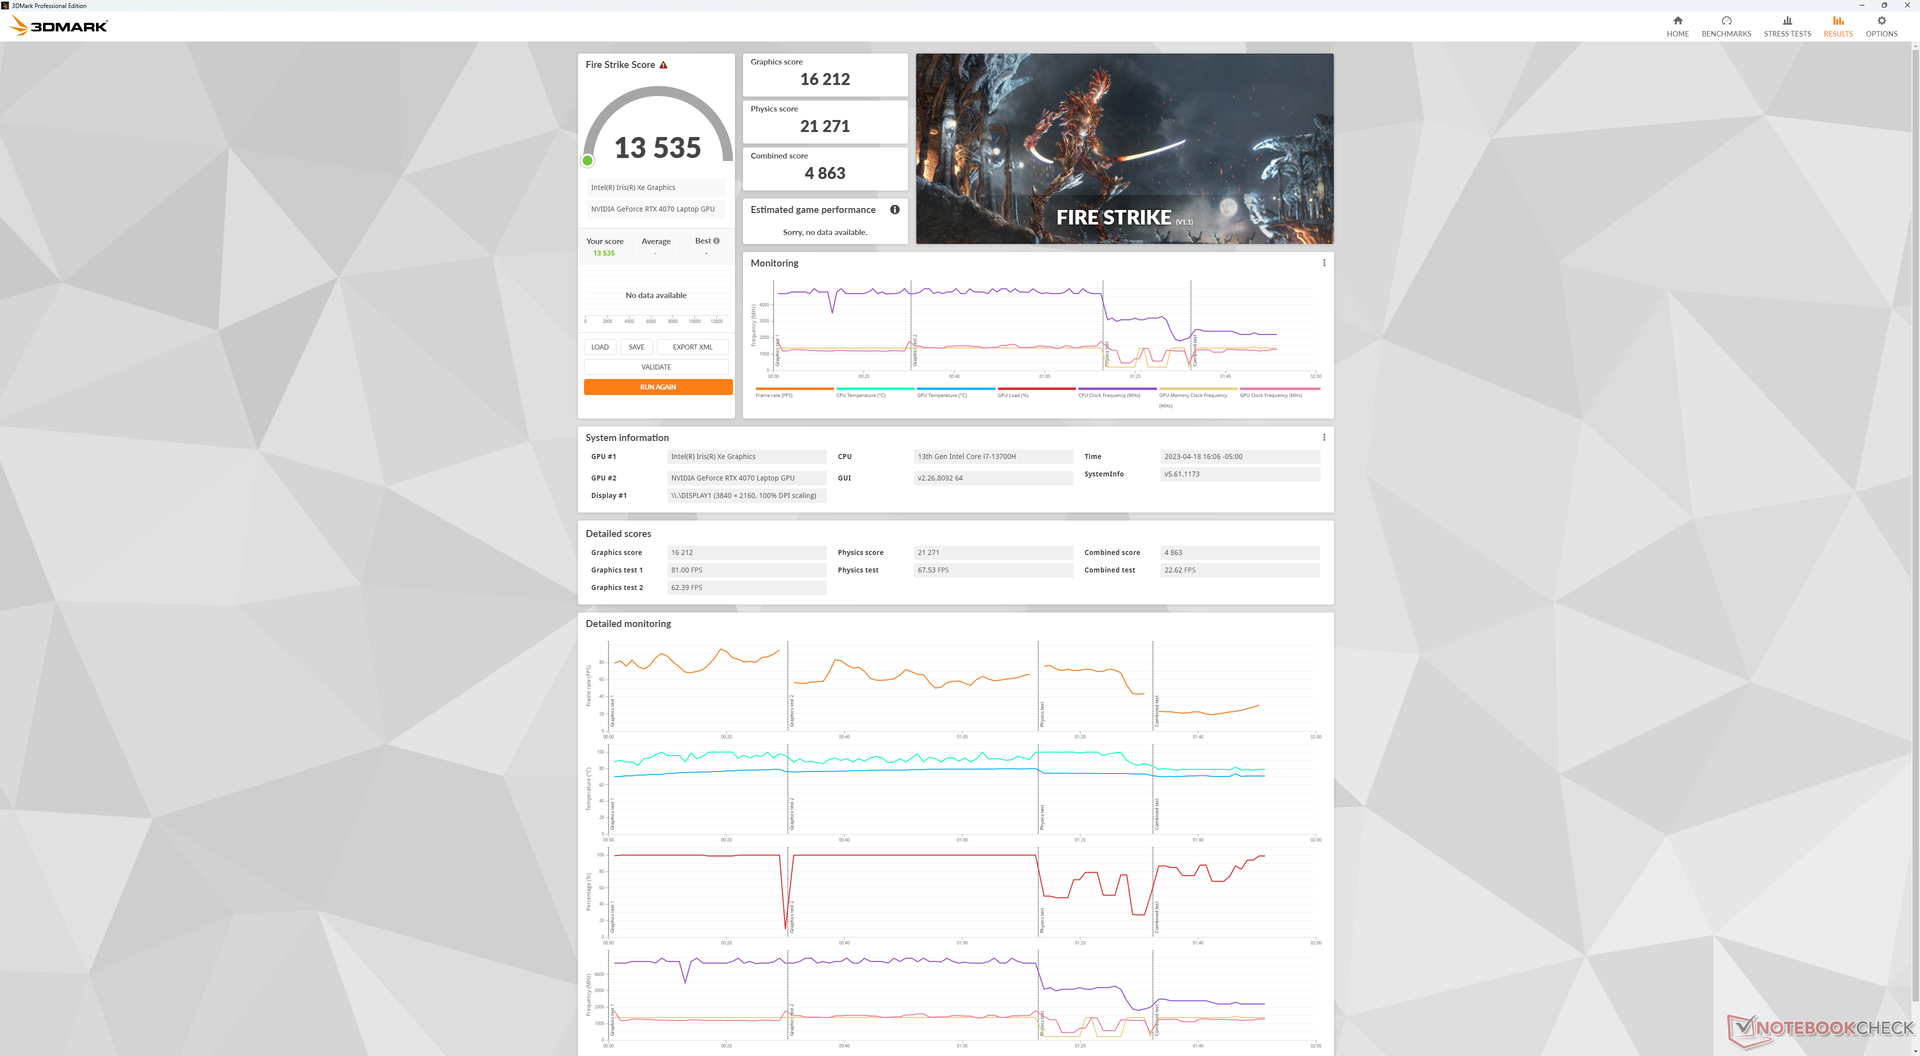
| 3DMark Fire Strike Score | 13535 points | |
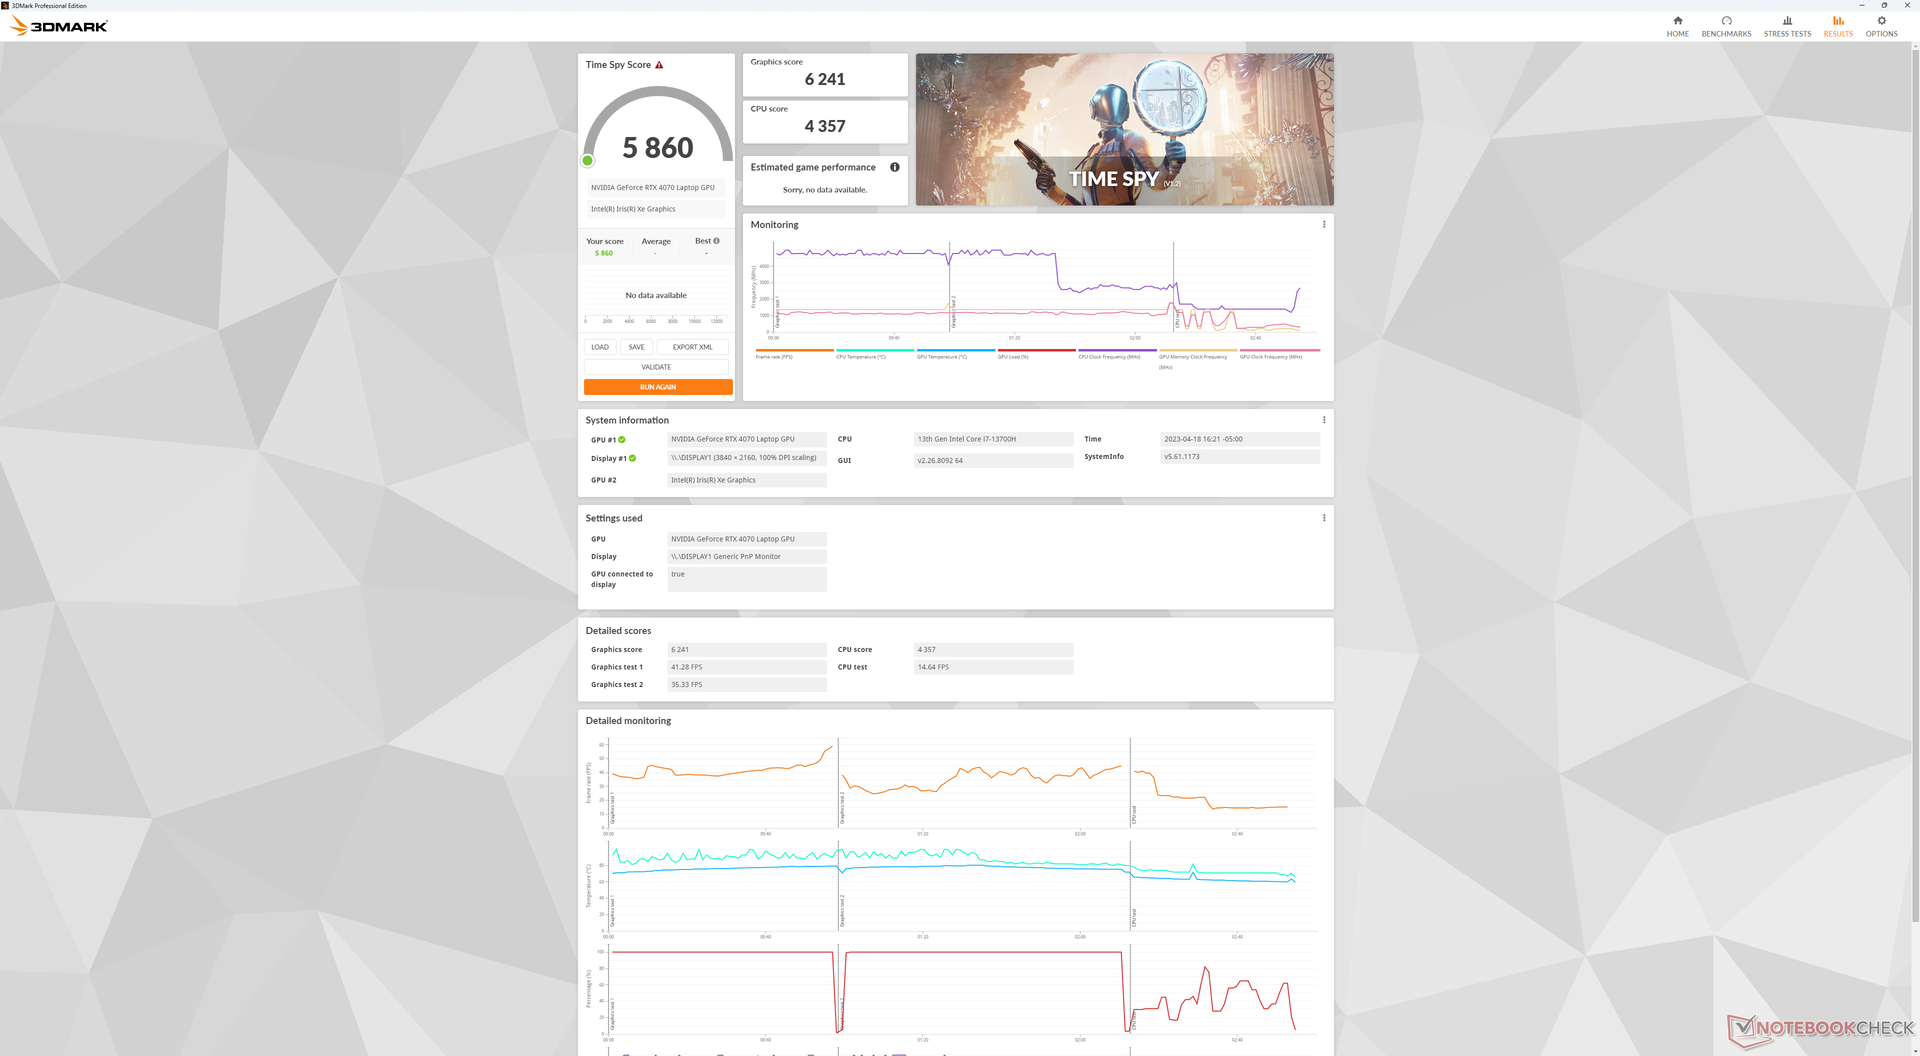
| 3DMark Time Spy Score | 5860 points | |
Help | ||
| Blender | |
| v3.3 Classroom OPTIX/RTX | |
| MSI Prestige 15 A12UD-093 | |
| Dell XPS 15 9530 RTX 4070 | |
| Average NVIDIA GeForce RTX 4070 Laptop GPU (18 - 28, n=44) | |
| v3.3 Classroom CUDA | |
| MSI Prestige 15 A12UD-093 | |
| Dell XPS 15 9530 RTX 4070 | |
| Average NVIDIA GeForce RTX 4070 Laptop GPU (32 - 172, n=48) | |
| v3.3 Classroom CPU | |
| MSI Prestige 15 A12UD-093 | |
| Dell XPS 15 9530 RTX 4070 | |
| Average NVIDIA GeForce RTX 4070 Laptop GPU (158 - 428, n=44) | |
* ... smaller is better
Gaming Performance
Despite the disappointing RTX 4070 performance mentioned above, the system can still run any current title on medium-high settings at 1080p and 60 FPS. Anything higher, however, and the GPU begins to struggle. Demanding titles like Cyberpunk 2077 or Returnal would each dip to the 40 FPS range if settings are above medium resulting in noticeable screen tearing without G-Sync assistance. Most games aside from undemanding multiplayer ones like DOTA 2 can barely run in the native 3.5K resolution.
Furthermore, performance can be unstable when gaming. Frame rates when idling on Witcher 3 would periodically dip from 50 FPS to 40 FPS before jumping back up to 50 FPS for seemingly no reason. Such behavior suggests poor prioritization of background activities.
Another unfortunate disadvantage is that frame rates at very low settings can sometimes be slower than the frame rates at higher settings. This was observed when running Cyberpunk 2077 and Returnal at low 1080p settings where frame rates would be consistently slower than medium 1080p settings even after repeat testing. Such behavior suggests a PSU limitation and consequent power struggle between the CPU and GPU when both are stressed.
| The Witcher 3 - 1920x1080 Ultra Graphics & Postprocessing (HBAO+) | |
| Asus Zephyrus Duo 16 GX650PY-NM006W | |
| Uniwill GM6PX7X RTX 4070 | |
| Alienware x15 R2 P111F | |
| Gigabyte Aero 15 OLED XD | |
| Dell XPS 15 9530 RTX 4070 | |
| MSI Stealth 15M A11SEK | |
| Dell XPS 15 9500 Core i7 4K UHD | |
| Dell XPS 15 9520 RTX 3050 Ti | |
| GTA V - 1920x1080 Highest Settings possible AA:4xMSAA + FX AF:16x | |
| Asus Zephyrus Duo 16 GX650PY-NM006W | |
| Uniwill GM6PX7X RTX 4070 | |
| Gigabyte Aero 15 OLED XD | |
| MSI Stealth 15M A11SEK | |
| Dell XPS 15 9530 RTX 4070 | |
| Dell XPS 15 9520 RTX 3050 Ti | |
| Final Fantasy XV Benchmark - 1920x1080 High Quality | |
| Asus Zephyrus Duo 16 GX650PY-NM006W | |
| Uniwill GM6PX7X RTX 4070 | |
| Alienware x15 R2 P111F | |
| Gigabyte Aero 15 OLED XD | |
| Dell XPS 15 9530 RTX 4070 | |
| MSI Stealth 15M A11SEK | |
| Dell XPS 15 9520 RTX 3050 Ti | |
| Strange Brigade - 1920x1080 ultra AA:ultra AF:16 | |
| Asus Zephyrus Duo 16 GX650PY-NM006W | |
| Uniwill GM6PX7X RTX 4070 | |
| Alienware x15 R2 P111F | |
| Gigabyte Aero 15 OLED XD | |
| Dell XPS 15 9530 RTX 4070 | |
| MSI Stealth 15M A11SEK | |
| Dell XPS 15 9520 RTX 3050 Ti | |
| Returnal | |
| 1920x1080 Low Preset | |
| Average NVIDIA GeForce RTX 4070 Laptop GPU (65 - 119, n=10) | |
| Dell XPS 15 9530 RTX 4070 | |
| 1920x1080 Medium Preset | |
| Average NVIDIA GeForce RTX 4070 Laptop GPU (69 - 117, n=11) | |
| Dell XPS 15 9530 RTX 4070 | |
| 1920x1080 High Preset | |
| Average NVIDIA GeForce RTX 4070 Laptop GPU (64 - 106, n=11) | |
| Dell XPS 15 9530 RTX 4070 | |
| 1920x1080 Epic Preset | |
| Average NVIDIA GeForce RTX 4070 Laptop GPU (54 - 90, n=11) | |
| Dell XPS 15 9530 RTX 4070 | |
| 2560x1440 Epic Preset | |
| Average NVIDIA GeForce RTX 4070 Laptop GPU (39 - 66, n=11) | |
| Dell XPS 15 9530 RTX 4070 | |
| 3840x2160 Epic Preset | |
| Average NVIDIA GeForce RTX 4070 Laptop GPU (21 - 39, n=7) | |
| Dell XPS 15 9530 RTX 4070 | |
Witcher 3 FPS Chart
| low | med. | high | ultra | QHD | 4K | |
| GTA V (2015) | 180 | 168.1 | 134.3 | 63.5 | 52.9 | 53 |
| The Witcher 3 (2015) | 354.2 | 233.3 | 123.9 | 69.8 | 47 | 26.5 |
| Dota 2 Reborn (2015) | 189.5 | 163.1 | 147.6 | 137 | 88.4 | |
| Final Fantasy XV Benchmark (2018) | 108.6 | 84 | 66 | 48.8 | 26.6 | |
| X-Plane 11.11 (2018) | 134.2 | 91.6 | 90.6 | 67.3 | ||
| Strange Brigade (2018) | 334 | 172.1 | 136.6 | 117.7 | 79.9 | 42.7 |
| Cyberpunk 2077 1.6 (2022) | 55.3 | 70 | 57.5 | 48 | 30 | 12.8 |
| Tiny Tina's Wonderlands (2022) | 98.1 | 92.5 | 74.3 | 58.6 | 49.8 | 39.2 |
| F1 22 (2022) | 155.1 | 148.5 | 123.5 | 39.2 | 10.6 | 4.7 |
| Returnal (2023) | 65 | 69 | 64 | 54 | 39 | 21 |
Emissions
System Noise — Not Too Loud For The Size
Fan noise when browsing the web or streaming video tends to hover around 24 dB(A) against a silent background of 23 dB(A) to be almost inaudible. Introducing higher loads like games would induce a fan noise between 40 to 45 dB(A) which is quieter than the Asus Zenbook Pro 15 or Gigabyte Aero 15 under loads. The XPS 15 is generally not as loud as other high-performance 15-inch multimedia laptops.
Noise Level
| Idle |
| 23.1 / 23.1 / 24.2 dB(A) |
| Load |
| 27.1 / 44.6 dB(A) |
 | ||
30 dB silent 40 dB(A) audible 50 dB(A) loud |
||
min: | ||
| Dell XPS 15 9530 RTX 4070 NVIDIA GeForce RTX 4070 Laptop GPU, i7-13700H, SK hynix PC801 HFS001TEJ9X101N | Dell XPS 15 9520 RTX 3050 Ti GeForce RTX 3050 Ti Laptop GPU, i7-12700H, WDC PC SN810 512GB | Dell XPS 15 9500 Core i7 4K UHD GeForce GTX 1650 Ti Mobile, i7-10875H, SK Hynix PC611 512GB | Asus Zenbook Pro 15 OLED UM535Q GeForce RTX 3050 Ti Laptop GPU, R9 5900HX, WDC PC SN730 SDBPNTY-1T00 | MSI Prestige 15 A12UD-093 GeForce RTX 3050 Ti Laptop GPU, i7-1280P, Micron 3400 1TB MTFDKBA1T0TFH | Gigabyte Aero 15 OLED XD GeForce RTX 3070 Laptop GPU, i7-11800H, Samsung PM9A1 MZVL21T0HCLR | |
|---|---|---|---|---|---|---|
| Noise | 0% | -24% | -7% | -22% | -35% | |
| off / environment * | 23.1 | 22.8 1% | 28.4 -23% | 22.8 1% | 26 -13% | 25 -8% |
| Idle Minimum * | 23.1 | 22.9 1% | 28.4 -23% | 22.9 1% | 26 -13% | 30 -30% |
| Idle Average * | 23.1 | 22.9 1% | 28.4 -23% | 22.9 1% | 30.7 -33% | 32 -39% |
| Idle Maximum * | 24.2 | 22.9 5% | 28.4 -17% | 22.9 5% | 30.7 -27% | 35 -45% |
| Load Average * | 27.1 | 30.9 -14% | 46 -70% | 33.2 -23% | 41.9 -55% | 44 -62% |
| Witcher 3 ultra * | 40.1 | 37.8 6% | 42 -5% | 47.3 -18% | 51 -27% | |
| Load Maximum * | 44.6 | 44.7 -0% | 47.1 -6% | 52.8 -18% | 40.7 9% | 60 -35% |
* ... smaller is better
Temperature
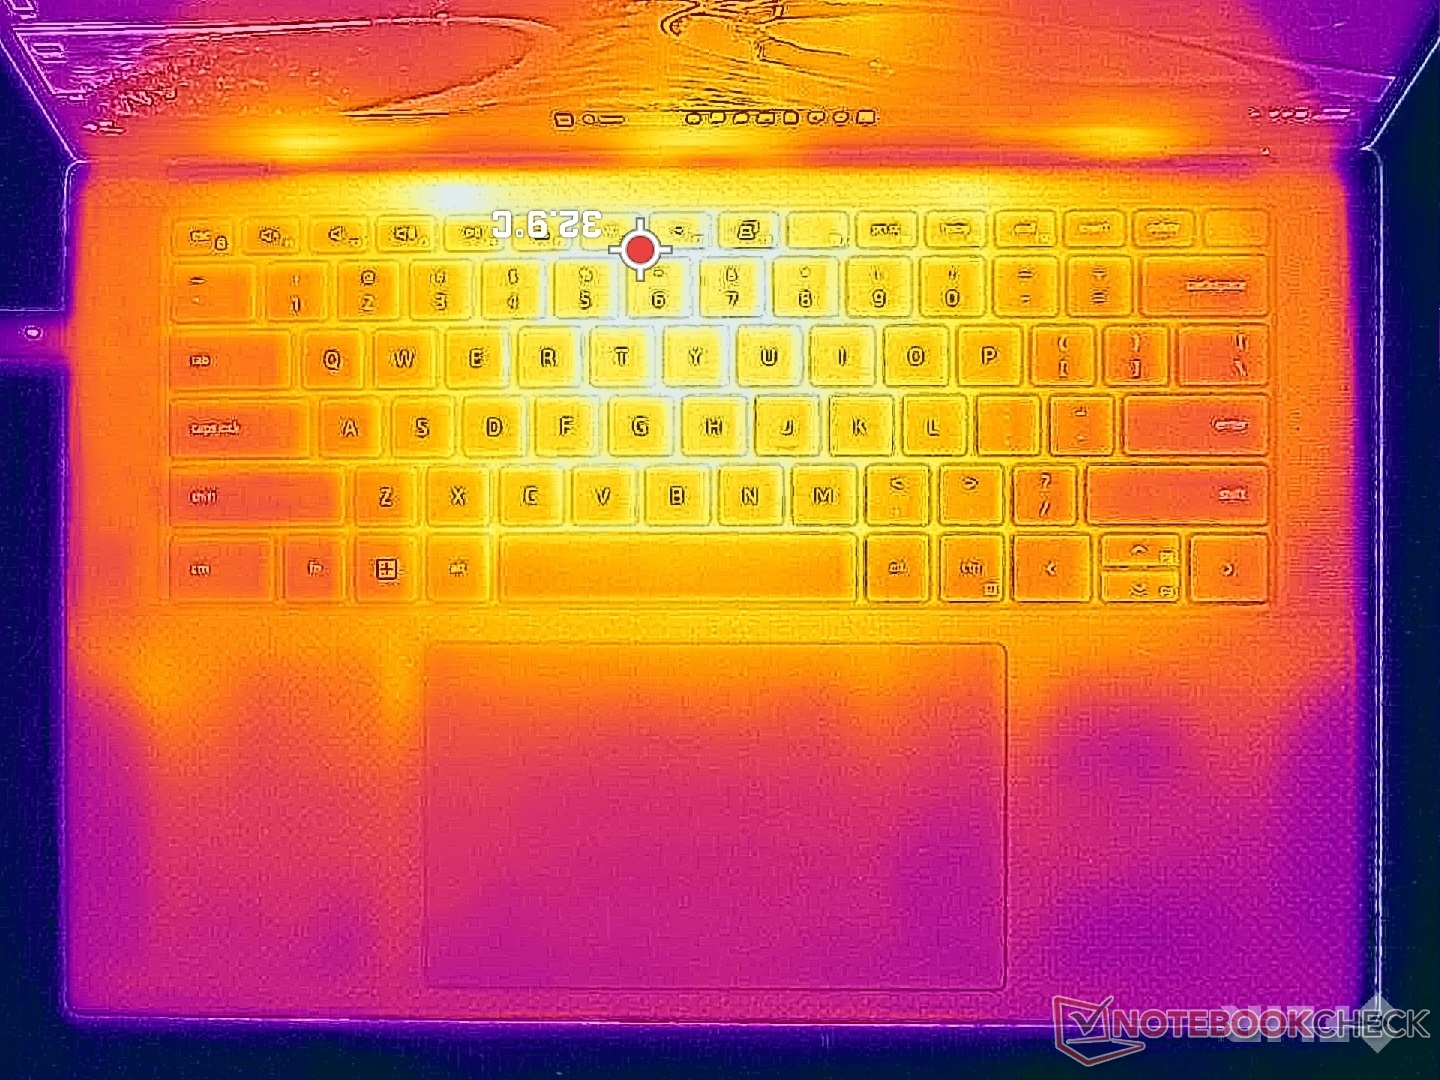
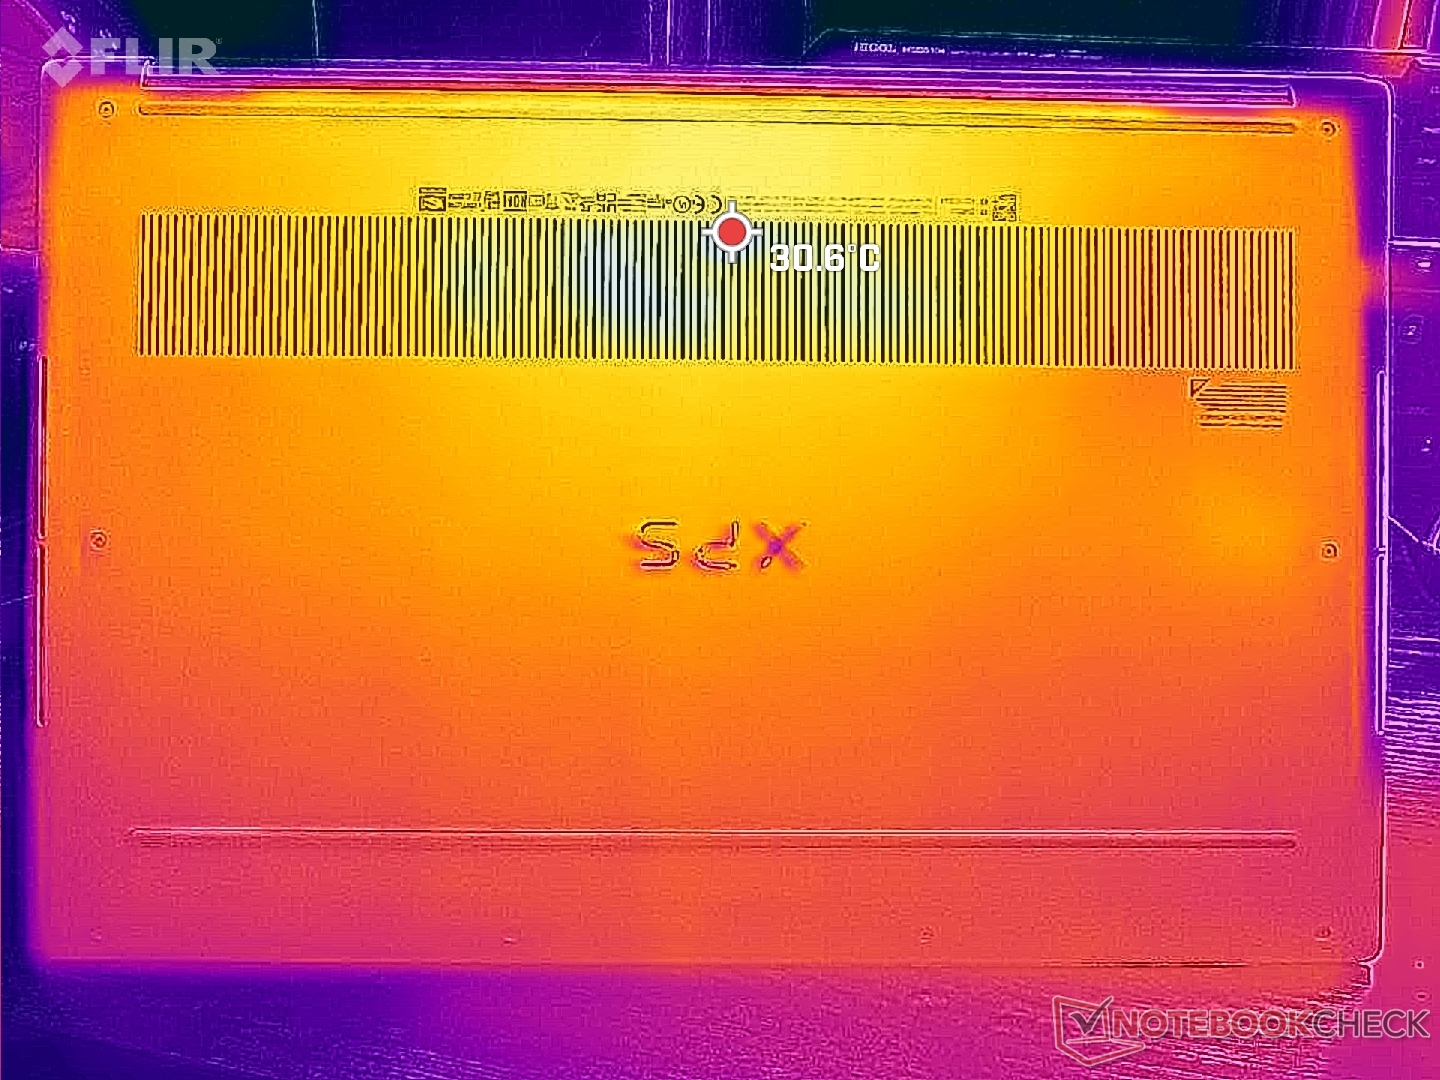
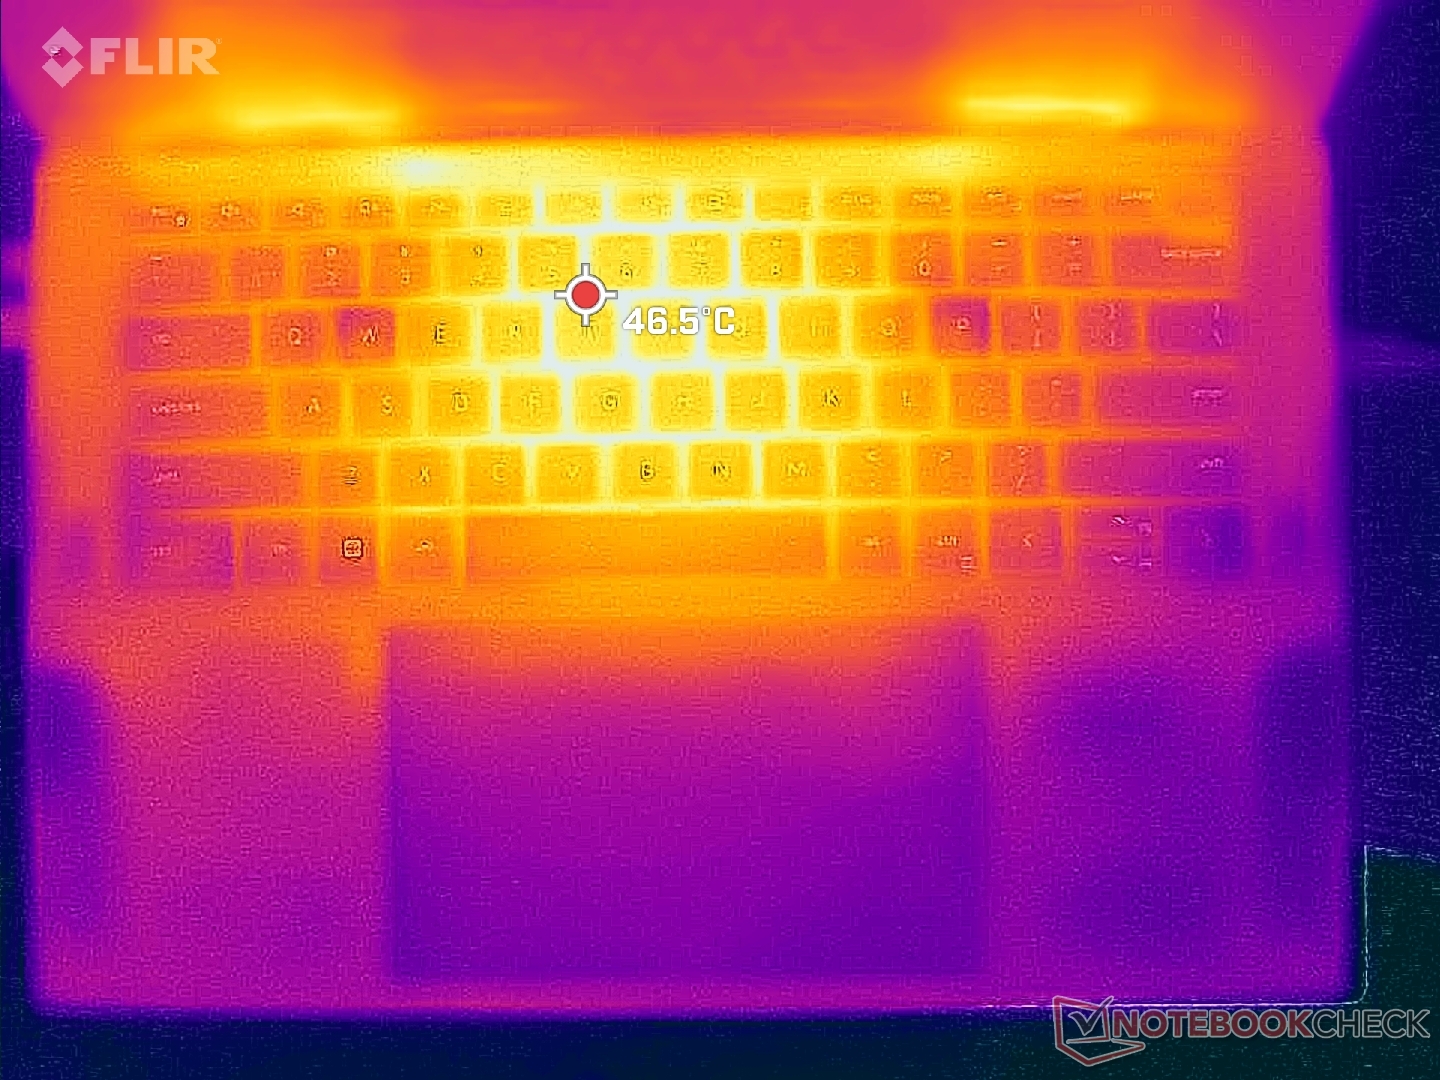
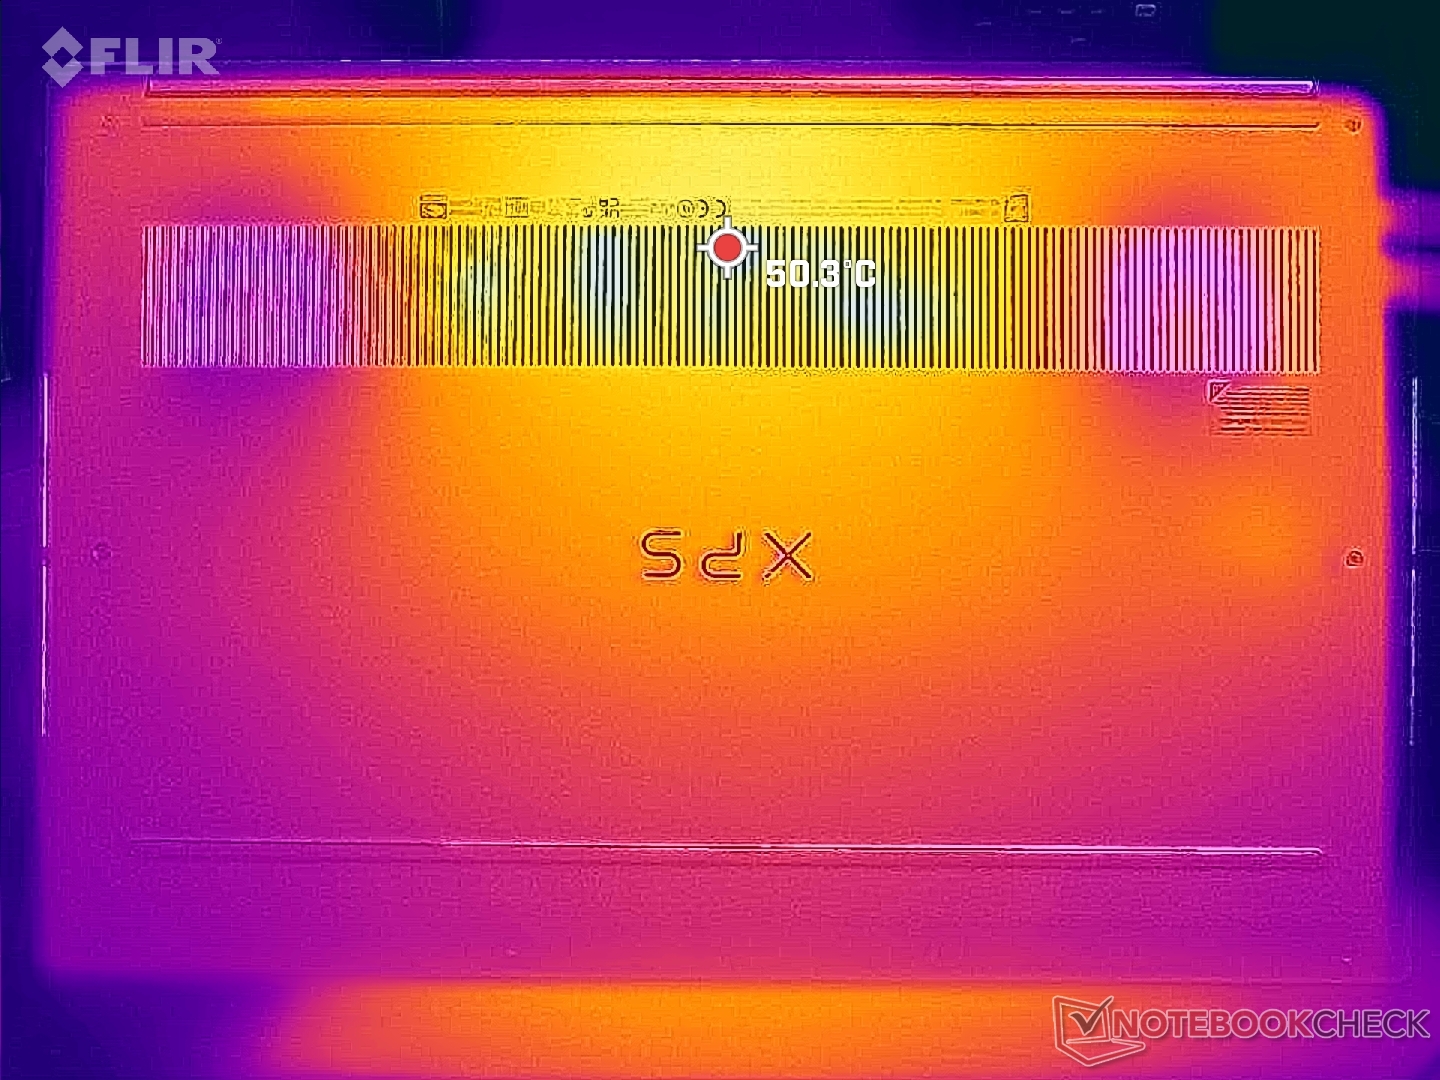
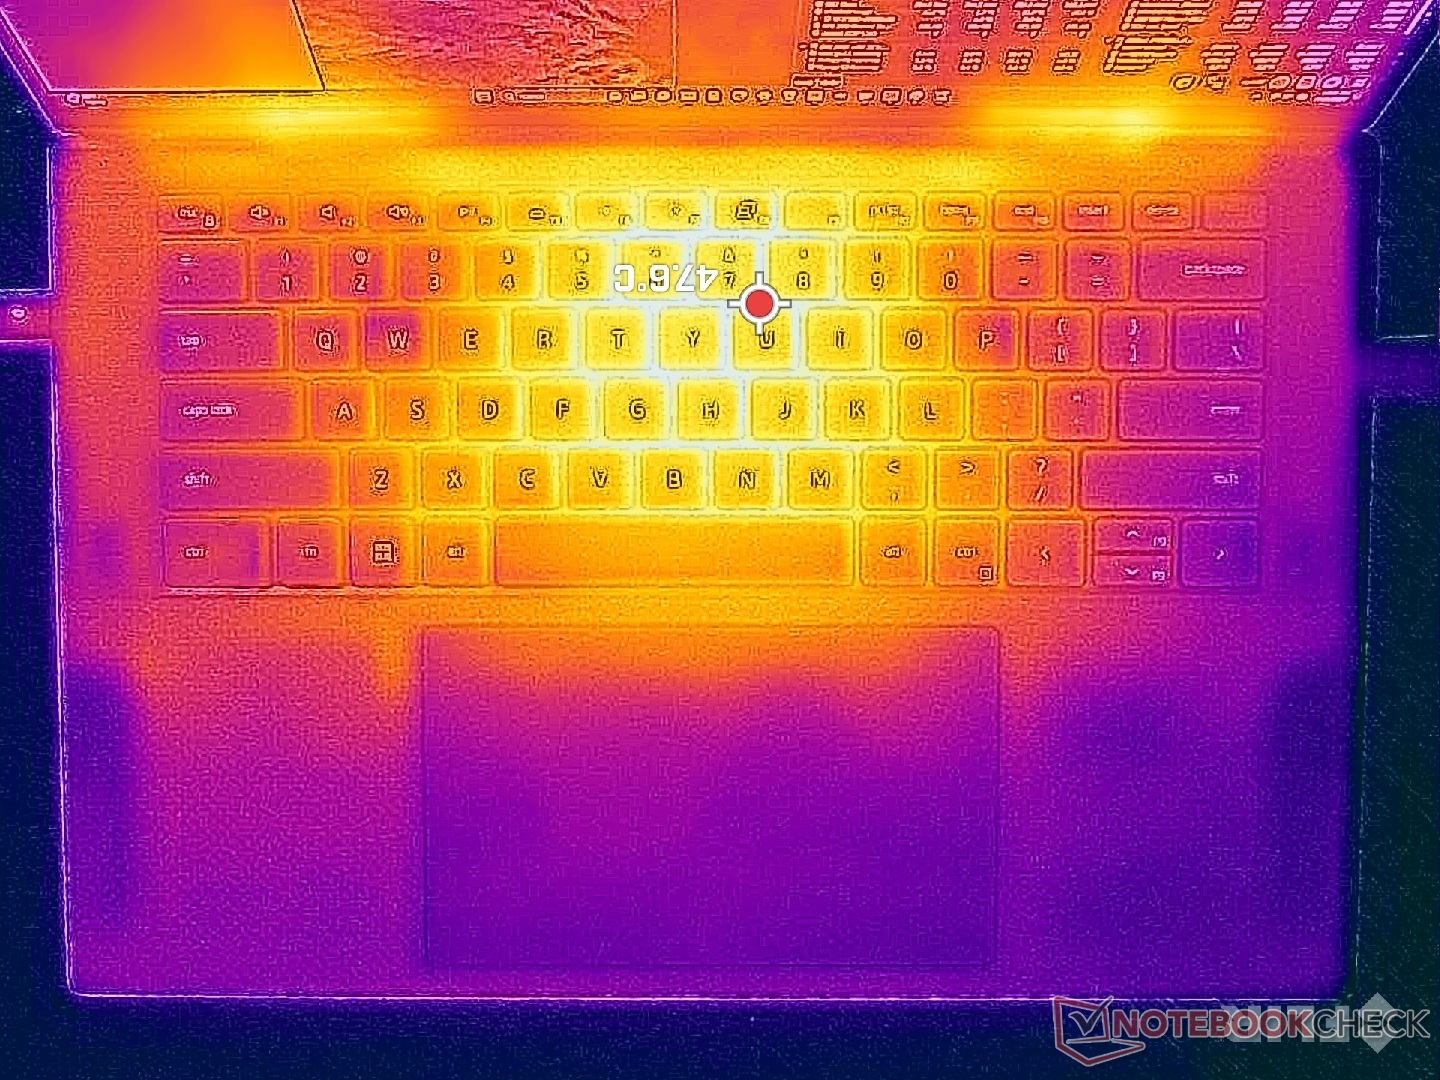
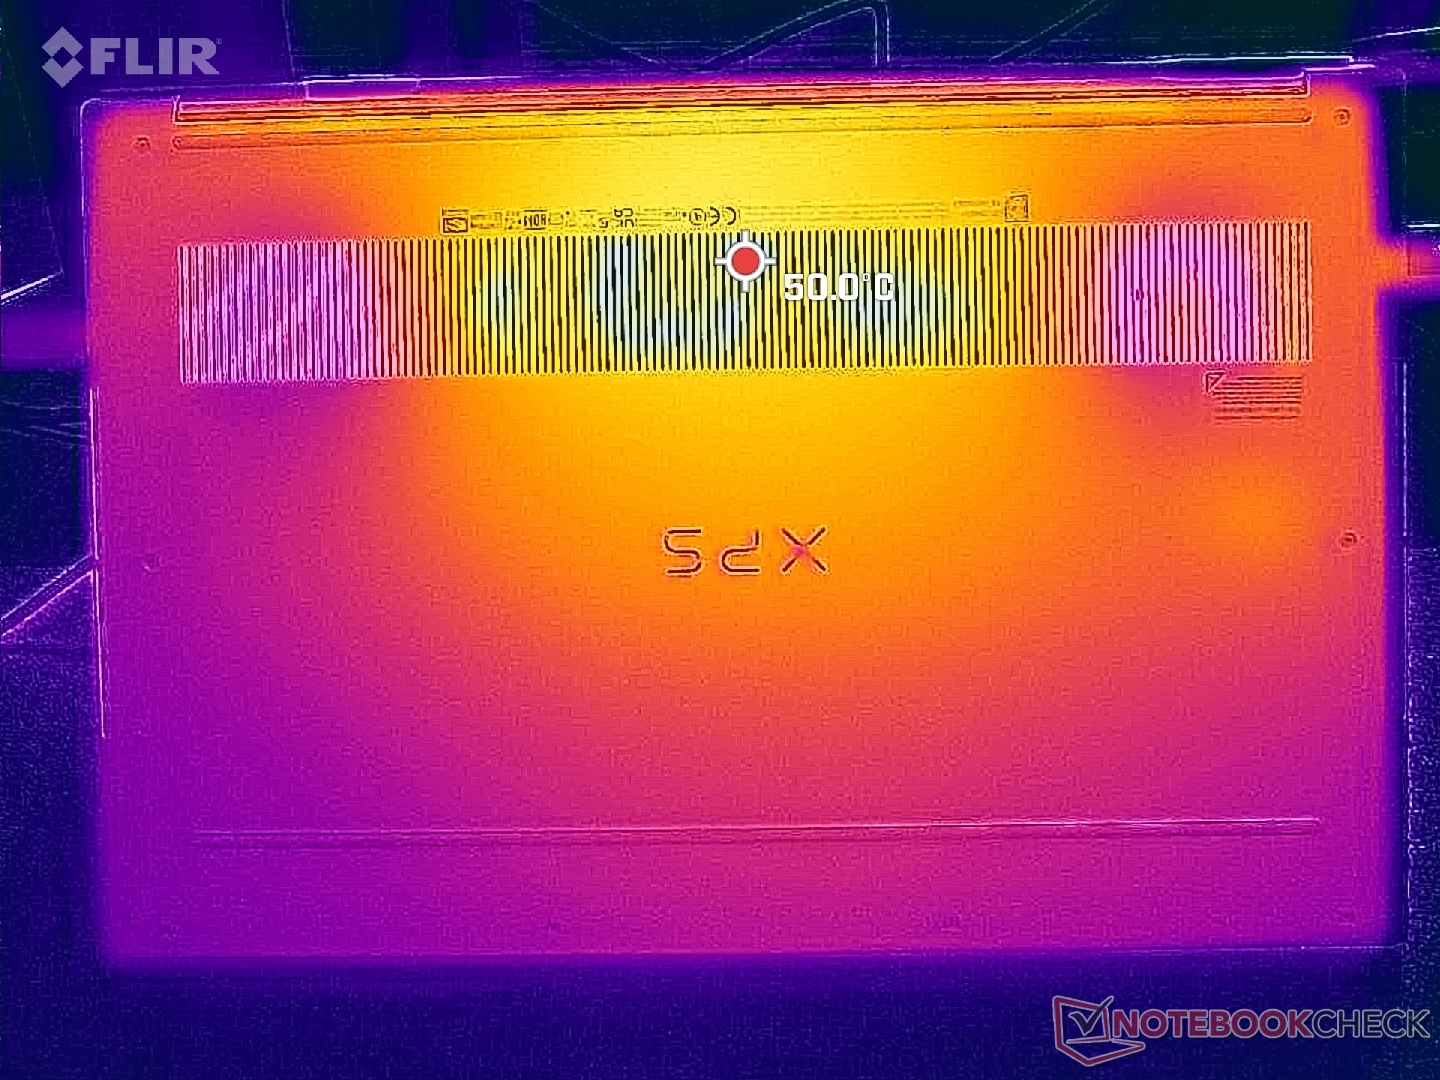
Surface temperatures are relatively warm at around 30 C even when simply idling on desktop due to the high power density of the thin chassis. This isn't any different from last year's model, however, since the power envelope has remained roughly the same. Skin temperature can feel uncomfortably warm at 45 C on the bottom side of the chassis when running demanding loads like games.
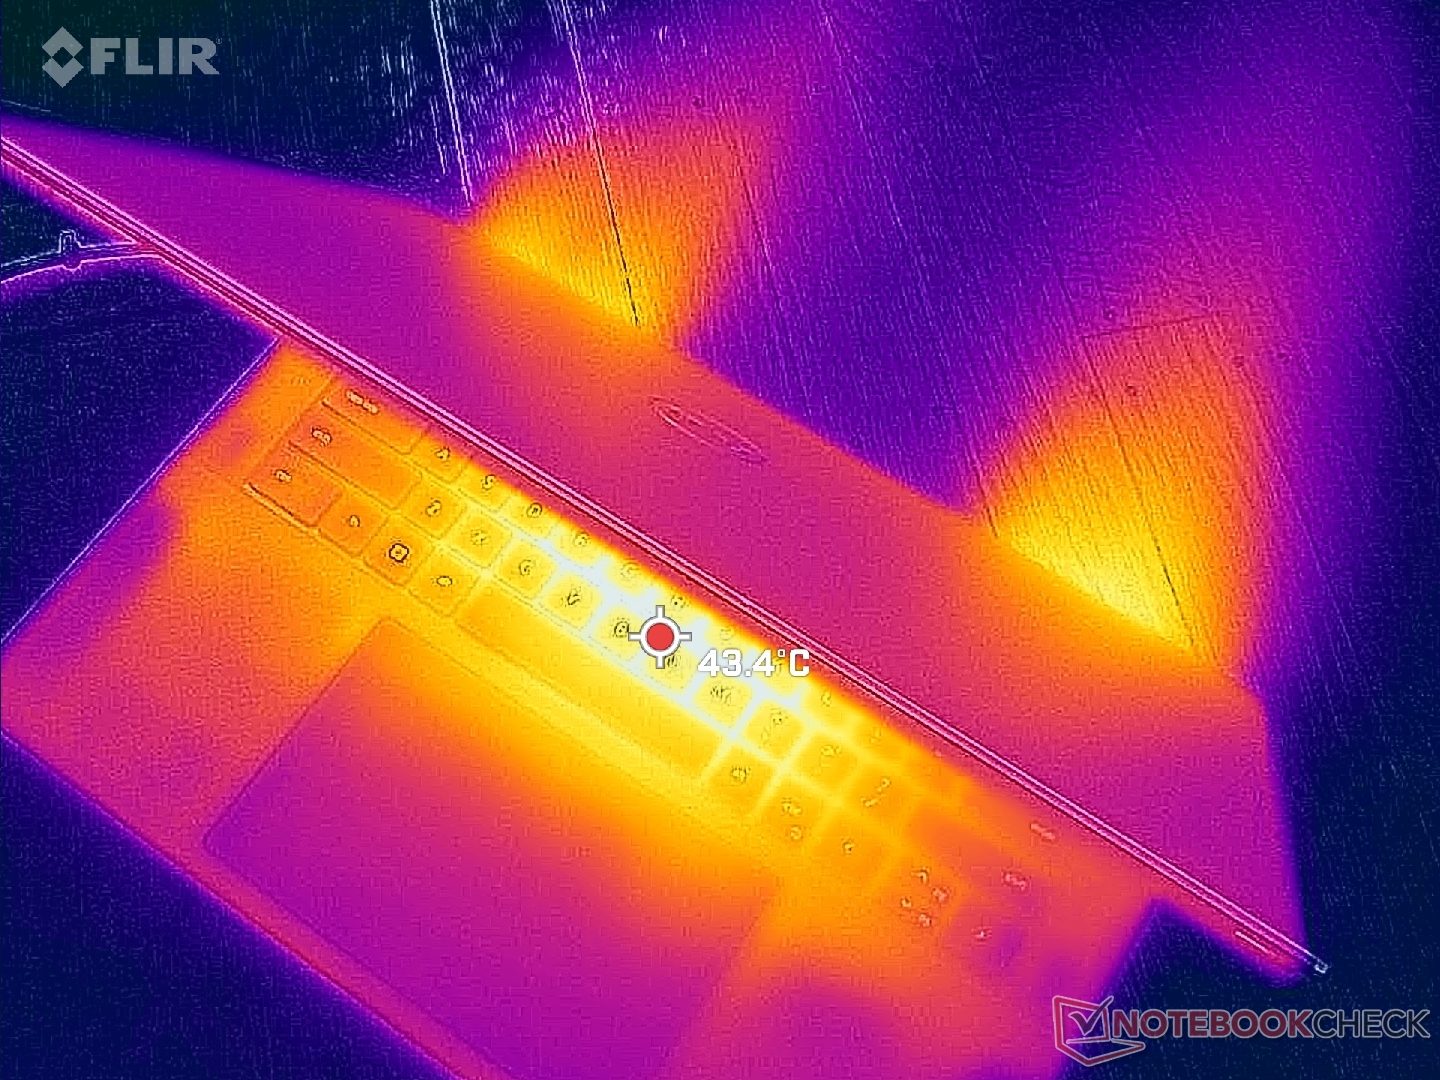
(-) The maximum temperature on the upper side is 45.6 °C / 114 F, compared to the average of 36.9 °C / 98 F, ranging from 21.1 to 71 °C for the class Multimedia.
(±) The bottom heats up to a maximum of 42 °C / 108 F, compared to the average of 39.1 °C / 102 F
(+) In idle usage, the average temperature for the upper side is 31.1 °C / 88 F, compared to the device average of 31.2 °C / 88 F.
(±) Playing The Witcher 3, the average temperature for the upper side is 37.2 °C / 99 F, compared to the device average of 31.2 °C / 88 F.
(+) The palmrests and touchpad are cooler than skin temperature with a maximum of 30.6 °C / 87.1 F and are therefore cool to the touch.
(±) The average temperature of the palmrest area of similar devices was 28.8 °C / 83.8 F (-1.8 °C / -3.3 F).
| Dell XPS 15 9530 RTX 4070 Intel Core i7-13700H, NVIDIA GeForce RTX 4070 Laptop GPU | Dell XPS 15 9520 RTX 3050 Ti Intel Core i7-12700H, NVIDIA GeForce RTX 3050 Ti Laptop GPU | Dell XPS 15 9500 Core i7 4K UHD Intel Core i7-10875H, NVIDIA GeForce GTX 1650 Ti Mobile | Asus Zenbook Pro 15 OLED UM535Q AMD Ryzen 9 5900HX, NVIDIA GeForce RTX 3050 Ti Laptop GPU | MSI Prestige 15 A12UD-093 Intel Core i7-1280P, NVIDIA GeForce RTX 3050 Ti Laptop GPU | Gigabyte Aero 15 OLED XD Intel Core i7-11800H, NVIDIA GeForce RTX 3070 Laptop GPU | |
|---|---|---|---|---|---|---|
| Heat | -5% | -2% | -4% | -3% | -9% | |
| Maximum Upper Side * | 45.6 | 51.4 -13% | 44 4% | 36 21% | 49 -7% | 45 1% |
| Maximum Bottom * | 42 | 51 -21% | 48.8 -16% | 47.2 -12% | 52.6 -25% | 54 -29% |
| Idle Upper Side * | 34.4 | 30 13% | 33 4% | 37 -8% | 29.7 14% | 34 1% |
| Idle Bottom * | 33.2 | 33 1% | 32.4 2% | 39.2 -18% | 30.7 8% | 36 -8% |
* ... smaller is better
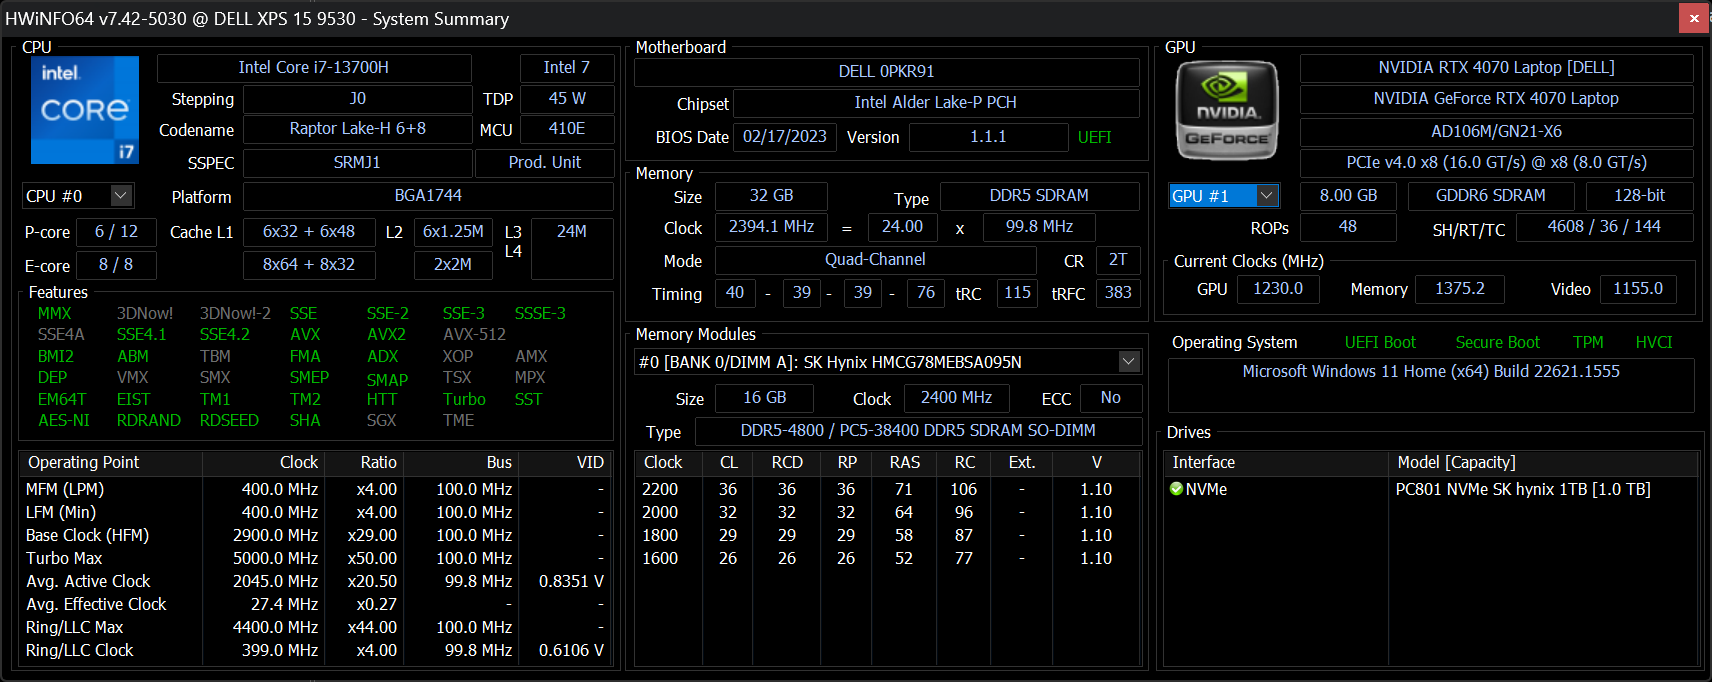
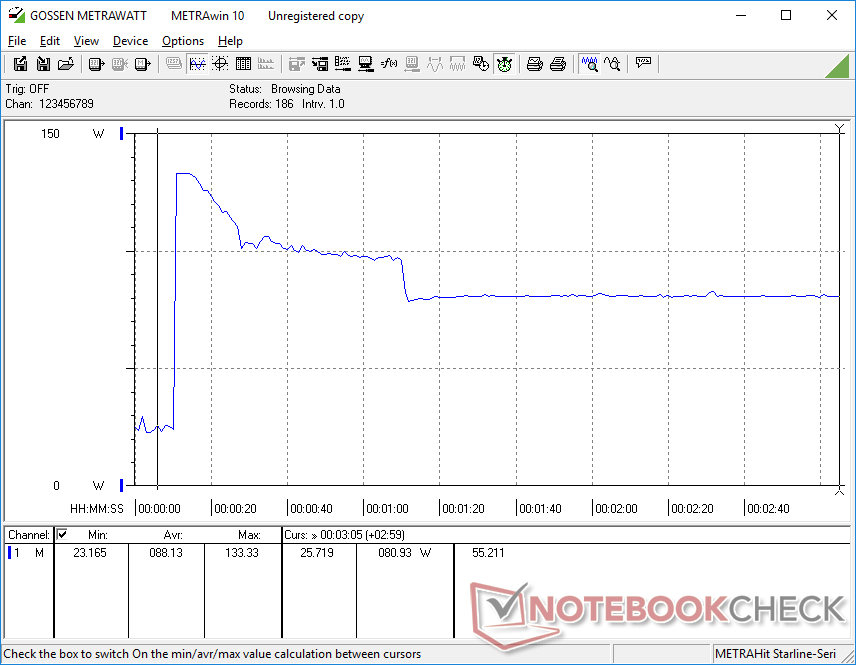
Stress Test — High CPU Temperatures
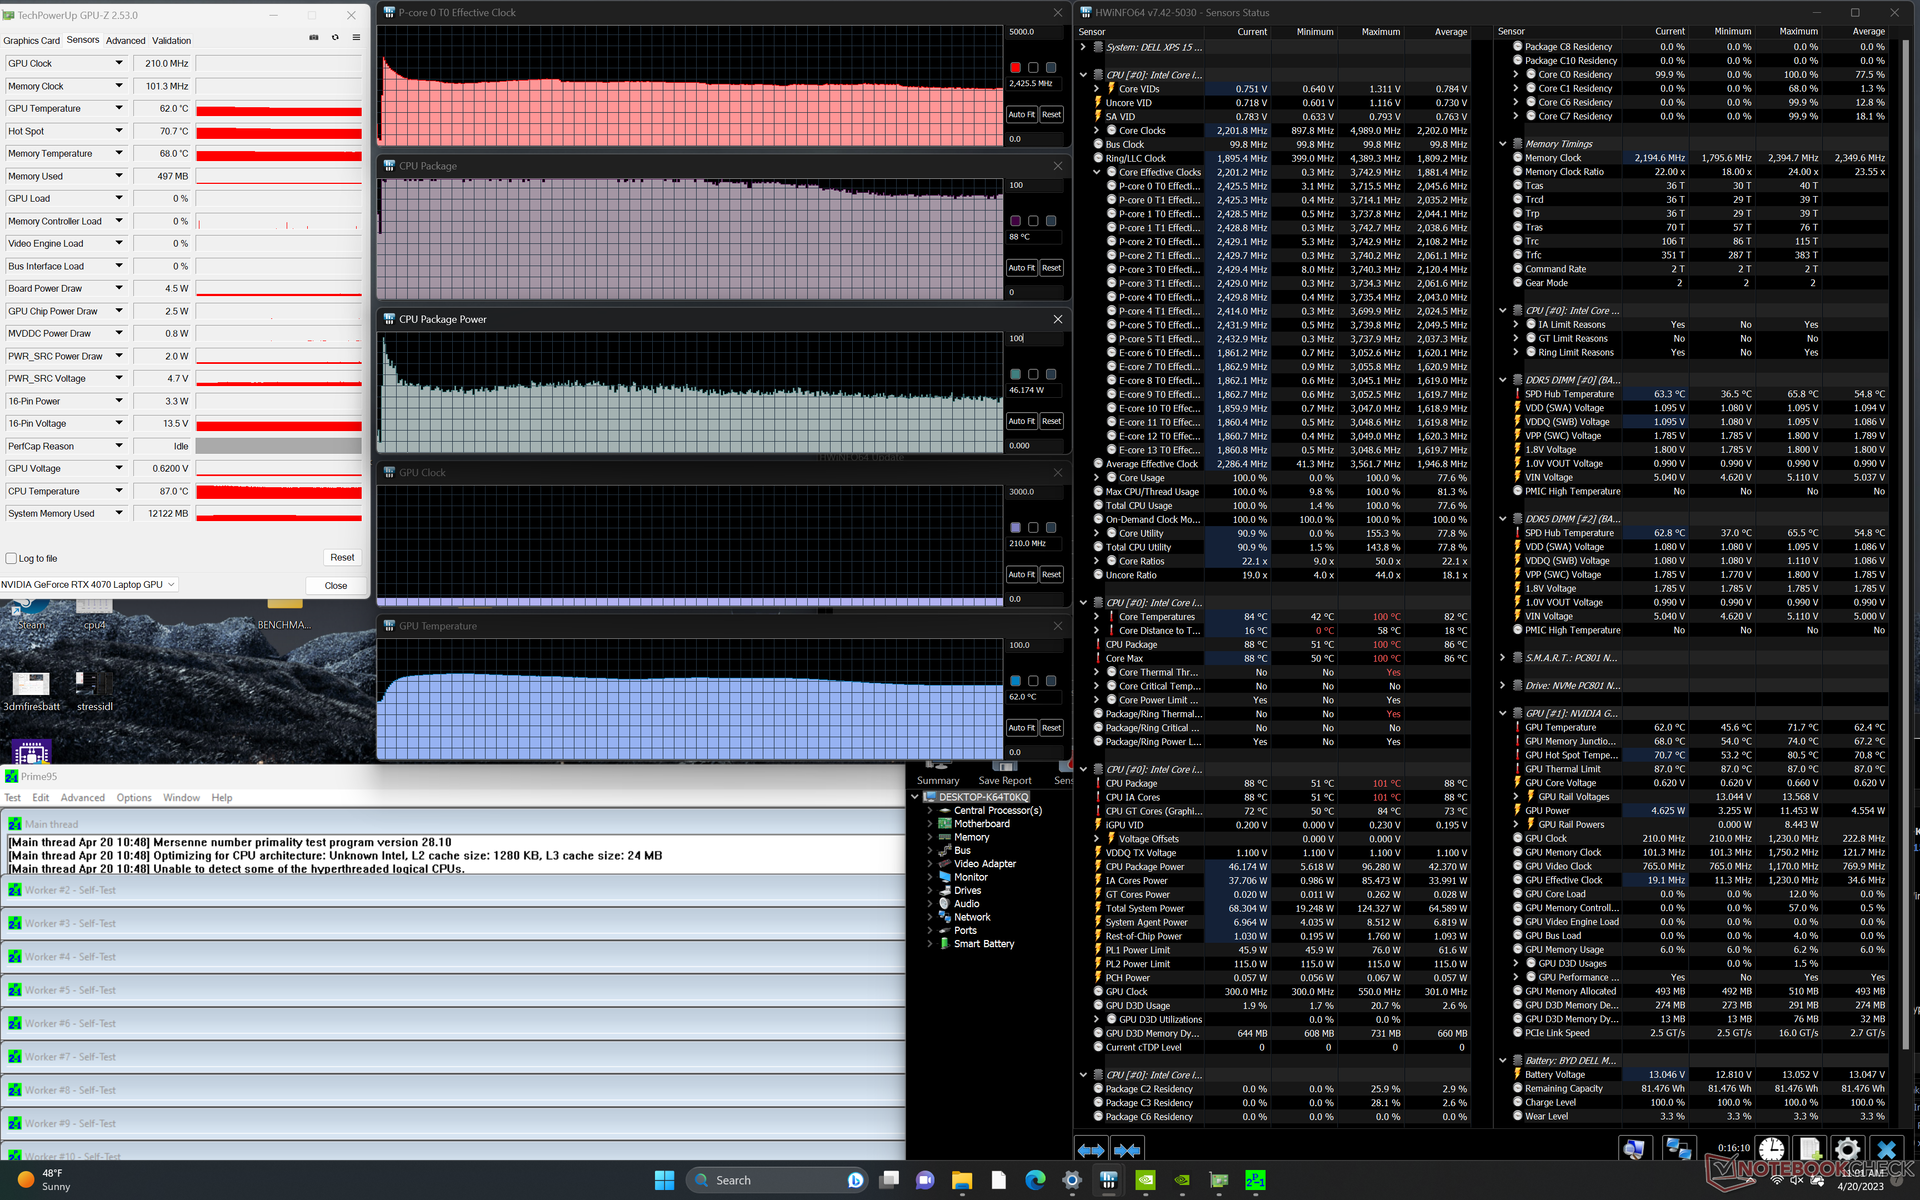
The CPU would boost to 3.7 GHz and 96 W for only a second or two when initiating Prime95 stress. This would steadily drop to just 2.7 GHz and 55 W because of the very high core temperature of 88 to 100 C when the CPU is fully stressed. In comparison, repeating this same test on the AMD-powered Asus Zenbook Pro 15 UM535Q would result in a cooler core temperature of just 76 C. The higher-than-average core temperature on the Dell system isn't surprising as it is a common characteristic of the XPS 15 series. Upgrading to the Core i9 configuration may therefore bring just slight benefits at best since our Core i7 configuration is already skirting the 100 C ceiling.
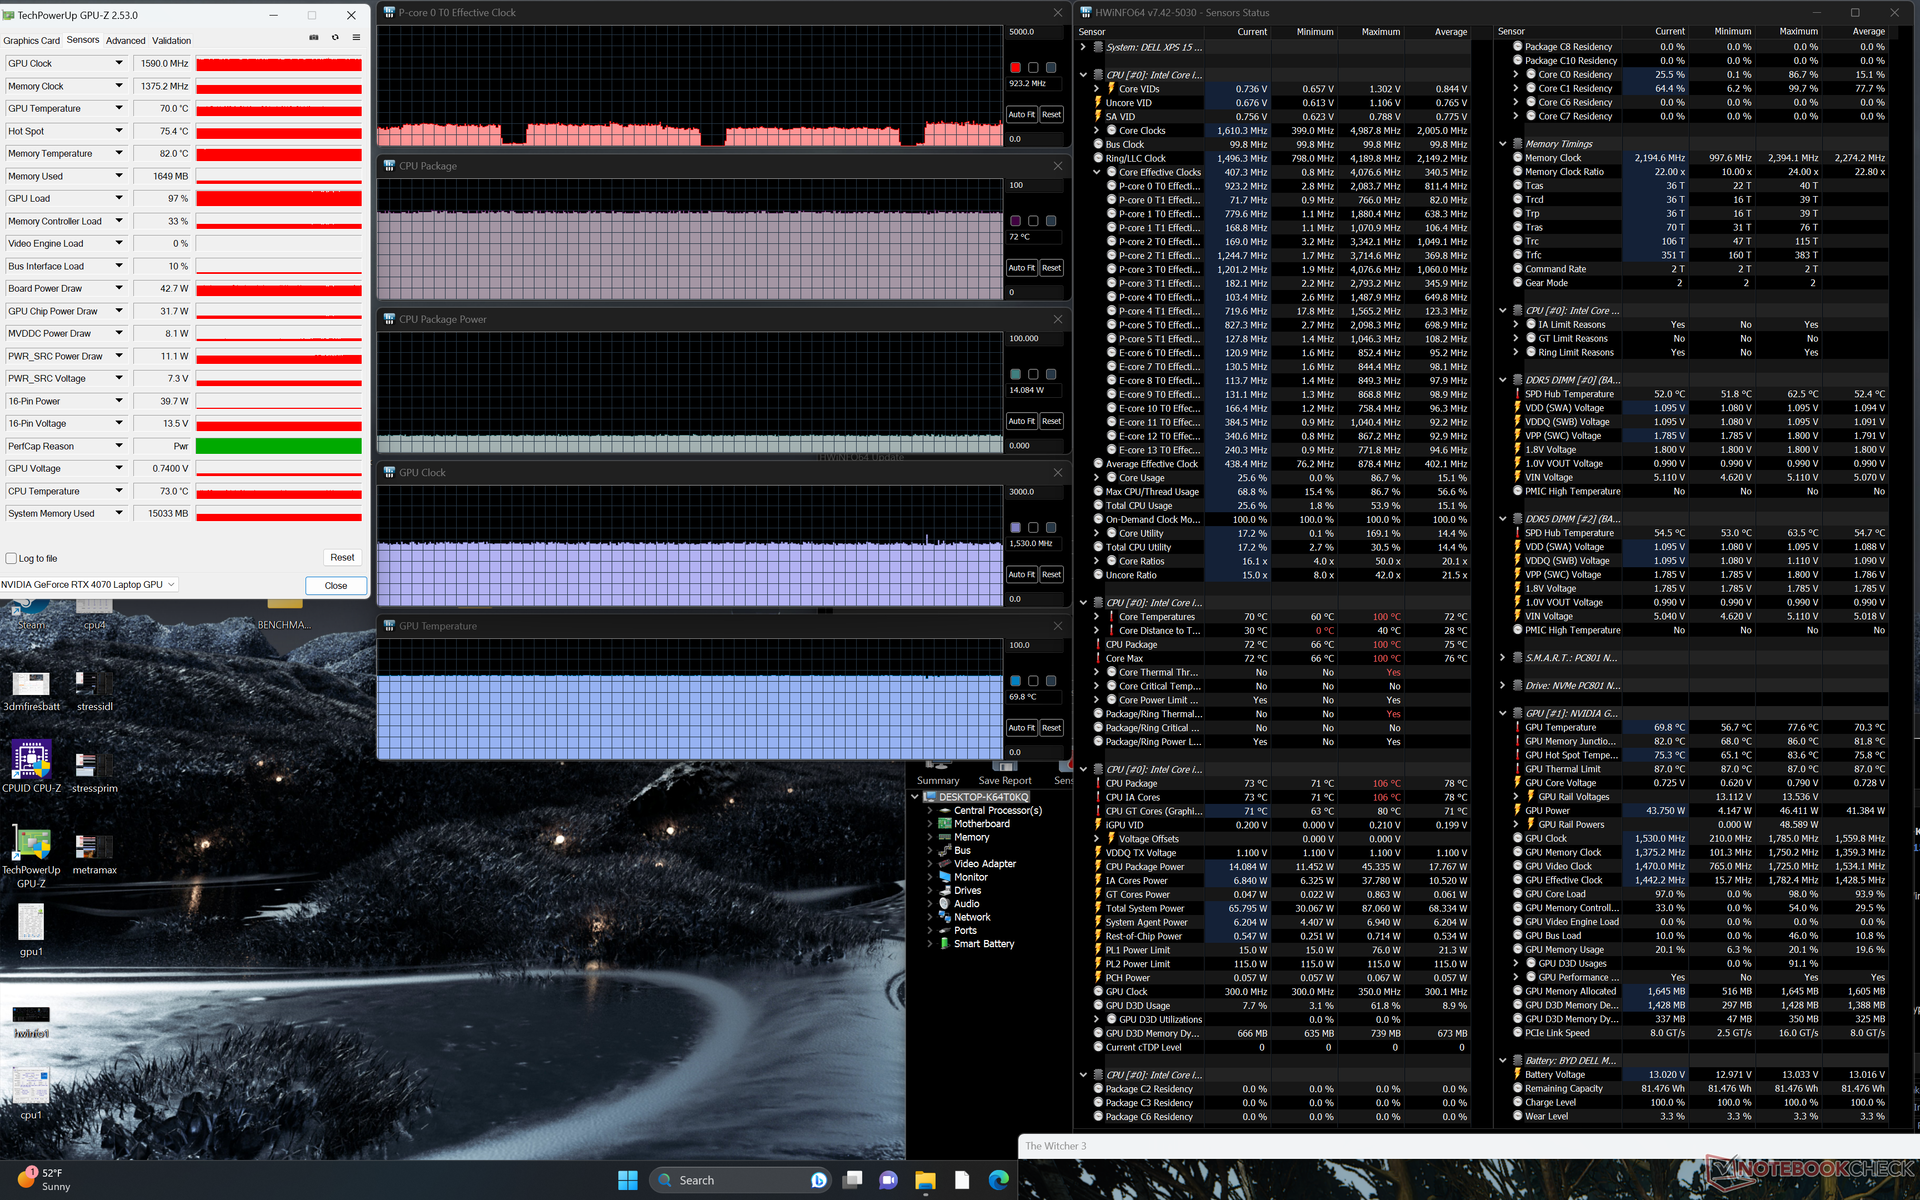
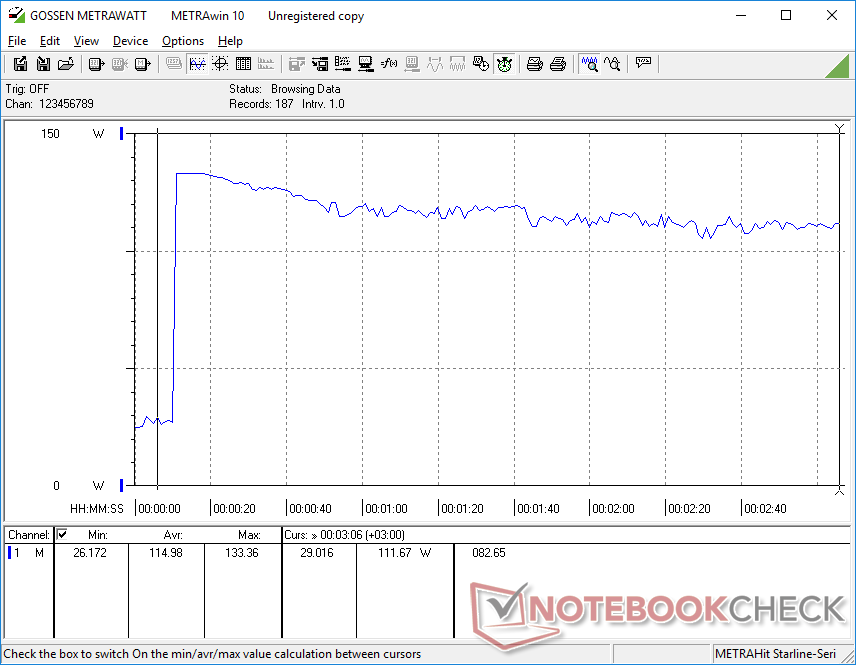
When running Witcher 3 to represent typical gaming loads, the GPU would stabilize at 1590 MHz core, 1375 MHz memory, 70 C, and 43 W against a 50 W target. Repeating this same test on the larger Uniwill GM6PX7X IDX with a more powerful 130 W RTX 4070 would result in a stable core clock, memory clock, temperature, and GPU power of 2370 MHz, 2125 MHz, 73 C, and 100 W, respectively. The performance differential between the 50 W and 100+ W RTX 4070 is very clear in this example.
Surprisingly, running on battery power does not impact performance which is rare for any GeForce RTX-powered laptop. A 3DMark 11 test on batteries would return Physics and Graphic scores of 20751 and 24569 points, respectively, compared to 18112 and 24229 points when on mains.
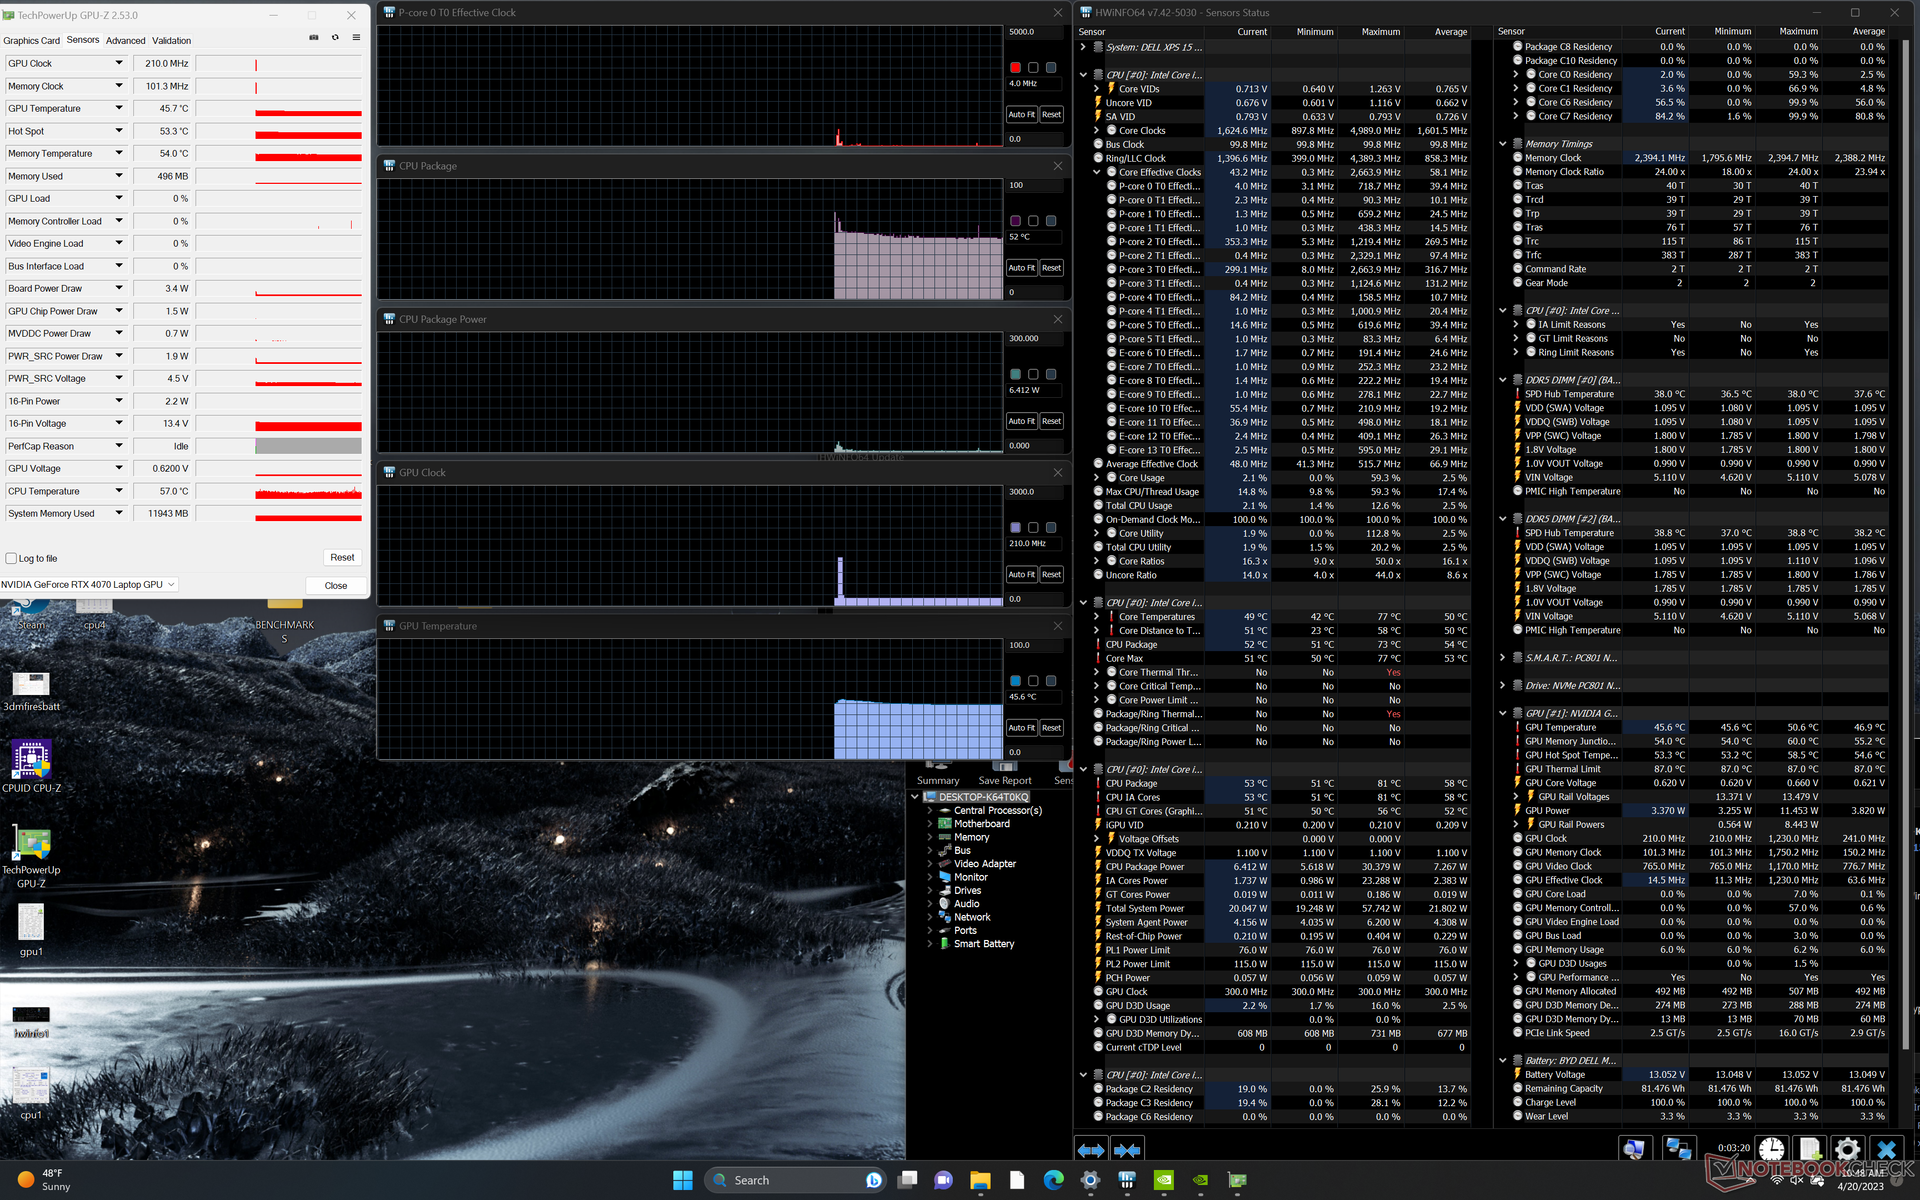
| CPU Clock (GHz) | GPU Clock (MHz) | Average CPU Temperature (°C) | Average GPU Temperature (°C) | |
| System Idle | -- | -- | 52 | 46 |
| Prime95 Stress | 2.4 | -- | 88 | 62 |
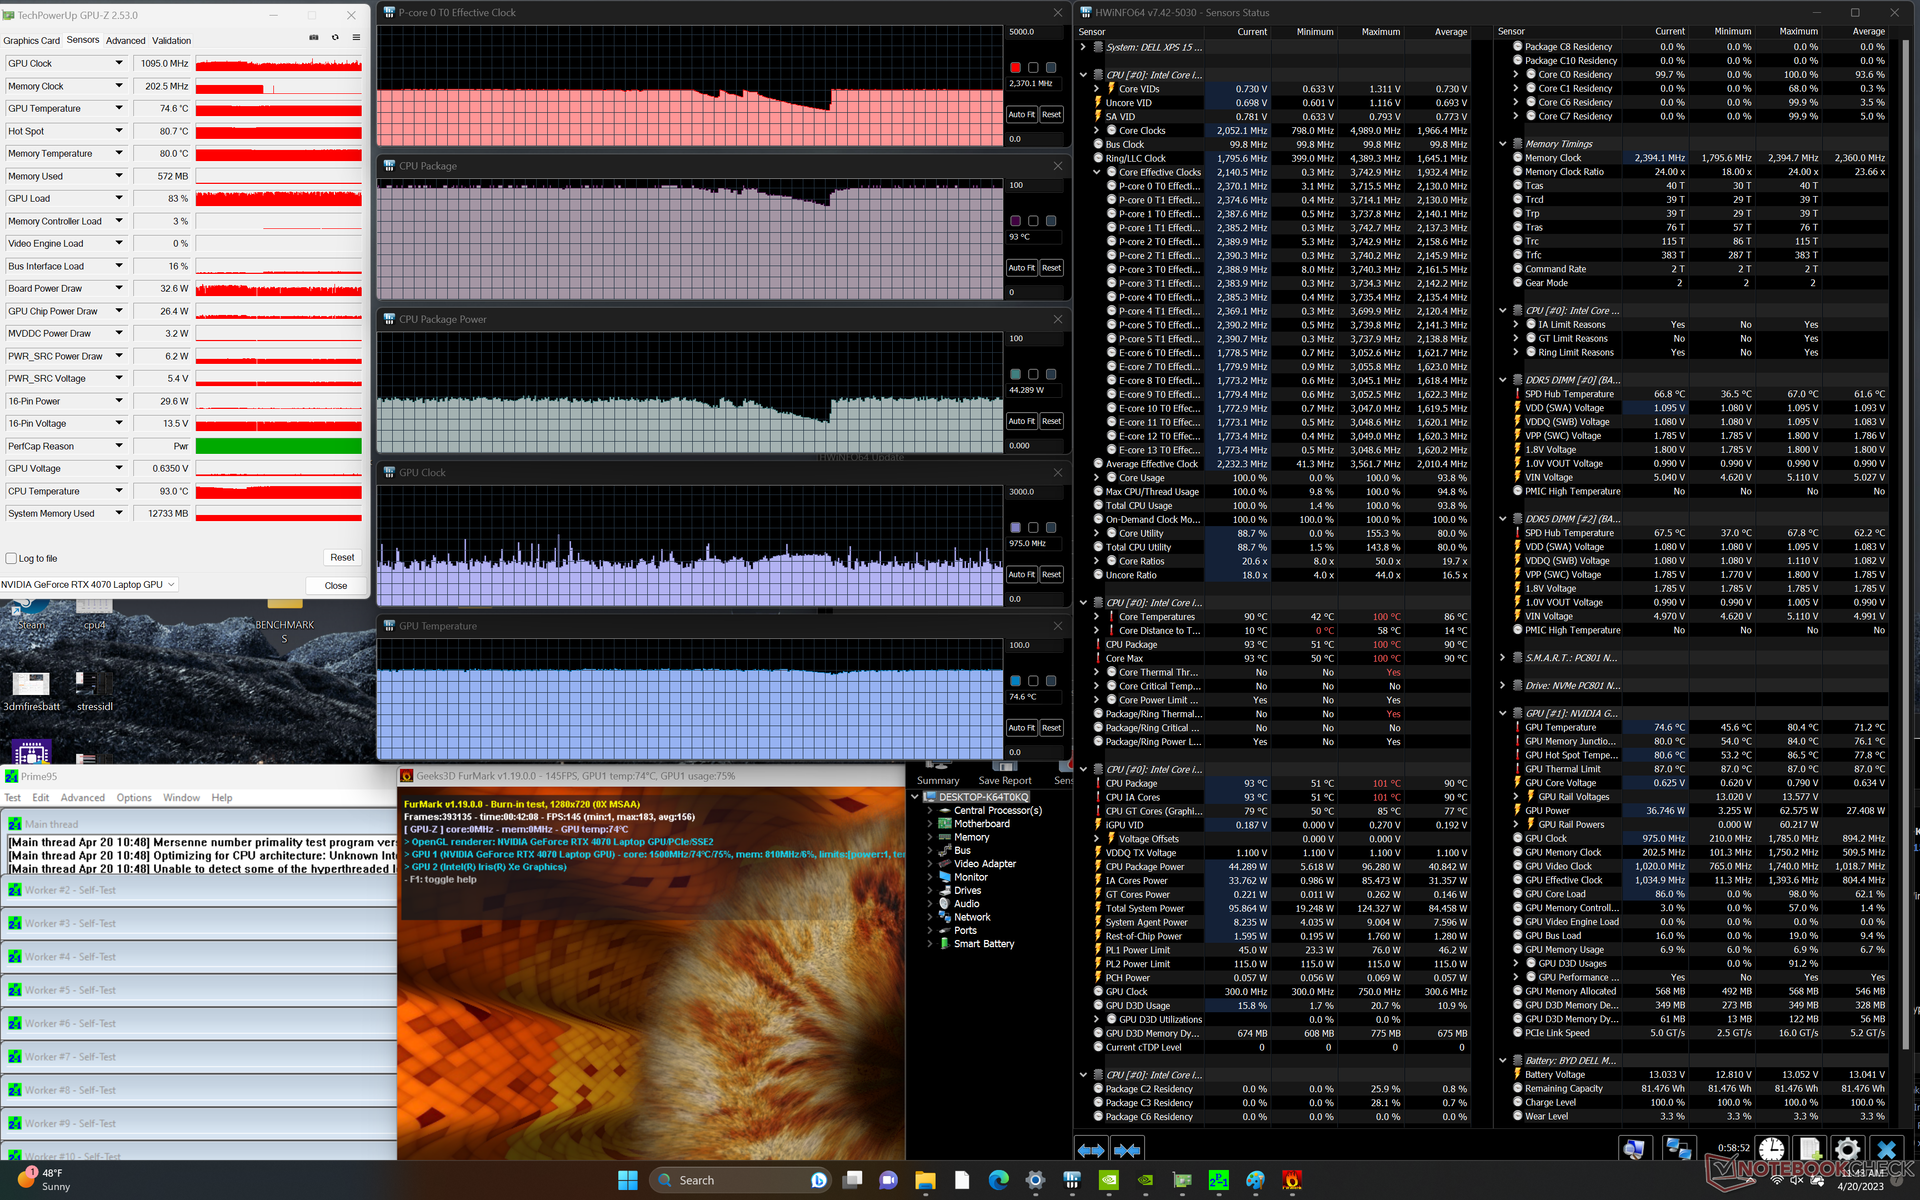
| Prime95 + FurMark Stress | 2.4 | ~1095 | 93 | 75 |
| Witcher 3 Stress | ~0.9 | 1590 | 72 | 70 |
Speakers
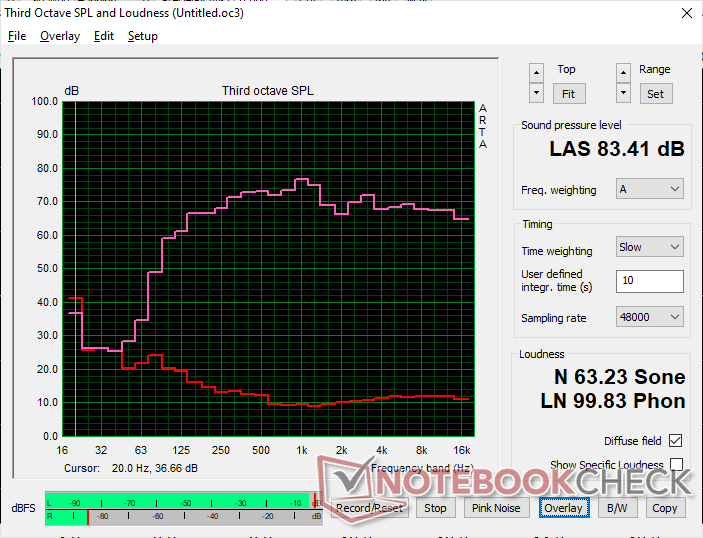
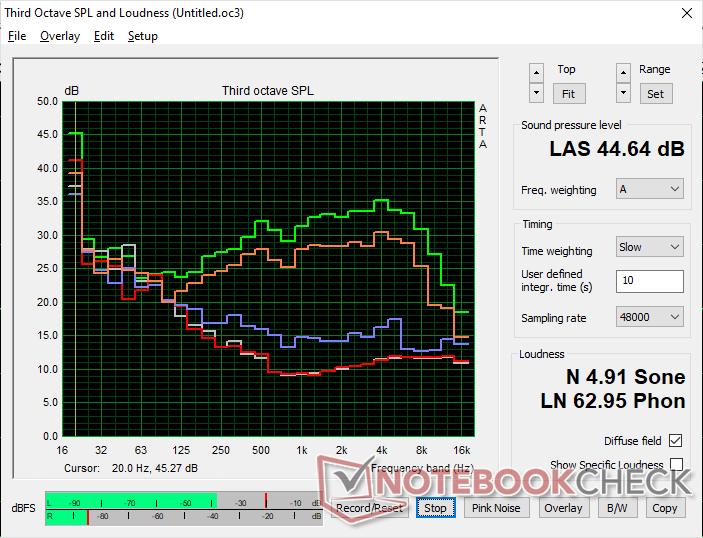
Dell XPS 15 9530 RTX 4070 audio analysis
(+) | speakers can play relatively loud (83.4 dB)
Bass 100 - 315 Hz
(+) | good bass - only 3.9% away from median
(+) | bass is linear (6.8% delta to prev. frequency)
Mids 400 - 2000 Hz
(+) | balanced mids - only 4.4% away from median
(+) | mids are linear (4.1% delta to prev. frequency)
Highs 2 - 16 kHz
(+) | balanced highs - only 1.1% away from median
(+) | highs are linear (3.3% delta to prev. frequency)
Overall 100 - 16.000 Hz
(+) | overall sound is linear (6.4% difference to median)
Compared to same class
» 2% of all tested devices in this class were better, 1% similar, 97% worse
» The best had a delta of 5%, average was 18%, worst was 45%
Compared to all devices tested
» 0% of all tested devices were better, 0% similar, 99% worse
» The best had a delta of 4%, average was 25%, worst was 134%
Apple MacBook Pro 16 2021 M1 Pro audio analysis
(+) | speakers can play relatively loud (84.7 dB)
Bass 100 - 315 Hz
(+) | good bass - only 3.8% away from median
(+) | bass is linear (5.2% delta to prev. frequency)
Mids 400 - 2000 Hz
(+) | balanced mids - only 1.3% away from median
(+) | mids are linear (2.1% delta to prev. frequency)
Highs 2 - 16 kHz
(+) | balanced highs - only 1.9% away from median
(+) | highs are linear (2.7% delta to prev. frequency)
Overall 100 - 16.000 Hz
(+) | overall sound is linear (4.6% difference to median)
Compared to same class
» 0% of all tested devices in this class were better, 0% similar, 100% worse
» The best had a delta of 5%, average was 18%, worst was 45%
Compared to all devices tested
» 0% of all tested devices were better, 0% similar, 100% worse
» The best had a delta of 4%, average was 25%, worst was 134%
Energy Management — Core H and GeForce RTX On USB-C
Power Consumption
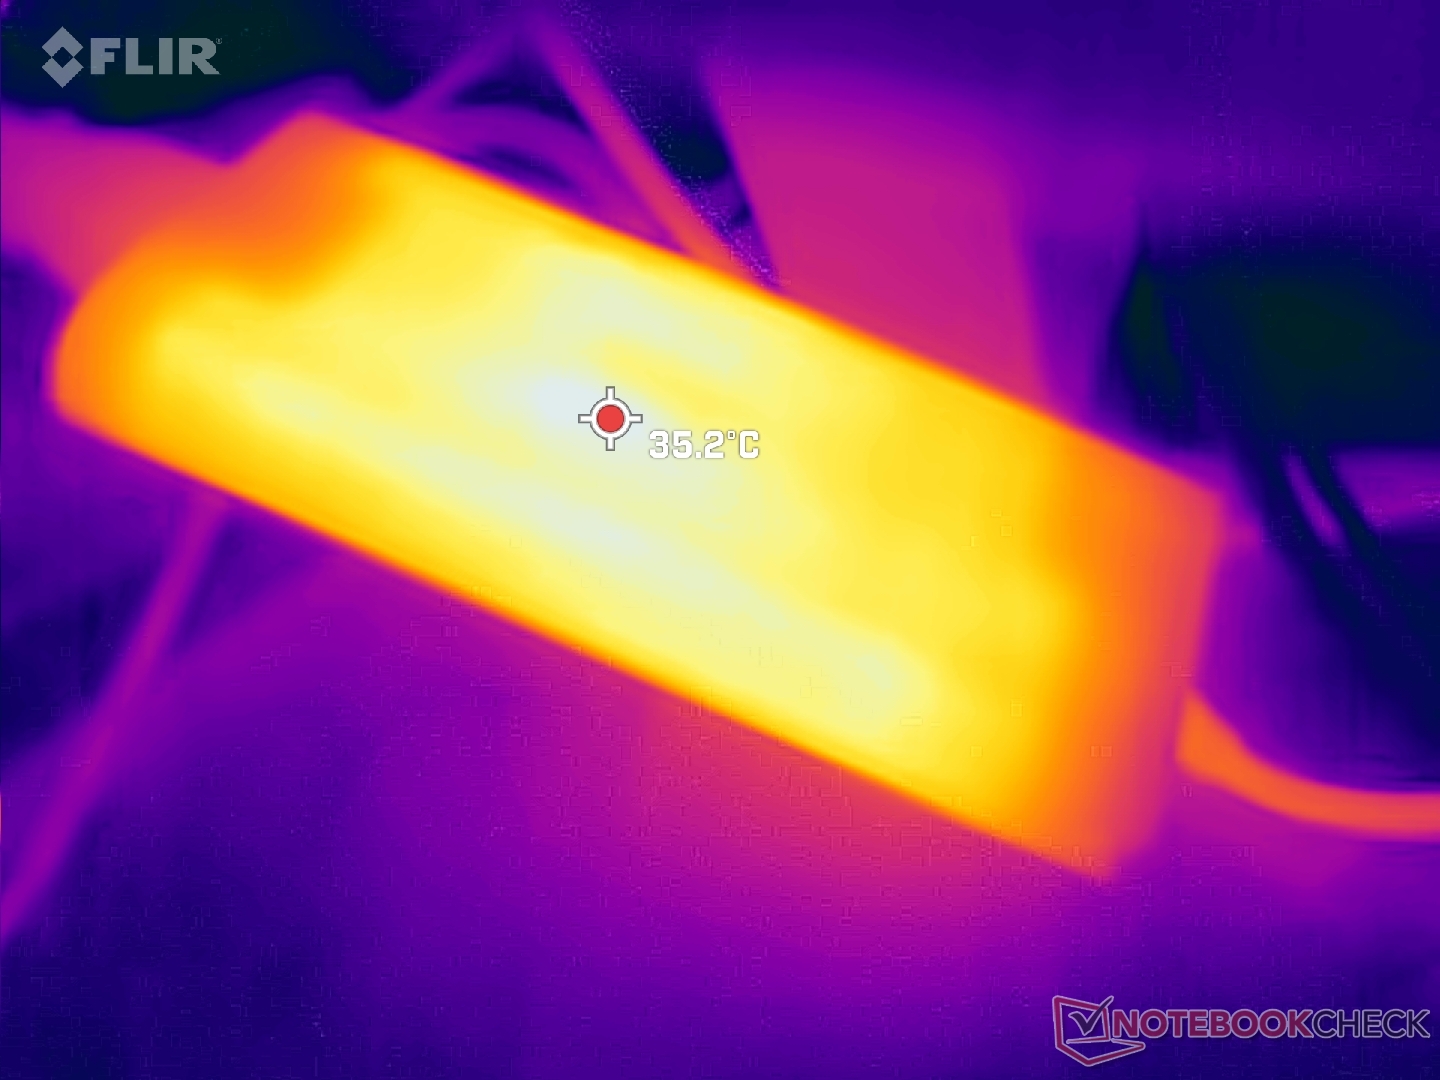
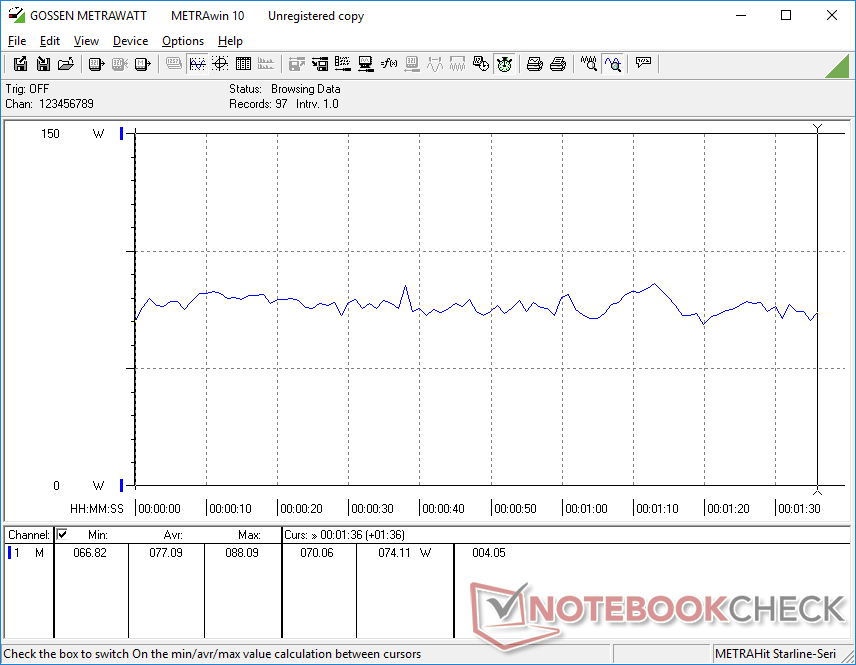
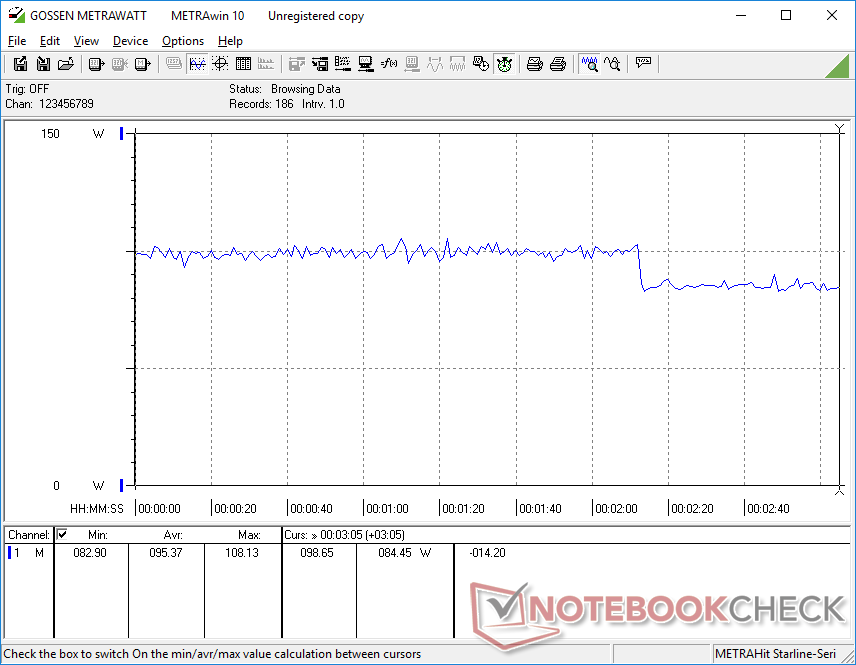
Power consumption is generally higher when compared to last year's model. When idling on desktop at the lowest settings, for example, the XPS 15 9530 would consume about 20 W compared to just 5 to 6 W on the older XPS 15 9520. When gaming, consumption would be about 25 percent higher meaning the extra performance over the older RTX 3050 Ti doesn't exactly come free.
We're able to record a temporary maximum draw of 133 W from the small-medium (~14.3 x 6.6 x 2.2cm) 130 W AC adapter. The XPS 15 is one of the first laptops sporting both a Core H-series CPU and GeForce RTX 4070 GPU to be powered solely by USB-C. This certainly has its advantages in terms of portability and versatility, but performance and charging can take a hit due to the limited power envelope. Charging from empty to full, for example, is slower than usual at around 2.5 hours and this will be even slower if running demanding loads simultaneously.
Thankfully, the battery does not slowly drain when gaming or running demanding loads unlike what we observed on older XPS 17 models.
| Off / Standby | |
| Idle | |
| Load |
|
| Dell XPS 15 9530 RTX 4070 i7-13700H, NVIDIA GeForce RTX 4070 Laptop GPU, SK hynix PC801 HFS001TEJ9X101N, OLED, 3456x2160, 15.60 | Dell XPS 15 9520 RTX 3050 Ti i7-12700H, GeForce RTX 3050 Ti Laptop GPU, WDC PC SN810 512GB, OLED, 3456x2160, 15.60 | Dell XPS 15 9500 Core i7 4K UHD i7-10875H, GeForce GTX 1650 Ti Mobile, SK Hynix PC611 512GB, IPS, 3840x2400, 15.60 | Asus Zenbook Pro 15 OLED UM535Q R9 5900HX, GeForce RTX 3050 Ti Laptop GPU, WDC PC SN730 SDBPNTY-1T00, OLED, 1920x1080, 15.60 | MSI Prestige 15 A12UD-093 i7-1280P, GeForce RTX 3050 Ti Laptop GPU, Micron 3400 1TB MTFDKBA1T0TFH, IPS, 3840x2160, 15.60 | Gigabyte Aero 15 OLED XD i7-11800H, GeForce RTX 3070 Laptop GPU, Samsung PM9A1 MZVL21T0HCLR, OLED, 3840x2160, 15.60 | |
|---|---|---|---|---|---|---|
| Power Consumption | 28% | 12% | 34% | 51% | -39% | |
| Idle Minimum * | 20 | 5.5 72% | 5.7 71% | 5.5 72% | 5.4 73% | 23 -15% |
| Idle Average * | 20.7 | 7.2 65% | 13.5 35% | 7.4 64% | 11.8 43% | 26 -26% |
| Idle Maximum * | 22.4 | 16 29% | 19.6 12% | 14.9 33% | 12.7 43% | 34 -52% |
| Load Average * | 77.1 | 91.8 -19% | 114.1 -48% | 78.2 -1% | 45.9 40% | 99 -28% |
| Witcher 3 ultra * | 95.4 | 74.6 22% | 93 3% | 80.1 16% | 45.7 52% | 163 -71% |
| Load Maximum * | 133.4 | 134.7 -1% | 135.2 -1% | 110.9 17% | 63 53% | 190 -42% |
* ... smaller is better
Power Consumption Witcher 3 / Stresstest
Power Consumption external Monitor
Battery Life — Slightly Shorter, But Not Bad
Runtimes are generally shorter than on last year's model which isn't surprising as the 13th gen Intel CPU and GeForce 40 GPU are under similar power envelopes as their respective predecessors. We're able to record 8 hours of real-world WLAN usage or 40 minutes shorter than on the 2022 XPS 15. It's still good even though it's a bit shorter than competing models like the Asus Zenbook Pro 15.
Battery life can be extended by displaying darker colors instead of white on the OLED configuration as detailed here. We expect the lower resolution IPS SKU to provide longer runtimes than what we've recorded here.
| Dell XPS 15 9530 RTX 4070 i7-13700H, NVIDIA GeForce RTX 4070 Laptop GPU, 86 Wh | Dell XPS 15 9520 RTX 3050 Ti i7-12700H, GeForce RTX 3050 Ti Laptop GPU, 86 Wh | Dell XPS 15 9500 Core i7 4K UHD i7-10875H, GeForce GTX 1650 Ti Mobile, 86 Wh | Asus Zenbook Pro 15 OLED UM535Q R9 5900HX, GeForce RTX 3050 Ti Laptop GPU, 96 Wh | MSI Prestige 15 A12UD-093 i7-1280P, GeForce RTX 3050 Ti Laptop GPU, 80 Wh | Gigabyte Aero 15 OLED XD i7-11800H, GeForce RTX 3070 Laptop GPU, 99 Wh | |
|---|---|---|---|---|---|---|
| Battery Runtime | 52% | 50% | 110% | 2% | 6% | |
| Reader / Idle | 688 | 886 29% | 1382 101% | 1571 128% | ||
| WiFi v1.3 | 481 | 528 10% | 546 14% | 766 59% | 531 10% | 508 6% |
| Load | 89 | 192 116% | 121 36% | 215 142% | 83 -7% | |
| H.264 | 423 | |||||
| Witcher 3 ultra | 131 |
Pros
Cons
Verdict — Sacrificing Performance For Thinness
The Core i7-13700H and GeForce RTX 4070 are typically reserved for bigger gaming laptops like the Asus ROG Strix G18 or Aorus 15X ASF each with bulky 200+ W power bricks. Cramming them into low-power thinner designs like the XPS 15 can certainly work, but performance inevitably takes a major hit. In this case, TGP has been cut by half or more for poor performance-per-dollar. If you plan on running both graphics editors and games equally, then a dedicated gaming machine like the Alienware x15 will handily outperform our XPS 15 by quite the margin even if configured with the same CPU and GPU.
The performance hit when running graphics editors is not as severe as the hit to gaming performance when compared to larger laptops with higher TGP targets. This is largely because even a 50 W RTX 4070 carries the same number of CUDA cores for acceleration as a 100+ W version. The XPS 15 9530 therefore excels at content creation with only the occasional gaming. It's an Nvidia Studio laptop, after all.
The XPS 15 9530 is the content creation laptop to own if you want to balance performance with portability. Don't expect it to perform like most other laptops with the same GPU, however.
There are plenty of changes we'd like to see on future models. Firstly, newer display options with 90 Hz or 120 Hz refresh rates would go a long way to improving the user experience. Secondly, the 720p webcam is abysmal as it feels unchanged from even a decade ago. Thirdly, a revised cooling solution potentially with liquid metal could help increase Turbo Boost performance without needing to thicken the design. And lastly, the DPC issues, frame skips, and frame drops should certainly be looked at especially for a flagship laptop geared towards content creation. There is a lot to like about the XPS 15 especially if you value its MacBook Pro-like portability, but the processors inside are outgrowing the chassis and feeling somewhat constrained because of it.
Price and Availability
The XPS 15 9530 is not yet widely available through retailers at the time of writing. The best chance of securing a model would be through Dell directly. Prices start at $2250 USD for the base configuration up to $4700 if fully configured with maximum storage and RAM.
Dell XPS 15 9530 RTX 4070
-
04/23/2023 v7
Allen Ngo
More articles related to this device
Dell XPS 15 9530 RTX 4070 (XPS 15 Series)Related Articles


Transparency
The present review sample was made available to the author as a loan by the manufacturer or a shop for the purposes of review. The lender had no influence on this review, nor did the manufacturer receive a copy of this review before publication. There was no obligation to publish this review.
Pricecompare
