 Deutsch
 English
 Español
 Français
 Italiano
 Nederlands
 Polski
 Português
 Русский
 Türkçe
 Svenska
 Chinese
 Magyar
Asus ROG Zephyrus G14 Review - Compact Gaming Laptop with AMD Zen4 Phoenix & RTX 4090
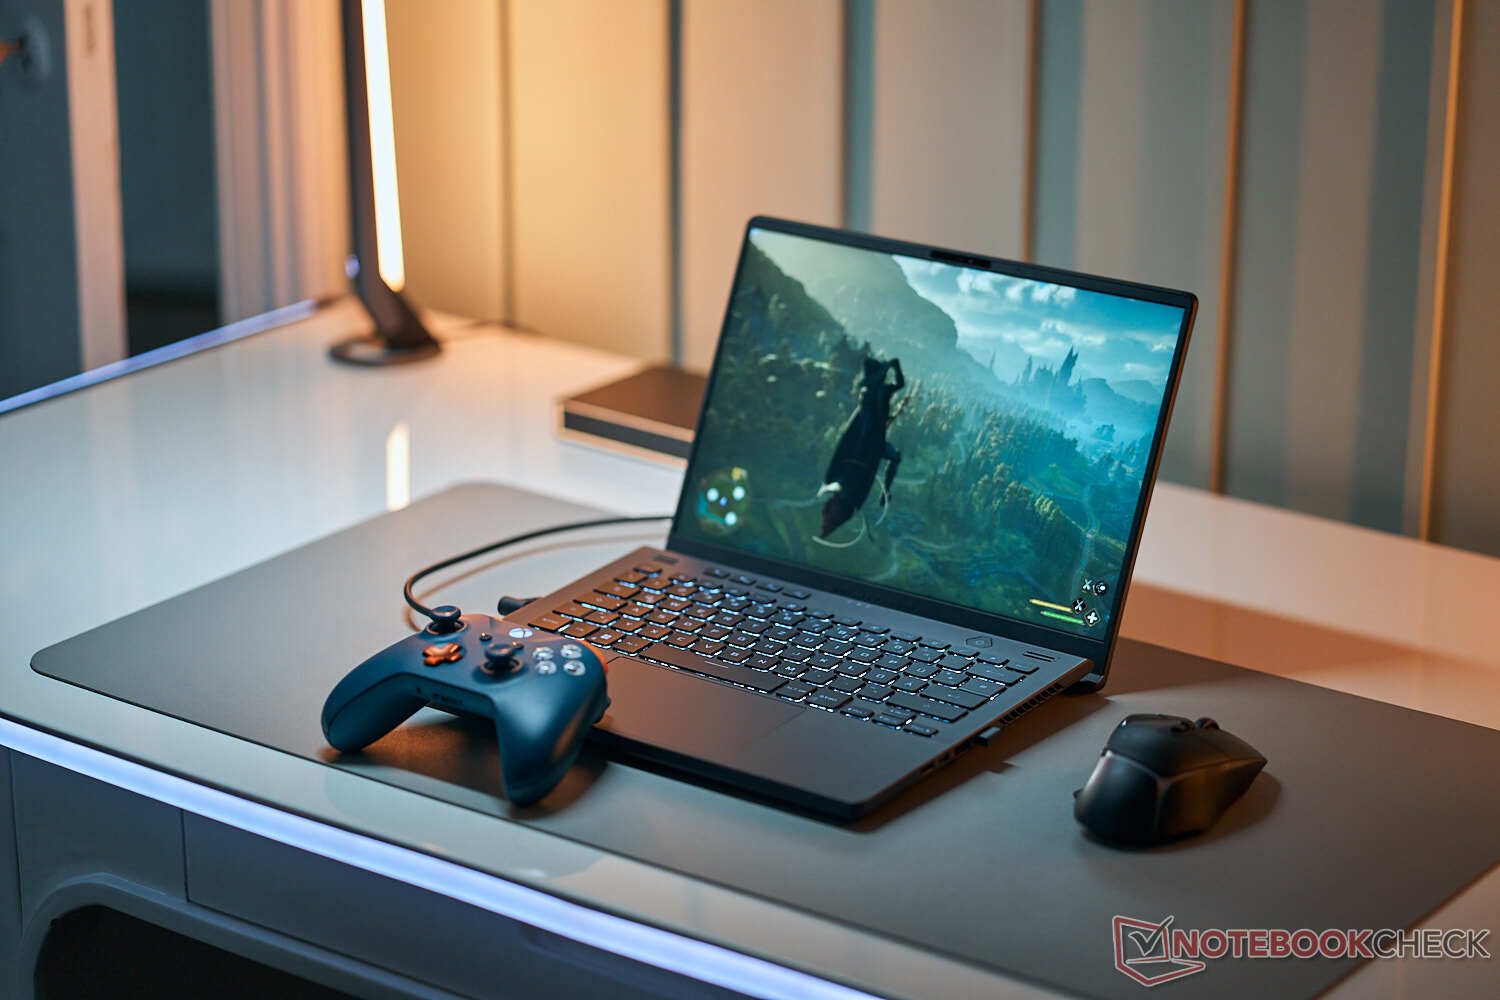
The Asus ROG Zephyrus G14 is a very powerful 14-inch laptop for gamers as well as content creators. Last year we tested it with the AMD Ryzen 9 6900HS and Radeon RX 6800S, this year, the new G14 is the first device with a new AMD Zen4 Phoenix processor, the Ryzen 9 7940HS. This time though, the new Ryzen 9 is combined with Nvidia’s latest laptop GPUs.
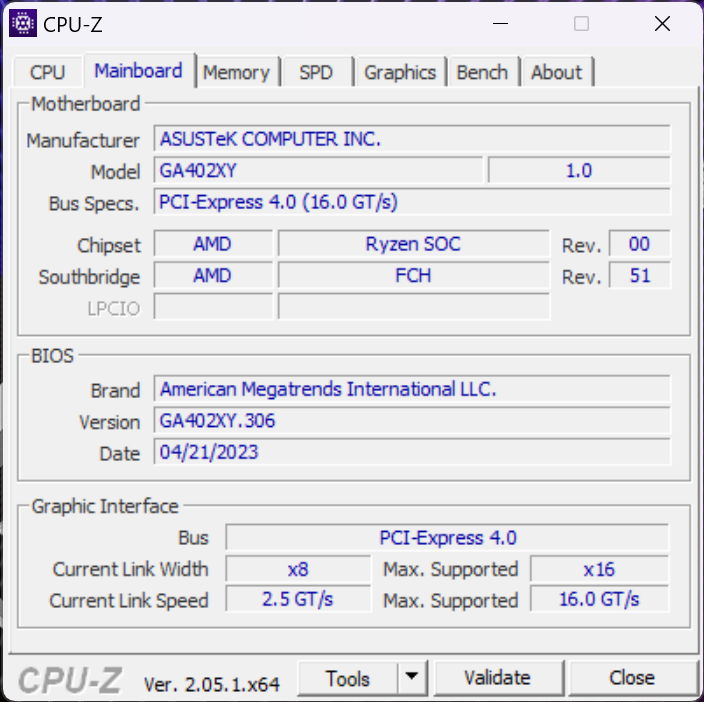
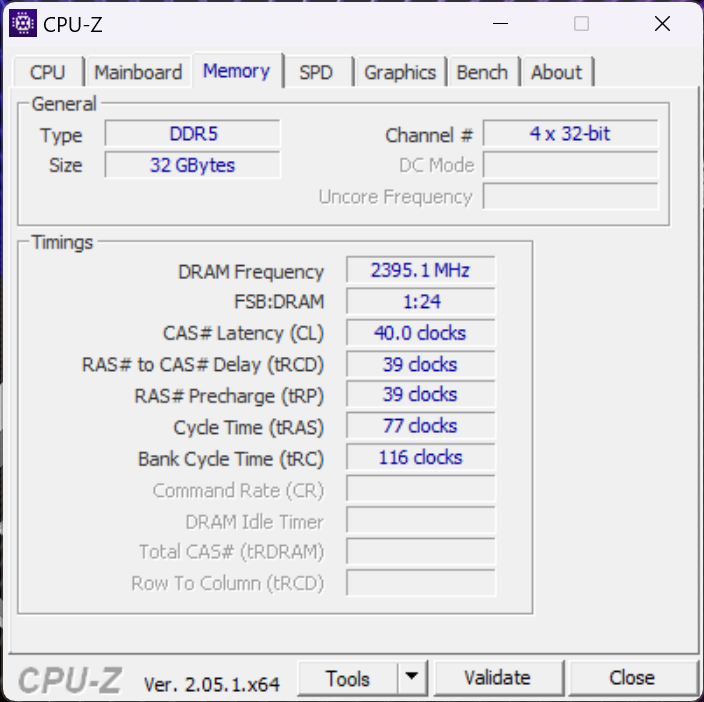
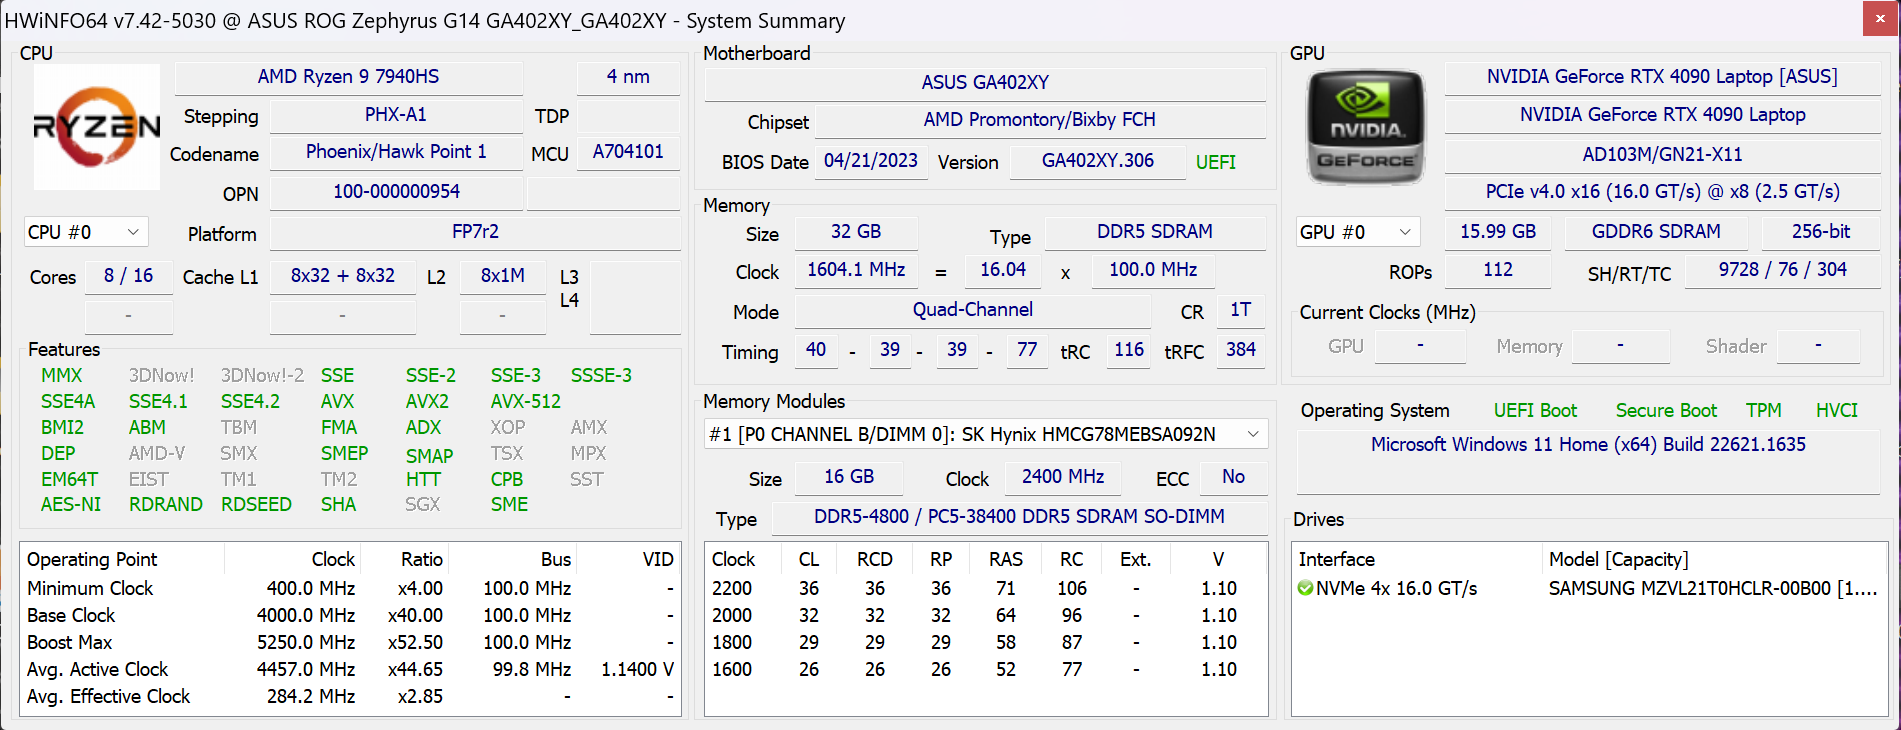
Our review unit with the designation ROG Zephyrus G14 GA402XY is the high-end model with the previously mentioned AMD Ryzen 9 7940HS, 32 GB RAM, a 1 TB PCIe-4.0 SSD, the Nvidia GeForce RTX 4090 Laptop, as well as a matte Mini-LED panel with the QHD+ resolution and 165 Hz refresh rate. This package is obviously not cheap and the RRP is listed at 3999 Euros. We included an overview about the other (less expensive) models in the Performance section. We obviously want to find our how the new AMD processor performs and how the compact 14-inch chassis handles the RTX 4090 Laptop.
We will also publish comprehensive analysis articles of the new AMD Ryzen 9 7940HS as well as the integrated GPU Radeon 780M soon.
Potential Rivals
Rating | Date | Model | Weight | Height | Size | Resolution | Best Price |
|---|---|---|---|---|---|---|---|
| 90 % | 04/2023 | Asus ROG Zephyrus G14 GA402XY R9 7940HS, NVIDIA GeForce RTX 4090 Laptop GPU | 1.7 kg | 20.5 mm | 14.00" | 2560x1600 | |
| 89.4 % | 05/2022 | Razer Blade 14 Ryzen 9 6900HX R9 6900HX, GeForce RTX 3070 Ti Laptop GPU | 1.8 kg | 16.8 mm | 14.00" | 2560x1440 | |
| 86.7 % | 03/2022 | Asus ROG Zephyrus G14 GA402RK R9 6900HS, Radeon RX 6800S | 1.7 kg | 19.5 mm | 14.00" | 2560x1600 | |
| 86.7 % | 03/2022 | Alienware x14 i7 RTX 3060 i7-12700H, GeForce RTX 3060 Laptop GPU | 1.8 kg | 14.5 mm | 14.00" | 1920x1080 | |
| 86 % | 11/2022 | Acer Predator Triton 300 SE i9-12900H, GeForce RTX 3060 Laptop GPU | 1.7 kg | 19.8 mm | 14.00" | 2880x1800 | |
| 93.9 % | 03/2023 | Apple MacBook Pro 14 2023 M2 Pro M2 Pro, M2 Pro 19-Core GPU | 1.6 kg | 15.5 mm | 14.20" | 3024x1964 |
Case - G14 with inconspicuous design
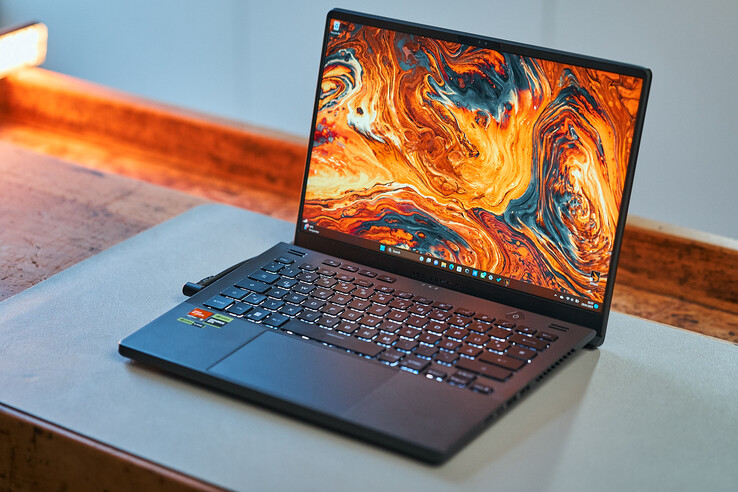
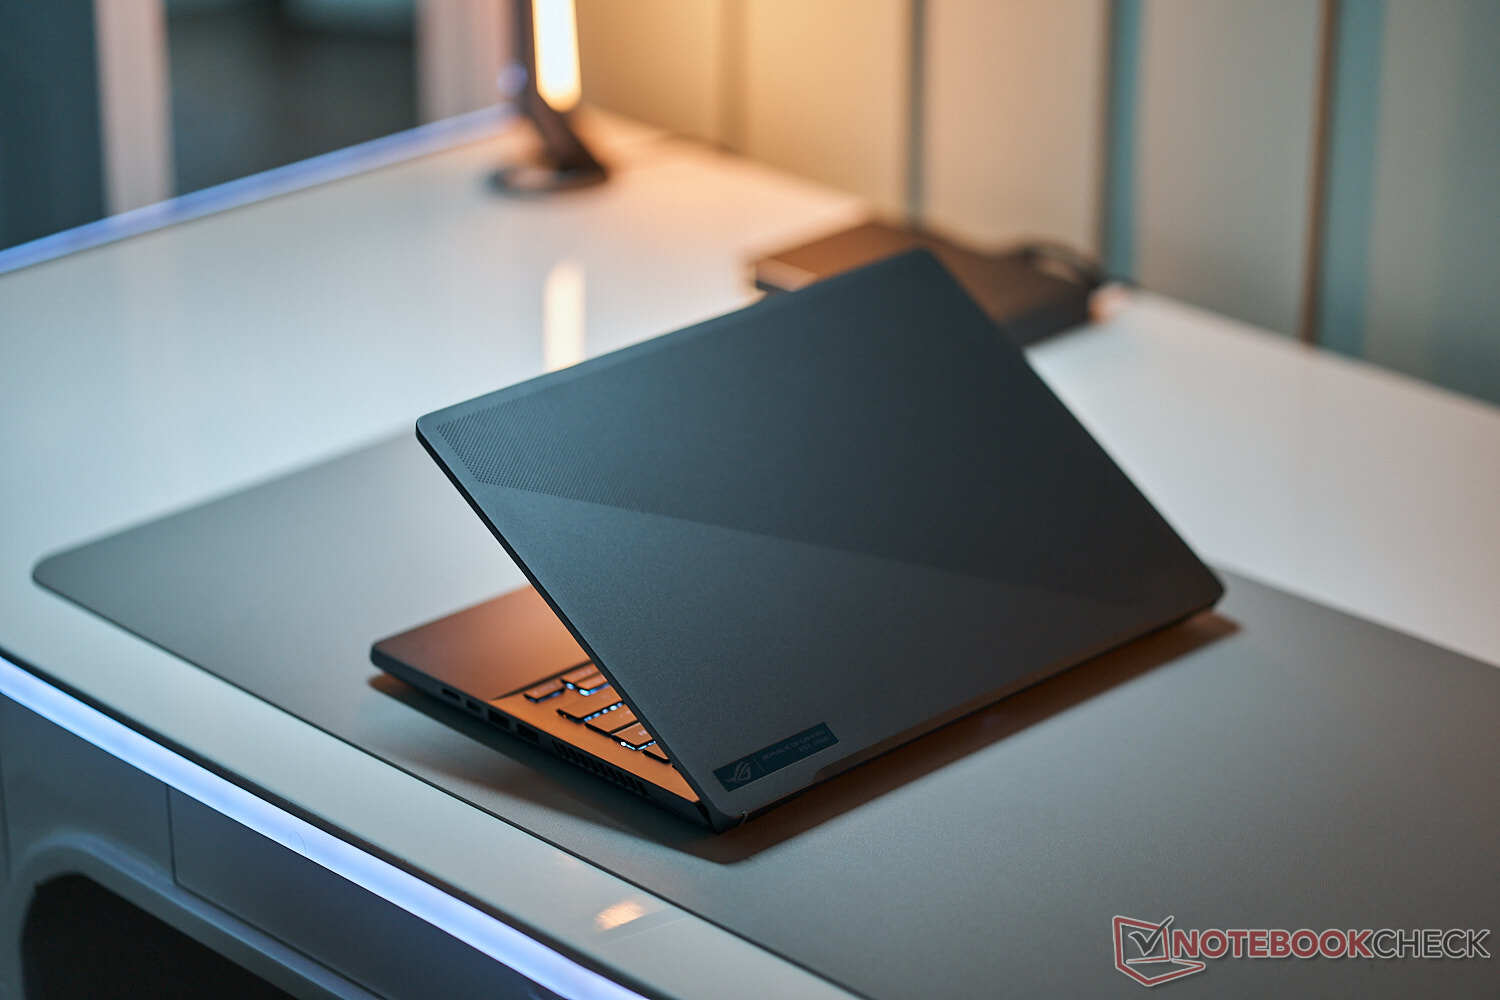
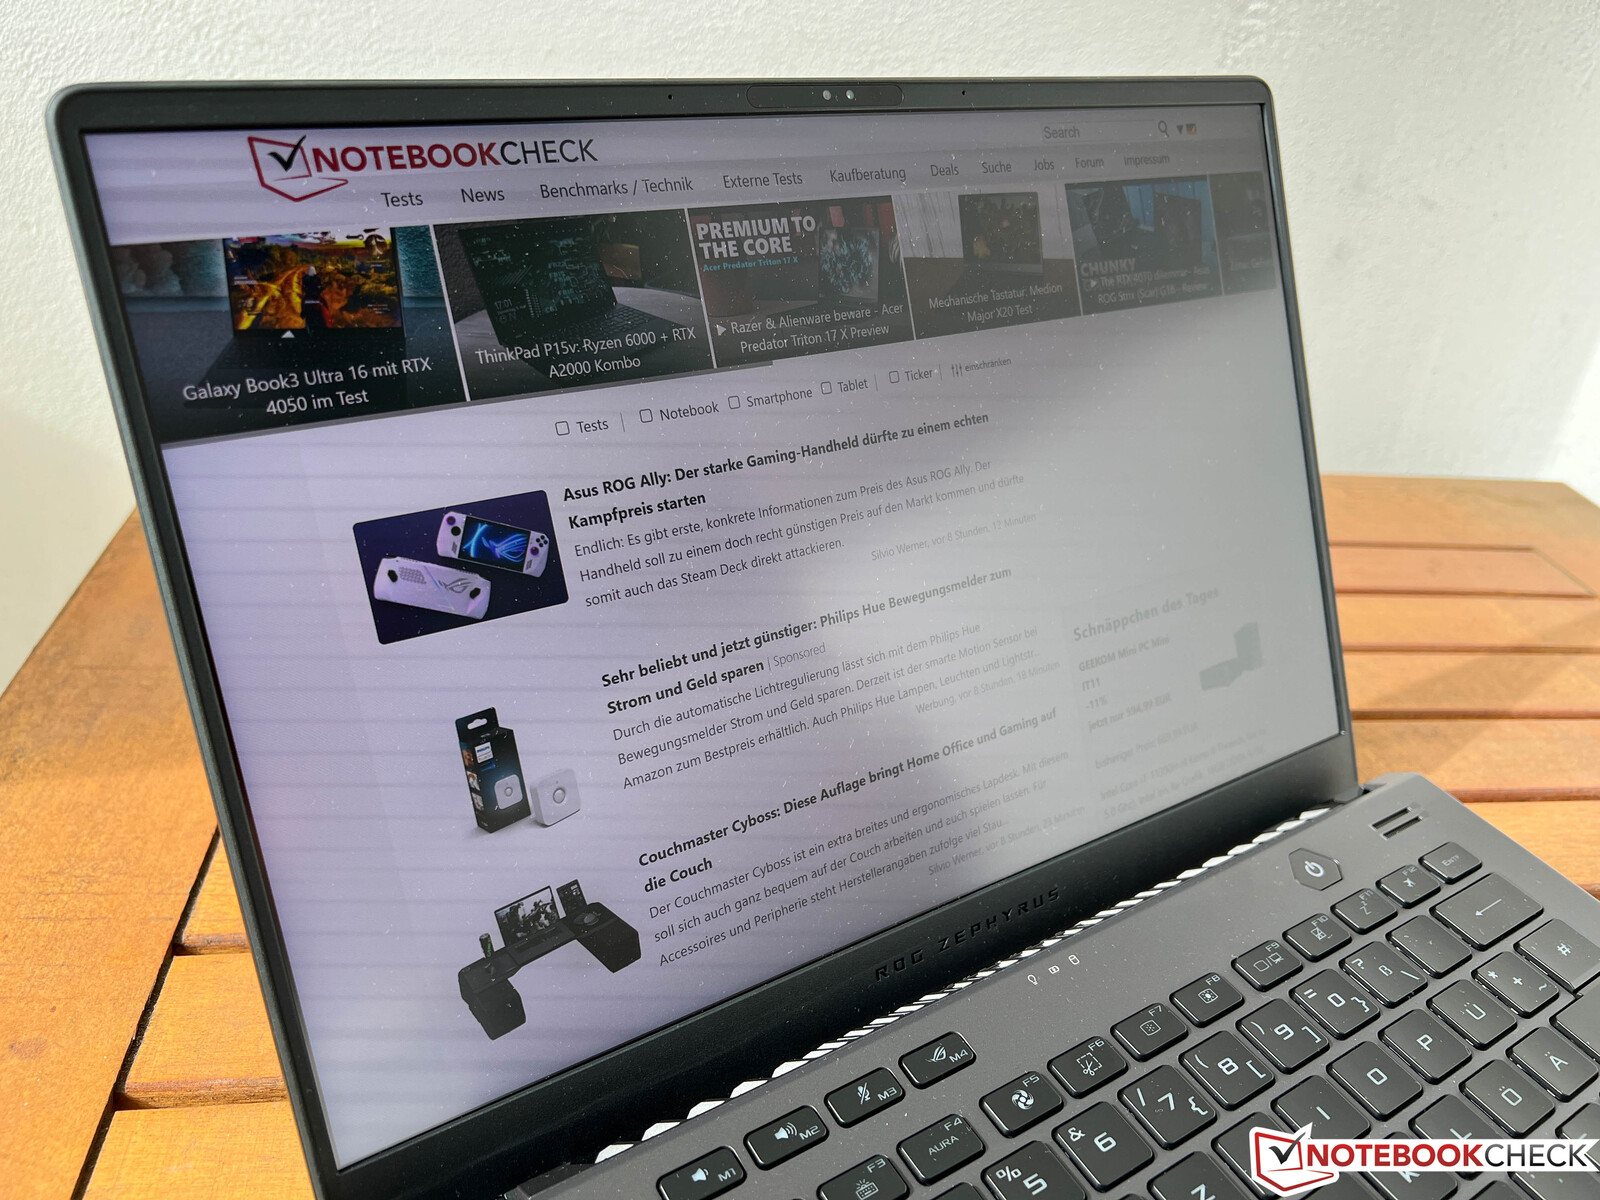
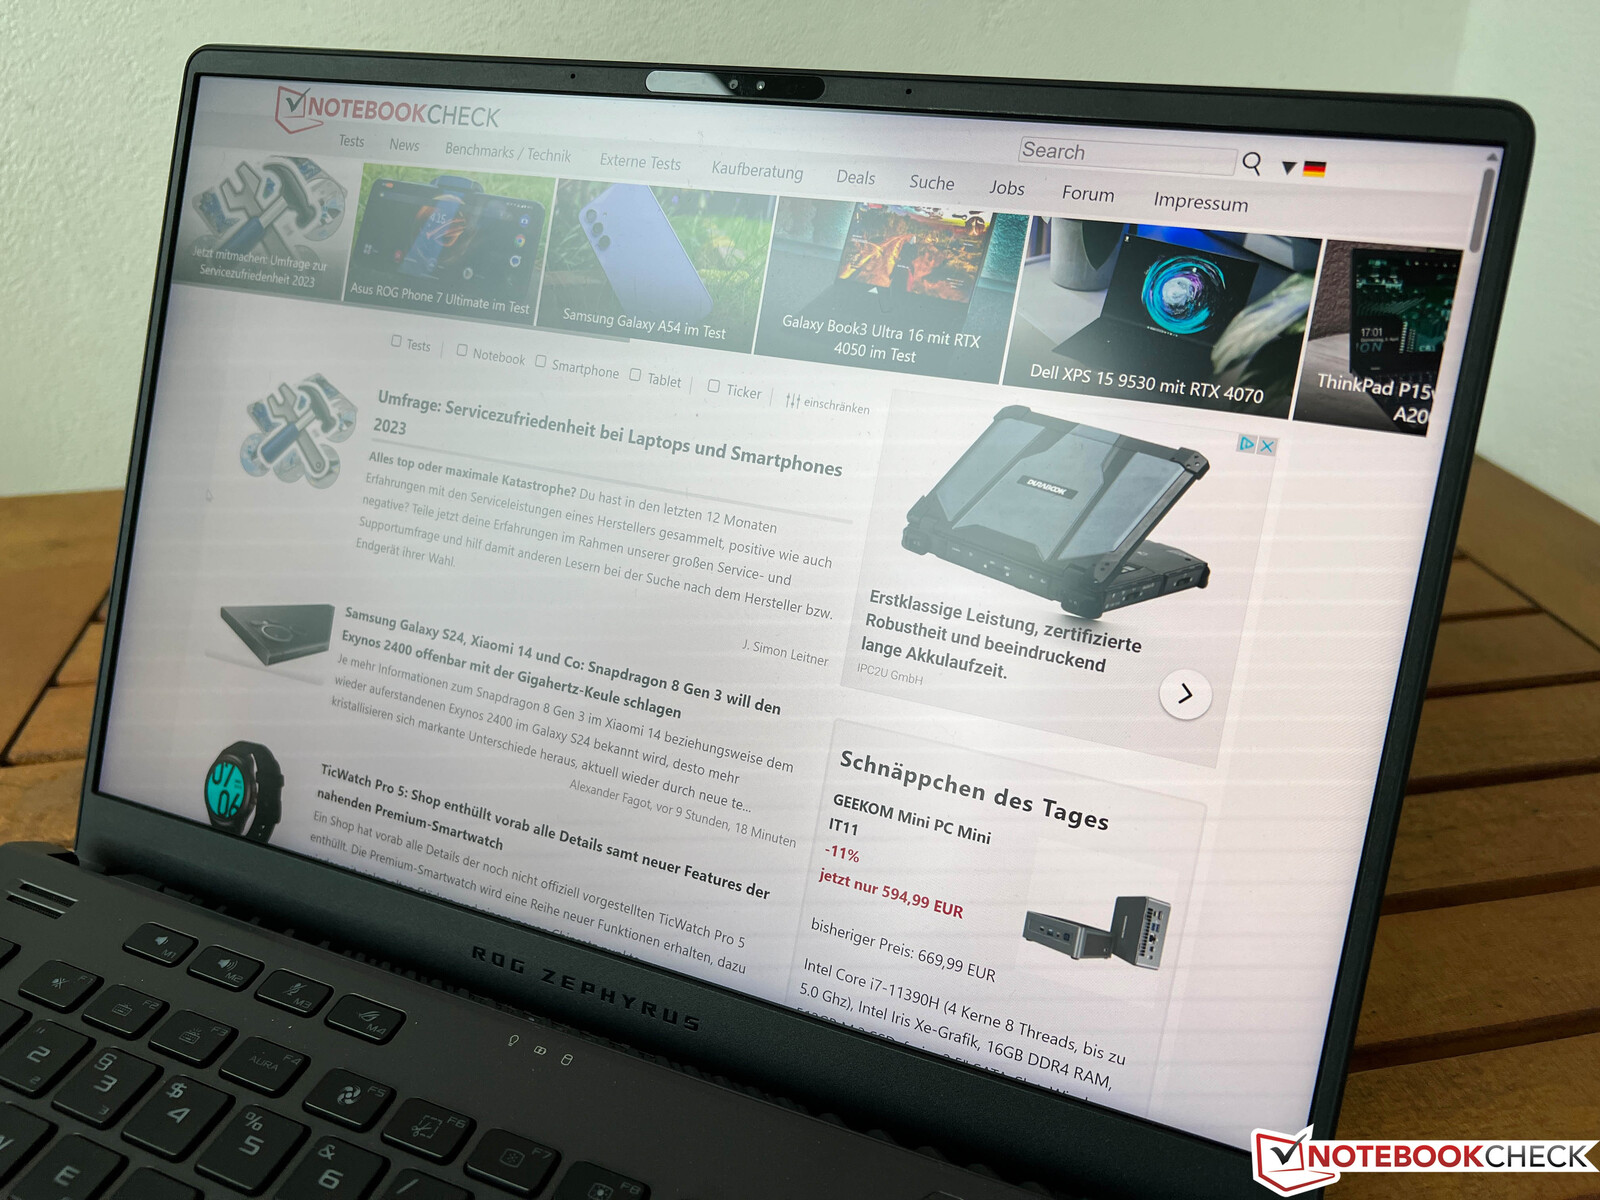
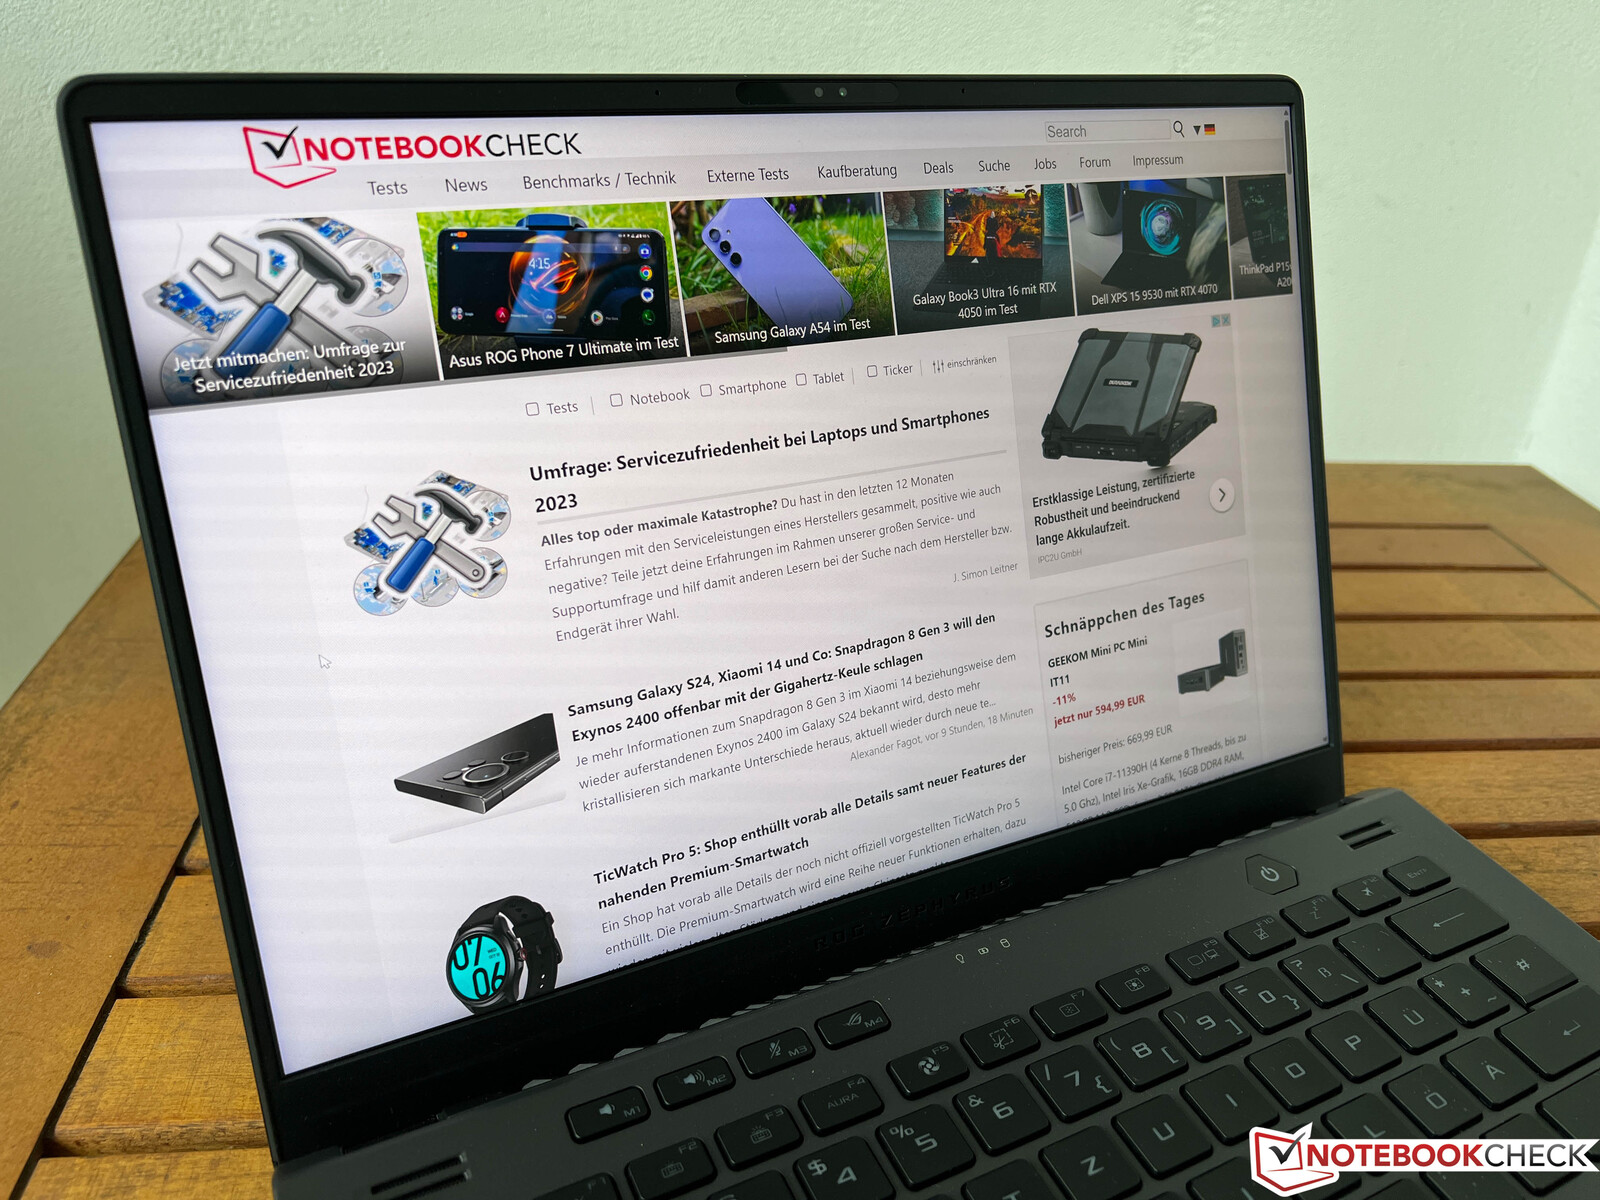
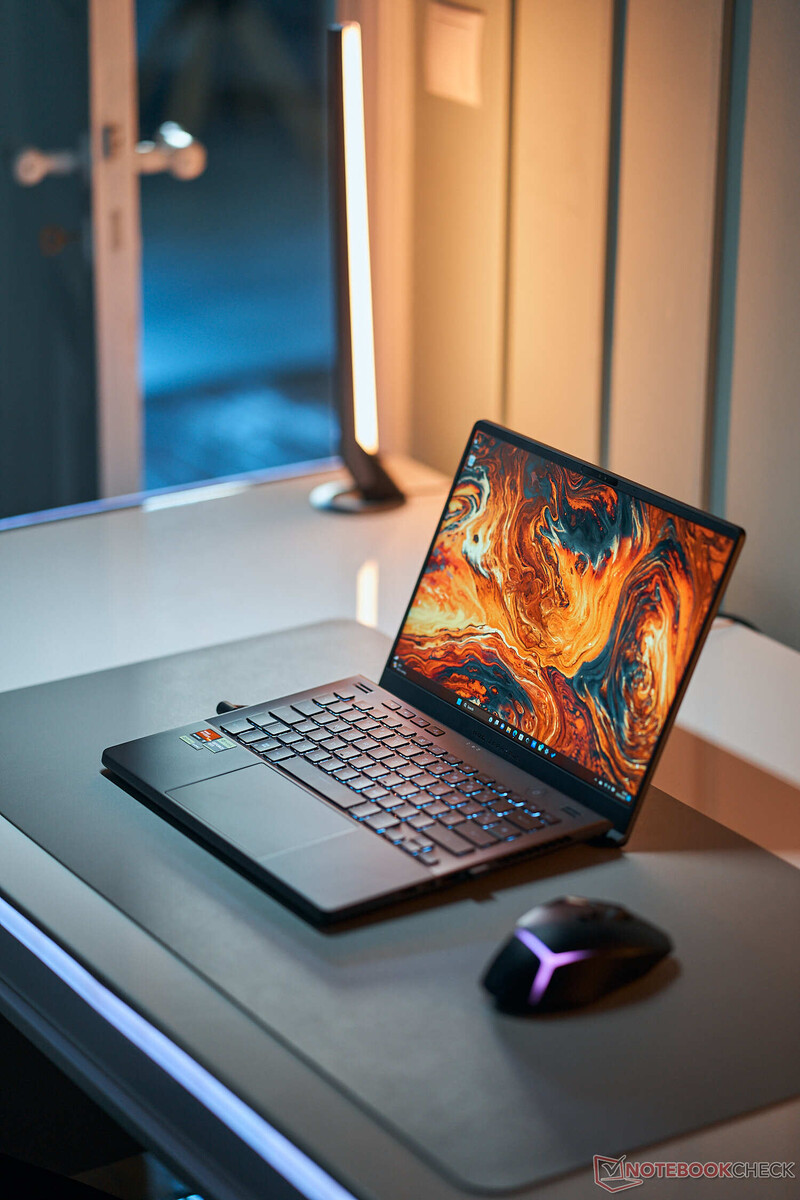
Asus did not change the chassis compared to the previous model. Last time we reviewed the white version including the AniME display on the lid, now we review the much more subtle version in grey. There are no striking design elements on this gaming laptop, either, there is just a subtle pattern on the lid. It should not be an issue to use this laptop in a professional environment without receiving too much attention.
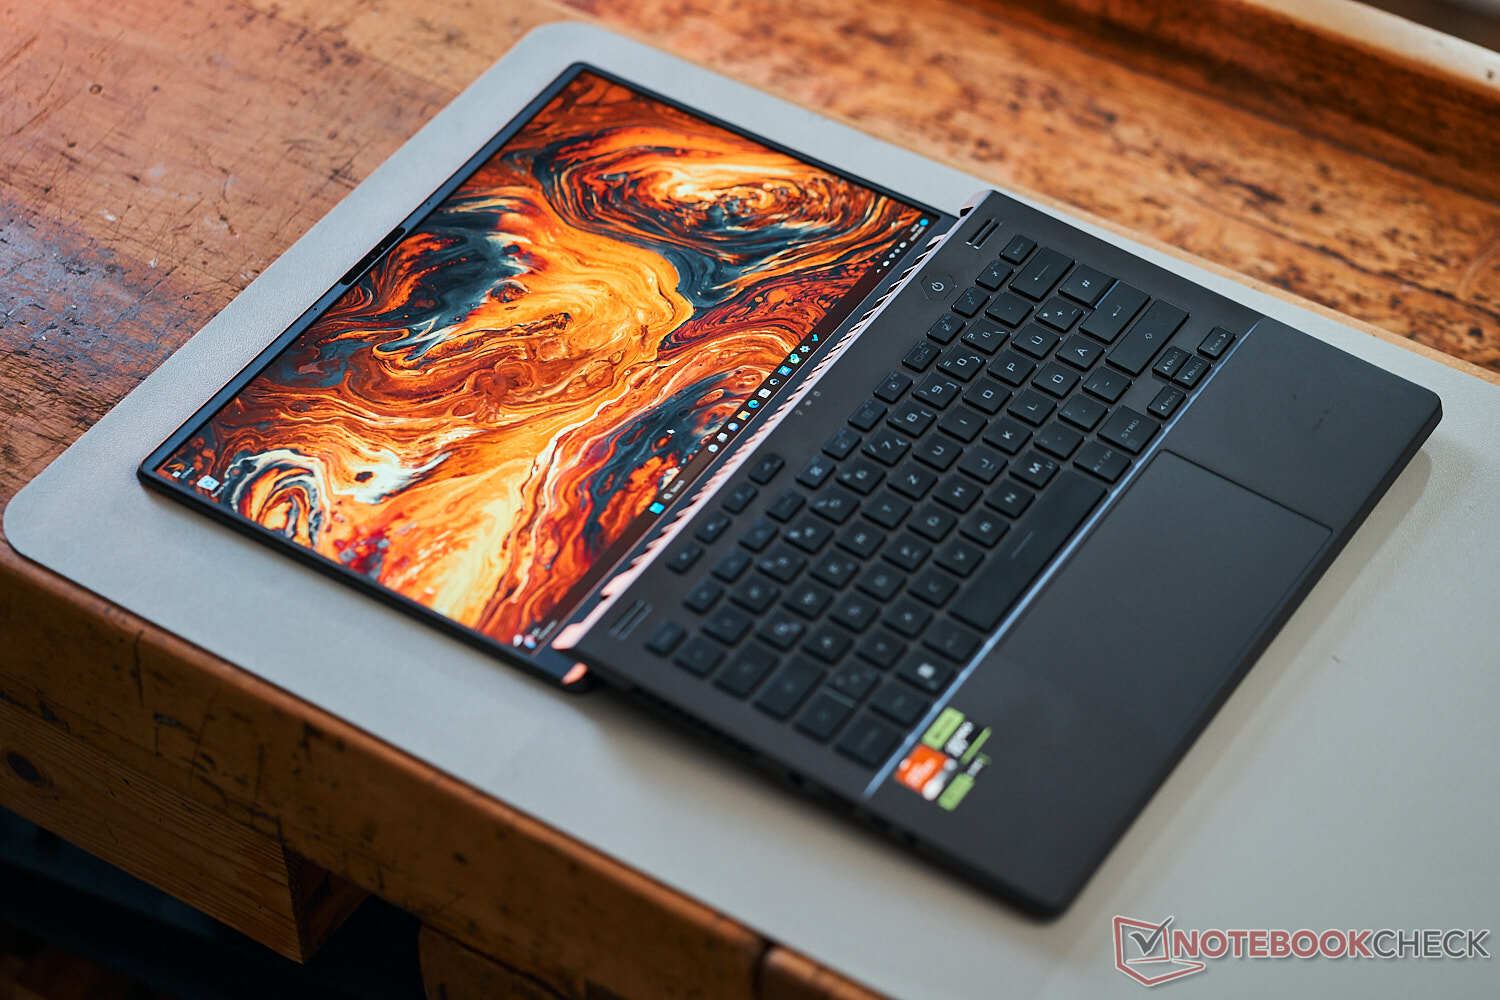
The base unit is still made of a magnesium alloy, even though the surfaces have a slight soft-touch finish. This no criticism though, and the device feels like a quality product and even fingerprints are not a big issue. The base unit is slightly raised when you open the lid, which improves thermals as well as ergonomics. The stability is really good, the keyboard does not flex and we could not twist the base unit. We also like the adjustment of the hinges, even though they cannot prevent a minor wobbling when you adjust the opening angle (up to 180 degrees). However, this should not be an issue in practice.
The lid is made of aluminum and slightly more flexible, but we could not provoke any creaking sounds, either. The bezels are very slim, especially at the sides, which results in a decent screen-to-body ratio of 81 %.
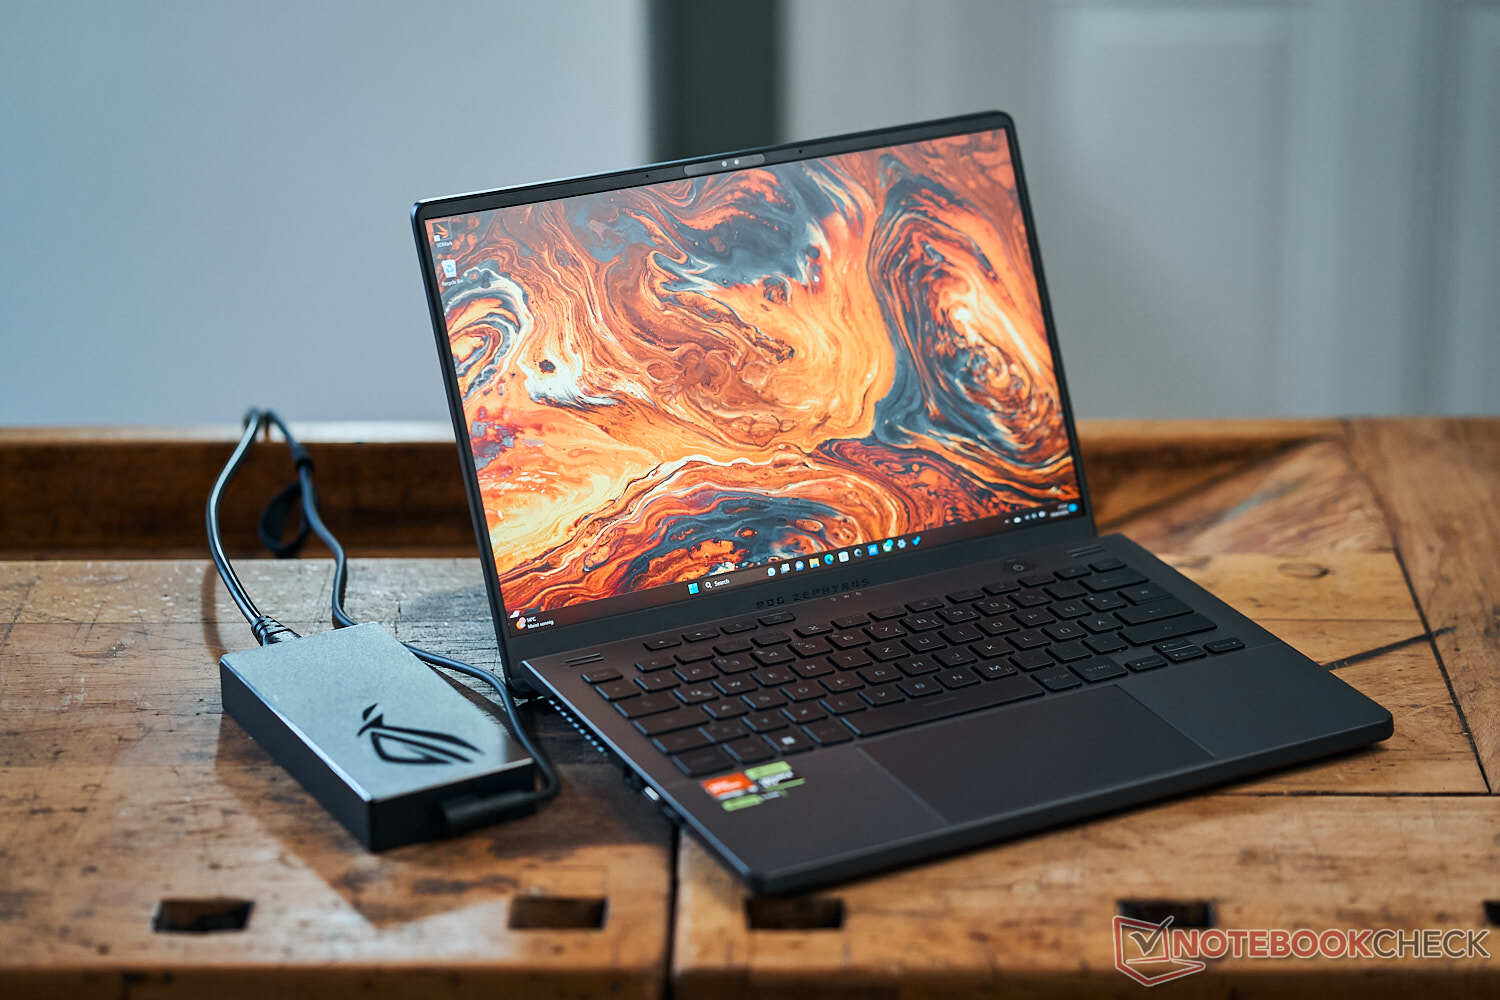
Tipping the scale at almost 1.7 kg, the new Zephyrus G14 is right in the middle of our comparison group, despite high-end components and the metal chassis. The Alienware x14 is by far the largest device in terms of footprint, but the other devices are very similar. However, the G14 is the thickest device at 20.5 mm. There are obviously much slimmer 14-inch laptops, but they are not nearly as powerful and the G14 is still a very mobile device. This is not really the case for the large 240W power adapter (727 grams), but you can also charge the device via USB-C on the go.
Connectivity - AMD Gamer with USB 4.0
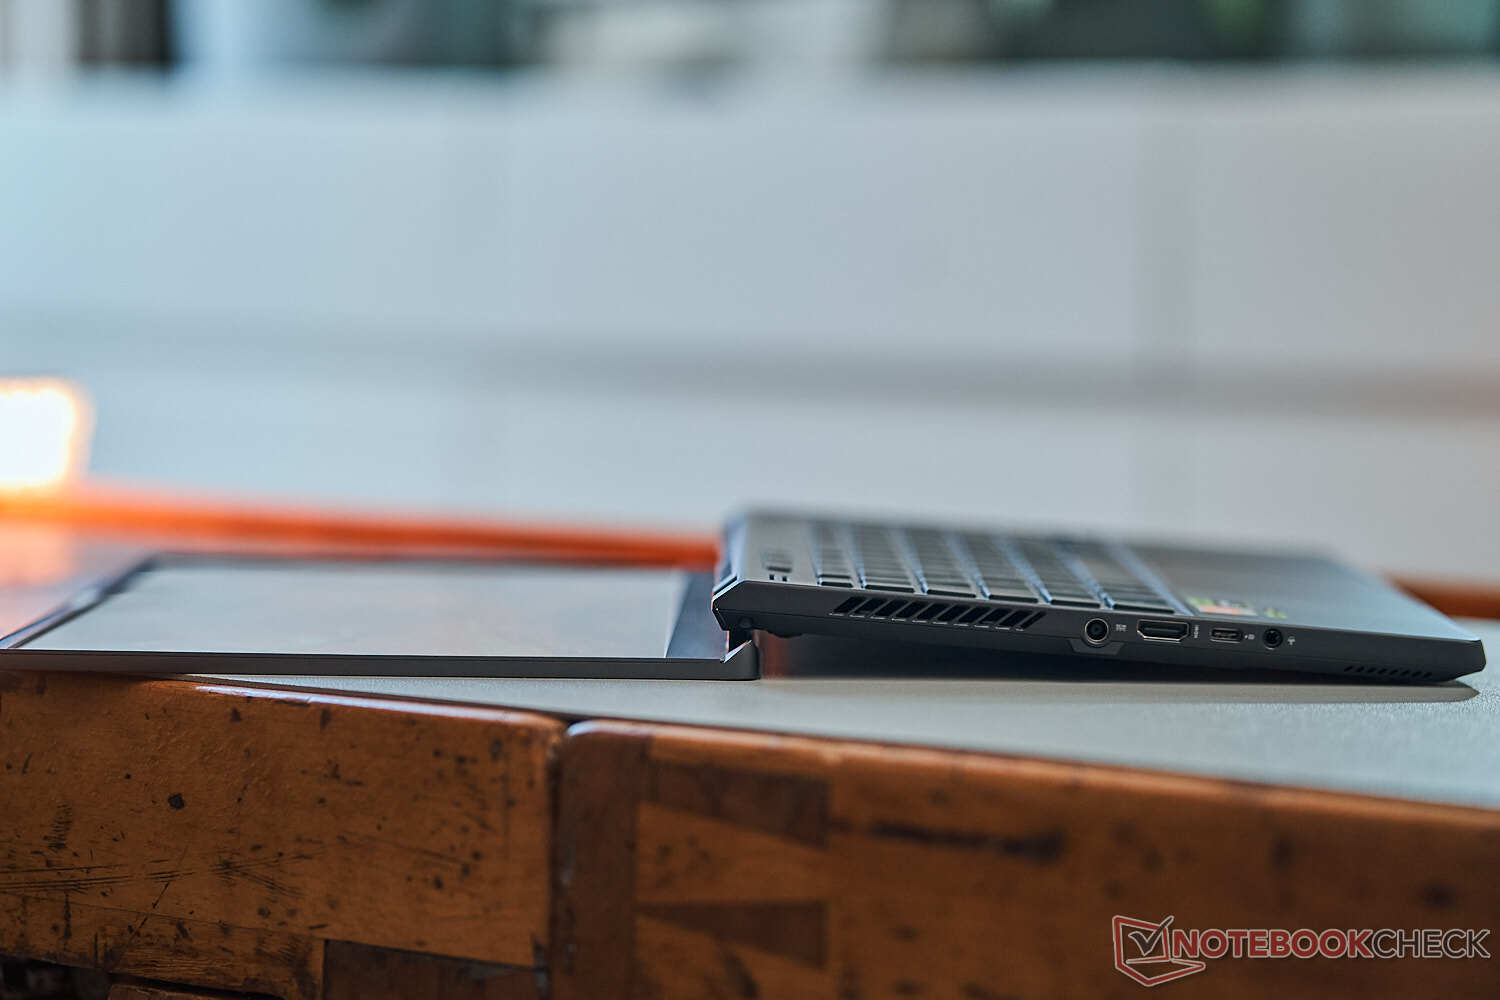
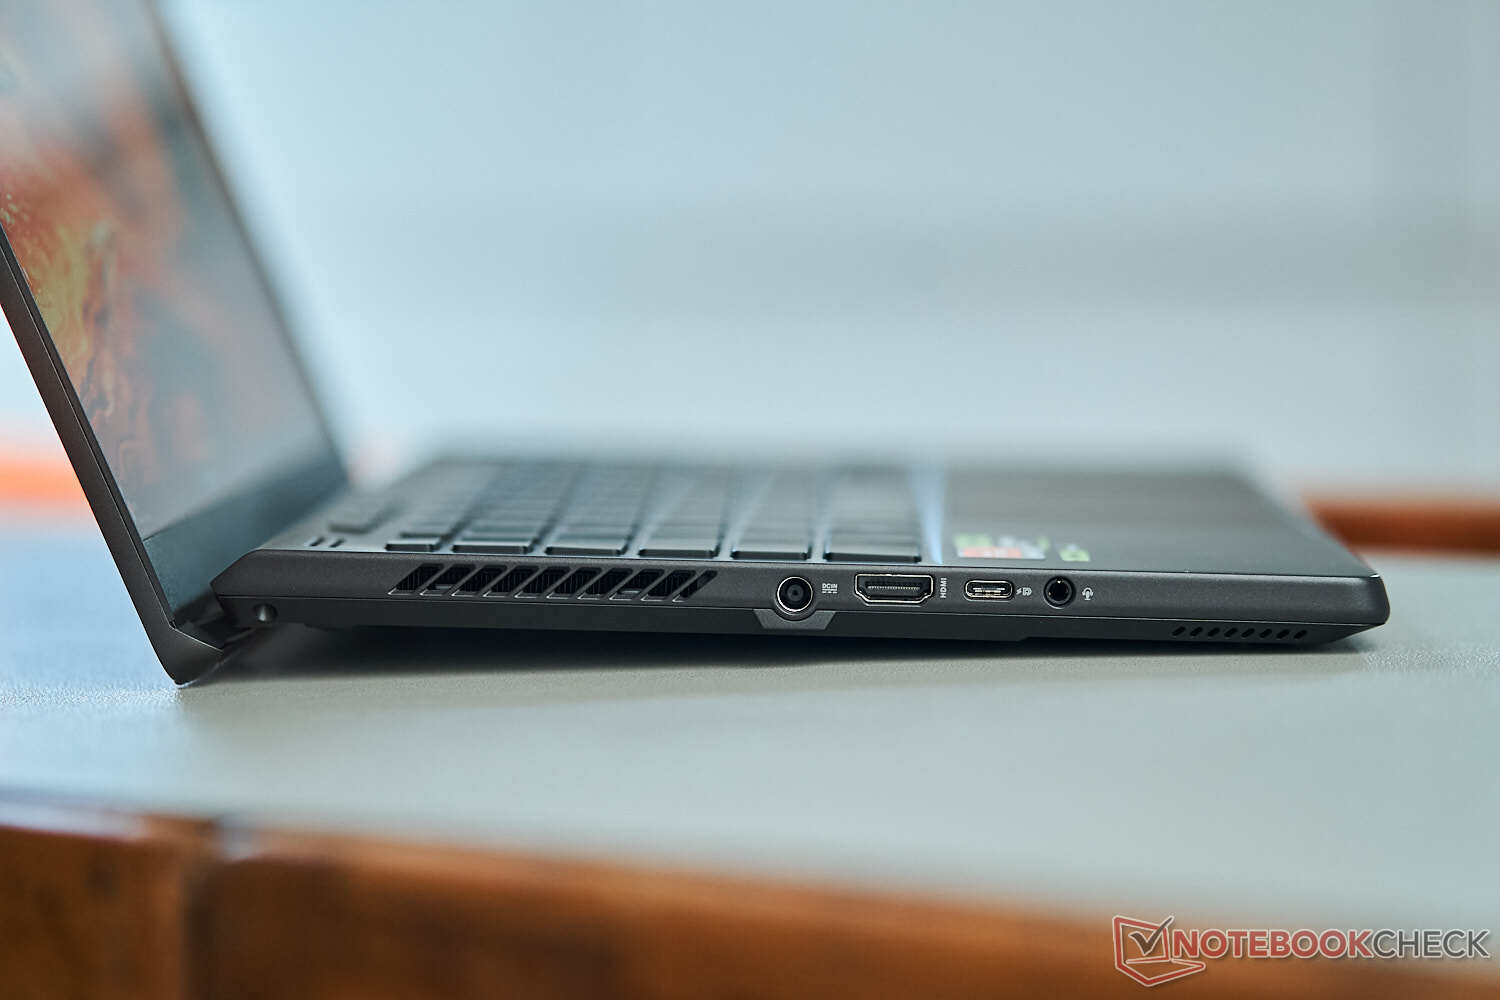
The port layout is identical to the predecessor, which means all the ports are still located at the front of the two sides. It can be rather crowded if you really use all the connectors. The rear area is completely reserved for the cooling and the fan exhausts.
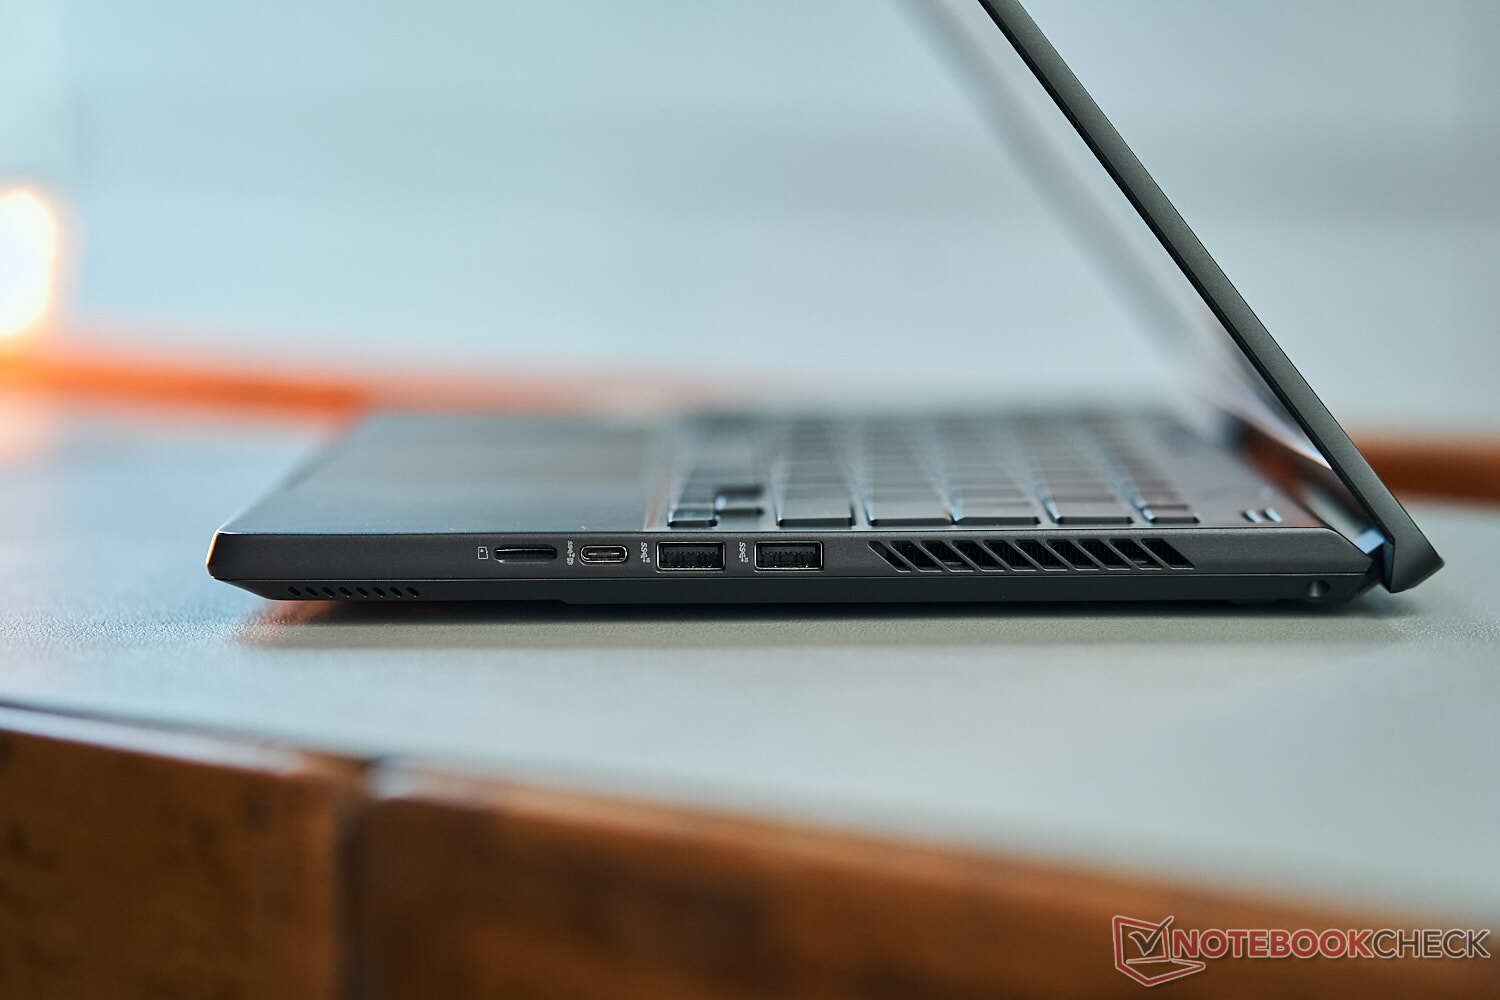
The USB-C port at the left side now supports the 4.0 standard including video output and power delivery. This port is attached to the iGPU, so you can use this output to use an external screen with the integrated GPU. If you use the USB-C port at the right side or the HDMI output, the graphics output will be handled by the Nvidia GPU, which will consume more energy in daily situations. We had no issues running a Thunderbolt dock (CalDigit TS4) and a 10 Gbps Ethernet adapter via USB 4.0.
SD Card Reader
The small microSD card reader (spring mechanism) is one of the fastest modules and we measured a maximum transfer rate of more than 260 MB/s with our reference card (Angelbird AV Pro V60) and still ~130 MB/s when we copied images from the card.
| SD Card Reader | |
| average JPG Copy Test (av. of 3 runs) | |
| Alienware x14 i7 RTX 3060 (Angelbird AV Pro V60) | |
| Apple MacBook Pro 14 2023 M2 Pro (AV Pro V60) | |
| Asus ROG Zephyrus G14 GA402RK (AV PRO microSD 128 GB V60) | |
| Asus ROG Zephyrus G14 GA402XY (Angelibrid AV Pro V60) | |
| Average of class Gaming (19 - 202, n=100, last 2 years) | |
| maximum AS SSD Seq Read Test (1GB) | |
| Asus ROG Zephyrus G14 GA402XY (Angelibrid AV Pro V60) | |
| Alienware x14 i7 RTX 3060 (Angelbird AV Pro V60) | |
| Apple MacBook Pro 14 2023 M2 Pro (AV Pro V60) | |
| Asus ROG Zephyrus G14 GA402RK (AV PRO microSD 128 GB V60) | |
| Average of class Gaming (25.8 - 269, n=94, last 2 years) | |
Communication
Asus uses a modern Wi-Fi module from RealTek (MT9722), which supports the latest Wi-Fi 6E standard as well as Bluetooth 5.2. However, we could not connect the test model with the corresponding 6 GHz network from our reference router (Asus), but the transfer rates in the 5 GHz network (Wi-Fi 6) are also very good and stable. We did not notice any connectivity issues during our review period.
Webcam
Asus upgraded the camera and now uses a 1080p module including IR camera for facial recognition in combination with Windows Hello. The webcam is better compared to the previous model and the overall quality is okay, but we have already seen better modules this year. We included a sample video in our video review, so you can bet a better impression of the quality.


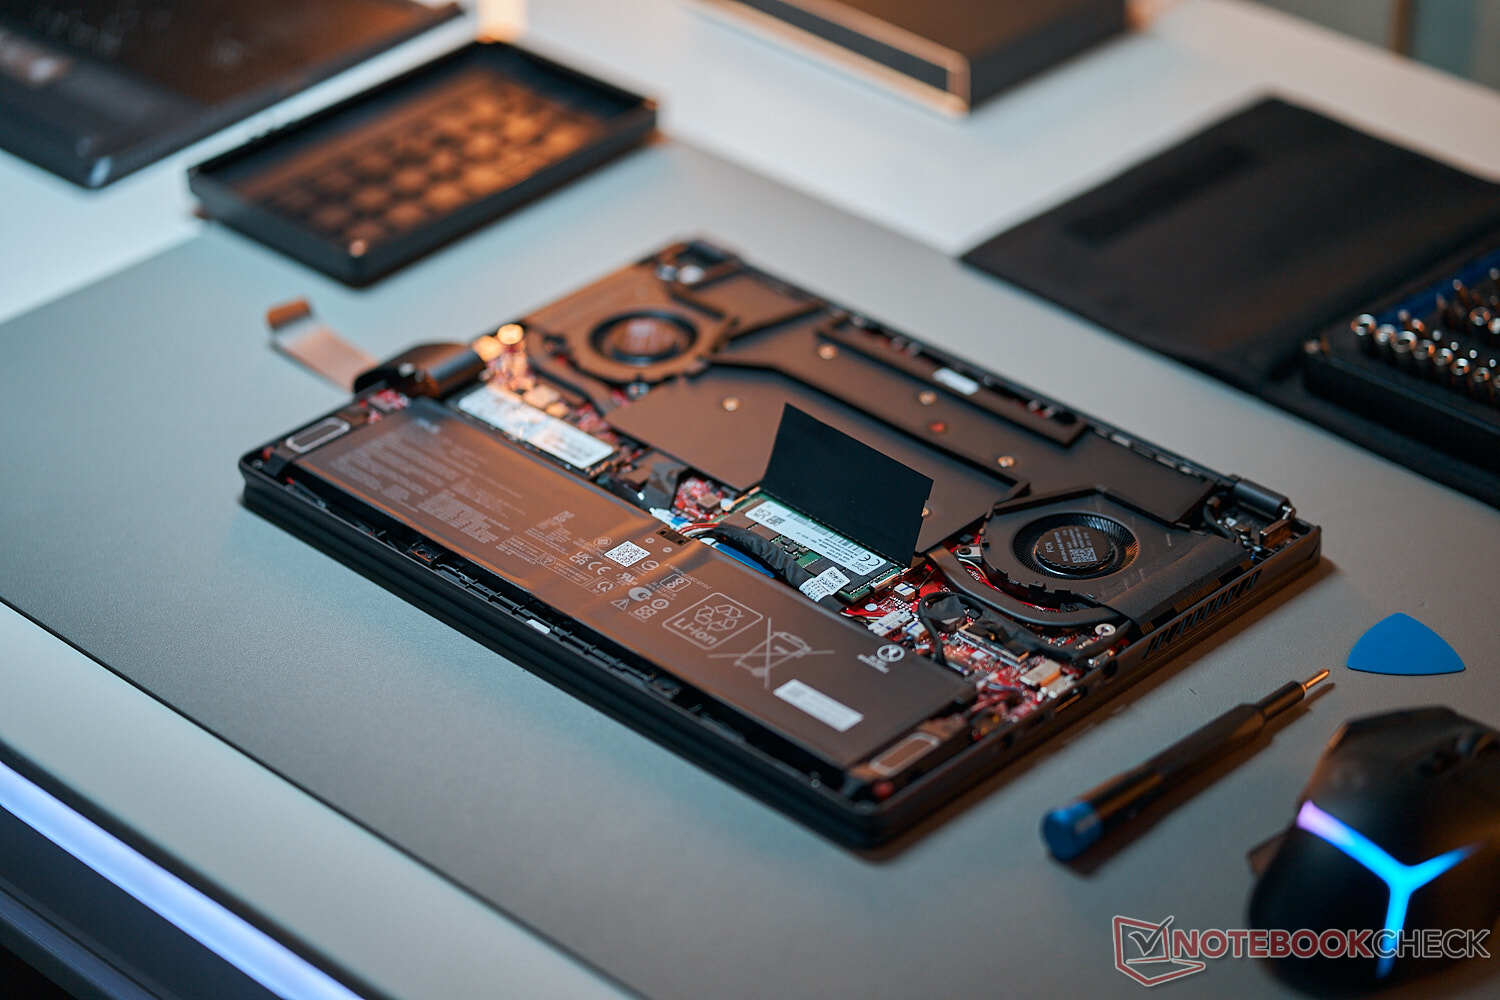
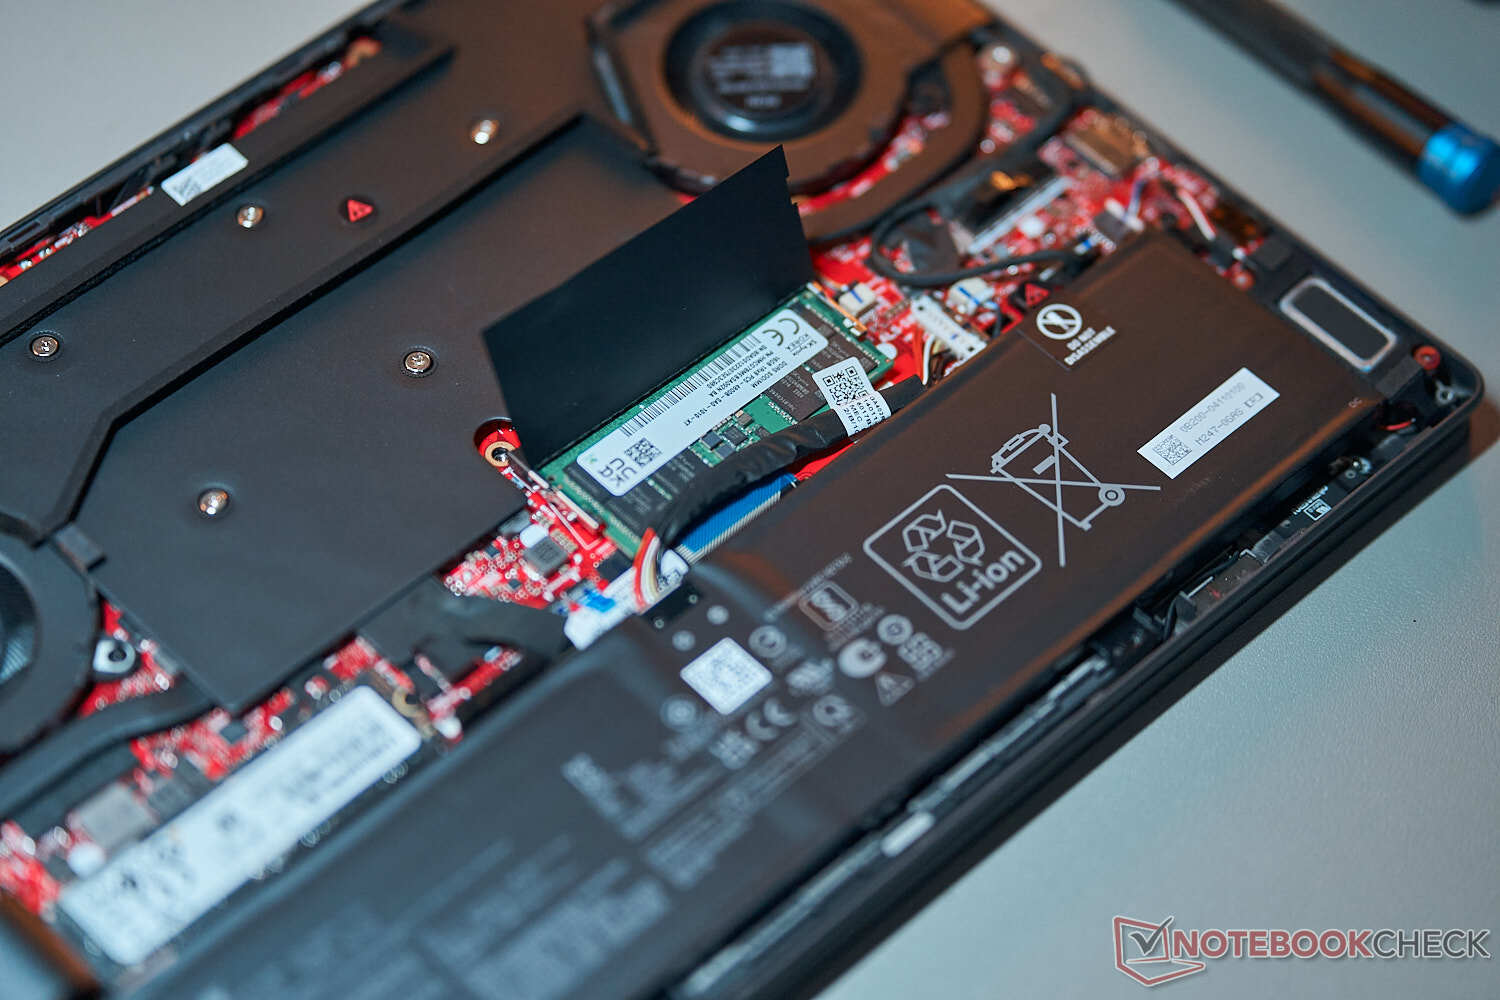
Maintenance
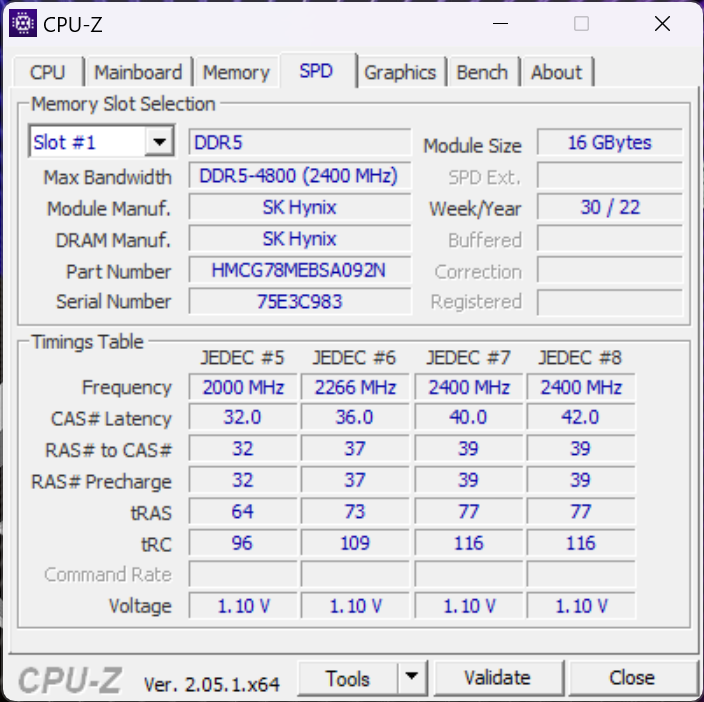
The bottom panel is once again secured by 11 small Philips screws, but some of them are hidden underneath small rubberized covers. Once inside you will see the large vapor chamber with the two fans as well as the battery. You can replace the SSD and there is one SO-DIMM slot in addition to 16 GB RAM onboard. This means you can use up to 48 GB RAM with a 32 GB module.
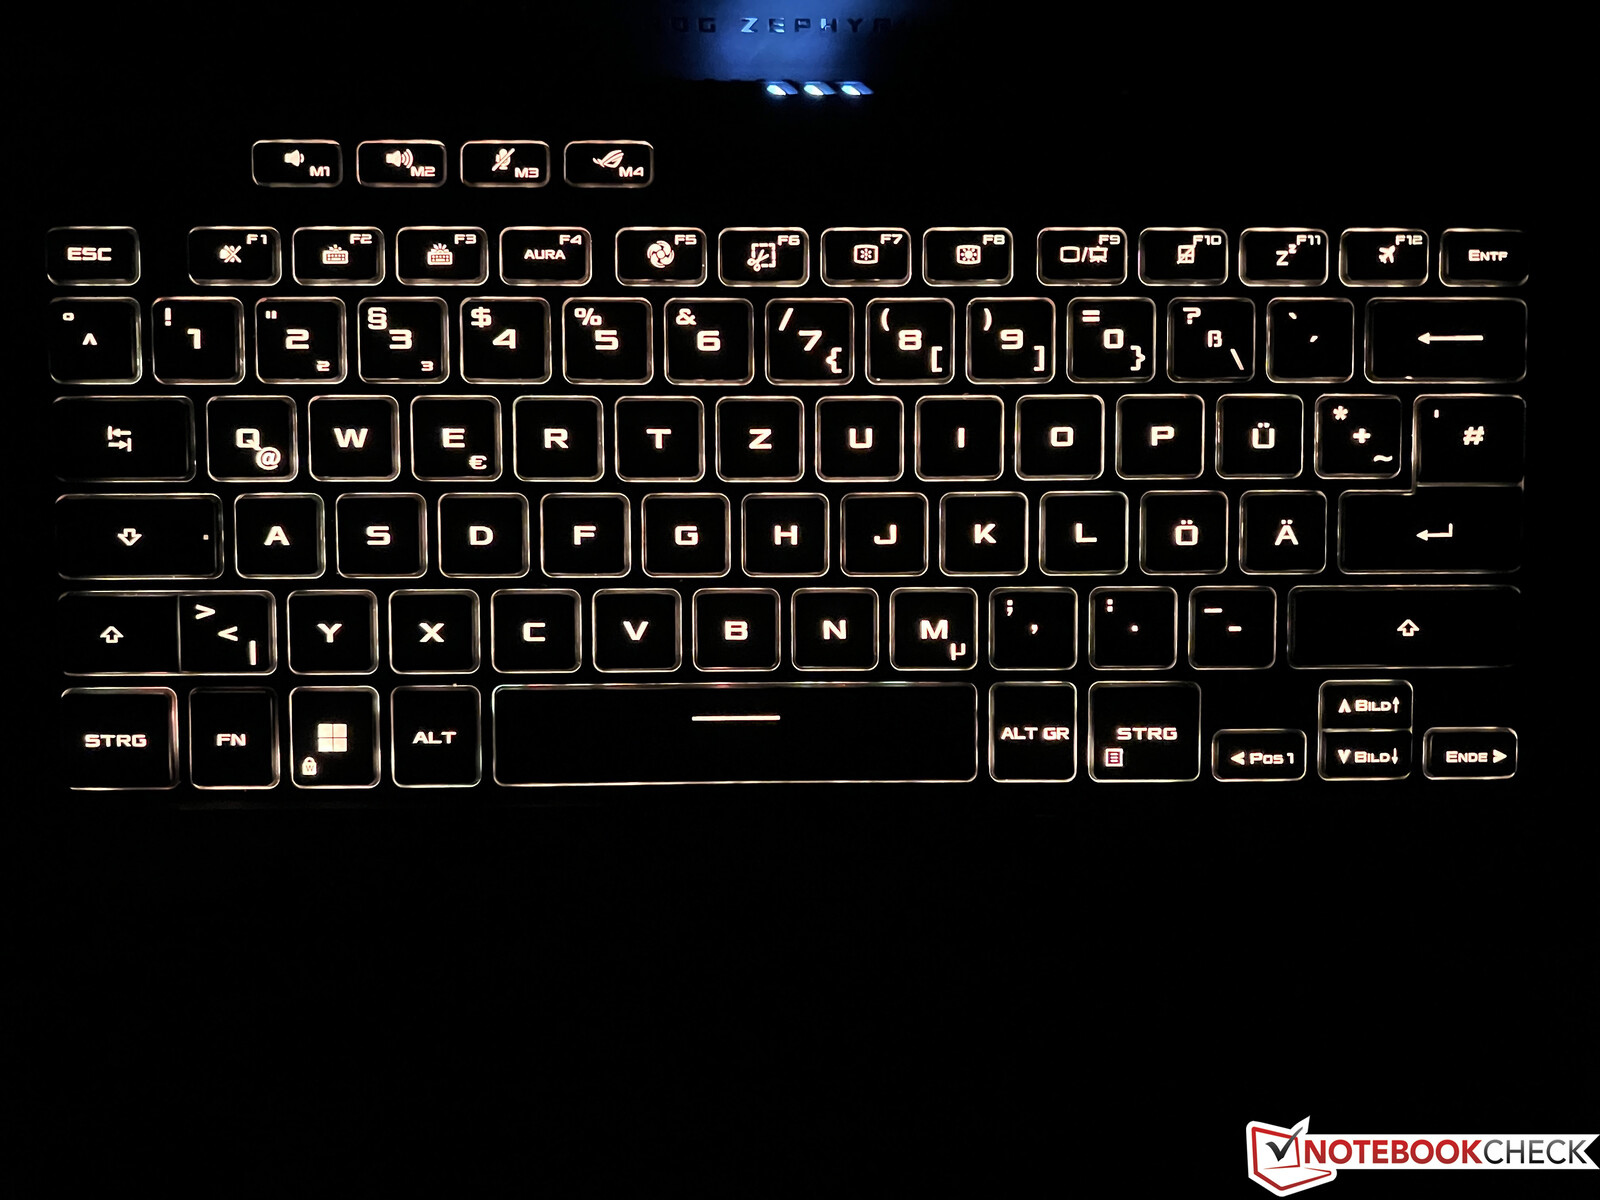
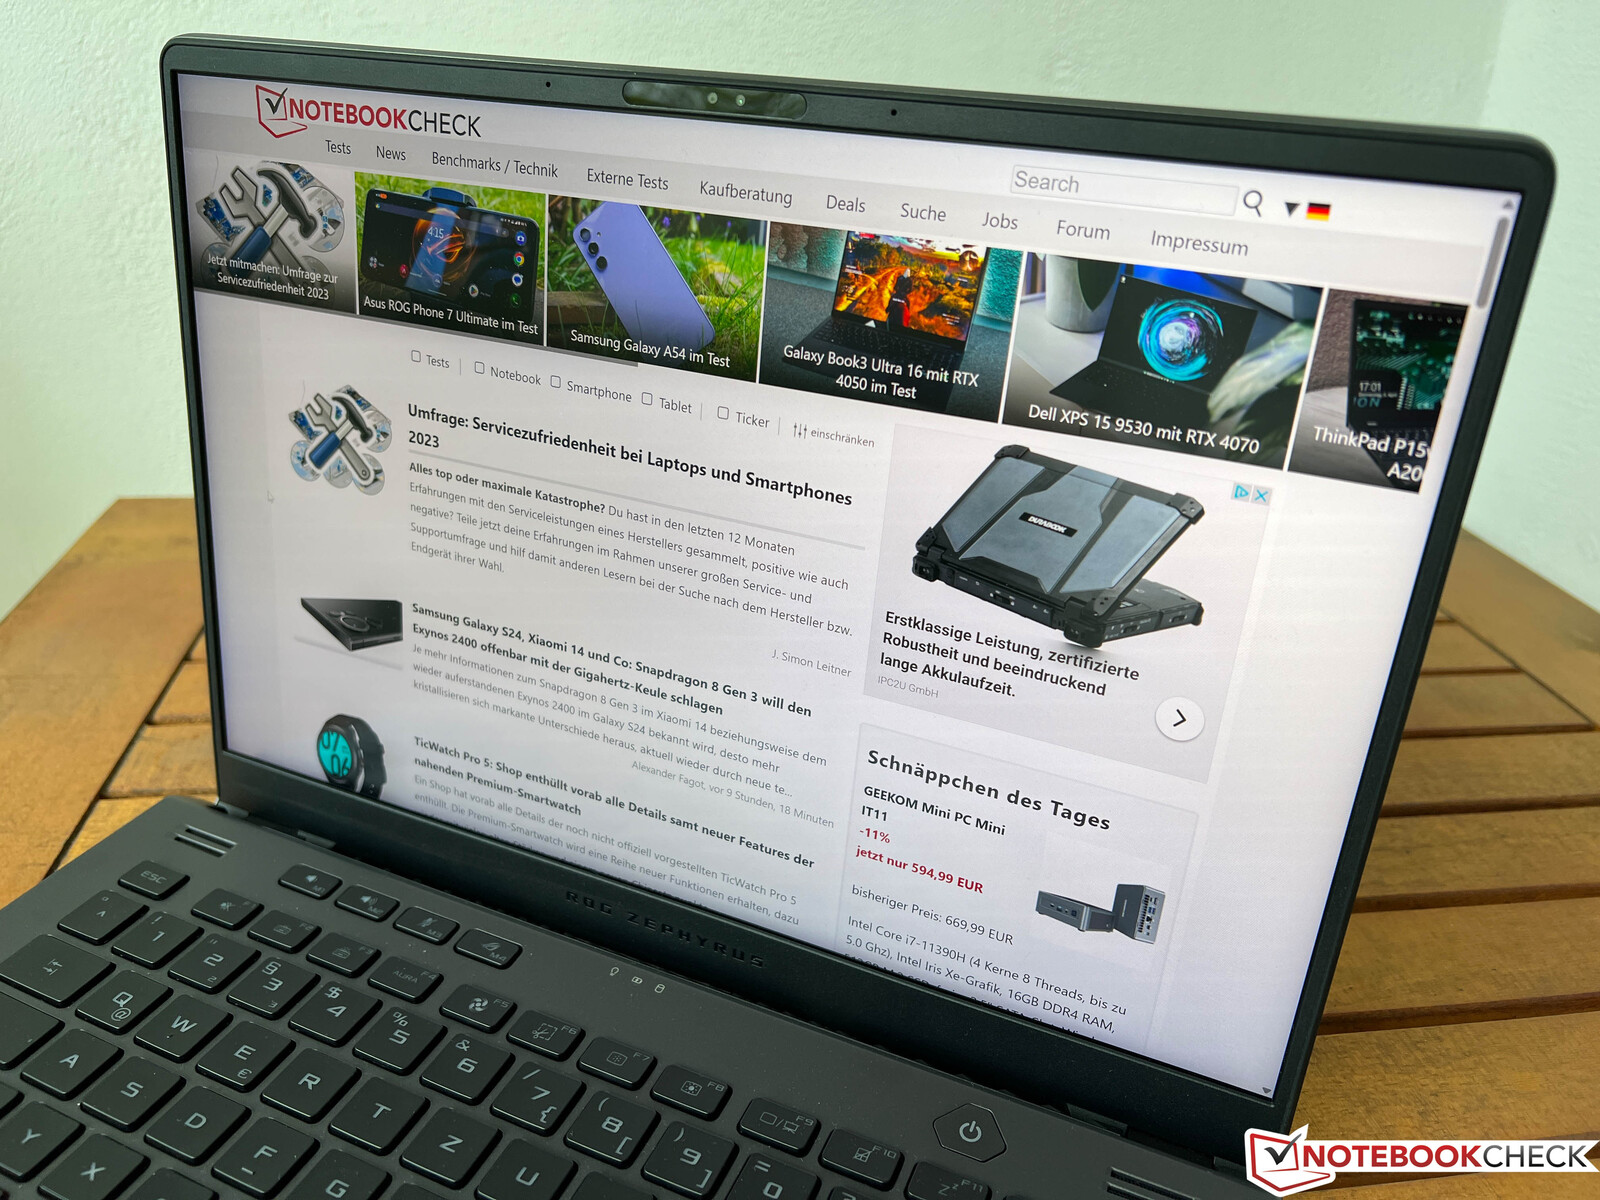
Input Devices - ROG 14 with Aura-Sync
The keyboard offers 1.7 mm travel and provides a very firm and precise feedback, so it is no problem to type longer texts on the G14. The keyboard illumination can be customized via software with multiple colors, but only in one zone. It is also possible to synchronize the illumination with other devices via Aura Sync.
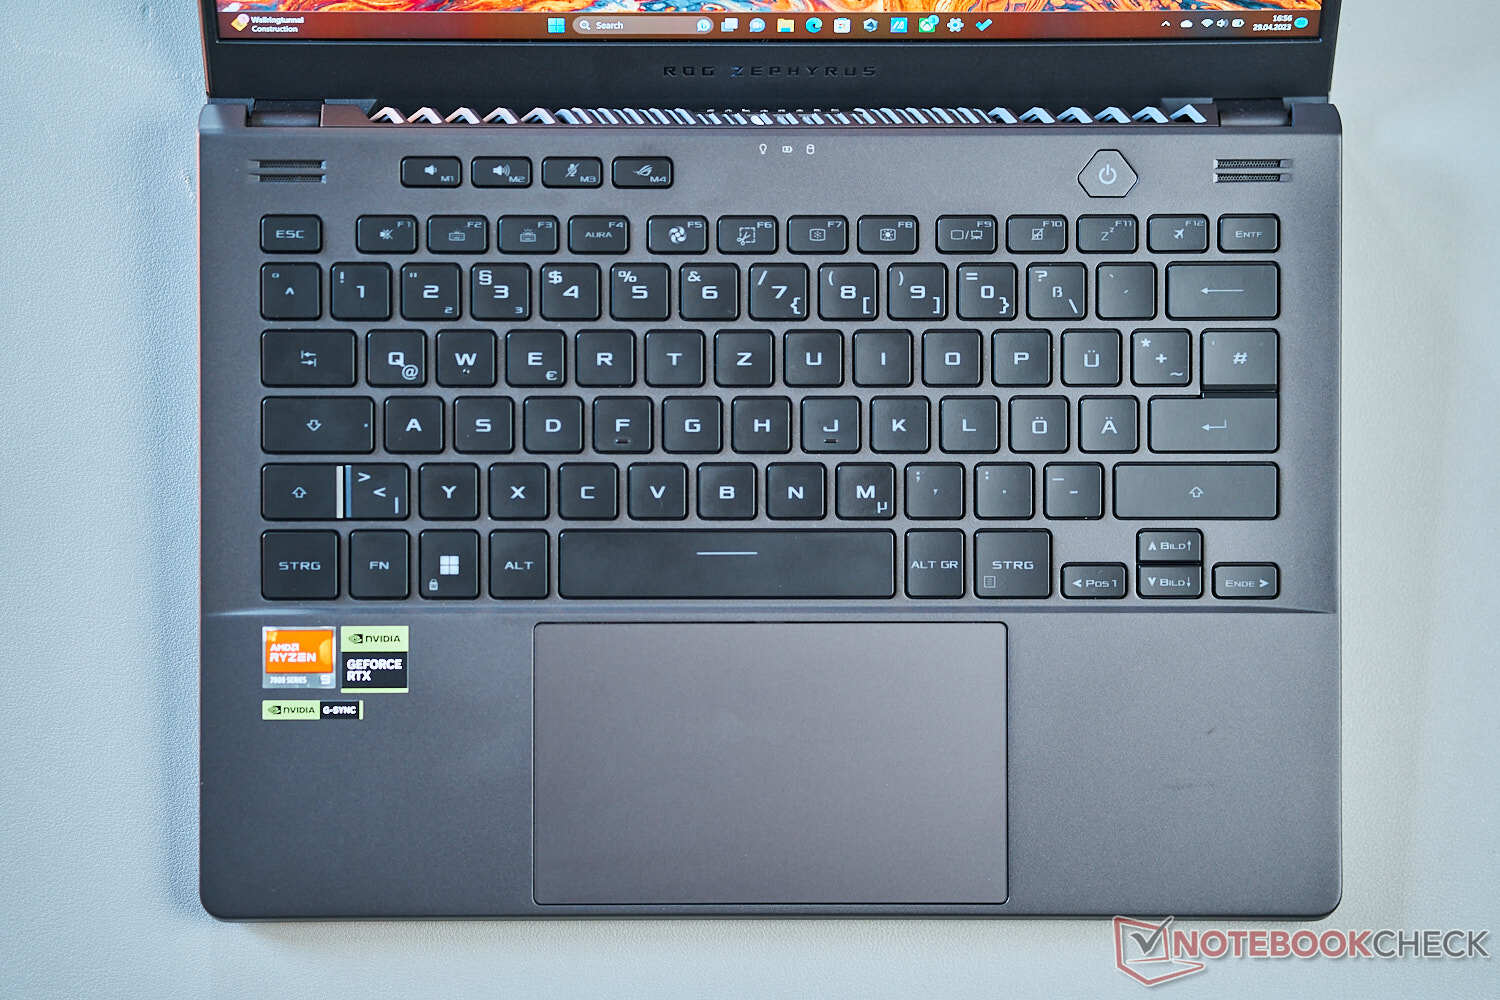
The glass touchpad (12.8 x 7.6 cm) offers good gliding capabilities and standard cursor movements as well as gestures with up to four fingers are no problem. The lower half of the pad can be pushed down, which results in firm feedback and clicking sound, even though it could be a bit quieter.
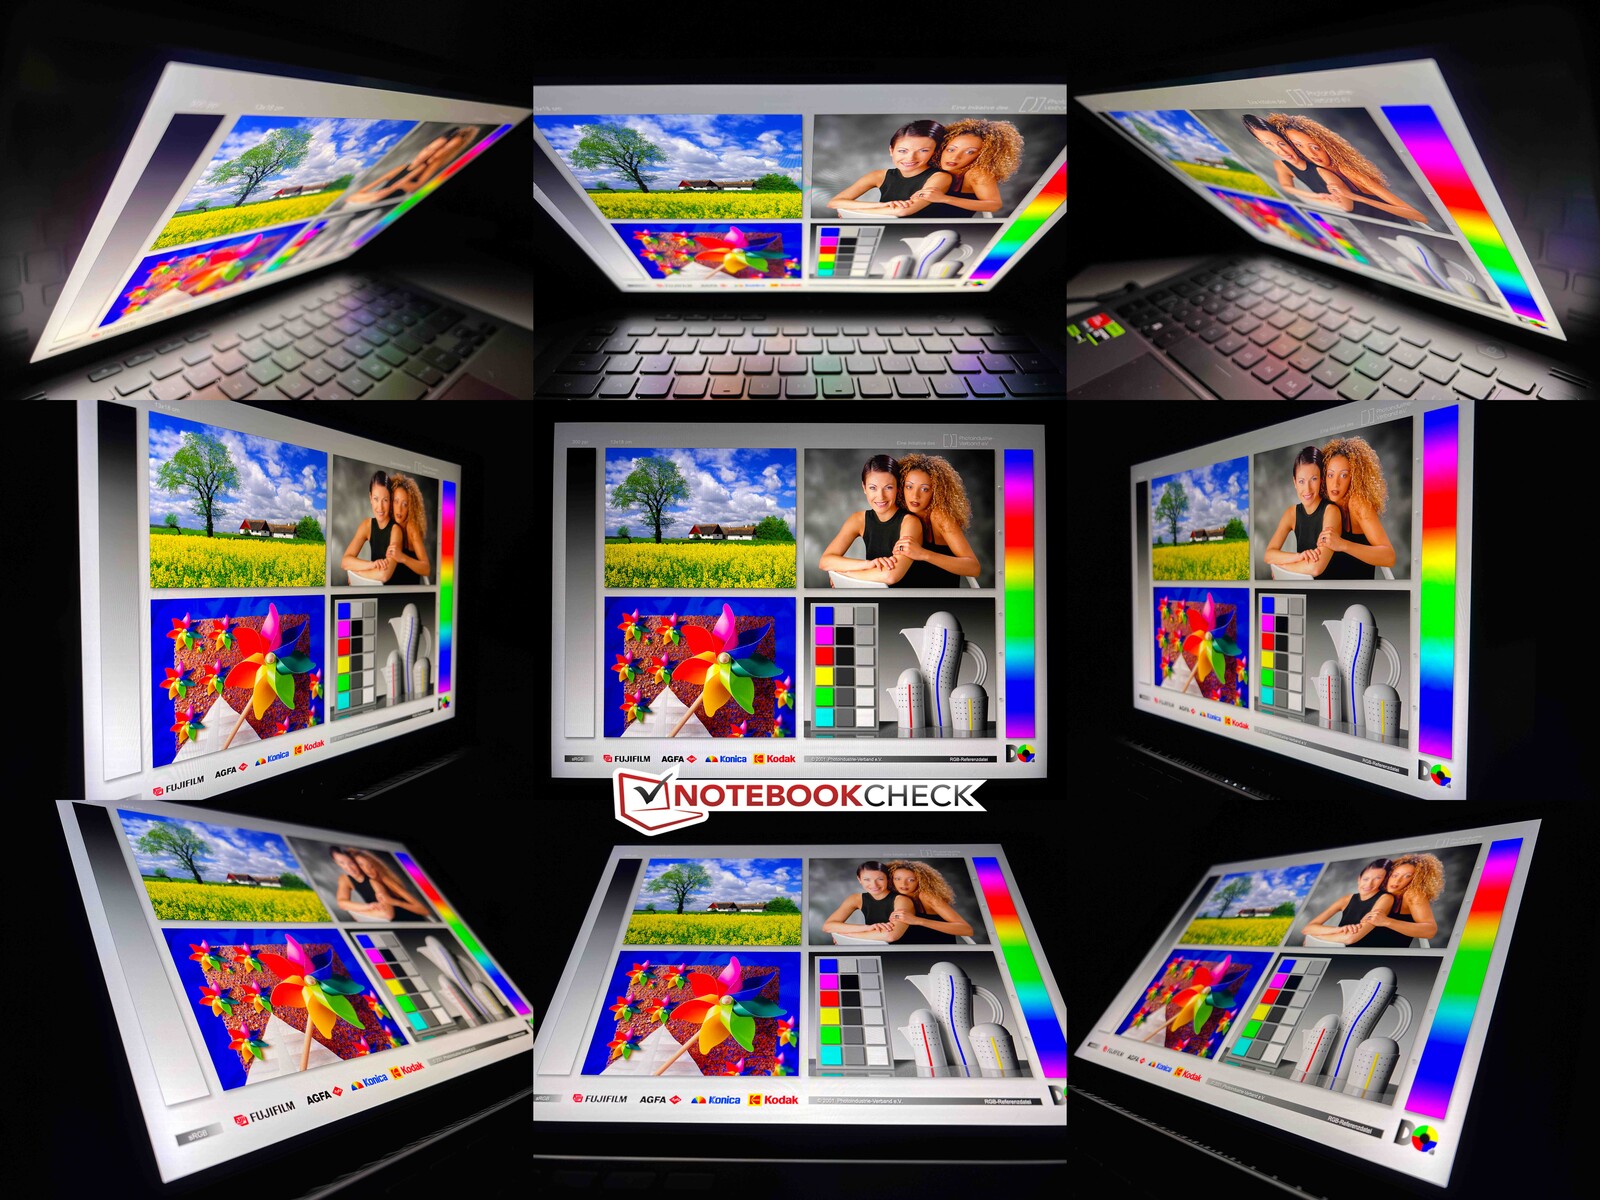
Display - Mini-LED with 165 Hz
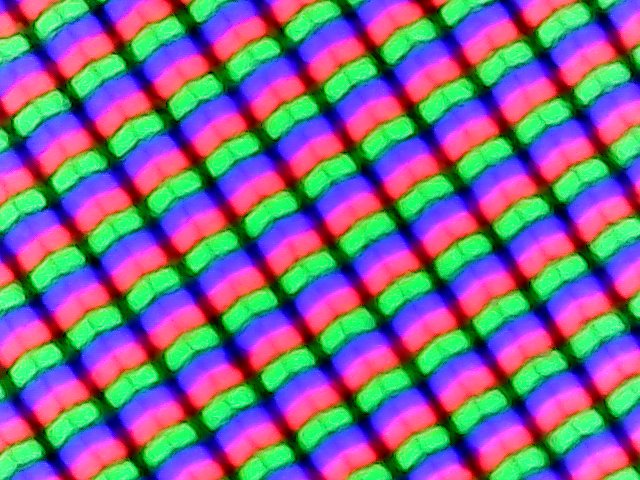
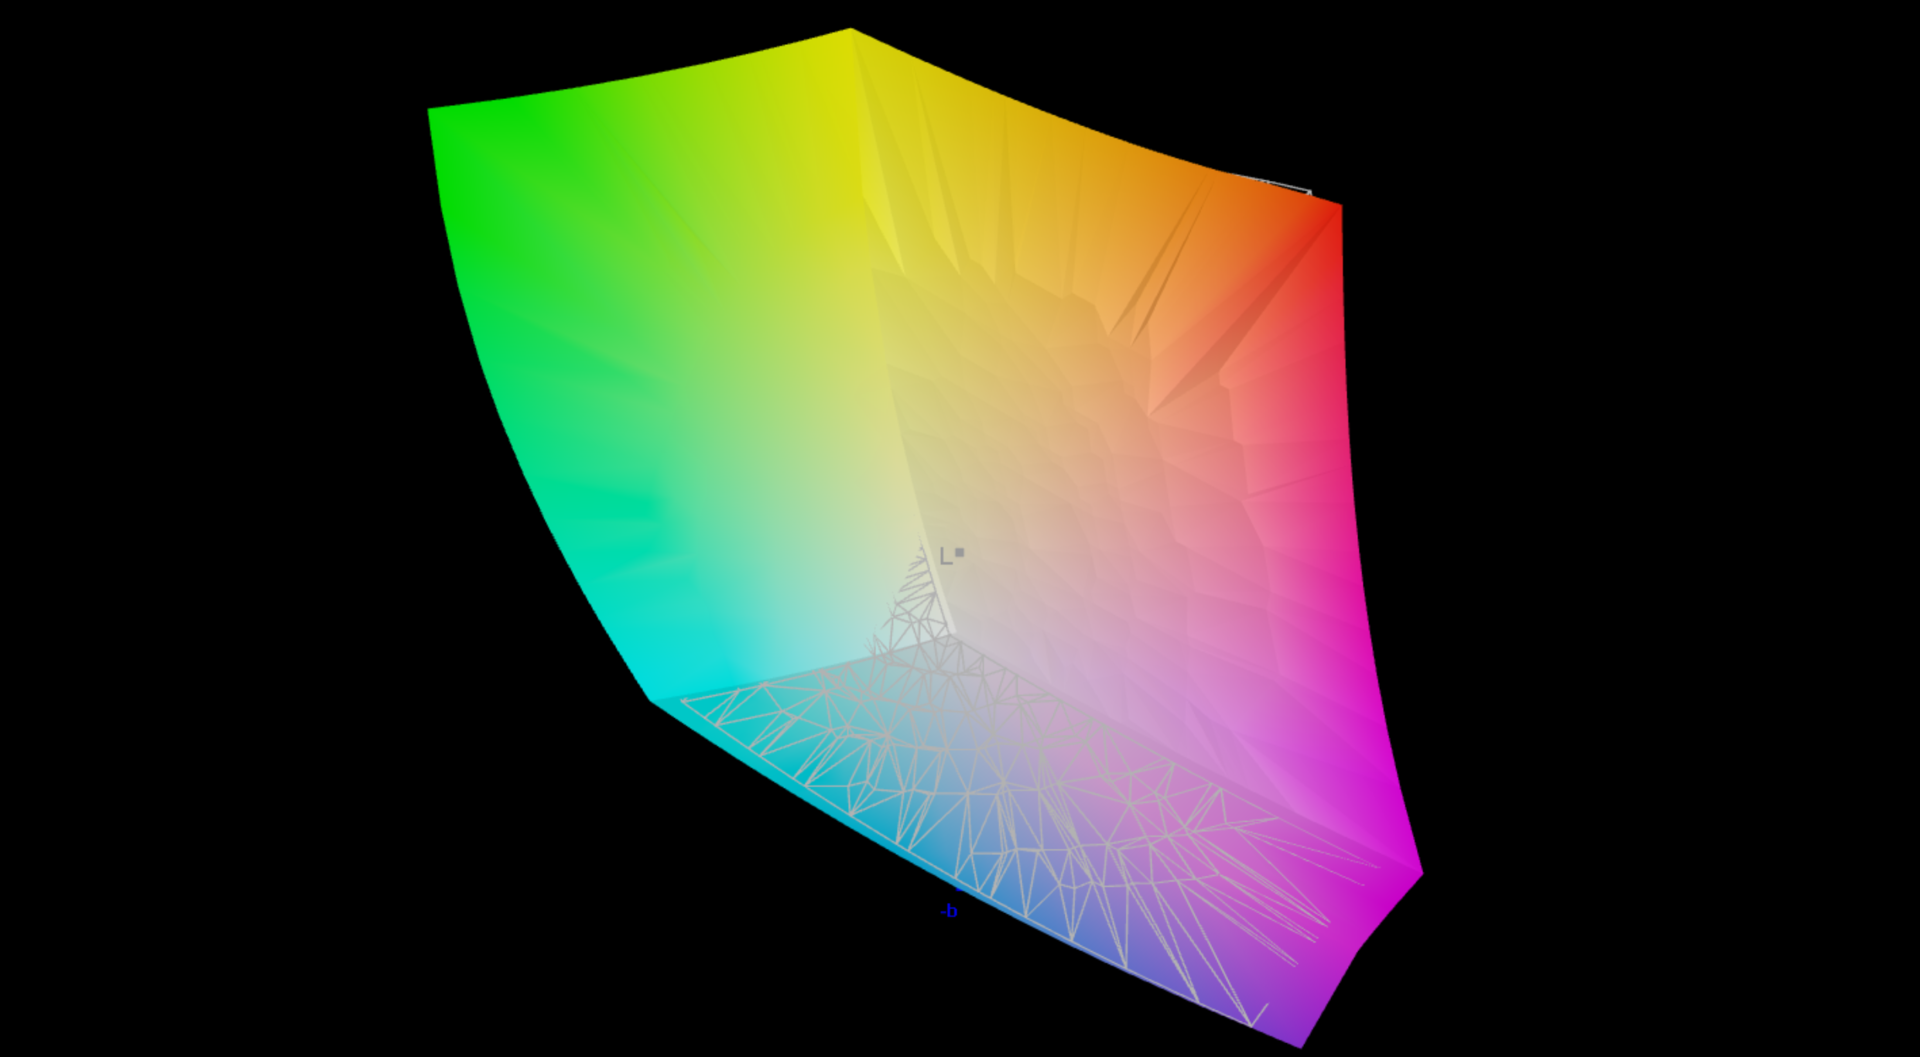
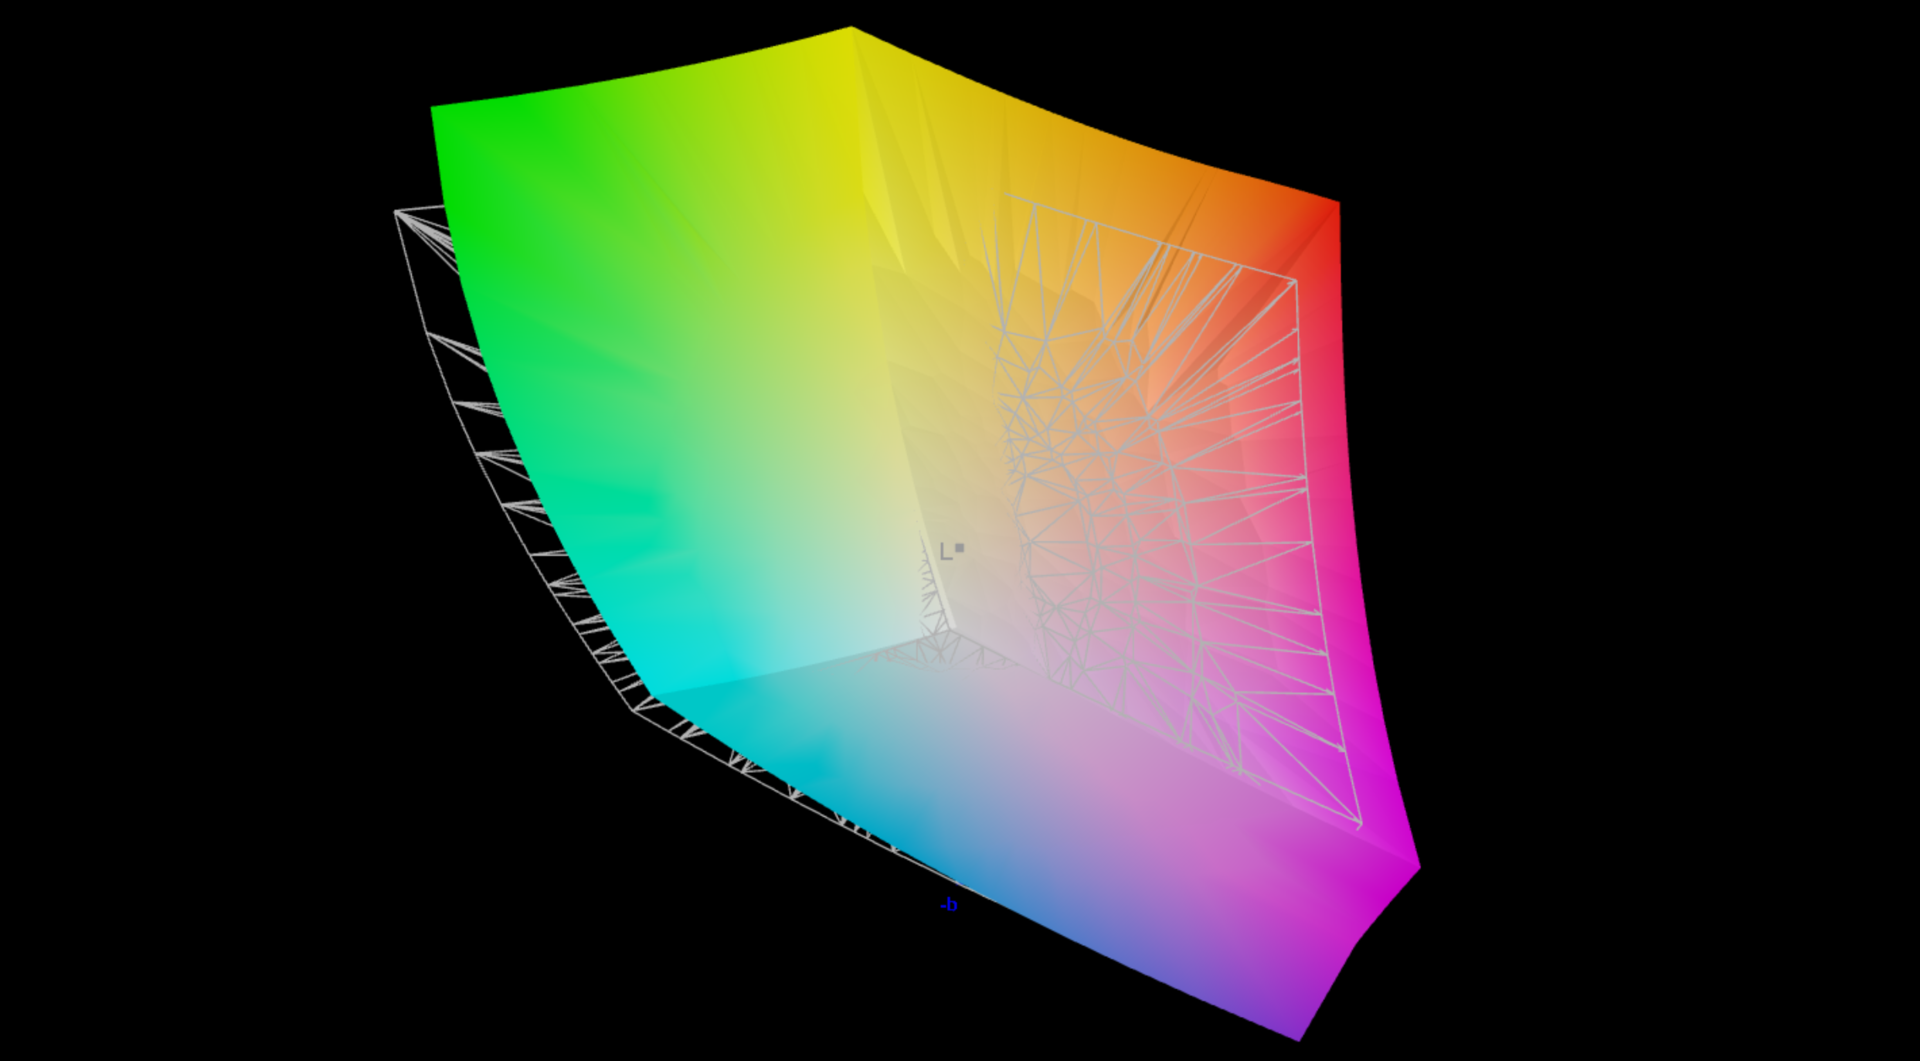
Asus ships the Zen4 models with 14-inch IPS or Mini-LED panels with the QHD+ resolution (2560 x 1600 pixels, 16:10). The spec sheet also lists a 1080p IPS panel, but we could not find any corresponding SKUs yet. All models with the RTX 4070 Laptop or better are shipped with the 165 Hz Mini-LED panel. The subjective picture impression is excellent, contents are razor-sharp and not grainy, colors are rich and movements are very smooth thanks to the high refresh rate.
The manufacturer advertises a brightness of 500 nits (600 nits peak for HDR), but our measurements show a higher average brightness of ~560 nits. In combination with the low black value (0), the contrast ratio is extremely high similar to OLED panels. This contrast ratio also has a big effect on the subjective picture quality. Mini-LED panels do not have problems with backlight bleeding, but there can be clouding (halos) due to the different dimming zones when bright objects move around on a dark background. This issue can be provoked, but it is usually not visible in everyday situations. Asus also uses the so-called Nebula HDR engine, which is supposed to reduce clouding.
| |||||||||||||||||||||||||
Brightness Distribution: 91 %
Center on Battery: 535 cd/m²
Contrast: ∞:1 (Black: 0 cd/m²)
ΔE Color 1 | 0.5-29.43 Ø5
ΔE Greyscale 1.8 | 0.57-98 Ø5.3
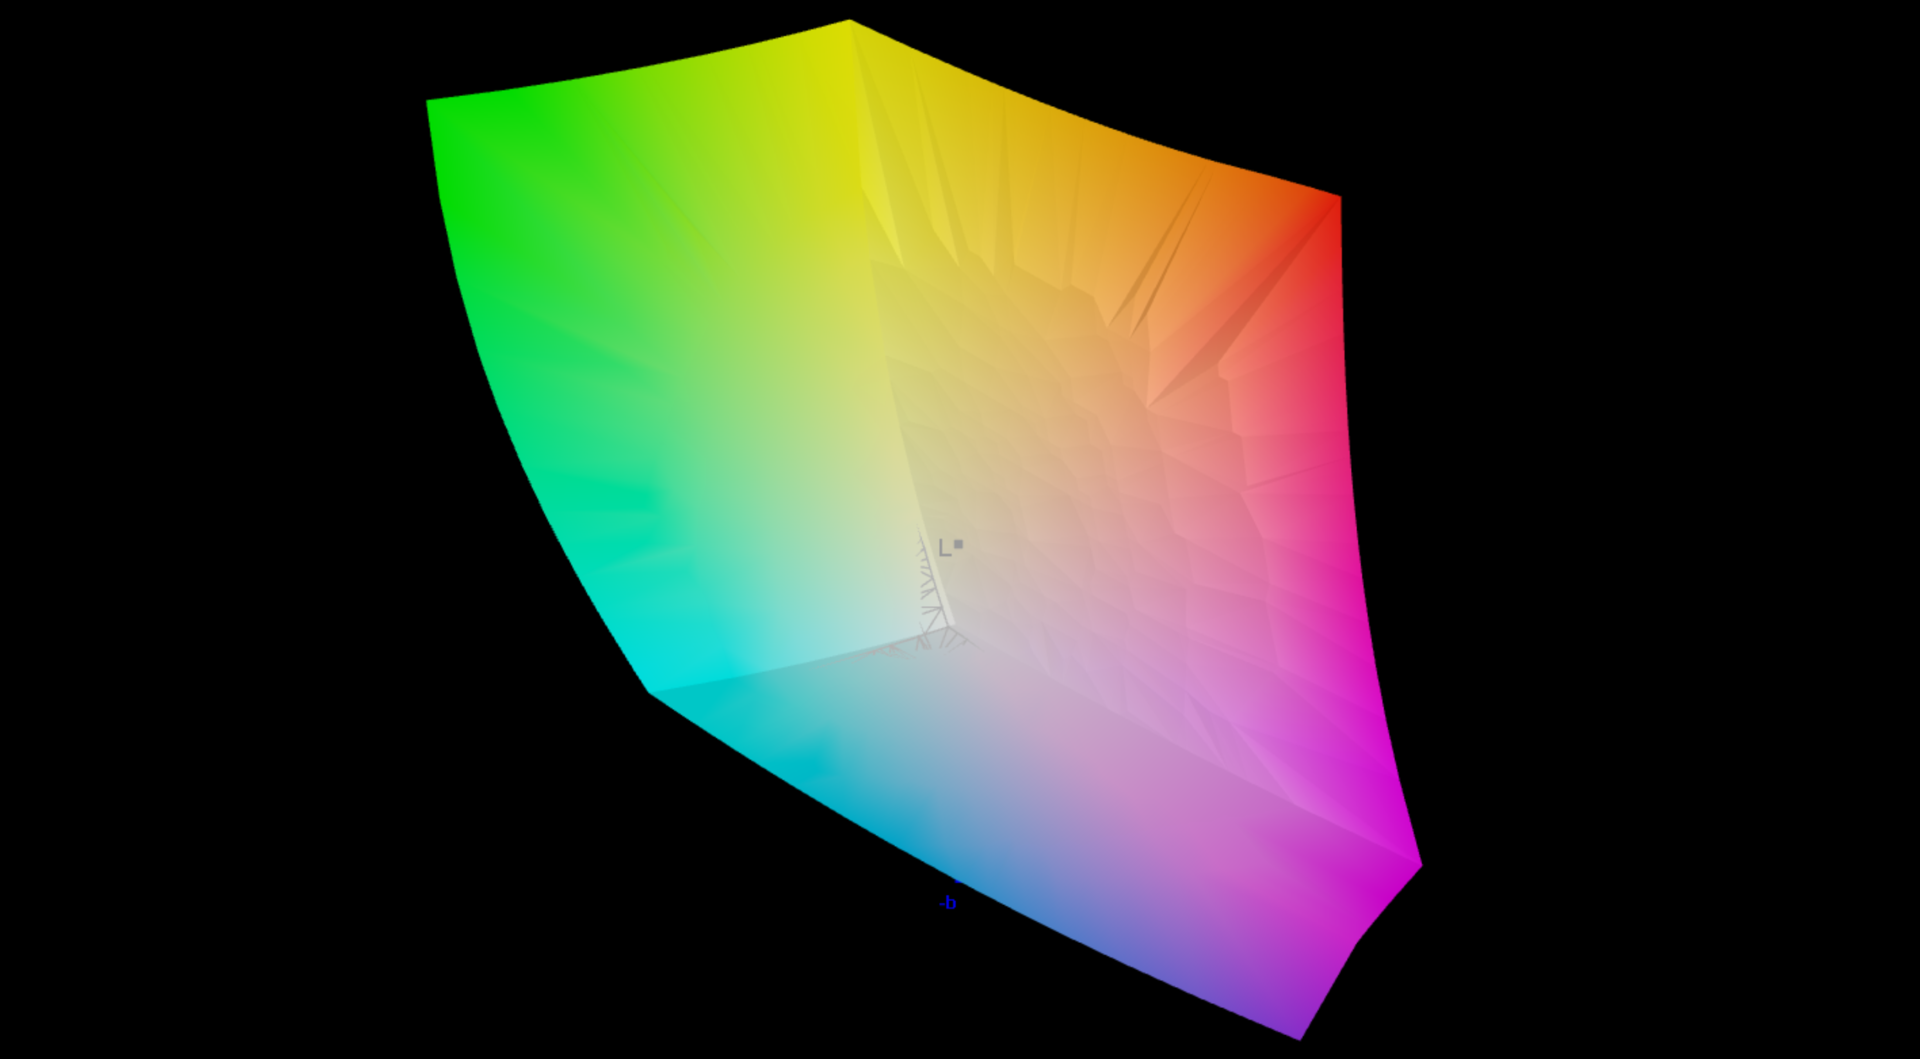
93.4% AdobeRGB 1998 (Argyll 2.2.0 3D)
100% sRGB (Argyll 2.2.0 3D)
99.6% Display P3 (Argyll 2.2.0 3D)
Gamma: 2.24
| Asus ROG Zephyrus G14 GA402XY B140QAN06.S, Mini-LED, 2560x1600, 14.00 | Razer Blade 14 Ryzen 9 6900HX TL140BDXP02-0, IPS, 2560x1440, 14.00 | Asus ROG Zephyrus G14 GA402RK NE140QDM-NX1 (BOE0A1D), IPS-Level, 2560x1600, 14.00 | Alienware x14 i7 RTX 3060 SHP154D, IPS, 1920x1080, 14.00 | Acer Predator Triton 300 SE Samsung ATNA40YK07-0, OLED, 2880x1800, 14.00 | Asus ROG Zephyrus M16 GU604VY-NM042X BOE0B74 (NE160QDM-NM4, IPS, 2560x1600, 16.00 | Apple MacBook Pro 14 2023 M2 Pro Mini-LED, 3024x1964, 14.20 | |
|---|---|---|---|---|---|---|---|
| Display | -3% | -3% | -2% | 2% | -1% | 0% | |
| Display P3 Coverage | 99.6 | 97.2 -2% | 97.4 -2% | 99.6 0% | 99.9 0% | 99.33 0% | 99.2 0% |
| sRGB Coverage | 100 | 99.9 0% | 99.9 0% | 100 0% | 100 0% | 99.9 0% | |
| AdobeRGB 1998 Coverage | 93.4 | 85.7 -8% | 85.5 -8% | 87.6 -6% | 99 6% | 90.01 -4% | |
| Response Times | -26% | 163% | 34% | 28% | -91% | -33% | |
| Response Time Grey 50% / Grey 80% * | 17.2 ? | 16.8 ? 2% | 8.8 ? 49% | 9.6 ? 44% | 1.36 ? 92% | 50.8 ? -195% | 35.2 ? -105% |
| Response Time Black / White * | 9.9 ? | 15.2 ? -54% | 6 ? 39% | 7.6 ? 23% | 1.36 ? 86% | 29.6 ? -199% | 26.4 ? -167% |
| PWM Frequency | 5430 | 27170 ? 400% | 367.6 ? -93% | 12000 121% | 14880 ? 174% | ||
| Screen | -29% | -79% | -98% | -98% | 19% | -4% | |
| Brightness middle | 535 | 354 -34% | 480 -10% | 434 -19% | 414.3 -23% | 634 19% | 500 -7% |
| Brightness | 563 | 328 -42% | 456 -19% | 411 -27% | 416 -26% | 627 11% | 489 -13% |
| Brightness Distribution | 91 | 86 -5% | 80 -12% | 89 -2% | 99 9% | 92 1% | 94 3% |
| Black Level * | 0.37 | 0.48 | 0.25 | 0.03 | 0.02 | ||
| Colorchecker dE 2000 * | 1 | 1.66 -66% | 2.62 -162% | 3 -200% | 4.68 -368% | 0.89 11% | 1.2 -20% |
| Colorchecker dE 2000 max. * | 2.8 | 3.83 -37% | 6.71 -140% | 7.1 -154% | 7.78 -178% | 1.79 36% | 2.6 7% |
| Greyscale dE 2000 * | 1.8 | 1.6 11% | 4.2 -133% | 5.1 -183% | 1.8 -0% | 1.13 37% | 1.7 6% |
| Gamma | 2.24 98% | 2.23 99% | 2.16 102% | 2.19 100% | 2.22 99% | 2.47 89% | 2.24 98% |
| CCT | 6337 103% | 6542 99% | 7122 91% | 6204 105% | 6207 105% | 6497 100% | 6791 96% |
| Contrast | 957 | 1000 | 1736 | 21133 | 25000 | ||
| Colorchecker dE 2000 calibrated * | 1.12 | 0.7 | 0.91 | ||||
| Total Average (Program / Settings) | -19% /
-21% | 27% /
0% | -22% /
-48% | -23% /
-41% | -24% /
-14% | -12% /
-12% |
* ... smaller is better

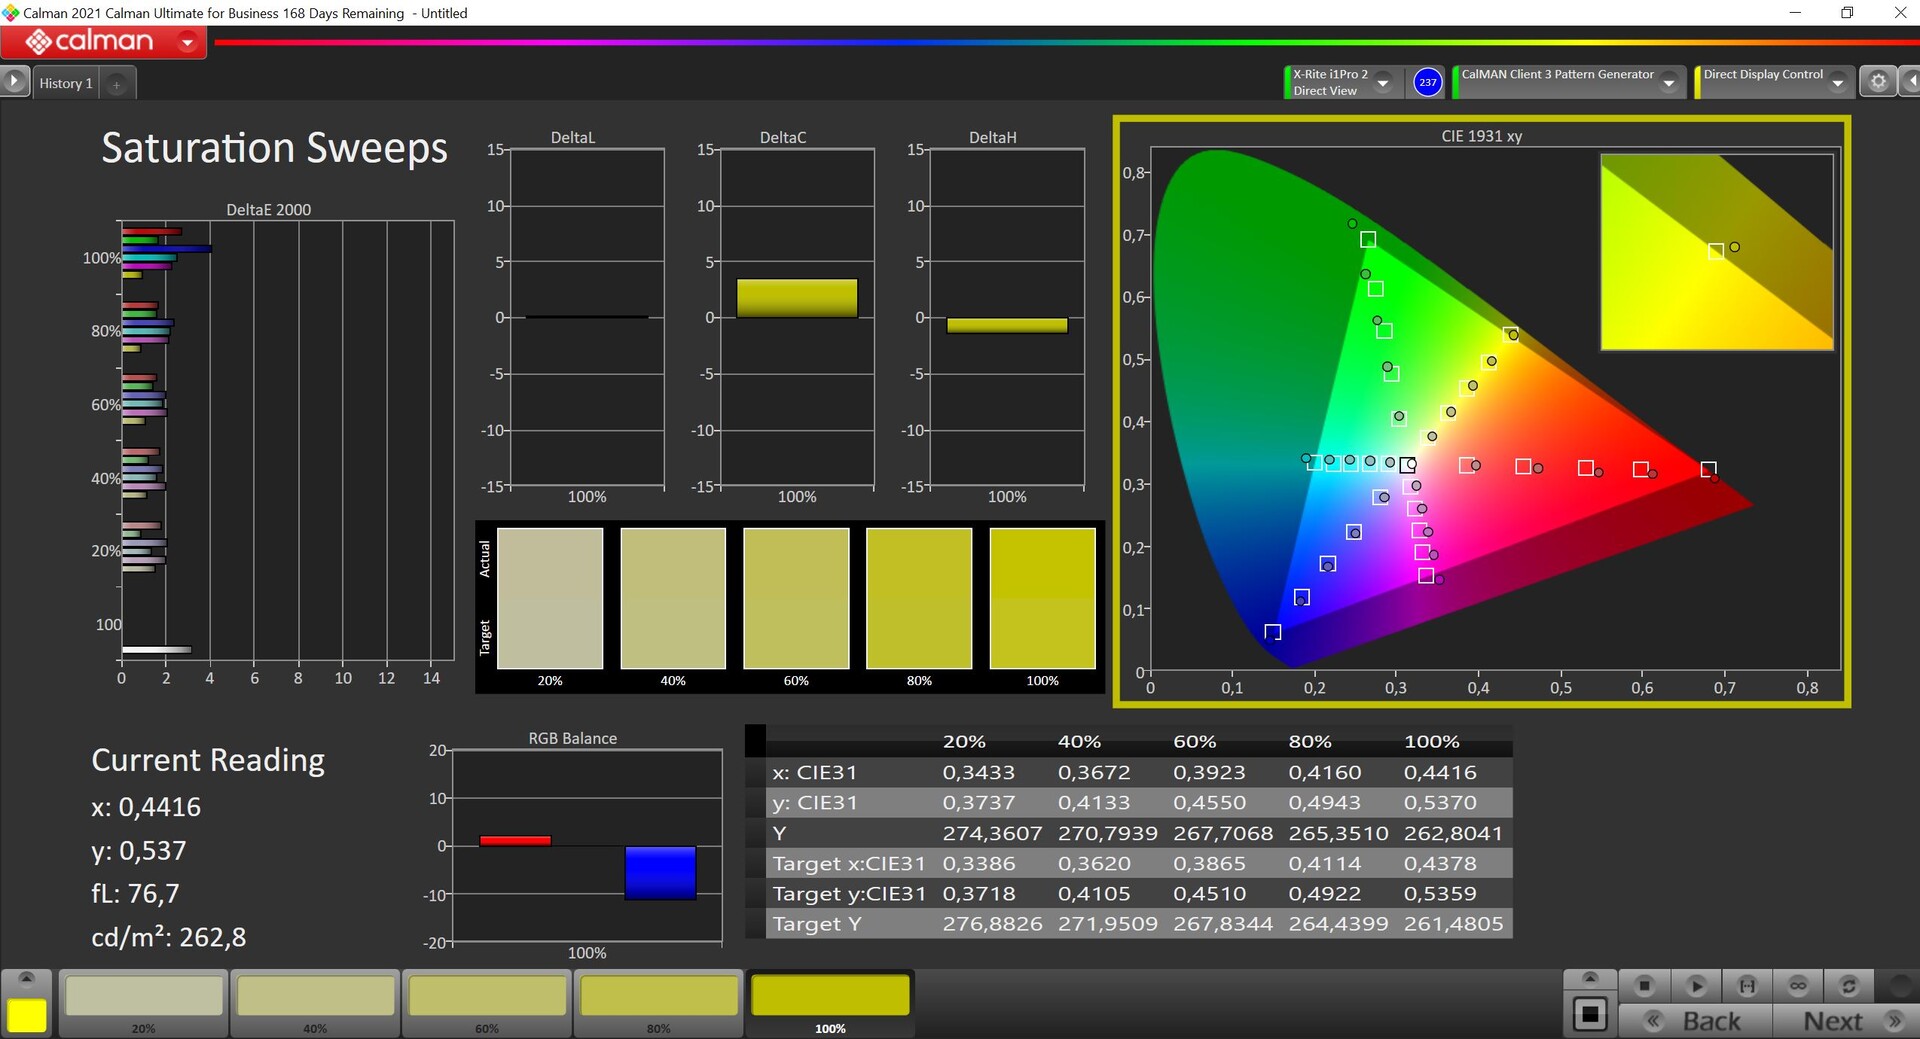
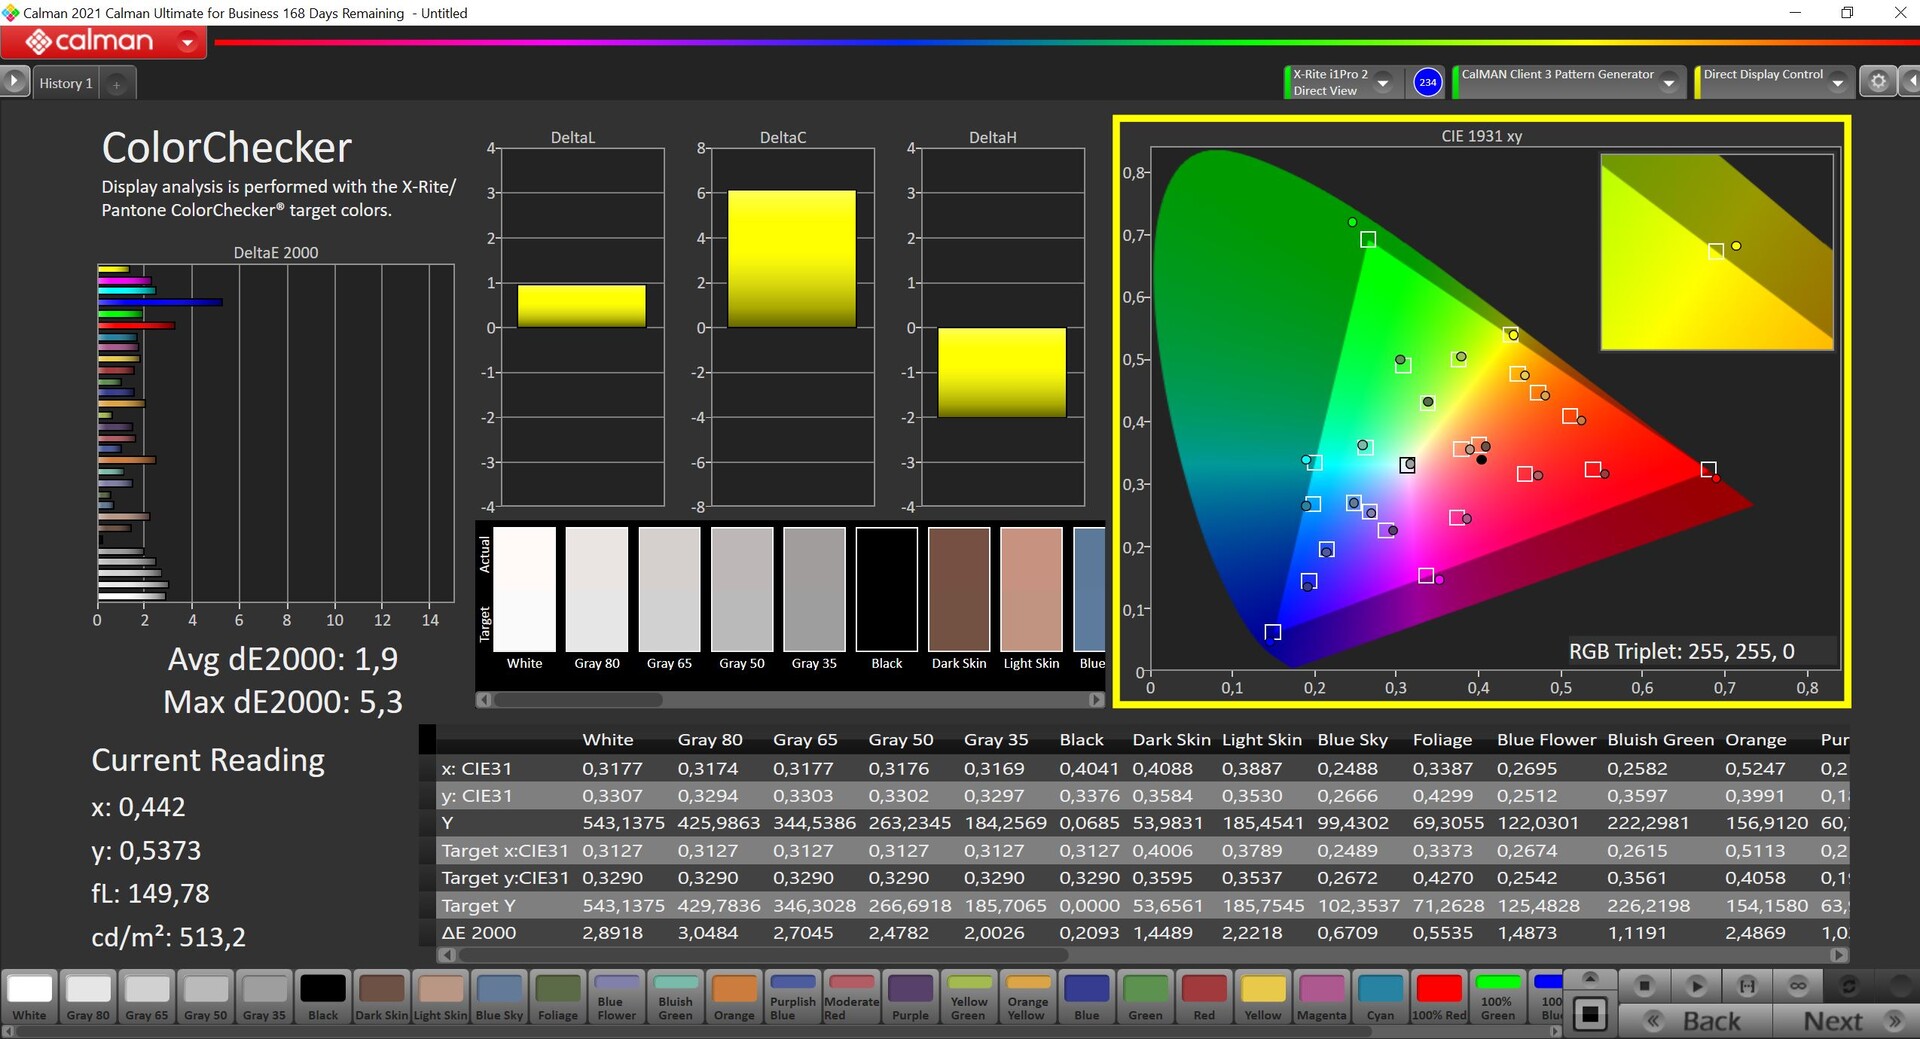
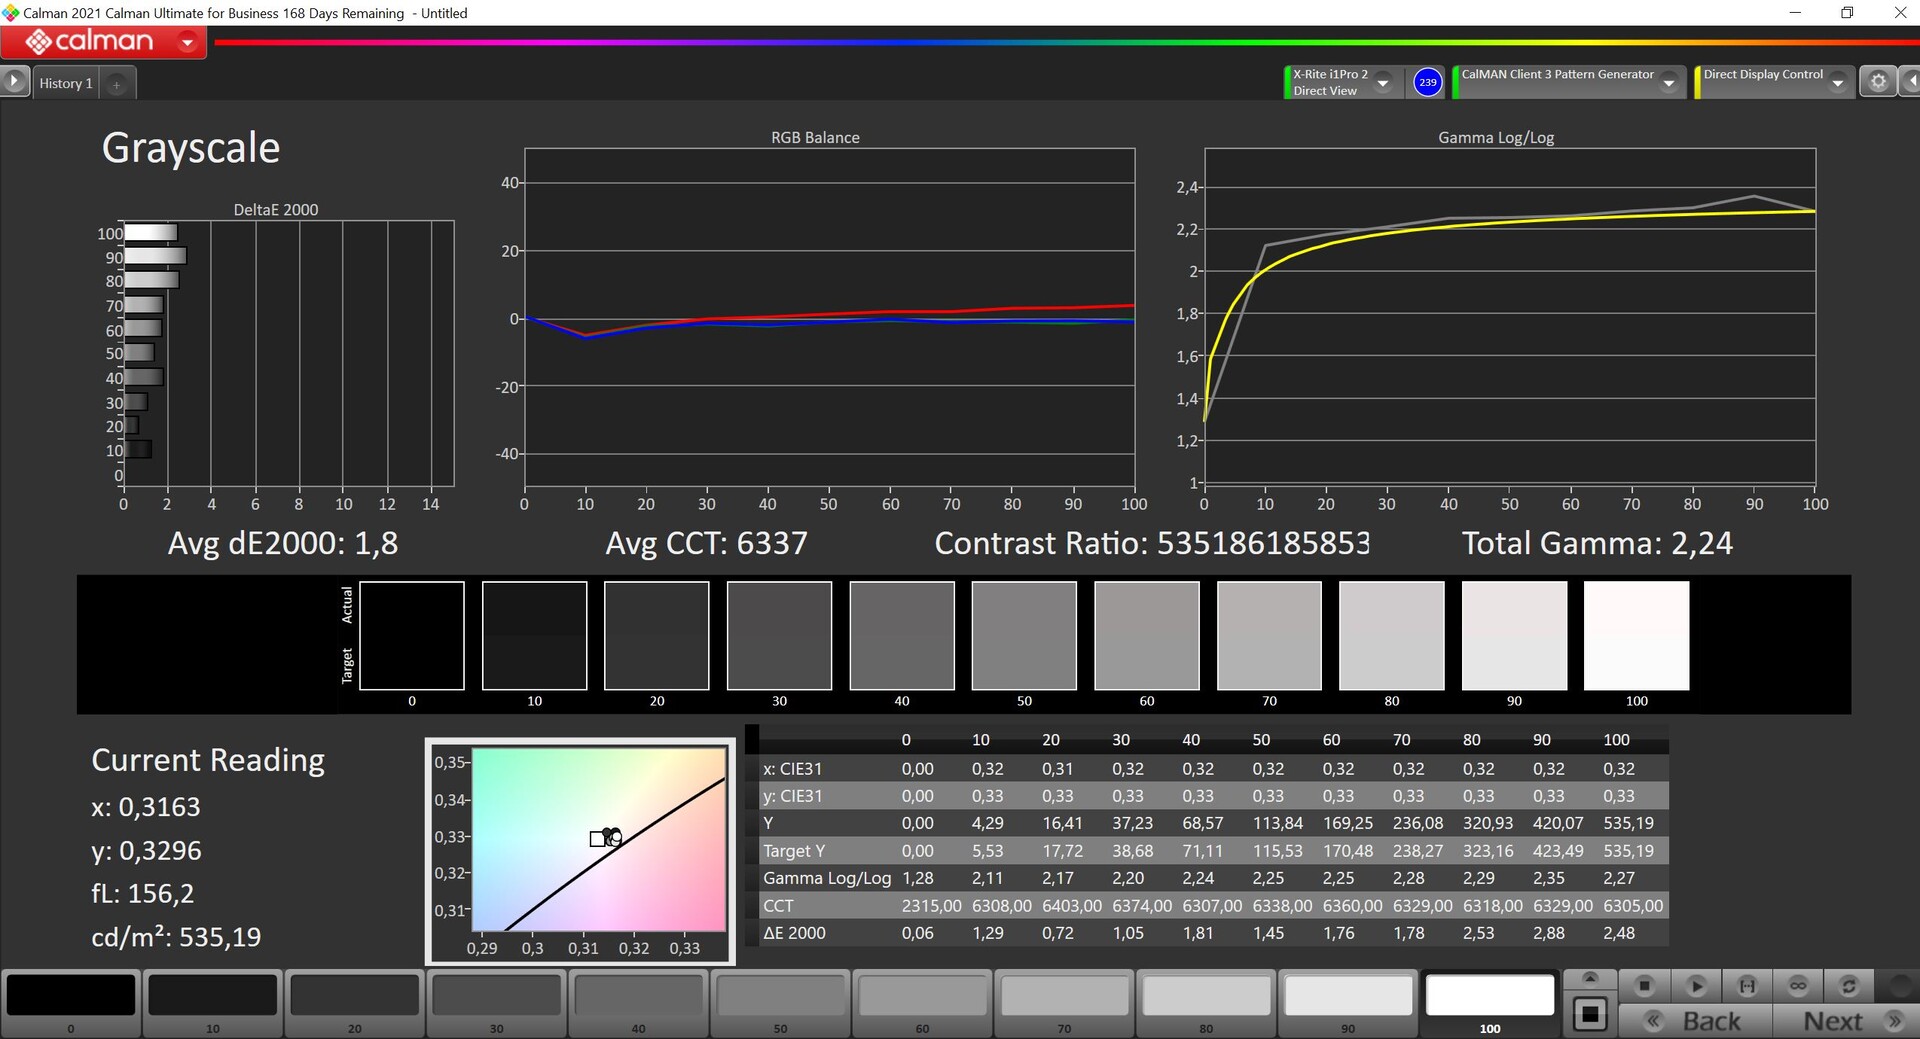
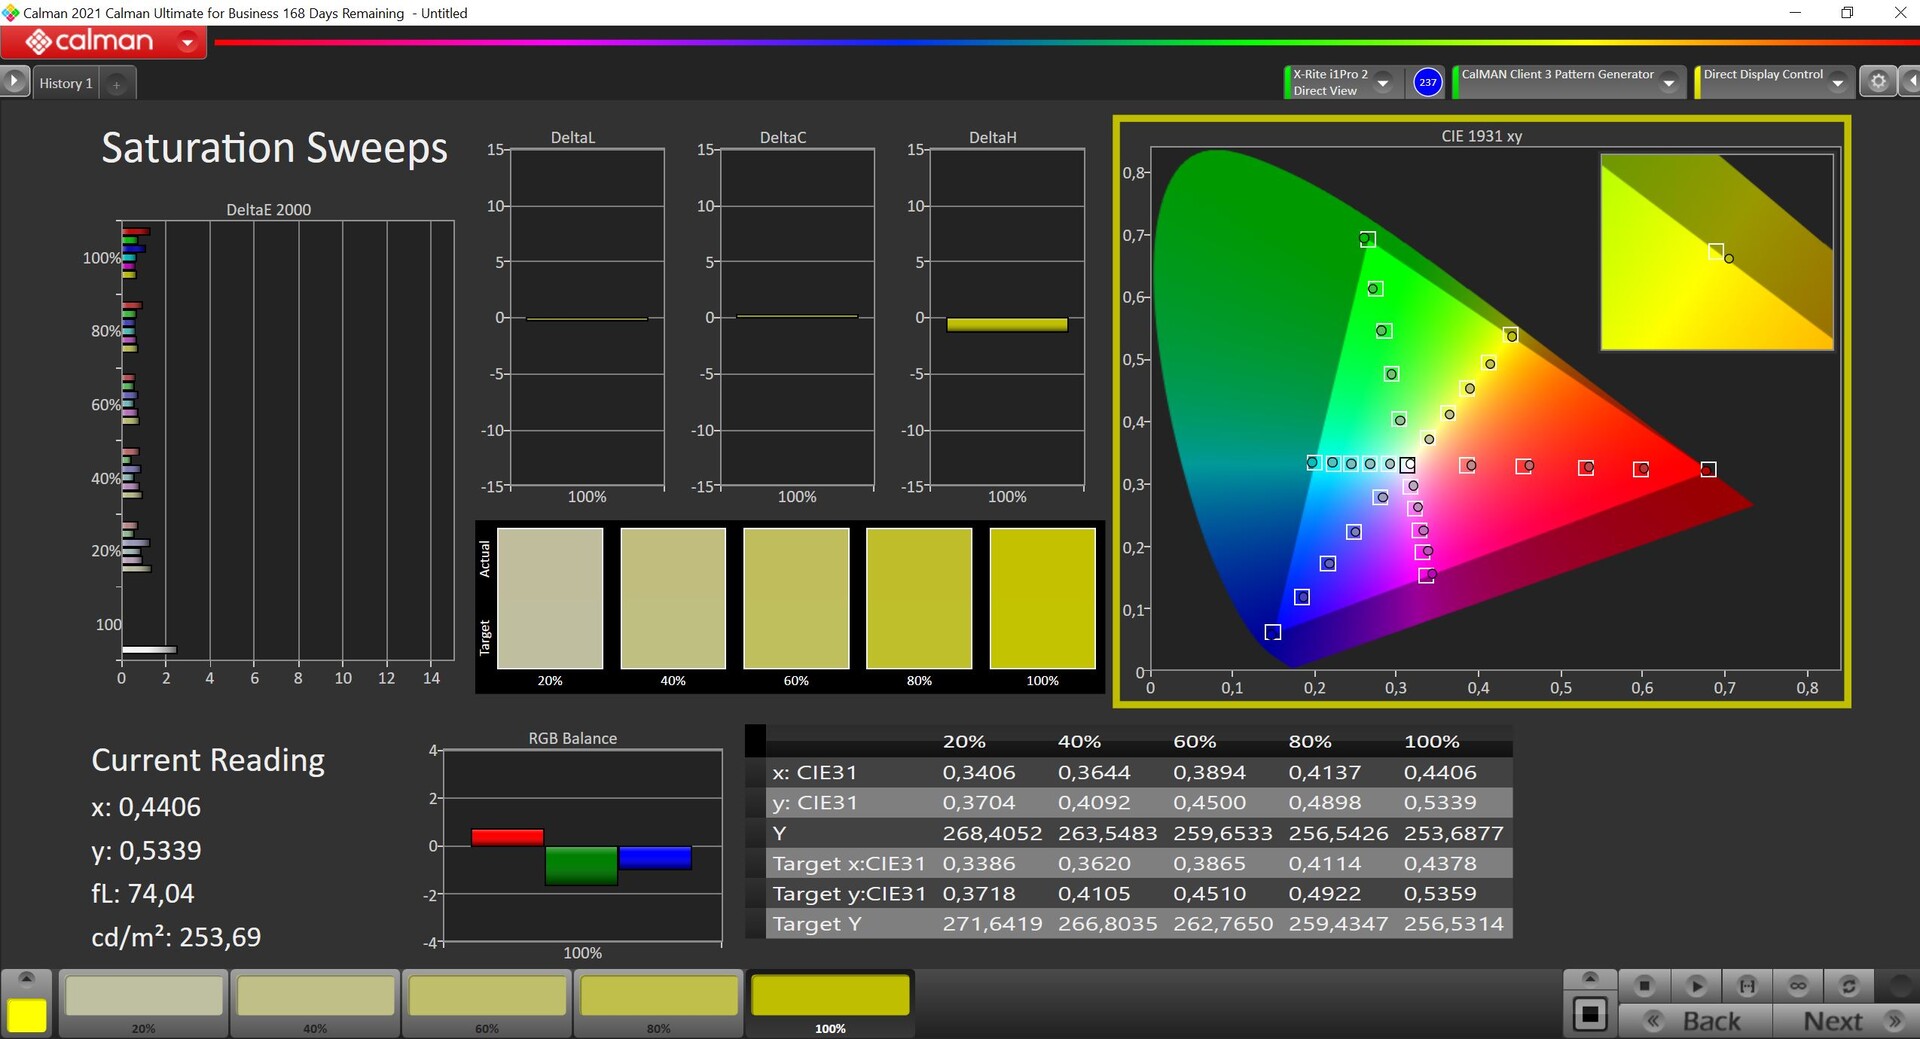
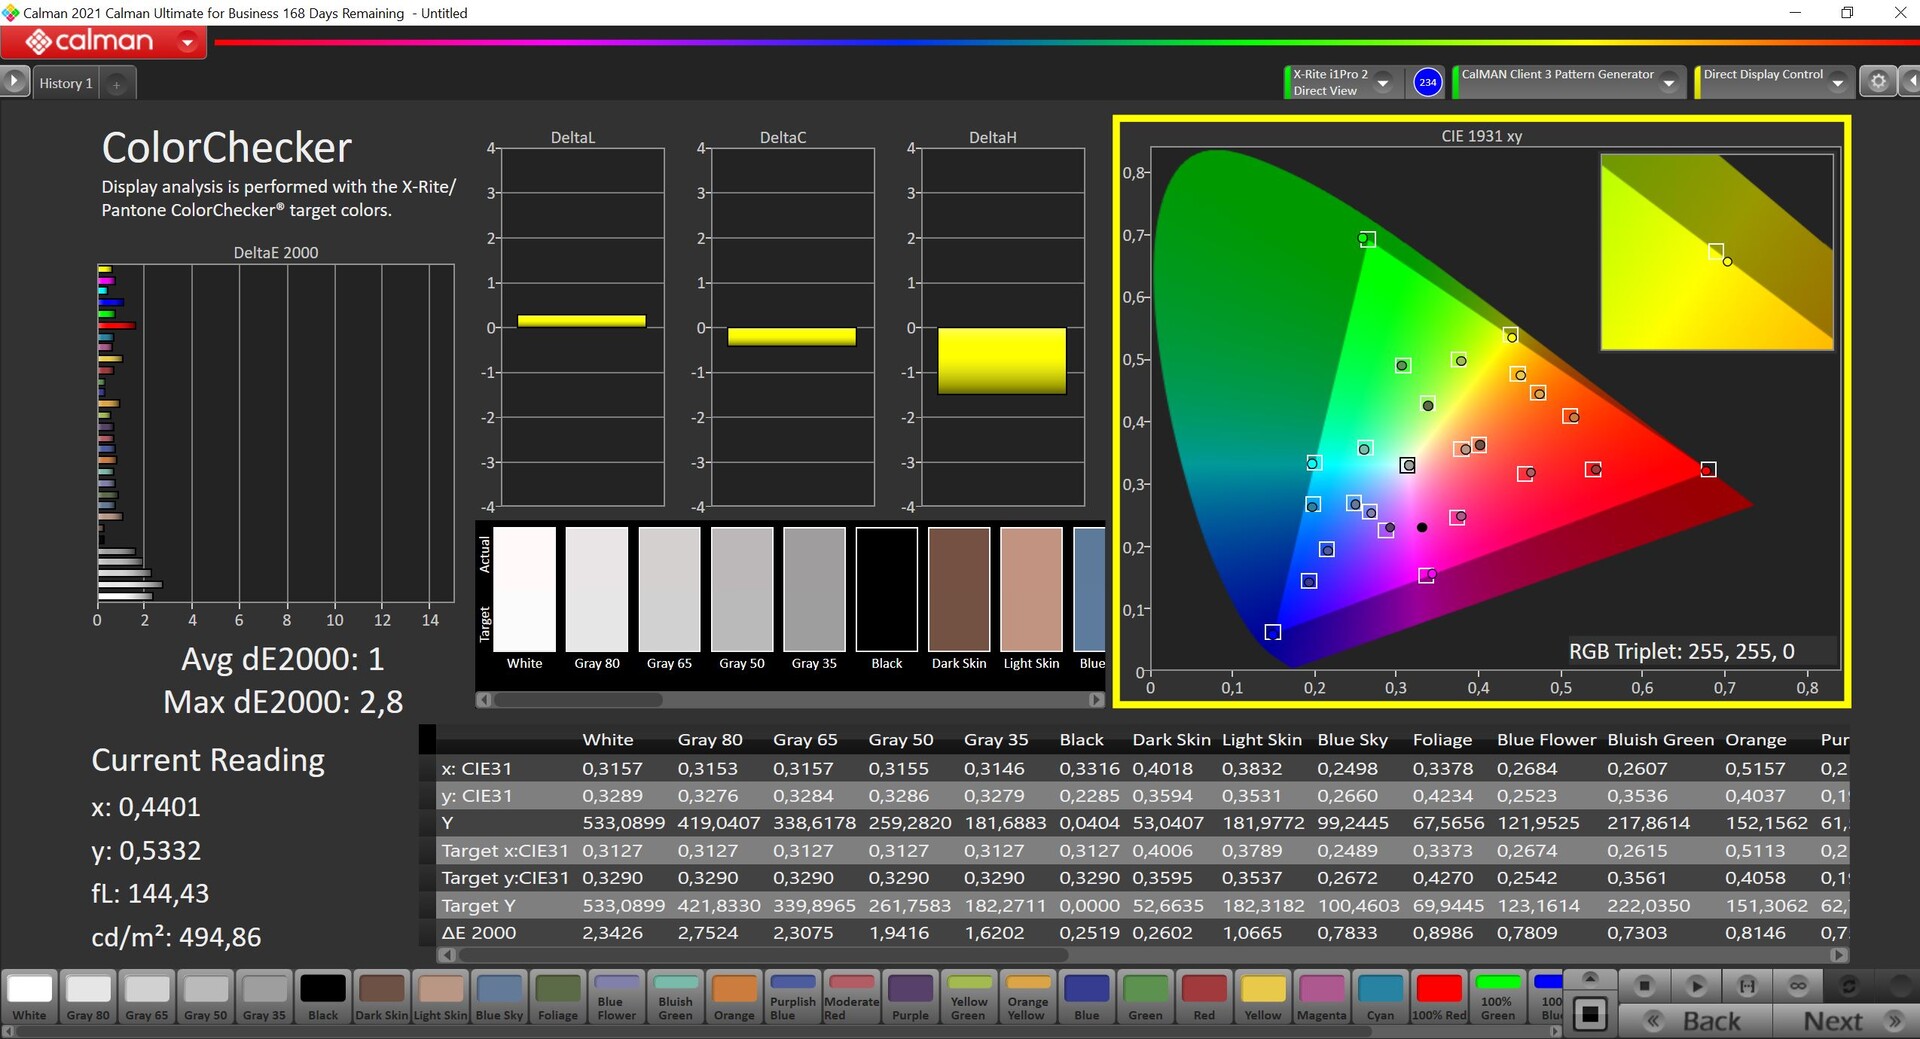
The Armoury Crate software offers different color profiles and the Native profile is activated by default. This is a good choice for regular usage scenarios with slightly oversaturated colors, so the picture appears a bit more colorful. We also analyzed the profile Display P3 with the professional CalMAN software (X-Rite i1 Pro 2), which offers very accurate colors compared to the P3 reference and it is an ideal choice when you want to edit pictures or videos. There is also an sRGB profile. We were not able to improve the picture quality even further with our own calibration, so we do not offer a profile at this point.
When you edit pictures, you will also be happy about the software setting to change from the multi-zone illumination to a single-zone illumination, which means the whole picture is evenly illuminated. However, this has a big impact on the black value and the contrast ratio, so we recommend the multi-zone mode for all other scenarios.
Display Response Times
| ↔ Response Time Black to White | ||
|---|---|---|
| 9.9 ms ... rise ↗ and fall ↘ combined | ↗ 0.5 ms rise | 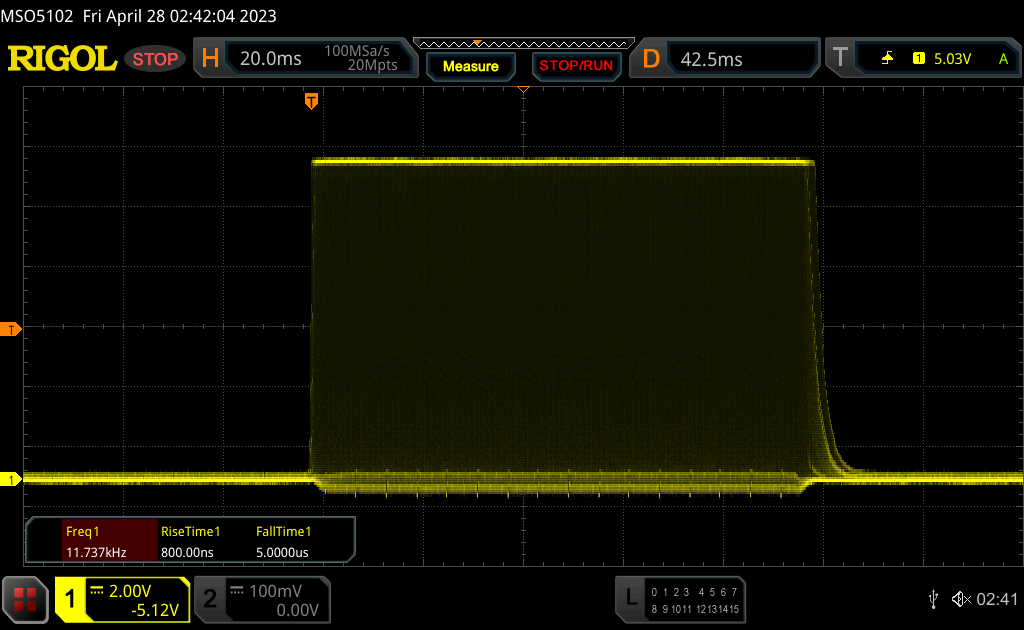 |
| ↘ 9.4 ms fall | ||
| The screen shows fast response rates in our tests and should be suited for gaming. In comparison, all tested devices range from 0.1 (minimum) to 240 (maximum) ms. » 22 % of all devices are better. This means that the measured response time is better than the average of all tested devices (21.5 ms). | ||
| ↔ Response Time 50% Grey to 80% Grey | ||
| 17.2 ms ... rise ↗ and fall ↘ combined | ↗ 7.2 ms rise | 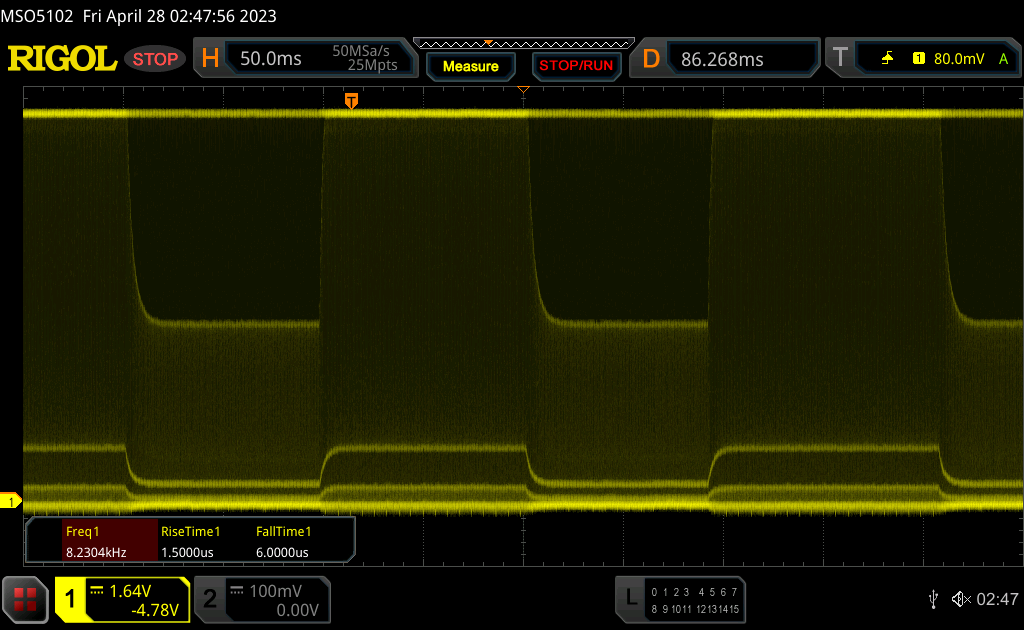 |
| ↘ 10 ms fall | ||
| The screen shows good response rates in our tests, but may be too slow for competitive gamers. In comparison, all tested devices range from 0.2 (minimum) to 636 (maximum) ms. » 26 % of all devices are better. This means that the measured response time is better than the average of all tested devices (33.7 ms). | ||
Screen Flickering / PWM (Pulse-Width Modulation)
| Screen flickering / PWM detected | 5430 Hz |  | |
The display backlight flickers at 5430 Hz (worst case, e.g., utilizing PWM) . The frequency of 5430 Hz is quite high, so most users sensitive to PWM should not notice any flickering. In comparison: 53 % of all tested devices do not use PWM to dim the display. If PWM was detected, an average of 17900 (minimum: 5 - maximum: 3846000) Hz was measured. | |||
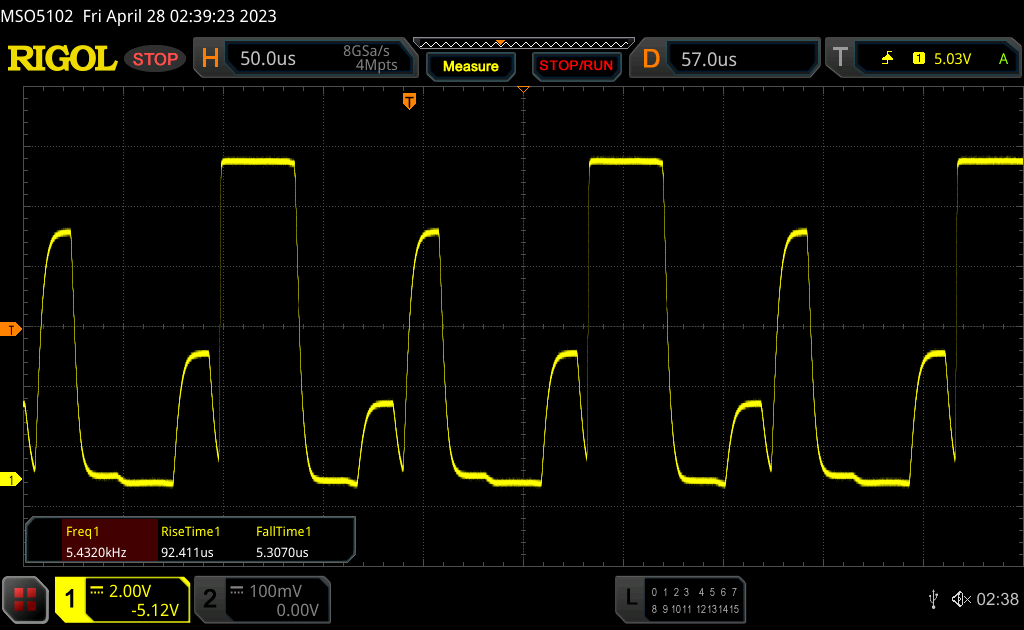
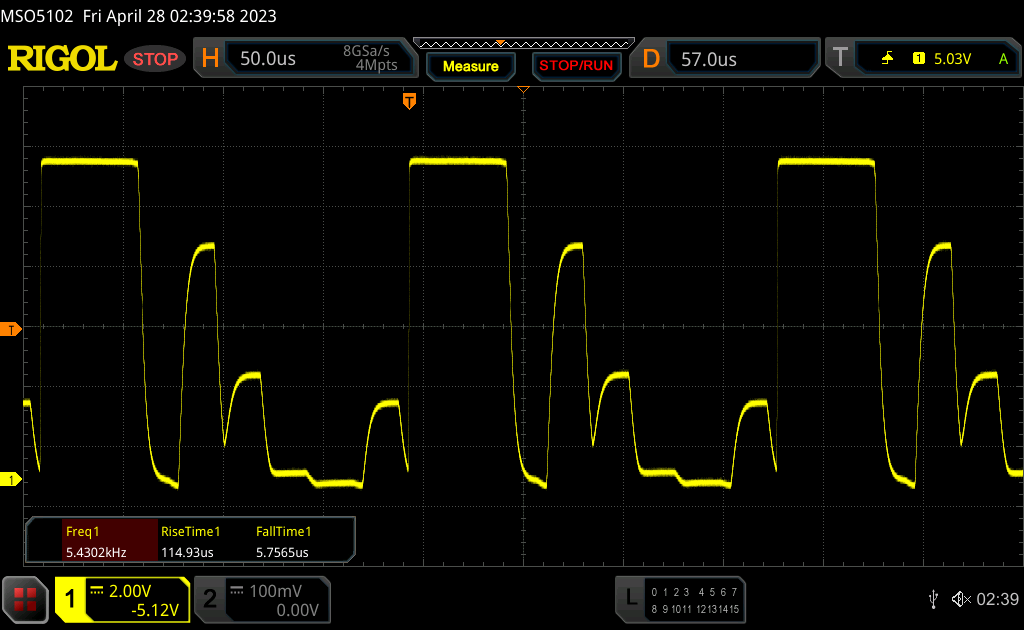
The individual dimming zones of Mini-LED panels are turned on and off at a frequency of 5 kHz, which corresponds with typical PWM. We can measure this flickering at all brightness levels, but there should not be any issues due to the high frequency. The response times are a bigger challenge, because the conventional method (which is used by us and the rest of the industry for LED and OLED screens) does not work properly. We included our measurements, but they are not really representative and the manufacturer advertises 3 ms.
Note: According to our information, most manufacturers are not able to determine the response times of Mini-LED panels properly. Instead, they measure the response times by replacing the Mini-LED backlight with a conventional backlight, because the response times depend on the panel itself and not the backlight. We will try to copy this process in the future and show the results, but we can obviously not do this for every review unit. It is also possible to check whether we have already tested the panel itself with a conventional backlight, but this is not the case for this particular QHD+ panel from AU Optronics.
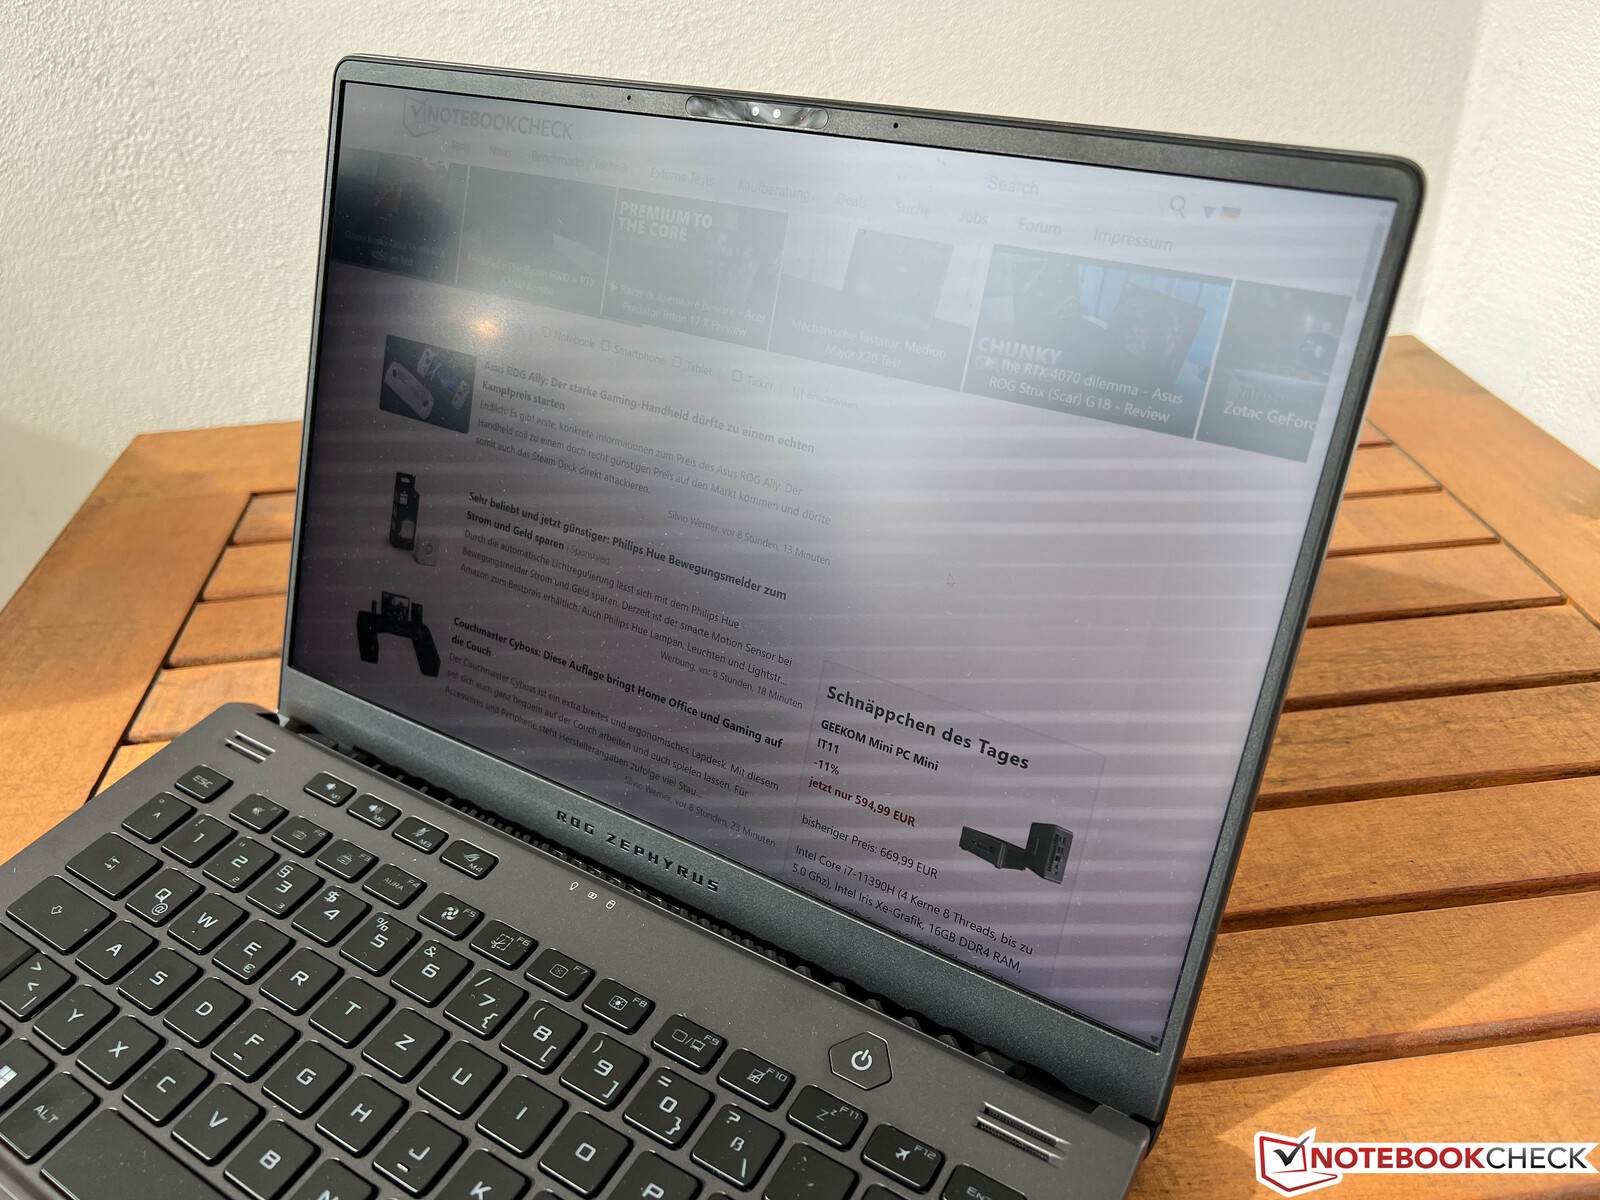
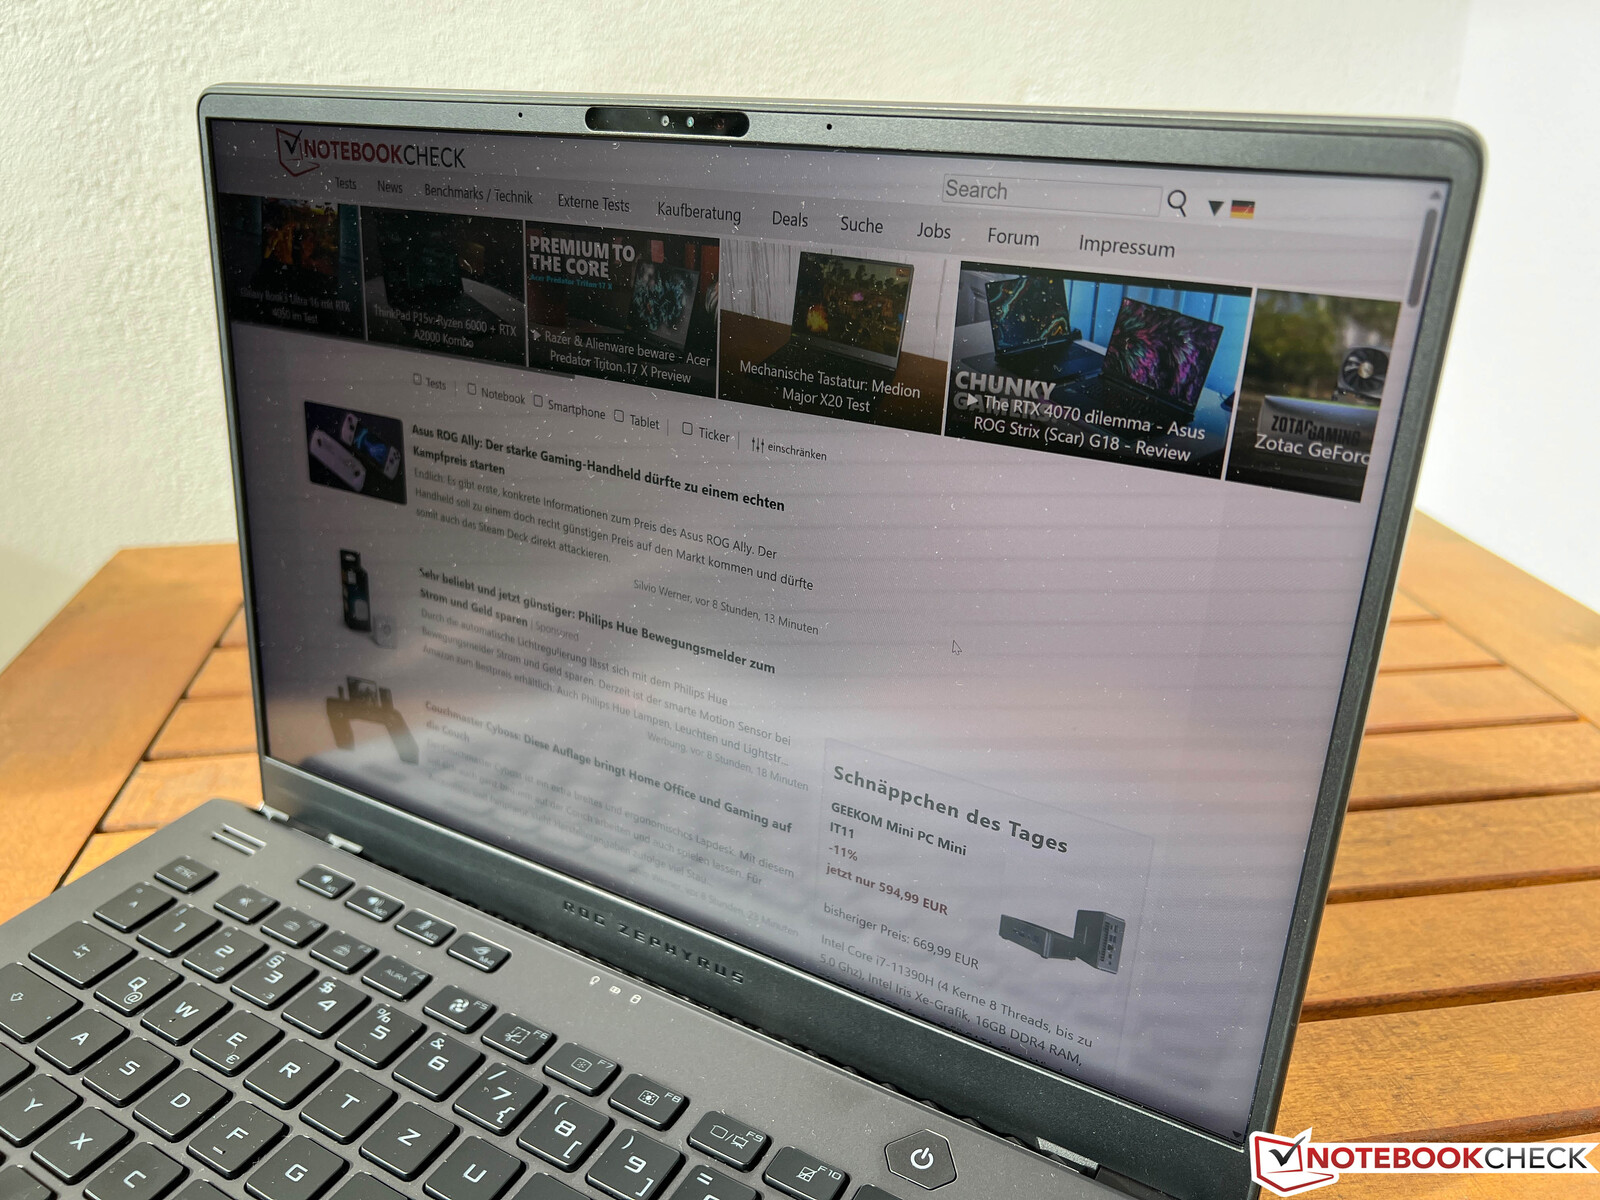
The high brightness in combination with the matte surface works very well in bright environments and we did not have an issue to see the display content even on a sunny day. The viewing angle stability is also excellent.
Performance - Zen4 Phoenix & RTX 4090 Laptop
Our review unit is the high-end SKU of the ROG Zephyrus G14 with the Ryzen 9 7940HS (Zen4, 4nm, Phoenix) as well as the GeForce RTX 4090 Laptop. You can also combine the new Zen4 chip with the smaller RTX GPUs down to the RTX 4060 Laptop, and the price difference is around 500 Euros for each downgrade. There is also an entry-level model with the Ryzen 7 7735HS (Zen3+, Rembrandt-R) and the RTX 4050 Laptop for 2099 Euros. We have listed the different SKU options in the table below. All versions of the ROG Zephyrus G14 are shipped with 16 GB RAM onboard with one additional SO-DIMM slot for up to 48 GB.
| SKU | CPU | GPU | RAM | SSD | Display (QHD+) | Price |
|---|---|---|---|---|---|---|
| GA402NU-N2010W | Ryzen 7 7735HS (Zen3+) | RTX 4050 Laptop | 16 GB | 1 TB | IPS/165 Hz/3ms | 2099 Euros |
| GA402XV-N2008W | Ryzen 9 7940HS (Zen4) | RTX 4060 Laptop | 16 GB | 1 TB | IPS/165 Hz/3ms | 2499 Euros |
| GA402XI-NC019W | Ryzen 9 7940HS (Zen4) | RTX 4070 Laptop | 32 GB | 1 TB | Mini-LED/165 Hz/3ms | 2999 Euros |
| GA402XZ-NC021W | Ryzen 9 7940HS (Zen4) | RTX 4080 Laptop | 32 GB | 1 TB | Mini-LED/165 Hz/3ms | 3499 Euros |
| GA402XY-NC020W | Ryzen 9 7940HS (Zen4) | RTX 4090 Laptop | 32 GB | 1 TB | Mini-LED/165 Hz/3ms | 3999 Euros |
Review Settings
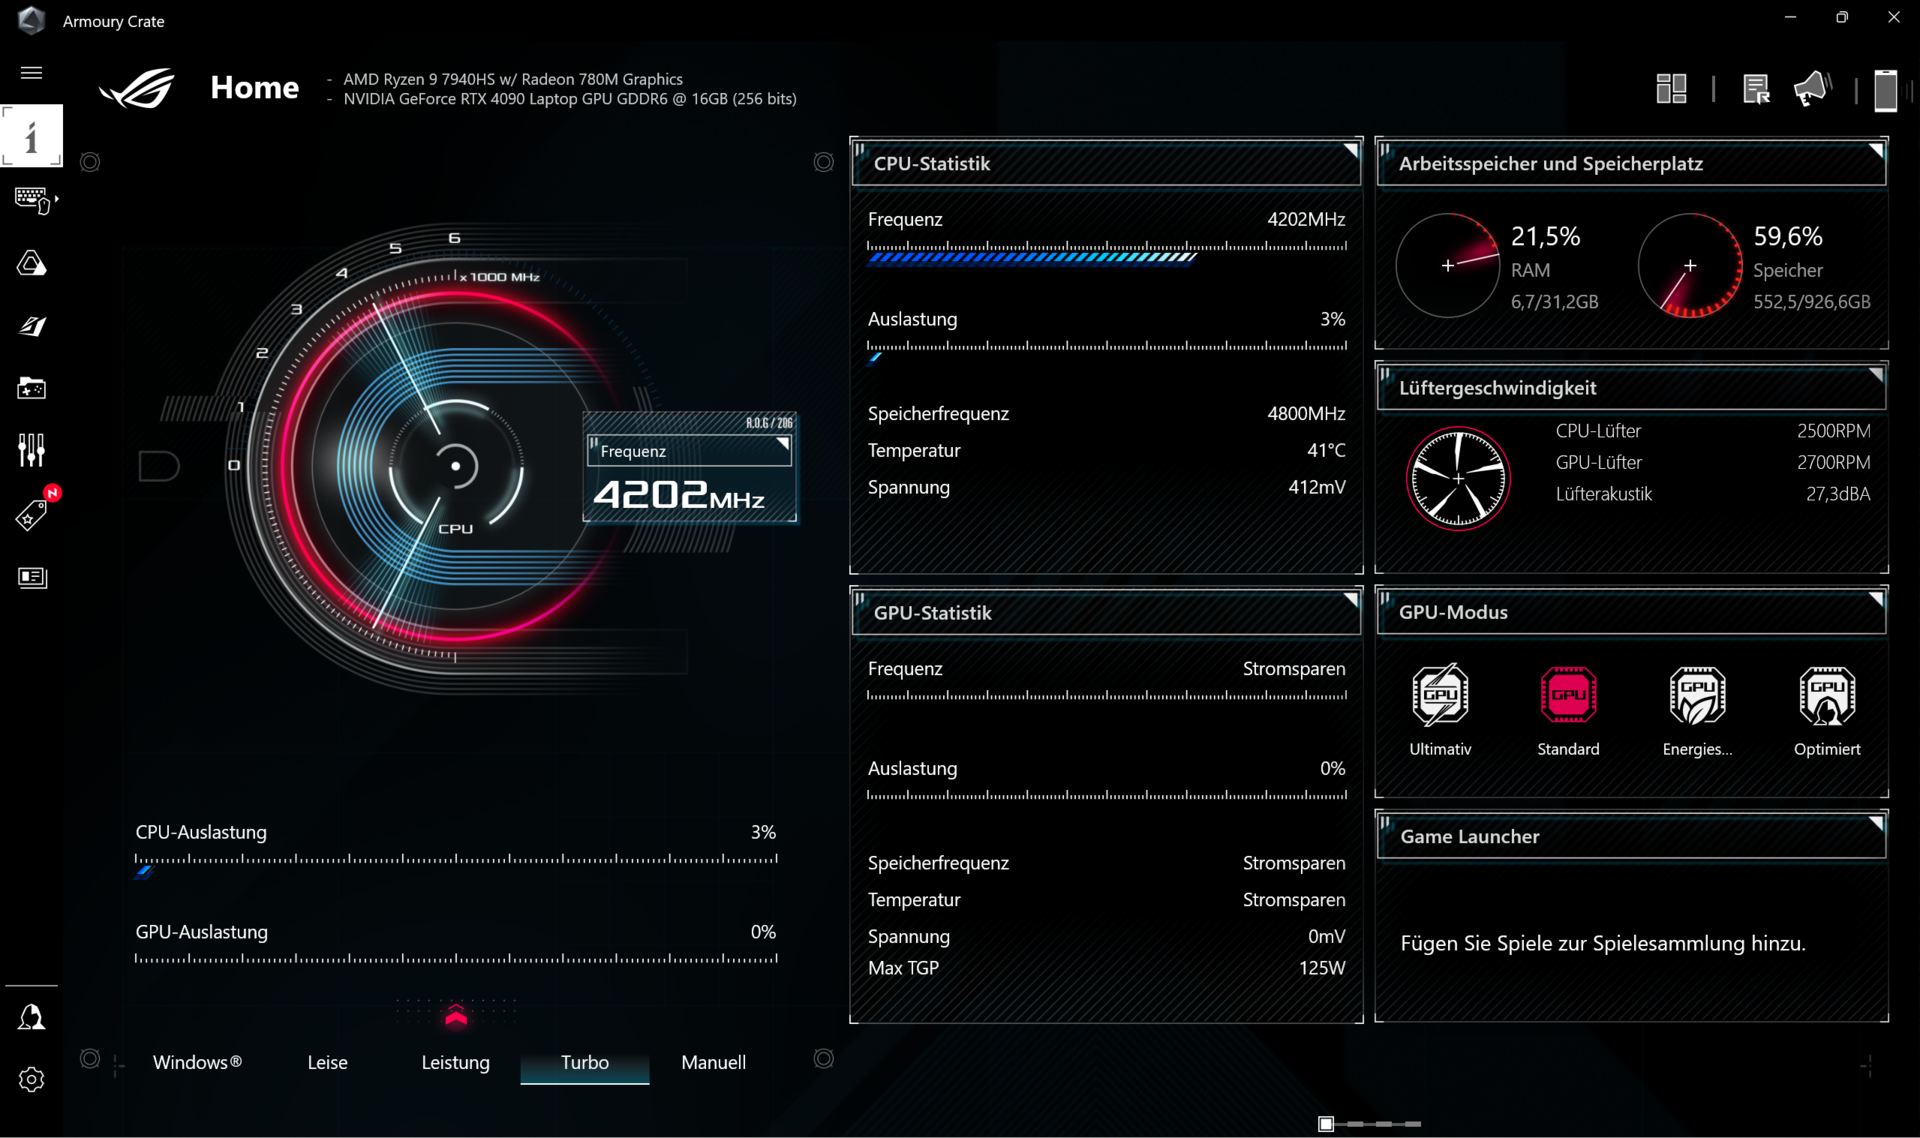
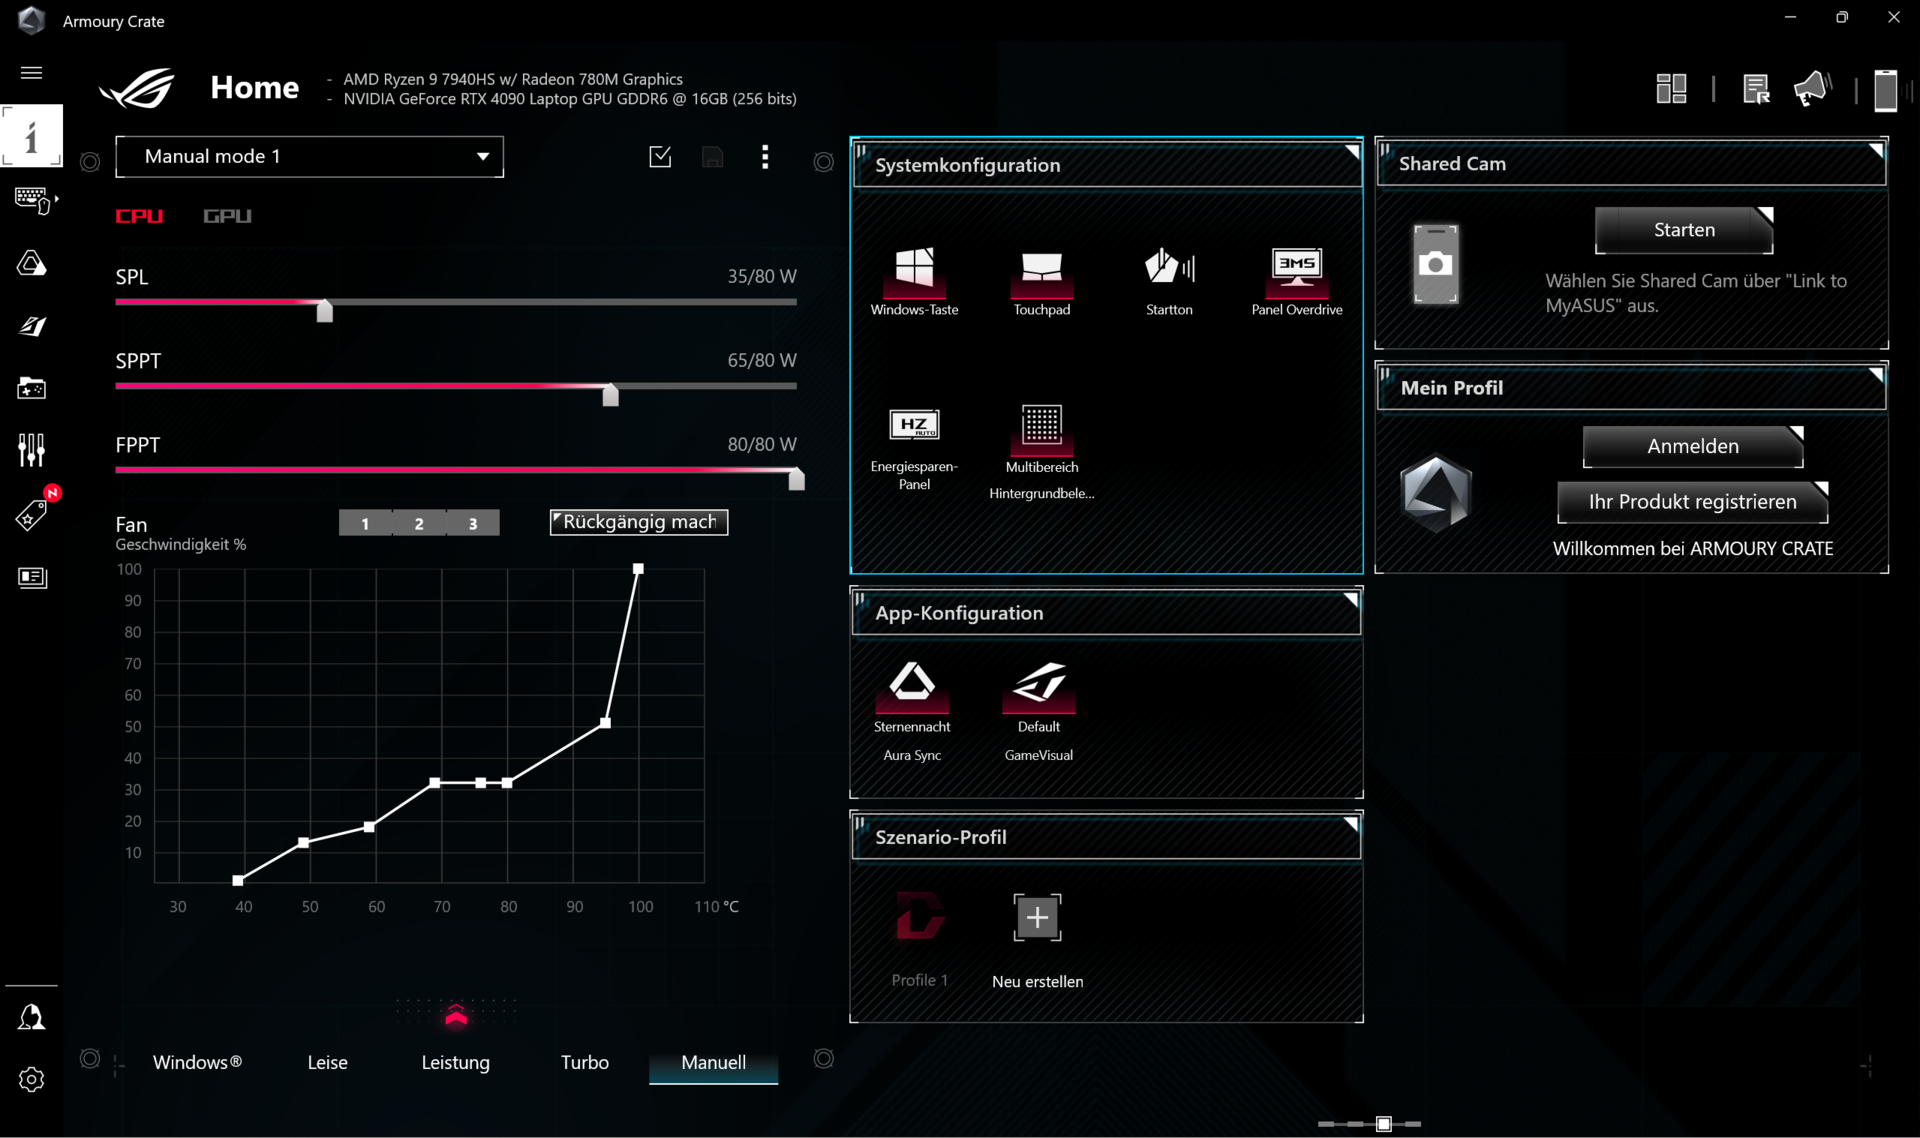
The preloaded Armoury Crate software offers different power profiles and also a manual mode, where you can adjust the TDP values for the CPU in a range between 15-80 Watts. We have listed the power profiles with the corresponding TDP/TGP values in the following table:
| Power profile | CPU | GPU | Stress test | Fan noise Witcher 3 |
|---|---|---|---|---|
| Silent | 45/65 Watts | 85 Watts | CPU: 25 Watts GPU: 80 Watts |
39.9 dB(A) |
| Performance | 45/65 Watts | 80 + 20 Watts | CPU: 30 Watts GPU: 80 Watts |
46.2 dB(A) |
| Turbo | 80/80 Watts | 100 + 25 Watts | CPU: 35 Watts GPU: 100 Watts |
52.5 dB(A) |
We used the Turbo mode for the following benchmarks and measurements to get the maximum GPU performance, but you can just use the Silent mode for daily tasks and just switch the power profiles very comfortably via key combination Fn+F5. We will also check the impact of the other power profiles in the fan noise section. The Turbo mode is not available on battery power.
You should get accustomed to the Armoury Crate software since it offers plenty of functions including the GPU mode (you can also deactivate the Nvidia GPU). We used the standard GPU mode in combination with Advanced Optimus for our review.
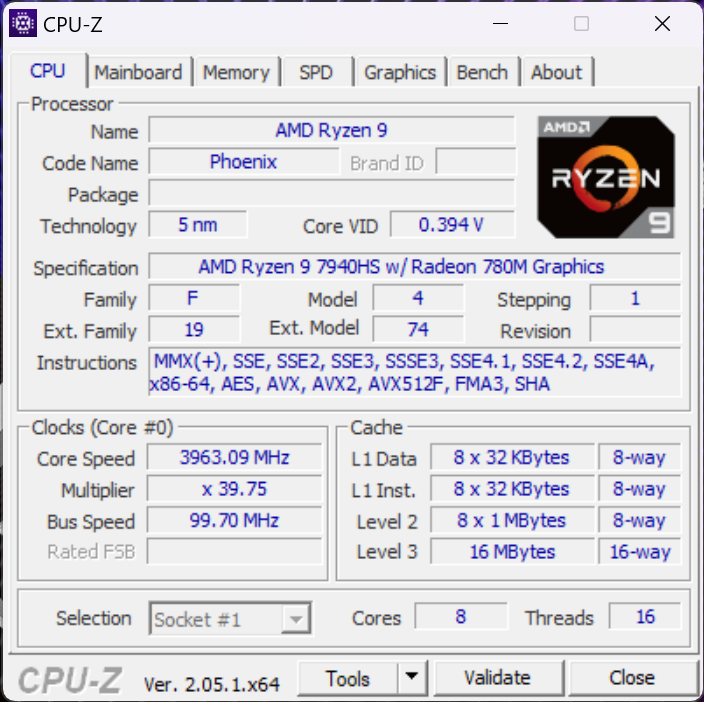
Processor - Ryzen 9 7940HS
Finally, there it is: The first AMD Ryzen 7000 mobile processor with 4 nm Zen4 cores with the code name Phoenix. Our review unit is equipped with the top model of the 45W HS range, the Ryzen 9 7940HS. Contrary to Intel, AMD does not use a hybrid architecture and just uses 8 full-fledged Zen4 cores with hyper threading support, so the CPU can execute up to 16 threads simultaneously. The processor consumes 80W in Turbo mode and can maintain this performance level.
AMD managed to improve the single-core performance by around 15 % compared to the old Ryzen 9 6900HS, but the AMD processor is still a bit slower than the current Intel chips as well as the high-end Ryzen 9 7945HX.
Cinebench R15 Multi Loop
We can see an advantage of 44 % compared to the previous G14 in multi-core tests and the new Ryzen 9 7940HS is only beaten by the HX CPUs as well as the fast Core i9-13900H in the ROG Zephyrus M16, but the Intel chip also consumes much more than 100 Watts.
All in all, the new Zen4 chip is very competitive and we will publish a much more detailed CPU analysis including performance and efficiency benchmarks shortly. We suspect the efficiency will be even better at lower TDP values.
The power consumption for the CPU is limited to 32 Watts on battery power, which results in a performance deficit of about 30 %. More CPU benchmarks are available here.
Cinebench R23: Multi Core | Single Core
Cinebench R20: CPU (Multi Core) | CPU (Single Core)
Cinebench R15: CPU Multi 64Bit | CPU Single 64Bit
Blender: v2.79 BMW27 CPU
7-Zip 18.03: 7z b 4 | 7z b 4 -mmt1
Geekbench 5.5: Multi-Core | Single-Core
HWBOT x265 Benchmark v2.2: 4k Preset
LibreOffice : 20 Documents To PDF
R Benchmark 2.5: Overall mean
| HWBOT x265 Benchmark v2.2 / 4k Preset | |
| Asus Zephyrus Duo 16 GX650PY-NM006W | |
| Lenovo Legion Pro 7 16IRX8H | |
| Asus ROG Strix G16 G614JZ | |
| Asus ROG Zephyrus G14 GA402XY | |
| Asus ROG Zephyrus M16 GU604VY-NM042X | |
| Average of class Gaming (3 - 37.6, n=232, last 2 years) | |
| Average AMD Ryzen 9 7940HS (20.1 - 22.6, n=8) | |
| Lenovo Yoga Pro 7 14IRH G8 | |
| Acer Predator Triton 300 SE | |
| Razer Blade 14 Ryzen 9 6900HX | |
| Alienware x14 i7 RTX 3060 | |
| Asus ROG Zephyrus G14 GA402RK | |
| LibreOffice / 20 Documents To PDF | |
| Asus Zephyrus Duo 16 GX650PY-NM006W | |
| Asus ROG Zephyrus M16 GU604VY-NM042X | |
| Razer Blade 14 Ryzen 9 6900HX | |
| Average of class Gaming (32.8 - 332, n=226, last 2 years) | |
| Asus ROG Strix G16 G614JZ | |
| Asus ROG Zephyrus G14 GA402RK | |
| Lenovo Yoga Pro 7 14IRH G8 | |
| Average AMD Ryzen 9 7940HS (36.9 - 54.8, n=9) | |
| Lenovo Legion Pro 7 16IRX8H | |
| Acer Predator Triton 300 SE | |
| Alienware x14 i7 RTX 3060 | |
| Asus ROG Zephyrus G14 GA402XY | |
* ... smaller is better
System Performance
The system performance is excellent and all inputs are executed without delays. The synthetic benchmark results are also good, but we cannot offer any results for AIDA right now, since the app repeatedly caused a crash. We are already in contact with the manufacturer to find a solution. Except for that, however, we did not notice any problems during our review period.
CrossMark: Overall | Productivity | Creativity | Responsiveness
| PCMark 10 / Score | |
| Asus ROG Zephyrus M16 GU604VY-NM042X | |
| Asus ROG Zephyrus G14 GA402XY | |
| Average AMD Ryzen 9 7940HS, NVIDIA GeForce RTX 4090 Laptop GPU () | |
| Lenovo Legion Pro 7 16IRX8H | |
| Asus ROG Zephyrus G14 GA402RK | |
| Acer Predator Triton 300 SE | |
| Average of class Gaming (5235 - 9852, n=200, last 2 years) | |
| Razer Blade 14 Ryzen 9 6900HX | |
| Lenovo Yoga Pro 7 14IRH G8 | |
| Alienware x14 i7 RTX 3060 | |
| PCMark 10 / Essentials | |
| Lenovo Legion Pro 7 16IRX8H | |
| Asus ROG Zephyrus M16 GU604VY-NM042X | |
| Acer Predator Triton 300 SE | |
| Razer Blade 14 Ryzen 9 6900HX | |
| Asus ROG Zephyrus G14 GA402RK | |
| Lenovo Yoga Pro 7 14IRH G8 | |
| Average of class Gaming (8300 - 12334, n=199, last 2 years) | |
| Asus ROG Zephyrus G14 GA402XY | |
| Average AMD Ryzen 9 7940HS, NVIDIA GeForce RTX 4090 Laptop GPU () | |
| Alienware x14 i7 RTX 3060 | |
| PCMark 10 / Productivity | |
| Asus ROG Zephyrus M16 GU604VY-NM042X | |
| Lenovo Legion Pro 7 16IRX8H | |
| Asus ROG Zephyrus G14 GA402XY | |
| Average AMD Ryzen 9 7940HS, NVIDIA GeForce RTX 4090 Laptop GPU () | |
| Acer Predator Triton 300 SE | |
| Asus ROG Zephyrus G14 GA402RK | |
| Average of class Gaming (6662 - 11833, n=199, last 2 years) | |
| Alienware x14 i7 RTX 3060 | |
| Lenovo Yoga Pro 7 14IRH G8 | |
| Razer Blade 14 Ryzen 9 6900HX | |
| PCMark 10 / Digital Content Creation | |
| Asus ROG Zephyrus G14 GA402XY | |
| Average AMD Ryzen 9 7940HS, NVIDIA GeForce RTX 4090 Laptop GPU () | |
| Asus ROG Zephyrus M16 GU604VY-NM042X | |
| Asus ROG Zephyrus G14 GA402RK | |
| Average of class Gaming (6462 - 18475, n=199, last 2 years) | |
| Razer Blade 14 Ryzen 9 6900HX | |
| Acer Predator Triton 300 SE | |
| Lenovo Yoga Pro 7 14IRH G8 | |
| Lenovo Legion Pro 7 16IRX8H | |
| Alienware x14 i7 RTX 3060 | |
| CrossMark / Overall | |
| Asus ROG Zephyrus M16 GU604VY-NM042X | |
| Acer Predator Triton 300 SE | |
| Alienware x14 i7 RTX 3060 | |
| Average of class Gaming (1247 - 2334, n=170, last 2 years) | |
| Asus ROG Zephyrus G14 GA402XY | |
| Average AMD Ryzen 9 7940HS, NVIDIA GeForce RTX 4090 Laptop GPU () | |
| Apple MacBook Pro 14 2023 M2 Pro | |
| Lenovo Yoga Pro 7 14IRH G8 | |
| CrossMark / Productivity | |
| Acer Predator Triton 300 SE | |
| Asus ROG Zephyrus M16 GU604VY-NM042X | |
| Alienware x14 i7 RTX 3060 | |
| Average of class Gaming (1299 - 2204, n=170, last 2 years) | |
| Asus ROG Zephyrus G14 GA402XY | |
| Average AMD Ryzen 9 7940HS, NVIDIA GeForce RTX 4090 Laptop GPU () | |
| Lenovo Yoga Pro 7 14IRH G8 | |
| Apple MacBook Pro 14 2023 M2 Pro | |
| CrossMark / Creativity | |
| Apple MacBook Pro 14 2023 M2 Pro | |
| Asus ROG Zephyrus M16 GU604VY-NM042X | |
| Acer Predator Triton 300 SE | |
| Asus ROG Zephyrus G14 GA402XY | |
| Average AMD Ryzen 9 7940HS, NVIDIA GeForce RTX 4090 Laptop GPU () | |
| Alienware x14 i7 RTX 3060 | |
| Average of class Gaming (1275 - 2514, n=170, last 2 years) | |
| Lenovo Yoga Pro 7 14IRH G8 | |
| CrossMark / Responsiveness | |
| Acer Predator Triton 300 SE | |
| Alienware x14 i7 RTX 3060 | |
| Average of class Gaming (1030 - 2330, n=170, last 2 years) | |
| Asus ROG Zephyrus M16 GU604VY-NM042X | |
| Asus ROG Zephyrus G14 GA402XY | |
| Average AMD Ryzen 9 7940HS, NVIDIA GeForce RTX 4090 Laptop GPU () | |
| Lenovo Yoga Pro 7 14IRH G8 | |
| Apple MacBook Pro 14 2023 M2 Pro | |
| PCMark 10 Score | 8253 points | |
Help | ||
We also performed the PugetBench tests for the two Adobe apps Photoshop and Premiere Pro. The G14 performs very well in Adobe Photoshop and can keep up with the powerful (and much larger) rivals, but the performance drops in Premiere Pro. We also included the performance while exporting videos on DaVinci Resolve (4K H.264) from 6K RAW source files:
| Device | Time for export |
|---|---|
| Asus ROG Zephyrus G14 (Ryzen 9, 7940HS) | 5:26 minutes |
| Lenovo Legion 7 (Core i9-13900HX, RTX 4090) | 4:54 minutes |
| Asus ROG Flow X16 (Core i9-13900H, RTX 4060) | 6:42 minutes |
| MSI Stealth 14 Studio (Core i7-13700H, RTX 4050) | 7:50 minutes |
| Asus ROG Scar 17 SE (Ryzen 9 7945HX, RTX 4090) | 4:37 minutes |
| Asus ROG Scar G16 (Core i9-13980HX, RTX 4080) | 5:32 minutes |
| Premiere Pro PugetBench - Overall Score 0.9 | |
| MSI Stealth 17 Studio A13VH-014 | |
| Asus Zephyrus Duo 16 GX650PY-NM006W | |
| MSI Titan GT77 HX 13VI | |
| Apple MacBook Pro 14 2023 M2 Pro | |
| Asus ROG Zephyrus G14 GA402XY | |
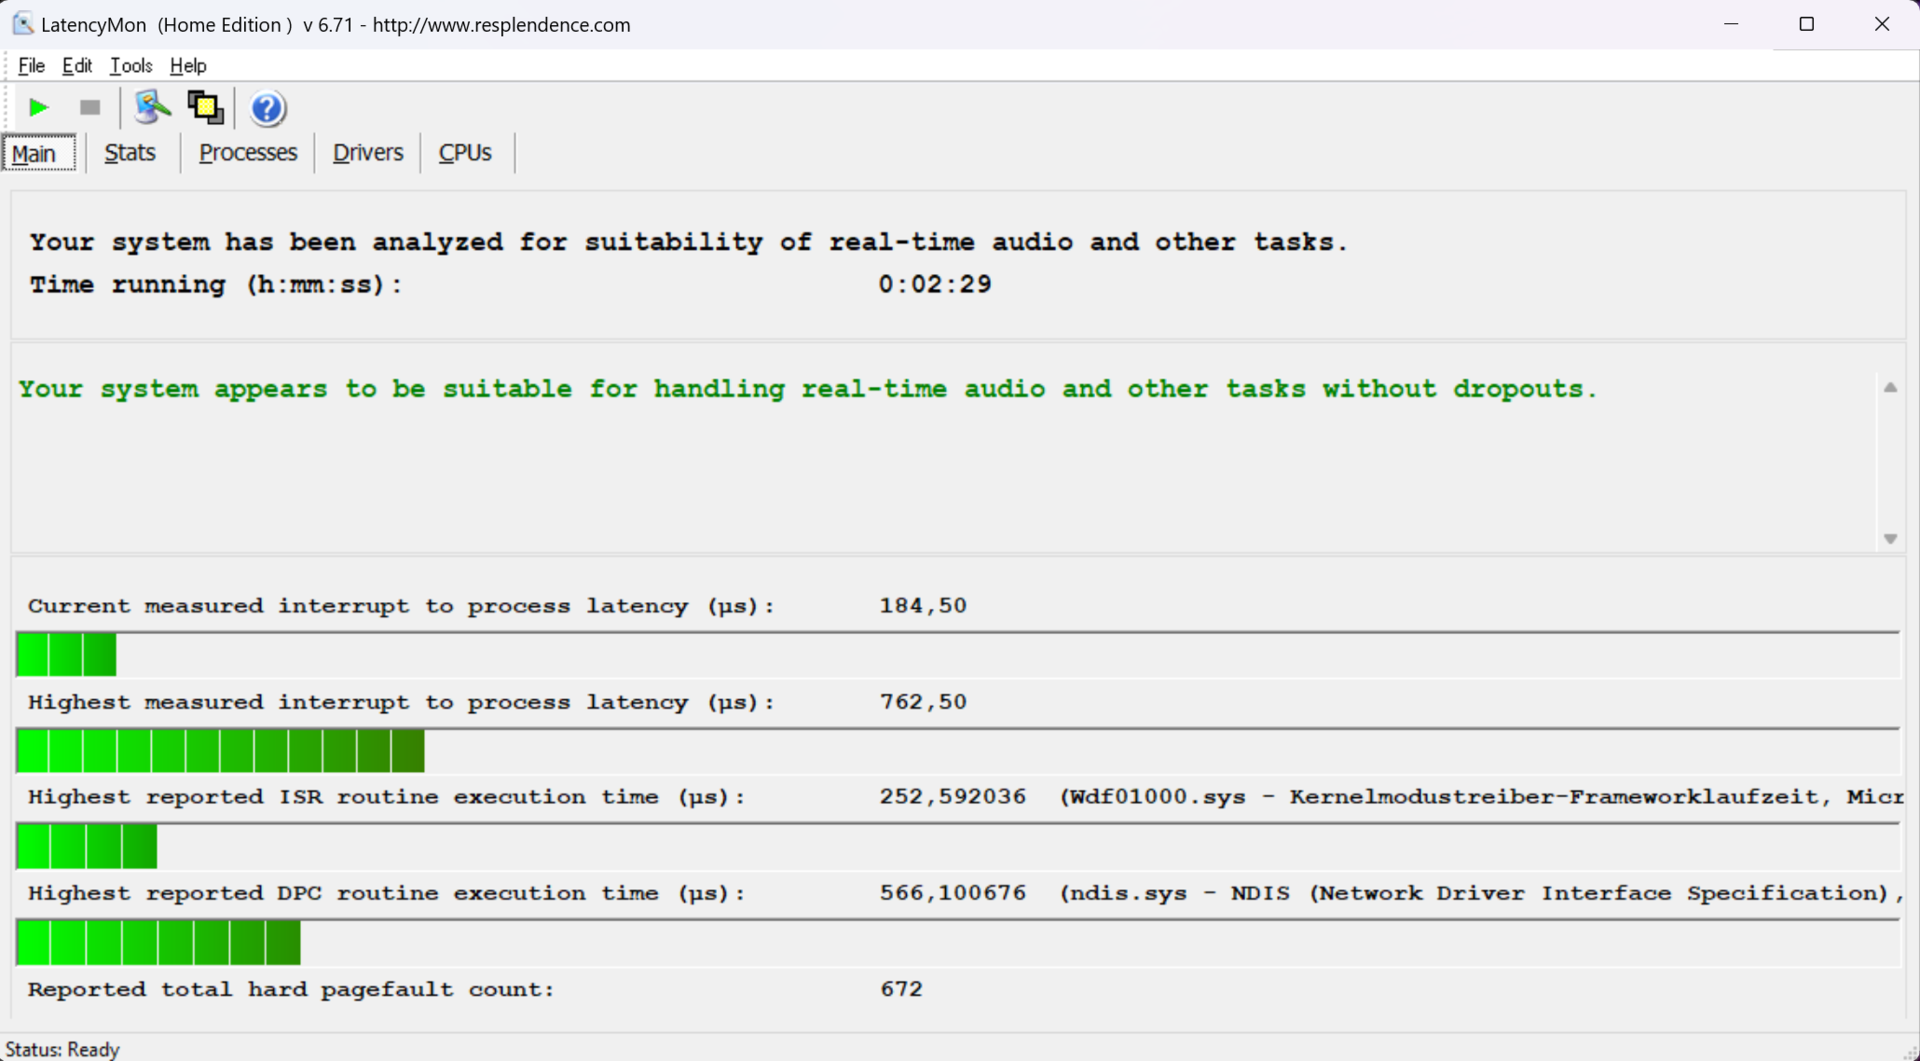
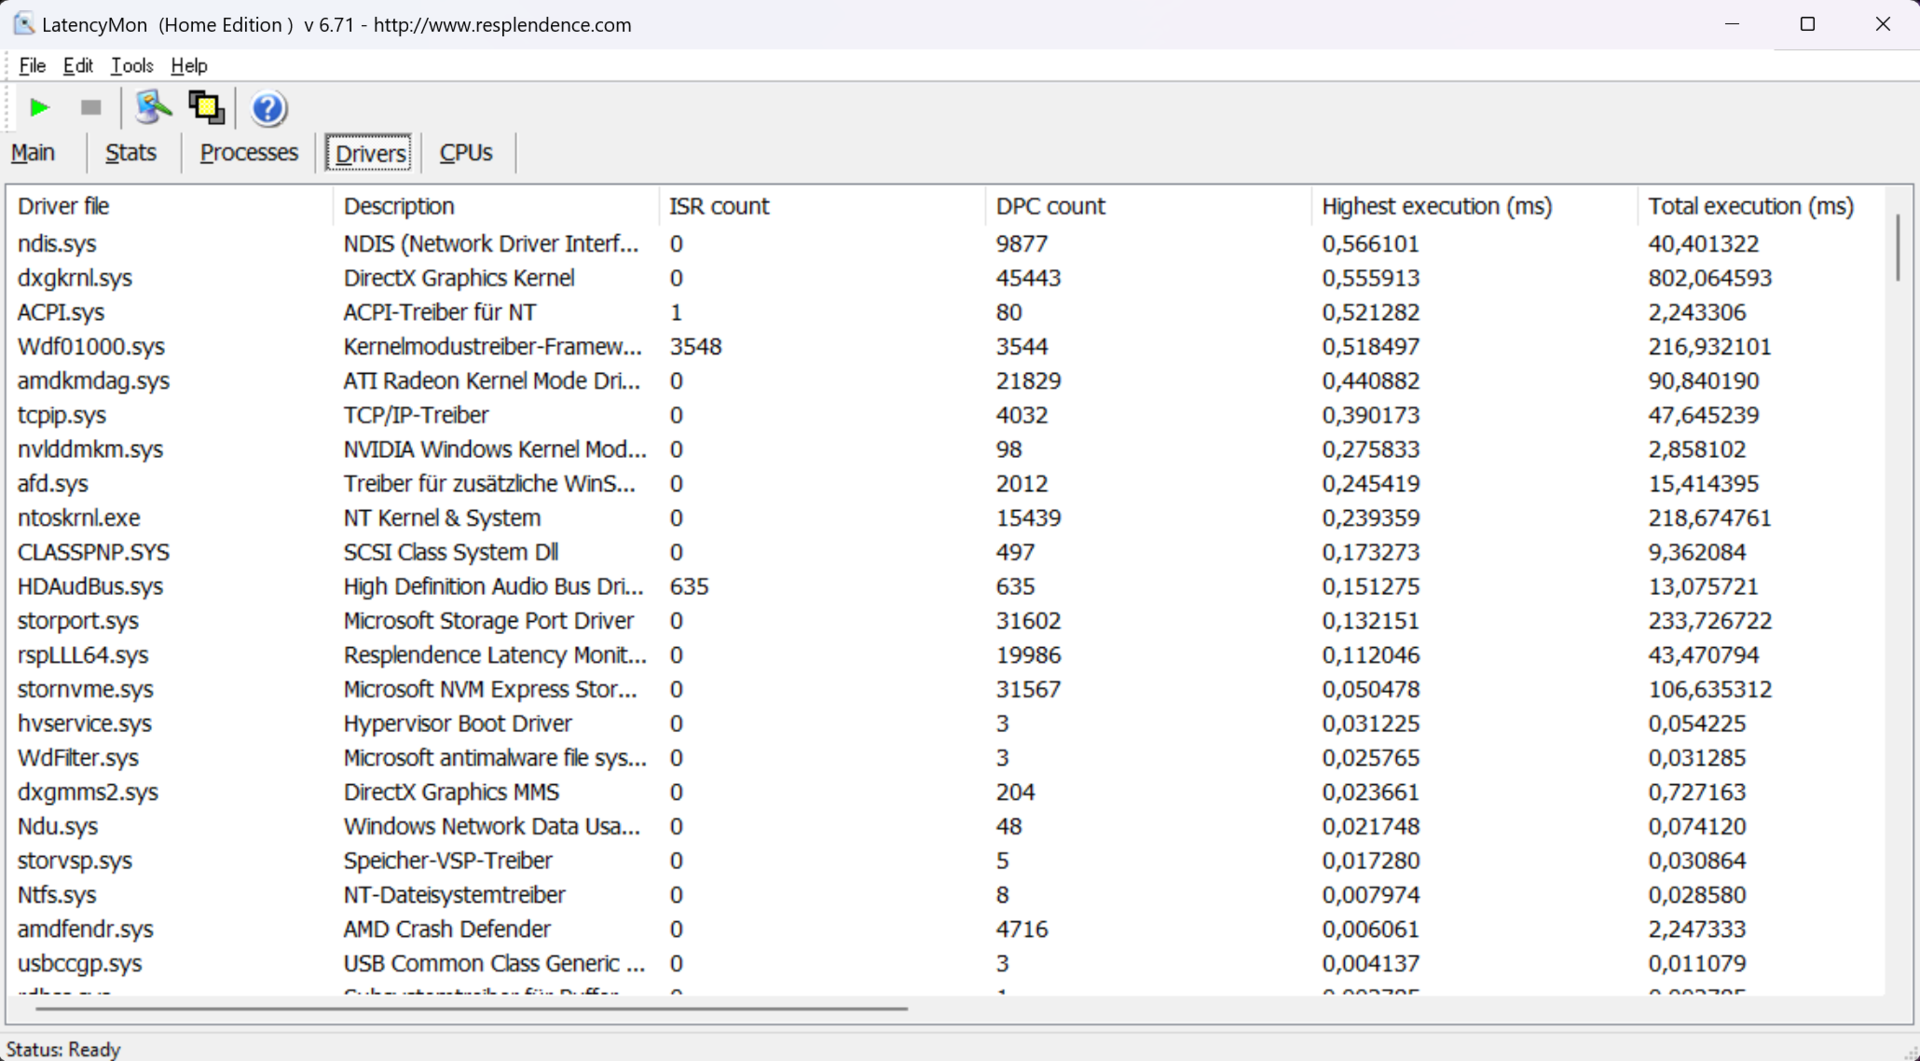
DPC-Latency
The review unit does not show any limitations in our standardized latency test (web browsing, 4K YouTube video playback, CPU load), so it is suitable for real-time audio applications.
| DPC Latencies / LatencyMon - interrupt to process latency (max), Web, Youtube, Prime95 | |
| Asus ROG Zephyrus G14 GA402RK | |
| Acer Predator Triton 300 SE | |
| Razer Blade 14 Ryzen 9 6900HX | |
| Alienware x14 i7 RTX 3060 | |
| Asus ROG Zephyrus G14 GA402XY | |
* ... smaller is better
Storage Devices
The 2023 ROG G14 once again offers one M.2-2280 slot, which is attached via PCIe-4.0 interface. Our review unit is equipped with the 1 TB version of the Samsung PM9A1 (OEM version of the 980 Pro) and the overall performance is very good. The performance is also very stable under sustained load, which is not a matter of course for modern laptops. Out of the box, you can 865 GB for your own files and apps. More SSD benchmarks are listed here.

* ... smaller is better
Disk Throttling: DiskSpd Read Loop, Queue Depth 8
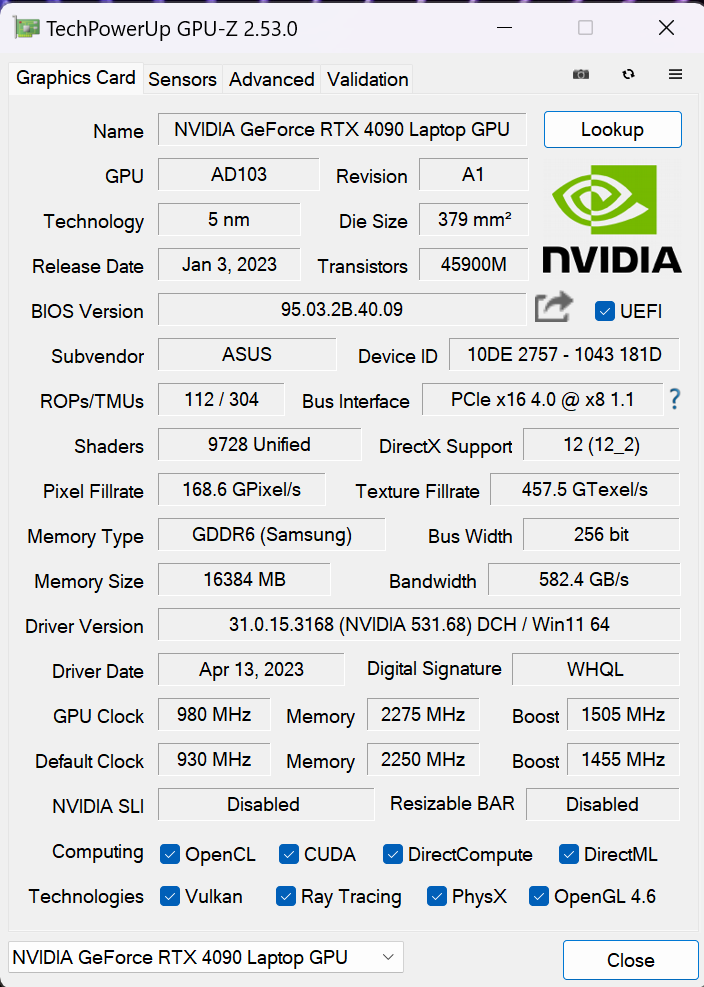
GPU Performance - RTX 4090 Laptop
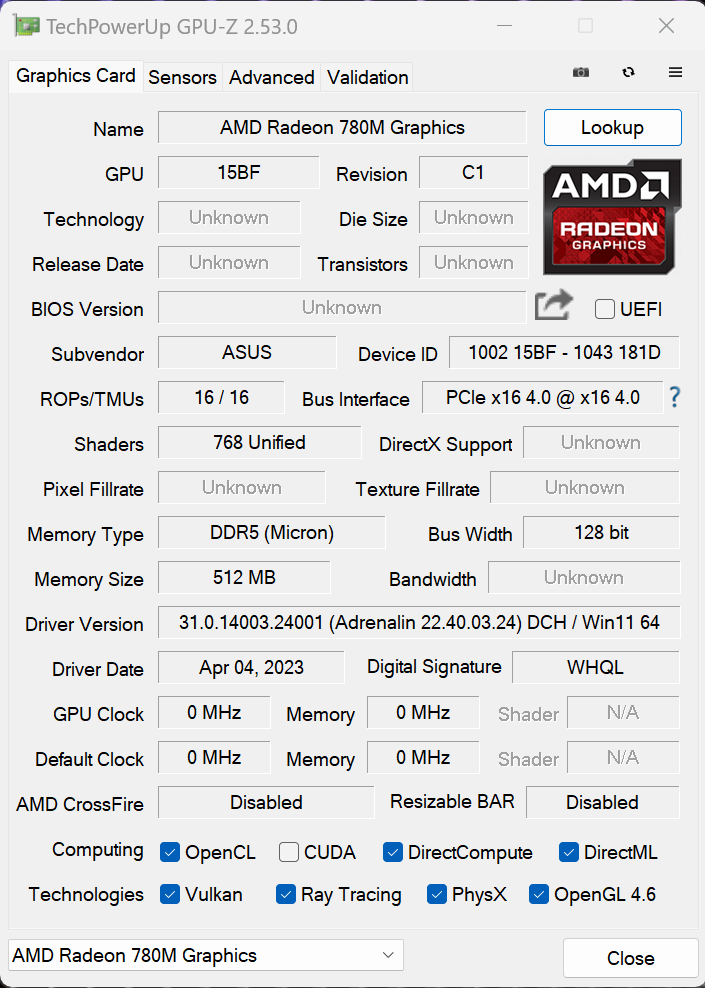
The AMD processor is equipped with the new iGPU Radeon 780M, which handles the graphics output in daily situations. We will have a closer look at the new iGPU in a dedicated article shortly. The Zephyrus G14 supports the Advanced Optimus technology, so the system cut our the iGPU without a restart. This is a comfortable solution to ensure maximum GPU performance and not wasting any power for all other tasks. The automatic switching works reliably, but there is a small stutter (1-2 seconds) when the system switches to the dGPU (when you launch a game, for example). If you don’t like this behavior, you can also switch to the “Optimus” setting in Nvidia’s control panel, which means the iGPU is not circumvented.
The RTX 4090 Laptop with 16 GB VRAM can consume up to 125 Watts in Turbo mode (100W TGP + 25W Dynamic Boost), so it is not the fastest RTX 4090 on the market. However, the GPU in the review unit still performs very well and the average RTX 4090 Laptop in our database is just 15 % faster. You will not find a more powerful 14-inch device right now. Compared to the previous ROG Zephyrus G14 with the Radeon RX 6800S, the new version is 65 % faster in the benchmarks.
The GPU performance is completely stable during longer workloads (Time Spy stress test: 99.1 %), but the performance is much lower on battery power. The GPU can only consume 55W on battery, which results in a performance deficit of about 52 %. More GPU benchmarks are available here.
| 3DMark 11 Performance | 41745 points | |
| 3DMark Fire Strike Score | 34720 points | |
| 3DMark Time Spy Score | 16719 points | |
Help | ||
| Blender / v3.3 Classroom OPTIX/RTX | |
| Acer Predator Triton 300 SE | |
| Lenovo Yoga Pro 7 14IRH G8 | |
| Average of class Gaming (9 - 142, n=180, last 2 years) | |
| Asus ROG Zephyrus M16 GU604VY-NM042X | |
| Lenovo Legion Pro 7 16IRX8H | |
| Asus ROG Strix G16 G614JZ | |
| Asus Zephyrus Duo 16 GX650PY-NM006W | |
| Asus ROG Zephyrus G14 GA402XY | |
| Average NVIDIA GeForce RTX 4090 Laptop GPU (9 - 19, n=34) | |
| Blender / v3.3 Classroom CUDA | |
| Acer Predator Triton 300 SE | |
| Lenovo Yoga Pro 7 14IRH G8 | |
| Average of class Gaming (16 - 175, n=187, last 2 years) | |
| Lenovo Legion Pro 7 16IRX8H | |
| Asus ROG Zephyrus G14 GA402XY | |
| Asus ROG Strix G16 G614JZ | |
| Asus Zephyrus Duo 16 GX650PY-NM006W | |
| Average NVIDIA GeForce RTX 4090 Laptop GPU (16 - 24, n=34) | |
| Asus ROG Zephyrus M16 GU604VY-NM042X | |
| Blender / v3.3 Classroom CPU | |
| Lenovo Yoga Pro 7 14IRH G8 | |
| Acer Predator Triton 300 SE | |
| Apple MacBook Pro 14 2023 M2 Pro | |
| Average of class Gaming (138 - 962, n=199, last 2 years) | |
| Asus ROG Zephyrus G14 GA402XY | |
| Asus ROG Zephyrus M16 GU604VY-NM042X | |
| Average NVIDIA GeForce RTX 4090 Laptop GPU (144 - 287, n=34) | |
| Lenovo Legion Pro 7 16IRX8H | |
| Asus ROG Strix G16 G614JZ | |
| Asus Zephyrus Duo 16 GX650PY-NM006W | |
| Blender / v3.3 Classroom METAL | |
| Apple MacBook Pro 14 2023 M2 Pro | |
* ... smaller is better
Gaming Performance
Our gaming benchmarks show a slightly wider gap compared to larger gaming laptops, which is a result of the processor or the TDP/TGP configuration, respectively. The AMD Ryzen 9 7940HS in the G14 is limited to 35W in combined workloads, which is mainly noticeable in the 1080p tests. However, the overall gaming performance is still very good and we see an advantage of ~50 % compared to last year’s model.
The performance of the G14 is also very good at higher resolutions and is usually comparable to fast RTX 4080 models, which means you can easily play all modern games at the highest settings in QHD. The gaming performance is also stable during longer sessions. More gaming benchmarks with the RTX 4090 are listed in our tech section.
| Call of Duty Modern Warfare 2 2022 | |
| 1920x1080 Extreme Quality Preset AA:T2X Filmic SM | |
| Asus Zephyrus Duo 16 GX650PY-NM006W | |
| Average NVIDIA GeForce RTX 4090 Laptop GPU (141 - 182, n=13) | |
| Asus ROG Zephyrus M16 GU604VY-NM042X | |
| Asus ROG Strix G16 G614JZ | |
| Asus ROG Zephyrus G14 GA402XY | |
| Lenovo Legion Pro 7 16IRX8H | |
| Average of class Gaming (15 - 182, n=39, last 2 years) | |
| 2560x1440 Extreme Quality Preset AA:T2X Filmic SM | |
| Average NVIDIA GeForce RTX 4090 Laptop GPU (104 - 137, n=14) | |
| Asus Zephyrus Duo 16 GX650PY-NM006W | |
| Asus ROG Zephyrus M16 GU604VY-NM042X | |
| Asus ROG Strix G16 G614JZ | |
| Lenovo Legion Pro 7 16IRX8H | |
| Asus ROG Zephyrus G14 GA402XY | |
| Average of class Gaming (47 - 137, n=35, last 2 years) | |
| 3840x2160 Extreme Quality Preset AA:T2X Filmic SM | |
| Average NVIDIA GeForce RTX 4090 Laptop GPU (63 - 86, n=12) | |
| Asus ROG Zephyrus M16 GU604VY-NM042X | |
| Lenovo Legion Pro 7 16IRX8H | |
| Average of class Gaming (34 - 86, n=21, last 2 years) | |
| Asus ROG Zephyrus G14 GA402XY | |
| Far Cry 6 | |
| 3840x2160 Ultra Graphics Quality + HD Textures AA:T | |
| Average NVIDIA GeForce RTX 4090 Laptop GPU (64 - 92, n=10) | |
| Asus ROG Zephyrus M16 GU604VY-NM042X | |
| Asus ROG Zephyrus G14 GA402XY | |
| Average of class Gaming (3.38 - 92, n=18, last 2 years) | |
| 2560x1440 Ultra Graphics Quality + HD Textures AA:T | |
| Average NVIDIA GeForce RTX 4090 Laptop GPU (85 - 146, n=12) | |
| Asus Zephyrus Duo 16 GX650PY-NM006W | |
| Asus ROG Zephyrus M16 GU604VY-NM042X | |
| Asus ROG Zephyrus G14 GA402XY | |
| Average of class Gaming (21.5 - 146, n=28, last 2 years) | |
| Asus ROG Zephyrus G14 GA402RK | |
| 1920x1080 Ultra Graphics Quality + HD Textures AA:T | |
| Average NVIDIA GeForce RTX 4090 Laptop GPU (91 - 167, n=12) | |
| Asus Zephyrus Duo 16 GX650PY-NM006W | |
| Asus ROG Zephyrus M16 GU604VY-NM042X | |
| Average of class Gaming (14.7 - 167, n=35, last 2 years) | |
| Asus ROG Zephyrus G14 GA402RK | |
| Asus ROG Zephyrus G14 GA402XY | |
We also checked some titles with Nvidia’s DLSS upsampling with the quality preset and frame generation. If available, we also activated ray tracing. The following results show impressive performance gains:
| Title | Nativ | DLSS Quality + FG + RT (if available) | Difference |
|---|---|---|---|
| Hogwarts Legacy | 43.1 FPS | 80.5 FPS | +86 % |
| Miles Morales | 50.8 FPS | 94.9 FPS | +87 % |
| Cyberpunk 2077 | 31.3 FPS | 81.9 FPS | +162 % |
| Witcher 3 4.00 | 33.6 FPS | 73.6 FPS | +119 % |
| Dying Light 2 | 34.8 FPS | 91.8 FPS | +163 % |
Witcher 3 FPS Chart
| low | med. | high | ultra | QHD | 4K DLSS | 4K | |
| GTA V (2015) | 172.3 | 114 | 108.9 | 143.3 | |||
| The Witcher 3 (2015) | 150.6 | 116.3 | |||||
| Dota 2 Reborn (2015) | 166.5 | 161 | 142.1 | 134.1 | |||
| Final Fantasy XV Benchmark (2018) | 186.7 | 145.5 | 113 | ||||
| X-Plane 11.11 (2018) | 121.3 | 105.2 | 82.7 | ||||
| Far Cry 5 (2018) | 142 | 130 | 123 | 75 | |||
| Strange Brigade (2018) | 306 | 274 | 218 | 126.3 | |||
| Shadow of the Tomb Raider (2018) | 166 | 166 | 135 | 73 | |||
| Assassin´s Creed Valhalla (2020) | 144 | 129 | 102 | 61 | |||
| F1 2021 (2021) | 276 | 169.6 | 140 | 89.9 | |||
| Far Cry 6 (2021) | 103 | 95 | 96 | 64 | |||
| Cyberpunk 2077 1.6 (2022) | 114.72 | 105.43 | 78 | 38.84 | |||
| Tiny Tina's Wonderlands (2022) | 168 | 141.12 | 103.39 | 53.27 | |||
| F1 22 (2022) | 220 | 98.4 | 65.9 | 36.8 | |||
| A Plague Tale Requiem (2022) | 87.1 | 77.4 | 58.9 | 48.4 | 33.1 | ||
| Call of Duty Modern Warfare 2 2022 (2022) | 147 | 141 | 104 | 86 | 63 | ||
| The Callisto Protocol (2022) | 116.43 | 102.64 | 82.09 | 48.14 | |||
| Hogwarts Legacy (2023) | 82.2 | 74.9 | 66.1 | 37.2 | |||
| The Last of Us (2023) | 103.1 | 92 | 68.2 | 54.3 | 34.9 |
Emissions - Gamer with moderate surface temperatures
System Noise
The noise level of the two fans depends massively on the power profile and they react very quickly to load in Turbo mode. This is okay for this mode and we recommend you use the Silent profile for undemanding tasks and just switch to another profile when you need more power. You should also check the performance of your favorite games in the slower profiles. If the performance is still okay, you can benefit from quieter fans. The G14 is pretty loud at 52 dB(A) in Turbo mode, but the fan noise does not show any signs of annoying frequencies and the noise levels are still okay considering the amount of performance and the compact chassis. There are plenty of larger gaming laptops where the fans are even louder. We occasionally noticed some minor electronic noises during synthetic and gaming benchmarks.
| Silent | Performance | Turbo | |
|---|---|---|---|
| 3DMark 06 | 29.5 dB(A) | 33 dB(A) | 49.5 dB(A) |
| Witcher 3 | 39.9 dB(A) | 46.2 dB(A) | 52.2 dB(A) |
| Cyberpunk 2077 | 39.9 dB(A) | 46.2 dB(A) | 52.2 dB(A) |
| Stress test | 39.9 dB(A) | 46.2 dB(A) | 52.2 dB(A) |
| Cinebench R23 Multi | 34.7 dB(A) | 39.9 dB(A) | 52.2 dB(A) |
Noise Level
| Idle |
| 23.6 / 23.6 / 33 dB(A) |
| Load |
| 49.5 / 52.2 dB(A) |
 | ||
30 dB silent 40 dB(A) audible 50 dB(A) loud |
||
min: | ||
| Asus ROG Zephyrus G14 GA402XY NVIDIA GeForce RTX 4090 Laptop GPU, R9 7940HS, Samsung PM9A1 MZVL21T0HCLR | Razer Blade 14 Ryzen 9 6900HX GeForce RTX 3070 Ti Laptop GPU, R9 6900HX, Samsung PM9A1 MZVL21T0HCLR | Asus ROG Zephyrus G14 GA402RK Radeon RX 6800S, R9 6900HS, Micron 2450 1TB MTFDKBK1T0TFK | Alienware x14 i7 RTX 3060 GeForce RTX 3060 Laptop GPU, i7-12700H, WDC PC SN810 1TB | Acer Predator Triton 300 SE GeForce RTX 3060 Laptop GPU, i9-12900H, Micron 3400 1TB MTFDKBA1T0TFH | Apple MacBook Pro 14 2023 M2 Pro M2 Pro 19-Core GPU, M2 Pro, Apple SSD AP2048Z | |
|---|---|---|---|---|---|---|
| Noise | 14% | 5% | 2% | -2% | 15% | |
| off / environment * | 23.3 | 23.3 -0% | 24 -3% | 24.7 -6% | 23.8 -2% | 23.9 -3% |
| Idle Minimum * | 23.6 | 23.3 1% | 24 -2% | 24.7 -5% | 23.8 -1% | 23.9 -1% |
| Idle Average * | 23.6 | 23.3 1% | 26 -10% | 24.7 -5% | 23.8 -1% | 23.9 -1% |
| Idle Maximum * | 33 | 23.3 29% | 31 6% | 30.9 6% | 30.6 7% | 23.9 28% |
| Load Average * | 49.5 | 34.7 30% | 45 9% | 40 19% | 44.2 11% | 26 47% |
| Witcher 3 ultra * | 52.2 | 42.1 19% | 43 18% | 51.5 1% | 60.1 -15% | |
| Load Maximum * | 52.2 | 42.1 19% | 45 14% | 51.5 1% | 60 -15% | 43.2 17% |
* ... smaller is better
Temperature
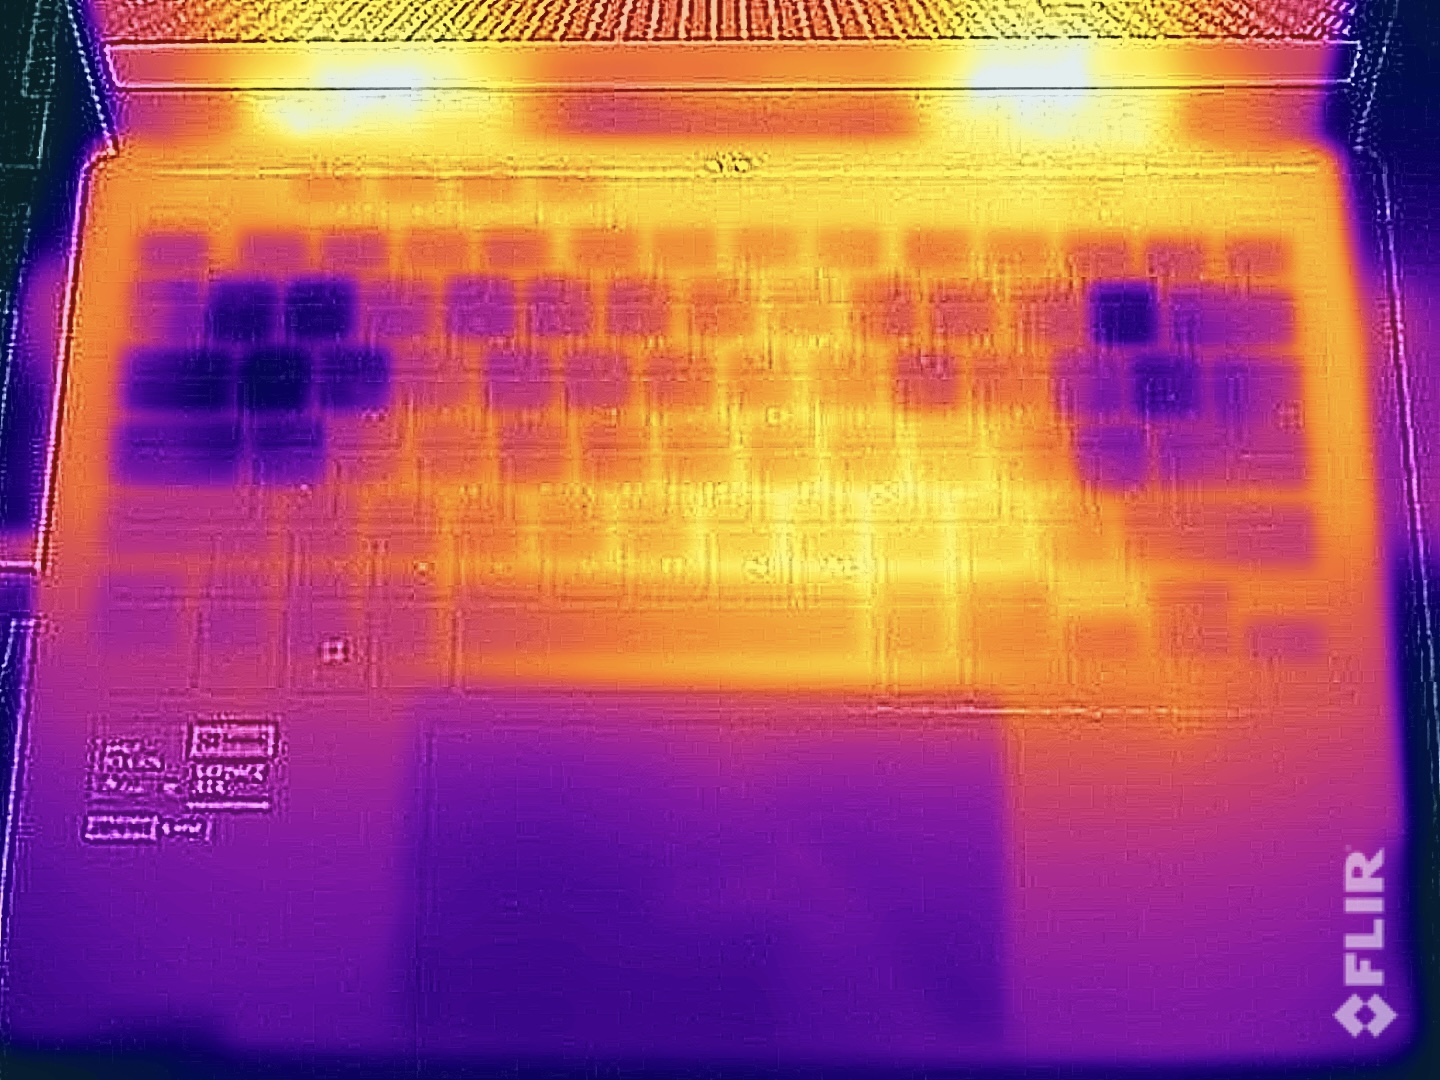
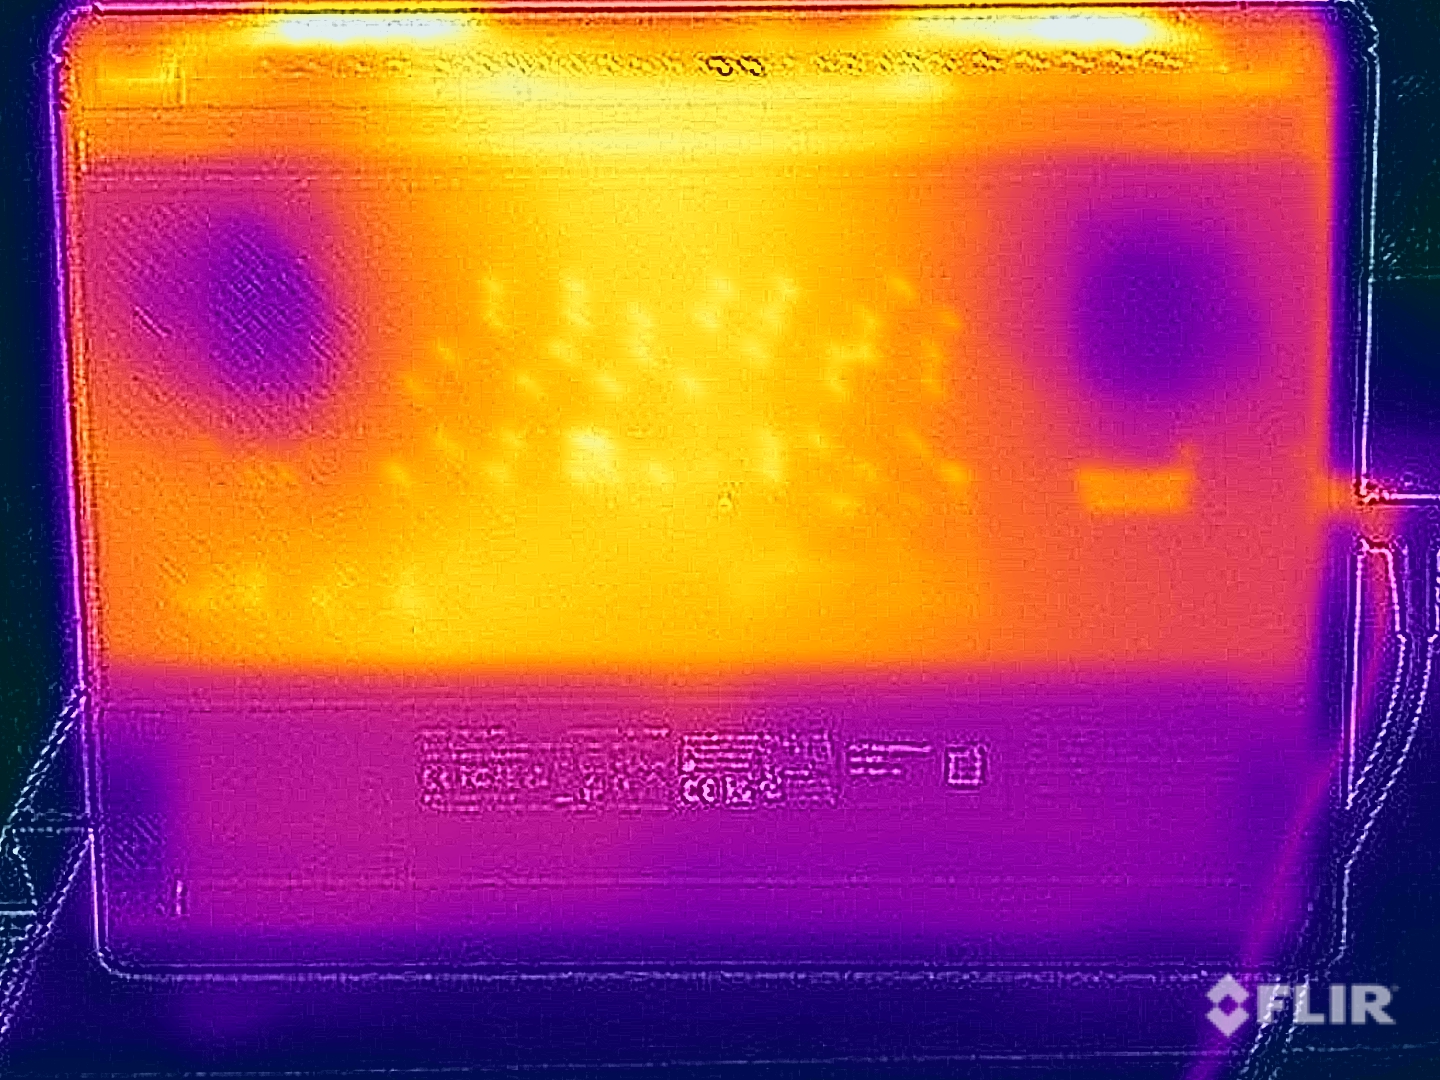
Asus manages the surface temperatures of the G14 very well considering the high performance and the compact size. The case is very cool in light workloads and we can measure up to 46 °C in the upper center section during the stress test and gaming. This is obviously noticeable while typing and the fingers can get a bit sweaty, but there are no limitations. Thanks to the ergo-lift hinges, you can even put the G14 on your lap under load. All in all, the cooling solution with liquid metal and the vapor chamber works really well.
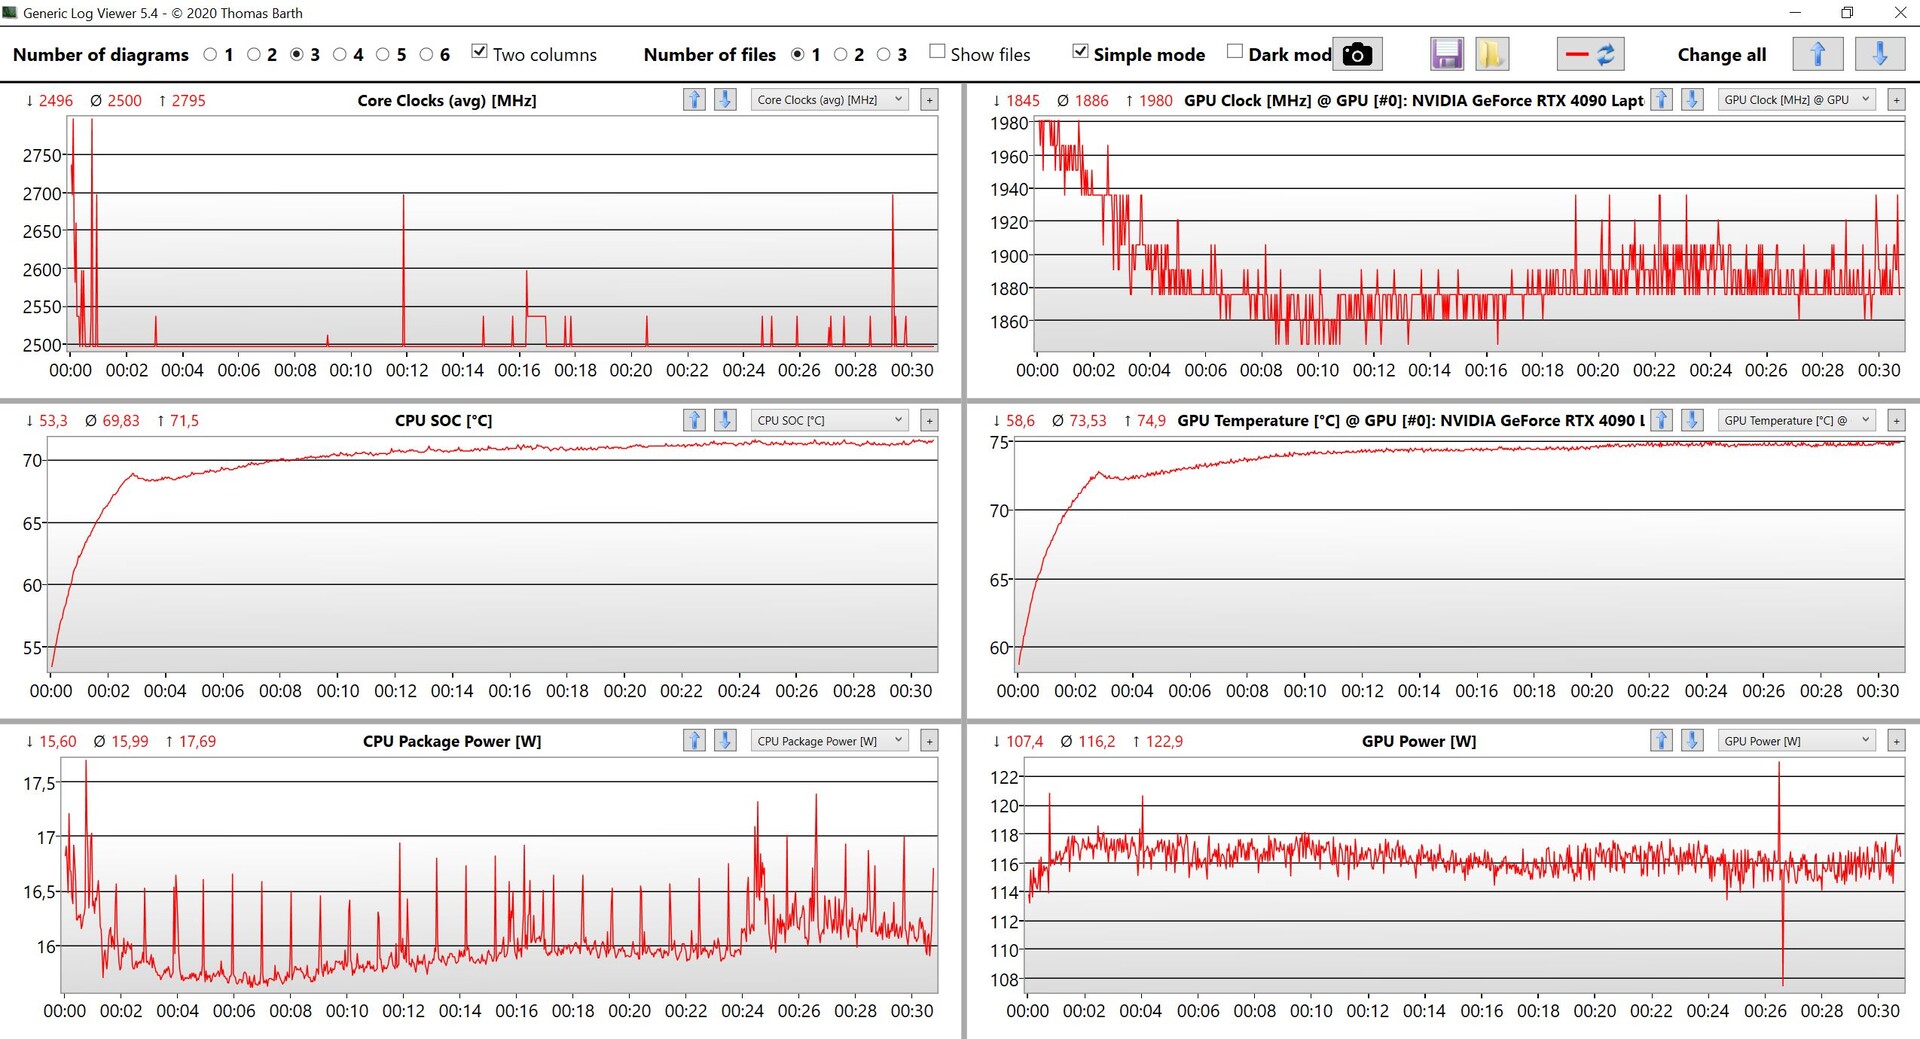
The behavior during the stress test is identical to the advertised specs and the dedicated GPU is clearly favored. After a couple of minutes, the processor levels off at 35W and the GPU at 100 Watts. There was no performance deficit immediately after the stress test.
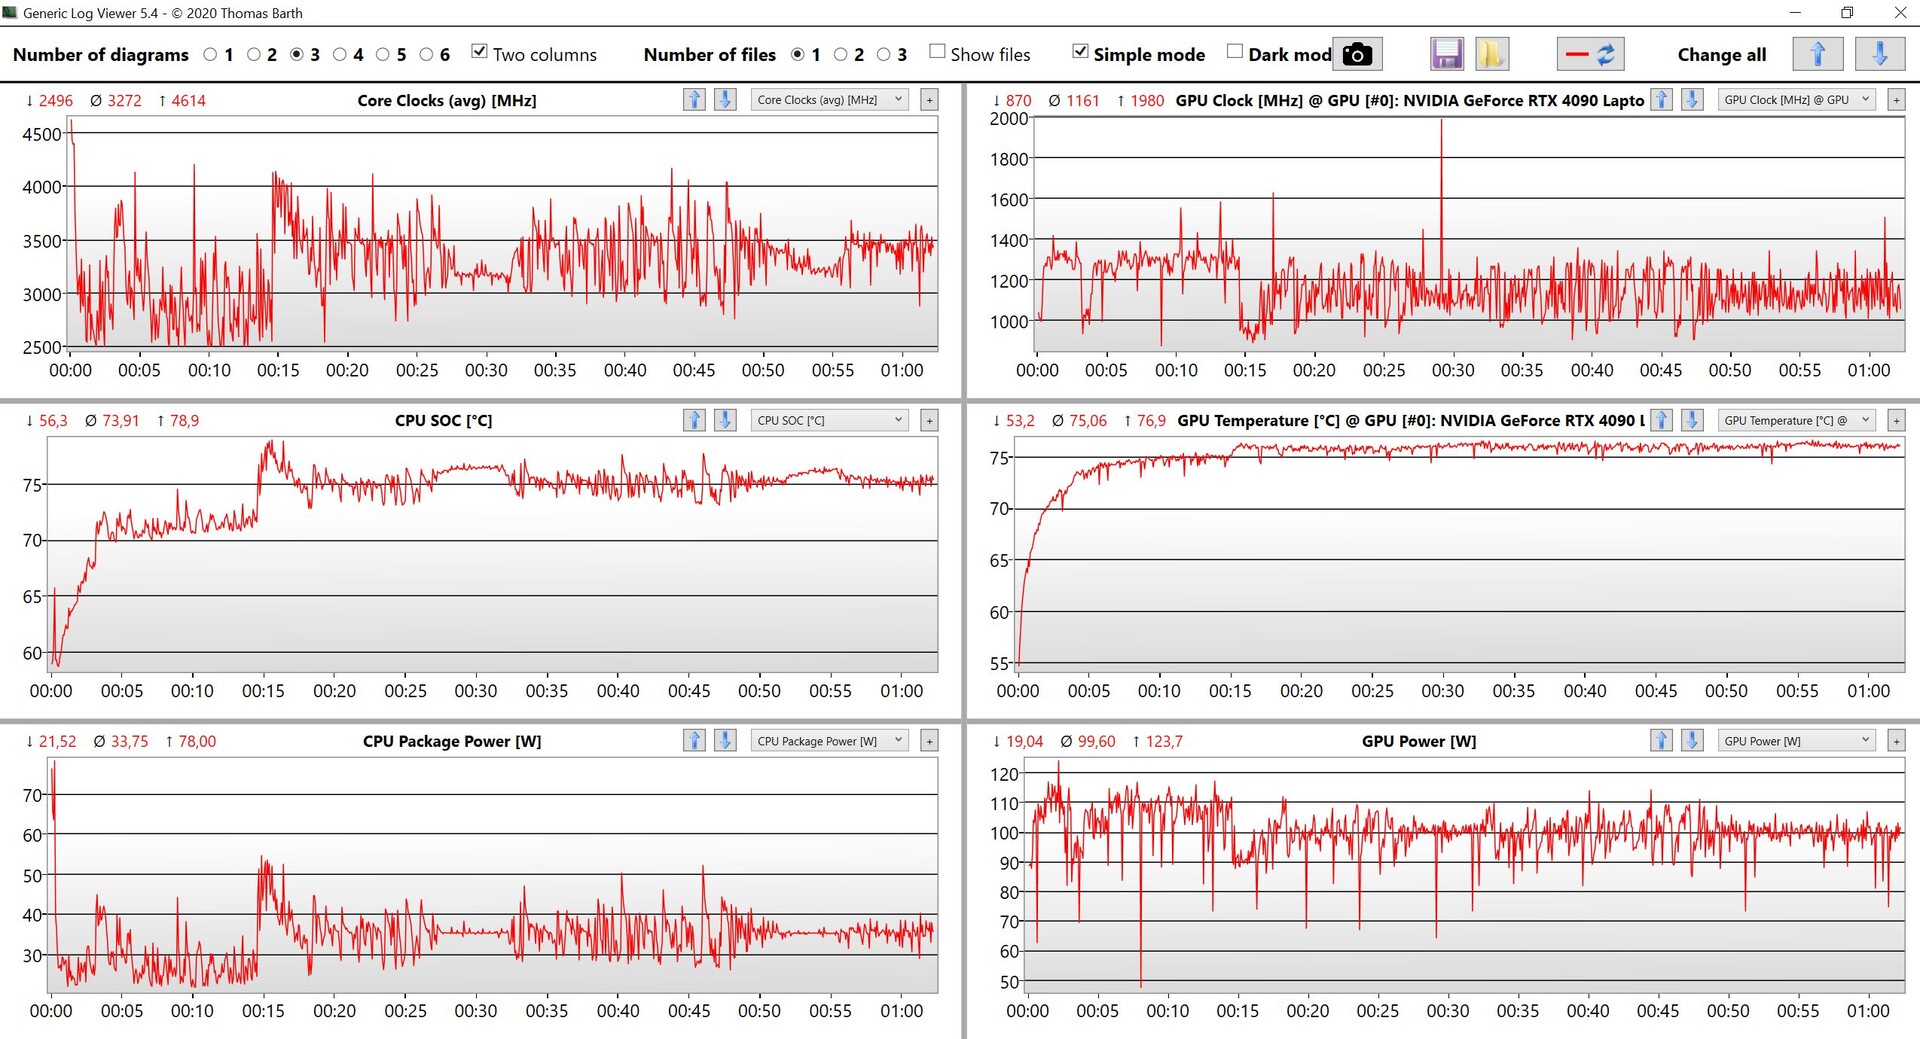
(-) The maximum temperature on the upper side is 47 °C / 117 F, compared to the average of 40.4 °C / 105 F, ranging from 21.2 to 68.8 °C for the class Gaming.
(-) The bottom heats up to a maximum of 46.5 °C / 116 F, compared to the average of 43.2 °C / 110 F
(+) In idle usage, the average temperature for the upper side is 25.1 °C / 77 F, compared to the device average of 33.8 °C / 93 F.
(-) Playing The Witcher 3, the average temperature for the upper side is 40.7 °C / 105 F, compared to the device average of 33.8 °C / 93 F.
(±) The palmrests and touchpad can get very hot to the touch with a maximum of 36.9 °C / 98.4 F.
(-) The average temperature of the palmrest area of similar devices was 28.9 °C / 84 F (-8 °C / -14.4 F).
| Asus ROG Zephyrus G14 GA402XY AMD Ryzen 9 7940HS, NVIDIA GeForce RTX 4090 Laptop GPU | Razer Blade 14 Ryzen 9 6900HX AMD Ryzen 9 6900HX, NVIDIA GeForce RTX 3070 Ti Laptop GPU | Asus ROG Zephyrus G14 GA402RK AMD Ryzen 9 6900HS, AMD Radeon RX 6800S | Alienware x14 i7 RTX 3060 Intel Core i7-12700H, NVIDIA GeForce RTX 3060 Laptop GPU | Acer Predator Triton 300 SE Intel Core i9-12900H, NVIDIA GeForce RTX 3060 Laptop GPU | Apple MacBook Pro 14 2023 M2 Pro Apple M2 Pro, Apple M2 Pro 19-Core GPU | |
|---|---|---|---|---|---|---|
| Heat | -14% | -16% | -1% | -0% | 13% | |
| Maximum Upper Side * | 47 | 40.6 14% | 55 -17% | 51.3 -9% | 43 9% | 46.9 -0% |
| Maximum Bottom * | 46.5 | 42.6 8% | 55 -18% | 44.4 5% | 46.4 -0% | 41.7 10% |
| Idle Upper Side * | 25.9 | 38 -47% | 30 -16% | 27.2 -5% | 28.2 -9% | 21.4 17% |
| Idle Bottom * | 28 | 37 -32% | 32 -14% | 26.6 5% | 28.4 -1% | 21.4 24% |
* ... smaller is better
Speakers
Asus implements two woofers and two tweeters, which are sitting above the keyboard and direct the sound towards the user. The overall result is very good and the sound appears rich with sufficient volume. Compared to Apple's MacBook Pro 14, however, the speaker system lacks a bit of punch. All in all, the modules are still suited for music and videos, but we recommend headphones or a headset during gaming due to the fan noise.
Asus ROG Zephyrus G14 GA402XY audio analysis
(±) | speaker loudness is average but good (80 dB)
Bass 100 - 315 Hz
(±) | reduced bass - on average 8.8% lower than median
(±) | linearity of bass is average (9.7% delta to prev. frequency)
Mids 400 - 2000 Hz
(+) | balanced mids - only 3.3% away from median
(+) | mids are linear (5% delta to prev. frequency)
Highs 2 - 16 kHz
(+) | balanced highs - only 2% away from median
(+) | highs are linear (4.3% delta to prev. frequency)
Overall 100 - 16.000 Hz
(+) | overall sound is linear (10% difference to median)
Compared to same class
» 4% of all tested devices in this class were better, 2% similar, 94% worse
» The best had a delta of 6%, average was 18%, worst was 132%
Compared to all devices tested
» 3% of all tested devices were better, 1% similar, 96% worse
» The best had a delta of 4%, average was 25%, worst was 134%
Apple MacBook Pro 14 2023 M2 Pro audio analysis
(+) | speakers can play relatively loud (84.3 dB)
Bass 100 - 315 Hz
(+) | good bass - only 3.8% away from median
(+) | bass is linear (6.9% delta to prev. frequency)
Mids 400 - 2000 Hz
(+) | balanced mids - only 2.1% away from median
(+) | mids are linear (2.2% delta to prev. frequency)
Highs 2 - 16 kHz
(+) | balanced highs - only 2.7% away from median
(+) | highs are linear (4.8% delta to prev. frequency)
Overall 100 - 16.000 Hz
(+) | overall sound is linear (6% difference to median)
Compared to same class
» 2% of all tested devices in this class were better, 0% similar, 98% worse
» The best had a delta of 5%, average was 18%, worst was 45%
Compared to all devices tested
» 0% of all tested devices were better, 0% similar, 100% worse
» The best had a delta of 4%, average was 25%, worst was 134%
Energy Management - Mini-LED costs runtime
Power Consumption
We record a maximum idle consumption of 15 Watts for the new ROG 14 at maximum brightness, which is surprisingly efficient. You can expect around 170 Watts during gaming and we can see a maximum consumption of 220 Watts during the start of the stress test, which will eventually also settle at 170 Watts. The 240W power adapter is therefore completely sufficient.
| Off / Standby | |
| Idle | |
| Load |
|
| Asus ROG Zephyrus G14 GA402XY R9 7940HS, NVIDIA GeForce RTX 4090 Laptop GPU, Samsung PM9A1 MZVL21T0HCLR, Mini-LED, 2560x1600, 14.00 | Razer Blade 14 Ryzen 9 6900HX R9 6900HX, GeForce RTX 3070 Ti Laptop GPU, Samsung PM9A1 MZVL21T0HCLR, IPS, 2560x1440, 14.00 | Asus ROG Zephyrus G14 GA402RK R9 6900HS, Radeon RX 6800S, Micron 2450 1TB MTFDKBK1T0TFK, IPS-Level, 2560x1600, 14.00 | Alienware x14 i7 RTX 3060 i7-12700H, GeForce RTX 3060 Laptop GPU, WDC PC SN810 1TB, IPS, 1920x1080, 14.00 | Acer Predator Triton 300 SE i9-12900H, GeForce RTX 3060 Laptop GPU, Micron 3400 1TB MTFDKBA1T0TFH, OLED, 2880x1800, 14.00 | Apple MacBook Pro 14 2023 M2 Pro M2 Pro, M2 Pro 19-Core GPU, Apple SSD AP2048Z, Mini-LED, 3024x1964, 14.20 | Average NVIDIA GeForce RTX 4090 Laptop GPU | Average of class Gaming | |
|---|---|---|---|---|---|---|---|---|
| Power Consumption | -31% | -3% | 15% | -2% | 44% | -78% | -45% | |
| Idle Minimum * | 9.4 | 10.2 -9% | 7 26% | 7.9 16% | 7.6 19% | 2.4 74% | 16.8 ? -79% | 13.8 ? -47% |
| Idle Average * | 14.2 | 26 -83% | 14 1% | 11.1 22% | 12.3 13% | 11.3 20% | 23.2 ? -63% | 19.2 ? -35% |
| Idle Maximum * | 14.5 | 26.7 -84% | 22 -52% | 11.8 19% | 17.6 -21% | 11.5 21% | 34.3 ? -137% | 27 ? -86% |
| Load Average * | 79 | 89.3 -13% | 98 -24% | 107.4 -36% | 111 -41% | 59.6 25% | 130 ? -65% | 111.3 ? -41% |
| Witcher 3 ultra * | 172 | 158.7 8% | 141 18% | 111 35% | 117.1 32% | 55.9 67% | ||
| Load Maximum * | 220.8 | 227.5 -3% | 188 15% | 140.4 36% | 245.8 -11% | 100 55% | 326 ? -48% | 251 ? -14% |
* ... smaller is better
Power consumption Witcher 3 / Stress test
Power consumption external screen
Battery Runtime
The battery capacity of 76 Wh is unchanged, but the runtimes are still a bit shorter compared to the previous model, which should mainly be a result of the Mini-LED panel. The new AMD chip might also consume a but more power, which was already the case for the Ryzen 9 7945HX. We will have a closer look at this in our CPU analysis. At 150 nits (50 % of the maximum brightness), our Wi-Fi test runs for 7.5 hours and about 5 hours at maximum brightness, both at 60 Hz. At 165 Hz, the Wi-Fi runtime at 150 nits drops to 6 hours, but the difference at maximum brightness is negligible with just 10 minutes.
All in all, the battery runtime is okay, but not great and most rivals manage longer runtimes. We will ad the results for the video test (our regular test at 150 nits as well as HDR test at full brightness) later. A full recharge takes around 90 minutes when the device is turned on; 50 % is available after 30 minutes and 80 % after around 50 minutes.
| Asus ROG Zephyrus G14 GA402XY R9 7940HS, NVIDIA GeForce RTX 4090 Laptop GPU, 76 Wh | Razer Blade 14 Ryzen 9 6900HX R9 6900HX, GeForce RTX 3070 Ti Laptop GPU, 62 Wh | Asus ROG Zephyrus G14 GA402RK R9 6900HS, Radeon RX 6800S, 76 Wh | Alienware x14 i7 RTX 3060 i7-12700H, GeForce RTX 3060 Laptop GPU, 80 Wh | Acer Predator Triton 300 SE i9-12900H, GeForce RTX 3060 Laptop GPU, 76 Wh | Apple MacBook Pro 14 2023 M2 Pro M2 Pro, M2 Pro 19-Core GPU, 70 Wh | Average of class Gaming | |
|---|---|---|---|---|---|---|---|
| Battery Runtime | 44% | 10% | 9% | 8% | 71% | 6% | |
| H.264 | 431 | 561 30% | 917 113% | 397 ? -8% | |||
| WiFi v1.3 | 448 | 571 27% | 572 28% | 535 19% | 374 -17% | 807 80% | 368 ? -18% |
| Load | 58 | 93 60% | 53 -9% | 45 -22% | 77 33% | 70 21% | 84.1 ? 45% |
| Reader / Idle | 732 | 1085 | 486 | 542 ? | |||
| Witcher 3 ultra | 45 | 80.6 ? |
Pros
Cons
Verdict - ROG Zephyrus G14 offers an impressive package
Asus improves the performance of the new 2023 ROG Zephyrus G14 considerable and offers a very powerful 14-inch notebook with plenty of performance for gamers and content creators. The high-quality chassis is unchanged from last year, but is now equipped with the latest and greatest from AMD as well as Nvidia.
Nvidia’s GeForce RTX 4090 Laptop operates at up to 125 Watts (~100-110W during gaming) and does not match the performance of the fastest versions, but they are usually reserved for much larger gaming laptops. The Zen4 CPU is also slowed down in combined workloads, but this is simply a result of the compact chassis. This affects the 1080p gaming performance a bit, but you ca still play all modern titles smoothly at the native QHD resolution.
The new AMD Ryzen 9 7940HS also leaves a good first impression. AMD managed to improve the single-core performance and the 9-core CPU can compete with modern Intel CPUs in multi-core tests, even though they consume more power. We will have an in-depth analysis of the new CPU and Radeon 780M iGPU (including efficiency measurements) shortly.
Maximum performance in a 14-inch notebook: Thanks to the Ryzen 9 7940HS and GeForce RTX 4090 Laptop, the new ROG Zephyrus G14 offers very powerful components in a compact 14-inch chassis. The overall performance is excellent and you also get a great 165 Hz Mini-LED panel. Pretty much the perfect package if you can afford it.
The Mini-LED panel also puts up a convincing performance in pretty much every regard, even though the MacBook Pro 14 still offers superior brightness values. The panel works extremely well for gaming and the included color profiles offer very accurate colors. It is also possible to switch the multi-zone to a single-zone illumination when you edit pictures.
This level of performance obviously has to be cooled. The surface temperatures are well in control, but the fans are pretty loud, especially in Turbo mode. Considering the performance, however, we still think the results are completely okay. The power profiles also offer a good balance and quitter fan noise if you want it. The battery runtime is just average and the performance is reduced on battery power, but that’s pretty much all the criticism we have.
The ne ROG G14 is not a cheap device at 4000 Euros, though. The smaller SKUs offer a better price-performance ratio, but you should keep in mind that both the RTX 4090 and RTX 4080 SKUs cannot utilize the full potential of the GPUs compared to larger gaming laptops with a 175W TGP limit. The situation is different for the RTX 4070 laptop and lower, because these GPUs only consume up to ~105W during gaming (independent of the TGP claim by the manufacturers).
We are already eager to see whether the rivals like the Razer Blade 14, Alienware x14 and Acer Predator Triton 300 SE can keep up. As of right now, the new ROG Zephyrus G14 does not really have any rivals in the 14-inch gaming segment.
Asus ROG Zephyrus G14 GA402XY
-
04/30/2023 v7
Andreas Osthoff
More articles related to this device
Asus ROG Zephyrus G14 GA402XY (ROG Zephyrus G14 GA402 Series)Related Articles


Transparency
The present review sample was made available to the author as a loan by the manufacturer or a shop for the purposes of review. The lender had no influence on this review, nor did the manufacturer receive a copy of this review before publication. There was no obligation to publish this review.
Pricecompare
