AMD Radeon Pro 560 vs NVIDIA GeForce GTX 1070 SLI (Desktop)
AMD Radeon Pro 560 ► remove from comparison
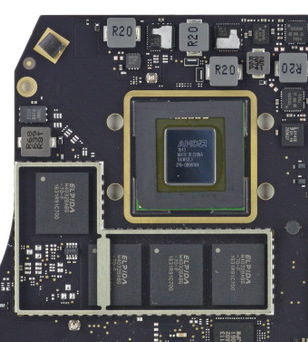
The AMD Radeon Pro 560 is a mobile graphics card based on the small Polaris 21 chip (not verified) from AMD. It is an option for the 15-inch Apple MacBook Pro (Mid 2017) and is probably very similar to the Radeon Pro 460 (except for the slightly improved process for the new Polaris 21 chip). It is similar to the desktop Radeon RX 460 , but not with all 1024 shader units.
Compared to the slower Radeon Pro 555 (entry-level model), the Radeon pro 460 is equipped with 4 GB GDDR5 memory. The average gaming performance in Windows of the Radeon Pro 460 is just above the GeForce GTX 960M and below an average GTX 965M ein. Compared to the slightly raised clocks of the desktop 500-series models, the Radeon Pro 560 should only be slightly faster.
The mobile Radeon Pro 560 should support all features of the desktop RX 460/560 like DisplayPort 1.2 (Polaris actually supports up to 1.4), HDMI 2.0 (via USB-C adapter), new H.265 video de- and encoder as well as architectural improvements. More information about the Polaris architecture is available in our dedicated review .
The Polaris 21 chip is manufactured in a slightly improved 14nm FinFET process according to AMD. The power consumption of the Radeon Pro 460 is 35 Watts according to AMD , so this should also be the case for the Pro 560.
NVIDIA GeForce GTX 1070 SLI (Desktop) ► remove from comparison
The Nvidia GeForce GTX 1070 SLI for desktops is a combination of two GTX 1070 graphics cards in SLI mode. Each card renders one frame at a time (AFR mode) but depends for most games on a good profile in the driver. Therefore, the performance can range from no gains over a single GTX 1070 to up to 90% faster performance. In most games with SLI support, the GTX 1070 SLI is therefore faster than a single GTX 1080 . However, sometimes the combination also suffers from micro-stuttering .
The technical details of the card are identical to a single GTX 1070 (see for more information) and the power consumption is doubled (2x 150 = 300 Watt).
AMD Radeon Pro 560 NVIDIA GeForce GTX 1070 SLI (Desktop) GeForce GTX 1000 Series Codename Polaris 21 Pascal GP104 SLI Architecture Polaris Pascal Pipelines 1024 - unified 3840 - unified Core Speed 907 MHz 1506 - 1683 (Boost) MHz Memory Speed 5080 MHz 8000 MHz Memory Bus Width 128 Bit 256 Bit Memory Type GDDR5 GDDR5 Max. Amount of Memory 4 GB 2x 8192 MB Shared Memory no no API DirectX 12, OpenGL Vulkan DirectX 12_1, OpenGL 4.5 Power Consumption 35 Watt 300 Watt Transistors 3 Billion 14.4 Billion technology 14 nm 16 nm Features DisplayPort 1.3 HBR / 1.4 HDR Ready, HDMI 2.0, AMD FreeSync Multi-Projection, VR Ready, G-SYNC, Vulkan, Multi Monitor, CUDA, 3D Vision, PhysX, GeForce Experience, Surround, GameStream, GPU Boost 2.0, Adaptive Vertical Sync, SLI Notebook Size large Date of Announcement 05.06.2017 16.08.2016
Benchmarks Performance Rating - 3DMark 11 + Fire Strike + Time Spy - GeForce GTX 1070 SLI (Desktop)
15.6 pt (47%)
...
NVIDIA GeForce GTX 1070 SLI (Desktop)
max:
3DMark - 3DMark Time Spy Score
1519 Points (4%)
10595 Points (31%)
3DMark - 3DMark Time Spy Graphics
1376 Points (4%)
11429 Points (30%)
3DMark - 3DMark Ice Storm Unlimited Graphics
198867 Points (23%)
373694 Points (42%)
3DMark - 3DMark Ice Storm Extreme Graphics
319308 Points (41%)
3DMark - 3DMark Cloud Gate Score
15047 Points (16%)
Model CPU GPU RAM Value Apple MacBook Pro 15 2017 (2.9 GHz, 560) i7-7820HQ Radeon Pro 560 4 GB 2.3.3693.0; v1.116 GB 15047
44914 Points (48%)
3DMark - 3DMark Cloud Gate Graphics
23105 Points (6%)
140180 Points (37%)
3DMark - 3DMark Fire Strike Standard Score
3576 Points (6%)
21076 Points (37%)
3DMark - 3DMark Fire Strike Standard Graphics
3892 Points (4%)
34226 Points (39%)
3DMark - 3DMark Ice Storm Graphics
320858 Points (38%)
3DMark 11 - 3DM11 Performance Score
5718 Points (8%)
26494 Points (37%)
3DMark 11 - 3DM11 Performance GPU
5305 Points (5%)
42691 Points (37%)
3DMark Vantage + AMD Radeon Pro 560 3DMark Vantage - 3DM Vant. Perf. total
18982 Points (6%)
3DM Vant. Perf. GPU no PhysX + AMD Radeon Pro 560 3DMark Vantage - 3DM Vant. Perf. GPU no PhysX
17782 Points (10%)
3DMark 03 - 3DMark 03 - Standard
133872 Points (70%)
3DMark 05 - 3DMark 05 - Standard
38635 Points (42%)
3DMark 06 3DMark 06 - Standard 1024x768 + AMD Radeon Pro 560
24516 Points (32%)
Model CPU GPU RAM Value 3DMark 06 - Standard 1024x768 Apple MacBook Pro 15 2017 (2.9 GHz, 560) i7-7820HQ Radeon Pro 560 4 GB 16 GB 24516
3DMark 06 - Standard 1280x1024 + NVIDIA GeForce GTX 1070 SLI (Desktop)
30179 Points (39%)
Unigine Valley 1.0 - Unigine Valley 1.0 DX
18.2 fps (6%)
97.7 fps (32%)
SPECviewperf 12 + NVIDIA GeForce GTX 1070 SLI (Desktop) SPECviewperf 12 - specvp12 sw-03
40.6 fps (10%)
specvp12 snx-02 + NVIDIA GeForce GTX 1070 SLI (Desktop) SPECviewperf 12 - specvp12 snx-02
6.4 fps (1%)
specvp12 showcase-01 + NVIDIA GeForce GTX 1070 SLI (Desktop) SPECviewperf 12 - specvp12 showcase-01
81.9 fps (18%)
specvp12 mediacal-01 + NVIDIA GeForce GTX 1070 SLI (Desktop) SPECviewperf 12 - specvp12 mediacal-01
33.9 fps (9%)
specvp12 maya-04 + NVIDIA GeForce GTX 1070 SLI (Desktop) SPECviewperf 12 - specvp12 maya-04
82.8 fps (23%)
specvp12 energy-01 + NVIDIA GeForce GTX 1070 SLI (Desktop) SPECviewperf 12 - specvp12 energy-01
7.2 fps (6%)
specvp12 creo-01 + NVIDIA GeForce GTX 1070 SLI (Desktop) SPECviewperf 12 - specvp12 creo-01
33.4 fps (13%)
specvp12 catia-04 + NVIDIA GeForce GTX 1070 SLI (Desktop) SPECviewperf 12 - specvp12 catia-04
61.5 fps (10%)
specvp12 3dsmax-05 + NVIDIA GeForce GTX 1070 SLI (Desktop) SPECviewperf 12 - specvp12 3dsmax-05
97.1 fps (17%)
Cinebench R10 Cinebench R10 Shading (32bit) + AMD Radeon Pro 560 Cinebench R10 - Cinebench R10 Shading (32bit)
9792 Points (7%)
Cinebench R11.5 Cinebench R11.5 OpenGL 64 Bit + AMD Radeon Pro 560 Cinebench R11.5 - Cinebench R11.5 OpenGL 64 Bit
74.3 fps (26%)
Cinebench R15 + AMD Radeon Pro 560 Cinebench R15 - Cinebench R15 OpenGL 64 Bit
86.8 fps (5%)
Cinebench R15 OpenGL Ref. Match 64 Bit + AMD Radeon Pro 560 Cinebench R15 - Cinebench R15 OpenGL Ref. Match 64 Bit
99.5 % (100%)
GFXBench - GFXBench Car Chase Offscreen
79.4 fps (9%)
GFXBench 3.1 - GFXBench Manhattan ES 3.1 Offscreen
76.8 fps (2%)
GFXBench 3.0 - GFXBench 3.0 Manhattan Offscreen
70 fps (4%)
GFXBench (DX / GLBenchmark) 2.7 + AMD Radeon Pro 560 GFXBench (DX / GLBenchmark) 2.7 - GFXBench T-Rex HD Offscreen C24Z16
283.6 fps (2%)
LuxMark v2.0 64Bit - LuxMark v2.0 Room GPU
686 Samples/s (3%)
4923 Samples/s (22%)
LuxMark v2.0 64Bit - LuxMark v2.0 Sala GPU
1323 Samples/s (2%)
9410 Samples/s (16%)
ComputeMark v2.1 - ComputeMark v2.1 Result
3756 Points (4%)
12910 Points (14%)
Average Benchmarks AMD Radeon Pro 560 → 100% n=13 Average Benchmarks NVIDIA GeForce GTX 1070 SLI (Desktop) → 590% n=13
- Range of benchmark values for this graphics card
- Average benchmark values for this graphics card
* Smaller numbers mean a higher performance
1 This benchmark is not used for the average calculation
Game Benchmarks The following benchmarks stem from our benchmarks of review laptops. The performance depends on the used graphics memory, clock rate, processor, system settings, drivers, and operating systems. So the results don't have to be representative for all laptops with this GPU. For detailed information on the benchmark results, click on the fps number.
GeForce GTX 1070 SLI (Desktop):
135 [X] AMD Ryzen 7 1800X 3.6GHz
GeForce GTX 1070 SLI (Desktop)
min:
94 fps, max:
170 fps
fps
GeForce GTX 1070 SLI (Desktop):
90.4 [X] AMD Ryzen 7 1800X 3.6GHz
GeForce GTX 1070 SLI (Desktop)
min:
69 fps, max:
102 fps
fps
GeForce GTX 1070 SLI (Desktop):
64.2 [X] AMD Ryzen 7 1800X 3.6GHz
GeForce GTX 1070 SLI (Desktop)
min:
11 fps, max:
85 fps
fps
GeForce GTX 1070 SLI (Desktop):
48.4 [X] AMD Ryzen 7 1800X 3.6GHz
GeForce GTX 1070 SLI (Desktop)
min:
36 fps, max:
59 fps
fps
GeForce GTX 1070 SLI (Desktop):
19.5 [X] AMD Ryzen 7 1800X 3.6GHz
GeForce GTX 1070 SLI (Desktop)
min:
15 fps, max:
23 fps
fps
GeForce GTX 1070 SLI (Desktop):
132.6 [X] AMD Ryzen 7 1800X 3.6GHz
GeForce GTX 1070 SLI (Desktop)
min:
90 fps, max:
175 fps
fps
GeForce GTX 1070 SLI (Desktop):
82.8 [X] AMD Ryzen 7 1800X 3.6GHz
GeForce GTX 1070 SLI (Desktop)
min:
64 fps, max:
104 fps
fps
GeForce GTX 1070 SLI (Desktop):
57.6 [X] AMD Ryzen 7 1800X 3.6GHz
GeForce GTX 1070 SLI (Desktop)
min:
41 fps, max:
85 fps
fps
GeForce GTX 1070 SLI (Desktop):
24.7 [X] AMD Ryzen 7 1800X 3.6GHz
GeForce GTX 1070 SLI (Desktop)
min:
19 fps, max:
38 fps
fps
GeForce GTX 1070 SLI (Desktop):
425.5 [X] AMD Ryzen 7 1800X 3.6GHz
GeForce GTX 1070 SLI (Desktop)
min:
300 fps, max:
500 fps
fps
GeForce GTX 1070 SLI (Desktop):
279.5 [X] AMD Ryzen 7 1800X 3.6GHz
GeForce GTX 1070 SLI (Desktop)
min:
184 fps, max:
375 fps
fps
GeForce GTX 1070 SLI (Desktop):
175.5 [X] AMD Ryzen 7 1800X 3.6GHz
GeForce GTX 1070 SLI (Desktop)
min:
144 fps, max:
189 fps
fps
GeForce GTX 1070 SLI (Desktop):
123 [X] AMD Ryzen 7 1800X 3.6GHz
GeForce GTX 1070 SLI (Desktop)
min:
114 fps, max:
135 fps
fps
GeForce GTX 1070 SLI (Desktop):
37.5 [X] AMD Ryzen 7 1800X 3.6GHz
GeForce GTX 1070 SLI (Desktop)
min:
35 fps, max:
40 fps
fps
GeForce GTX 1070 SLI (Desktop):
160.8 [X] AMD Ryzen 7 1800X 3.6GHz
GeForce GTX 1070 SLI (Desktop)
min:
115 fps, max:
186 fps
fps
GeForce GTX 1070 SLI (Desktop):
145.7 [X] AMD Ryzen 7 1800X 3.6GHz
GeForce GTX 1070 SLI (Desktop)
min:
139 fps, max:
158 fps
fps
GeForce GTX 1070 SLI (Desktop):
129.5 [X] AMD Ryzen 7 1800X 3.6GHz
GeForce GTX 1070 SLI (Desktop)
min:
117 fps, max:
141 fps
fps
GeForce GTX 1070 SLI (Desktop):
119.9 [X] AMD Ryzen 7 1800X 3.6GHz
GeForce GTX 1070 SLI (Desktop)
min:
111 fps, max:
131 fps
fps
GeForce GTX 1070 SLI (Desktop):
58.1 [X] AMD Ryzen 7 1800X 3.6GHz
GeForce GTX 1070 SLI (Desktop)
min:
48 fps, max:
67 fps
fps
GeForce GTX 1070 SLI (Desktop):
140.7 [X] AMD Ryzen 7 1800X 3.6GHz
GeForce GTX 1070 SLI (Desktop)
min:
94 fps, max:
208 fps
fps
GeForce GTX 1070 SLI (Desktop):
118.2 [X] AMD Ryzen 7 1800X 3.6GHz
GeForce GTX 1070 SLI (Desktop)
min:
84 fps, max:
162 fps
fps
GeForce GTX 1070 SLI (Desktop):
109.4 [X] AMD Ryzen 7 1800X 3.6GHz
GeForce GTX 1070 SLI (Desktop)
min:
72 fps, max:
138 fps
fps
GeForce GTX 1070 SLI (Desktop):
108.1 [X] AMD Ryzen 7 1800X 3.6GHz
GeForce GTX 1070 SLI (Desktop)
min:
75 fps, max:
139 fps
fps
GeForce GTX 1070 SLI (Desktop):
40.9 [X] AMD Ryzen 7 1800X 3.6GHz
GeForce GTX 1070 SLI (Desktop)
min:
28 fps, max:
47 fps
fps
GeForce GTX 1070 SLI (Desktop):
187.5 [X] AMD Ryzen 7 1800X 3.6GHz
GeForce GTX 1070 SLI (Desktop)
fps
GeForce GTX 1070 SLI (Desktop):
125.1 [X] AMD Ryzen 7 1800X 3.6GHz
GeForce GTX 1070 SLI (Desktop)
fps
GeForce GTX 1070 SLI (Desktop):
109.2 [X] AMD Ryzen 7 1800X 3.6GHz
GeForce GTX 1070 SLI (Desktop)
fps
GeForce GTX 1070 SLI (Desktop):
101.7 [X] AMD Ryzen 7 1800X 3.6GHz
GeForce GTX 1070 SLI (Desktop)
fps
GeForce GTX 1070 SLI (Desktop):
40.7 [X] AMD Ryzen 7 1800X 3.6GHz
GeForce GTX 1070 SLI (Desktop)
fps
GeForce GTX 1070 SLI (Desktop):
75 [X] AMD Ryzen 7 1800X 3.6GHz
GeForce GTX 1070 SLI (Desktop)
fps
GeForce GTX 1070 SLI (Desktop):
72 [X] AMD Ryzen 7 1800X 3.6GHz
GeForce GTX 1070 SLI (Desktop)
fps
GeForce GTX 1070 SLI (Desktop):
70 [X] AMD Ryzen 7 1800X 3.6GHz
GeForce GTX 1070 SLI (Desktop)
fps
GeForce GTX 1070 SLI (Desktop):
61 [X] AMD Ryzen 7 1800X 3.6GHz
GeForce GTX 1070 SLI (Desktop)
fps
GeForce GTX 1070 SLI (Desktop):
31 [X] AMD Ryzen 7 1800X 3.6GHz
GeForce GTX 1070 SLI (Desktop)
fps
GeForce GTX 1070 SLI (Desktop):
121 [X] AMD Ryzen 7 1800X 3.6GHz
GeForce GTX 1070 SLI (Desktop)
fps
GeForce GTX 1070 SLI (Desktop):
119 [X] AMD Ryzen 7 1800X 3.6GHz
GeForce GTX 1070 SLI (Desktop)
fps
GeForce GTX 1070 SLI (Desktop):
124 [X] AMD Ryzen 7 1800X 3.6GHz
GeForce GTX 1070 SLI (Desktop)
fps
GeForce GTX 1070 SLI (Desktop):
120.9 [X] AMD Ryzen 7 1800X 3.6GHz
GeForce GTX 1070 SLI (Desktop)
fps
GeForce GTX 1070 SLI (Desktop):
58.1 [X] AMD Ryzen 7 1800X 3.6GHz
GeForce GTX 1070 SLI (Desktop)
fps
GeForce GTX 1070 SLI (Desktop):
120.5 [X] AMD Ryzen 7 1800X 3.6GHz
GeForce GTX 1070 SLI (Desktop)
min:
105 fps, max:
123 fps
fps
GeForce GTX 1070 SLI (Desktop):
120.2 [X] AMD Ryzen 7 1800X 3.6GHz
GeForce GTX 1070 SLI (Desktop)
min:
111 fps, max:
124 fps
fps
GeForce GTX 1070 SLI (Desktop):
101.4 [X] AMD Ryzen 7 1800X 3.6GHz
GeForce GTX 1070 SLI (Desktop)
min:
93 fps, max:
117 fps
fps
GeForce GTX 1070 SLI (Desktop):
79.8 [X] AMD Ryzen 7 1800X 3.6GHz
GeForce GTX 1070 SLI (Desktop)
min:
72 fps, max:
88 fps
fps
GeForce GTX 1070 SLI (Desktop):
26.1 [X] AMD Ryzen 7 1800X 3.6GHz
GeForce GTX 1070 SLI (Desktop)
min:
24 fps, max:
30 fps
fps
GeForce GTX 1070 SLI (Desktop):
93.7 [X] AMD Ryzen 7 1800X 3.6GHz
GeForce GTX 1070 SLI (Desktop)
min:
78 fps, max:
109 fps
fps
GeForce GTX 1070 SLI (Desktop):
65.7 [X] AMD Ryzen 7 1800X 3.6GHz
GeForce GTX 1070 SLI (Desktop)
min:
56 fps, max:
77 fps
fps
GeForce GTX 1070 SLI (Desktop):
59.1 [X] AMD Ryzen 7 1800X 3.6GHz
GeForce GTX 1070 SLI (Desktop)
min:
49 fps, max:
69 fps
fps
GeForce GTX 1070 SLI (Desktop):
57.7 [X] AMD Ryzen 7 1800X 3.6GHz
GeForce GTX 1070 SLI (Desktop)
min:
49 fps, max:
67 fps
fps
GeForce GTX 1070 SLI (Desktop):
24.4 [X] AMD Ryzen 7 1800X 3.6GHz
GeForce GTX 1070 SLI (Desktop)
min:
21 fps, max:
28 fps
fps
GeForce GTX 1070 SLI (Desktop):
111 [X] AMD Ryzen 7 1800X 3.6GHz
GeForce GTX 1070 SLI (Desktop)
min:
53 fps, max:
168 fps
fps
GeForce GTX 1070 SLI (Desktop):
95 [X] AMD Ryzen 7 1800X 3.6GHz
GeForce GTX 1070 SLI (Desktop)
min:
45 fps, max:
170 fps
fps
GeForce GTX 1070 SLI (Desktop):
81 [X] AMD Ryzen 7 1800X 3.6GHz
GeForce GTX 1070 SLI (Desktop)
min:
39 fps, max:
135 fps
fps
GeForce GTX 1070 SLI (Desktop):
67 [X] AMD Ryzen 7 1800X 3.6GHz
GeForce GTX 1070 SLI (Desktop)
min:
3 fps, max:
116 fps
fps
GeForce GTX 1070 SLI (Desktop):
45 [X] AMD Ryzen 7 1800X 3.6GHz
GeForce GTX 1070 SLI (Desktop)
min:
3 fps, max:
99 fps
fps
GeForce GTX 1070 SLI (Desktop):
344.6 [X] AMD Ryzen 7 1800X 3.6GHz
GeForce GTX 1070 SLI (Desktop)
min:
324 fps, max:
379 fps
fps
GeForce GTX 1070 SLI (Desktop):
331.3 [X] AMD Ryzen 7 1800X 3.6GHz
GeForce GTX 1070 SLI (Desktop)
min:
306 fps, max:
403 fps
fps
GeForce GTX 1070 SLI (Desktop):
310.6 [X] AMD Ryzen 7 1800X 3.6GHz
GeForce GTX 1070 SLI (Desktop)
min:
280 fps, max:
350 fps
fps
GeForce GTX 1070 SLI (Desktop):
305.4 [X] AMD Ryzen 7 1800X 3.6GHz
GeForce GTX 1070 SLI (Desktop)
min:
282 fps, max:
354 fps
fps
GeForce GTX 1070 SLI (Desktop):
187.6 [X] AMD Ryzen 7 1800X 3.6GHz
GeForce GTX 1070 SLI (Desktop)
min:
160 fps, max:
218 fps
fps
GeForce GTX 1070 SLI (Desktop):
121.4 [X] AMD Ryzen 7 1800X 3.6GHz
GeForce GTX 1070 SLI (Desktop)
min:
25 fps, max:
145 fps
fps
GeForce GTX 1070 SLI (Desktop):
85.2 [X] AMD Ryzen 7 1800X 3.6GHz
GeForce GTX 1070 SLI (Desktop)
min:
65 fps, max:
95 fps
fps
GeForce GTX 1070 SLI (Desktop):
81.6 [X] AMD Ryzen 7 1800X 3.6GHz
GeForce GTX 1070 SLI (Desktop)
min:
45 fps, max:
101 fps
fps
GeForce GTX 1070 SLI (Desktop):
62.1 [X] AMD Ryzen 7 1800X 3.6GHz
GeForce GTX 1070 SLI (Desktop)
min:
48 fps, max:
68 fps
fps
GeForce GTX 1070 SLI (Desktop):
26.7 [X] AMD Ryzen 7 1800X 3.6GHz
GeForce GTX 1070 SLI (Desktop)
min:
24 fps, max:
29 fps
fps
GeForce GTX 1070 SLI (Desktop):
221 [X] AMD Ryzen 7 1800X 3.6GHz
GeForce GTX 1070 SLI (Desktop)
min:
174 fps, max:
252 fps
fps
GeForce GTX 1070 SLI (Desktop):
190 [X] AMD Ryzen 7 1800X 3.6GHz
GeForce GTX 1070 SLI (Desktop)
min:
142 fps, max:
223 fps
fps
GeForce GTX 1070 SLI (Desktop):
168 [X] AMD Ryzen 7 1800X 3.6GHz
GeForce GTX 1070 SLI (Desktop)
min:
137 fps, max:
195 fps
fps
GeForce GTX 1070 SLI (Desktop):
109 [X] AMD Ryzen 7 1800X 3.6GHz
GeForce GTX 1070 SLI (Desktop)
min:
90 fps, max:
131 fps
fps
GeForce GTX 1070 SLI (Desktop):
68 [X] AMD Ryzen 7 1800X 3.6GHz
GeForce GTX 1070 SLI (Desktop)
min:
60 fps, max:
77 fps
fps
GeForce GTX 1070 SLI (Desktop):
160.2 [X] AMD Ryzen 7 1800X 3.6GHz
GeForce GTX 1070 SLI (Desktop)
min:
142.6 fps, max:
180.3 fps
fps
GeForce GTX 1070 SLI (Desktop):
121.9 [X] AMD Ryzen 7 1800X 3.6GHz
GeForce GTX 1070 SLI (Desktop)
min:
109.9 fps, max:
136 fps
fps
GeForce GTX 1070 SLI (Desktop):
109.1 [X] AMD Ryzen 7 1800X 3.6GHz
GeForce GTX 1070 SLI (Desktop)
min:
98 fps, max:
124.9 fps
fps
GeForce GTX 1070 SLI (Desktop):
69.4 [X] AMD Ryzen 7 1800X 3.6GHz
GeForce GTX 1070 SLI (Desktop)
min:
61.5 fps, max:
77.6 fps
fps
GeForce GTX 1070 SLI (Desktop):
57.4 [X] AMD Ryzen 7 1800X 3.6GHz
GeForce GTX 1070 SLI (Desktop)
min:
48.7 fps, max:
65.4 fps
fps
GeForce GTX 1070 SLI (Desktop):
223.2 [X] AMD Ryzen 7 1800X 3.6GHz
GeForce GTX 1070 SLI (Desktop)
min:
47.9 fps, max:
263.6 fps
fps
GeForce GTX 1070 SLI (Desktop):
178.4 [X] AMD Ryzen 7 1800X 3.6GHz
GeForce GTX 1070 SLI (Desktop)
min:
47.2 fps, max:
223 fps
fps
GeForce GTX 1070 SLI (Desktop):
173.3 [X] AMD Ryzen 7 1800X 3.6GHz
GeForce GTX 1070 SLI (Desktop)
min:
46.7 fps, max:
219.2 fps
fps
GeForce GTX 1070 SLI (Desktop):
151.8 [X] AMD Ryzen 7 1800X 3.6GHz
GeForce GTX 1070 SLI (Desktop)
min:
46.9 fps, max:
196.8 fps
fps
GeForce GTX 1070 SLI (Desktop):
87.3 [X] AMD Ryzen 7 1800X 3.6GHz
GeForce GTX 1070 SLI (Desktop)
min:
24.5 fps, max:
117.7 fps
fps
GeForce GTX 1070 SLI (Desktop):
282.2 [X] AMD Ryzen 7 1800X 3.6GHz
GeForce GTX 1070 SLI (Desktop)
min:
236 fps, max:
347 fps
fps
GeForce GTX 1070 SLI (Desktop):
233.4 [X] AMD Ryzen 7 1800X 3.6GHz
GeForce GTX 1070 SLI (Desktop)
min:
171 fps, max:
311 fps
fps
GeForce GTX 1070 SLI (Desktop):
174.8 [X] AMD Ryzen 7 1800X 3.6GHz
GeForce GTX 1070 SLI (Desktop)
min:
141 fps, max:
206 fps
fps
GeForce GTX 1070 SLI (Desktop):
155.7 [X] AMD Ryzen 7 1800X 3.6GHz
GeForce GTX 1070 SLI (Desktop)
min:
131 fps, max:
194 fps
fps
GeForce GTX 1070 SLI (Desktop):
52.7 [X] AMD Ryzen 7 1800X 3.6GHz
GeForce GTX 1070 SLI (Desktop)
min:
43 fps, max:
62 fps
fps
GeForce GTX 1070 SLI (Desktop):
120.7 [X] AMD Ryzen 7 1800X 3.6GHz
GeForce GTX 1070 SLI (Desktop)
fps
GeForce GTX 1070 SLI (Desktop):
112 [X] AMD Ryzen 7 1800X 3.6GHz
GeForce GTX 1070 SLI (Desktop)
fps
GeForce GTX 1070 SLI (Desktop):
103.2 [X] AMD Ryzen 7 1800X 3.6GHz
GeForce GTX 1070 SLI (Desktop)
fps
GeForce GTX 1070 SLI (Desktop):
89.1 [X] AMD Ryzen 7 1800X 3.6GHz
GeForce GTX 1070 SLI (Desktop)
fps
GeForce GTX 1070 SLI (Desktop):
60.4 [X] AMD Ryzen 7 1800X 3.6GHz
GeForce GTX 1070 SLI (Desktop)
fps
GeForce GTX 1070 SLI (Desktop):
108.9 [X] AMD Ryzen 7 1800X 3.6GHz
GeForce GTX 1070 SLI (Desktop)
min:
91 fps, max:
120 fps
fps
GeForce GTX 1070 SLI (Desktop):
104.9 [X] AMD Ryzen 7 1800X 3.6GHz
GeForce GTX 1070 SLI (Desktop)
min:
78 fps, max:
120 fps
fps
GeForce GTX 1070 SLI (Desktop):
101 [X] AMD Ryzen 7 1800X 3.6GHz
GeForce GTX 1070 SLI (Desktop)
min:
50 fps, max:
120 fps
fps
GeForce GTX 1070 SLI (Desktop):
80.9 [X] AMD Ryzen 7 1800X 3.6GHz
GeForce GTX 1070 SLI (Desktop)
min:
60 fps, max:
120 fps
fps
GeForce GTX 1070 SLI (Desktop):
62 [X] AMD Ryzen 7 1800X 3.6GHz
GeForce GTX 1070 SLI (Desktop)
min:
42 fps, max:
77 fps
fps
GeForce GTX 1070 SLI (Desktop):
185.3 [X] AMD Ryzen 7 1800X 3.6GHz
GeForce GTX 1070 SLI (Desktop)
min:
176 fps, max:
200 fps
fps
GeForce GTX 1070 SLI (Desktop):
165.3 [X] AMD Ryzen 7 1800X 3.6GHz
GeForce GTX 1070 SLI (Desktop)
min:
155 fps, max:
183 fps
fps
GeForce GTX 1070 SLI (Desktop):
149.9 [X] AMD Ryzen 7 1800X 3.6GHz
GeForce GTX 1070 SLI (Desktop)
min:
141 fps, max:
159 fps
fps
GeForce GTX 1070 SLI (Desktop):
138.9 [X] AMD Ryzen 7 1800X 3.6GHz
GeForce GTX 1070 SLI (Desktop)
min:
131 fps, max:
162 fps
fps
GeForce GTX 1070 SLI (Desktop):
67.7 [X] AMD Ryzen 7 1800X 3.6GHz
GeForce GTX 1070 SLI (Desktop)
min:
65 fps, max:
73 fps
fps
GeForce GTX 1070 SLI (Desktop):
79.2 [X] AMD Ryzen 7 1800X 3.6GHz
GeForce GTX 1070 SLI (Desktop)
min:
62 fps, max:
135 fps
fps
GeForce GTX 1070 SLI (Desktop):
77.3 [X] AMD Ryzen 7 1800X 3.6GHz
GeForce GTX 1070 SLI (Desktop)
min:
58 fps, max:
134 fps
fps
GeForce GTX 1070 SLI (Desktop):
69.3 [X] AMD Ryzen 7 1800X 3.6GHz
GeForce GTX 1070 SLI (Desktop)
min:
51 fps, max:
115 fps
fps
GeForce GTX 1070 SLI (Desktop):
66.5 [X] AMD Ryzen 7 1800X 3.6GHz
GeForce GTX 1070 SLI (Desktop)
min:
40 fps, max:
108 fps
fps
GeForce GTX 1070 SLI (Desktop):
47.9 [X] AMD Ryzen 7 1800X 3.6GHz
GeForce GTX 1070 SLI (Desktop)
min:
38 fps, max:
59 fps
fps
GeForce GTX 1070 SLI (Desktop):
200.7 [X] AMD Ryzen 7 1800X 3.6GHz
GeForce GTX 1070 SLI (Desktop)
fps
GeForce GTX 1070 SLI (Desktop):
170 [X] AMD Ryzen 7 1800X 3.6GHz
GeForce GTX 1070 SLI (Desktop)
fps
GeForce GTX 1070 SLI (Desktop):
131.8 [X] AMD Ryzen 7 1800X 3.6GHz
GeForce GTX 1070 SLI (Desktop)
fps
GeForce GTX 1070 SLI (Desktop):
117.7 [X] AMD Ryzen 7 1800X 3.6GHz
GeForce GTX 1070 SLI (Desktop)
fps
GeForce GTX 1070 SLI (Desktop):
66.4 [X] AMD Ryzen 7 1800X 3.6GHz
GeForce GTX 1070 SLI (Desktop)
fps
GeForce GTX 1070 SLI (Desktop):
72 [X] AMD Ryzen 7 1800X 3.6GHz
GeForce GTX 1070 SLI (Desktop)
min:
59 fps, max:
85 fps
fps
GeForce GTX 1070 SLI (Desktop):
66 [X] AMD Ryzen 7 1800X 3.6GHz
GeForce GTX 1070 SLI (Desktop)
min:
53 fps, max:
82 fps
fps
GeForce GTX 1070 SLI (Desktop):
61 [X] AMD Ryzen 7 1800X 3.6GHz
GeForce GTX 1070 SLI (Desktop)
min:
51 fps, max:
74 fps
fps
GeForce GTX 1070 SLI (Desktop):
58 [X] AMD Ryzen 7 1800X 3.6GHz
GeForce GTX 1070 SLI (Desktop)
min:
44 fps, max:
68 fps
fps
GeForce GTX 1070 SLI (Desktop):
64 [X] AMD Ryzen 7 1800X 3.6GHz
GeForce GTX 1070 SLI (Desktop)
min:
50 fps, max:
72 fps
fps
GeForce GTX 1070 SLI (Desktop):
205.7 [X] AMD Ryzen 7 1800X 3.6GHz
GeForce GTX 1070 SLI (Desktop)
min:
193 fps, max:
215 fps
fps
GeForce GTX 1070 SLI (Desktop):
161 [X] AMD Ryzen 7 1800X 3.6GHz
GeForce GTX 1070 SLI (Desktop)
min:
155 fps, max:
167 fps
fps
GeForce GTX 1070 SLI (Desktop):
142.1 [X] AMD Ryzen 7 1800X 3.6GHz
GeForce GTX 1070 SLI (Desktop)
min:
136 fps, max:
149 fps
fps
GeForce GTX 1070 SLI (Desktop):
139.2 [X] AMD Ryzen 7 1800X 3.6GHz
GeForce GTX 1070 SLI (Desktop)
min:
133 fps, max:
150 fps
fps
GeForce GTX 1070 SLI (Desktop):
74 [X] AMD Ryzen 7 1800X 3.6GHz
GeForce GTX 1070 SLI (Desktop)
min:
66 fps, max:
88 fps
fps
GeForce GTX 1070 SLI (Desktop):
243.4 [X] AMD Ryzen 7 1800X 3.6GHz
GeForce GTX 1070 SLI (Desktop)
min:
112.4 fps, max:
379.8 fps
fps
GeForce GTX 1070 SLI (Desktop):
196 [X] AMD Ryzen 7 1800X 3.6GHz
GeForce GTX 1070 SLI (Desktop)
min:
77 fps, max:
302 fps
fps
GeForce GTX 1070 SLI (Desktop):
159.6 [X] AMD Ryzen 7 1800X 3.6GHz
GeForce GTX 1070 SLI (Desktop)
min:
68 fps, max:
245 fps
fps
GeForce GTX 1070 SLI (Desktop):
141.1 [X] AMD Ryzen 7 1800X 3.6GHz
GeForce GTX 1070 SLI (Desktop)
min:
84.4 fps, max:
211.8 fps
fps
GeForce GTX 1070 SLI (Desktop):
53 [X] AMD Ryzen 7 1800X 3.6GHz
GeForce GTX 1070 SLI (Desktop)
min:
40.1 fps, max:
73.3 fps
fps
GeForce GTX 1070 SLI (Desktop):
170.4 [X] AMD Ryzen 7 1800X 3.6GHz
GeForce GTX 1070 SLI (Desktop)
min:
46 fps, max:
206 fps
fps
GeForce GTX 1070 SLI (Desktop):
132.4 [X] AMD Ryzen 7 1800X 3.6GHz
GeForce GTX 1070 SLI (Desktop)
min:
32 fps, max:
155 fps
fps
GeForce GTX 1070 SLI (Desktop):
111.2 [X] AMD Ryzen 7 1800X 3.6GHz
GeForce GTX 1070 SLI (Desktop)
min:
28 fps, max:
133 fps
fps
GeForce GTX 1070 SLI (Desktop):
73.1 [X] AMD Ryzen 7 1800X 3.6GHz
GeForce GTX 1070 SLI (Desktop)
min:
14 fps, max:
91 fps
fps
GeForce GTX 1070 SLI (Desktop):
54.4 [X] AMD Ryzen 7 1800X 3.6GHz
GeForce GTX 1070 SLI (Desktop)
min:
24 fps, max:
65 fps
fps
GeForce GTX 1070 SLI (Desktop):
125.9 [X] AMD Ryzen 7 1800X 3.6GHz
GeForce GTX 1070 SLI (Desktop)
fps
GeForce GTX 1070 SLI (Desktop):
114.6 [X] AMD Ryzen 7 1800X 3.6GHz
GeForce GTX 1070 SLI (Desktop)
fps
GeForce GTX 1070 SLI (Desktop):
88.7 [X] AMD Ryzen 7 1800X 3.6GHz
GeForce GTX 1070 SLI (Desktop)
fps
GeForce GTX 1070 SLI (Desktop):
86.1 [X] AMD Ryzen 7 1800X 3.6GHz
GeForce GTX 1070 SLI (Desktop)
fps
GeForce GTX 1070 SLI (Desktop):
81.3 [X] AMD Ryzen 7 1800X 3.6GHz
GeForce GTX 1070 SLI (Desktop)
fps
GeForce GTX 1070 SLI (Desktop):
276.9 [X] AMD Ryzen 7 1800X 3.6GHz
GeForce GTX 1070 SLI (Desktop)
fps
GeForce GTX 1070 SLI (Desktop):
242.9 [X] AMD Ryzen 7 1800X 3.6GHz
GeForce GTX 1070 SLI (Desktop)
fps
GeForce GTX 1070 SLI (Desktop):
233.4 [X] AMD Ryzen 7 1800X 3.6GHz
GeForce GTX 1070 SLI (Desktop)
fps
GeForce GTX 1070 SLI (Desktop):
199.5 [X] AMD Ryzen 7 1800X 3.6GHz
GeForce GTX 1070 SLI (Desktop)
fps
NVIDIA GeForce GTX 1070 SLI (Desktop) low med. high ultra QHD 4K Kingdom Come: Deliverance 135 90.4 64.2 48.4 19.5 Final Fantasy XV Benchmark 132.6 82.8 57.6 24.7 Fortnite 425.5 279.5 175.5 123 37.5 Star Wars Battlefront 2 160.8 145.7 129.5 119.9 58.1 Need for Speed Payback 140.7 118.2 109.4 108.1 40.9 Wolfenstein II: The New Colossus 187.5 125.1 109.2 101.7 40.7 Assassin´s Creed Origins 75 72 70 61 31 Destiny 2 121 119 124 120.9 58.1 ELEX 120.5 120.2 101.4 79.8 26.1 The Evil Within 2 93.7 65.7 59.1 57.7 24.4 Middle-earth: Shadow of War 111 95 81 67 45 FIFA 18 344.6 331.3 310.6 305.4 187.6 Ark Survival Evolved 121.4 85.2 81.6 62.1 26.7 F1 2017 221 190 168 109 68 Ghost Recon Wildlands 160.2 121.9 109.1 69.4 57.4 For Honor 223.2 178.4 173.3 151.8 87.3 Resident Evil 7 282.2 233.4 174.8 155.7 52.7 Watch Dogs 2 120.7 112 103.2 89.1 60.4 Dishonored 2 108.9 104.9 101 80.9 62 Battlefield 1 185.3 165.3 149.9 138.9 67.7 Deus Ex Mankind Divided 79.2 77.3 69.3 66.5 47.9 The Division 200.7 170 131.8 117.7 66.4 Far Cry Primal 72 66 61 58 64 Rise of the Tomb Raider 205.7 161 142.1 139.2 74 Rainbow Six Siege 243.4 196 159.6 141.1 53 The Witcher 3 170.4 132.4 111.2 73.1 54.4 GTA V 125.9 114.6 88.7 86.1 81.3 BioShock Infinite 276.9 242.9 233.4 199.5 < 30 fps < 60 fps < 120 fps ≥ 120 fps 6 22 13 15 2 14 12 3 15 9 5 12 9 1
For more games that might be playable and a list of all games and graphics cards visit our Gaming List
v1.27
log 16. 02:14:09
#0 checking url part for id 8066 +0s ... 0s
#1 checking url part for id 8092 +0s ... 0s
#2 not redirecting to Ajax server +0s ... 0s
#3 did not recreate cache, as it is less than 5 days old! Created at Thu, 13 Jun 2024 05:35:10 +0200 +0.001s ... 0.001s
#4 composed specs +0.146s ... 0.147s
#5 did output specs +0s ... 0.147s
#6 start showIntegratedCPUs +0s ... 0.147s
#7 getting avg benchmarks for device 8066 +0.028s ... 0.174s
#8 got single benchmarks 8066 +0.007s ... 0.182s
#9 getting avg benchmarks for device 8092 +0.02s ... 0.201s
#10 got single benchmarks 8092 +0.006s ... 0.208s
#11 got avg benchmarks for devices +0s ... 0.208s
#12 min, max, avg, median took s +0.288s ... 0.495s
#13 before gaming benchmark output +0s ... 0.496s
#14 Got 138 rows for game benchmarks. +0.011s ... 0.506s
#15 composed SQL query for gamebenchmarks +0s ... 0.506s
#16 got data and put it in $dataArray +0.023s ... 0.53s
#17 benchmarks composed for output. +0.068s ... 0.598s
#18 calculated avg scores. +0s ... 0.598s
#19 return log +0.046s ... 0.644s
Please share our article, every link counts!
Redaktion, 2017-09- 8 (Update: 2023-07- 1)
 Deutsch
 English
 Español
 Français
 Italiano
 Nederlands
 Polski
 Português
 Русский
 Türkçe
 Svenska
 Chinese
 Magyar