

AMD Ryzen 9 3900 vs Intel Core i7-3630QM vs AMD Ryzen 3 3100
AMD Ryzen 9 3900
► remove from comparison
The Ryzen 9 3900 is a fast desktop CPU with 12 cores and 24 threads based on the Matisse series. It is the fastest 65 Watt CPU at launch in late 2019 and clocks the cores between 3.1 (base) to 4.3 (boost) clock (including Precision Boost). It uses 4 CCX-clusters where 3 of the 4 cores are activated. The CPU is manufactured in the modern 7nm process at TSMC. The I/O die on the package is separate and manufactured in 12 nm at Globalfoundries.
Due to the reduced Turbo speed, the Ryzen 9 3900 is aimed at content creators and other professionals that can make use of the 12 cores. For games, a fast 8-core CPU with higher boost clocks is the better choice.
Intel Core i7-3630QM
► remove from comparison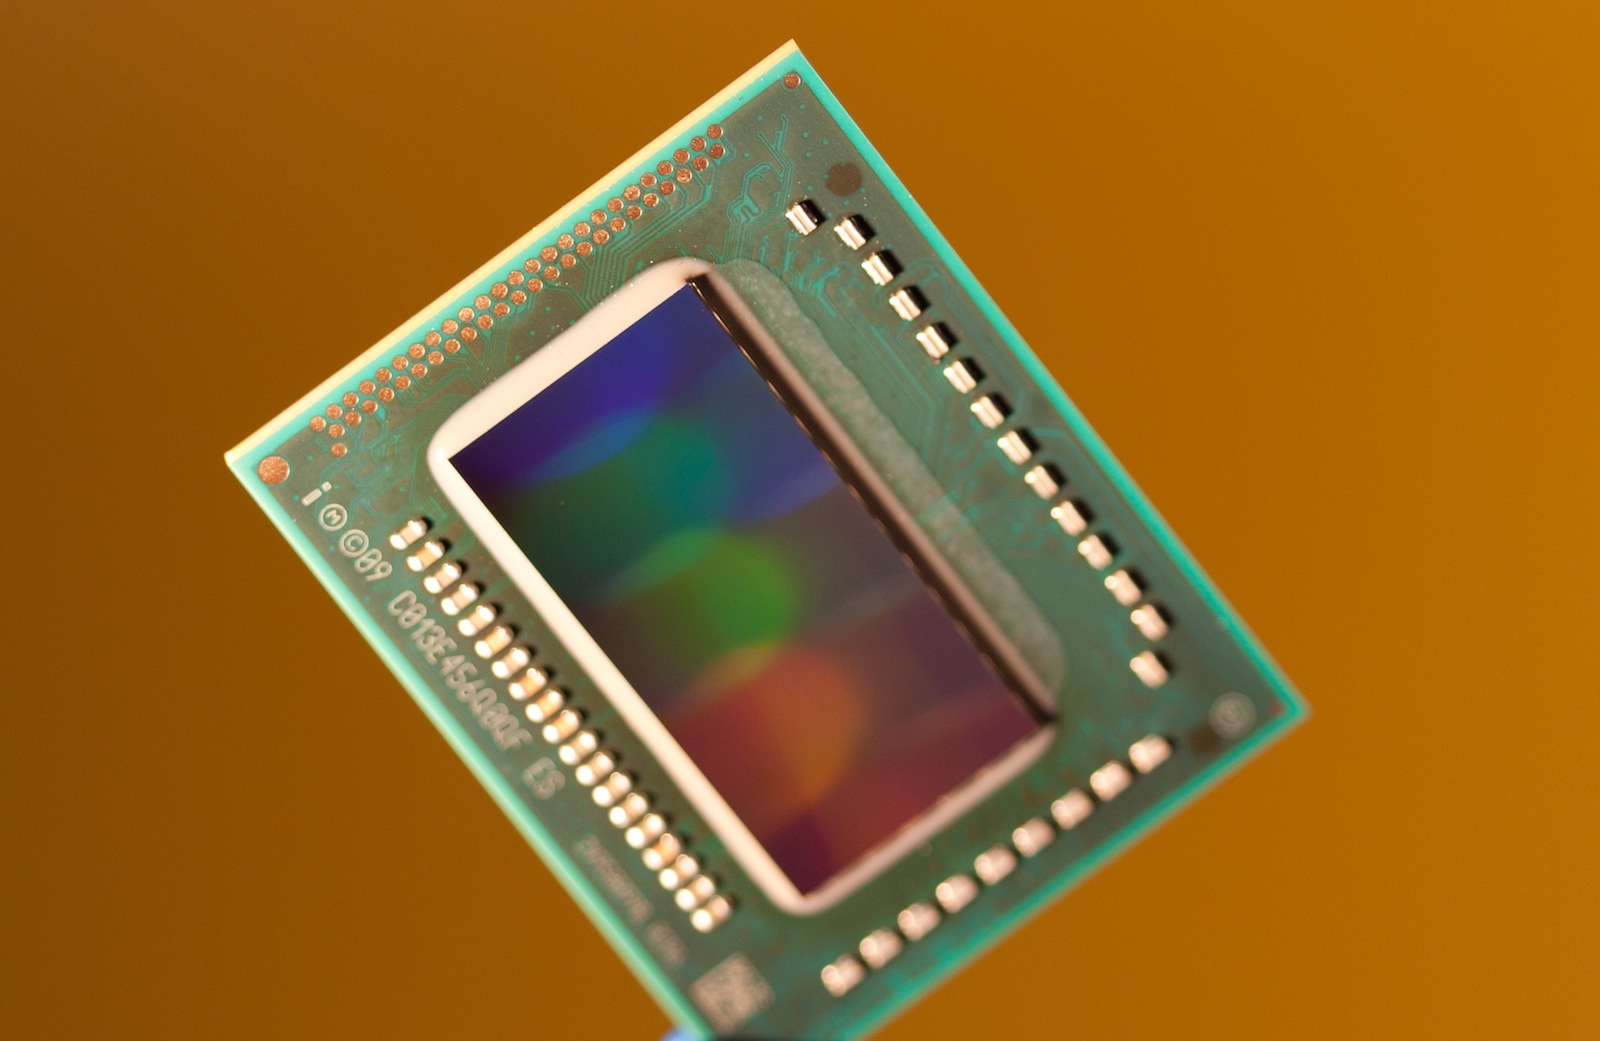
The Intel Core i7-3630QM is a fast quad-core processor for laptops based on the Ivy Bridge architecture and successor of the i7-3630QM. Due to Hyperthreading, the four cores can handle up to eight threads in parallel leading to better utilization of the CPU. Each core offers a base speed of 2.4 GHz but can dynamically increase clock rates with Turbo Boost up to 3.2 GHz (for 4 active cores), 3.3 GHz (for 2 active cores) and 3.4 GHz (for 1 active core).
Ivy Bridge is an enhanced die shrink of the Sandy Bridge architecture with improvements on both GPU and CPU performance. The CPUs are produced in 22nm (versus 32nm Sandy Bridge CPUs) and are the first to introduce 3D transistors for increased energy efficiency when compared to similarly clocked Sandy Bridge processors. Other new features are integrated PCI Express 3.0 and DDR3(L)-1600 support. Except VT-d and vPro the 3630QM supports all functions of the Ivy Bridge core like VT-x, AES or Trusted Execution.
The performance of the Core i7-3630QM should be slightly above a similarly clocked Sandy Bridge processor due to slight architectural improvements. As a result, overall performance should be above the former fastest model, the Core i7-2920XM.
The integrated Intel HD Graphics 4000 offers 16 Execution Units (EUs) clocked at 650 MHz up to 1150 MHz with Turbo Boost, making it one of the faster variants.
As with most quad-core Ivy Bridge models, the Core i7-3630QM is specified at a TDP of 45 Watts including graphics card and memory controller. Therefore, the CPU is well-suited for laptops 15-inches or greater.
AMD Ryzen 3 3100
► remove from comparison
The Ryzen 3 3100 is a cheap entry level desktop processor of the Matisse series with 4 cores and 8 threads. It clocks from 3.6 (base) - 3.9 GHz (boost) and uses the Zen 2 microarchitecture. It uses two CCX clusters with two cores each. Therefore, there are some disadvantages compared to the faster Ryzen 3 3300X that uses all four cores of a single CCX-cluster. The CPU is manufactured on the modern 7 nm process at TSMC. The I/O die that is not part of the main die is manufactured on 12 nm at Globalfoundries. The TDP is 65 Watts and therefore the CPU won't need a big beefy cooler.
In multi-threaded applications the performance of the Ryzen 3 3100 can reach the old Core i7-7700K (a former high end CPU). In games and single threaded applications, the performance is slightly lower as the higher clocked Ryzen 3 3300X is on par with the 7700K. Still, the 3100 can be a good pick for an entry level gaming system.
| Model | AMD Ryzen 9 3900 | Intel Core i7-3630QM | AMD Ryzen 3 3100 | ||||||||||||||||||||||||||||||||||||||||||||||||||||||||||||||||||||||||||||||||||||||||||||||||||||||||||||||||||||||||||||||||||||
| Codename | Matisse (Zen 2) | Ivy Bridge | Matisse (Zen 2) | ||||||||||||||||||||||||||||||||||||||||||||||||||||||||||||||||||||||||||||||||||||||||||||||||||||||||||||||||||||||||||||||||||||
| Series | AMD Matisse (Ryzen 3000 Desktop) | Intel Core i7 | AMD Matisse (Ryzen 3000 Desktop) | ||||||||||||||||||||||||||||||||||||||||||||||||||||||||||||||||||||||||||||||||||||||||||||||||||||||||||||||||||||||||||||||||||||
| Series: Matisse (Ryzen 3000 Desktop) Matisse (Zen 2) |
|
|
| ||||||||||||||||||||||||||||||||||||||||||||||||||||||||||||||||||||||||||||||||||||||||||||||||||||||||||||||||||||||||||||||||||||
| Clock | 3100 - 4300 MHz | 2400 - 3400 MHz | 3600 - 3900 MHz | ||||||||||||||||||||||||||||||||||||||||||||||||||||||||||||||||||||||||||||||||||||||||||||||||||||||||||||||||||||||||||||||||||||
| L1 Cache | 768 KB | 256 KB | 256 KB | ||||||||||||||||||||||||||||||||||||||||||||||||||||||||||||||||||||||||||||||||||||||||||||||||||||||||||||||||||||||||||||||||||||
| L2 Cache | 6 MB | 1 MB | 2 MB | ||||||||||||||||||||||||||||||||||||||||||||||||||||||||||||||||||||||||||||||||||||||||||||||||||||||||||||||||||||||||||||||||||||
| L3 Cache | 64 MB | 6 MB | 16 MB | ||||||||||||||||||||||||||||||||||||||||||||||||||||||||||||||||||||||||||||||||||||||||||||||||||||||||||||||||||||||||||||||||||||
| Cores / Threads | 12 / 24 | 4 / 8 | 4 / 8 | ||||||||||||||||||||||||||||||||||||||||||||||||||||||||||||||||||||||||||||||||||||||||||||||||||||||||||||||||||||||||||||||||||||
| TDP | 65 Watt | 45 Watt | 65 Watt | ||||||||||||||||||||||||||||||||||||||||||||||||||||||||||||||||||||||||||||||||||||||||||||||||||||||||||||||||||||||||||||||||||||
| Technology | 7 nm | 22 nm | 7 nm | ||||||||||||||||||||||||||||||||||||||||||||||||||||||||||||||||||||||||||||||||||||||||||||||||||||||||||||||||||||||||||||||||||||
| Socket | AM4 (1331) | FCPGA988 | AM4 (LGA1331) | ||||||||||||||||||||||||||||||||||||||||||||||||||||||||||||||||||||||||||||||||||||||||||||||||||||||||||||||||||||||||||||||||||||
| Features | MMX(+), SSE, SSE2, SSE3, SSSE3, SSE4.1, SSE4.2, SSE4A, x86-64, AMD-V, AES, AVX, AVX2, FMA3, SHA, Precision Boost 2 | HD Graphics 4000, DDR3(L)-1600 Memory Controller, HyperThreading, AVX, Quick Sync, Virtualization | DDR4-3200 RAM, PCIe 4, MMX, SSE, SSE2, SSE3, SSSE3, SSE4A, SSE4.1, SSE4.2, AVX, AVX2, BMI2, ABM, FMA, ADX, SMEP, SMAP, SMT, CPB, AES-NI, RDRAND, RDSEED, SHA, SME | ||||||||||||||||||||||||||||||||||||||||||||||||||||||||||||||||||||||||||||||||||||||||||||||||||||||||||||||||||||||||||||||||||||
| Architecture | x86 | x86 | x86 | ||||||||||||||||||||||||||||||||||||||||||||||||||||||||||||||||||||||||||||||||||||||||||||||||||||||||||||||||||||||||||||||||||||
| Announced | |||||||||||||||||||||||||||||||||||||||||||||||||||||||||||||||||||||||||||||||||||||||||||||||||||||||||||||||||||||||||||||||||||||||
| Transistors | 1400 Million | ||||||||||||||||||||||||||||||||||||||||||||||||||||||||||||||||||||||||||||||||||||||||||||||||||||||||||||||||||||||||||||||||||||||
| Die Size | 160 mm2 | ||||||||||||||||||||||||||||||||||||||||||||||||||||||||||||||||||||||||||||||||||||||||||||||||||||||||||||||||||||||||||||||||||||||
| max. Temp. | 105 °C | ||||||||||||||||||||||||||||||||||||||||||||||||||||||||||||||||||||||||||||||||||||||||||||||||||||||||||||||||||||||||||||||||||||||
| iGPU | Intel HD Graphics 4000 (650 - 1150 MHz) | ||||||||||||||||||||||||||||||||||||||||||||||||||||||||||||||||||||||||||||||||||||||||||||||||||||||||||||||||||||||||||||||||||||||
| $99 U.S. | |||||||||||||||||||||||||||||||||||||||||||||||||||||||||||||||||||||||||||||||||||||||||||||||||||||||||||||||||||||||||||||||||||||||
| Manufacturer | www.amd.com |

Benchmarks

Average Benchmarks AMD Ryzen 9 3900 → 100% n=16
Average Benchmarks Intel Core i7-3630QM → 50% n=16
Average Benchmarks AMD Ryzen 3 3100 → 64% n=16
* Smaller numbers mean a higher performance
1 This benchmark is not used for the average calculation