Apple M3 Pro 18-Core GPU vs NVIDIA GeForce RTX 4070 SUPER
Apple M3 Pro 18-Core GPU ► remove from comparison
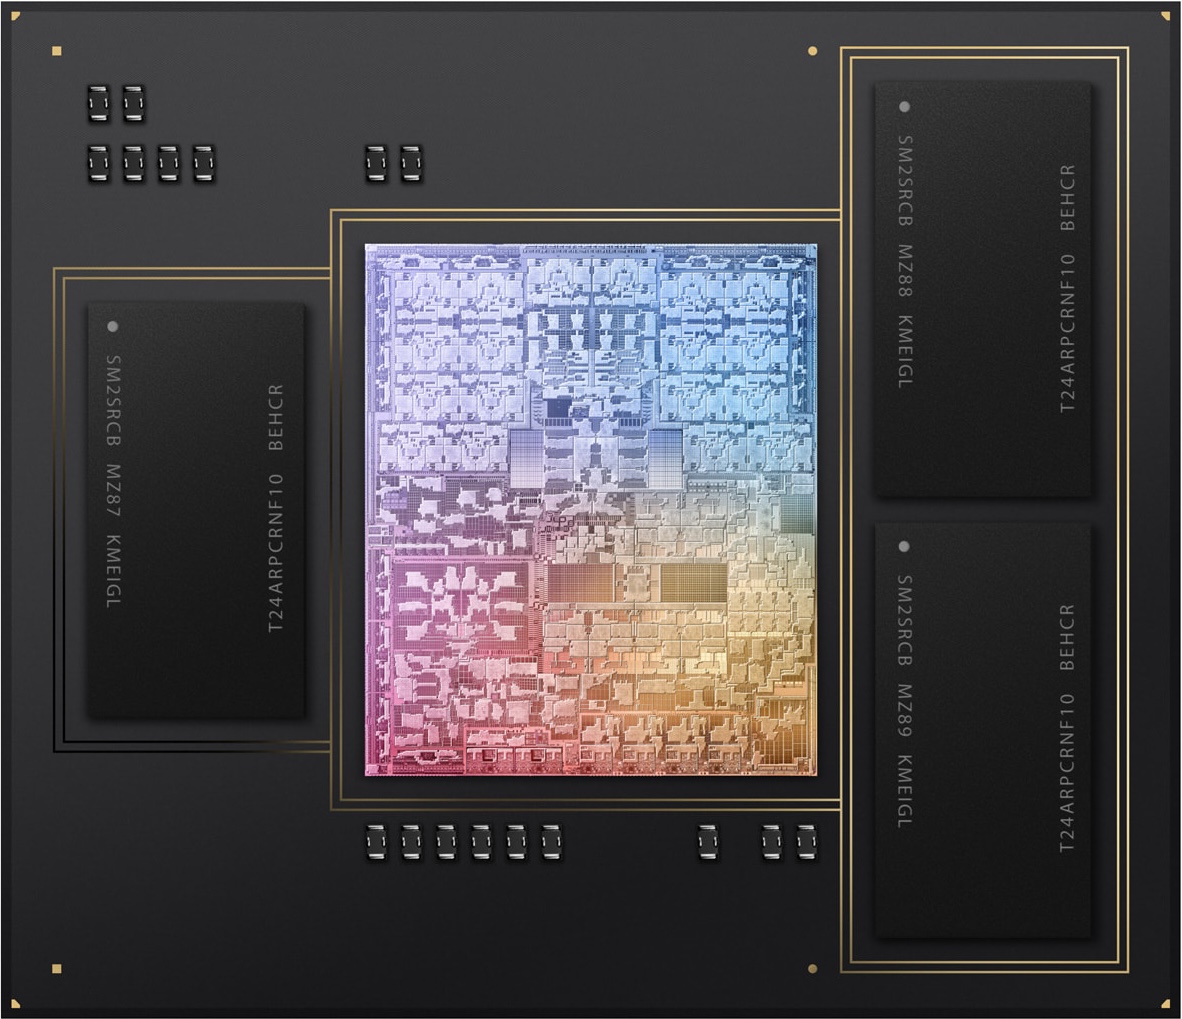
The Apple M3 Pro 18-Core GPU is a self-designed graphics card in the Apple M3 Pro (with 12 CPU cores) and offers all eighteen cores available on the chip. The graphics card uses a new architecture and now offers dynamic caching, mesh shading and ray tracing acceleration.
The GPU can access up to 36 GB LPDDR5-6400 unified memory via a 192-bit memory bus (max 150 GBit/s). Thanks to dynamic caching, the GPU only reserves as much memory as is required.
The entire chip is manufactured in the current 3nm process (probably N3B) at TSMC.
NVIDIA GeForce RTX 4070 SUPER ► remove from comparison
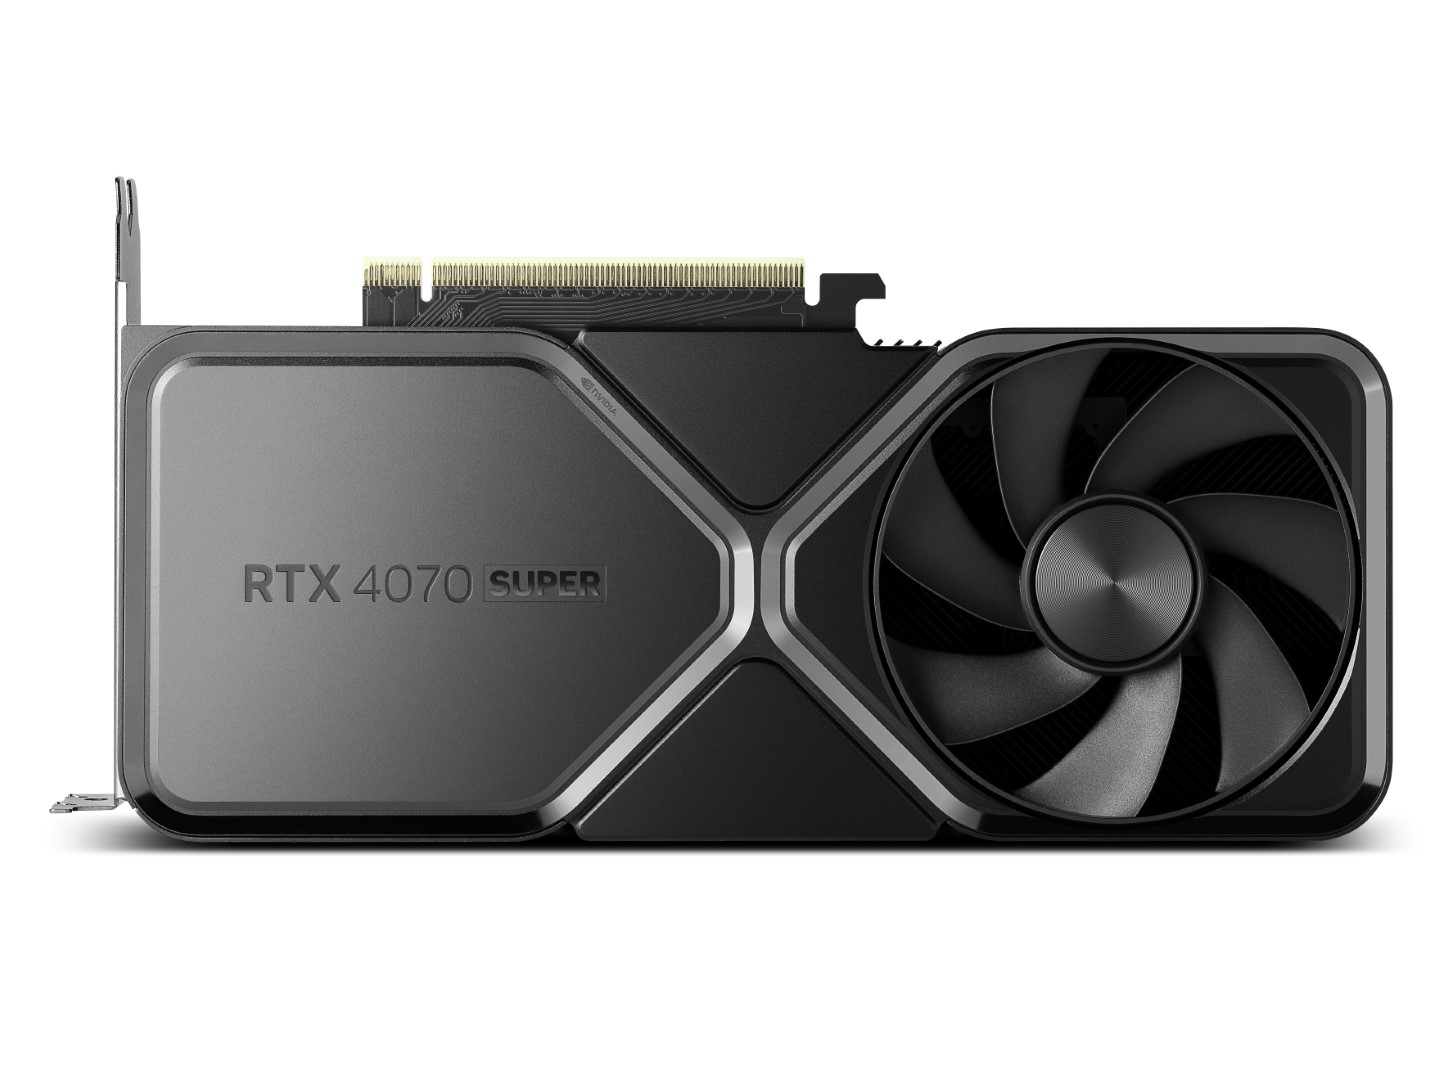
The Nvidia GeForce RTX 4070 SUPER is a high-end desktop graphics card based on the Ada Lovelace architecture. It uses the AD104 chip and offers 7,168 cores and 12 GB GDDR6X graphics memory (192-bit bus with 21 Gbits).
The performance of the RTX 4070S lies between the older RTX 4070 and RTX 4070 Ti in the top class of high-end GPUs in 2024. Compared to AMD GPUs, the 4070 Super is similar fast as the AMD Radeon RX 7800 XT . This makes the GPU best suited for QHD and maximum details of demanding games (such as Avatar Frontiers of Pandora, Allan Wake 2, Cyberpunk 2033 or F1 23). Less demanding games can also be played smoothly in 4K (AC Mirage, Cod MW 3, ...).
The AD104 chip is produced at TSMC in 5 nm (4N with EUV) and is specified with a TGP (Total Graphics Power) of 200 watts.
Apple M3 Pro 18-Core GPU NVIDIA GeForce RTX 4070 SUPER GeForce RTX 4000 Series Pipelines 18 - unified 7168 - unified Memory Type LPDDR5-6400 GDDR6X Shared Memory no no technology 5 nm 5 nm Notebook Size medium sized Date of Announcement 31.10.2023 17.01.2024 Codename AD104 Architecture Ada Lovelace TMUs 224 ROPs 80 Raytracing Cores 56 Tensor / AI Cores 224 Core Speed 1980 - 2475 (Boost) MHz Theoretical Performance 35.5 TFLOPS FP16, 35.5 TFLOPS FP32, 0.55 TFLOPS FP64 Cache L2: 48 MB Memory Speed 21000 effective = 1313 MHz Memory Bus Width 192 Bit Max. Amount of Memory 12 GB Memory Bandwidth 504.2 GB/s API DirectX 12 Ultimate, Shader 6.7, OpenGL 4.6, OpenCL 3.0, Vulkan 1.3 Power Consumption 220 Watt Transistors 35.8 Billion Die Size 295 mm² PCIe 4.0 x16 Displays 4 Displays (max.), HDMI 2.1, DisplayPort 1.4a Predecessor NVIDIA GeForce RTX 4070
CPU in M3 Pro 18-Core GPU GPU Base Speed GPU Boost / Turbo Apple M3 Pro 12-Core 12 x 2748 MHz, 27 W ? MHz ? MHz
Benchmarks Performance Rating - 3DMark 11 + Fire Strike + Time Spy - NVIDIA GeForce RTX 4070 SUPER
22.3 pt (67%)
...
NVIDIA GeForce RTX 4070 SUPER
...
max:
3DMark - 3DMark Time Spy Score
min: 21080 avg: 21186 median: 21186 (61%) max: 21292 Points
3DMark - 3DMark Time Spy Graphics
min: 20867 avg: 20992 median: 20992 (56%) max: 21117 Points
3DMark - 3DMark Ice Storm Unlimited Graphics
min: 763636 avg: 766679 median: 766678 (87%) max: 769721 Points
3DMark - 3DMark Ice Storm Extreme Graphics
min: 515758 avg: 517177 median: 517176 (66%) max: 518595 Points
3DMark - 3DMark Cloud Gate Score
min: 81504 avg: 81898 median: 81897.5 (88%) max: 82291 Points
3DMark - 3DMark Cloud Gate Graphics
min: 170014 avg: 171098 median: 171098 (45%) max: 172182 Points
3DMark - 3DMark Fire Strike Standard Score
min: 39061 avg: 40120 median: 40119.5 (71%) max: 41178 Points
3DMark - 3DMark Fire Strike Standard Graphics
min: 48043 avg: 48876 median: 48876 (55%) max: 49709 Points
3DMark - 3DMark Ice Storm Graphics
min: 559629 avg: 564567 median: 564567 (68%) max: 569505 Points
3DMark - 3DMark Wild Life Unlimited
min: 134699 avg: 135490 median: 135490 (68%) max: 136280 Points
3DMark - 3DMark Wild Life Extreme Unlimited
14545 Points (17%)
min: 41082 avg: 41368 median: 41368 (48%) max: 41654 Points
GPU TDP ? TDP 28 W 100% 35%
3DMark - 3DMark Night Raid
min: 89236 avg: 89795 median: 89795 (85%) max: 90354 Points
3DMark - 3DMark Night Raid Graphics Score
min: 195290 avg: 198557 median: 198556 (76%) max: 201823 Points
3DMark 11 - 3DM11 Performance Score
min: 51107 avg: 51340 median: 51339.5 (71%) max: 51572 Points
3DMark 11 - 3DM11 Performance GPU
min: 67852 avg: 68373 median: 68373 (59%) max: 68894 Points
Unigine Valley 1.0 - Unigine Valley 1.0 DX
min: 213.8 avg: 214.6 median: 214.6 (70%) max: 215.3 fps
Blender - Blender 3.3 Classroom CUDA *
19 Seconds (3%)
Blender - Blender 3.3 Classroom OPTIX *
11 Seconds (4%)
Blender - Blender 3.3 Classroom METAL *
69 Seconds (7%)
GFXBench - GFXBench 5.0 4K Aztec Ruins High Tier Offscreen
97.8 fps (40%)
GFXBench - GFXBench 5.0 Aztec Ruins High Tier Offscreen
219.7 fps (40%)
GFXBench - GFXBench 5.0 Aztec Ruins Normal Tier Offscreen
580 fps (43%)
GFXBench - GFXBench Car Chase Offscreen
436 fps (49%)
GFXBench 3.1 - GFXBench Manhattan ES 3.1 Offscreen
670 fps (14%)
GFXBench 3.0 - GFXBench 3.0 Manhattan Offscreen
936 fps (55%)
GFXBench (DX / GLBenchmark) 2.7 + Apple M3 Pro 18-Core GPU GFXBench (DX / GLBenchmark) 2.7 - GFXBench T-Rex HD Offscreen C24Z16
1480 fps (12%)
Geekbench 6.2 - Geekbench 6.2 GPU OpenCL
50373 Points (15%)
Geekbench 6.2 - Geekbench 6.2 GPU Metal
78324 Points (50%)
LuxMark v2.0 64Bit - LuxMark v2.0 Room GPU
min: 8257 avg: 8260 median: 8259.5 (37%) max: 8262 Samples/s
LuxMark v2.0 64Bit - LuxMark v2.0 Sala GPU
min: 19072 avg: 19102 median: 19101.5 (33%) max: 19131 Samples/s
ComputeMark v2.1 - ComputeMark v2.1 Result
min: 47808 avg: 47986 median: 47985.5 (52%) max: 48163 Points
Power Consumption - Furmark Stress Test Power Consumption - external Monitor *
min: 333 avg: 359 median: 345 (49%) max: 413 Watt
Power Consumption - The Witcher 3 Power Consumption - external Monitor *
40 Watt (6%)
min: 372 avg: 381.3 median: 382.5 (53%) max: 388 Watt
GPU TDP ? TDP 28 W 100% 202%
Power Consumption - Witcher 3 Power Consumption *
52.1 Watt (11%)
Power Consumption - Witcher 3 ultra Power Efficiency
0.8 fps per Watt (74%)
Power Consumption - Witcher 3 ultra Power Efficiency - external Monitor
min: 1.075 avg: 1.1 median: 1.1 (89%) max: 1.207 fps per Watt
min: 0.509 avg: 0.5 median: 0.5 (43%) max: 0.541 fps per Watt
GPU TDP ? TDP 28 W 49% 100%
Emissions Witcher 3 Fan Noise + Apple M3 Pro 18-Core GPU Emissions - Witcher 3 Fan Noise
25.1 dB(A) (40%)
Average Benchmarks Apple M3 Pro 18-Core GPU → 100% n=1 Average Benchmarks NVIDIA GeForce RTX 4070 SUPER → 284% n=1
- Range of benchmark values for this graphics card
- Average benchmark values for this graphics card
* Smaller numbers mean a higher performance
1 This benchmark is not used for the average calculation
Game Benchmarks The following benchmarks stem from our benchmarks of review laptops. The performance depends on the used graphics memory, clock rate, processor, system settings, drivers, and operating systems. So the results don't have to be representative for all laptops with this GPU. For detailed information on the benchmark results, click on the fps number.
NVIDIA GeForce RTX 4070 SUPER:
137.4 fps
NVIDIA GeForce RTX 4070 SUPER:
122.1 129.9 ~ 126 fps
NVIDIA GeForce RTX 4070 SUPER:
96.2 101.2 ~ 99 fps
NVIDIA GeForce RTX 4070 SUPER:
61.5 67.6 ~ 65 fps
NVIDIA GeForce RTX 4070 SUPER:
33.9 34.6 ~ 34 fps
NVIDIA GeForce RTX 4070 SUPER:
56.6 60.5 ~ 59 fps
NVIDIA GeForce RTX 4070 SUPER:
226 fps
NVIDIA GeForce RTX 4070 SUPER:
179 184 ~ 182 fps
NVIDIA GeForce RTX 4070 SUPER:
165 166 ~ 166 fps
NVIDIA GeForce RTX 4070 SUPER:
118 120 ~ 119 fps
NVIDIA GeForce RTX 4070 SUPER:
70 71 ~ 71 fps
NVIDIA GeForce RTX 4070 SUPER:
99 100 ~ 100 fps
NVIDIA GeForce RTX 4070 SUPER:
112.8 fps
NVIDIA GeForce RTX 4070 SUPER:
105.1 114.1 ~ 110 fps
NVIDIA GeForce RTX 4070 SUPER:
73.8 79.7 ~ 77 fps
NVIDIA GeForce RTX 4070 SUPER:
40 42.7 ~ 41 fps
NVIDIA GeForce RTX 4070 SUPER:
28.9 44.2 ~ 37 fps
100%
M3 Pro 18-Core GPU:
212 fps
100%
M3 Pro 18-Core GPU:
140 fps
100%
M3 Pro 18-Core GPU:
77 fps
100%
M3 Pro 18-Core GPU:
58 fps
100%
M3 Pro 18-Core GPU:
42 fps
NVIDIA GeForce RTX 4070 SUPER:
205 fps
NVIDIA GeForce RTX 4070 SUPER:
193 204 ~ 199 fps
NVIDIA GeForce RTX 4070 SUPER:
157 169 ~ 163 fps
NVIDIA GeForce RTX 4070 SUPER:
121 130 ~ 126 fps
NVIDIA GeForce RTX 4070 SUPER:
72 77 ~ 75 fps
NVIDIA GeForce RTX 4070 SUPER:
99 106 ~ 103 fps
100%
M3 Pro 18-Core GPU:
53 fps
351%
NVIDIA GeForce RTX 4070 SUPER:
186 fps
100%
M3 Pro 18-Core GPU:
42.6 fps
427%
NVIDIA GeForce RTX 4070 SUPER:
181.8 fps
100%
M3 Pro 18-Core GPU:
35 fps
454%
NVIDIA GeForce RTX 4070 SUPER:
156.3 162.1 ~ 159 fps
100%
M3 Pro 18-Core GPU:
30.8 fps
451%
NVIDIA GeForce RTX 4070 SUPER:
136.2 141.9 ~ 139 fps
NVIDIA GeForce RTX 4070 SUPER:
83.8 89.6 ~ 87 fps
NVIDIA GeForce RTX 4070 SUPER:
38.4 38.9 ~ 39 fps
NVIDIA GeForce RTX 4070 SUPER:
228 fps
100%
M3 Pro 18-Core GPU:
53 fps
379%
NVIDIA GeForce RTX 4070 SUPER:
198.8 203 ~ 201 fps
100%
M3 Pro 18-Core GPU:
43 fps
463%
NVIDIA GeForce RTX 4070 SUPER:
194.3 203 ~ 199 fps
NVIDIA GeForce RTX 4070 SUPER:
140.3 142.7 ~ 142 fps
NVIDIA GeForce RTX 4070 SUPER:
71.6 71.7 ~ 72 fps
NVIDIA GeForce RTX 4070 SUPER:
115.4 119.7 ~ 118 fps
NVIDIA GeForce RTX 4070 SUPER:
380 381 ~ 381 fps
NVIDIA GeForce RTX 4070 SUPER:
398 406 ~ 402 fps
NVIDIA GeForce RTX 4070 SUPER:
344 357 ~ 351 fps
NVIDIA GeForce RTX 4070 SUPER:
122.4 125.9 ~ 124 fps
NVIDIA GeForce RTX 4070 SUPER:
78 81.2 ~ 80 fps
NVIDIA GeForce RTX 4070 SUPER:
39 40.7 ~ 40 fps
NVIDIA GeForce RTX 4070 SUPER:
66.8 69.7 ~ 68 fps
100%
M3 Pro 18-Core GPU:
30 fps
100%
M3 Pro 18-Core GPU:
26 fps
100%
M3 Pro 18-Core GPU:
17 fps
NVIDIA GeForce RTX 4070 SUPER:
208 fps
NVIDIA GeForce RTX 4070 SUPER:
201.7 216.1 ~ 209 fps
NVIDIA GeForce RTX 4070 SUPER:
149.6 155.7 ~ 153 fps
NVIDIA GeForce RTX 4070 SUPER:
118 123.8 ~ 121 fps
NVIDIA GeForce RTX 4070 SUPER:
73.6 78 ~ 76 fps
NVIDIA GeForce RTX 4070 SUPER:
363 381 ~ 372 fps
NVIDIA GeForce RTX 4070 SUPER:
386 403 ~ 395 fps
NVIDIA GeForce RTX 4070 SUPER:
321 340 ~ 331 fps
NVIDIA GeForce RTX 4070 SUPER:
128.7 136.3 ~ 133 fps
NVIDIA GeForce RTX 4070 SUPER:
83.1 88.8 ~ 86 fps
NVIDIA GeForce RTX 4070 SUPER:
41.9 44.6 ~ 43 fps
NVIDIA GeForce RTX 4070 SUPER:
285 fps
NVIDIA GeForce RTX 4070 SUPER:
279 284 ~ 282 fps
NVIDIA GeForce RTX 4070 SUPER:
278 291 ~ 285 fps
NVIDIA GeForce RTX 4070 SUPER:
189.6 194.8 ~ 192 fps
NVIDIA GeForce RTX 4070 SUPER:
87.5 92.7 ~ 90 fps
NVIDIA GeForce RTX 4070 SUPER:
195.7 fps
NVIDIA GeForce RTX 4070 SUPER:
184.1 fps
NVIDIA GeForce RTX 4070 SUPER:
156.5 161.8 ~ 159 fps
NVIDIA GeForce RTX 4070 SUPER:
141 146 ~ 144 fps
NVIDIA GeForce RTX 4070 SUPER:
91.3 92.8 ~ 92 fps
NVIDIA GeForce RTX 4070 SUPER:
43.5 44.9 ~ 44 fps
NVIDIA GeForce RTX 4070 SUPER:
201 fps
NVIDIA GeForce RTX 4070 SUPER:
150.5 157 ~ 154 fps
NVIDIA GeForce RTX 4070 SUPER:
108 109.7 ~ 109 fps
NVIDIA GeForce RTX 4070 SUPER:
52.8 54.5 ~ 54 fps
NVIDIA GeForce RTX 4070 SUPER:
206 fps
NVIDIA GeForce RTX 4070 SUPER:
181.8 193.7 ~ 188 fps
NVIDIA GeForce RTX 4070 SUPER:
139.4 145.9 ~ 143 fps
NVIDIA GeForce RTX 4070 SUPER:
79 82.7 ~ 81 fps
NVIDIA GeForce RTX 4070 SUPER:
169.2 fps
NVIDIA GeForce RTX 4070 SUPER:
159.1 fps
NVIDIA GeForce RTX 4070 SUPER:
135.5 142.3 ~ 139 fps
NVIDIA GeForce RTX 4070 SUPER:
106 109.2 ~ 108 fps
NVIDIA GeForce RTX 4070 SUPER:
61.4 63.4 ~ 62 fps
NVIDIA GeForce RTX 4070 SUPER:
233 fps
NVIDIA GeForce RTX 4070 SUPER:
216 226 ~ 221 fps
NVIDIA GeForce RTX 4070 SUPER:
156.8 161.5 ~ 159 fps
NVIDIA GeForce RTX 4070 SUPER:
80.5 83.2 ~ 82 fps
NVIDIA GeForce RTX 4070 SUPER:
193.6 fps
NVIDIA GeForce RTX 4070 SUPER:
179.3 184.2 ~ 182 fps
NVIDIA GeForce RTX 4070 SUPER:
163.4 166.6 ~ 165 fps
NVIDIA GeForce RTX 4070 SUPER:
125.4 131.2 ~ 128 fps
NVIDIA GeForce RTX 4070 SUPER:
66.2 68.9 ~ 68 fps
NVIDIA GeForce RTX 4070 SUPER:
224 fps
NVIDIA GeForce RTX 4070 SUPER:
172.7 180.1 ~ 176 fps
NVIDIA GeForce RTX 4070 SUPER:
112.6 115.5 ~ 114 fps
NVIDIA GeForce RTX 4070 SUPER:
57.4 58.2 ~ 58 fps
NVIDIA GeForce RTX 4070 SUPER:
67.1 69 ~ 68 fps
100%
M3 Pro 18-Core GPU:
87 fps
100%
M3 Pro 18-Core GPU:
56 fps
100%
M3 Pro 18-Core GPU:
41 fps
100%
M3 Pro 18-Core GPU:
25 fps
NVIDIA GeForce RTX 4070 SUPER:
267 fps
NVIDIA GeForce RTX 4070 SUPER:
224 fps
NVIDIA GeForce RTX 4070 SUPER:
178.8 186.1 ~ 182 fps
NVIDIA GeForce RTX 4070 SUPER:
144.8 150.6 ~ 148 fps
NVIDIA GeForce RTX 4070 SUPER:
116.1 120.8 ~ 118 fps
NVIDIA GeForce RTX 4070 SUPER:
72.8 76.1 ~ 74 fps
100%
M3 Pro 18-Core GPU:
71 fps
373%
NVIDIA GeForce RTX 4070 SUPER:
265 fps
100%
M3 Pro 18-Core GPU:
65 fps
398%
NVIDIA GeForce RTX 4070 SUPER:
257 260 ~ 259 fps
100%
M3 Pro 18-Core GPU:
57 fps
439%
NVIDIA GeForce RTX 4070 SUPER:
244 255 ~ 250 fps
100%
M3 Pro 18-Core GPU:
37 fps
478%
NVIDIA GeForce RTX 4070 SUPER:
165.3 188 ~ 177 fps
NVIDIA GeForce RTX 4070 SUPER:
91.5 96.7 ~ 94 fps
NVIDIA GeForce RTX 4070 SUPER:
570 601 ~ 586 fps
NVIDIA GeForce RTX 4070 SUPER:
398 469 ~ 434 fps
NVIDIA GeForce RTX 4070 SUPER:
418 437 ~ 428 fps
NVIDIA GeForce RTX 4070 SUPER:
376 385 ~ 381 fps
NVIDIA GeForce RTX 4070 SUPER:
260 270 ~ 265 fps
NVIDIA GeForce RTX 4070 SUPER:
130 134.7 ~ 132 fps
NVIDIA GeForce RTX 4070 SUPER:
203 fps
NVIDIA GeForce RTX 4070 SUPER:
199 201 ~ 200 fps
NVIDIA GeForce RTX 4070 SUPER:
188 191 ~ 190 fps
NVIDIA GeForce RTX 4070 SUPER:
181 185 ~ 183 fps
NVIDIA GeForce RTX 4070 SUPER:
101 104 ~ 103 fps
NVIDIA GeForce RTX 4070 SUPER:
226 233 ~ 230 fps
NVIDIA GeForce RTX 4070 SUPER:
196.3 196.4 ~ 196 fps
NVIDIA GeForce RTX 4070 SUPER:
151.9 152.4 ~ 152 fps
NVIDIA GeForce RTX 4070 SUPER:
129.1 131.7 ~ 130 fps
NVIDIA GeForce RTX 4070 SUPER:
235 244 ~ 240 fps
NVIDIA GeForce RTX 4070 SUPER:
234 235 ~ 235 fps
NVIDIA GeForce RTX 4070 SUPER:
194 197.1 ~ 196 fps
NVIDIA GeForce RTX 4070 SUPER:
148 150.5 ~ 149 fps
NVIDIA GeForce RTX 4070 SUPER:
84.8 85.2 ~ 85 fps
NVIDIA GeForce RTX 4070 SUPER:
244 250 ~ 247 fps
NVIDIA GeForce RTX 4070 SUPER:
228 229 ~ 229 fps
NVIDIA GeForce RTX 4070 SUPER:
221 223 ~ 222 fps
NVIDIA GeForce RTX 4070 SUPER:
208 209 ~ 209 fps
NVIDIA GeForce RTX 4070 SUPER:
192.9 202 ~ 197 fps
NVIDIA GeForce RTX 4070 SUPER:
566 fps
NVIDIA GeForce RTX 4070 SUPER:
406 418 ~ 412 fps
100%
M3 Pro 18-Core GPU:
43 fps
467%
NVIDIA GeForce RTX 4070 SUPER:
191.9 210 ~ 201 fps
NVIDIA GeForce RTX 4070 SUPER:
148.9 159.1 ~ 154 fps
NVIDIA GeForce RTX 4070 SUPER:
129.4 136.7 ~ 133 fps
NVIDIA GeForce RTX 4070 SUPER:
187.7 188.3 ~ 188 fps
100%
M3 Pro 18-Core GPU:
90 fps
209%
NVIDIA GeForce RTX 4070 SUPER:
187.6 187.9 ~ 188 fps
100%
M3 Pro 18-Core GPU:
79 fps
237%
NVIDIA GeForce RTX 4070 SUPER:
186.9 186.9 ~ 187 fps
100%
M3 Pro 18-Core GPU:
52 fps
306%
NVIDIA GeForce RTX 4070 SUPER:
158.8 160 ~ 159 fps
100%
M3 Pro 18-Core GPU:
49 fps
302%
NVIDIA GeForce RTX 4070 SUPER:
147.2 148.2 ~ 148 fps
NVIDIA GeForce RTX 4070 SUPER:
164.6 166.6 ~ 166 fps
Average Gaming Apple M3 Pro 18-Core GPU → 100% Average Gaming 30-70 fps → 100%
Average Gaming NVIDIA GeForce RTX 4070 SUPER → 382%  Deutsch
 English
 Español
 Français
 Italiano
 Nederlands
 Polski
 Português
 Русский
 Türkçe
 Svenska
 Chinese
 Magyar