Conclusion
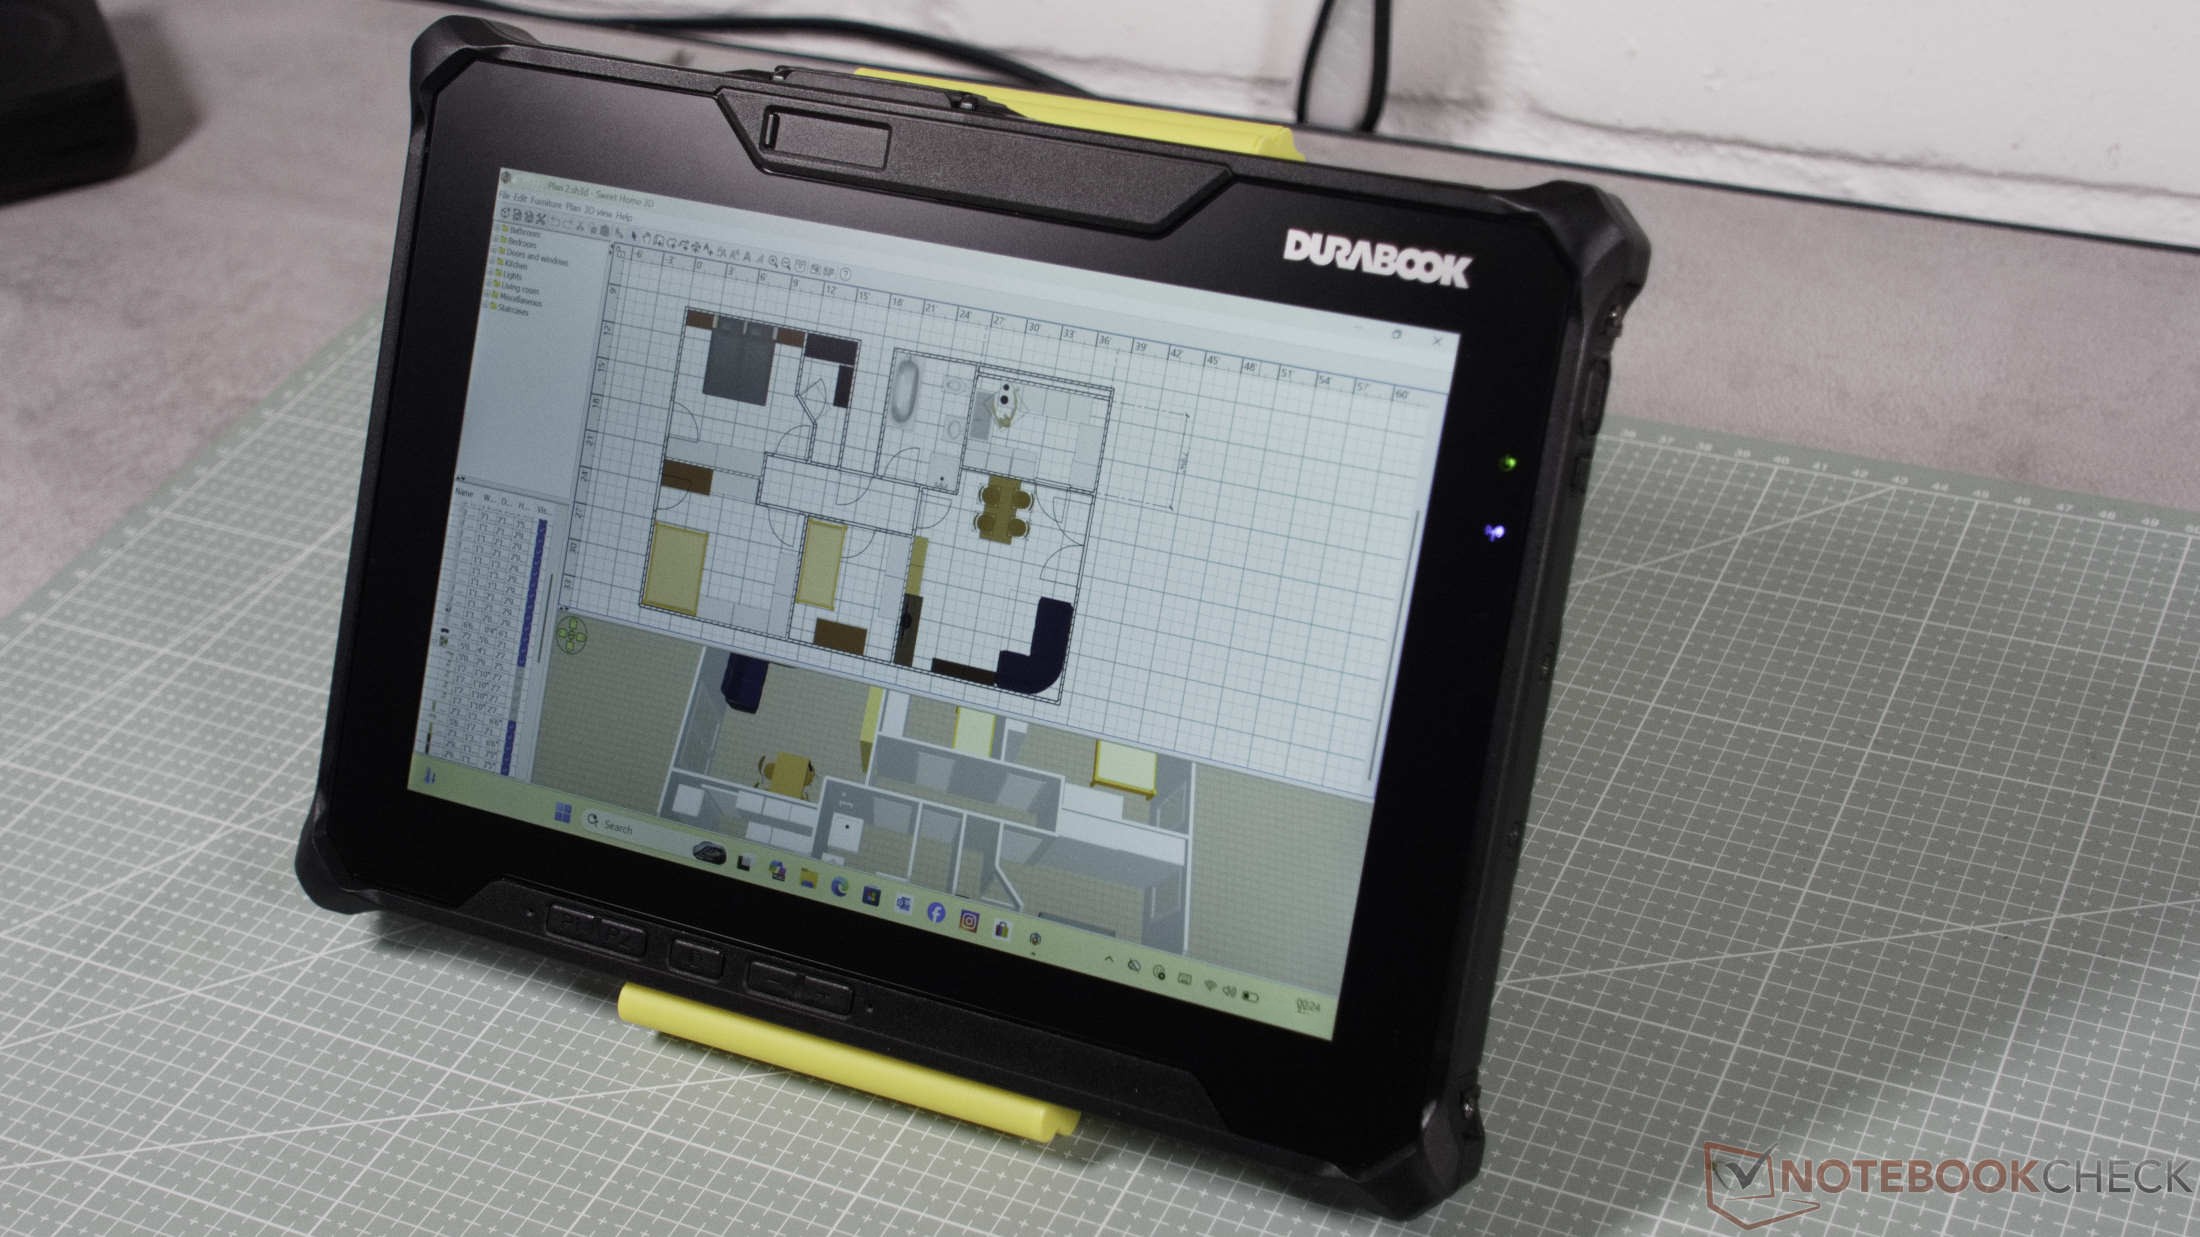
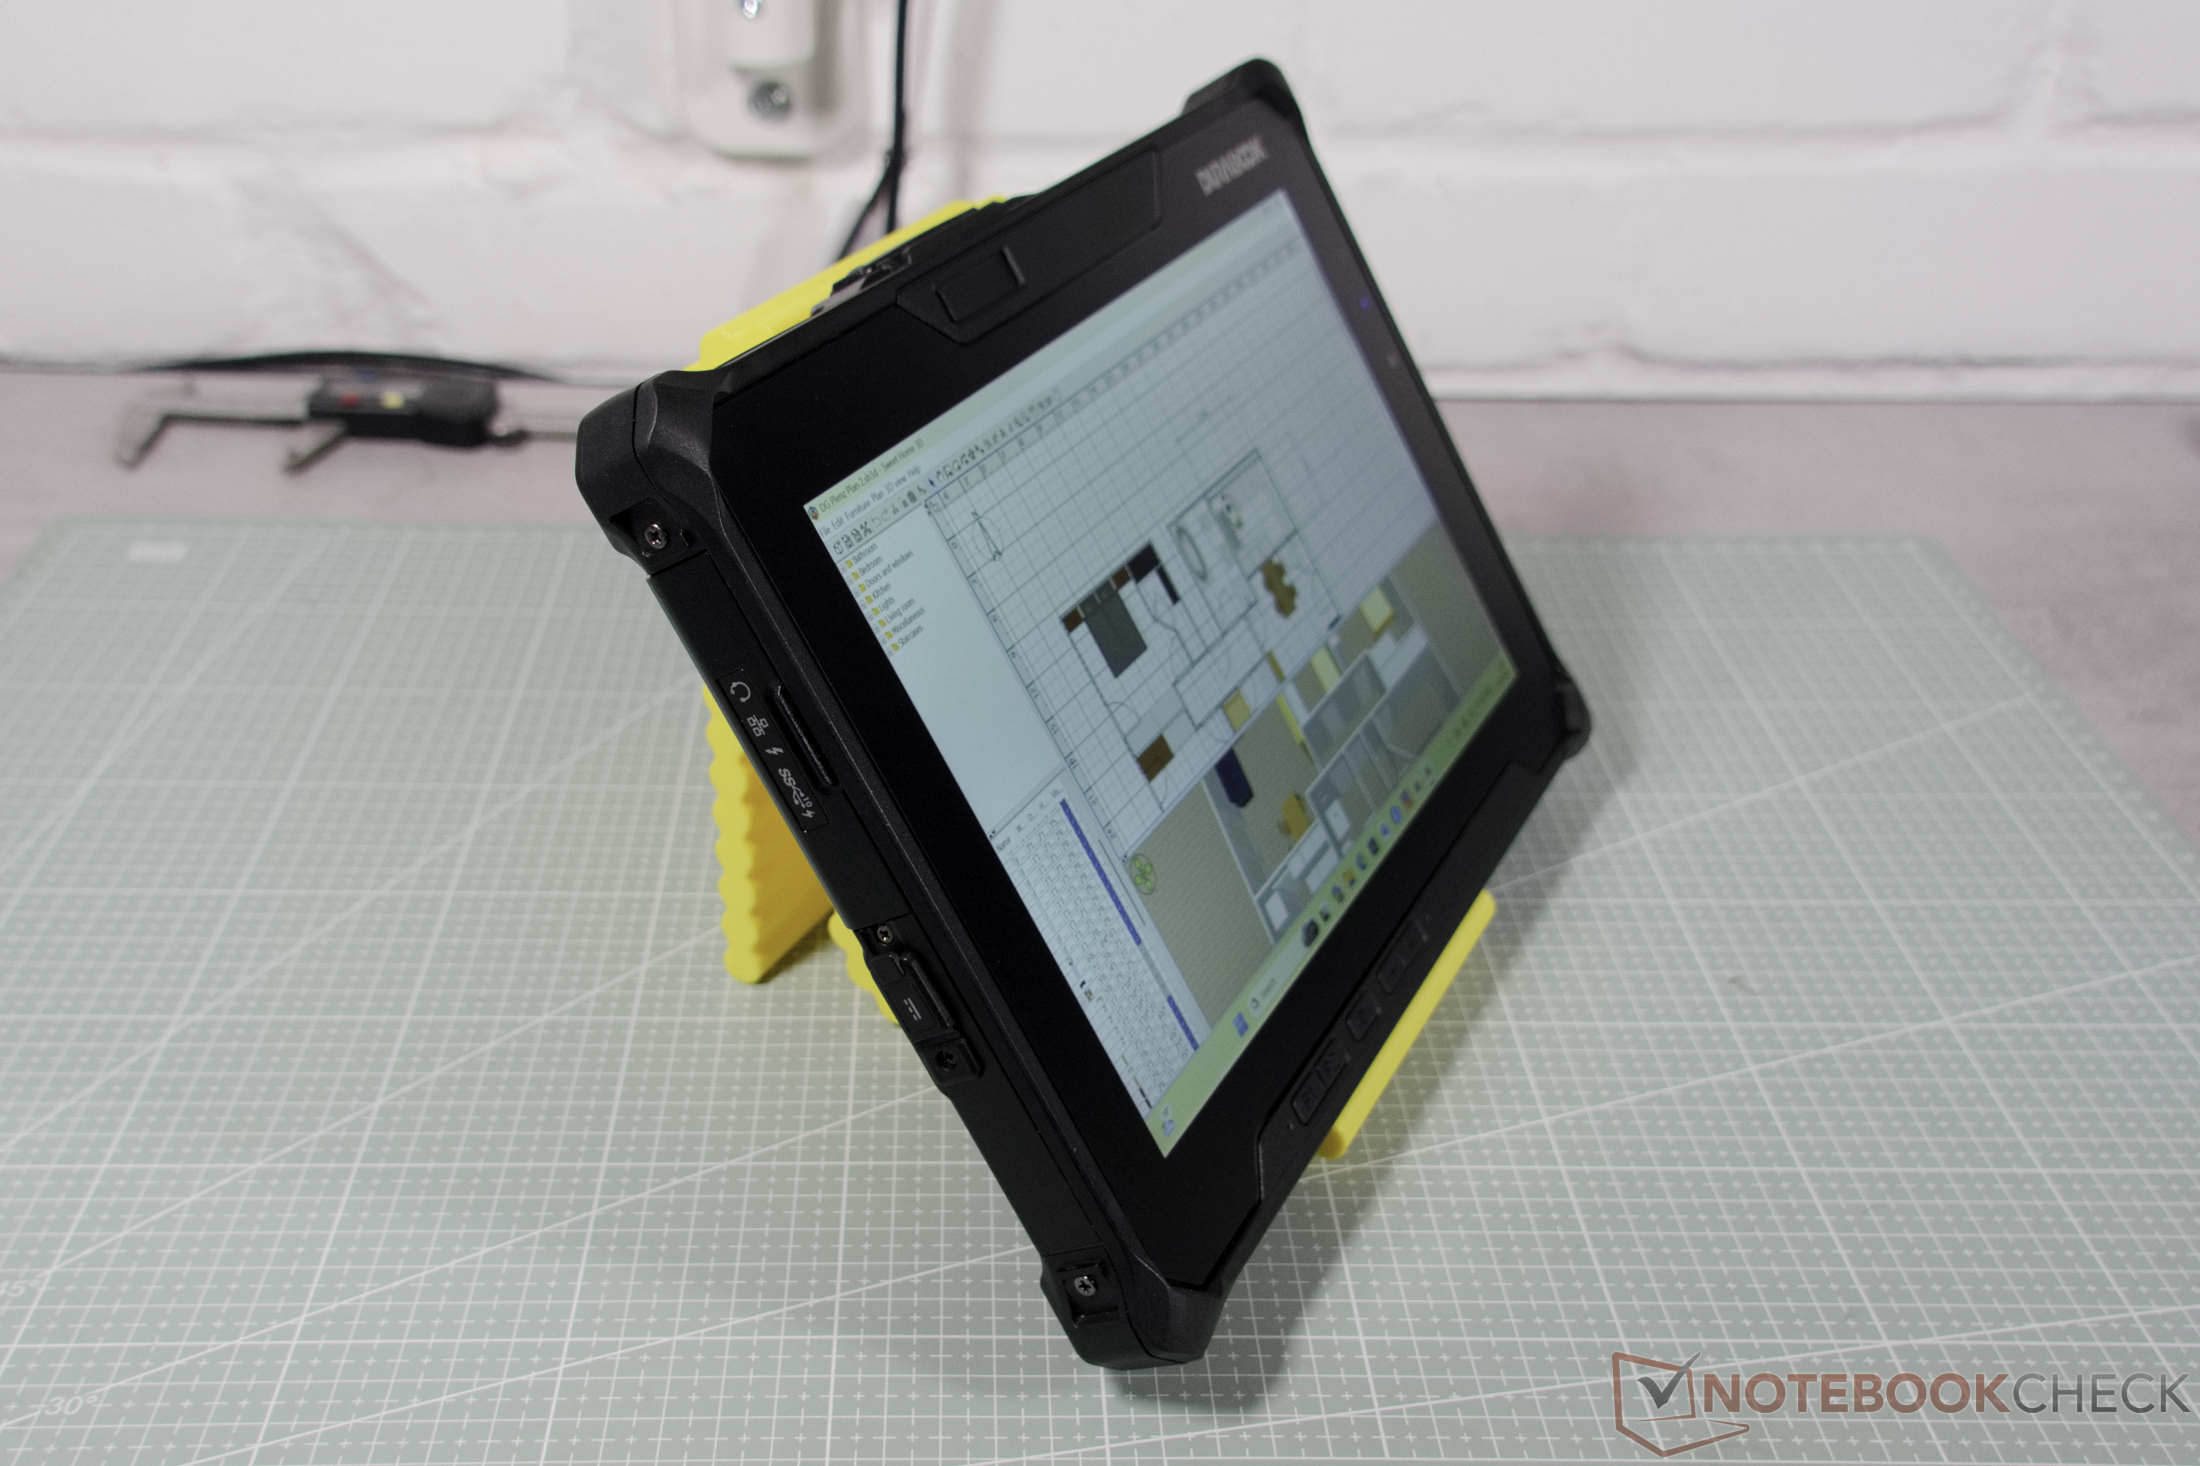
When you look at the Durabook R10, it seems like a brick compared to conventional consumer tablets. With a height of just under three centimeters, thick display bezels, and a weight of over 1.2 kilograms (~2.65 lbs), the 10.1-inch device feels heavy in the hand. Thin and featherlight are not the goals here. The manufacturer builds no-compromise tools for use in extremely demanding environments—whether on a dusty construction site, in an industrial facility, or in the field.
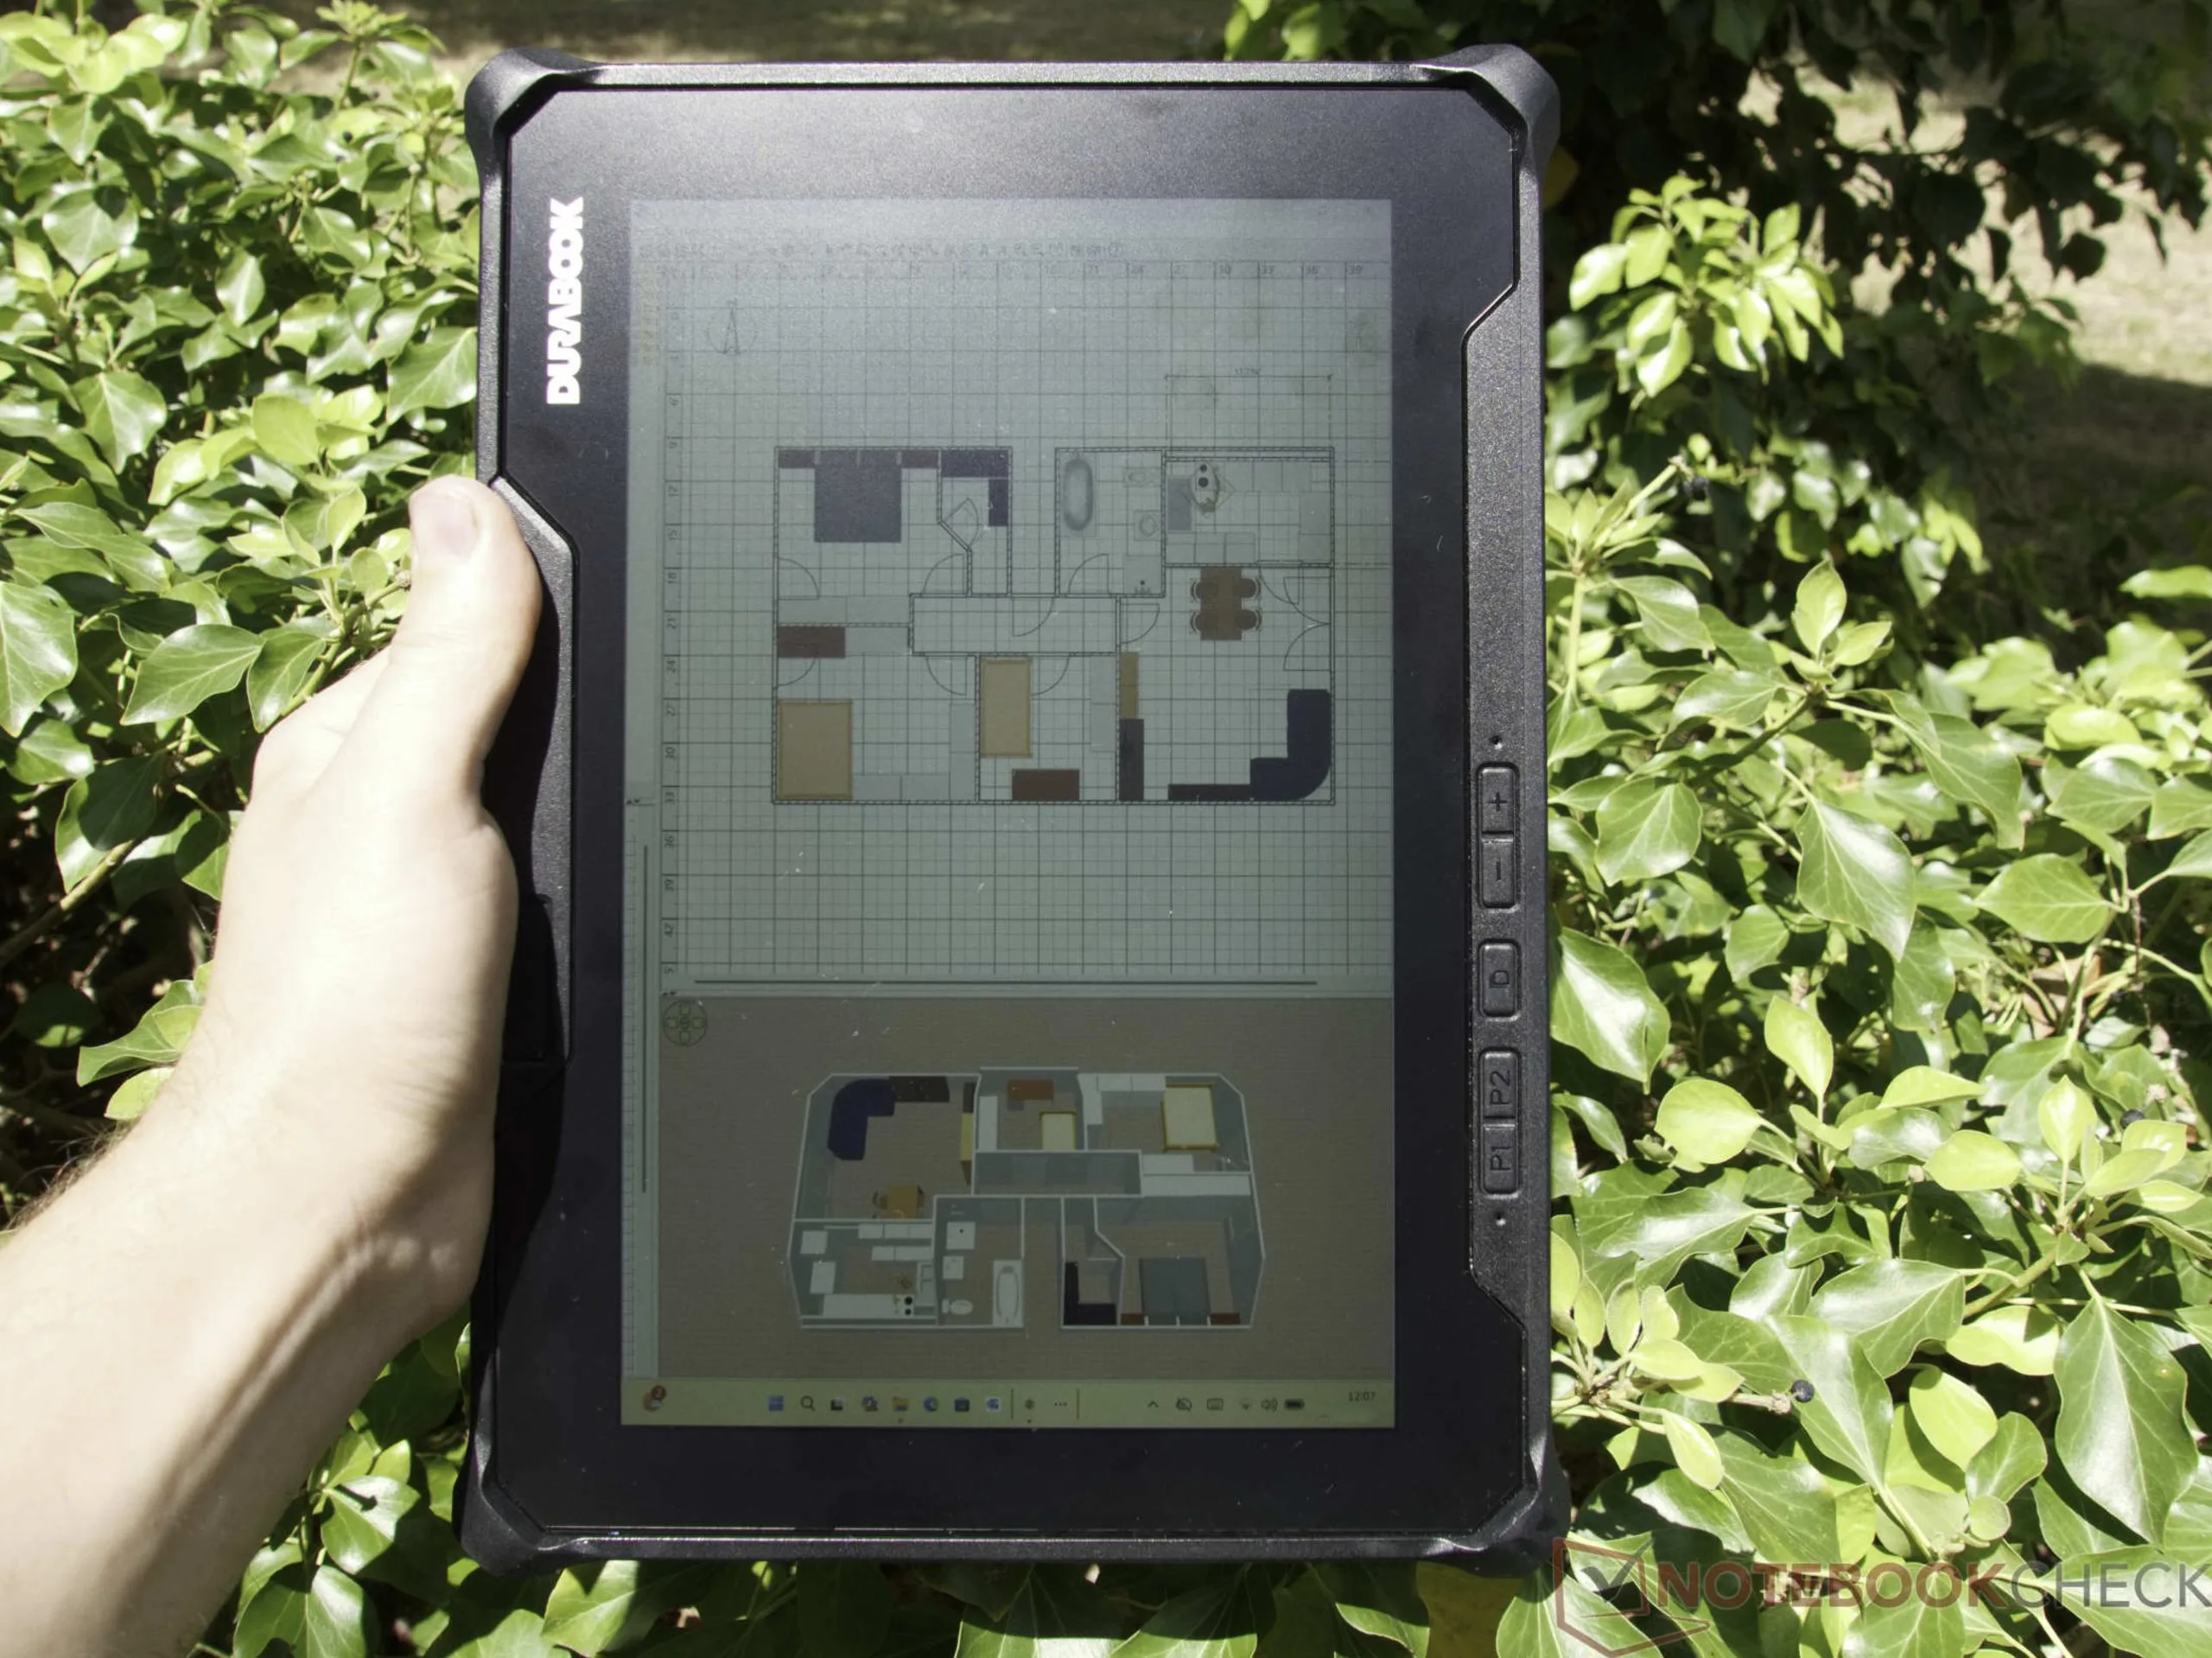
The R10 is designed precisely for these harsh conditions. The magnesium alloy casing is built like a tank, easily withstands hard drops, and is rigorously sealed against water and dirt. The absolute standout features for outdoor use, however, are the screen and the power system. With a brightness of well over 1,000 cd/m²—confirmed in our test—the rugged tablet effortlessly withstands even direct sunlight. It also features a built-in backup battery for true hot-swapping. This means the main battery can be easily removed from the device and replaced while it’s still running.
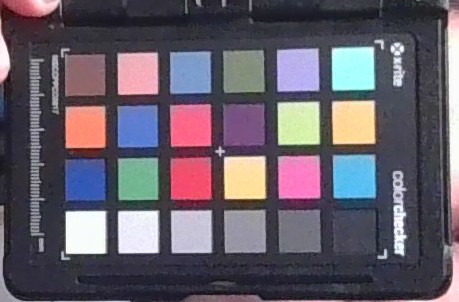
Of course, this level of specialization requires compromises. For color-critical work, the display—with its visible green cast—is unusable, and the cameras and built-in mono speaker serve only basic purposes. The built-in Intel Core Ultra 7 258V handles everyday office and document tasks with ease, but struggles with high DPC latencies in testing, which can lead to problems during real-time data capture. In addition, the card reader is awkwardly tucked away behind the battery. On the plus side, the bulky chassis doesn’t get too hot even under heavy load, while the internal fan hums pleasantly quietly in the background.
Price and Availability
The pricing and availability of the Durabook R10 are primarily geared toward professional customers. The manufacturer does not list prices on its website; instead, prices are calculated exclusively upon individual request. This is also because many of the highly specialized configurations—tailored to individual customer requirements— are sold exclusively directly through Durabook. The rugged tablet can occasionally be found in specialized retail stores. For example, the retailer Ruggedbooks lists the base model with an Intel Core Ultra 5 226V for around 2,759 Euros (~$3146). At Elmark-Automation , a comparable configuration with the same processor starts at around 2,730 Euros (~$3113).
Specifications
Case, Accessories, and Input Devices
The Durabook R10's case is made of a rugged magnesium alloy and is perfectly suited for the toughest work environments. Certified to the U.S. military standard MIL-STD-810H, the tablet is designed to withstand drops from heights of up to 1.8 meters (~5.9 feet) and extreme environmental conditions. In addition, its IP66 certification ensures protection against dust and high-pressure water jets. For sensitive applications, the MIL-STD-461F certification also guarantees excellent electromagnetic compatibility.
Durabook Z14I-HG: AI Power for Extreme Conditions
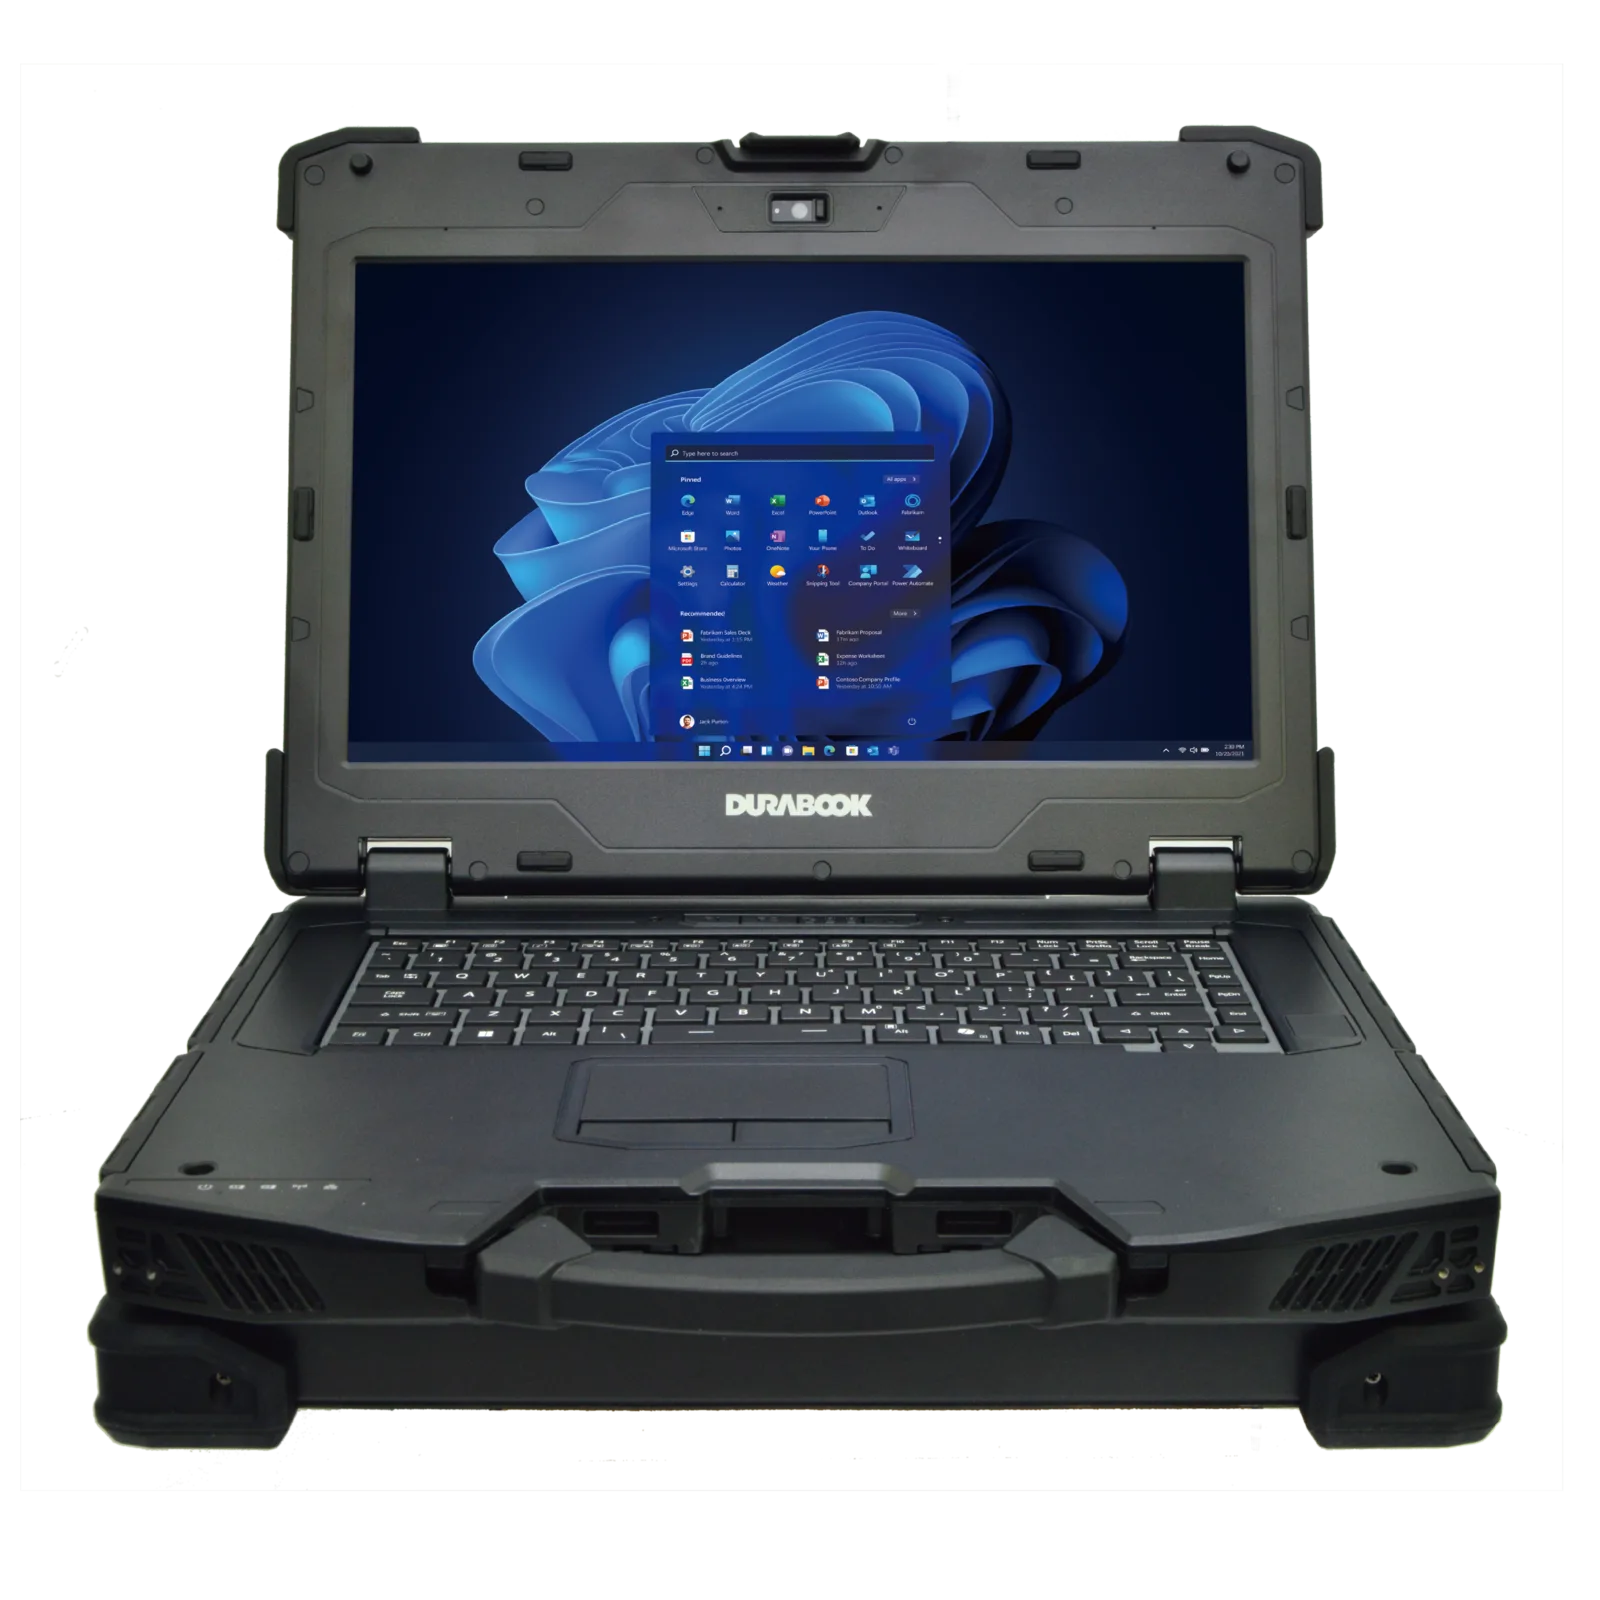
With the Z14I-HG, Durabook introduces a new generation of mobile workstations: fully rugged, AI-ready, and designed for the most demanding applications right on the job site. The 14-inch system combines edge AI performance of up to 682 TOPS with powerful Intel® Core™ Ultra processors. It also features an AI Boost NPU and, optionally, an NVIDIA® RTX™ 3500 Ada (12 GB) or RTX™ 5000 Ada (16 GB) GPU. Anyone who relies on powerful and rugged hardware—such as in industrial automation, field service, or technical research—benefits from fast AI analysis and professional-grade graphics performance for mobile high-performance computing.
Whether it’s real-time 3D rendering, AI inference, or data-intensive simulations—the Z14I-HG processes demanding workloads locally. This reduces latency. At the same time, independence from cloud providers enhances data security, for example during inspections, predictive maintenance, or digital twin applications.
The system is certified to MIL-STD-810H, MIL-STD-461G, and IP66. It withstands extreme temperatures, humidity, and electromagnetic interference. Additionally, the 1200-nit DynaVue® display remains perfectly readable even in direct sunlight and supports multiple input modes as well as multi-screen setups.
The Z14I-HG workstation is available now and can be ordered directly from Durabook.
Connectivity
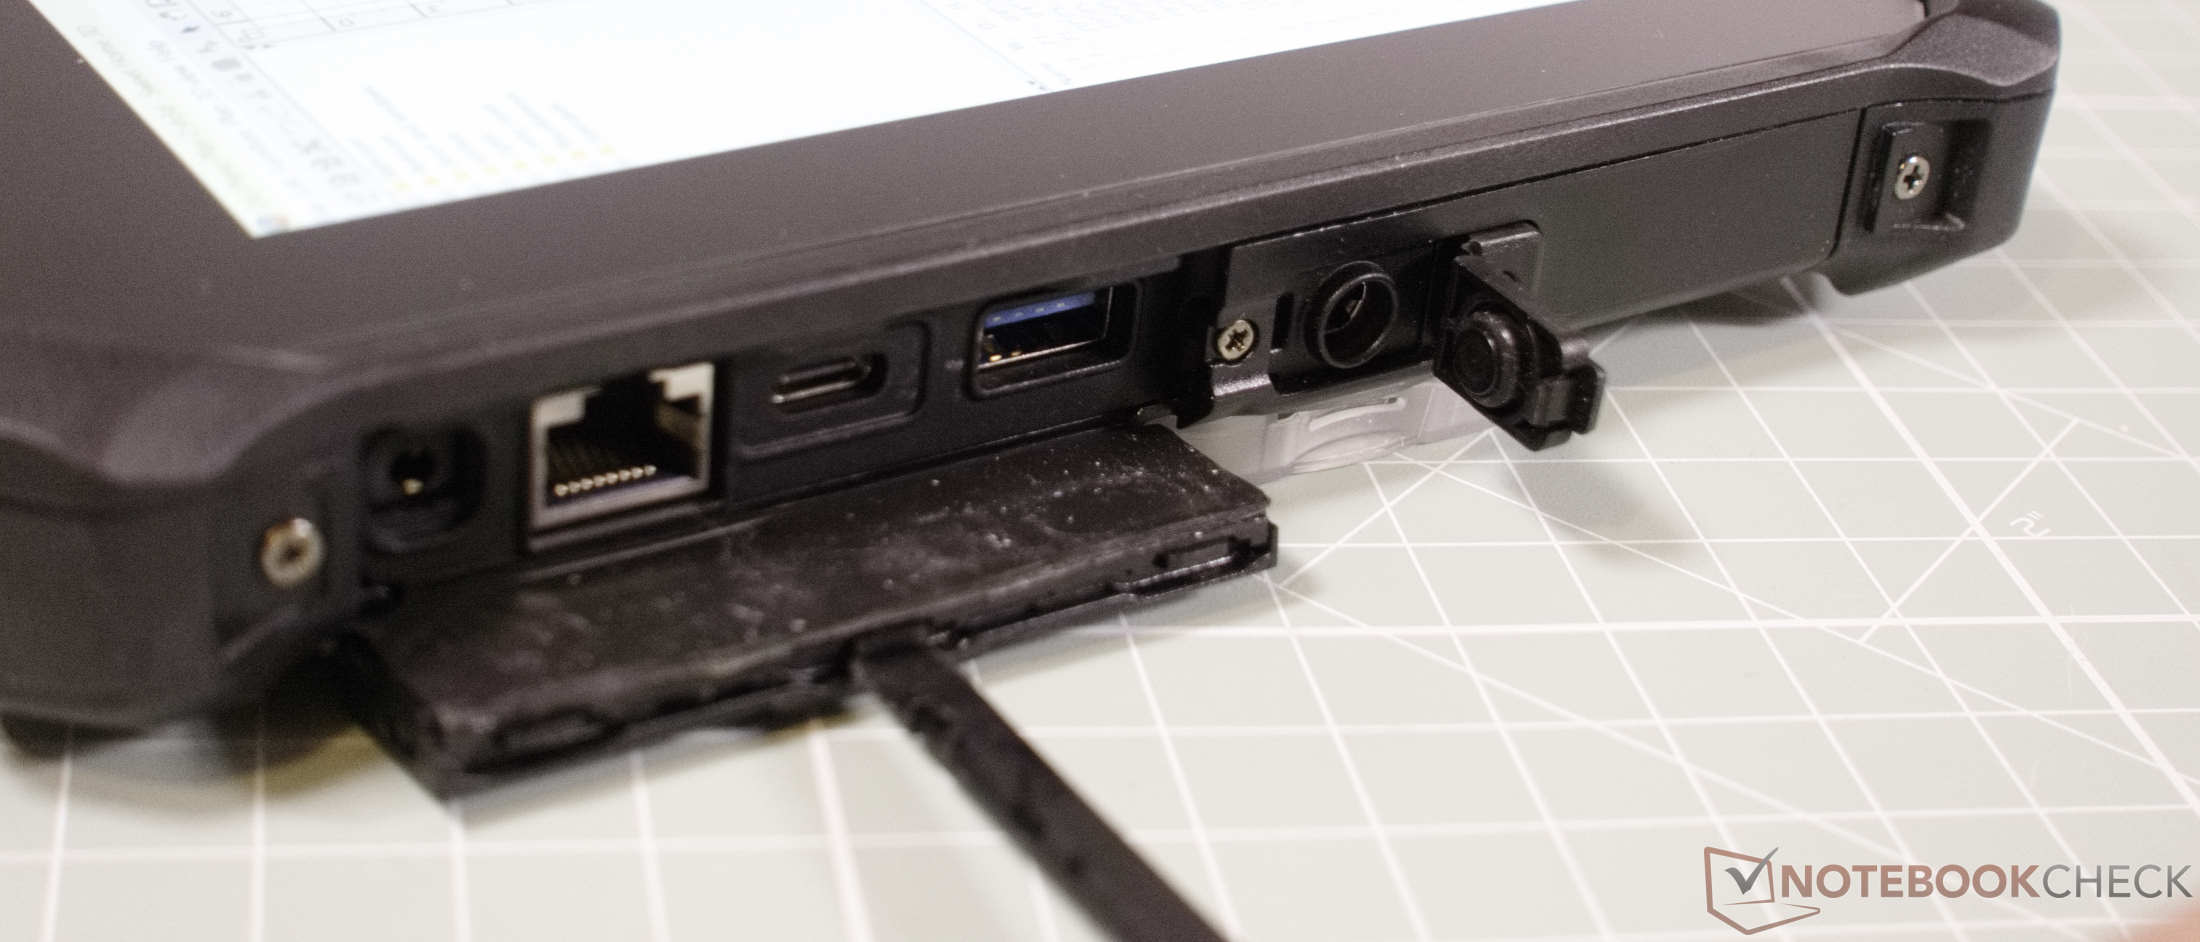
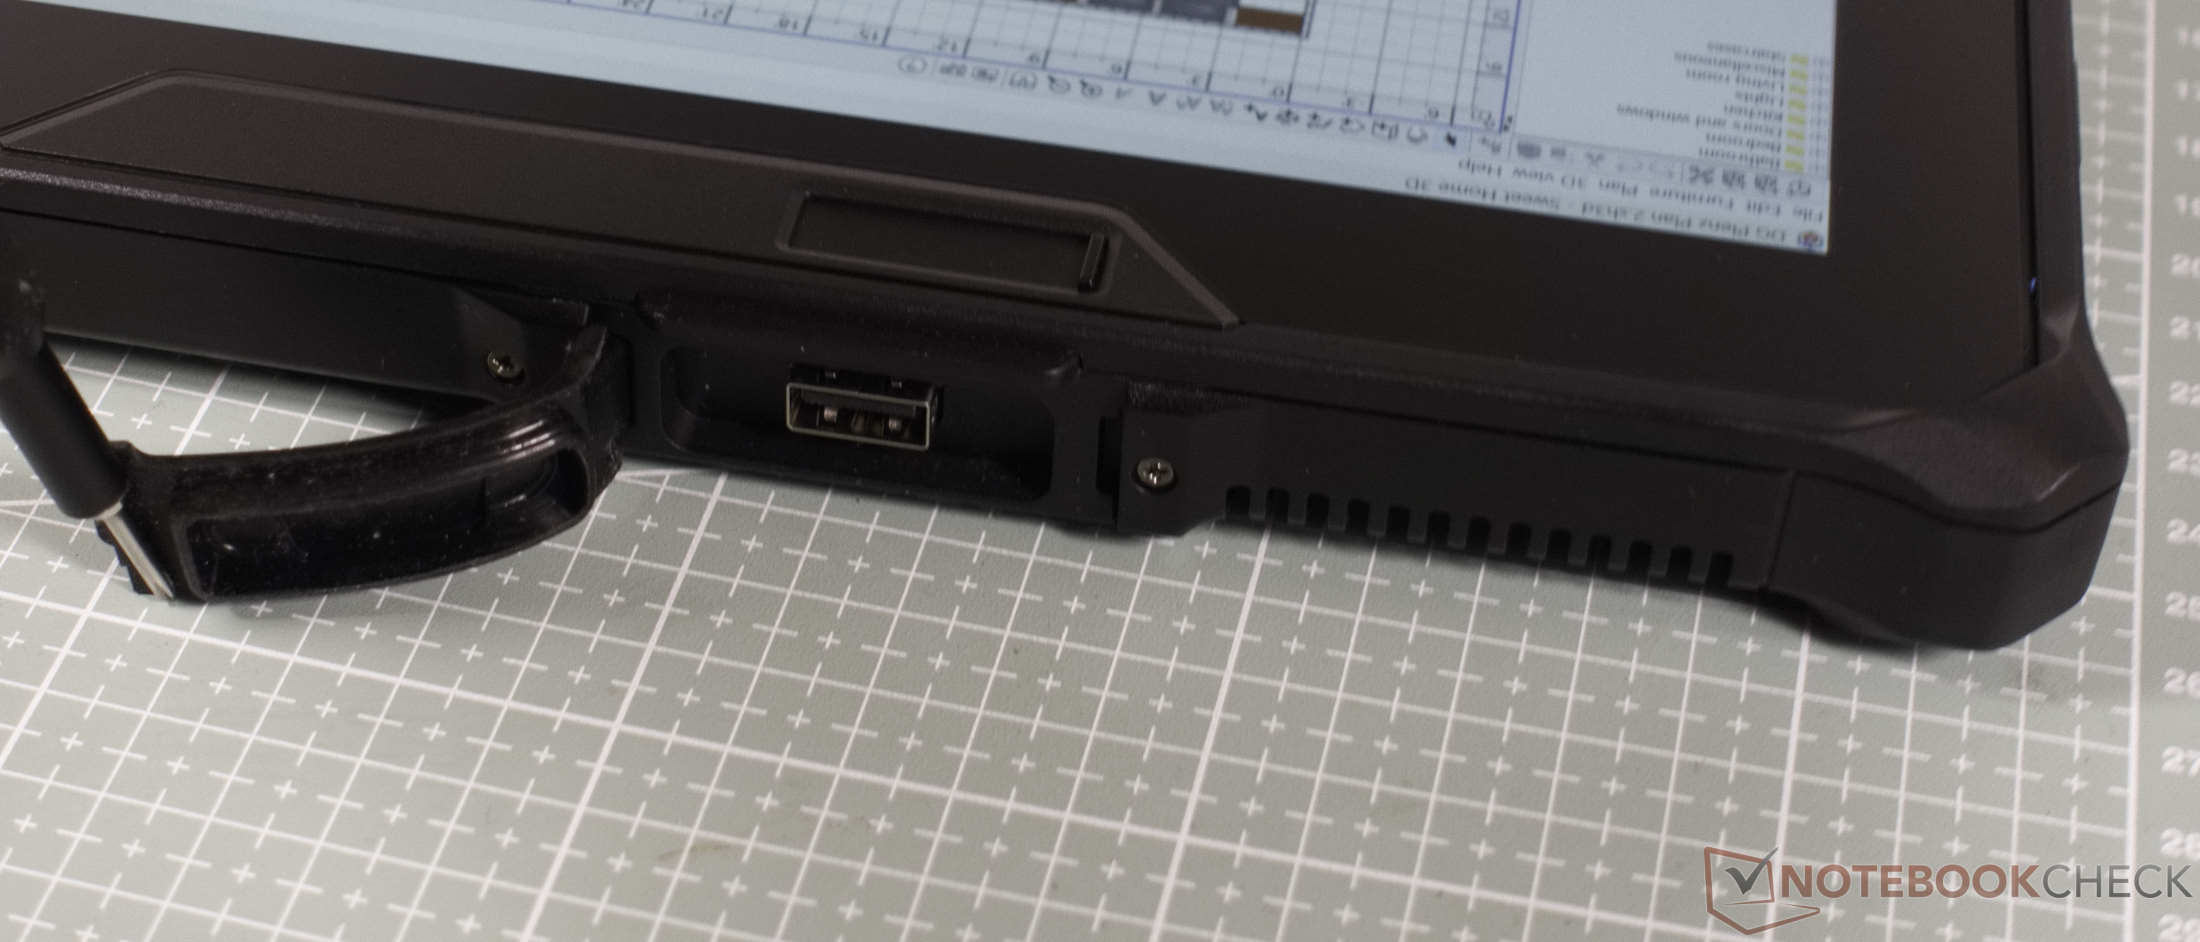
All ports are hidden behind sturdy protective caps. The tablet features a modern USB-C port with Thunderbolt, DisplayPort, and Power Delivery. It also includes an RJ-45 Gigabit Ethernet port, a headset jack, and a standard power jack.
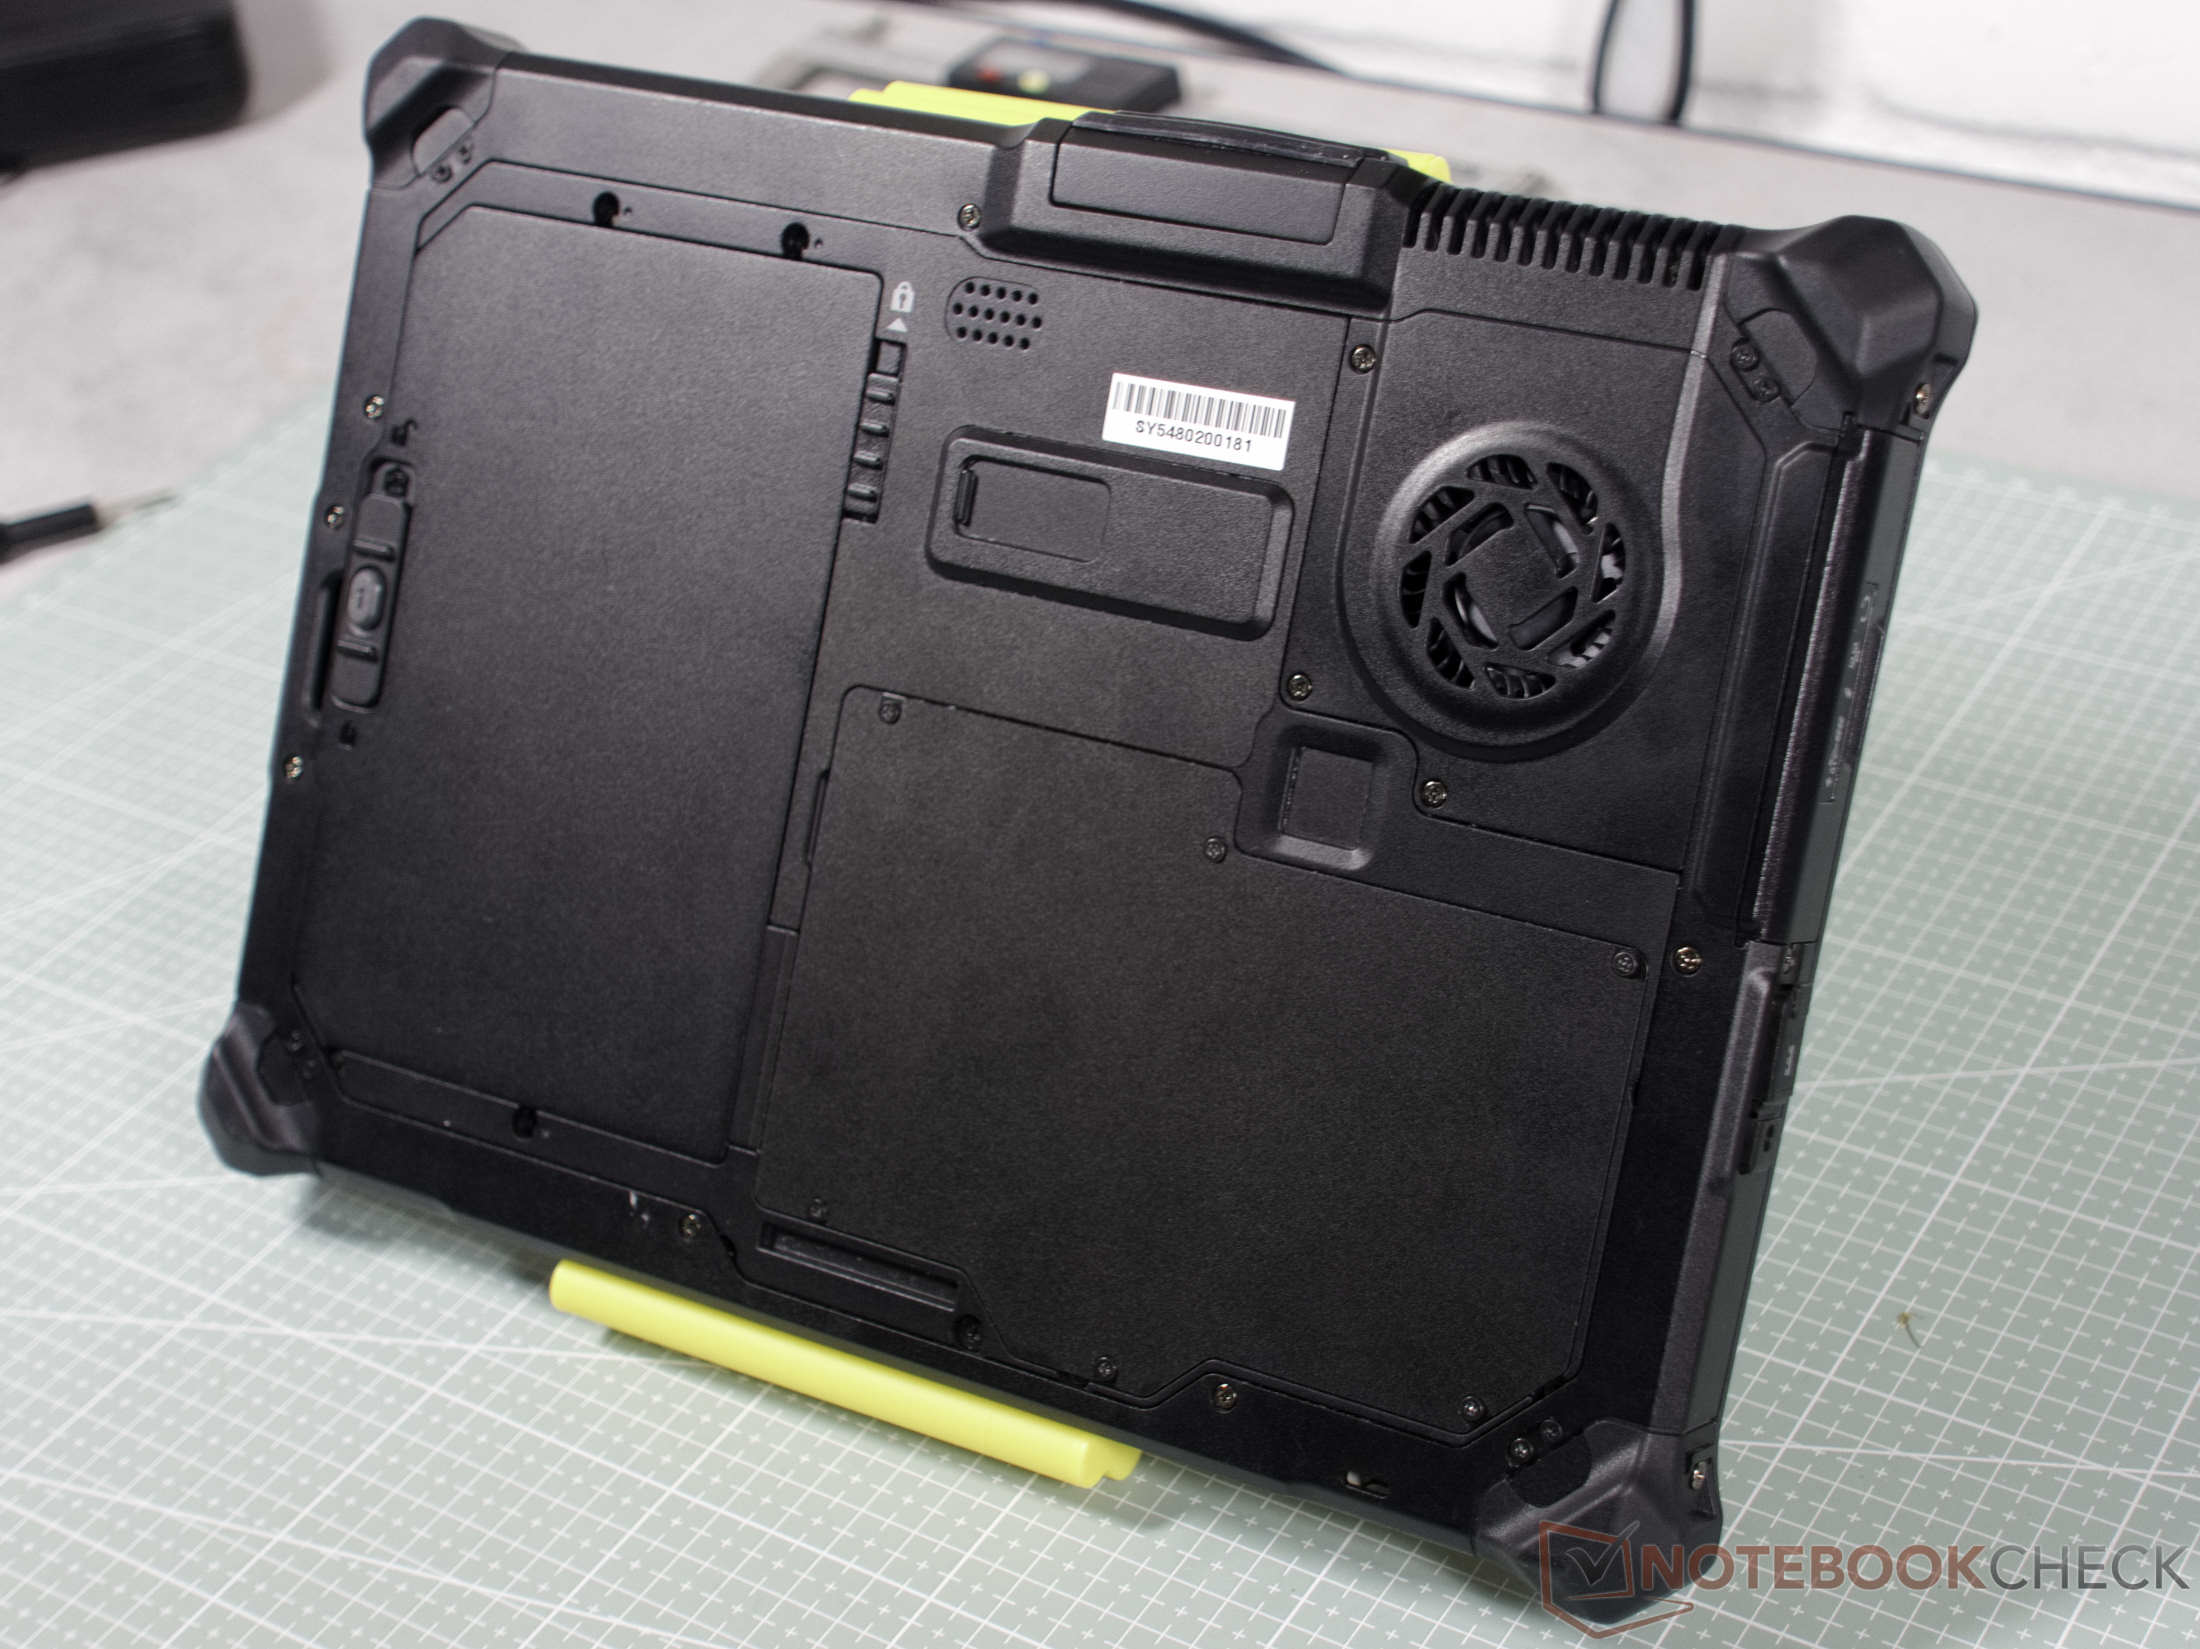
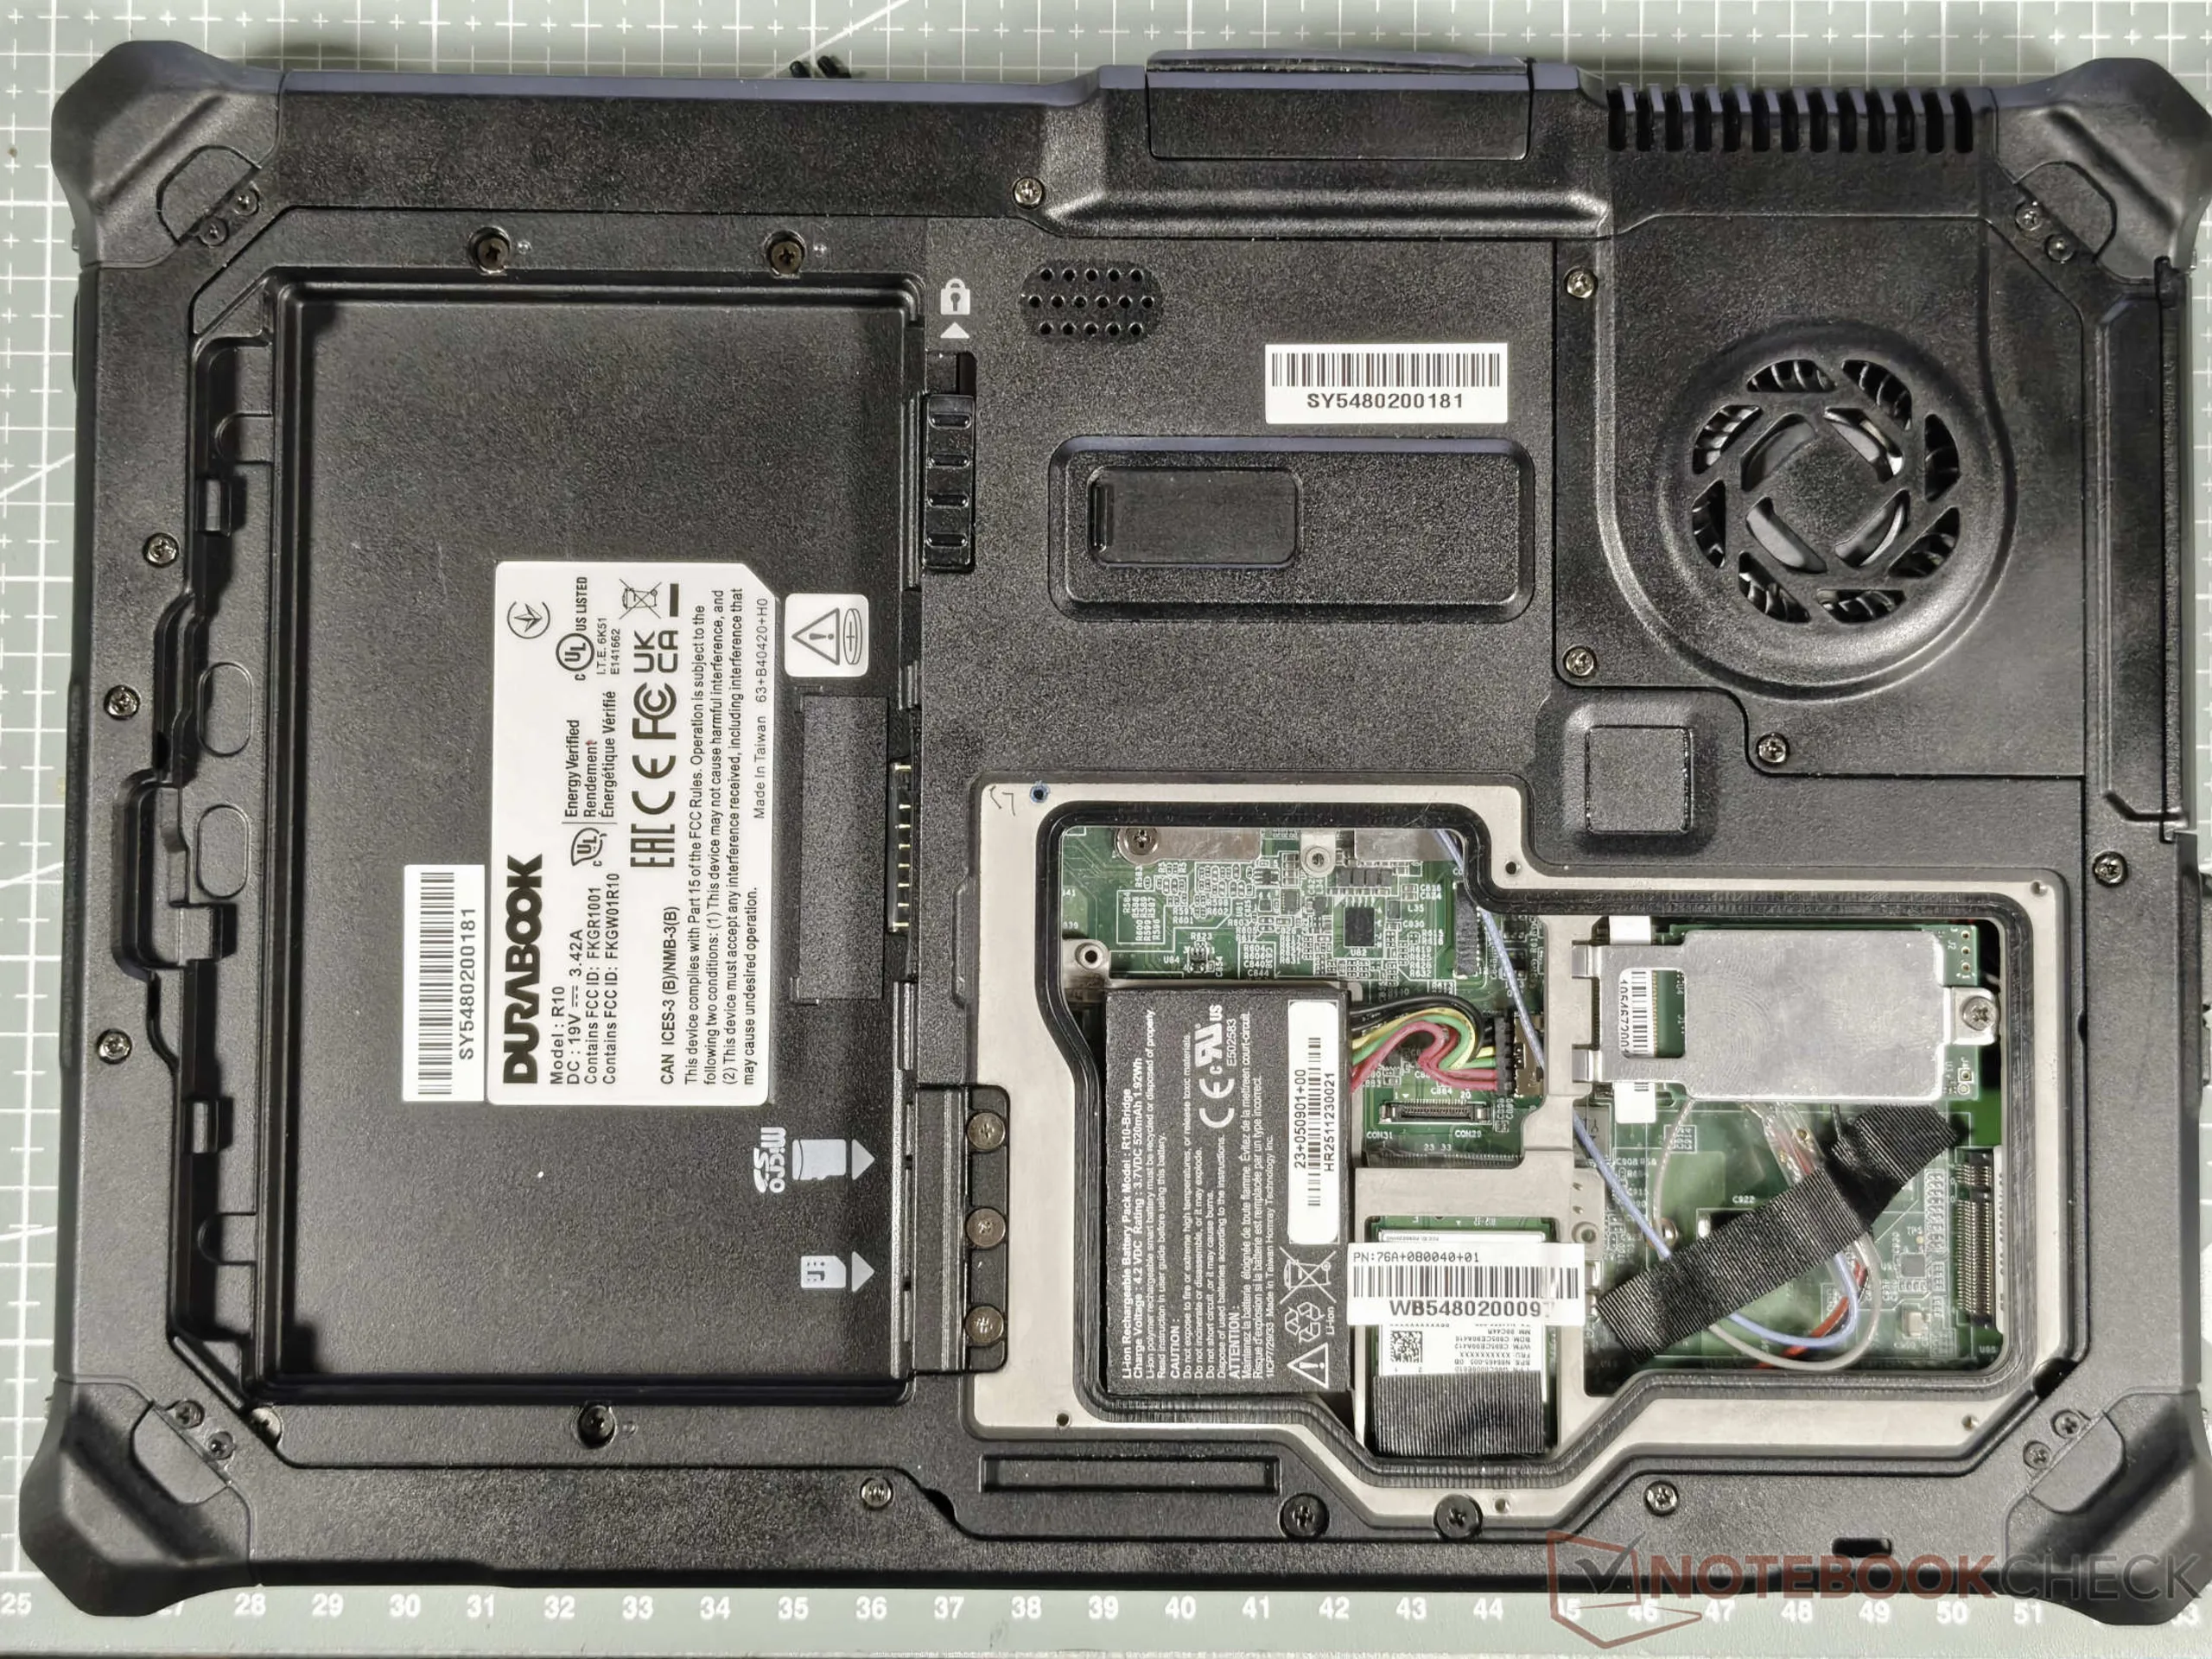
The back of the tablet also features a biometric fingerprint scanner for secure system login. Unfortunately, the built-in SD card reader is somewhat inaccessible, located inside behind the battery. However, it is reasonably fast. Inside the tablet, there are also empty slots for expansion cards. In terms of wireless connectivity, the rugged tablet offers Wi-Fi 7 and Bluetooth 5.4.
| SD Card Reader | |
| average JPG Copy Test (av. of 3 runs) | |
| Durabook R10 | |
| Dell Latitude 7030 Rugged Extreme (AV Pro V60) | |
| Durabook R8 Tablet (AV Pro V60) | |
| Average of class Tablet (10.2 - 79.2, n=44, last 2 years) | |
| Dynabook Portege Z40L-N (AV PRO microSD 128 GB V60) | |
| maximum AS SSD Seq Read Test (1GB) | |
| Dell Latitude 7030 Rugged Extreme (AV Pro V60) | |
| Durabook R10 | |
| Dynabook Portege Z40L-N (AV PRO microSD 128 GB V60) | |
| Average of class Tablet (n=1last 2 years) | |
| Durabook R8 Tablet (AV Pro V60) | |
Camera
The Full HD front-facing camera is more than adequate for video conferences. The 11-megapixel main camera on the back takes impressively good macro shots, but struggles with wide-angle shots due to slow autofocus and a narrow dynamic range. Thanks to the built-in flash, the camera remains usable in dark rooms.


Input Devices
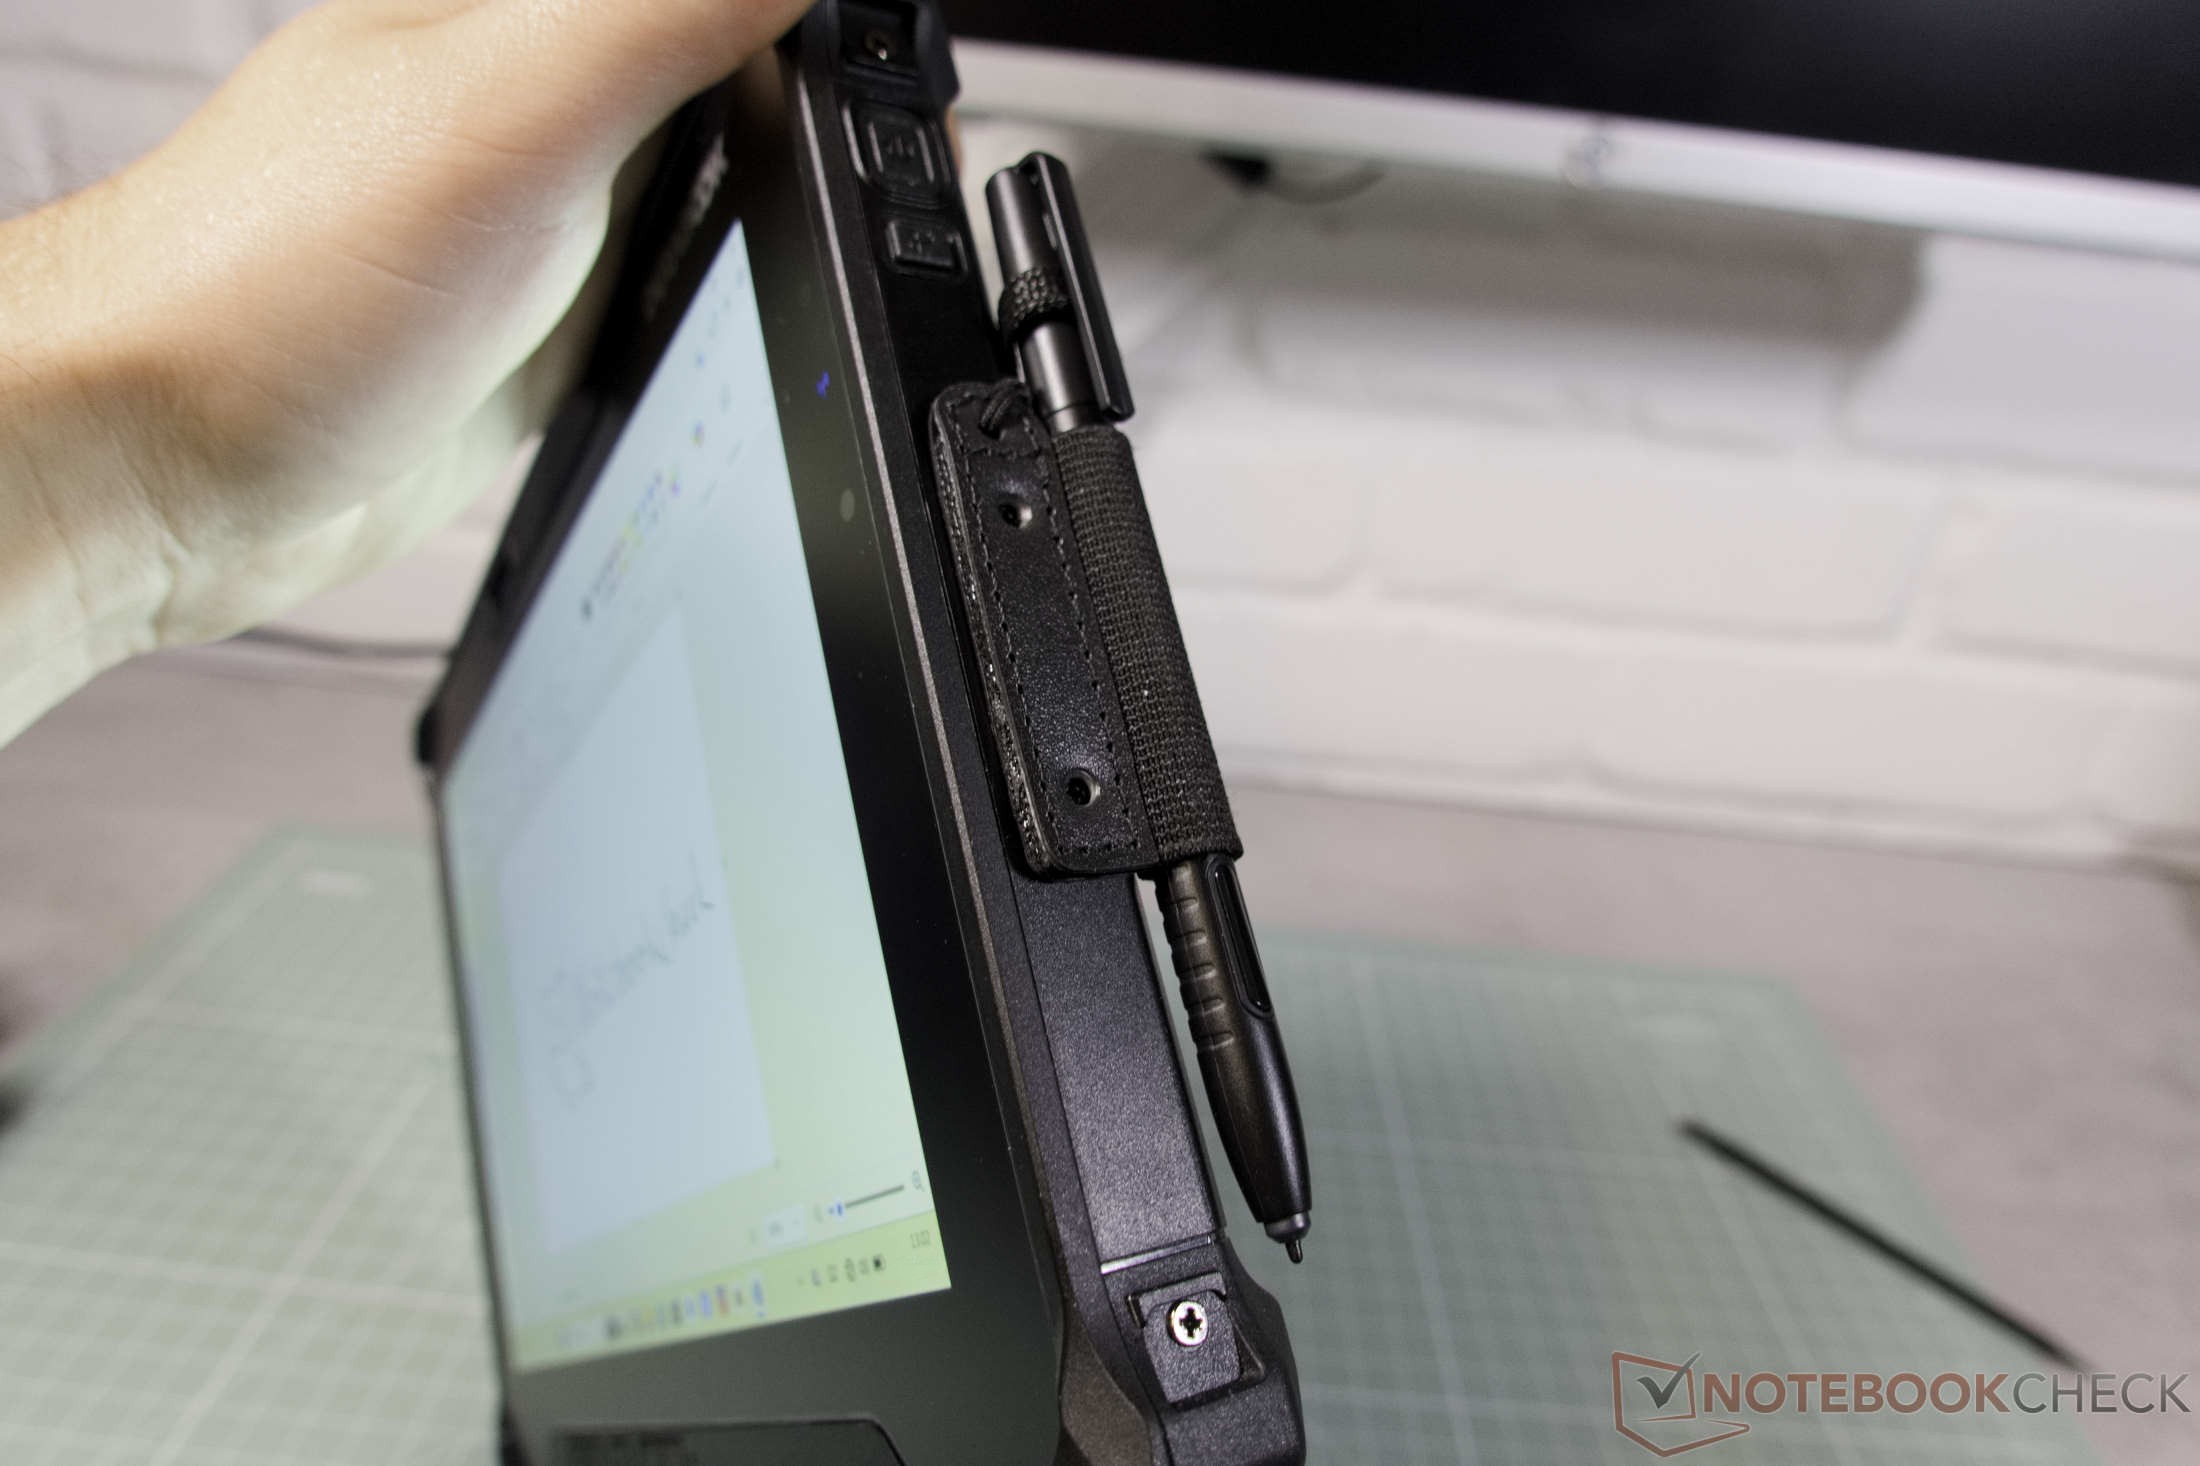
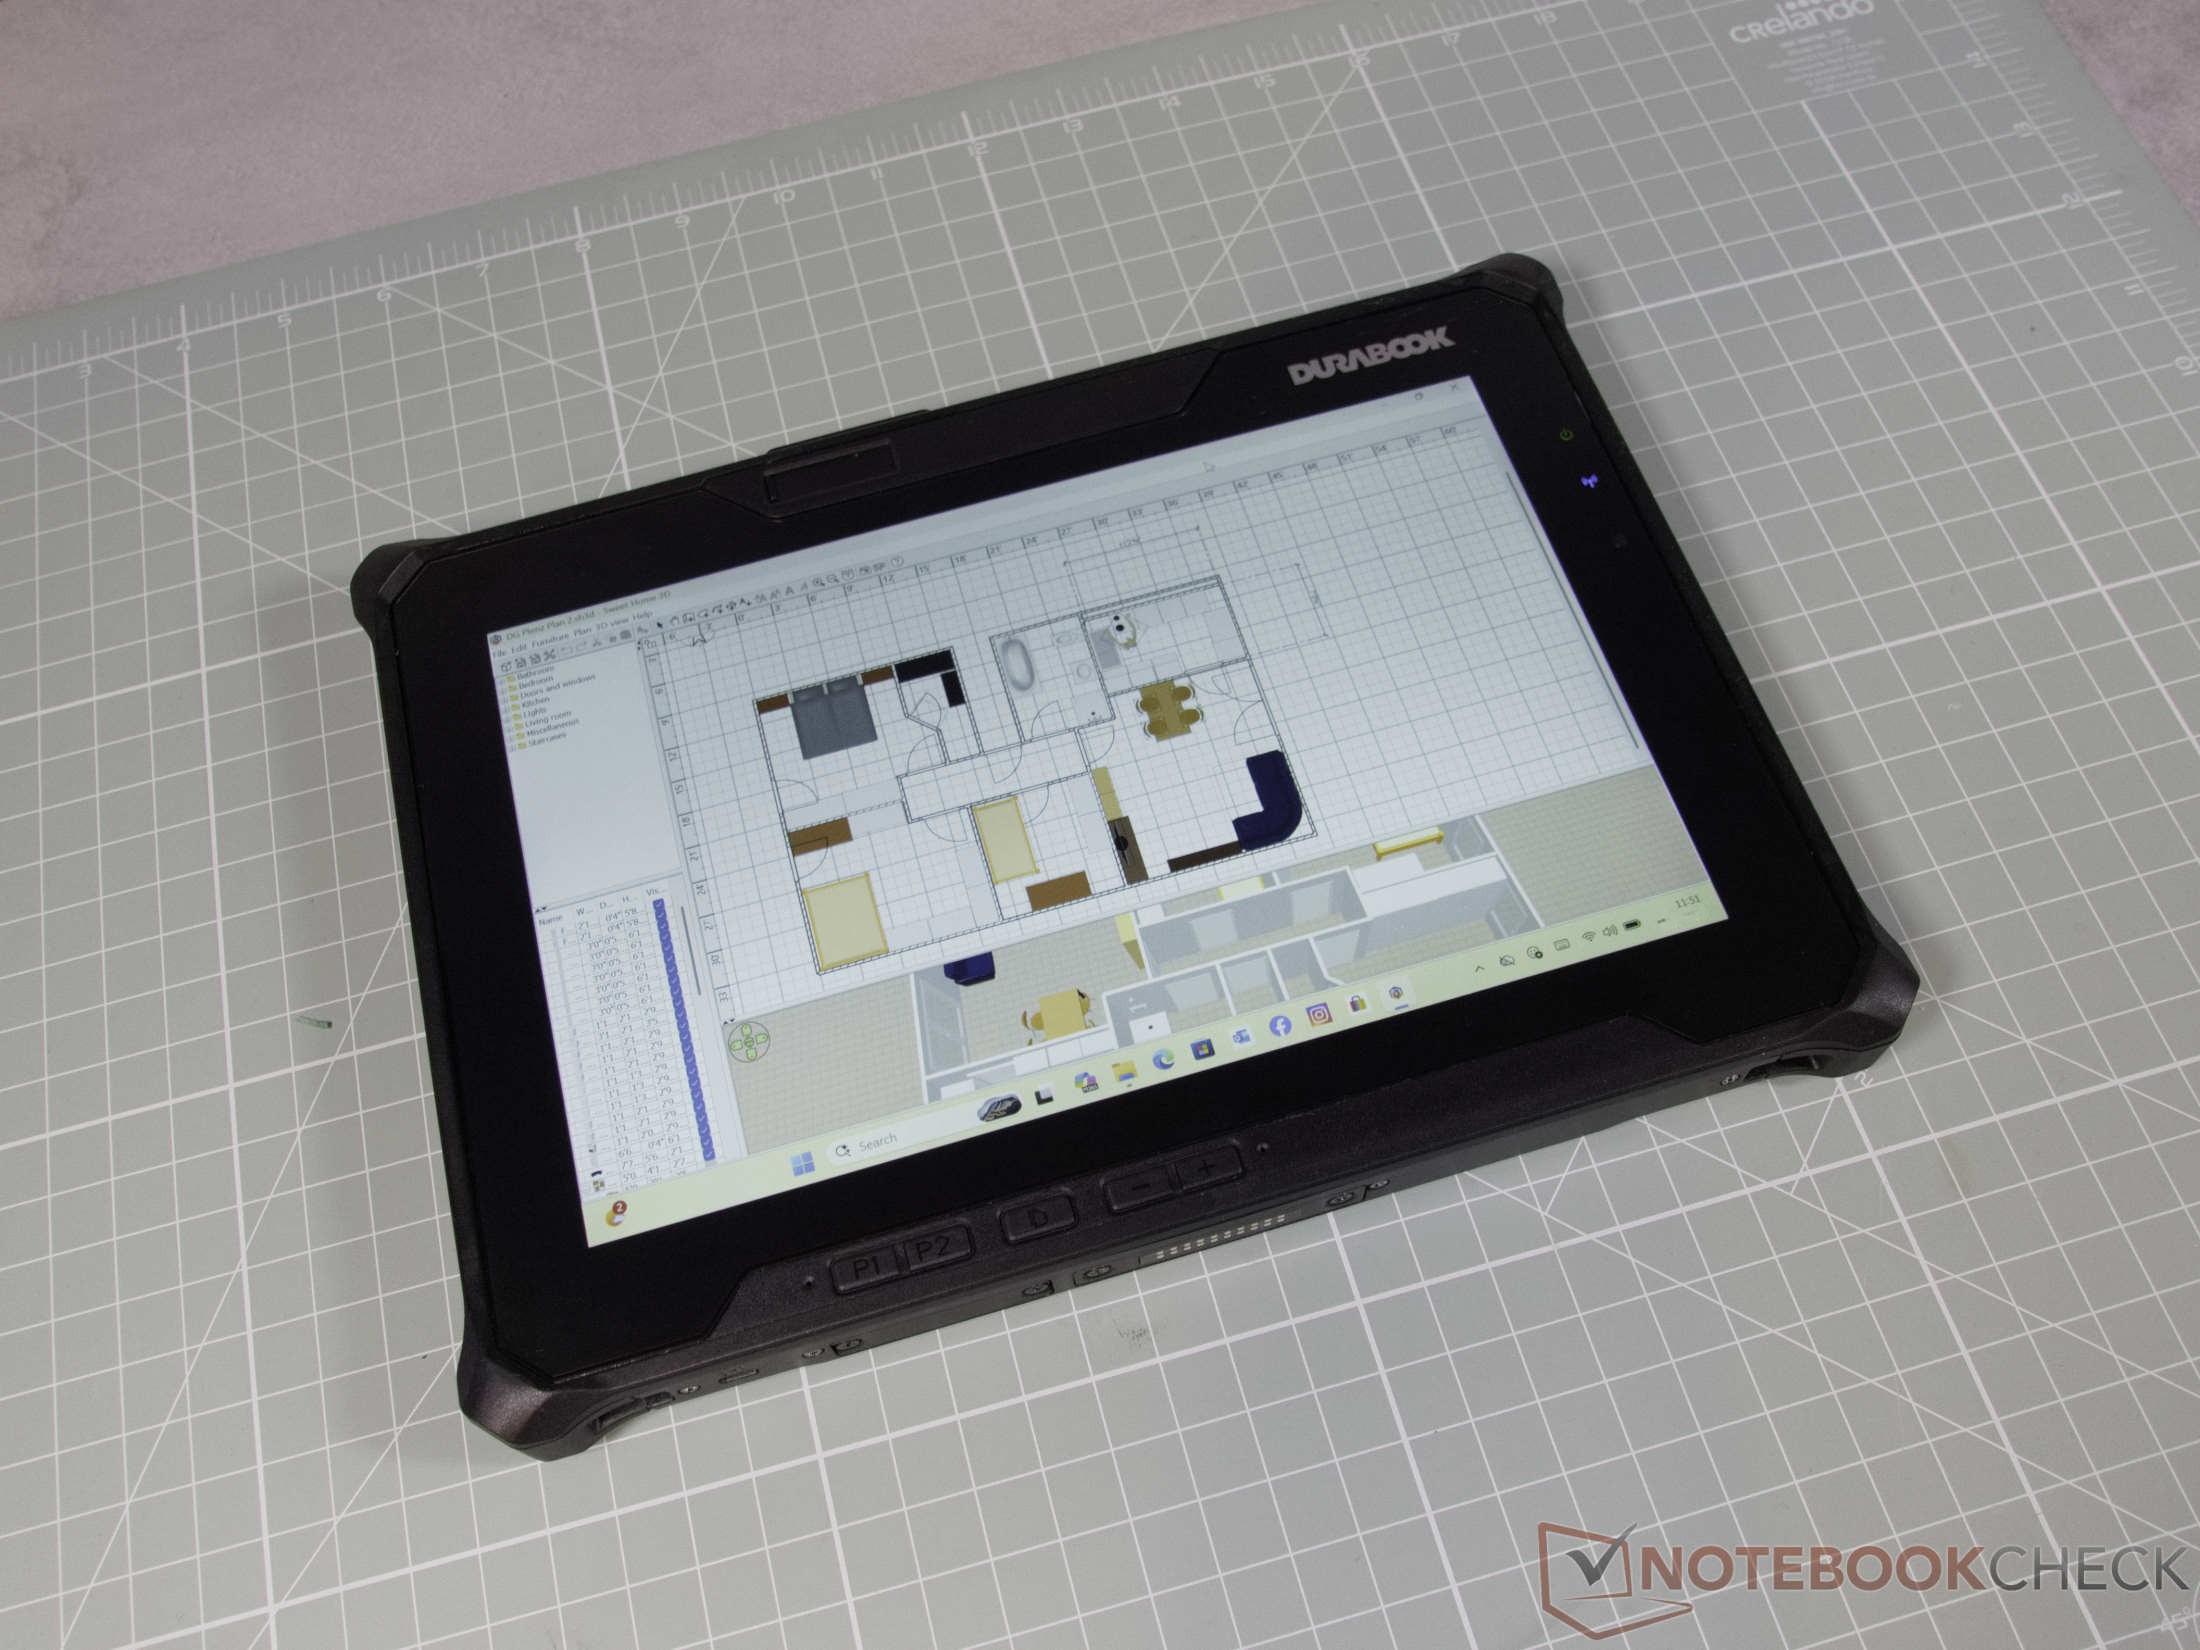
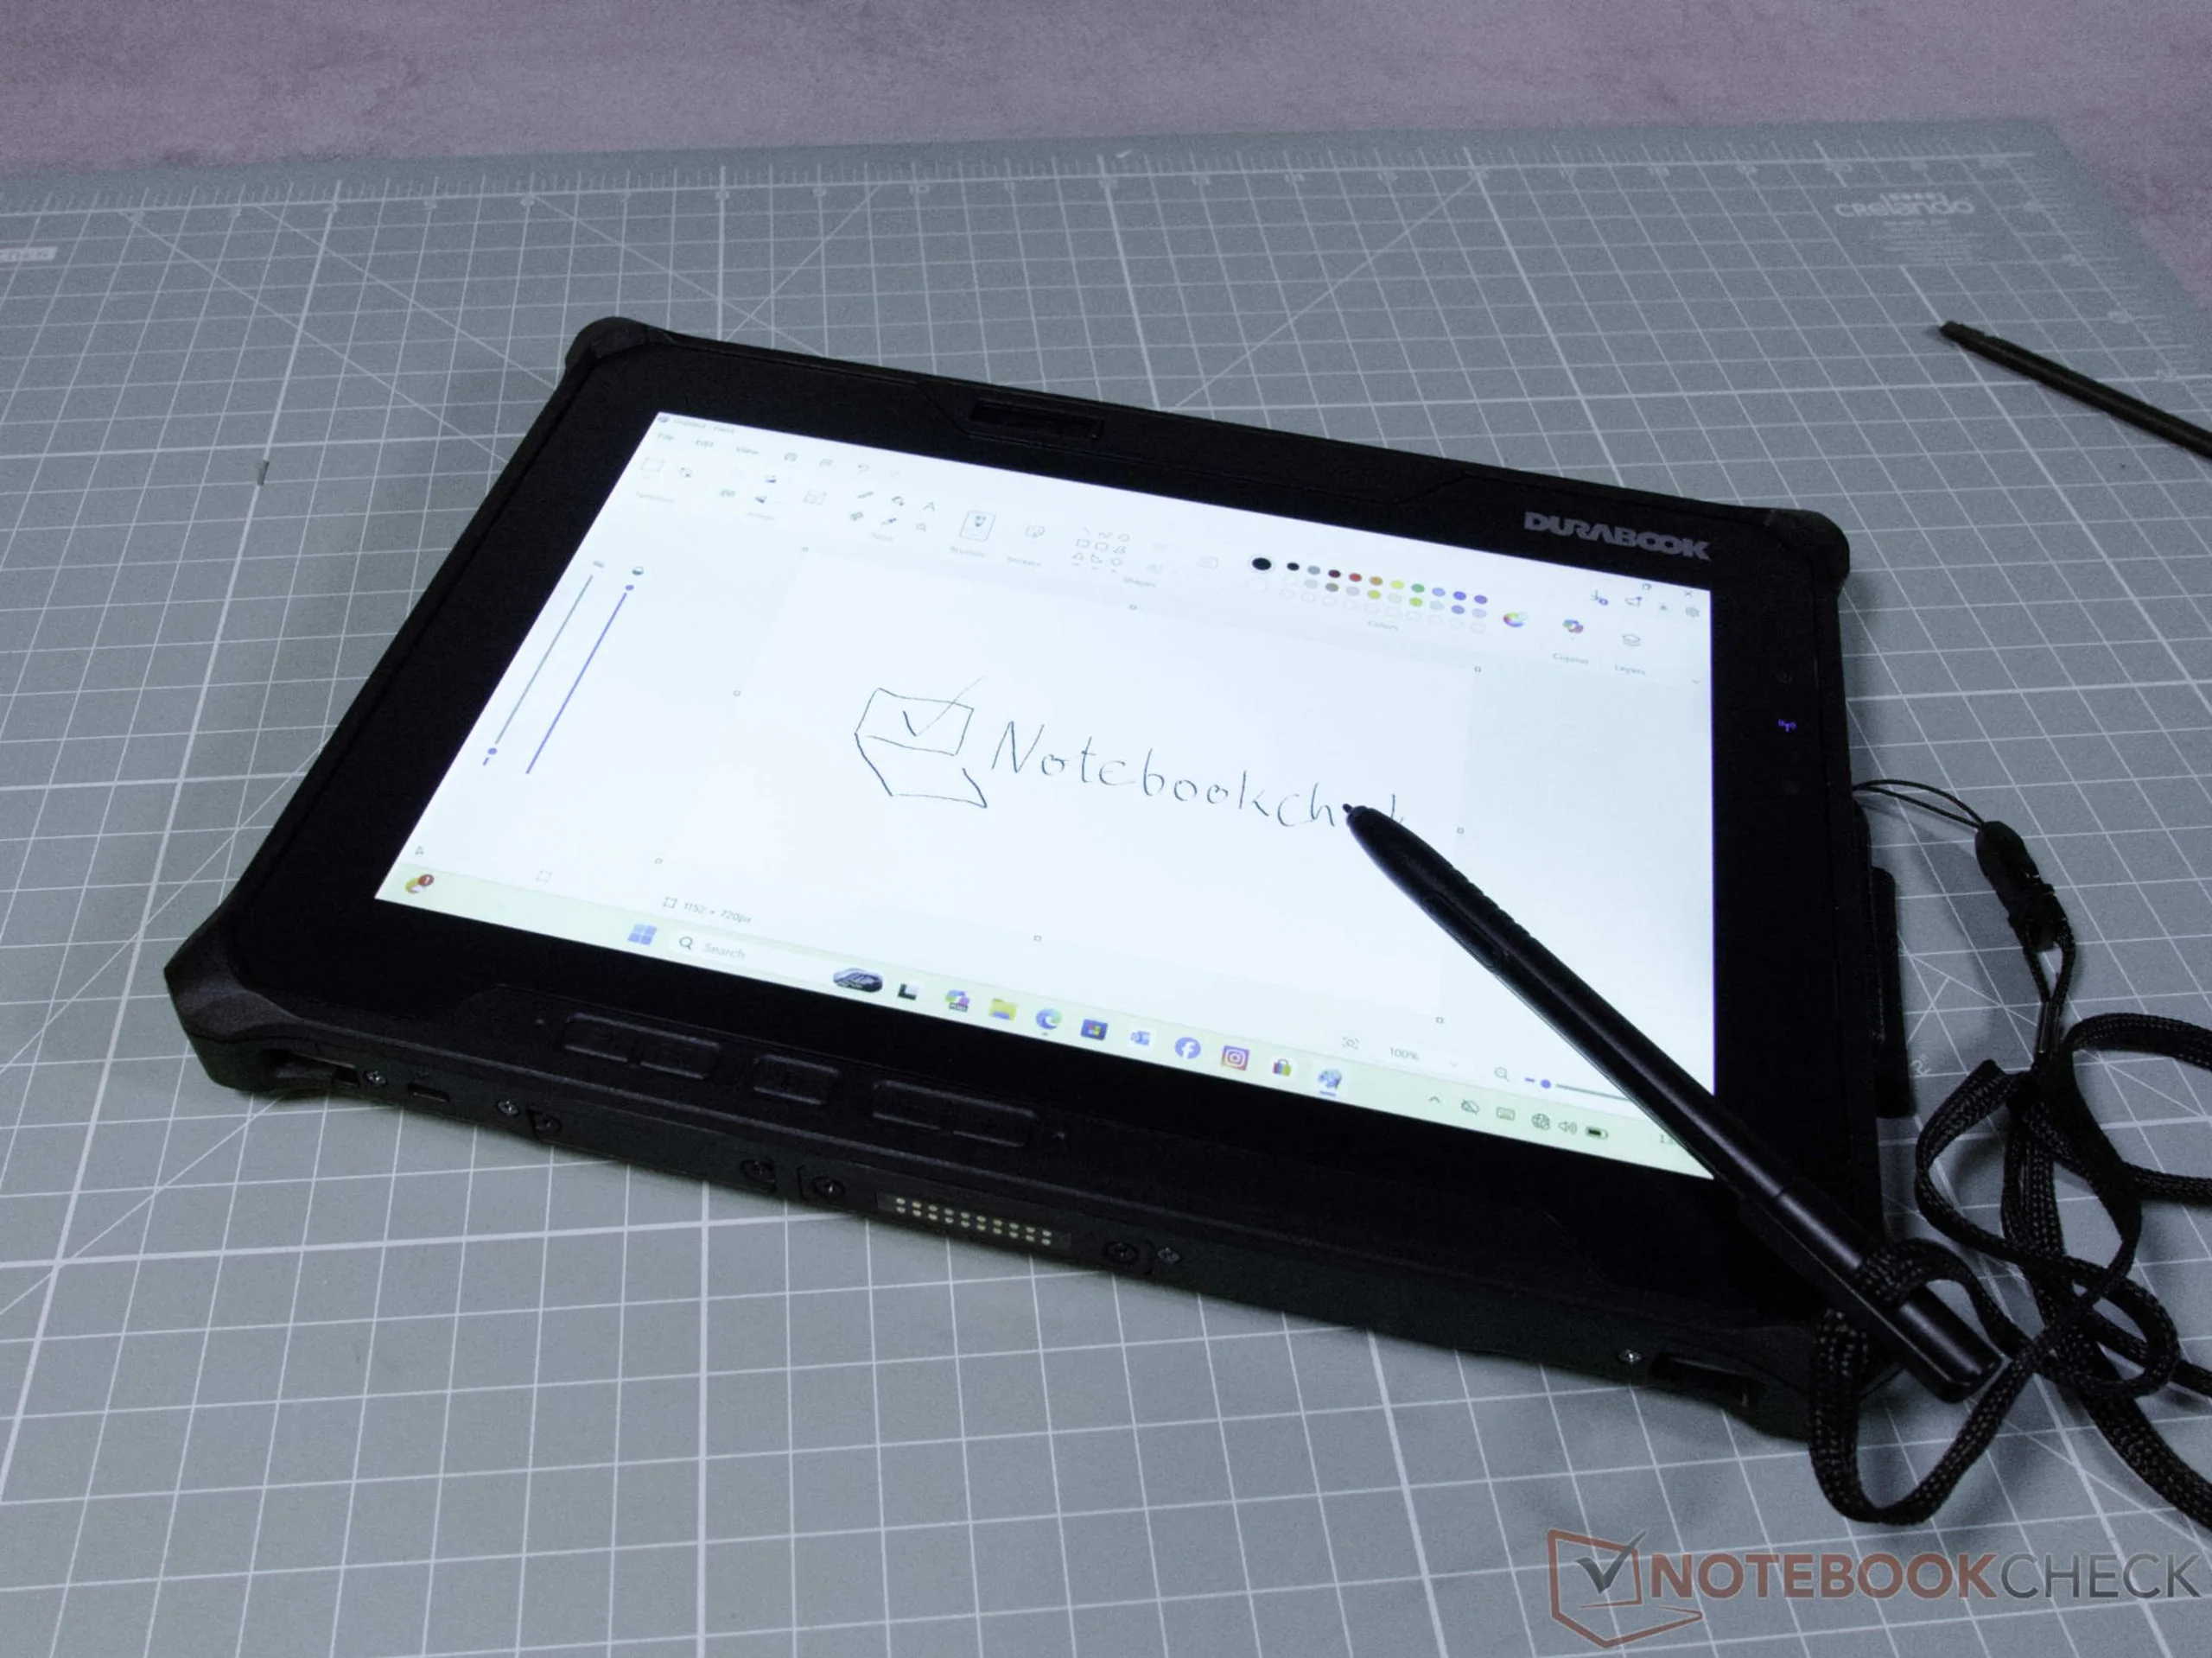
In addition to the touchscreen, the Durabook R10 features six buttons whose functions can be customized. The touchscreen remains the central control element, however, and can be flexibly optimized for harsh working environments. For example, the touch mode can be switched so that the screen reliably recognizes input either while wearing thick protective gloves or in wet conditions. For detailed blueprints or sketches, the screen supports the Microsoft Pen Protocol 1.51.
The Durabook stylus is surprisingly light yet precise. An optional pen holder can be screwed onto the tablet; it also includes a safety strap for the pen.
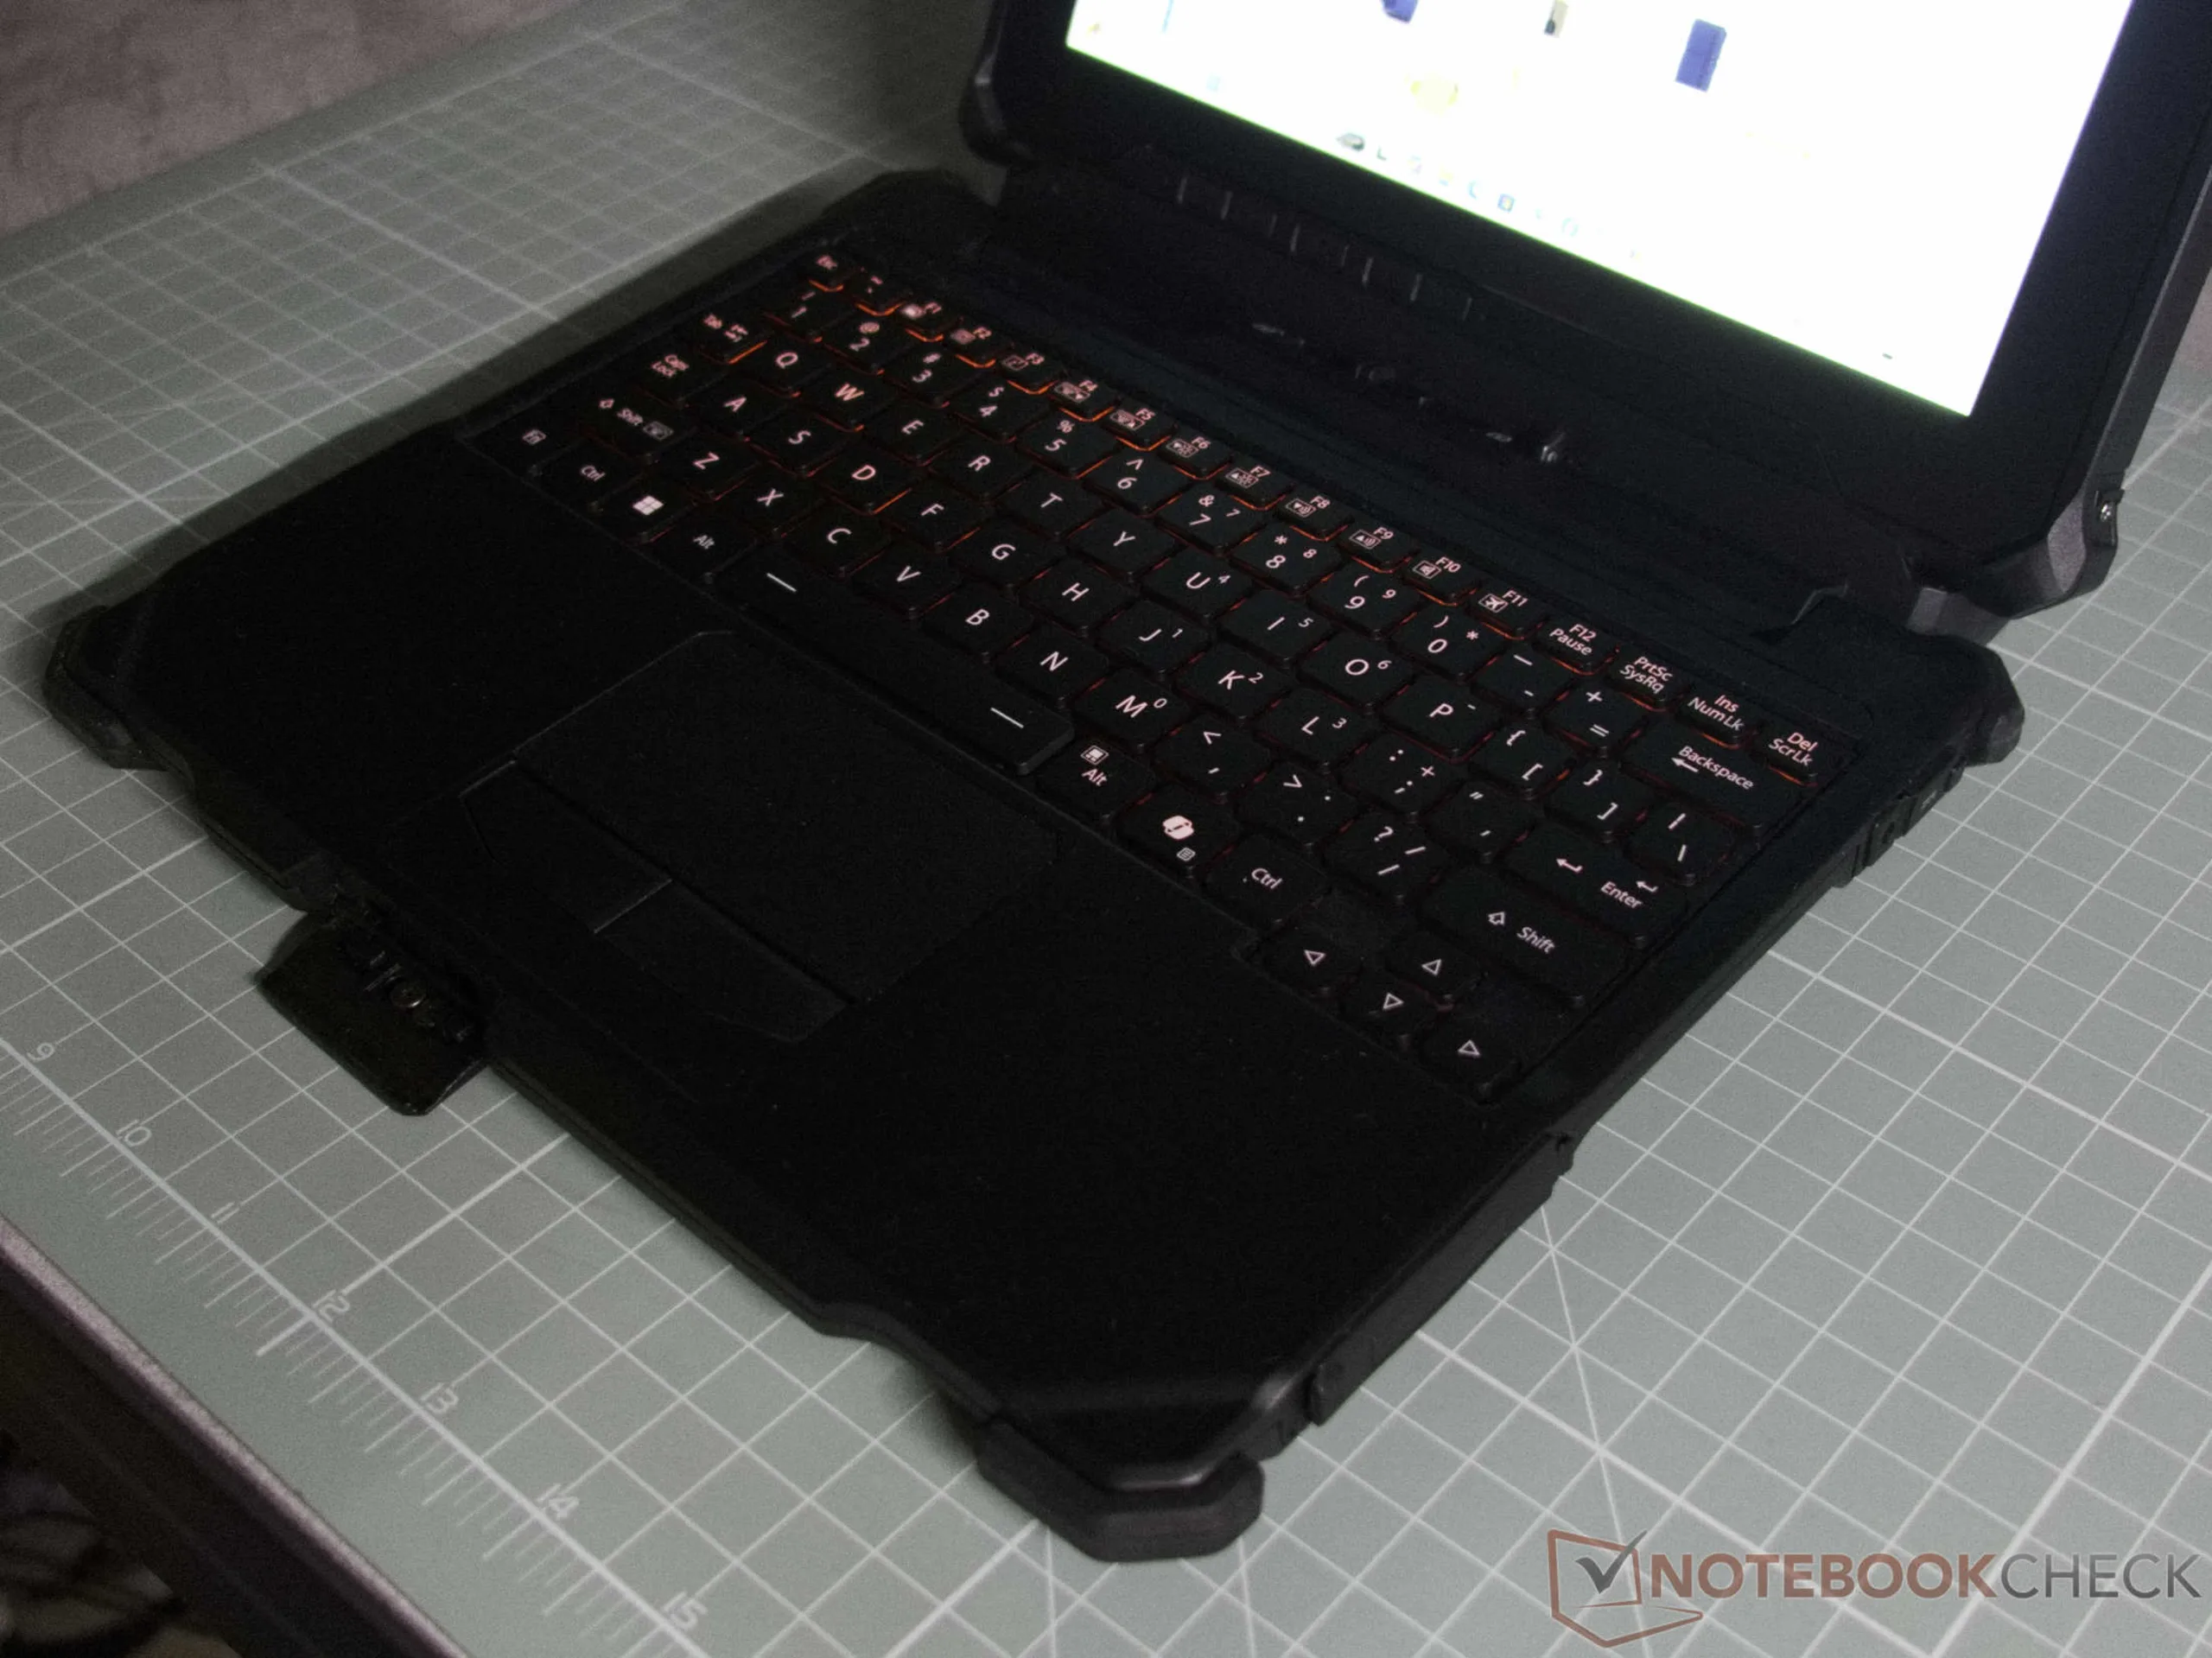
Optionally, the tablet can be upgraded to a detachable model. The accompanying keyboard module offers eye-friendly red backlighting as well as several additional ports. Two USB-A 3.2 ports come standard, and HDMI or LAN ports can be configured as needed. The keyboard unit also features an additional charging port.
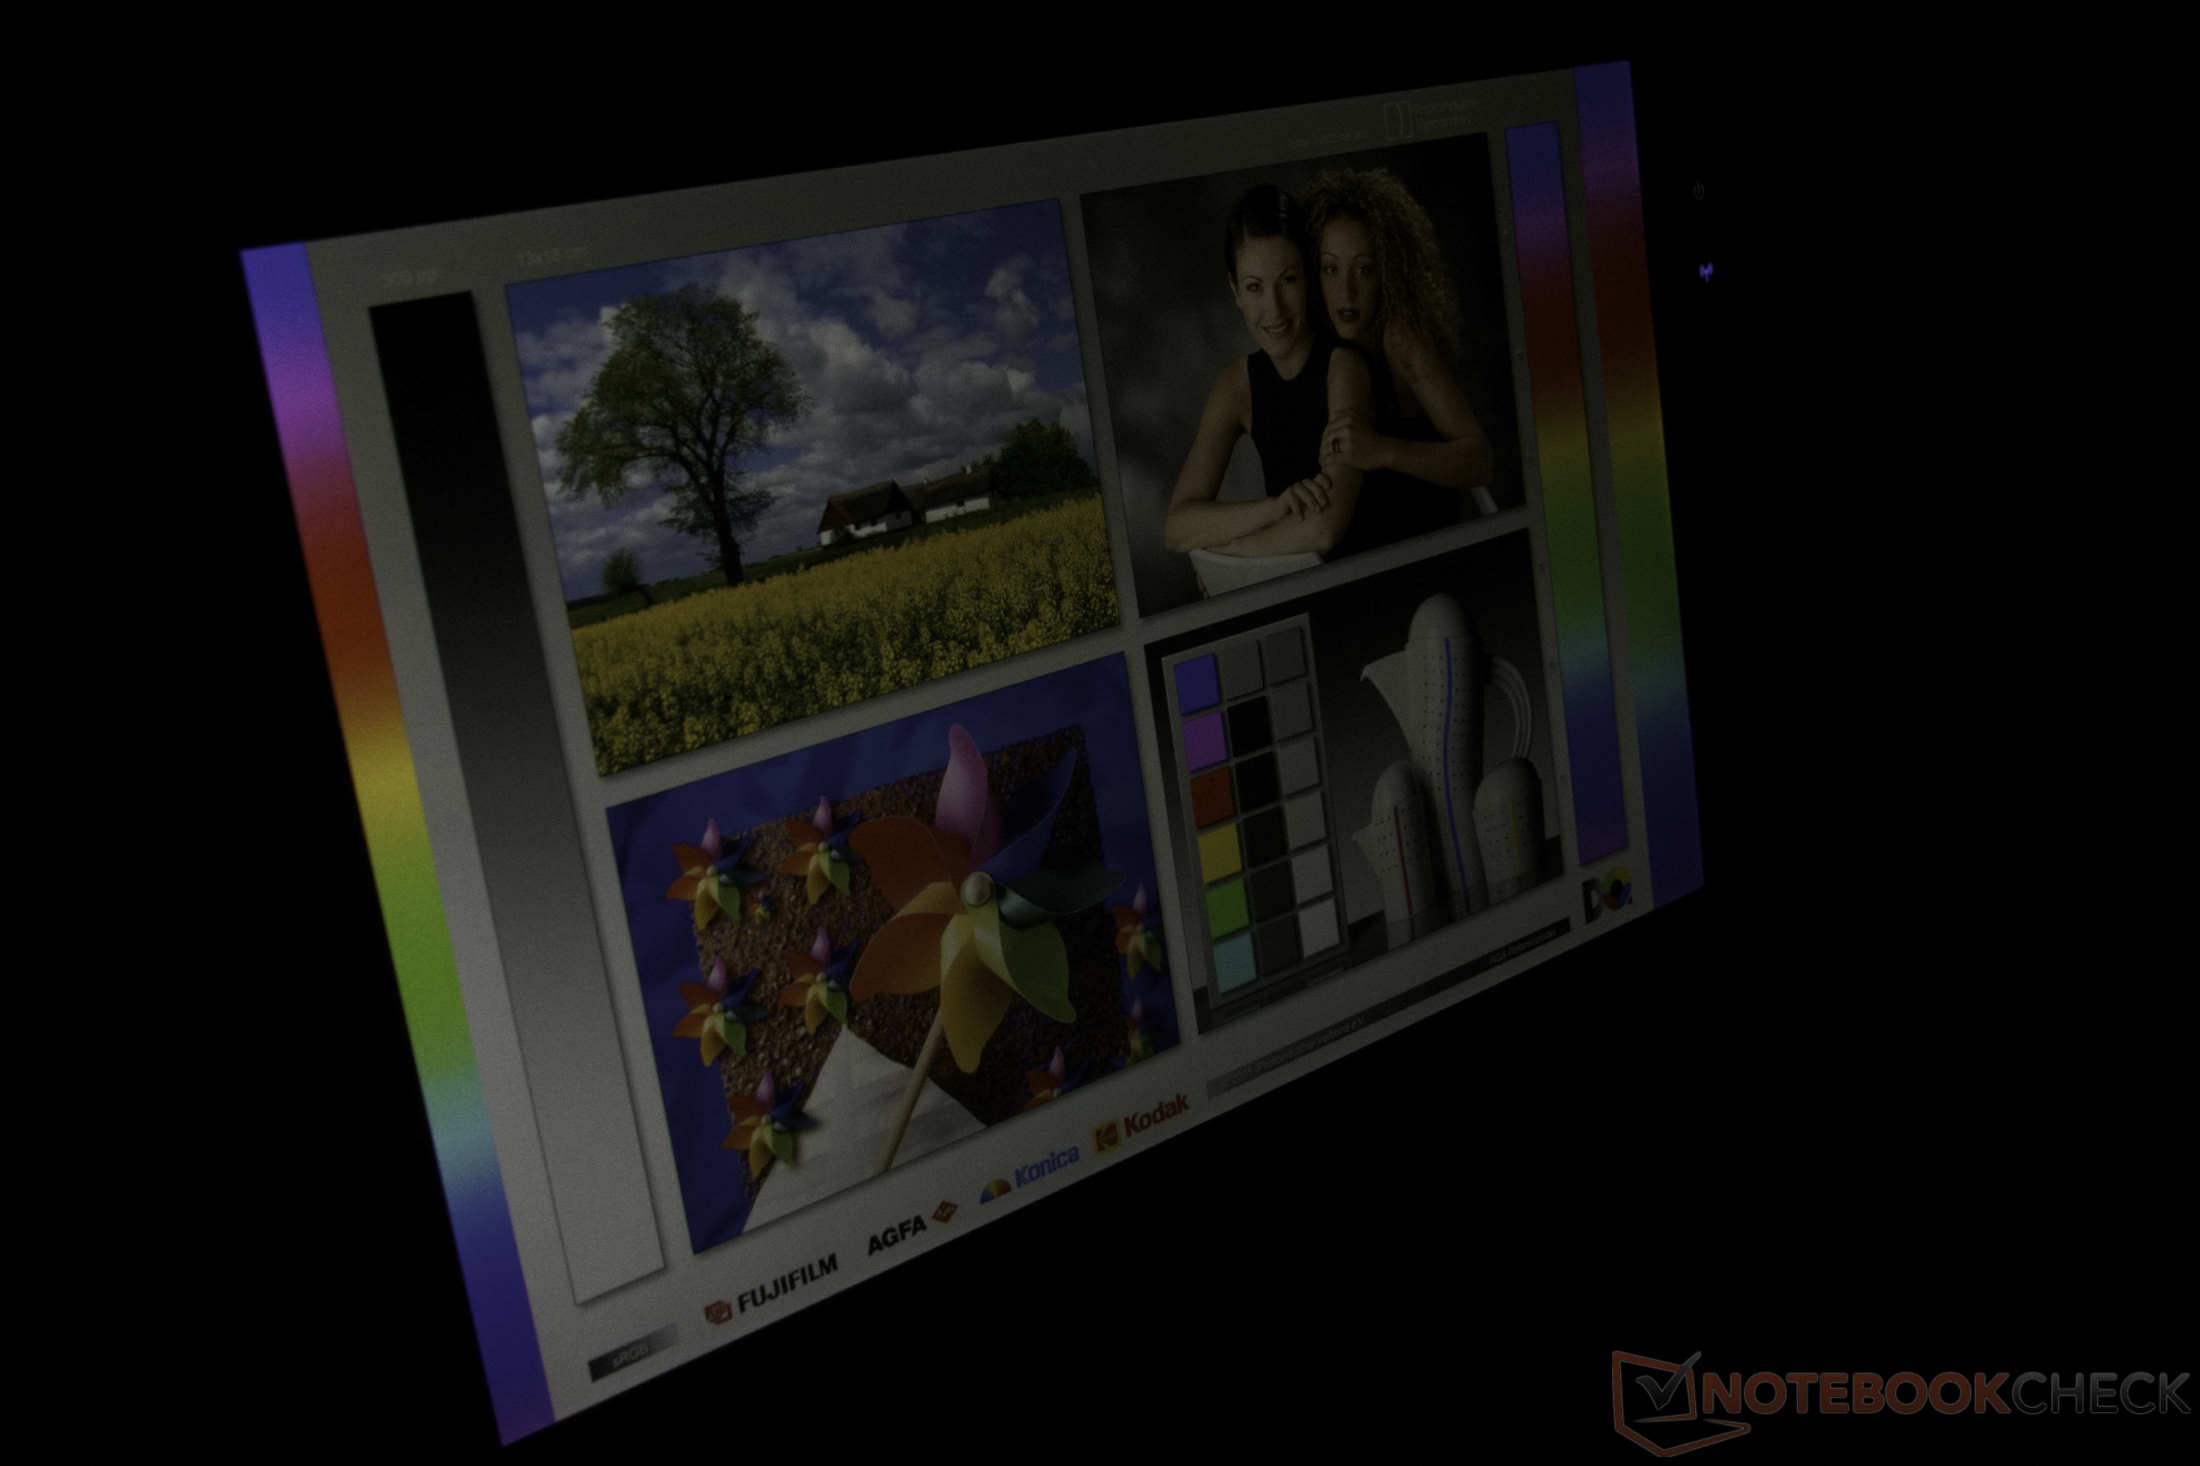
Display
The 10.1-inch WUXGA screen is uncompromisingly designed for outdoor use. With an enormous luminance of over 1,000 cd/m², the panel is so bright that all on-screen content remains perfectly legible even in direct sunlight. A pre-installed matte screen protector effectively reduces distracting reflections, though it does give bright areas a slight rainbow effect. Adaptive brightness is a practical convenience feature.

| |||||||||||||||||||||||||
Brightness Distribution: 92 %
Center on Battery: 1040 cd/m²
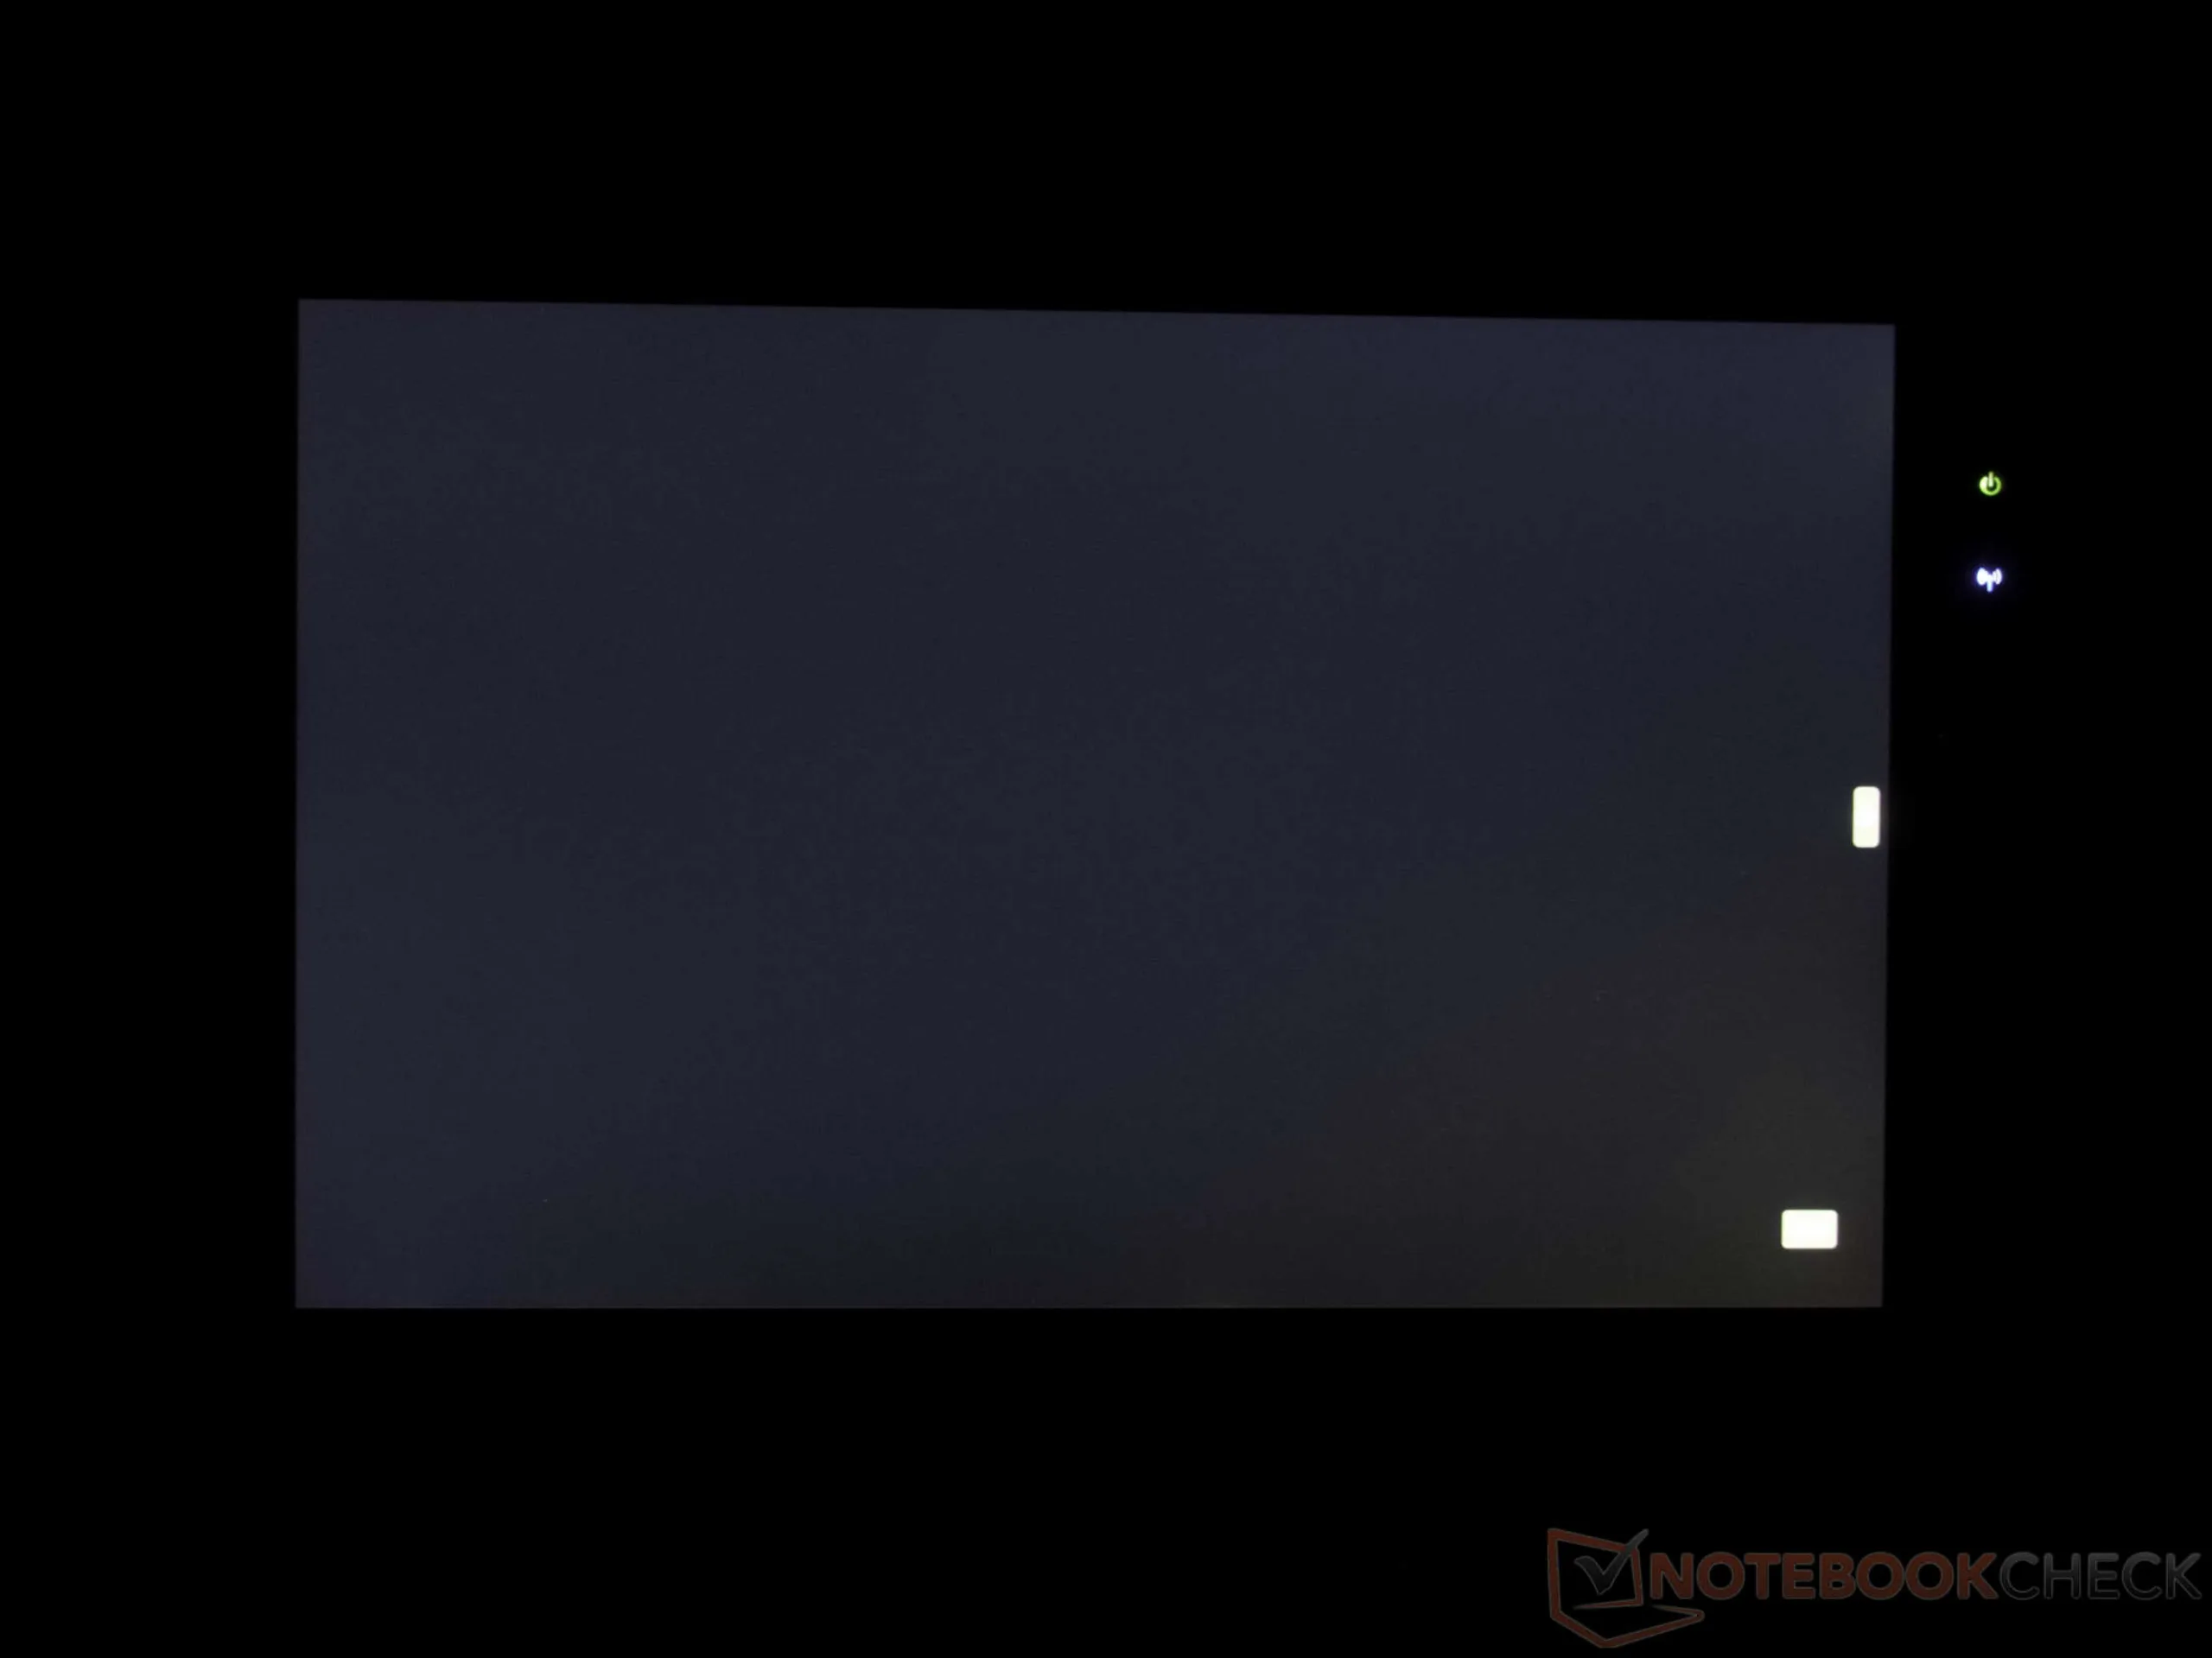
Contrast: 1024:1 (Black: 1.05 cd/m²)
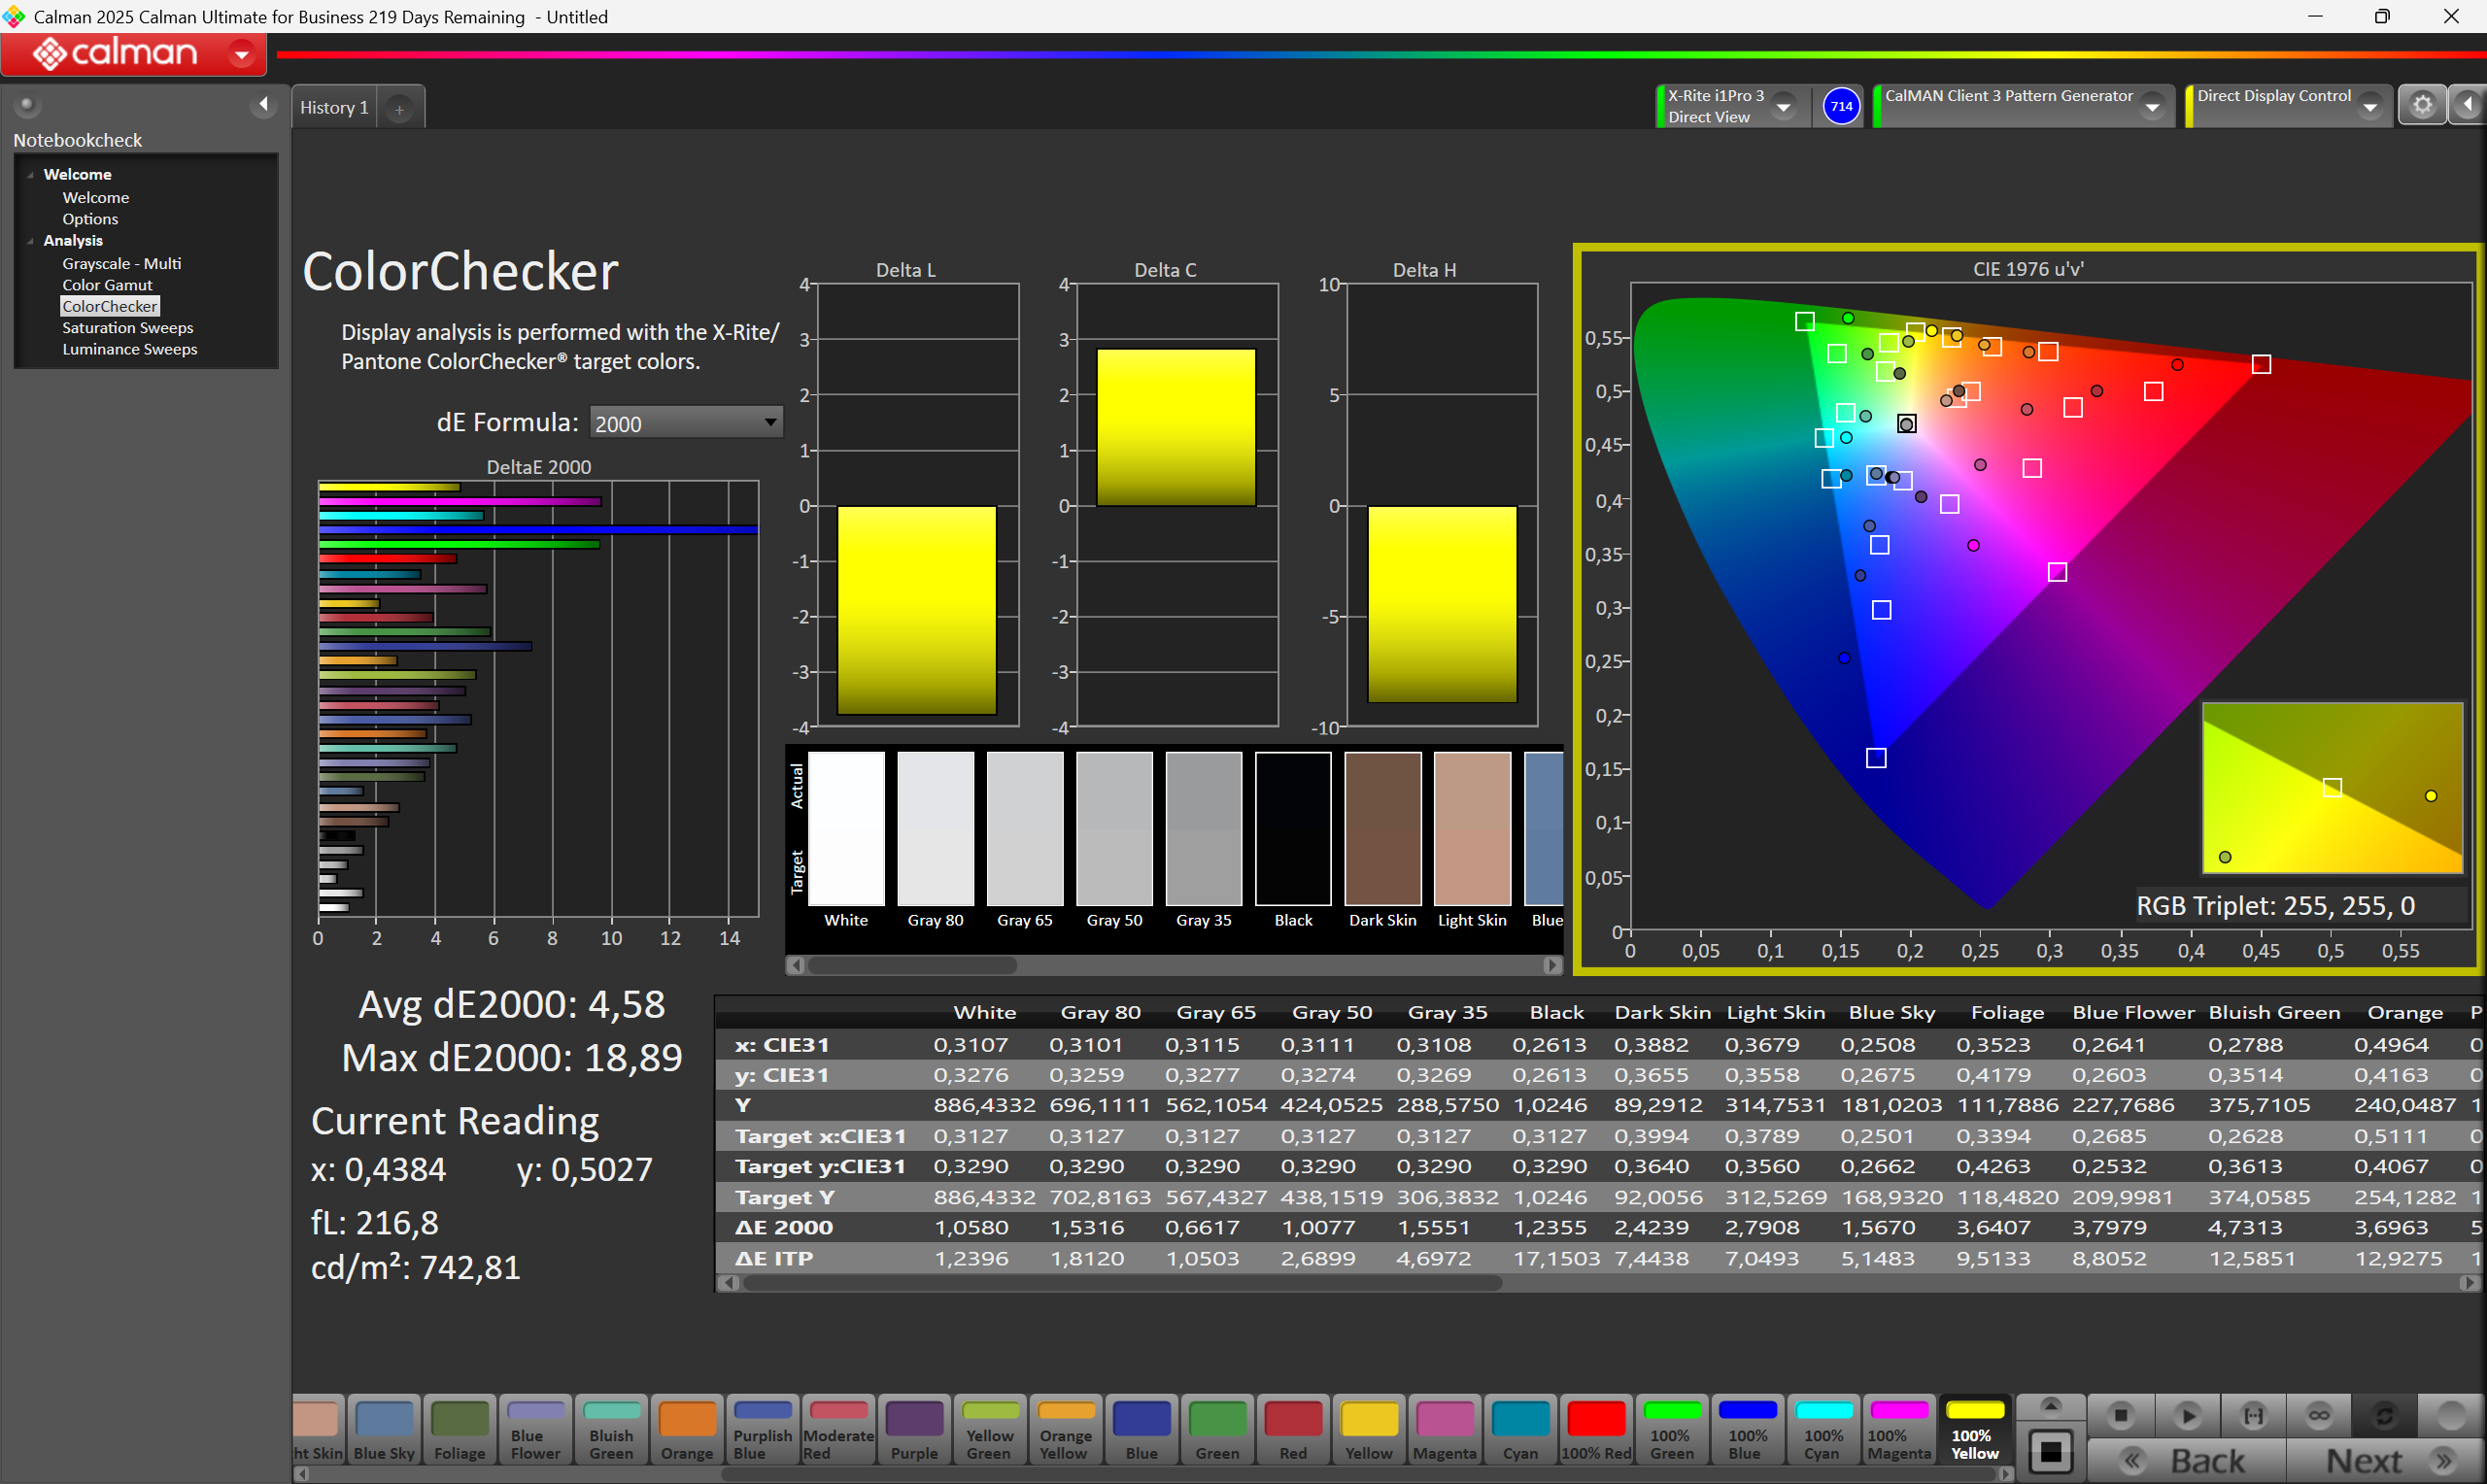
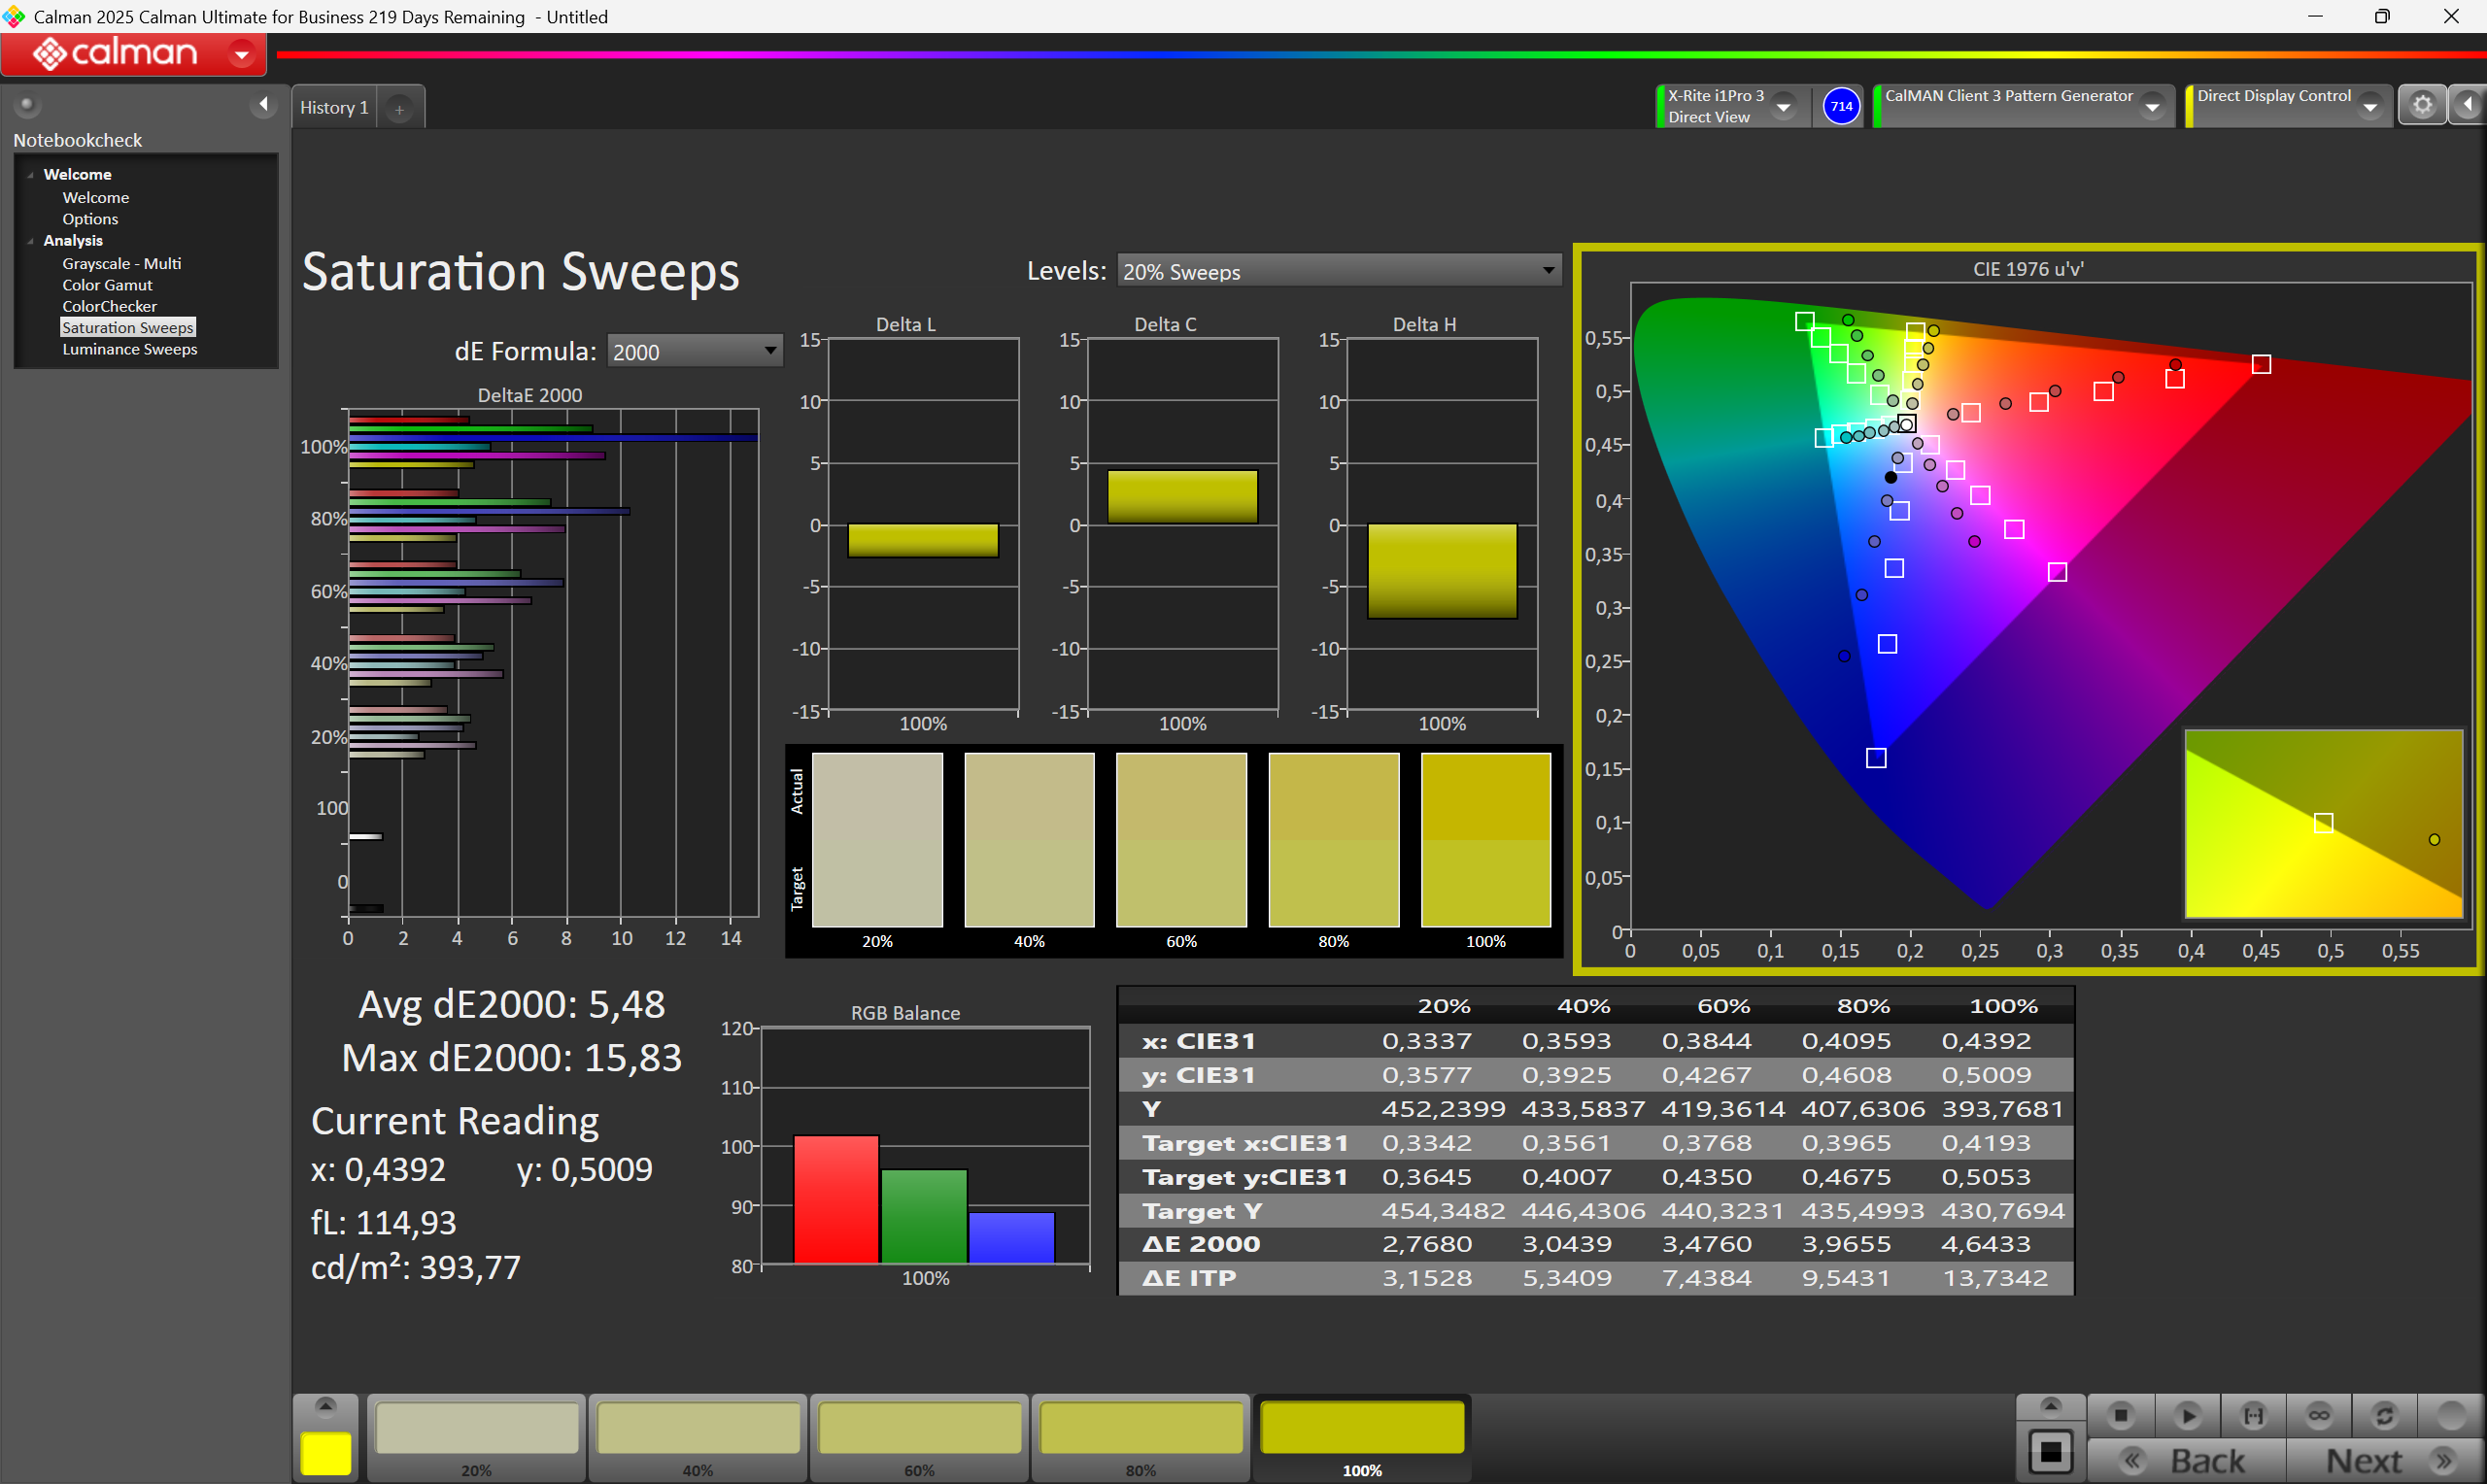
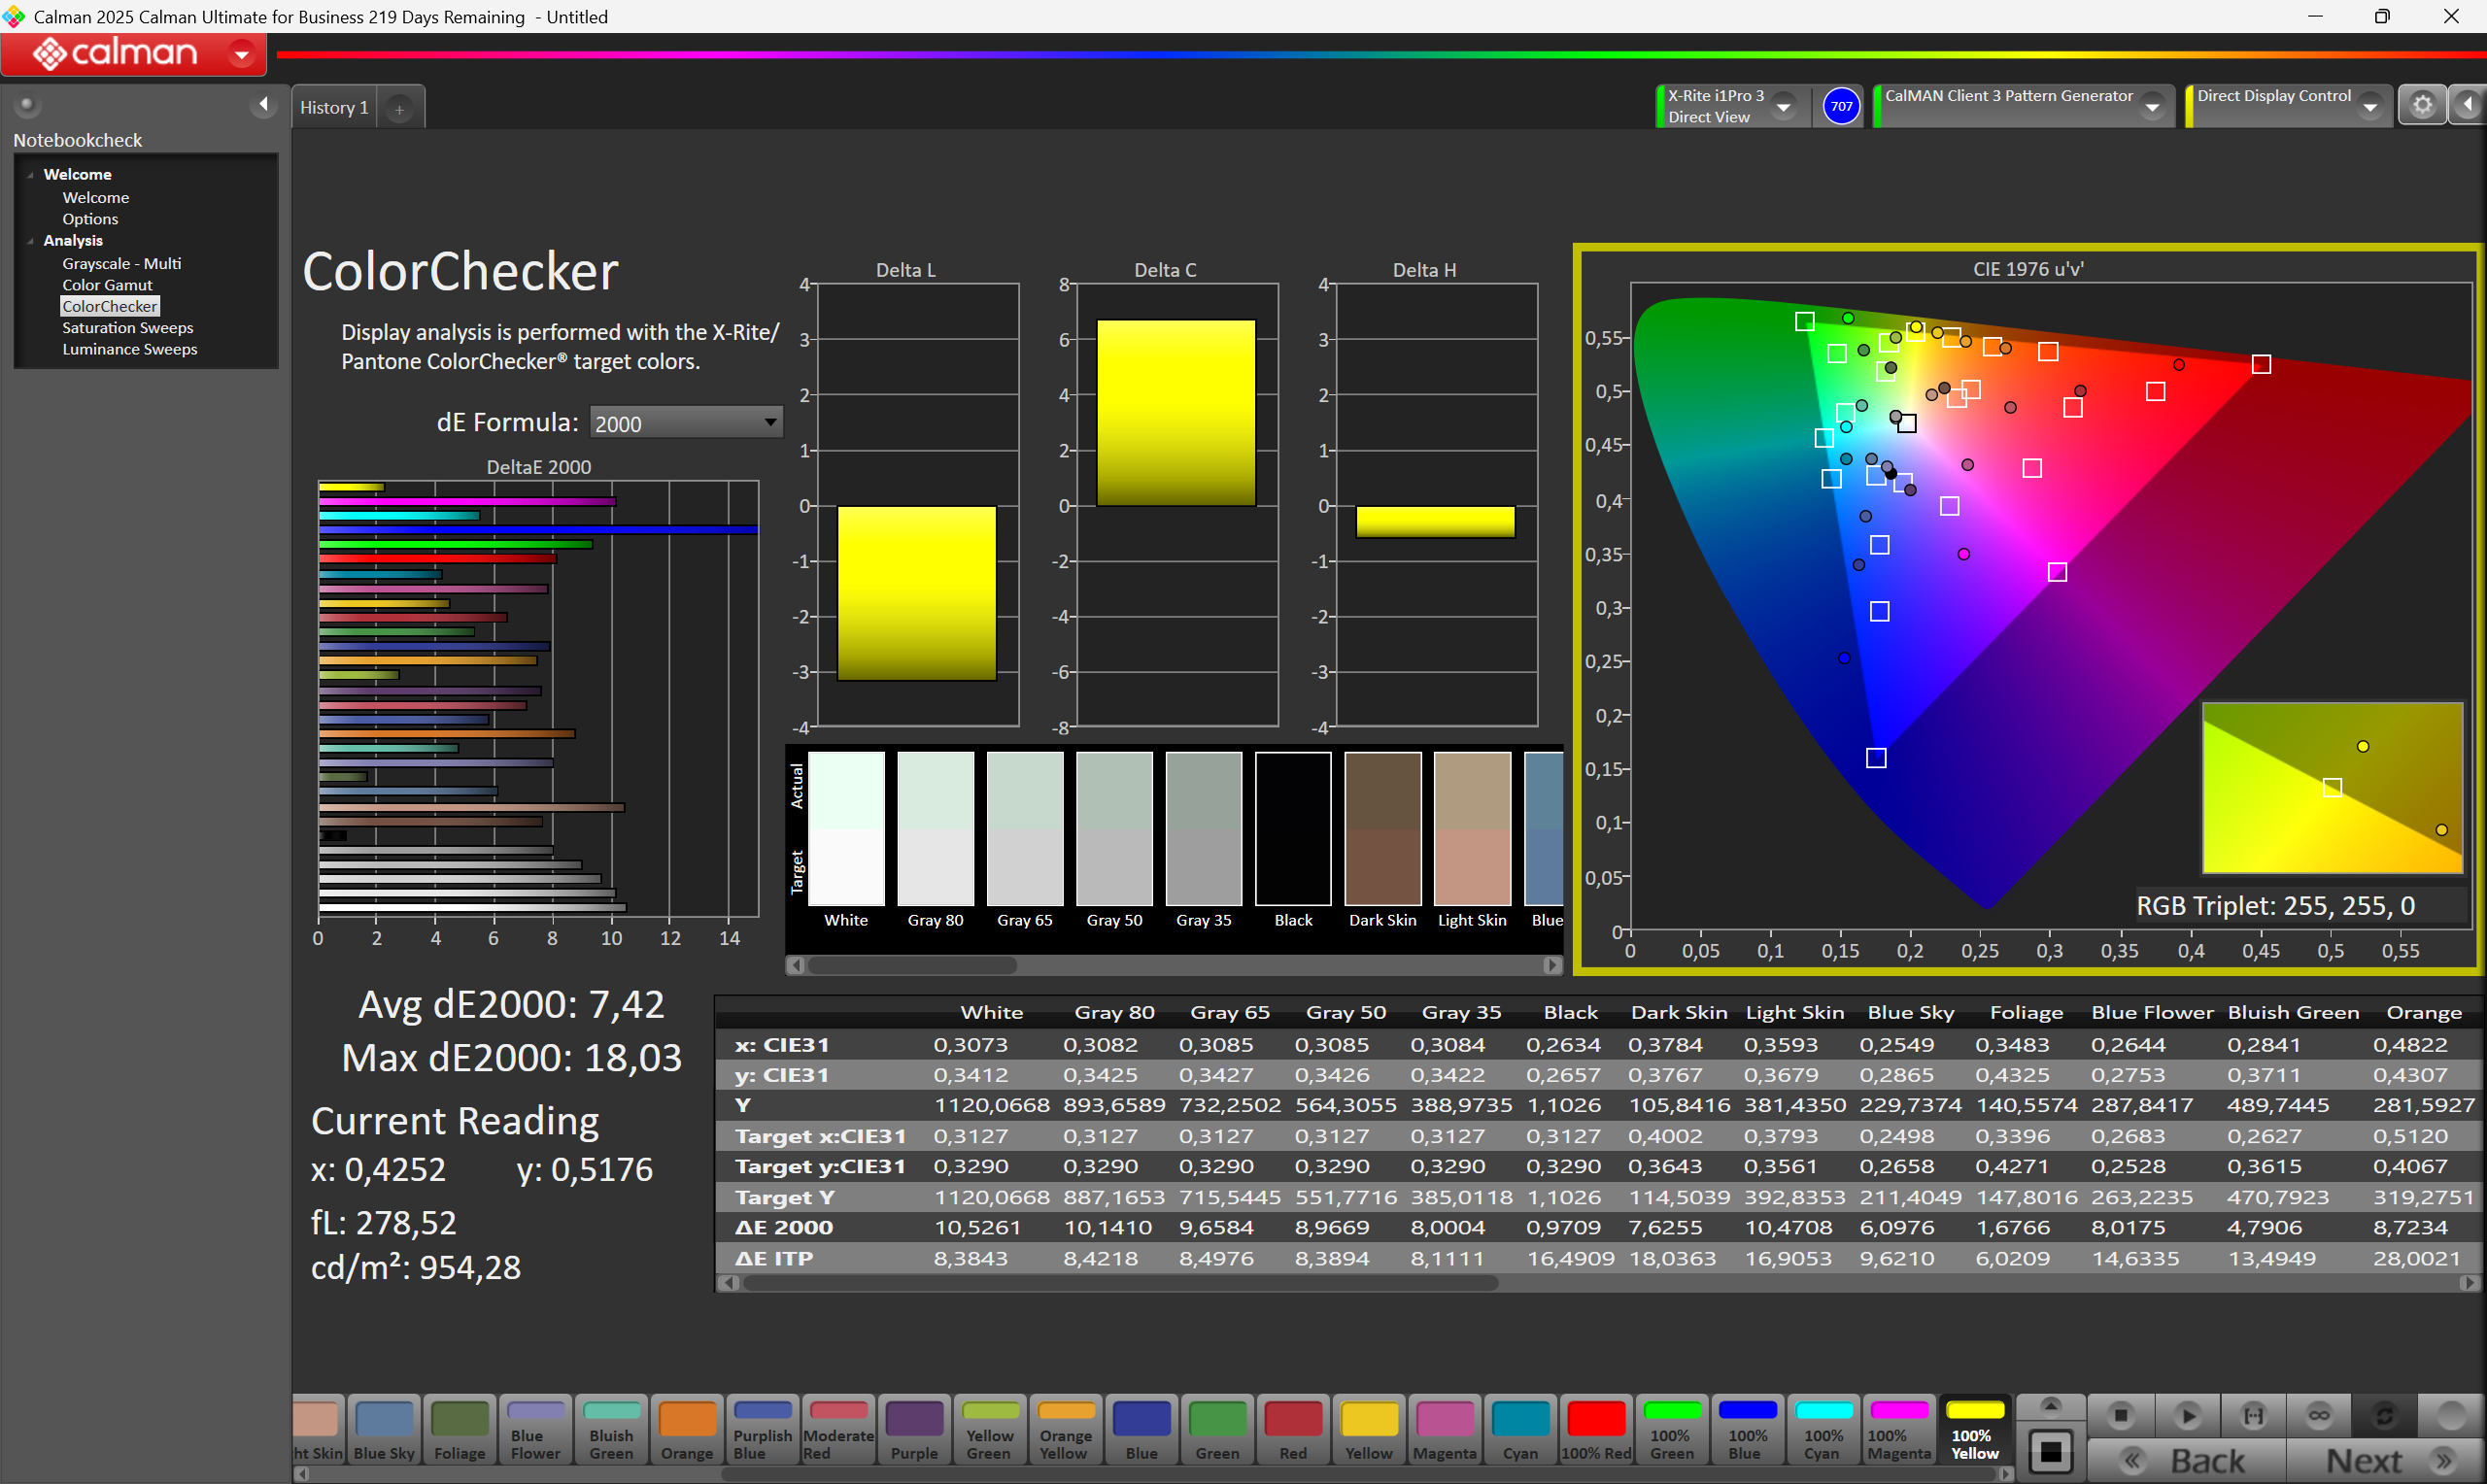
ΔE ColorChecker Calman: 7.42 | ∀{0.5-29.43 Ø4.72}
calibrated: 4.58
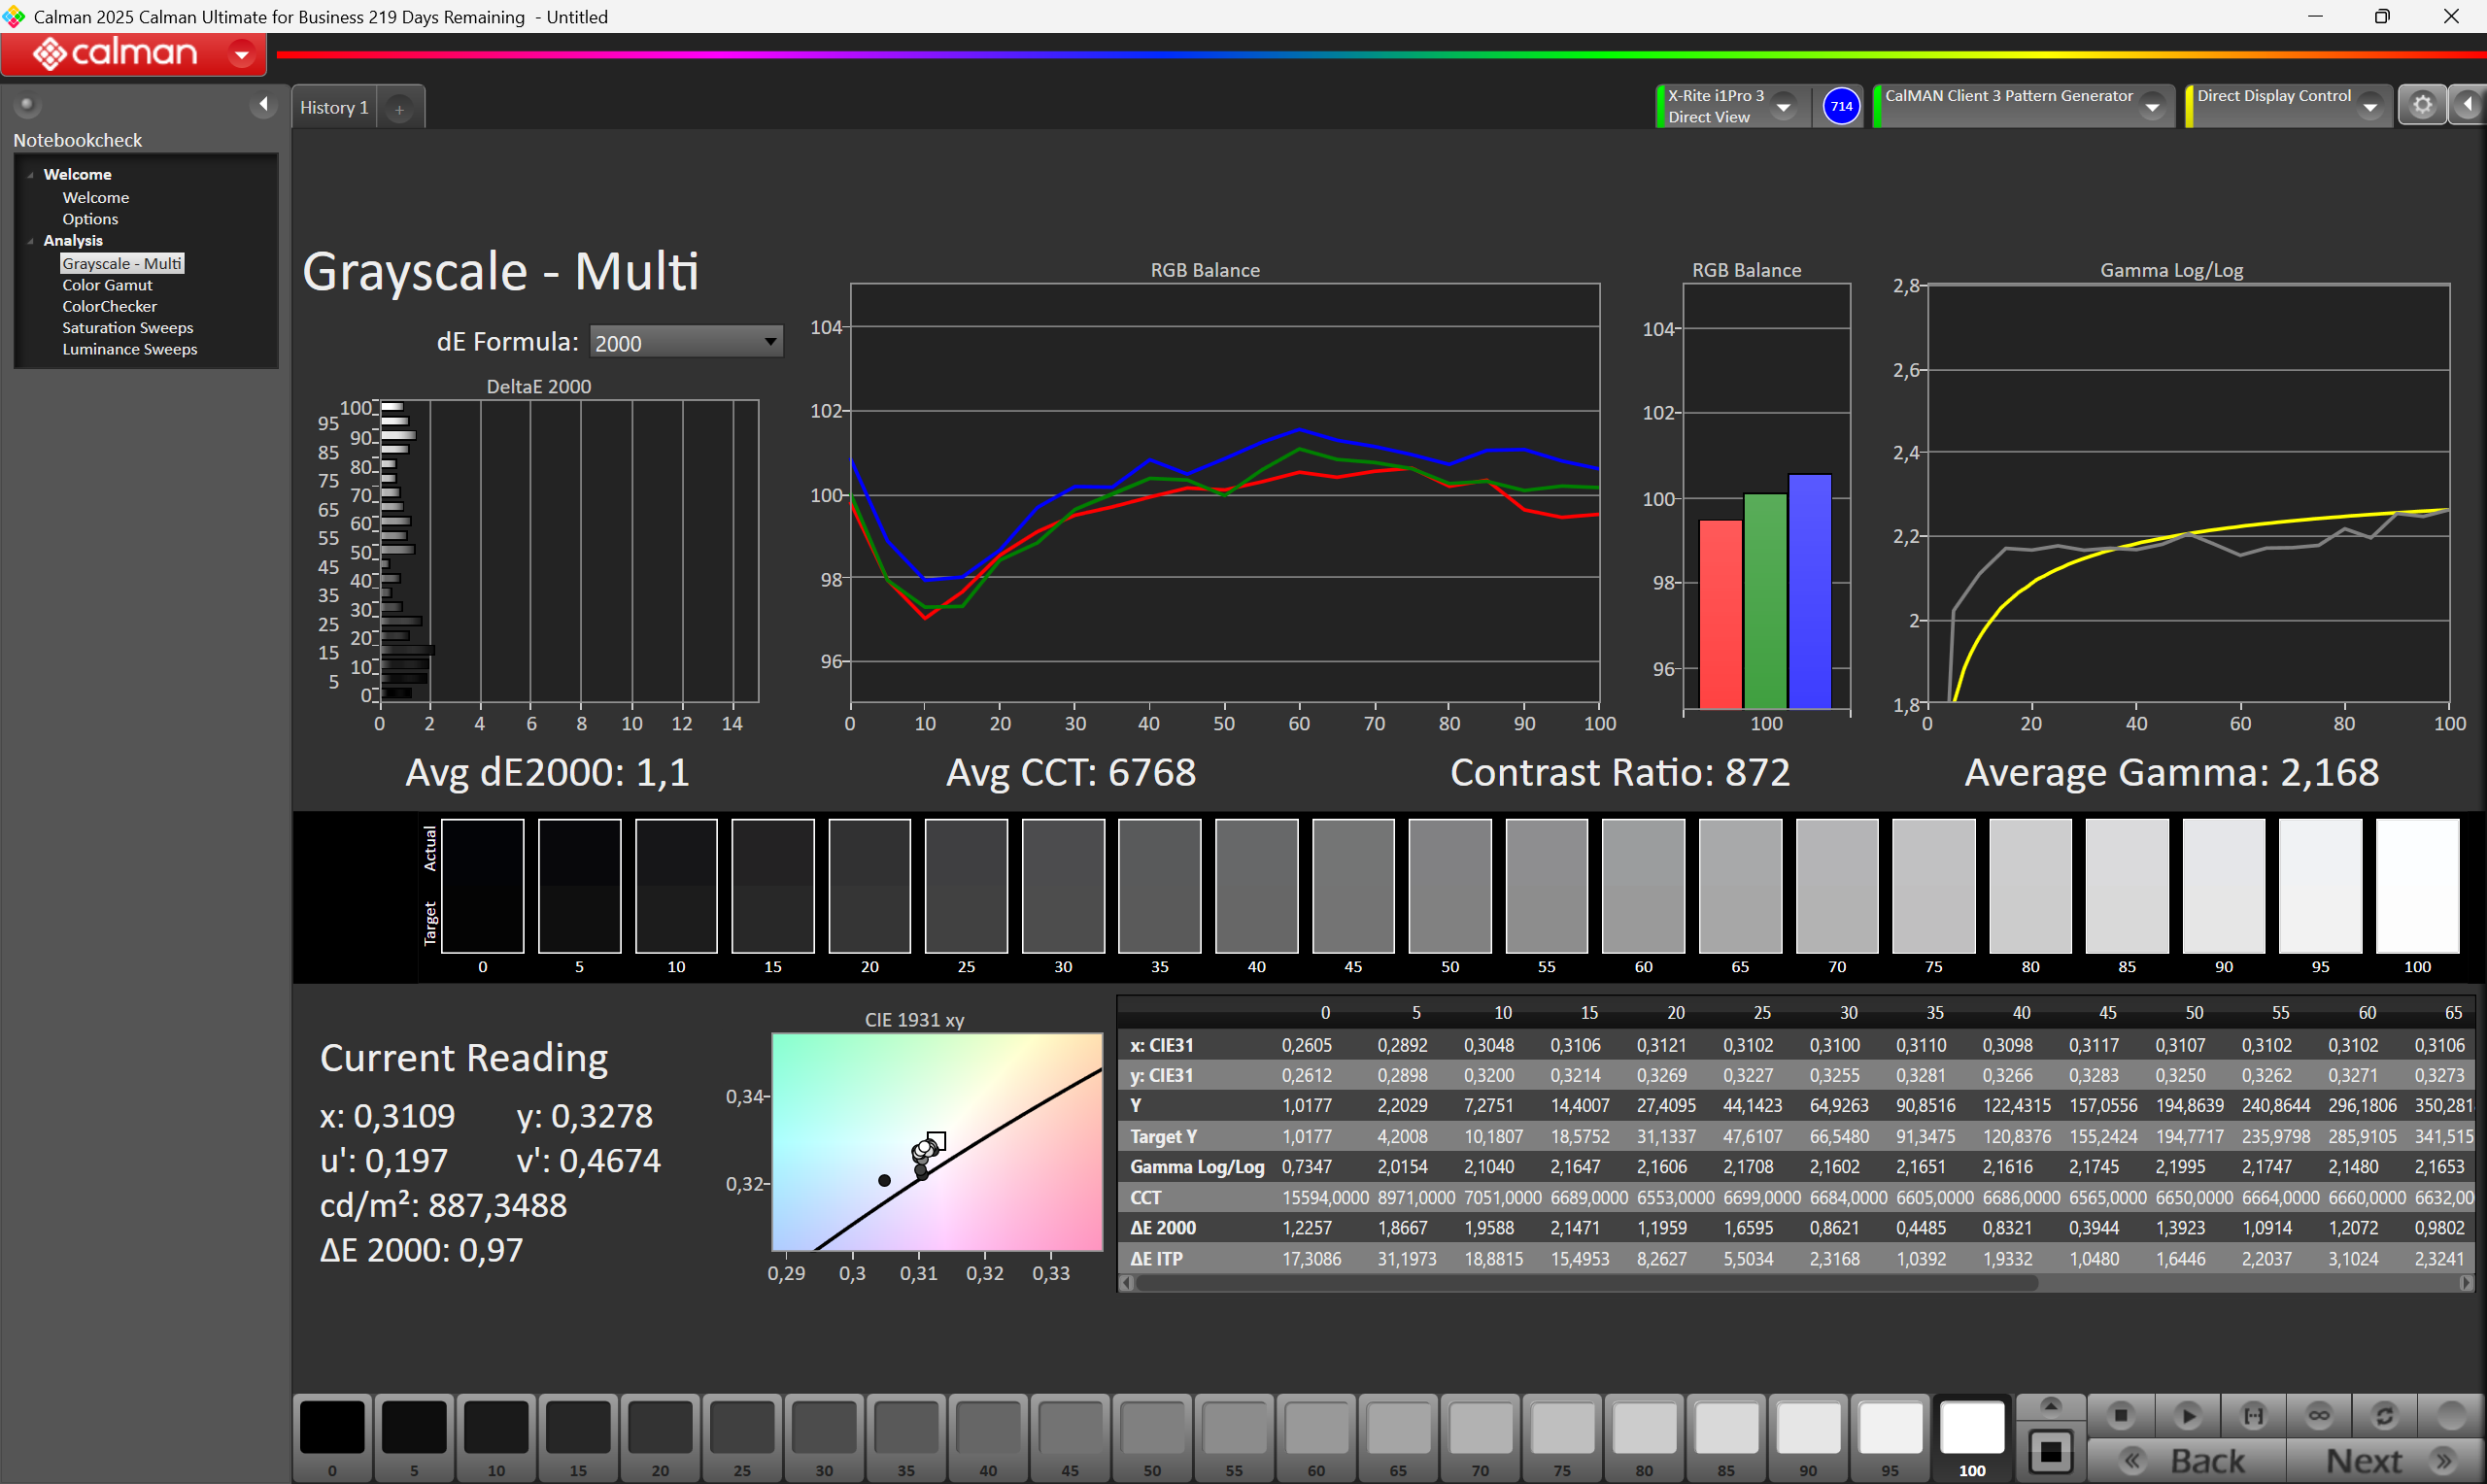
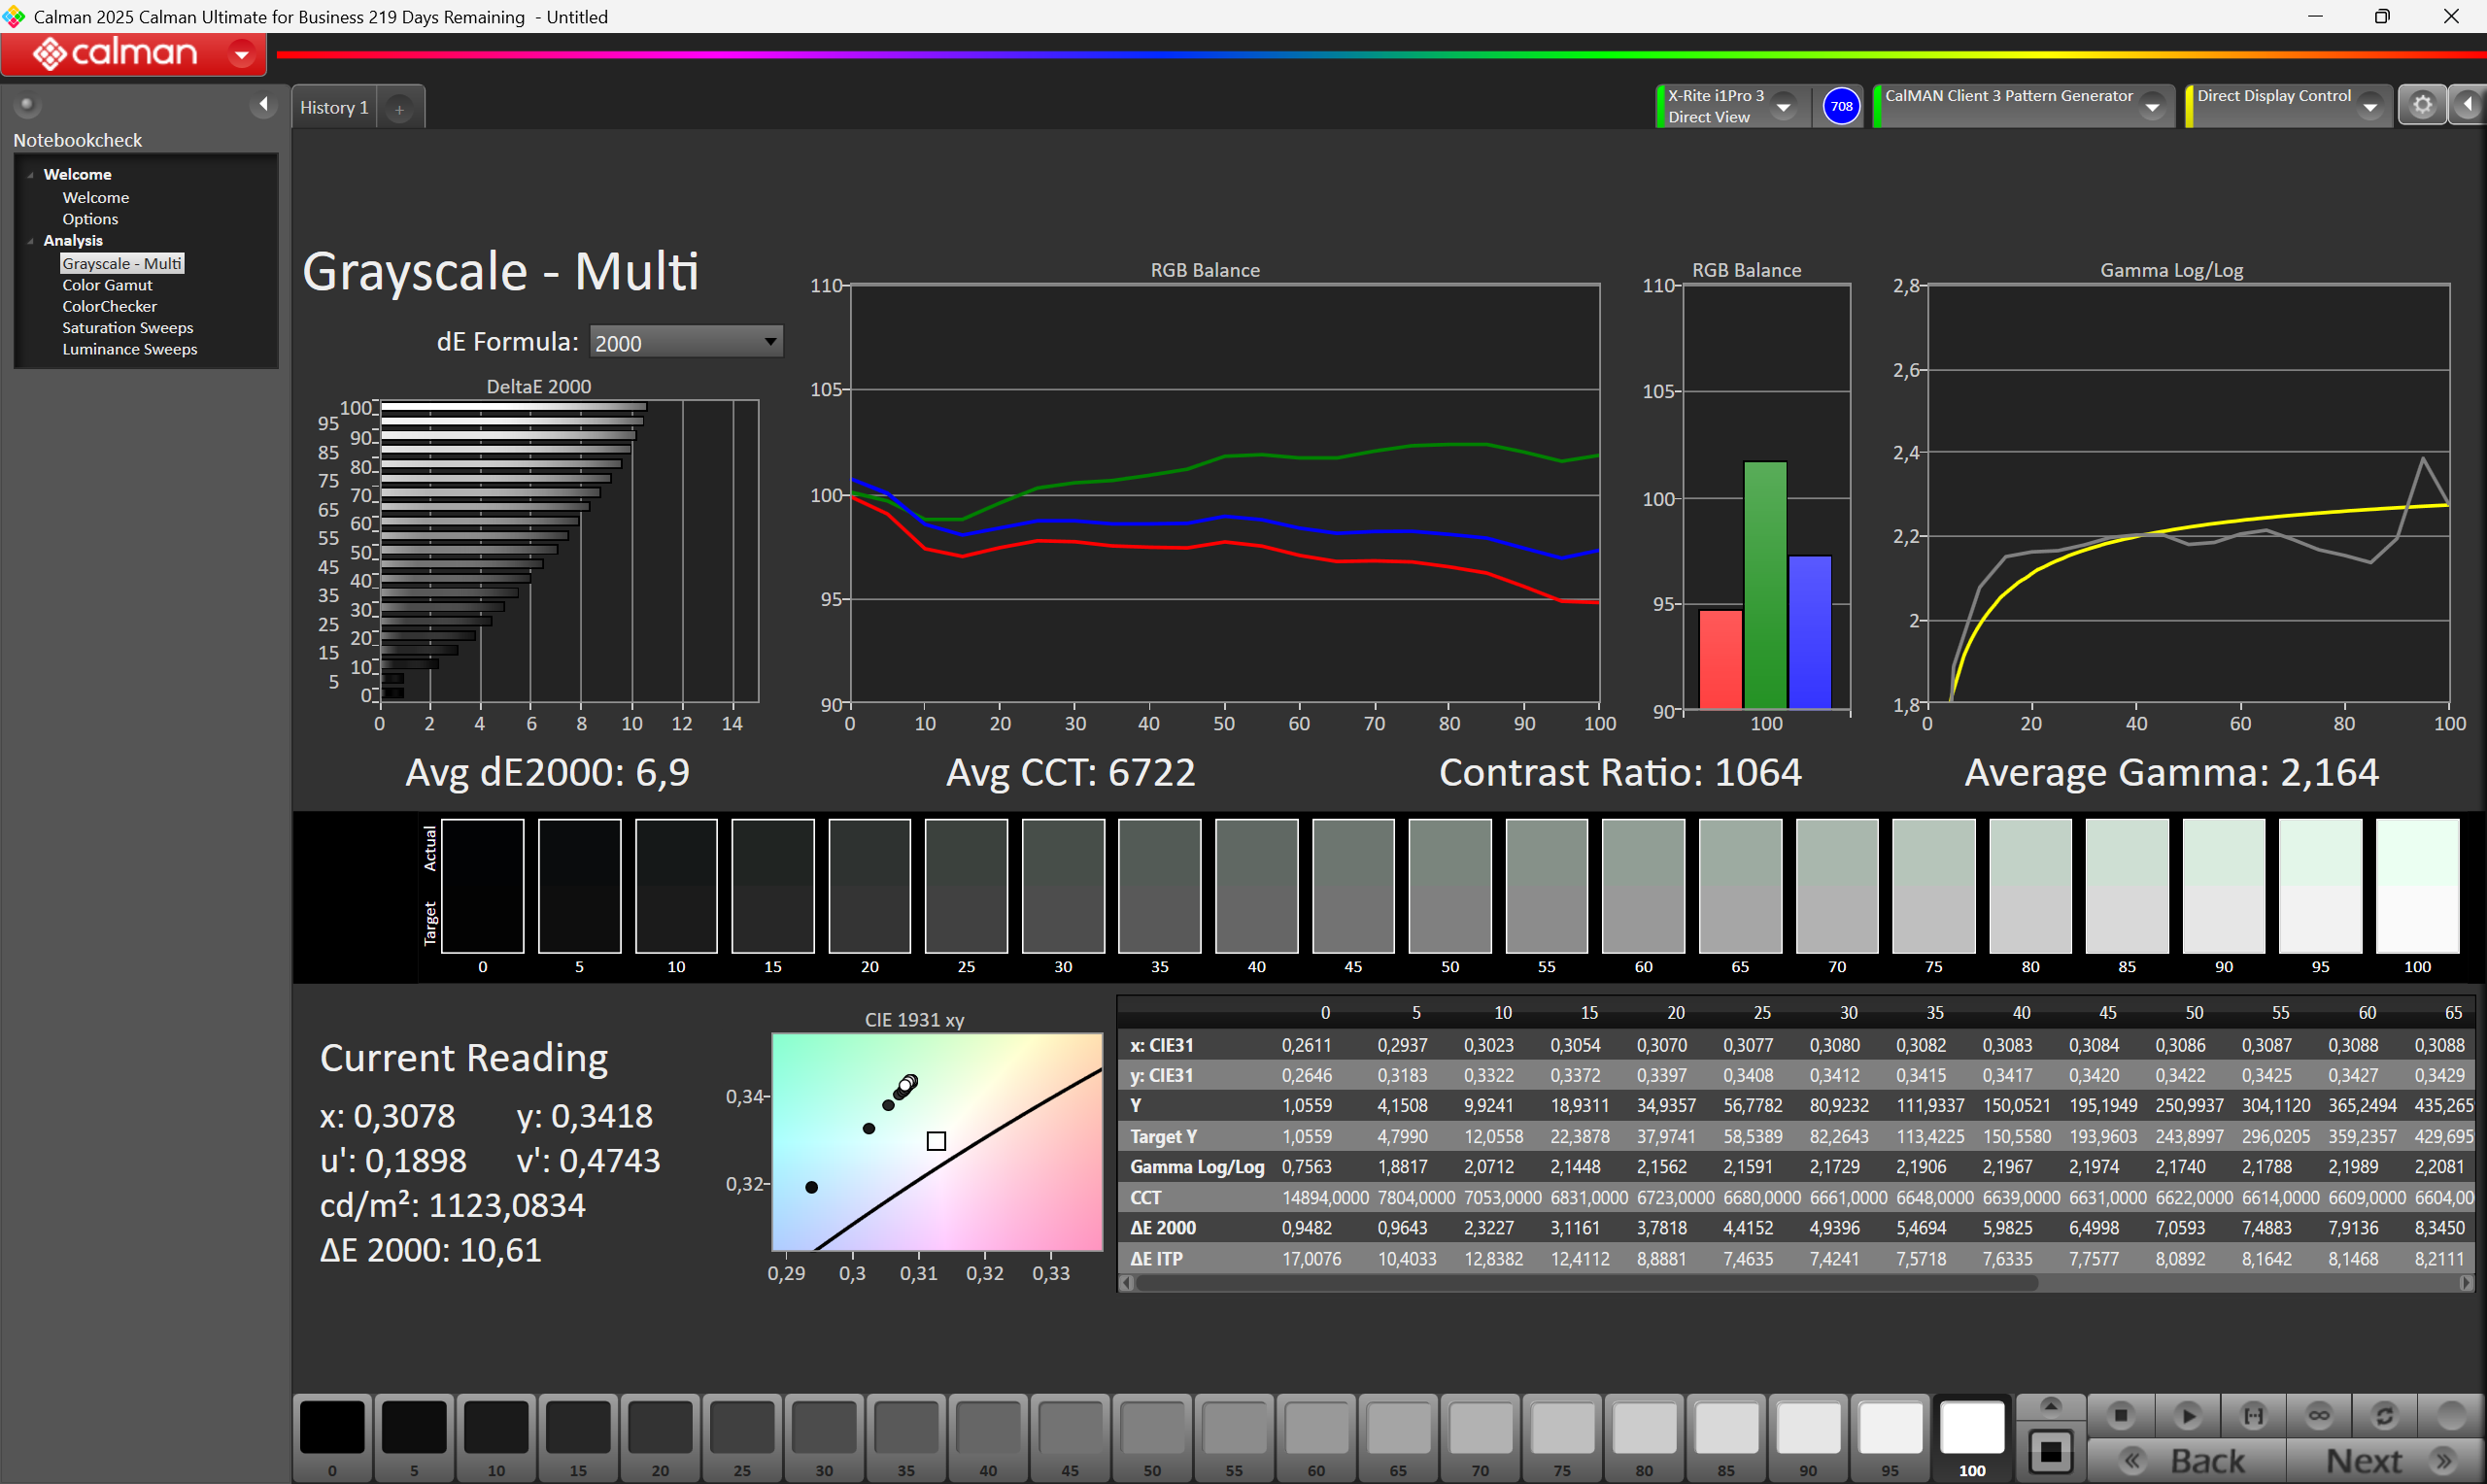
ΔE Greyscale Calman: 6.9 | ∀{0.09-98 Ø4.97}
44.17% AdobeRGB 1998 (Argyll 3D)
61.77% sRGB (Argyll 3D)
42.75% Display P3 (Argyll 3D)
Gamma: 2.164
CCT: 6722 K
| Durabook R10 HannStar 101GUW2, TFT, 1920x1200, 10.1", 60 Hz | Dell Latitude 7030 Rugged Extreme Sharp LQ101N1, IPS, 1920x1200, 10", 60 Hz | Lenovo ThinkPad T14 Gen 6 21QG001VGE MNE007JA1-3, IPS LED, 1920x1200, 14", 60 Hz | Dynabook Portege Z40L-N BOE NE140WUM-N6K, IPS, 1920x1200, 14", 60 Hz | Durabook R8 Tablet Digital Flat Panel, IPS, 1280x800, 8", 60 Hz | Lenovo ThinkPad T14 Gen 6 AMD NE140WUM-N6M, , 1920x1200, 14", 60 Hz | |
|---|---|---|---|---|---|---|
| Display | 65% | 58% | 62% | 22% | 57% | |
| Display P3 Coverage (%) | 42.75 | 72.2 69% | 67.7 58% | 70.1 64% | 51.5 20% | 66.9 56% |
| sRGB Coverage (%) | 61.77 | 99 60% | 98.3 59% | 99 60% | 77.4 25% | 98.5 59% |
| AdobeRGB 1998 Coverage (%) | 44.17 | 72.7 65% | 69.9 58% | 71.8 63% | 53.1 20% | 68.9 56% |
| Response Times | 26% | 10% | 8% | 30% | 28% | |
| Response Time Grey 50% / Grey 80% * (ms) | 53.2 ? | 35.9 ? 33% | 40.2 ? 24% | 42.1 ? 21% | 32.4 ? 39% | 31.1 ? 42% |
| Response Time Black / White * (ms) | 27.6 ? | 22.4 ? 19% | 29.1 ? -5% | 26.7 ? 3% | 21.9 ? 21% | 24.1 ? 13% |
| PWM Frequency (Hz) | 300 | 300 ? | ||||
| PWM Amplitude * (%) | 100 | 100 -0% | ||||
| Screen | 45% | 45% | 34% | 5% | 28% | |
| Brightness middle (cd/m²) | 1075 | 1183.9 10% | 554 -48% | 445.4 -59% | 943.7 -12% | 557 -48% |
| Brightness (cd/m²) | 1042 | 1140 9% | 516 -50% | 424 -59% | 870 -17% | 526 -50% |
| Brightness Distribution (%) | 92 | 88 -4% | 91 -1% | 91 -1% | 85 -8% | 84 -9% |
| Black Level * (cd/m²) | 1.05 | 0.74 30% | 0.24 77% | 0.23 78% | 0.85 19% | 0.4 62% |
| Contrast (:1) | 1024 | 1600 56% | 2308 125% | 1937 89% | 1110 8% | 1393 36% |
| Colorchecker dE 2000 * | 7.42 | 2.03 73% | 1.5 80% | 2.85 62% | 6.35 14% | 2.4 68% |
| Colorchecker dE 2000 max. * | 18.03 | 3.44 81% | 3.4 81% | 4.57 75% | 8.86 51% | 5.9 67% |
| Colorchecker dE 2000 calibrated * | 4.58 | 0.53 88% | 0.9 80% | 1.54 66% | 5.1 -11% | 0.7 85% |
| Greyscale dE 2000 * | 6.9 | 2.6 62% | 2.7 61% | 3.3 52% | 6.9 -0% | 4 42% |
| Gamma | 2.164 102% | 2.27 97% | 2.25 98% | 2.03 108% | 2.65 83% | 2.15 102% |
| CCT | 6722 97% | 6102 107% | 6882 94% | 6497 100% | 6956 93% | 7017 93% |
| Total Average (Program / Settings) | 45% /
47% | 38% /
43% | 35% /
34% | 19% /
12% | 38% /
34% |
* ... smaller is better
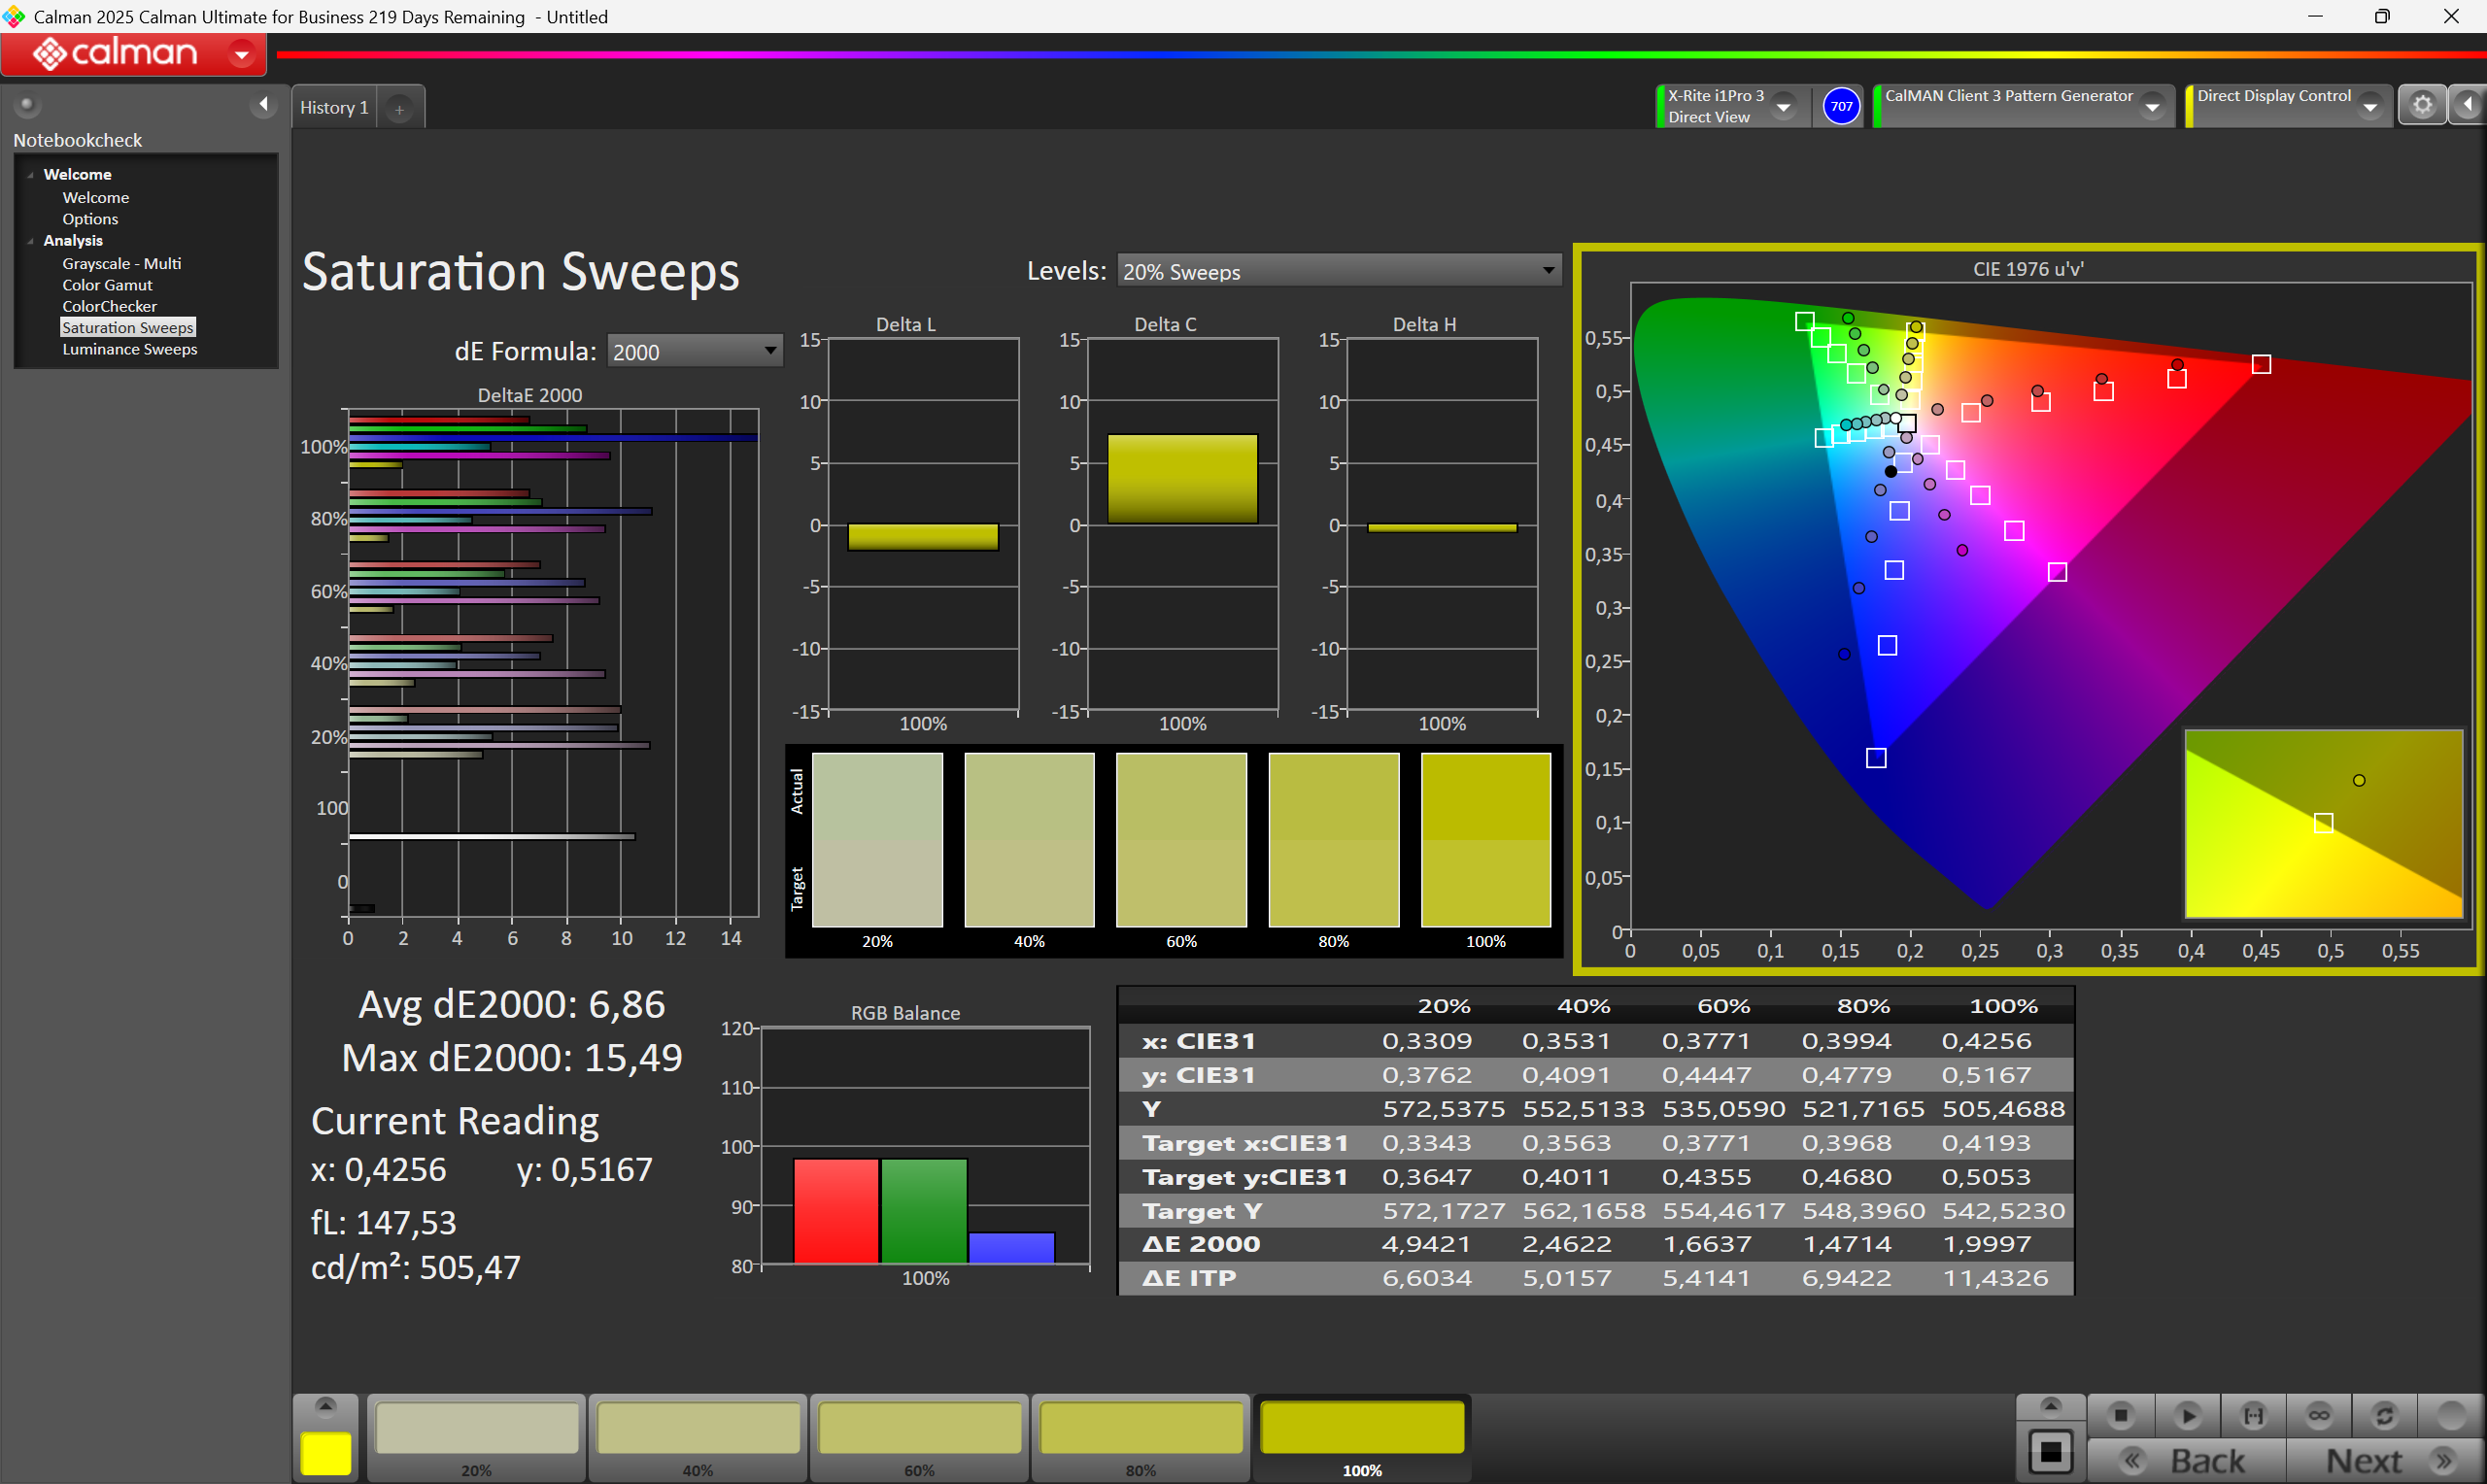
This tablet is unsuitable for color-critical work. With an sRGB color gamut coverage of a meager 61 percent, colors appear washed out. Out of the box, the panel has a noticeable green cast.
Display Response Times
| ↔ Response Time Black to White | ||
|---|---|---|
| 27.6 ms ... rise ↗ and fall ↘ combined | ↗ 16 ms rise |   |
| ↘ 11.6 ms fall | ||
| The screen shows relatively slow response rates in our tests and may be too slow for gamers. In comparison, all tested devices range from 0.1 (minimum) to 240 (maximum) ms. » 70 % of all devices are better. This means that the measured response time is worse than the average of all tested devices (19.8 ms). | ||
| ↔ Response Time 50% Grey to 80% Grey | ||
| 53.2 ms ... rise ↗ and fall ↘ combined | ↗ 20 ms rise |   |
| ↘ 33.2 ms fall | ||
| The screen shows slow response rates in our tests and will be unsatisfactory for gamers. In comparison, all tested devices range from 0.165 (minimum) to 636 (maximum) ms. » 90 % of all devices are better. This means that the measured response time is worse than the average of all tested devices (31 ms). | ||
Screen Flickering / PWM (Pulse-Width Modulation)
| Screen flickering / PWM detected | 300 Hz Amplitude: 100 % |  | |
The display backlight flickers at 300 Hz (worst case, e.g., utilizing PWM) . The frequency of 300 Hz is relatively high, so most users sensitive to PWM should not notice any flickering. However, there are reports that some users are still sensitive to PWM at 500 Hz and above, so be aware. In comparison: 52 % of all tested devices do not use PWM to dim the display. If PWM was detected, an average of 7781 (minimum: 5 - maximum: 343500) Hz was measured. | |||


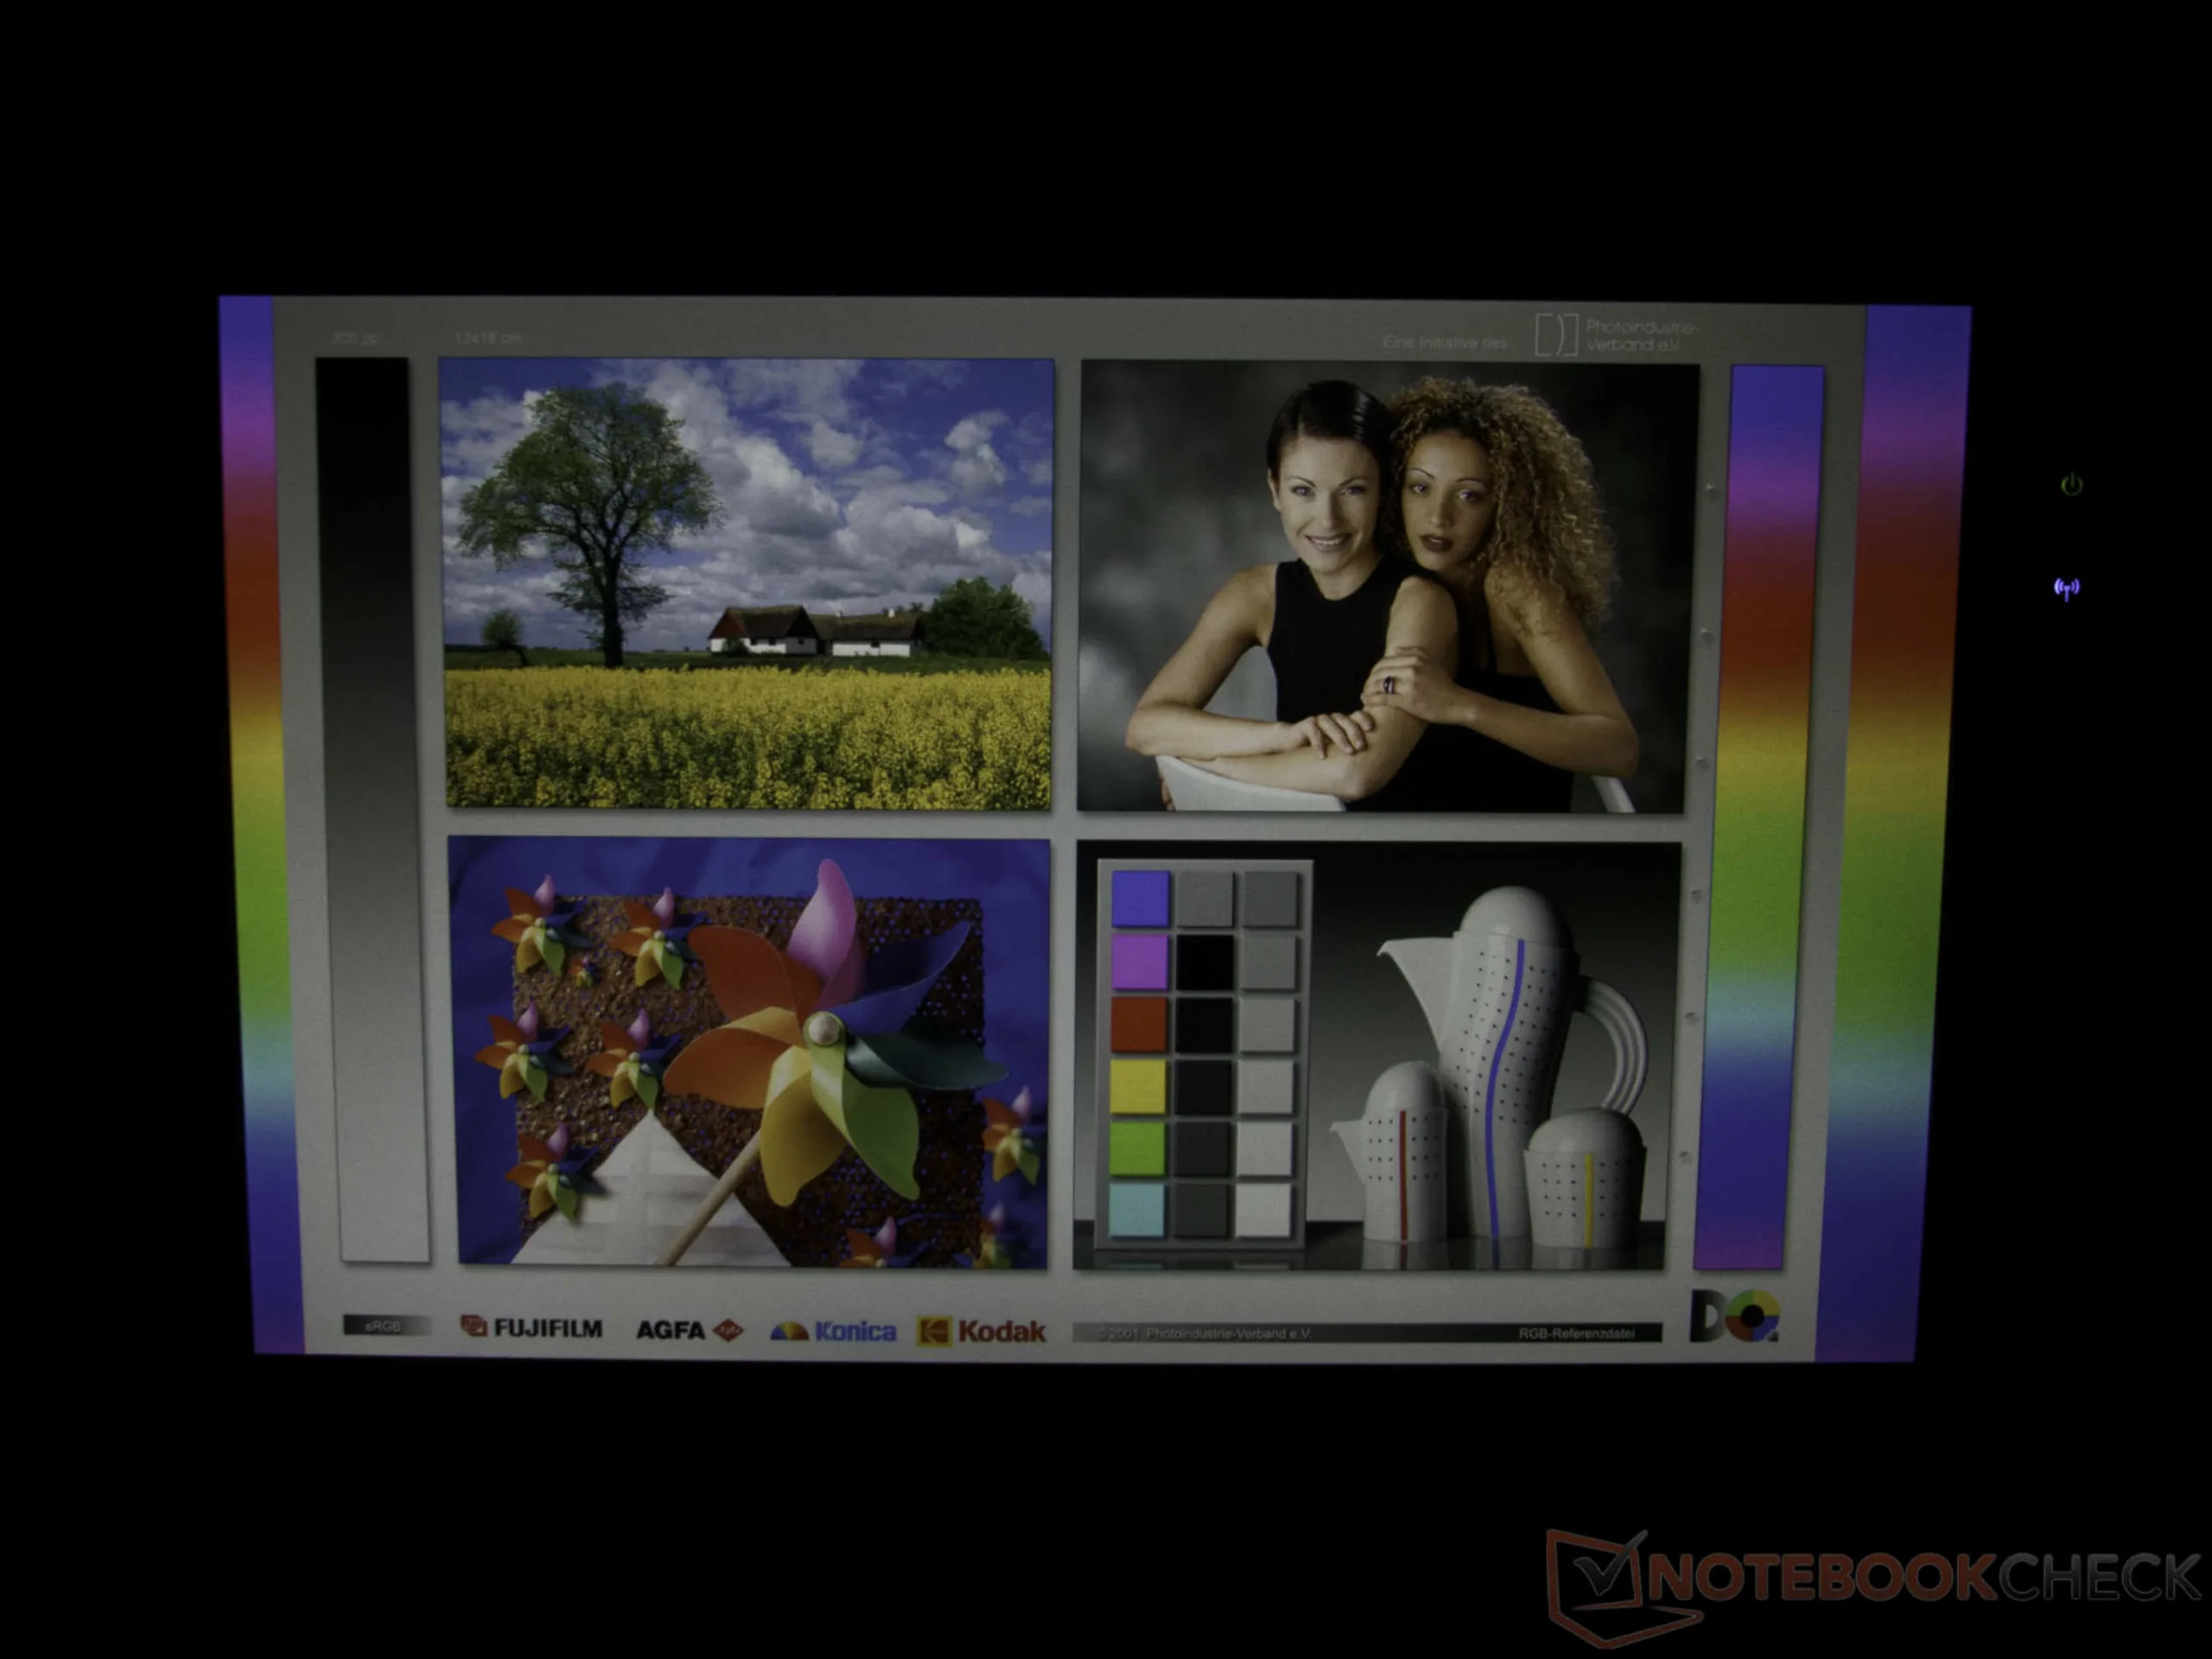
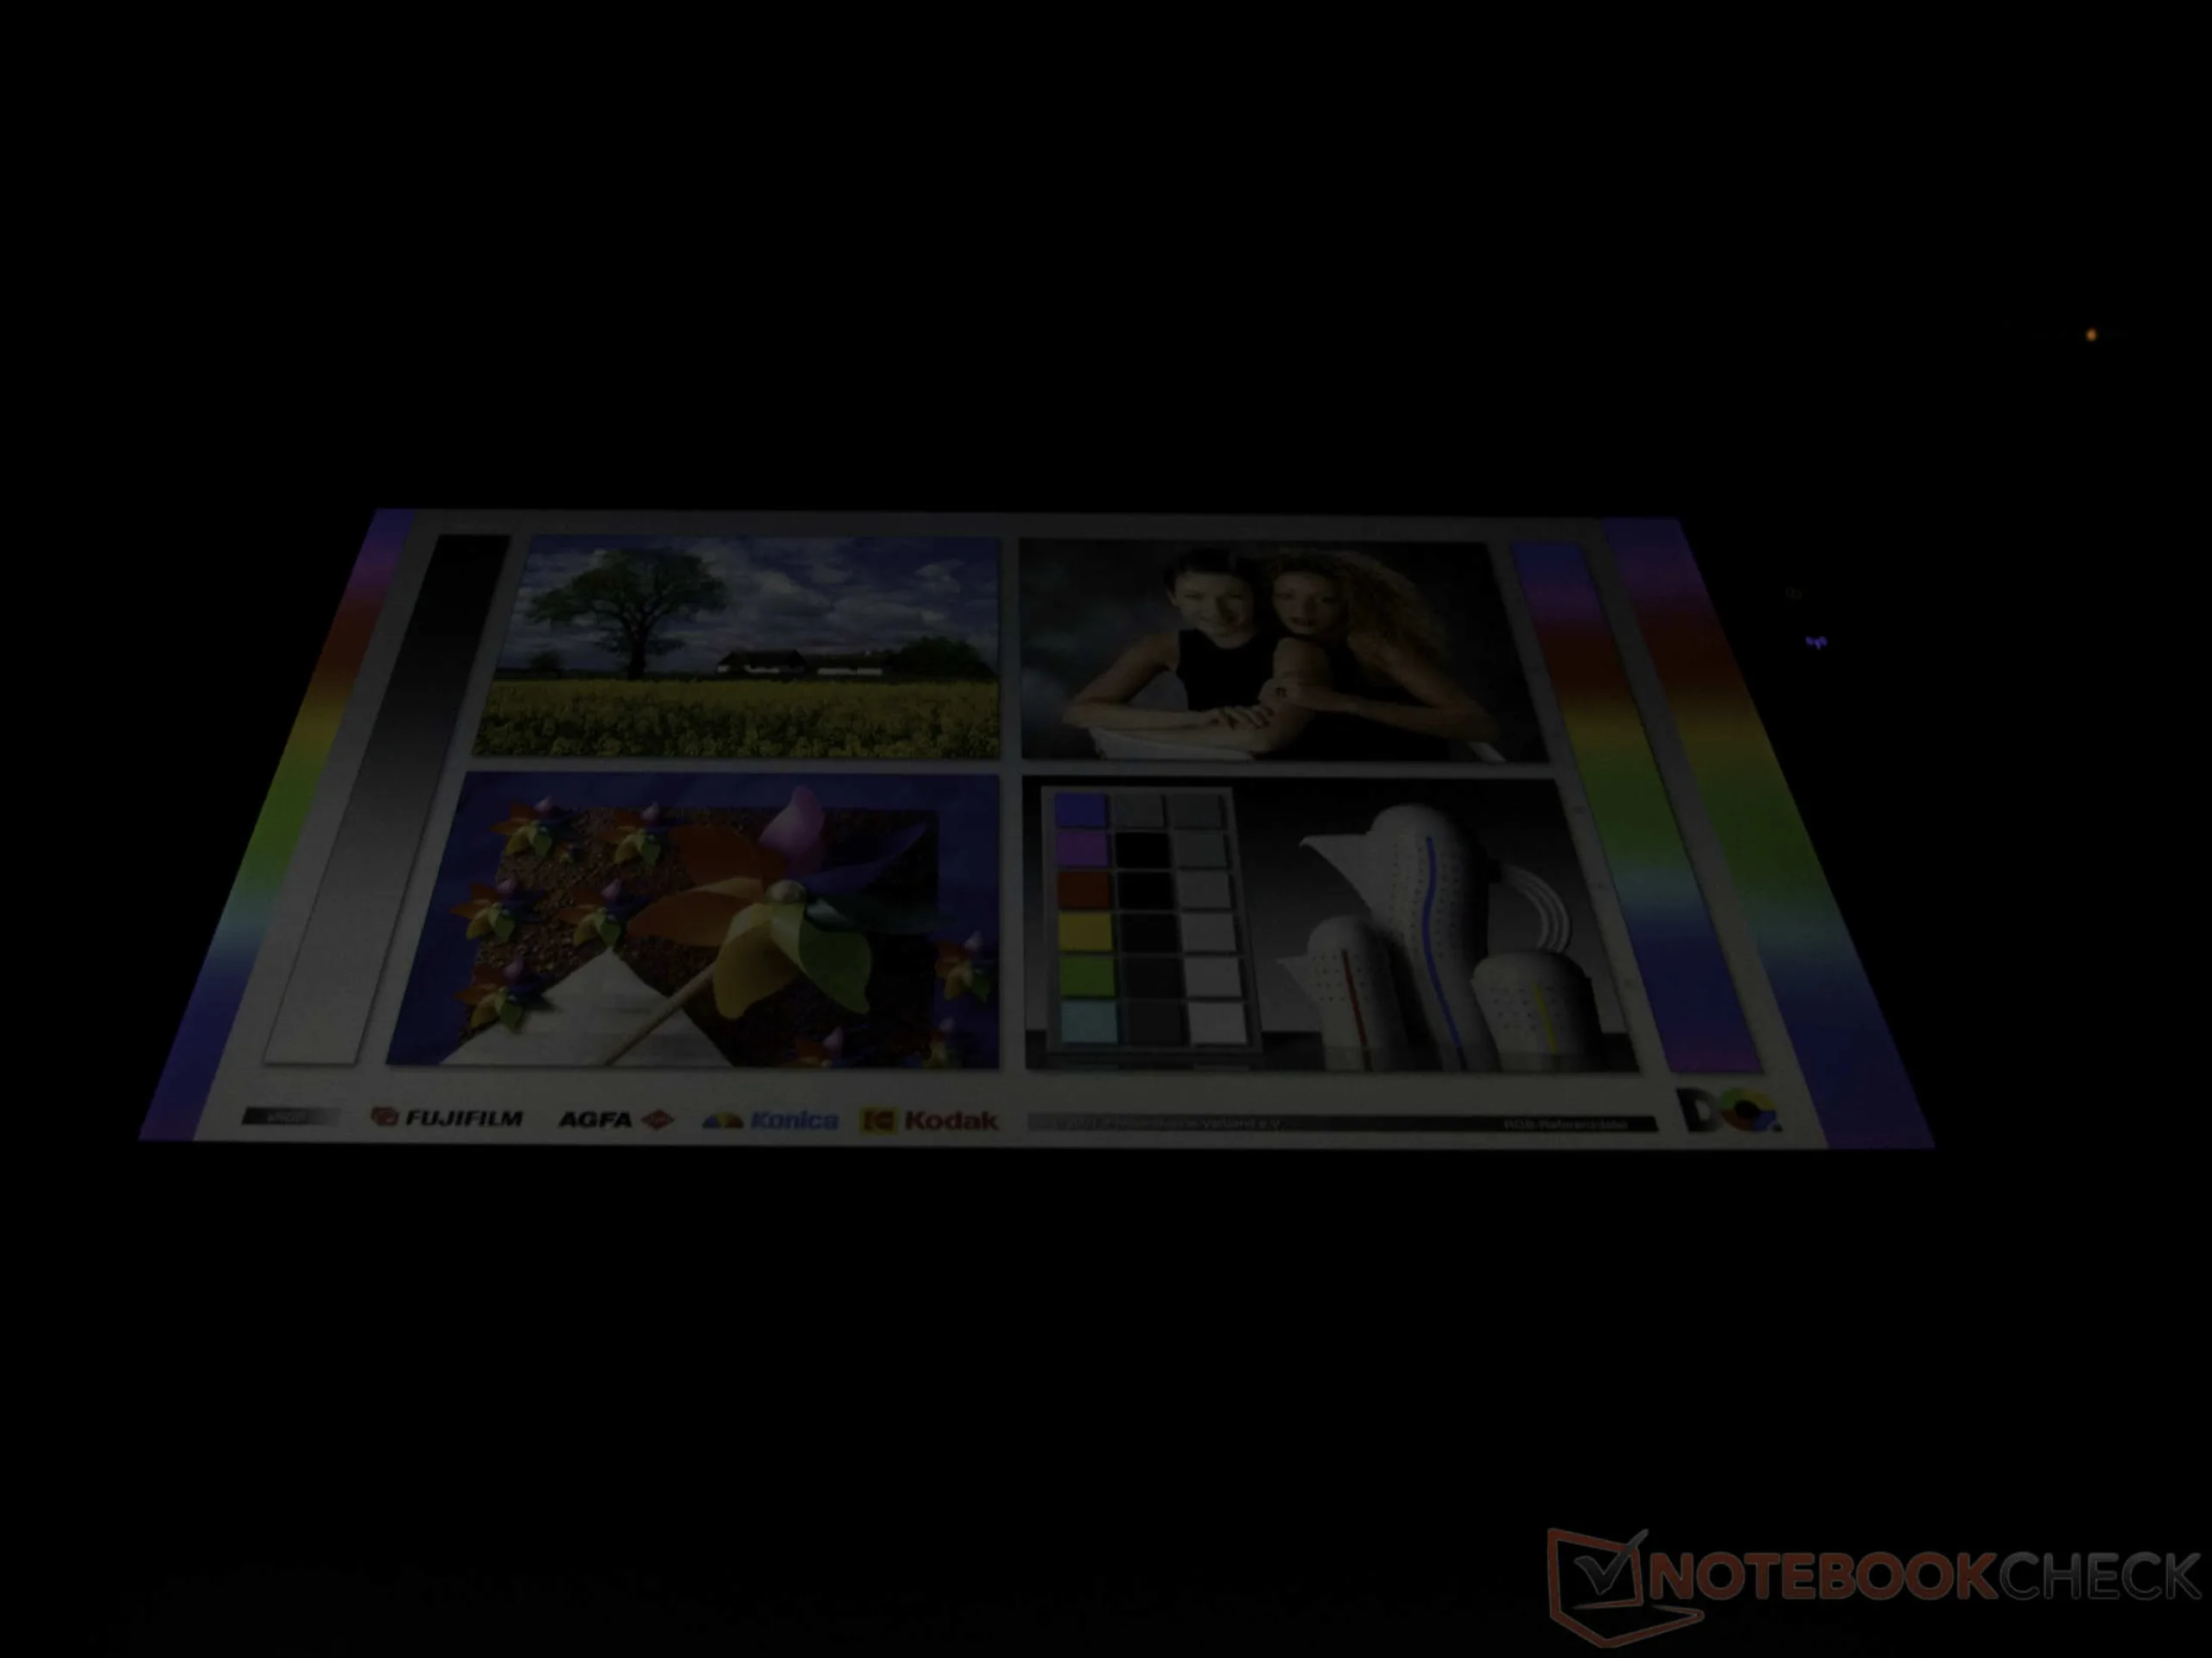
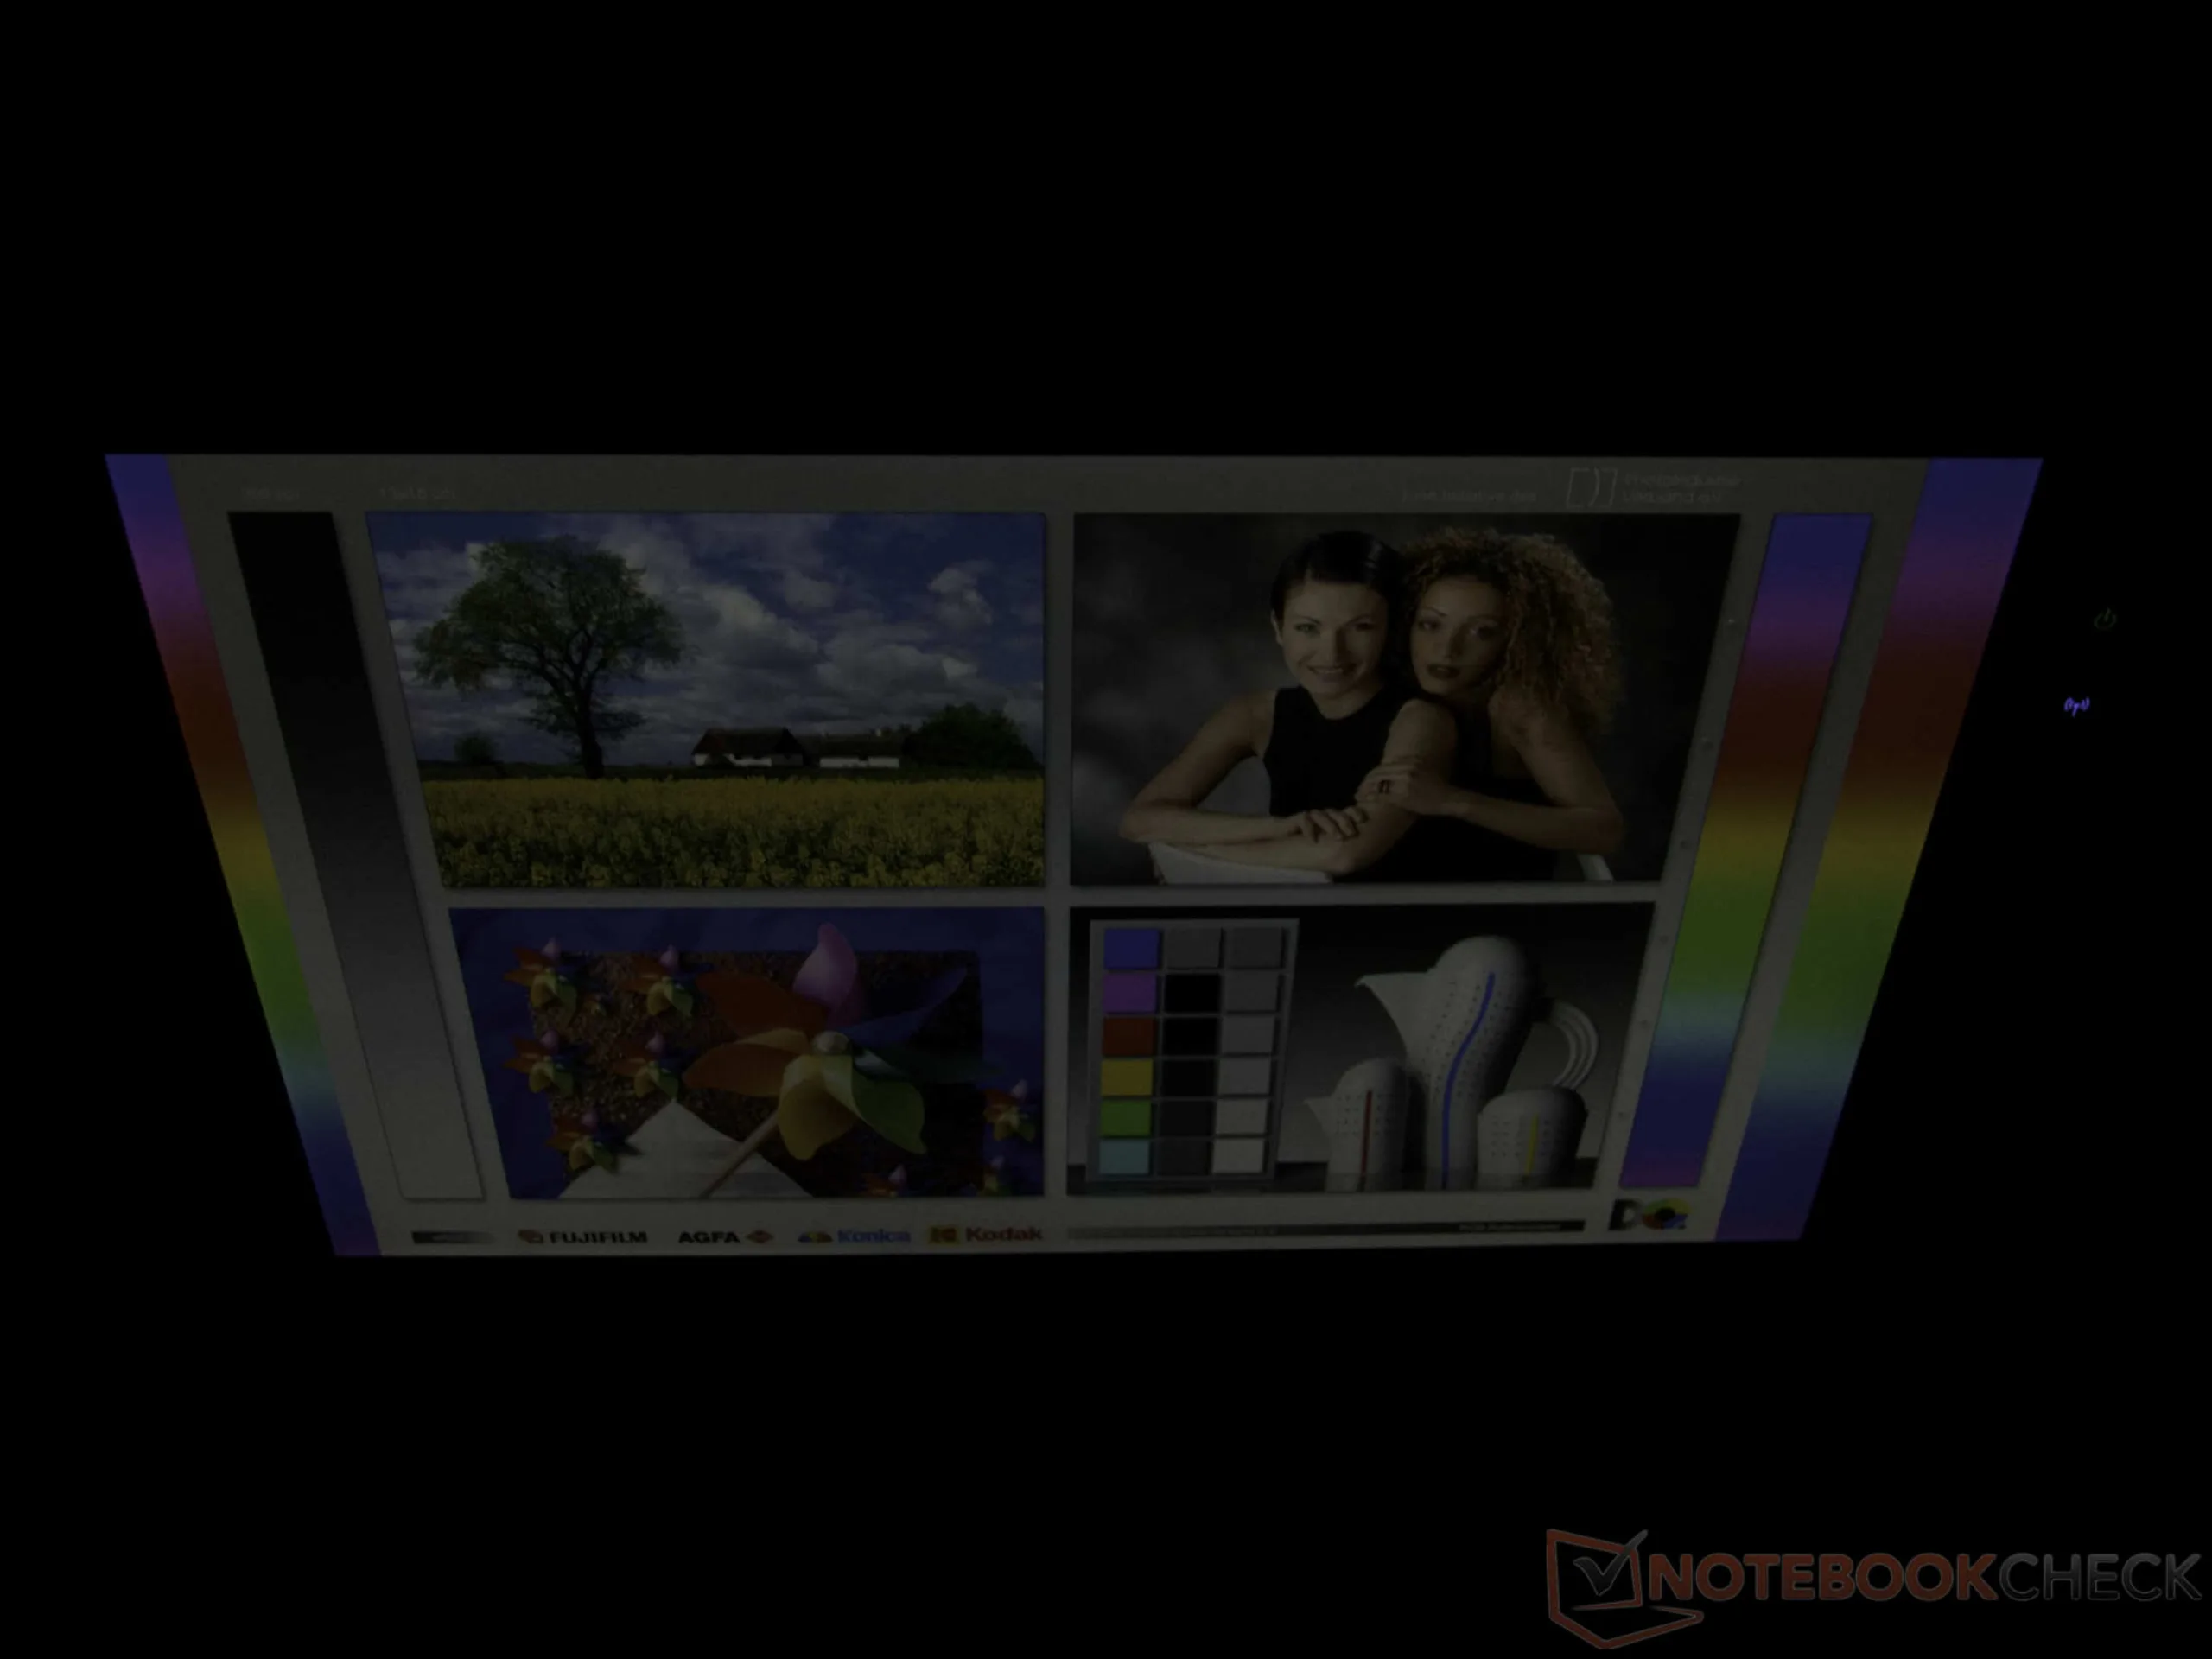
Outdoor use
Perspective Analysis
Performance
Under the rugged hood, a state-of-the-art Intel Core Ultra processor works tirelessly. For the R10, nearly all Core Ultra 5 and Core Ultra 7 processors from the Lunar Lake generation can be configured. Depending on the processor class, vPro Enterprise versions are available.
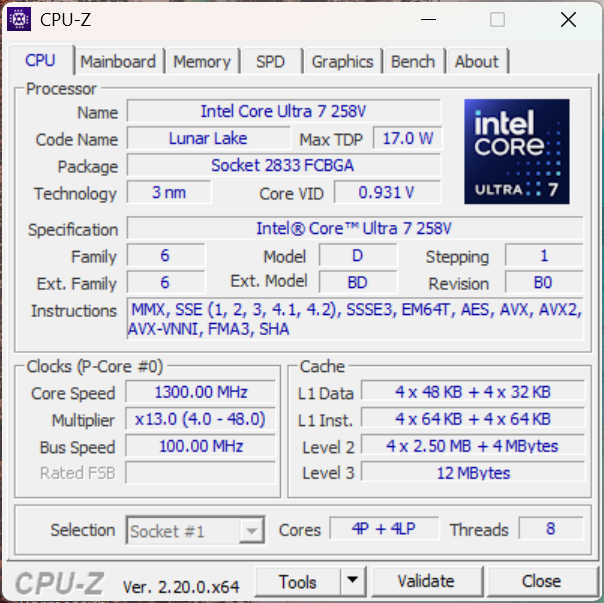
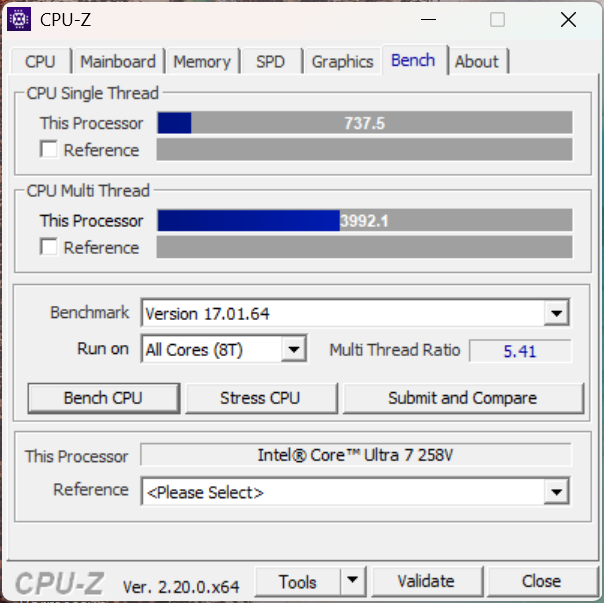
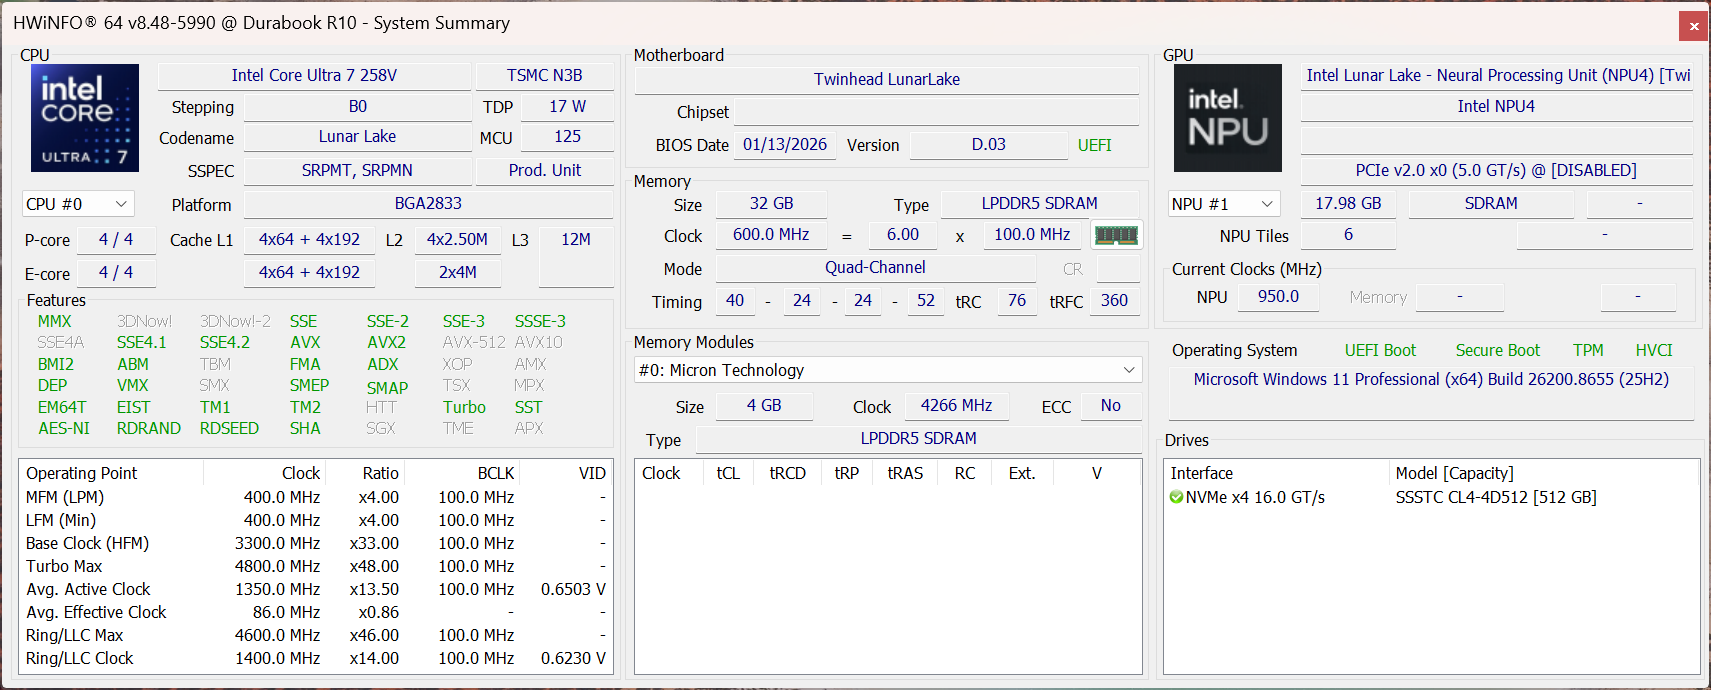
Processor Performance
The 258V in the test unit features eight cores without multithreading. During brief load spikes, the system allows up to 32 watts before the power consumption is permanently throttled to around 17 watts. As a result, the Core Ultra 7’s performance remains below average in our comparison. There is no power management feature with adjustable TDP values here.
Cinebench R15 Multi-Core Endurance Test
Cinebench R23: Multi Core | Single Core
Cinebench R20: CPU (Multi Core) | CPU (Single Core)
Cinebench R15: CPU Multi 64Bit | CPU Single 64Bit
Blender: v2.79 BMW27 CPU
7-Zip 18.03: 7z b 4 | 7z b 4 -mmt1
Geekbench 6.7: Multi-Core | Single-Core
Geekbench 5.5: Multi-Core | Single-Core
HWBOT x265 Benchmark v2.2: 4k Preset
LibreOffice : 20 Documents To PDF
R Benchmark 2.5: Overall mean
| CPU Performance rating | |
| Lenovo ThinkPad T14 Gen 6 AMD | |
| Lenovo ThinkPad T14 Gen 6 21QG001VGE | |
| Average Intel Core Ultra 7 258V | |
| Dynabook Portege Z40L-N | |
| Durabook R10 | |
| Dell Latitude 7030 Rugged Extreme | |
| Average of class Tablet | |
| Durabook R8 Tablet -2! | |
| Cinebench R23 / Multi Core | |
| Lenovo ThinkPad T14 Gen 6 AMD | |
| Lenovo ThinkPad T14 Gen 6 21QG001VGE | |
| Average Intel Core Ultra 7 258V (7920 - 11097, n=25) | |
| Average of class Tablet (8043 - 10868, n=3, last 2 years) | |
| Dell Latitude 7030 Rugged Extreme | |
| Durabook R10 | |
| Durabook R10 | |
| Dynabook Portege Z40L-N | |
| Durabook R8 Tablet | |
| Cinebench R23 / Single Core | |
| Lenovo ThinkPad T14 Gen 6 AMD | |
| Lenovo ThinkPad T14 Gen 6 21QG001VGE | |
| Durabook R10 | |
| Durabook R10 | |
| Average of class Tablet (1822 - 1921, n=3, last 2 years) | |
| Average Intel Core Ultra 7 258V (1664 - 1957, n=25) | |
| Dynabook Portege Z40L-N | |
| Dell Latitude 7030 Rugged Extreme | |
| Durabook R8 Tablet | |
| Cinebench R20 / CPU (Multi Core) | |
| Lenovo ThinkPad T14 Gen 6 AMD | |
| Lenovo ThinkPad T14 Gen 6 21QG001VGE | |
| Average Intel Core Ultra 7 258V (3130 - 4314, n=24) | |
| Average of class Tablet (3137 - 4255, n=2, last 2 years) | |
| Dell Latitude 7030 Rugged Extreme | |
| Durabook R10 | |
| Dynabook Portege Z40L-N | |
| Durabook R8 Tablet | |
| Cinebench R20 / CPU (Single Core) | |
| Lenovo ThinkPad T14 Gen 6 AMD | |
| Lenovo ThinkPad T14 Gen 6 21QG001VGE | |
| Average of class Tablet (705 - 739, n=2, last 2 years) | |
| Dynabook Portege Z40L-N | |
| Average Intel Core Ultra 7 258V (643 - 749, n=24) | |
| Durabook R10 | |
| Dell Latitude 7030 Rugged Extreme | |
| Durabook R8 Tablet | |
| Cinebench R15 / CPU Multi 64Bit | |
| Lenovo ThinkPad T14 Gen 6 AMD | |
| Lenovo ThinkPad T14 Gen 6 21QG001VGE | |
| Average Intel Core Ultra 7 258V (1280 - 1656, n=24) | |
| Average of class Tablet (1285 - 1651, n=2, last 2 years) | |
| Dell Latitude 7030 Rugged Extreme | |
| Durabook R10 | |
| Dynabook Portege Z40L-N | |
| Durabook R8 Tablet | |
| Cinebench R15 / CPU Single 64Bit | |
| Average of class Tablet (274 - 299, n=2, last 2 years) | |
| Lenovo ThinkPad T14 Gen 6 21QG001VGE | |
| Average Intel Core Ultra 7 258V (258 - 298, n=24) | |
| Dynabook Portege Z40L-N | |
| Durabook R10 | |
| Dell Latitude 7030 Rugged Extreme | |
| Lenovo ThinkPad T14 Gen 6 AMD | |
| Durabook R8 Tablet | |
| Blender / v2.79 BMW27 CPU | |
| Durabook R8 Tablet | |
| Durabook R10 | |
| Dynabook Portege Z40L-N | |
| Average of class Tablet (337 - 484, n=2, last 2 years) | |
| Dell Latitude 7030 Rugged Extreme | |
| Average Intel Core Ultra 7 258V (315 - 484, n=24) | |
| Lenovo ThinkPad T14 Gen 6 21QG001VGE | |
| Lenovo ThinkPad T14 Gen 6 AMD | |
| 7-Zip 18.03 / 7z b 4 | |
| Lenovo ThinkPad T14 Gen 6 AMD | |
| Lenovo ThinkPad T14 Gen 6 21QG001VGE | |
| Dell Latitude 7030 Rugged Extreme | |
| Average Intel Core Ultra 7 258V (24486 - 36724, n=24) | |
| Average of class Tablet (24486 - 36610, n=2, last 2 years) | |
| Dynabook Portege Z40L-N | |
| Durabook R10 | |
| Durabook R8 Tablet | |
| 7-Zip 18.03 / 7z b 4 -mmt1 | |
| Lenovo ThinkPad T14 Gen 6 AMD | |
| Lenovo ThinkPad T14 Gen 6 21QG001VGE | |
| Dynabook Portege Z40L-N | |
| Average Intel Core Ultra 7 258V (4769 - 5869, n=24) | |
| Average of class Tablet (4769 - 5991, n=2, last 2 years) | |
| Dell Latitude 7030 Rugged Extreme | |
| Durabook R10 | |
| Durabook R8 Tablet | |
| Geekbench 6.7 / Multi-Core | |
| Lenovo ThinkPad T14 Gen 6 AMD | |
| Lenovo ThinkPad T14 Gen 6 21QG001VGE | |
| Average Intel Core Ultra 7 258V (8964 - 11334, n=24) | |
| Dynabook Portege Z40L-N | |
| Durabook R10 | |
| Dell Latitude 7030 Rugged Extreme | |
| Average of class Tablet (1104 - 16544, n=86, last 2 years) | |
| Geekbench 6.7 / Single-Core | |
| Lenovo ThinkPad T14 Gen 6 AMD | |
| Lenovo ThinkPad T14 Gen 6 21QG001VGE | |
| Dynabook Portege Z40L-N | |
| Average Intel Core Ultra 7 258V (2593 - 2795, n=24) | |
| Durabook R10 | |
| Dell Latitude 7030 Rugged Extreme | |
| Average of class Tablet (323 - 4128, n=86, last 2 years) | |
| Geekbench 5.5 / Multi-Core | |
| Lenovo ThinkPad T14 Gen 6 AMD | |
| Lenovo ThinkPad T14 Gen 6 21QG001VGE | |
| Average Intel Core Ultra 7 258V (7574 - 9918, n=24) | |
| Dynabook Portege Z40L-N | |
| Durabook R10 | |
| Dell Latitude 7030 Rugged Extreme | |
| Average of class Tablet (303 - 10522, n=39, last 2 years) | |
| Durabook R8 Tablet | |
| Geekbench 5.5 / Single-Core | |
| Lenovo ThinkPad T14 Gen 6 AMD | |
| Lenovo ThinkPad T14 Gen 6 21QG001VGE | |
| Dynabook Portege Z40L-N | |
| Average Intel Core Ultra 7 258V (1891 - 2046, n=24) | |
| Durabook R10 | |
| Dell Latitude 7030 Rugged Extreme | |
| Durabook R8 Tablet | |
| Average of class Tablet (103 - 2286, n=39, last 2 years) | |
| HWBOT x265 Benchmark v2.2 / 4k Preset | |
| Lenovo ThinkPad T14 Gen 6 AMD | |
| Lenovo ThinkPad T14 Gen 6 21QG001VGE | |
| Average Intel Core Ultra 7 258V (7.11 - 14.2, n=24) | |
| Average of class Tablet (7.11 - 12.9, n=2, last 2 years) | |
| Dynabook Portege Z40L-N | |
| Dell Latitude 7030 Rugged Extreme | |
| Durabook R10 | |
| Durabook R8 Tablet | |
| LibreOffice / 20 Documents To PDF | |
| Durabook R10 | |
| Durabook R8 Tablet | |
| Average of class Tablet (48.3 - 62.8, n=2, last 2 years) | |
| Lenovo ThinkPad T14 Gen 6 AMD | |
| Average Intel Core Ultra 7 258V (41.1 - 62.8, n=24) | |
| Lenovo ThinkPad T14 Gen 6 21QG001VGE | |
| Dell Latitude 7030 Rugged Extreme | |
| Dynabook Portege Z40L-N | |
| R Benchmark 2.5 / Overall mean | |
| Durabook R8 Tablet | |
| Durabook R10 | |
| Dell Latitude 7030 Rugged Extreme | |
| Average of class Tablet (0.4361 - 0.542, n=2, last 2 years) | |
| Dynabook Portege Z40L-N | |
| Average Intel Core Ultra 7 258V (0.443 - 0.542, n=24) | |
| Lenovo ThinkPad T14 Gen 6 21QG001VGE | |
| Lenovo ThinkPad T14 Gen 6 AMD | |
* ... smaller is better
AIDA64: FP32 Ray-Trace | FPU Julia | CPU SHA3 | FPU SinJulia | FPU Mandel | CPU AES | CPU ZLib | FP64 Ray-Trace | CPU PhotoWorxx | CPU CheckMate
| Performance rating | |
| Lenovo ThinkPad T14 Gen 6 AMD | |
| Lenovo ThinkPad T14 Gen 6 21QG001VGE -1! | |
| Average Intel Core Ultra 7 258V | |
| Average of class Tablet | |
| Durabook R10 | |
| Dynabook Portege Z40L-N -1! | |
| Dell Latitude 7030 Rugged Extreme -1! | |
| Durabook R8 Tablet -1! | |
| AIDA64 / FP32 Ray-Trace | |
| Lenovo ThinkPad T14 Gen 6 AMD (v8.20.8100) | |
| Lenovo ThinkPad T14 Gen 6 AMD (v6.92.6600) | |
| Lenovo ThinkPad T14 Gen 6 21QG001VGE (v6.92.6600) | |
| Average Intel Core Ultra 7 258V (8454 - 12781, n=26) | |
| Average of class Tablet (8485 - 12759, n=2, last 2 years) | |
| Dynabook Portege Z40L-N (v6.92.6600) | |
| Durabook R10 (v8.20.8100) | |
| Dell Latitude 7030 Rugged Extreme (v6.92.6600) | |
| Durabook R8 Tablet (v6.85.6300) | |
| AIDA64 / FPU Julia | |
| Lenovo ThinkPad T14 Gen 6 AMD (v8.20.8100) | |
| Lenovo ThinkPad T14 Gen 6 AMD (v6.92.6600) | |
| Lenovo ThinkPad T14 Gen 6 21QG001VGE (v6.92.6600) | |
| Average Intel Core Ultra 7 258V (40875 - 63401, n=26) | |
| Average of class Tablet (42586 - 62102, n=2, last 2 years) | |
| Dynabook Portege Z40L-N (v6.92.6600) | |
| Durabook R10 (v8.20.8100) | |
| Dell Latitude 7030 Rugged Extreme (v6.92.6600) | |
| Durabook R8 Tablet (v6.85.6300) | |
| AIDA64 / CPU SHA3 | |
| Lenovo ThinkPad T14 Gen 6 AMD (v6.92.6600) | |
| Lenovo ThinkPad T14 Gen 6 AMD (v8.20.8100) | |
| Lenovo ThinkPad T14 Gen 6 21QG001VGE (v6.92.6600) | |
| Average Intel Core Ultra 7 258V (1930 - 2817, n=26) | |
| Average of class Tablet (2056 - 2784, n=2, last 2 years) | |
| Durabook R10 (v8.20.8100) | |
| Dynabook Portege Z40L-N (v6.92.6600) | |
| Dell Latitude 7030 Rugged Extreme (v6.92.6600) | |
| Durabook R8 Tablet (v6.85.6300) | |
| AIDA64 / FPU SinJulia | |
| Lenovo ThinkPad T14 Gen 6 AMD (v8.20.8100) | |
| Lenovo ThinkPad T14 Gen 6 AMD (v6.92.6600) | |
| Lenovo ThinkPad T14 Gen 6 21QG001VGE (v6.92.6600) | |
| Average Intel Core Ultra 7 258V (3817 - 4440, n=26) | |
| Average of class Tablet (4083 - 4429, n=2, last 2 years) | |
| Dell Latitude 7030 Rugged Extreme (v6.92.6600) | |
| Durabook R10 (v8.20.8100) | |
| Dynabook Portege Z40L-N (v6.92.6600) | |
| Durabook R8 Tablet (v6.85.6300) | |
| AIDA64 / FPU Mandel | |
| Lenovo ThinkPad T14 Gen 6 AMD (v8.20.8100) | |
| Lenovo ThinkPad T14 Gen 6 AMD (v6.92.6600) | |
| Lenovo ThinkPad T14 Gen 6 21QG001VGE (v6.92.6600) | |
| Average Intel Core Ultra 7 258V (21670 - 33565, n=26) | |
| Average of class Tablet (22775 - 31836, n=2, last 2 years) | |
| Dynabook Portege Z40L-N (v6.92.6600) | |
| Durabook R10 (v8.20.8100) | |
| Dell Latitude 7030 Rugged Extreme (v6.92.6600) | |
| Durabook R8 Tablet (v6.85.6300) | |
| AIDA64 / CPU AES | |
| Lenovo ThinkPad T14 Gen 6 AMD (v6.92.6600) | |
| Lenovo ThinkPad T14 Gen 6 AMD (v8.20.8100) | |
| Lenovo ThinkPad T14 Gen 6 21QG001VGE (v6.92.6600) | |
| Average Intel Core Ultra 7 258V (30957 - 40753, n=26) | |
| Average of class Tablet (34551 - 38941, n=2, last 2 years) | |
| Dell Latitude 7030 Rugged Extreme (v6.92.6600) | |
| Durabook R10 (v8.20.8100) | |
| Dynabook Portege Z40L-N (v6.92.6600) | |
| Durabook R8 Tablet (v6.85.6300) | |
| AIDA64 / CPU ZLib | |
| Lenovo ThinkPad T14 Gen 6 AMD (v6.92.6600) | |
| Lenovo ThinkPad T14 Gen 6 AMD (v8.20.8100) | |
| Lenovo ThinkPad T14 Gen 6 21QG001VGE (v6.92.6600) | |
| Dell Latitude 7030 Rugged Extreme (v6.92.6600) | |
| Average Intel Core Ultra 7 258V (422 - 632, n=26) | |
| Average of class Tablet (434 - 631, n=2, last 2 years) | |
| Dynabook Portege Z40L-N (v6.92.6600) | |
| Durabook R10 (v8.20.8100) | |
| Durabook R8 Tablet (v6.85.6300) | |
| AIDA64 / FP64 Ray-Trace | |
| Lenovo ThinkPad T14 Gen 6 AMD (v6.92.6600) | |
| Lenovo ThinkPad T14 Gen 6 AMD (v8.20.8100) | |
| Lenovo ThinkPad T14 Gen 6 21QG001VGE (v6.92.6600) | |
| Average Intel Core Ultra 7 258V (4258 - 6930, n=26) | |
| Average of class Tablet (4660 - 6803, n=2, last 2 years) | |
| Dynabook Portege Z40L-N (v6.92.6600) | |
| Durabook R10 (v8.20.8100) | |
| Dell Latitude 7030 Rugged Extreme (v6.92.6600) | |
| Durabook R8 Tablet (v6.85.6300) | |
| AIDA64 / CPU PhotoWorxx | |
| Lenovo ThinkPad T14 Gen 6 21QG001VGE (v6.92.6600) | |
| Average of class Tablet (52755 - 54886, n=2, last 2 years) | |
| Average Intel Core Ultra 7 258V (44223 - 59245, n=26) | |
| Durabook R10 (v8.20.8100) | |
| Dynabook Portege Z40L-N (v6.92.6600) | |
| Dell Latitude 7030 Rugged Extreme (v6.92.6600) | |
| Lenovo ThinkPad T14 Gen 6 AMD (v8.20.8100) | |
| Lenovo ThinkPad T14 Gen 6 AMD (v6.92.6600) | |
| Durabook R8 Tablet (v6.85.6300) | |
| AIDA64 / CPU CheckMate | |
| Lenovo ThinkPad T14 Gen 6 AMD (v8.20.8100) | |
| Average Intel Core Ultra 7 258V (2014 - 2513, n=2) | |
| Durabook R10 (v8.20.8100) | |
| Average of class Tablet (n=1last 2 years) | |
System and Storage Performance
In everyday use, the platform ensures smooth performance for Office tasks. However, when looking at benchmark scores, the tablet’s performance is generally below average for Lunar Lake. Only in terms of storage speed does the tablet shine, delivering the strong performance typical of Lunar Lake.
PCMark 10: Score | Essentials | Productivity | Digital Content Creation
CrossMark: Overall | Productivity | Creativity | Responsiveness
WebXPRT 3: Overall
WebXPRT 4: Overall
Mozilla Kraken 1.1: Total
| Performance rating | |
| Lenovo ThinkPad T14 Gen 6 AMD | |
| Lenovo ThinkPad T14 Gen 6 21QG001VGE | |
| Average Intel Core Ultra 7 258V, Intel Arc Graphics 140V | |
| Dynabook Portege Z40L-N | |
| Durabook R10 | |
| Dell Latitude 7030 Rugged Extreme | |
| Average of class Tablet | |
| Durabook R8 Tablet | |
| PCMark 10 / Score | |
| Durabook R10 | |
| Lenovo ThinkPad T14 Gen 6 21QG001VGE | |
| Average of class Tablet (6924 - 7420, n=2, last 2 years) | |
| Lenovo ThinkPad T14 Gen 6 AMD | |
| Average Intel Core Ultra 7 258V, Intel Arc Graphics 140V (6265 - 7420, n=23) | |
| Dynabook Portege Z40L-N | |
| Dell Latitude 7030 Rugged Extreme | |
| Durabook R8 Tablet | |
| PCMark 10 / Essentials | |
| Lenovo ThinkPad T14 Gen 6 AMD | |
| Lenovo ThinkPad T14 Gen 6 21QG001VGE | |
| Average Intel Core Ultra 7 258V, Intel Arc Graphics 140V (9295 - 11467, n=23) | |
| Dynabook Portege Z40L-N | |
| Average of class Tablet (9991 - 10351, n=2, last 2 years) | |
| Durabook R10 | |
| Dell Latitude 7030 Rugged Extreme | |
| Durabook R8 Tablet | |
| PCMark 10 / Productivity | |
| Durabook R10 | |
| Average of class Tablet (8823 - 13600, n=2, last 2 years) | |
| Lenovo ThinkPad T14 Gen 6 AMD | |
| Dynabook Portege Z40L-N | |
| Lenovo ThinkPad T14 Gen 6 21QG001VGE | |
| Average Intel Core Ultra 7 258V, Intel Arc Graphics 140V (7357 - 13600, n=23) | |
| Dell Latitude 7030 Rugged Extreme | |
| Durabook R8 Tablet | |
| PCMark 10 / Digital Content Creation | |
| Lenovo ThinkPad T14 Gen 6 21QG001VGE | |
| Average Intel Core Ultra 7 258V, Intel Arc Graphics 140V (8160 - 10308, n=23) | |
| Average of class Tablet (8160 - 9863, n=2, last 2 years) | |
| Dynabook Portege Z40L-N | |
| Lenovo ThinkPad T14 Gen 6 AMD | |
| Durabook R10 | |
| Dell Latitude 7030 Rugged Extreme | |
| Durabook R8 Tablet | |
| CrossMark / Overall | |
| Lenovo ThinkPad T14 Gen 6 AMD | |
| Lenovo ThinkPad T14 Gen 6 21QG001VGE | |
| Average Intel Core Ultra 7 258V, Intel Arc Graphics 140V (1275 - 1742, n=22) | |
| Dynabook Portege Z40L-N | |
| Dell Latitude 7030 Rugged Extreme | |
| Durabook R10 | |
| Durabook R8 Tablet | |
| Average of class Tablet (319 - 2375, n=46, last 2 years) | |
| CrossMark / Productivity | |
| Lenovo ThinkPad T14 Gen 6 AMD | |
| Lenovo ThinkPad T14 Gen 6 21QG001VGE | |
| Average Intel Core Ultra 7 258V, Intel Arc Graphics 140V (1267 - 1684, n=22) | |
| Dynabook Portege Z40L-N | |
| Dell Latitude 7030 Rugged Extreme | |
| Durabook R10 | |
| Durabook R8 Tablet | |
| Average of class Tablet (346 - 2036, n=44, last 2 years) | |
| CrossMark / Creativity | |
| Lenovo ThinkPad T14 Gen 6 AMD | |
| Lenovo ThinkPad T14 Gen 6 21QG001VGE | |
| Average Intel Core Ultra 7 258V, Intel Arc Graphics 140V (1393 - 1977, n=22) | |
| Dynabook Portege Z40L-N | |
| Dell Latitude 7030 Rugged Extreme | |
| Durabook R10 | |
| Durabook R8 Tablet | |
| Average of class Tablet (288 - 2620, n=44, last 2 years) | |
| CrossMark / Responsiveness | |
| Average of class Tablet (333 - 12671, n=44, last 2 years) | |
| Lenovo ThinkPad T14 Gen 6 AMD | |
| Lenovo ThinkPad T14 Gen 6 21QG001VGE | |
| Average Intel Core Ultra 7 258V, Intel Arc Graphics 140V (999 - 1411, n=22) | |
| Dynabook Portege Z40L-N | |
| Dell Latitude 7030 Rugged Extreme | |
| Durabook R10 | |
| Durabook R8 Tablet | |
| WebXPRT 3 / Overall | |
| Lenovo ThinkPad T14 Gen 6 AMD | |
| Dynabook Portege Z40L-N | |
| Lenovo ThinkPad T14 Gen 6 21QG001VGE | |
| Average Intel Core Ultra 7 258V, Intel Arc Graphics 140V (219 - 317, n=22) | |
| Durabook R10 | |
| Dell Latitude 7030 Rugged Extreme | |
| Average of class Tablet (108 - 480, n=10, last 2 years) | |
| Durabook R8 Tablet | |
| WebXPRT 4 / Overall | |
| Dynabook Portege Z40L-N | |
| Lenovo ThinkPad T14 Gen 6 21QG001VGE | |
| Lenovo ThinkPad T14 Gen 6 AMD | |
| Average Intel Core Ultra 7 258V, Intel Arc Graphics 140V (199.5 - 291, n=22) | |
| Durabook R10 | |
| Dell Latitude 7030 Rugged Extreme | |
| Durabook R8 Tablet | |
| Average of class Tablet (39 - 376, n=56, last 2 years) | |
| Mozilla Kraken 1.1 / Total | |
| Average of class Tablet (243 - 27101, n=66, last 2 years) | |
| Durabook R8 Tablet | |
| Dell Latitude 7030 Rugged Extreme | |
| Durabook R10 | |
| Average Intel Core Ultra 7 258V, Intel Arc Graphics 140V (468 - 559, n=24) | |
| Lenovo ThinkPad T14 Gen 6 21QG001VGE | |
| Dynabook Portege Z40L-N | |
| Lenovo ThinkPad T14 Gen 6 AMD | |
* ... smaller is better
| PCMark 10 Score | 7420 points | |
Help | ||
| AIDA64 / Memory Copy | |
| Durabook R10 | |
| Lenovo ThinkPad T14 Gen 6 21QG001VGE | |
| Average of class Tablet (108317 - 110050, n=2, last 2 years) | |
| Average Intel Core Ultra 7 258V (104408 - 114336, n=24) | |
| Dynabook Portege Z40L-N | |
| Dell Latitude 7030 Rugged Extreme | |
| Lenovo ThinkPad T14 Gen 6 AMD | |
| Lenovo ThinkPad T14 Gen 6 AMD | |
| Durabook R8 Tablet | |
| AIDA64 / Memory Read | |
| Lenovo ThinkPad T14 Gen 6 21QG001VGE | |
| Average Intel Core Ultra 7 258V (82846 - 89417, n=24) | |
| Dynabook Portege Z40L-N | |
| Average of class Tablet (85395 - 87747, n=2, last 2 years) | |
| Durabook R10 | |
| Dell Latitude 7030 Rugged Extreme | |
| Lenovo ThinkPad T14 Gen 6 AMD | |
| Lenovo ThinkPad T14 Gen 6 AMD | |
| Durabook R8 Tablet | |
| AIDA64 / Memory Write | |
| Lenovo ThinkPad T14 Gen 6 21QG001VGE | |
| Average Intel Core Ultra 7 258V (108824 - 117989, n=24) | |
| Average of class Tablet (108824 - 117859, n=2, last 2 years) | |
| Dynabook Portege Z40L-N | |
| Durabook R10 | |
| Dell Latitude 7030 Rugged Extreme | |
| Lenovo ThinkPad T14 Gen 6 AMD | |
| Lenovo ThinkPad T14 Gen 6 AMD | |
| Durabook R8 Tablet | |
| AIDA64 / Memory Latency | |
| Dell Latitude 7030 Rugged Extreme | |
| Lenovo ThinkPad T14 Gen 6 AMD | |
| Lenovo ThinkPad T14 Gen 6 AMD | |
| Durabook R8 Tablet | |
| Durabook R10 | |
| Dynabook Portege Z40L-N | |
| Lenovo ThinkPad T14 Gen 6 21QG001VGE | |
| Average of class Tablet (94.4 - 101.7, n=2, last 2 years) | |
| Average Intel Core Ultra 7 258V (95 - 101.7, n=24) | |
* ... smaller is better
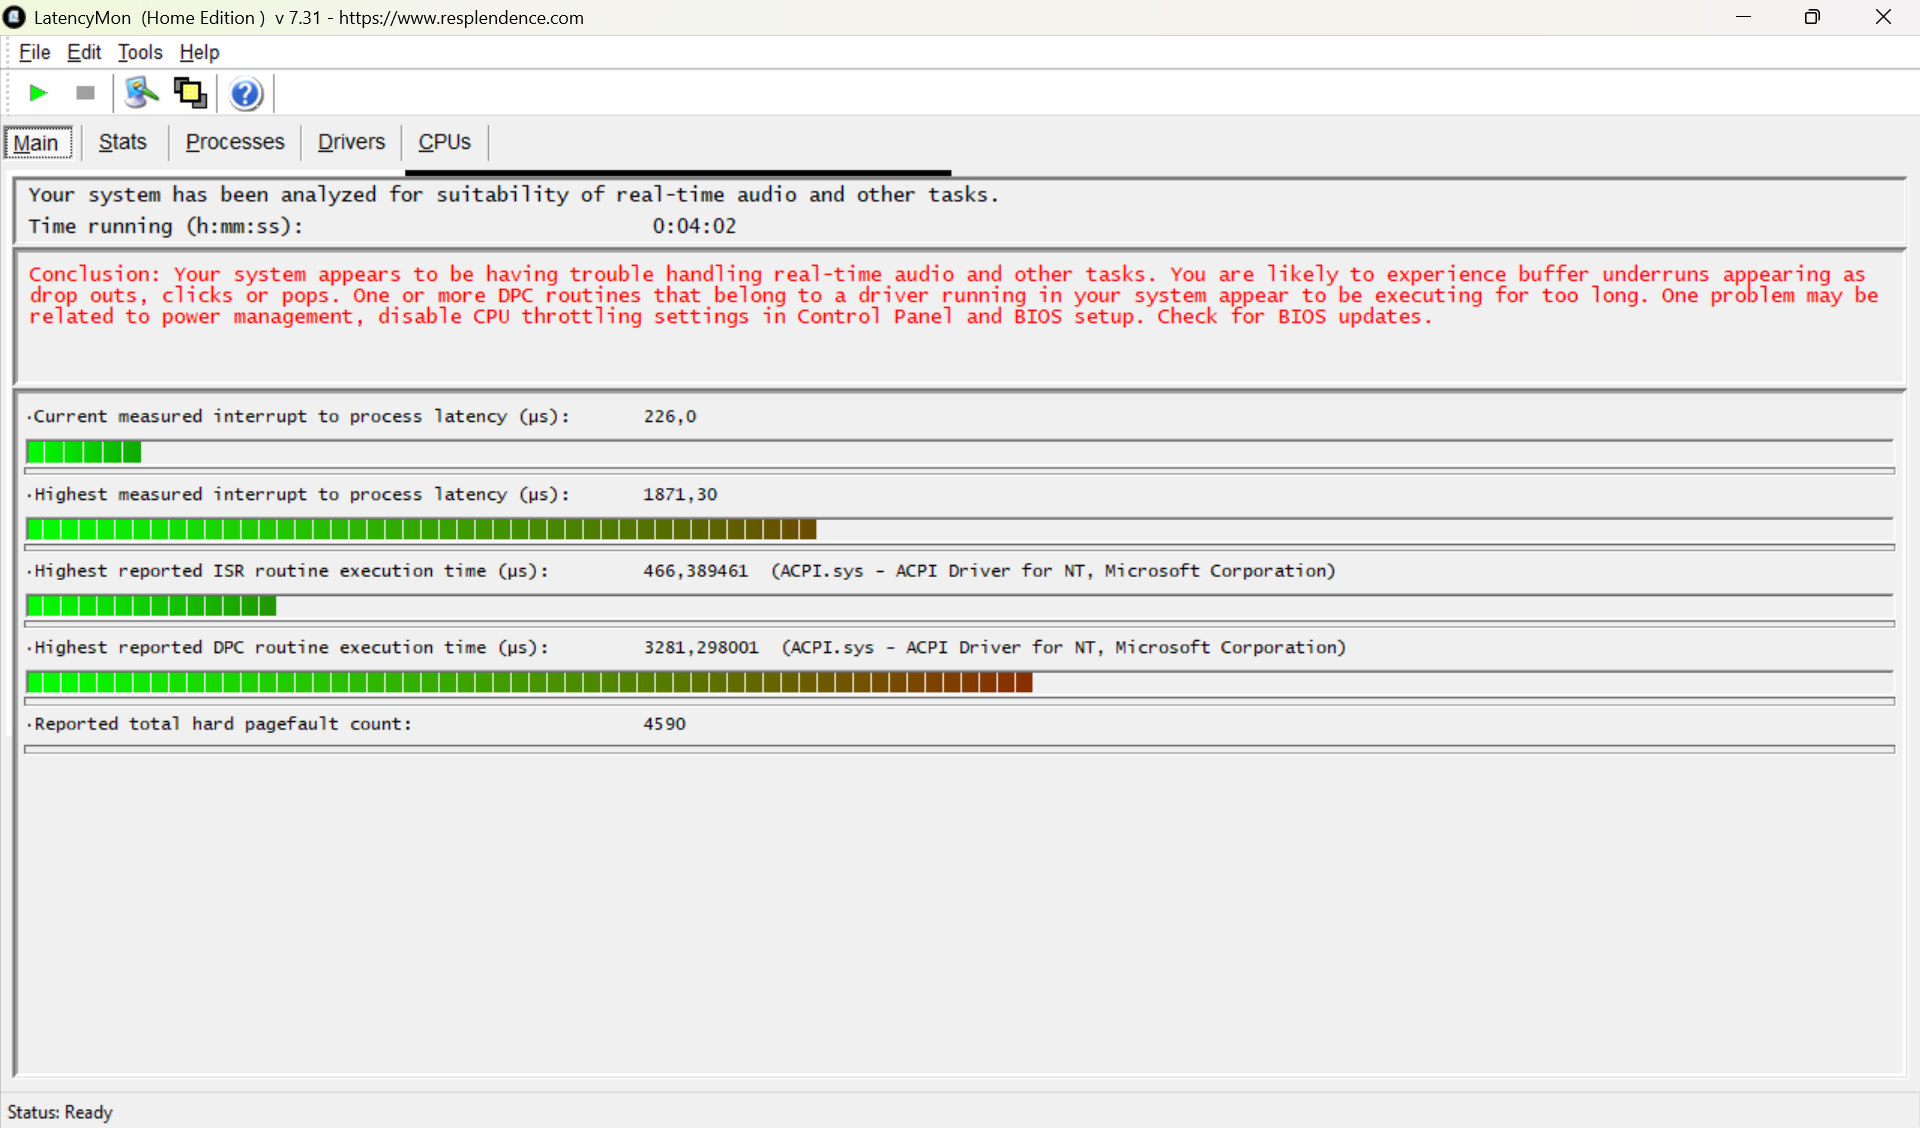
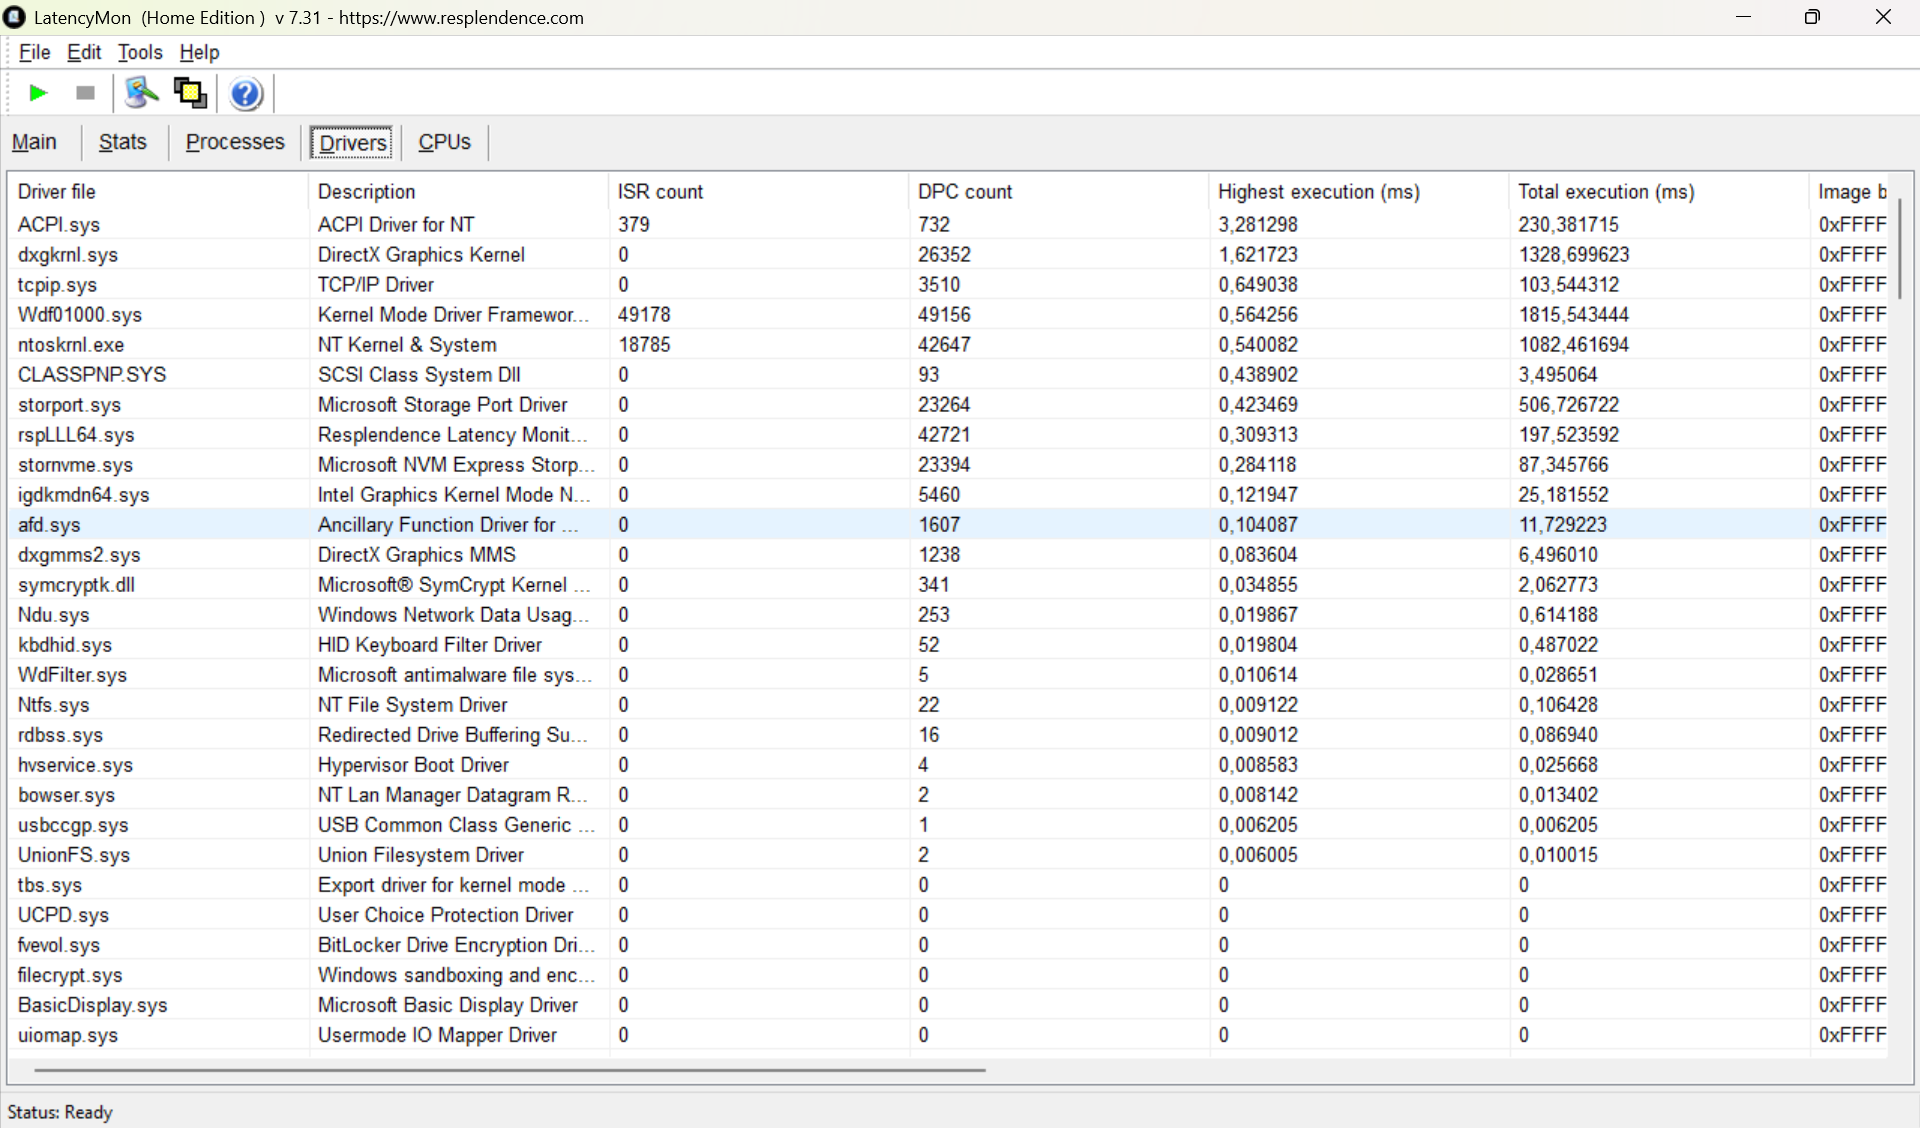
DPC Latencies
The LatencyMon analysis tool shows that the ACPI driver causes delays of up to 3,281 microseconds on the tablet. This can lead to glitches during time-sensitive tasks such as audio editing or high-frequency data acquisition.
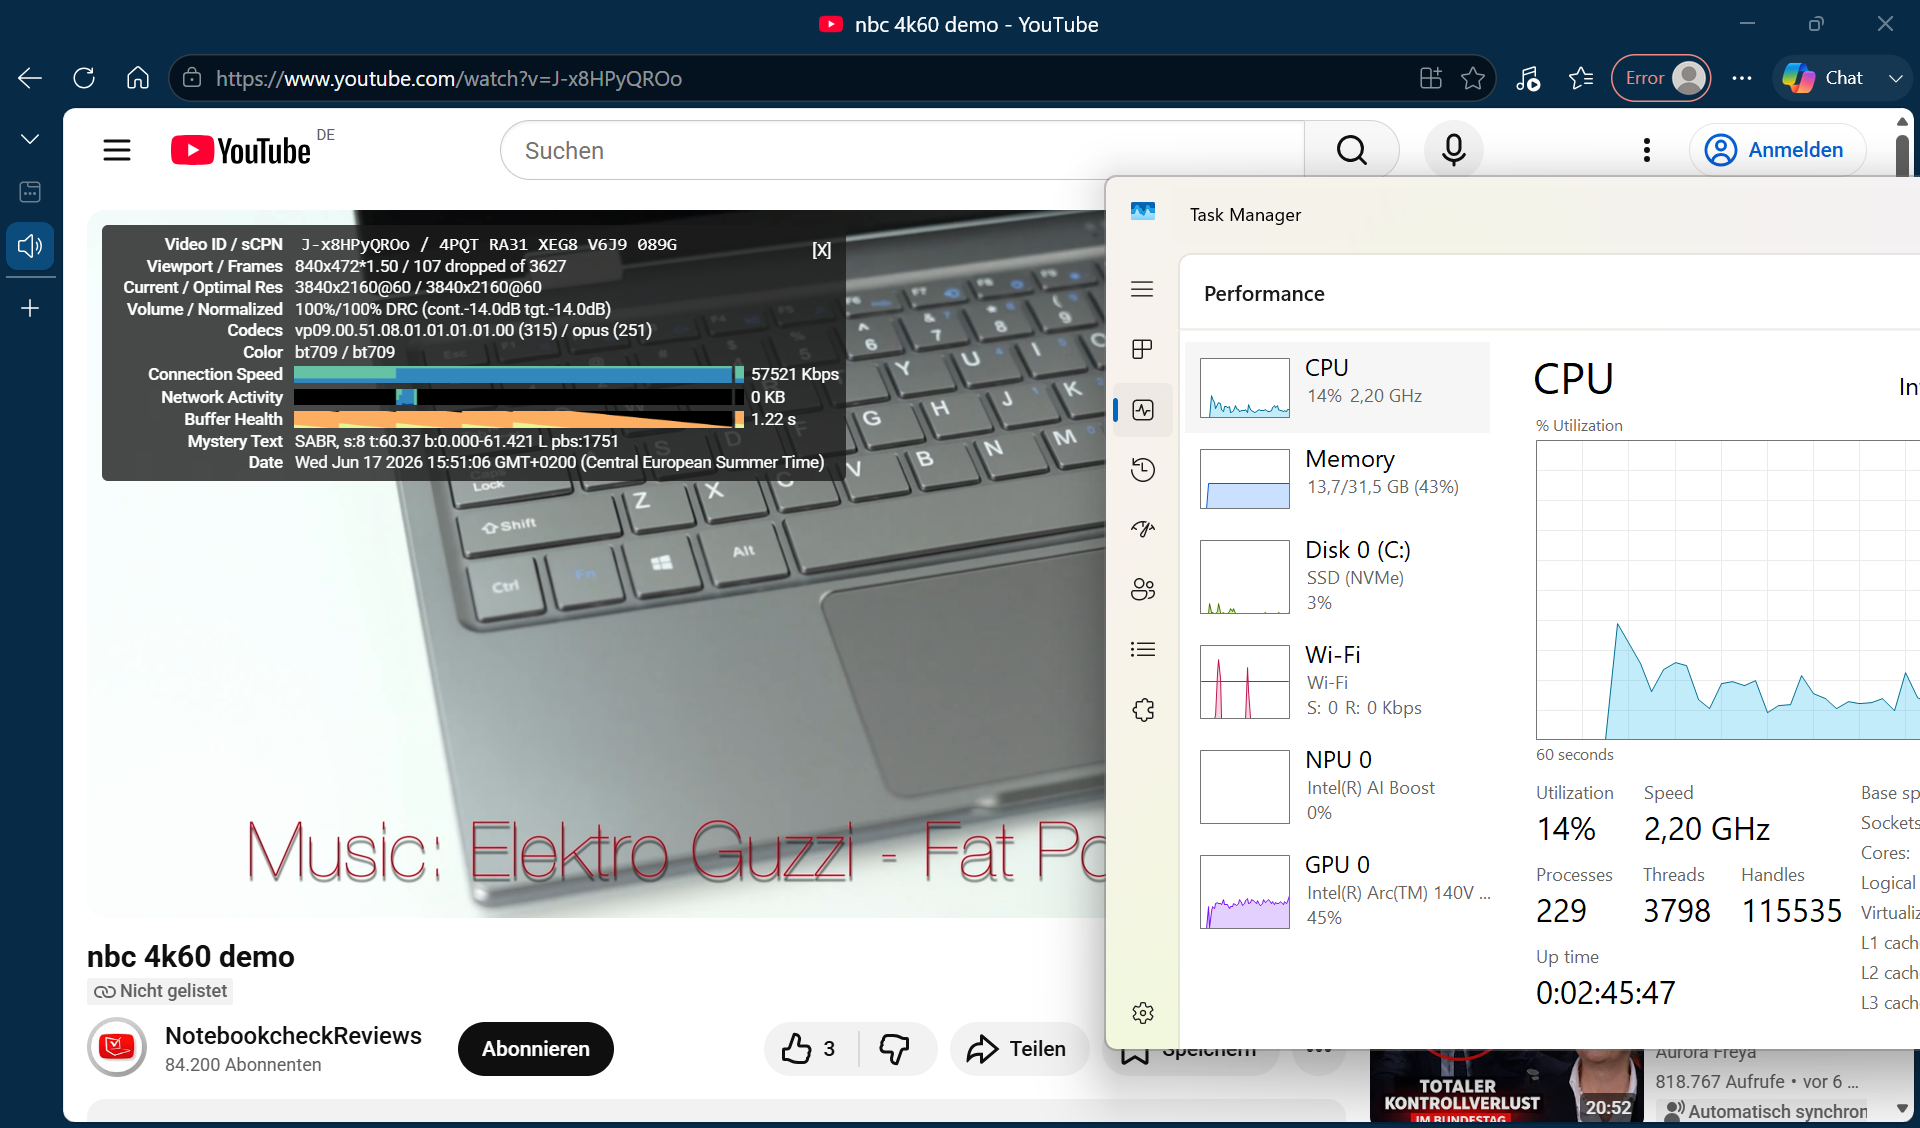
| DPC Latencies / LatencyMon - interrupt to process latency (max), Web, Youtube, Prime95 | |
| Durabook R10 | |
| Dell Latitude 7030 Rugged Extreme | |
| Durabook R8 Tablet | |
| Lenovo ThinkPad T14 Gen 6 21QG001VGE | |
| Dynabook Portege Z40L-N | |
| Average of class Tablet (482 - 1871, n=2, last 2 years) | |
* ... smaller is better
Mass Storage

* ... smaller is better
Sustained Read Performance: DiskSpd Read Loop, Queue Depth 8
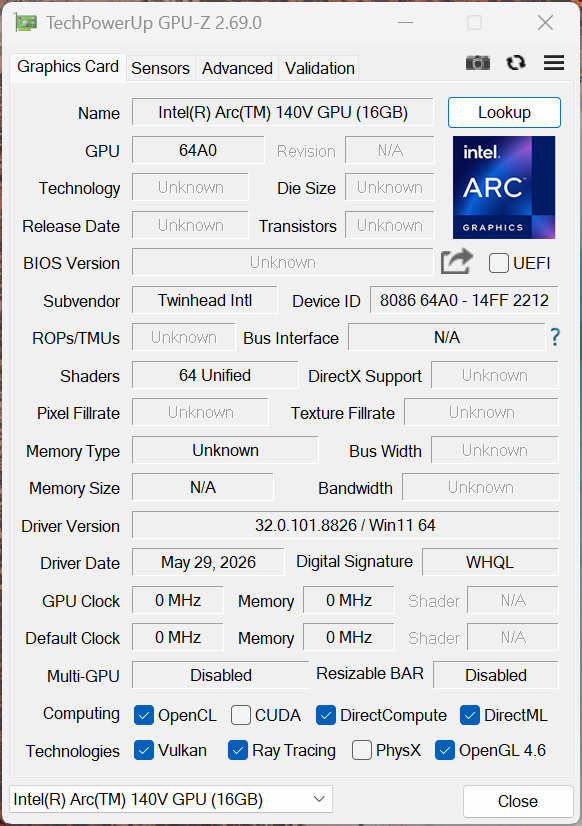
GPU and Gaming Performance
Graphics processing is handled by the Intel Arc Graphics 140V, which is integrated into the processor. It handles high-resolution videos, light 3D tasks, and multi-monitor setups with ease. However, large CAD files or graphically demanding applications can pose a challenge for the Intel graphics.
| 3DMark 11 Performance | 9563 points | |
| 3DMark Ice Storm Standard Score | 178031 points | |
| 3DMark Cloud Gate Standard Score | 26729 points | |
| 3DMark Fire Strike Score | 7287 points | |
| 3DMark Time Spy Score | 3373 points | |
| 3DMark Steel Nomad Score | 743 points | |
| 3DMark Steel Nomad Light Score | 2843 points | |
Help | ||
* ... smaller is better
| Performance rating - Percent | |
| Lenovo ThinkPad T14 Gen 6 21QG001VGE -1! | |
| Average of class Tablet | |
| Dynabook Portege Z40L-N | |
| Durabook R10 | |
| Lenovo ThinkPad T14 Gen 6 AMD -1! | |
| Dell Latitude 7030 Rugged Extreme -1! | |
| Durabook R8 Tablet -5! | |
| Cyberpunk 2077 - 1920x1080 Ultra Preset (FSR off) | |
| Lenovo ThinkPad T14 Gen 6 21QG001VGE | |
| Average of class Tablet (21.2 - 28.7, n=2, last 2 years) | |
| Durabook R10 | |
| Dynabook Portege Z40L-N | |
| Lenovo ThinkPad T14 Gen 6 AMD | |
| Dell Latitude 7030 Rugged Extreme | |
| Baldur's Gate 3 - 1920x1080 Ultra Preset AA:T | |
| Lenovo ThinkPad T14 Gen 6 21QG001VGE | |
| Average of class Tablet (22.8 - 28.3, n=2, last 2 years) | |
| Dynabook Portege Z40L-N | |
| Durabook R10 | |
| Lenovo ThinkPad T14 Gen 6 AMD | |
| GTA V - 1920x1080 Highest AA:4xMSAA + FX AF:16x | |
| Lenovo ThinkPad T14 Gen 6 21QG001VGE | |
| Average of class Tablet (21.1 - 27.8, n=2, last 2 years) | |
| Dynabook Portege Z40L-N | |
| Durabook R10 | |
| Lenovo ThinkPad T14 Gen 6 AMD | |
| Dell Latitude 7030 Rugged Extreme | |
| Final Fantasy XV Benchmark - 1920x1080 High Quality | |
| Lenovo ThinkPad T14 Gen 6 21QG001VGE | |
| Average of class Tablet (25.4 - 34.4, n=3, last 2 years) | |
| Durabook R10 | |
| Durabook R10 | |
| Dynabook Portege Z40L-N | |
| Lenovo ThinkPad T14 Gen 6 AMD | |
| Dell Latitude 7030 Rugged Extreme | |
| Strange Brigade - 1920x1080 ultra AA:ultra AF:16 | |
| Average of class Tablet (44.4 - 58, n=2, last 2 years) | |
| Dynabook Portege Z40L-N | |
| Durabook R10 | |
| Dell Latitude 7030 Rugged Extreme | |
| Dota 2 Reborn - 1920x1080 ultra (3/3) best looking | |
| Lenovo ThinkPad T14 Gen 6 21QG001VGE | |
| Average of class Tablet (70.9 - 84.5, n=2, last 2 years) | |
| Durabook R10 | |
| Dynabook Portege Z40L-N | |
| Dell Latitude 7030 Rugged Extreme | |
| Lenovo ThinkPad T14 Gen 6 AMD | |
| Durabook R8 Tablet | |
Cyberpunk 2077 Ultra FPS Chart
| low | med. | high | ultra | |
|---|---|---|---|---|
| GTA V (2015) | 128.8 | 125.6 | 50.7 | 21.1 |
| Dota 2 Reborn (2015) | 92.5 | 75 | 51.7 | 70.9 |
| Final Fantasy XV Benchmark (2018) | 63.8 | 35.9 | 25.4 | |
| X-Plane 11.11 (2018) | 34.5 | 31.4 | 30.1 | |
| Strange Brigade (2018) | 161.3 | 52.1 | 52.9 | 44.4 |
| Baldur's Gate 3 (2023) | 34.1 | 24.9 | 22.8 | |
| Cyberpunk 2077 (2023) | 37.9 | 21.2 | ||
| F1 24 (2024) | 40.4 | 14.6 | ||
| F1 25 (2025) | 55.8 | 48.6 | 34.9 |
Emissions & Energy
Noise Emissions
The internal fan runs almost continuously. While it remains nearly inaudible when the system is idle, it doesn't get very loud even during a stress test, registering at 31 dB(A). However, this quiet hum is completely drowned out when the device is used outdoors.
Noise level
| Idle |
| 27.7 / 27.7 / 27.7 dB(A) |
| Load |
| / 31.6 dB(A) |
 | ||
30 dB silent 40 dB(A) audible 50 dB(A) loud |
||
min: | ||
| Durabook R10 Core Ultra 7 258V, Arc 140V | Dell Latitude 7030 Rugged Extreme i7-1260U, Iris Xe G7 96EUs | Lenovo ThinkPad T14 Gen 6 21QG001VGE Core Ultra 7 258V, Arc 140V | Dynabook Portege Z40L-N Core Ultra 7 258V, Arc 140V | Durabook R8 Tablet i5-1230U, Iris Xe G7 80EUs | Lenovo ThinkPad T14 Gen 6 AMD Ryzen AI 7 PRO 350, Radeon 860M | |
|---|---|---|---|---|---|---|
| Noise | -1% | 0% | 6% | 7% | ||
| off / environment * (dB) | 25.9 | 23 11% | 25.1 3% | 23.5 9% | 24.5 5% | |
| Idle Minimum * (dB) | 27.7 | 23.5 15% | 25.1 9% | 23.6 15% | 24.5 12% | |
| Idle Average * (dB) | 27.7 | 23.5 15% | 25.1 9% | 23.6 15% | 24.5 12% | |
| Idle Maximum * (dB) | 27.7 | 23.5 15% | 27.1 2% | 23.6 15% | 24.5 12% | |
| Load Maximum * (dB) | 31.6 | 50.6 -60% | 38.5 -22% | 39 -23% | 33.7 -7% | |
| Load Average * (dB) | 24.1 | 34.8 | 37 | 26.8 | ||
| Cyberpunk 2077 ultra * (dB) | 50.5 | 38.3 | 37.8 | 35.3 |
* ... smaller is better
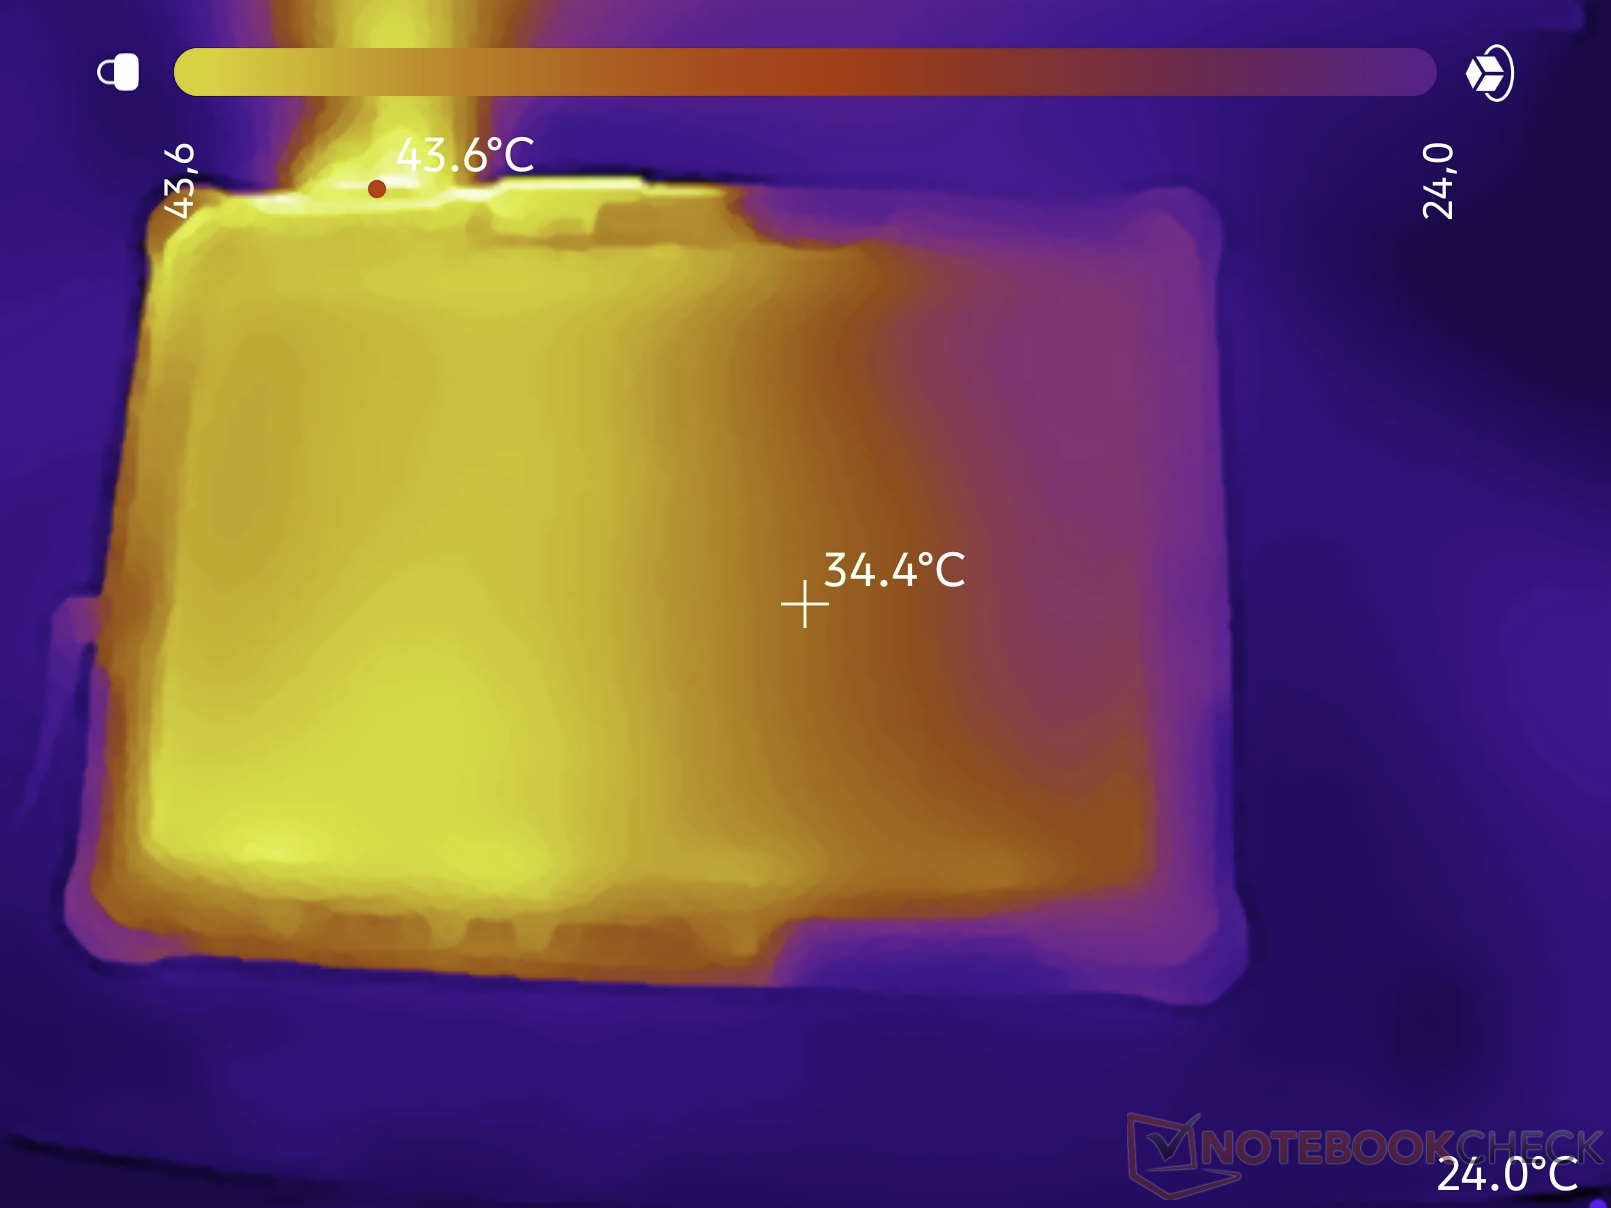
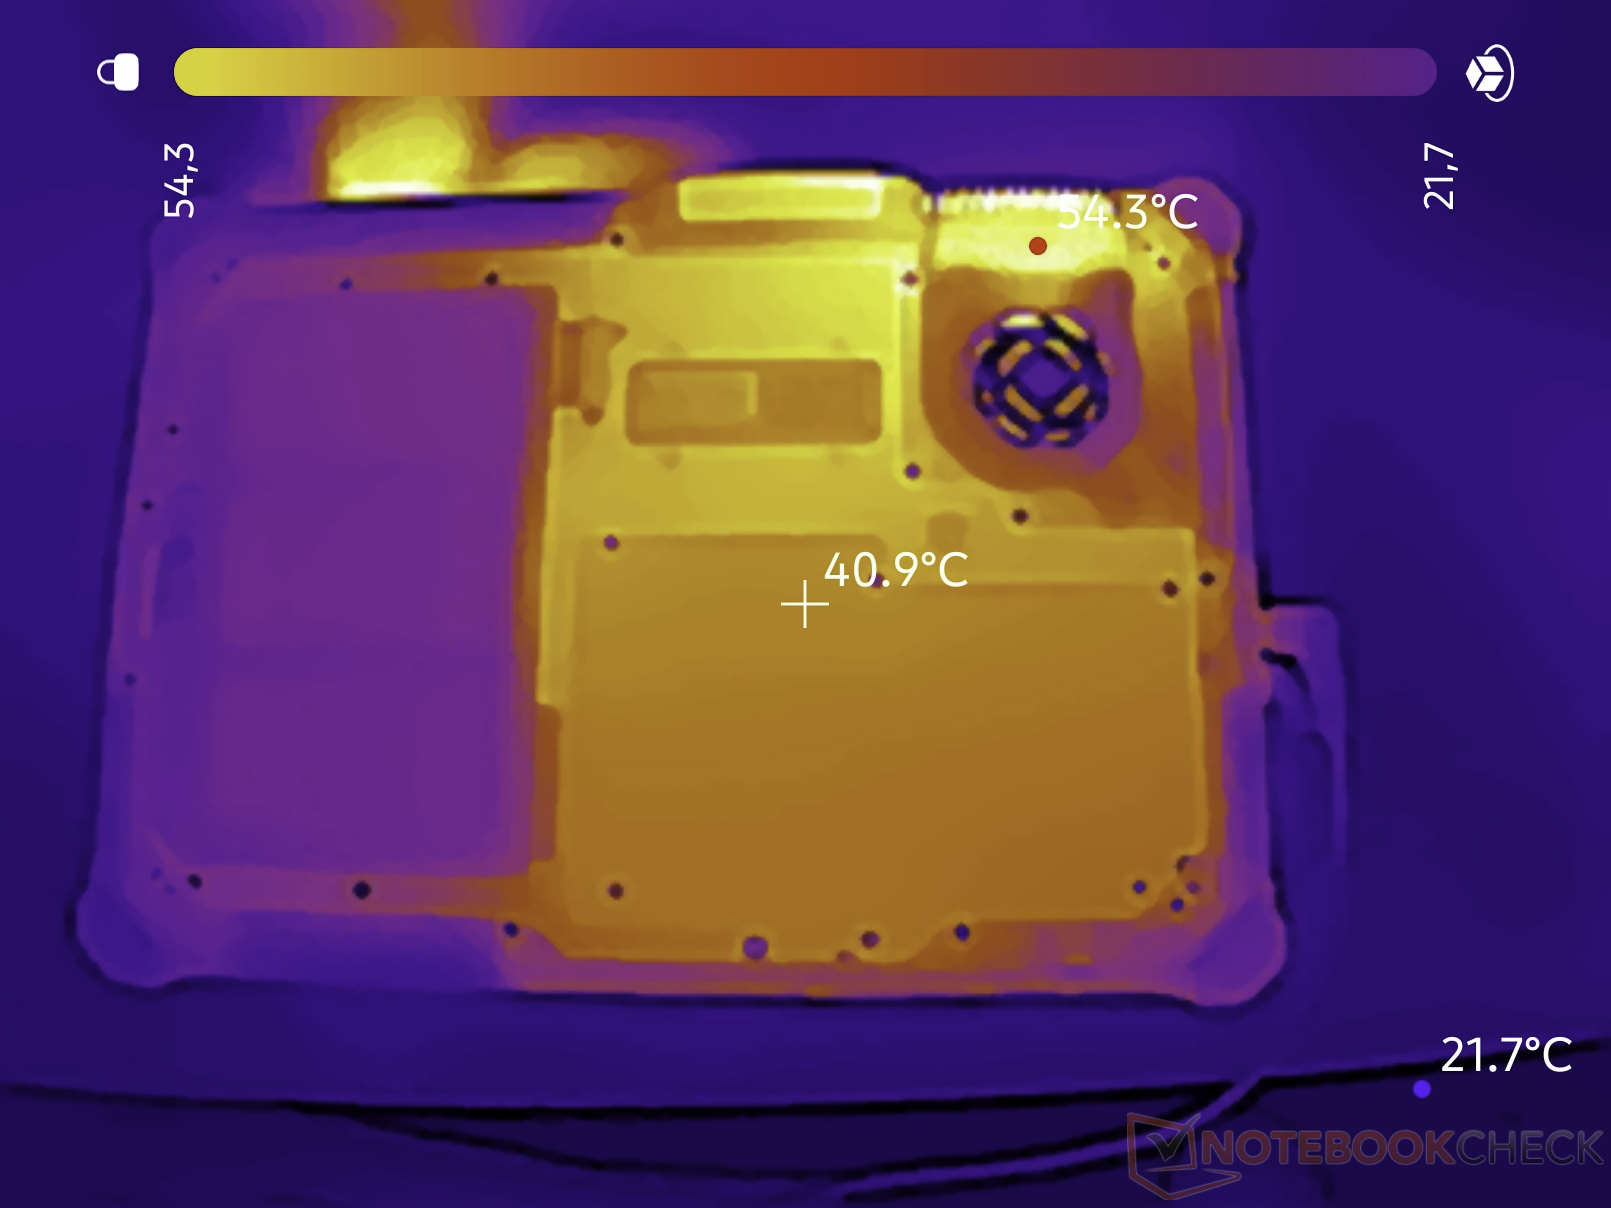
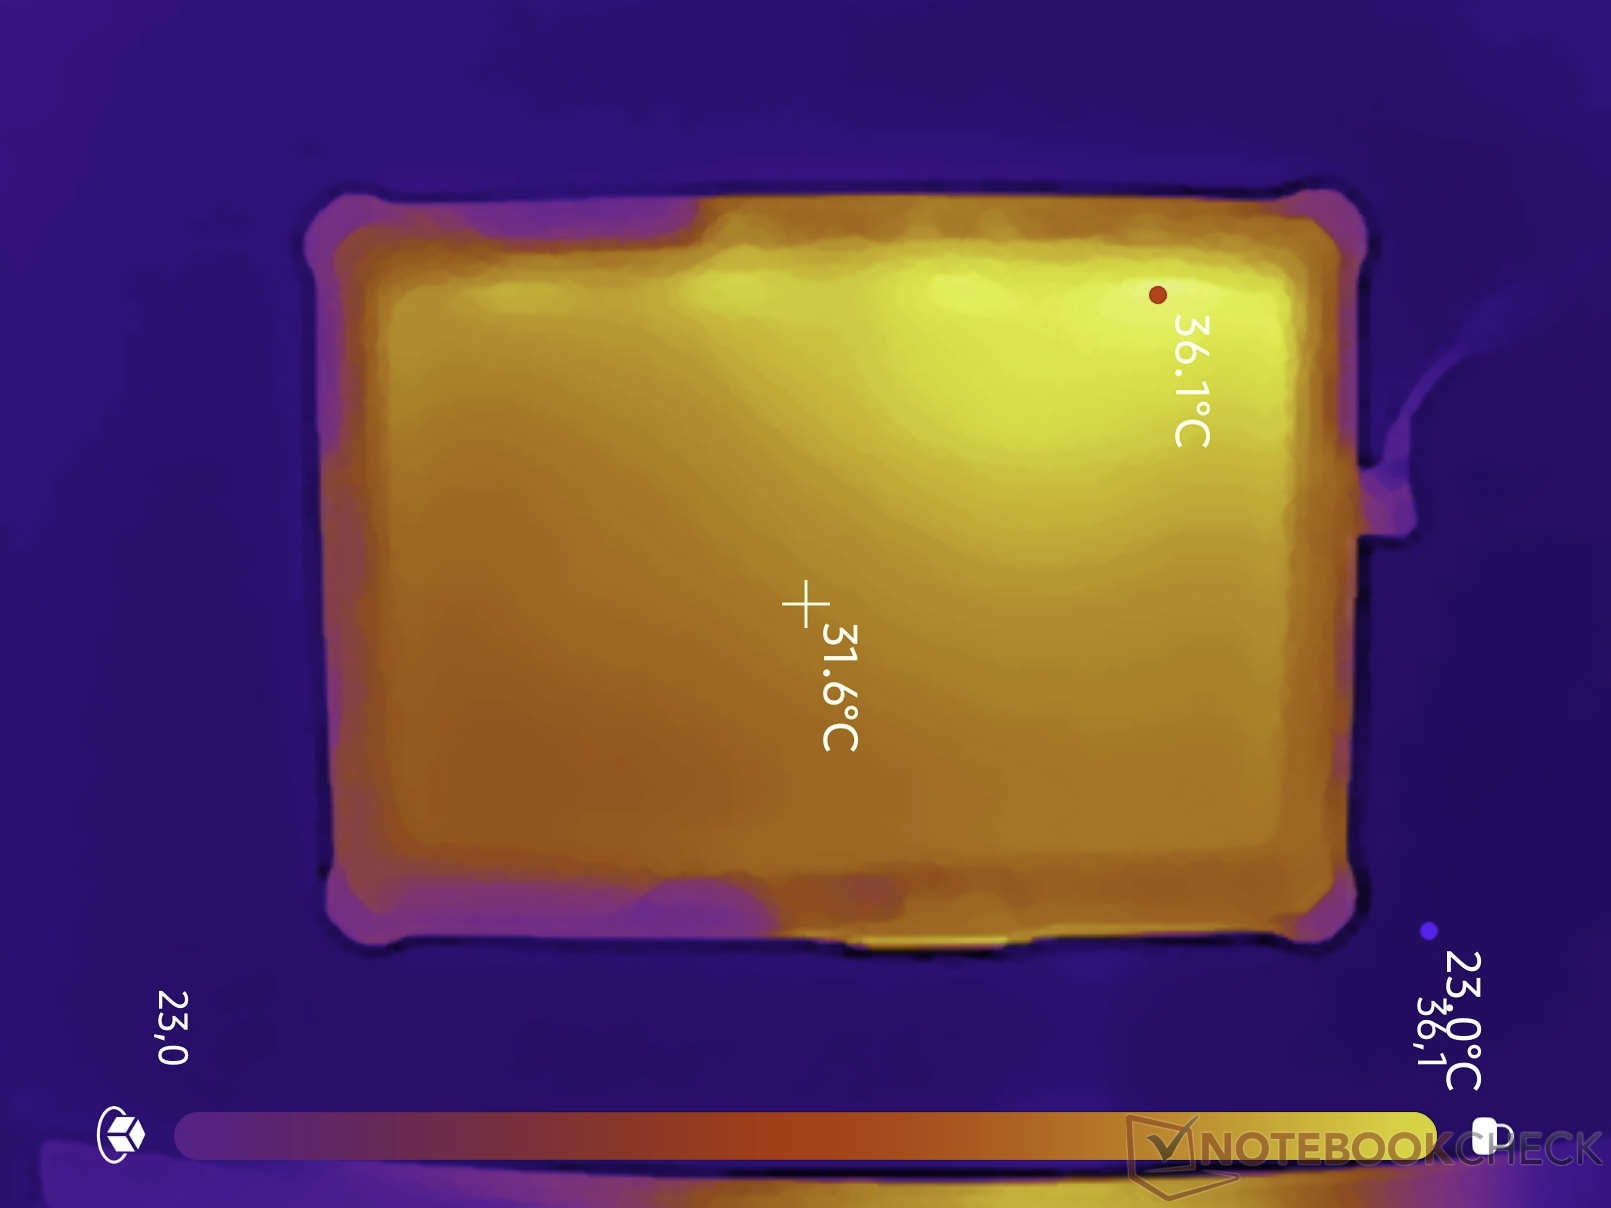
Temperature
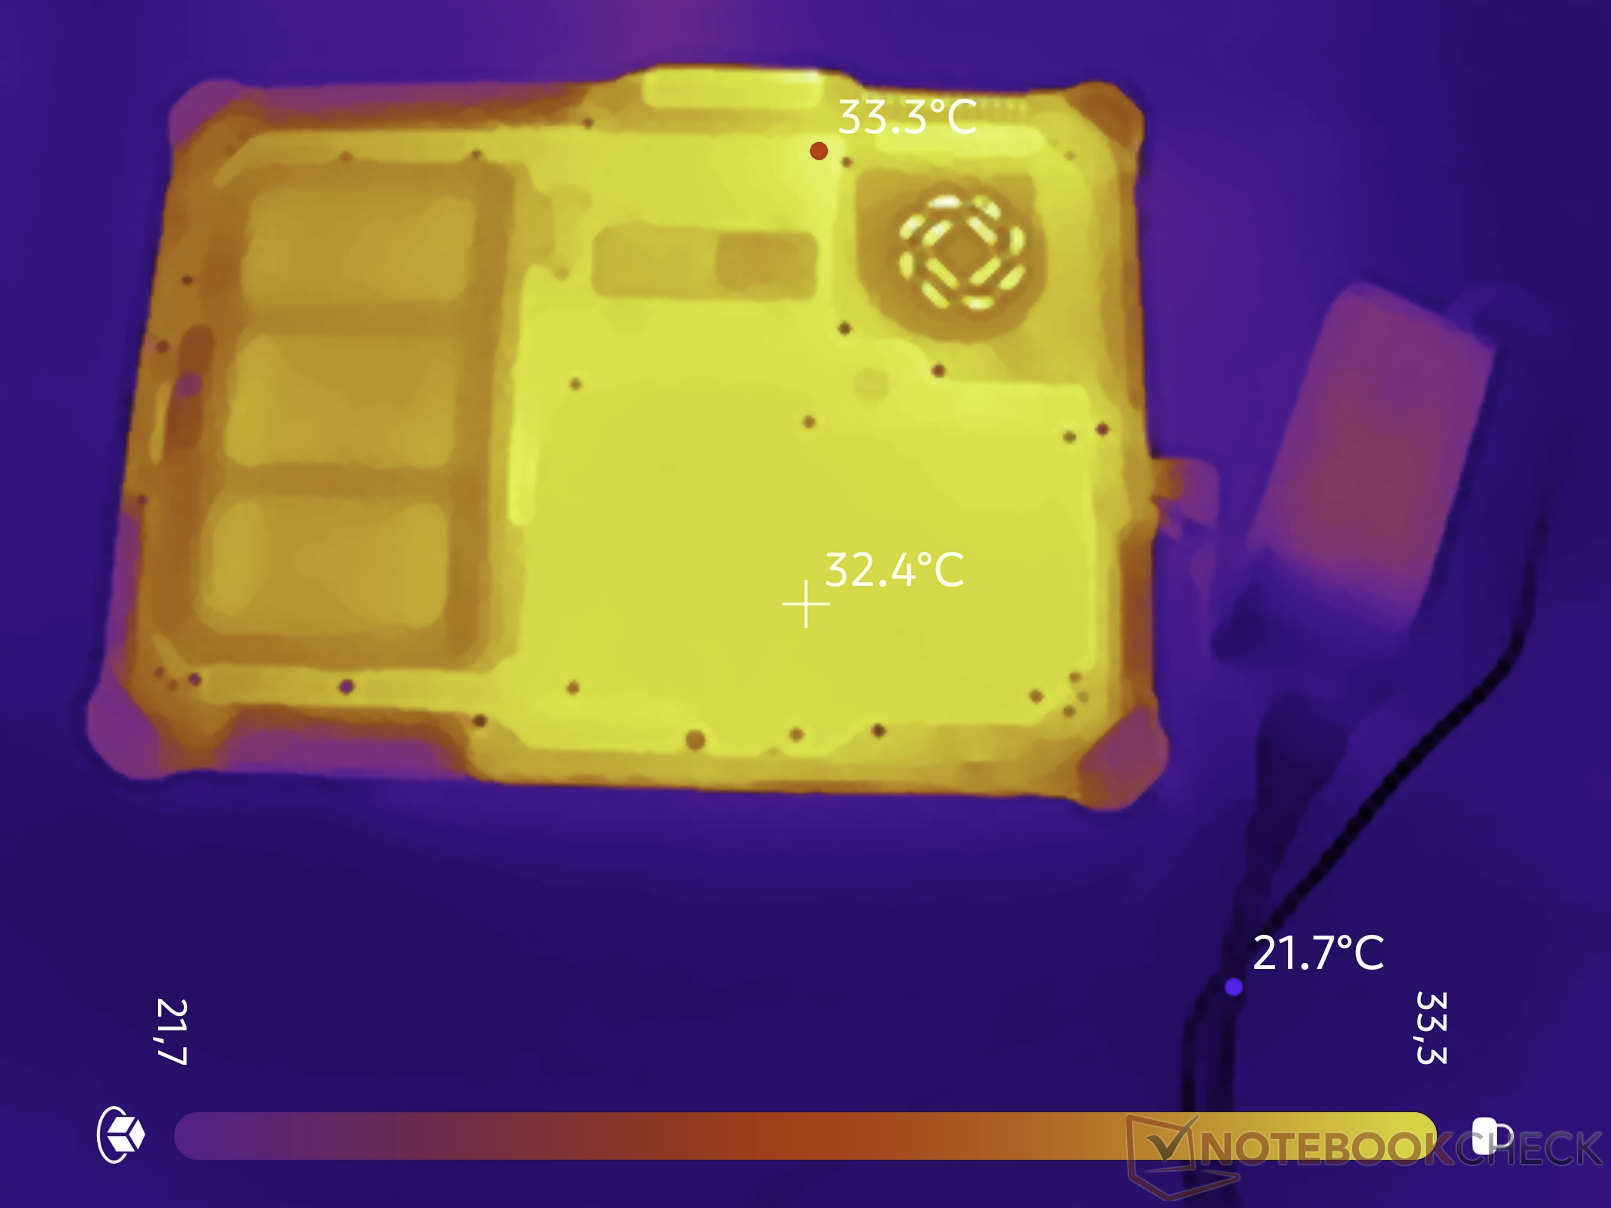
The cooling system performs exceptionally well. During the stress test, the tablet only reaches temperatures above 40 °C (104 °F) in a few spots. The rest of the solid chassis remains at a comfortable temperature.
(±) The maximum temperature on the upper side is 43.6 °C / 110 F, compared to the average of 33.6 °C / 92 F, ranging from 20.7 to 53.2 °C for the class Tablet.
(±) The bottom heats up to a maximum of 40 °C / 104 F, compared to the average of 33.2 °C / 92 F
(±) In idle usage, the average temperature for the upper side is 33.3 °C / 92 F, compared to the device average of 30 °C / 86 F.
| Durabook R10 Core Ultra 7 258V, Arc 140V | Dell Latitude 7030 Rugged Extreme i7-1260U, Iris Xe G7 96EUs | Lenovo ThinkPad T14 Gen 6 21QG001VGE Core Ultra 7 258V, Arc 140V | Dynabook Portege Z40L-N Core Ultra 7 258V, Arc 140V | Durabook R8 Tablet i5-1230U, Iris Xe G7 80EUs | Lenovo ThinkPad T14 Gen 6 AMD Ryzen AI 7 PRO 350, Radeon 860M | |
|---|---|---|---|---|---|---|
| Heat | 11% | 16% | -2% | -0% | -3% | |
| Maximum Upper Side * (°C) | 43.6 | 37.2 15% | 39.7 9% | 41.2 6% | 38.2 12% | 47.7 -9% |
| Maximum Bottom * (°C) | 40 | 43.4 -9% | 38.1 5% | 38 5% | 49.6 -24% | 49.5 -24% |
| Idle Upper Side * (°C) | 36.1 | 26.4 27% | 24.3 33% | 35.4 2% | 32.2 11% | 30.7 15% |
| Idle Bottom * (°C) | 33.3 | 29.6 11% | 27.7 17% | 39.8 -20% | 33.4 -0% | 31.6 5% |
* ... smaller is better
Speaker
The device's audio capabilities are modest. The built-in mono speaker on the back of the tablet reaches a maximum volume of 54 dB(A) and delivers rather mediocre sound quality. This is sufficient for playing system alert tones, at least in quiet environments.
Durabook R10 audio analysis
(-) | not very loud speakers (58.3 dB)
Bass 100 - 315 Hz
(-) | nearly no bass - on average 17.7% lower than median
(±) | linearity of bass is average (7.6% delta to prev. frequency)
Mids 400 - 2000 Hz
(+) | balanced mids - only 2.9% away from median
(±) | linearity of mids is average (13.7% delta to prev. frequency)
Highs 2 - 16 kHz
(+) | balanced highs - only 4.7% away from median
(±) | linearity of highs is average (10.2% delta to prev. frequency)
Overall 100 - 16.000 Hz
(-) | overall sound is not linear (31.3% difference to median)
Compared to same class
» 90% of all tested devices in this class were better, 3% similar, 7% worse
» The best had a delta of 7%, average was 20%, worst was 129%
Compared to all devices tested
» 90% of all tested devices were better, 2% similar, 8% worse
» The best had a delta of 4%, average was 24%, worst was 134%
Apple MacBook Pro 16 2021 M1 Pro audio analysis
(+) | speakers can play relatively loud (84.7 dB)
Bass 100 - 315 Hz
(+) | good bass - only 3.8% away from median
(+) | bass is linear (5.2% delta to prev. frequency)
Mids 400 - 2000 Hz
(+) | balanced mids - only 1.3% away from median
(+) | mids are linear (2.1% delta to prev. frequency)
Highs 2 - 16 kHz
(+) | balanced highs - only 1.9% away from median
(+) | highs are linear (2.7% delta to prev. frequency)
Overall 100 - 16.000 Hz
(+) | overall sound is linear (4.6% difference to median)
Compared to same class
» 0% of all tested devices in this class were better, 0% similar, 100% worse
» The best had a delta of 5%, average was 17%, worst was 45%
Compared to all devices tested
» 0% of all tested devices were better, 0% similar, 100% worse
» The best had a delta of 4%, average was 24%, worst was 134%
Energy consumption and battery life
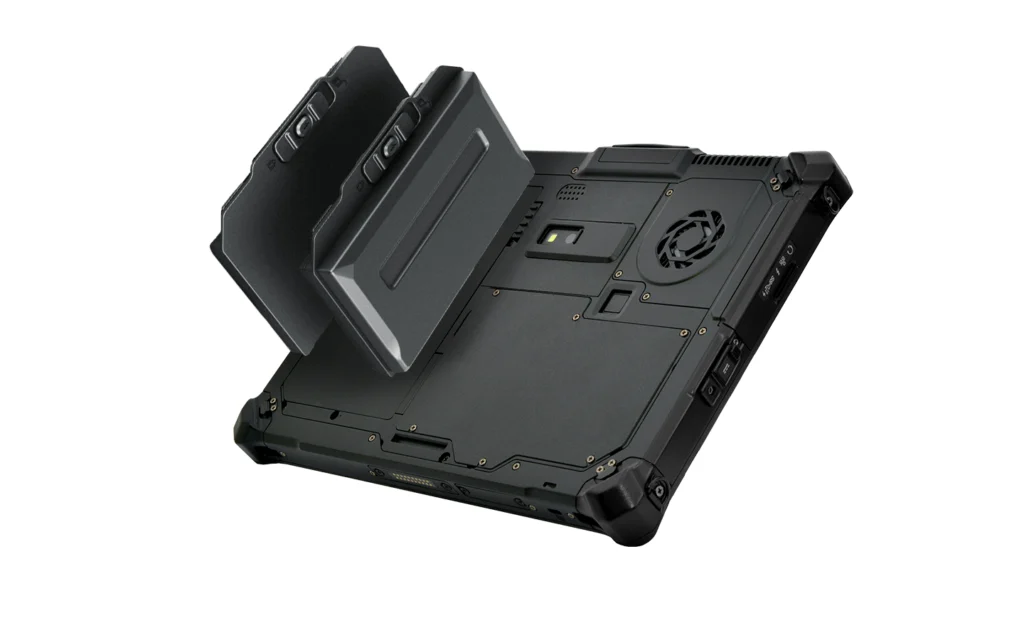
In our stress test, we recorded a maximum power consumption of 55 watts. By far the biggest power drain is the extremely bright display, which puts significant strain on the battery or power adapter. Away from a power outlet, the battery delivered a runtime of eight hours during continuous web browsing over Wi-Fi in our test. Thanks to the hot-swap feature, the battery can be replaced while the device is running. Inside the Durabook is a small battery, which provides just over a minute of power and allows the battery to be replaced without shutting down the device. For even longer use without charging or battery replacement, the manufacturer also offers a high-capacity battery, though it protrudes significantly from the device.
| Off / Standby | |
| Idle | |
| Load |
|
Key:
min: | |
Energy consumption Cyberpunk / Stress Test
Energy consumption with an external monitor
| Durabook R10 Core Ultra 7 258V, Arc 140V, 48 Wh | Dell Latitude 7030 Rugged Extreme i7-1260U, Iris Xe G7 96EUs, 36 Wh | Lenovo ThinkPad T14 Gen 6 21QG001VGE Core Ultra 7 258V, Arc 140V, 57 Wh | Dynabook Portege Z40L-N Core Ultra 7 258V, Arc 140V, 56 Wh | Durabook R8 Tablet i5-1230U, Iris Xe G7 80EUs, 27.4 Wh | Lenovo ThinkPad T14 Gen 6 AMD Ryzen AI 7 PRO 350, Radeon 860M, 57 Wh | Average of class Tablet | |
|---|---|---|---|---|---|---|---|
| Battery Runtime | |||||||
| WiFi Websurfing (h) | 8.4 | 6.1 -27% | 19.4 131% | 19.1 127% | 5.3 -37% | 13.8 64% | 15.8 ? 88% |
| Battery runtime | -27% | 131% | 127% | -37% | 64% | 88% | |
| WiFi v1.3 (h) | 8.4 | 6.1 -27% | 19.4 131% | 19.1 127% | 5.3 -37% | 13.8 64% | 15.8 ? 88% |
| Load (h) | 1.6 | 1.1 | 4.16 ? | ||||
| Total Average (Program / Settings) | -27% /
-27% | 131% /
131% | 127% /
127% | -37% /
-37% | 64% /
64% | 88% /
88% |
| Durabook R10 Core Ultra 7 258V, Arc 140V, 48 Wh | Dell Latitude 7030 Rugged Extreme i7-1260U, Iris Xe G7 96EUs, 36 Wh | Lenovo ThinkPad T14 Gen 6 21QG001VGE Core Ultra 7 258V, Arc 140V, 57 Wh | Dynabook Portege Z40L-N Core Ultra 7 258V, Arc 140V, 56 Wh | Durabook R8 Tablet i5-1230U, Iris Xe G7 80EUs, 27.4 Wh | Lenovo ThinkPad T14 Gen 6 AMD Ryzen AI 7 PRO 350, Radeon 860M, 57 Wh | Average of class Tablet | |
|---|---|---|---|---|---|---|---|
| Battery runtime | -27% | 131% | 127% | -37% | 64% | 88% | |
| WiFi v1.3 (h) | 8.4 | 6.1 -27% | 19.4 131% | 19.1 127% | 5.3 -37% | 13.8 64% | 15.8 ? 88% |
| Load (h) | 1.6 | 1.1 | 4.16 ? |
Notebookcheck Overall Rating
The Durabook R10 is a true heavyweight designed for extreme working environments. Its certified military standards, bright display, and seamless power supply are thoroughly impressive. However, below-average CPU performance, high latency, and a slightly greenish screen require some compromises.
Durabook R10
- 06/18/2026 v8
Marc Herter
 Total Sustainability Score:
 A Comparison of Possible Alternatives
Image | Model / Review | Price | Weight | Height | Display |
|---|---|---|---|---|---|
1. 76.5%  | Durabook R10 Intel Core Ultra 7 258V ⎘ Intel Arc Graphics 140V ⎘ 32 GB Memory | Amazon: 1. $14.99 ZBAGUG for Durabook R10 Tabl... 2. $17.99 ZBAGUG 2-Pack for Durabook R... | 1.3 kg | 29 mm | 10.10" 1920x1200 224 PPI TFT |
2. 82.3%  | Dell Latitude 7030 Rugged Extreme Intel Core i7-1260U ⎘ Intel Iris Xe Graphics G7 96EUs ⎘ 32 GB Memory, 1024 GB SSD | Amazon: 1. $2,049.00 Dell Latitude Rugged Extreme... 2. $2,199.00 Dell Latitude 7330 Rugged Ex... 3. $1,850.00 Dell Latitude Rugged Extreme... List Price: 3000 USD | 1.1 kg | 25.4 mm | 10.00" 1920x1200 226 PPI IPS |
3. 79.6% v7 (old)  | Durabook R8 Tablet Intel Core i5-1230U ⎘ Intel Iris Xe Graphics G7 80EUs ⎘ 8 GB Memory, 128 GB SSD | Amazon: 1. $38.99 PowerHOOD DC19V AC Power Ada... 2. $39.95 BoxWave Screen Protector Com... 3. $39.95 BoxWave Screen Protector Com... | 856 g | 20.6 mm | 8.00" 1280x800 189 PPI IPS |
Transparency
The selection of devices to be reviewed is made by our editorial team. The test sample was provided to the author as a loan by the manufacturer or retailer for the purpose of this review. The lender had no influence on this review, nor did the manufacturer receive a copy of this review before publication. There was no obligation to publish this review. As an independent media company, Notebookcheck is not subjected to the authority of manufacturers, retailers or publishers.
This is how Notebookcheck is testing
Every year, Notebookcheck independently reviews hundreds of laptops and smartphones using standardized procedures to ensure that all results are comparable. We have continuously developed our test methods for around 20 years and set industry standards in the process. In our test labs, high-quality measuring equipment is utilized by experienced technicians and editors. These tests involve a multi-stage validation process. Our complex rating system is based on hundreds of well-founded measurements and benchmarks, which maintains objectivity. Further information on our test methods can be found here.

