Notebookcheck Logo

Apple M3 Pro & M3 Max analysis - Apple has significantly upgraded its Max CPU

The biggest step since the M1. Apple has made big changes to its new M3 Pro and M3 Max chips and for the first time, the the M3 Max not only offers considerably more GPU performance compared to the M3 Pro, but it also features a much faster CPU. This is in part due to its new core configuration. But what does the new SoC's efficiency look like?

Apple has recently unveiled its new M3 SoCs (M3M3 Pro & M3 Max) which are produced using a modern 3-nm process. We already took a detailed look at the new base M3 SoC's performance and efficiency, so now it's the faster M3 Pro and M3 Max chips' turn. Aside from them now being made using a 3-nm process, they also feature a wide range of new changes, in particular regarding how their performance and efficiency clusters are built. Furthermore, we will be comparing their performance and efficiency with those of AMD, Intel and Nvidia CPUs/GPUs. Subsequently, we will be comparing them to the new Snapdragon X Elite, only recently presented by Qualcomm.

Apple M3 Pro & M3 Max overview

The change to the M3 generation has brought with it lots of differences when it comes to the Pro and Max models. The regular M3's core configuration hasn't been changed (still one performance cluster and one efficiency cluster with four cores each), whereas the new Pro/Max chips' clusters consist of 6 cores each. The M3 Pro features a performance cluster with 5 or 6 active cores, as well as an efficiency cluster with 6 cores. This means you can get the M3 Pro with 11 or 12 CPU cores. The new M3 Max, on the other hand, has had its CPU performance massively increased by Apple, as it now uses two performance clusters (with 5 or 6 active cores each) in combination with a slimmed-down efficiency cluster (4 cores) — meaning this is a CPU with either 14 or 16 cores in total. While the new M3 Pro focuses mainly on efficiency, the M3 Max is definitely targeted more toward maximum CPU performance.

The CPU cores themselves are almost identical on all of the M3 models. The performance cores can achieve a maximum of 4.056 Ghz or ~3.6 GHz when all cores are placed under load in the M3, and up to 2.748 GHz in the M3 Pro — however, the M3 Max can only achieve up to 2.567 GHz. Thanks to their new 3-nm finish (presumably N3B process at TMSC), Apple has managed to clearly improve their clock rates without having to make all too many compromises when it comes to power consumption.

Apple M3, M3 Pro & M3 Max (source: Apple)

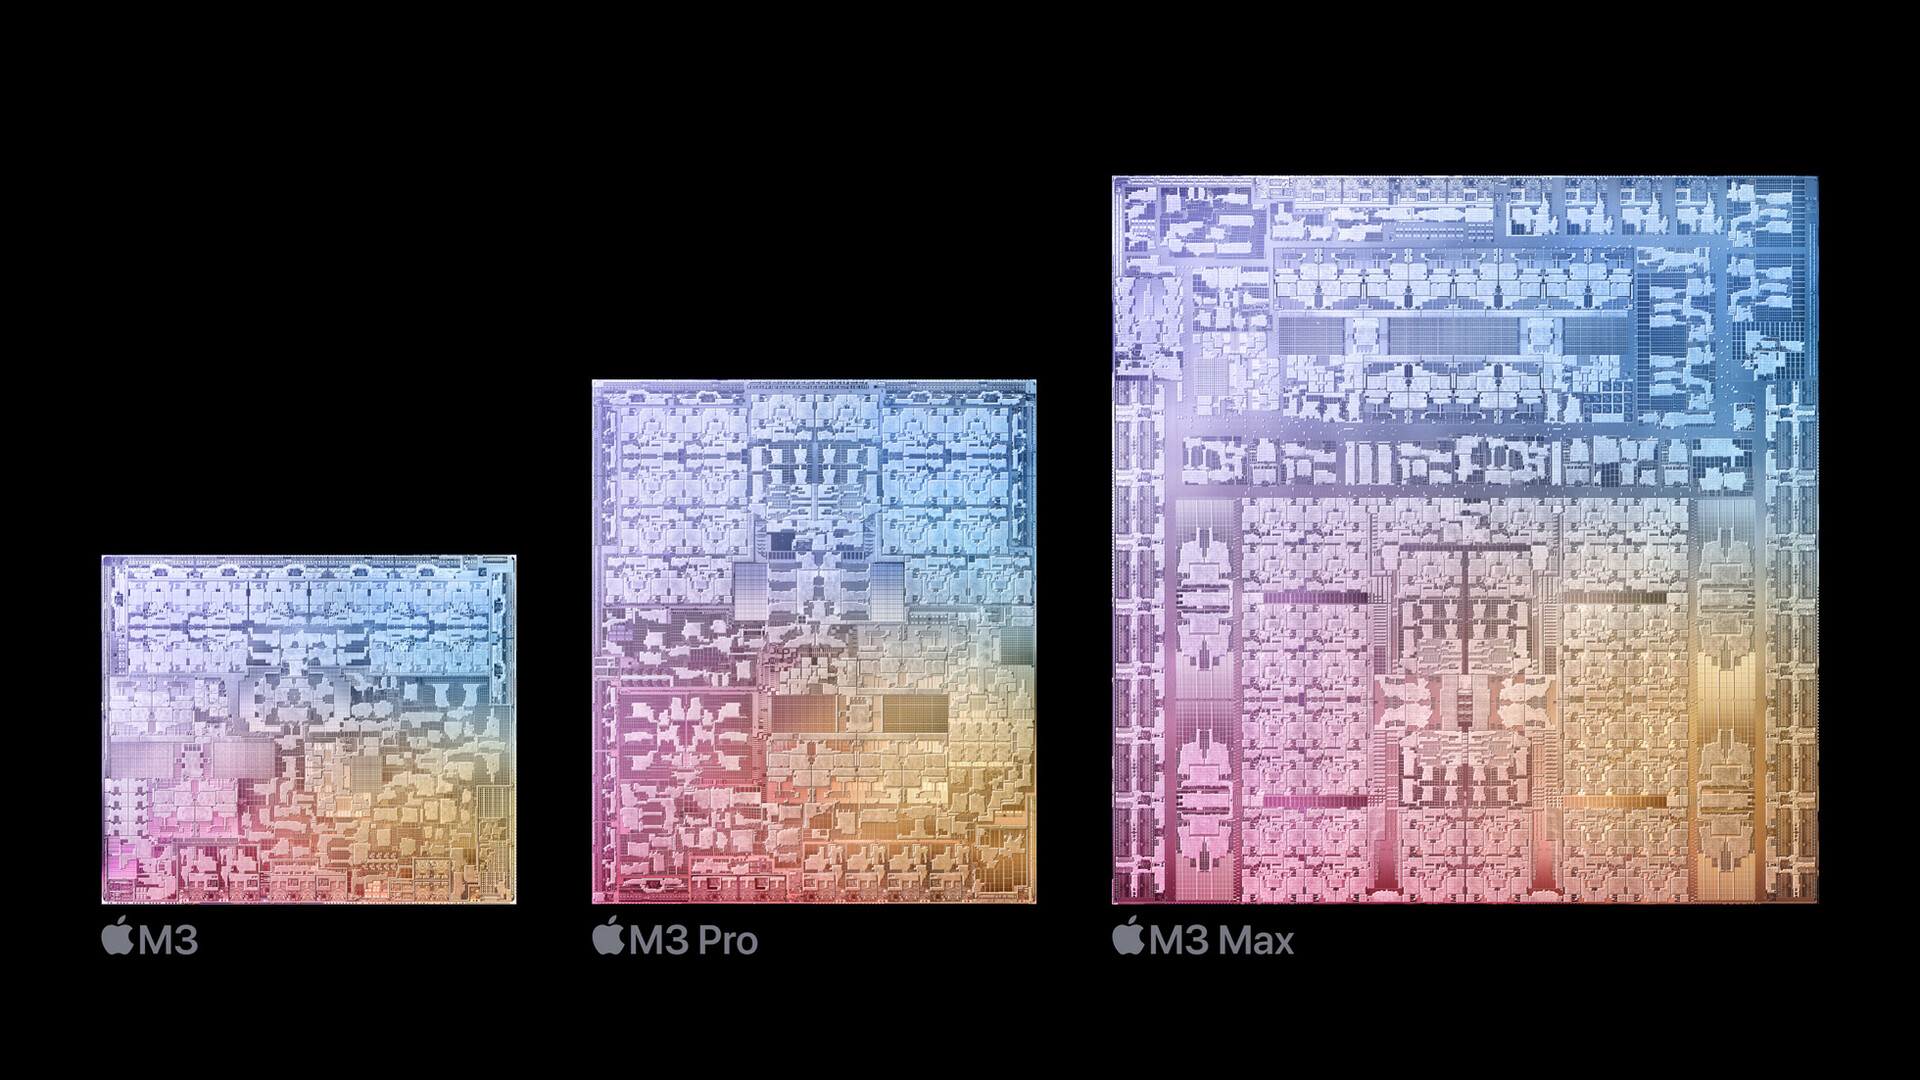
Together with their different RAM capacities (18 or 36 GB in the M3 Pro; 36, 48, 96 or 128 GB in the M3 Max) as well as their different GPU configurations, the chips differ significantly from each other in terms of structure and a direct comparison shows that the new M3 Max is a significantly larger chip than the M3 Pro.

Apple has revised the GPU's entire architecture, now only using dynamic caching, whereby the cache and memory are allocated dynamically based on the actual requirements of applications. In addition, the M3 Pro/M3 Max's GPUs now support hardware-based ray tracing, mesh shading and AV1 decoding. The M3 Pro (14 or 18 GPU cores) can control two external screens in addition to the integrated display, while the M3 Max (30 or 40 GPU cores) can power four.

Test procedure

In order to make a meaningful comparison between the different processors and graphics cards, we will be taking a look at their power consumption in addition to their pure performance in synthetic benchmarks, from which we will then determine their efficiency. Our consumption measurements are always carried out on an external display so that we can eliminate the different internal displays as influencing factors. Nevertheless, we will be measuring the system's overall consumption, not just relying on the displayed CPU and GPU values. This is, of course, why the different chip sizes, including more RAM etc., also play a role.

Single-core performance

The single-core performance is practically identical in all of the new M3 SoCs and in this aspect, Apple was able to increase their performance by a whopping 20 % compared to the old M2 generation. Compared to the M1 generation, their performance is even 30 % higher. The CPU itself has a power consumption of around 5.5 watts (according to Power Metrics), although we noticed some slight differences between the individual CPUs.

Single-Core Performance Rating - Percent
Apple M3 Pro 12-Core
Apple MacBook Pro 16 2023 M3 Pro
99.7 pt
Apple M3 Max 16-Core
Apple MacBook Pro 16 2023 M3 Max
99.5 pt
Apple M3 Pro 11-Core
Apple MacBook Pro 14 2023 M3 Pro
98.9 pt
Apple M3 Max 16-Core
Apple MacBook Pro 14 2023 M3 Max
98.8 pt
Apple M3
Apple MacBook Pro 14 2023 M3
98.2 pt
Apple M2 Pro
Apple MacBook Pro 14 2023 M2 Pro
83.5 pt
Apple M2 Pro 10-Core
Apple MacBook Pro 14 2023 M2 Pro Entry
82.7 pt
Apple M2
Apple MacBook Pro 13 2022 M2
81.3 pt
Apple M2
Apple MacBook Air M2 Entry
80.9 pt
Apple M1 Pro
Apple MacBook Pro 16 2021 M1 Pro
76.5 pt
Apple M1 Pro 8-Core
Apple MacBook Pro 14 2021 M1 Pro Entry
76.5 pt
Apple M1
Apple MacBook Pro 13 Late 2020 M1 Entry (8 / 256 GB)
75.4 pt
Apple M1
Apple MacBook Air 2020 M1 Entry
74.7 pt
Cinebench R23 - Single Core
Apple M3 Pro 12-Core
Apple MacBook Pro 16 2023 M3 Pro
1977 Points
Apple M3 Max 16-Core
Apple MacBook Pro 16 2023 M3 Max
1968 Points
Apple M3 Max 16-Core
Apple MacBook Pro 14 2023 M3 Max
1950 Points
Apple M3 Pro 11-Core
Apple MacBook Pro 14 2023 M3 Pro
1942 Points
Apple M3
Apple MacBook Pro 14 2023 M3
1904 Points
Apple M2 Pro
Apple MacBook Pro 14 2023 M2 Pro
1647 Points
Apple M2 Pro 10-Core
Apple MacBook Pro 14 2023 M2 Pro Entry
1643 Points
Apple M2
Apple MacBook Air M2 Entry
1585 Points
Apple M2
Apple MacBook Pro 13 2022 M2
1581 Points
Apple M1 Pro
Apple MacBook Pro 16 2021 M1 Pro
1534 Points
Apple M1 Pro 8-Core
Apple MacBook Pro 14 2021 M1 Pro Entry
1531 Points
Apple M1
Apple MacBook Pro 13 Late 2020 M1 Entry (8 / 256 GB)
1513 Points
Apple M1
Apple MacBook Air 2020 M1 Entry
1496 Points
Geekbench 5.5 - Single-Core
Apple M3
Apple MacBook Pro 14 2023 M3
2342 Points
Apple M3 Max 16-Core
Apple MacBook Pro 16 2023 M3 Max
2331 Points
Apple M3 Pro 11-Core
Apple MacBook Pro 14 2023 M3 Pro
2331 Points
Apple M3 Pro 12-Core
Apple MacBook Pro 16 2023 M3 Pro
2327 Points
Apple M3 Max 16-Core
Apple MacBook Pro 14 2023 M3 Max
2318 Points
Apple M2 Pro
Apple MacBook Pro 14 2023 M2 Pro
1961 Points
Apple M2
Apple MacBook Pro 13 2022 M2
1937 Points
Apple M2 Pro 10-Core
Apple MacBook Pro 14 2023 M2 Pro Entry
1926 Points
Apple M2
Apple MacBook Air M2 Entry
1914 Points
Apple M1 Pro 8-Core
Apple MacBook Pro 14 2021 M1 Pro Entry
1769 Points
Apple M1 Pro
Apple MacBook Pro 16 2021 M1 Pro
1768 Points
Apple M1
Apple MacBook Pro 13 Late 2020 M1 Entry (8 / 256 GB)
1740 Points
Apple M1
Apple MacBook Air 2020 M1 Entry
1727 Points

These slight fluctuations definitely have a major impact on efficiency, as their overall consumption is so low. The small M3 Pro with 11 CPU cores in the MacBook Pro 14 performed particularly well, even placing ahead of the Apple M3 in our measurement. The M3 Pro with 12 CPU cores performed slightly worse but it still came ahead of the old M2 Pro.

Power Consumption / Cinebench R23 Single Power Efficiency - external Monitor
Apple M3 Pro 11-Core
Apple MacBook Pro 14 2023 M3 Pro
198.6 Points per Watt
Apple M3
Apple MacBook Pro 14 2023 M3
190.4 Points per Watt
Apple M2
Apple MacBook Air M2 Entry
179.3 Points per Watt
Apple M1
Apple MacBook Air 2020 M1 Entry
165.1 Points per Watt
Apple M2
Apple MacBook Pro 13 2022 M2
161.7 Points per Watt
Apple M3 Pro 12-Core
Apple MacBook Pro 16 2023 M3 Pro
142.2 Points per Watt
Apple M2 Pro
Apple MacBook Pro 14 2023 M2 Pro
140.8 Points per Watt
Apple M3 Max 16-Core
Apple MacBook Pro 14 2023 M3 Max
125.8 Points per Watt
Apple M2 Pro 10-Core
Apple MacBook Pro 14 2023 M2 Pro Entry
118.2 Points per Watt
Apple M3 Max 16-Core
Apple MacBook Pro 16 2023 M3 Max
113.8 Points per Watt
Apple M1 Pro
Apple MacBook Pro 16 2021 M1 Pro
110.4 Points per Watt
Power Consumption / Cinebench R23 Single (external Monitor)
Apple M3 Max 16-Core
Apple MacBook Pro 16 2023 M3 Max
17.3 (16.2min, 16.2P1 - 21.4max) Watt *
Apple M3 Max 16-Core
Apple MacBook Pro 14 2023 M3 Max
15.5 (10.4min, 13.6P1 - 22.6max) Watt *
Apple M1 Pro
Apple MacBook Pro 16 2021 M1 Pro
13.9 (12.3min, 13.3P1 - 22.1max) Watt *
Apple M2 Pro 10-Core
Apple MacBook Pro 14 2023 M2 Pro Entry
13.9 (12.2min, 12.7P1 - 16.5max) Watt *
Apple M3 Pro 12-Core
Apple MacBook Pro 16 2023 M3 Pro
13.9 (12.1min, 12.2P1 - 15.8max) Watt *
Apple M2 Pro
Apple MacBook Pro 14 2023 M2 Pro
11.7 (9.94min, 10.7P1 - 13.6max) Watt *
Apple M3
Apple MacBook Pro 14 2023 M3
10 (9.53min, 9.57P1 - 12.8max) Watt *
Apple M2
Apple MacBook Pro 13 2022 M2
9.78 (9.13min, 9.21P1 - 11.2max) Watt *
Apple M3 Pro 11-Core
Apple MacBook Pro 14 2023 M3 Pro
9.78 (8.94min, 9P1 - 10.8max) Watt *
Apple M1
Apple MacBook Air 2020 M1 Entry
9.06 (8.41min, 8.57P1 - 19max) Watt *
Apple M2
Apple MacBook Air M2 Entry
8.84 (8.3min, 8.37P1 - 9.82max) Watt *

* ... smaller is better

Multi-core performance

We noted significantly greater differences in their multi-core performance. Firstly, the M3 Pro offers slightly more performance than the old M2 Pro despite it having fewer performance cores, but Apple has also been able to reduce its power consumption. The small M3 Pro with 11 CPU cores consumes around 24 watts (M2 Pro with 10 cores: around 27 watts); the M3 Pro with 12 CPU cores consumes about 27 watts (M2 Pro with 12 cores: around 34 watts). More performance with lower consumption naturally means significantly better efficiency, and the new M3 Pro is clearly the leader in this respect.

We have so far only been able to test the top-of-the-range version of the M3 Max with 16 CPU cores and its performance advantage over the M3 Pro and the old M2 Max is a whopping 54-56 %, meaning Apple has finally gotten rid of a major point of criticism that the old models had. Although its power consumption has also increased significantly (M3 Max up to 56 watts; M2 Max up to 36 watts), its efficiency is still slightly better than the M2 Pro/M2 Max — but the M3 Max didn't come close to the M3 Pro's efficiency in our multi-core tests.

Multi-Core Performance Rating - Percent
Apple M3 Max 16-Core
Apple MacBook Pro 14 2023 M3 Max
100 pt
Apple M3 Max 16-Core
Apple MacBook Pro 16 2023 M3 Max
99.5 pt
Apple M3 Pro 12-Core
Apple MacBook Pro 16 2023 M3 Pro
64.6 pt
Apple M2 Max
Apple MacBook Pro 16 2023 M2 Max
64 pt
Apple M2 Pro
Apple MacBook Pro 14 2023 M2 Pro
63 pt
Apple M3 Pro 11-Core
Apple MacBook Pro 14 2023 M3 Pro
56.6 pt
Apple M1 Pro
Apple MacBook Pro 16 2021 M1 Pro
52.8 pt
Apple M2 Pro 10-Core
Apple MacBook Pro 14 2023 M2 Pro Entry
51 pt
Apple M1 Pro 8-Core
Apple MacBook Pro 14 2021 M1 Pro Entry
41.5 pt
Apple M2
Apple MacBook Pro 13 2022 M2
37.6 pt
Apple M2
Apple MacBook Air M2 Entry
37.4 pt
Apple M1
Apple MacBook Pro 13 Late 2020 M1 Entry (8 / 256 GB)
32.7 pt
Apple M1
Apple MacBook Air 2020 M1 Entry
31.9 pt
Cinebench R23 - Multi Core
Apple M3 Max 16-Core
Apple MacBook Pro 16 2023 M3 Max
24024 Points
Apple M3 Max 16-Core
Apple MacBook Pro 14 2023 M3 Max
24020 Points
Apple M3 Pro 12-Core
Apple MacBook Pro 16 2023 M3 Pro
15106 Points
Apple M2 Pro
Apple MacBook Pro 14 2023 M2 Pro
14787 Points
Apple M2 Max
Apple MacBook Pro 16 2023 M2 Max
14767 Points
Apple M3 Pro 11-Core
Apple MacBook Pro 14 2023 M3 Pro
13315 Points
Apple M1 Pro
Apple MacBook Pro 16 2021 M1 Pro
12370 Points
Apple M2 Pro 10-Core
Apple MacBook Pro 14 2023 M2 Pro Entry
11811 Points
Apple M1 Pro 8-Core
Apple MacBook Pro 14 2021 M1 Pro Entry
9581 Points
Apple M2
Apple MacBook Pro 13 2022 M2
8745 Points
Apple M2
Apple MacBook Air M2 Entry
8667 Points
Apple M1
Apple MacBook Pro 13 Late 2020 M1 Entry (8 / 256 GB)
7811 Points
Apple M1
Apple MacBook Air 2020 M1 Entry
7409 (6401.39min - 7409.31max) Points
Geekbench 5.5 - Multi-Core
Apple M3 Max 16-Core
Apple MacBook Pro 14 2023 M3 Max
23059 Points
Apple M3 Max 16-Core
Apple MacBook Pro 16 2023 M3 Max
22816 Points
Apple M2 Max
Apple MacBook Pro 16 2023 M2 Max
15348 Points
Apple M3 Pro 12-Core
Apple MacBook Pro 16 2023 M3 Pro
15298 Points
Apple M2 Pro
Apple MacBook Pro 14 2023 M2 Pro
14859 Points
Apple M3 Pro 11-Core
Apple MacBook Pro 14 2023 M3 Pro
13312 Points
Apple M1 Pro
Apple MacBook Pro 16 2021 M1 Pro
12499 Points
Apple M2 Pro 10-Core
Apple MacBook Pro 14 2023 M2 Pro Entry
12189 Points
Apple M1 Pro 8-Core
Apple MacBook Pro 14 2021 M1 Pro Entry
9942 Points
Apple M2
Apple MacBook Pro 13 2022 M2
8962 Points
Apple M2
Apple MacBook Air M2 Entry
8951 Points
Apple M1
Apple MacBook Pro 13 Late 2020 M1 Entry (8 / 256 GB)
7590 Points
Apple M1
Apple MacBook Air 2020 M1 Entry
7578 Points
Power Consumption / Cinebench R23 Multi Power Efficiency - external Monitor
Apple M3 Pro 11-Core
Apple MacBook Pro 14 2023 M3 Pro
394 Points per Watt
Apple M3 Pro 12-Core
Apple MacBook Pro 16 2023 M3 Pro
358 Points per Watt
Apple M2
Apple MacBook Pro 13 2022 M2
346 Points per Watt
Apple M2
Apple MacBook Air M2 Entry
343 Points per Watt
Apple M1
Apple MacBook Air 2020 M1 Entry
337 Points per Watt
Apple M3 Max 16-Core
Apple MacBook Pro 14 2023 M3 Max
307 Points per Watt
Apple M3 Max 16-Core
Apple MacBook Pro 16 2023 M3 Max
306 Points per Watt
Apple M1 Pro
Apple MacBook Pro 16 2021 M1 Pro
290 Points per Watt
Apple M2 Pro
Apple MacBook Pro 14 2023 M2 Pro
275 Points per Watt
Apple M2 Pro 10-Core
Apple MacBook Pro 14 2023 M2 Pro Entry
250 Points per Watt
Apple M2 Max
Apple MacBook Pro 16 2023 M2 Max
233 Points per Watt
Power Consumption / Cinebench R23 Multi (external Monitor)
Apple M3 Max 16-Core
Apple MacBook Pro 16 2023 M3 Max
78.6 (71.7min, 73.3P1 - 80.2max) Watt *
Apple M3 Max 16-Core
Apple MacBook Pro 14 2023 M3 Max
78.3 (75.9min, 76.1P1 - 81.7max) Watt *
Apple M2 Max
Apple MacBook Pro 16 2023 M2 Max
63.5 (61.8min, 62.1P1 - 67.8max) Watt *
Apple M2 Pro
Apple MacBook Pro 14 2023 M2 Pro
53.7 (50.8min, 51.2P1 - 60.8max) Watt *
Apple M2 Pro 10-Core
Apple MacBook Pro 14 2023 M2 Pro Entry
47.2 (45.8min, 46.1P1 - 48.5max) Watt *
Apple M1 Pro
Apple MacBook Pro 16 2021 M1 Pro
42.7 (16.4min, 25.7P1 - 50.1max) Watt *
Apple M3 Pro 12-Core
Apple MacBook Pro 16 2023 M3 Pro
42.2 (41.4min, 41.5P1 - 43.6max) Watt *
Apple M3 Pro 11-Core
Apple MacBook Pro 14 2023 M3 Pro
33.8 (33min, 33.1P1 - 36.3max) Watt *
Apple M2
Apple MacBook Pro 13 2022 M2
25.3 (24.4min, 24.5P1 - 27.2max) Watt *
Apple M2
Apple MacBook Air M2 Entry
25.3 (23.2min, 23.5P1 - 27.5max) Watt *
Apple M1
Apple MacBook Air 2020 M1 Entry
22 (18.7min, 18.8P1 - 25.2max) Watt *

* ... smaller is better

Apple M3 Pro/Max vs. AMD and Intel

Now to compare the new Apple M3 generation with other current mobile processors from AMD and Intel. In the case of AMD, both its U-series chips and its HS processors prove to be interesting competitors, while Intel's main competitors are the Raptor Lake P and Raptor Lake H processors.

Let's start with single-core performance. Here, you can clearly see what a big step Apple has taken with its M3 generation. Despite its low power consumption, its new performance core can easily keep up with the performance cores of the current Raptor Lake CPUs from Intel, which require significantly more power. Only the i9 CPUs from Intel (H or HX) offer slightly more performance thanks to their high turbo clocks, but they fall significantly behind in terms of efficiency. However, all other CPUs (Ryzen 9 7945HXCore i7-13700HX  etc.) are kept in check by the Apple M3 chips.

Cinebench R23 - Single Core
Intel Core i9-13980HX
Asus ProArt Studiobook 16 OLED H7604
2110 Points
Intel Core i9-13900H
Asus Zenbook Pro 14 OLED UX6404VI
2054 Points
Apple M3 Pro 12-Core
Apple MacBook Pro 16 2023 M3 Pro
1977 Points
Apple M3 Max 16-Core
Apple MacBook Pro 16 2023 M3 Max
1968 Points
AMD Ryzen 9 7945HX
Asus Zephyrus Duo 16 GX650PY-NM006W
1940 Points
Intel Core i7-13700HX
Alienware m16 R1 Intel
1933 Points
Intel Core i7-13700H
SCHENKER Vision 14 2023
1912 Points
Intel Core i7-1360P
Lenovo Yoga 9 14IRP G8
1877 Points
AMD Ryzen 9 7845HX
Alienware m16 R1 AMD
1852 Points
AMD Ryzen 7 7840S
Lenovo Yoga Slim 7 14APU G8
1761 Points
AMD Ryzen 7 7840U
HP EliteBook 845 G10 5Z4X0ES
1581 Points
AMD Ryzen 9 PRO 7940HS
HP EliteBook 845 G10 818N0EA
1568 Points
Geekbench 5.5 - Single-Core
Apple M3 Max 16-Core
Apple MacBook Pro 16 2023 M3 Max
2331 Points
Apple M3 Pro 12-Core
Apple MacBook Pro 16 2023 M3 Pro
2327 Points
Intel Core i9-13980HX
Asus ProArt Studiobook 16 OLED H7604
2137 Points
AMD Ryzen 9 7945HX
Asus Zephyrus Duo 16 GX650PY-NM006W
2132 Points
AMD Ryzen 9 7845HX
Alienware m16 R1 AMD
2008 Points
Intel Core i9-13900H
Asus Zenbook Pro 14 OLED UX6404VI
2001 Points
AMD Ryzen 7 7840S
Lenovo Yoga Slim 7 14APU G8
1939 Points
Intel Core i7-13700HX
Alienware m16 R1 Intel
1845 Points
Intel Core i7-13700H
SCHENKER Vision 14 2023
1830 Points
Intel Core i7-1360P
Lenovo Yoga 9 14IRP G8
1790 Points
AMD Ryzen 9 PRO 7940HS
HP EliteBook 845 G10 818N0EA
1758 Points
AMD Ryzen 7 7840U
HP EliteBook 845 G10 5Z4X0ES
1723 Points
Power Consumption - Cinebench R23 Single Power Efficiency - external Monitor
Apple M3 Pro 12-Core
Apple MacBook Pro 16 2023 M3 Pro
142.2 Points per Watt
Apple M3 Max 16-Core
Apple MacBook Pro 16 2023 M3 Max
113.8 Points per Watt
AMD Ryzen 7 7840U
HP EliteBook 845 G10 5Z4X0ES
100.7 Points per Watt
AMD Ryzen 9 PRO 7940HS
HP EliteBook 845 G10 818N0EA
92.2 Points per Watt
Intel Core i7-13700H
SCHENKER Vision 14 2023
53.3 Points per Watt
AMD Ryzen 7 7840S
Lenovo Yoga Slim 7 14APU G8
48.2 Points per Watt
Intel Core i7-1360P
Lenovo Yoga 9 14IRP G8
48 Points per Watt
AMD Ryzen 9 7945HX
Asus Zephyrus Duo 16 GX650PY-NM006W
26.4 Points per Watt
Intel Core i9-13980HX
Asus ProArt Studiobook 16 OLED H7604
25.4 Points per Watt

In our multi-core tests, the tide changes a little, as the HX CPUs from AMD (Ryzen 9) and Intel (Core i9-HX) offer more performance than the M3 Max can, especially during the Cinebench R23 test. However, you shouldn't forget that they consume significantly more power (well over 100 watts).

The M3 Pro, on the other hand, is on par with slower variants of the 45-watt CPUs from AMD and Intel, such as the Ryzen 9 7940HS or the Core i7-13700H. However, these slower variants also require more power, which can be seen from their efficiency. However, AMD is still within striking distance, especially with its Ryzen 7 7840U — only beaten by the new M3 Pro with 11 CPU cores in terms of multi-core efficiency. Intel, on the other hand, falls significantly behind and can hardly compete in this aspect.

Cinebench R23: Multi Core | Geekbench 5.5: Multi-Core | Power Consumption: Cinebench R23 Multi Power Efficiency - external Monitor
Cinebench R23 / Multi Core
AMD Ryzen 9 7945HX
Asus Zephyrus Duo 16 GX650PY-NM006W
34521 (32987.6min - 34521.3max) Points
Intel Core i9-13980HX
Asus ProArt Studiobook 16 OLED H7604
30789 Points
AMD Ryzen 9 7845HX
Alienware m16 R1 AMD
26876 (25414.3min - 26876.4max) Points
Apple M3 Max 16-Core
Apple MacBook Pro 16 2023 M3 Max
24024 Points
Intel Core i7-13700HX
Alienware m16 R1 Intel
21889 Points
Intel Core i9-13900H
Asus Zenbook Pro 14 OLED UX6404VI
19014 Points
Intel Core i7-13700H
Microsoft Surface Laptop Studio 2 RTX 4060
16279 Points
Apple M3 Pro 12-Core
Apple MacBook Pro 16 2023 M3 Pro
15106 Points
AMD Ryzen 7 7840S
Lenovo Yoga Slim 7 14APU G8
15102 Points
AMD Ryzen 9 PRO 7940HS
HP EliteBook 845 G10 818N0EA
14919 Points
Intel Core i7-13700H
SCHENKER VISION 16 Pro (M23)
14760 Points
Apple M3 Pro 11-Core
Apple MacBook Pro 14 2023 M3 Pro
13315 Points
AMD Ryzen 7 7840U
HP EliteBook 845 G10 5Z4X0ES
12385 Points
Intel Core i7-13700H
SCHENKER Vision 14 2023
12275 Points
Intel Core i7-1360P
Lenovo Yoga 9 14IRP G8
11922 Points
Intel Core i7-1365U
Lenovo ThinkPad X1 Carbon G11-21HNS00000
9343 Points
Intel Core i7-1355U
Asus ExpertBook B9 B9403CVA-KM0153X
7733 Points
Qualcomm Snapdragon 8cx Gen 3
Microsoft Surface Pro 9, ARM
3567 Points
Geekbench 5.5 / Multi-Core
Apple M3 Max 16-Core
Apple MacBook Pro 16 2023 M3 Max
22816 Points
Intel Core i9-13980HX
Asus ProArt Studiobook 16 OLED H7604
20053 Points
AMD Ryzen 9 7945HX
Asus Zephyrus Duo 16 GX650PY-NM006W
19583 Points
Apple M3 Pro 12-Core
Apple MacBook Pro 16 2023 M3 Pro
15298 Points
AMD Ryzen 9 7845HX
Alienware m16 R1 AMD
15068 Points
Intel Core i9-13900H
Asus Zenbook Pro 14 OLED UX6404VI
14566 Points
Intel Core i7-13700HX
Alienware m16 R1 Intel
14448 Points
Apple M3 Pro 11-Core
Apple MacBook Pro 14 2023 M3 Pro
13312 Points
Intel Core i7-13700H
Microsoft Surface Laptop Studio 2 RTX 4060
12851 Points
Intel Core i7-13700H
SCHENKER VISION 16 Pro (M23)
11808 Points
AMD Ryzen 7 7840S
Lenovo Yoga Slim 7 14APU G8
11288 Points
Intel Core i7-1360P
Lenovo Yoga 9 14IRP G8
10785 Points
Intel Core i7-13700H
SCHENKER Vision 14 2023
10515 Points
AMD Ryzen 9 PRO 7940HS
HP EliteBook 845 G10 818N0EA
9897 Points
AMD Ryzen 7 7840U
HP EliteBook 845 G10 5Z4X0ES
9864 Points
Intel Core i7-1365U
Lenovo ThinkPad X1 Carbon G11-21HNS00000
8709 Points
Intel Core i7-1355U
Asus ExpertBook B9 B9403CVA-KM0153X
7635 Points
Qualcomm Snapdragon 8cx Gen 3
Microsoft Surface Pro 9, ARM
7522 Points
Power Consumption / Cinebench R23 Multi Power Efficiency - external Monitor
Apple M3 Pro 11-Core
Apple MacBook Pro 14 2023 M3 Pro
394 Points per Watt
AMD Ryzen 7 7840U
HP EliteBook 845 G10 5Z4X0ES
369 Points per Watt
Apple M3 Pro 12-Core
Apple MacBook Pro 16 2023 M3 Pro
358 Points per Watt
Apple M3 Max 16-Core
Apple MacBook Pro 16 2023 M3 Max
306 Points per Watt
AMD Ryzen 9 PRO 7940HS
HP EliteBook 845 G10 818N0EA
254 Points per Watt
AMD Ryzen 7 7840S
Lenovo Yoga Slim 7 14APU G8
235 Points per Watt
Intel Core i7-1355U
Asus ExpertBook B9 B9403CVA-KM0153X
209 Points per Watt
Intel Core i7-1365U
Lenovo ThinkPad X1 Carbon G11-21HNS00000
208 Points per Watt
AMD Ryzen 9 7945HX
Asus Zephyrus Duo 16 GX650PY-NM006W
194.4 Points per Watt
Intel Core i7-13700H
SCHENKER Vision 14 2023
184.9 Points per Watt
Intel Core i7-1360P
Lenovo Yoga 9 14IRP G8
183.7 Points per Watt
Intel Core i7-13700H
SCHENKER VISION 16 Pro (M23)
173 Points per Watt
Intel Core i7-13700H
Microsoft Surface Laptop Studio 2 RTX 4060
170.6 Points per Watt
Intel Core i9-13980HX
Asus ProArt Studiobook 16 OLED H7604
135 Points per Watt
Qualcomm Snapdragon 8cx Gen 3
Microsoft Surface Pro 9, ARM
111.5 Points per Watt
Cinebench R23: Multi Core | Geekbench 5.5: Multi-Core | Power Consumption: Cinebench R23 Multi Power Efficiency - external Monitor

GPU performance & efficiency

We primarily use the cross-platform 3DMark-Test Wildlife Extreme Unlimited to test graphics performance, as this gives us a good direct comparison to Windows computers. The new M3 Pro gives you a relatively small advantage of around 10 % compared to the predecessor models and the large M3 Pro GPU can keep up with the RTX 4050 Laptop or a slower variant of the RTX 4060 Laptop. In our OpenCL test from Geekbench, the GeForce CPUs did much better.

During the 3DMark test, the new M3 Max GPU with 40 cores (maximum 60 watts) came 25 % ahead of the old M2 Max GPU with 38 cores (maximum 64 watts) and only 9 % behind the dedicated GeForce RTX 4090 Laptop with a TGP of 125 watts. However, the M3 Max GPU's OpenCL performance was again significantly worse and it even fell behind the GeForce RTX 4060 laptop (80-watt TGP).

3DMark / Wild Life Extreme Unlimited
NVIDIA GeForce RTX 4090 Laptop GPU
Asus ROG Zephyrus G14 GA402XY
34519 Points
Apple M3 Max 40-Core GPU
Apple MacBook Pro 14 2023 M3 Max
31403 Points
Apple M2 Max 38-Core GPU
Apple MacBook Pro 16 2023 M2 Max
25103 Points
NVIDIA GeForce RTX 4070 Laptop GPU
Asus ProArt Studiobook 16 OLED H7604
22642 Points
NVIDIA GeForce RTX 4060 Laptop GPU
Microsoft Surface Laptop Studio 2 RTX 4060
15268 Points
NVIDIA GeForce RTX 4050 Laptop GPU
Lenovo Yoga Pro 9-14IRP G8
15208 Points
Apple M3 Pro 18-Core GPU
Apple MacBook Pro 16 2023 M3 Pro
14545 Points
Apple M2 Pro 19-Core GPU
Apple MacBook Pro 14 2023 M2 Pro
12968 Points
Apple M3 Pro 14-Core GPU
Apple MacBook Pro 14 2023 M3 Pro
12094 Points
Apple M2 Pro 16-Core GPU
Apple MacBook Pro 14 2023 M2 Pro Entry
11224 Points
Apple M1 Pro 16-Core GPU
Apple MacBook Pro 16 2021 M1 Pro
10352 Points
NVIDIA GeForce RTX 3050 Ti Laptop GPU
SCHENKER Vision 14 2022 RTX 3050 Ti
9340 Points
AMD Radeon 780M
Lenovo Yoga Slim 7 14APU G8
5465 Points
Geekbench 5.5 / Metal Score
Apple M3 Max 40-Core GPU
Apple MacBook Pro 14 2023 M3 Max
100376 Points
Apple M2 Max 38-Core GPU
Apple MacBook Pro 16 2023 M2 Max
86678 Points
Apple M3 Pro 18-Core GPU
Apple MacBook Pro 16 2023 M3 Pro
55240 Points
Apple M2 Pro 19-Core GPU
Apple MacBook Pro 14 2023 M2 Pro
52054 Points
Apple M2 Pro 16-Core GPU
Apple MacBook Pro 14 2023 M2 Pro Entry
46834 Points
Apple M3 Pro 14-Core GPU
Apple MacBook Pro 14 2023 M3 Pro
46145 Points
Apple M1 Pro 16-Core GPU
Apple MacBook Pro 16 2021 M1 Pro
42115 Points
Geekbench 5.5 / OpenCL Score
NVIDIA GeForce RTX 4090 Laptop GPU
Asus ROG Zephyrus G14 GA402XY
181222 Points
NVIDIA GeForce RTX 4070 Laptop GPU
Asus ProArt Studiobook 16 OLED H7604
120093 Points
NVIDIA GeForce RTX 4060 Laptop GPU
Microsoft Surface Laptop Studio 2 RTX 4060
95081 Points
Apple M3 Max 40-Core GPU
Apple MacBook Pro 14 2023 M3 Max
93147 Points
NVIDIA GeForce RTX 4050 Laptop GPU
Lenovo Yoga Pro 9-14IRP G8
86275 Points
Apple M2 Max 38-Core GPU
Apple MacBook Pro 16 2023 M2 Max
71726 Points
NVIDIA GeForce RTX 3050 Ti Laptop GPU
SCHENKER Vision 14 2022 RTX 3050 Ti
61067 Points
Apple M3 Pro 18-Core GPU
Apple MacBook Pro 16 2023 M3 Pro
52441 Points
Apple M2 Pro 19-Core GPU
Apple MacBook Pro 14 2023 M2 Pro
46941 Points
Apple M3 Pro 14-Core GPU
Apple MacBook Pro 14 2023 M3 Pro
45348 Points
Apple M2 Pro 16-Core GPU
Apple MacBook Pro 14 2023 M2 Pro Entry
42483 Points
Apple M1 Pro 16-Core GPU
Apple MacBook Pro 16 2021 M1 Pro
37867 Points
AMD Radeon 780M
Lenovo Yoga Slim 7 14APU G8
36162 Points
GFXBench / Aztec Ruins High Tier Offscreen
Apple M3 Max 40-Core GPU
Apple MacBook Pro 14 2023 M3 Max
416 fps
Apple M2 Max 38-Core GPU
Apple MacBook Pro 16 2023 M2 Max
397.6 fps
Apple M3 Pro 18-Core GPU
Apple MacBook Pro 16 2023 M3 Pro
219.7 fps
Apple M2 Pro 19-Core GPU
Apple MacBook Pro 14 2023 M2 Pro
210.4 fps
Apple M2 Pro 16-Core GPU
Apple MacBook Pro 14 2023 M2 Pro Entry
181.1 fps
Apple M3 Pro 14-Core GPU
Apple MacBook Pro 14 2023 M3 Pro
178.7 fps
Apple M1 Pro 16-Core GPU
Apple MacBook Pro 16 2021 M1 Pro
166 fps

When looking at efficiency, we have to reach for the Windows game The Witcher 3, as this gives us the most comparative values and the CPU load is quite low. Of course, this is not an optimal starting situation for the MacBooks and the resulting values are not fully comparable with Windows laptops, as only the emulated version runs on the Macs via CrossOver. This naturally also costs some performance. With last year's M2 Pro models, we also carried out the test on MacBooks for the first time and they were able to take the lead in the comparison field.

The new M3 models (both M3 Pro versions and M3 Max) came out on top despite these poor conditions, although the RTX 4090 Laptop (125 watts) in the Asus ROG Zephyrus G14 wasn't much worse and it, of course, offers significantly more gaming performance overall.

Power Consumption - Witcher 3 ultra Efficiency (external Monitor)
Apple M3 Pro 14-Core GPU
Apple MacBook Pro 14 2023 M3 Pro
1.189 fps per Watt
Apple M3 Pro 18-Core GPU
Apple MacBook Pro 16 2023 M3 Pro
1.075 fps per Watt
Apple M3 Max 40-Core GPU
Apple MacBook Pro 14 2023 M3 Max
1.049 fps per Watt
Apple M2 Pro 19-Core GPU
Apple MacBook Pro 14 2023 M2 Pro
1.028 fps per Watt
NVIDIA GeForce RTX 4090 Laptop GPU
Asus ROG Zephyrus G14 GA402XY
0.947 fps per Watt
Apple M2 Max 38-Core GPU
Apple MacBook Pro 16 2023 M2 Max
0.942 fps per Watt
Apple M2 Pro 16-Core GPU
Apple MacBook Pro 14 2023 M2 Pro Entry
0.941 fps per Watt
NVIDIA GeForce RTX 4060 Laptop GPU
Microsoft Surface Laptop Studio 2 RTX 4060
0.764 fps per Watt
NVIDIA GeForce RTX 4090 Laptop GPU
Asus Zephyrus Duo 16 GX650PY-NM006W
0.732 fps per Watt
NVIDIA GeForce RTX 4050 Laptop GPU
Lenovo Yoga Pro 9-14IRP G8
0.619 fps per Watt
NVIDIA GeForce RTX 4070 Laptop GPU
Asus ProArt Studiobook 16 OLED H7604
0.553 fps per Watt
AMD Radeon 780M
Lenovo Yoga Slim 7 14APU G8
0.495 fps per Watt
NVIDIA GeForce RTX 3050 Ti Laptop GPU
SCHENKER Vision 14 2022 RTX 3050 Ti
0.4933 fps per Watt

Apple M3 Pro/Max vs. Qualcomm Snapdragon X Elite

Prior to the new M3 MacBooks being announced, Qualcomm presented its new Snapdragon X Elite SoC and also published some benchmark results that are able to provide us with a good comparison. Two systems were shown, one with a reference design of 23 watts and one with 80 watts.

In terms of CPU performance, the Snapdragon performs well overall. Although the M3 models were faster in the single-core tests, their lead wasn't all too large. In the Cinebench 2024 multi-core test, however, the reference system with 23 watts came ahead of the M3 and the M3 Pro with 11 CPU cores and the gap to the M3 Pro with 12 CPU cores was only 10 %. The 80-watt system did better than the M3 Pro models, but it couldn't keep up with the new M3 Max with 16 CPU cores when it came to performance.

Cinebench 2024: CPU Multi Core | CPU Single Core | Geekbench 6.2: Multi-Core | Single-Core
Cinebench 2024 / CPU Multi Core
Apple MacBook Pro 14 2023 M3 Max
M3 Max 40-Core GPU, Apple M3 Max 16-Core, Apple SSD AP2048Z
1532 Points
SD X Elite Reference 80W
SD X Elite Adreno GPU , Snapdragon X Elite
1220 Points
Apple MacBook Pro 16 2023 M3 Pro
M3 Pro 18-Core GPU, Apple M3 Pro 12-Core, Apple SSD AP0512Z
1059 Points
SD X Elite Reference 23W
SD X Elite Adreno GPU , Snapdragon X Elite
950 Points
Apple MacBook Pro 14 2023 M3 Pro
M3 Pro 14-Core GPU, Apple M3 Pro 11-Core, Apple SSD AP0512Z
908 Points
Apple MacBook Pro 14 2023 M3
M3 10-Core GPU, M3, Apple SSD AP1024Z
712 Points
Cinebench 2024 / CPU Single Core
Apple MacBook Pro 14 2023 M3 Pro
M3 Pro 14-Core GPU, Apple M3 Pro 11-Core, Apple SSD AP0512Z
144 Points
Apple MacBook Pro 16 2023 M3 Pro
M3 Pro 18-Core GPU, Apple M3 Pro 12-Core, Apple SSD AP0512Z
143 Points
Apple MacBook Pro 14 2023 M3
M3 10-Core GPU, M3, Apple SSD AP1024Z
140 Points
Apple MacBook Pro 14 2023 M3 Max
M3 Max 40-Core GPU, Apple M3 Max 16-Core, Apple SSD AP2048Z
140 Points
SD X Elite Reference 80W
SD X Elite Adreno GPU , Snapdragon X Elite
133 Points
SD X Elite Reference 23W
SD X Elite Adreno GPU , Snapdragon X Elite
124 Points
Geekbench 6.2 / Multi-Core
Apple MacBook Pro 14 2023 M3 Max
M3 Max 40-Core GPU, Apple M3 Max 16-Core, Apple SSD AP2048Z
21264 Points
Apple MacBook Pro 16 2023 M3 Pro
M3 Pro 18-Core GPU, Apple M3 Pro 12-Core, Apple SSD AP0512Z
15480 Points
SD X Elite Reference 80W
SD X Elite Adreno GPU , Snapdragon X Elite
15239 Points
Apple MacBook Pro 14 2023 M3 Pro
M3 Pro 14-Core GPU, Apple M3 Pro 11-Core, Apple SSD AP0512Z
14412 Points
SD X Elite Reference 23W
SD X Elite Adreno GPU , Snapdragon X Elite
14056 Points
Apple MacBook Pro 14 2023 M3
M3 10-Core GPU, M3, Apple SSD AP1024Z
11966 Points
Geekbench 6.2 / Single-Core
Apple MacBook Pro 14 2023 M3 Max
M3 Max 40-Core GPU, Apple M3 Max 16-Core, Apple SSD AP2048Z
3157 Points
Apple MacBook Pro 16 2023 M3 Pro
M3 Pro 18-Core GPU, Apple M3 Pro 12-Core, Apple SSD AP0512Z
3138 Points
Apple MacBook Pro 14 2023 M3 Pro
M3 Pro 14-Core GPU, Apple M3 Pro 11-Core, Apple SSD AP0512Z
3113 Points
Apple MacBook Pro 14 2023 M3
M3 10-Core GPU, M3, Apple SSD AP1024Z
3099 Points
SD X Elite Reference 80W
SD X Elite Adreno GPU , Snapdragon X Elite
2966 Points
SD X Elite Reference 23W
SD X Elite Adreno GPU , Snapdragon X Elite
2777 Points

The GPU performance looks worse, as even the more powerful 80-watt reference system of the Snapdragon X Elite can only beat the 10-core GPU of the normal Apple M3, but all other GPUs of the M3 Pro/Max models are more powerful.

GFXBench - 1920x1080 Aztec Ruins Normal Tier Offscreen
Apple MacBook Pro 14 2023 M3 Max
M3 Max 40-Core GPU, Apple M3 Max 16-Core, Apple SSD AP2048Z
858 fps
Apple MacBook Pro 16 2023 M3 Pro
M3 Pro 18-Core GPU, Apple M3 Pro 12-Core, Apple SSD AP0512Z
580 fps
Apple MacBook Pro 14 2023 M3 Pro
M3 Pro 14-Core GPU, Apple M3 Pro 11-Core, Apple SSD AP0512Z
481.9 fps
SD X Elite Reference 80W
SD X Elite Adreno GPU , Snapdragon X Elite
356 fps
Apple MacBook Pro 14 2023 M3
M3 10-Core GPU, M3, Apple SSD AP1024Z
329.6 fps
SD X Elite Reference 23W
SD X Elite Adreno GPU , Snapdragon X Elite
294 fps

Verdict - The M3 Max is now the undisputed Apple flagship

We already saw in our analysis of the base M3 SoC that Apple was able to increase its clock rates thanks to a new 3 nm production — without increasing the power consumption. This, of course, applies to the new variants of the M3 Pro and M3 Max, too. As the actual cores are also identical, there are no significant differences in single-core performance between the M3 variants, as was the case with the previous models. Apple was able to increase this by a massive 20 % compared to the M2 generation. As a result, Apple has overtaken AMD's Zen4 in one fell swoop and the gap to Intel's performance cores has been closed. Only the HX models such as the Core i9-13980HX still have an advantage thanks to their very high turbo clock, but this comes at the expense of power consumption, which is also reflected in their efficiency. 

Apple has massively upgraded its new M3 Max, because in addition to its more powerful GPU, it now also features a significantly faster CPU — while the new M3 Pro places a greater focus on efficiency. 

When it comes to multi-core performance, there are major differences in the M3 Pro/M3 Max, as Apple has changed their core configuration compared to the M2 generation. In addition, the CPU performance of the old M2 Pro/Max CPUs was identical, which is no longer the case. The new M3 Max has received twice the number of fast performance cores but in turn, it has sacrificed two efficiency cores. In addition to the more powerful GPUs, the M3 Max SoCs now also offer significantly more CPU performance compared to the M3 Pro. In comparison with AMD and Intel, the M3 Max is only beaten by the HX CPUs, which require significantly more power. This makes the MacBook Pro 14 with the M3 Max the fastest 14-inch laptop on the market when it comes to CPU performance, as the HX CPUs are only available from 16 inches upwards. Apple was also able to further increase its GPU performance, but its overall performance is still well behind the fast dedicated graphics cards.

With the M3 Max CPU, Apple has finally managed to close the gap to the fast AMD and Intel processors; only the Core HX models with a power consumption of significantly more than 100 watts offer even more multi-core performance.

When it comes to efficiency, Apple still has an advantage — especially over Intel — and we are curious to see whether the new Meteor Lake processors can change this. However, AMD can come much closer with its Zen4 processors. The Ryzen 7 7840U in particular is very efficient and can come quite close to Apple in the 30/25 watt range. The Apple GPUs now also offer more performance and cope very well with native games (such as Baldur's Gate 3 or No Man's Sky) and their efficiency is still very good — but nevertheless, dedicated graphics cards offer more overall performance and are still the better choice if you want to play a lot of games. However, Apple GPUs still have an advantage when it comes to video editing in particular, as they can access the shared RAM.

All in all, the new M3 generation is a clear step forward for Apple, as both performance and efficiency have been increased thanks to their new 3 nm production process. However, AMD is not far behind and the situation could change with its upcoming Zen5 chips. Intel lags behind, especially in terms of efficiency (and of course the integrated GPU), but this is exactly where the upcoming Meteor Lake generation should come in. The new Qualcomm Snapdragon X Elite seems to be able to keep up well, especially when it comes to CPU performance, but there is no concrete information on its availability yet.

Apple's MacBook Pro 14 with the M3 Max is the fastest 14-inch laptop when it comes to CPU performance.
Read all 6 comments / answer
static version load dynamic
Loading comments
Comment on this article
Please share our article, every link counts!
> Expert Reviews and News on Laptops, Smartphones and Tech Innovations > Reviews > Apple M3 Pro & M3 Max analysis - Apple has significantly upgraded its Max CPU
Andreas Osthoff, 2023-12-14 (Update: 2023-12-14)