Qualcomm Adreno 680 vs ARM Mali-G71 MP20 vs Qualcomm Adreno 644
Qualcomm Adreno 680 ► remove from comparison
The Qualcomm Adreno 680 is an integrated graphics card in the Qualcomm Snapdragon 8cx SoC for Windows laptops. According to Qualcomm it is 2x faster than the previous Adreno 630 in the Snapdragon 850 for Windows PCs with a 60% improved efficiency (thanks to the 7nm process). The performance should be similar to a Intel UHD Graphics 620 (e.g. in a 8th gen Core i5) when running native ARM64 compiled Windows apps and games. Running emulated 32 bit games (64 bit games compiled for AMD/Intel are not supported), the performance is notably slower.
ARM Mali-G71 MP20 ► remove from comparison
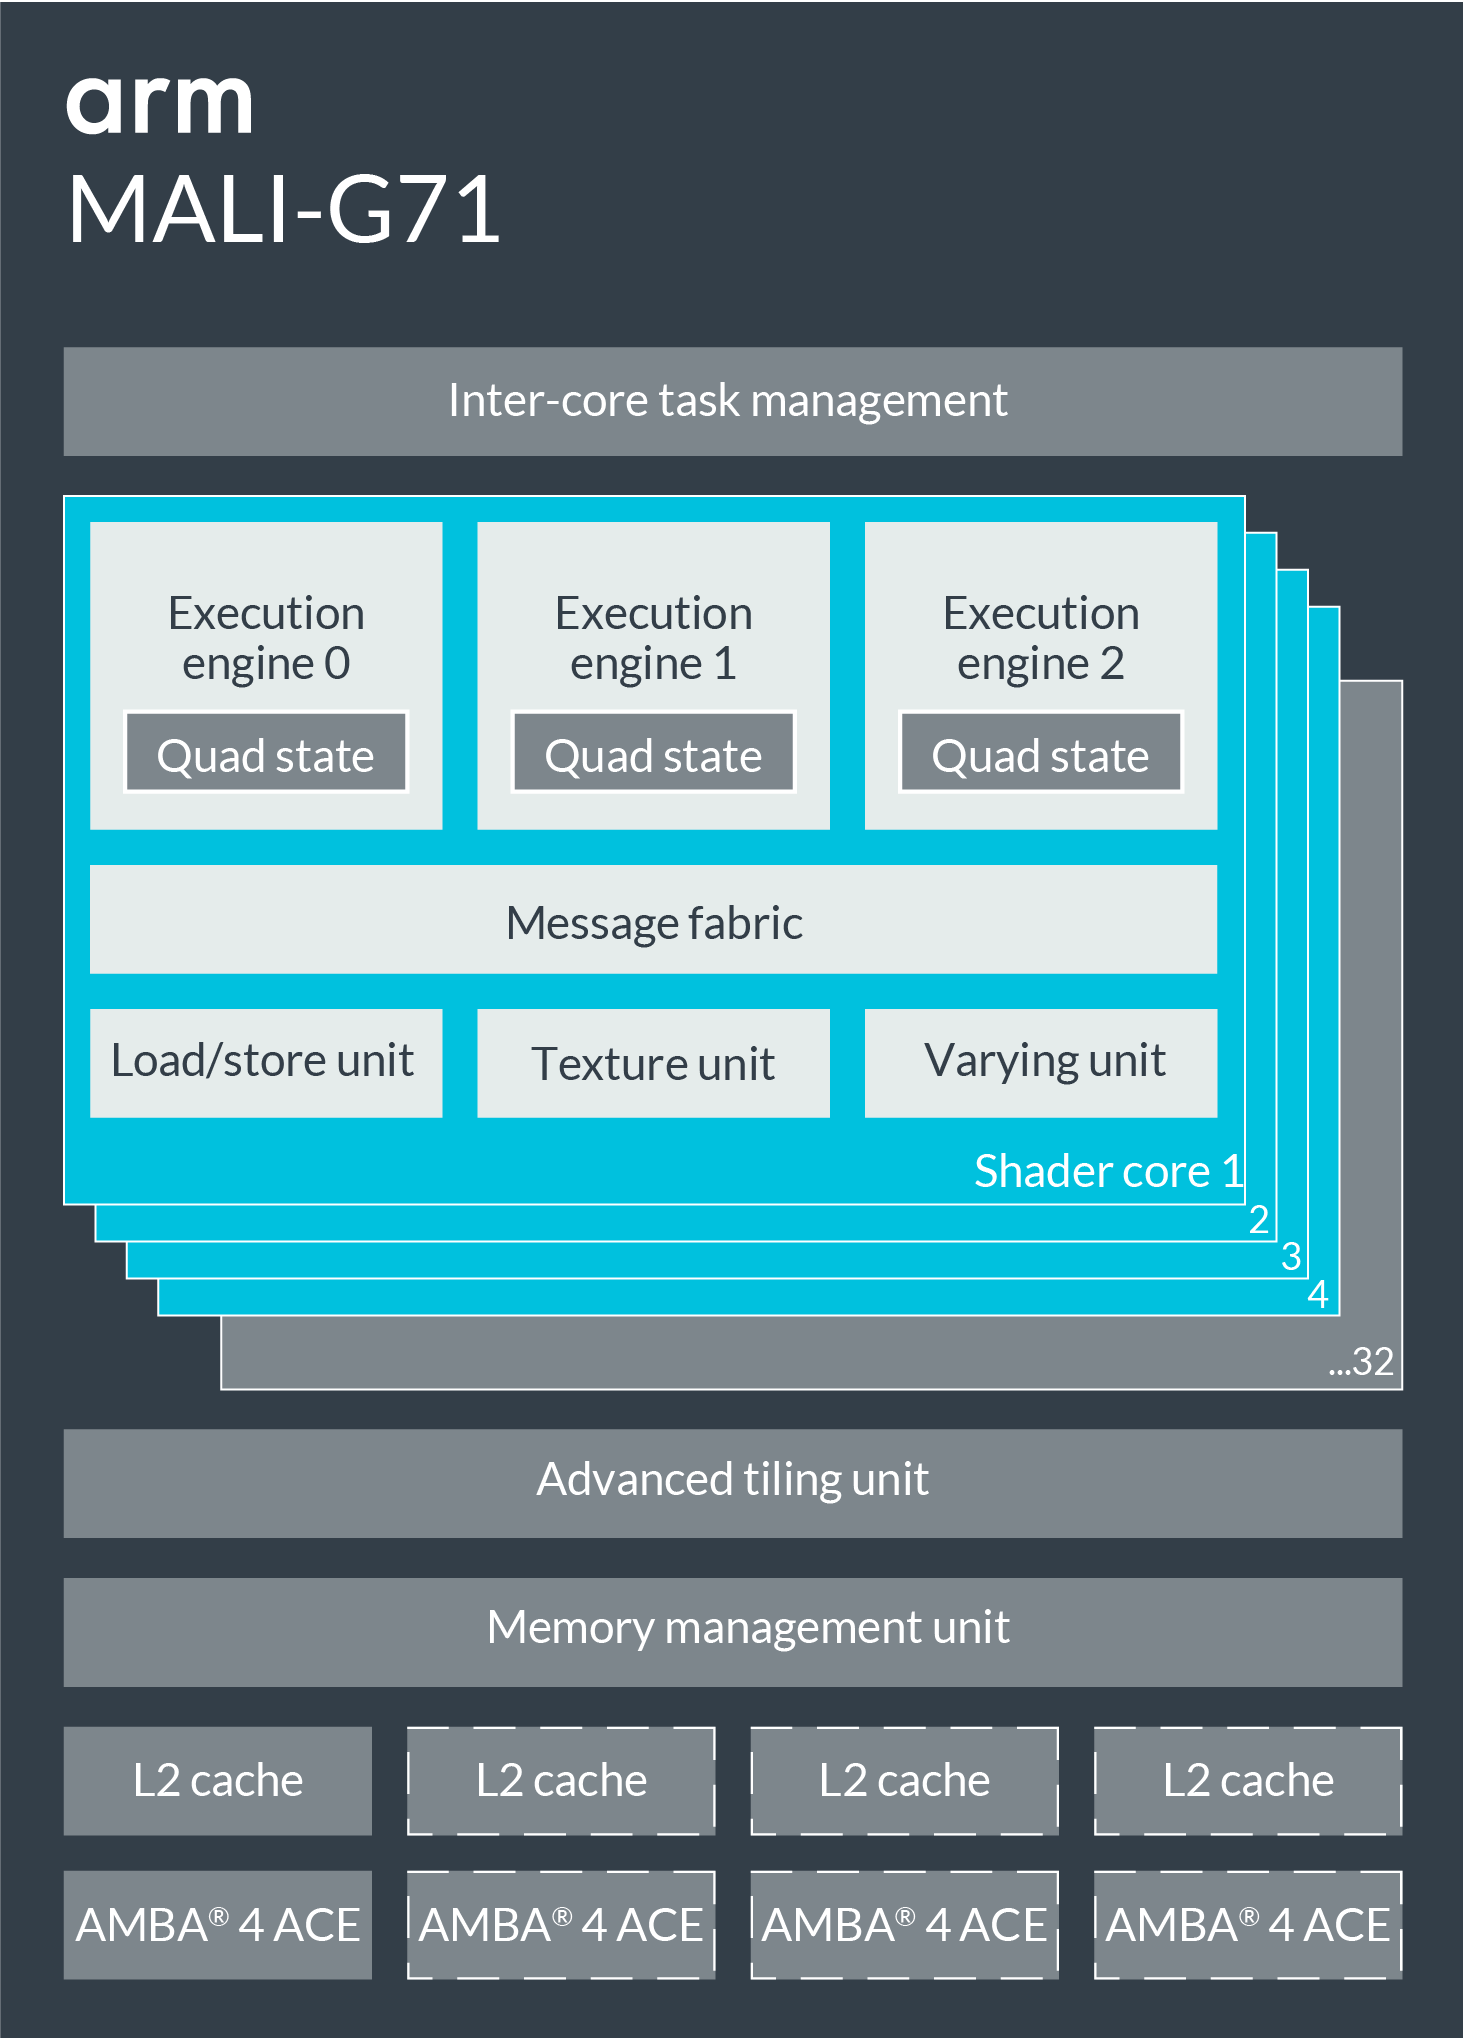
The ARM Mali-G71 MP20 is an integrated high-end graphics adapter for ARM SoCs, which was e.g. used in smartphone chip Samsung Exynos 9 8895 . It features 20 clusters and is manufactured in 10nm FinFET (in the Exynos 8895). The performance is in the high-end class and therefore all current Android games should run fluently on the chip.
Qualcomm Adreno 644 ► remove from comparison
The Qualcomm Adreno 644 is a smartphone and tablet GPU that is integrated within the Qualcomm Snapdragon 7 Gen 1 SoC. The chip was announced mid 2022 and was available in early 2023 in upper mid-range Android smartphones.
According to Qualcomm, the Adreno 644 GPU offers a 20% improved performance over the Adreno 642 , its predecessor, which is integrated in the Snapdragon 780G SoC. This is also thanks to the fast LPDDR5 with 3200 MHz. In our benchmarks with the Mi 13 Lite however, the performance was only on par with the old Adreno 642.
The Adreno 644 supports OpenCL 2.0 FP, OpenGL ES 3.2 and Vulkan 1.1.
The Snapdragon 7 Gen 1 is manufactured in the modern 4nm process with EUV at Samsung that should provide a good power efficiency.
Qualcomm Adreno 680 ARM Mali-G71 MP20 Qualcomm Adreno 644 Adreno 600 Series Shared Memory yes no yes API DirectX 12 OpenGL ES 3.2 OpenGL ES 3.2 Power Consumption 7 Watt technology 7 nm 16 nm 4 nm Date of Announcement 06.12.2018 29.03.2017 07.05.2021 Codename Mimir Architecture Bifrost Pipelines 8 - unified Core Speed 900 (Boost) MHz Link to Manufacturer Page www.arm.com Features OpenGL ES 3.2, OpenCL 2.0, DirectX 12, Vulkan 1.1 Predecessor Adreno 642
Benchmarks 3DMark - 3DMark Ice Storm Unlimited Graphics
min: 33077 avg: 35410 median: 36347 (4%) max: 36807 Points
3DMark - 3DMark Sling Shot (ES 3.0) Unlimited
min: 3222 avg: 3555 median: 3426 (15%) max: 4016 Points
min: 6303 avg: 6921 median: 6953.5 (30%) max: 7472 Points
3DMark - 3DMark Sling Shot (ES 3.0) Unlimited Graphics
min: 3896 avg: 4314 median: 4137 (9%) max: 4908 Points
min: 8656 avg: 8893 median: 8751 (19%) max: 9414 Points
3DMark - 3DMark Sling Shot Extreme (ES 3.1) Unlimited
min: 2648 avg: 3058 median: 3261 (16%) max: 3265 Points
min: 5501 avg: 6172 median: 6286 (31%) max: 6466 Points
3DMark - 3DMark Sling Shot Extreme (ES 3.1) Unlimited Graphics
min: 2723 avg: 3293 median: 3571 (11%) max: 3584 Points
min: 6767 avg: 7065 median: 7023 (21%) max: 7388 Points
3DMark - 3DMark Wild Life Unlimited
min: 3035 avg: 3133 median: 3143 (2%) max: 3184 Points
3DMark - 3DMark Wild Life Extreme Unlimited
min: 825 avg: 834 median: 829 (1%) max: 854 Points
3DMark 11 - 3DM11 Performance Score
min: 1650 avg: 1847 median: 1847 (3%) max: 2044 Points
3DMark 11 - 3DM11 Performance GPU
min: 1593 avg: 1936 median: 1935.5 (2%) max: 2278 Points
Cinebench R10 Cinebench R10 Shading (32bit) + Qualcomm Adreno 680 Cinebench R10 - Cinebench R10 Shading (32bit)
353 Points (0%)
GFXBench - GFXBench 5.0 4K Aztec Ruins High Tier Offscreen
min: 7 avg: 7.5 median: 7.5 (3%) max: 7.9 fps
GFXBench - GFXBench 5.0 Aztec Ruins High Tier Offscreen
min: 15 avg: 16.6 median: 17 (3%) max: 18 fps
GFXBench - GFXBench 5.0 Aztec Ruins Normal Tier Offscreen
min: 41 avg: 46 median: 47 (3%) max: 49 fps
GFXBench - GFXBench Car Chase Offscreen
25 fps (3%)
min: 37 avg: 38.2 median: 38 (4%) max: 40 fps
GFXBench 3.1 - GFXBench Manhattan ES 3.1 Offscreen
min: 24 avg: 36 median: 42 (1%) max: 42 fps
min: 52 avg: 62.4 median: 65 (1%) max: 67 fps
GFXBench 3.0 - GFXBench 3.0 Manhattan Offscreen
min: 50 avg: 54.3 median: 51 (3%) max: 62 fps
min: 86 avg: 89.2 median: 88 (5%) max: 94 fps
GFXBench (DX / GLBenchmark) 2.7 + Qualcomm Adreno 680 GFXBench (DX / GLBenchmark) 2.7 - GFXBench T-Rex HD Offscreen C24Z16
140.2 fps (1%)
GFXBench T-Rex HD Offscreen C24Z16 + ARM Mali-G71 MP20
min: 104 avg: 110 median: 105 (1%) max: 121 fps
GFXBench T-Rex HD Offscreen C24Z16 + Qualcomm Adreno 644
min: 147 avg: 150.2 median: 148 (1%) max: 158 fps
Antutu v9 - AnTuTu v9 GPU
min: 174679 avg: 177977 median: 175343 (22%) max: 187645 Points
Basemark X 1.1 - Basemark X 1.1 High Quality
min: 41022 avg: 41847 median: 42183 (96%) max: 42335 Points
Basemark X 1.1 - Basemark X 1.1 Medium Quality
min: 41901 avg: 43072 median: 43464 (97%) max: 43852 Points
Basemark GPU 1.2 - Basemark GPU 1.2 Vulkan Official Medium Offscreen 1080
min: 50.74 avg: 51.7 median: 51.7 (0%) max: 52.63 fps
Geekbench 6.2 - Geekbench 6.2 GPU OpenCL
min: 2496 avg: 2535 median: 2498 (1%) max: 2610 Points
Geekbench 6.2 - Geekbench 6.2 GPU Vulkan
min: 2650 avg: 2794 median: 2738 (1%) max: 2993 Points
ComputeMark v2.1 - ComputeMark v2.1 Result
1890 Points (2%)
PassMark PerformanceTest Mobile V1 - PerformanceTest Mobile V1 2D Graphics Tests
7552 Points (8%)
30029 Points (30%)
PassMark PerformanceTest Mobile V1 - PerformanceTest Mobile V1 3D Graphics Tests
2573 Points (5%)
42541 Points (74%)
Power Consumption - Furmark Stress Test Power Consumption - external Monitor *
12.6 Watt (2%)
Power Consumption - GFXBench Aztec Ruins Normal Tier Offscreen Power Consumption 150cd *
min: 4.19 avg: 4.8 median: 4.6 (2%) max: 5.9 Watt
Average Benchmarks Qualcomm Adreno 680 → 100% n=1 Average Benchmarks ARM Mali-G71 MP20 → 75% n=1 Average Benchmarks Qualcomm Adreno 644 → 106% n=1
- Range of benchmark values for this graphics card
- Average benchmark values for this graphics card
* Smaller numbers mean a higher performance
1 This benchmark is not used for the average calculation
Game Benchmarks The following benchmarks stem from our benchmarks of review laptops. The performance depends on the used graphics memory, clock rate, processor, system settings, drivers, and operating systems. So the results don't have to be representative for all laptops with this GPU. For detailed information on the benchmark results, click on the fps number.
Adreno 644:
42 [X] Motorola Razr 40 2.0.2
Qualcomm Snapdragon 7 Gen 1 1.8GHz
Adreno 644
min:
36 fps, max:
45 fps
fps
Adreno 644:
45 [X] Motorola Razr 40 2.0.2
Qualcomm Snapdragon 7 Gen 1 1.8GHz
Adreno 644
min:
40 fps, max:
46 fps
fps
Adreno 644:
45 [X] Motorola Razr 40 1.61.6
Qualcomm Snapdragon 7 Gen 1 1.8GHz
Adreno 644
min:
44 fps, max:
45 fps
89 [X] Xiaomi 13 Lite 1.61.6
Qualcomm Snapdragon 7 Gen 1 1.8GHz
Adreno 644
min:
84 fps, max:
90 fps
~ 67 fps
Adreno 644:
60 [X] Motorola Razr 40 2.7.0
Qualcomm Snapdragon 7 Gen 1 1.8GHz
Adreno 644
min:
56 fps, max:
60 fps
60 ~ 60 fps
Adreno 644:
40 [X] Honor 90 5G 2.7.0
Qualcomm Snapdragon 7 Gen 1 1.8GHz
Adreno 644
min:
37 fps, max:
41 fps
fps
Adreno 644:
40 [X] Xiaomi 13 Lite 2.5.0
Qualcomm Snapdragon 7 Gen 1 1.8GHz
Adreno 644
min:
34 fps, max:
41 fps
40 [X] Xiaomi 13 Lite 2.5.0
Qualcomm Snapdragon 7 Gen 1 1.8GHz
Adreno 644
min:
22 fps, max:
41 fps
40 [X] Motorola Razr 40 2.7.0
Qualcomm Snapdragon 7 Gen 1 1.8GHz
Adreno 644
min:
38 fps, max:
41 fps
40 [X] Honor 90 5G 2.7.0
Qualcomm Snapdragon 7 Gen 1 1.8GHz
Adreno 644
min:
37 fps, max:
41 fps
40 ~ 40 fps
Mali-G71 MP20:
30 30 30 ~ 30 fps
Adreno 644:
60 [X] Honor 90 5G 1.9.1
Qualcomm Snapdragon 7 Gen 1 1.8GHz
Adreno 644
min:
59 fps, max:
61 fps
fps
Mali-G71 MP20:
30 30 30 ~ 30 fps
Mali-G71 MP20:
29 30 30 ~ 30 fps
Adreno 644:
60 61 [X] Xiaomi 13 Lite 3.9.0
Qualcomm Snapdragon 7 Gen 1 1.8GHz
Adreno 644
min:
50 fps, max:
61 fps
~ 61 fps
Qualcomm Adreno 644 low med. high ultra QHD 4K Diablo Immortal 42 45 Armajet 67 PUBG Mobile 60 40 40 Dead Trigger 2 60 Subway Surfers 61 < 30 fps < 60 fps < 120 fps ≥ 120 fps 1 1 1 1 3 1
ARM Mali-G71 MP20 low med. high ultra QHD 4K Dead Trigger 2 30 Asphalt 8: Airborne 30 30 Temple Run 2 60 < 30 fps < 60 fps < 120 fps ≥ 120 fps 1 2 1
For more games that might be playable and a list of all games and graphics cards visit our Gaming List
v1.26
log 01. 07:33:48
#0 checking url part for id 9846 +0s ... 0s
#1 checking url part for id 7732 +0s ... 0s
#2 checking url part for id 11580 +0s ... 0s
#3 not redirecting to Ajax server +0s ... 0s
#4 did not recreate cache, as it is less than 5 days old! Created at Wed, 01 May 2024 05:36:19 +0200 +0.001s ... 0.001s
#5 composed specs +0.133s ... 0.134s
#6 did output specs +0s ... 0.134s
#7 start showIntegratedCPUs +0s ... 0.134s
#8 getting avg benchmarks for device 9846 +0.036s ... 0.17s
#9 got single benchmarks 9846 +0.012s ... 0.183s
#10 getting avg benchmarks for device 7732 +0.002s ... 0.184s
#11 got single benchmarks 7732 +0.009s ... 0.194s
#12 getting avg benchmarks for device 11580 +0.002s ... 0.195s
#13 got single benchmarks 11580 +0.013s ... 0.208s
#14 got avg benchmarks for devices +0s ... 0.208s
#15 min, max, avg, median took s +0.097s ... 0.305s
#16 before gaming benchmark output +0s ... 0.305s
#17 Got 25 rows for game benchmarks. +0.013s ... 0.319s
#18 composed SQL query for gamebenchmarks +0s ... 0.319s
#19 got data and put it in $dataArray +0.003s ... 0.322s
#20 benchmarks composed for output. +0.016s ... 0.338s
#21 calculated avg scores. +0s ... 0.338s
#22 return log +0.002s ... 0.34s
Please share our article, every link counts!
Redaktion, 2017-09- 8 (Update: 2023-07- 1)
 Deutsch
 English
 Español
 Français
 Italiano
 Nederlands
 Polski
 Português
 Русский
 Türkçe
 Svenska
 Chinese
 Magyar