 Deutsch
 English
 Español
 Français
 Italiano
 Nederlands
 Polski
 Português
 Русский
 Türkçe
 Svenska
 Chinese
 Magyar
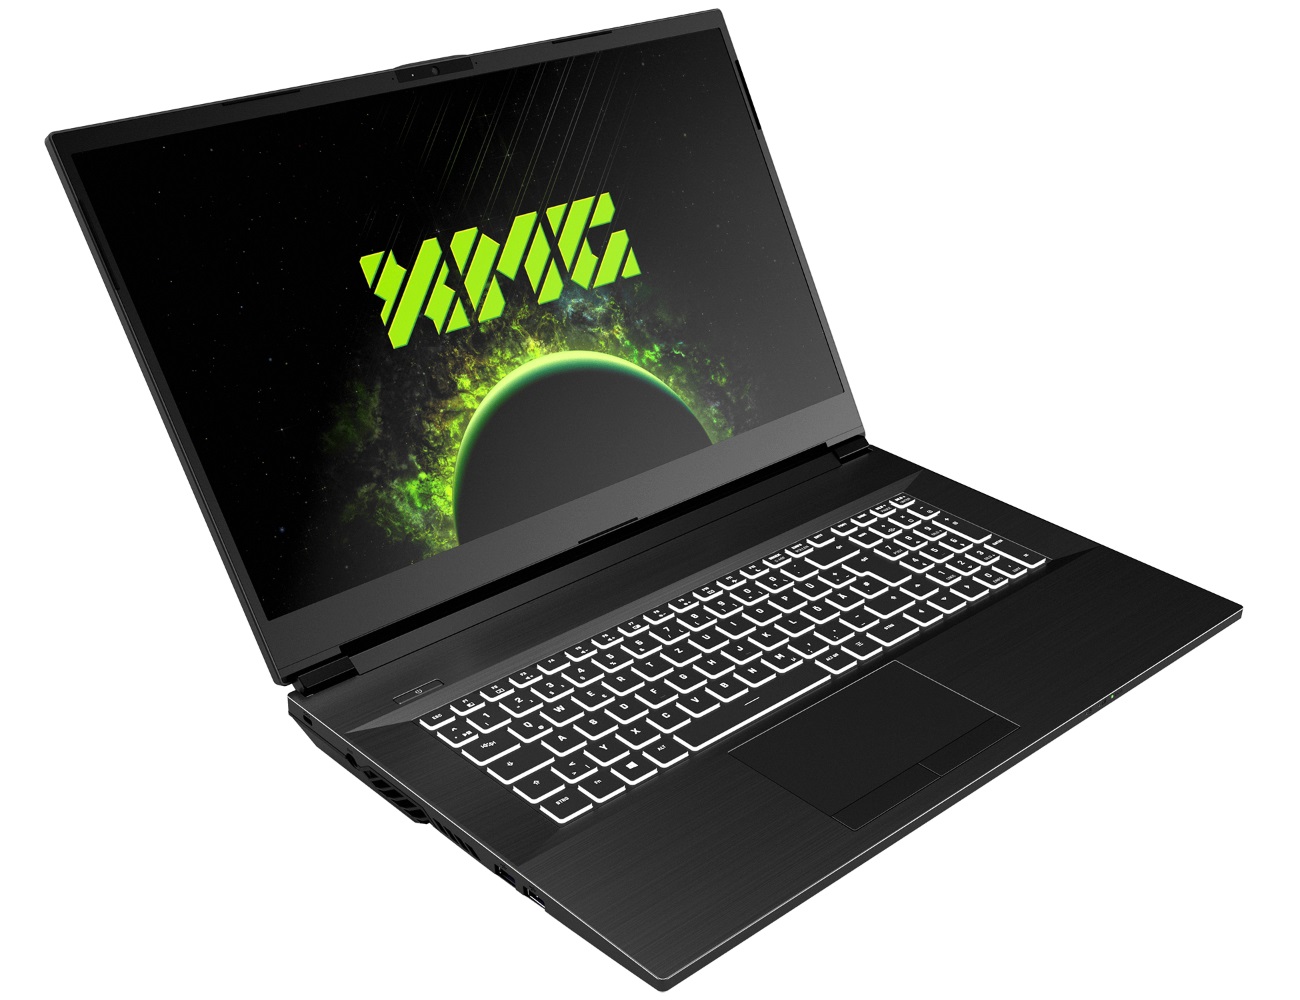
XMG Apex 17 (Clevo NH77ERQ) laptop review: For noise-resistant gamers

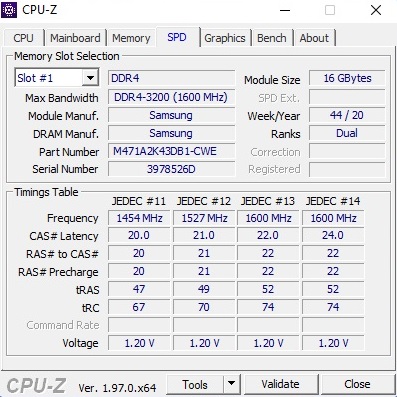
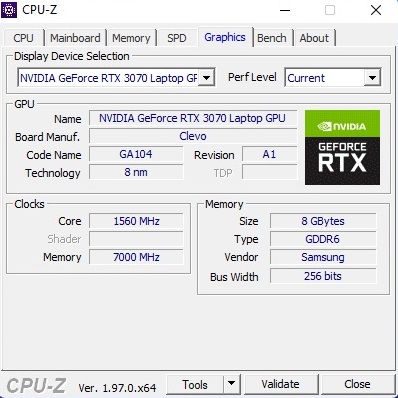
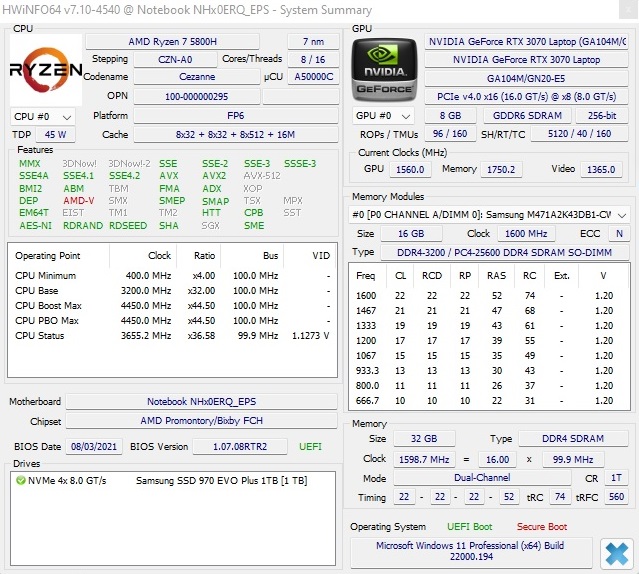
As known from Schenker Technologies, the device can be extensively configured in the in-house webshop bestware.com. While the processor is either a Ryzen 7 5800H or a Ryzen 9 5900HX, the graphics card is a GeForce RTX 3060 with 6 GB VRAM or a GeForce RTX 3070 with 8 GB VRAM. In either case, a matte 144 Hz IPS display takes care of the image reproduction. The DDR4 working memory ranges from 8 to a maximum of 64 GB (2x SO-DIMM). Otherwise, the 17-inch case accommodates up to two M.2 SSDs (PCIe 3.0 x4). Buyers can also influence the WLAN module, the keyboard's language and the operating system.
The price of the Apex 17 starts at 1,479 Euros (~$1,692). Our test configuration with Ryzen 7 5800H, GeForce RTX 3070, 32 GB dual-channel RAM and 1 TB SSD would currently cost over 2,000 Euros (~$2,289).
Competitors of the Apex 17 include other 17-inch gaming notebooks with the RTX 3070, like the Razer Blade 17, the MSI GP76, the Acer Nitro 5 AN517 and the in-house XMG Neo 17. All of these laptops appear in the tables as comparison devices.
Possible competitors in comparison
Rating | Date | Model | Weight | Height | Size | Resolution | Best Price |
|---|---|---|---|---|---|---|---|
| 83.4 % | 11/2021 | SCHENKER XMG Apex 17 M21 R7 5800H, GeForce RTX 3070 Laptop GPU | 2.6 kg | 32.4 mm | 17.30" | 1920x1080 | |
| 85.1 % | 01/2021 | SCHENKER XMG Neo 17 (Early 2021, RTX 3070, 5800H) R7 5800H, GeForce RTX 3070 Laptop GPU | 2.5 kg | 27 mm | 17.30" | 2560x1440 | |
| 89.4 % | 09/2021 | Razer Blade 17 RTX 3070 i7-11800H, GeForce RTX 3070 Laptop GPU | 2.8 kg | 19.9 mm | 17.30" | 1920x1080 | |
| 85.1 % | 03/2021 | MSI GP76 Leopard 10UG i7-10750H, GeForce RTX 3070 Laptop GPU | 2.9 kg | 26 mm | 17.30" | 1920x1080 | |
| 81.3 % | 08/2021 | Acer Nitro 5 AN517-41-R5Z7 R7 5800H, GeForce RTX 3070 Laptop GPU | 2.7 kg | 24.9 mm | 17.30" | 1920x1080 |
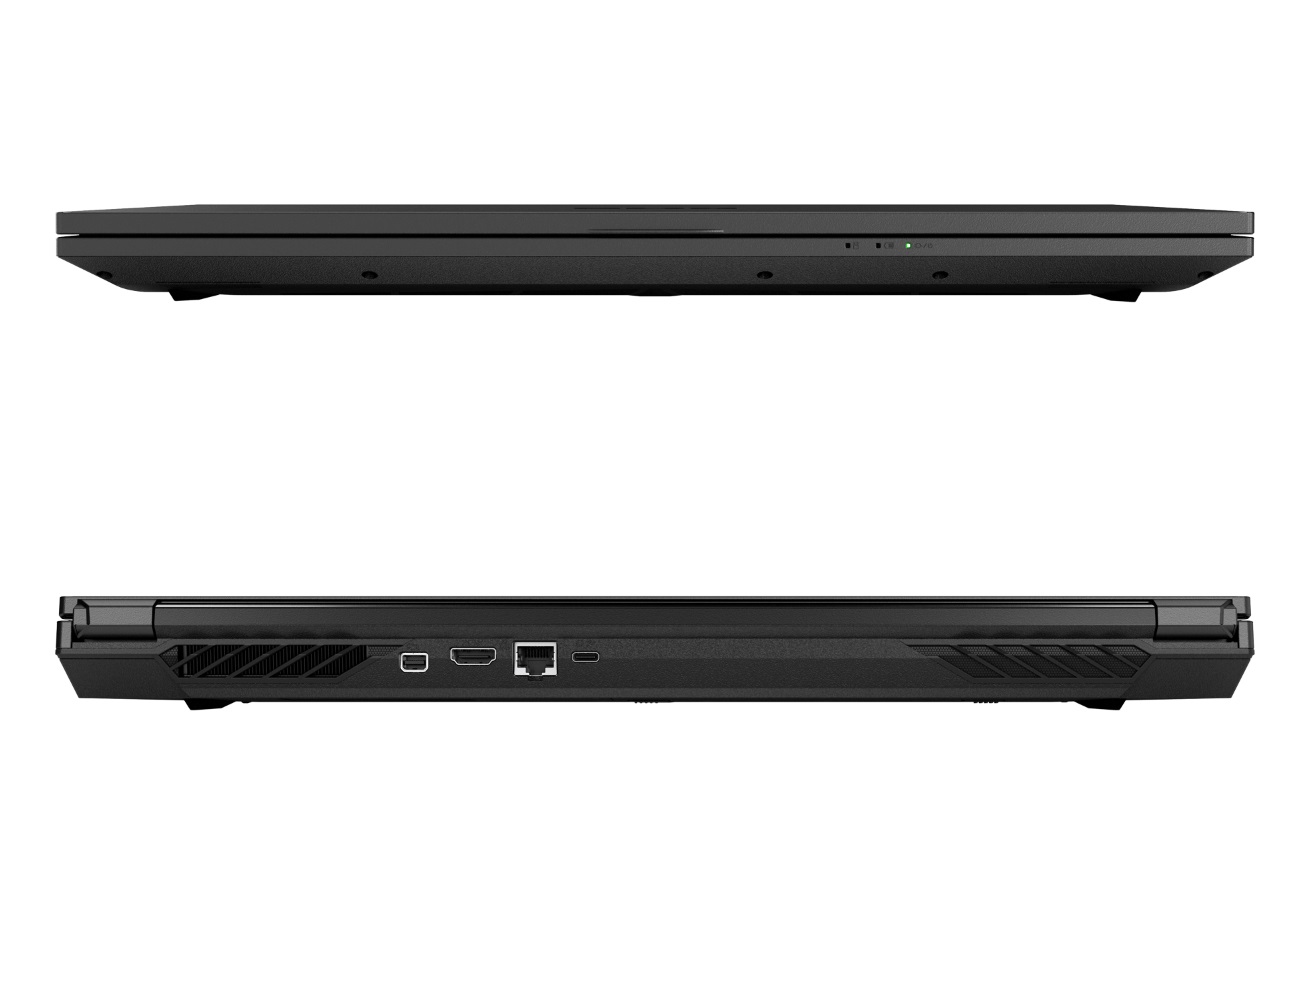
Since the Apex 17 is almost identical in construction to the recently tested Gigabyte A7 X1 (Clevo barebone), we will not go further into the case, the equipment and the input devices in this article. You can find the corresponding information in the linked review.
Communication
Webcam


Display
The display used differs from the A7 X1 despite identical basic specifications (Full HD, 144 Hz, IPS). Instead of an AU Optronics panel, the Schenker notebook uses a panel from LG Philips, which unfortunately does not quite match the Gigabyte counterpart. Besides the brightness, the contrast is also weaker. An average of 285 cd/m² and 823:1 are quite low in the price range of around 2000 Euros (~$2,289). The QHD panel of the XMG Neo 17 with 381 cd/m² and 1108:1 shows how it can be better.
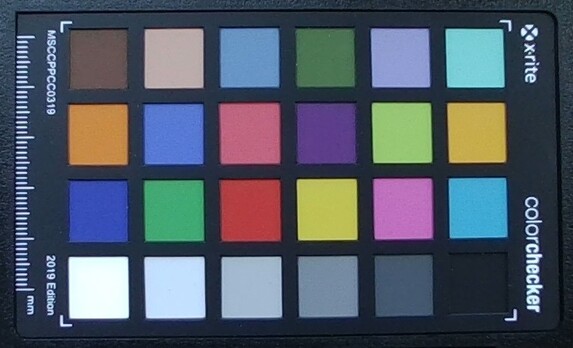
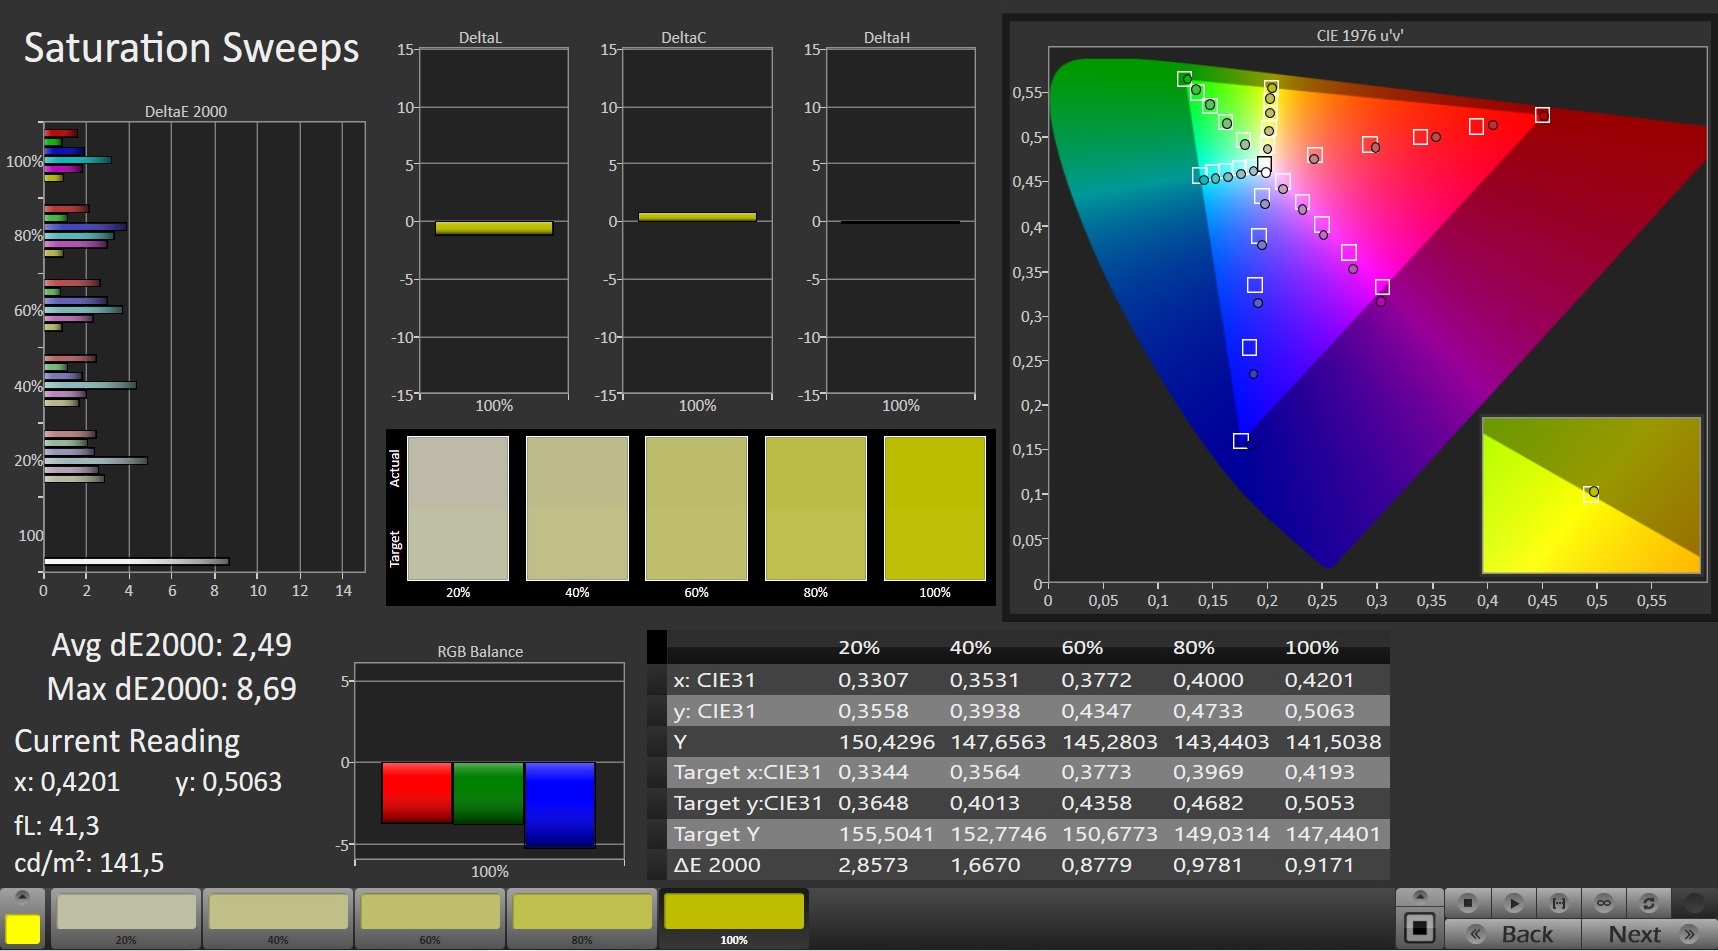
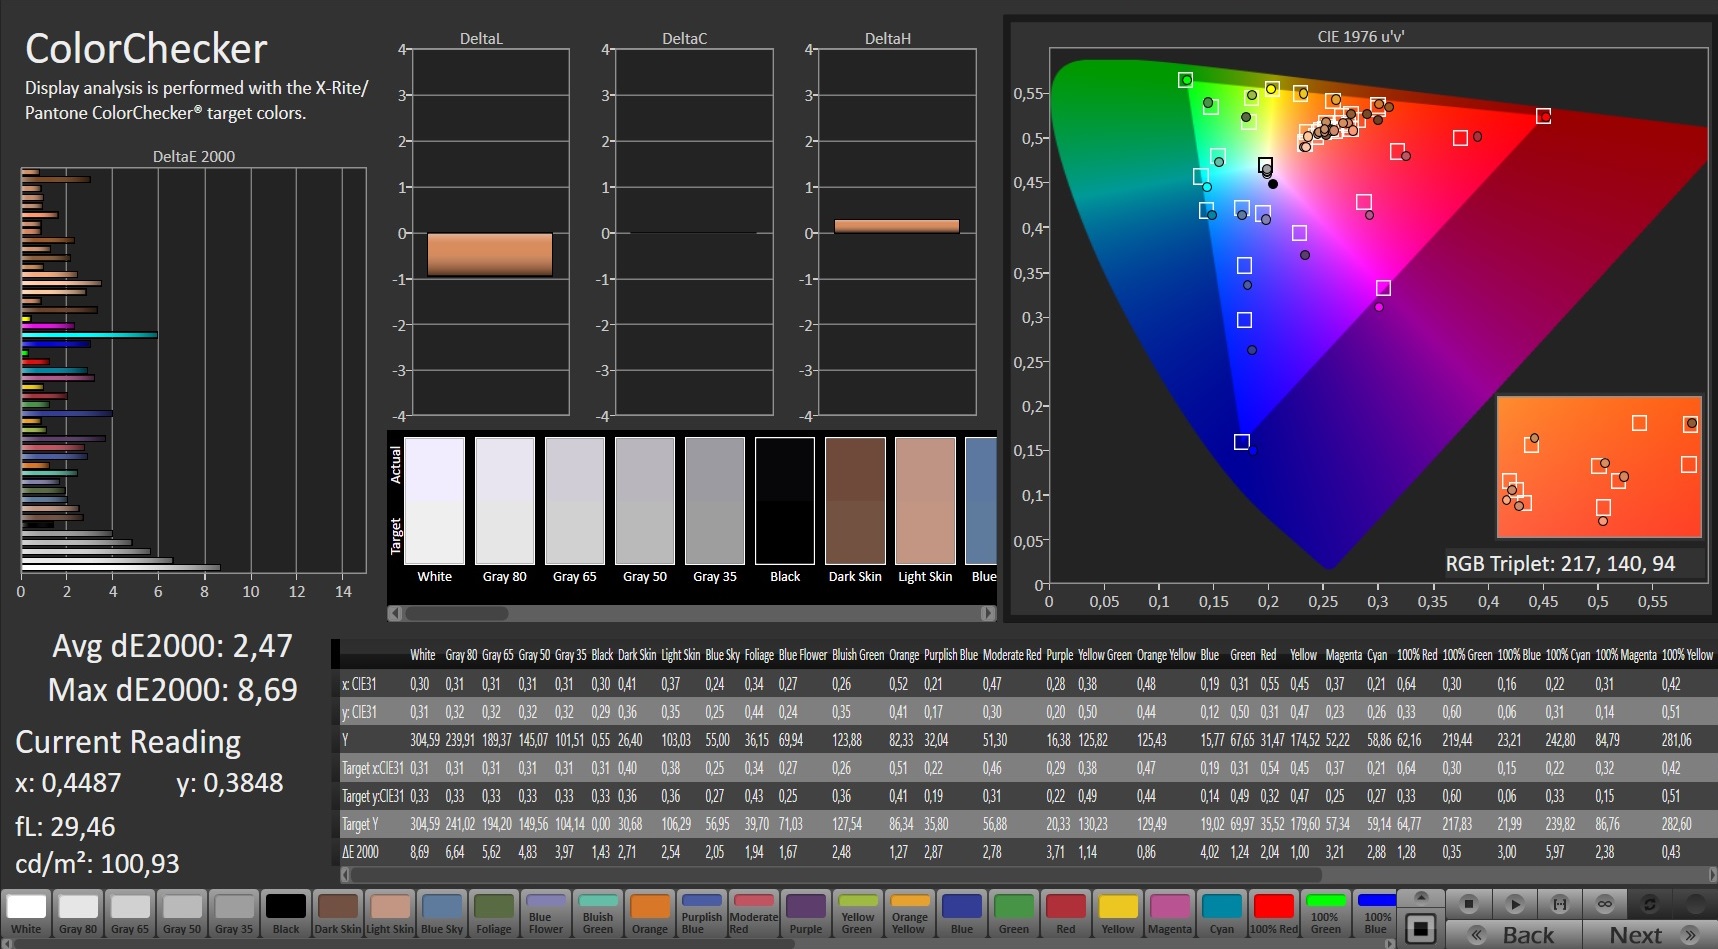
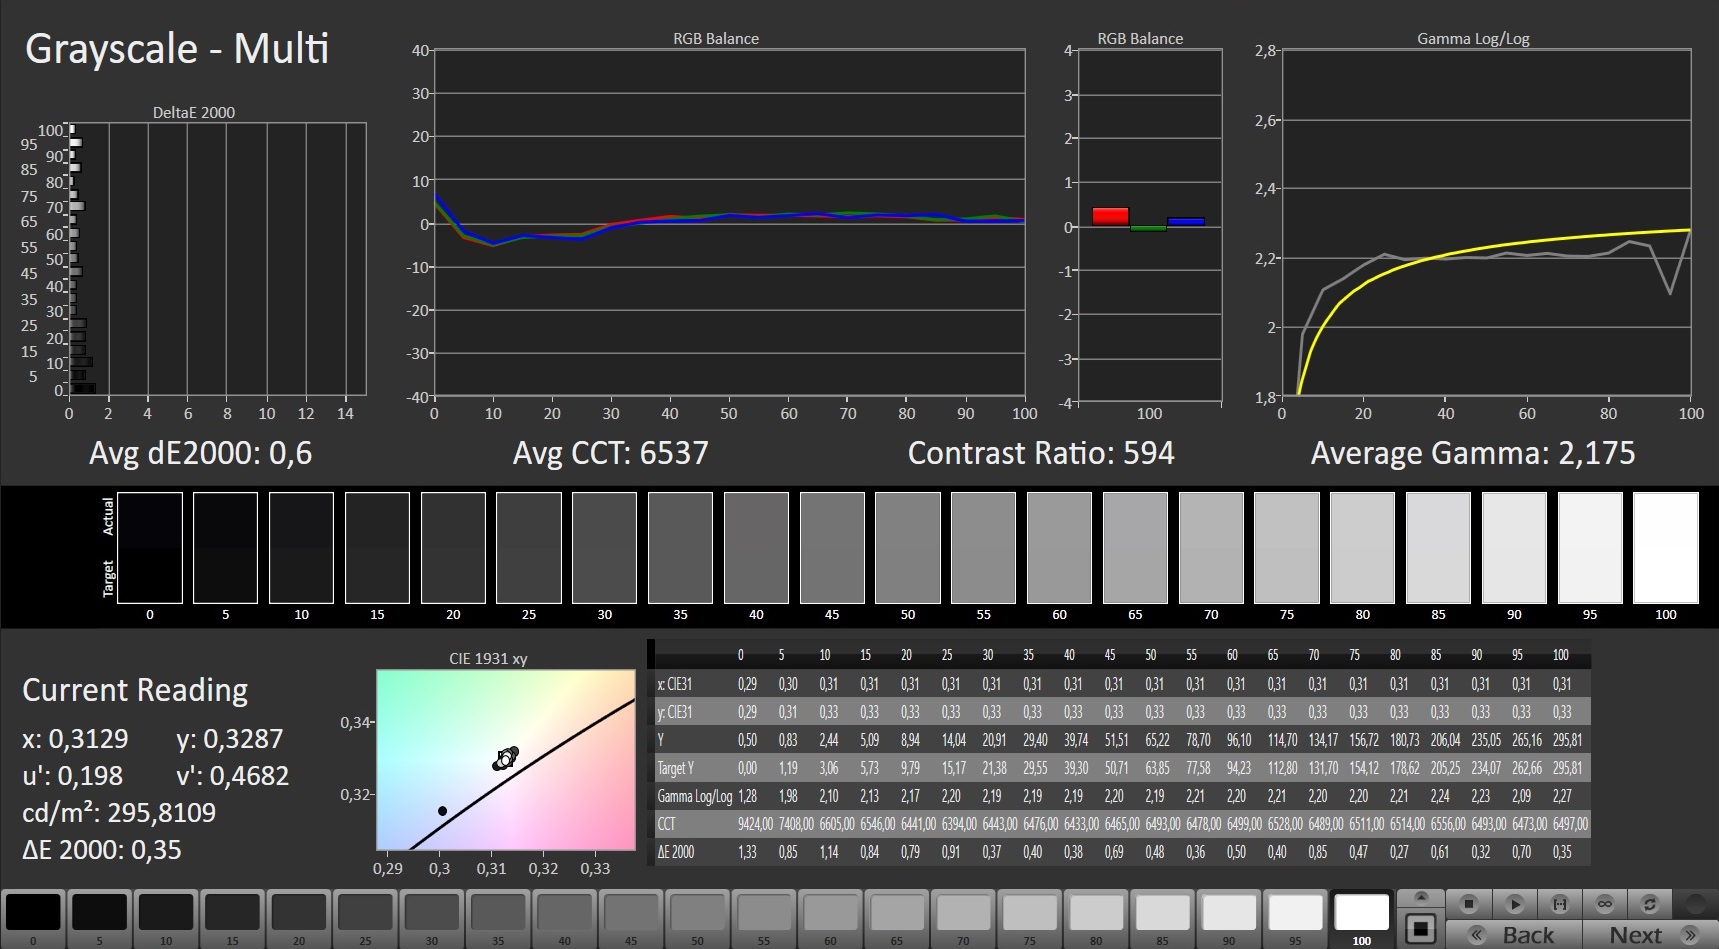
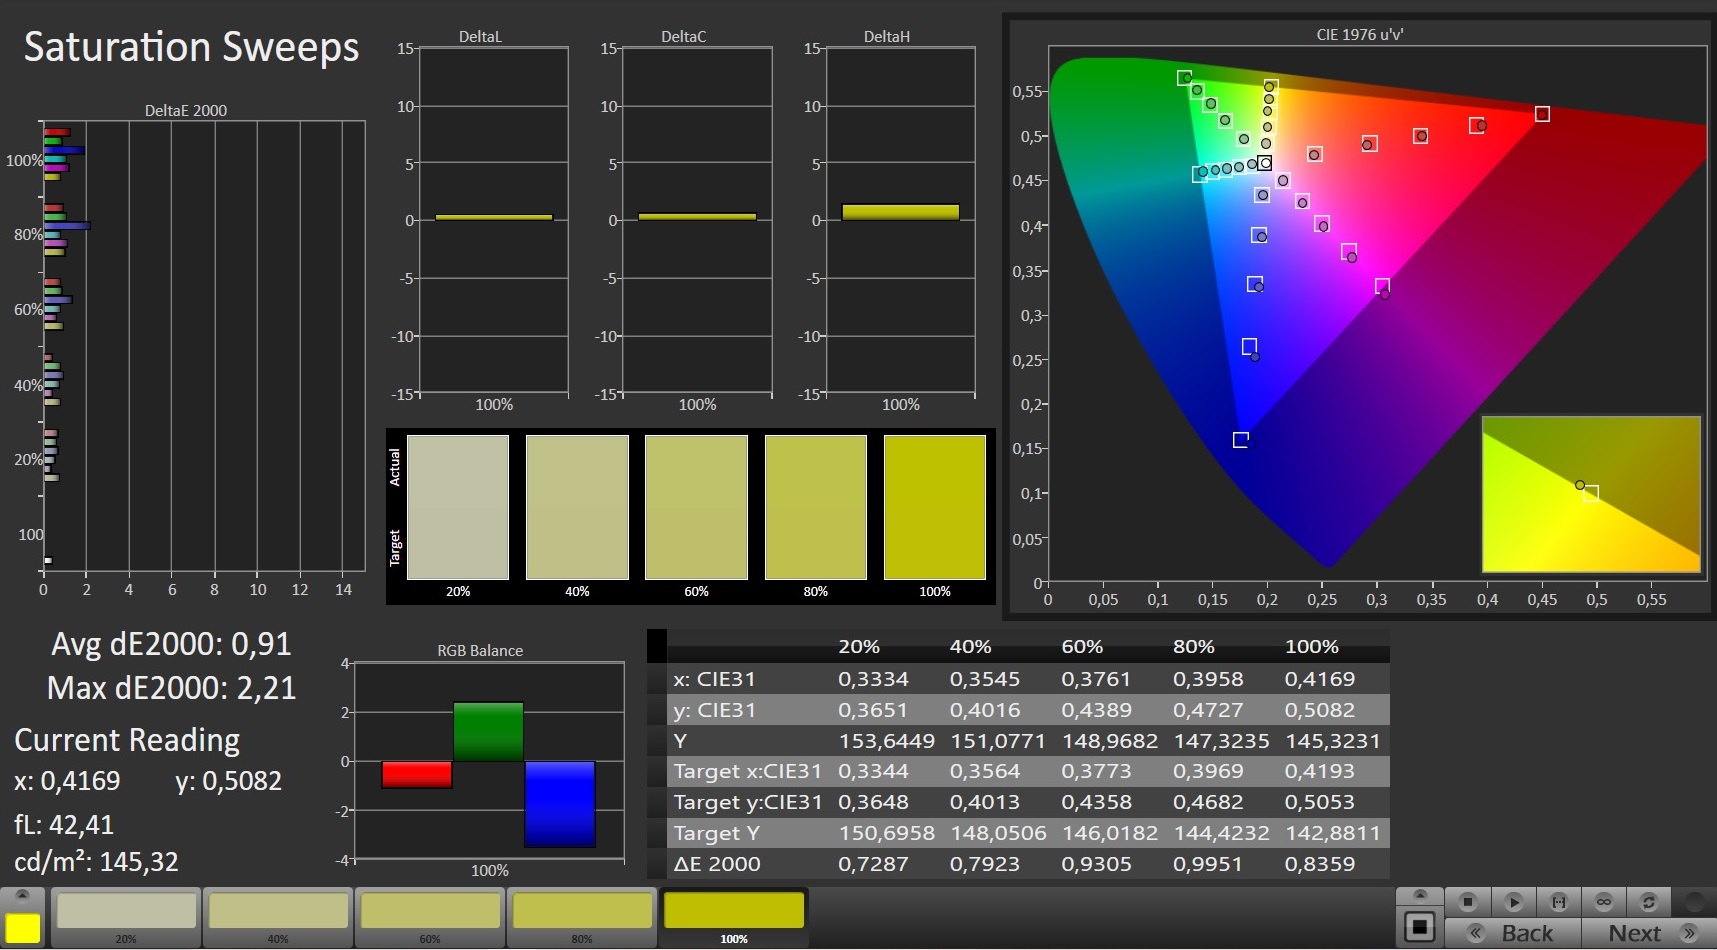
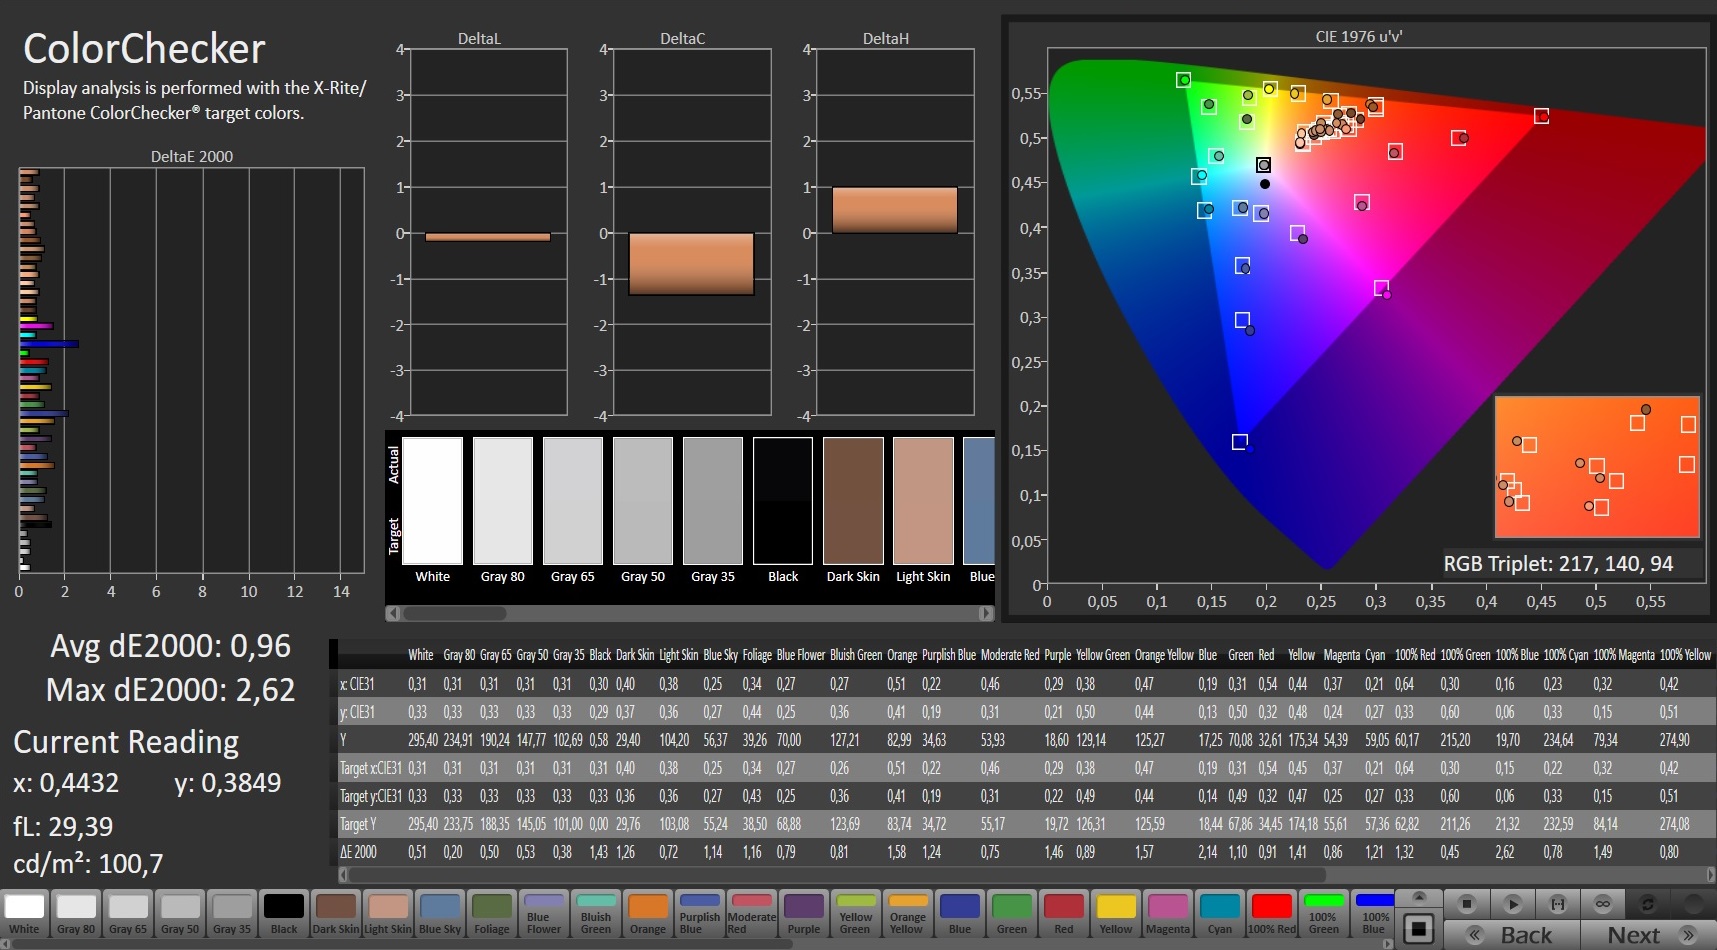
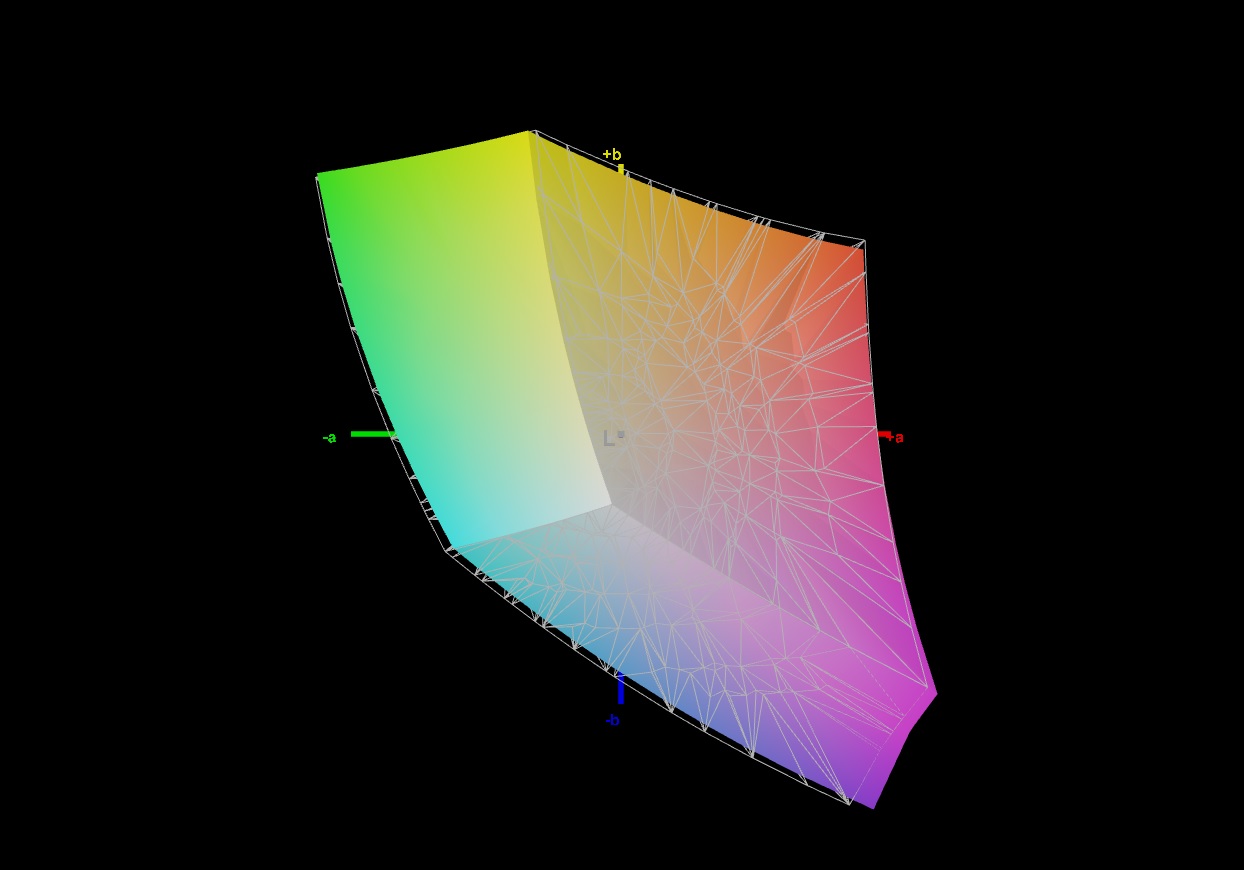
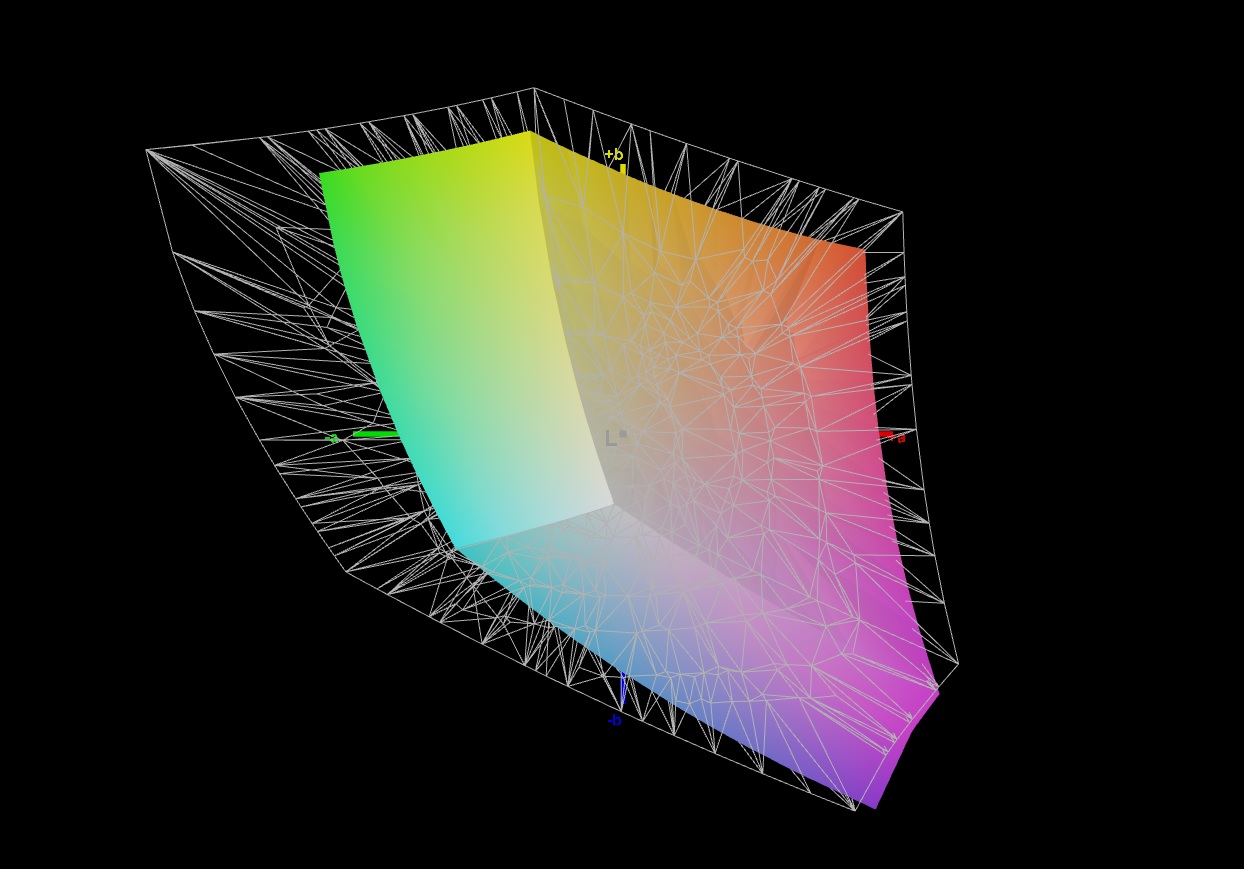
On the other hand, there are plus points for the short response time and the decent color space. 96% sRGB is completely sufficient for a gaming notebook. The color reproduction can also hardly be criticized, although improvements can still be achieved via calibration (our ICC file is linked below). The viewing angle stability is on the typical IPS level, so it is good.
| |||||||||||||||||||||||||
Brightness Distribution: 94 %
Center on Battery: 292 cd/m²
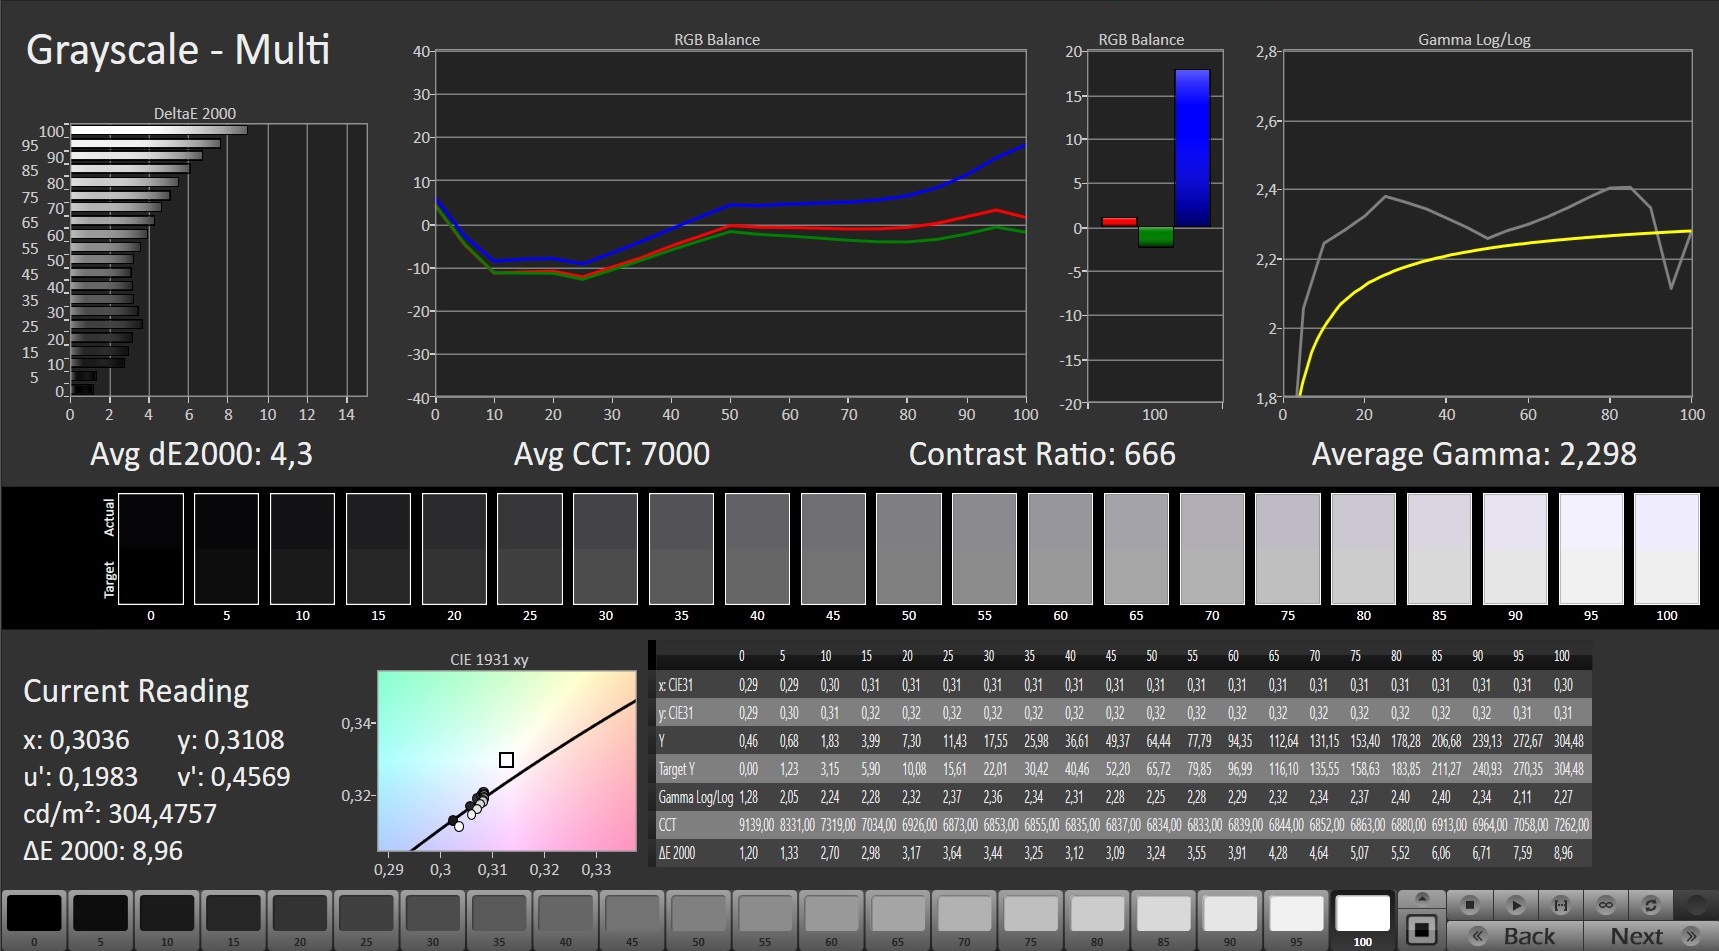
Contrast: 823:1 (Black: 0.355 cd/m²)
ΔE Color 2.47 | 0.5-29.43 Ø5, calibrated: 0.96
ΔE Greyscale 4.3 | 0.57-98 Ø5.3
65.8% AdobeRGB 1998 (Argyll 2.2.0 3D)
95.9% sRGB (Argyll 2.2.0 3D)
65% Display P3 (Argyll 2.2.0 3D)
Gamma: 2.298
| SCHENKER XMG Apex 17 M21 LG Philips LP173WFG-SPB3, IPS, 1920x1080, 17.30 | SCHENKER XMG Neo 17 (Early 2021, RTX 3070, 5800H) BOE NE173QHM-NY2 (BOE0977), IPS, 2560x1440, 17.30 | Razer Blade 17 RTX 3070 AU Optronics B173HAN05.4, IPS, 1920x1080, 17.30 | MSI GP76 Leopard 10UG Chi Mei CMN176E, IPS, 1920x1080, 17.30 | Acer Nitro 5 AN517-41-R5Z7 BOE NV173FHM-NX4, IPS, 1920x1080, 17.30 | |
|---|---|---|---|---|---|
| Display | 7% | 8% | 1% | -43% | |
| Display P3 Coverage | 65 | 70.5 8% | 71.7 10% | 64.7 0% | 36.7 -44% |
| sRGB Coverage | 95.9 | 99.5 4% | 98.8 3% | 96.4 1% | 55.3 -42% |
| AdobeRGB 1998 Coverage | 65.8 | 71.8 9% | 73.6 12% | 66.9 2% | 37.9 -42% |
| Response Times | -4% | 44% | 24% | -27% | |
| Response Time Grey 50% / Grey 80% * | 15.2 ? | 16.8 ? -11% | 4.2 ? 72% | 7.4 ? 51% | 18 ? -18% |
| Response Time Black / White * | 10.4 ? | 10 ? 4% | 8.8 ? 15% | 10.8 ? -4% | 14 ? -35% |
| PWM Frequency | 24510 ? | ||||
| Screen | 15% | -22% | 22% | -19% | |
| Brightness middle | 292 | 410 40% | 323.3 11% | 328 12% | 282 -3% |
| Brightness | 285 | 381 34% | 315 11% | 314 10% | 255 -11% |
| Brightness Distribution | 94 | 88 -6% | 91 -3% | 87 -7% | 85 -10% |
| Black Level * | 0.355 | 0.37 -4% | 0.33 7% | 0.29 18% | 0.24 32% |
| Contrast | 823 | 1108 35% | 980 19% | 1131 37% | 1175 43% |
| Colorchecker dE 2000 * | 2.47 | 2.55 -3% | 4.59 -86% | 1.93 22% | 5.91 -139% |
| Colorchecker dE 2000 max. * | 8.69 | 4.33 50% | 10.82 -25% | 4.94 43% | 10.98 -26% |
| Colorchecker dE 2000 calibrated * | 0.96 | 1.28 -33% | 1.4 -46% | 0.68 29% | |
| Greyscale dE 2000 * | 4.3 | 3.4 21% | 7.9 -84% | 2.8 35% | 5.85 -36% |
| Gamma | 2.298 96% | 2.275 97% | 2.28 96% | 2.18 101% | 2.32 95% |
| CCT | 7000 93% | 6637 98% | 5941 109% | 7023 93% | 7372 88% |
| Color Space (Percent of AdobeRGB 1998) | 72 | 67 | 35 | ||
| Color Space (Percent of sRGB) | 95 | 89 | 55 | ||
| Total Average (Program / Settings) | 6% /
11% | 10% /
-6% | 16% /
18% | -30% /
-25% |
* ... smaller is better
Display Response Times
| ↔ Response Time Black to White | ||
|---|---|---|
| 10.4 ms ... rise ↗ and fall ↘ combined | ↗ 6 ms rise | 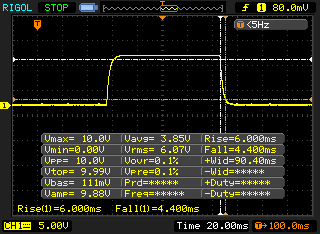 |
| ↘ 4.4 ms fall | ||
| The screen shows good response rates in our tests, but may be too slow for competitive gamers. In comparison, all tested devices range from 0.1 (minimum) to 240 (maximum) ms. » 23 % of all devices are better. This means that the measured response time is better than the average of all tested devices (21.5 ms). | ||
| ↔ Response Time 50% Grey to 80% Grey | ||
| 15.2 ms ... rise ↗ and fall ↘ combined | ↗ 7.6 ms rise | 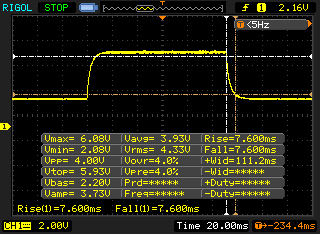 |
| ↘ 7.6 ms fall | ||
| The screen shows good response rates in our tests, but may be too slow for competitive gamers. In comparison, all tested devices range from 0.2 (minimum) to 636 (maximum) ms. » 24 % of all devices are better. This means that the measured response time is better than the average of all tested devices (33.7 ms). | ||
Screen Flickering / PWM (Pulse-Width Modulation)
| Screen flickering / PWM not detected | 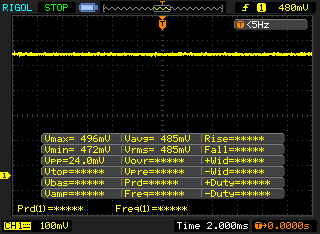 | ||
In comparison: 53 % of all tested devices do not use PWM to dim the display. If PWM was detected, an average of 17900 (minimum: 5 - maximum: 3846000) Hz was measured. | |||
Test conditions
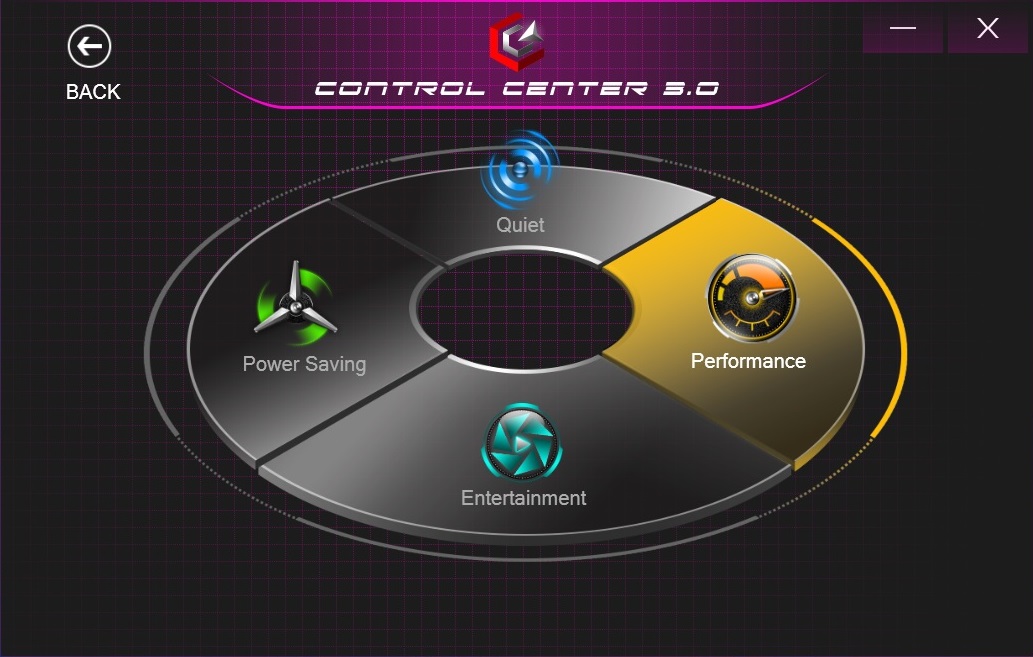
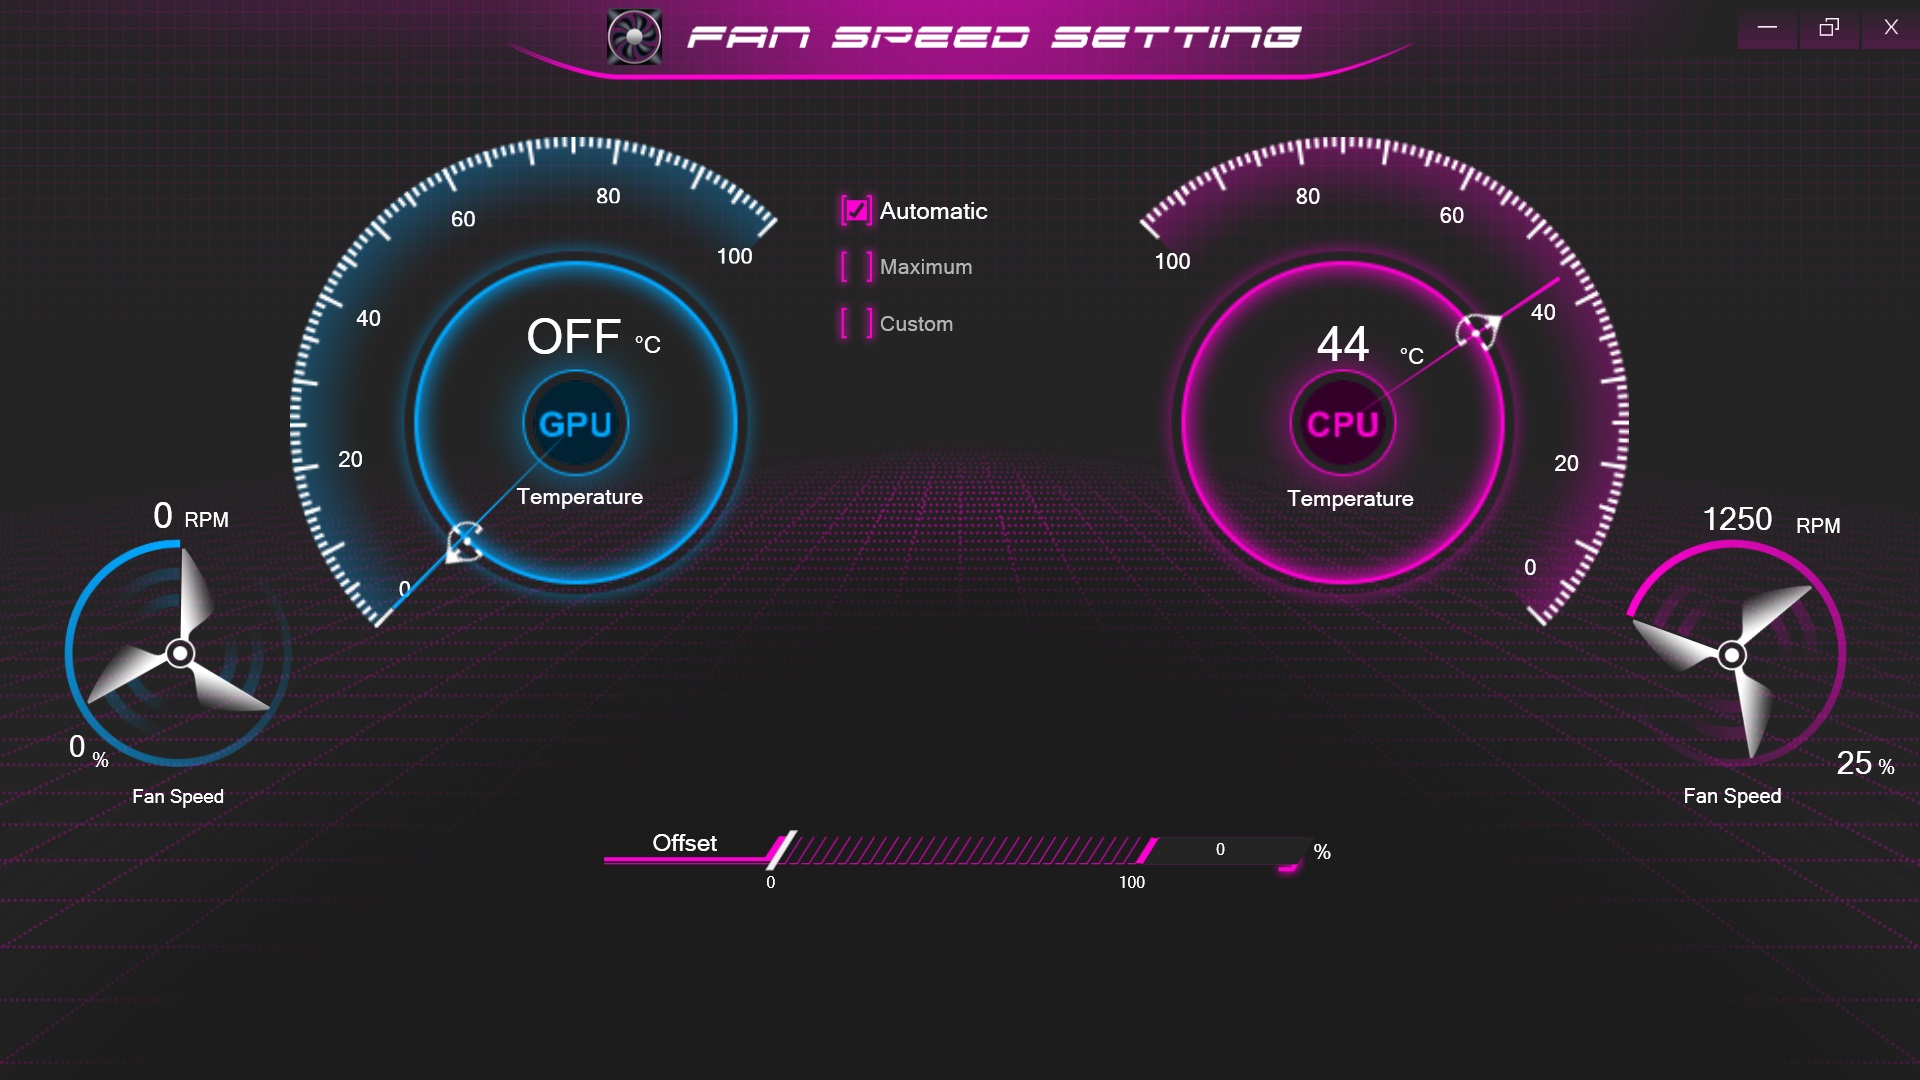
Various system settings can be made in the preloaded Control Center, which comes from the barebone manufacturer Clevo. These include the fan control and the performance profile. To get the maximum power out of the Apex 17, we used the Performance mode for our tests (only the battery measurements were performed in Entertainment mode). We left the fan speed setting at the default option Automatic.
Note: To prevent Windows 11, which was installed on the test device, from negatively influencing the benchmark results, we waited for AMD's latest motherboard driver and a certain Microsoft update (keyword L3 cache bug).
Power
No matter which CPU or GPU you choose for the configuration: The Apex 17 tends towards the high-end segment. To be adequately prepared for the future, we would recommend 16 GB RAM and a minimum of 500 GB SSD. The basic configuration is extremely meager in this respect (8 GB & 250 GB).
Processor
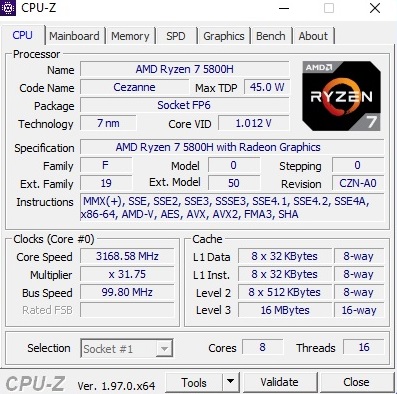
The Ryzen 7 5800H installed in the review sample is an extremely fast eight-core processor that can process up to 16 threads in parallel via SMT. There were no nasty surprises in our benchmark course. The Cinebench scores are all on a high level and can hold their own against the competition. The performance also remained quite stable in the Loop test (compare graph).
Cinebench R15 Multi Endurance Test
* ... smaller is better
AIDA64: FP32 Ray-Trace | FPU Julia | CPU SHA3 | CPU Queen | FPU SinJulia | FPU Mandel | CPU AES | CPU ZLib | FP64 Ray-Trace | CPU PhotoWorxx
| Performance Rating | |
| Average of class Gaming | |
| SCHENKER XMG Apex 17 M21 | |
| SCHENKER XMG Neo 17 (Early 2021, RTX 3070, 5800H) | |
| Acer Nitro 5 AN517-41-R5Z7 | |
| Average AMD Ryzen 7 5800H | |
| MSI GP76 Leopard 10UG | |
| Razer Blade 17 RTX 3070 -9! | |
| AIDA64 / FP32 Ray-Trace | |
| Average of class Gaming (3069 - 60169, n=225, last 2 years) | |
| SCHENKER XMG Apex 17 M21 | |
| SCHENKER XMG Neo 17 (Early 2021, RTX 3070, 5800H) | |
| Acer Nitro 5 AN517-41-R5Z7 | |
| Average AMD Ryzen 7 5800H (10349 - 15169, n=29) | |
| MSI GP76 Leopard 10UG | |
| AIDA64 / FPU Julia | |
| SCHENKER XMG Apex 17 M21 | |
| Average of class Gaming (18567 - 252486, n=225, last 2 years) | |
| SCHENKER XMG Neo 17 (Early 2021, RTX 3070, 5800H) | |
| Acer Nitro 5 AN517-41-R5Z7 | |
| Average AMD Ryzen 7 5800H (63663 - 95954, n=29) | |
| MSI GP76 Leopard 10UG | |
| AIDA64 / CPU SHA3 | |
| Average of class Gaming (629 - 10389, n=225, last 2 years) | |
| SCHENKER XMG Apex 17 M21 | |
| SCHENKER XMG Neo 17 (Early 2021, RTX 3070, 5800H) | |
| Acer Nitro 5 AN517-41-R5Z7 | |
| Average AMD Ryzen 7 5800H (2096 - 3287, n=29) | |
| MSI GP76 Leopard 10UG | |
| AIDA64 / CPU Queen | |
| Average of class Gaming (15371 - 200651, n=225, last 2 years) | |
| Acer Nitro 5 AN517-41-R5Z7 | |
| SCHENKER XMG Apex 17 M21 | |
| Average AMD Ryzen 7 5800H (91846 - 99215, n=29) | |
| SCHENKER XMG Neo 17 (Early 2021, RTX 3070, 5800H) | |
| MSI GP76 Leopard 10UG | |
| AIDA64 / FPU SinJulia | |
| Average of class Gaming (2137 - 32988, n=225, last 2 years) | |
| Acer Nitro 5 AN517-41-R5Z7 | |
| SCHENKER XMG Apex 17 M21 | |
| SCHENKER XMG Neo 17 (Early 2021, RTX 3070, 5800H) | |
| Average AMD Ryzen 7 5800H (9962 - 11871, n=29) | |
| MSI GP76 Leopard 10UG | |
| AIDA64 / FPU Mandel | |
| SCHENKER XMG Apex 17 M21 | |
| SCHENKER XMG Neo 17 (Early 2021, RTX 3070, 5800H) | |
| Acer Nitro 5 AN517-41-R5Z7 | |
| Average AMD Ryzen 7 5800H (36083 - 52732, n=29) | |
| Average of class Gaming (10291 - 134044, n=225, last 2 years) | |
| MSI GP76 Leopard 10UG | |
| AIDA64 / CPU AES | |
| SCHENKER XMG Apex 17 M21 | |
| SCHENKER XMG Neo 17 (Early 2021, RTX 3070, 5800H) | |
| Acer Nitro 5 AN517-41-R5Z7 | |
| Average AMD Ryzen 7 5800H (50226 - 127832, n=29) | |
| Average of class Gaming (19065 - 328679, n=225, last 2 years) | |
| MSI GP76 Leopard 10UG | |
| AIDA64 / CPU ZLib | |
| Average of class Gaming (150.9 - 2409, n=225, last 2 years) | |
| SCHENKER XMG Neo 17 (Early 2021, RTX 3070, 5800H) | |
| SCHENKER XMG Apex 17 M21 | |
| Acer Nitro 5 AN517-41-R5Z7 | |
| Average AMD Ryzen 7 5800H (591 - 828, n=29) | |
| MSI GP76 Leopard 10UG | |
| Razer Blade 17 RTX 3070 | |
| AIDA64 / FP64 Ray-Trace | |
| Average of class Gaming (1518 - 31796, n=225, last 2 years) | |
| SCHENKER XMG Apex 17 M21 | |
| SCHENKER XMG Neo 17 (Early 2021, RTX 3070, 5800H) | |
| Acer Nitro 5 AN517-41-R5Z7 | |
| Average AMD Ryzen 7 5800H (5457 - 7884, n=29) | |
| MSI GP76 Leopard 10UG | |
| AIDA64 / CPU PhotoWorxx | |
| Average of class Gaming (10805 - 60161, n=226, last 2 years) | |
| SCHENKER XMG Apex 17 M21 | |
| MSI GP76 Leopard 10UG | |
| SCHENKER XMG Neo 17 (Early 2021, RTX 3070, 5800H) | |
| Average AMD Ryzen 7 5800H (14445 - 25421, n=29) | |
| Acer Nitro 5 AN517-41-R5Z7 | |
System performance
The system performance looks similarly good. The Apex 17 also takes one of the top places here, although the competing devices were still tested with Windows 10, which can mean certain deviations.
| PCMark 10 / Score | |
| Average of class Gaming (5235 - 9852, n=200, last 2 years) | |
| Razer Blade 17 RTX 3070 | |
| SCHENKER XMG Neo 17 (Early 2021, RTX 3070, 5800H) | |
| SCHENKER XMG Apex 17 M21 | |
| Average AMD Ryzen 7 5800H, NVIDIA GeForce RTX 3070 Laptop GPU (6717 - 6983, n=6) | |
| Acer Nitro 5 AN517-41-R5Z7 | |
| MSI GP76 Leopard 10UG | |
| PCMark 10 / Essentials | |
| Razer Blade 17 RTX 3070 | |
| Average of class Gaming (8300 - 12334, n=199, last 2 years) | |
| SCHENKER XMG Apex 17 M21 | |
| Acer Nitro 5 AN517-41-R5Z7 | |
| SCHENKER XMG Neo 17 (Early 2021, RTX 3070, 5800H) | |
| Average AMD Ryzen 7 5800H, NVIDIA GeForce RTX 3070 Laptop GPU (9548 - 10226, n=6) | |
| MSI GP76 Leopard 10UG | |
| PCMark 10 / Productivity | |
| Average of class Gaming (6662 - 11833, n=199, last 2 years) | |
| Acer Nitro 5 AN517-41-R5Z7 | |
| Razer Blade 17 RTX 3070 | |
| SCHENKER XMG Apex 17 M21 | |
| Average AMD Ryzen 7 5800H, NVIDIA GeForce RTX 3070 Laptop GPU (8849 - 9514, n=6) | |
| SCHENKER XMG Neo 17 (Early 2021, RTX 3070, 5800H) | |
| MSI GP76 Leopard 10UG | |
| PCMark 10 / Digital Content Creation | |
| Average of class Gaming (6462 - 18475, n=199, last 2 years) | |
| Razer Blade 17 RTX 3070 | |
| SCHENKER XMG Neo 17 (Early 2021, RTX 3070, 5800H) | |
| SCHENKER XMG Apex 17 M21 | |
| Average AMD Ryzen 7 5800H, NVIDIA GeForce RTX 3070 Laptop GPU (8948 - 10389, n=6) | |
| Acer Nitro 5 AN517-41-R5Z7 | |
| MSI GP76 Leopard 10UG | |
| PCMark 10 Score | 6972 points | |
Help | ||
| AIDA64 / Memory Copy | |
| Average of class Gaming (21842 - 92565, n=225, last 2 years) | |
| SCHENKER XMG Apex 17 M21 | |
| SCHENKER XMG Neo 17 (Early 2021, RTX 3070, 5800H) | |
| Average AMD Ryzen 7 5800H (34964 - 44180, n=29) | |
| MSI GP76 Leopard 10UG | |
| AIDA64 / Memory Read | |
| Average of class Gaming (24879 - 90647, n=225, last 2 years) | |
| SCHENKER XMG Apex 17 M21 | |
| SCHENKER XMG Neo 17 (Early 2021, RTX 3070, 5800H) | |
| Average AMD Ryzen 7 5800H (39548 - 47260, n=29) | |
| MSI GP76 Leopard 10UG | |
| AIDA64 / Memory Write | |
| Average of class Gaming (21619 - 103259, n=225, last 2 years) | |
| SCHENKER XMG Apex 17 M21 | |
| MSI GP76 Leopard 10UG | |
| Average AMD Ryzen 7 5800H (28456 - 47022, n=29) | |
| SCHENKER XMG Neo 17 (Early 2021, RTX 3070, 5800H) | |
| AIDA64 / Memory Latency | |
| SCHENKER XMG Neo 17 (Early 2021, RTX 3070, 5800H) | |
| Average of class Gaming (59.5 - 152.5, n=222, last 2 years) | |
| Average AMD Ryzen 7 5800H (76.3 - 105.1, n=29) | |
| SCHENKER XMG Apex 17 M21 | |
| MSI GP76 Leopard 10UG | |
| Razer Blade 17 RTX 3070 | |
* ... smaller is better
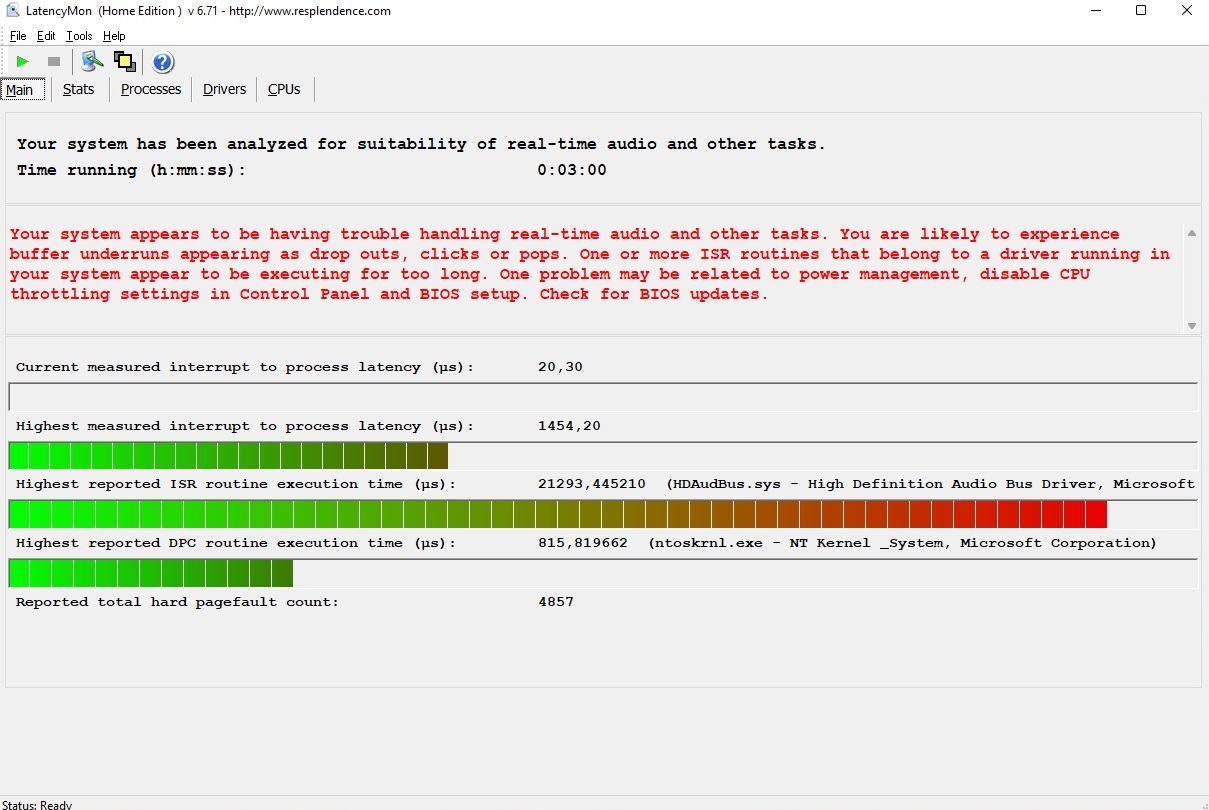
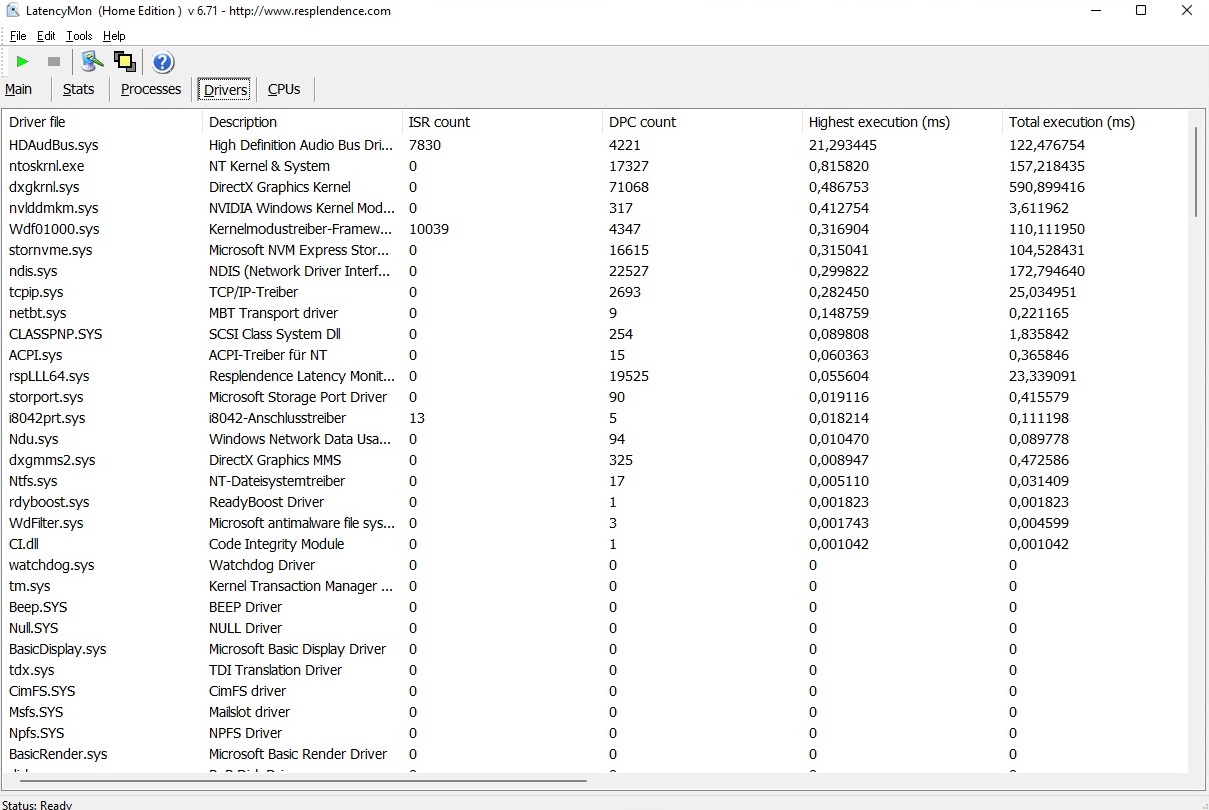
DPC latencies
There is room for improvement in terms of latencies. According to the LatencyMon tool, the Apex 17 is not really suitable for real-time audio and/or video editing in its state of delivery, if such application scenarios are planned (should only apply to very few buyers).
| DPC Latencies / LatencyMon - interrupt to process latency (max), Web, Youtube, Prime95 | |
| SCHENKER XMG Neo 17 (Early 2021, RTX 3070, 5800H) | |
| SCHENKER XMG Apex 17 M21 | |
| Acer Nitro 5 AN517-41-R5Z7 | |
| MSI GP76 Leopard 10UG | |
| Razer Blade 17 RTX 3070 | |
* ... smaller is better
Mass storage
Our test device had a 1 TB SSD from Samsung on board as mass storage. As usual, the 970 Evo Plus delivers an all-around successful performance - be it reading or writing. If you want to expand the storage later, there is a free M.2 slot under the hood.

Continuous load read: DiskSpd Read Loop, Queue Depth 8
Graphics card
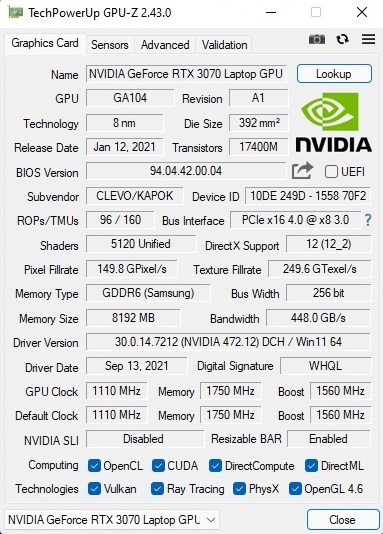
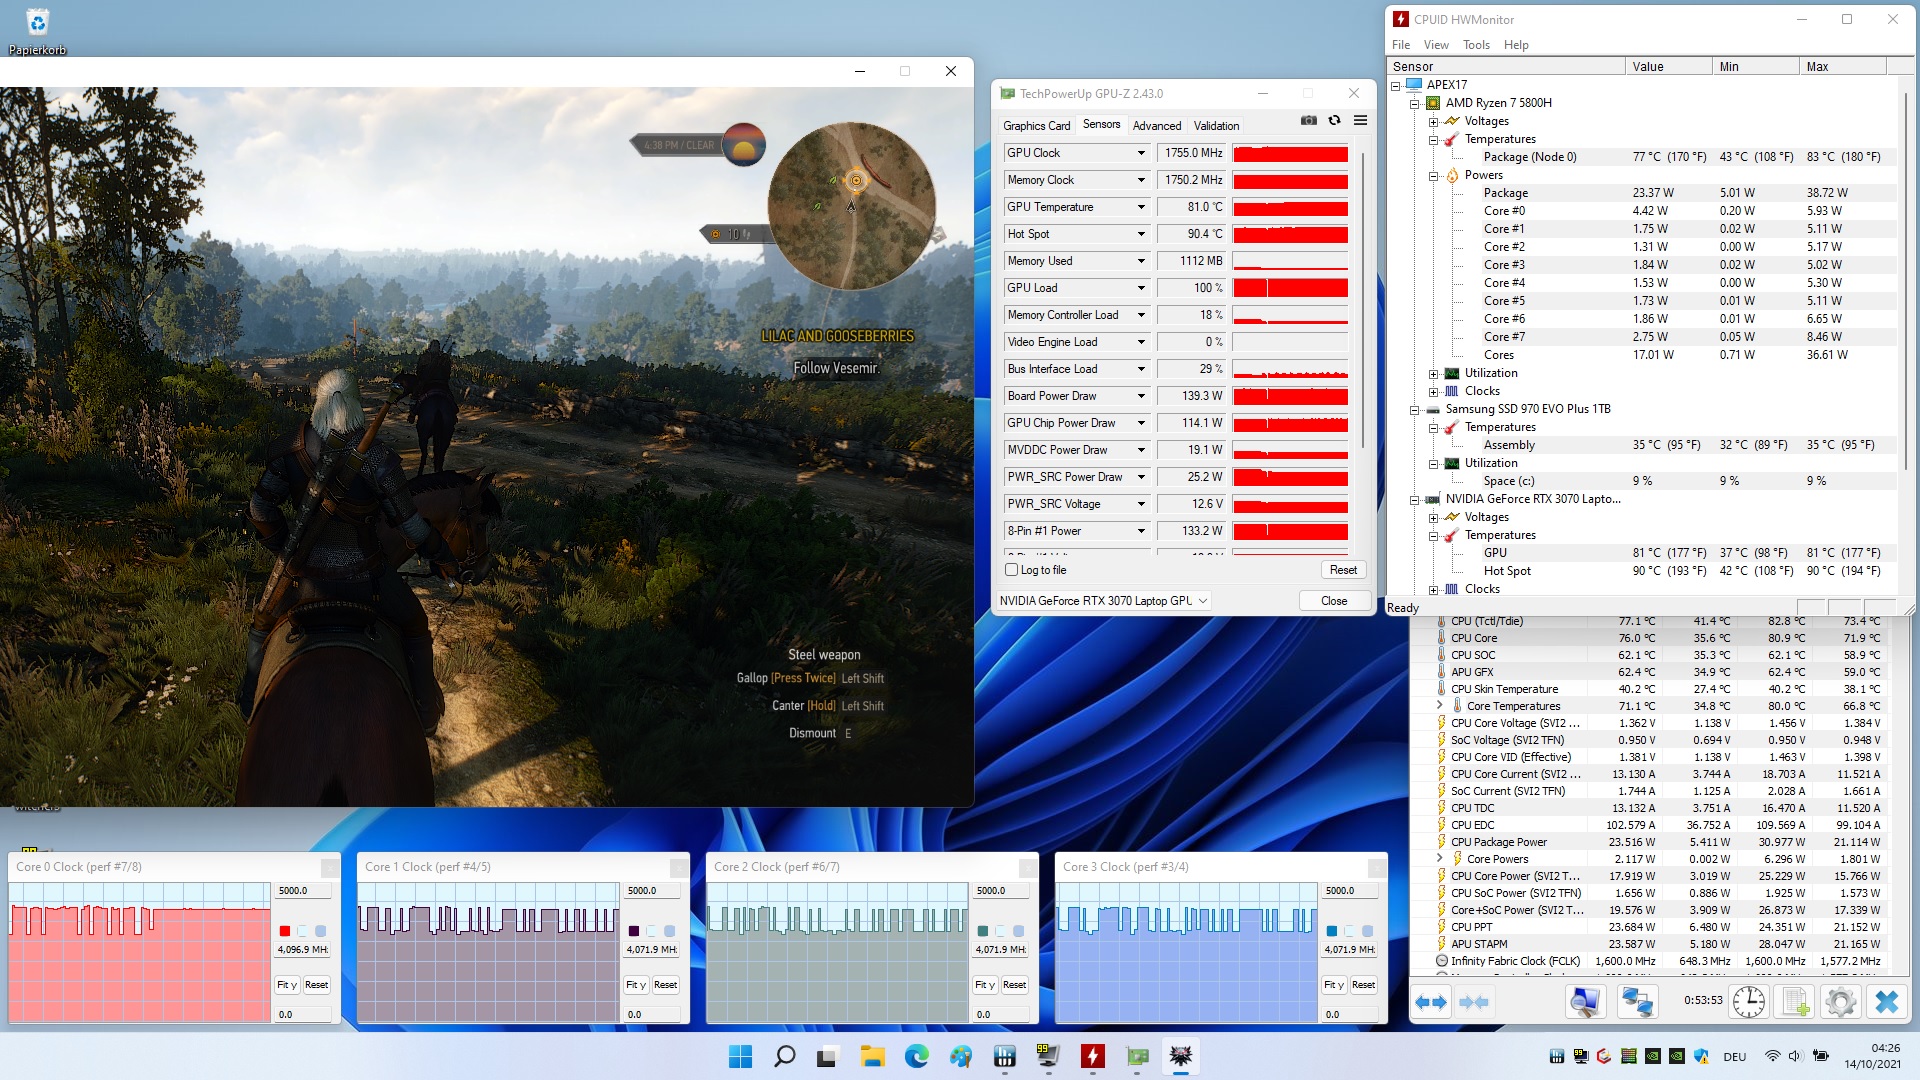
The performance of Nvidia's amp generation depends very much on the set TGP. Schenker gives the RTX 3070 a whole 140 watts in performance mode (including 15 watts Dynamic Boost), which is the maximum value for this GPU. Thus, it is not surprising that the Apex 17 scores quite well in the graphics benchmarks. Analogous to the CPU and system performance, the 17-incher also makes itself comfortable in the upper third of the test field here.
| 3DMark 11 Performance | 28685 points | |
| 3DMark Cloud Gate Standard Score | 47429 points | |
| 3DMark Fire Strike Score | 24012 points | |
| 3DMark Time Spy Score | 10640 points | |
Help | ||
Gaming performance
In the native Full HD resolution of 1,920 x 1,080, the RTX 3070 can smoothly display all current games with maximum details. Even particularly demanding games usually reach over 60 FPS. The Apex 17 would also still manage well with an external QHD display.
| The Witcher 3 | |
| 1920x1080 High Graphics & Postprocessing (Nvidia HairWorks Off) | |
| Average of class Gaming (17.5 - 449, n=167, last 2 years) | |
| Razer Blade 17 RTX 3070 | |
| SCHENKER XMG Neo 17 (Early 2021, RTX 3070, 5800H) | |
| SCHENKER XMG Apex 17 M21 | |
| Average NVIDIA GeForce RTX 3070 Laptop GPU (122.1 - 207, n=34) | |
| Acer Nitro 5 AN517-41-R5Z7 | |
| 1920x1080 Ultra Graphics & Postprocessing (HBAO+) | |
| Average of class Gaming (8.61 - 216, n=227, last 2 years) | |
| MSI GP76 Leopard 10UG | |
| SCHENKER XMG Neo 17 (Early 2021, RTX 3070, 5800H) | |
| Razer Blade 17 RTX 3070 | |
| SCHENKER XMG Apex 17 M21 | |
| Average NVIDIA GeForce RTX 3070 Laptop GPU (34.9 - 109, n=52) | |
| Acer Nitro 5 AN517-41-R5Z7 | |
During the endurance test with The Witcher 3 (1 hour @FHD/Ultra) there were no abnormalities. The frame rate remained pretty stable over the entire period, as it should.
Witcher 3 FPS-Diagram
| low | med. | high | ultra | |
| GTA V (2015) | 172 | 158 | 92.9 | |
| The Witcher 3 (2015) | 262 | 174 | 100 | |
| Dota 2 Reborn (2015) | 148 | 135 | 127 | 122 |
| Final Fantasy XV Benchmark (2018) | 132 | 100 | ||
| X-Plane 11.11 (2018) | 104 | 91.9 | 75 | |
| Far Cry 5 (2018) | 124 | 119 | 110 | |
| Strange Brigade (2018) | 203 | 183 | 173 | |
| Hitman 3 (2021) | 176 | 170 | 162 | |
| Outriders (2021) | 118 | 117 | 117 | |
| Resident Evil Village (2021) | 178 | 176 | 156 | |
| Mass Effect Legendary Edition (2021) | 105 | |||
| Days Gone (2021) | 154 | 140 | 106 | |
| Monster Hunter Stories 2 (2021) | 144 | 143 | ||
| Deathloop (2021) | 117 | 106 | 90.1 | |
| New World (2021) | 96.8 | 92.7 | 86.8 | |
| Alan Wake Remastered (2021) | 82.7 | 79.2 | ||
| Far Cry 6 (2021) | 103 | 91 | 87 | |
| Back 4 Blood (2021) | 220 | 205 | 193 | |
| Guardians of the Galaxy (2021) | 112 | 111 | 110 | |
| Riders Republic (2021) | 136 | 114 | 105 |
Emissions
Noise emissions
One of the crucial weaknesses of Clevo barebones has always been the poor fan control. Although the Apex 17 remains relatively quiet with 25 to 31 dB(A) in idle mode, the fans turn up to 57 to 59 dB(A) under load when using the performance mode - an annoyingly loud noise level that ultimately forces the use of a headset. If you want it to be quieter, you should switch to Entertainment or Quiet mode when gaming and especially during less demanding tasks like playing videos.
Noise Level
| Idle |
| 25 / 28 / 31 dB(A) |
| Load |
| 57 / 59 dB(A) |
 | ||
30 dB silent 40 dB(A) audible 50 dB(A) loud |
||
min: | ||
| SCHENKER XMG Apex 17 M21 R7 5800H, GeForce RTX 3070 Laptop GPU | SCHENKER XMG Neo 17 (Early 2021, RTX 3070, 5800H) R7 5800H, GeForce RTX 3070 Laptop GPU | Razer Blade 17 RTX 3070 i7-11800H, GeForce RTX 3070 Laptop GPU | MSI GP76 Leopard 10UG i7-10750H, GeForce RTX 3070 Laptop GPU | Acer Nitro 5 AN517-41-R5Z7 R7 5800H, GeForce RTX 3070 Laptop GPU | Average of class Gaming | |
|---|---|---|---|---|---|---|
| Noise | -3% | 11% | 1% | 0% | 6% | |
| off / environment * | 25 | 24 4% | 24.2 3% | 24 4% | 26 -4% | 24.1 ? 4% |
| Idle Minimum * | 25 | 29 -16% | 24.7 1% | 25 -0% | 26 -4% | 25.6 ? -2% |
| Idle Average * | 28 | 32 -14% | 24.7 12% | 32 -14% | 33.1 -18% | 27.4 ? 2% |
| Idle Maximum * | 31 | 38 -23% | 24.7 20% | 34 -10% | 31.3 -1% | 30.7 ? 1% |
| Load Average * | 57 | 49 14% | 44.3 22% | 54 5% | 49.8 13% | 43.1 ? 24% |
| Witcher 3 ultra * | 57 | 53 7% | 56.3 1% | 51 11% | ||
| Load Maximum * | 59 | 55 7% | 47.7 19% | 54 8% | 49.6 16% | 53.4 ? 9% |
* ... smaller is better
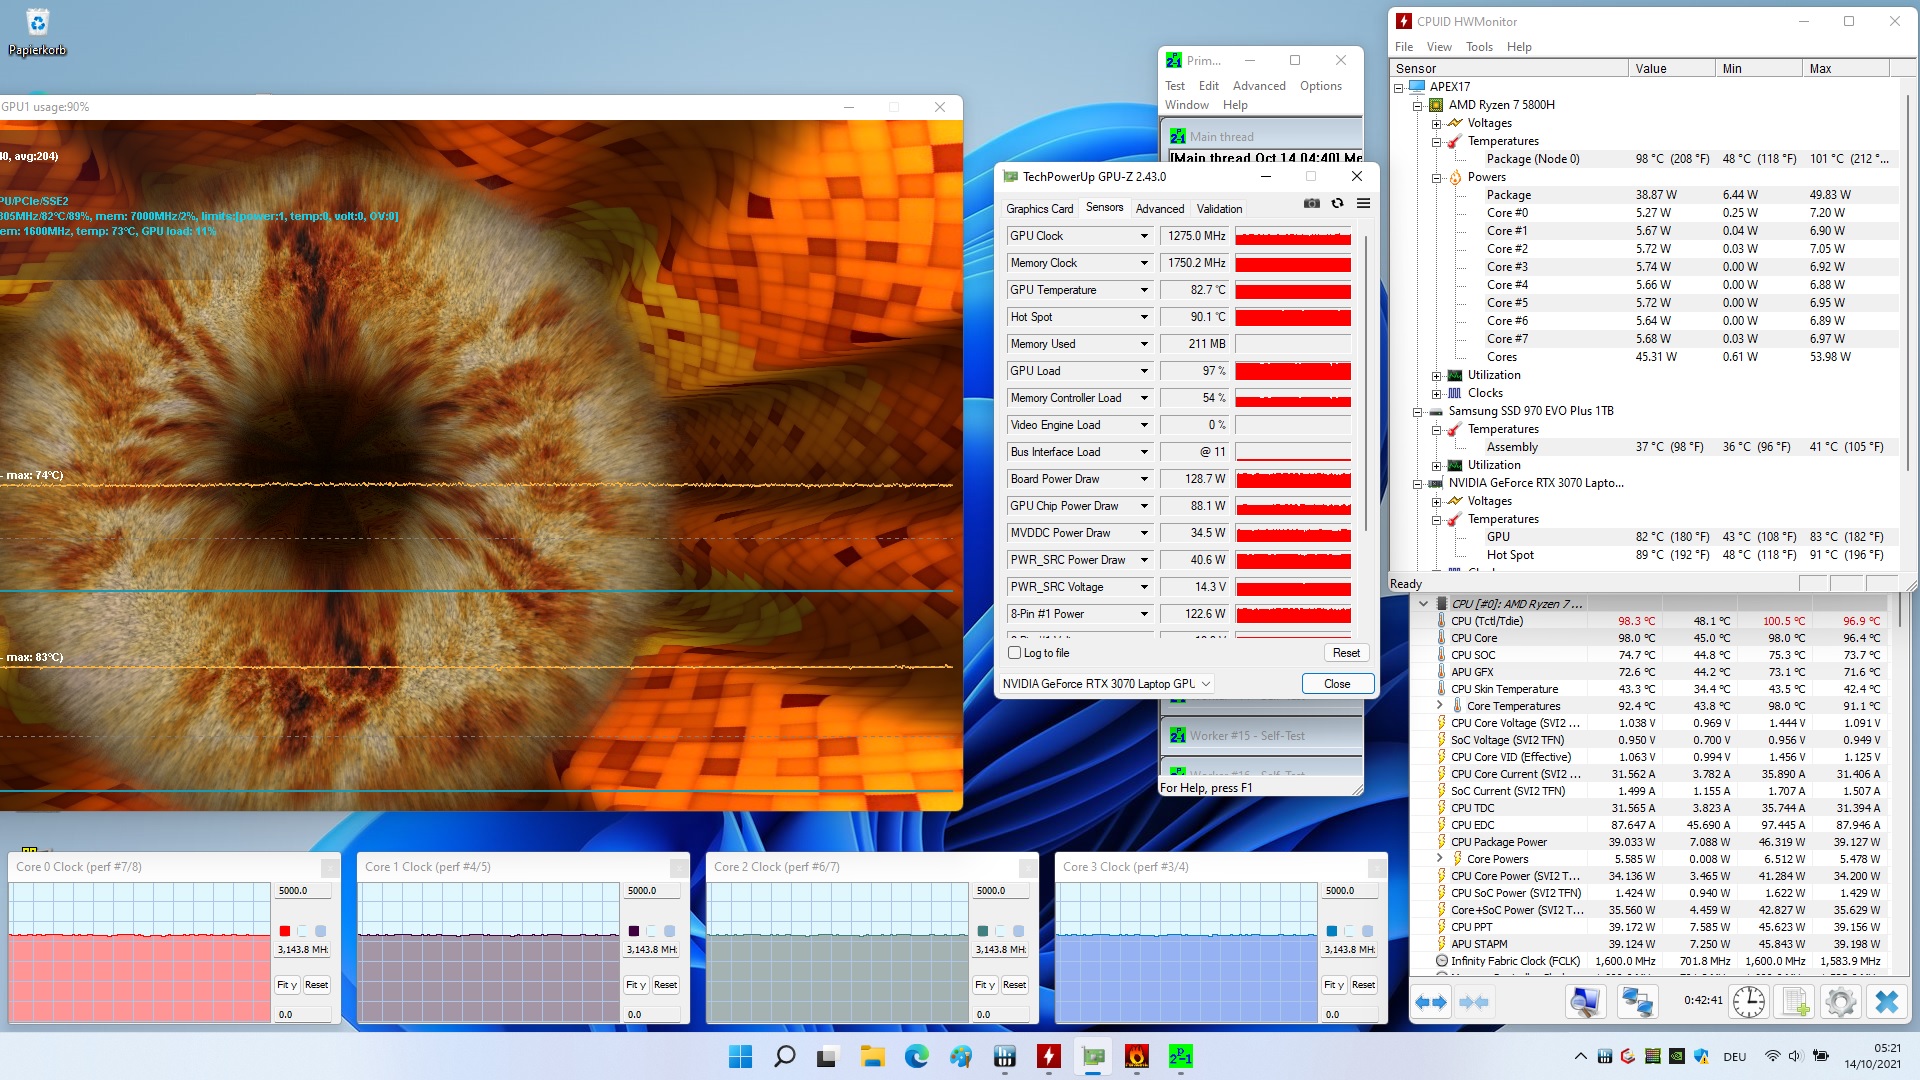
Temperature
The temperature development of the Apex 17 is in line with the competition despite the higher noise level. After one hour of full load with the tools FurMark and Prime95, we could coax up to 45 °C (113 °F) out of the chassis on the upper side and up to 49 °C (120.2 °F) on the underside. The processor in particular heats up inside the case. While the RTX 3070 reached around 83 °C (181.4 °F) during the stress test, the Ryzen 7 5800H almost cracked the 100 °C (212 °F) mark according to the HWMonitor tool.
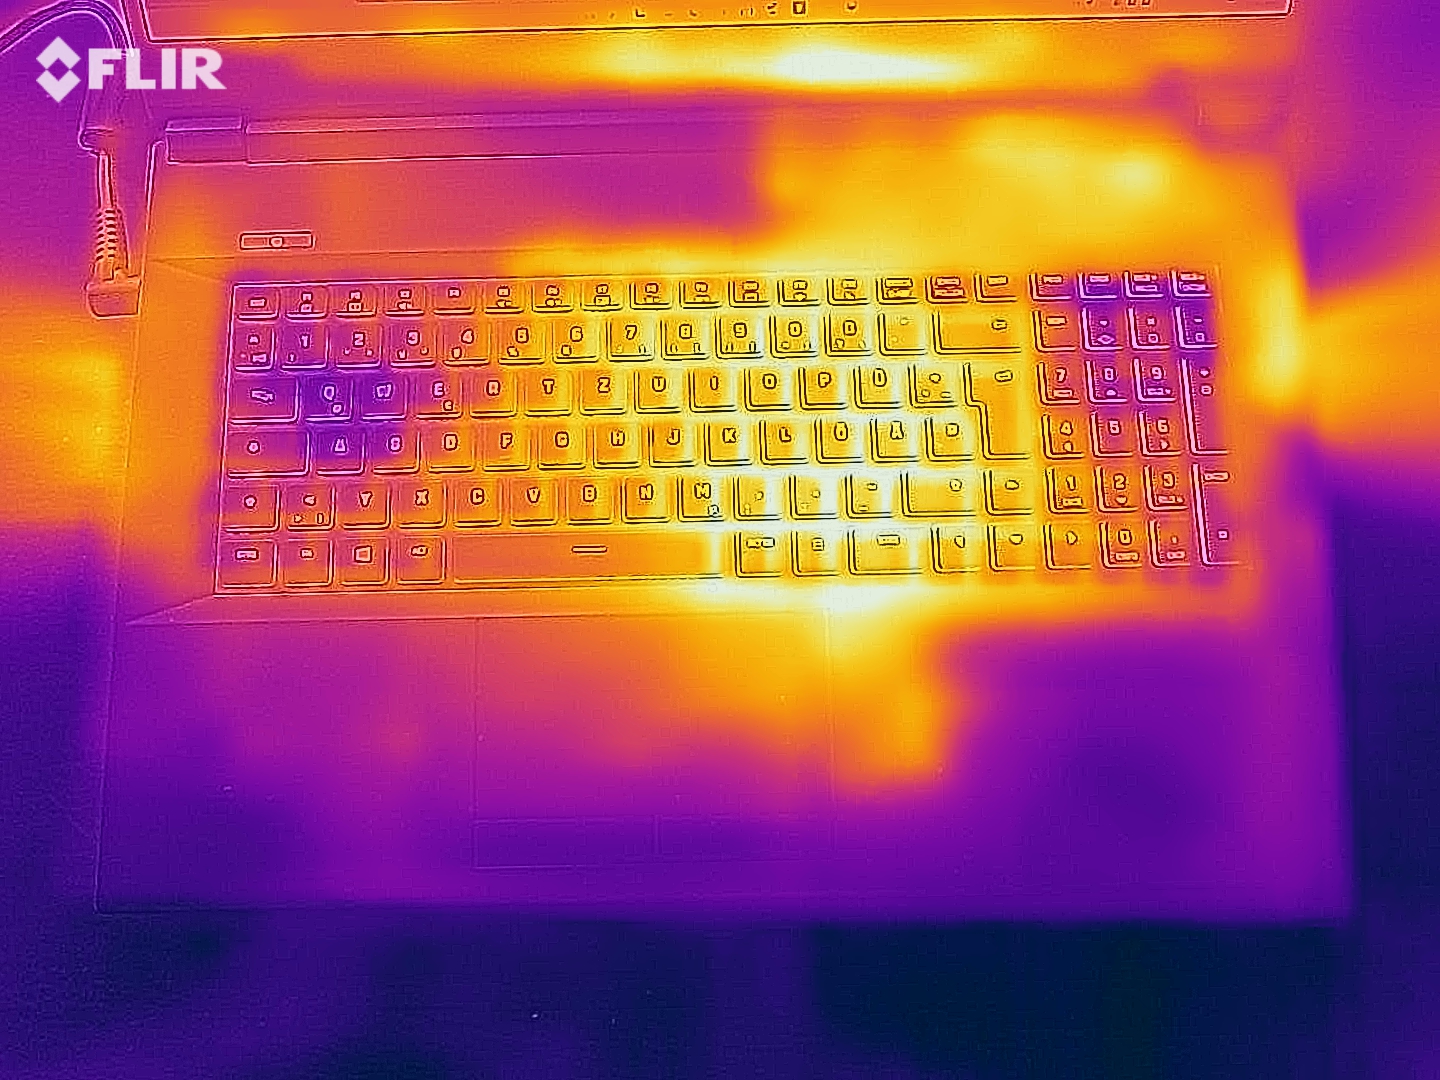
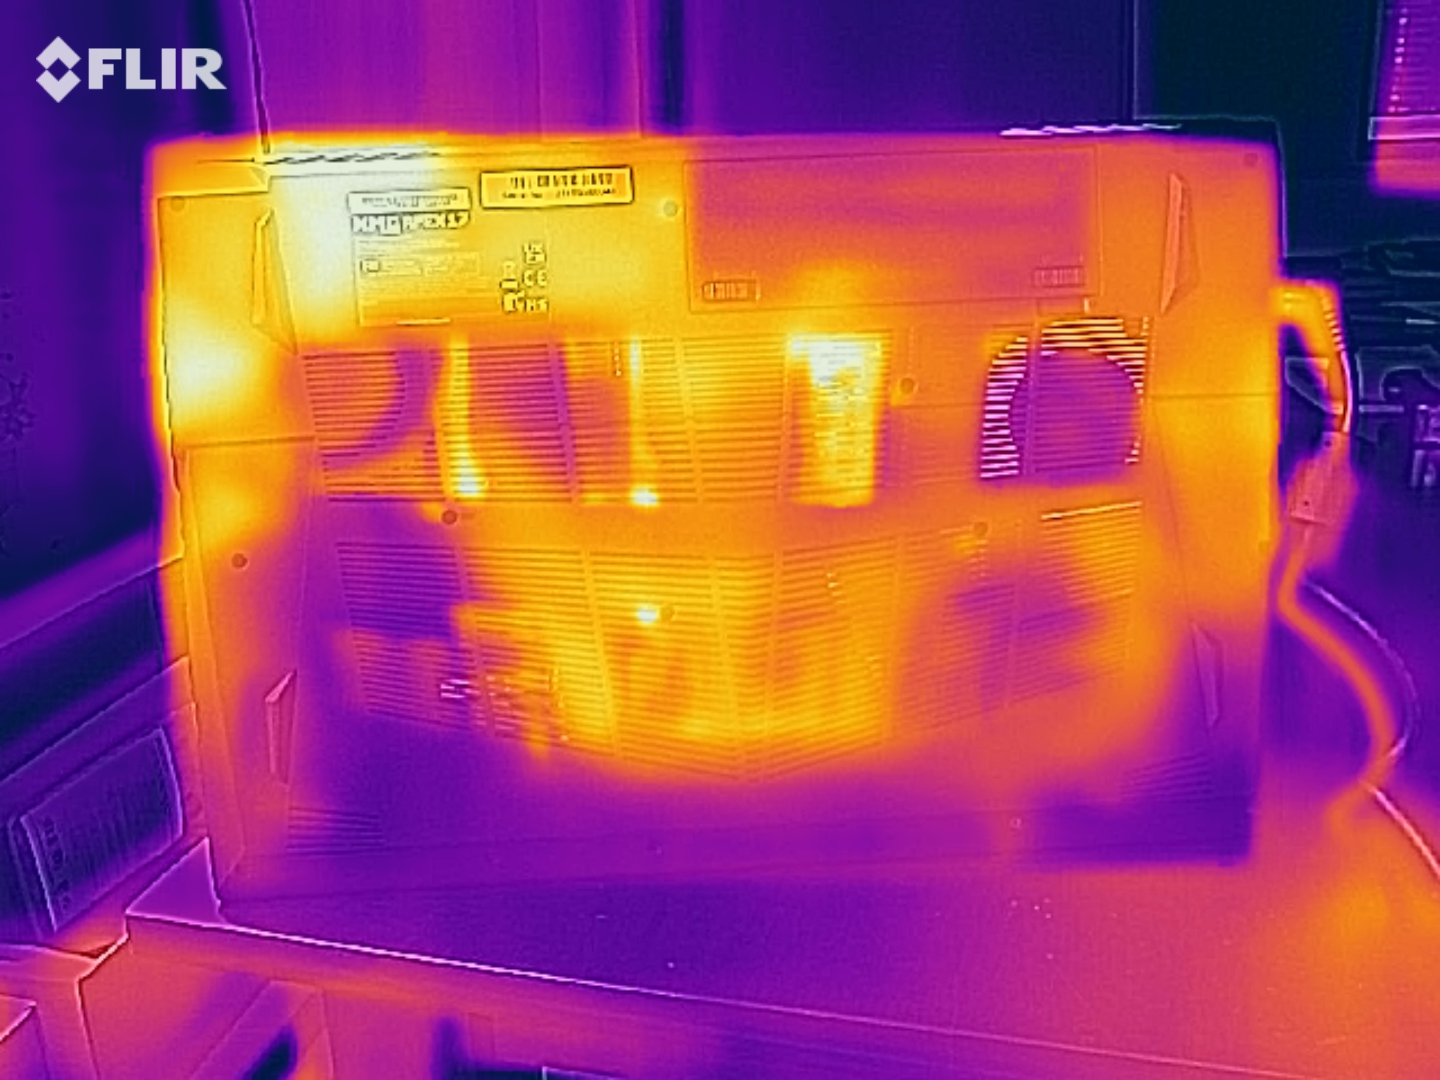
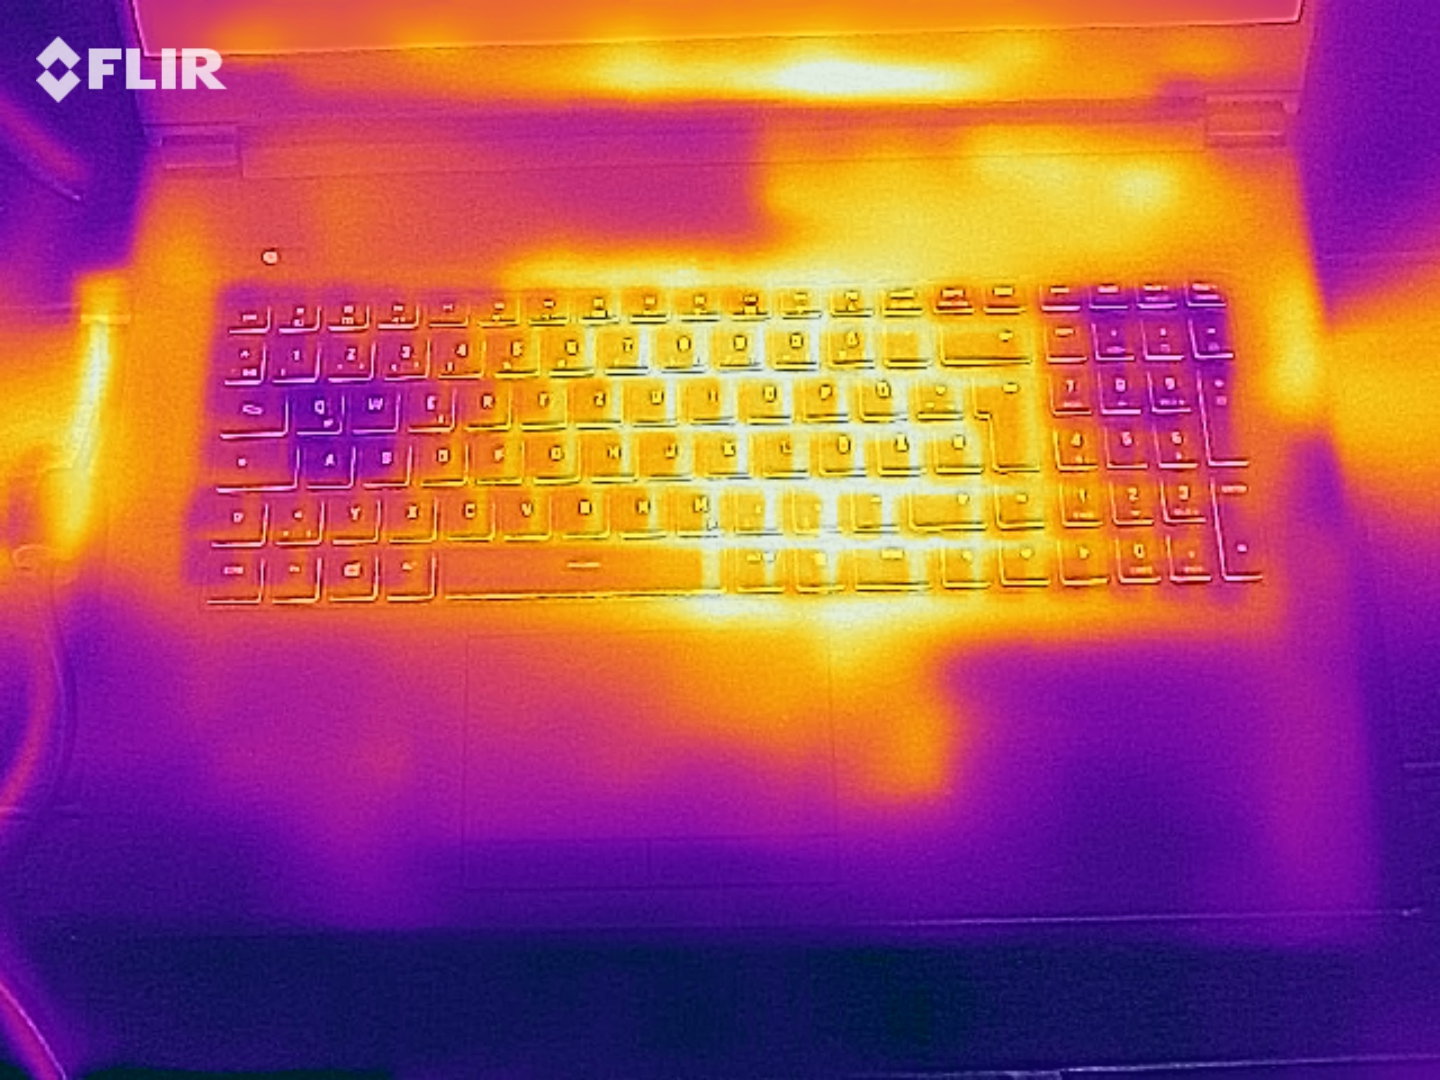
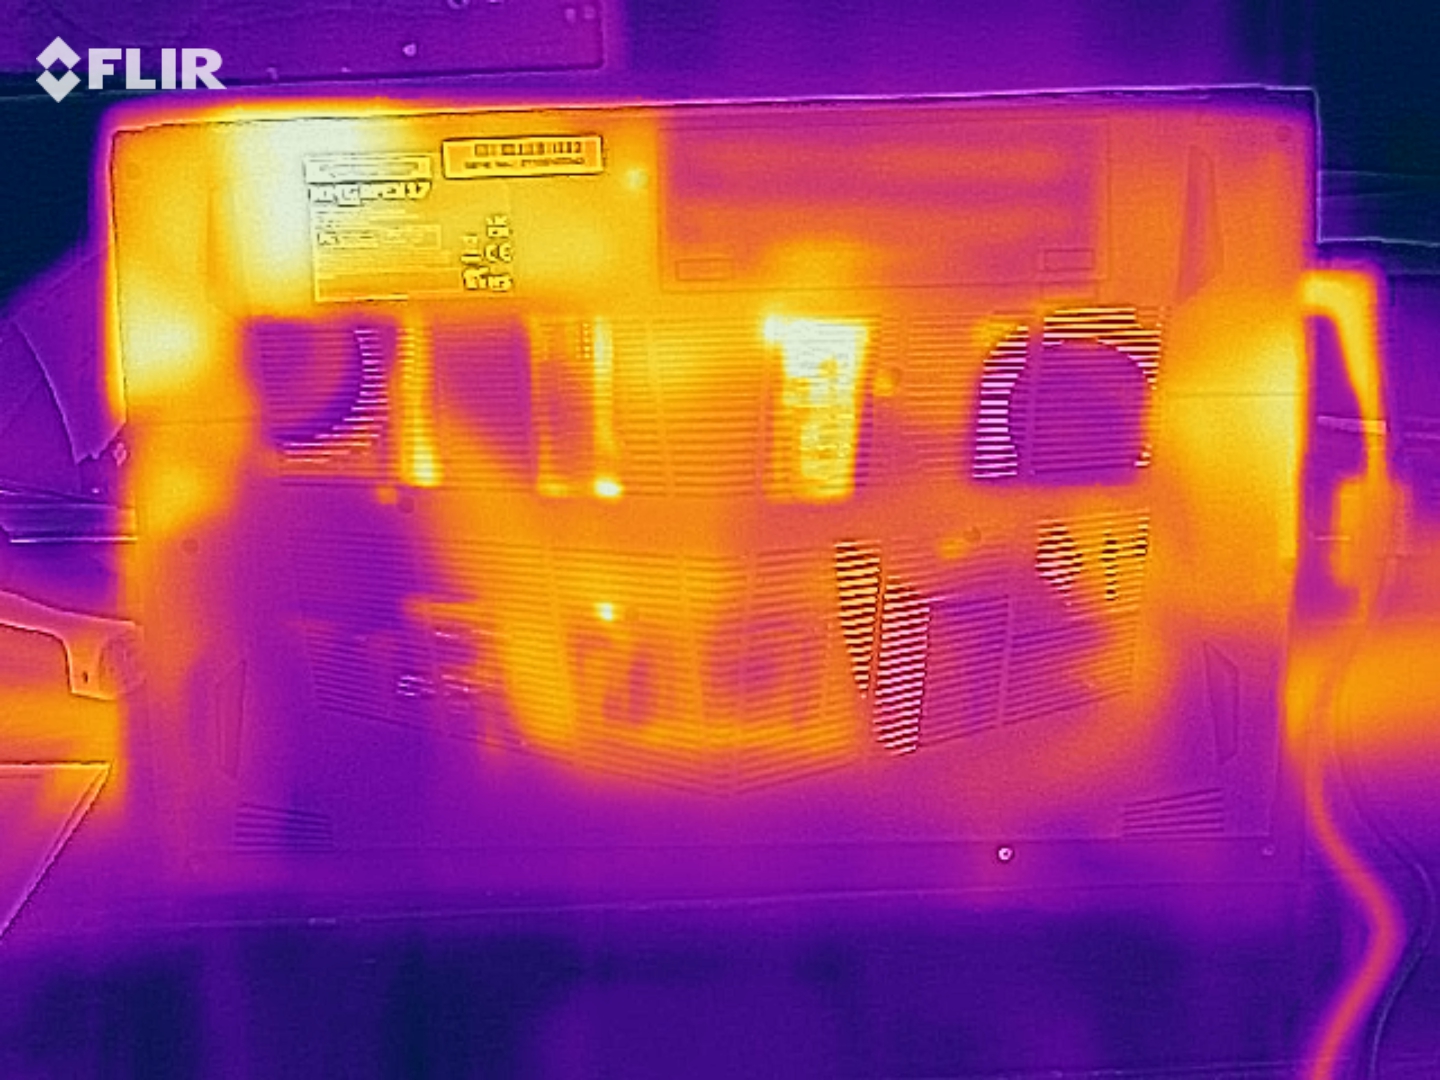
(±) The maximum temperature on the upper side is 45 °C / 113 F, compared to the average of 40.4 °C / 105 F, ranging from 21.2 to 68.8 °C for the class Gaming.
(-) The bottom heats up to a maximum of 49 °C / 120 F, compared to the average of 43.2 °C / 110 F
(+) In idle usage, the average temperature for the upper side is 25.9 °C / 79 F, compared to the device average of 33.8 °C / 93 F.
(±) Playing The Witcher 3, the average temperature for the upper side is 37.6 °C / 100 F, compared to the device average of 33.8 °C / 93 F.
(±) The palmrests and touchpad can get very hot to the touch with a maximum of 37 °C / 98.6 F.
(-) The average temperature of the palmrest area of similar devices was 28.9 °C / 84 F (-8.1 °C / -14.6 F).
| SCHENKER XMG Apex 17 M21 R7 5800H, GeForce RTX 3070 Laptop GPU | SCHENKER XMG Neo 17 (Early 2021, RTX 3070, 5800H) R7 5800H, GeForce RTX 3070 Laptop GPU | Razer Blade 17 RTX 3070 i7-11800H, GeForce RTX 3070 Laptop GPU | MSI GP76 Leopard 10UG i7-10750H, GeForce RTX 3070 Laptop GPU | Acer Nitro 5 AN517-41-R5Z7 R7 5800H, GeForce RTX 3070 Laptop GPU | Average of class Gaming | |
|---|---|---|---|---|---|---|
| Heat | -13% | -10% | -3% | -9% | -7% | |
| Maximum Upper Side * | 45 | 47 -4% | 41 9% | 43 4% | 44 2% | 46 ? -2% |
| Maximum Bottom * | 49 | 51 -4% | 47.2 4% | 47 4% | 52.7 -8% | 49.5 ? -1% |
| Idle Upper Side * | 27 | 32 -19% | 33.2 -23% | 30 -11% | 32.6 -21% | 31.4 ? -16% |
| Idle Bottom * | 30 | 37 -23% | 39 -30% | 33 -10% | 32.1 -7% | 32.5 ? -8% |
* ... smaller is better
Speaker
SCHENKER XMG Apex 17 M21 audio analysis
(+) | speakers can play relatively loud (84 dB)
Bass 100 - 315 Hz
(-) | nearly no bass - on average 22.5% lower than median
(±) | linearity of bass is average (12.9% delta to prev. frequency)
Mids 400 - 2000 Hz
(±) | higher mids - on average 5.5% higher than median
(±) | linearity of mids is average (8.8% delta to prev. frequency)
Highs 2 - 16 kHz
(+) | balanced highs - only 3.8% away from median
(+) | highs are linear (5.4% delta to prev. frequency)
Overall 100 - 16.000 Hz
(±) | linearity of overall sound is average (18.3% difference to median)
Compared to same class
» 55% of all tested devices in this class were better, 8% similar, 36% worse
» The best had a delta of 6%, average was 18%, worst was 132%
Compared to all devices tested
» 34% of all tested devices were better, 8% similar, 58% worse
» The best had a delta of 4%, average was 25%, worst was 134%
SCHENKER XMG Neo 17 (Early 2021, RTX 3070, 5800H) audio analysis
(+) | speakers can play relatively loud (84 dB)
Bass 100 - 315 Hz
(-) | nearly no bass - on average 20.8% lower than median
(±) | linearity of bass is average (12.3% delta to prev. frequency)
Mids 400 - 2000 Hz
(+) | balanced mids - only 2.9% away from median
(+) | mids are linear (5.1% delta to prev. frequency)
Highs 2 - 16 kHz
(+) | balanced highs - only 2.7% away from median
(±) | linearity of highs is average (7.6% delta to prev. frequency)
Overall 100 - 16.000 Hz
(+) | overall sound is linear (14.5% difference to median)
Compared to same class
» 25% of all tested devices in this class were better, 6% similar, 69% worse
» The best had a delta of 6%, average was 18%, worst was 132%
Compared to all devices tested
» 15% of all tested devices were better, 3% similar, 82% worse
» The best had a delta of 4%, average was 25%, worst was 134%
Power management
Energy consumption
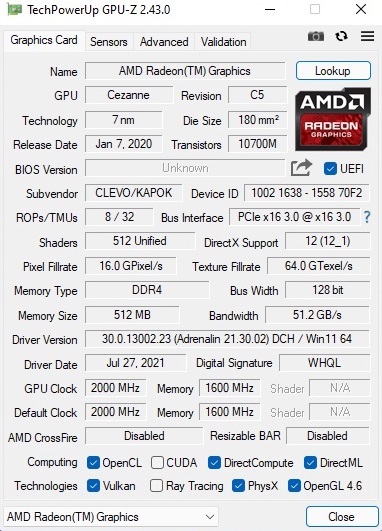
Thanks to the graphics switching (Nvidia Optimus), the Apex 17 does not consume too much energy during undemanding tasks. 10 to 20 watts idle consumption is less than the competition. The differences are limited under load.
| Off / Standby | |
| Idle | |
| Load |
|
| SCHENKER XMG Apex 17 M21 R7 5800H, GeForce RTX 3070 Laptop GPU | SCHENKER XMG Neo 17 (Early 2021, RTX 3070, 5800H) R7 5800H, GeForce RTX 3070 Laptop GPU | Razer Blade 17 RTX 3070 i7-11800H, GeForce RTX 3070 Laptop GPU | MSI GP76 Leopard 10UG i7-10750H, GeForce RTX 3070 Laptop GPU | Acer Nitro 5 AN517-41-R5Z7 R7 5800H, GeForce RTX 3070 Laptop GPU | Average of class Gaming | |
|---|---|---|---|---|---|---|
| Power Consumption | -15% | -50% | -8% | -21% | -24% | |
| Idle Minimum * | 10 | 13 -30% | 20.9 -109% | 12 -20% | 18.7 -87% | 13.8 ? -38% |
| Idle Average * | 14 | 16 -14% | 25.1 -79% | 16 -14% | 22 -57% | 19.2 ? -37% |
| Idle Maximum * | 20 | 26 -30% | 45 -125% | 28 -40% | 25.2 -26% | 27 ? -35% |
| Load Average * | 112 | 125 -12% | 102 9% | 92 18% | 134.7 -20% | 111.3 ? 1% |
| Witcher 3 ultra * | 202 | 187 7% | 189 6% | 198 2% | 135 33% | |
| Load Maximum * | 231 | 259 -12% | 234.8 -2% | 210 9% | 157 32% | 251 ? -9% |
* ... smaller is better
Energy consumption Witcher 3
Battery life
The battery capacity is modest. 49 Wh are no longer up-to-date in 2021, especially in view of the price. For comparison: The competition offers 62 to 70 Wh. Fortunately, the runtimes do not drop completely due to the moderate energy consumption. The Apex 17 lasted around 5 hours in our Wi-Fi test with medium brightness - a decent rate.
| SCHENKER XMG Apex 17 M21 R7 5800H, GeForce RTX 3070 Laptop GPU, 49 Wh | SCHENKER XMG Neo 17 (Early 2021, RTX 3070, 5800H) R7 5800H, GeForce RTX 3070 Laptop GPU, 62 Wh | Razer Blade 17 RTX 3070 i7-11800H, GeForce RTX 3070 Laptop GPU, 70 Wh | MSI GP76 Leopard 10UG i7-10750H, GeForce RTX 3070 Laptop GPU, 65 Wh | Acer Nitro 5 AN517-41-R5Z7 R7 5800H, GeForce RTX 3070 Laptop GPU, 57.5 Wh | Average of class Gaming | |
|---|---|---|---|---|---|---|
| Battery Runtime | -30% | 15% | -18% | 32% | 30% | |
| Reader / Idle | 422 | 281 -33% | 404 -4% | 337 -20% | 608 44% | 544 ? 29% |
| WiFi v1.3 | 294 | 208 -29% | 314 7% | 252 -14% | 334 14% | 368 ? 25% |
| Load | 62 | 44 -29% | 88 42% | 49 -21% | 86 39% | 84.2 ? 36% |
| H.264 | 420 | 399 ? |
Pros
Cons
Verdict
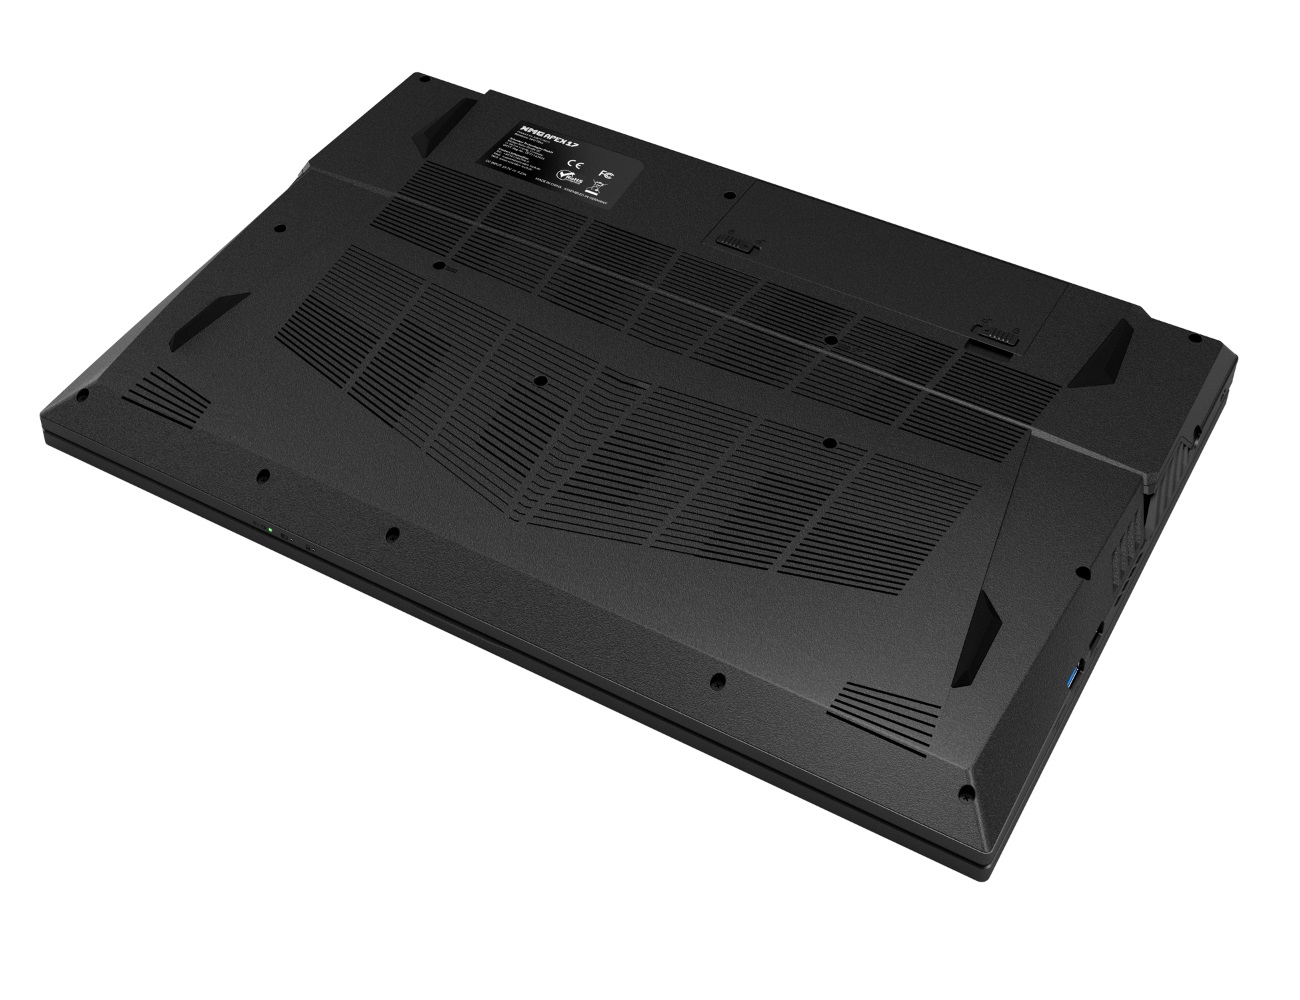
If you are looking for a gaming notebook with good maintenance options, the Apex 17 is the right choice.
An externally accessible and removable battery is rarely found nowadays (although the battery capacity leaves much to be desired).
Apart from the extremely high noise development in performance mode - there are different performance profiles - the 17 incher otherwise looks rather unspectacular. The case, input devices and interfaces cut a solid figure. On the other hand, it is a bit unfortunate that the manufacturer did not install a better display. Brightness and contrast only meet the high demands to a limited extent.
In return, the Apex 17 scores in the performance category. The processor and graphics card deliver above-average benchmark rates (not least thanks to the generous TDP).
Economy fans who would like to have an RTX 3070 should rather go for the Acer Nitro 5 AN517, which costs a few 100 Euros (~$114) less with similar equipment (but also has a lower TGP).
Price and availability
The XMG Apex 17 is available in the manufacturer's store bestware.com starting at €1,479 (~$1,692).
SCHENKER XMG Apex 17 M21
-
11/02/2021 v7
Florian Glaser
More articles related to this device
SCHENKER XMG Apex 17 M21 (XMG Apex Series)Related Articles


Pricecompare

