 Deutsch
 English
 Español
 Français
 Italiano
 Nederlands
 Polski
 Português
 Русский
 Türkçe
 Svenska
 Chinese
 Magyar
Gigabyte A7 X1 in review: Gaming laptop offers stable endurance performance

With the Gigabyte G5 KC, we recently reviewed a laptop from the manufacturer that costs just under 1,000 Euros (~$1,162) but is still a powerful device. With prices around 2,400 Euros (~$2,789), Gigabyte also offers considerably more expensive models, such as the Aero 15 OLED XD.
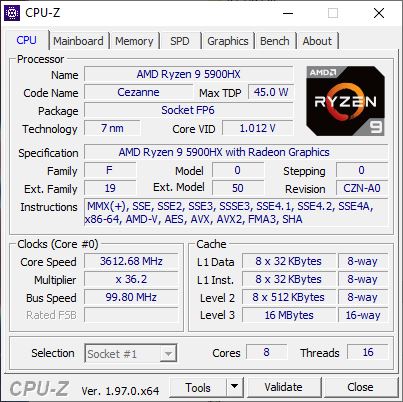
Our current review sample ranks in the middle in terms of pricing at around 1,800 Euros (~$2,092) and is equipped with an AMD Ryzen 9 5900HX and an Nvidia GeForce RTX 3070. It also comes with 16 GB of RAM and a 512 GB SSD.
Possible contenders in comparison
Rating | Date | Model | Weight | Height | Size | Resolution | Best Price |
|---|---|---|---|---|---|---|---|
| 83.2 % | 10/2021 | Gigabyte A7 X1 R9 5900HX, GeForce RTX 3070 Laptop GPU | 2.5 kg | 34 mm | 17.30" | 1920x1080 | |
| 85 % | 07/2021 | Medion Erazer Beast X25 R9 5900HX, GeForce RTX 3080 Laptop GPU | 2.3 kg | 23 mm | 17.30" | 1920x1080 | |
| 85.5 % | 07/2021 | Medion Erazer Beast X20 i7-10870H, GeForce RTX 3070 Laptop GPU | 2.2 kg | 23 mm | 17.30" | 2560x1440 | |
| 82.8 % | 06/2021 | Asus TUF Gaming F17 FX706HM i9-11900H, GeForce RTX 3060 Laptop GPU | 2.7 kg | 26 mm | 17.30" | 1920x1080 | |
| 85.1 % | 01/2021 | SCHENKER XMG Neo 17 (Early 2021, RTX 3070, 5800H) R7 5800H, GeForce RTX 3070 Laptop GPU | 2.5 kg | 27 mm | 17.30" | 2560x1440 |
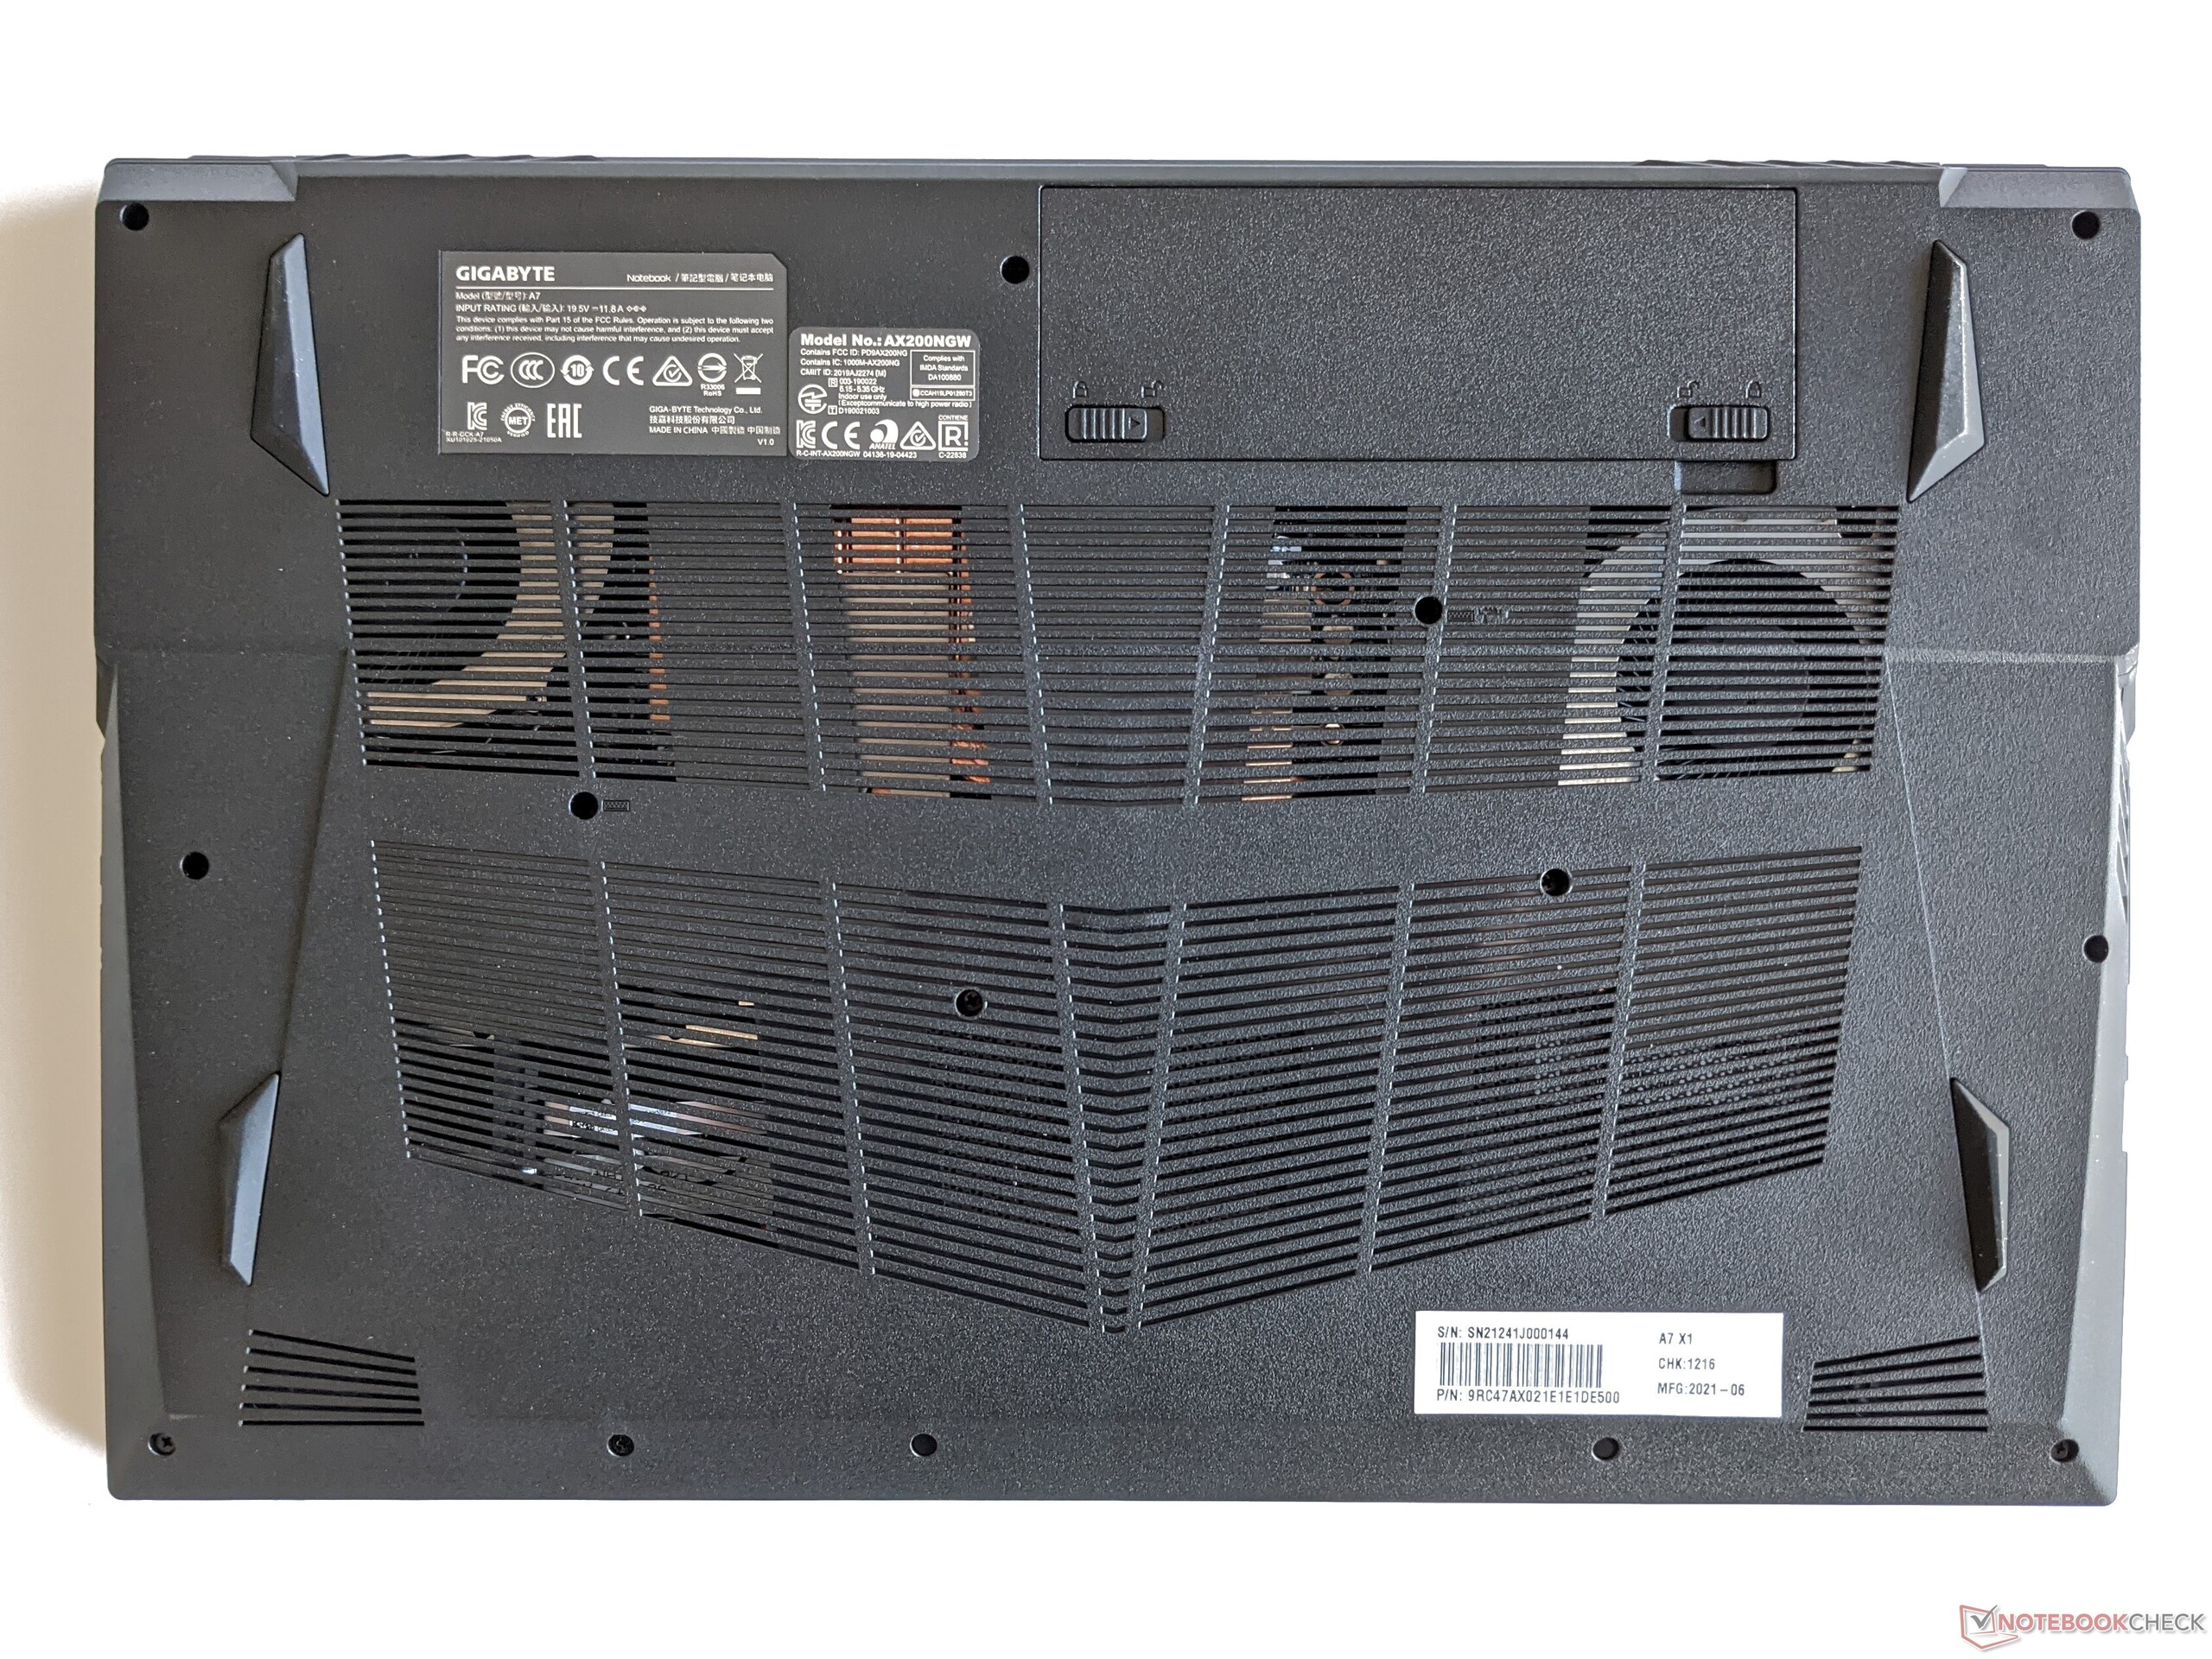
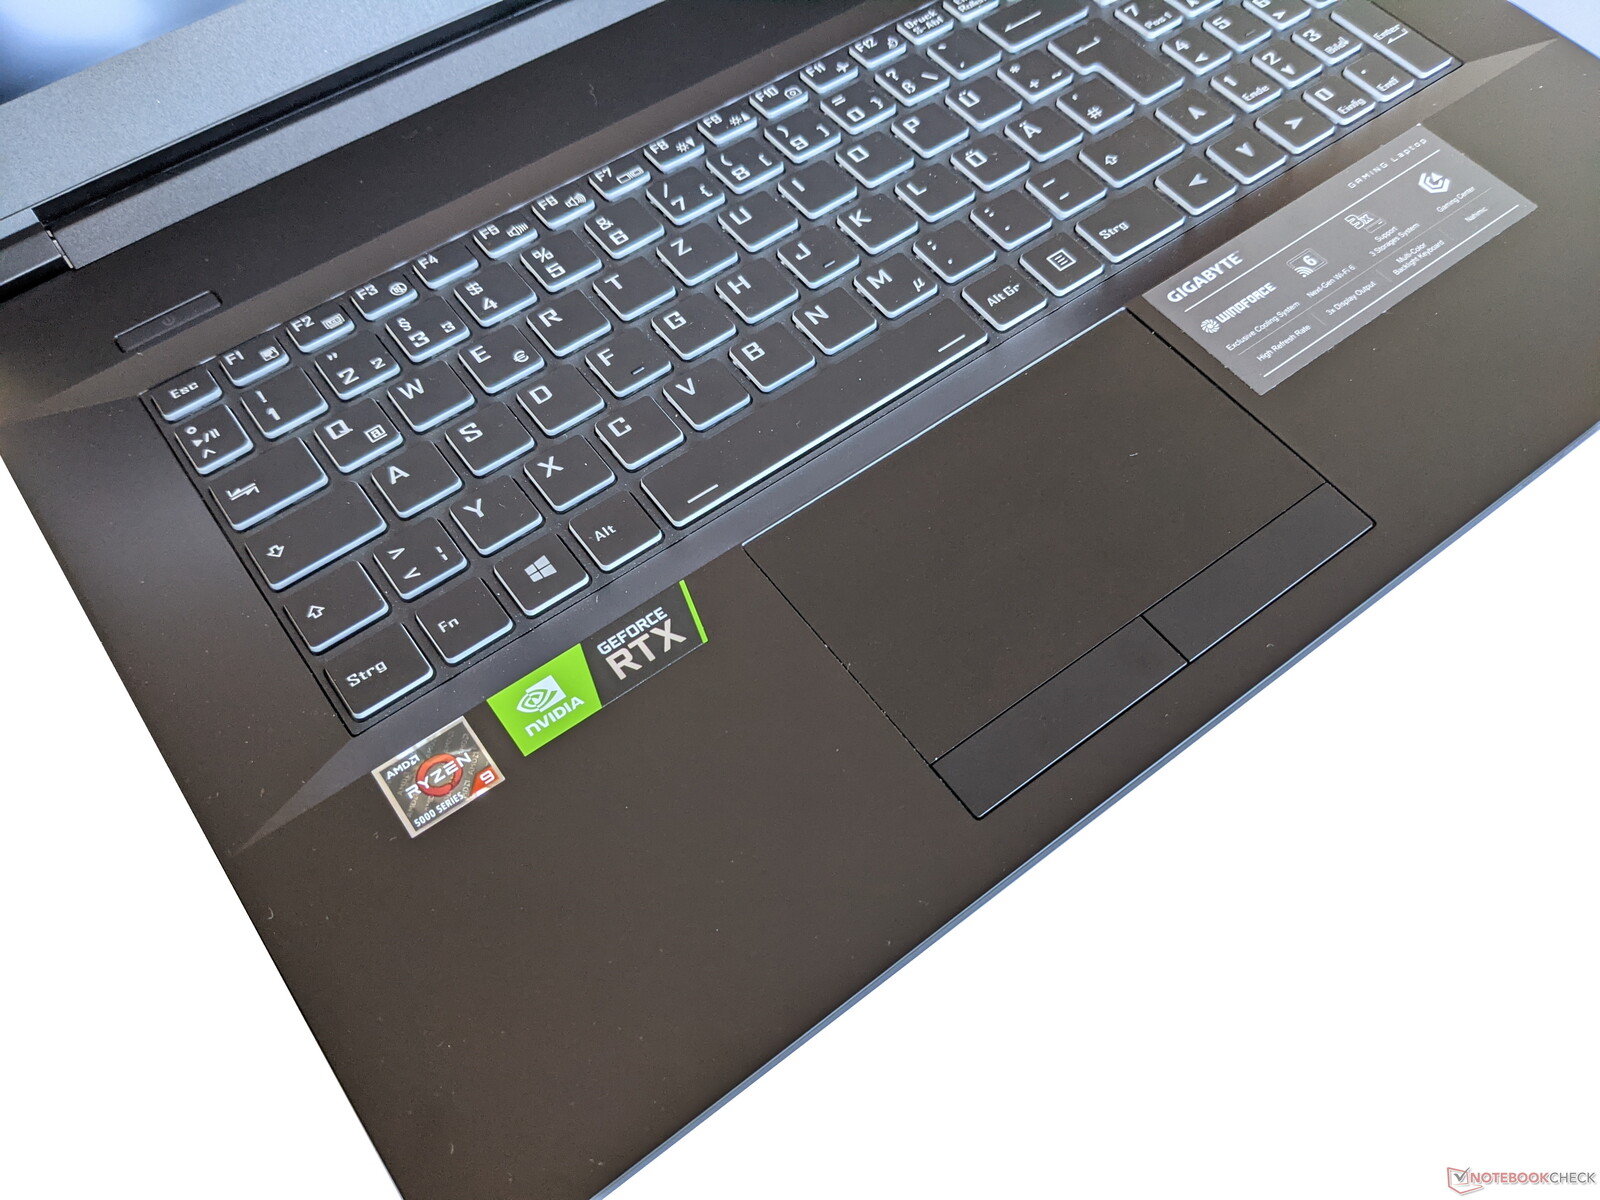
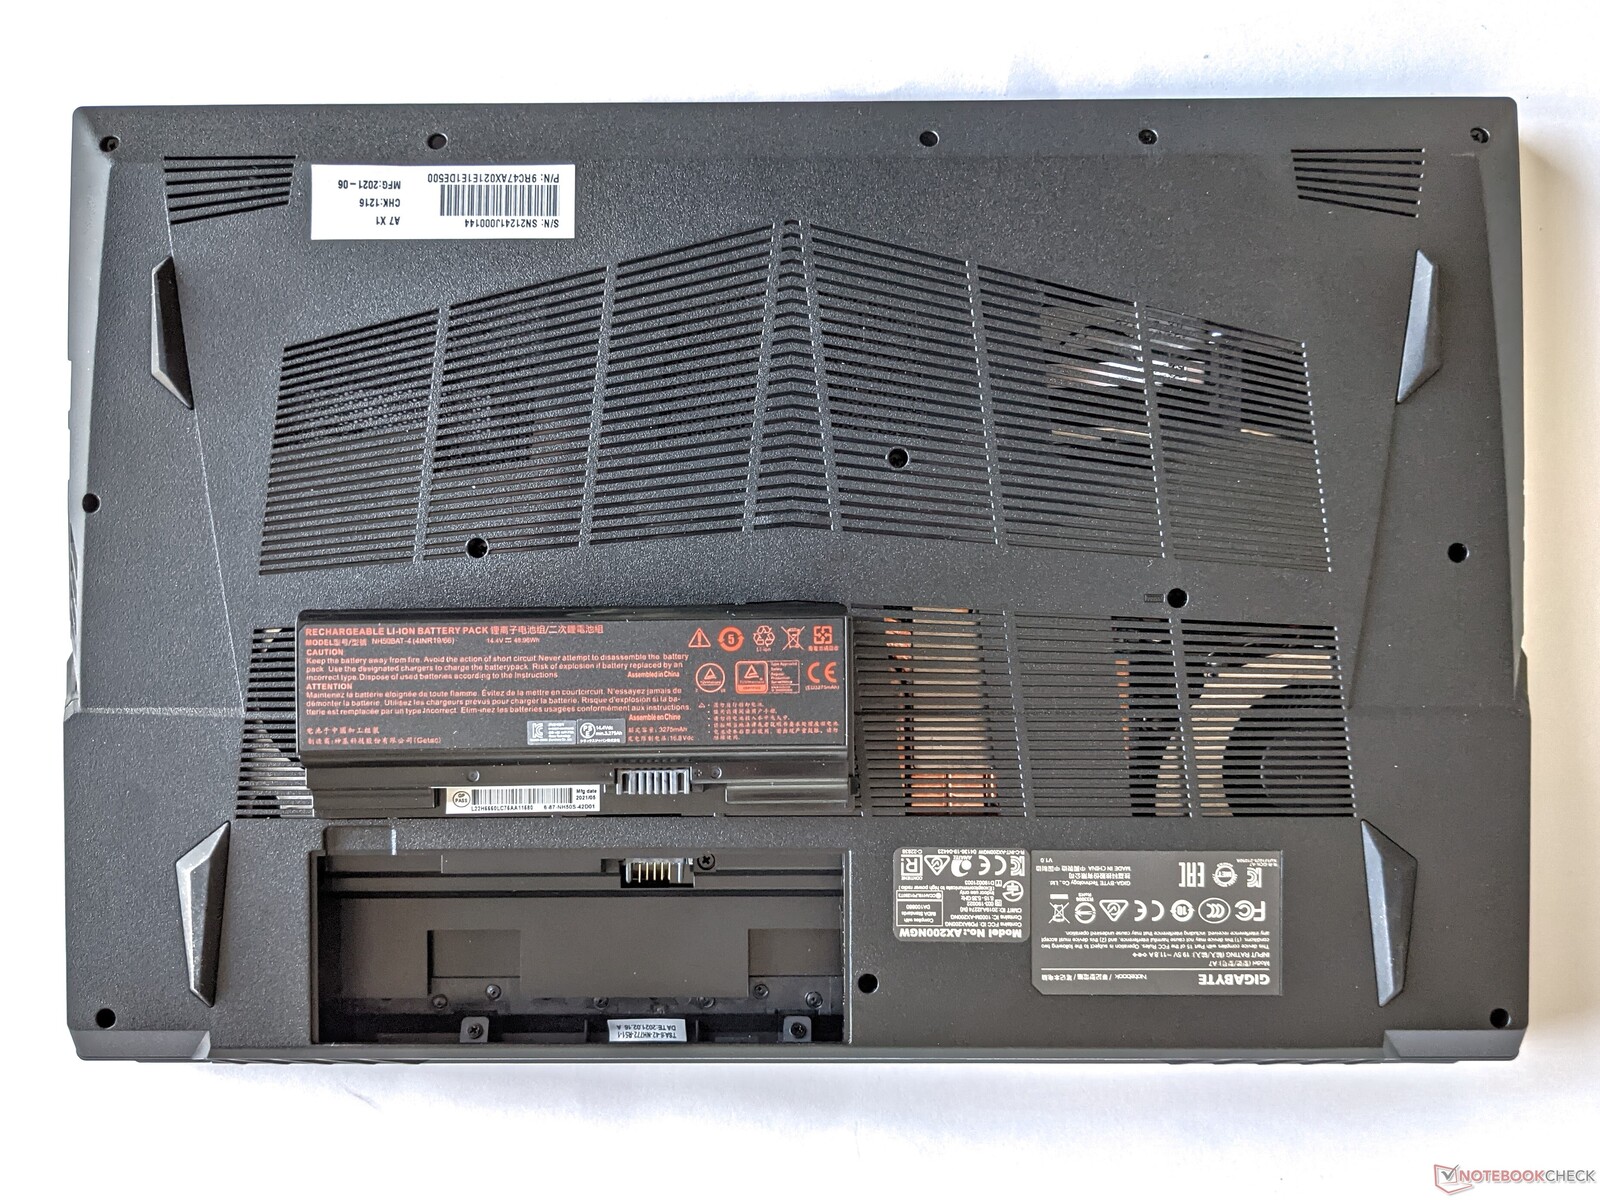
Case - Gaming laptop with replaceable battery
Gigabyte uses a plastic case for the A7 X1, which has a decent build quality and looks sturdy. The display can be opened to a maximum angle of about 135° and is held firmly in every position by the hinges. There are generous air vents at the bottom, and the battery, which can be removed without the need for any tools, is also found here.
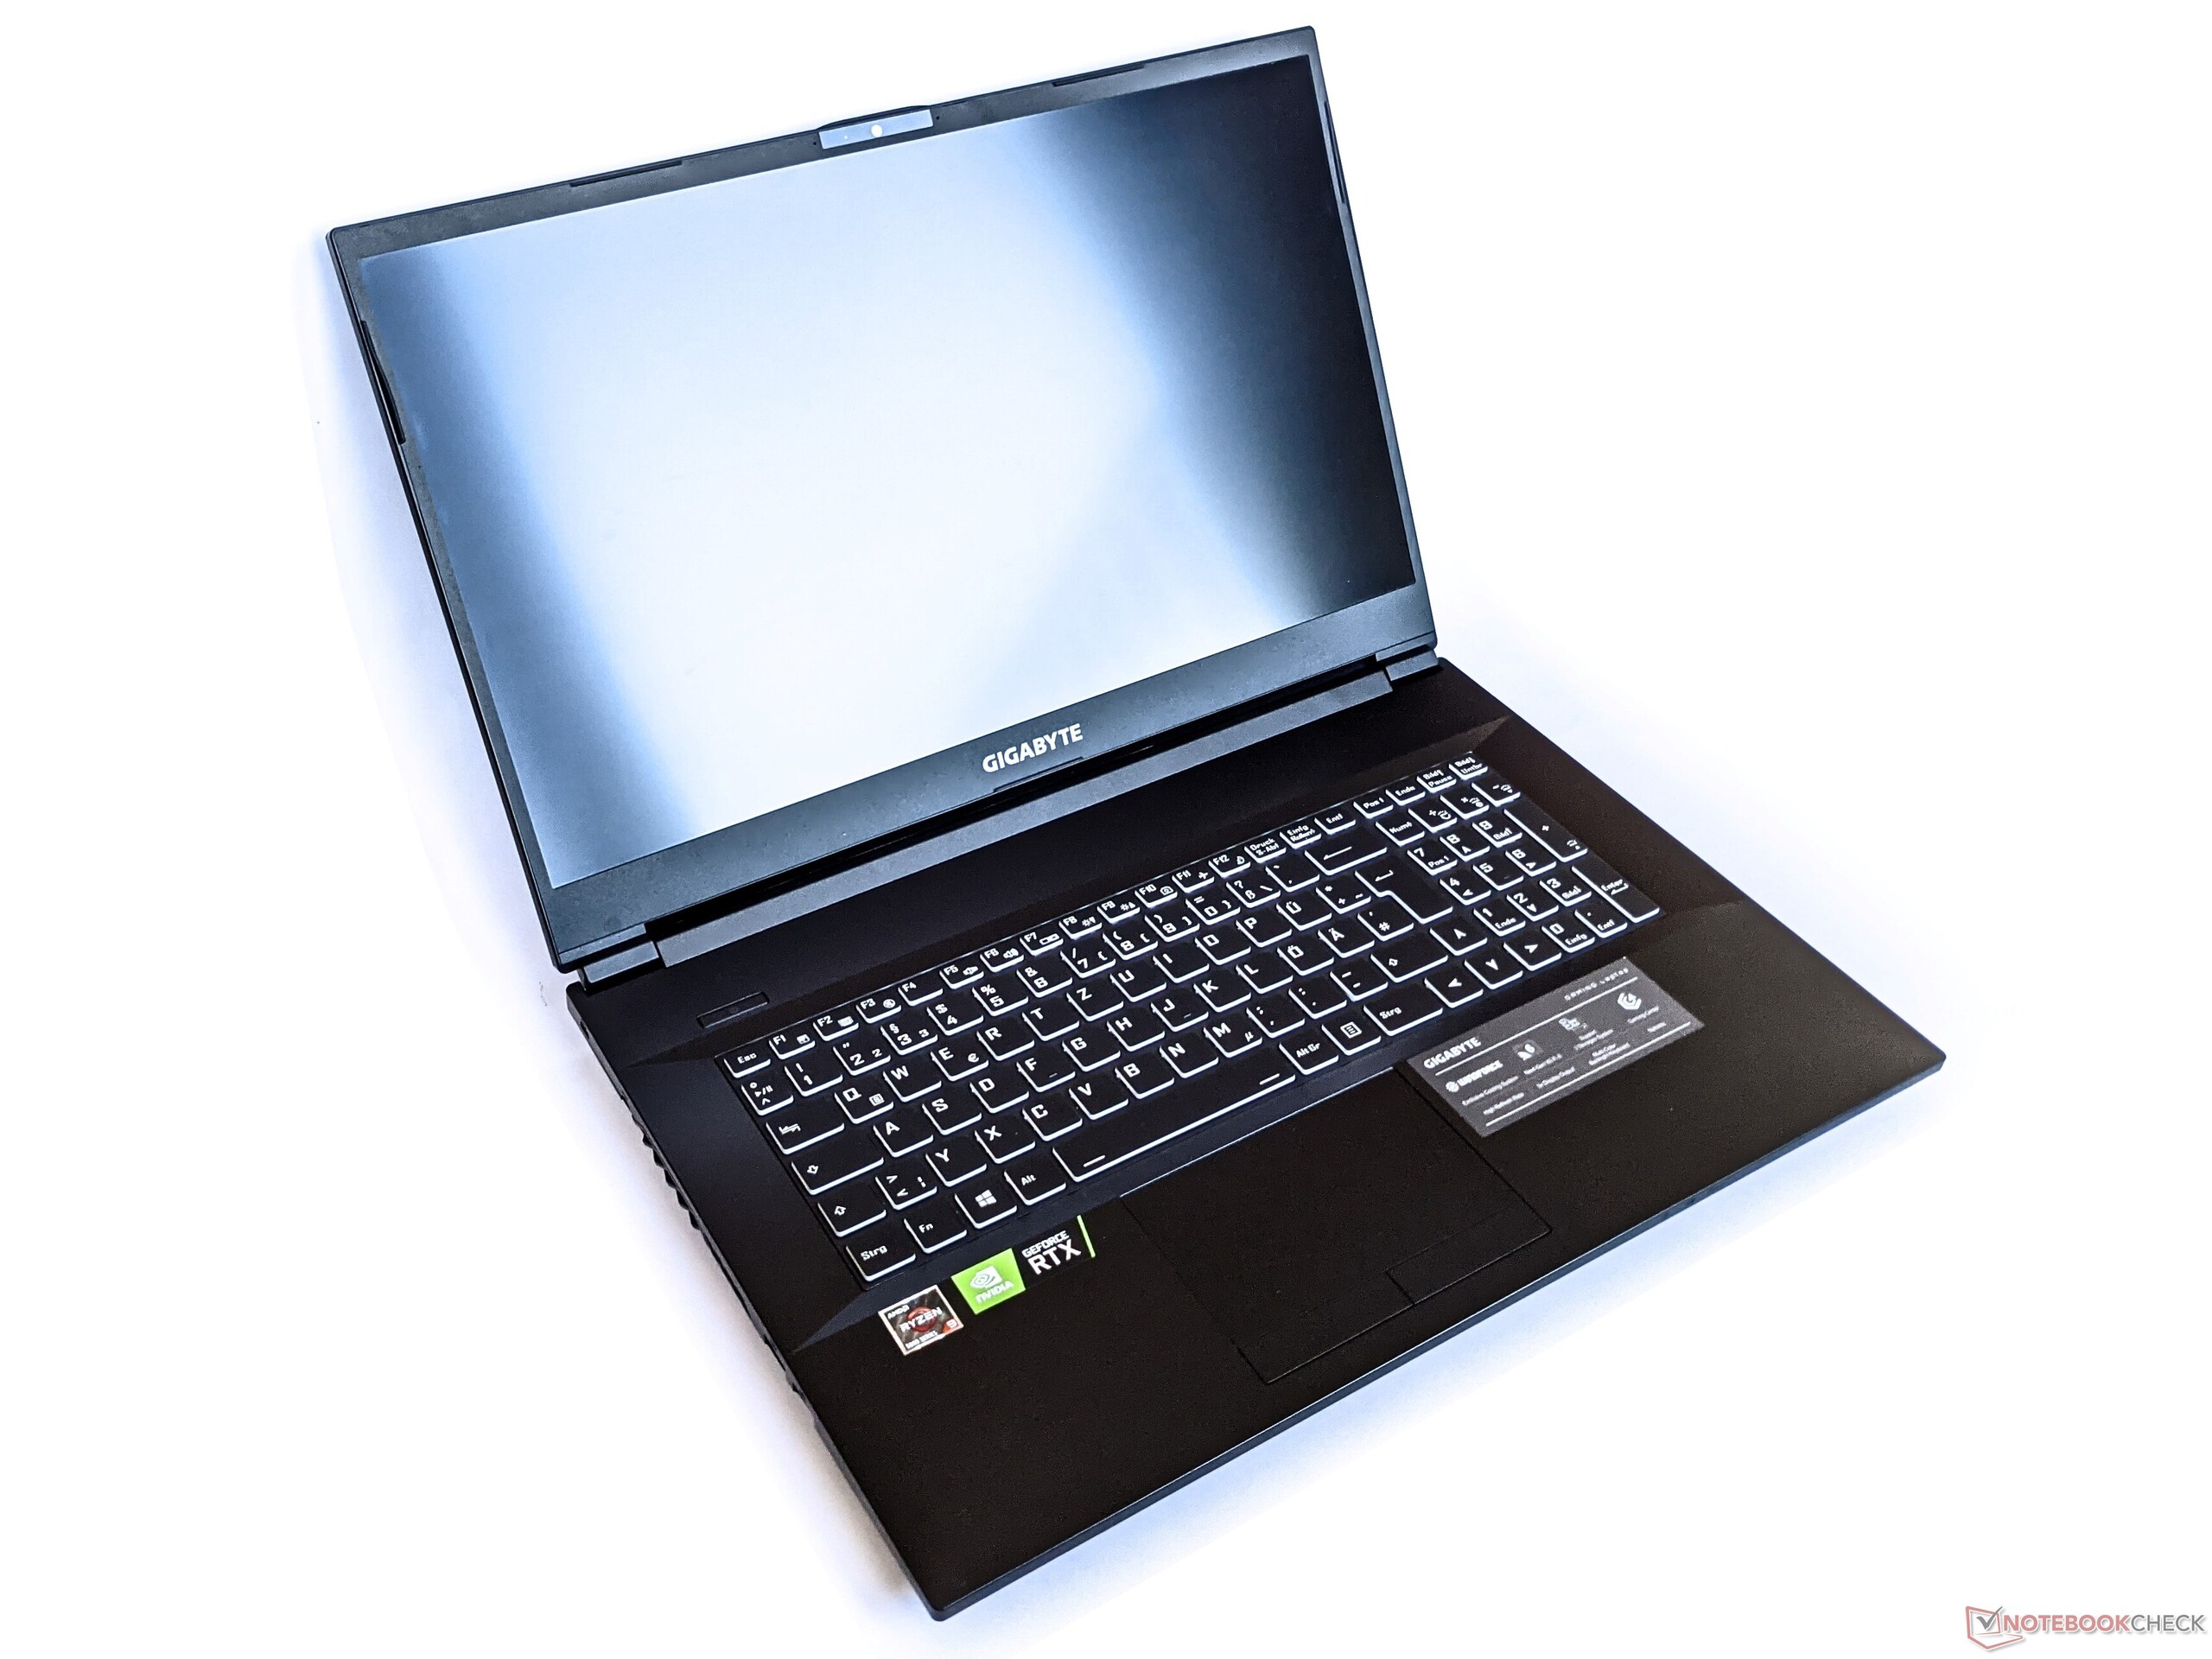
In terms of length and width, the Gigabyte A7 X1 doesn't differ much from other 17-inch gaming laptops. However, it's significantly thicker than most competitors at 3.4 cm.
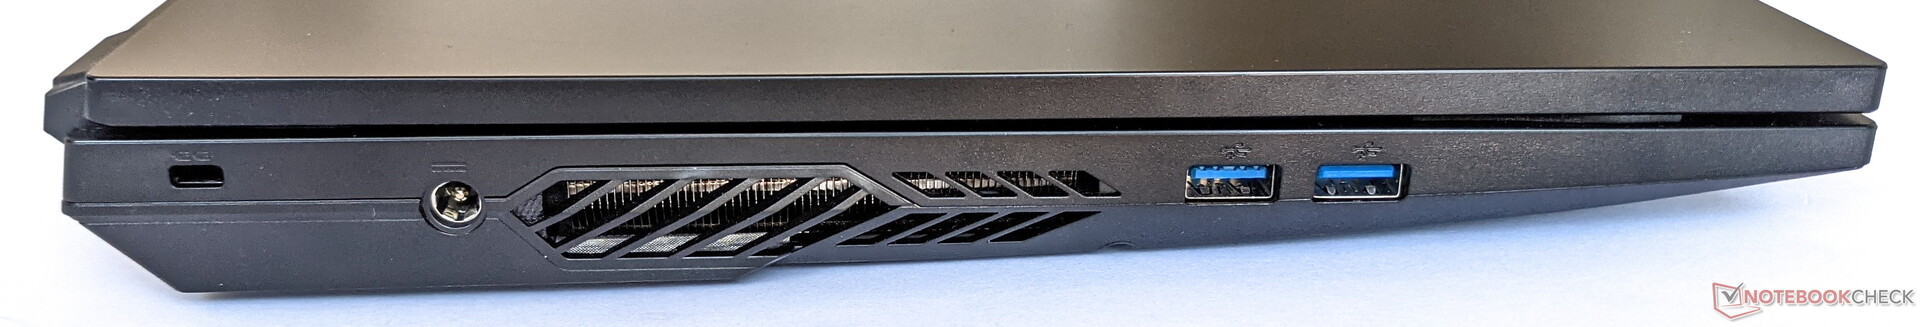
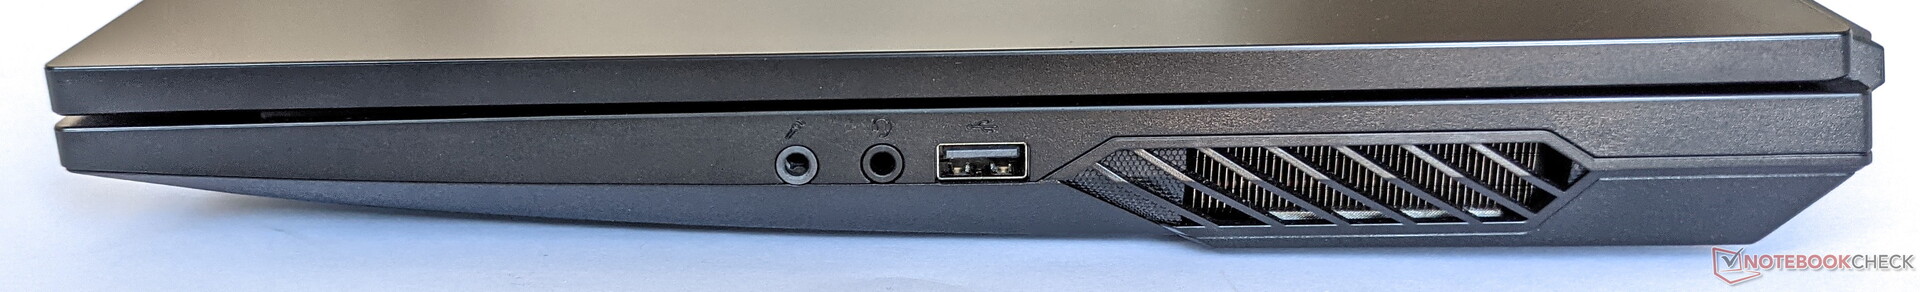
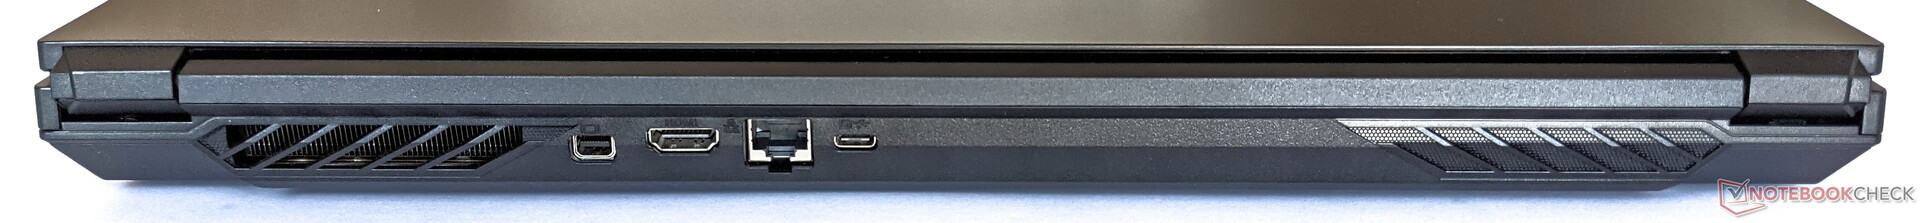
Connectivity - Laptop supports connecting several monitors
The Gigabyte A7 X1 offers a basic assortment of ports. Notable here is the USB-C port at the back, which also supports DisplayPort 1.4. In combination with the Mini DP and HDMI, there are numerous connection options for external displays.
Communication
The Gigabyte A7 X1 can establish network connections over Gigabit LAN, Bluetooth 5.2, and Wi-Fi 6. In combination with our Netgear Nighthawk AX12 reference router, the latter achieves average speeds of 988 Mb/s for sending data and 1,432 Mb/s for receiving it. While the first value is only sufficient for the penultimate place in our test field, the A7 X1 outperforms our chosen competition devices when it comes to receiving data.
Webcam
Like most other manufacturers, Gigabyte has installed a low-resolution 0.9 MP webcam in the A7 X1. Even in good lighting conditions, the webcam shows blurry images and colors that are too pale.


Accessories
The Gigabyte A7 X1 comes with an appropriate power adapter in addition to the laptop. Other accessories and a replacement battery, for example, can be ordered directly from Gigabyte.
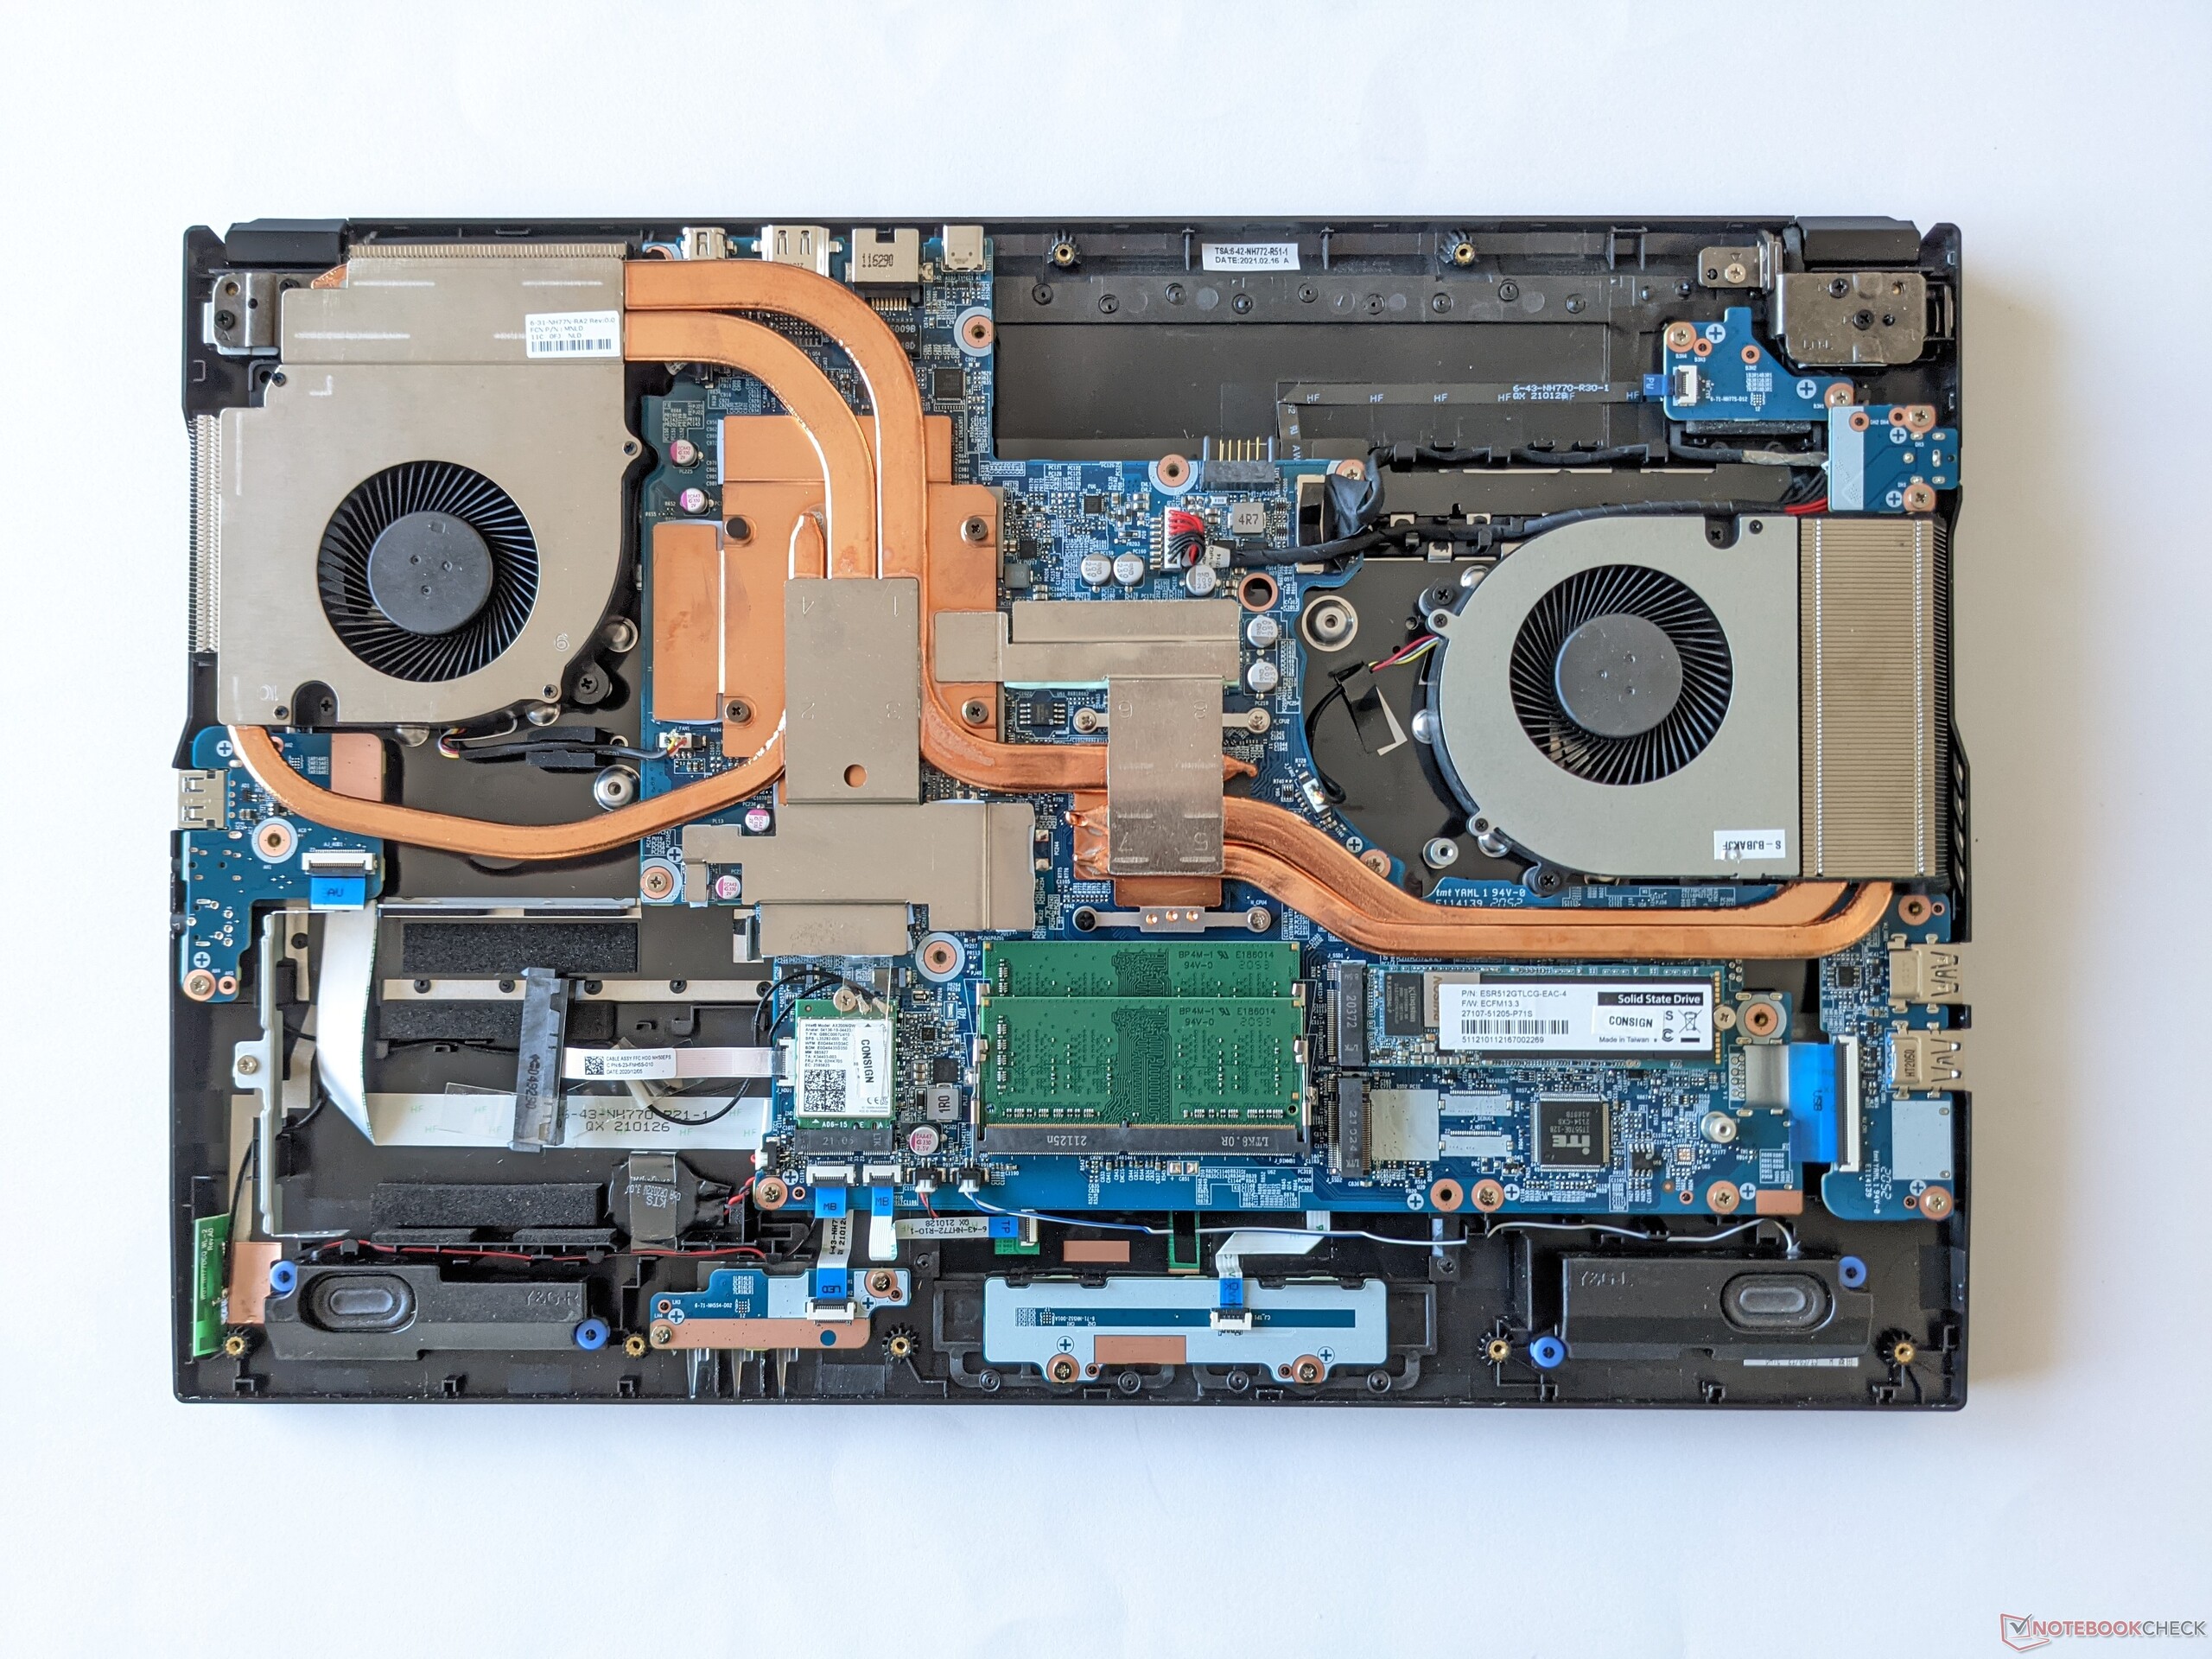
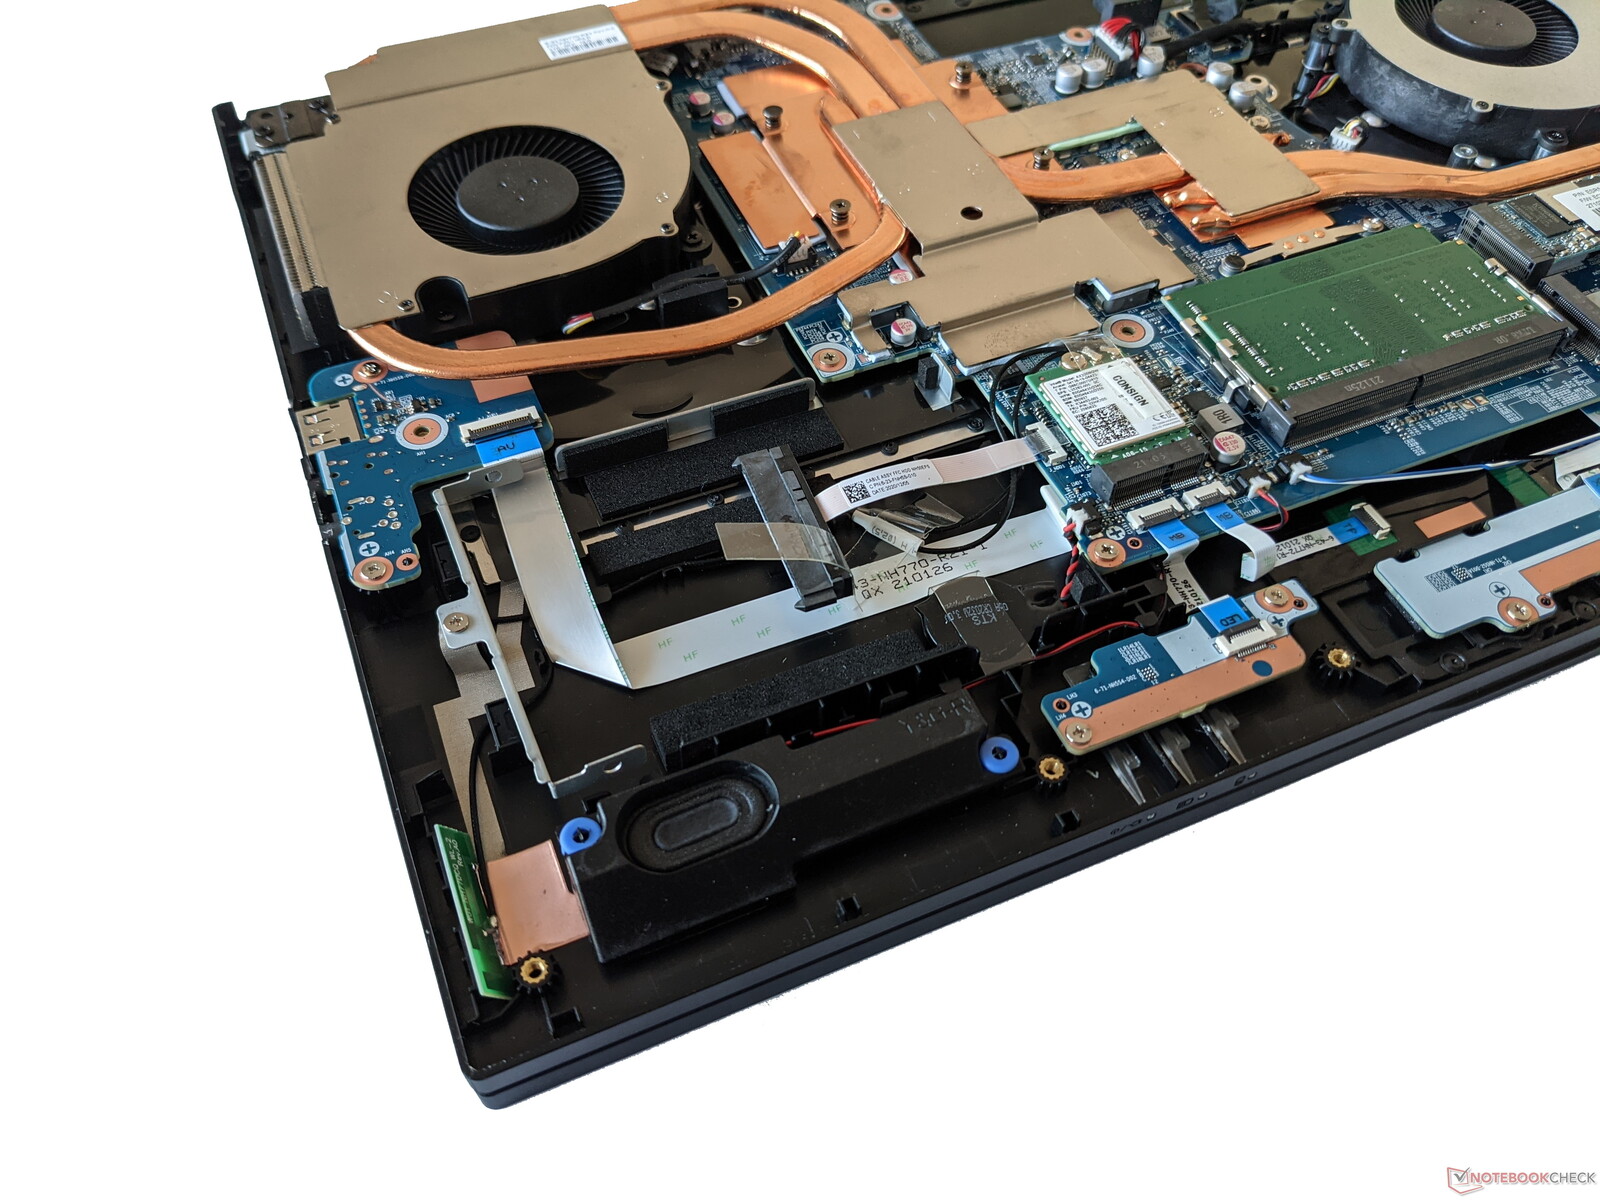
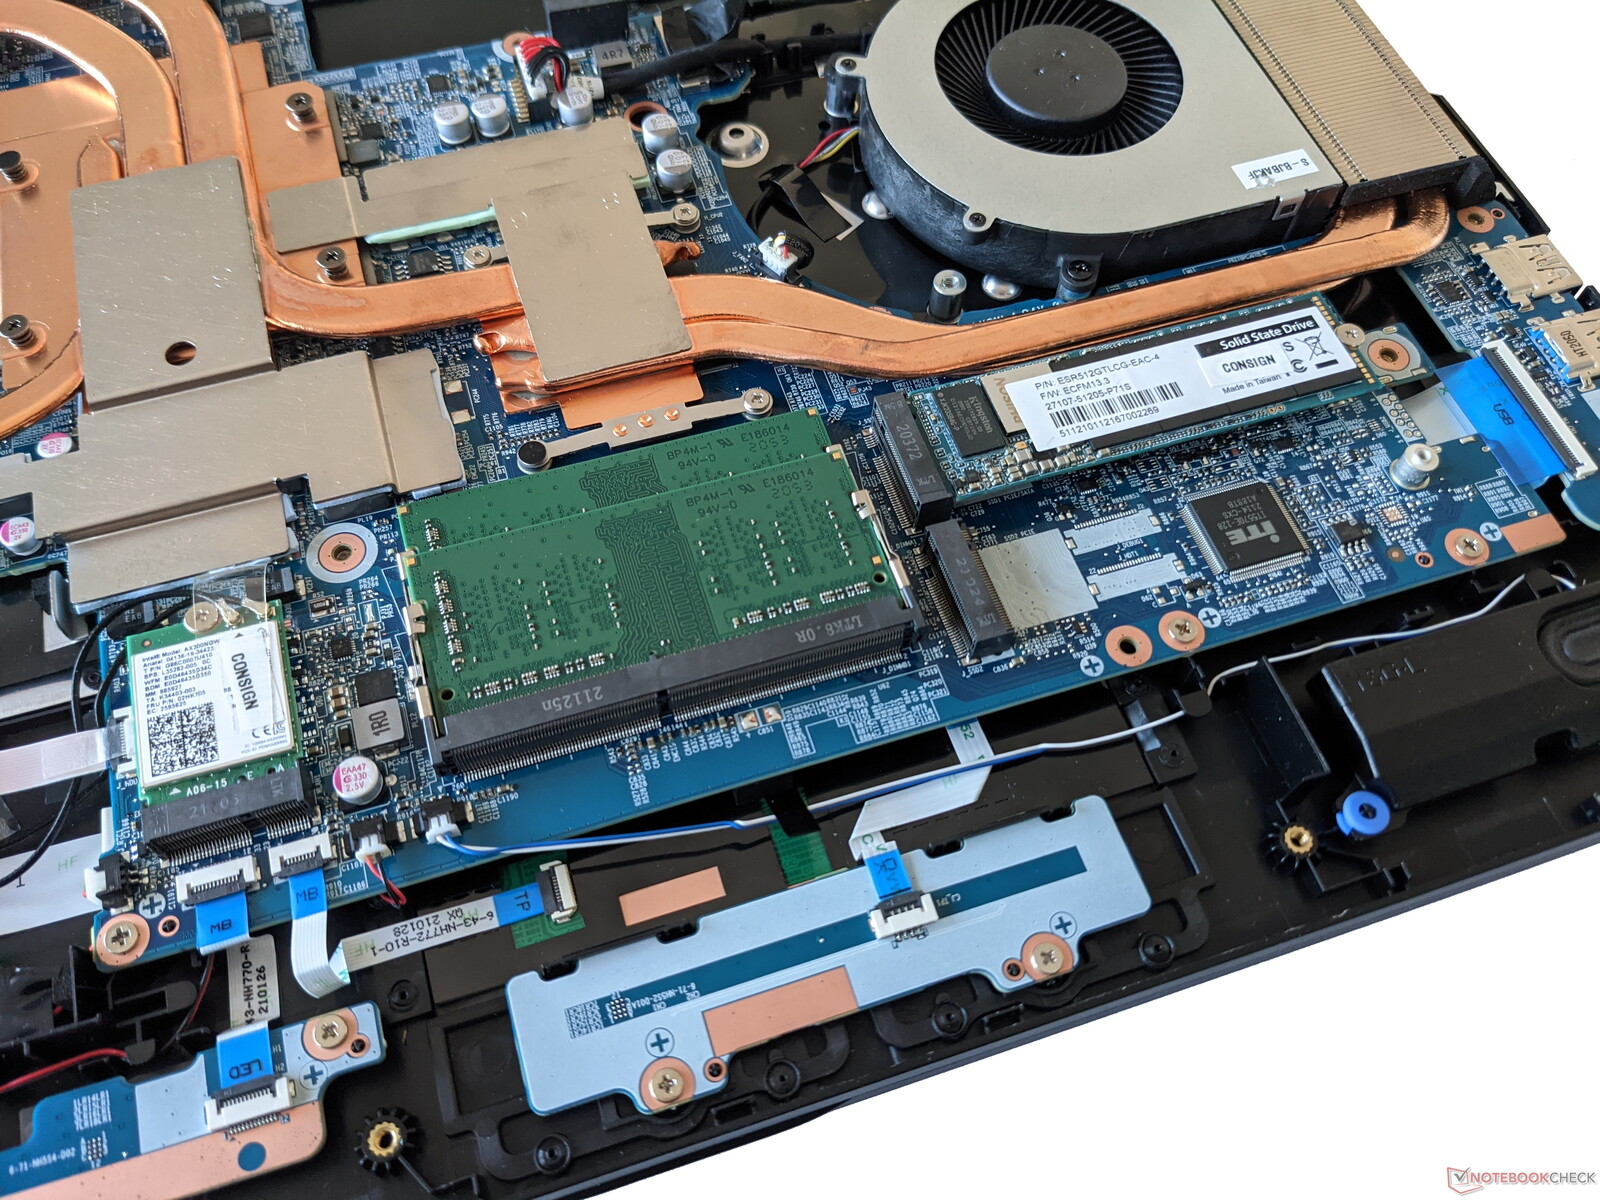
Maintenance
The base cover of the Gigabyte A7 X1 can be taken off after all visible screws have been removed. The interior reveals access to an empty 2.5-inch drive slot. The WLAN module and RAM can also be replaced. In addition, there's a second M.2 slot alongside the one occupied by the factory-installed SSD.
Warranty
Gigabyte provides the A7 X1 with a 24-month warranty period.
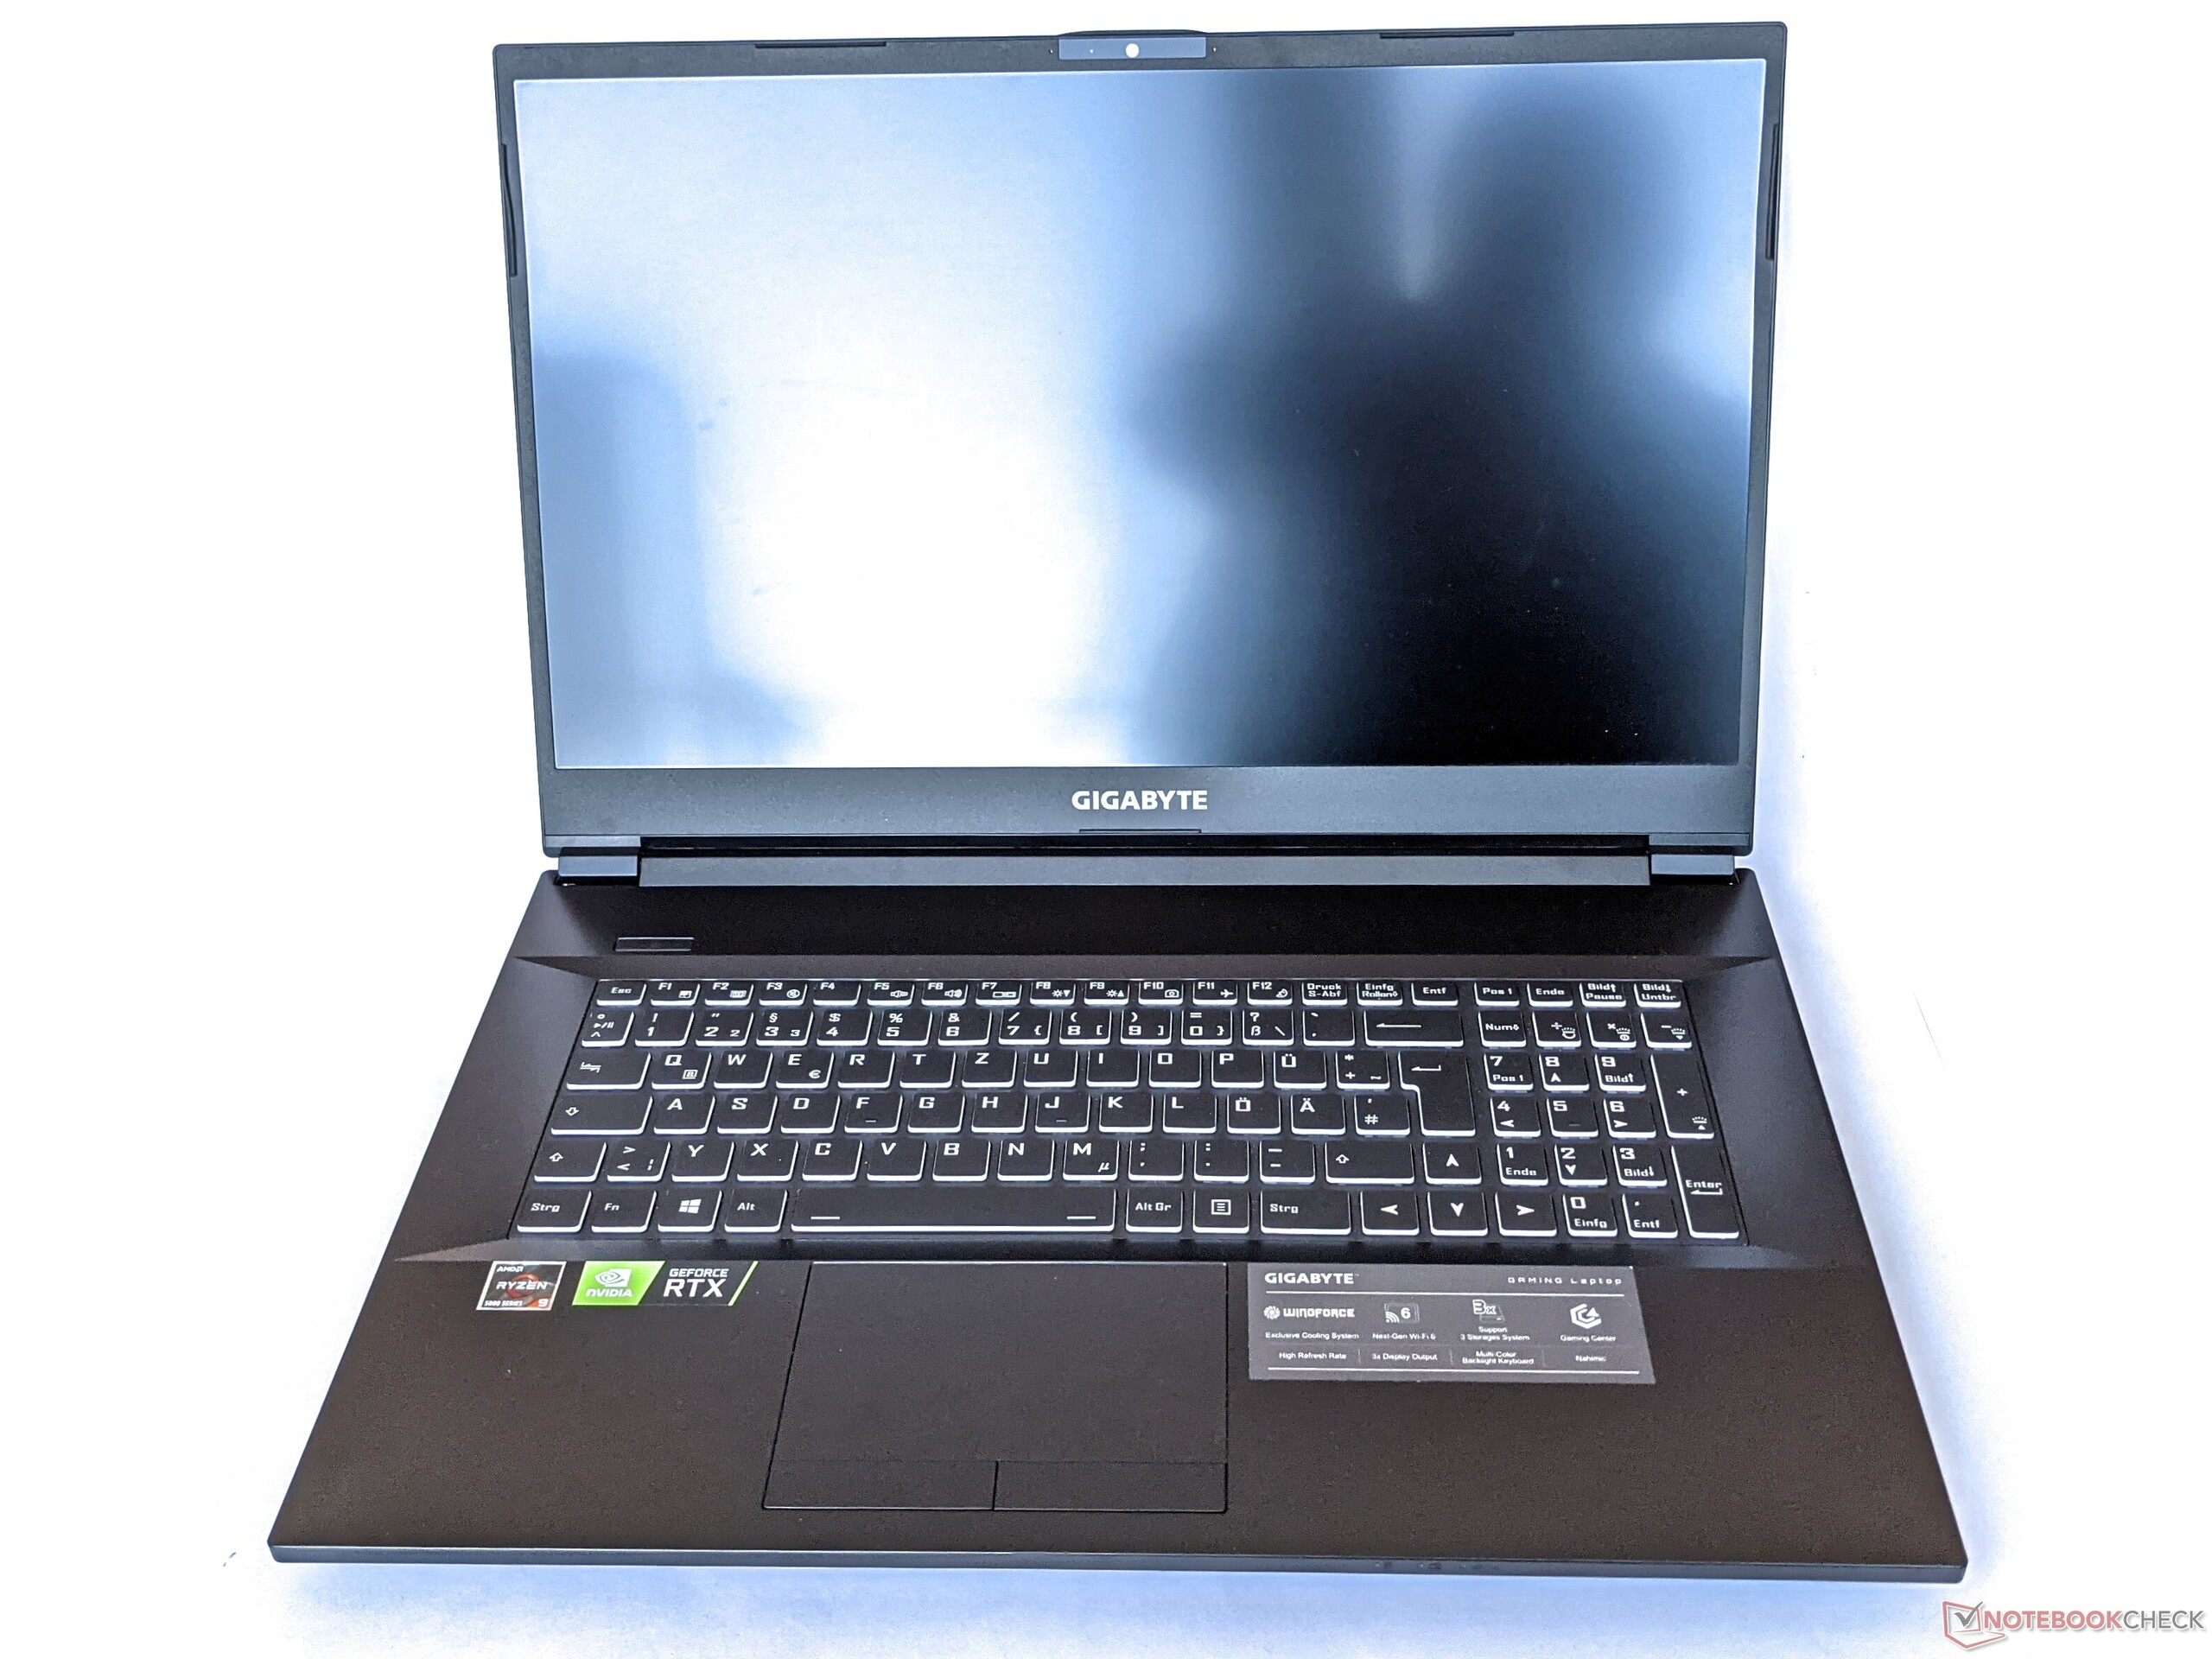
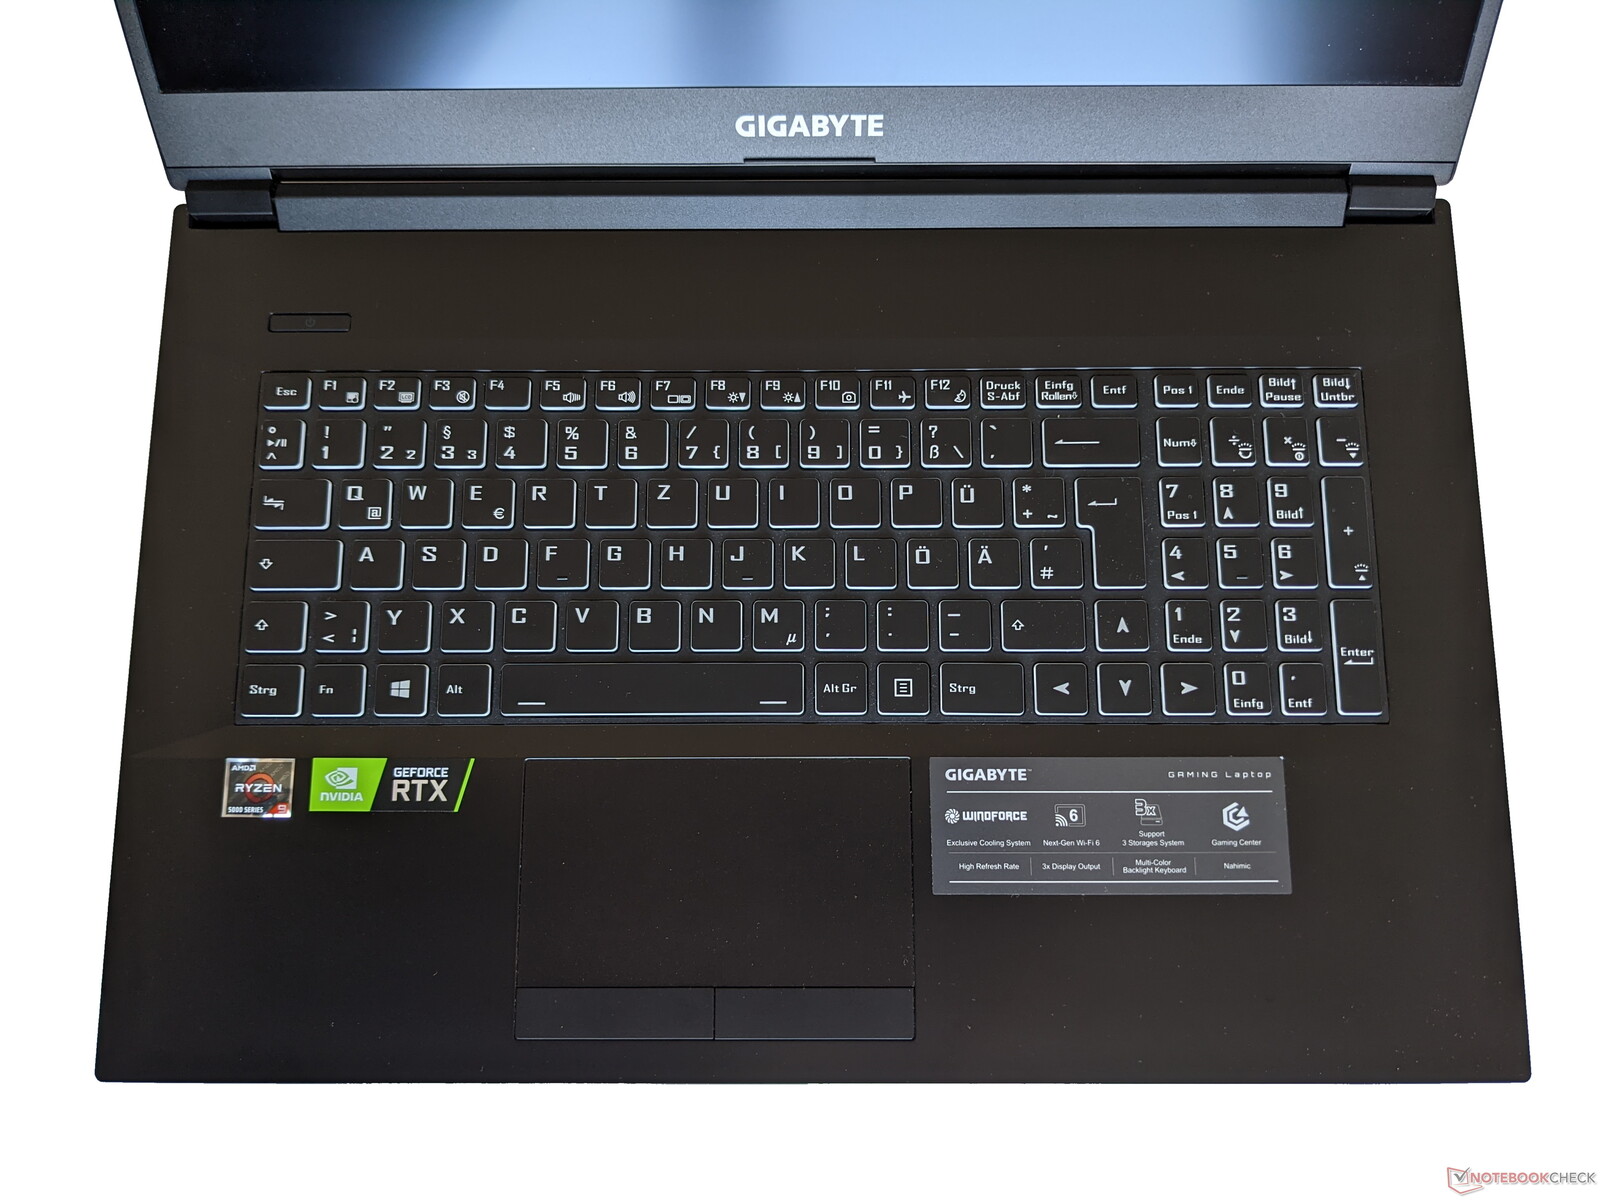
Input devices - Gigabyte laptop with keyboard backlighting
Keyboard
The keyboard of the A7 X1 provides a good grip for the fingers and is therefore also suitable for entering lengthy text. In addition, the arrow keys are normal-sized, and only the F keys and the number pad keys are a bit narrower. Thanks to the use of a complete keyboard layout, there's no need for double assignments, either.
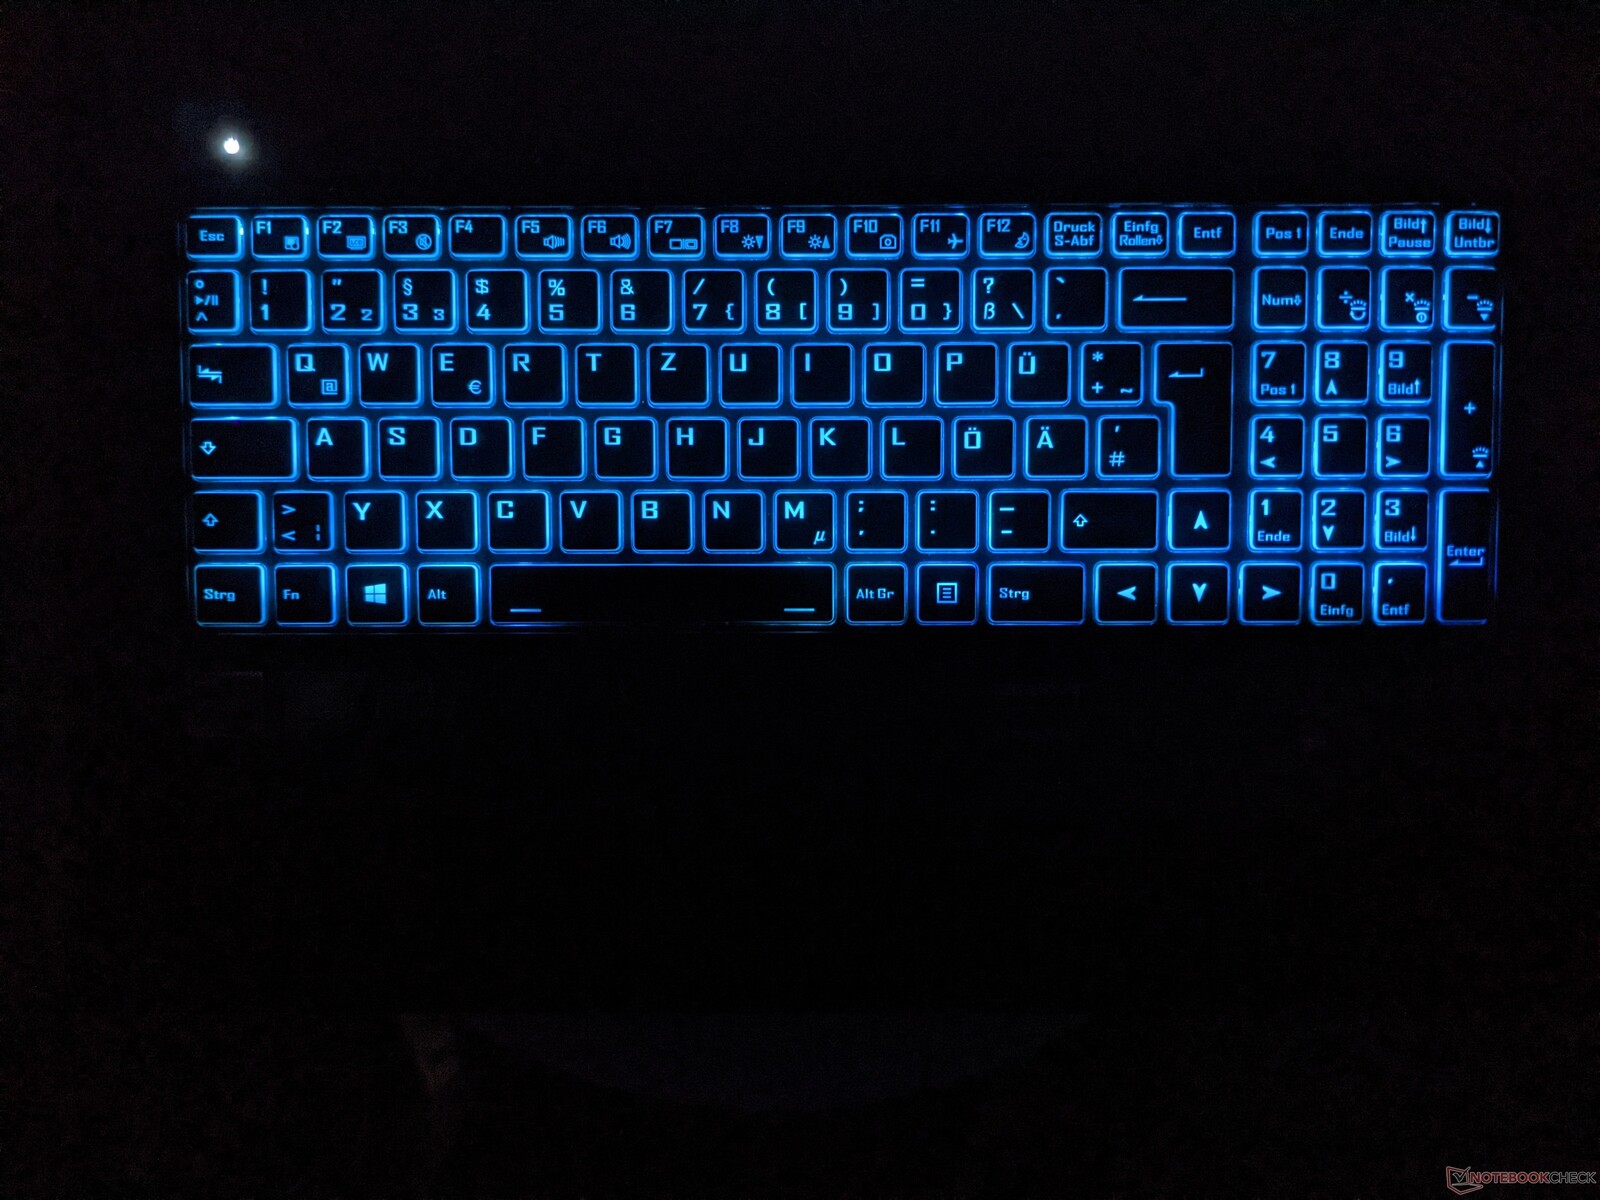
The keyboard also features backlighting, although the colors can't be customized. The letters are illuminated uniformly and without glare.
Touchpad
Gigabyte has opted for a touchpad with separate mouse buttons as a mouse replacement. While the pad's surface is perfectly suitable for navigating the mouse pointer, the mouse buttons feel a bit soft depending on where you press them. Nevertheless, the pad responds to triggered inputs with an audible click.
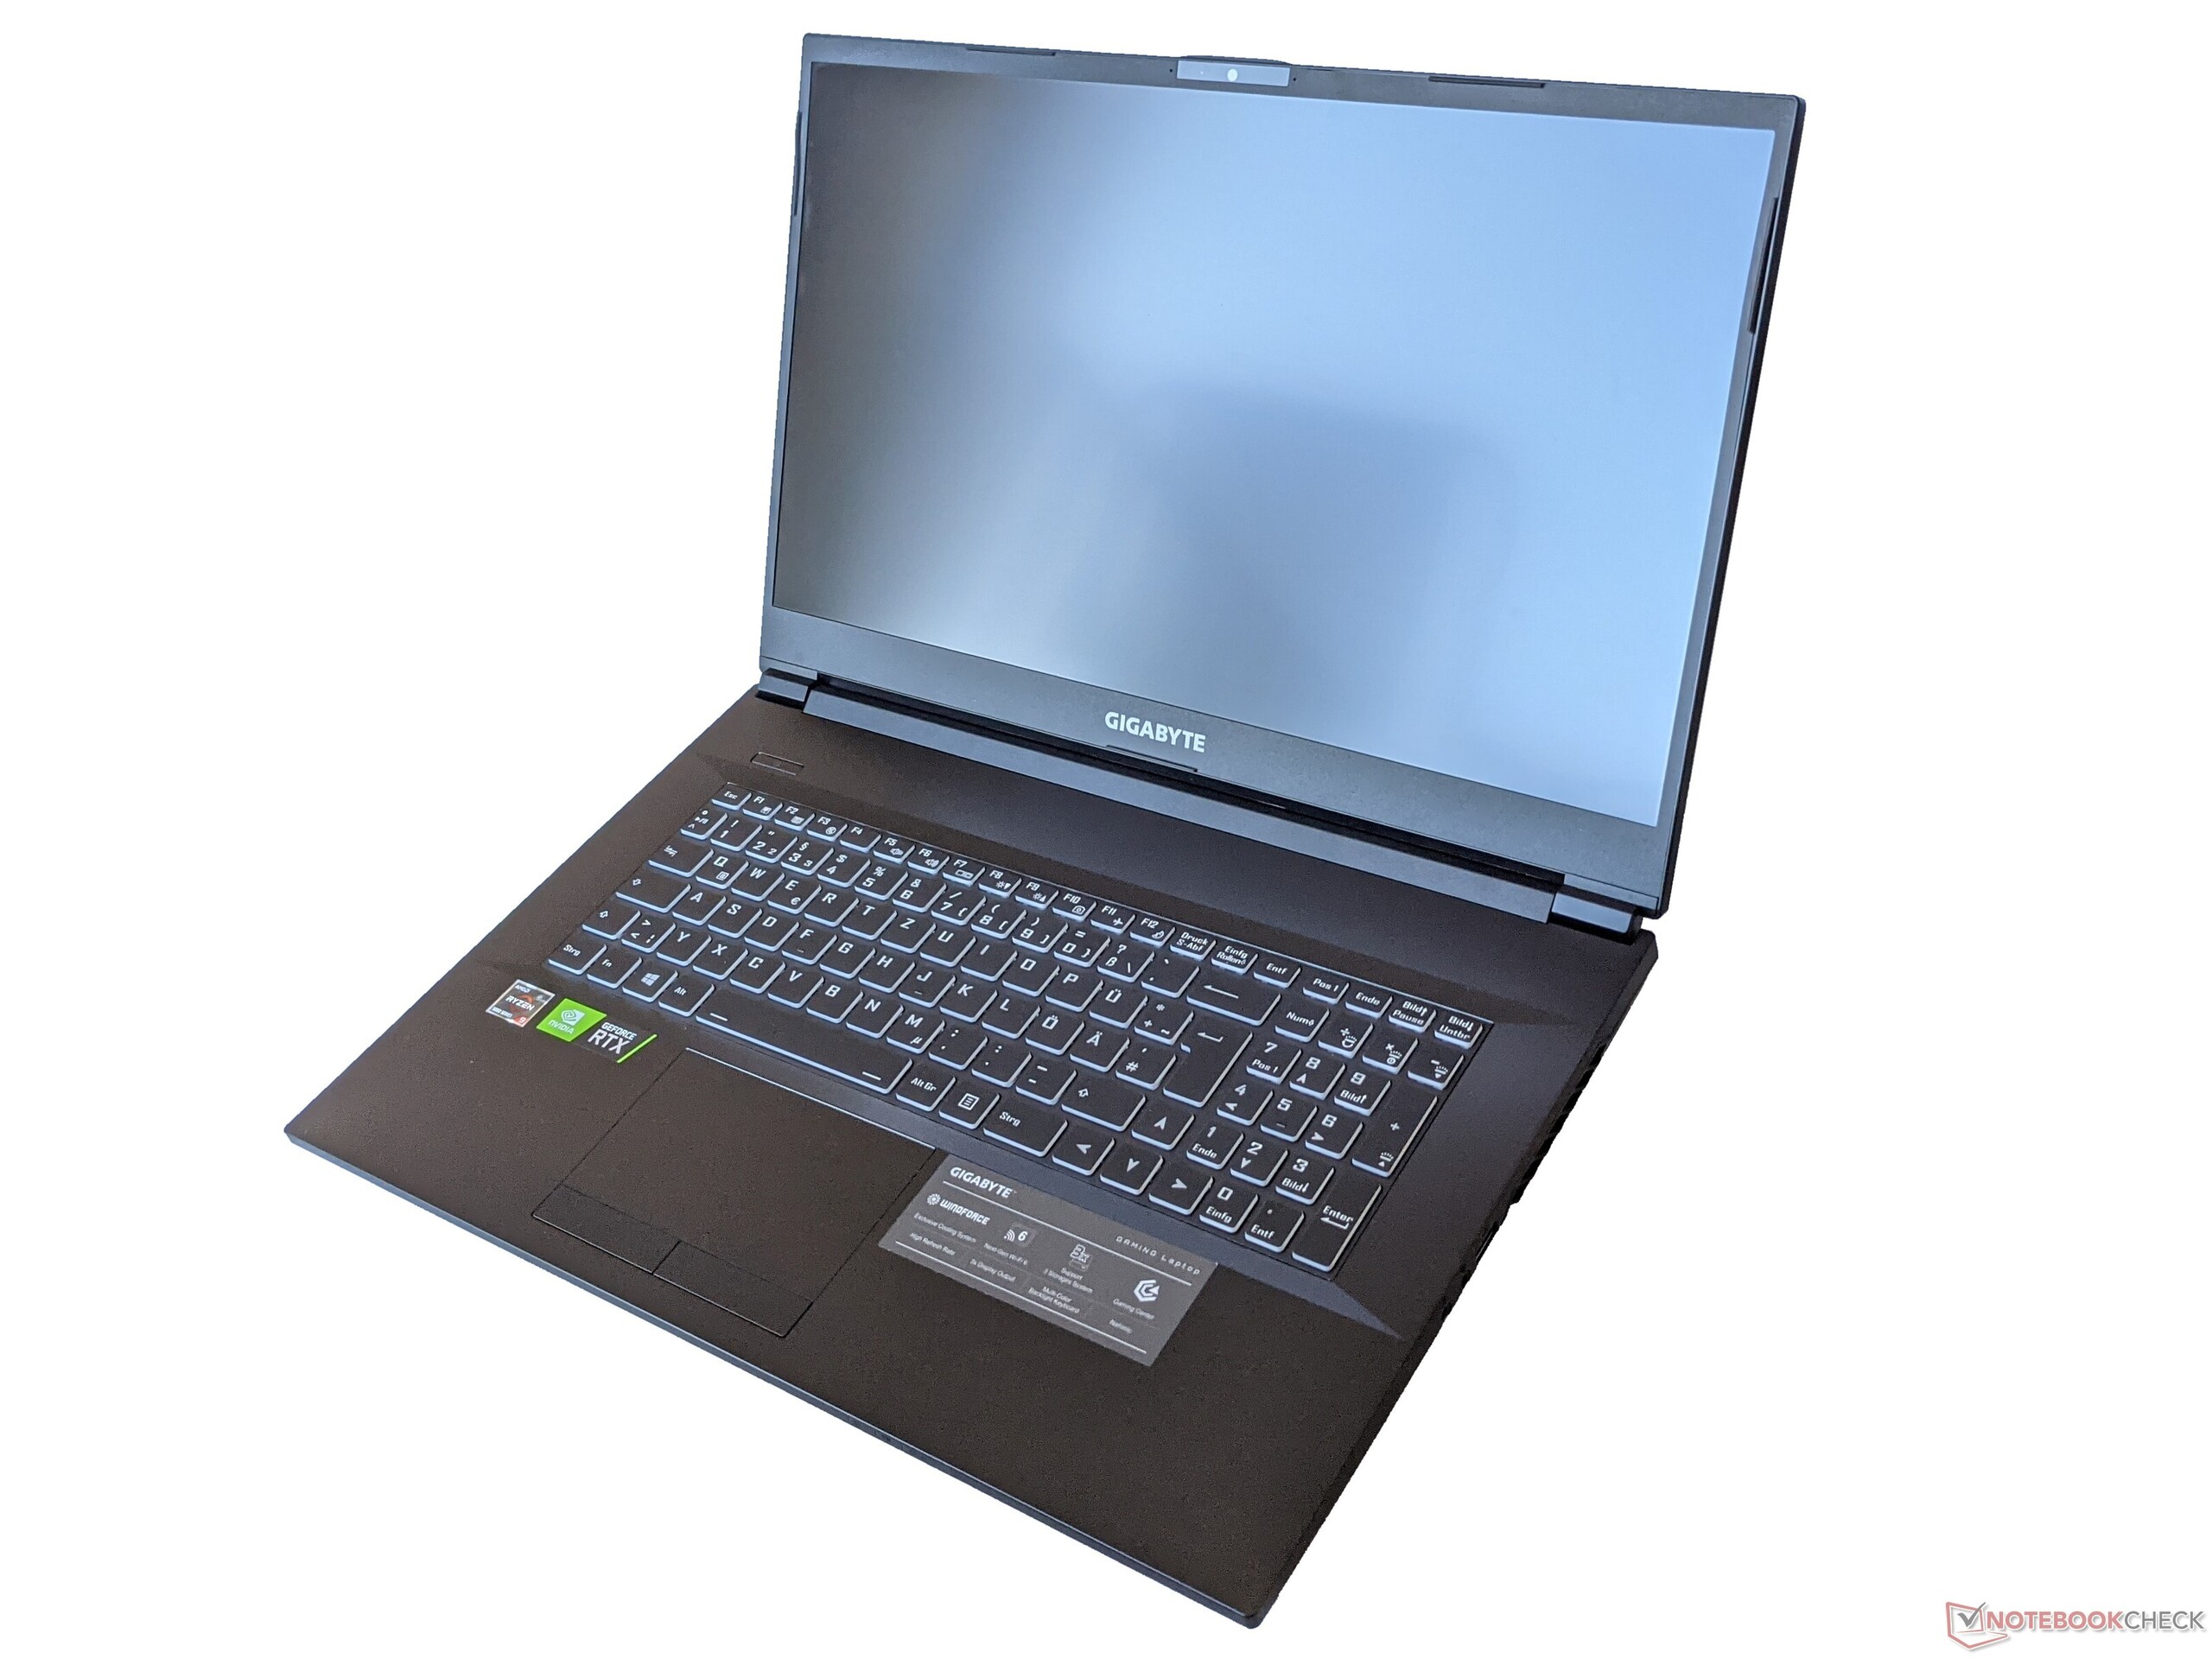
Display - 144 Hz IPS panel
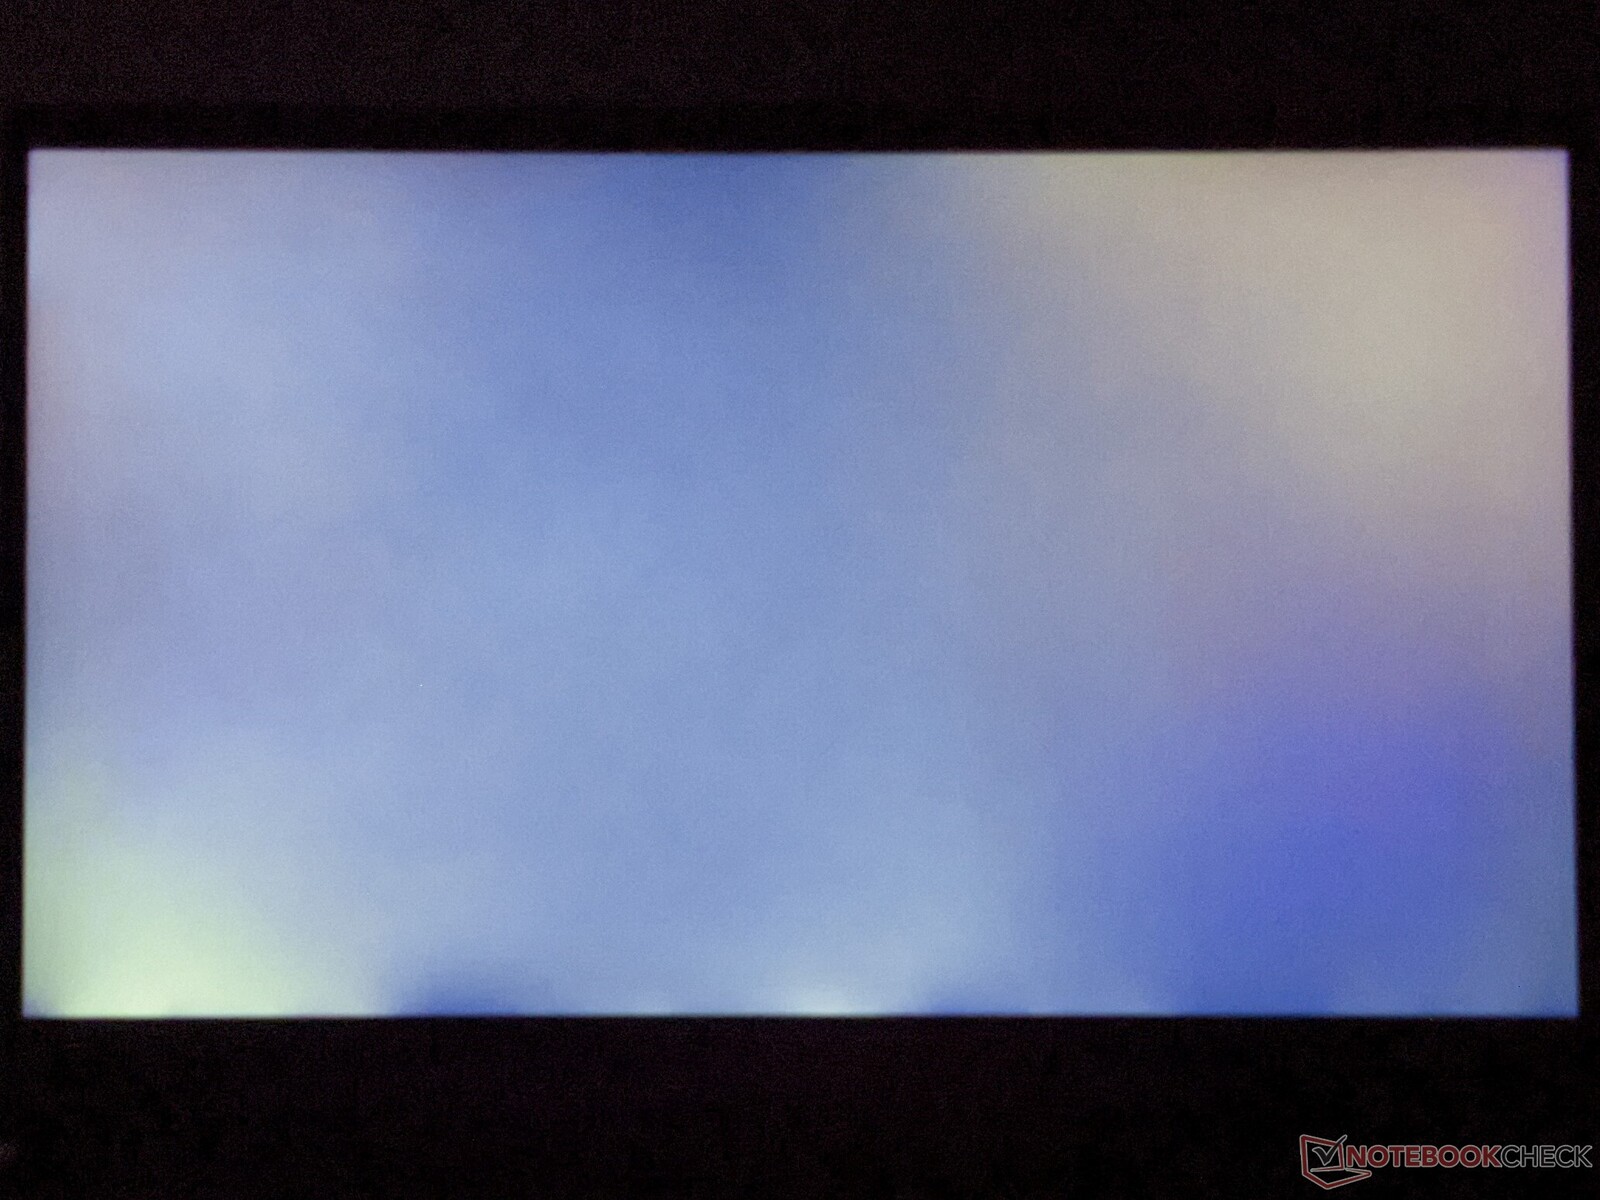
The Gigabyte A7 X1's screen consists of a 17.3-inch IPS panel that offers a resolution of 1920x1080 pixels. The average maximum brightness is 318 cd/m², which corresponds to the middle of our test field. On the other hand, the brightness distribution of 95% is the highest among our chosen competitor devices.
No PWM is used for brightness control, which is helpful for users with sensitive eyes.
| |||||||||||||||||||||||||
Brightness Distribution: 95 %
Center on Battery: 325 cd/m²
Contrast: 1121:1 (Black: 0.29 cd/m²)
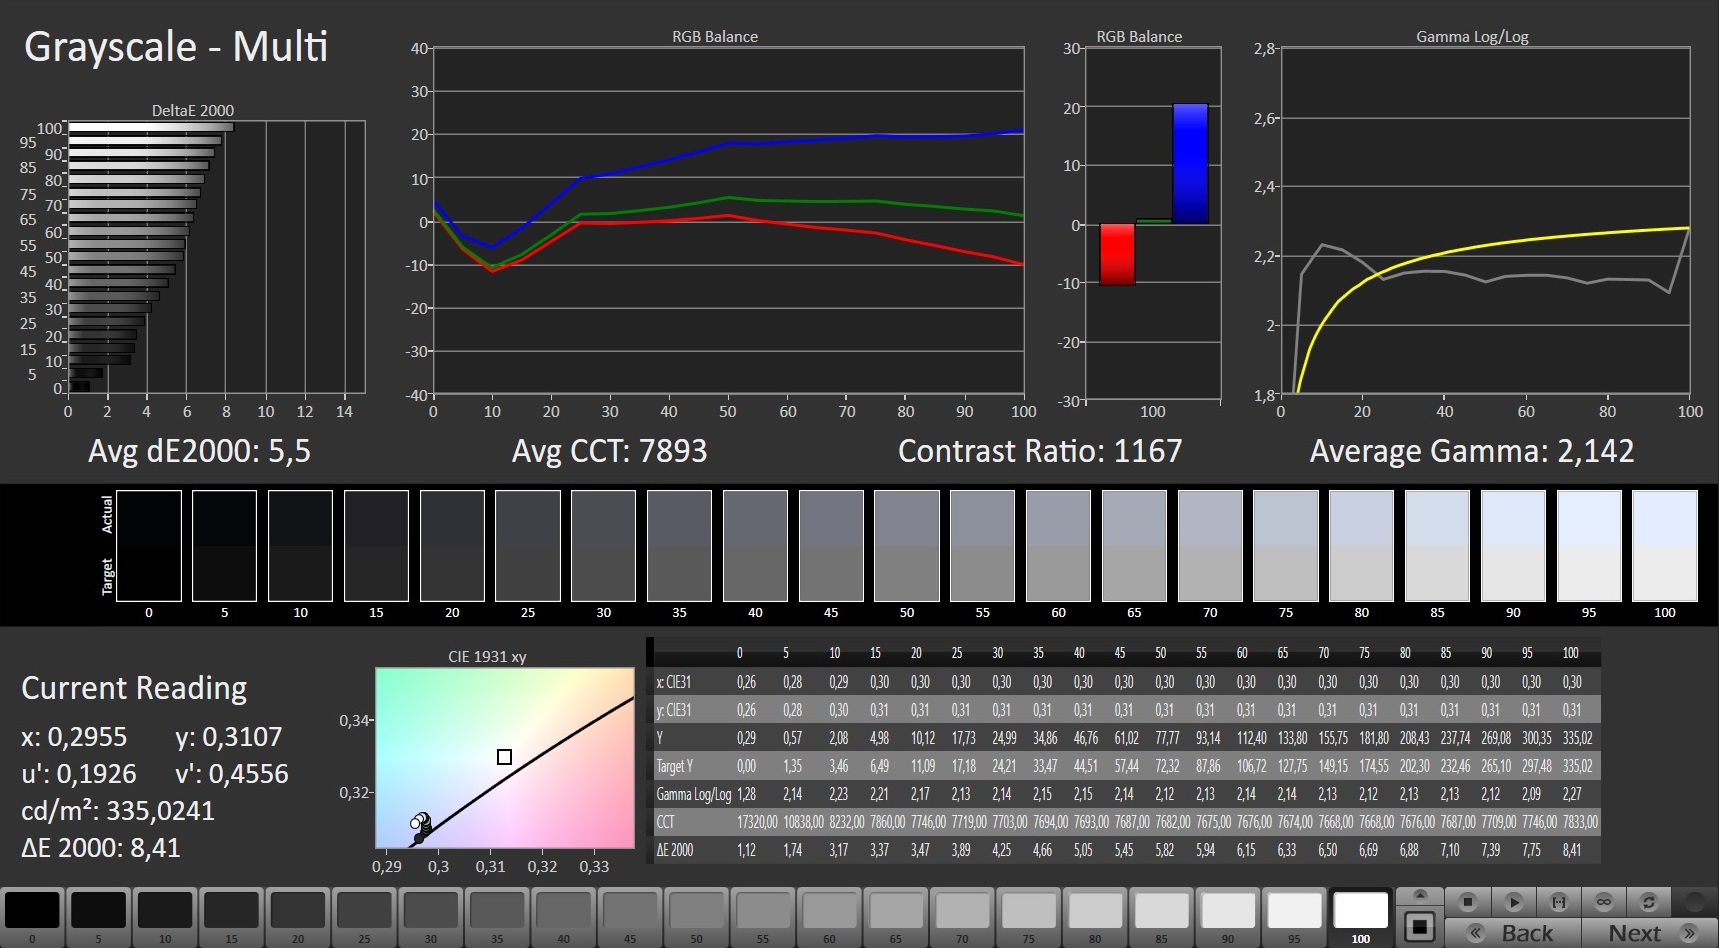
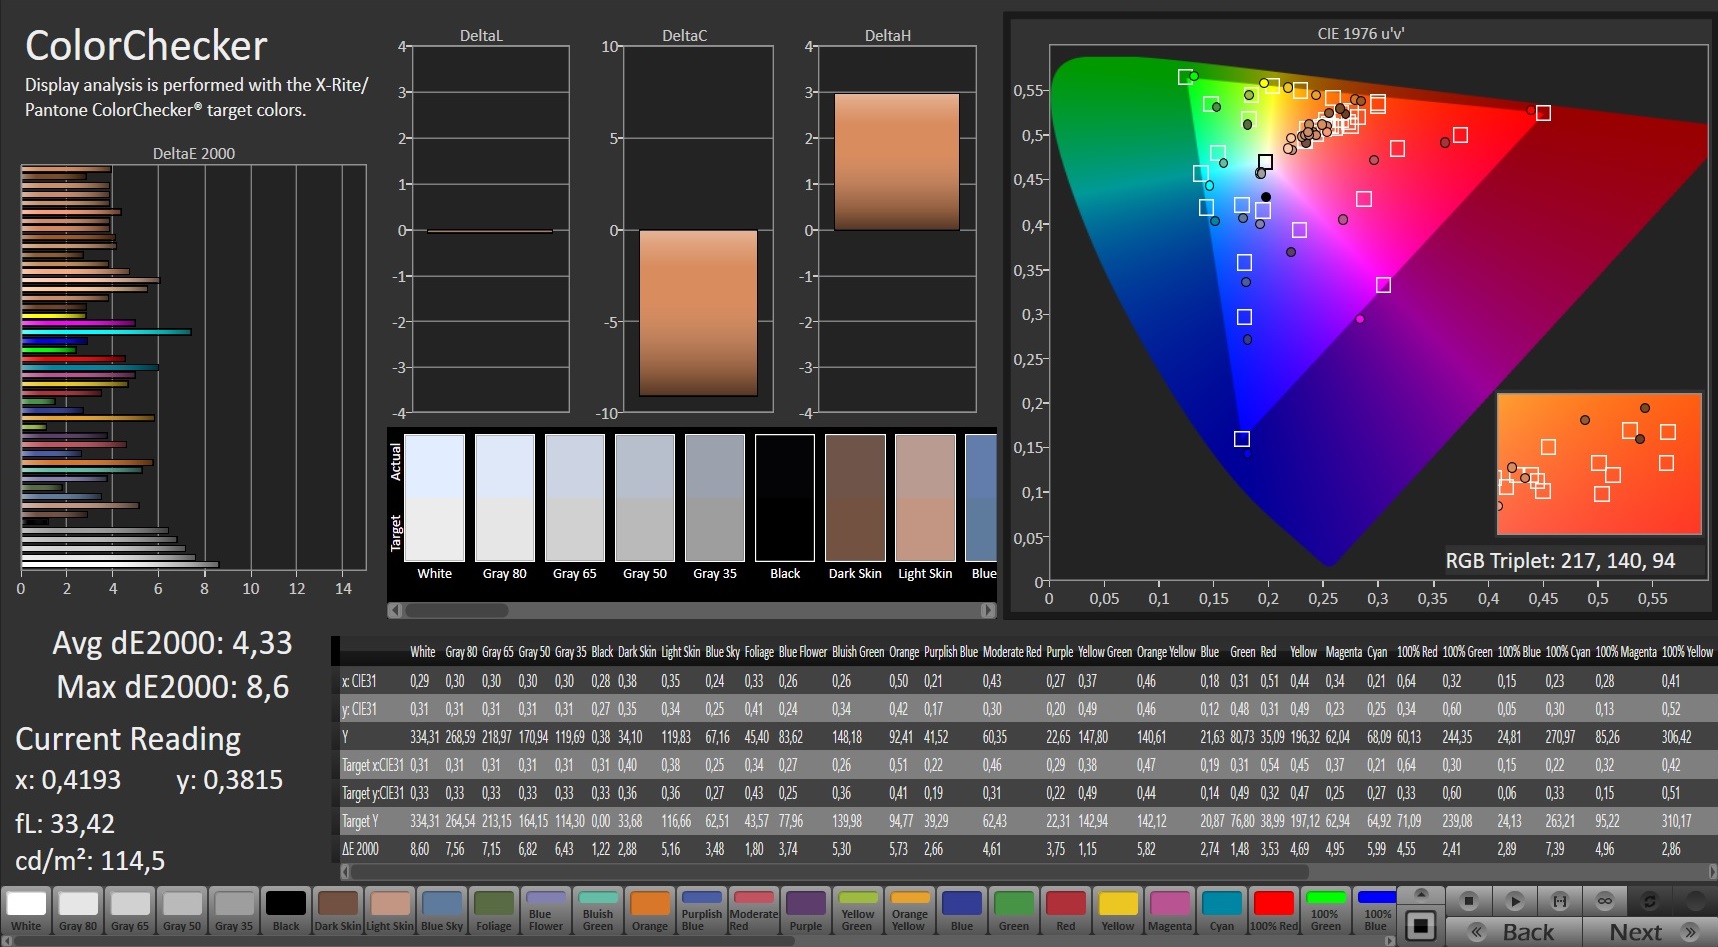
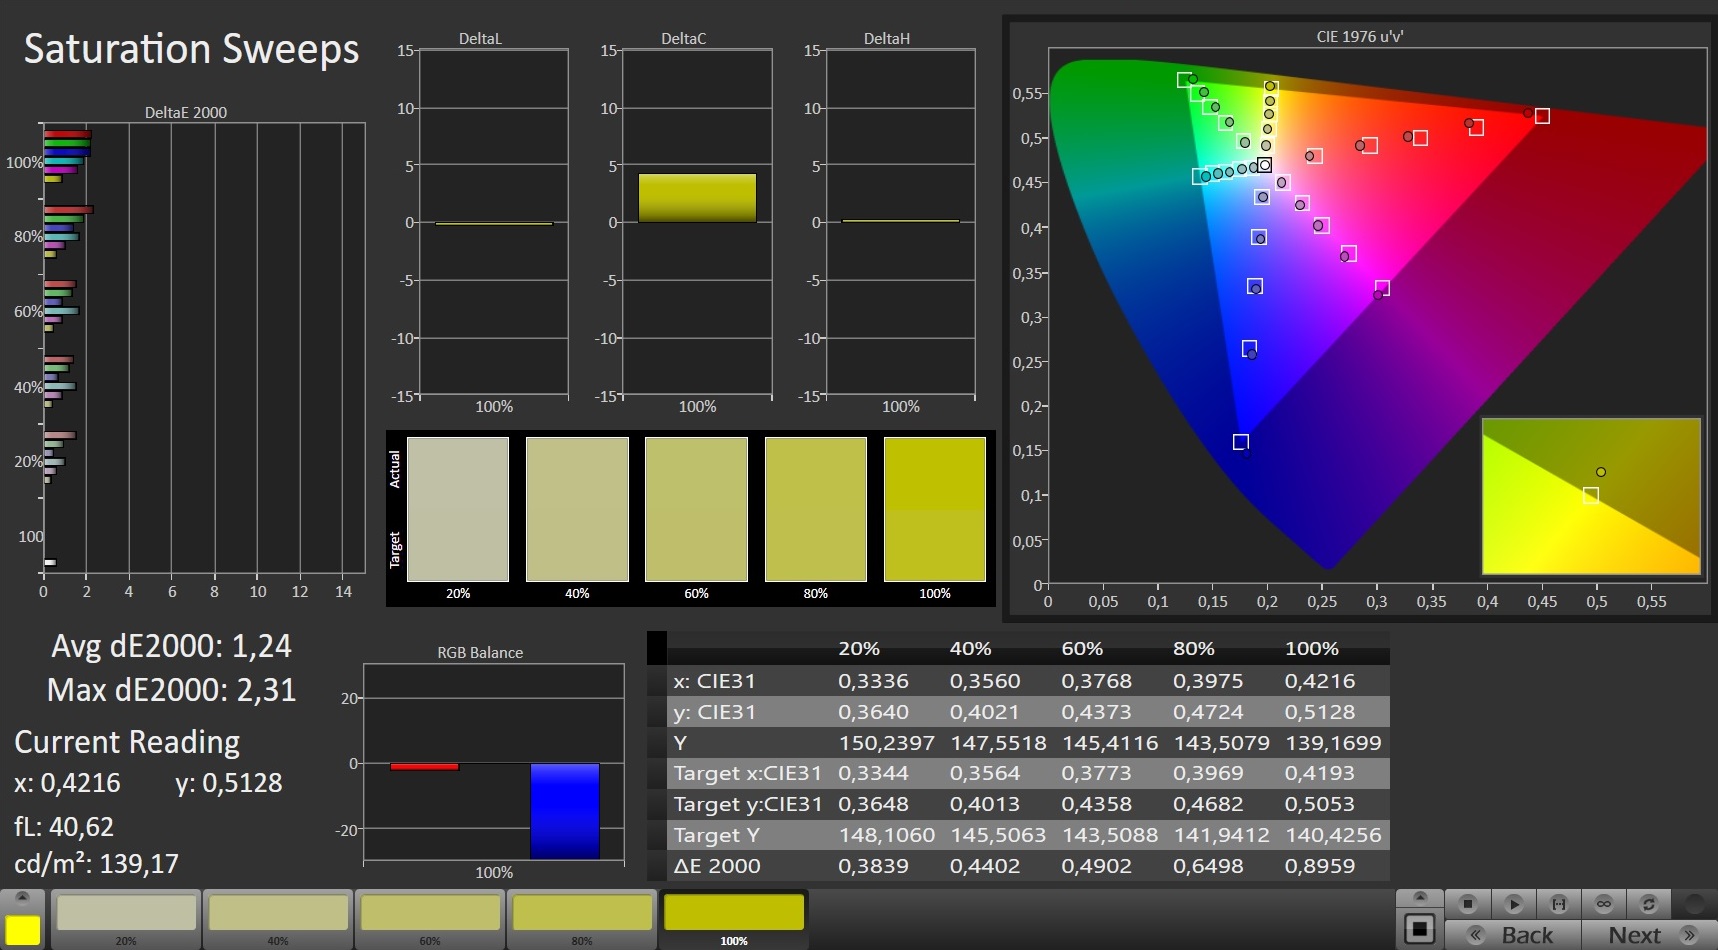
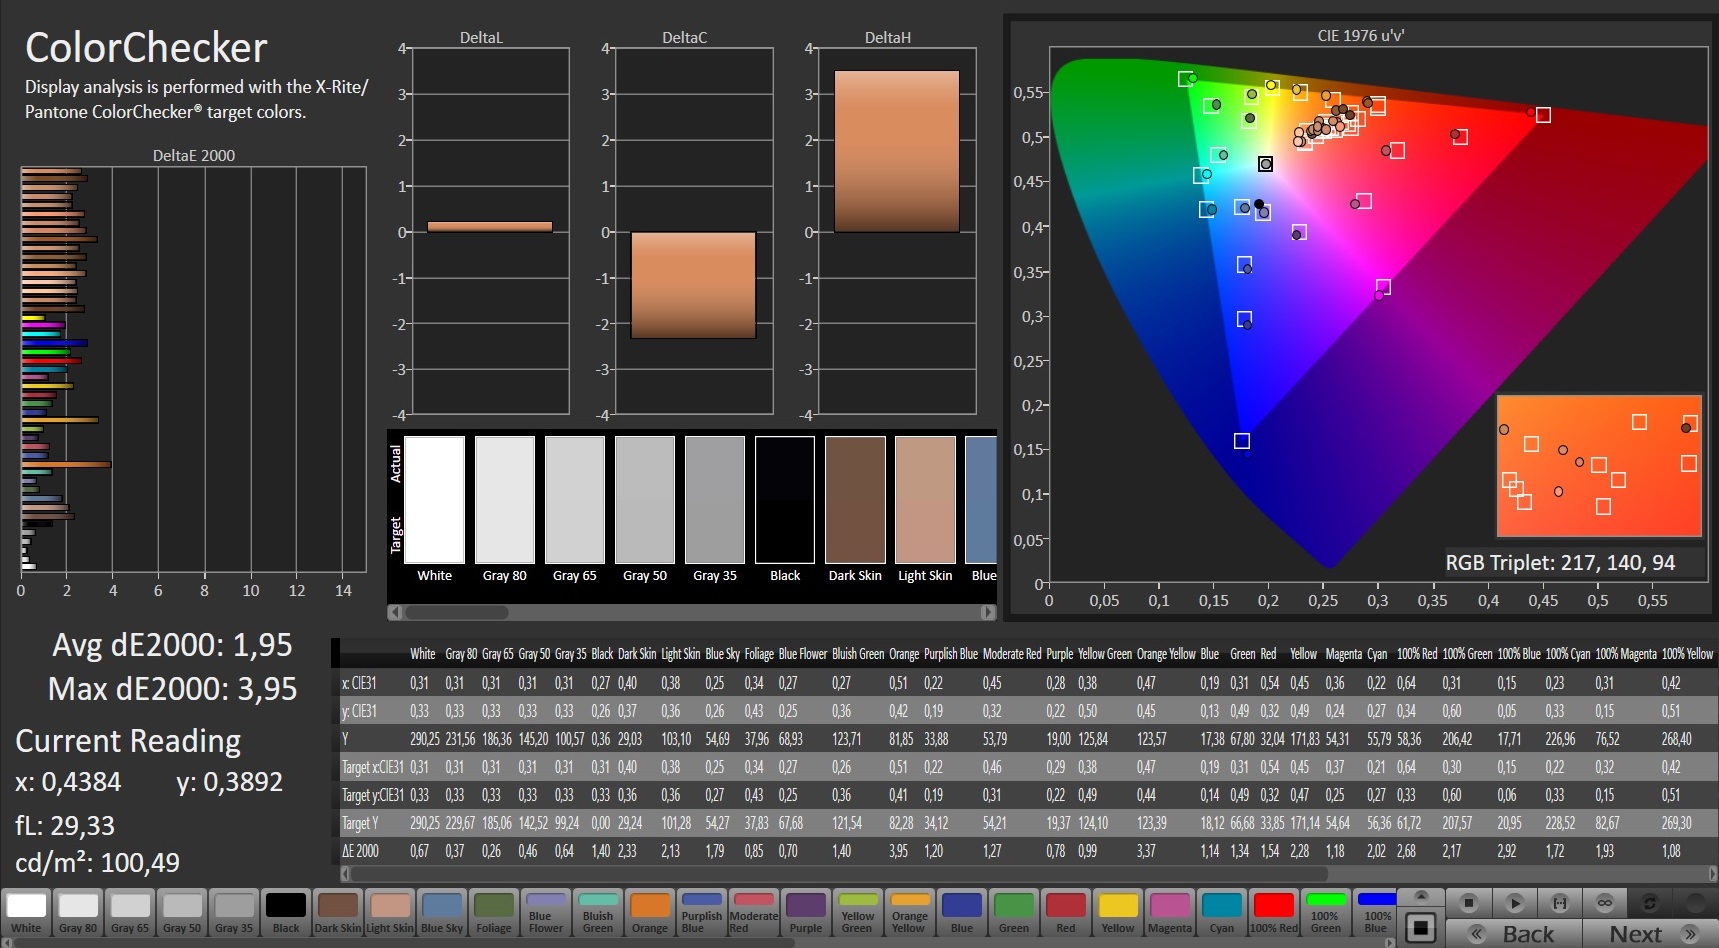
ΔE Color 4.33 | 0.5-29.43 Ø5, calibrated: 1.95
ΔE Greyscale 5.5 | 0.57-98 Ø5.3
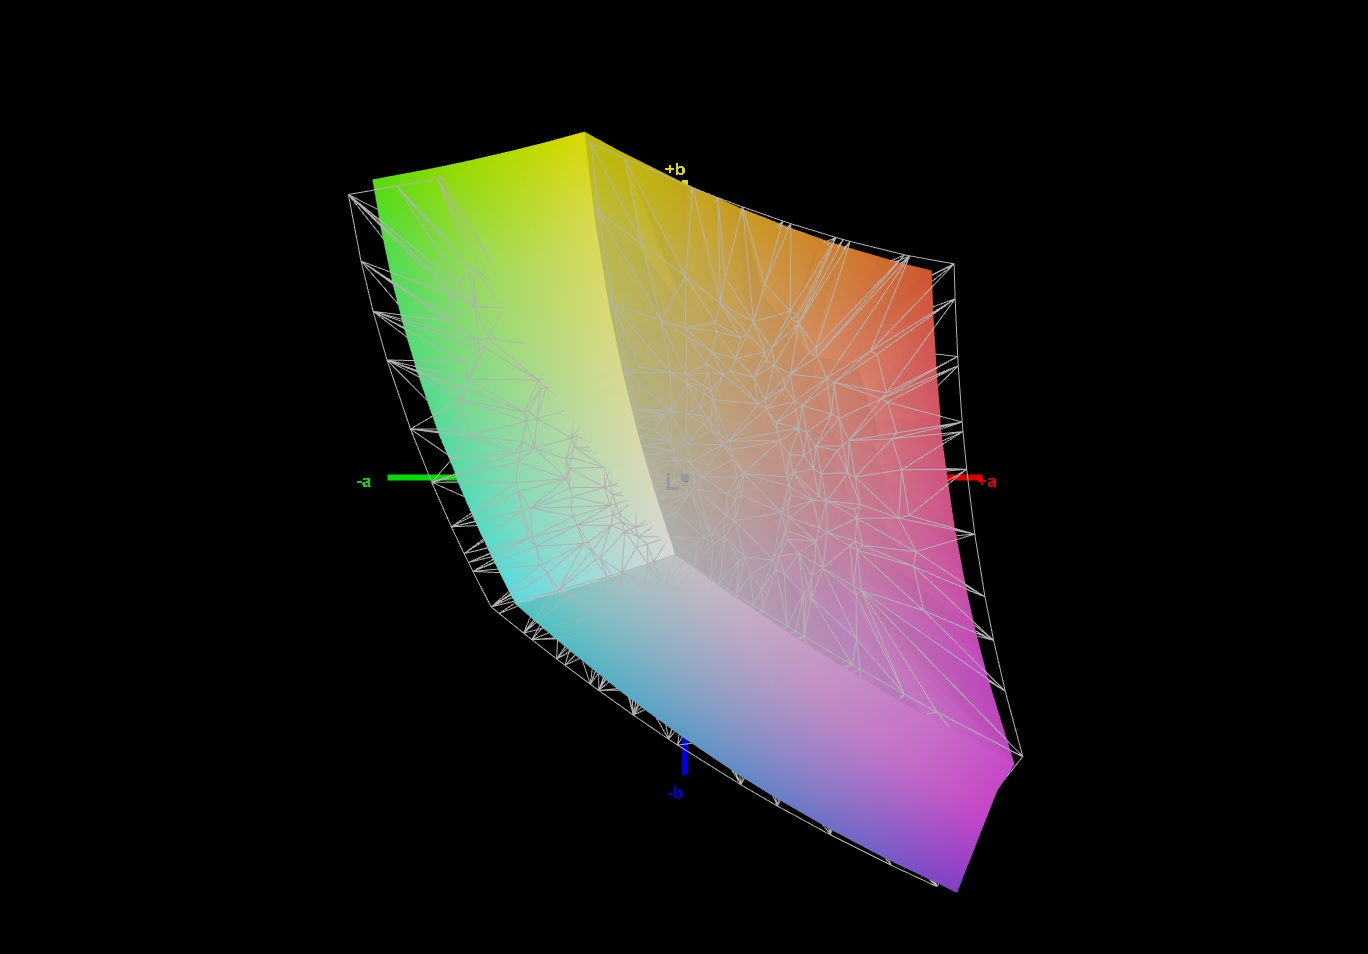
63.2% AdobeRGB 1998 (Argyll 2.2.0 3D)
90.9% sRGB (Argyll 2.2.0 3D)
61.5% Display P3 (Argyll 2.2.0 3D)
Gamma: 2.142
| Gigabyte A7 X1 AU Optronics AUO8E8D, IPS, 1920x1080, 17.30 | Medion Erazer Beast X25 BOE NE173FHM-NZ1 (BOE0884), IPS, 1920x1080, 17.30 | Medion Erazer Beast X20 BOE CQ NE173QHM-NY2, IPS, 2560x1440, 17.30 | Asus TUF Gaming F17 FX706HM AU Optronics AUI8294 (B173HAN04.9), IPS, 1920x1080, 17.30 | SCHENKER XMG Neo 17 (Early 2021, RTX 3070, 5800H) BOE NE173QHM-NY2 (BOE0977), IPS, 2560x1440, 17.30 | |
|---|---|---|---|---|---|
| Display | 12% | 12% | -34% | 13% | |
| Display P3 Coverage | 61.5 | 70.4 14% | 70.1 14% | 40.1 -35% | 70.5 15% |
| sRGB Coverage | 90.9 | 99.8 10% | 99 9% | 60 -34% | 99.5 9% |
| AdobeRGB 1998 Coverage | 63.2 | 71.6 13% | 71.3 13% | 41.4 -34% | 71.8 14% |
| Response Times | 45% | 6% | -105% | 1% | |
| Response Time Grey 50% / Grey 80% * | 16 ? | 9.2 ? 42% | 16 ? -0% | 32.4 -103% | 16.8 ? -5% |
| Response Time Black / White * | 10.8 ? | 5.6 ? 48% | 9.6 ? 11% | 22.4 -107% | 10 ? 7% |
| PWM Frequency | |||||
| Screen | 17% | 19% | -11% | 19% | |
| Brightness middle | 325 | 329 1% | 370 14% | 266 -18% | 410 26% |
| Brightness | 318 | 315 -1% | 341 7% | 264 -17% | 381 20% |
| Brightness Distribution | 95 | 88 -7% | 82 -14% | 79 -17% | 88 -7% |
| Black Level * | 0.29 | 0.33 -14% | 0.42 -45% | 0.32 -10% | 0.37 -28% |
| Contrast | 1121 | 997 -11% | 881 -21% | 831 -26% | 1108 -1% |
| Colorchecker dE 2000 * | 4.33 | 2.03 53% | 1.76 59% | 3.97 8% | 2.55 41% |
| Colorchecker dE 2000 max. * | 8.6 | 5.5 36% | 2.88 67% | 8.93 -4% | 4.33 50% |
| Colorchecker dE 2000 calibrated * | 1.95 | 0.82 58% | 1.3 33% | 3.5 -79% | 1.28 34% |
| Greyscale dE 2000 * | 5.5 | 3.5 36% | 1.8 67% | 1.8 67% | 3.4 38% |
| Gamma | 2.142 103% | 2.223 99% | 2.176 101% | 2.31 95% | 2.275 97% |
| CCT | 7893 82% | 6526 100% | 6543 99% | 6754 96% | 6637 98% |
| Color Space (Percent of AdobeRGB 1998) | 41.4 | 72 | |||
| Color Space (Percent of sRGB) | 60 | 95 | |||
| Total Average (Program / Settings) | 25% /
20% | 12% /
15% | -50% /
-29% | 11% /
15% |
* ... smaller is better
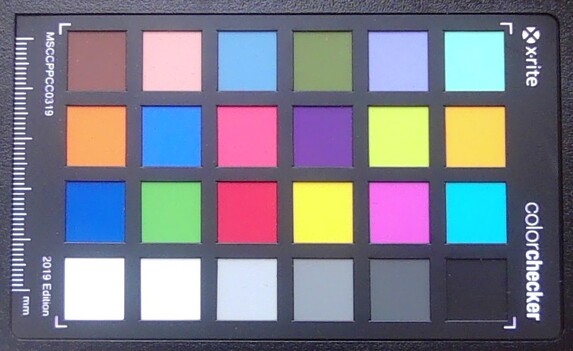
Gigabyte's gaming laptop is also able to lead our test field with a contrast ratio of 1,121:1 and a black level of 0.29 cd/m². The color-space coverage of 90.9% (sRGB) and 63.2% (AdobeRGB) is a bit lower, but images still look vivid.
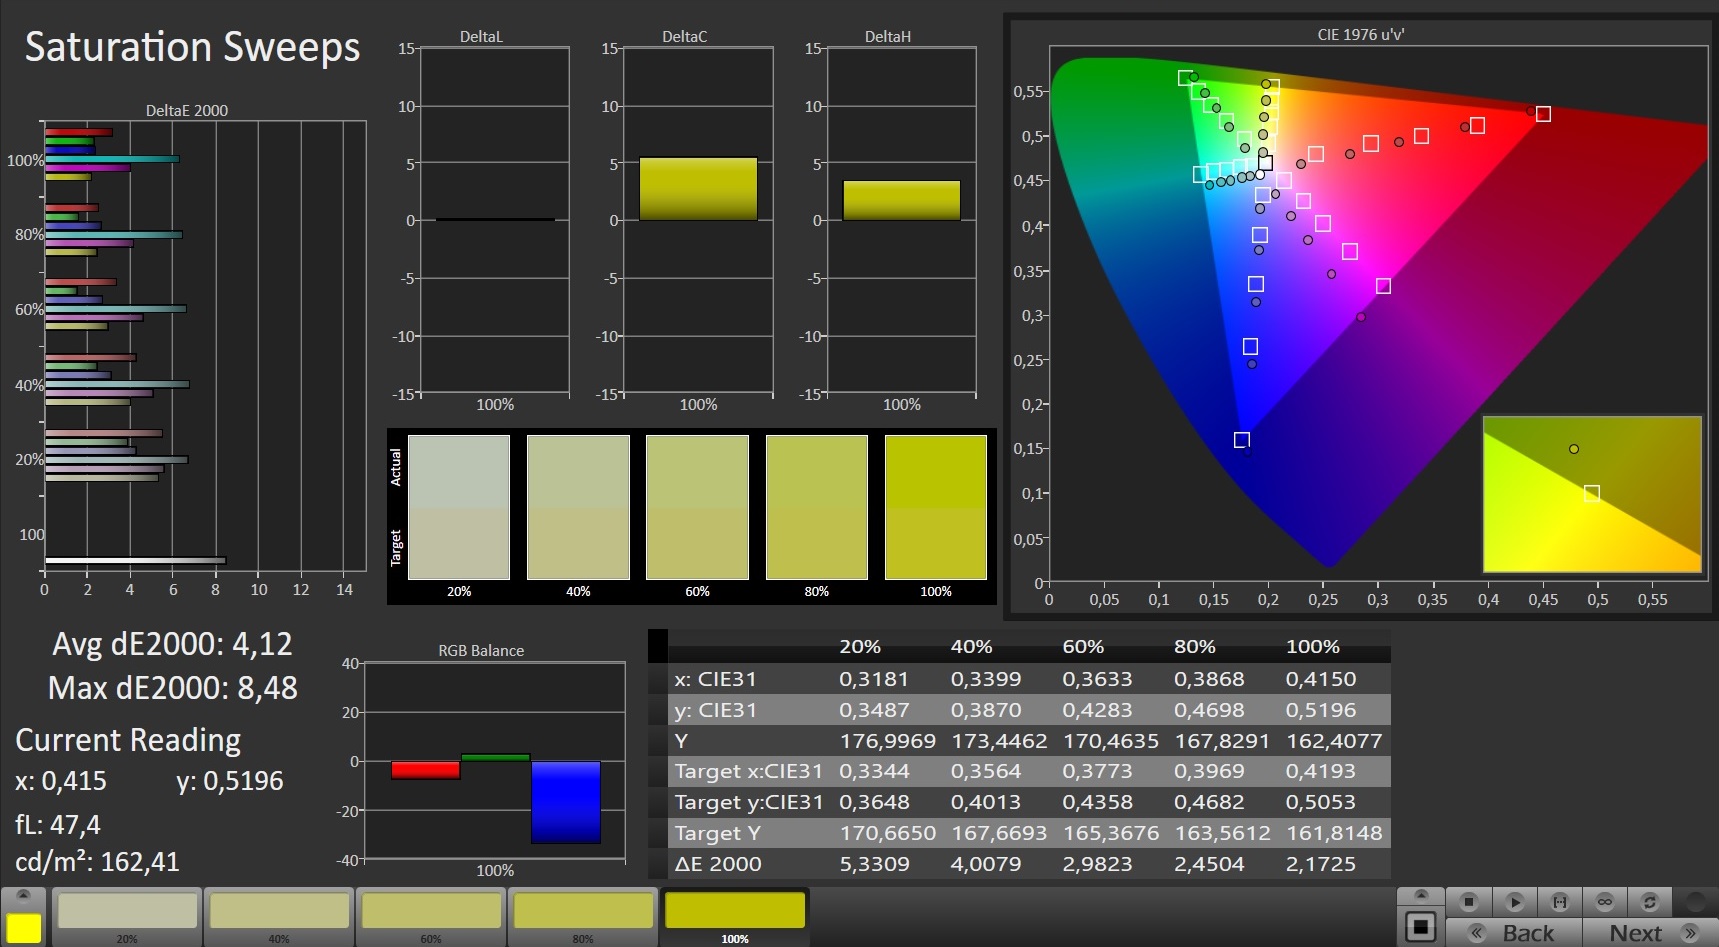
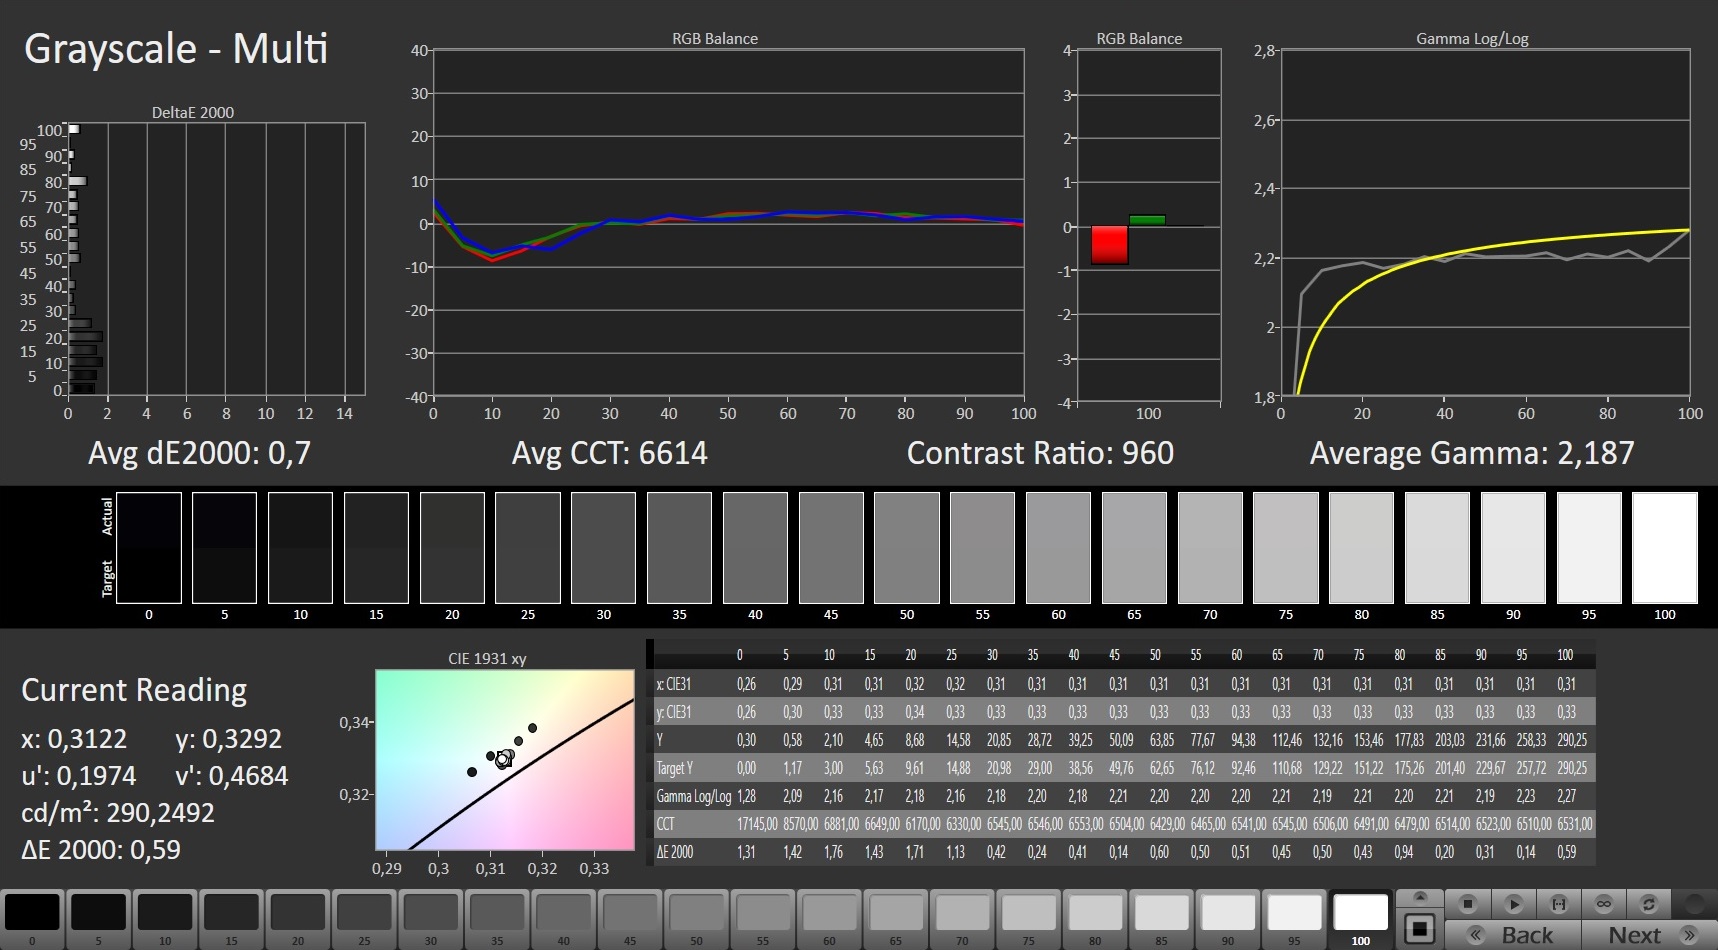
The CalMAN analysis also shows that colors are displayed with a blue proportion that is too high out of the box. However, this can be corrected almost completely with a calibration. The corresponding ICC file can be downloaded in the window located at the top, to the right of the display's brightness distribution graph.
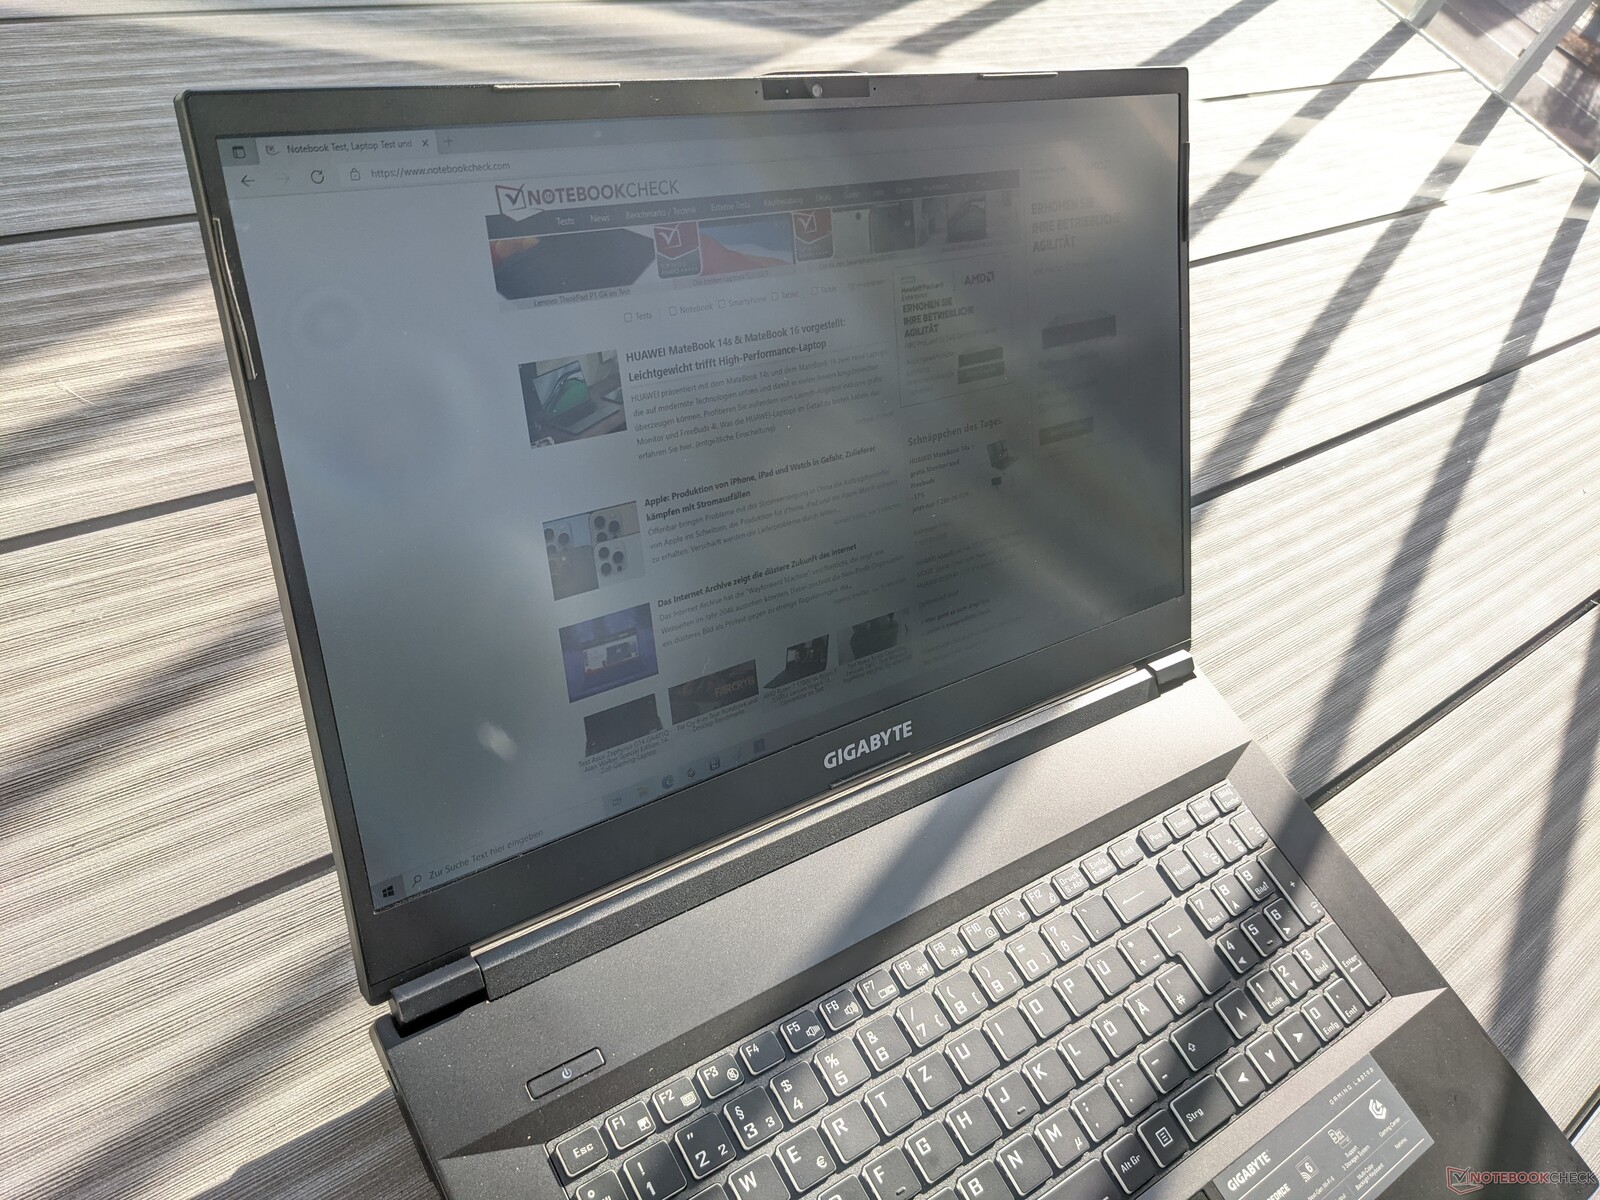
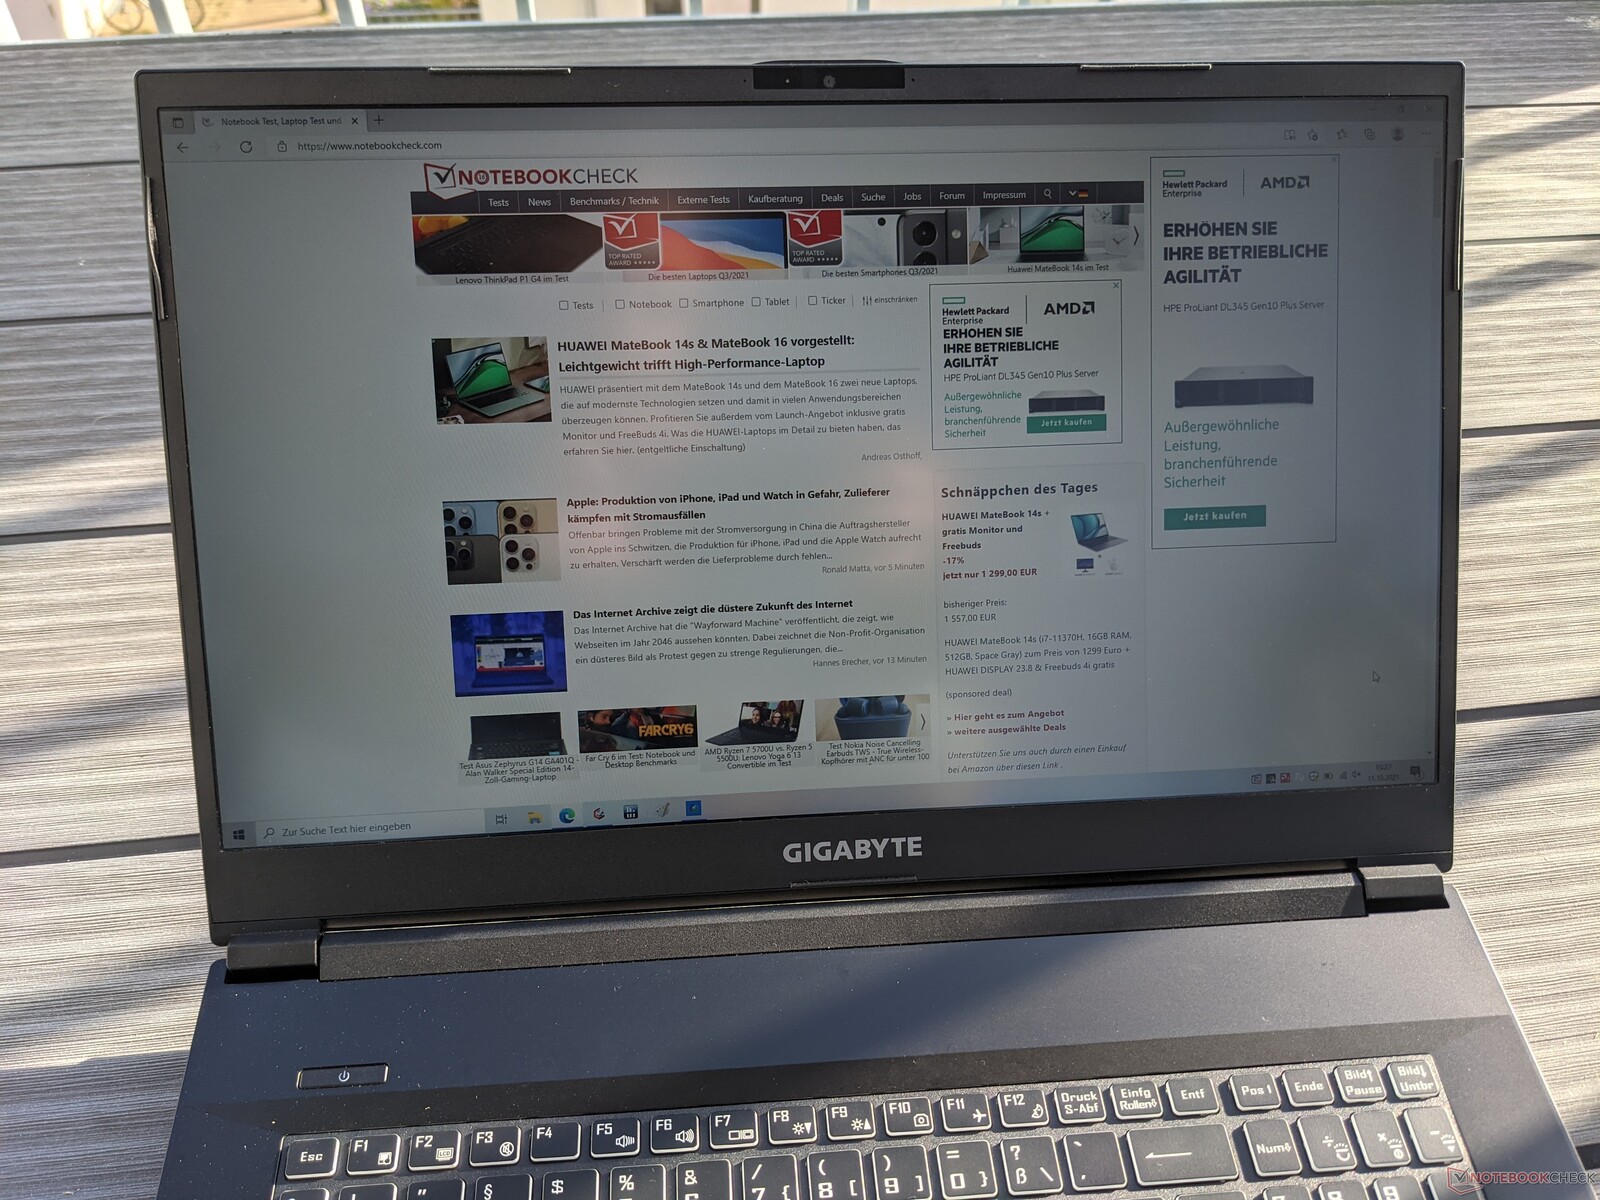
Gigabyte's gaming laptop can definitely be used outdoors as long as areas with shade are favored. The matte screen is not reflective, but the display brightness isn't sufficient to compensate for strong ambient light.

Display Response Times
| ↔ Response Time Black to White | ||
|---|---|---|
| 10.8 ms ... rise ↗ and fall ↘ combined | ↗ 6.4 ms rise | 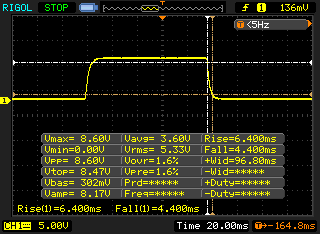 |
| ↘ 4.4 ms fall | ||
| The screen shows good response rates in our tests, but may be too slow for competitive gamers. In comparison, all tested devices range from 0.1 (minimum) to 240 (maximum) ms. » 24 % of all devices are better. This means that the measured response time is better than the average of all tested devices (21.5 ms). | ||
| ↔ Response Time 50% Grey to 80% Grey | ||
| 16 ms ... rise ↗ and fall ↘ combined | ↗ 7.6 ms rise | 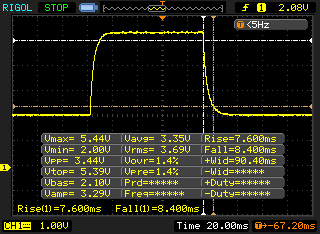 |
| ↘ 8.4 ms fall | ||
| The screen shows good response rates in our tests, but may be too slow for competitive gamers. In comparison, all tested devices range from 0.2 (minimum) to 636 (maximum) ms. » 25 % of all devices are better. This means that the measured response time is better than the average of all tested devices (33.7 ms). | ||
Screen Flickering / PWM (Pulse-Width Modulation)
| Screen flickering / PWM not detected | 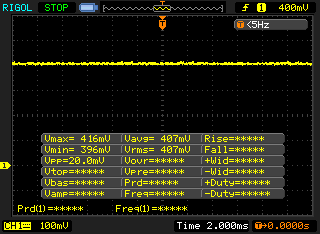 | ||
In comparison: 53 % of all tested devices do not use PWM to dim the display. If PWM was detected, an average of 17900 (minimum: 5 - maximum: 3846000) Hz was measured. | |||
The Gigabyte A7 X1's IPS panel is very viewing-angle stable. This allows content to be viewed without distortions or inaccurate colors, even from very flat angles.

Performance - Stable even under prolonged load
Gigabyte has equipped the A7 X1 with the latest gaming hardware. Our review configuration comes with a powerful AMD CPU, but this model is also available as the Gigabyte K7 with the Intel Core i7-10870H and the Nvidia GeForce RTX 3060.
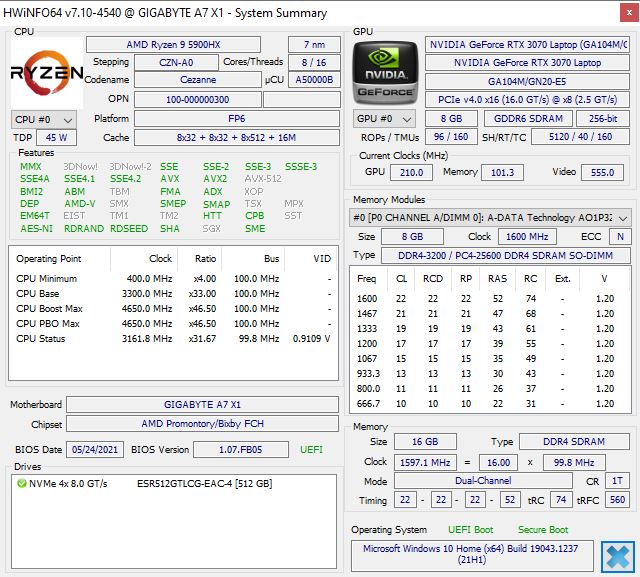
Processor
The AMD Ryzen 9 5900HX used here is a processor with eight cores that can handle up to 16 tasks simultaneously. The clock rates are between 3.3 and 4.6 GHz, with the cooling system and the preset TDP being significantly responsible for performance. Gigabyte chose a long-term TDP value (PL1) of 54 watts. The short-term power consumption (PL2) can reach up to 65 watts.
In our Cinebench R15 continuous load loop, Gigabyte's gaming laptop is able to maintain its CPU performance at a very stable and high level. The A7 X1 shows a good multi-core performance in the individual tests in particular, which is usually sufficient for one of the top places in our test field.
Cinebench R15 Multi endurance test
* ... smaller is better
System performance
The Gigabyte A7 X1 achieves a score in the middle of our test field in the PCMark 10 test for evaluating system performance. While it reached first place in the "Productivity" and "Digital Content Creation" subcategories, the modest "Essentials" score brings the overall rating down.
During our test period, the system ran very smoothly and responded extremely quickly to inputs. Both applications and folders were launched and opened without delays.
| PCMark 10 / Score | |
| Average of class Gaming (5235 - 9852, n=197, last 2 years) | |
| SCHENKER XMG Neo 17 (Early 2021, RTX 3070, 5800H) | |
| Average AMD Ryzen 9 5900HX, NVIDIA GeForce RTX 3070 Laptop GPU (6875 - 6967, n=4) | |
| Asus TUF Gaming F17 FX706HM | |
| Gigabyte A7 X1 | |
| Medion Erazer Beast X25 | |
| Medion Erazer Beast X20 | |
| PCMark 10 / Essentials | |
| Average of class Gaming (8300 - 12334, n=196, last 2 years) | |
| Asus TUF Gaming F17 FX706HM | |
| Average AMD Ryzen 9 5900HX, NVIDIA GeForce RTX 3070 Laptop GPU (9991 - 10413, n=3) | |
| SCHENKER XMG Neo 17 (Early 2021, RTX 3070, 5800H) | |
| Medion Erazer Beast X25 | |
| Gigabyte A7 X1 | |
| Medion Erazer Beast X20 | |
| PCMark 10 / Productivity | |
| Average of class Gaming (6662 - 11833, n=196, last 2 years) | |
| Average AMD Ryzen 9 5900HX, NVIDIA GeForce RTX 3070 Laptop GPU (9301 - 9381, n=3) | |
| Gigabyte A7 X1 | |
| Medion Erazer Beast X25 | |
| Asus TUF Gaming F17 FX706HM | |
| SCHENKER XMG Neo 17 (Early 2021, RTX 3070, 5800H) | |
| Medion Erazer Beast X20 | |
| PCMark 10 / Digital Content Creation | |
| Average of class Gaming (6462 - 18475, n=196, last 2 years) | |
| SCHENKER XMG Neo 17 (Early 2021, RTX 3070, 5800H) | |
| Gigabyte A7 X1 | |
| Average AMD Ryzen 9 5900HX, NVIDIA GeForce RTX 3070 Laptop GPU (9383 - 9561, n=3) | |
| Medion Erazer Beast X25 | |
| Asus TUF Gaming F17 FX706HM | |
| Medion Erazer Beast X20 | |
| PCMark 10 Score | 6898 points | |
Help | ||
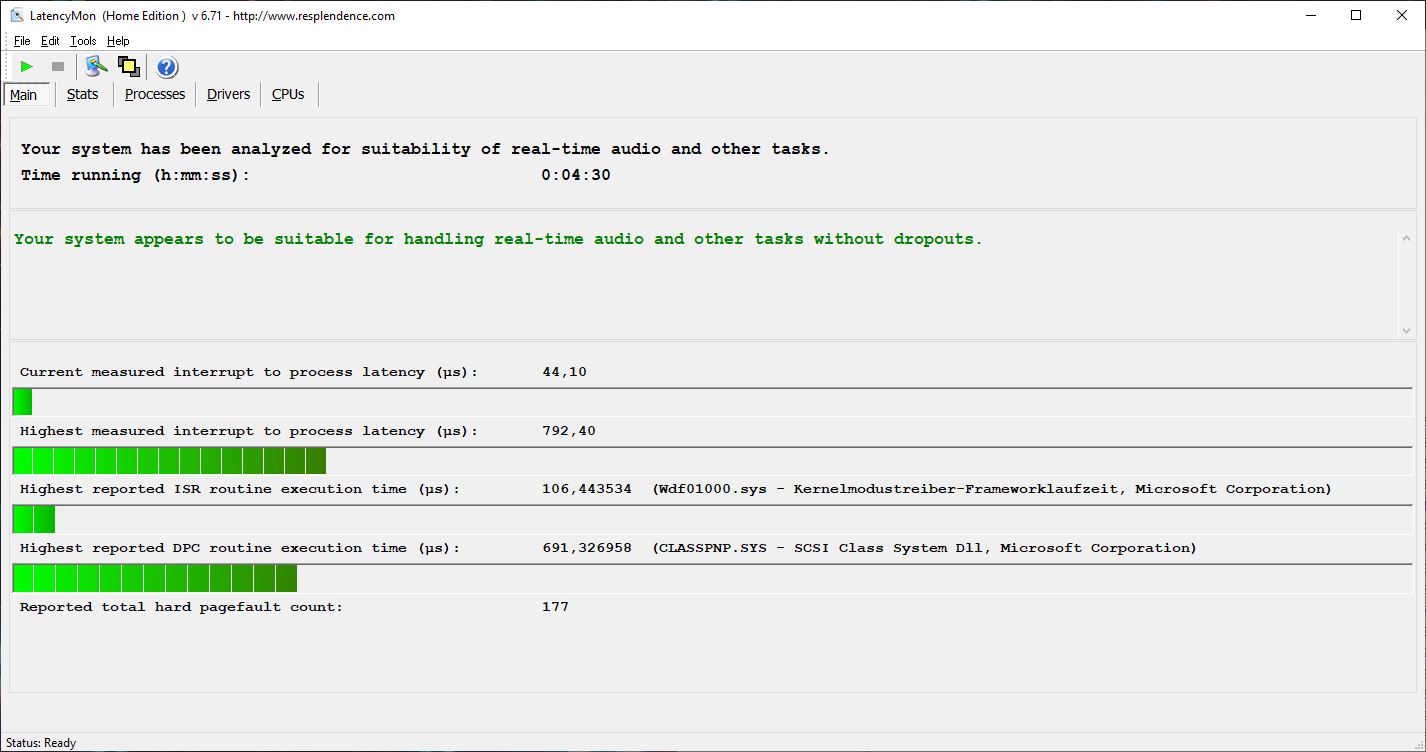
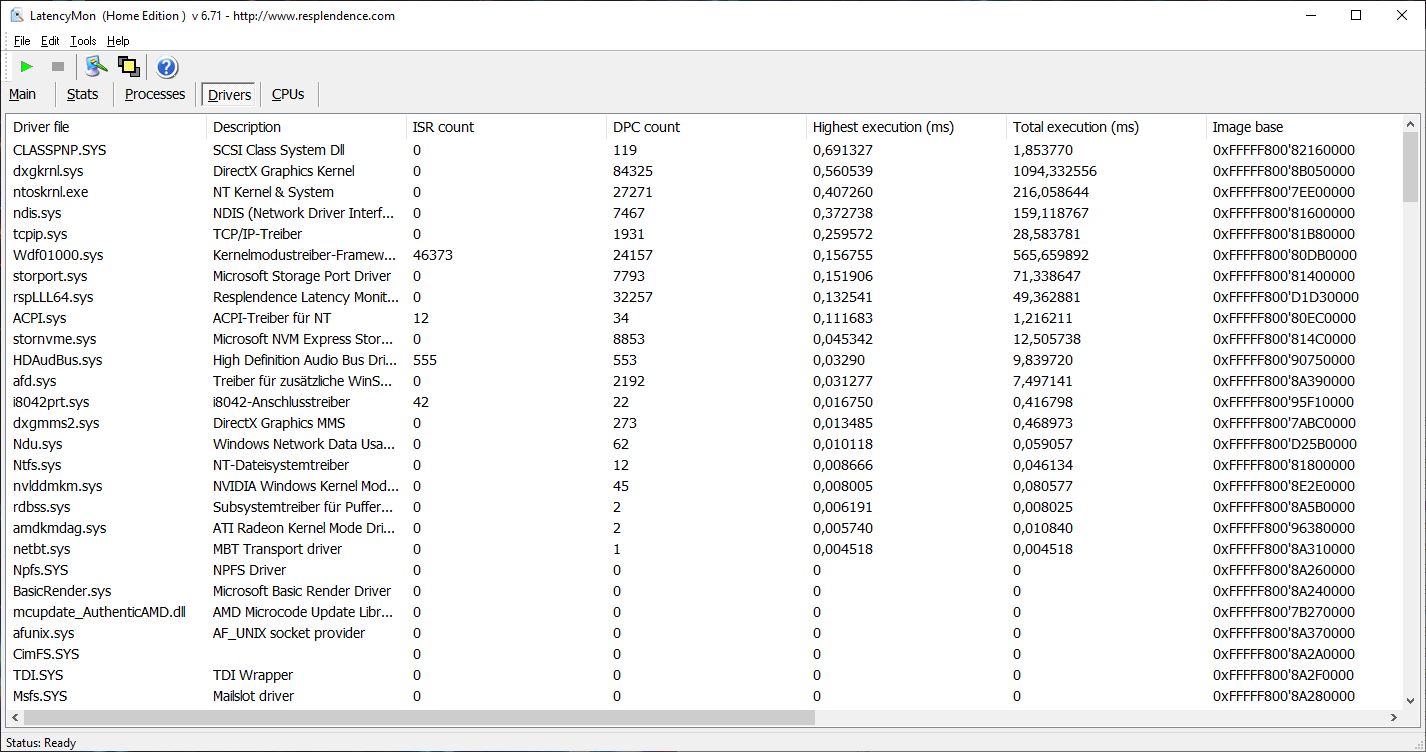
DPC latencies
In our test configuration, the Gigabyte A7 X1 shows very low latencies in the LatencyMon test. This makes it well suited for real-time applications.
| DPC Latencies / LatencyMon - interrupt to process latency (max), Web, Youtube, Prime95 | |
| SCHENKER XMG Neo 17 (Early 2021, RTX 3070, 5800H) | |
| Asus TUF Gaming F17 FX706HM | |
| Medion Erazer Beast X25 | |
| Medion Erazer Beast X20 | |
| Gigabyte A7 X1 | |
* ... smaller is better
Storage
The SSD used by Gigabyte in our test configuration shows very good read and write rates, which are only slightly surpassed by the rest of our test field in most cases.
For a comparison with other mass storage devices, see our HDD/SSD Benchmarks article.
| Gigabyte A7 X1 ESR512GTLCG-EAC-4 | Medion Erazer Beast X25 Samsung PM9A1 MZVL22T0HBLB | Medion Erazer Beast X20 Phison E12S-2TB-Phison-SSD-BICS4 | Asus TUF Gaming F17 FX706HM SK Hynix HFM001TD3JX013N | SCHENKER XMG Neo 17 (Early 2021, RTX 3070, 5800H) Samsung SSD 970 EVO Plus 500GB | Average ESR512GTLCG-EAC-4 | |
|---|---|---|---|---|---|---|
| CrystalDiskMark 5.2 / 6 | 14% | 3% | 18% | 27% | 3% | |
| Write 4K | 125.1 | 129.7 4% | 155.5 24% | 168.8 35% | 206.1 65% | 131.7 ? 5% |
| Read 4K | 43.51 | 62.4 43% | 47.96 10% | 72 65% | 53 22% | 45.4 ? 4% |
| Write Seq | 2128 | 2436 14% | 1591 -25% | 3018 42% | 2303 ? 8% | |
| Read Seq | 1958 | 2354 20% | 1371 -30% | 2575 32% | 1716 ? -12% | |
| Write 4K Q32T1 | 579 | 512 -12% | 532 -8% | 459.5 -21% | 535 -8% | 525 ? -9% |
| Read 4K Q32T1 | 464.4 | 436.2 -6% | 627 35% | 473.1 2% | 608 31% | 581 ? 25% |
| Write Seq Q32T1 | 2501 | 3541 42% | 3017 21% | 3129 25% | 3242 30% | 2515 ? 1% |
| Read Seq Q32T1 | 3473 | 3568 3% | 3440 -1% | 3529 2% | 3617 4% | 3417 ? -2% |
| AS SSD | 16% | 15% | 10% | 26% | 6% | |
| Seq Read | 2859 | 2591 -9% | 2849 0% | 2837 -1% | 3020 6% | 2643 ? -8% |
| Seq Write | 1530 | 1900 24% | 2831 85% | 1565 2% | 2631 72% | 2134 ? 39% |
| 4K Read | 41.47 | 53.9 30% | 51.3 24% | 55.4 34% | 60.3 45% | 48.3 ? 16% |
| 4K Write | 133.9 | 112.6 -16% | 106.3 -21% | 152.9 14% | 171.6 28% | 116.4 ? -13% |
| 4K-64 Read | 1218 | 1335 10% | 1763 45% | 1327 9% | 1410 16% | 1586 ? 30% |
| 4K-64 Write | 2108 | 2966 41% | 2010 -5% | 1922 -9% | 2324 10% | 1975 ? -6% |
| Access Time Read * | 0.098 | 0.038 61% | 0.093 5% | 0.035 64% | 0.045 54% | 0.09975 ? -2% |
| Access Time Write * | 0.028 | 0.036 -29% | 0.035 -25% | 0.028 -0% | 0.024 14% | 0.03325 ? -19% |
| Score Read | 1545 | 1648 7% | 2099 36% | 1666 8% | 1773 15% | 1899 ? 23% |
| Score Write | 2395 | 3269 36% | 2399 0% | 2232 -7% | 2759 15% | 2305 ? -4% |
| Score Total | 4666 | 5733 23% | 5573 19% | 4695 1% | 5429 16% | 5151 ? 10% |
| Total Average (Program / Settings) | 15% /
15% | 9% /
10% | 14% /
13% | 27% /
27% | 5% /
5% |
* ... smaller is better

Continuous load read: DiskSpd Read Loop, Queue Depth 8
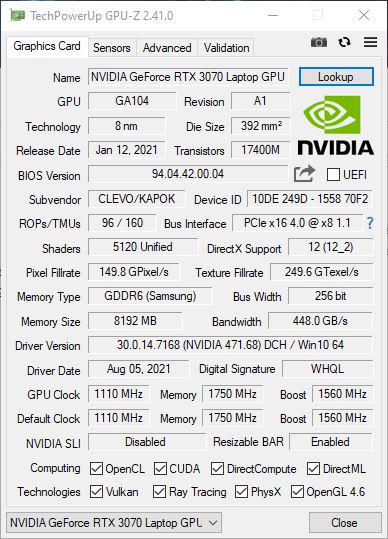
Graphics card
An Nvidia GeForce RTX 3070 is responsible for rendering demanding image content in the A7 X1. The latter can operate with a TDP of 140 watts, thereby achieving very good results in the 3DMark tests, which are just slightly short of one of the top places in our test field. On the other hand, the Gigabyte laptop can lead our test field when it comes to the 3DMark 11 benchmark.
To see how other graphics cards perform in comparison, see our GPU Benchmarks article.
| 3DMark 11 Performance | 26404 points | |
| 3DMark Cloud Gate Standard Score | 54931 points | |
| 3DMark Fire Strike Score | 23233 points | |
| 3DMark Time Spy Score | 10315 points | |
Help | ||
Gaming performance
The Gigabyte A7 X1 consistently achieves smooth and high frame rates at Full HD resolution and maximum details in the games that we tested. This means that both recent and upcoming titles will run without any problems. Compared with our test field, the rates achieved are at a medium level and a bit below the average of other gaming laptops with the Nvidia GeForce RTX 3070 at times.
Our GPU Benchmarks article shows the performance that can be expected from the Nvidia GeForce RTX 3070 in other games.
| The Witcher 3 - 1920x1080 Ultra Graphics & Postprocessing (HBAO+) | |
| Average of class Gaming (8.61 - 216, n=226, last 2 years) | |
| Medion Erazer Beast X20 | |
| SCHENKER XMG Neo 17 (Early 2021, RTX 3070, 5800H) | |
| Medion Erazer Beast X25 | |
| Gigabyte A7 X1 | |
| Average NVIDIA GeForce RTX 3070 Laptop GPU (34.9 - 109, n=52) | |
| Asus TUF Gaming F17 FX706HM | |
| Final Fantasy XV Benchmark - 1920x1080 High Quality | |
| Average of class Gaming (9.13 - 194.9, n=226, last 2 years) | |
| Medion Erazer Beast X25 | |
| Medion Erazer Beast X20 | |
| Average NVIDIA GeForce RTX 3070 Laptop GPU (27.9 - 107, n=49) | |
| Asus TUF Gaming F17 FX706HM | |
| GTA V - 1920x1080 Highest Settings possible AA:4xMSAA + FX AF:16x | |
| Average of class Gaming (6.38 - 167.7, n=216, last 2 years) | |
| SCHENKER XMG Neo 17 (Early 2021, RTX 3070, 5800H) | |
| Medion Erazer Beast X25 | |
| Average NVIDIA GeForce RTX 3070 Laptop GPU (21.7 - 125.8, n=50) | |
| Medion Erazer Beast X20 | |
| Gigabyte A7 X1 | |
| Asus TUF Gaming F17 FX706HM | |
| Strange Brigade - 1920x1080 ultra AA:ultra AF:16 | |
| Average of class Gaming (14.6 - 421, n=224, last 2 years) | |
| Gigabyte A7 X1 | |
| Medion Erazer Beast X20 | |
| Medion Erazer Beast X25 | |
| Average NVIDIA GeForce RTX 3070 Laptop GPU (36.2 - 194, n=46) | |
| Asus TUF Gaming F17 FX706HM | |
Our endurance test with The Witcher 3 also shows that performance doesn't suffer noticeably even during long gaming sessions, and that the system is able to compensate well for fluctuations.
The Witcher 3 FPS diagram
| low | med. | high | ultra | |
| GTA V (2015) | 174 | 164 | 139 | 83.6 |
| The Witcher 3 (2015) | 95.9 | |||
| Dota 2 Reborn (2015) | 139 | 125 | 119 | 113 |
| X-Plane 11.11 (2018) | 98.9 | 86.8 | 72.2 | |
| Strange Brigade (2018) | 311 | 232 | 208 | 185 |
| Cyberpunk 2077 1.0 (2020) | 104.5 | 89.6 | 77.1 | 66.3 |
Emissions - The laptop can also run quietly
Noise emissions
When the Gigabyte A7 X1 is only used to run the browser and perform office tasks, the laptop is usually silent, and the fans seldom rise to a quiet 35 dB(A). Under load and in gaming mode, however, the noise level can get considerably louder and more annoying with up to 59 dB(A).
We weren't able to detect any other background noise, such as coil whine or the like.
Noise Level
| Idle |
| 25 / 29 / 35 dB(A) |
| Load |
| 58 / 59 dB(A) |
 | ||
30 dB silent 40 dB(A) audible 50 dB(A) loud |
||
min: | ||
Temperature
According to our measurements, the surfaces of the Gigabyte A7 X1 heat up to 49 °C (~120 °F). The warmest spot is at the lower left corner, but the gaming laptop never feels too hot. The palm rests only heat up moderately as well.
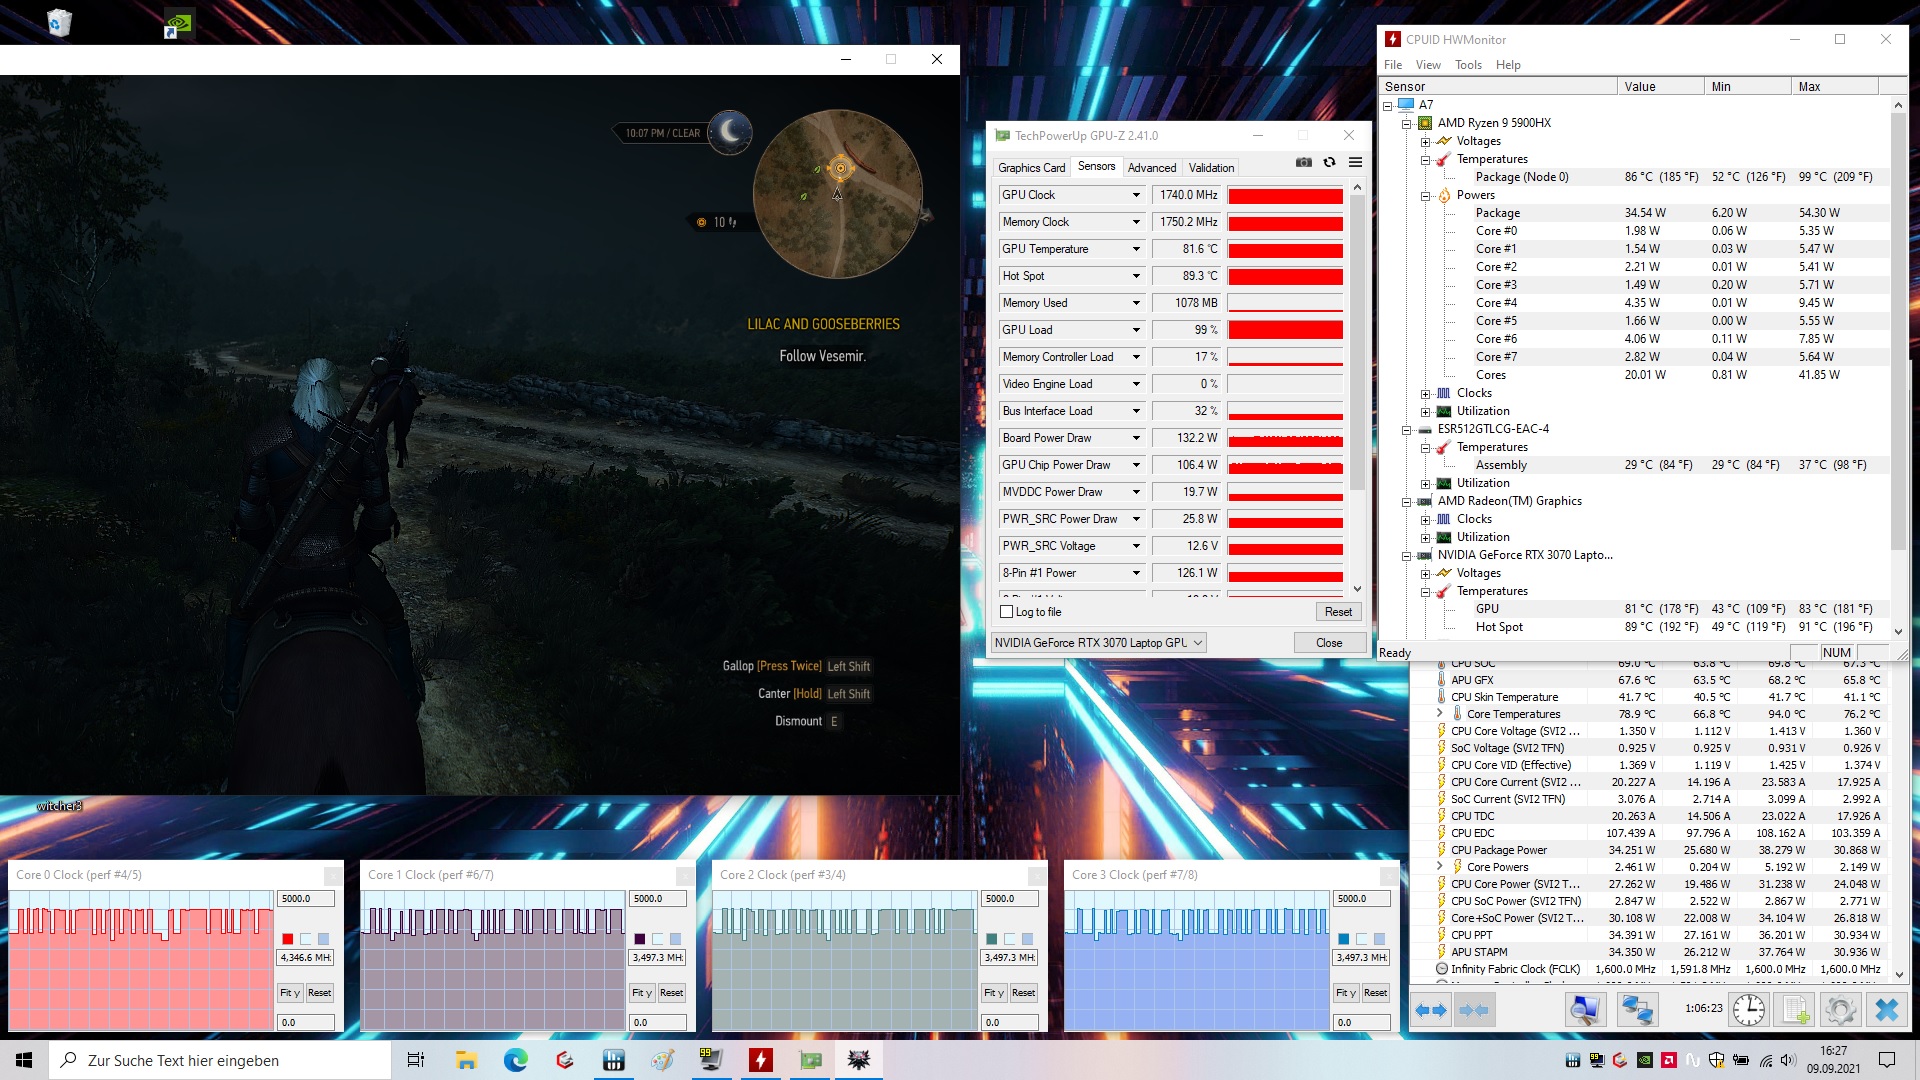
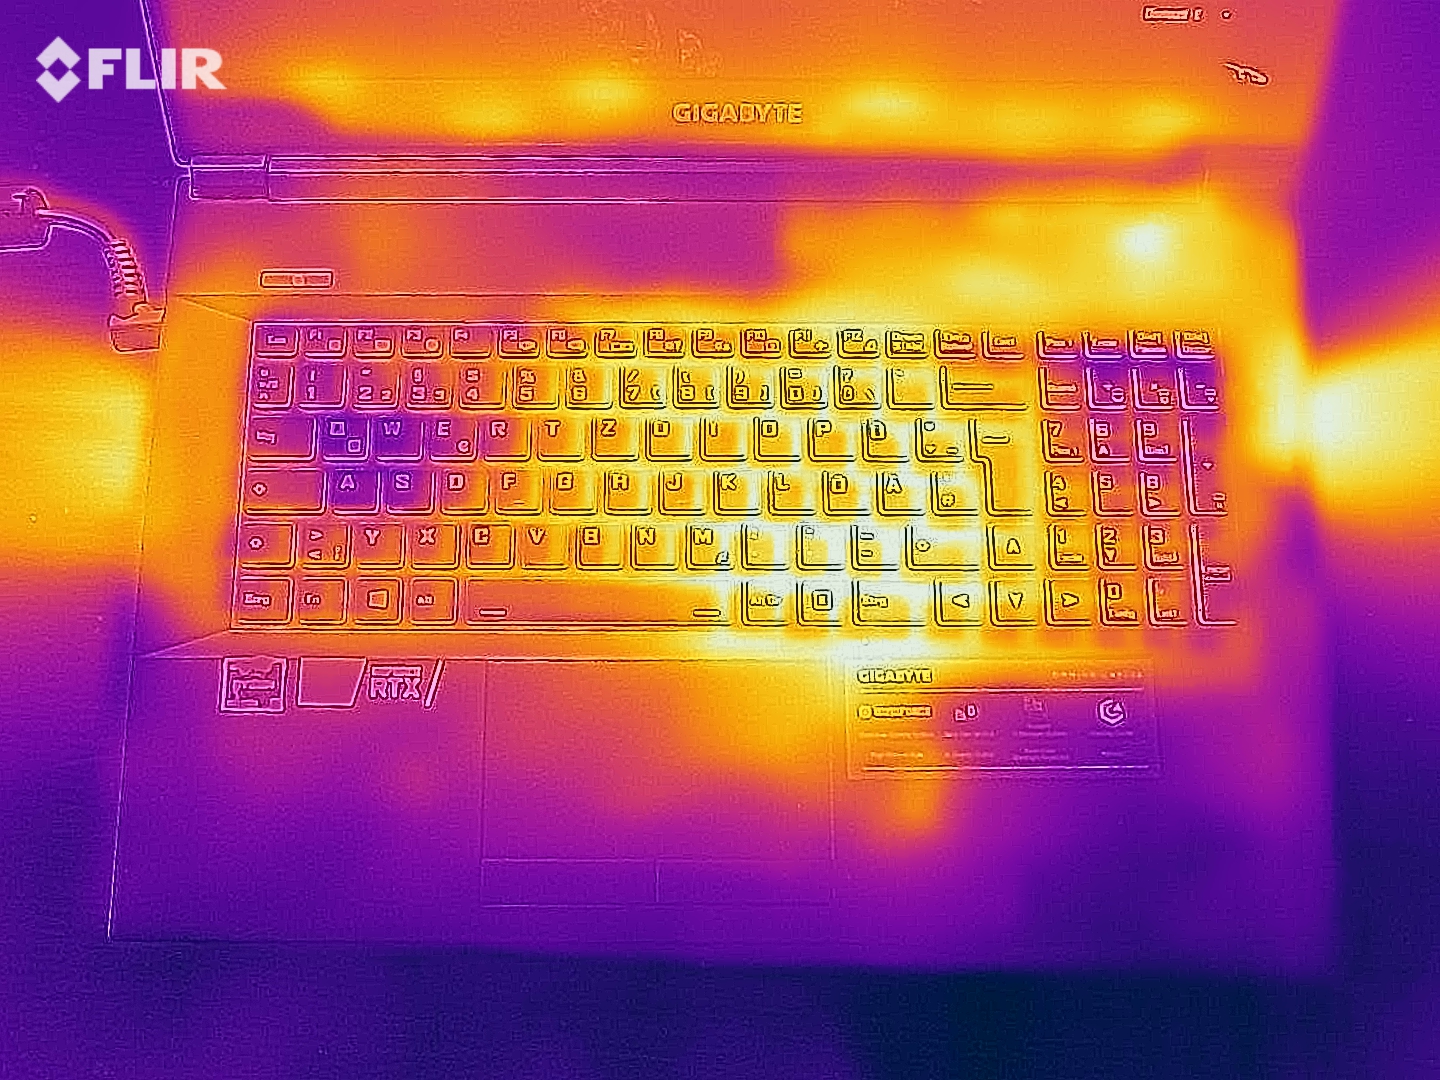
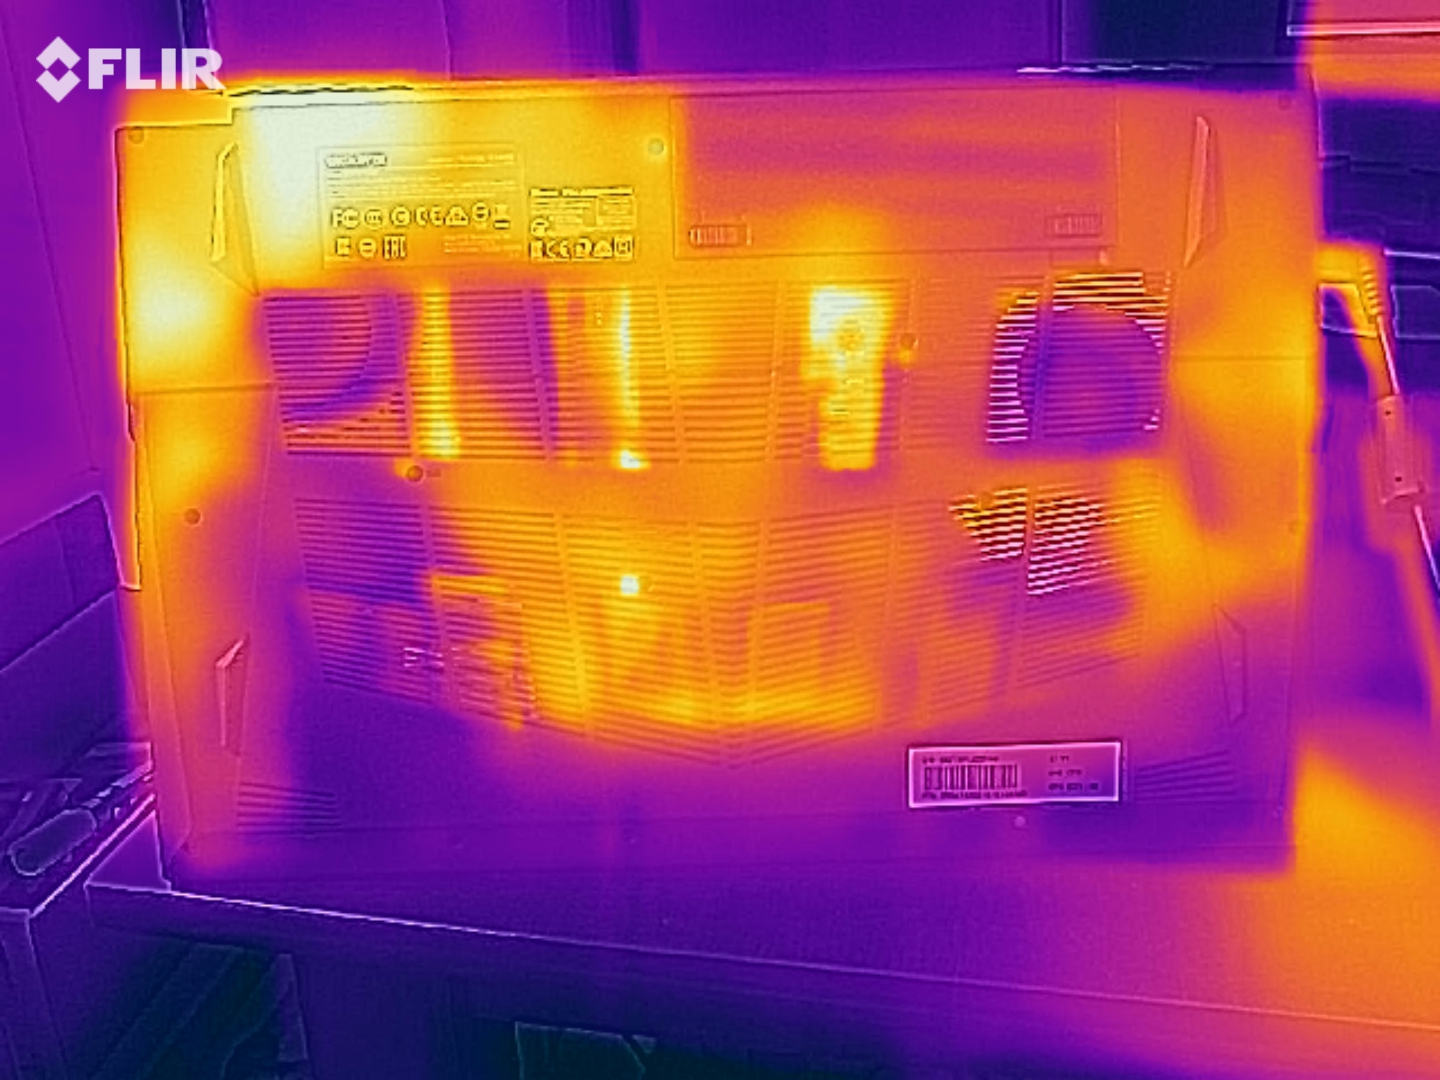
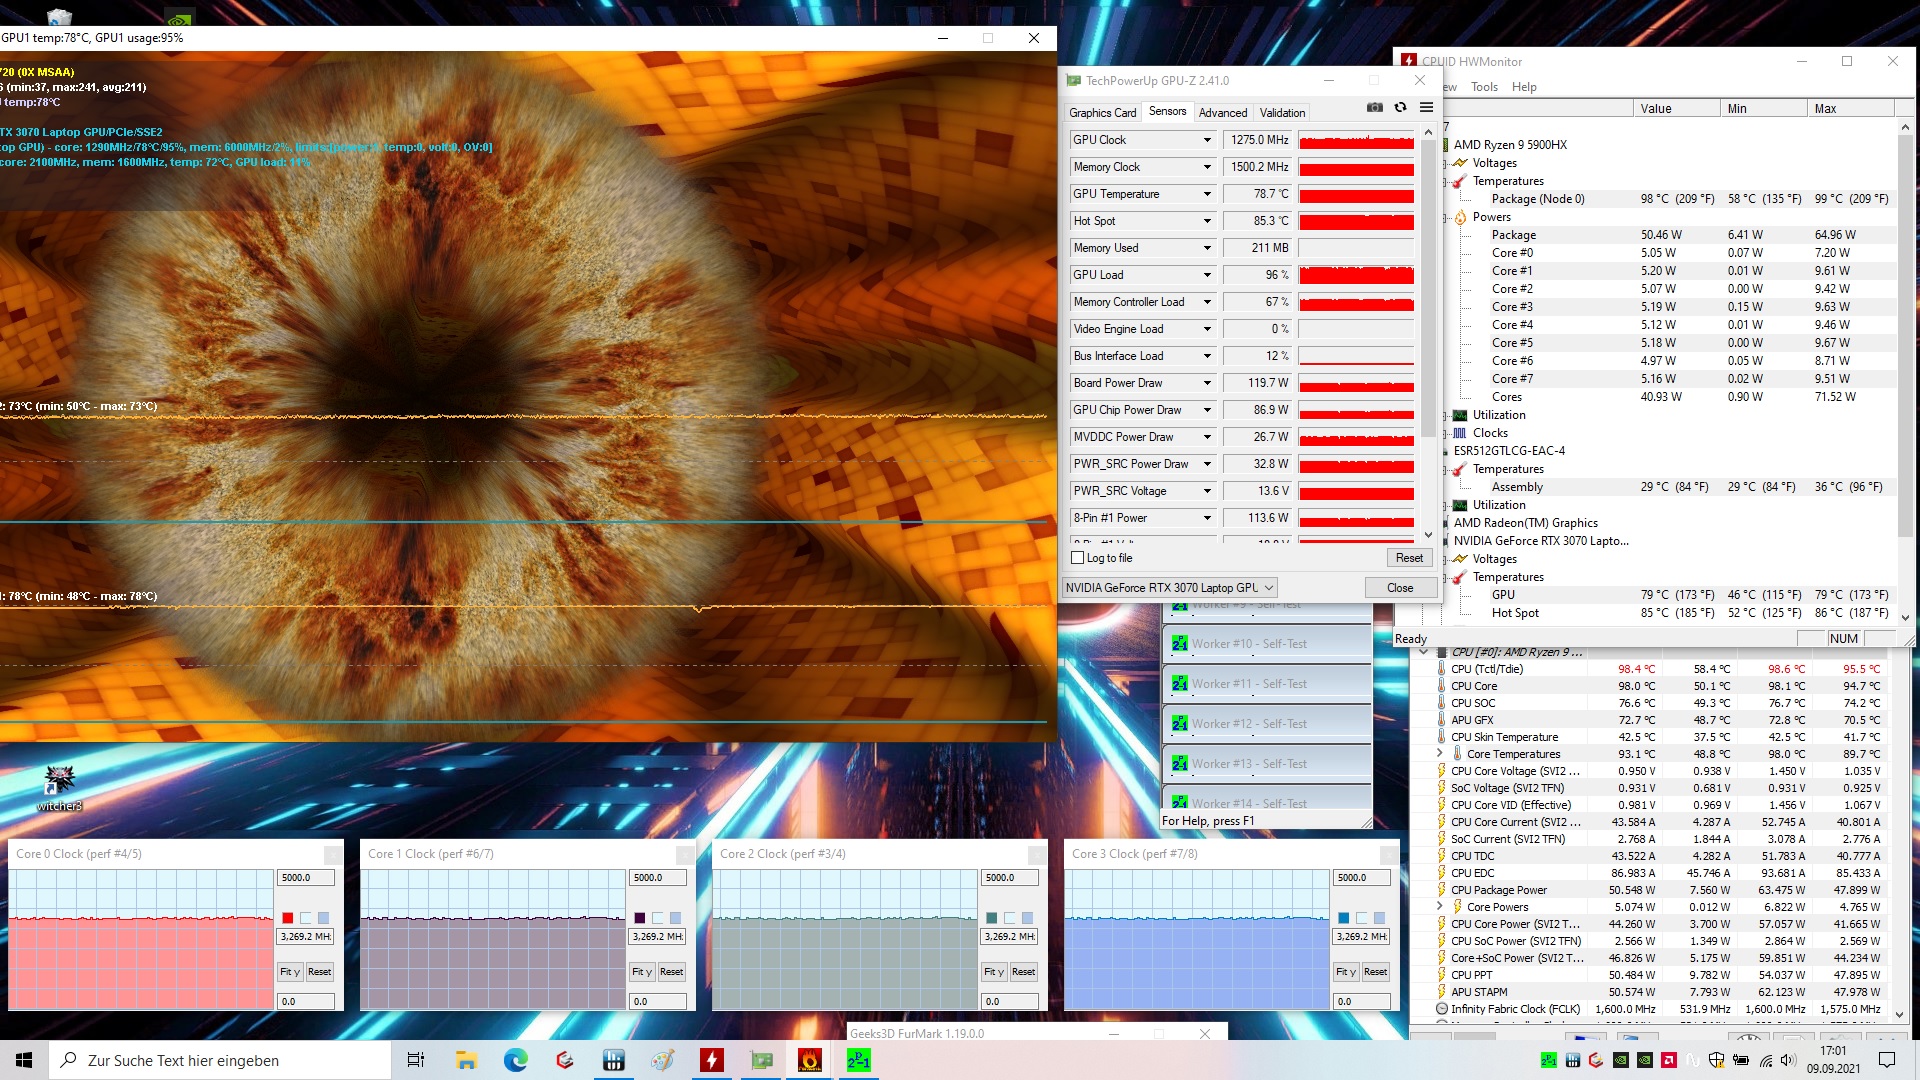
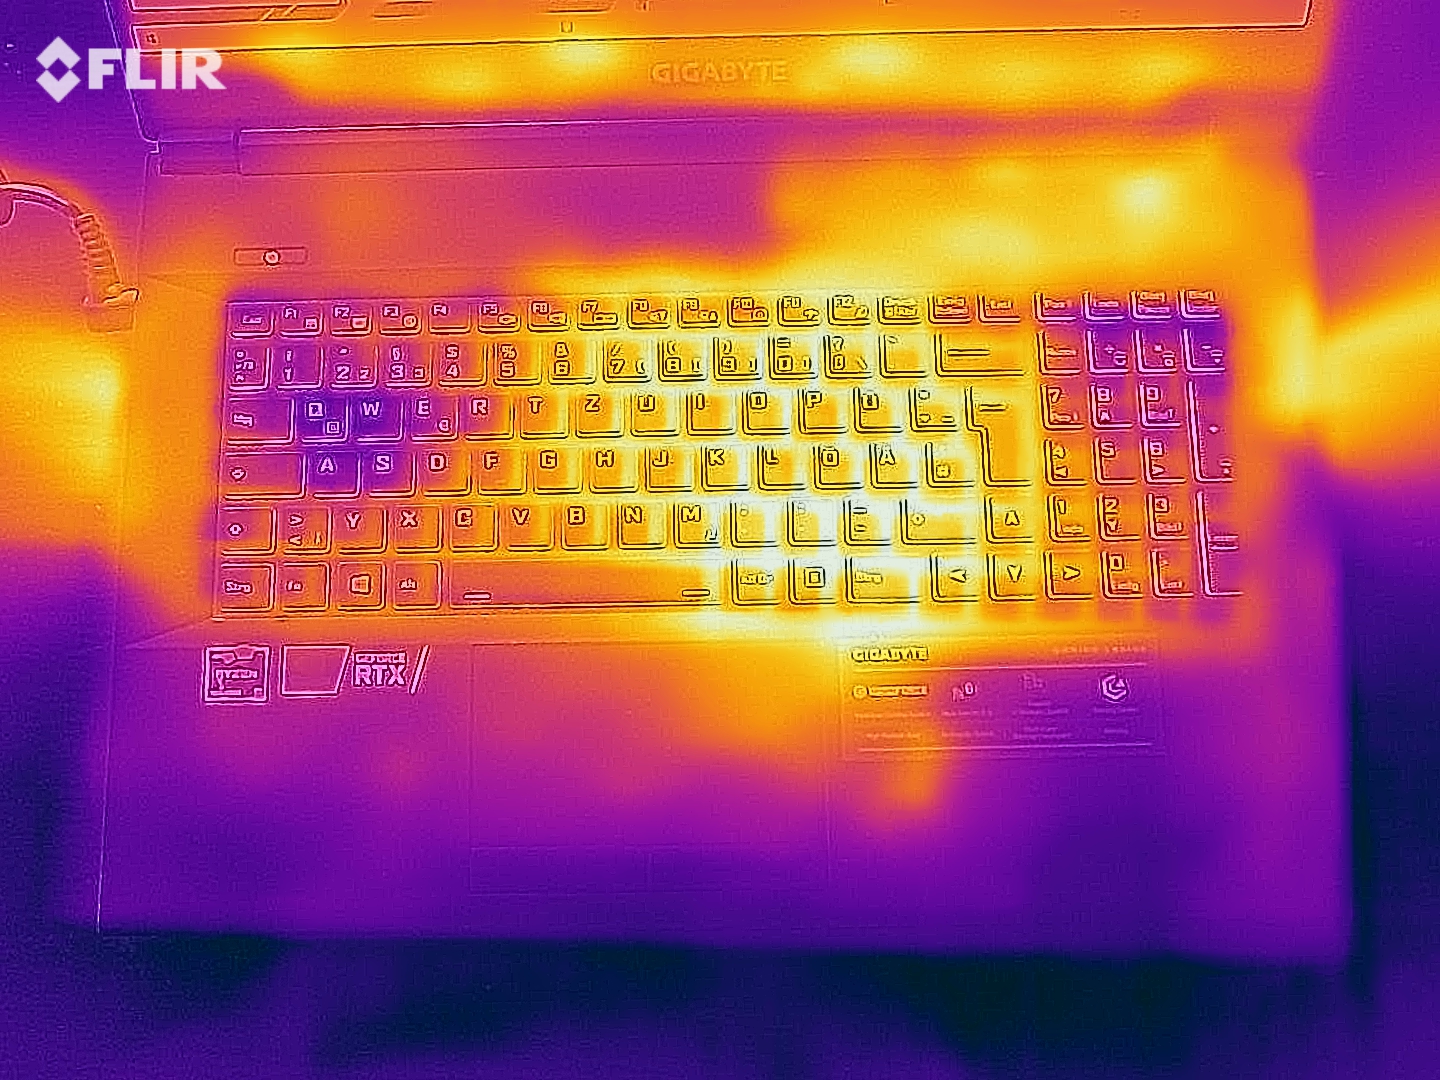
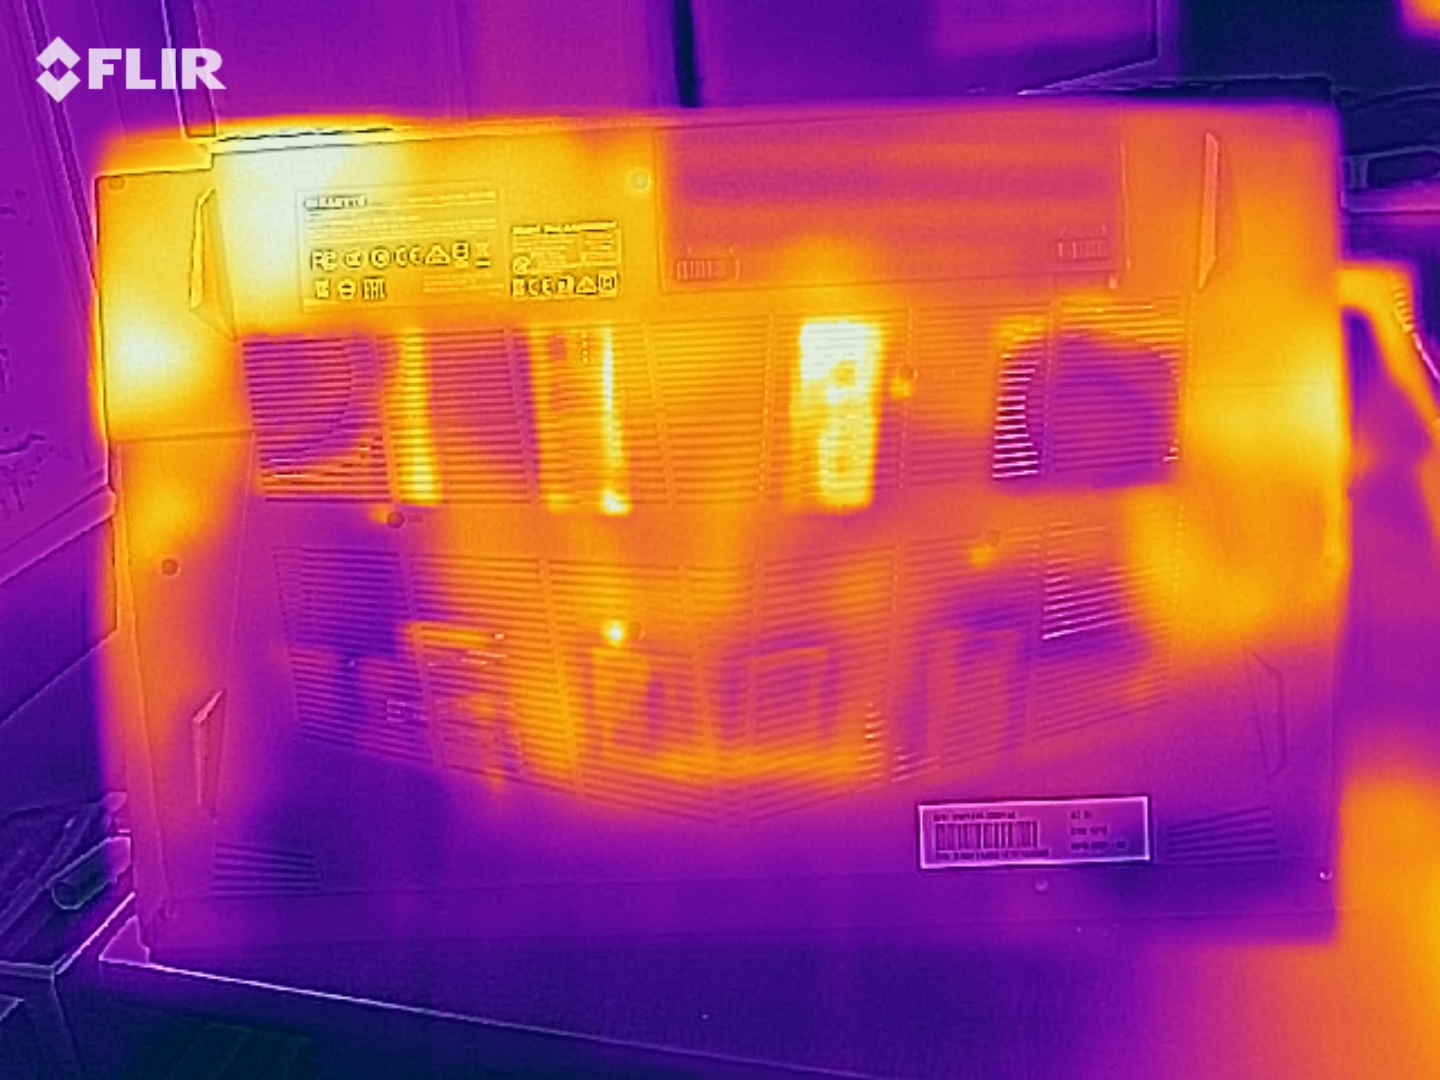
The temperatures inside the Gigabyte A7 X1 climb up to 99 °C (~210 °F) in our endurance stress test that lasts about an hour. Nevertheless, the CPU clock rates never drop below the base value of 3.3 GHz, and the system continues to run smoothly. We can also see this behavior in the endurance stress test with The Witcher 3, although the clock rates are even slightly higher here at approximately 3.5 GHz.
(±) The maximum temperature on the upper side is 44 °C / 111 F, compared to the average of 40.4 °C / 105 F, ranging from 21.2 to 68.8 °C for the class Gaming.
(-) The bottom heats up to a maximum of 49 °C / 120 F, compared to the average of 43.2 °C / 110 F
(+) In idle usage, the average temperature for the upper side is 26.1 °C / 79 F, compared to the device average of 33.8 °C / 93 F.
(-) Playing The Witcher 3, the average temperature for the upper side is 40.6 °C / 105 F, compared to the device average of 33.8 °C / 93 F.
(-) The palmrests and touchpad can get very hot to the touch with a maximum of 41 °C / 105.8 F.
(-) The average temperature of the palmrest area of similar devices was 28.9 °C / 84 F (-12.1 °C / -21.8 F).
Speakers
The speakers of the Gigabyte A7 X1 offer a relatively high volume and a sound spectrum dominated by mids and highs. This makes them perfectly suitable for playing media content. However, external speakers or headphones are recommended in the long run.
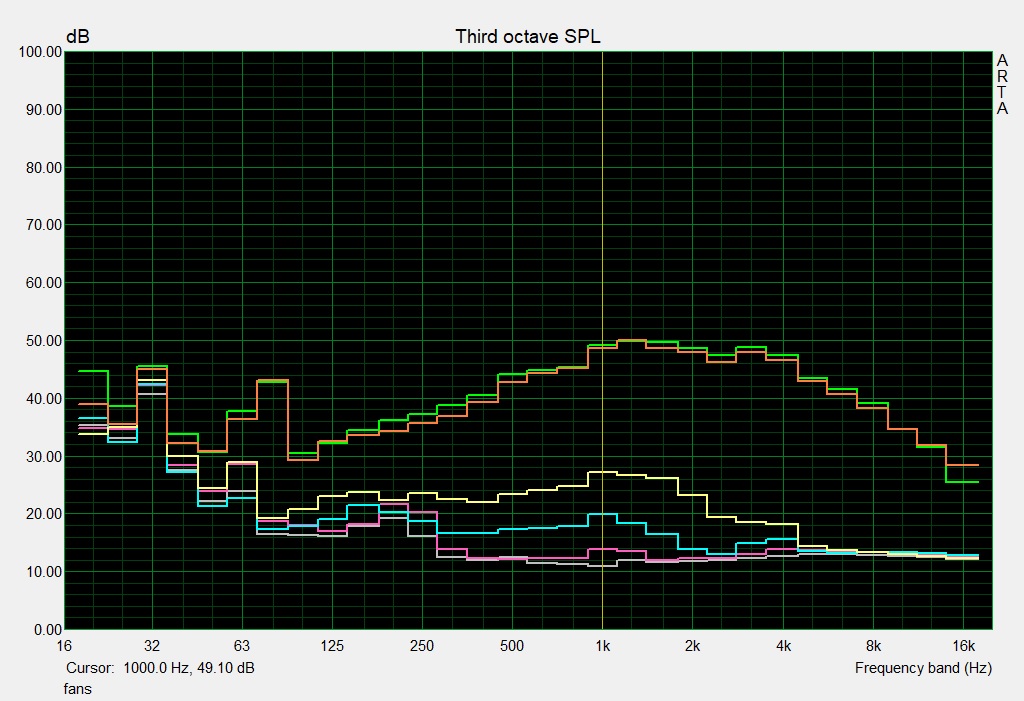
Gigabyte A7 X1 audio analysis
(+) | speakers can play relatively loud (85 dB)
Bass 100 - 315 Hz
(-) | nearly no bass - on average 30.3% lower than median
(±) | linearity of bass is average (13.4% delta to prev. frequency)
Mids 400 - 2000 Hz
(±) | higher mids - on average 6.8% higher than median
(±) | linearity of mids is average (11.3% delta to prev. frequency)
Highs 2 - 16 kHz
(+) | balanced highs - only 4.4% away from median
(+) | highs are linear (5.4% delta to prev. frequency)
Overall 100 - 16.000 Hz
(±) | linearity of overall sound is average (23.5% difference to median)
Compared to same class
» 83% of all tested devices in this class were better, 5% similar, 12% worse
» The best had a delta of 6%, average was 18%, worst was 132%
Compared to all devices tested
» 66% of all tested devices were better, 7% similar, 28% worse
» The best had a delta of 4%, average was 25%, worst was 134%
SCHENKER XMG Neo 17 (Early 2021, RTX 3070, 5800H) audio analysis
(+) | speakers can play relatively loud (84 dB)
Bass 100 - 315 Hz
(-) | nearly no bass - on average 20.8% lower than median
(±) | linearity of bass is average (12.3% delta to prev. frequency)
Mids 400 - 2000 Hz
(+) | balanced mids - only 2.9% away from median
(+) | mids are linear (5.1% delta to prev. frequency)
Highs 2 - 16 kHz
(+) | balanced highs - only 2.7% away from median
(±) | linearity of highs is average (7.6% delta to prev. frequency)
Overall 100 - 16.000 Hz
(+) | overall sound is linear (14.5% difference to median)
Compared to same class
» 25% of all tested devices in this class were better, 6% similar, 69% worse
» The best had a delta of 6%, average was 18%, worst was 132%
Compared to all devices tested
» 15% of all tested devices were better, 3% similar, 82% worse
» The best had a delta of 4%, average was 25%, worst was 134%
Energy management - Slightly weak battery life
Energy consumption
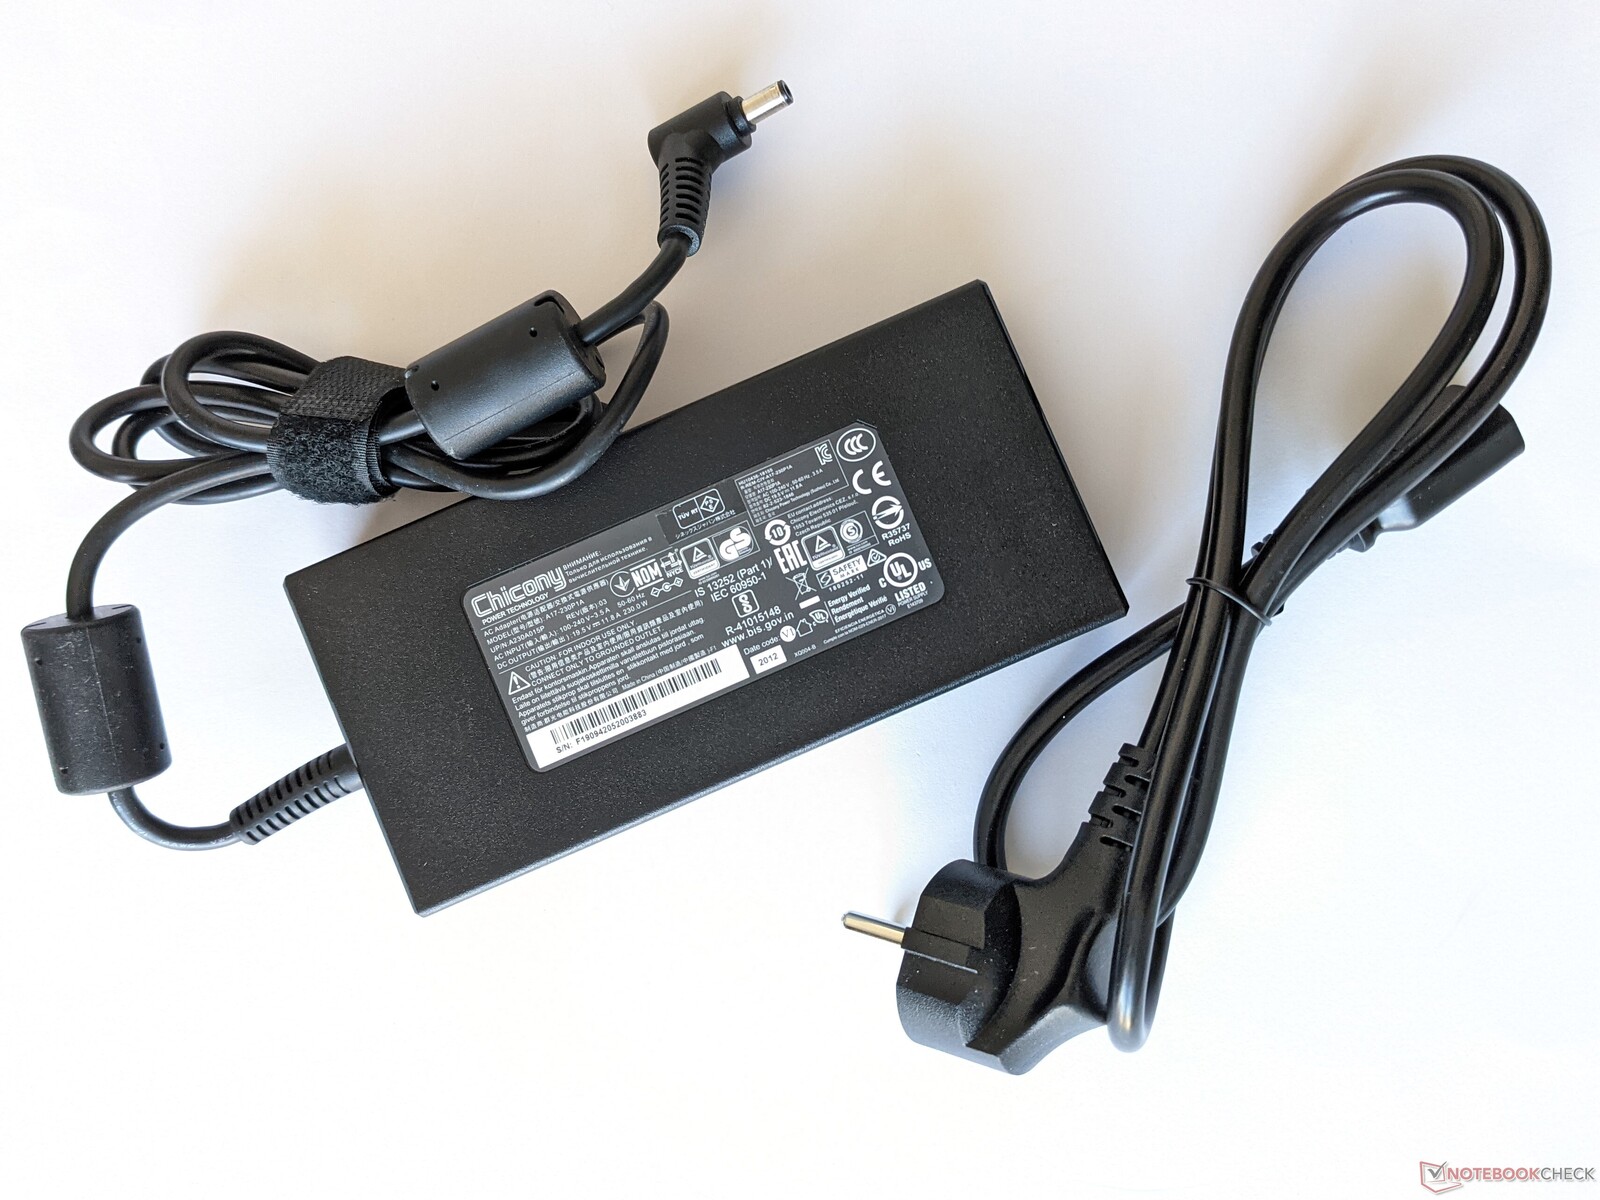
With an average power consumption of 14 watts in our idle scenario, the Gigabyte A7 X1 is one of the most frugal laptops in our test field. Under load, though, power consumption can reach short peaks of up to 229 watts. Values of around 205 watts are to be expected during gaming.
The included power adapter can handle an output of 230 watts, which is a sufficiently high capacity.
| Off / Standby | |
| Idle | |
| Load |
|
| Gigabyte A7 X1 R9 5900HX, GeForce RTX 3070 Laptop GPU | Medion Erazer Beast X25 R9 5900HX, GeForce RTX 3080 Laptop GPU | Medion Erazer Beast X20 i7-10870H, GeForce RTX 3070 Laptop GPU | Asus TUF Gaming F17 FX706HM i9-11900H, GeForce RTX 3060 Laptop GPU | SCHENKER XMG Neo 17 (Early 2021, RTX 3070, 5800H) R7 5800H, GeForce RTX 3070 Laptop GPU | Average of class Gaming | |
|---|---|---|---|---|---|---|
| Power Consumption | -41% | -15% | 17% | -12% | -20% | |
| Idle Minimum * | 12 | 22 -83% | 13 -8% | 10.3 14% | 13 -8% | 13.8 ? -15% |
| Idle Average * | 14 | 26 -86% | 18 -29% | 13.1 6% | 16 -14% | 19.2 ? -37% |
| Idle Maximum * | 19 | 34 -79% | 32 -68% | 14.1 26% | 26 -37% | 26.9 ? -42% |
| Load Average * | 118 | 120 -2% | 106 10% | 110 7% | 125 -6% | 111.1 ? 6% |
| Witcher 3 ultra * | 205 | 189 8% | 192 6% | 138 33% | 187 9% | |
| Load Maximum * | 229 | 231 -1% | 232 -1% | 190 17% | 259 -13% | 251 ? -10% |
* ... smaller is better
Energy consumption during The Witcher 3 / stress test
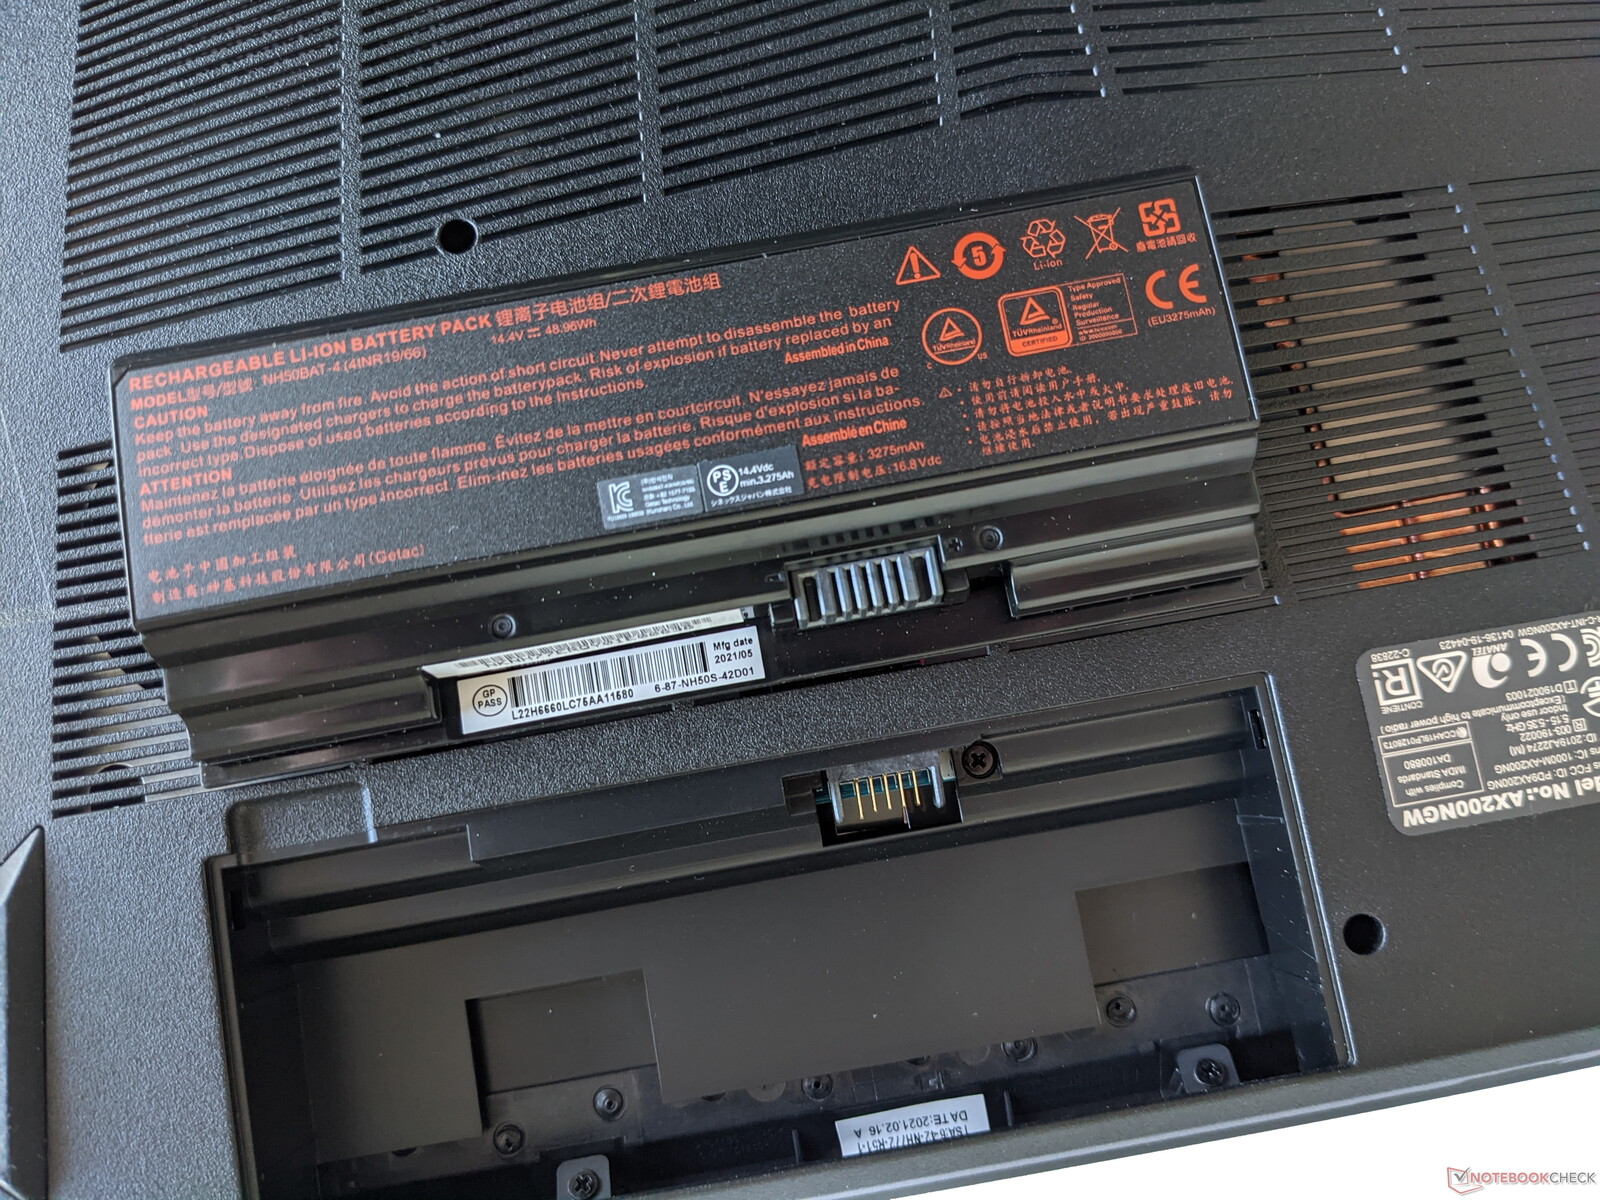
Battery life
The Gigabyte A7 X1 achieves a runtime of 4:40 hours in our real-world Wi-Fi test. This means that it makes good use of its 48.96 Wh battery, but it doesn't reach the rates of our chosen competition. In return, the gaming laptop's battery can be removed without the need for tools and replaced if necessary.
| Gigabyte A7 X1 R9 5900HX, GeForce RTX 3070 Laptop GPU, 48.96 Wh | Medion Erazer Beast X25 R9 5900HX, GeForce RTX 3080 Laptop GPU, 91 Wh | Medion Erazer Beast X20 i7-10870H, GeForce RTX 3070 Laptop GPU, 91 Wh | Asus TUF Gaming F17 FX706HM i9-11900H, GeForce RTX 3060 Laptop GPU, 90 Wh | SCHENKER XMG Neo 17 (Early 2021, RTX 3070, 5800H) R7 5800H, GeForce RTX 3070 Laptop GPU, 62 Wh | Average of class Gaming | |
|---|---|---|---|---|---|---|
| Battery Runtime | 30% | 63% | 86% | -33% | 24% | |
| WiFi v1.3 | 280 | 410 46% | 373 33% | 454 62% | 208 -26% | 368 ? 31% |
| Load | 72 | 81 13% | 138 92% | 151 110% | 44 -39% | 84.4 ? 17% |
Pros
Cons
Verdict - Powerful and upgradeable
In terms of looks, the Gigabyte A7 X1 is certainly not a trendy, slim, and ultra-mobile gaming laptop. But it does what it's supposed to do, namely bringing games smoothly onto the screen, very well. Both the processor and the GeForce RTX 3070 are able to unleash their performance without restrictions thanks to the well-ventilated case.
The Gigabyte A7 X1 brings modern games smoothly onto the screen and offers excellent maintenance options.
Another advantage of the large build is that many components can be easily upgraded or replaced. For example, not only can the battery be replaced completely without tools, but there are also additional free slots for mass storage devices inside, and you can also gain access to the WLAN module and RAM.
If you find the A7 X1 too bulky, you can take a look at the 15-inch Gigabyte G5 KC counterpart, which is equipped with an Intel CPU. The Schenker XMG Neo 17 is a bit slimmer but also more expensive.
Price and availability
Gigabyte A7 X1
-
10/13/2021 v7
Mike Wobker

Pricecompare

