

Acer Nitro 5 AN517-41 in review: GeForce RTX 3070 on the back burner

Acer has a mid-range gaming notebook in the 17.3-inch class in its lineup with the Nitro 5, which is powered by a Ryzen 7-5800H APU and a GeForce RTX-3070 Laptop Graphics core. The configuration variant we have is available for just under 1,500 Euros (~$1764). The competitors include devices like the MSI GP76 Leopard 10UG, the Schenker XMG Core 17 (Early 2021), the Asus TUF Gaming F17 FX706HM, and the MSI Katana GF76 11UE - the latter three are RTX 3060 notebooks that are priced on par with the Nitro 5.
Comparably priced 17.3-inch RTX 3070 notebooks are currently hardly found in our database. Therefore, we also consider 15.6-inch RTX 3070 devices, such as the Asus TUF Gaming A15 FA506QR and the Aorus 15G XC. 17.3-inch counterparts of both computers exist.
Possible competitors in comparison
Rating | Date | Model | Weight | Height | Size | Resolution | Price |
|---|---|---|---|---|---|---|---|
| 81.3 % v7 (old) | 08 / 2021 | Acer Nitro 5 AN517-41-R5Z7 R7 5800H, GeForce RTX 3070 Laptop GPU | 2.7 kg | 24.9 mm | 17.30" | 1920x1080 | |
| 80.4 % v7 (old) | 06 / 2021 | MSI Katana GF76 11UE i7-11800H, GeForce RTX 3060 Laptop GPU | 2.7 kg | 25.2 mm | 17.30" | 1920x1080 | |
| 83.9 % v7 (old) | 06 / 2021 | Schenker XMG Core 17 (Early 2021) i7-10870H, GeForce RTX 3060 Laptop GPU | 2.5 kg | 30.05 mm | 17.30" | 2560x1440 | |
| 82.8 % v7 (old) | 06 / 2021 | Asus TUF Gaming F17 FX706HM i9-11900H, GeForce RTX 3060 Laptop GPU | 2.7 kg | 26 mm | 17.30" | 1920x1080 | |
| 85.1 % v7 (old) | 03 / 2021 | MSI GP76 Leopard 10UG i7-10750H, GeForce RTX 3070 Laptop GPU | 2.9 kg | 26 mm | 17.30" | 1920x1080 | |
| 86.4 % v7 (old) | 02 / 2021 | Aorus 15G XC i7-10870H, GeForce RTX 3070 Laptop GPU | 2.1 kg | 23 mm | 15.60" | 1920x1080 | |
| 85 % v7 (old) | 07 / 2021 | Asus TUF Gaming A15 FA506QR-AZ061T R7 5800H, GeForce RTX 3070 Laptop GPU | 2.3 kg | 24 mm | 15.60" | 1920x1080 |
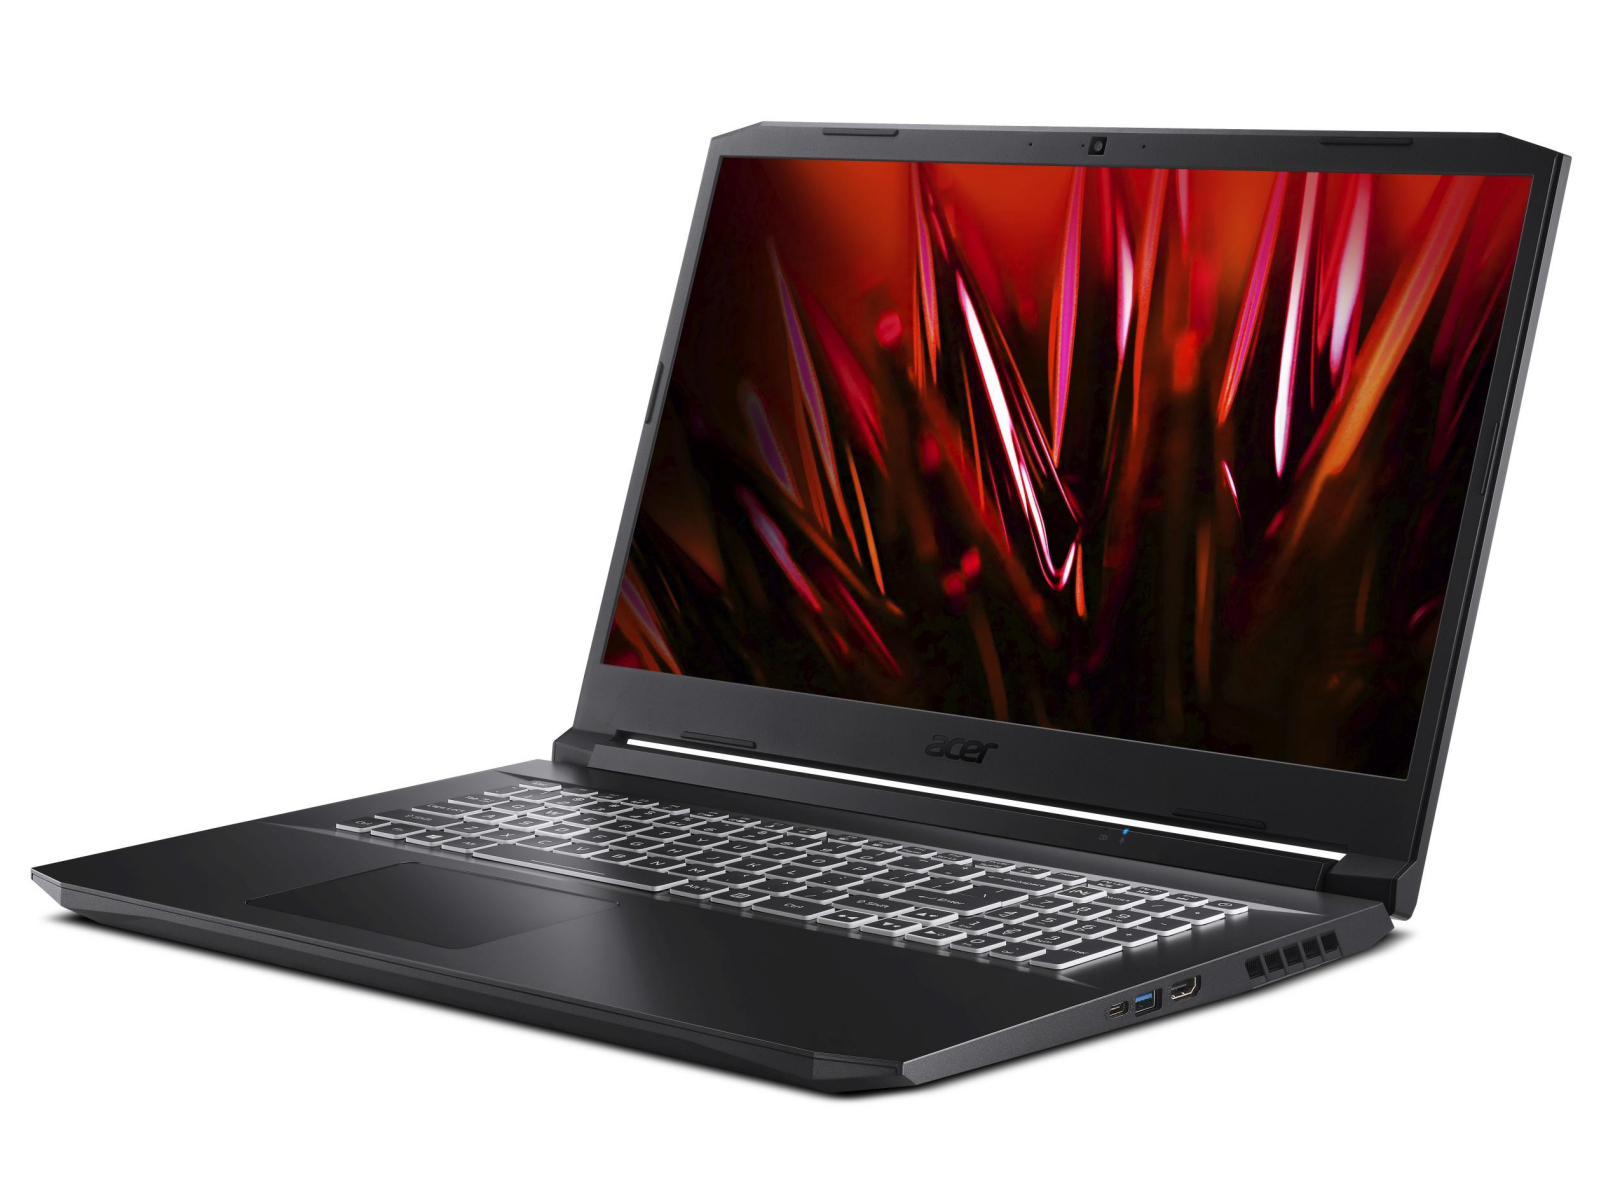
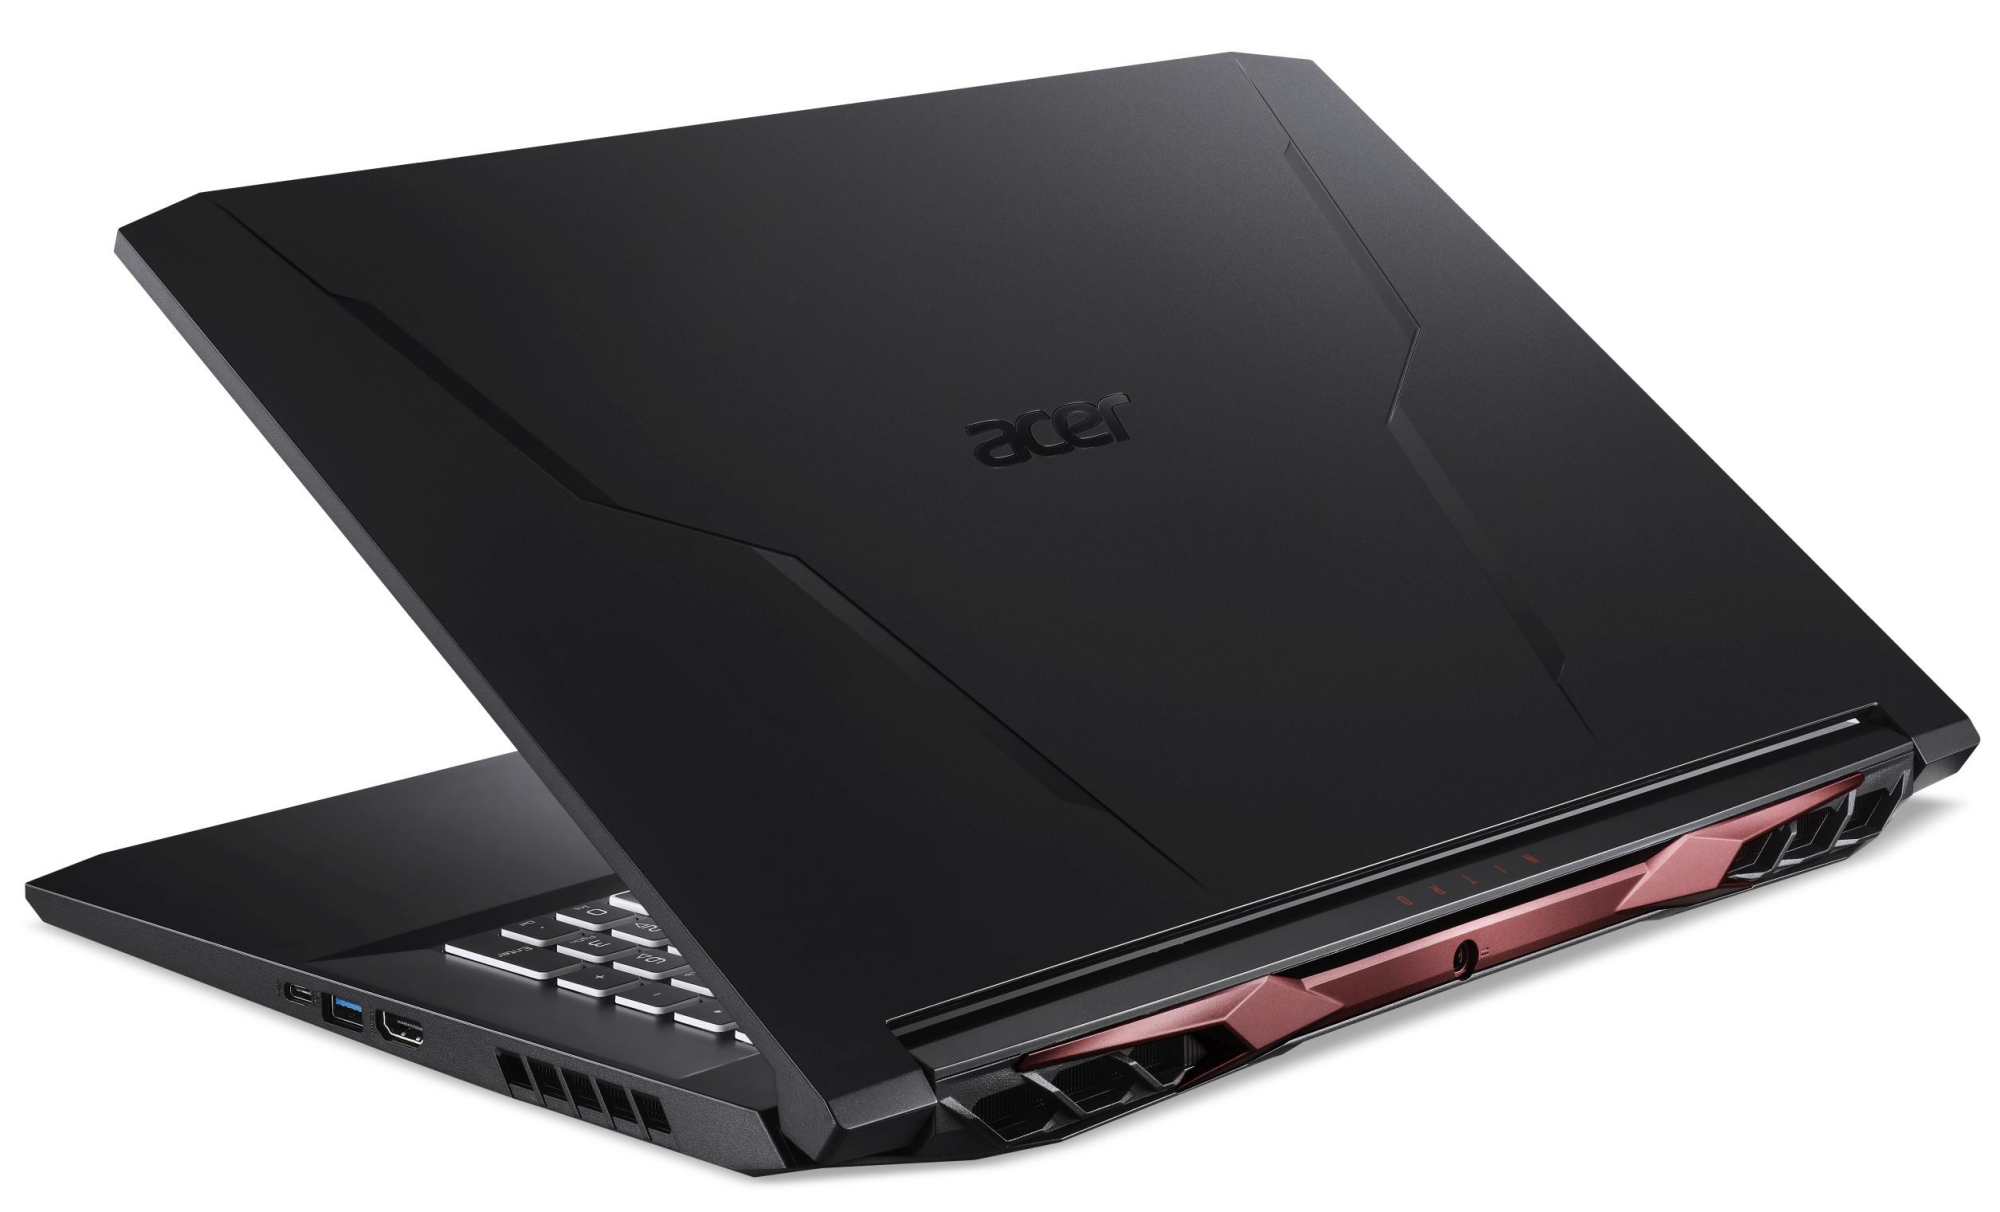
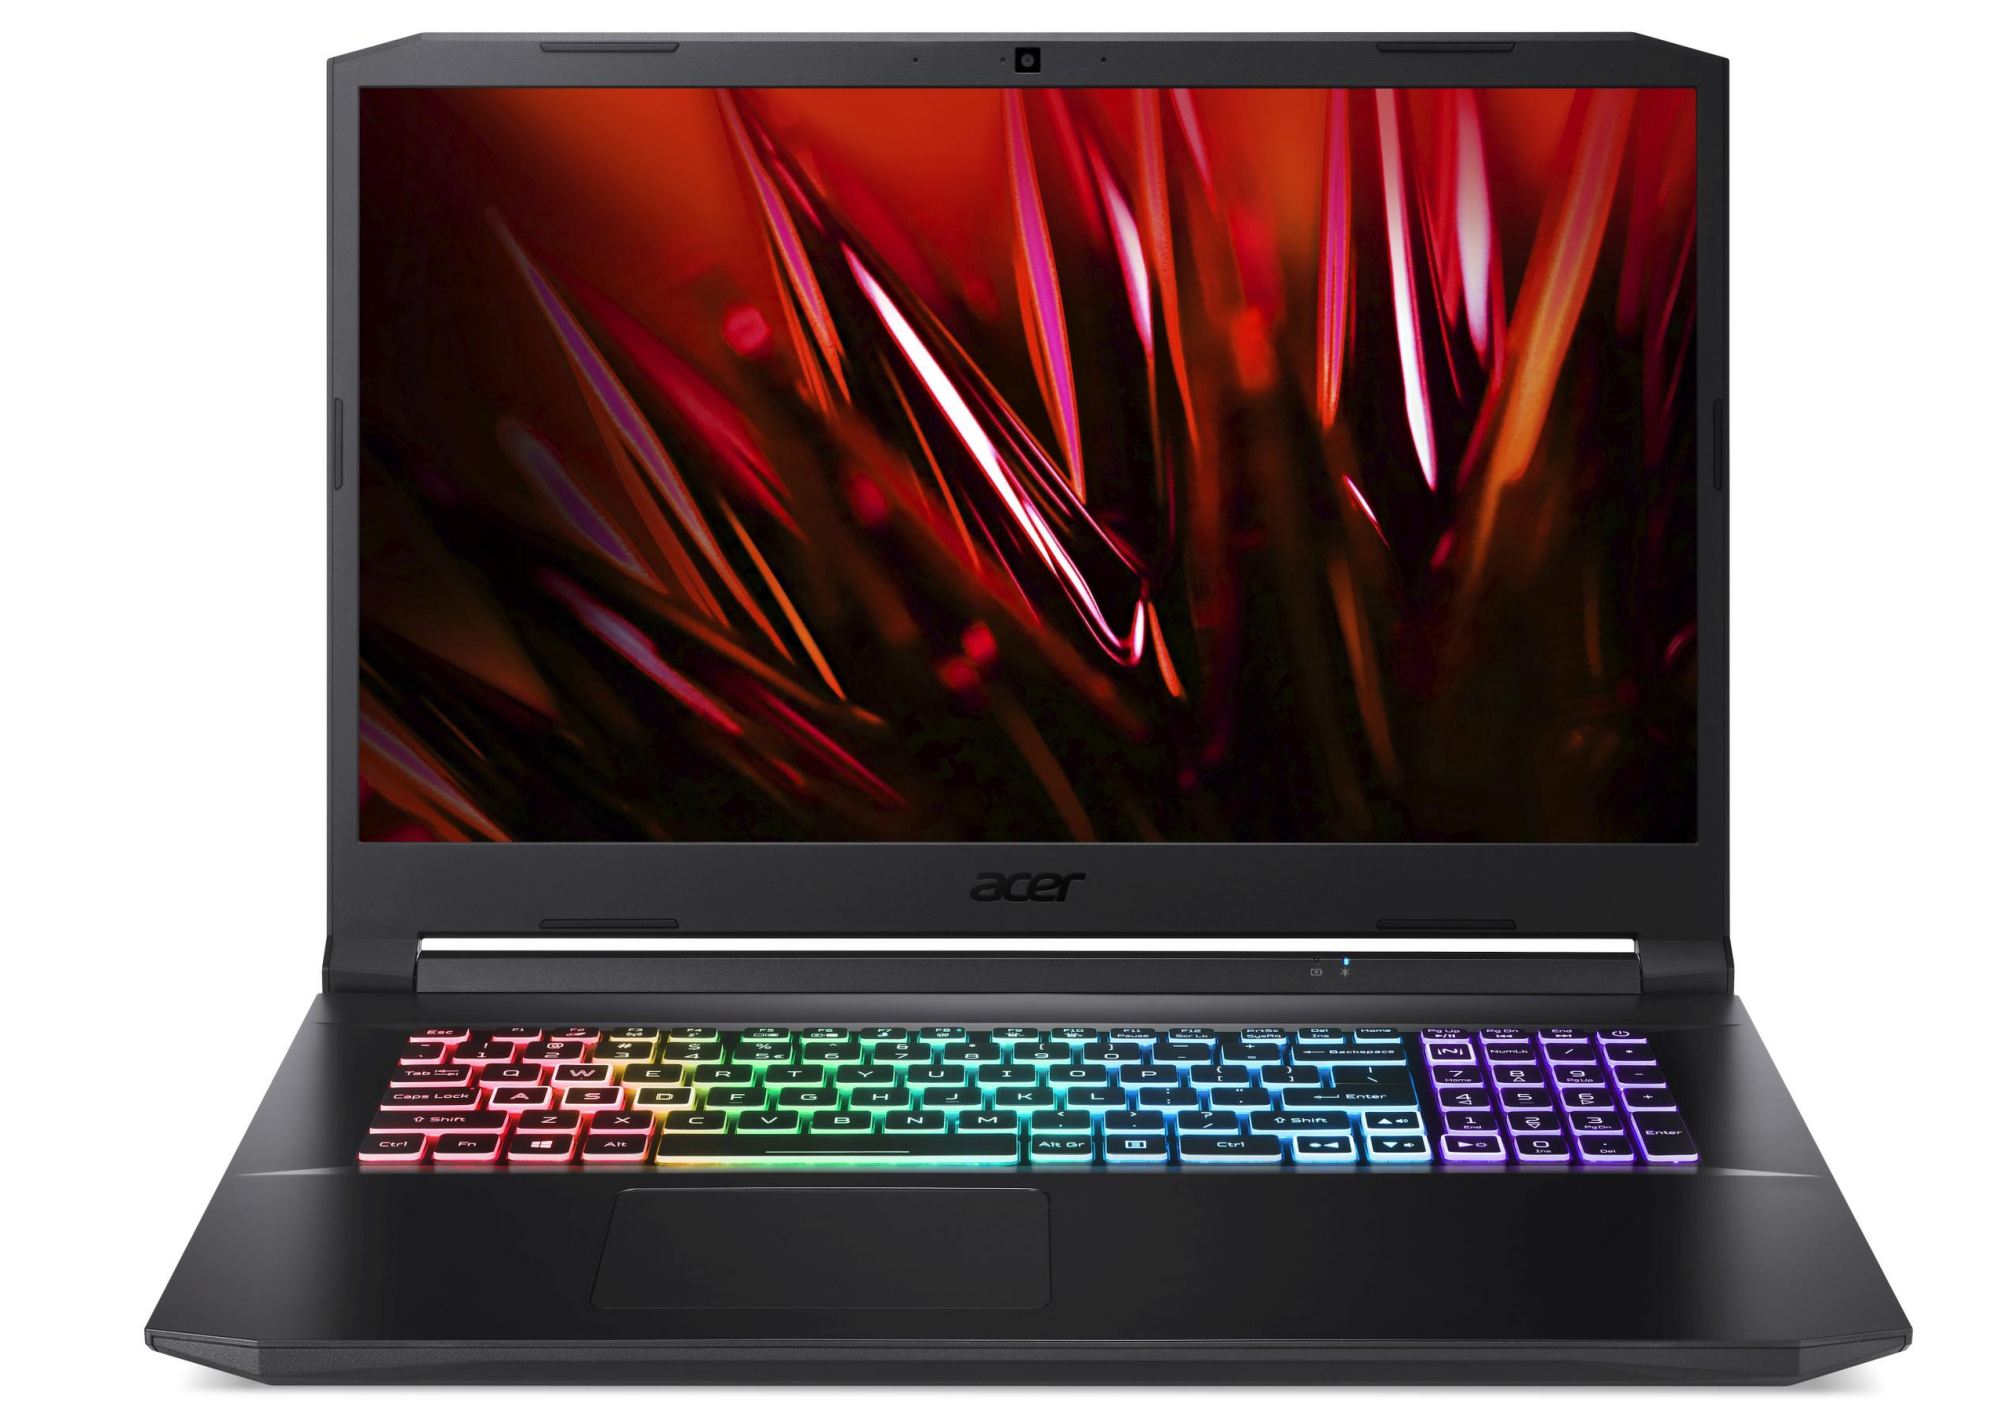
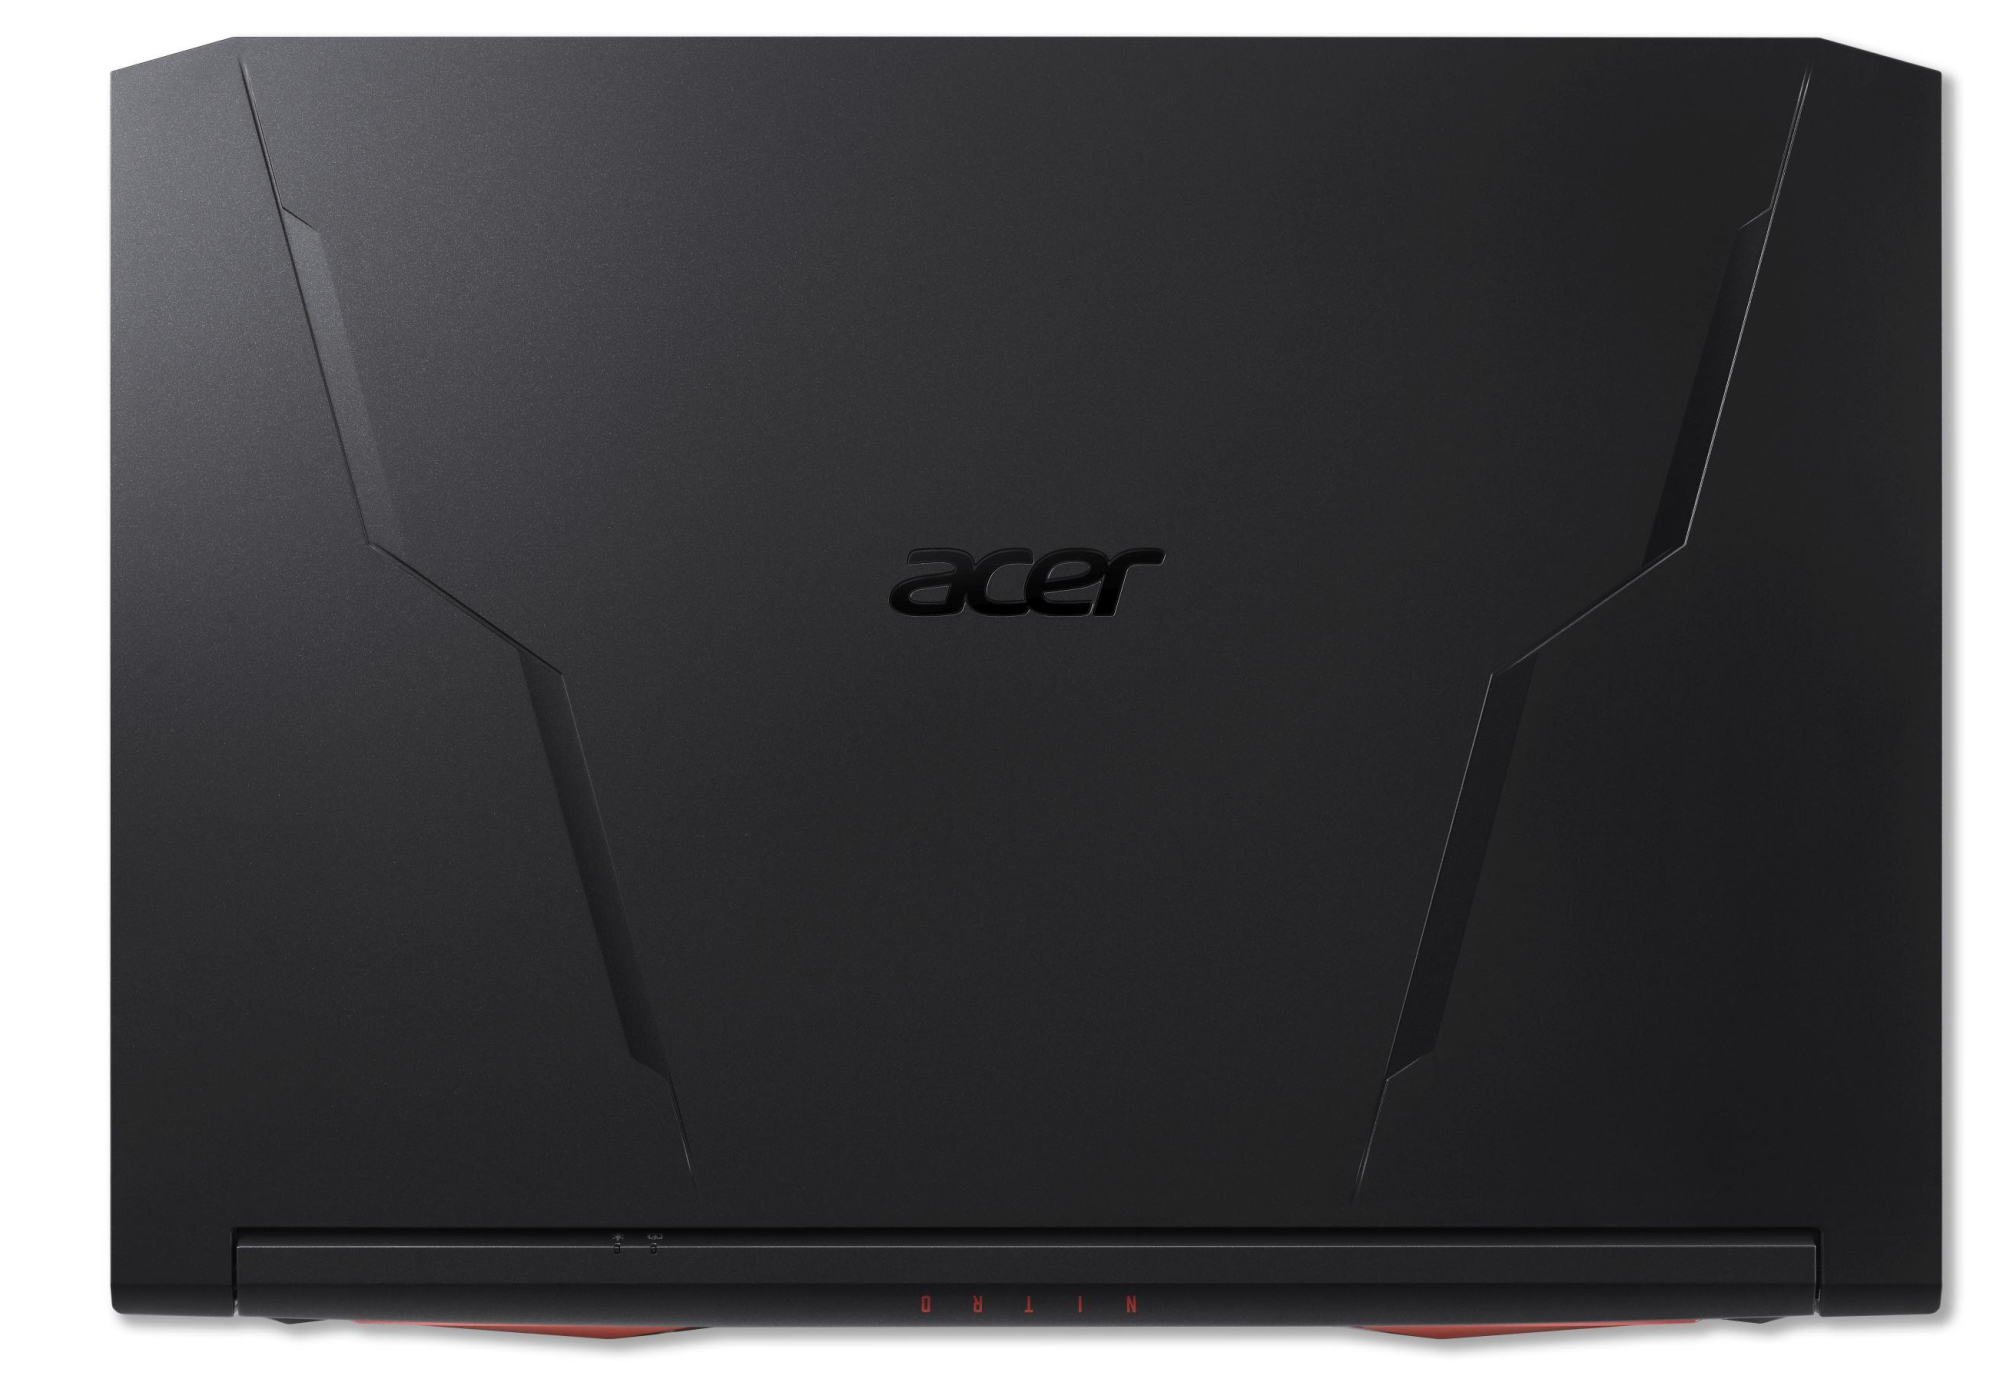
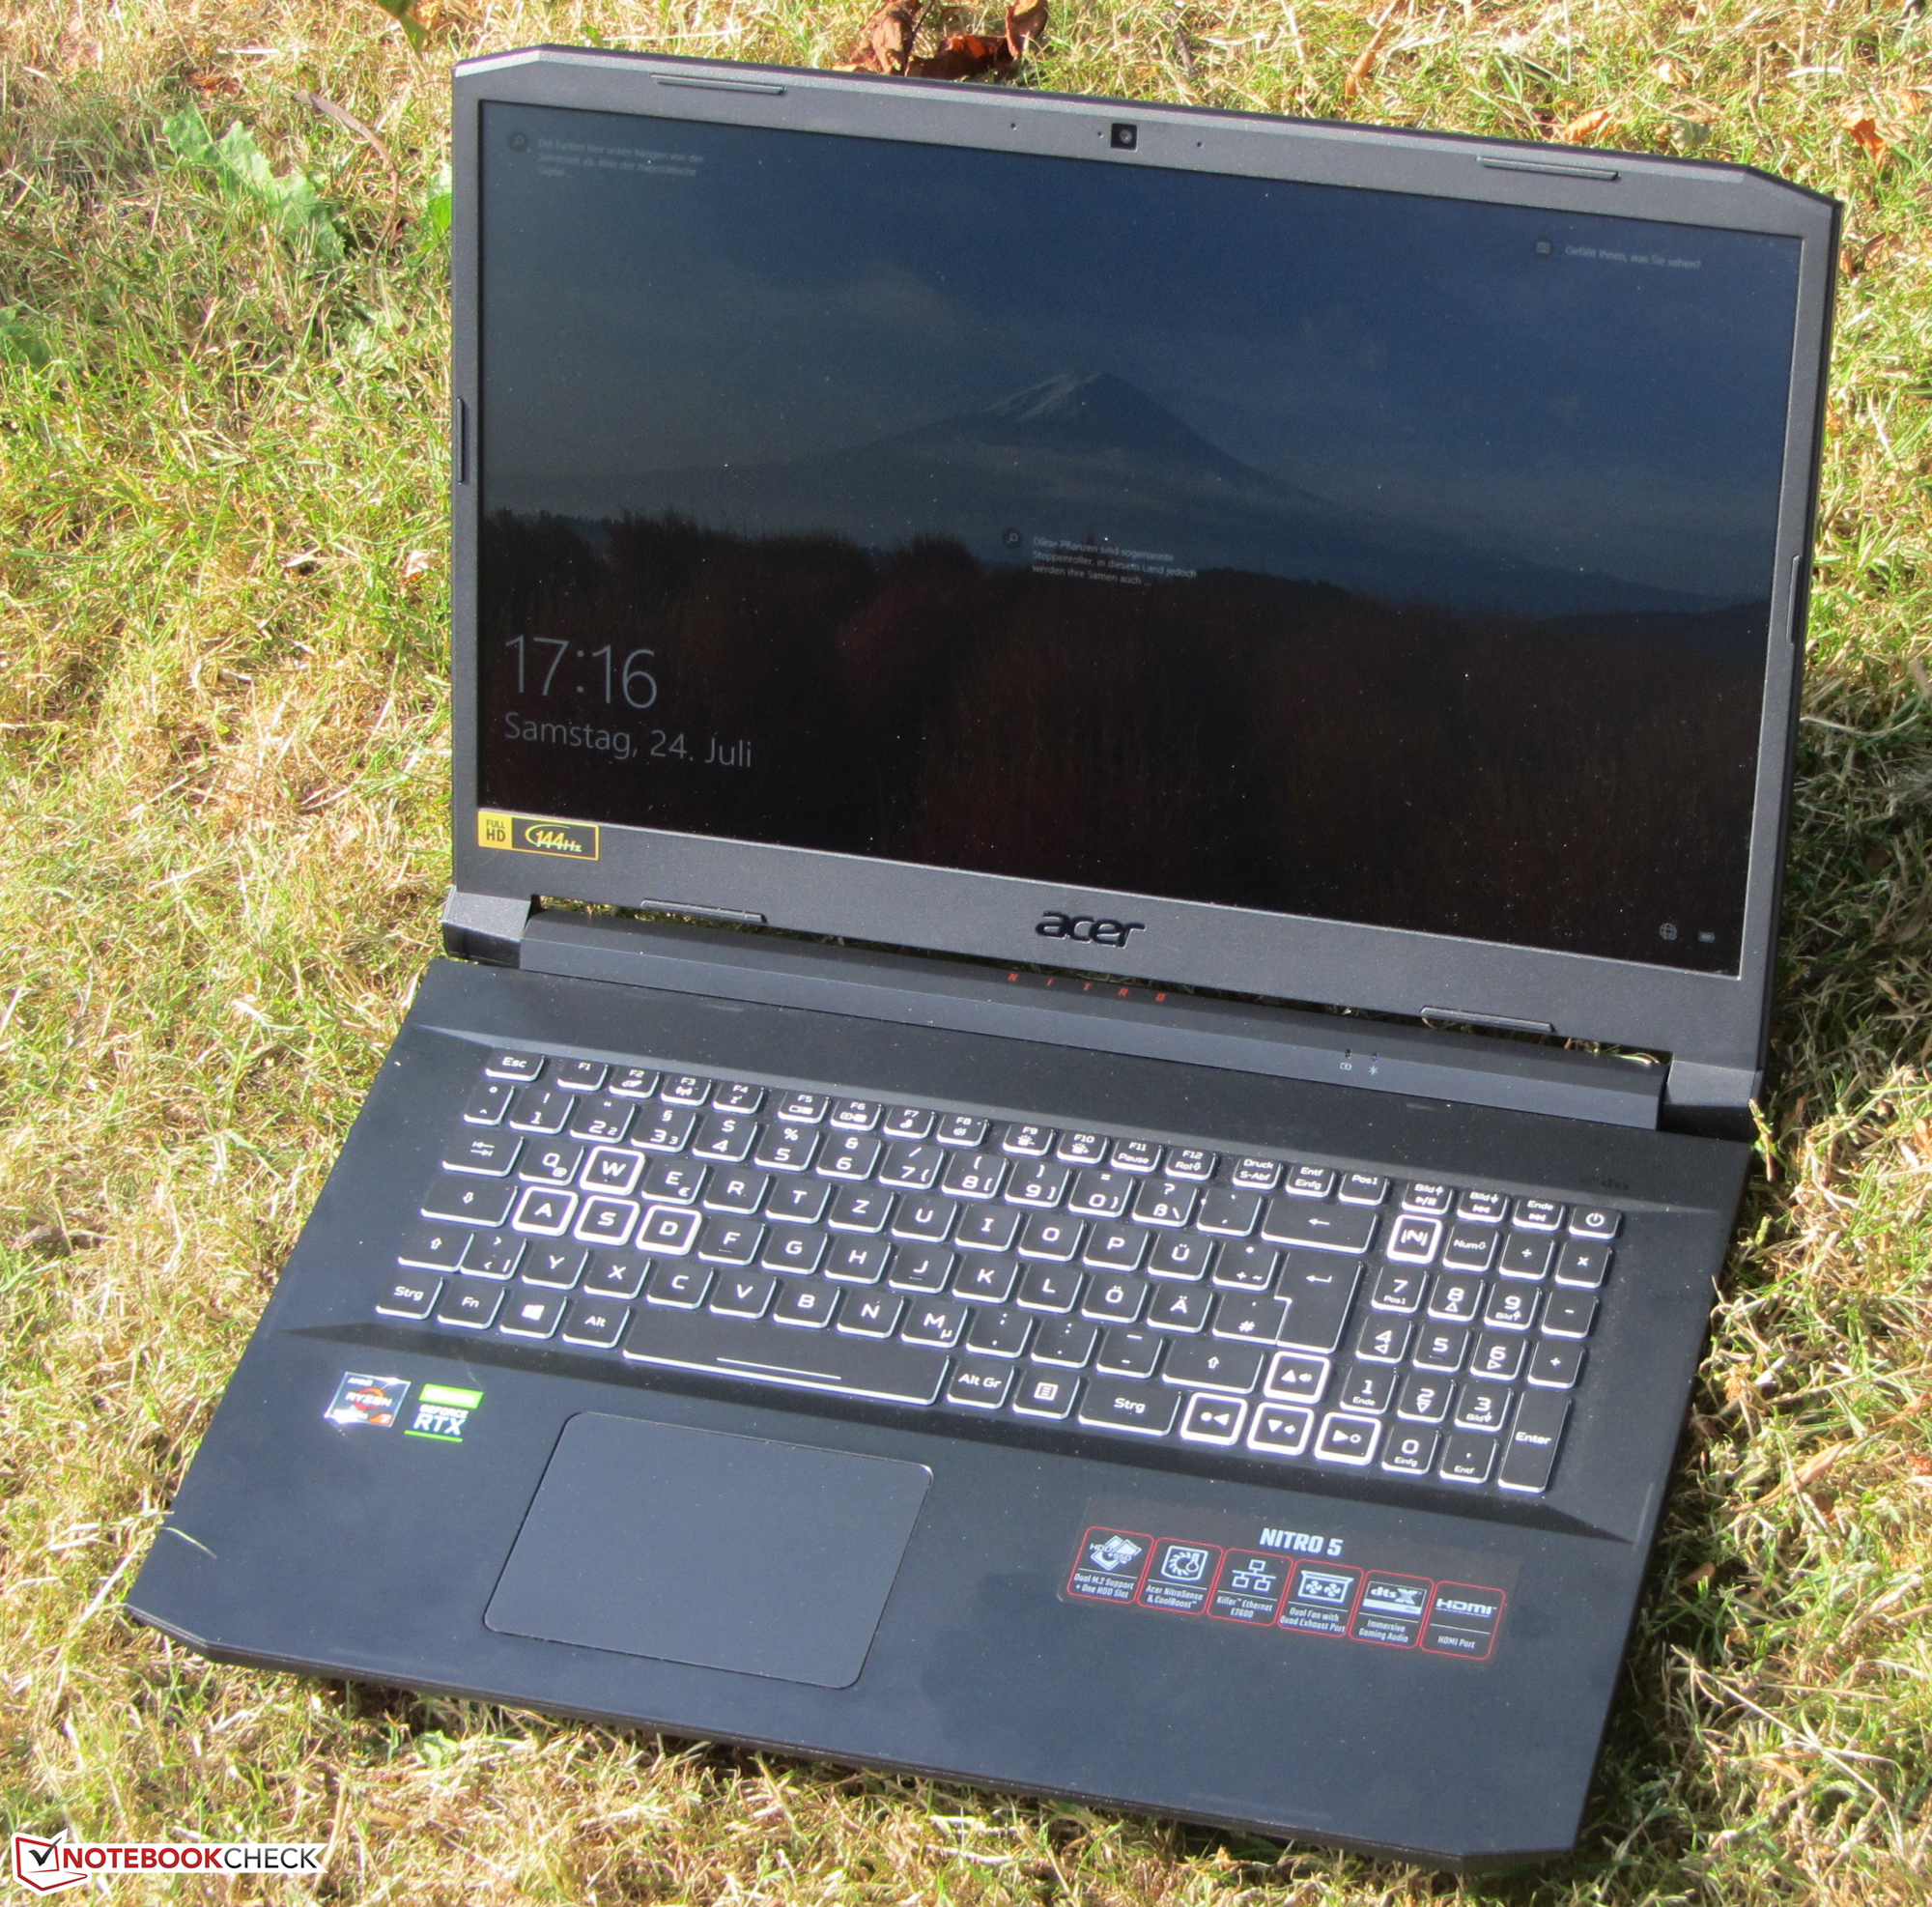
Case - Nitro 5 with plastic case
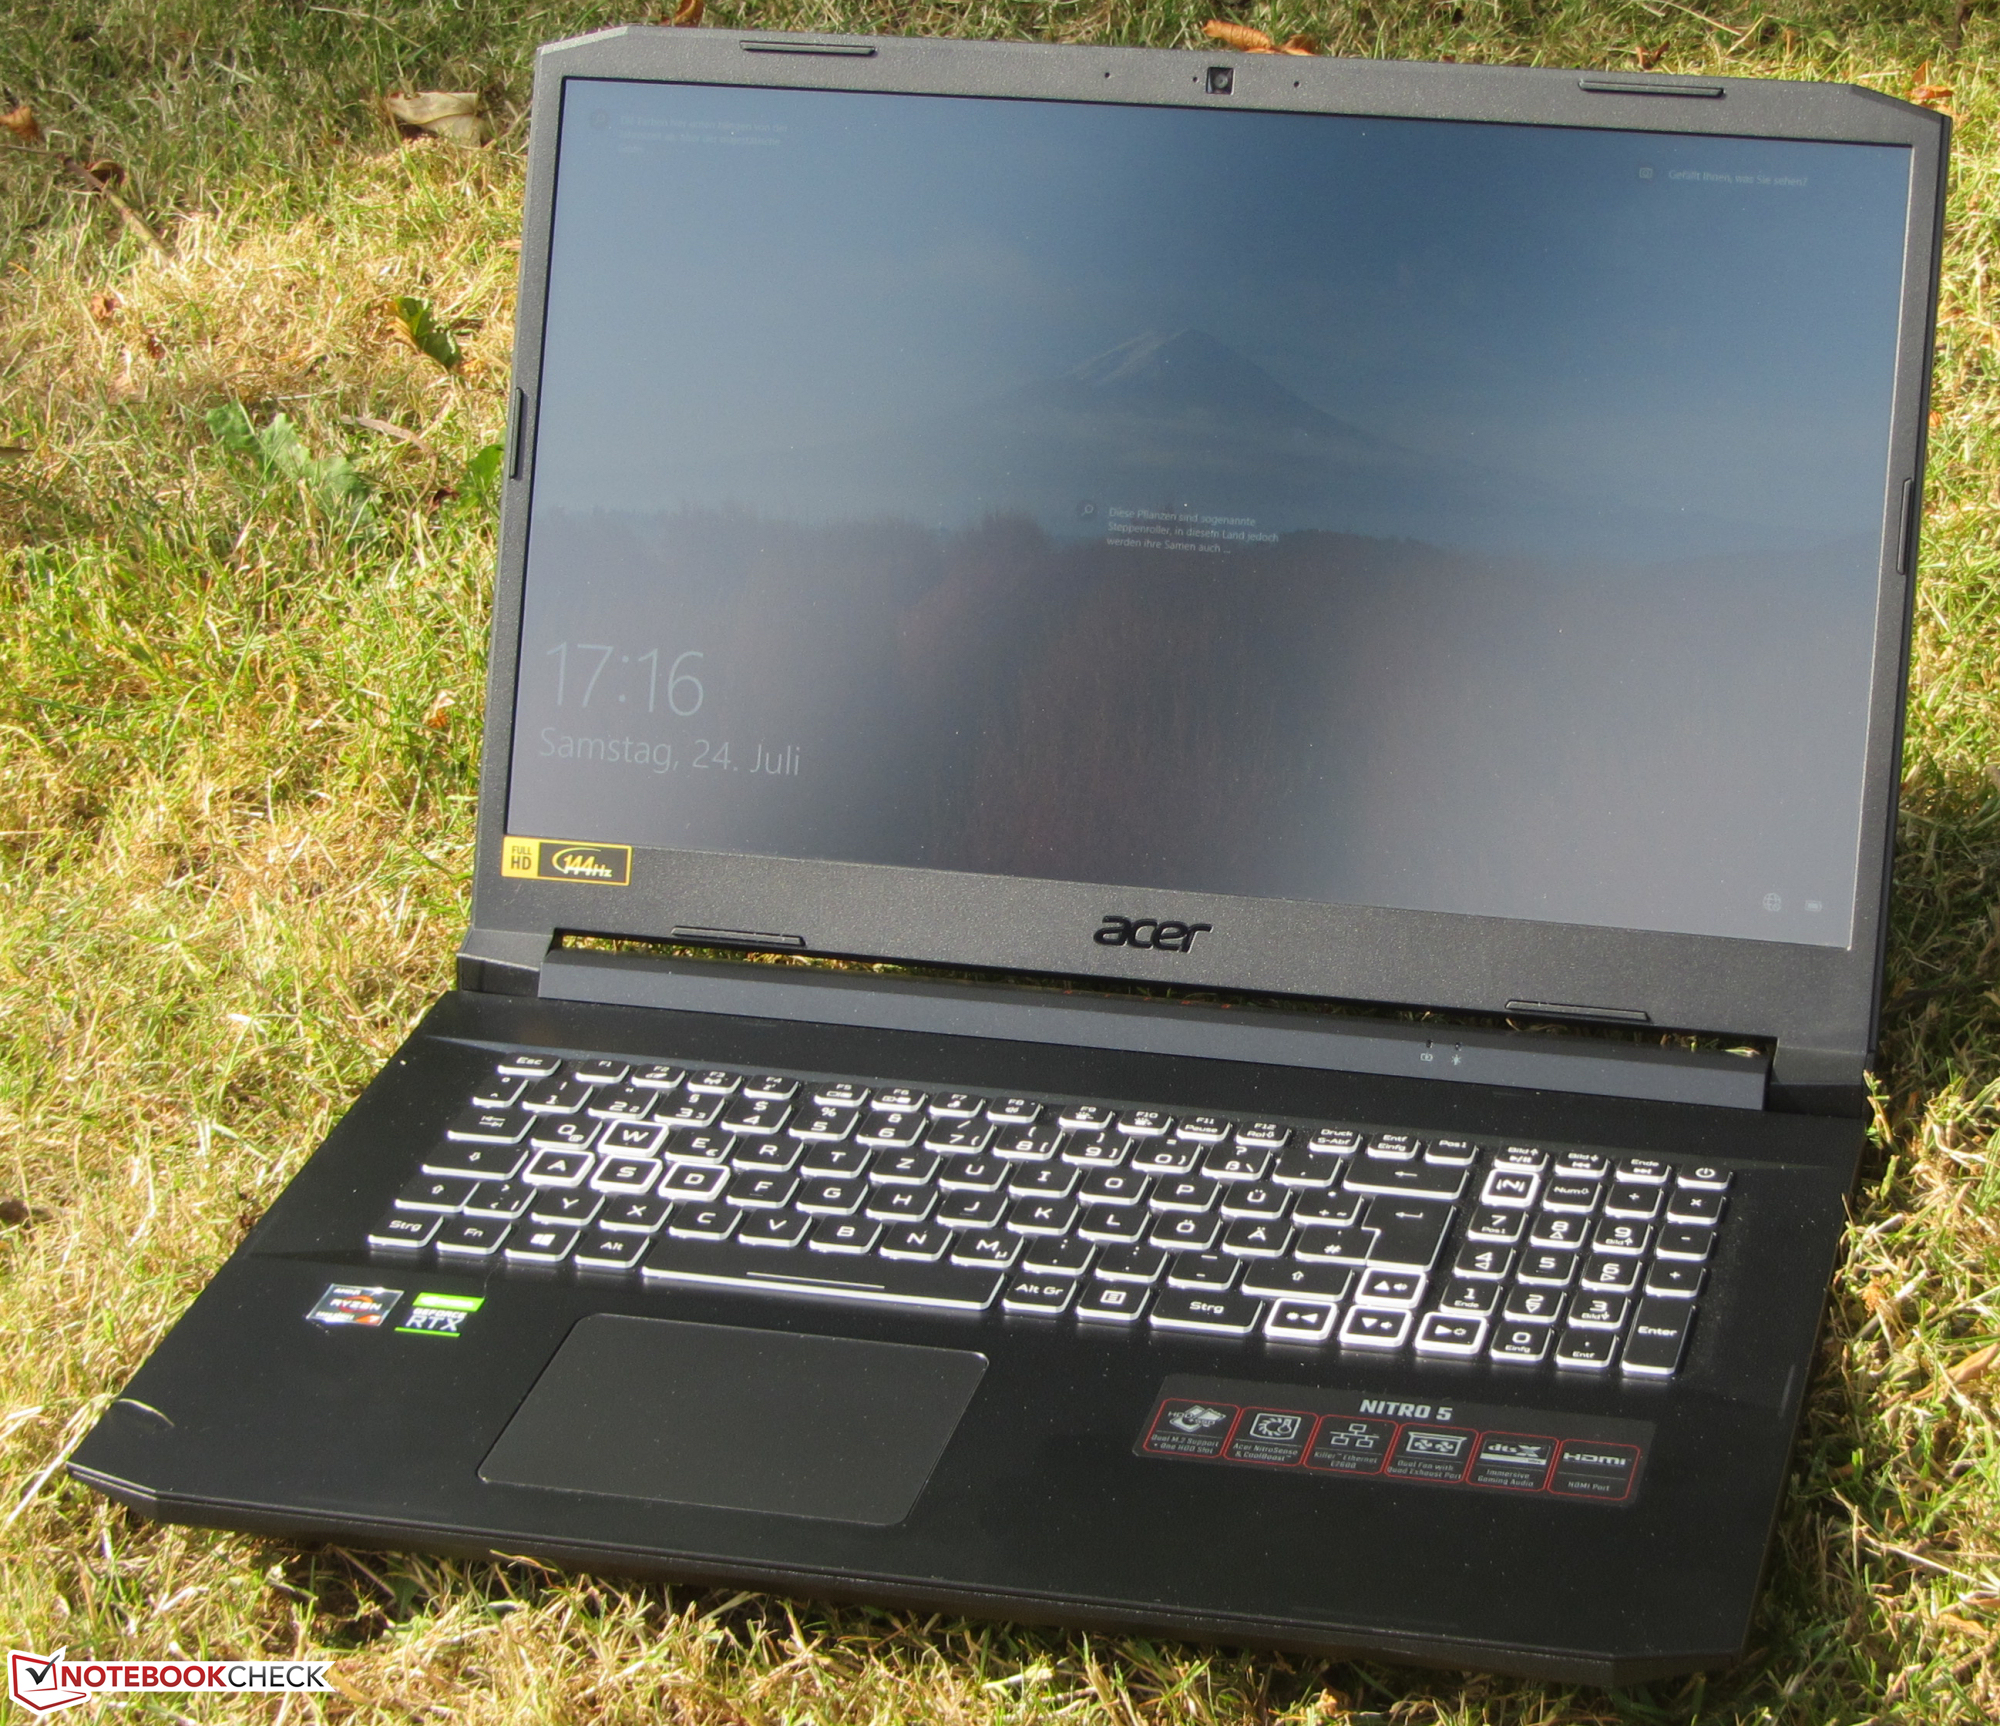
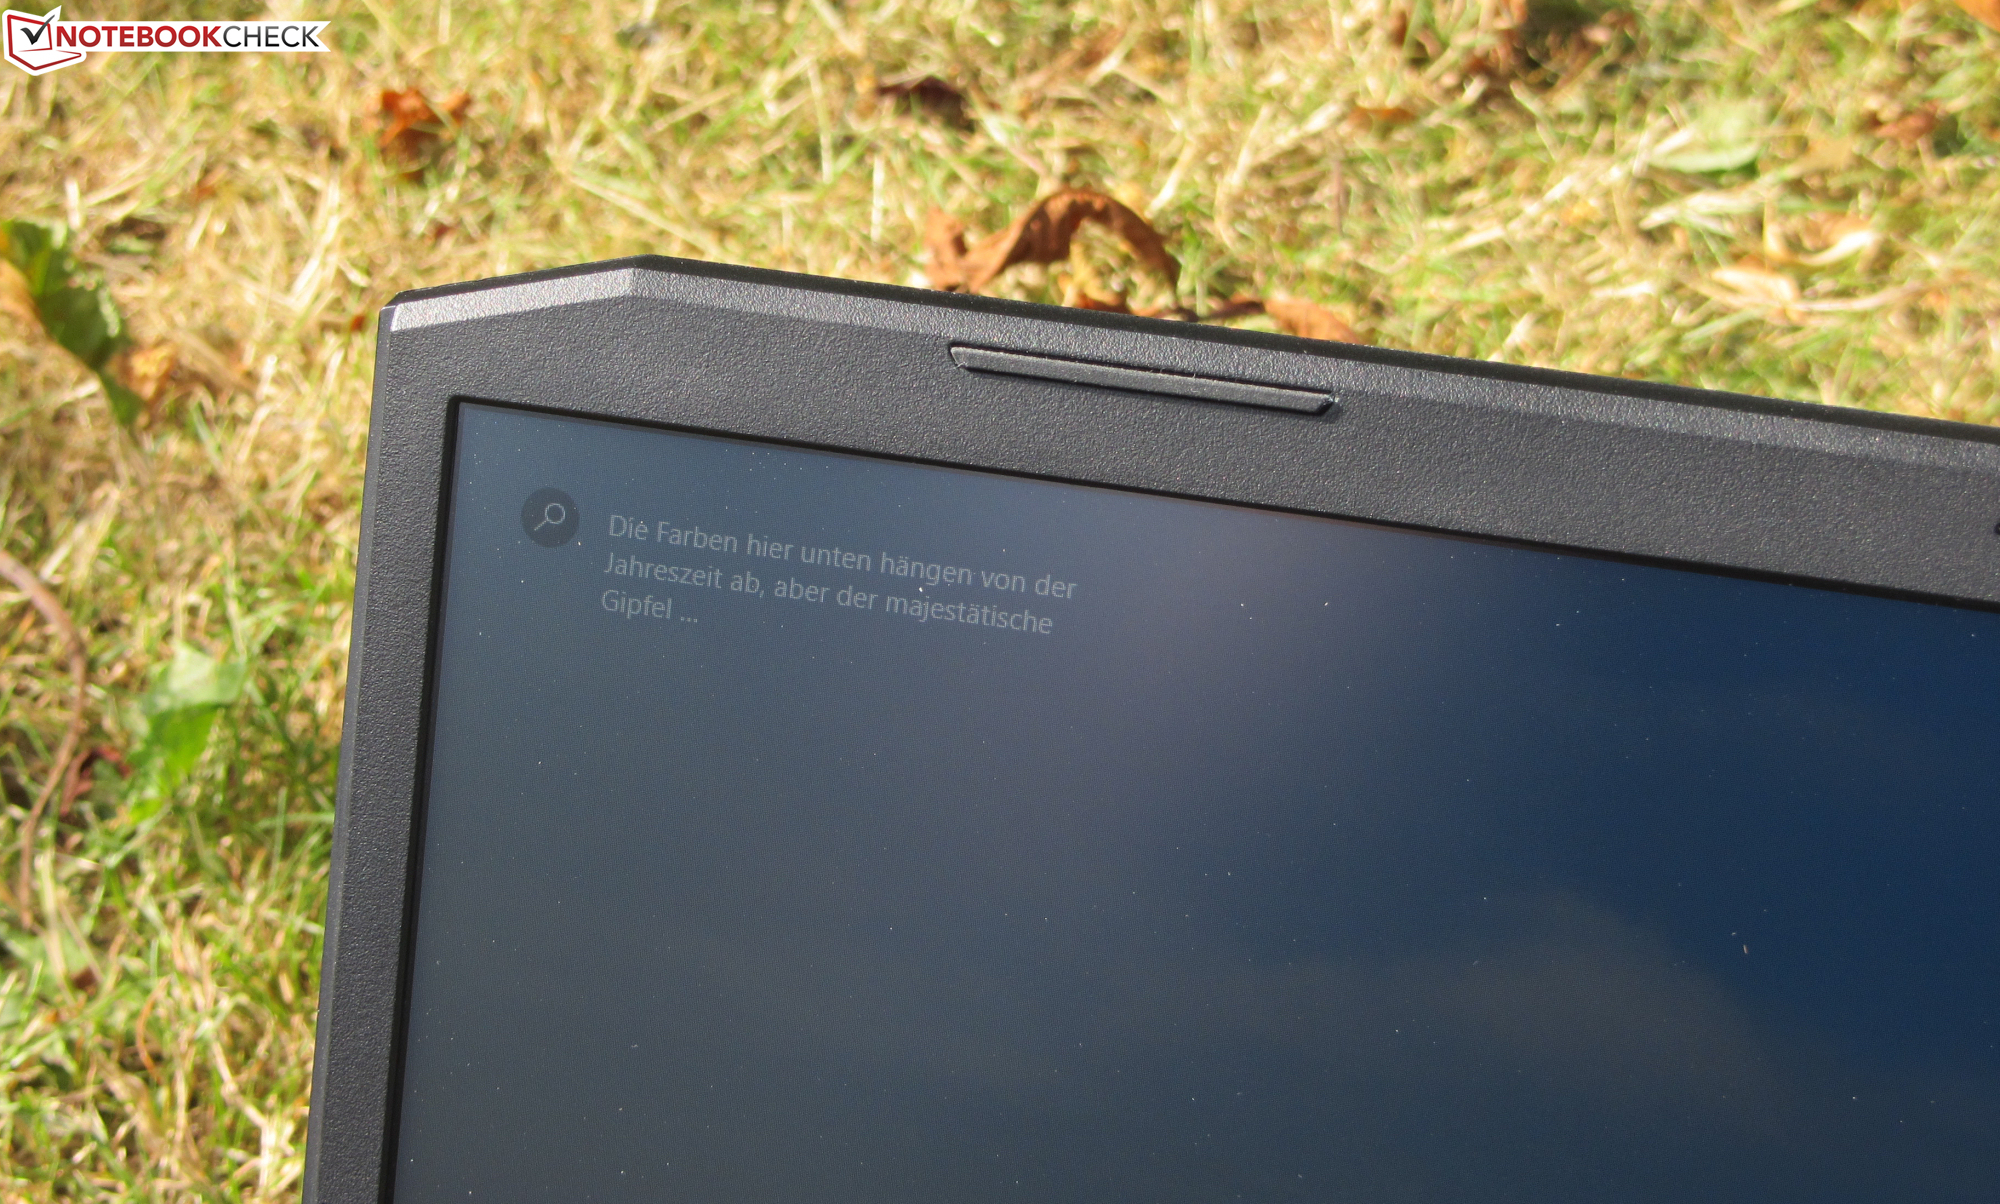
Acer does not use high-end looking case materials for the Nitro 5. The case is made of black plastic. The wine-red area between the rear air vents and the red "Nitro" lettering on the hinge cover add a bit of color. The smooth surfaces of the chassis are quite susceptible to fingerprints. There is no maintenance hatch. The battery is screwed inside.
The computer doesn't reveal any workmanship flaws. The gaps are correct and there are no material protrusions. There is room for improvement in terms of stability and stiffness: The base unit and especially the lid can be twisted a bit too much. Pressure on the lid's back doesn't lead to image changes. The hinges keep the lid firmly in position. One-hand opening of the lid is possible.
Within our comparison field, the Nitro 5 and the MSI GP76 are the largest devices in terms of surface area. In terms of weight, most notebooks are on par. The Schenker XMG Core 17 (Early 2021) is considerably more compact and lighter than the competition, while the MSI GP76 weighs the most.
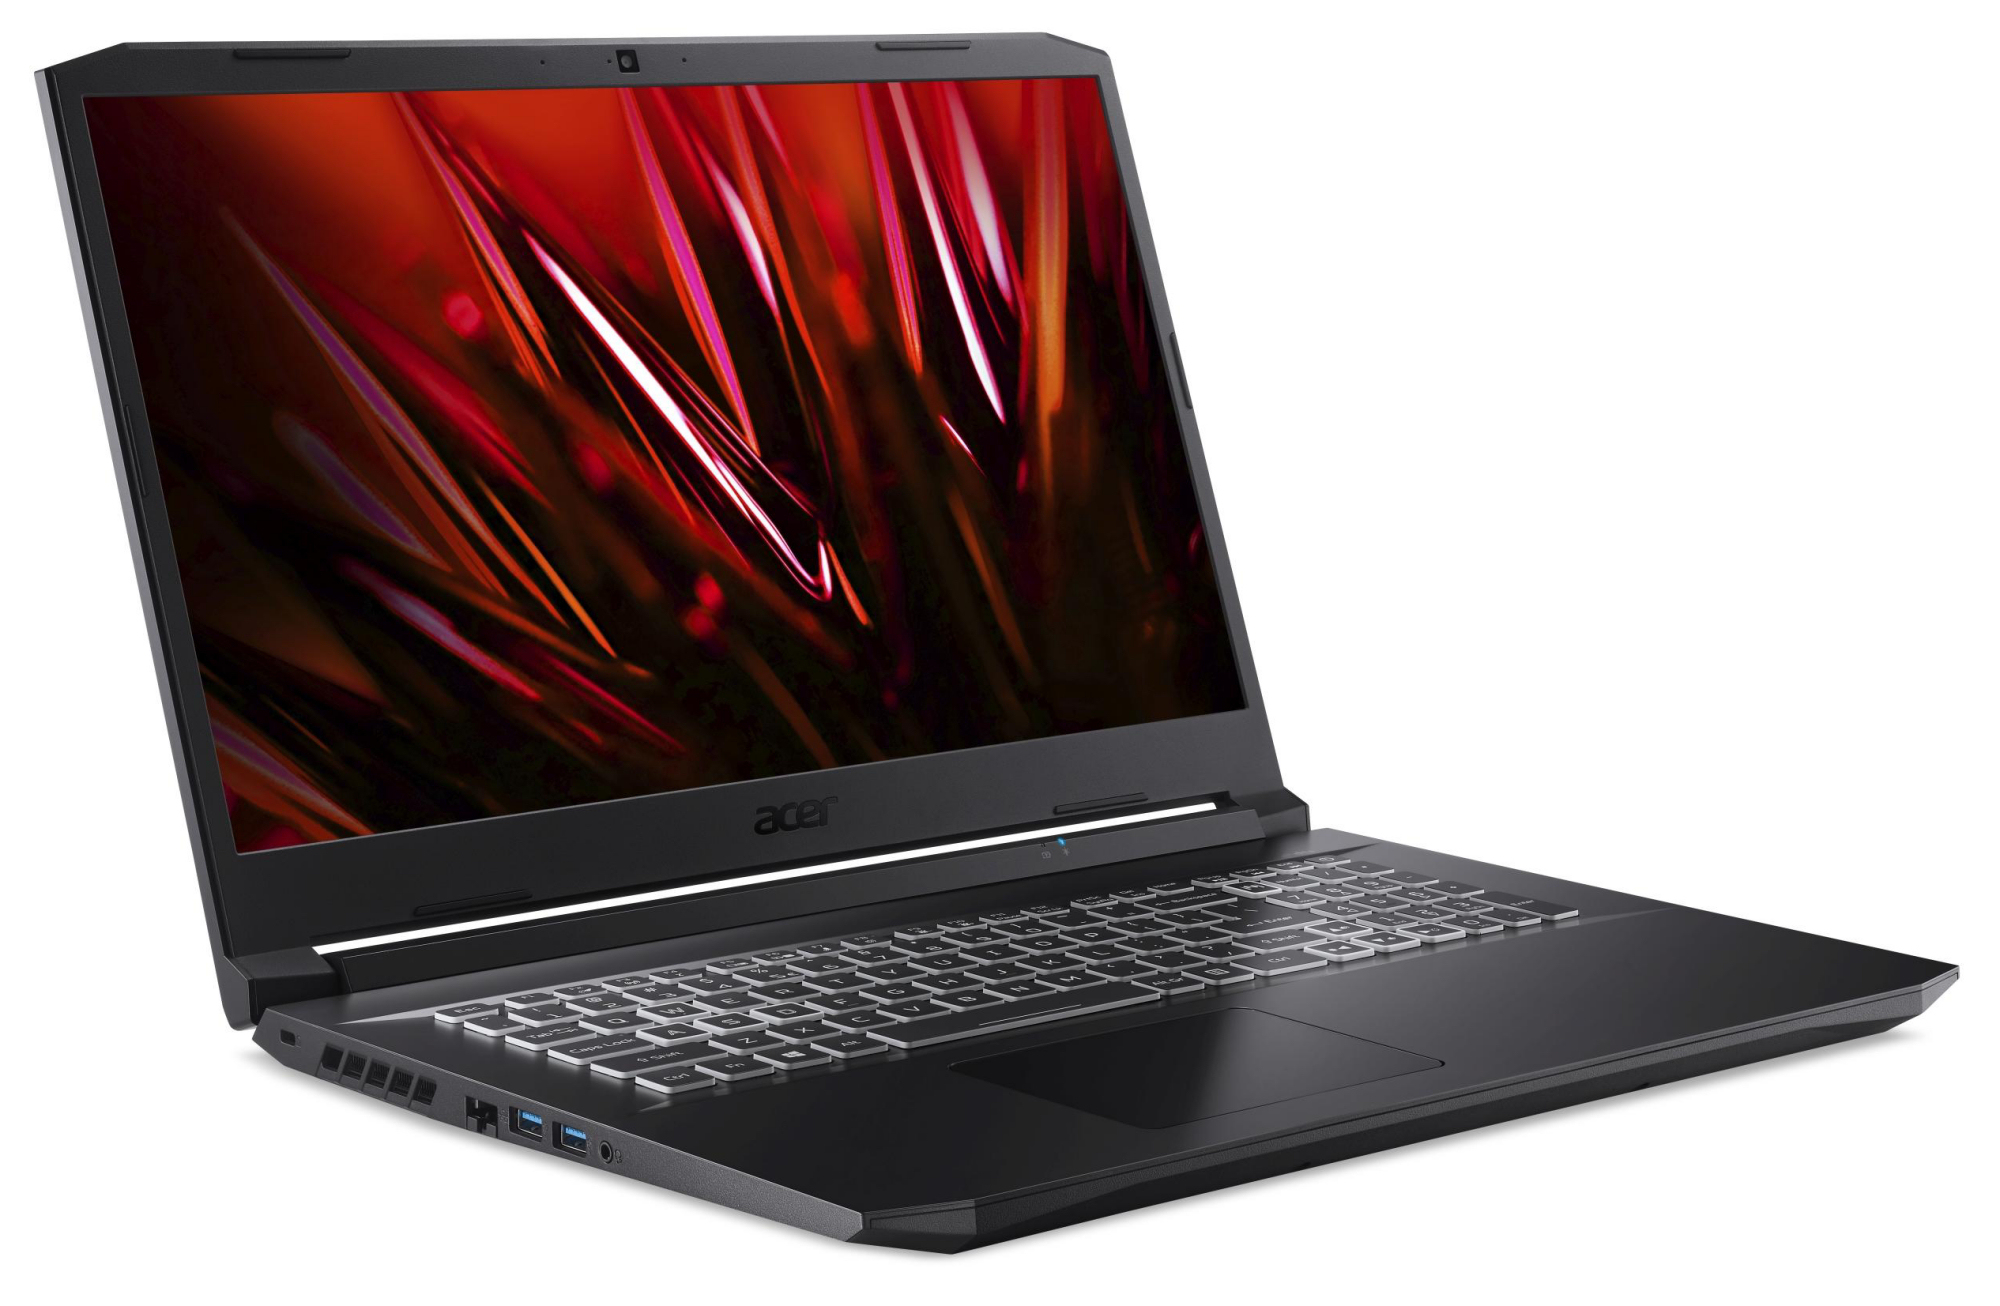
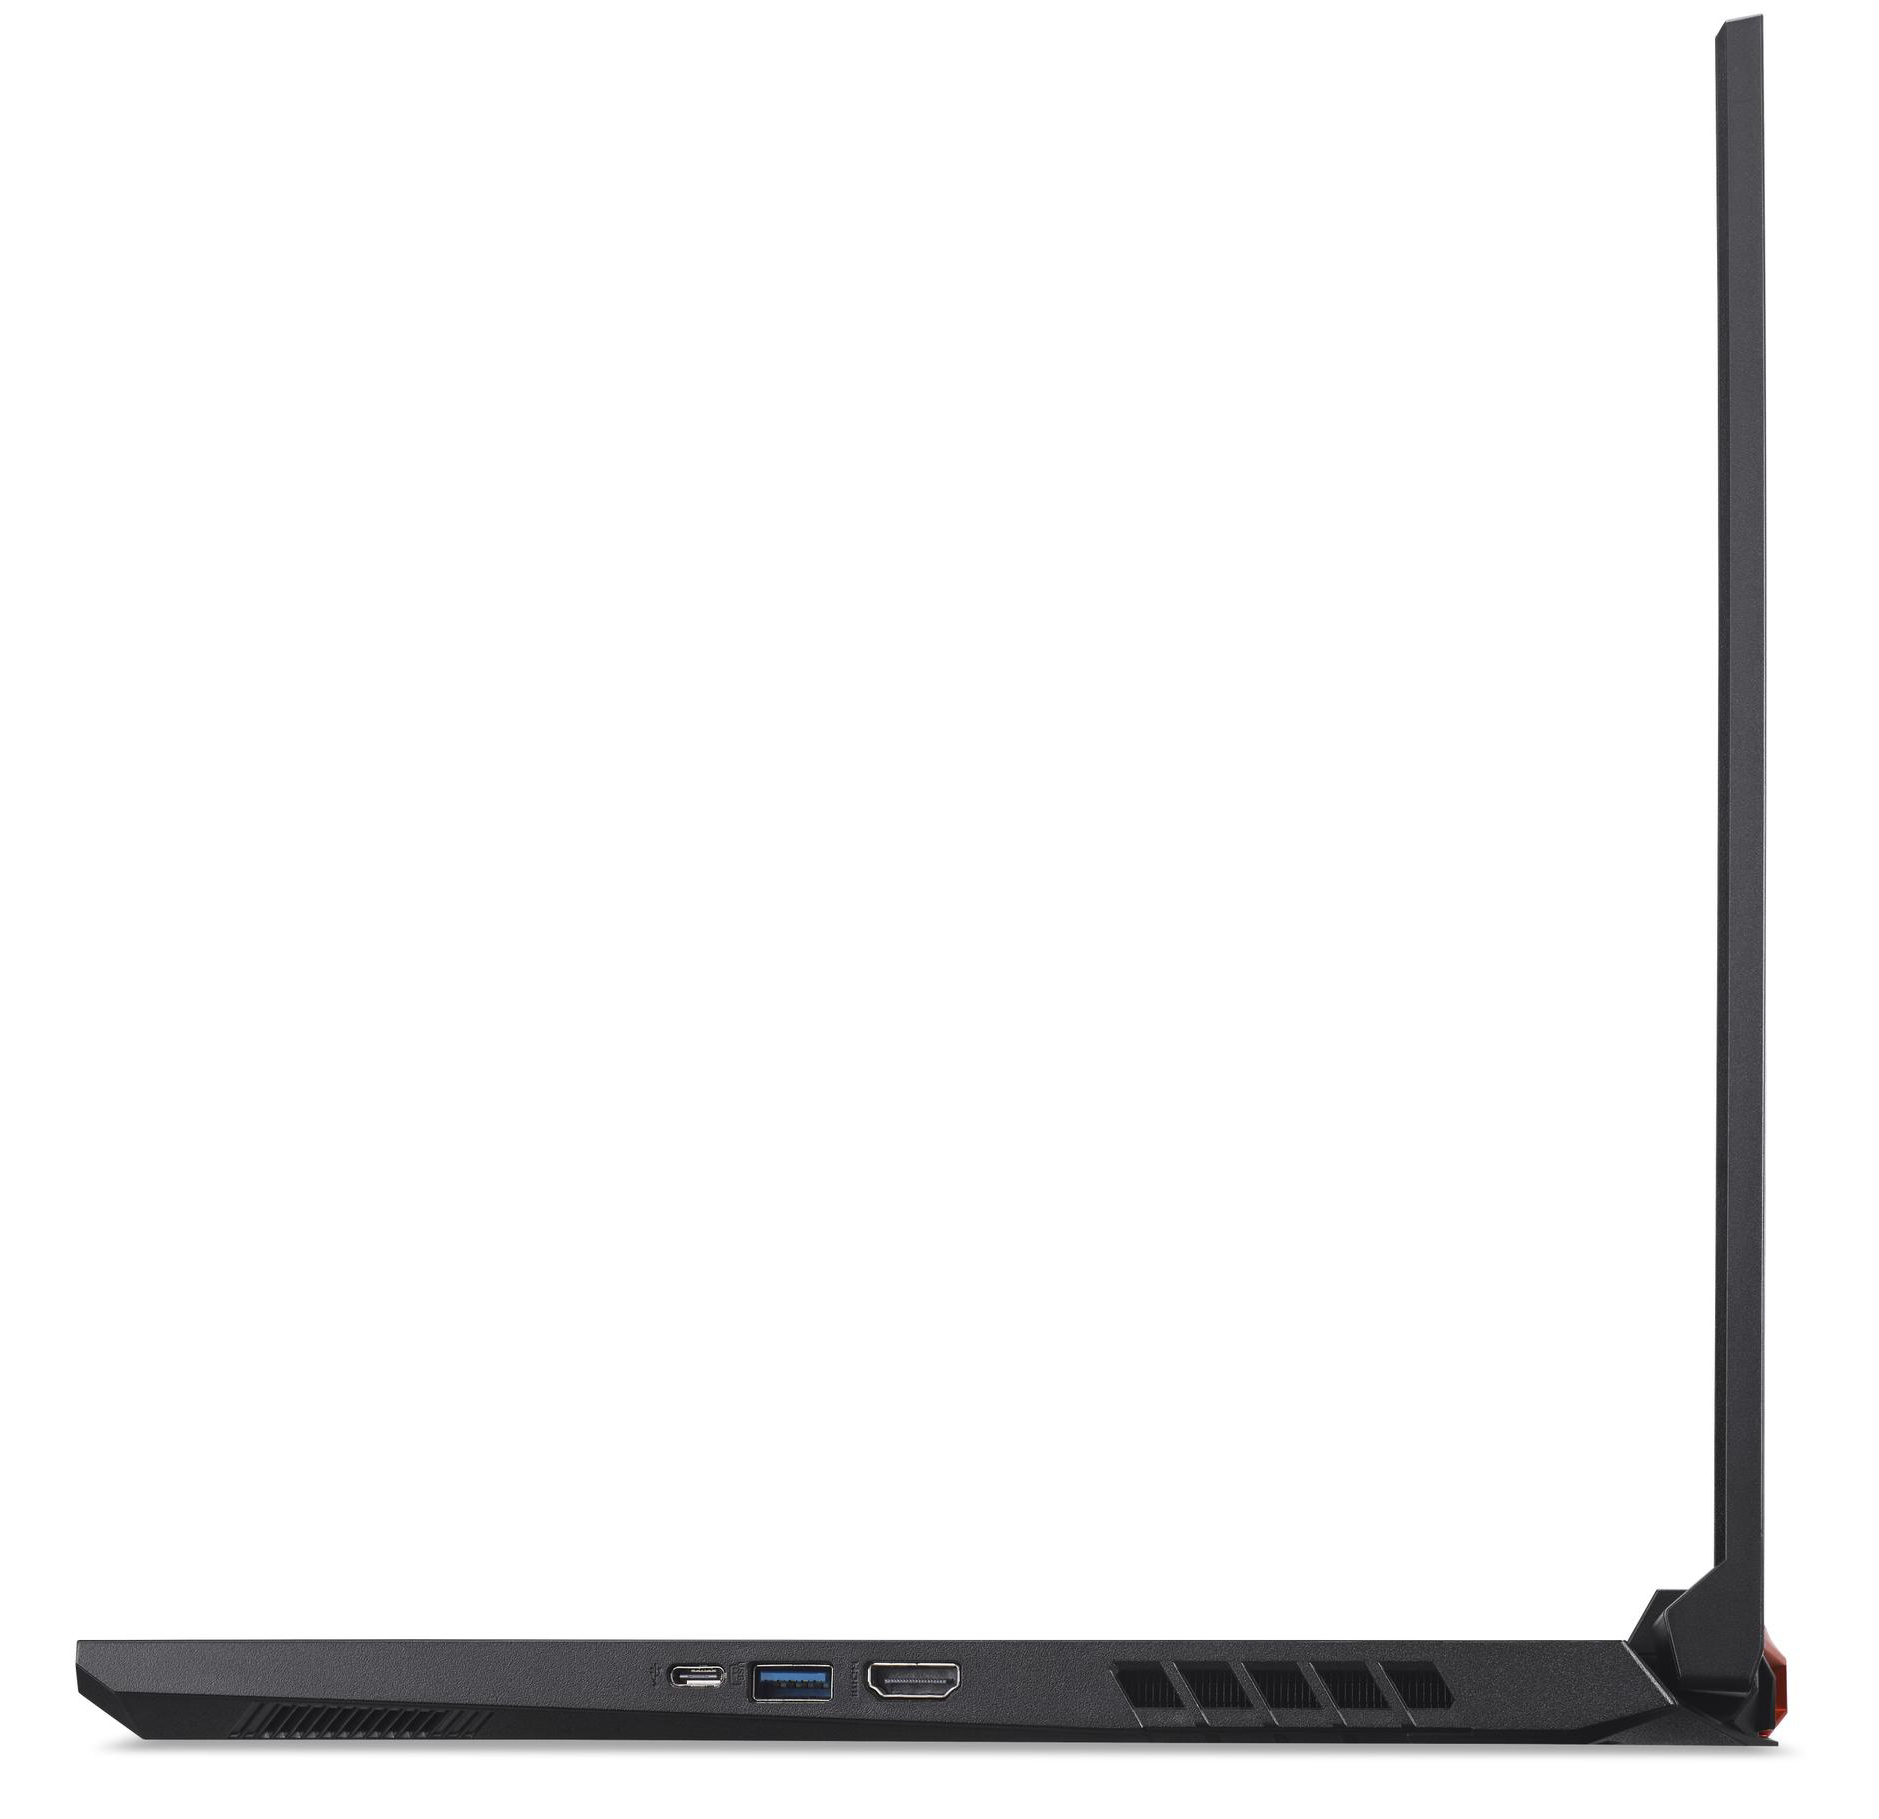
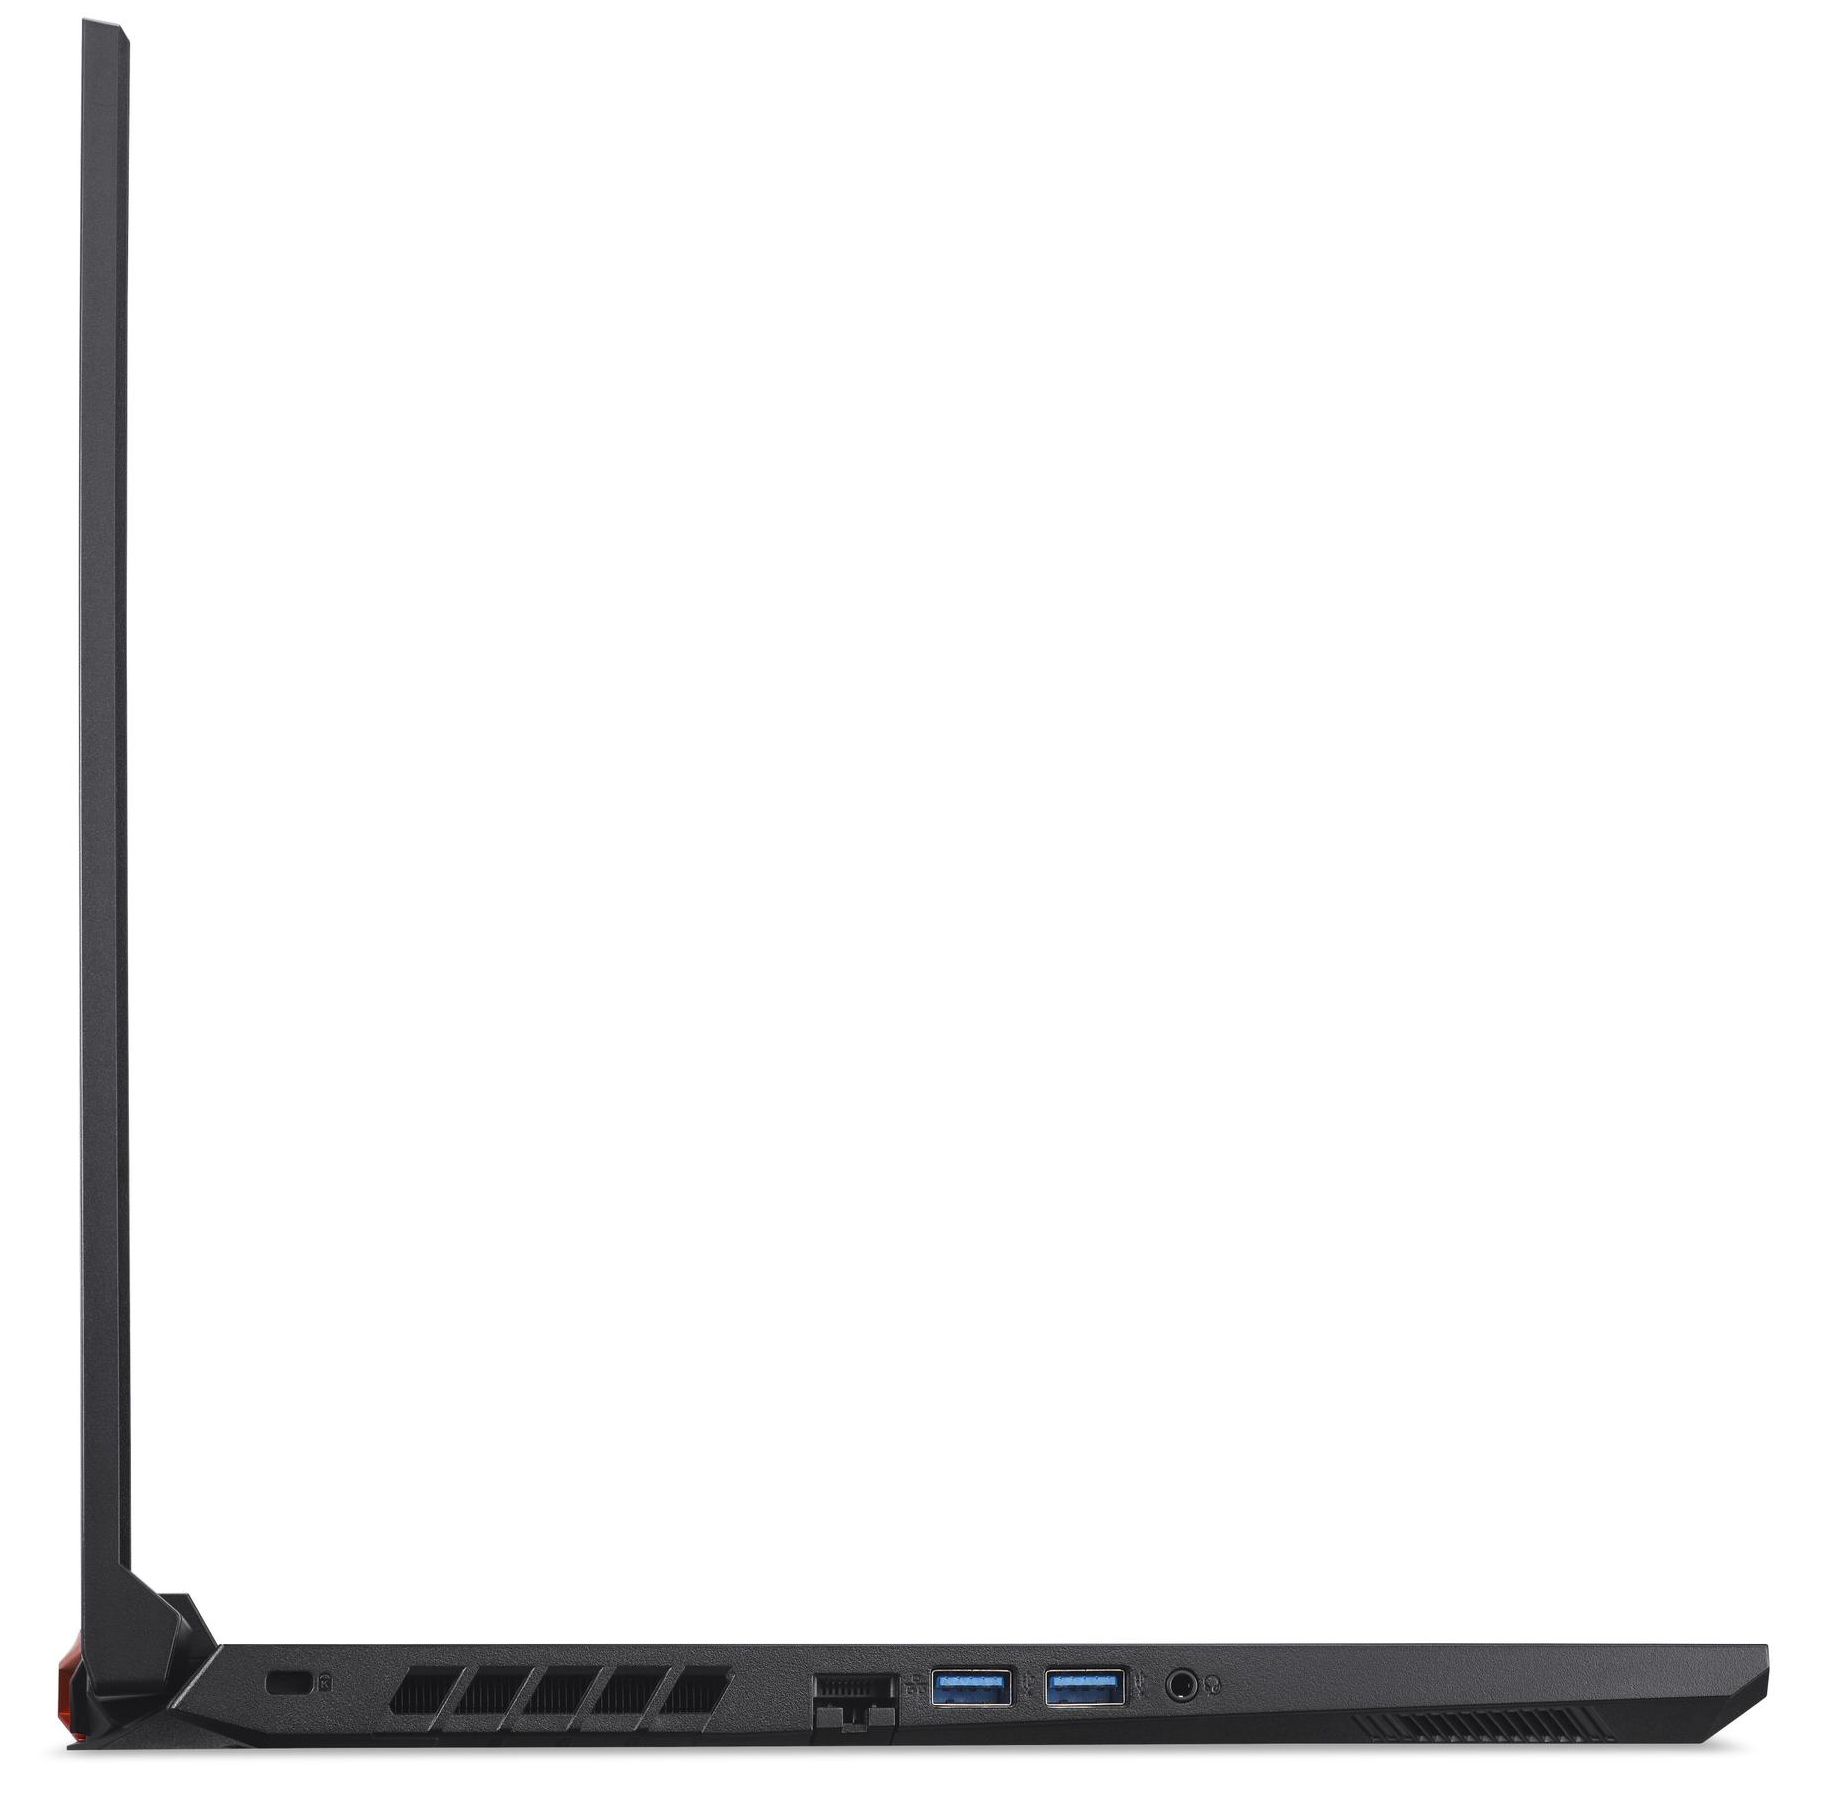
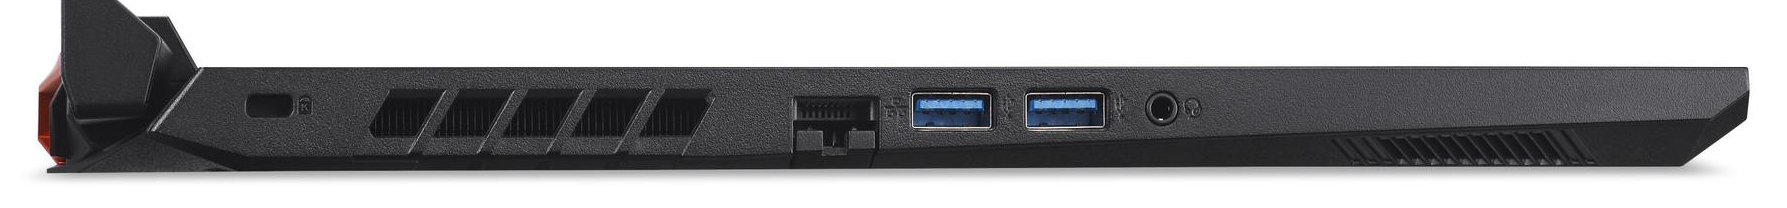
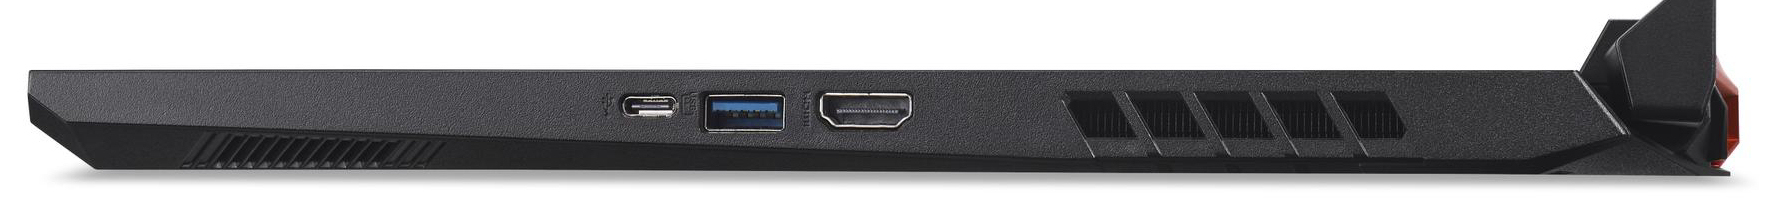
Equipment - the Acer computer does not have Thunderbolt to offer
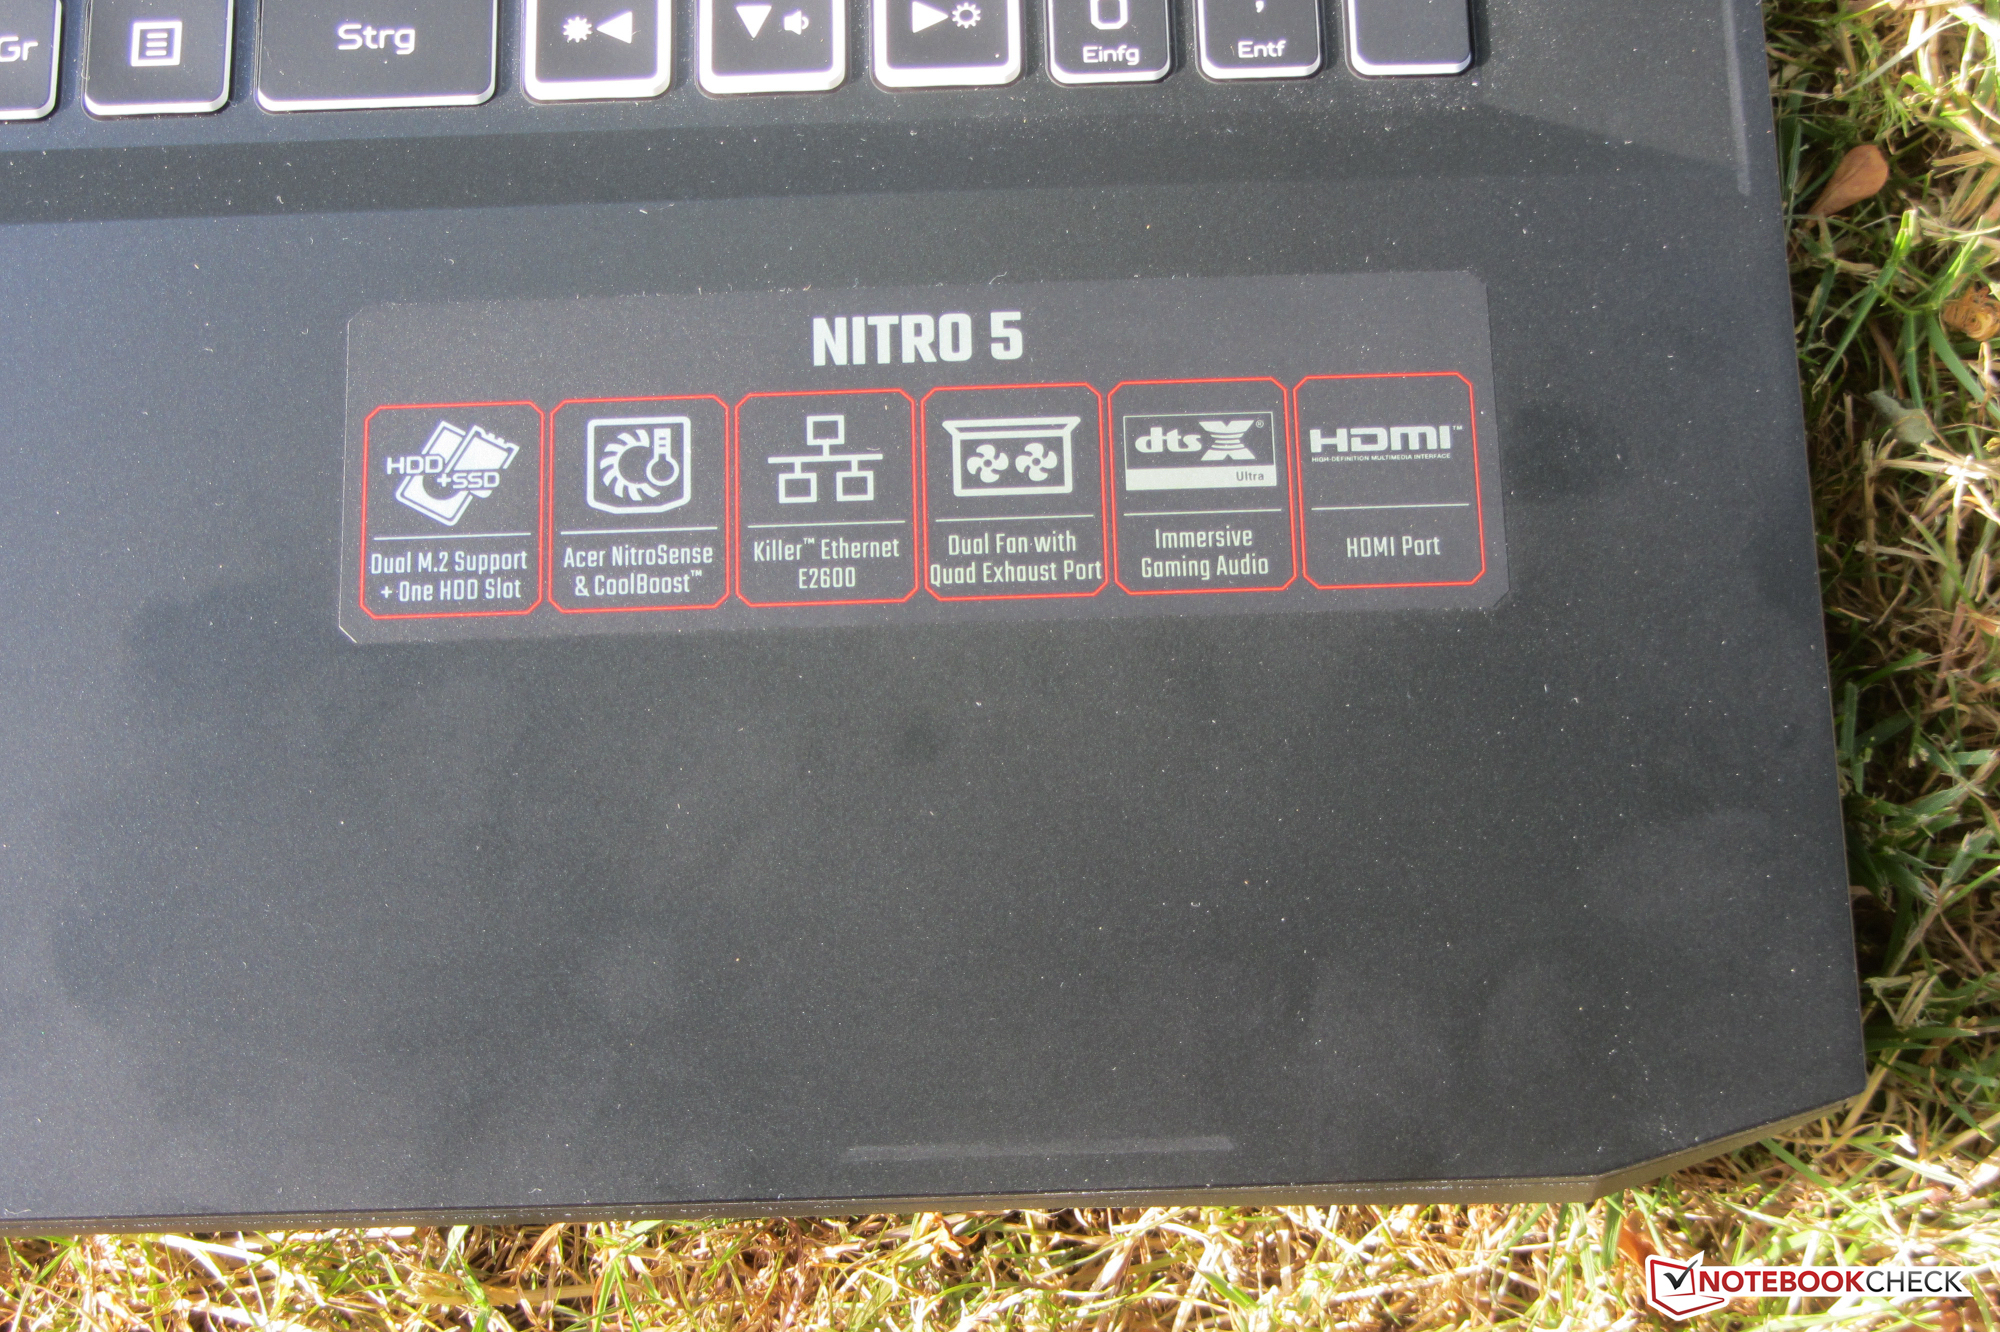
The Nitro offers three USB-A ports (2x USB 3.2 Gen 1, 1x USB 3.2 Gen 2) and one USB-C port (USB 3.2 Gen 2). The latter does not support PowerDelivery or Displayport-per-USB-C. Thus, there is only one video output with the HDMI port. Acer has not equipped the notebook with a memory card reader.
Communication
The WLAN chip (Mediatek MT7921) supports the 802.11ax standard and offers Bluetooth 5 functionality. The data rates determined under optimal conditions (no other WLAN devices in the near vicinity, small distance between notebook and server PC) fall short of the chip's capabilities. We suspect a driver problem. Wired network connections are handled by a Killer E2600 Gigabit Ethernet controller. It performs its tasks smoothly.
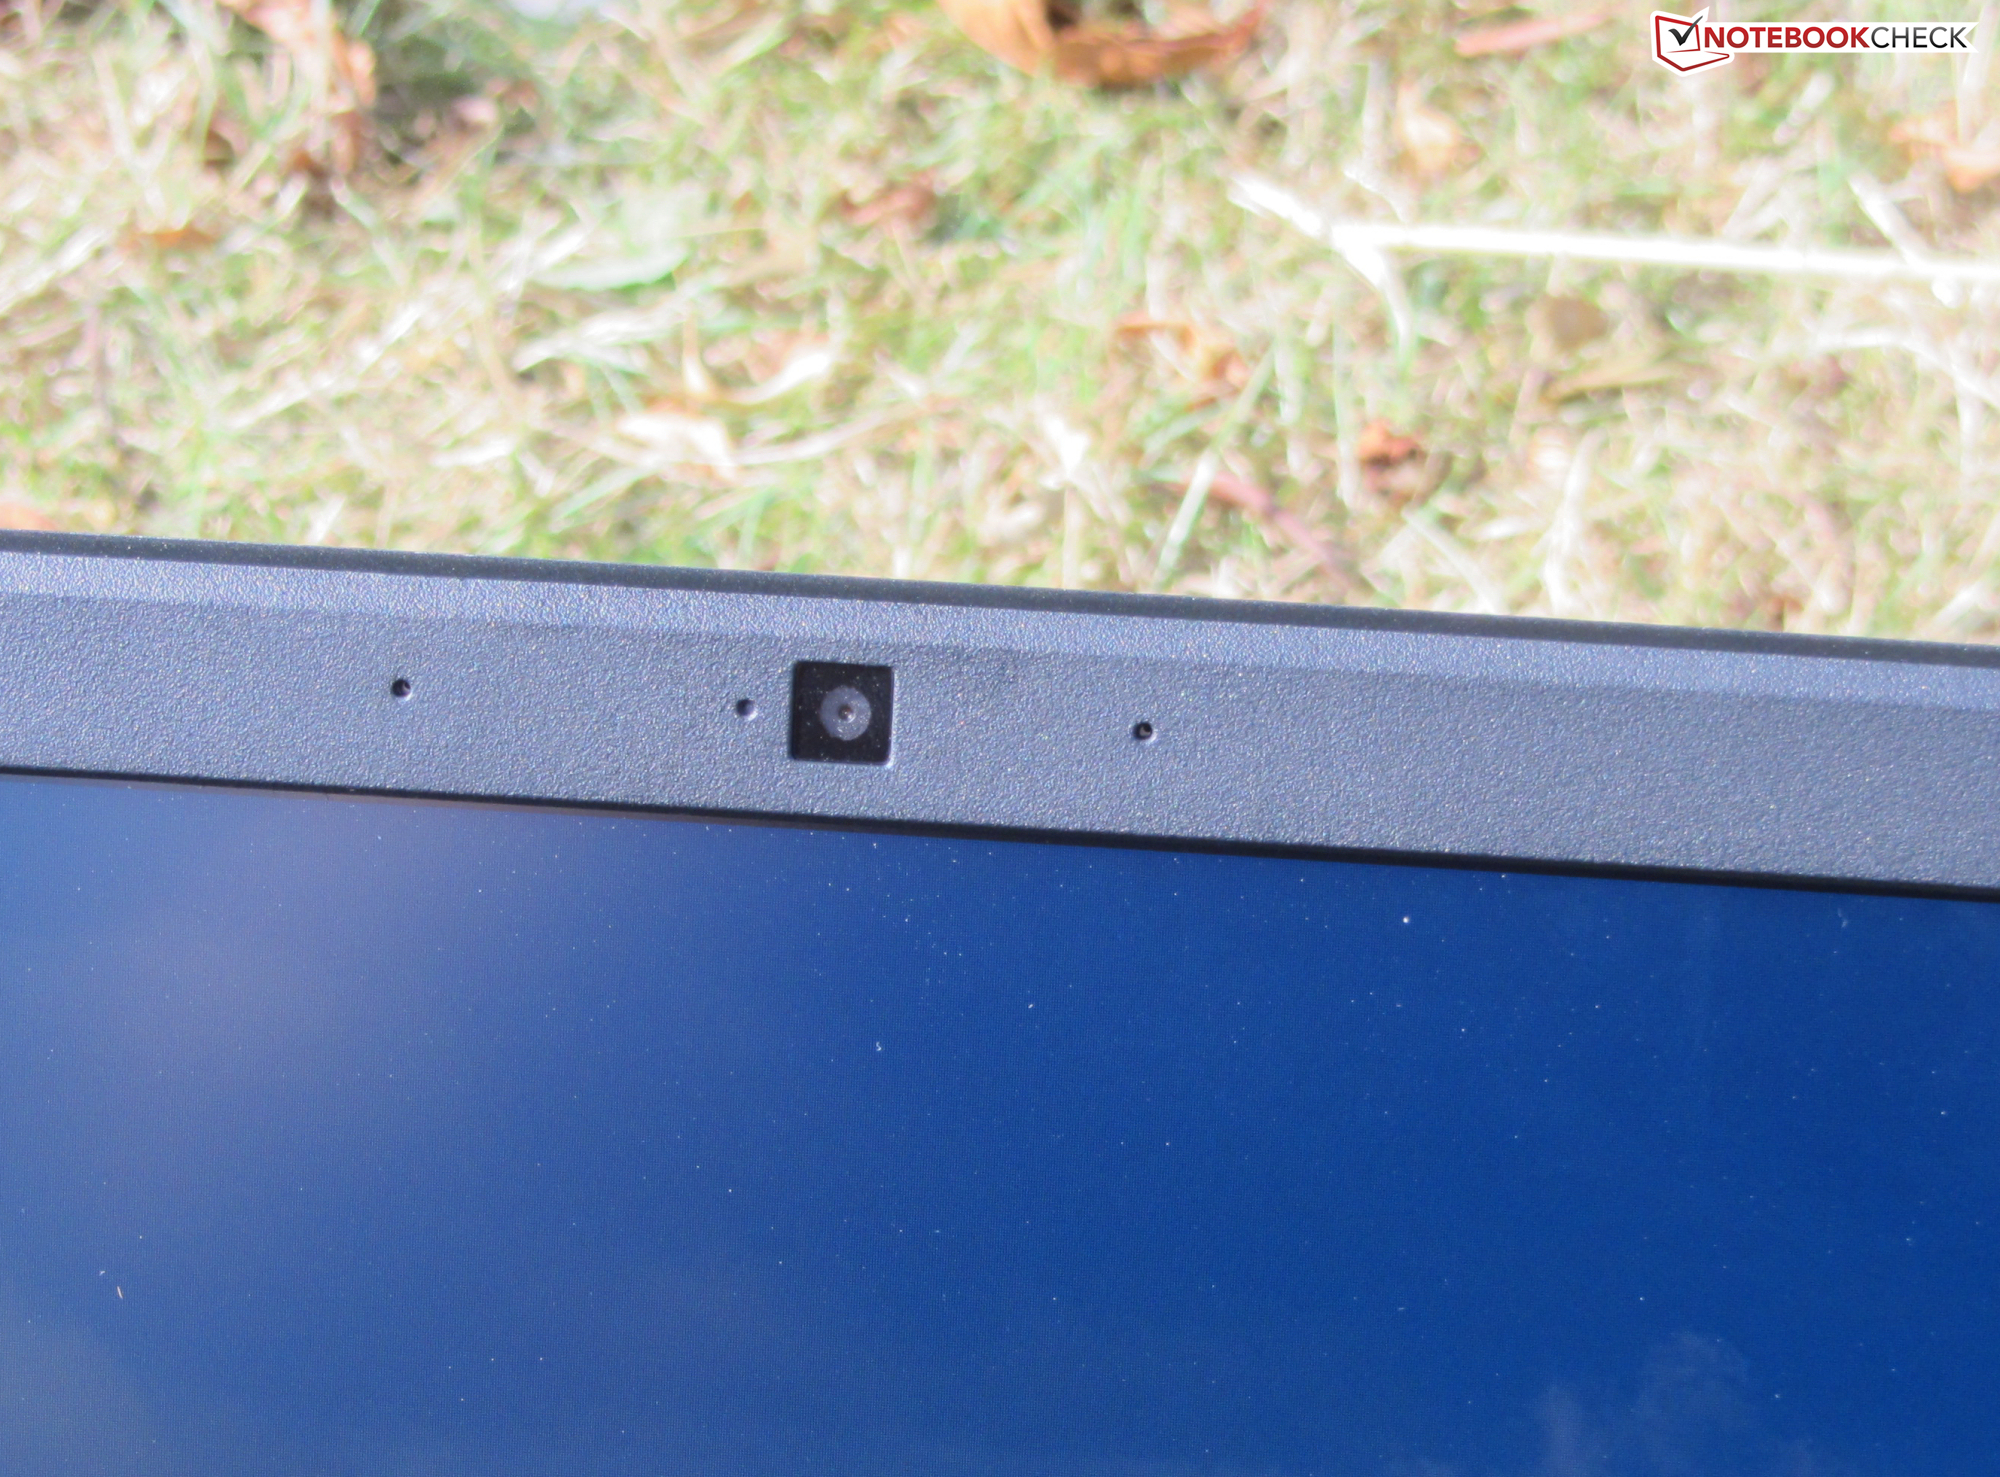
Webcam
The webcam (0.9 MP) produces pictures in a maximum resolution of 1,280 x 720 pixels. The color accuracy is a problem. With a deviation of almost 12, the target (DeltaE less than 3) is clearly missed.


Accessories
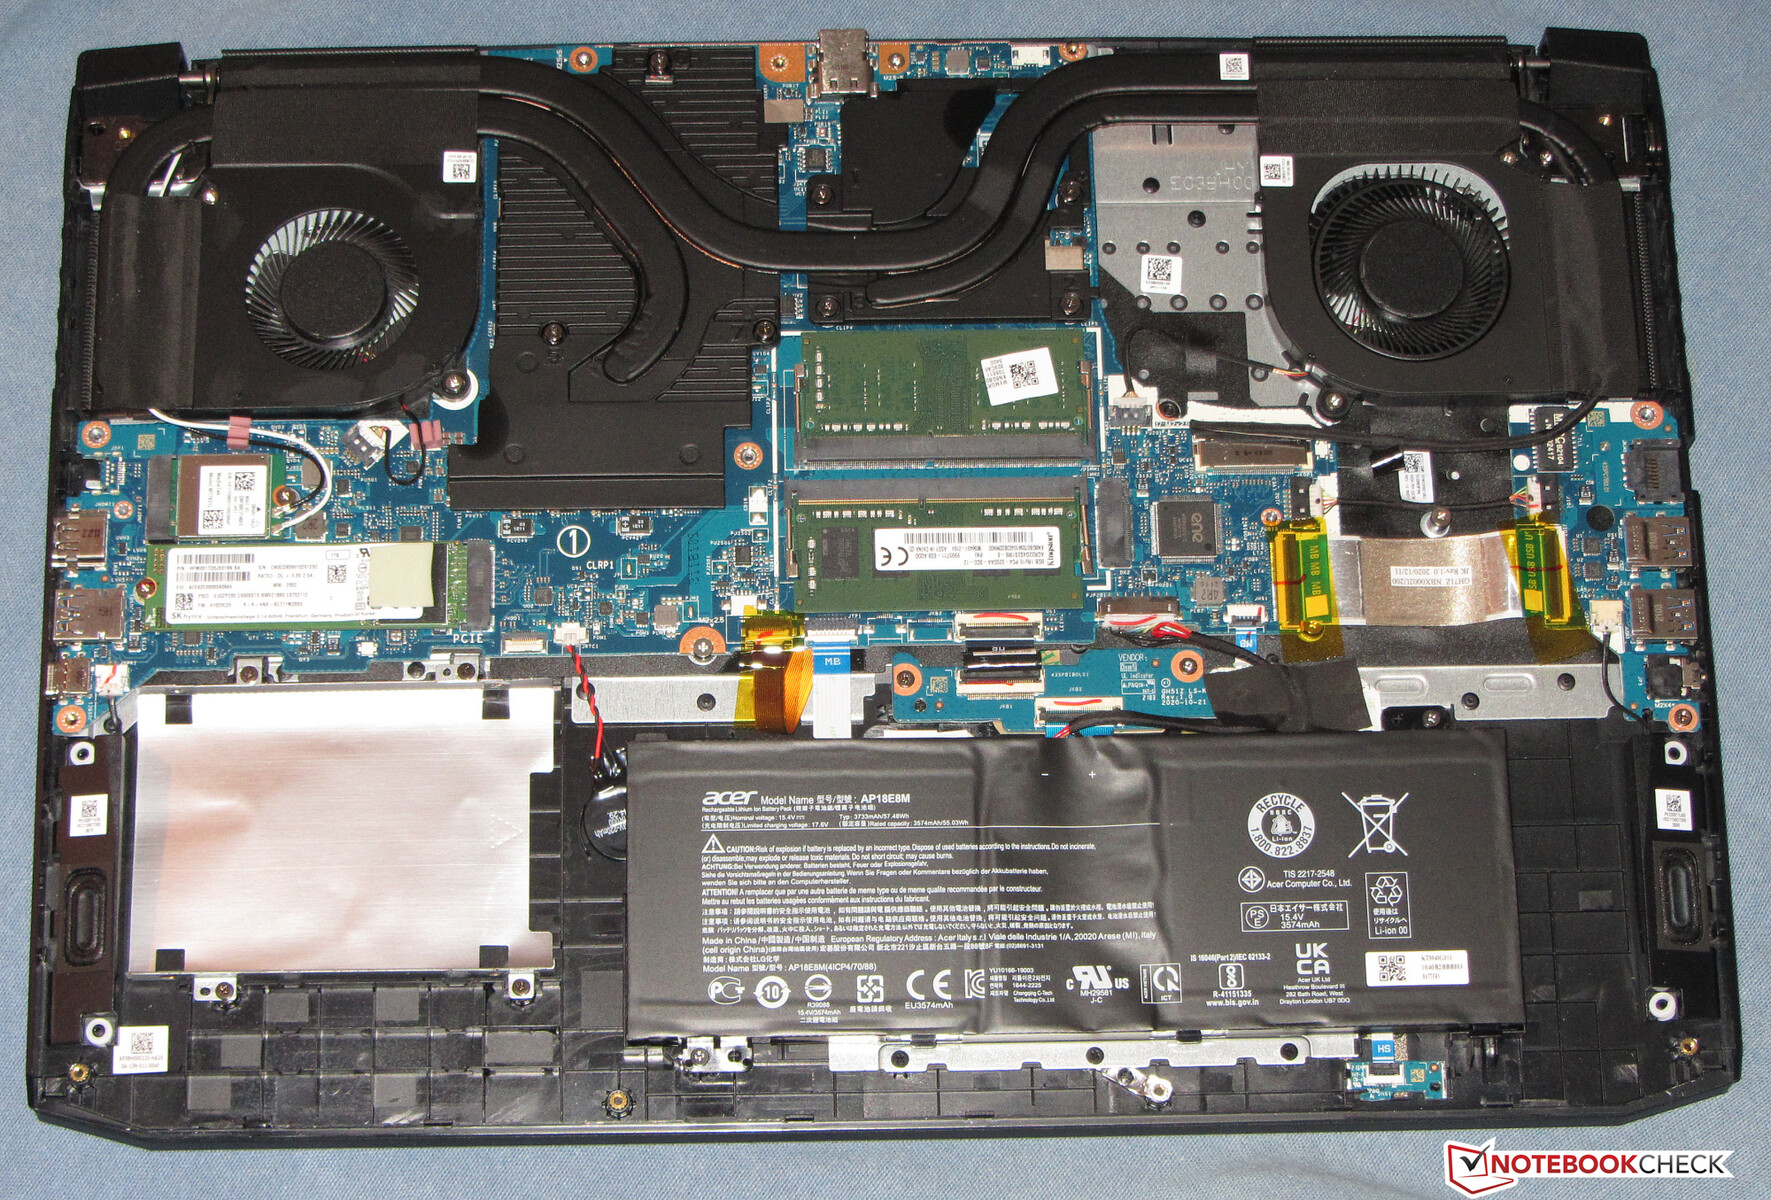
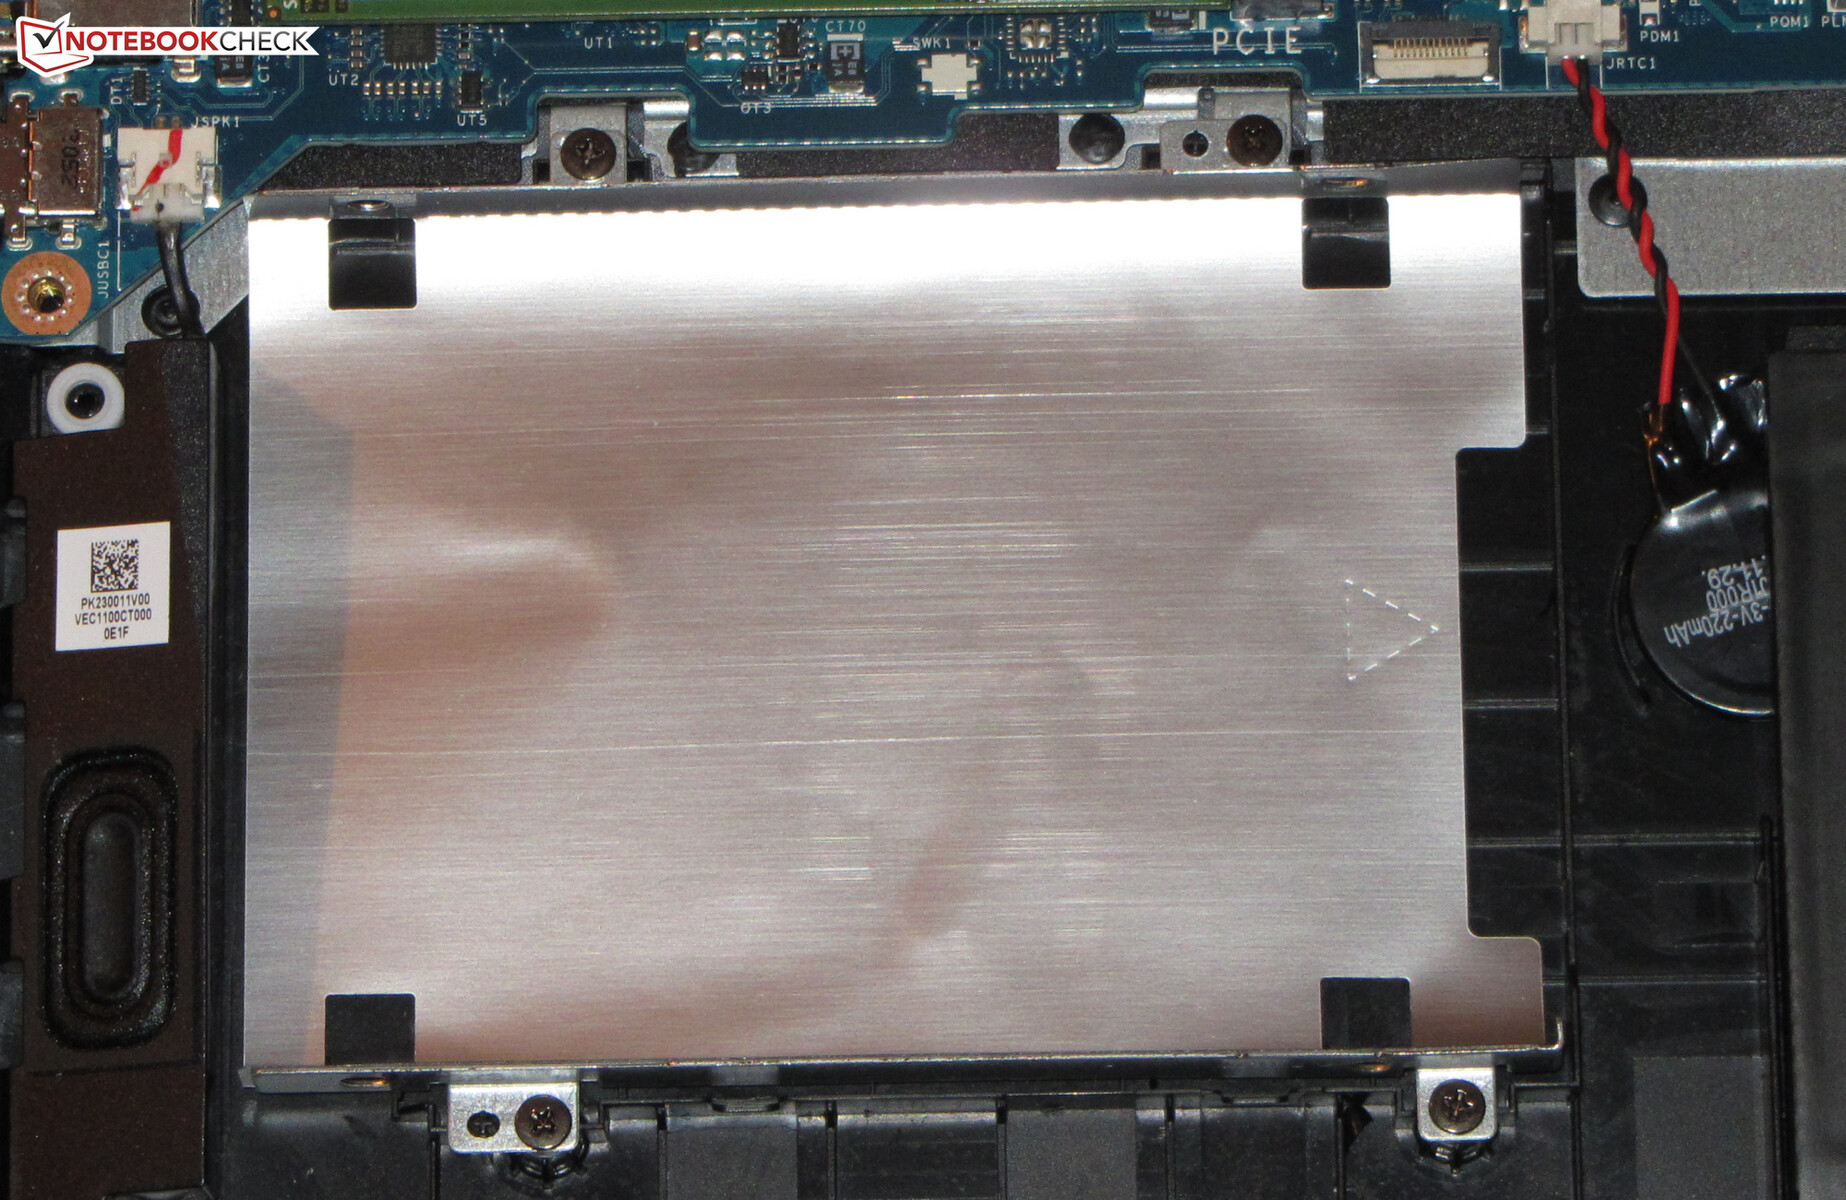
The notebook comes with the usual documents: A quick start guide and warranty information. In addition, a short ribbon cable including a SATA connector is included, which would be needed to install a 2.5-inch storage medium. The corresponding mounting frame is already inside the notebook.
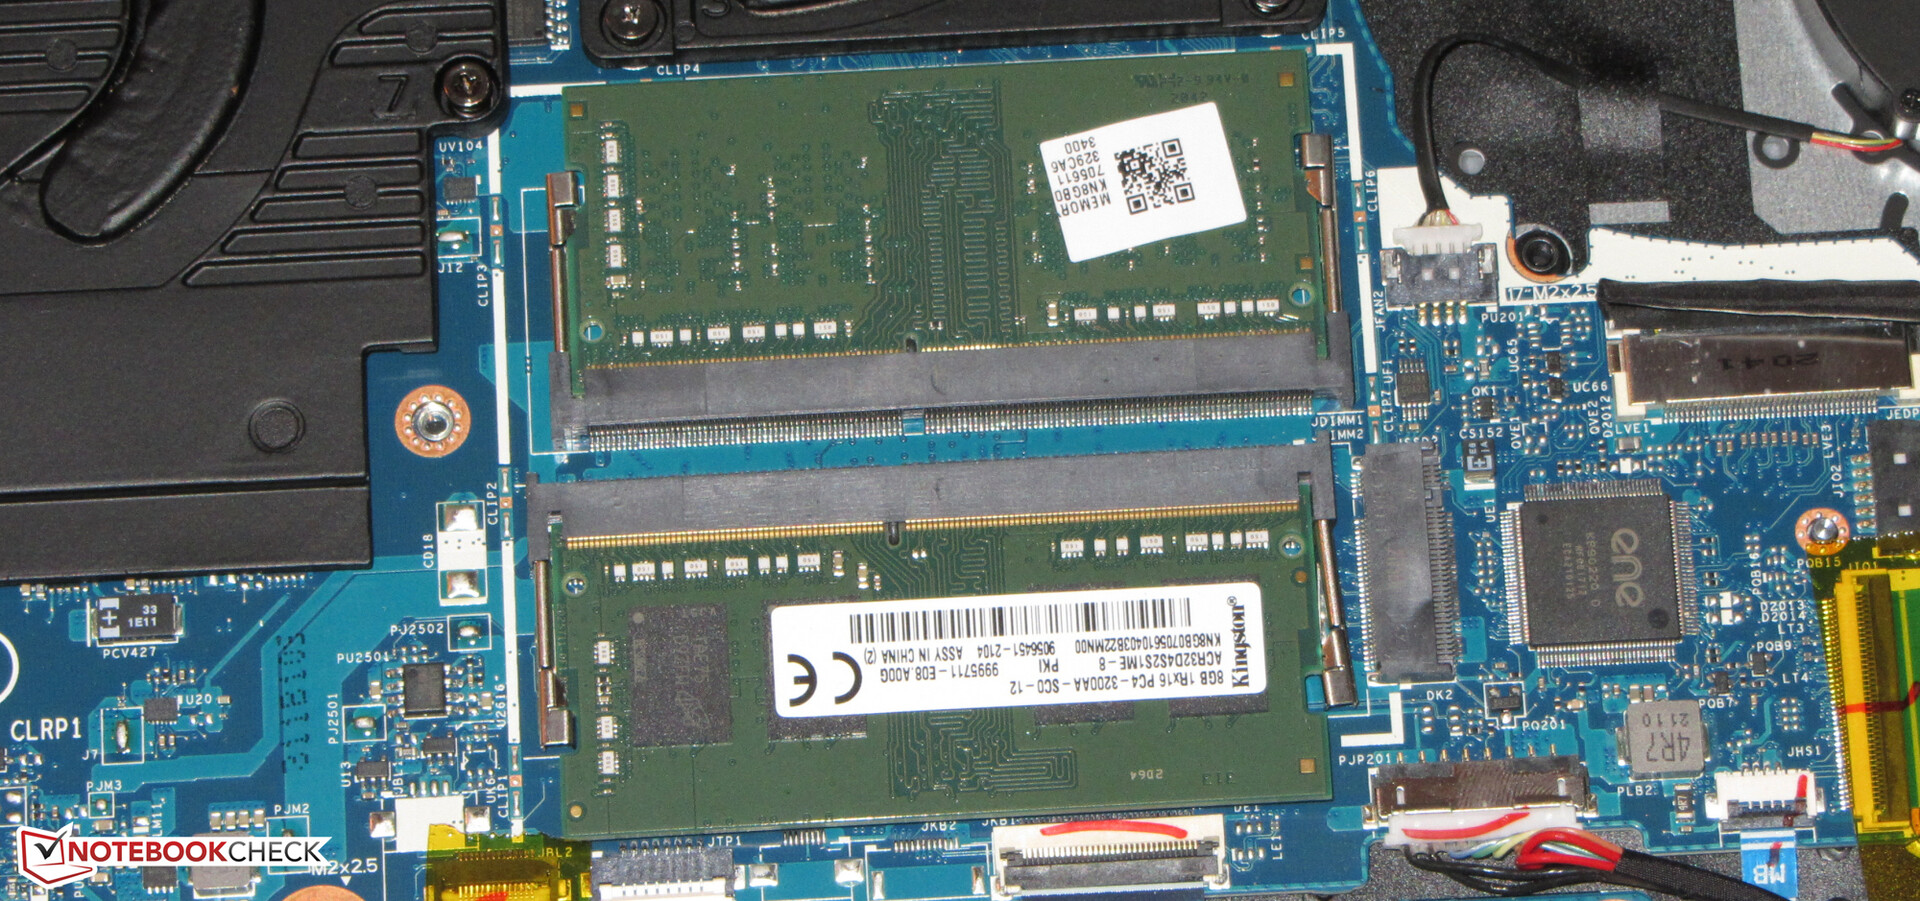
Maintenance
Access to the innards requires disassembly of the bottom shell. After removing all screws on the bottom of the device, the bottom shell can be detached with the help of a flat spatula or a joint smoother. Care must be taken here: The bottom shell is sometimes quite tight.
Warranty
Acer grants the 17.3 incher a two-year warranty. An extension to three years costs just under 100 Euros (~$118).
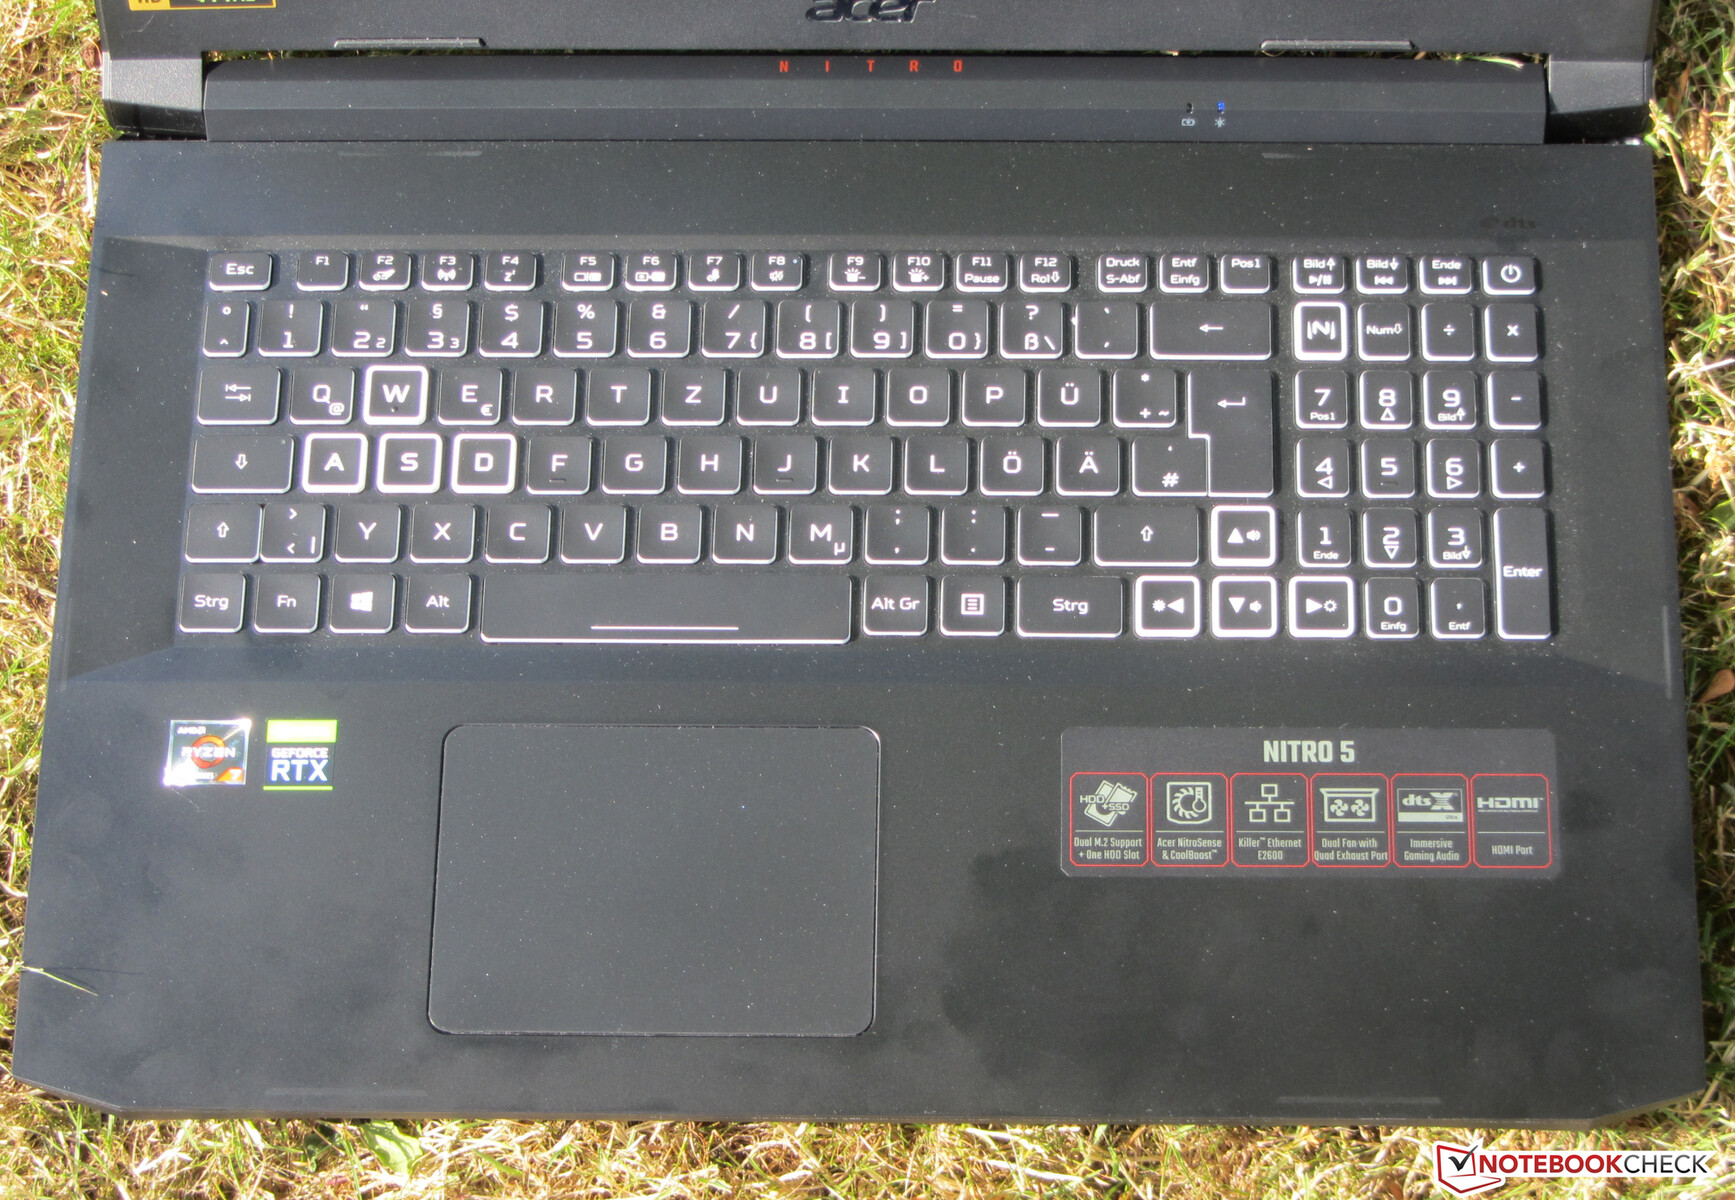
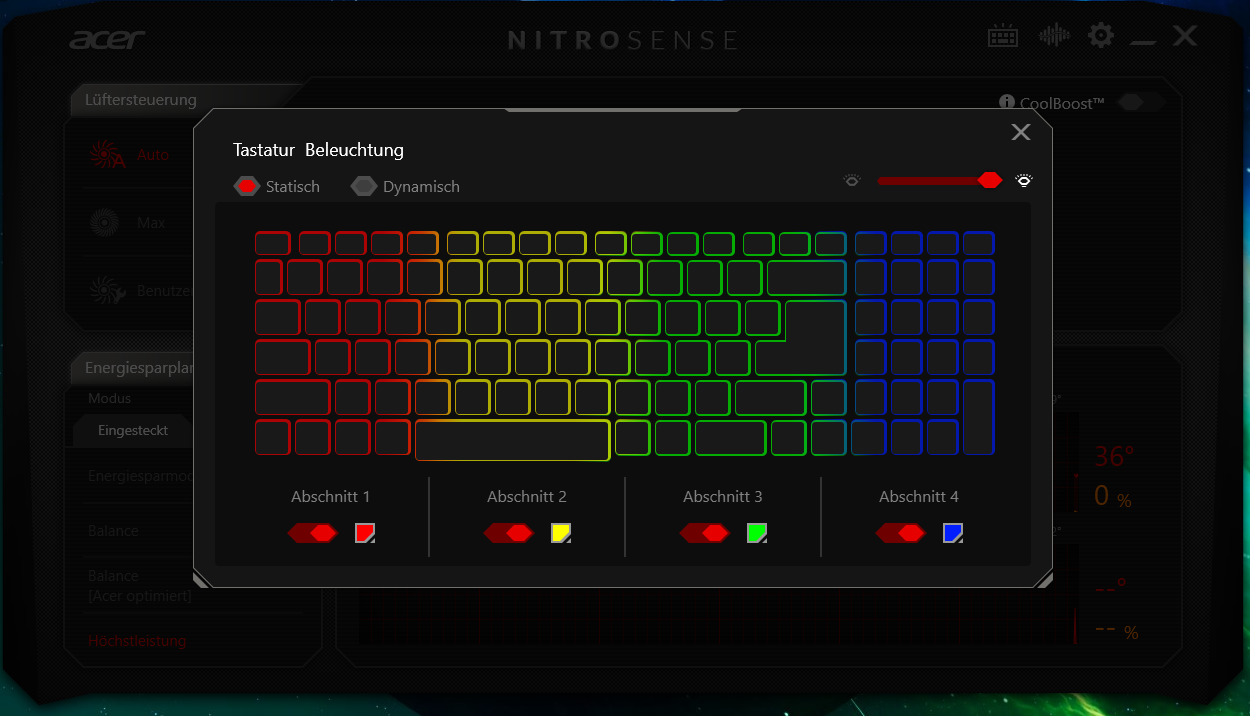
Input devices - Keyboard with RGB lighting
Keyboard
The main keys (letters, number row) of the illuminated chiclet keyboard have a slightly concave curvature. The other keys (function keys, number pad) have a flat design. They offer a medium stroke and a clear pressure point. The key resistance is quite acceptable, but could be crisper for our taste. The keyboard yields a bit during typing. This did not prove to be annoying. All in all, Acer delivers a keyboard that is suitable for everyday use.
Touchpad
The smooth surface of the multitouch-capable ClickPad (about 10.6 x 7.8 cm/~4.2 x 3.1 inches) makes it easy for the fingers to glide. It also responds to inputs in the corners. The pad has a short stroke and a clear pressure point.
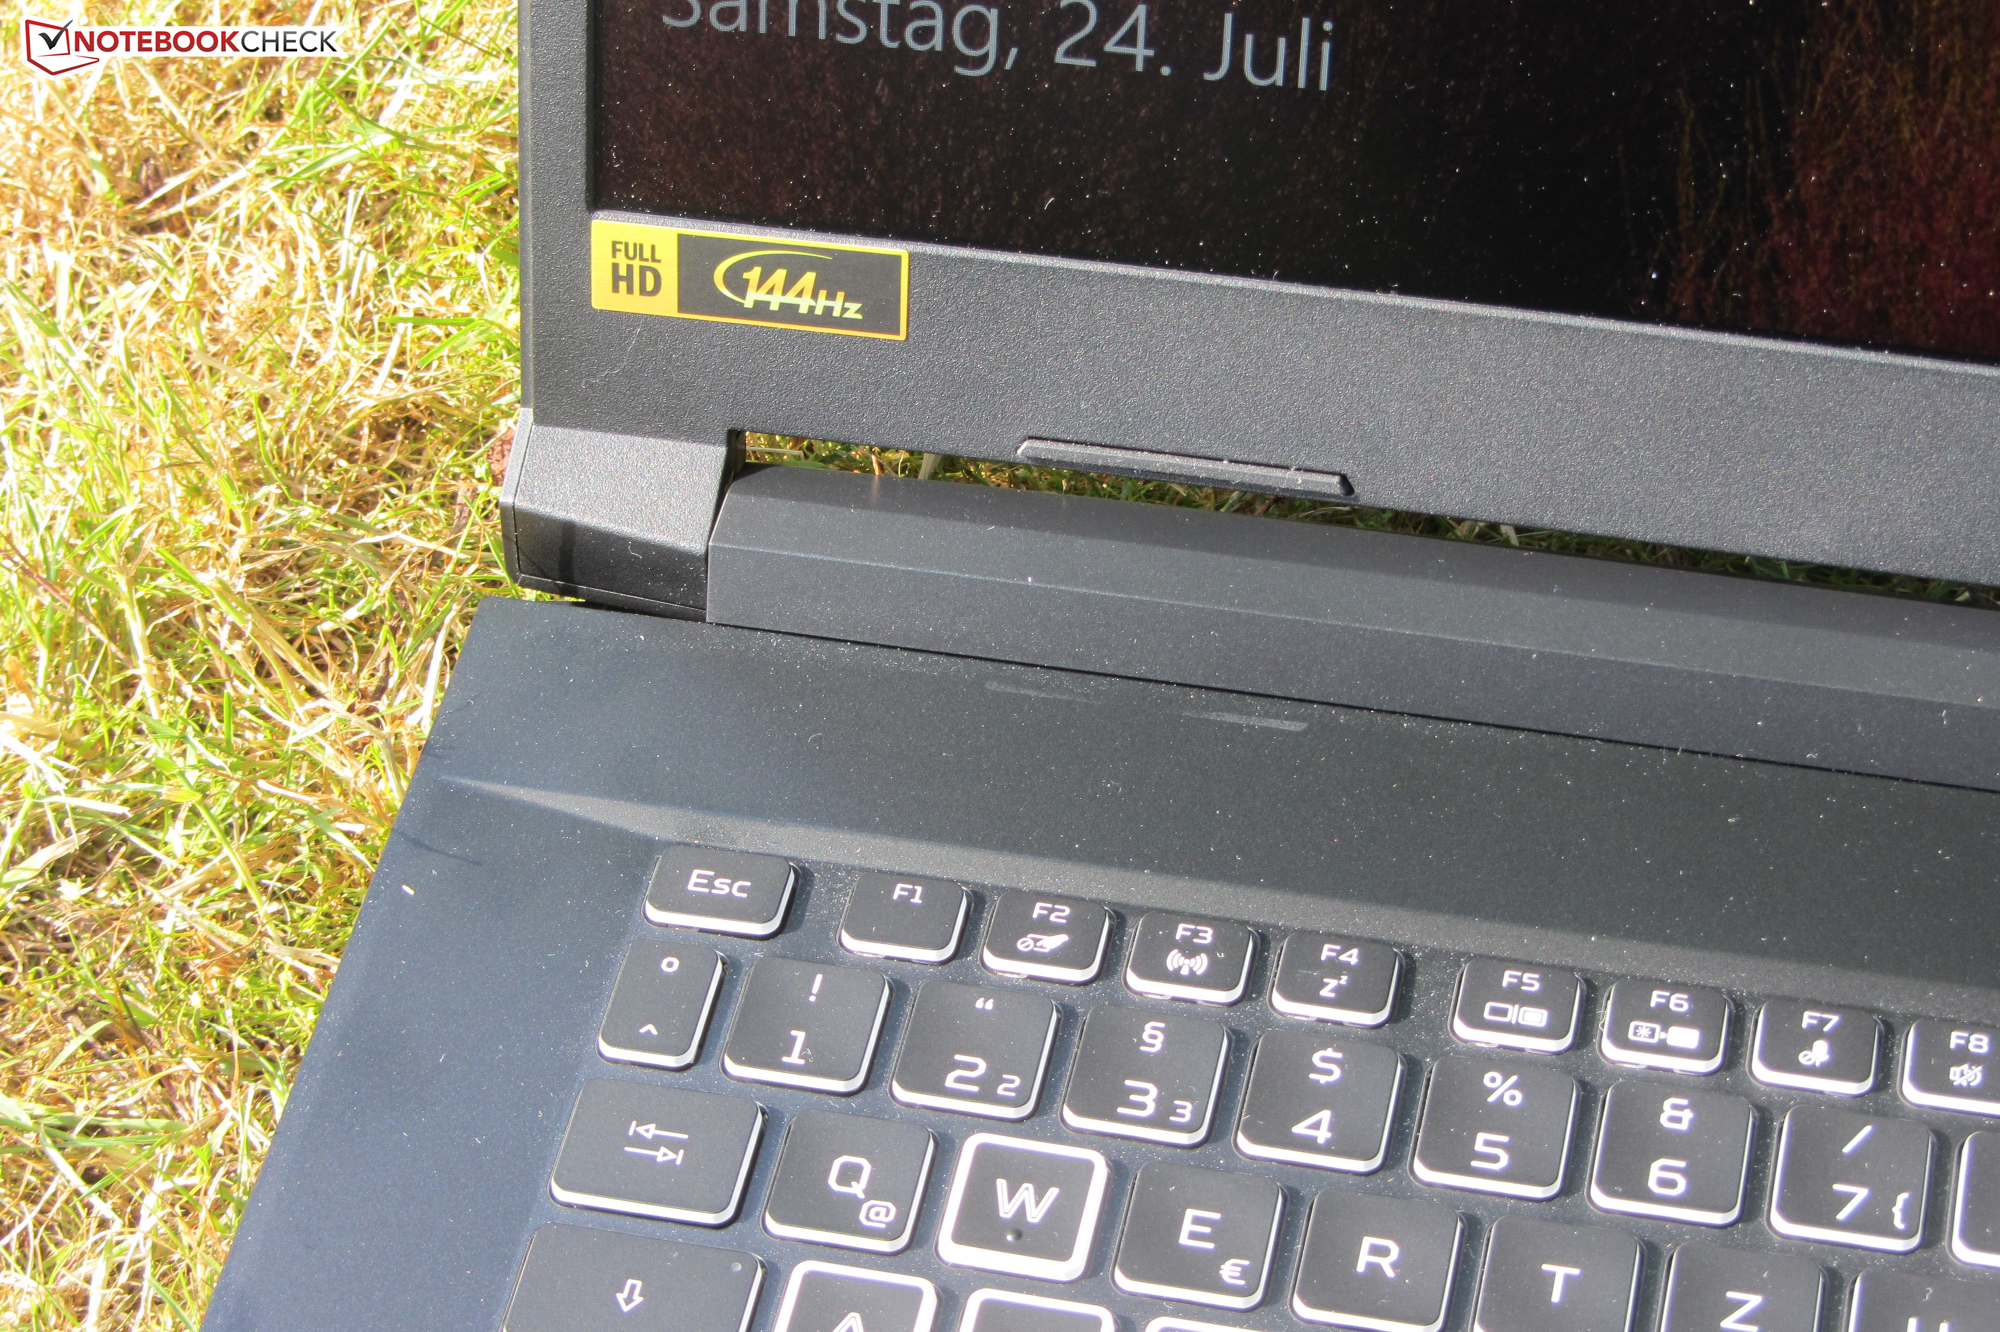
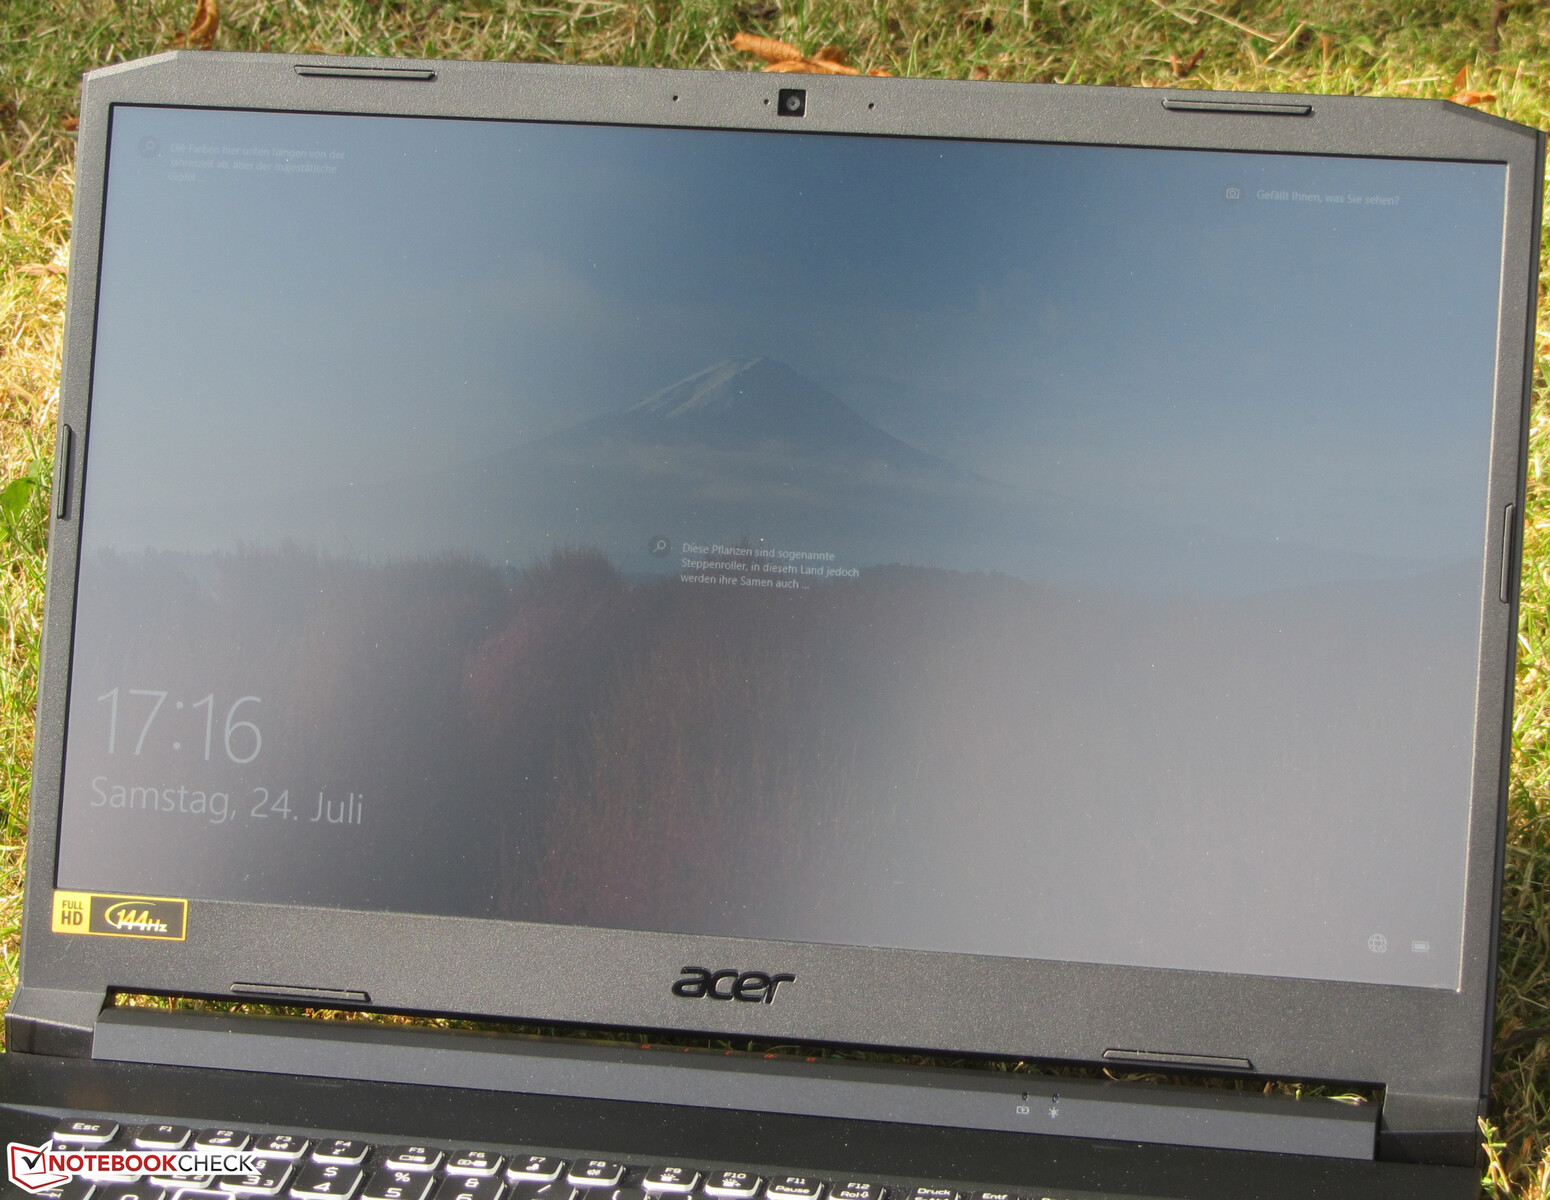
Display - 144 Hz IPS
While the matte 17.3-inch display (1,920 x 1,080 pixels) delivers a good contrast (1,175:1), the average brightness (255.1 cd/m²) is too low. We consider values beyond 300 cd/m² to be good. The 144 Hz panel offers short response times. PWM flickering could not be detected.


| |||||||||||||||||||||||||
Brightness Distribution: 85 %
Center on Battery: 283 cd/m²
Contrast: 1175:1 (Black: 0.24 cd/m²)
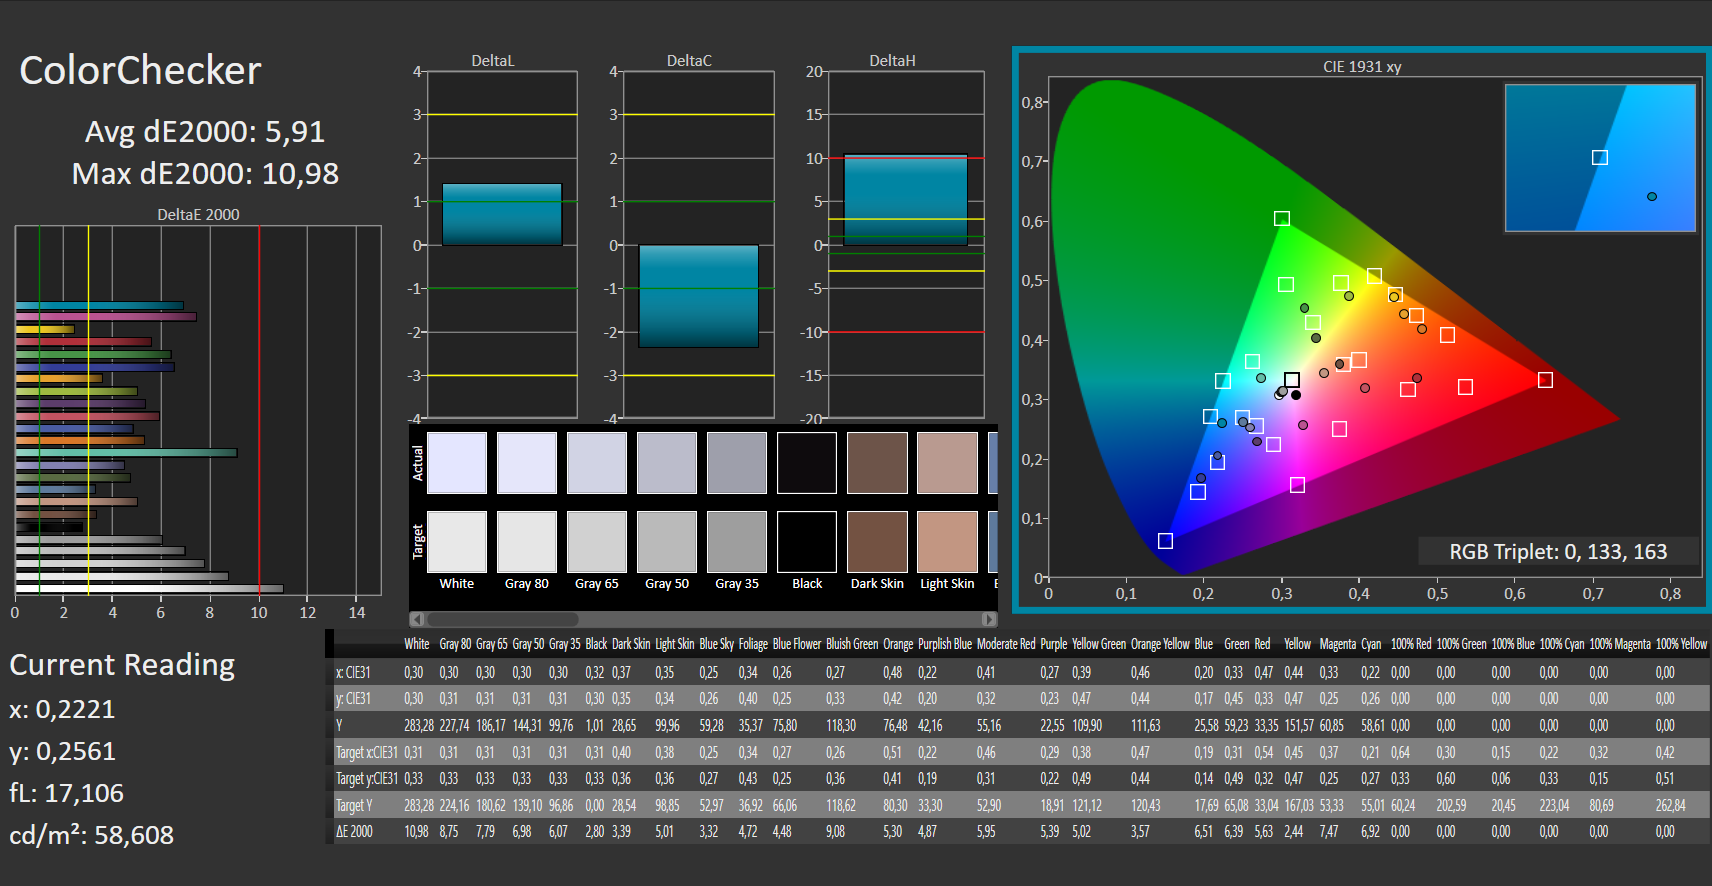
ΔE ColorChecker Calman: 5.91 | ∀{0.5-29.43 Ø4.79}
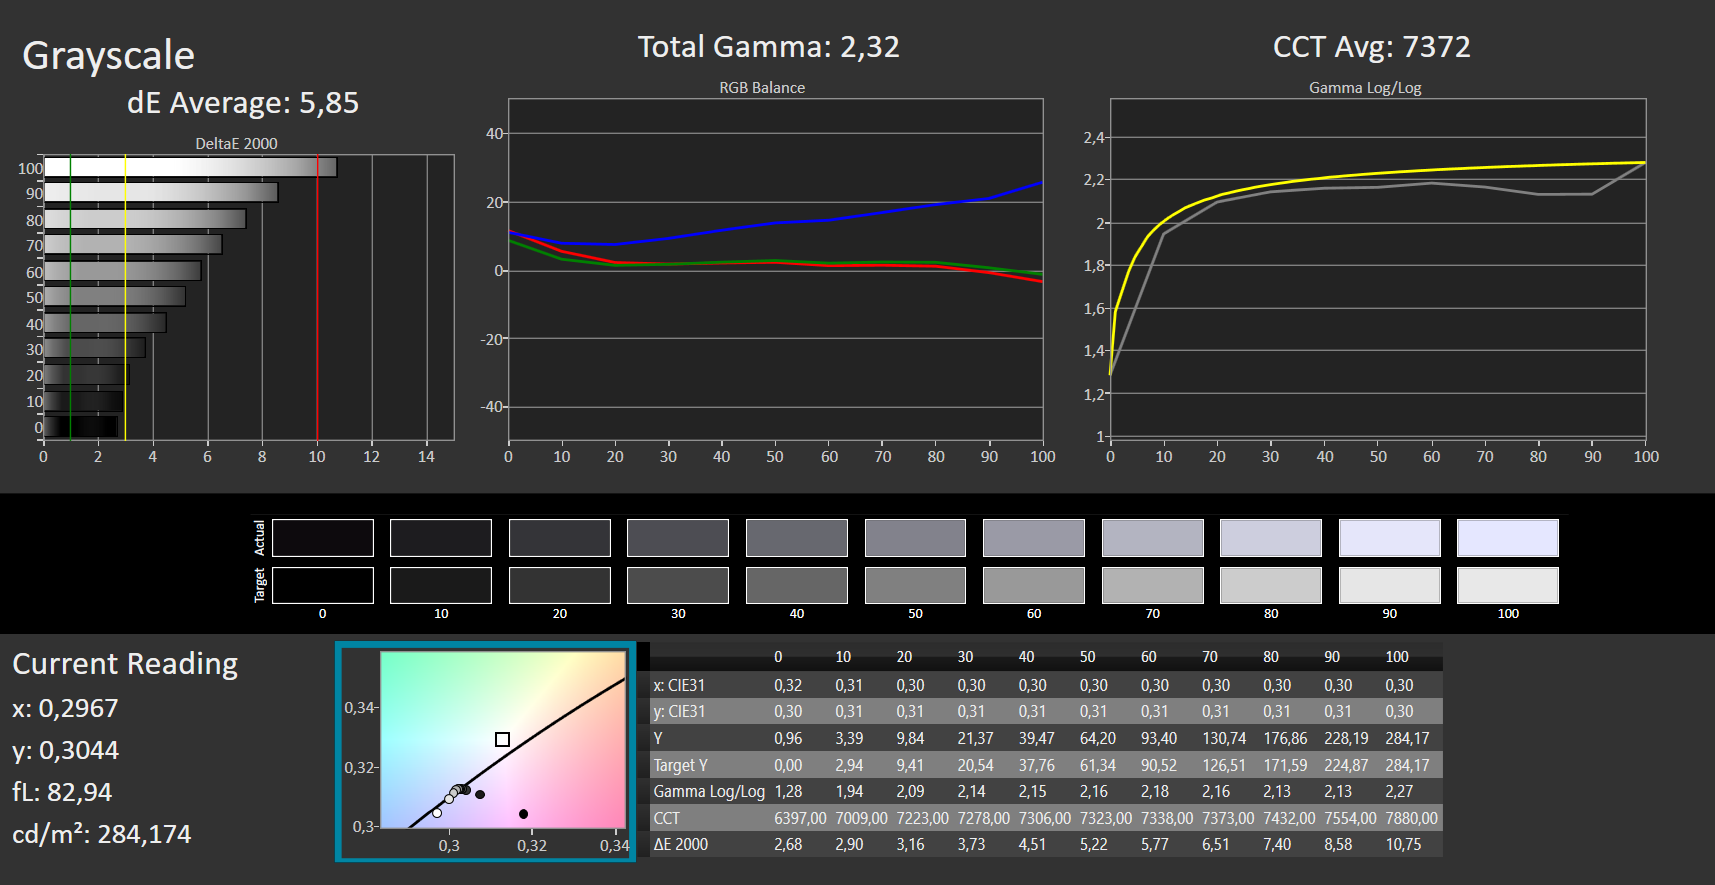
ΔE Greyscale Calman: 5.85 | ∀{0.09-98 Ø5}
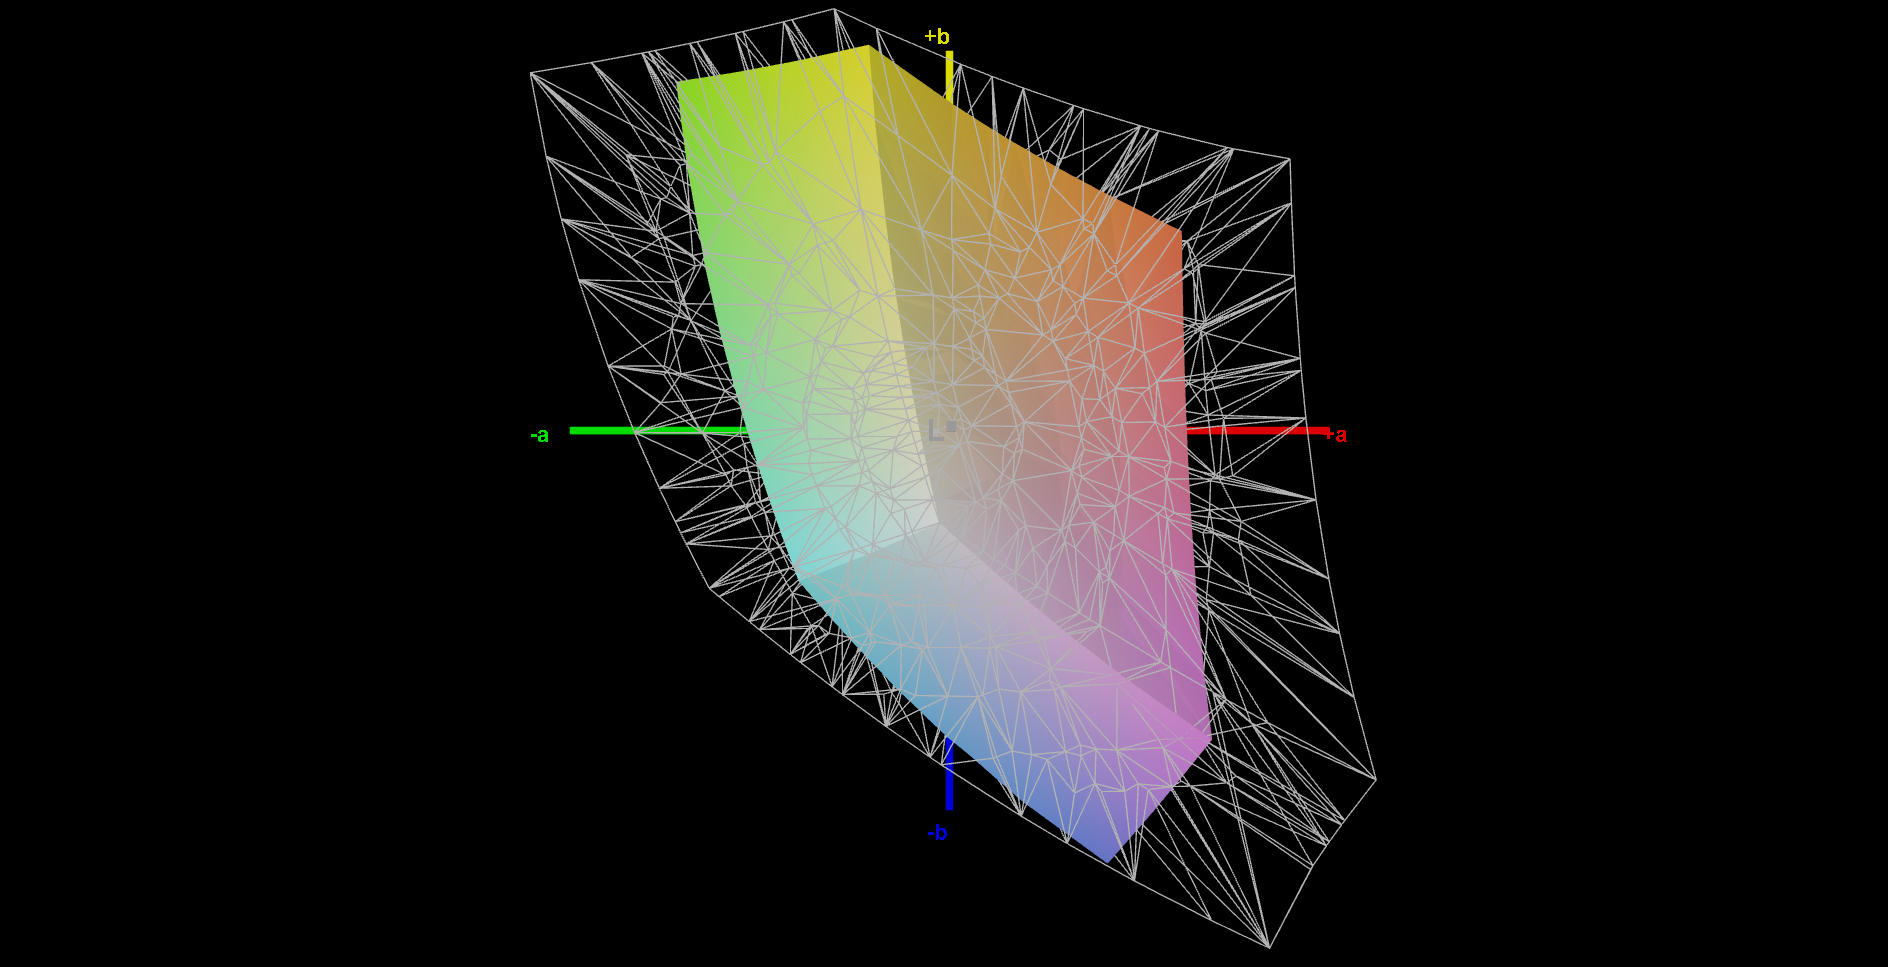
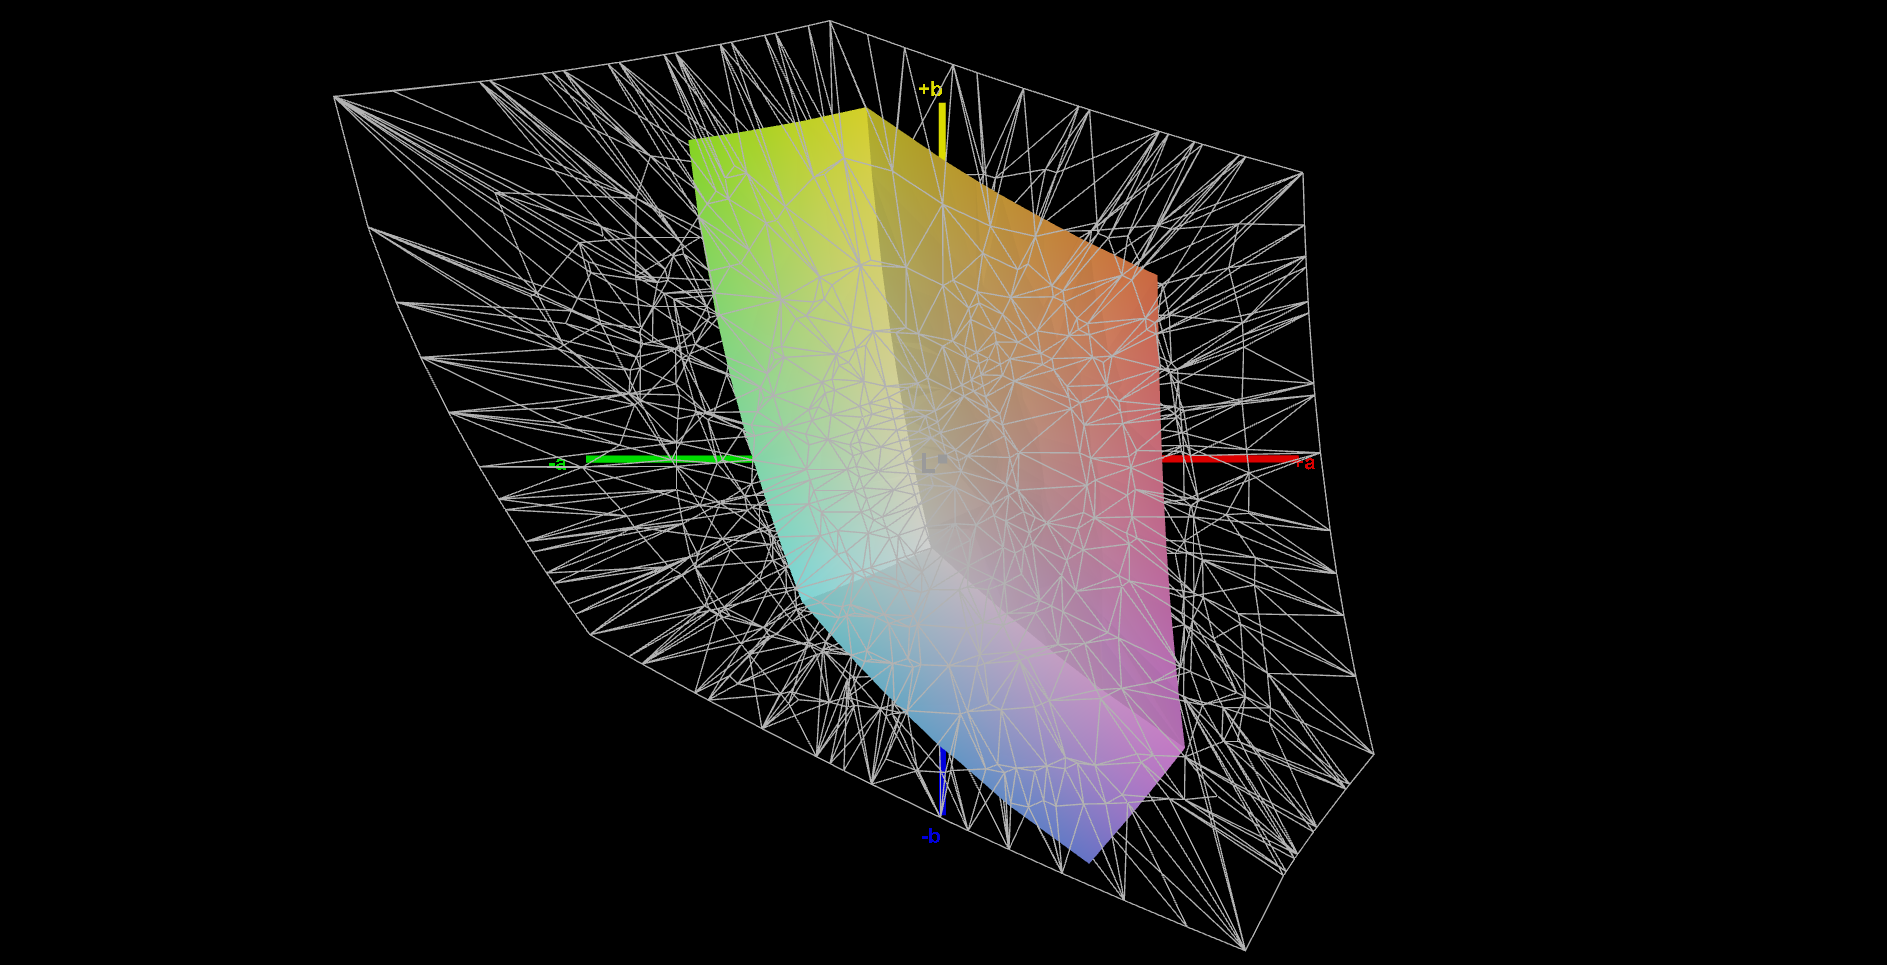
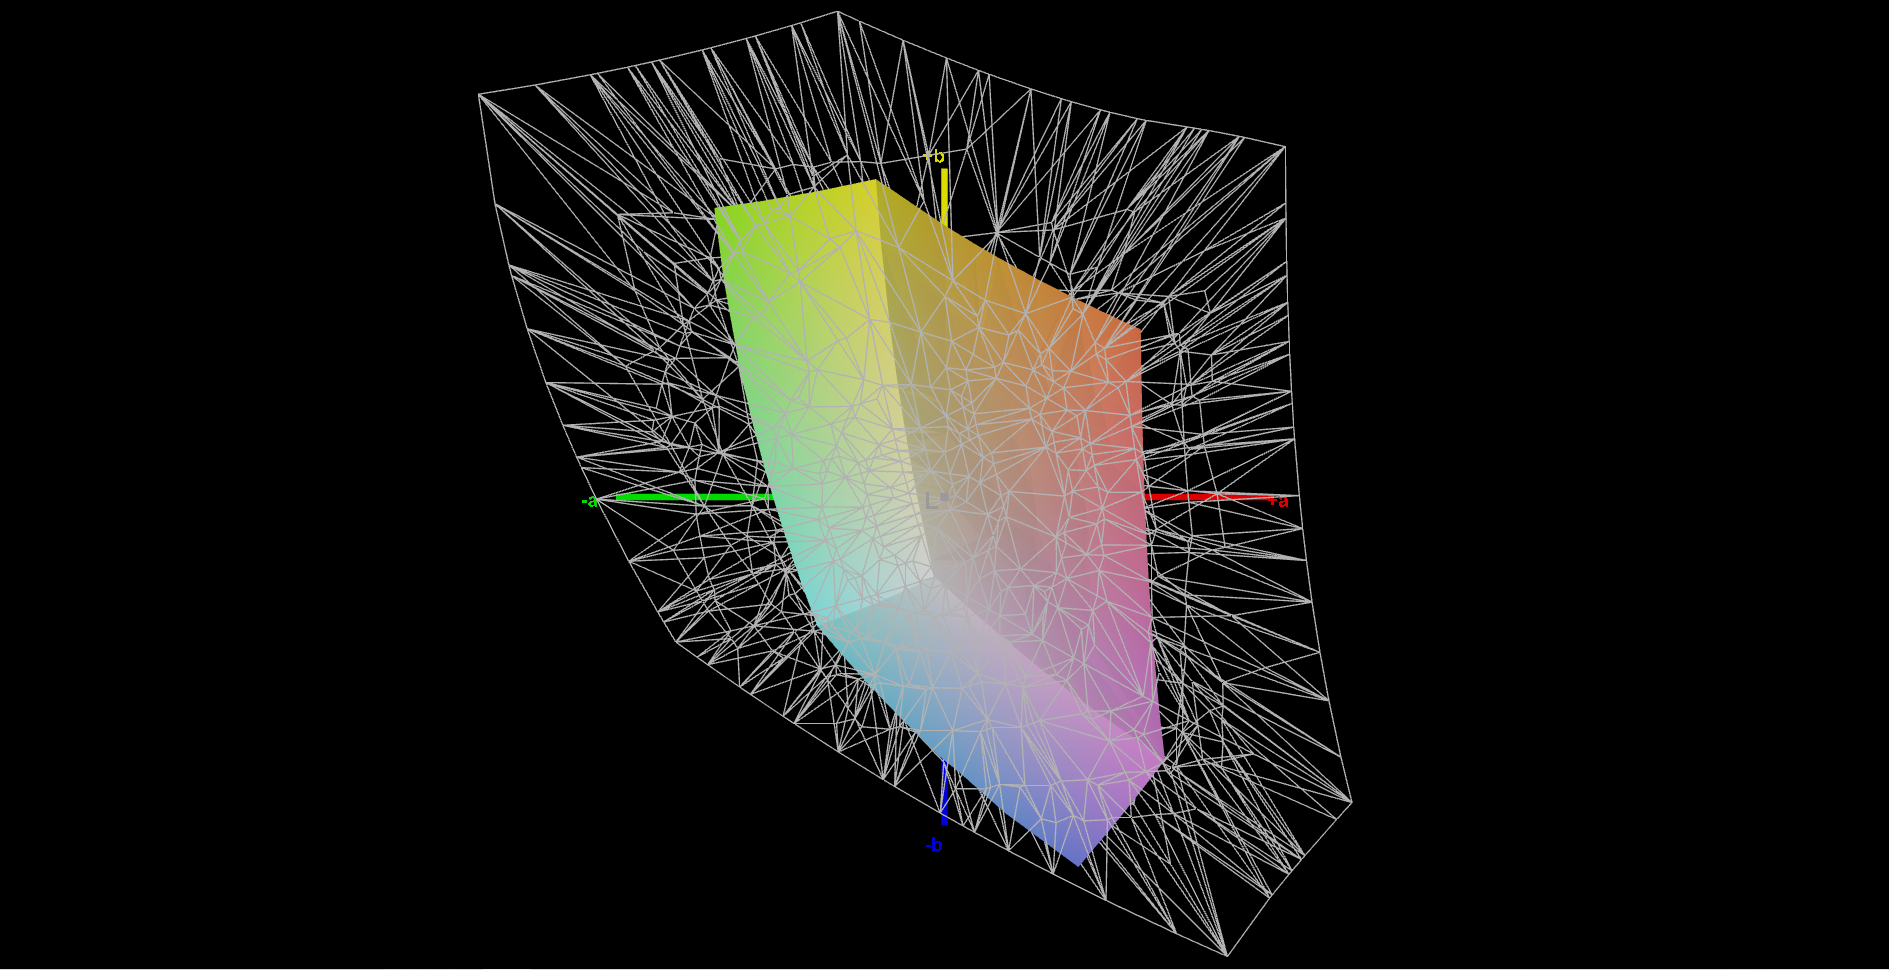
55% sRGB (Argyll 1.6.3 3D)
35% AdobeRGB 1998 (Argyll 1.6.3 3D)
37.9% AdobeRGB 1998 (Argyll 3D)
55.3% sRGB (Argyll 3D)
36.7% Display P3 (Argyll 3D)
Gamma: 2.32
CCT: 7372 K
| Acer Nitro 5 AN517-41-R5Z7 BOE NV173FHM-NX4, IPS, 1920x1080, 17.3" | MSI Katana GF76 11UE AU Optronics B173HAN04.9, IPS, 1920x1080, 17.3" | Schenker XMG Core 17 (Early 2021) BOE CQ NE173QHM-NY2, IPS, 2560x1440, 17.3" | Asus TUF Gaming F17 FX706HM AU Optronics AUI8294 (B173HAN04.9), IPS, 1920x1080, 17.3" | MSI GP76 Leopard 10UG Chi Mei CMN176E, IPS, 1920x1080, 17.3" | |
|---|---|---|---|---|---|
| Display | 8% | 82% | 9% | 76% | |
| Display P3 Coverage (%) | 36.7 | 39.8 8% | 68.1 86% | 40.1 9% | 64.7 76% |
| sRGB Coverage (%) | 55.3 | 59.5 8% | 98.5 78% | 60 8% | 96.4 74% |
| AdobeRGB 1998 Coverage (%) | 37.9 | 41.12 8% | 69.3 83% | 41.4 9% | 66.9 77% |
| Response Times | -95% | 18% | -70% | 41% | |
| Response Time Grey 50% / Grey 80% * (ms) | 18 ? | 36.8 ? -104% | 16.8 ? 7% | 32.4 -80% | 7.4 ? 59% |
| Response Time Black / White * (ms) | 14 ? | 26 ? -86% | 10 ? 29% | 22.4 -60% | 10.8 ? 23% |
| PWM Frequency (Hz) | 24510 ? | ||||
| Screen | -2% | 28% | 8% | 34% | |
| Brightness middle (cd/m²) | 282 | 260 -8% | 370 31% | 266 -6% | 328 16% |
| Brightness (cd/m²) | 255 | 251 -2% | 333 31% | 264 4% | 314 23% |
| Brightness Distribution (%) | 85 | 85 0% | 84 -1% | 79 -7% | 87 2% |
| Black Level * (cd/m²) | 0.24 | 0.26 -8% | 0.38 -58% | 0.32 -33% | 0.29 -21% |
| Contrast (:1) | 1175 | 1000 -15% | 974 -17% | 831 -29% | 1131 -4% |
| Colorchecker dE 2000 * | 5.91 | 3.9 34% | 2.41 59% | 3.97 33% | 1.93 67% |
| Colorchecker dE 2000 max. * | 10.98 | 20.64 -88% | 7.32 33% | 8.93 19% | 4.94 55% |
| Greyscale dE 2000 * | 5.85 | 1.6 73% | 3.9 33% | 1.8 69% | 2.8 52% |
| Gamma | 2.32 95% | 2.068 106% | 2.287 96% | 2.31 95% | 2.18 101% |
| CCT | 7372 88% | 6511 100% | 7302 89% | 6754 96% | 7023 93% |
| Color Space (Percent of AdobeRGB 1998) (%) | 35 | 69 97% | 41.4 18% | 67 91% | |
| Color Space (Percent of sRGB) (%) | 55 | 93 69% | 60 9% | 89 62% | |
| Colorchecker dE 2000 calibrated * | 3.71 | 1.19 | 3.5 | 0.68 | |
| Total Average (Program / Settings) | -30% /
-14% | 43% /
37% | -18% /
-2% | 50% /
43% |
* ... smaller is better
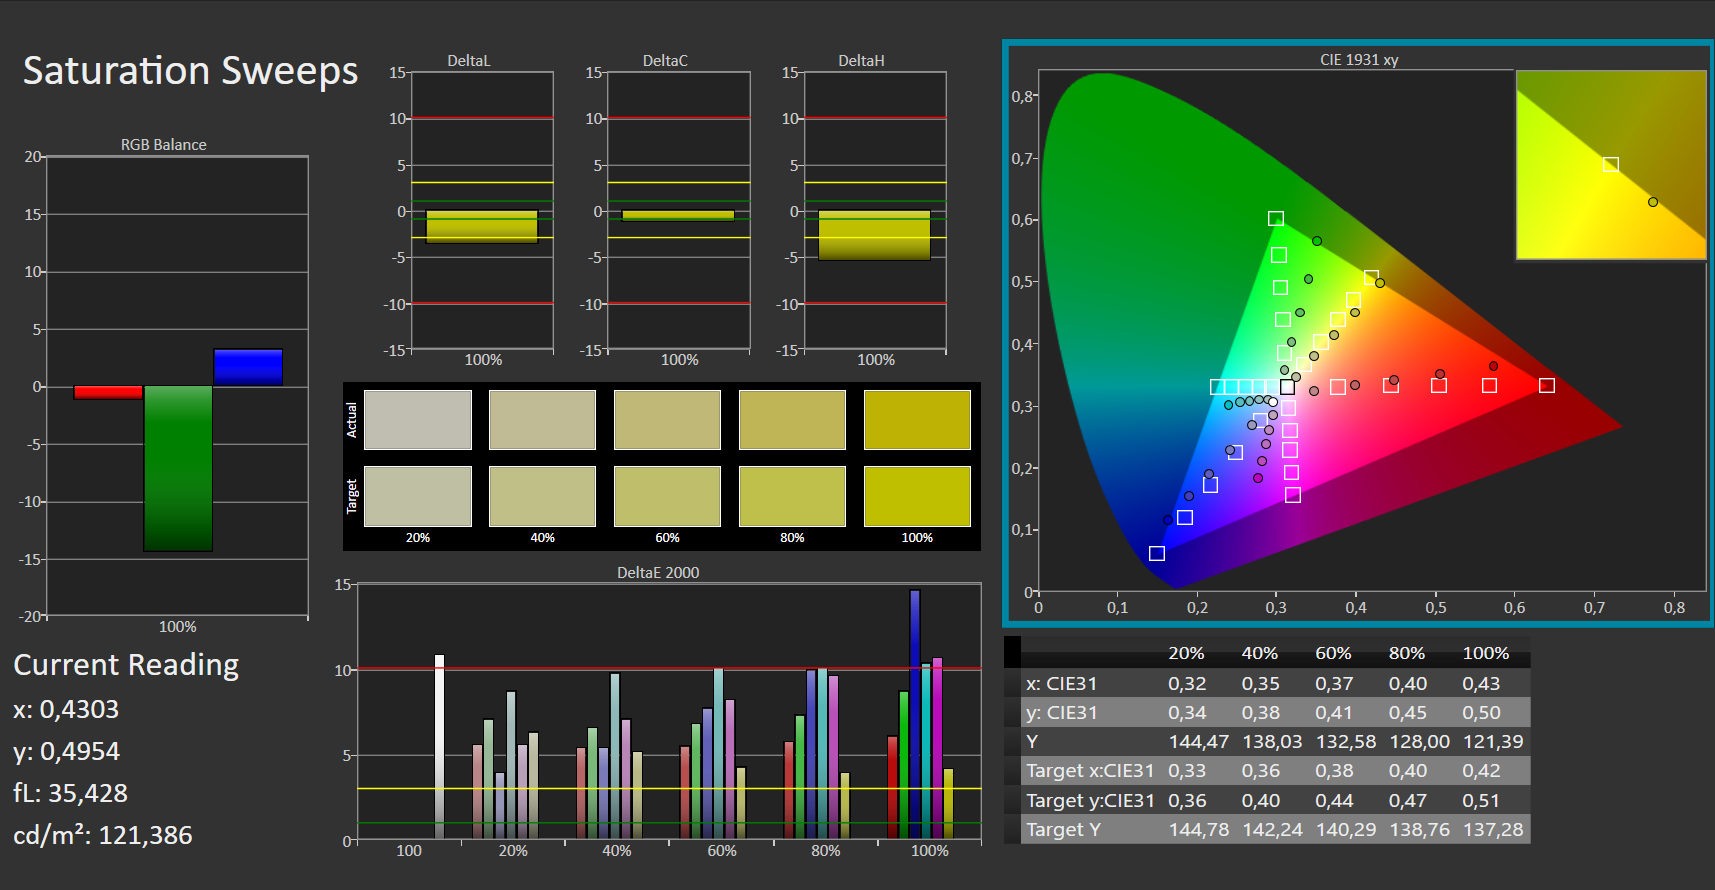
The screen shows a quite decent color reproduction in its state of delivery. However, the target (Delta E less than 3) is missed with a Delta E 2000 color deviation of almost 6. The display does not suffer from a blue cast. The color spaces AdobeRGB (38%), sRGB (55%) and DCI-P3 (37%) are not completely reproduced.
Display Response Times
| ↔ Response Time Black to White | ||
|---|---|---|
| 14 ms ... rise ↗ and fall ↘ combined | ↗ 7 ms rise |  |
| ↘ 7 ms fall | ||
| The screen shows good response rates in our tests, but may be too slow for competitive gamers. In comparison, all tested devices range from 0.1 (minimum) to 240 (maximum) ms. » 33 % of all devices are better. This means that the measured response time is better than the average of all tested devices (20.3 ms). | ||
| ↔ Response Time 50% Grey to 80% Grey | ||
| 18 ms ... rise ↗ and fall ↘ combined | ↗ 8 ms rise |  |
| ↘ 10 ms fall | ||
| The screen shows good response rates in our tests, but may be too slow for competitive gamers. In comparison, all tested devices range from 0.165 (minimum) to 636 (maximum) ms. » 31 % of all devices are better. This means that the measured response time is better than the average of all tested devices (31.7 ms). | ||
Screen Flickering / PWM (Pulse-Width Modulation)
| Screen flickering / PWM not detected |  | ||
In comparison: 53 % of all tested devices do not use PWM to dim the display. If PWM was detected, an average of 8163 (minimum: 5 - maximum: 343500) Hz was measured. | |||
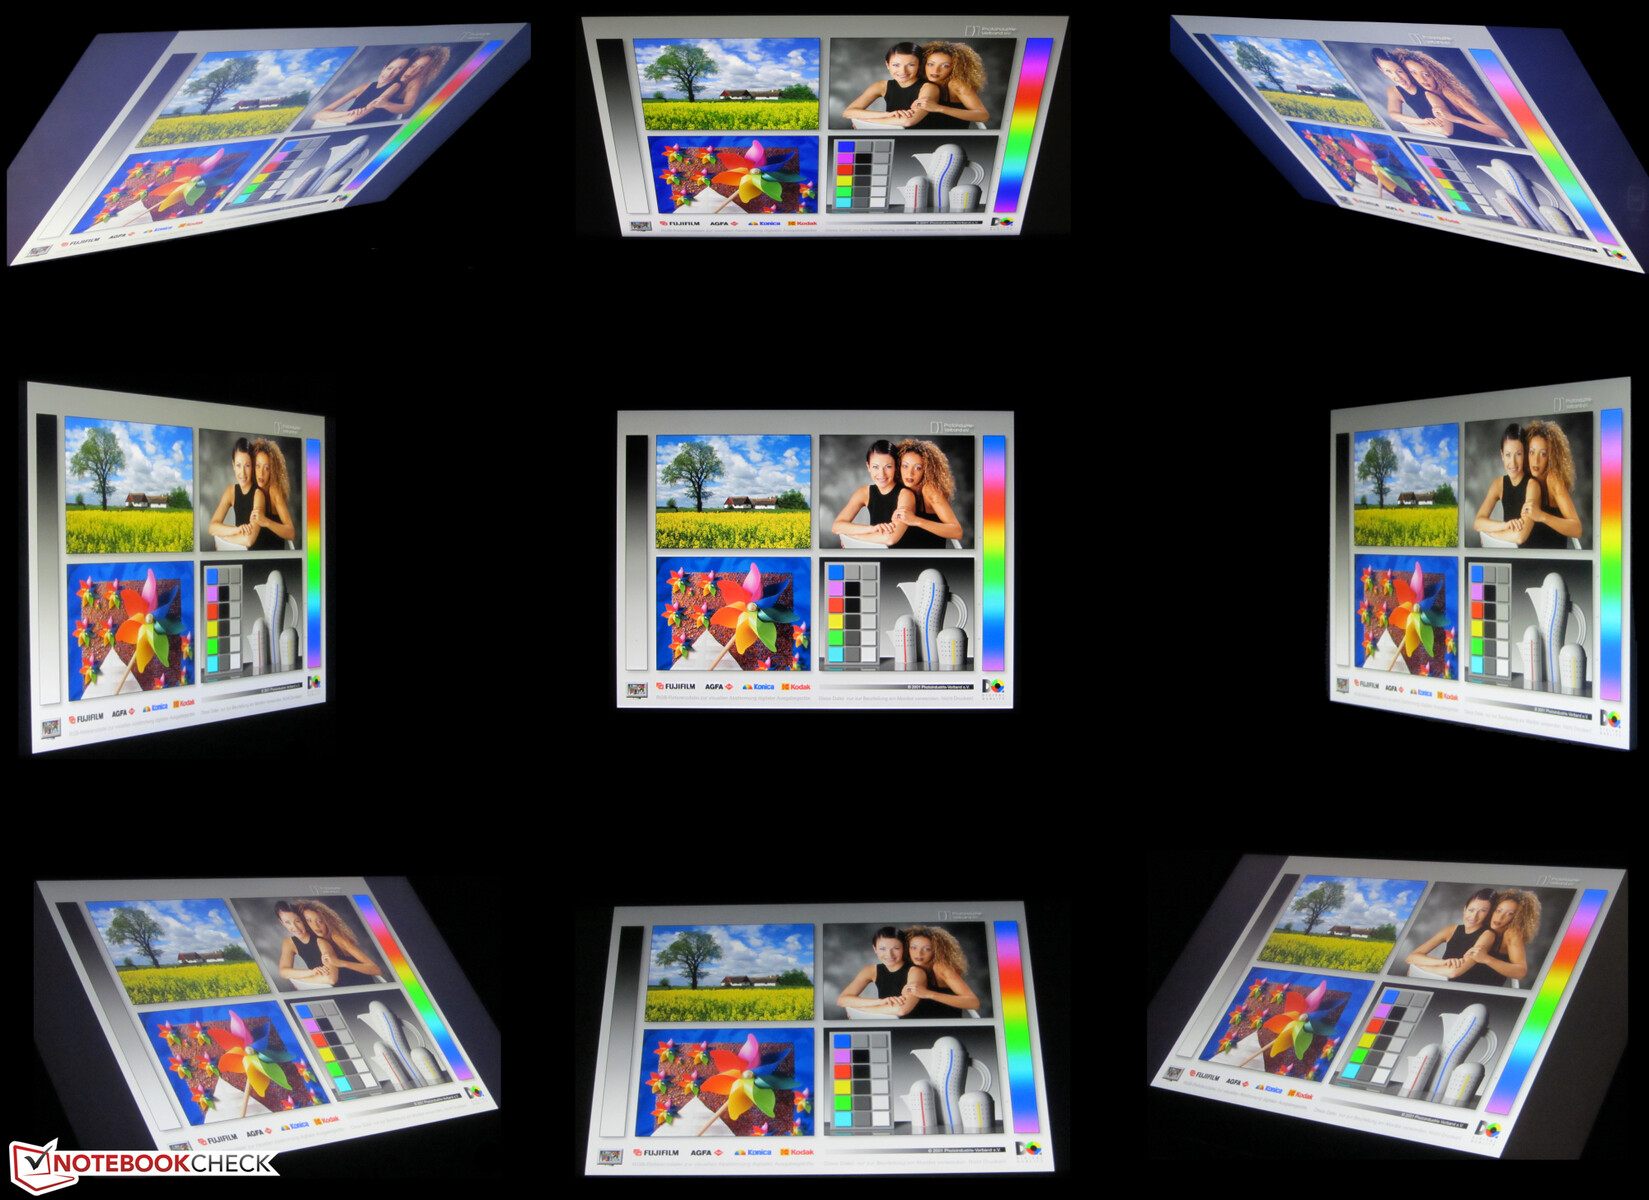
The viewing-angle stable IPS panel can be read from any position. Outdoors, reading the display is possible in the shade or under cloudy skies.
Performance - Ryzen 7 Power
With the Nitro 5 AN517-41, Acer has a 17.3-inch gaming notebook in its lineup that brings every current game smoothly to the screen and also cuts a good figure in all other application areas.
Test conditions
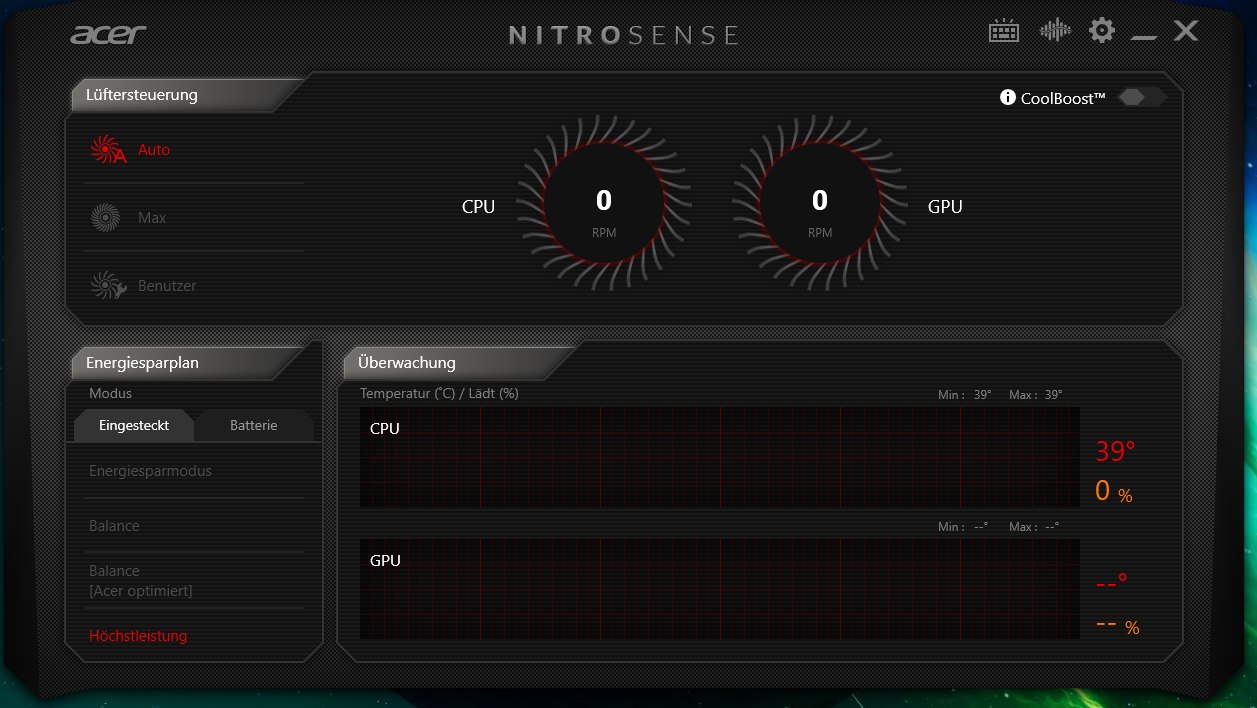
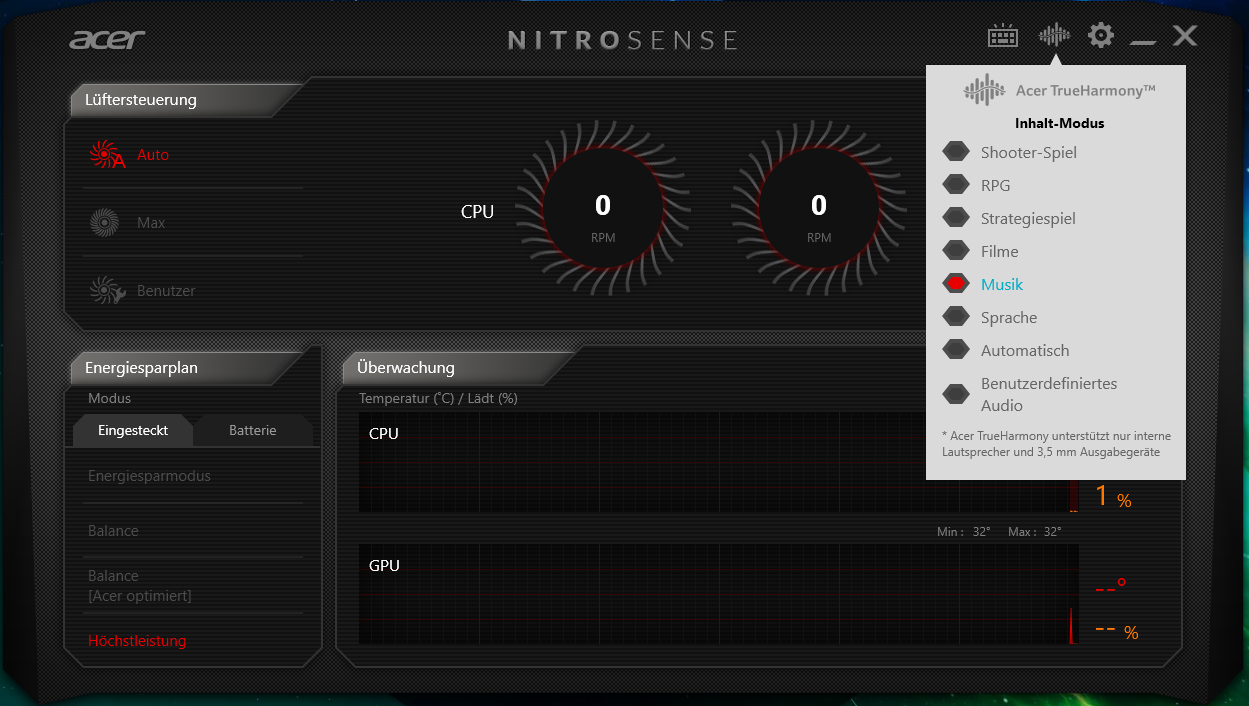
The pre-installed NitroSense software offers various performance profiles and allows influencing the two fans. We performed all benchmarks with the performance profile "High Performance" and used the automatic fan control. The performance profiles correspond to the standard Windows 10 profiles.
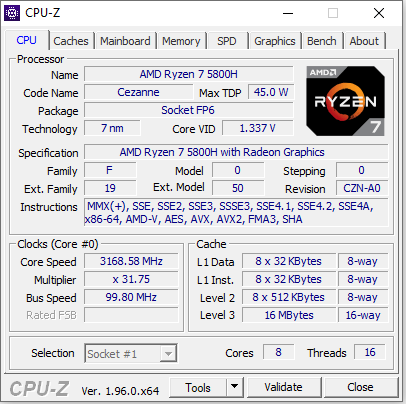
Processor
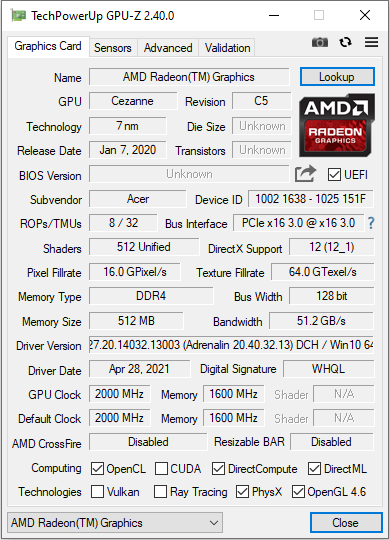
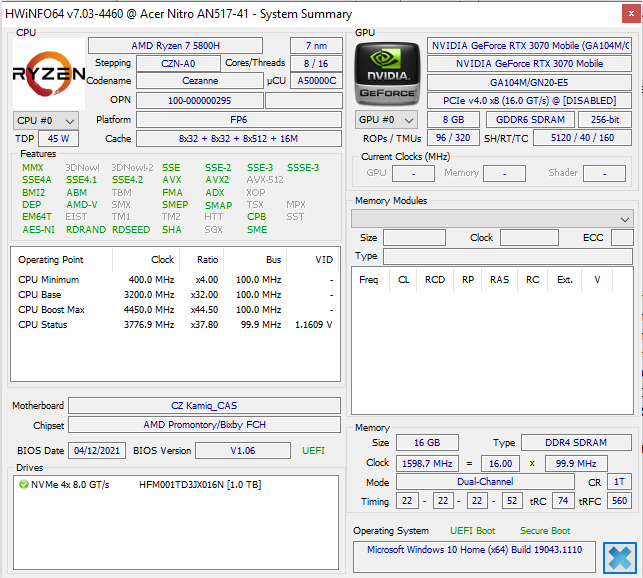
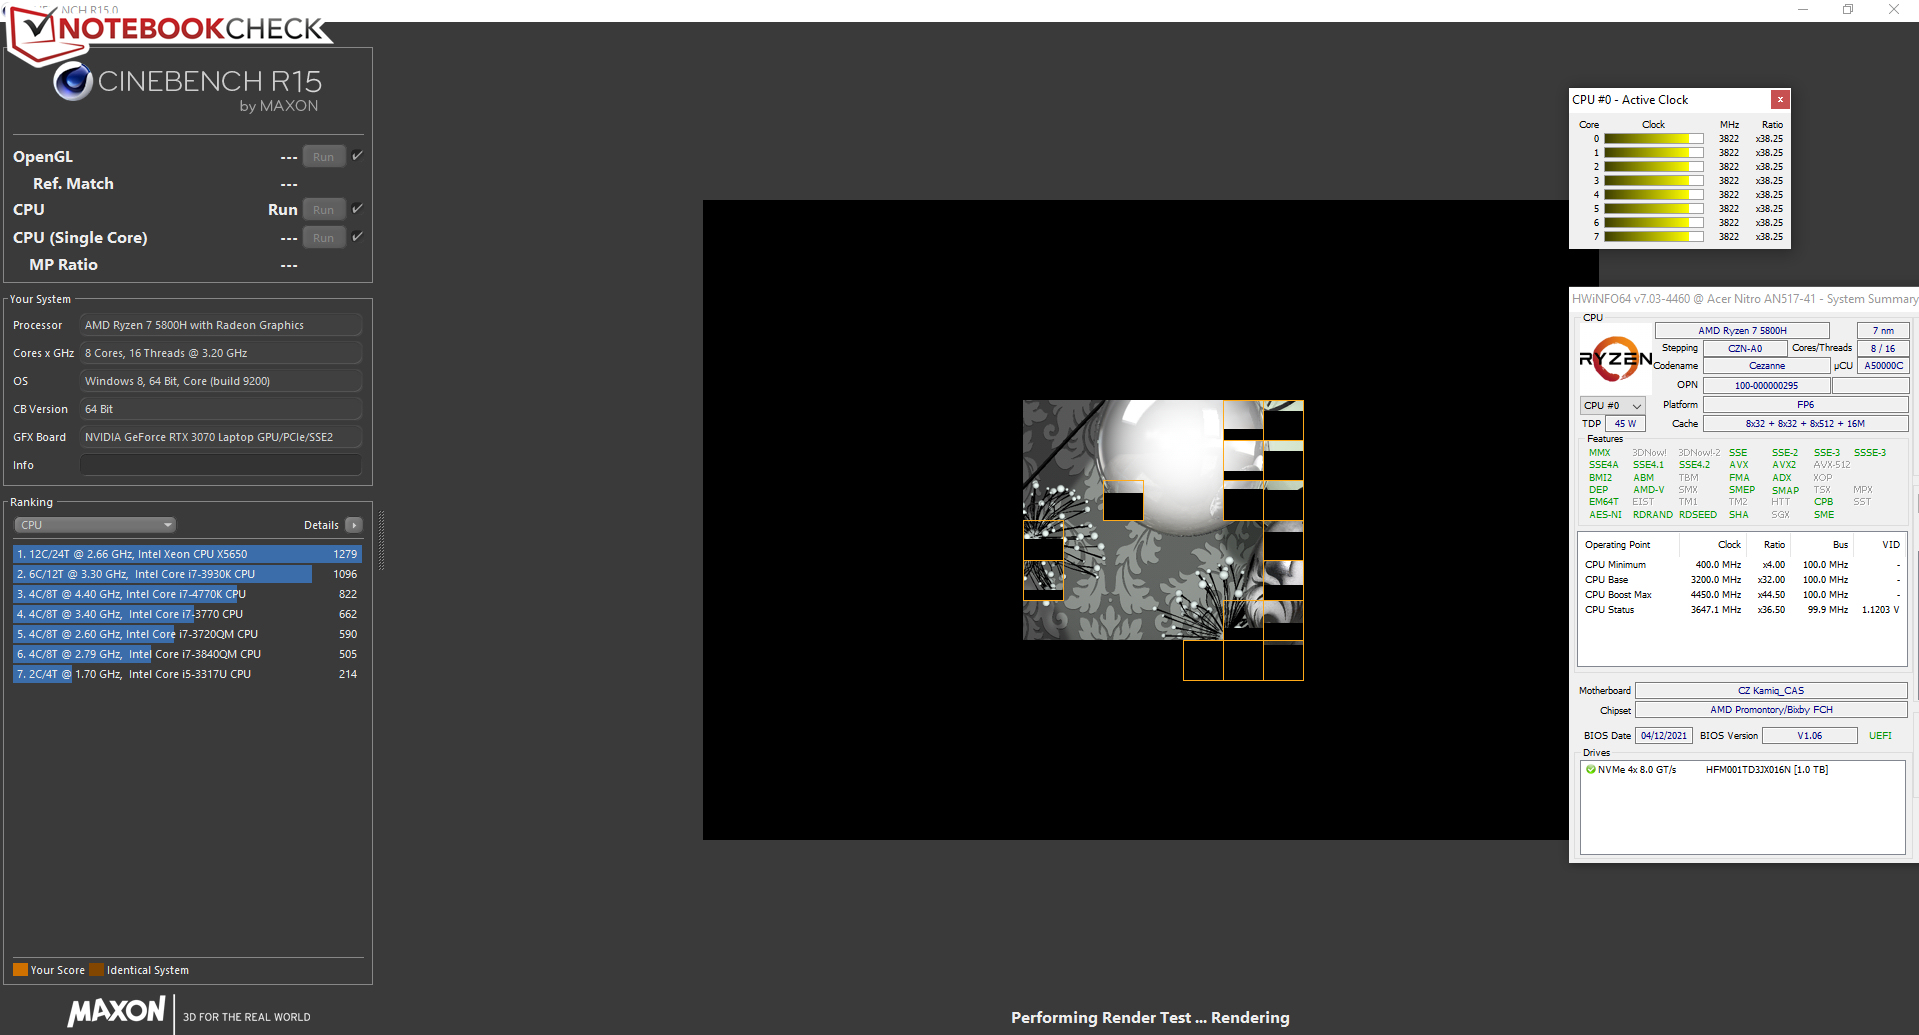
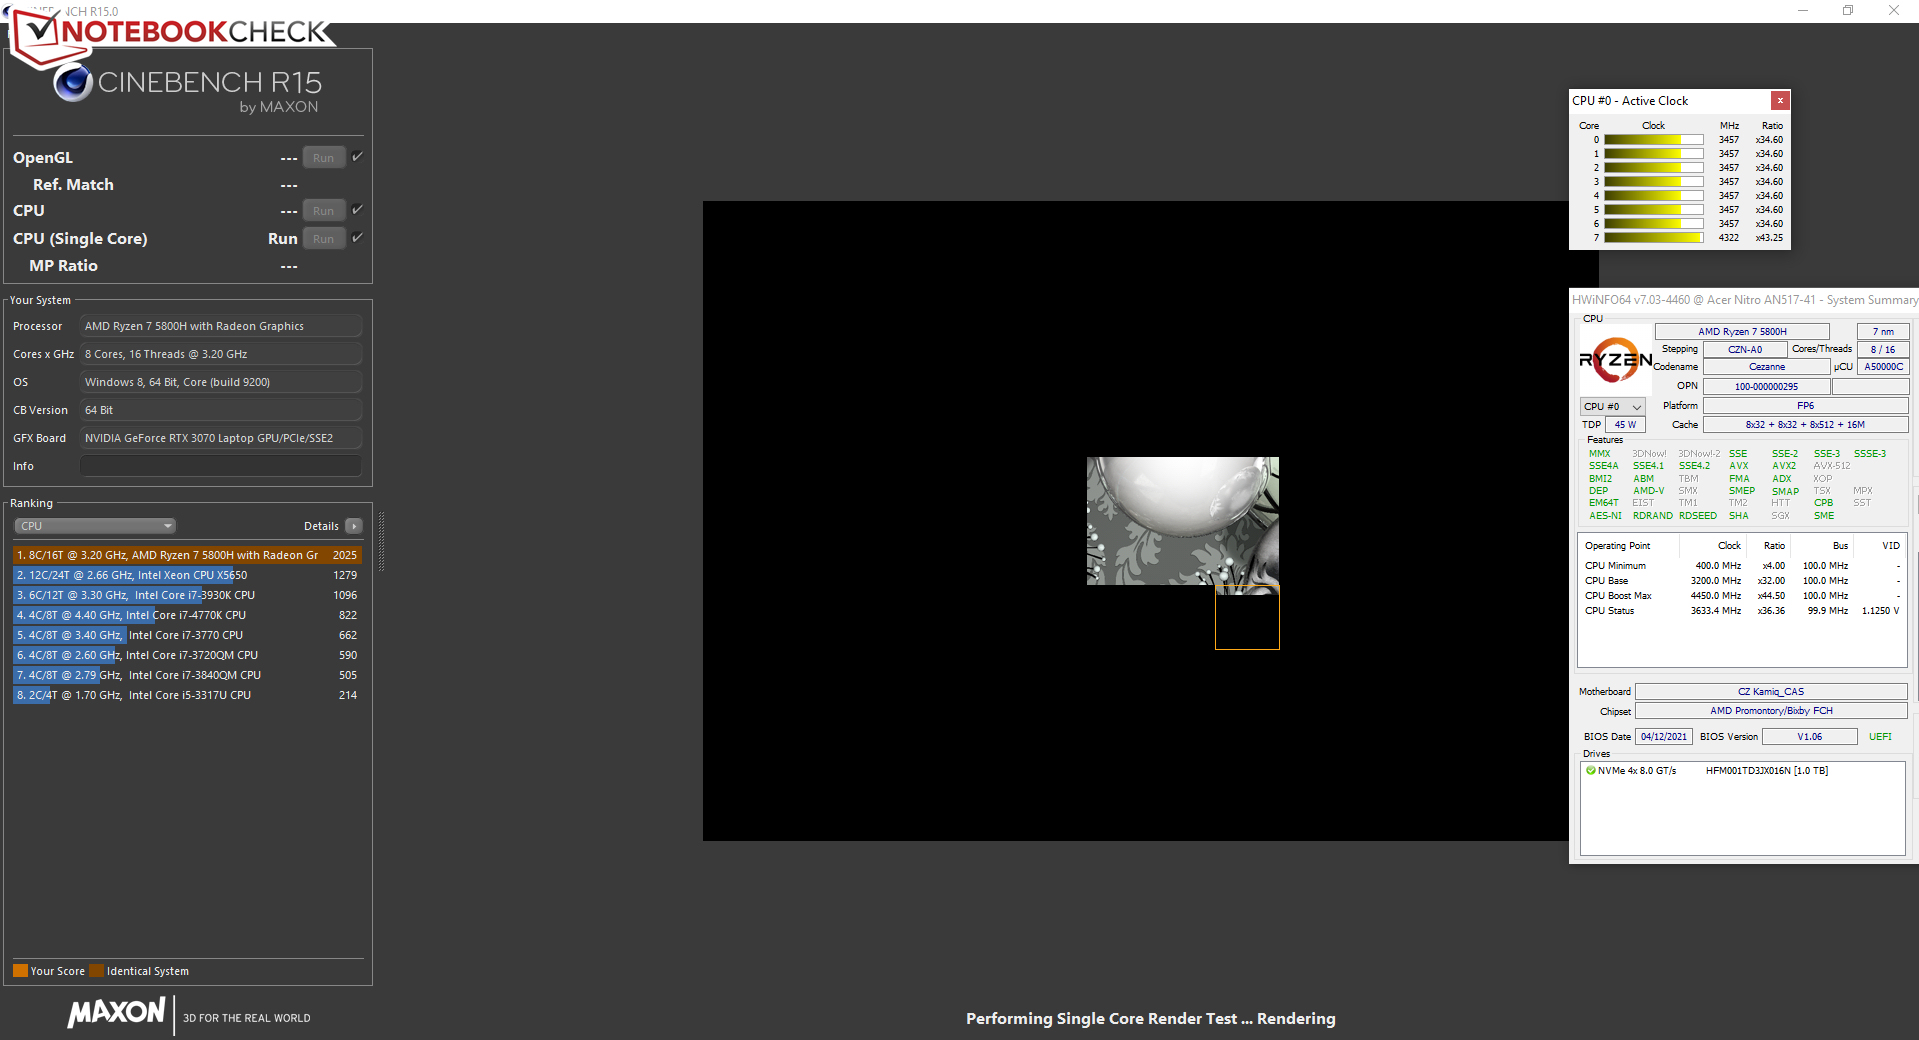
The CPU part of the Ryzen 7-5800H APU (Cezanne) consists of an eight-core processor that operates with a base speed of 3.2 GHz. An increase up to 4.4 GHz is possible via Turbo. Simultaneous multithreading (two threads can be processed per core) is supported.
The multi-thread test of the Cinebench R15 benchmark is processed with 3.7 GHz (mains operation) or 2.5 to 3.5 GHz (battery operation). The single-thread test is always run with 3.4 to 4.4 GHz.
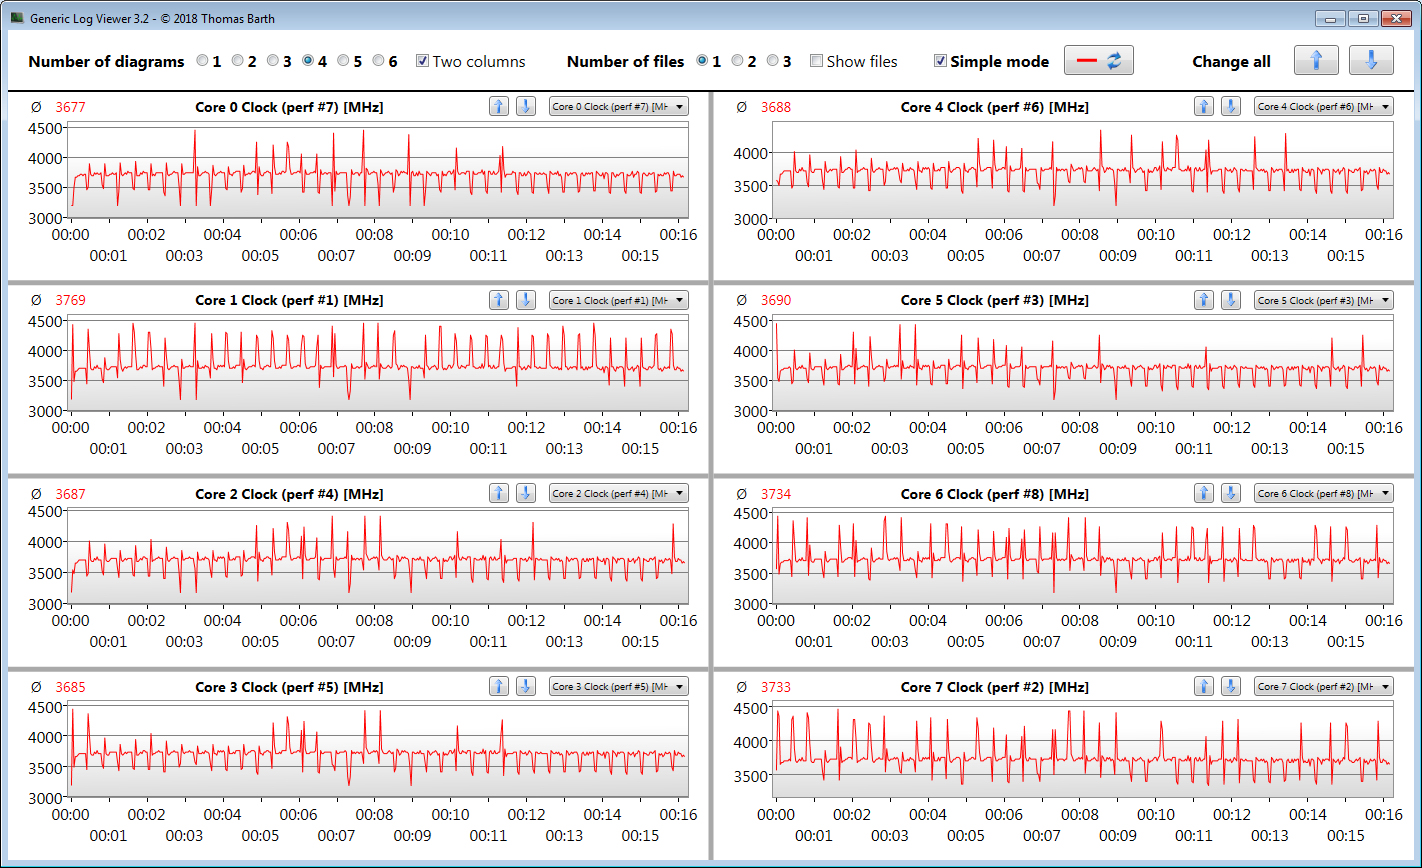
We check whether the CPU Turbo is also used permanently in mains operation by running the multi-thread test of the Cinebench R15 benchmark in a loop for at least 30 minutes. The Turbo is used on a medium level.
* ... smaller is better
System performance
The nimble and smoothly working system offers enough computing power for performance-hungry application areas like gaming, video editing and image processing over the next few years. In addition, the PCMark results are very good.
| PCMark 8 Home Score Accelerated v2 | 5154 points | |
| PCMark 8 Creative Score Accelerated v2 | 6097 points | |
| PCMark 8 Work Score Accelerated v2 | 6217 points | |
| PCMark 10 Score | 6749 points | |
Help | ||
| PCMark 10 / Score | |
| Average of class Gaming (5776 - 9852, n=119, last 2 years) | |
| Asus TUF Gaming A15 FA506QR-AZ061T | |
| Asus TUF Gaming F17 FX706HM | |
| Average AMD Ryzen 7 5800H, NVIDIA GeForce RTX 3070 Laptop GPU (6717 - 6983, n=6) | |
| Acer Nitro 5 AN517-41-R5Z7 | |
| MSI Katana GF76 11UE | |
| Aorus 15G XC | |
| MSI GP76 Leopard 10UG | |
| Schenker XMG Core 17 (Early 2021) | |
| PCMark 10 / Essentials | |
| Average of class Gaming (8840 - 12600, n=123, last 2 years) | |
| Asus TUF Gaming F17 FX706HM | |
| Asus TUF Gaming A15 FA506QR-AZ061T | |
| Acer Nitro 5 AN517-41-R5Z7 | |
| Average AMD Ryzen 7 5800H, NVIDIA GeForce RTX 3070 Laptop GPU (9548 - 10226, n=6) | |
| MSI Katana GF76 11UE | |
| Aorus 15G XC | |
| Schenker XMG Core 17 (Early 2021) | |
| MSI GP76 Leopard 10UG | |
| PCMark 10 / Productivity | |
| Average of class Gaming (6662 - 14612, n=119, last 2 years) | |
| Asus TUF Gaming A15 FA506QR-AZ061T | |
| Acer Nitro 5 AN517-41-R5Z7 | |
| Average AMD Ryzen 7 5800H, NVIDIA GeForce RTX 3070 Laptop GPU (8849 - 9514, n=6) | |
| Asus TUF Gaming F17 FX706HM | |
| MSI Katana GF76 11UE | |
| Aorus 15G XC | |
| MSI GP76 Leopard 10UG | |
| Schenker XMG Core 17 (Early 2021) | |
| PCMark 10 / Digital Content Creation | |
| Average of class Gaming (7440 - 19351, n=119, last 2 years) | |
| Average AMD Ryzen 7 5800H, NVIDIA GeForce RTX 3070 Laptop GPU (8948 - 10389, n=6) | |
| Asus TUF Gaming F17 FX706HM | |
| Asus TUF Gaming A15 FA506QR-AZ061T | |
| Acer Nitro 5 AN517-41-R5Z7 | |
| Aorus 15G XC | |
| MSI Katana GF76 11UE | |
| MSI GP76 Leopard 10UG | |
| Schenker XMG Core 17 (Early 2021) | |
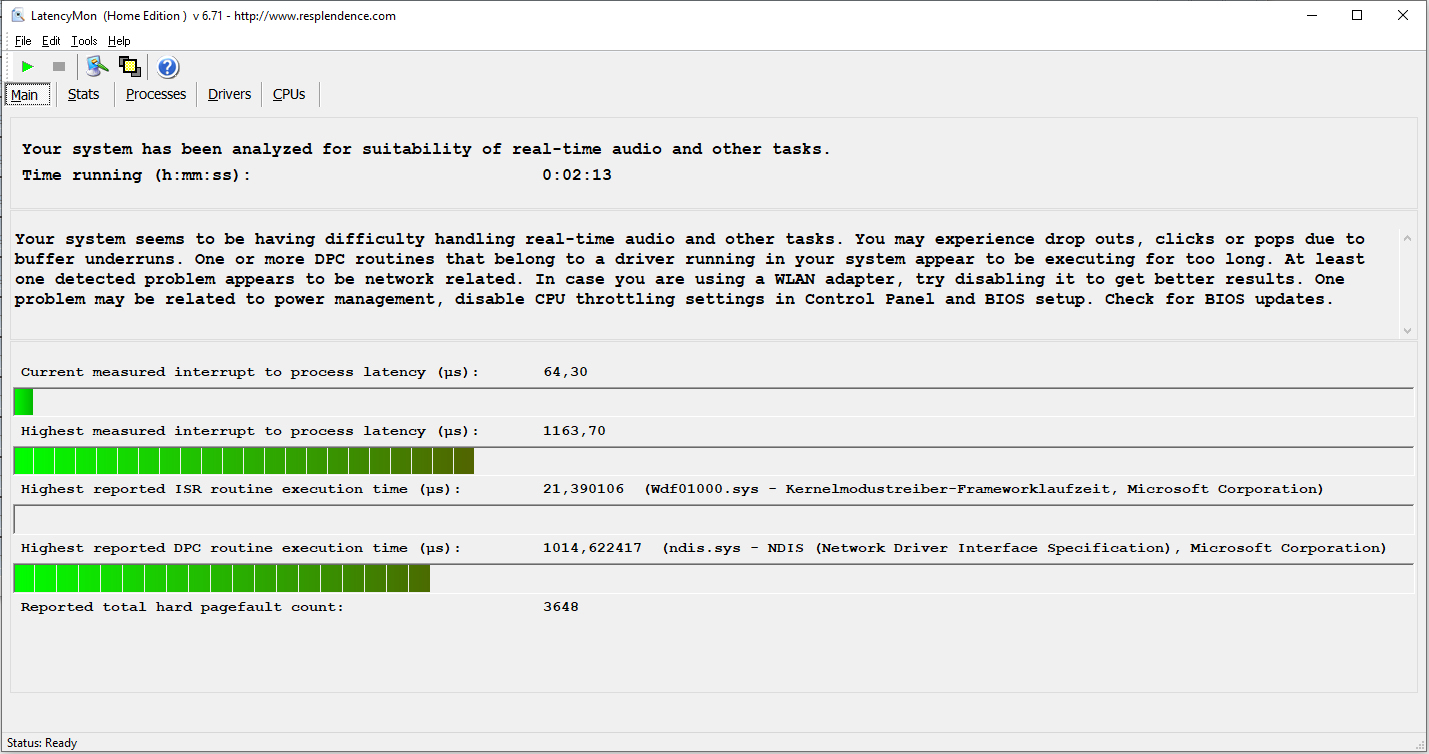
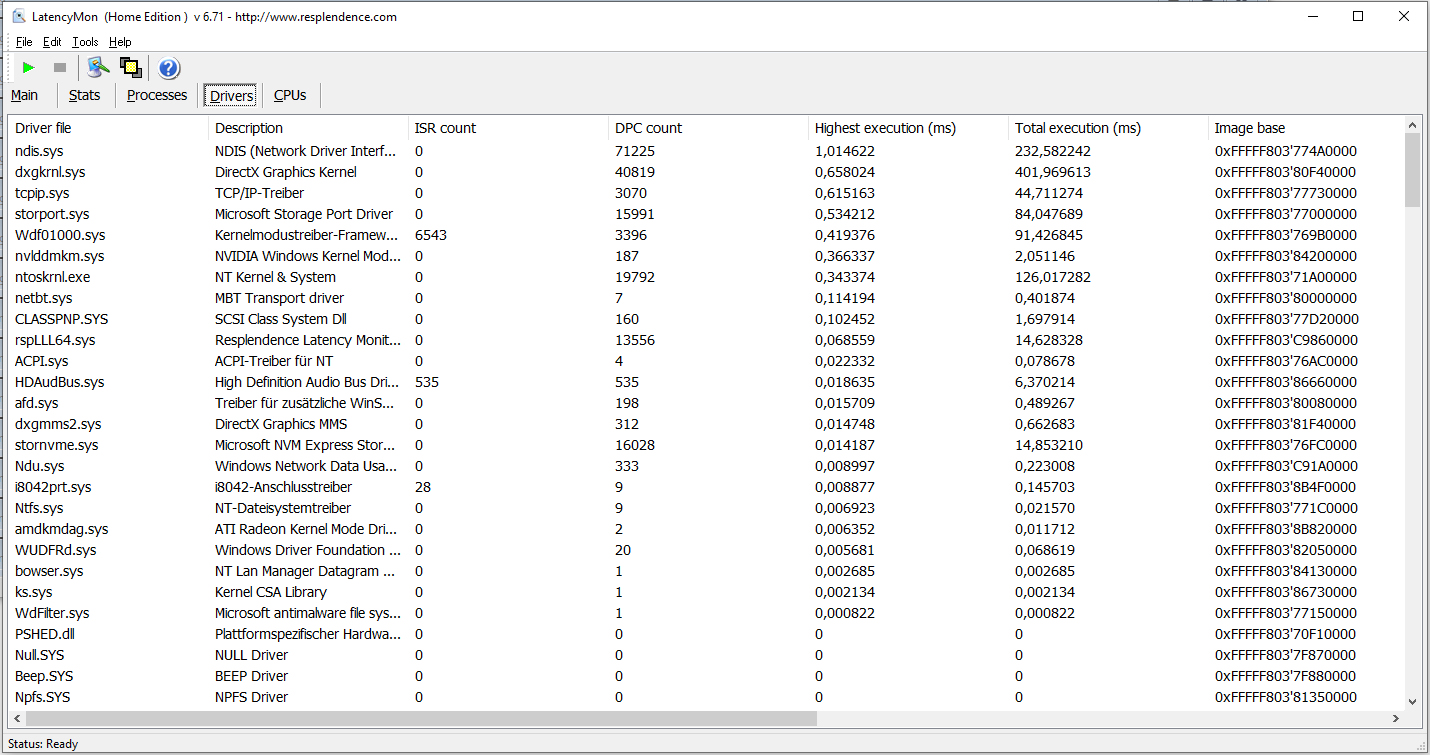
DPC latencies
The standardized latency monitor test (web surfing, 4K video playback, Prime95 high-load) revealed conspicuous DPC latencies. The system does not seem to be suitable for real-time video and audio editing.
| DPC Latencies / LatencyMon - interrupt to process latency (max), Web, Youtube, Prime95 | |
| MSI Katana GF76 11UE | |
| Asus TUF Gaming F17 FX706HM | |
| Acer Nitro 5 AN517-41-R5Z7 | |
| MSI GP76 Leopard 10UG | |
| Schenker XMG Core 17 (Early 2021) | |
* ... smaller is better
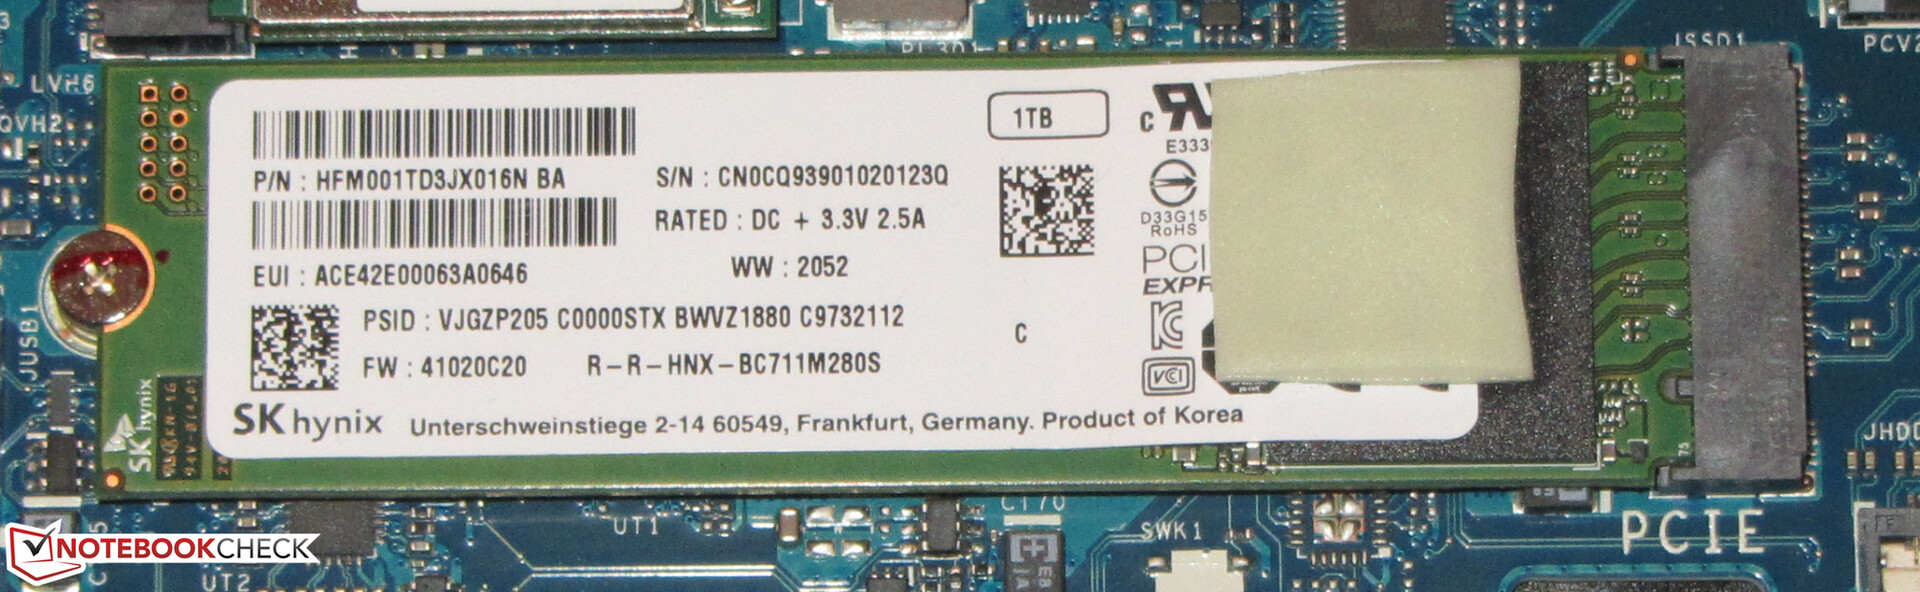
Mass storage
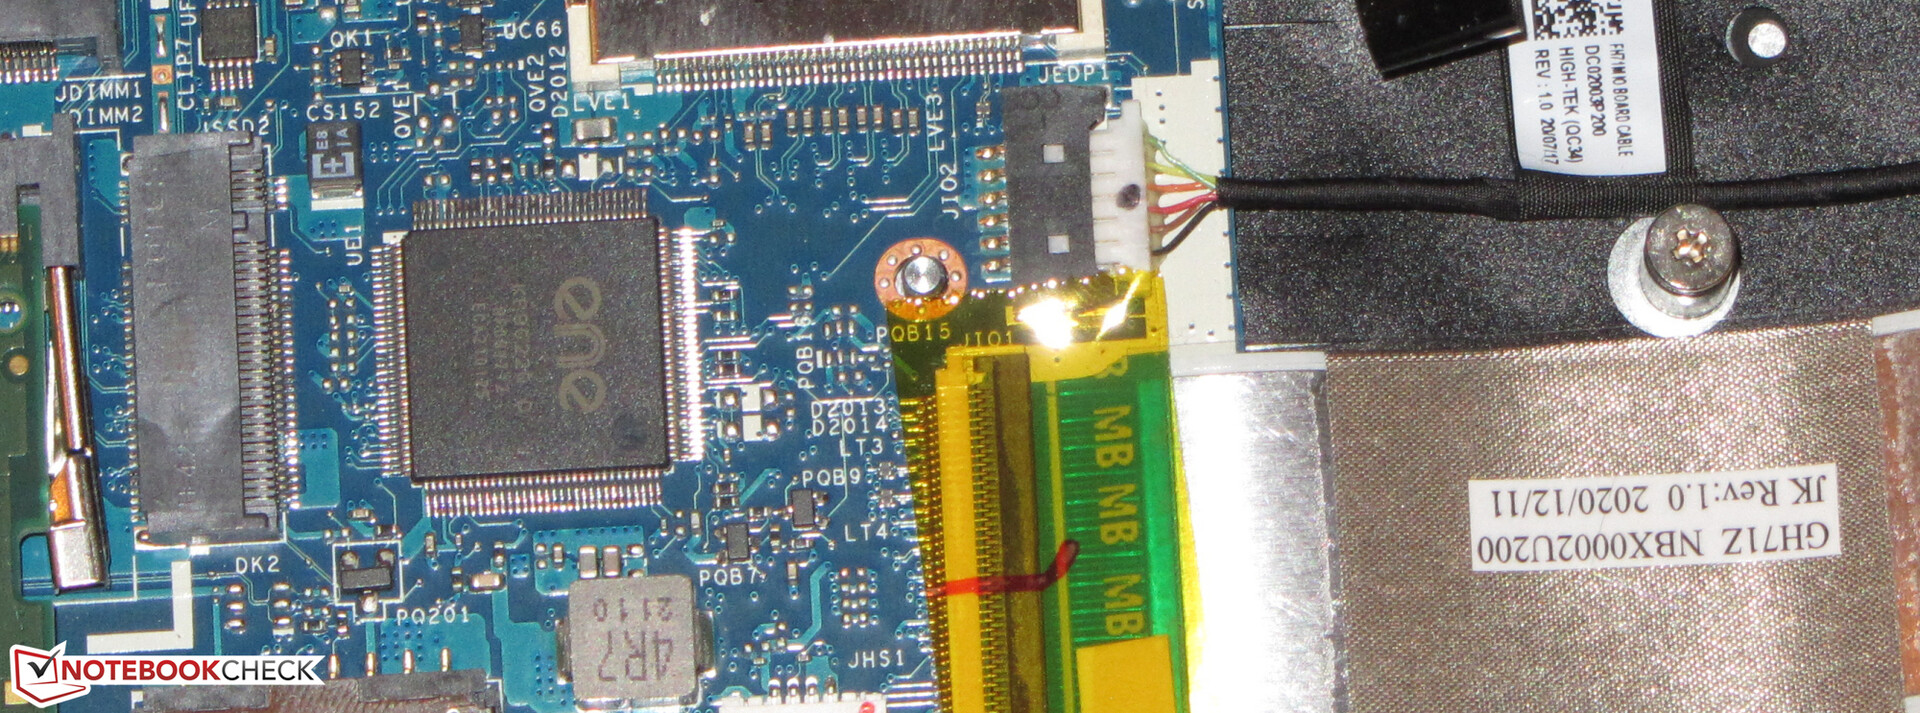
An NVMe SSD (M.2-2280) from SK Hynix serves as the system drive. It provides 1 TB of storage space and delivers good transfer rates. It is not one of the top SSD models.
The notebook also has room for a second M.2-2280 SSD (NVMe) and a 2.5-inch storage device (SATA slot and screws are in the box, the mounting frame is inside the notebook).

| Acer Nitro 5 AN517-41-R5Z7 SK Hynix BC711 1TB HFM001TD3JX016N | MSI Katana GF76 11UE Kingston OM8PCP3512F-AB | Schenker XMG Core 17 (Early 2021) Samsung SSD 970 EVO Plus 1TB | Asus TUF Gaming F17 FX706HM SK Hynix HFM001TD3JX013N | MSI GP76 Leopard 10UG Kingston OM8PCP3512F-AB | Aorus 15G XC ESR512GTLCG-EAC-4 | Asus TUF Gaming A15 FA506QR-AZ061T SK Hynix HFM001TD3JX013N | Average SK Hynix BC711 1TB HFM001TD3JX016N | |
|---|---|---|---|---|---|---|---|---|
| CrystalDiskMark 5.2 / 6 | -38% | 5% | 1% | -37% | -10% | 3% | -0% | |
| Write 4K (MB/s) | 146.7 | 107.3 -27% | 145.7 -1% | 168.8 15% | 143.7 -2% | 137.6 -6% | 182.5 24% | 140.1 ? -4% |
| Read 4K (MB/s) | 63.7 | 45.46 -29% | 51.3 -19% | 72 13% | 45.1 -29% | 45.87 -28% | 73.2 15% | 64.2 ? 1% |
| Write Seq (MB/s) | 2954 | 978 -67% | 3036 3% | 978 -67% | 2304 -22% | 3005 2% | 2944 ? 0% | |
| Read Seq (MB/s) | 1974 | 1255 -36% | 2837 44% | 1163 -41% | 1052 -47% | 2358 19% | 2169 ? 10% | |
| Write 4K Q32T1 (MB/s) | 496.9 | 579 17% | 511 3% | 459.5 -8% | 519 4% | 601 21% | 389.5 -22% | 468 ? -6% |
| Read 4K Q32T1 (MB/s) | 549 | 299.6 -45% | 582 6% | 473.1 -14% | 302.7 -45% | 677 23% | 463.8 -16% | 533 ? -3% |
| Write Seq Q32T1 (MB/s) | 3062 | 978 -68% | 3294 8% | 3129 2% | 981 -68% | 2536 -17% | 3166 3% | 3073 ? 0% |
| Read Seq Q32T1 (MB/s) | 3580 | 1977 -45% | 3522 -2% | 3529 -1% | 1983 -45% | 3372 -6% | 3590 0% | 3582 ? 0% |
| Write 4K Q8T8 (MB/s) | 484.5 | |||||||
| Read 4K Q8T8 (MB/s) | 1518 | |||||||
| AS SSD | -63% | 1% | -1% | -46% | -21% | -1% | 4% | |
| Seq Read (MB/s) | 2891 | 1704 -41% | 2876 -1% | 2837 -2% | 1659 -43% | 2048 -29% | 3133 8% | 2933 ? 1% |
| Seq Write (MB/s) | 2692 | 716 -73% | 2803 4% | 1565 -42% | 921 -66% | 2403 -11% | 2969 10% | 2713 ? 1% |
| 4K Read (MB/s) | 52.6 | 37.77 -28% | 55.3 5% | 55.4 5% | 51 -3% | 48.27 -8% | 55.2 5% | 54.2 ? 3% |
| 4K Write (MB/s) | 134.9 | 66 -51% | 106.9 -21% | 152.9 13% | 120.1 -11% | 101.6 -25% | 129.7 -4% | 134.5 ? 0% |
| 4K-64 Read (MB/s) | 1845 | 441.2 -76% | 1662 -10% | 1327 -28% | 463.5 -75% | 1606 -13% | 1891 2% | 1850 ? 0% |
| 4K-64 Write (MB/s) | 2142 | 735 -66% | 2101 -2% | 1922 -10% | 909 -58% | 1473 -31% | 1795 -16% | 2154 ? 1% |
| Access Time Read * (ms) | 0.191 | 0.067 | 0.035 | 0.179 | 0.131 | 0.052 | ||
| Access Time Write * (ms) | 0.028 | 0.053 -89% | 0.037 -32% | 0.028 -0% | 0.032 -14% | 0.038 -36% | 0.028 -0% | 0.028 ? -0% |
| Score Read (Points) | 2186 | 649 -70% | 2005 -8% | 1666 -24% | 680 -69% | 1859 -15% | 2259 3% | 2197 ? 1% |
| Score Write (Points) | 2546 | 872 -66% | 2488 -2% | 2232 -12% | 1121 -56% | 1815 -29% | 2221 -13% | 2560 ? 1% |
| Score Total (Points) | 5842 | 1816 -69% | 5520 -6% | 4695 -20% | 2130 -64% | 4645 -20% | 5630 -4% | 5871 ? 0% |
| Copy ISO MB/s (MB/s) | 2130 | 912 -57% | 2029 -5% | 2081 -2% | 1188 -44% | 2195 ? 3% | ||
| Copy Program MB/s (MB/s) | 642 | 278.9 -57% | 691 8% | 734 14% | 488.1 -24% | 660 ? 3% | ||
| Copy Game MB/s (MB/s) | 821 | 144.6 -82% | 1513 84% | 1617 97% | 878 7% | 1157 ? 41% | ||
| Total Average (Program / Settings) | -51% /
-54% | 3% /
3% | 0% /
-0% | -42% /
-42% | -16% /
-17% | 1% /
1% | 2% /
3% |
* ... smaller is better
Continuous load read: DiskSpd Read Loop, Queue Depth 8
Graphics card
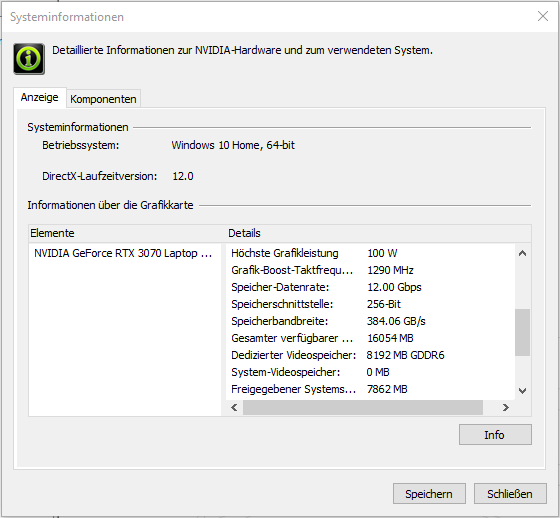
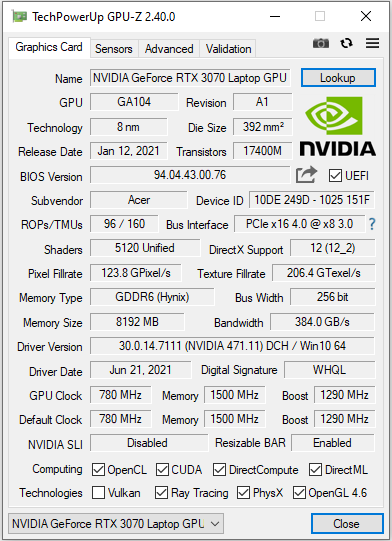
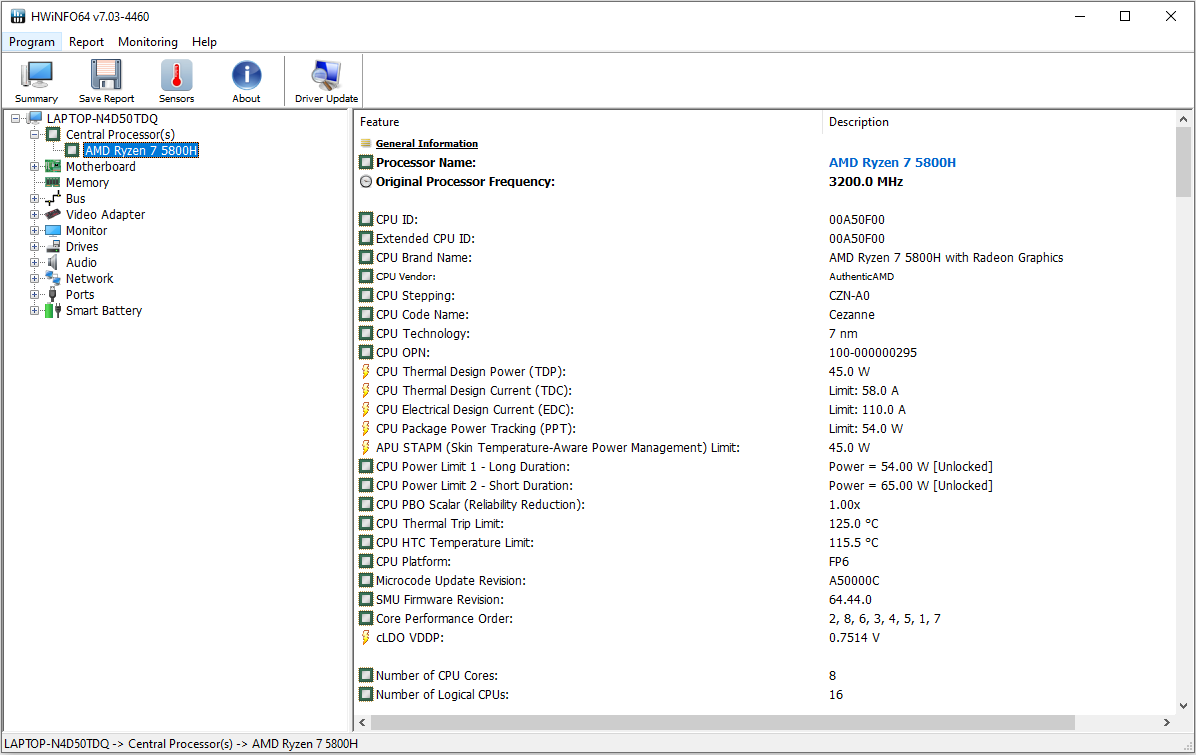
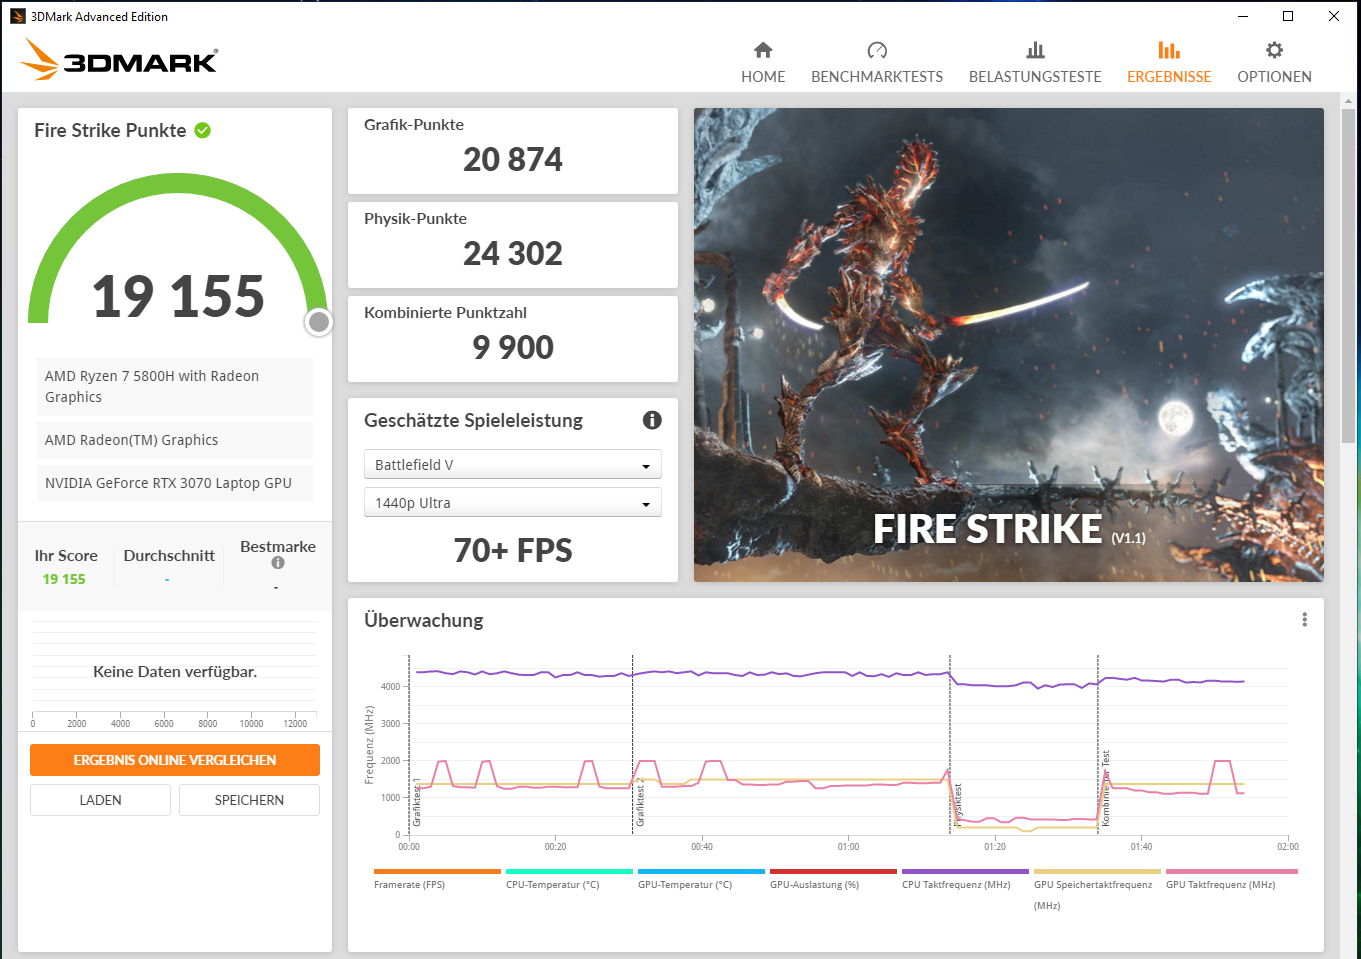
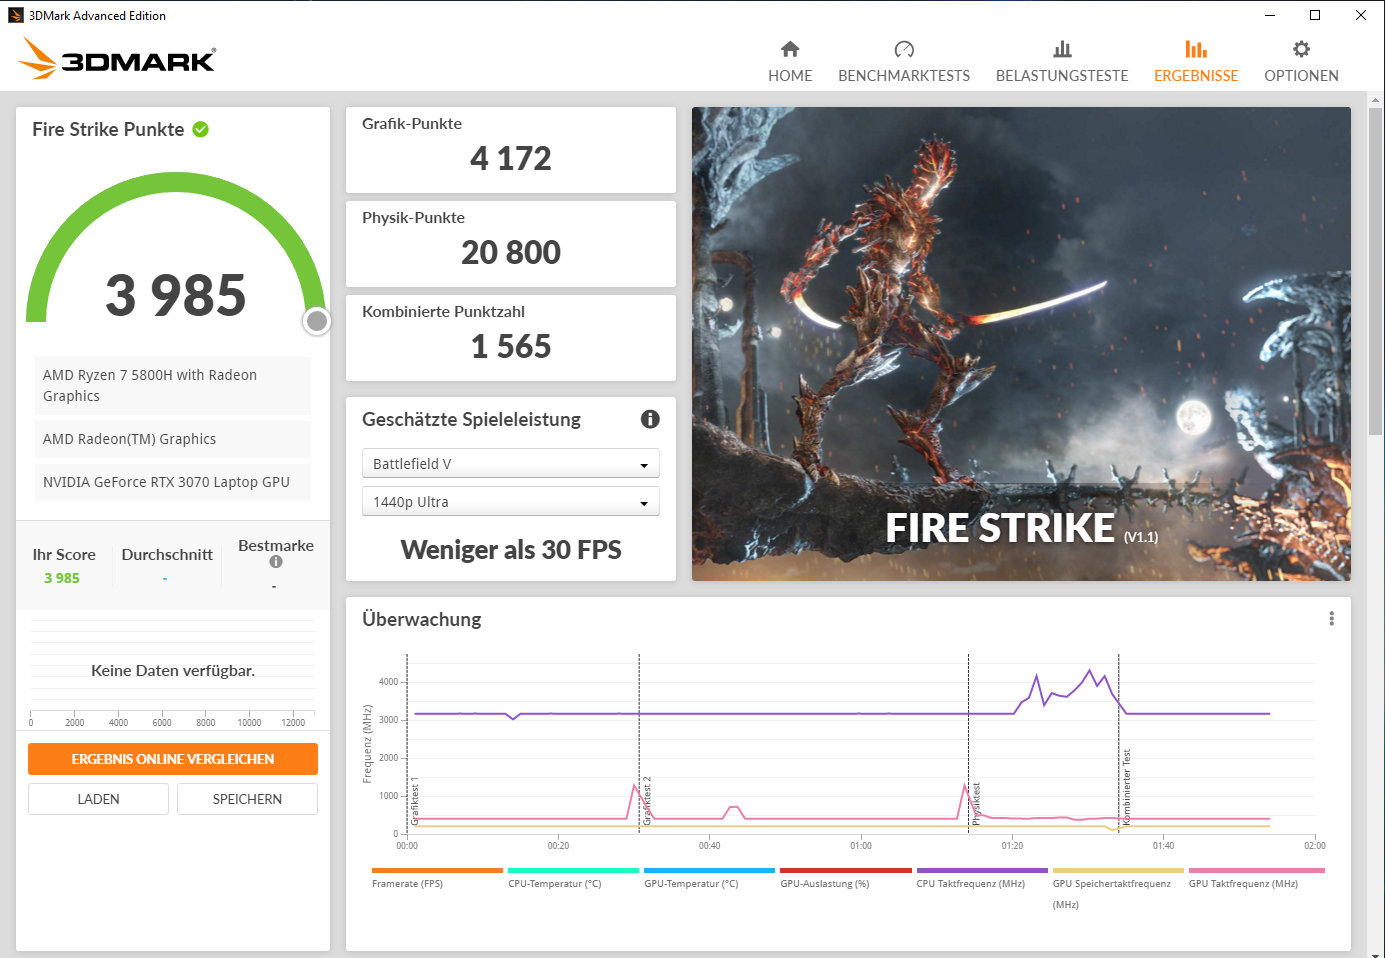
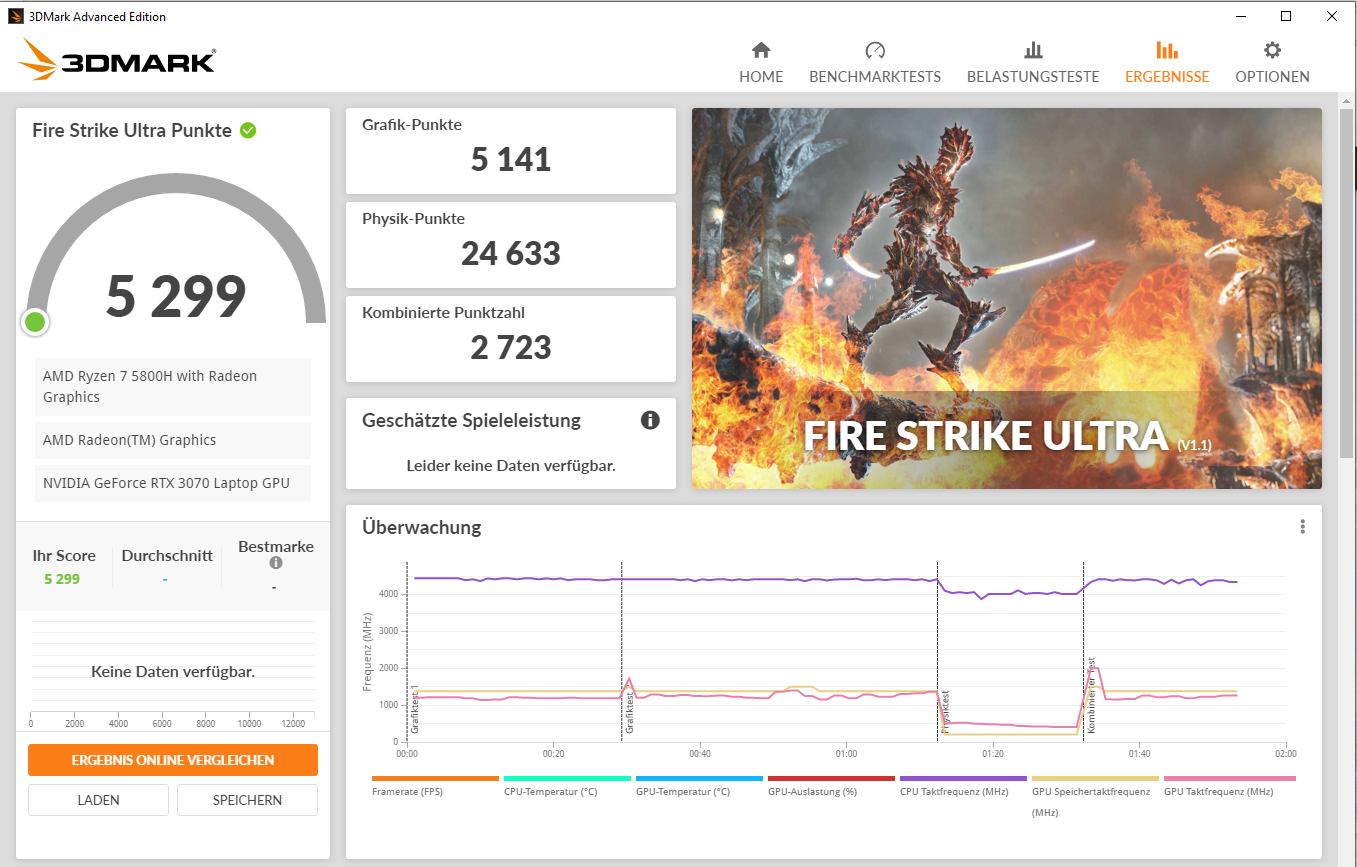
The actual performance of an RTX-3000 graphics core depends on the maximum TGP that a notebook manufacturer chooses within the limits defined by Nvidia. Acer grants the GeForce RTX-3070 Laptop GPU (Overview of all RTX-3070 laptops including the TGPs) a maximum TGP of 100 watts.
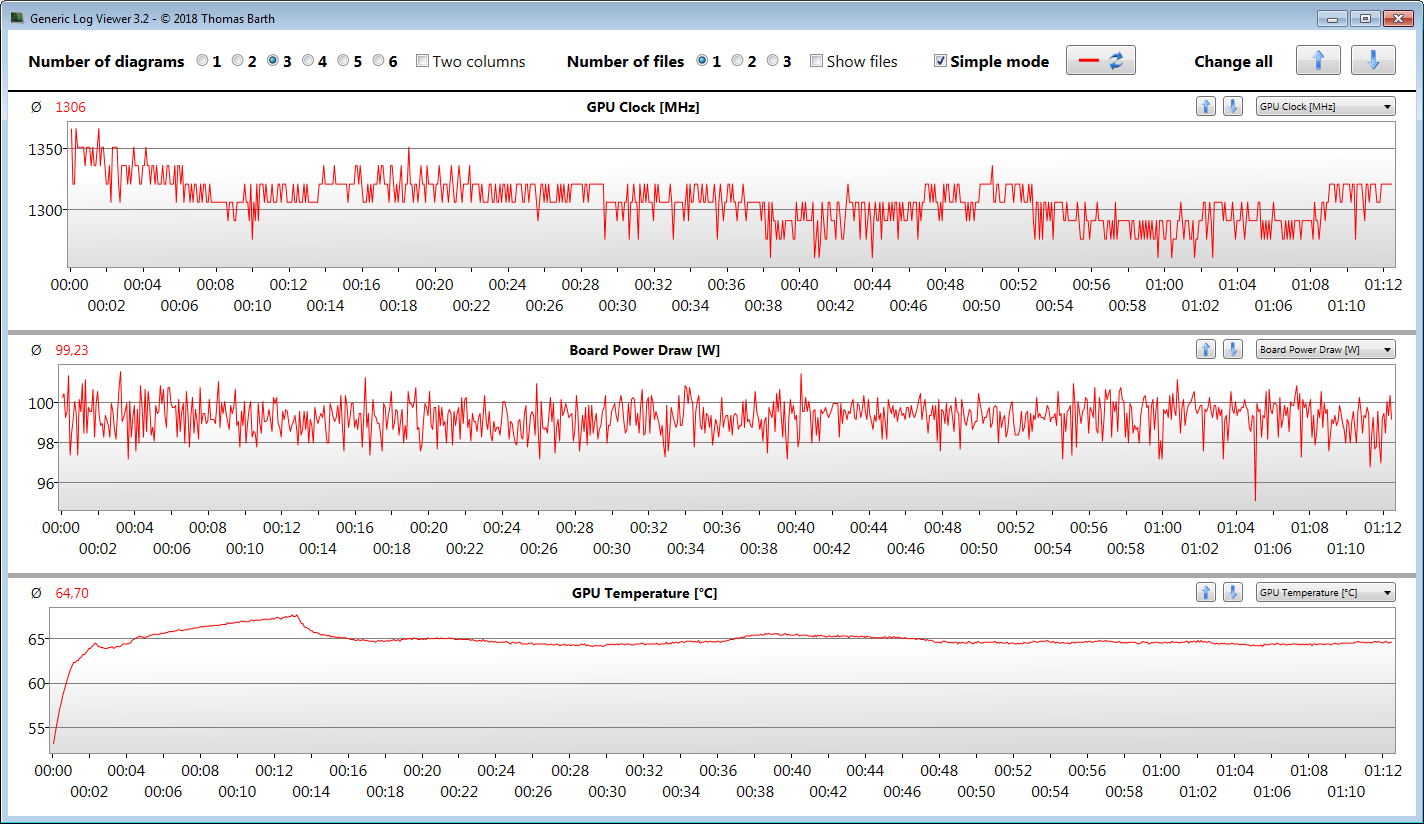
The GPU does decently and delivers results on a below-average RTX-3070 level. There is room for improvement: A firmware update released by Acer increases the GPU performance a bit and brings the benchmark results closer to the RTX-3070 average.
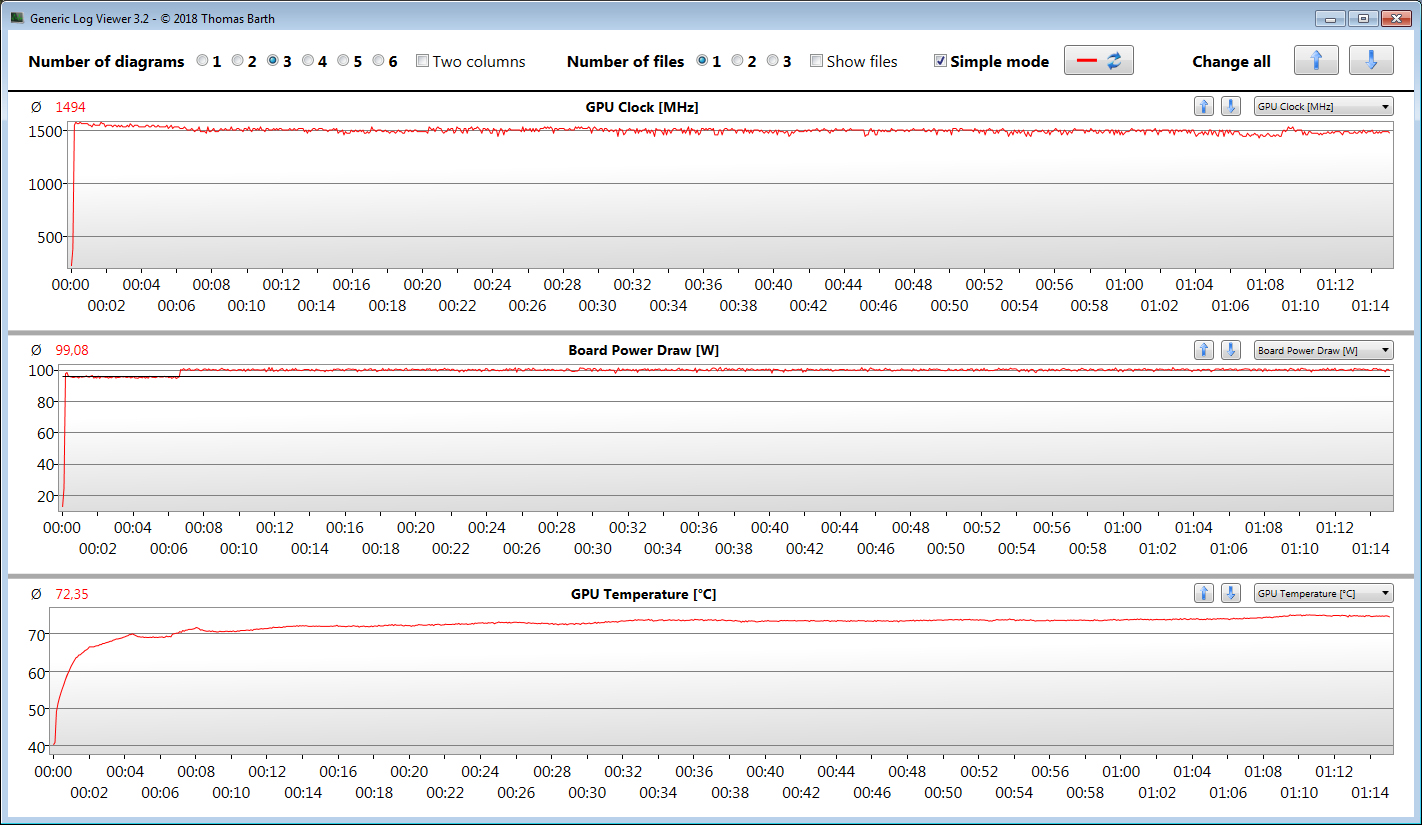
However, the update does not cause an increase in TGP - it remains at 100 watts according to Nvidia's system info. Presumably, Acer has moved the temperature limits upwards -at least that is what the Witcher 3 test shows. After the FW update, the GPU runs through the test with a higher clock and reaches a higher average temperature (65 °C vs. 72 °C/149 °F vs. ~162 °F).
The RTX 3070 can draw on fast GDDR6 graphics memory (8,192 MB). The Vega-8 graphics core integrated in the processor is active and the notebook works with Nvidia's Optimus switching graphics solution.
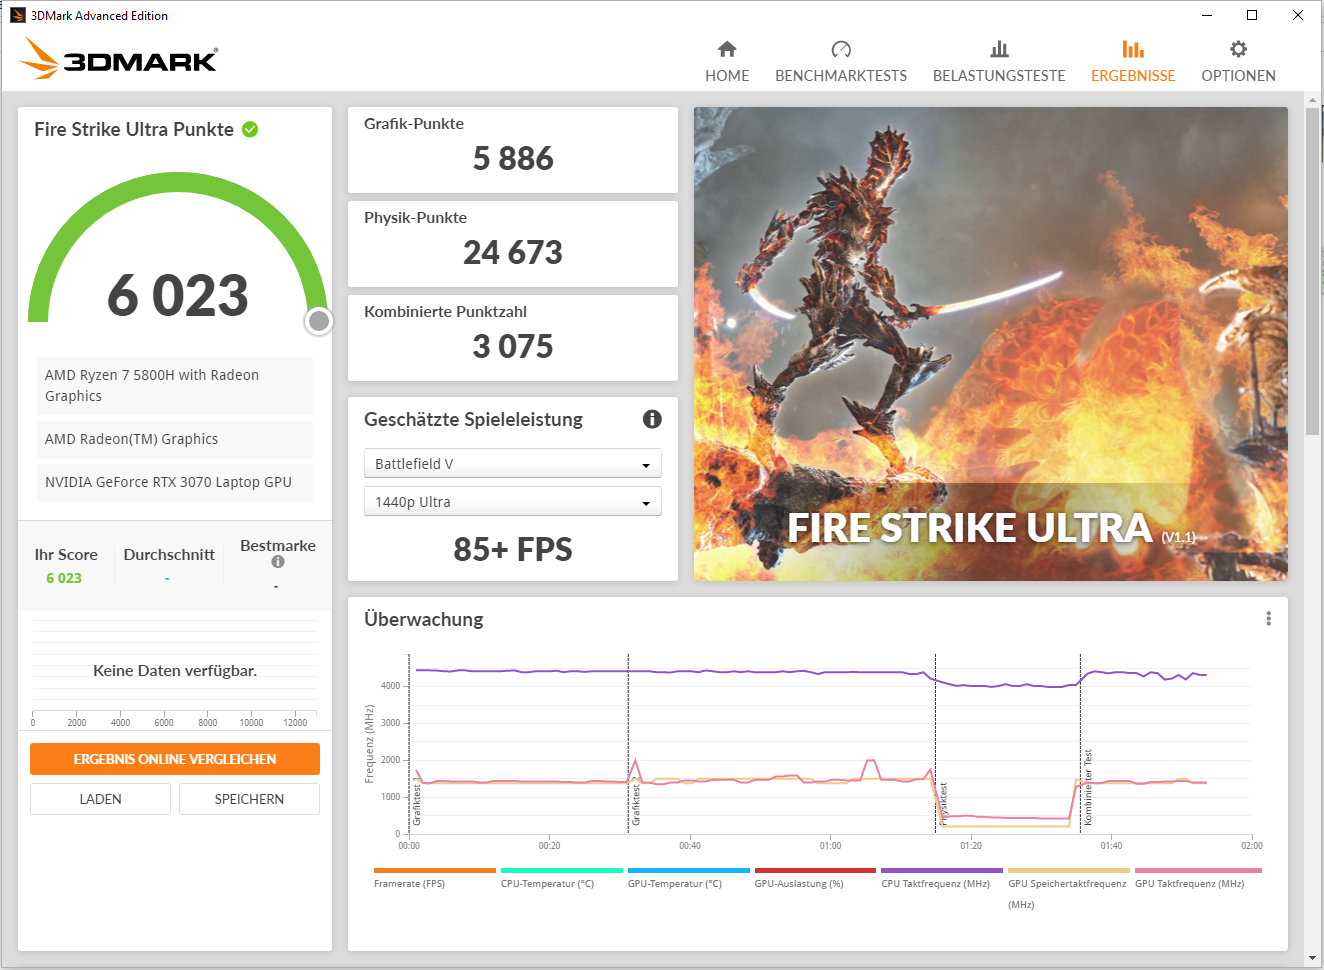
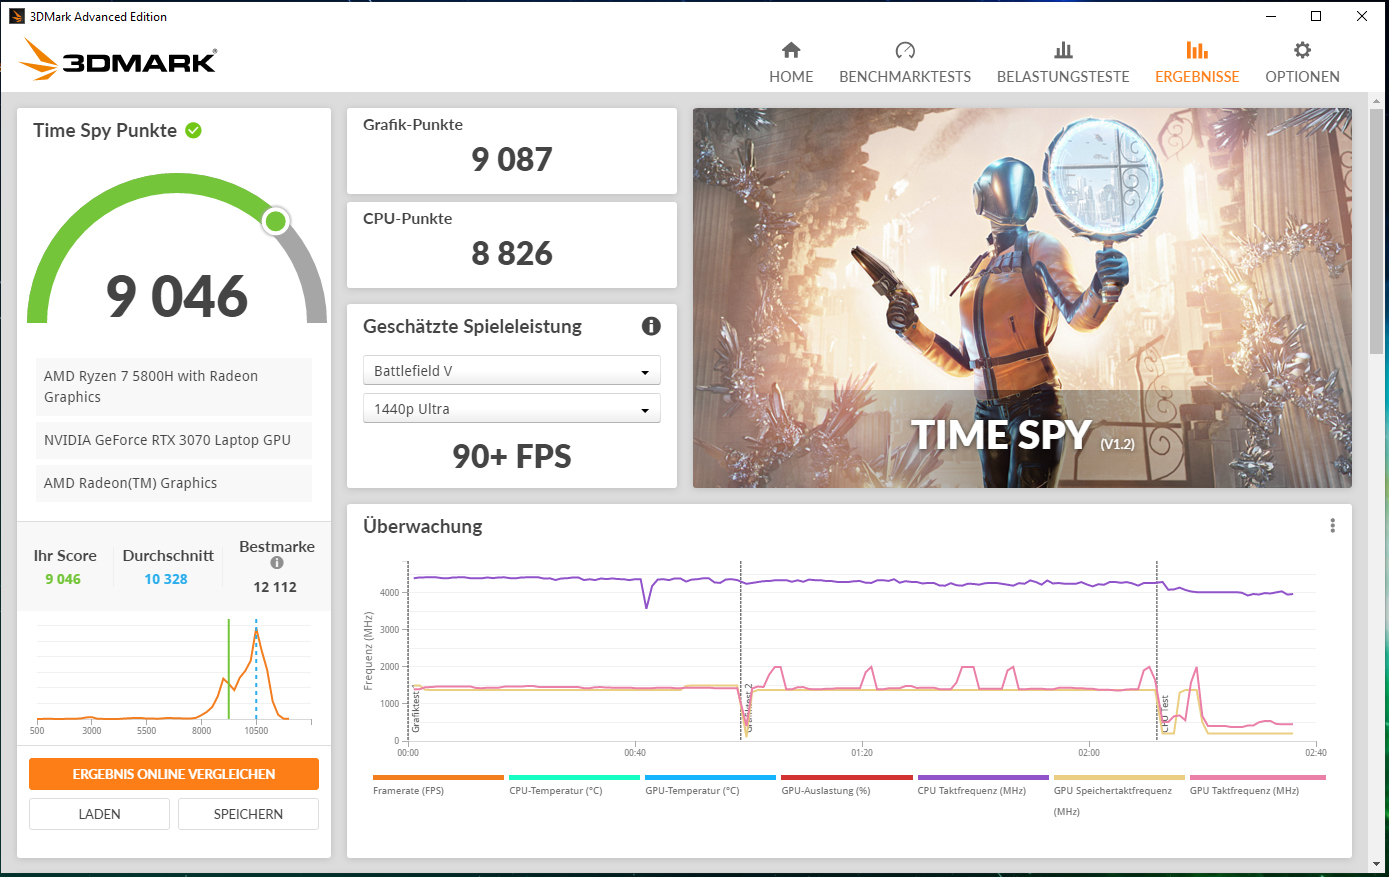
| 3DMark 11 Performance | 22631 points | |
| 3DMark Cloud Gate Standard Score | 45032 points | |
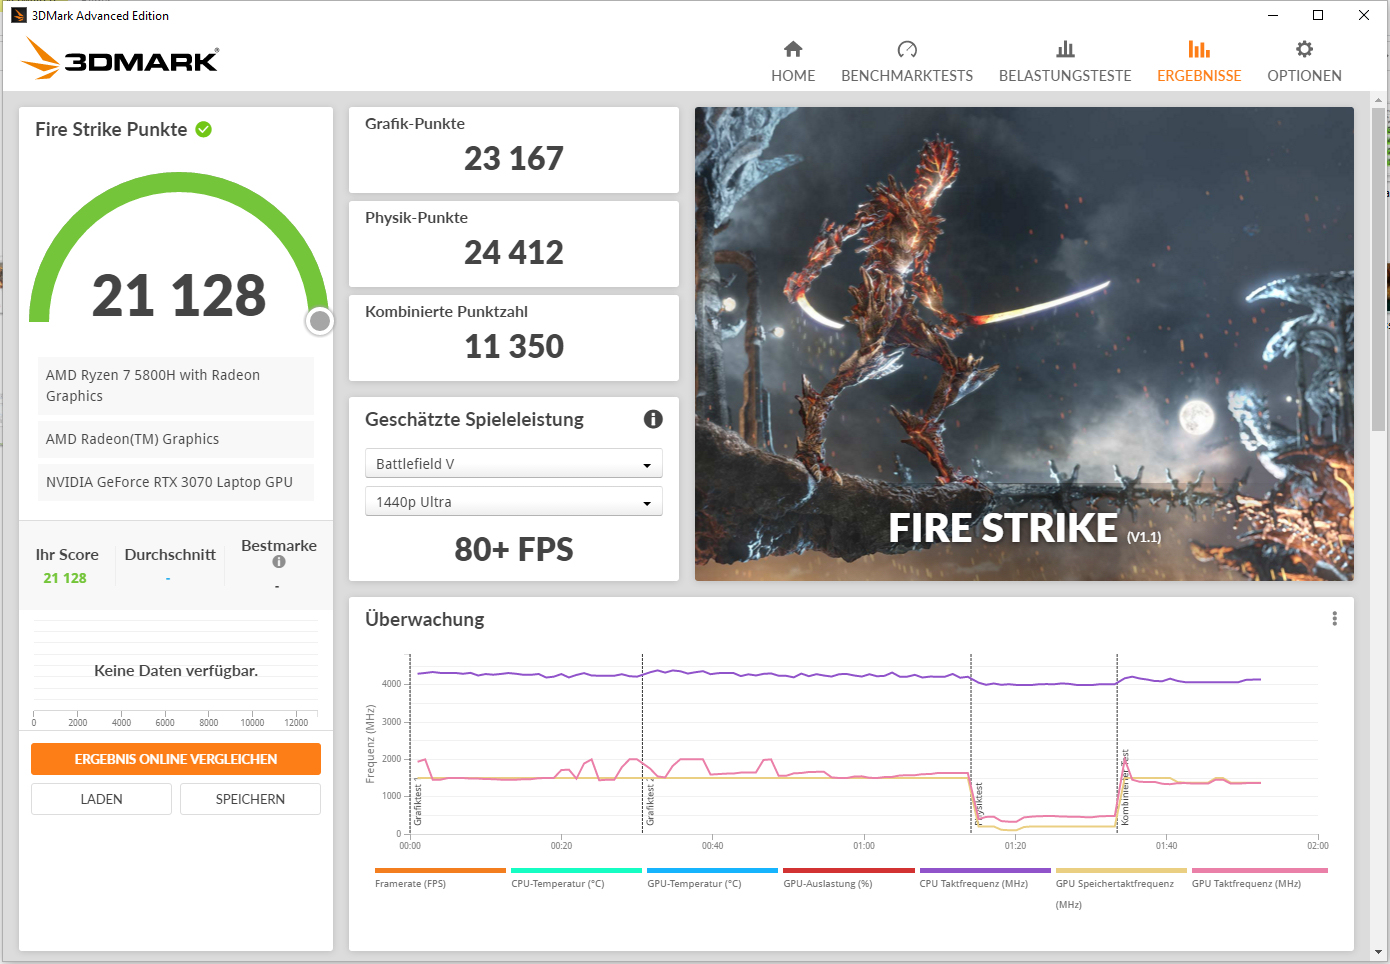
| 3DMark Fire Strike Score | 19155 points | |
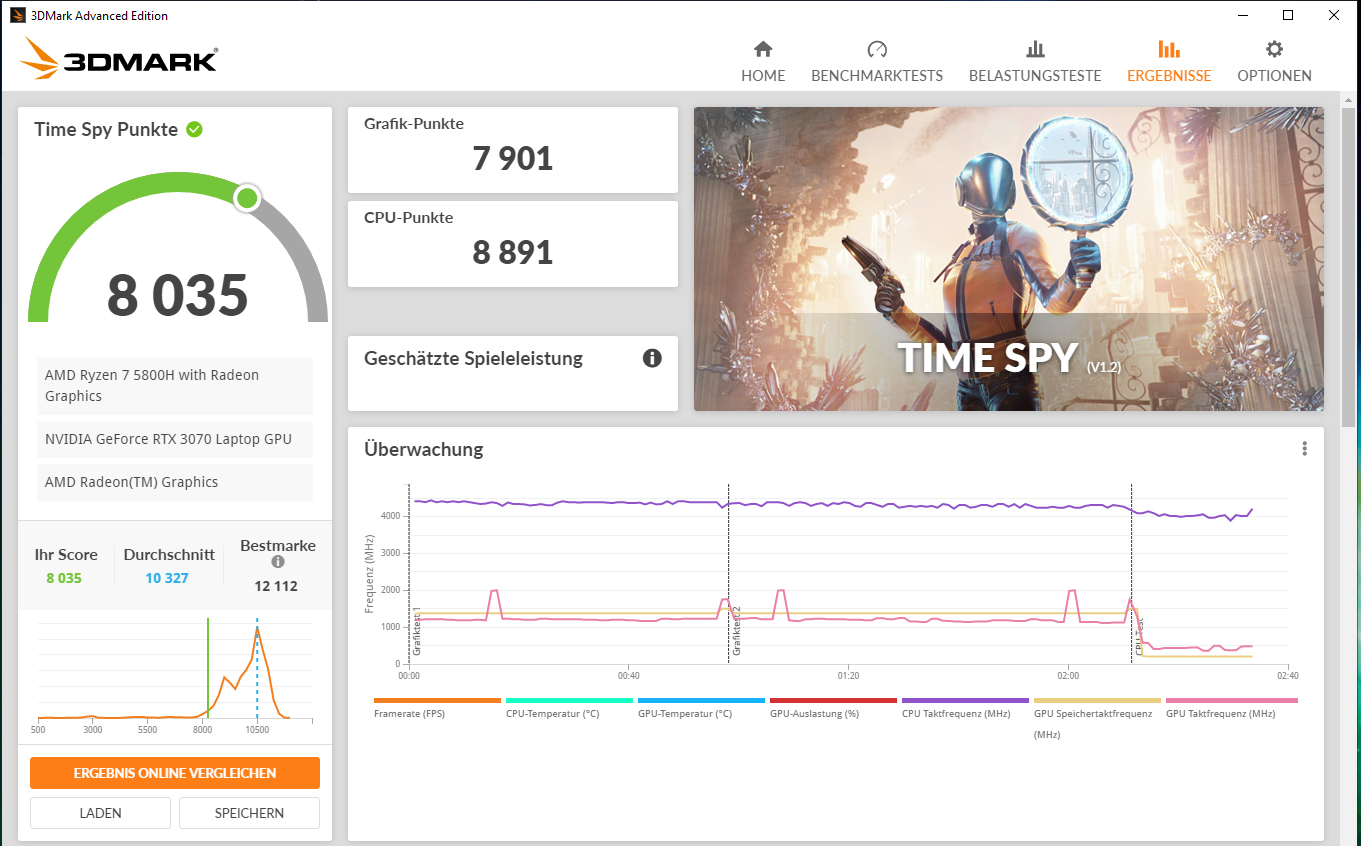
| 3DMark Time Spy Score | 8035 points | |
Help | ||
| 3DMark 11 - 1280x720 Performance GPU | |
| Average of class Gaming (13523 - 80022, n=136, last 2 years) | |
| MSI GP76 Leopard 10UG | |
| Aorus 15G XC | |
| Average NVIDIA GeForce RTX 3070 Laptop GPU (12535 - 38275, n=54) | |
| Acer Nitro 5 AN517-41-R5Z7 (FW-Update) | |
| Asus TUF Gaming A15 FA506QR-AZ061T | |
| Acer Nitro 5 AN517-41-R5Z7 | |
| Schenker XMG Core 17 (Early 2021) | |
| Asus TUF Gaming F17 FX706HM | |
| MSI Katana GF76 11UE | |
| 3DMark | |
| 1920x1080 Fire Strike Graphics | |
| Average of class Gaming (6487 - 62849, n=150, last 2 years) | |
| MSI GP76 Leopard 10UG | |
| Aorus 15G XC | |
| Average NVIDIA GeForce RTX 3070 Laptop GPU (7178 - 29128, n=52) | |
| Acer Nitro 5 AN517-41-R5Z7 (FW-Update) | |
| Asus TUF Gaming A15 FA506QR-AZ061T | |
| Acer Nitro 5 AN517-41-R5Z7 | |
| Schenker XMG Core 17 (Early 2021) | |
| Asus TUF Gaming F17 FX706HM | |
| MSI Katana GF76 11UE | |
| 2560x1440 Time Spy Graphics | |
| Average of class Gaming (2295 - 25984, n=147, last 2 years) | |
| MSI GP76 Leopard 10UG | |
| Aorus 15G XC | |
| Average NVIDIA GeForce RTX 3070 Laptop GPU (2644 - 11019, n=53) | |
| Acer Nitro 5 AN517-41-R5Z7 (FW-Update) | |
| Asus TUF Gaming A15 FA506QR-AZ061T | |
| Acer Nitro 5 AN517-41-R5Z7 | |
| Schenker XMG Core 17 (Early 2021) | |
| Asus TUF Gaming F17 FX706HM | |
| MSI Katana GF76 11UE | |
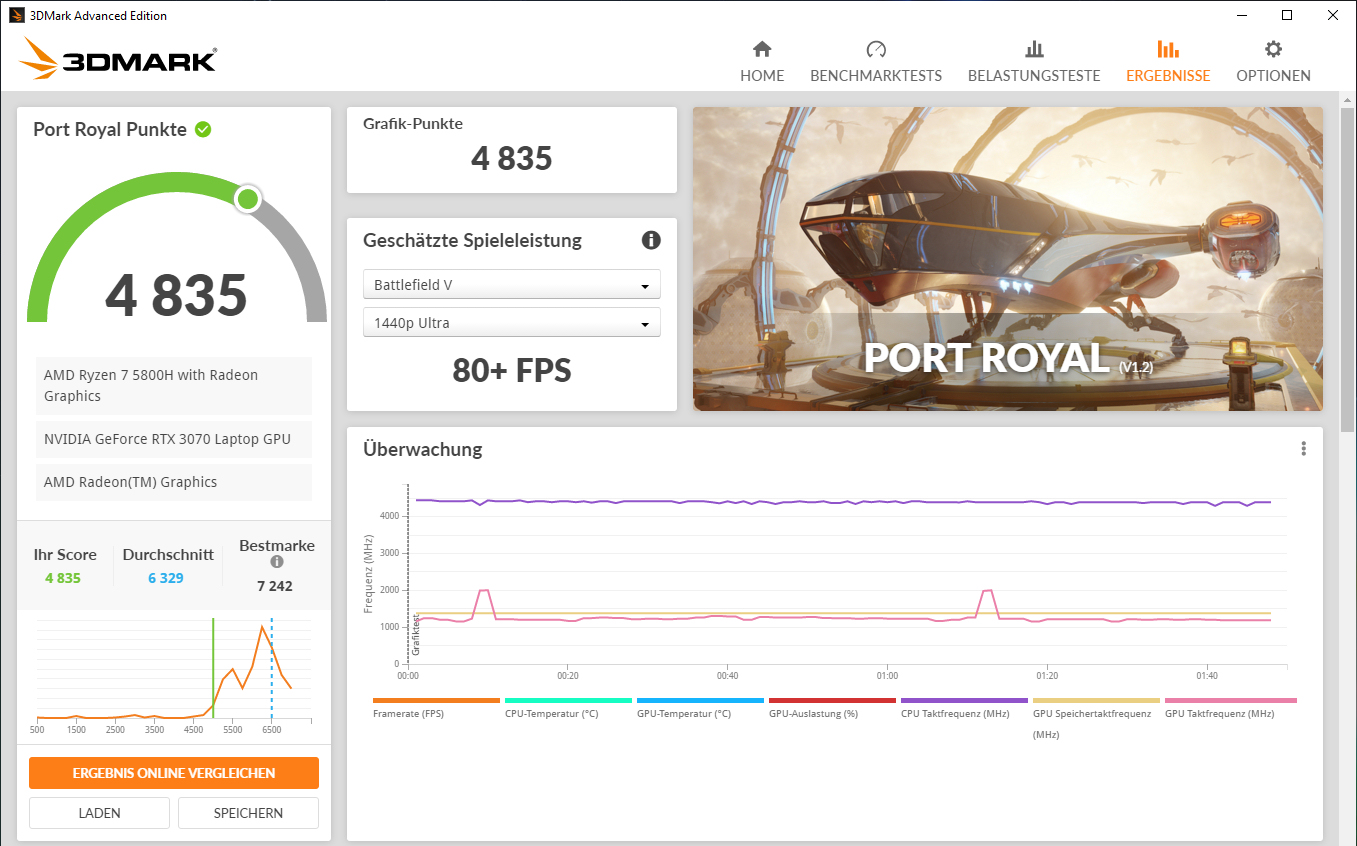
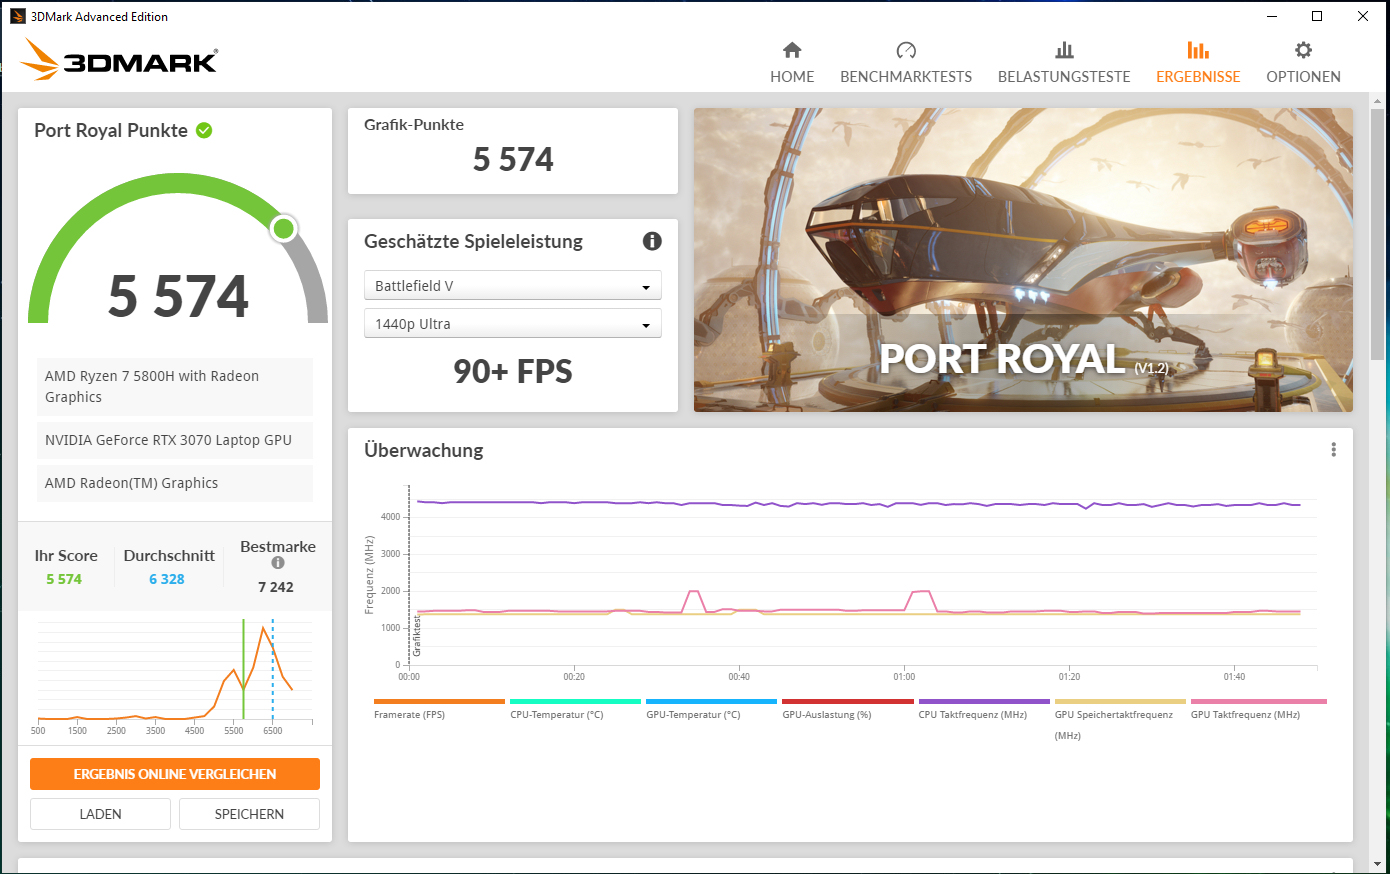
| 2560x1440 Port Royal Graphics | |
| Average of class Gaming (984 - 16978, n=81, last 2 years) | |
| Average NVIDIA GeForce RTX 3070 Laptop GPU (1640 - 6542, n=39) | |
| Acer Nitro 5 AN517-41-R5Z7 (FW-Update) | |
| Acer Nitro 5 AN517-41-R5Z7 | |
| Schenker XMG Core 17 (Early 2021) | |
| MSI Katana GF76 11UE | |
Gaming performance
The laptop displays all current games smoothly on the screen. FHD resolution (1,920 x 1,080 pixels) and maximum quality settings can usually be selected. The Nitro delivers below-average frame rates compared with the average of the RTX-3070 notebooks tested so far. After running the aforementioned FW update, the frame rates of some games increase slightly and move closer to the RTX-3070 average.
| The Witcher 3 - 1920x1080 Ultra Graphics & Postprocessing (HBAO+) | |
| Average of class Gaming (18.4 - 240, n=60, last 2 years) | |
| MSI GP76 Leopard 10UG | |
| Aorus 15G XC | |
| Average NVIDIA GeForce RTX 3070 Laptop GPU (34.9 - 109, n=52) | |
| Acer Nitro 5 AN517-41-R5Z7 (FW-Update) | |
| Schenker XMG Core 17 (Early 2021) | |
| Acer Nitro 5 AN517-41-R5Z7 | |
| Asus TUF Gaming A15 FA506QR-AZ061T | |
| Asus TUF Gaming F17 FX706HM | |
| MSI Katana GF76 11UE | |
| Dota 2 Reborn - 1920x1080 ultra (3/3) best looking | |
| Average of class Gaming (65.1 - 248, n=143, last 2 years) | |
| MSI Katana GF76 11UE | |
| Asus TUF Gaming F17 FX706HM | |
| Average NVIDIA GeForce RTX 3070 Laptop GPU (26.9 - 163.9, n=58) | |
| Aorus 15G XC | |
| Schenker XMG Core 17 (Early 2021) | |
| MSI GP76 Leopard 10UG | |
| Acer Nitro 5 AN517-41-R5Z7 | |
| Asus TUF Gaming A15 FA506QR-AZ061T | |
| Acer Nitro 5 AN517-41-R5Z7 (FW-Update) | |
| X-Plane 11.11 - 1920x1080 high (fps_test=3) | |
| Average of class Gaming (33.4 - 150.2, n=146, last 2 years) | |
| MSI Katana GF76 11UE | |
| Average NVIDIA GeForce RTX 3070 Laptop GPU (12.4 - 118.8, n=61) | |
| MSI GP76 Leopard 10UG | |
| Asus TUF Gaming F17 FX706HM | |
| Aorus 15G XC | |
| Acer Nitro 5 AN517-41-R5Z7 (FW-Update) | |
| Acer Nitro 5 AN517-41-R5Z7 | |
| Schenker XMG Core 17 (Early 2021) | |
| Asus TUF Gaming A15 FA506QR-AZ061T | |
| Final Fantasy XV Benchmark - 1920x1080 High Quality | |
| Average of class Gaming (19.2 - 215, n=141, last 2 years) | |
| MSI GP76 Leopard 10UG | |
| Average NVIDIA GeForce RTX 3070 Laptop GPU (27.9 - 107, n=49) | |
| Acer Nitro 5 AN517-41-R5Z7 (1.3, FW-Update) | |
| Asus TUF Gaming A15 FA506QR-AZ061T (1.3) | |
| Schenker XMG Core 17 (Early 2021) (1.3) | |
| Acer Nitro 5 AN517-41-R5Z7 (1.3) | |
| MSI Katana GF76 11UE (1.3) | |
| Asus TUF Gaming F17 FX706HM (1.3) | |
| GTA V - 1920x1080 Highest Settings possible AA:4xMSAA + FX AF:16x | |
| Average of class Gaming (12.1 - 186.9, n=129, last 2 years) | |
| Average NVIDIA GeForce RTX 3070 Laptop GPU (21.7 - 125.8, n=50) | |
| Schenker XMG Core 17 (Early 2021) | |
| Acer Nitro 5 AN517-41-R5Z7 (FW-Update) | |
| Asus TUF Gaming A15 FA506QR-AZ061T | |
| Acer Nitro 5 AN517-41-R5Z7 | |
| MSI Katana GF76 11UE | |
| Asus TUF Gaming F17 FX706HM | |
| Strange Brigade - 1920x1080 ultra AA:ultra AF:16 | |
| Average of class Gaming (38.9 - 456, n=128, last 2 years) | |
| Average NVIDIA GeForce RTX 3070 Laptop GPU (36.2 - 194, n=46) | |
| Acer Nitro 5 AN517-41-R5Z7 (1.47.22.14 D3D12, FW-Update) | |
| Asus TUF Gaming A15 FA506QR-AZ061T (1.47.22.14 D3D12) | |
| Acer Nitro 5 AN517-41-R5Z7 (1.47.22.14 D3D12) | |
| Schenker XMG Core 17 (Early 2021) (1.47.22.14 D3D12) | |
| Asus TUF Gaming F17 FX706HM (1.47.22.14 D3D12) | |
| MSI Katana GF76 11UE (1.47.22.14 D3D12) | |
| Dirt 5 - 1920x1080 Ultra High Preset | |
| Average NVIDIA GeForce RTX 3070 Laptop GPU (50 - 96, n=11) | |
| Acer Nitro 5 AN517-41-R5Z7 (FW-Update) | |
| Schenker XMG Core 17 (Early 2021) | |
| Acer Nitro 5 AN517-41-R5Z7 | |
| MSI Katana GF76 11UE | |
| Far Cry 5 - 1920x1080 Ultra Preset AA:T | |
| Average of class Gaming (70 - 174, n=48, last 2 years) | |
| MSI GP76 Leopard 10UG | |
| Average NVIDIA GeForce RTX 3070 Laptop GPU (89 - 140, n=36) | |
| Schenker XMG Core 17 (Early 2021) | |
| Asus TUF Gaming A15 FA506QR-AZ061T | |
| Acer Nitro 5 AN517-41-R5Z7 (FW-Update) | |
| Acer Nitro 5 AN517-41-R5Z7 | |
| Asus TUF Gaming F17 FX706HM | |
| MSI Katana GF76 11UE | |
To check whether the frame rates remain largely constant over a longer period, we run the game "The Witcher 3" for about 60 minutes with Full HD resolution and maximum quality settings. The game character is not moved. A drop in the frame rates is not noticed.
Witcher 3 FPS-Diagram
| low | med. | high | ultra | |
|---|---|---|---|---|
| GTA V (2015) | 172 | 134 | 81.3 | |
| The Witcher 3 (2015) | 253 | 213 | 135 | 78.4 |
| Dota 2 Reborn (2015) | 140 | 134 | 116 | 110 |
| Final Fantasy XV Benchmark (2018) | 148 | 101 | 76.7 | |
| X-Plane 11.11 (2018) | 96.5 | 83.4 | 70.4 | |
| Far Cry 5 (2018) | 123 | 103 | 98 | 94 |
| Strange Brigade (2018) | 303 | 172 | 152 | 138 |
| Dirt 5 (2020) | 181 | 105 | 86.5 | 71.5 |
Emissions - The Acer computer heats up moderately
Noise emissions
The two fans operate at low speeds in idle and are barely audible. Occasionally they stand still, but this state of affairs ends under load. The maximum sound pressure level is just under 50 dB(A) (stress test, medium load). The noise development is acceptable in gaming mode.
Noise level
| Idle |
| 26 / 33.1 / 31.3 dB(A) |
| Load |
| 49.8 / 49.6 dB(A) |
 | ||
30 dB silent 40 dB(A) audible 50 dB(A) loud |
||
min: | ||
| Acer Nitro 5 AN517-41-R5Z7 R7 5800H, GeForce RTX 3070 Laptop GPU | MSI Katana GF76 11UE i7-11800H, GeForce RTX 3060 Laptop GPU | Schenker XMG Core 17 (Early 2021) i7-10870H, GeForce RTX 3060 Laptop GPU | Asus TUF Gaming F17 FX706HM i9-11900H, GeForce RTX 3060 Laptop GPU | Average NVIDIA GeForce RTX 3070 Laptop GPU | Average of class Gaming | |
|---|---|---|---|---|---|---|
| Noise | -10% | -6% | 2% | 3% | 6% | |
| off / environment * (dB) | 26 | 25 4% | 25 4% | 25 4% | 24.9 ? 4% | 24.1 ? 7% |
| Idle Minimum * (dB) | 26 | 33 -27% | 30 -15% | 26 -0% | 26.7 ? -3% | 26.1 ? -0% |
| Idle Average * (dB) | 33.1 | 34 -3% | 32 3% | 31 6% | 28.7 ? 13% | 27.6 ? 17% |
| Idle Maximum * (dB) | 31.3 | 35 -12% | 36 -15% | 33 -5% | 31.7 ? -1% | 30.2 ? 4% |
| Load Average * (dB) | 49.8 | 53 -6% | 53 -6% | 48 4% | 45 ? 10% | 43 ? 14% |
| Load Maximum * (dB) | 49.6 | 57 -15% | 54 -9% | 49 1% | 52.6 ? -6% | 53.6 ? -8% |
| Witcher 3 ultra * (dB) | 49 | 51 | 47 |
* ... smaller is better
Temperature
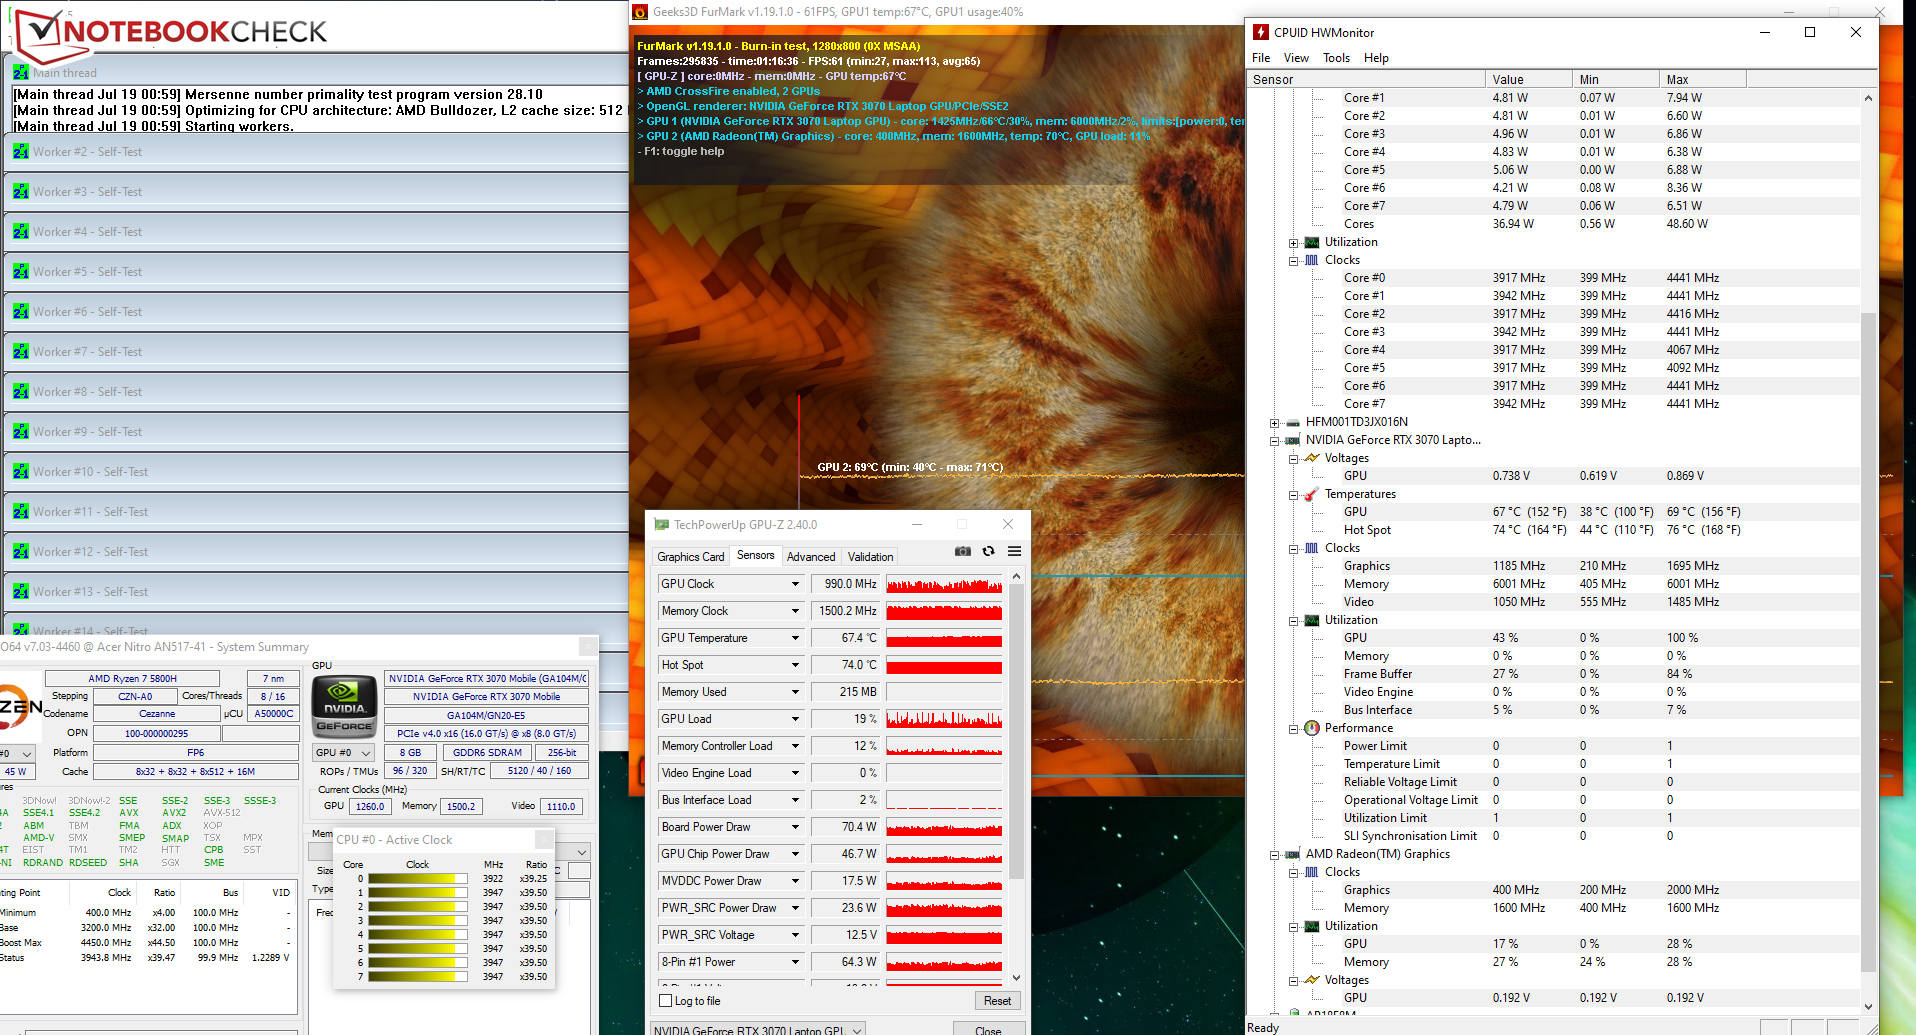
Our stress test (Prime95 and FurMark run for at least one hour) runs the CPU and GPU at 3.9 GHz and 500 to 1000 MHz, respectively. The stress test represents an extreme scenario. We use this test to check whether the system runs stably at full load.
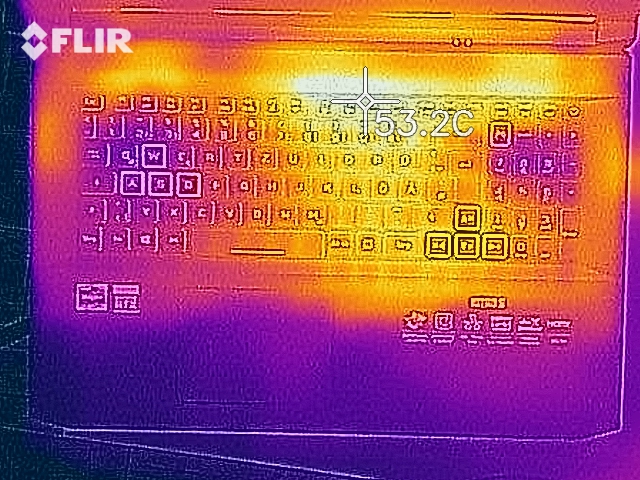
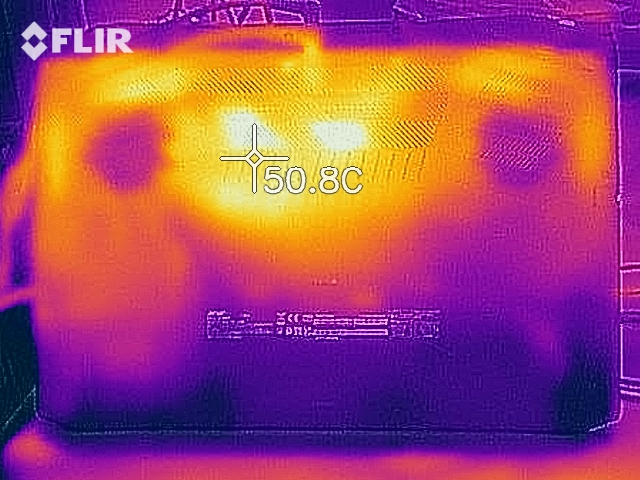
The notebook heats up moderately. During the stress test, a temperature beyond 50 °C (122 °F) was only reached at one measuring point. The temperatures are within a green zone in everyday use.
(±) The maximum temperature on the upper side is 44 °C / 111 F, compared to the average of 40.4 °C / 105 F, ranging from 21.2 to 68.8 °C for the class Gaming.
(-) The bottom heats up to a maximum of 52.7 °C / 127 F, compared to the average of 43.3 °C / 110 F
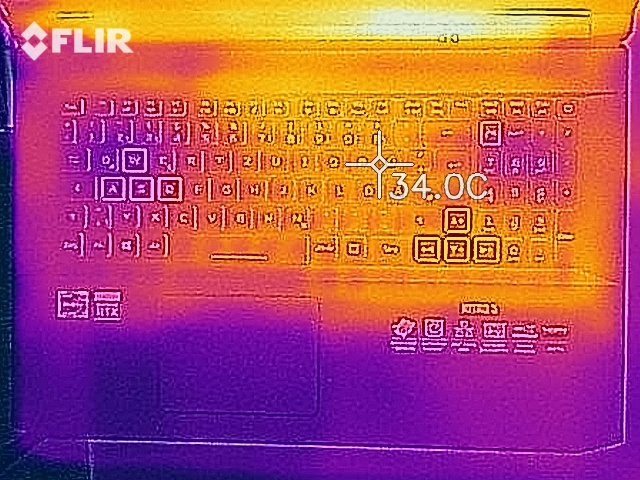
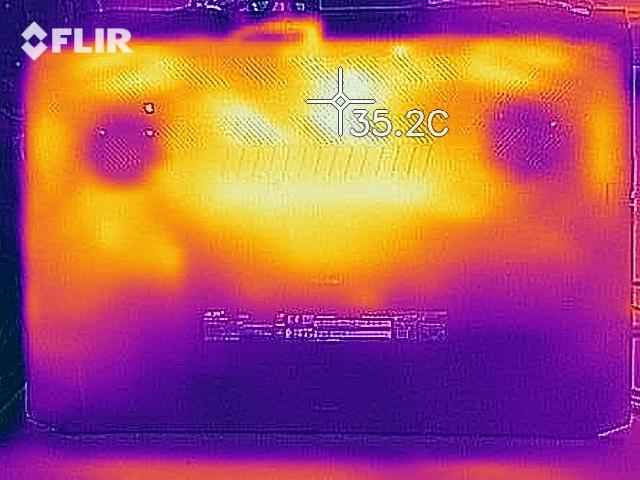
(+) In idle usage, the average temperature for the upper side is 28.9 °C / 84 F, compared to the device average of 33.9 °C / 93 F.
(+) The palmrests and touchpad are cooler than skin temperature with a maximum of 26.9 °C / 80.4 F and are therefore cool to the touch.
(±) The average temperature of the palmrest area of similar devices was 28.9 °C / 84 F (+2 °C / 3.6 F).
| Acer Nitro 5 AN517-41-R5Z7 R7 5800H, GeForce RTX 3070 Laptop GPU | MSI Katana GF76 11UE i7-11800H, GeForce RTX 3060 Laptop GPU | Schenker XMG Core 17 (Early 2021) i7-10870H, GeForce RTX 3060 Laptop GPU | Asus TUF Gaming F17 FX706HM i9-11900H, GeForce RTX 3060 Laptop GPU | Average NVIDIA GeForce RTX 3070 Laptop GPU | Average of class Gaming | |
|---|---|---|---|---|---|---|
| Heat | -1% | 0% | -21% | -4% | 1% | |
| Maximum Upper Side * (°C) | 44 | 51 -16% | 44 -0% | 58.5 -33% | 47.8 ? -9% | 45.5 ? -3% |
| Maximum Bottom * (°C) | 52.7 | 52 1% | 50 5% | 58.5 -11% | 52.9 ? -0% | 48.1 ? 9% |
| Idle Upper Side * (°C) | 32.6 | 32 2% | 30 8% | 38 -17% | 32.4 ? 1% | 31.4 ? 4% |
| Idle Bottom * (°C) | 32.1 | 29 10% | 36 -12% | 39 -21% | 34.2 ? -7% | 34.3 ? -7% |
* ... smaller is better
Speaker
The stereo speakers produce a decent sound that lacks bass. Headphones or external speakers are recommended for a better sound experience.
Acer Nitro 5 AN517-41-R5Z7 audio analysis
(±) | speaker loudness is average but good (75.5 dB)
Bass 100 - 315 Hz
(-) | nearly no bass - on average 27.4% lower than median
(±) | linearity of bass is average (11.3% delta to prev. frequency)
Mids 400 - 2000 Hz
(+) | balanced mids - only 4.1% away from median
(±) | linearity of mids is average (8.7% delta to prev. frequency)
Highs 2 - 16 kHz
(±) | higher highs - on average 6% higher than median
(+) | highs are linear (5% delta to prev. frequency)
Overall 100 - 16.000 Hz
(±) | linearity of overall sound is average (22.5% difference to median)
Compared to same class
» 80% of all tested devices in this class were better, 5% similar, 14% worse
» The best had a delta of 6%, average was 18%, worst was 132%
Compared to all devices tested
» 65% of all tested devices were better, 6% similar, 29% worse
» The best had a delta of 4%, average was 24%, worst was 134%
MSI GP76 Leopard 10UG audio analysis
(+) | speakers can play relatively loud (85 dB)
Bass 100 - 315 Hz
(-) | nearly no bass - on average 18.5% lower than median
(±) | linearity of bass is average (10.8% delta to prev. frequency)
Mids 400 - 2000 Hz
(+) | balanced mids - only 2.9% away from median
(+) | mids are linear (2.4% delta to prev. frequency)
Highs 2 - 16 kHz
(+) | balanced highs - only 2.8% away from median
(+) | highs are linear (4.2% delta to prev. frequency)
Overall 100 - 16.000 Hz
(+) | overall sound is linear (13.2% difference to median)
Compared to same class
» 19% of all tested devices in this class were better, 4% similar, 77% worse
» The best had a delta of 6%, average was 18%, worst was 132%
Compared to all devices tested
» 13% of all tested devices were better, 3% similar, 85% worse
» The best had a delta of 4%, average was 24%, worst was 134%
Power management - Nitro gaming notebook delivers solid battery runtimes
Energy consumption
We recorded a maximum power consumption of 25.2 watts in idle. The stress test and Witcher 3 test increase the power consumption up to 157 watts and 135 watts on average, respectively. The following diagram illustrates the fairly constant power consumption of the notebook during the Witcher 3 test. The power supply's nominal power is 180 watts.
| Off / Standby | |
| Idle | |
| Load |
|
Key:
min: | |
Energy consumption Witcher 3
| Acer Nitro 5 AN517-41-R5Z7 R7 5800H, GeForce RTX 3070 Laptop GPU | MSI Katana GF76 11UE i7-11800H, GeForce RTX 3060 Laptop GPU | Schenker XMG Core 17 (Early 2021) i7-10870H, GeForce RTX 3060 Laptop GPU | Asus TUF Gaming F17 FX706HM i9-11900H, GeForce RTX 3060 Laptop GPU | MSI GP76 Leopard 10UG i7-10750H, GeForce RTX 3070 Laptop GPU | Aorus 15G XC i7-10870H, GeForce RTX 3070 Laptop GPU | Asus TUF Gaming A15 FA506QR-AZ061T R7 5800H, GeForce RTX 3070 Laptop GPU | Average NVIDIA GeForce RTX 3070 Laptop GPU | Average of class Gaming | |
|---|---|---|---|---|---|---|---|---|---|
| Power Consumption | 18% | 1% | 21% | 1% | 2% | 19% | -2% | -4% | |
| Idle Minimum * (Watt) | 18.7 | 9 52% | 13 30% | 10.3 45% | 12 36% | 13 30% | 10.2 45% | 15.6 ? 17% | 13.8 ? 26% |
| Idle Average * (Watt) | 22 | 13 41% | 16 27% | 13.1 40% | 16 27% | 16 27% | 12.8 42% | 20.1 ? 9% | 19.7 ? 10% |
| Idle Maximum * (Watt) | 25.2 | 20 21% | 29 -15% | 14.1 44% | 28 -11% | 30 -19% | 15 40% | 29.4 ? -17% | 26.7 ? -6% |
| Load Average * (Watt) | 134.7 | 102 24% | 100 26% | 110 18% | 92 32% | 92 32% | 130 3% | 110.8 ? 18% | 111.1 ? 18% |
| Witcher 3 ultra * (Watt) | 135 | 149 -10% | 173 -28% | 138 -2% | 198 -47% | 154 -14% | 137 -1% | ||
| Load Maximum * (Watt) | 157 | 187 -19% | 213 -36% | 190 -21% | 210 -34% | 223 -42% | 184 -17% | 214 ? -36% | 261 ? -66% |
* ... smaller is better
Battery life
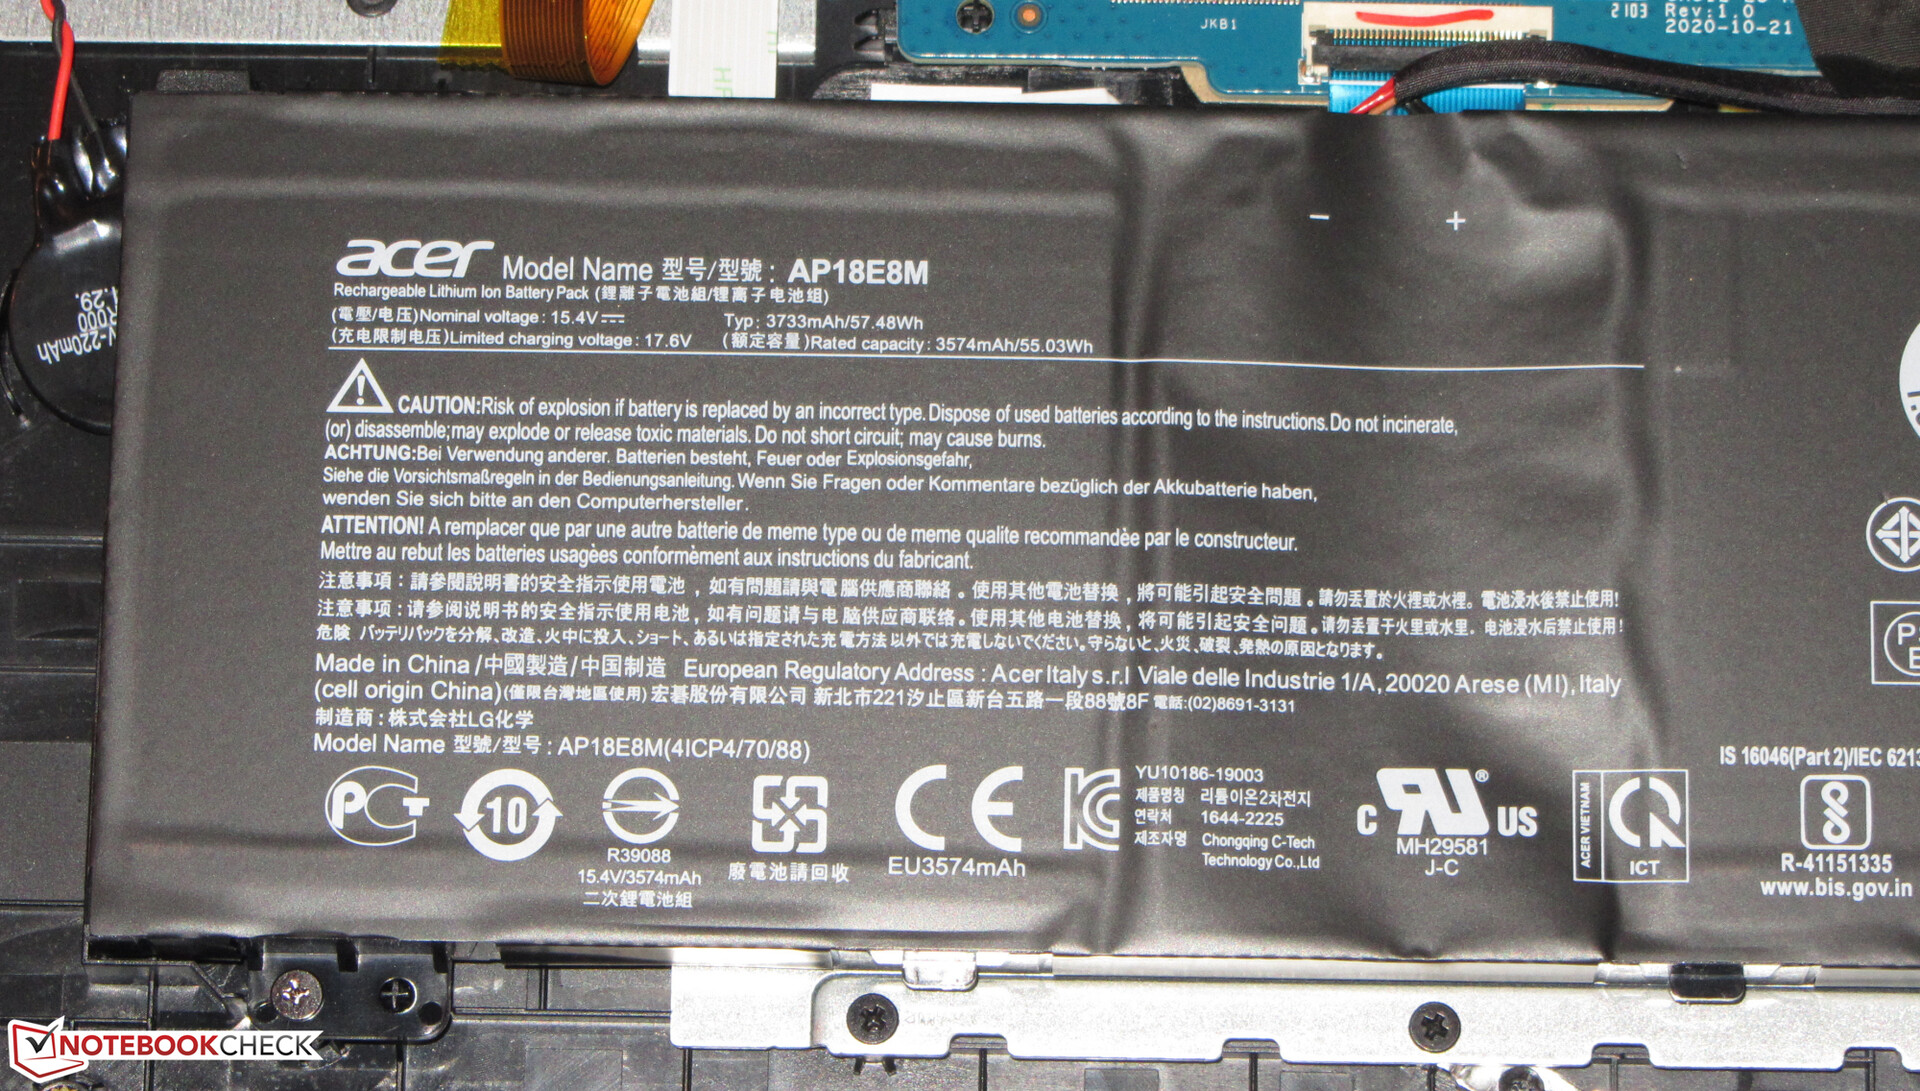
The 17.3 incher achieves runtimes of 5:34 h and 7:00 h in the WLAN test (calling up websites via a script) and video test (short movie Big Buck Bunny (H.264 encoding, FHD) in a loop), respectively. During both tests, the notebook's energy-saving features are disabled and the display brightness is set to about 150 cd/m². The wireless modules are also disabled for the video test.
| Acer Nitro 5 AN517-41-R5Z7 R7 5800H, GeForce RTX 3070 Laptop GPU, 57.5 Wh | MSI Katana GF76 11UE i7-11800H, GeForce RTX 3060 Laptop GPU, 53 Wh | Schenker XMG Core 17 (Early 2021) i7-10870H, GeForce RTX 3060 Laptop GPU, 62 Wh | Asus TUF Gaming F17 FX706HM i9-11900H, GeForce RTX 3060 Laptop GPU, 90 Wh | MSI GP76 Leopard 10UG i7-10750H, GeForce RTX 3070 Laptop GPU, 65 Wh | Aorus 15G XC i7-10870H, GeForce RTX 3070 Laptop GPU, 99 Wh | Asus TUF Gaming A15 FA506QR-AZ061T R7 5800H, GeForce RTX 3070 Laptop GPU, 90 Wh | Average of class Gaming | |
|---|---|---|---|---|---|---|---|---|
| Battery runtime | -34% | -19% | 45% | -38% | 16% | 82% | 7% | |
| Reader / Idle (h) | 10.1 | 4.8 -52% | 7.7 -24% | 5.6 -45% | 9.6 -5% | 17.4 72% | 9.79 ? -3% | |
| H.264 (h) | 7 | 3.9 -44% | 4.7 -33% | 8.5 21% | 6.5 -7% | 7.74 ? 11% | ||
| WiFi v1.3 (h) | 5.6 | 3.7 -34% | 4.9 -12% | 7.6 36% | 4.2 -25% | 6.3 13% | 11.4 104% | 6.61 ? 18% |
| Load (h) | 1.4 | 1.3 -7% | 1.3 -7% | 2.5 79% | 0.8 -43% | 2.3 64% | 2.4 71% | 1.42 ? 1% |
| Witcher 3 ultra (h) | 0.8 | 1.039 ? |
Pros
Cons
Verdict - Solid mid-range gamer
The Nitro 5 does not belong to the top group of RTX 3070 notebooks: Compared with the RTX 3070 notebooks tested so far, the computer delivers below-average frame rates - this is due to the 100-watt TGP. The GPU performance can be increased a bit with a firmware update. The device scores with a high level of CPU performance.
The Acer Nitro 5 AN517-41 offers a lot of performance for the Euro.
Throttling is not a concern. CPU and GPU can produce their performance constantly. The laptop heats up moderately under load. The noise development is on the usual class level. The installation of the FW update should increase the heat and noise development a bit.
The screen (FHD, IPS, 144 Hz) offers stable viewing angles, good contrast, a matte surface, short response times and decent color reproduction. Average brightness and color space coverage are too low.
An alternative to the Nitro 5 would be the MSI GP76 Leopard 10UG. The computer comes with a GeForce RTX-3070 laptop GPU that runs with the maximum possible TGP of 140 watts. However, the GP76 delivers less CPU power than the Nitro 5.
In a few days, the review of the RTX-3070 Nitro 5 will be followed by a review of a sister model equipped with a GeForce RTX-3080 laptop GPU.
Price and availability
The Acer Nitro 5 AN517-41-R5Z7 (Ryzen 7-5800H, GeForce RTX 3070, 16 GB RAM, 1 TB SSD, Windows 10 Home) is available for a price of 1,499 Euros (~$1763) in Notebooksbilliger.de. The device is currently sold out.
Acer Nitro 5 AN517-41-R5Z7
- 08/02/2021 v7 (old)
Sascha Mölck
Price comparison

