 Deutsch
 English
 Español
 Français
 Italiano
 Nederlands
 Polski
 Português
 Русский
 Türkçe
 Svenska
 Chinese
 Magyar
MSI Katana GF76 review: Gaming laptop with room for improvement
MSI offers its latest gaming combat sword, the Katana GF76, which is the 17-inch sibling of the 15.6-inch Katana GF66, in various configuration options. The configuration that we have in for testing is the MSI Katana GF76 11UE-036 featuring the Intel Core i7-11800H, the GeForce RTX 3060 laptop GPU, as well as 16 GB of DDR4-3200 RAM, and a 512 GB M.2 PCIe NVMe SSD, and it's the third-best configuration variant.
Among others, the device has to face competitors in the test like the Aorus 17G YD with the same CPU, as well as the MSI GP76 Leopard 10UG with the i7-10750H and the GeForce RTX 3070 laptop GPU, which is a superior graphics card.
Possible contenders in comparison
Rating | Date | Model | Weight | Height | Size | Resolution | Best Price |
|---|---|---|---|---|---|---|---|
| 80.4 % | 06/2021 | MSI Katana GF76 11UE i7-11800H, GeForce RTX 3060 Laptop GPU | 2.7 kg | 25.2 mm | 17.30" | 1920x1080 | |
| 85.1 % | 03/2021 | MSI GP76 Leopard 10UG i7-10750H, GeForce RTX 3070 Laptop GPU | 2.9 kg | 26 mm | 17.30" | 1920x1080 | |
| 80.4 % | 03/2021 | MSI GF65 Thin 10UE i7-10750H, GeForce RTX 3060 Laptop GPU | 1.9 kg | 21.7 mm | 15.60" | 1920x1080 | |
| 84.7 % | 06/2021 | Alienware m15 R5 Ryzen Edition R7 5800H, GeForce RTX 3060 Laptop GPU | 2.5 kg | 22.85 mm | 15.60" | 1920x1080 | |
| 83.9 % | 06/2021 | SCHENKER XMG Core 17 (Early 2021) i7-10870H, GeForce RTX 3060 Laptop GPU | 2.5 kg | 30.05 mm | 17.30" | 2560x1440 | |
| 86 % | 06/2021 | Aorus 17G YD i7-11800H, GeForce RTX 3080 Laptop GPU | 2.8 kg | 26 mm | 17.30" | 1920x1080 |
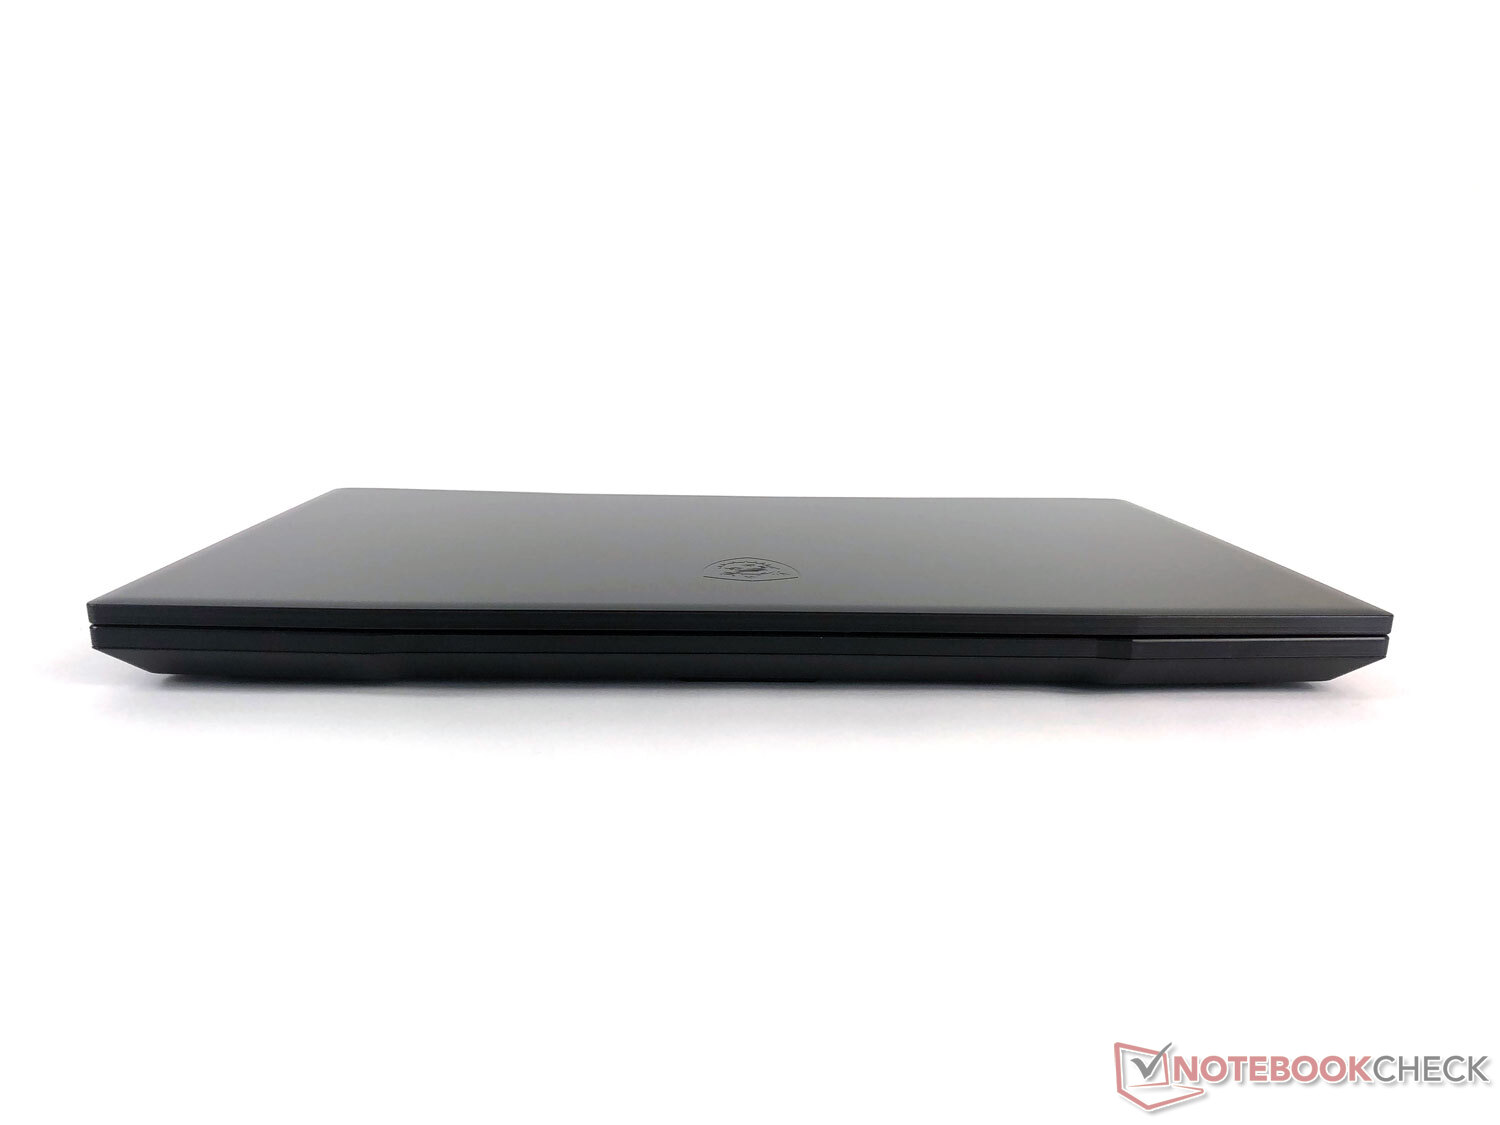
Case: Relatively compact for a 17.3-inch device
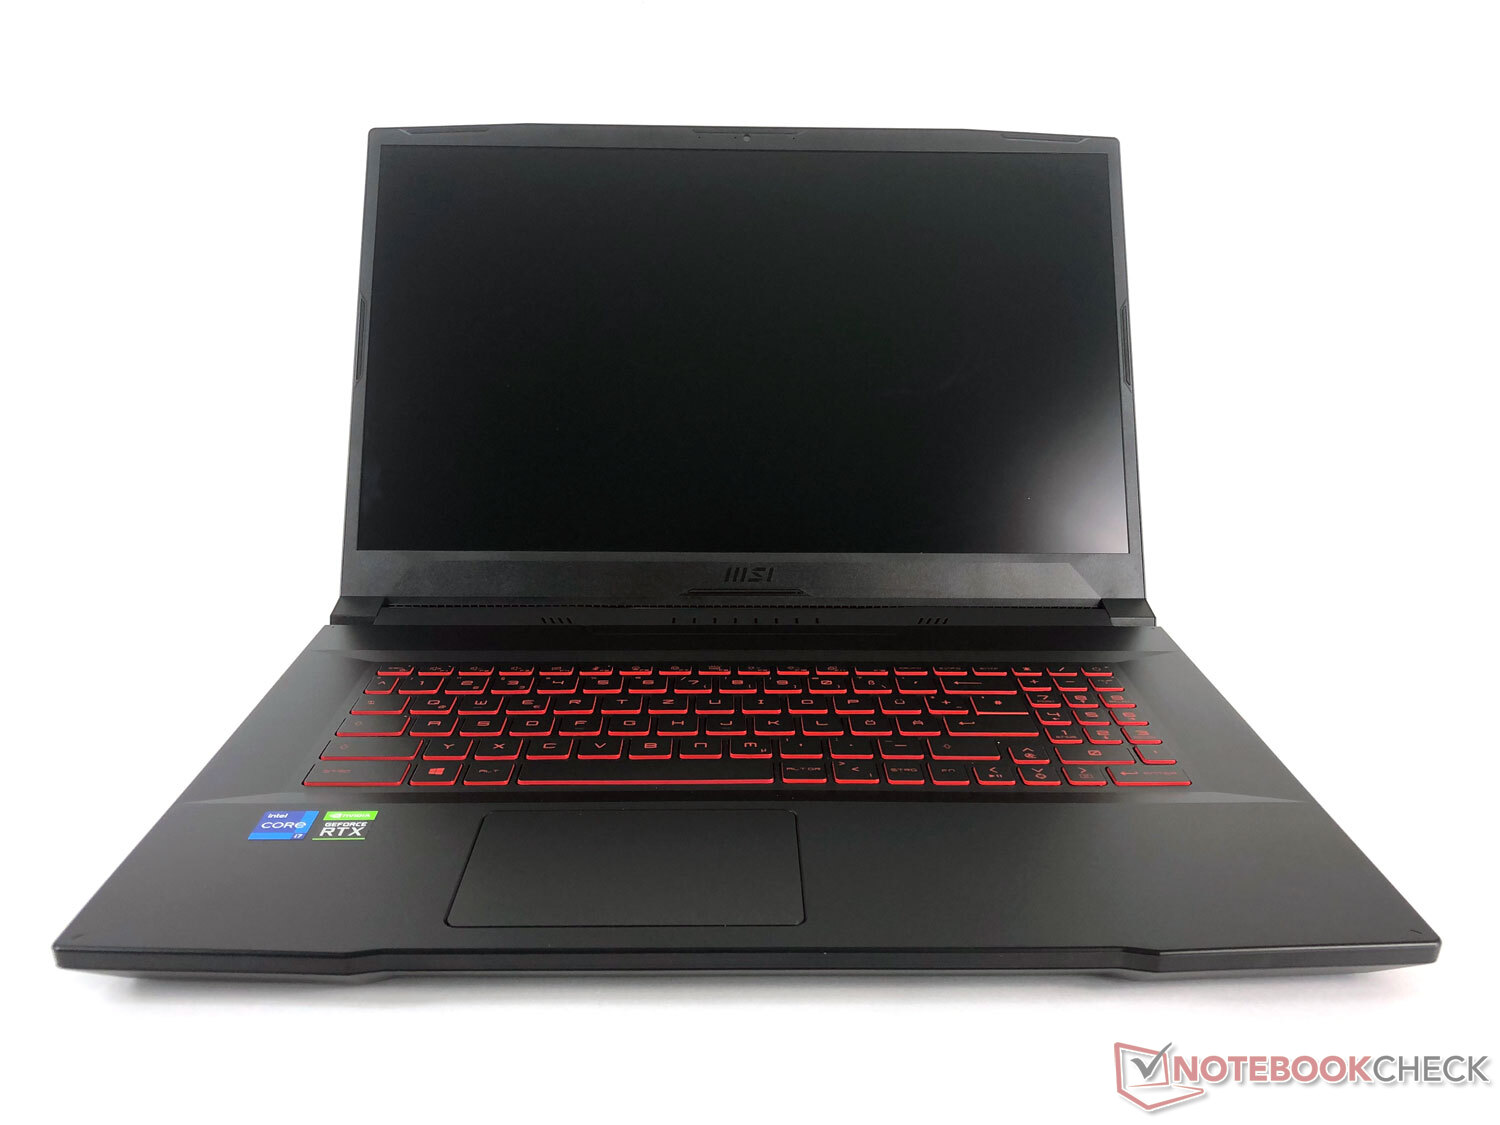
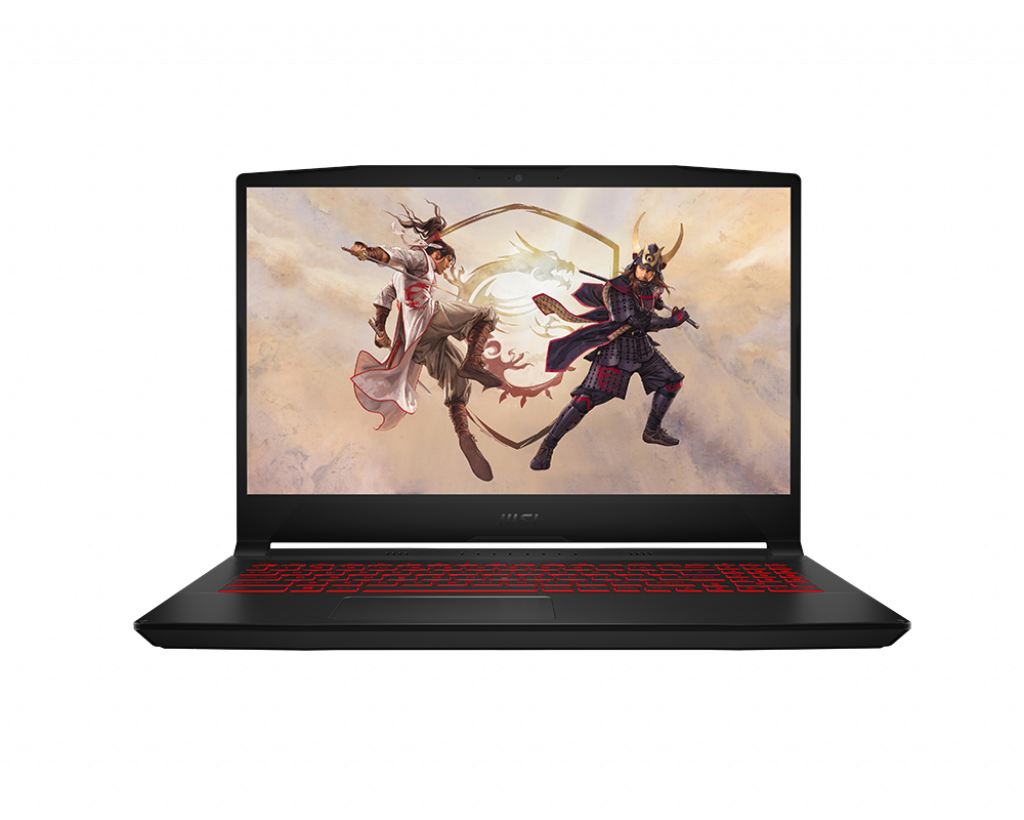
The MSI Katana GF76 comes in a jet-black design with a backlit keyboard that has red accents. If you don't like the somber look, the device is also available as the Sword 17 with a white chassis and blue keyboard backlighting.
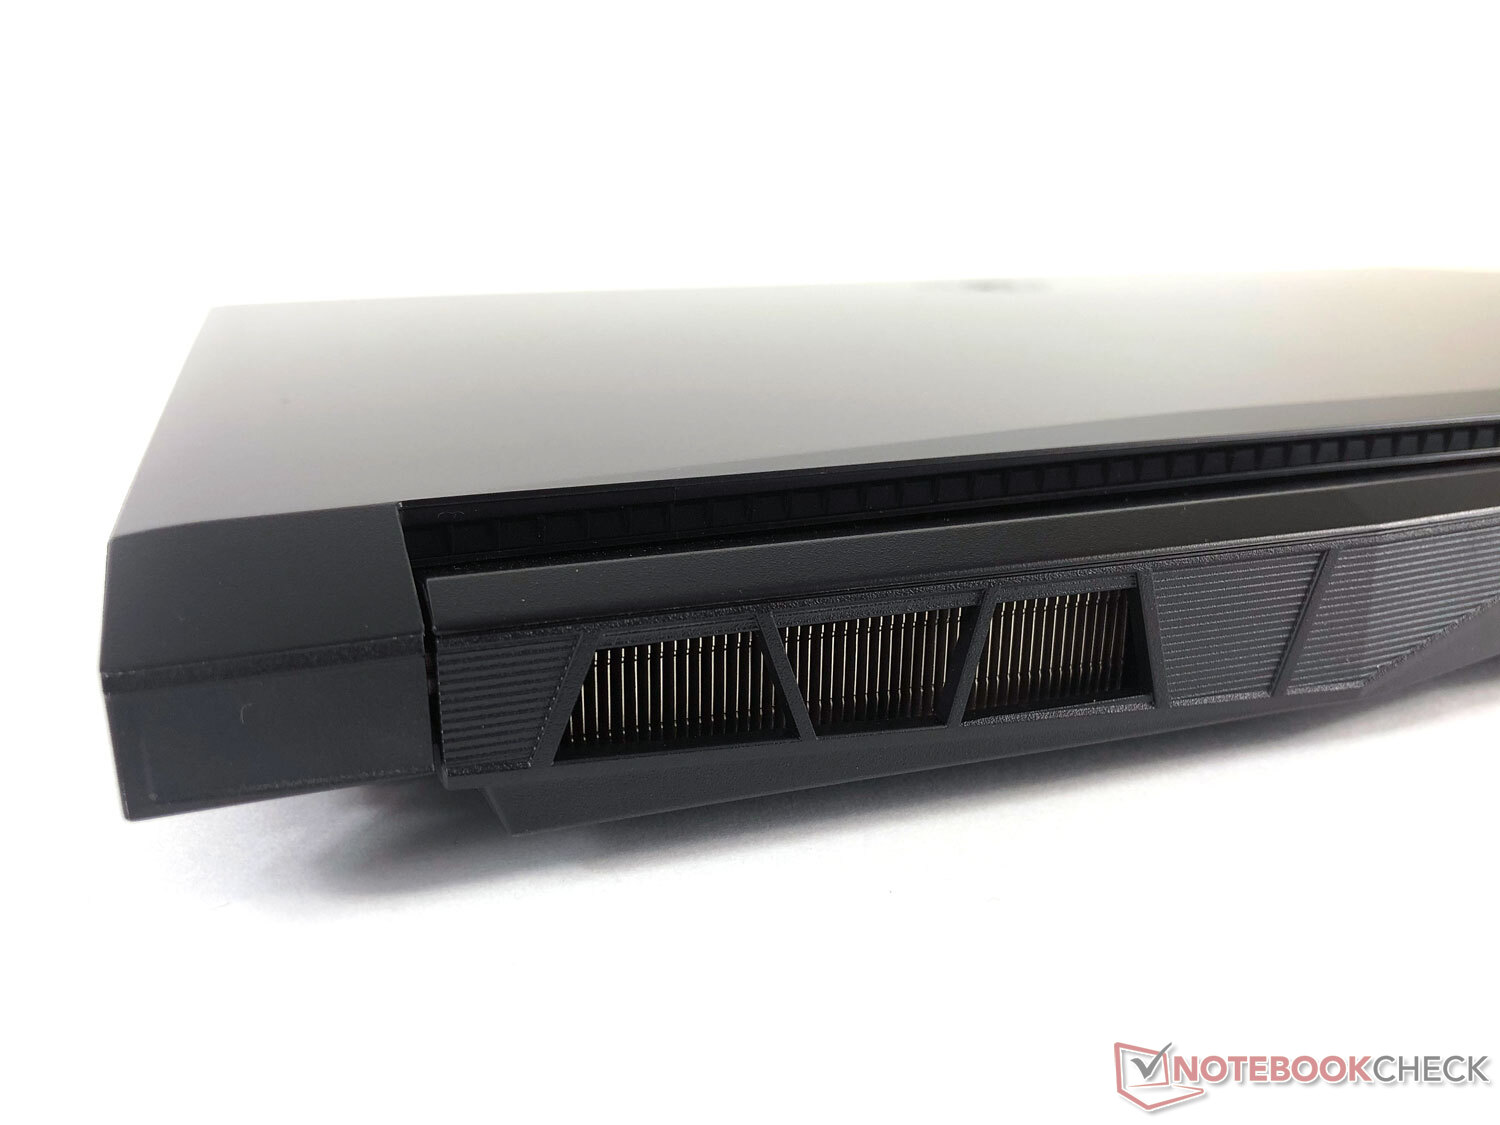
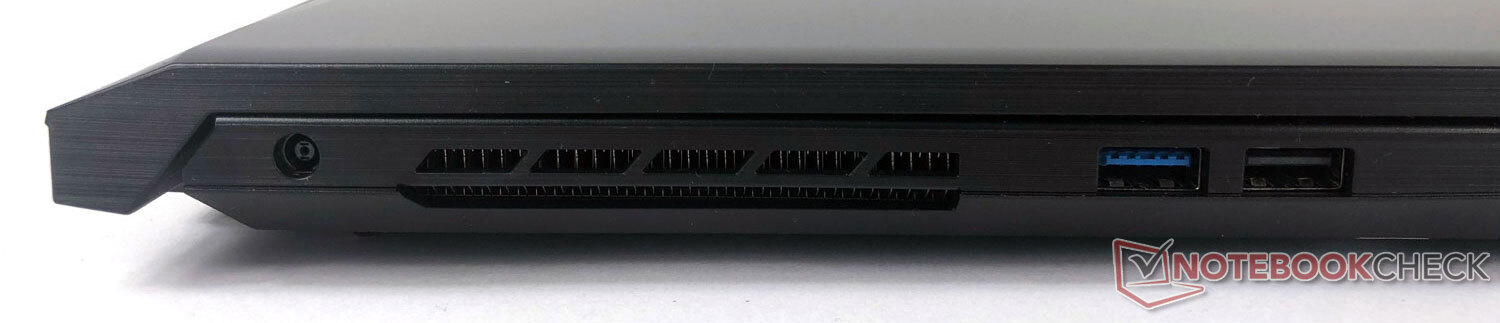
Compared to some other gaming laptops, the design of the Katana GF76 is relatively modest. Fortunately, the laptop doesn't have sharp edges - as is the case with swords from which it borrows its name - but it does have an angular design. The most noticeable elements are the large air vents at the back and on the left side that are used for the "Cooler Boost 5" cooling system.
Despite the fact that the case is made of plastic, it makes a solid impression in terms of feel, and a decent one in terms of quality. As you would expect from MSI, workmanship regarding gap dimensions and the like is high quality. The hinges have been designed in such a way that the laptop can be opened with one hand, but the display remains firmly in place despite some slight wobbling.
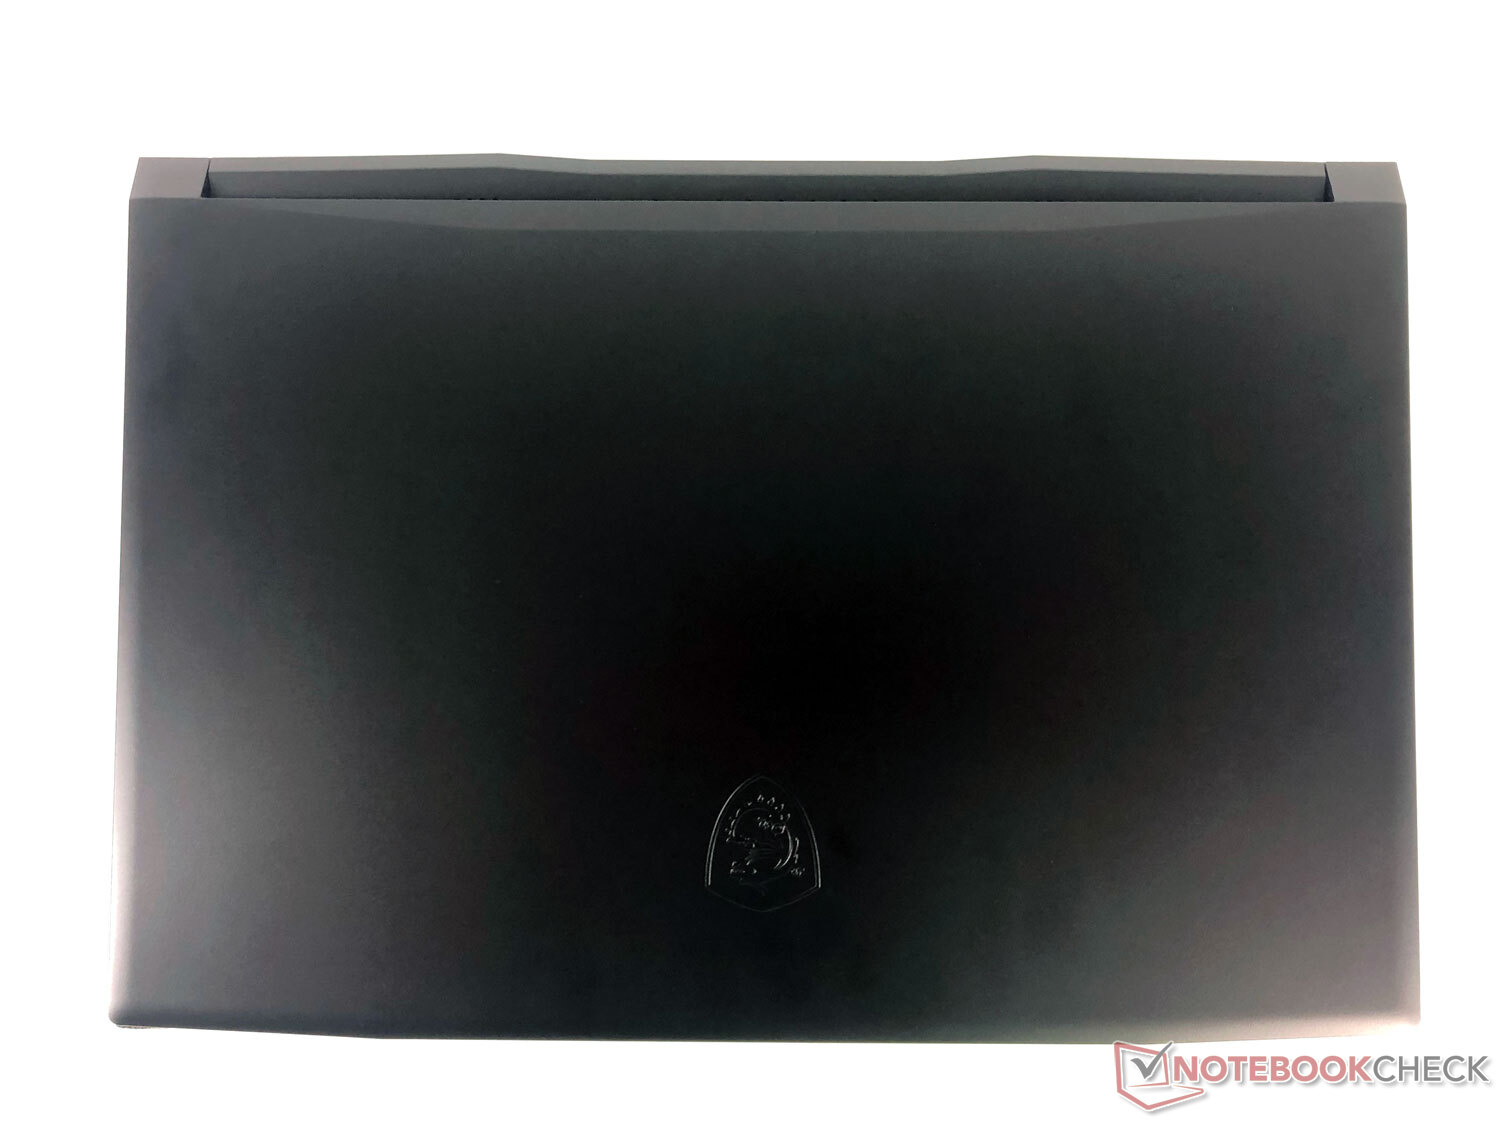
If we include the other gaming laptops with 17.3-inch displays in our size comparison, the MSI Katana GF76 is quite compact. With its 39.8 x 27.3 cm footprint, it's smaller than the Aorus 17G YD and the MSI GP76 Leopard 10UG. Only the Schenker XMG Core 17 (Tongfang GM7MG0R) has a slightly smaller size, but it's much thicker than the Katana GF76 in exchange, which measures a good 2.5 cm.
Our test candidate weighs around 2.7 kg. This places it at the front of the 17.3-inch field, and it can even almost keep up with the 15.6-inch Alienware m15 R5 Ryzen Edition that is equipped with the same GPU.
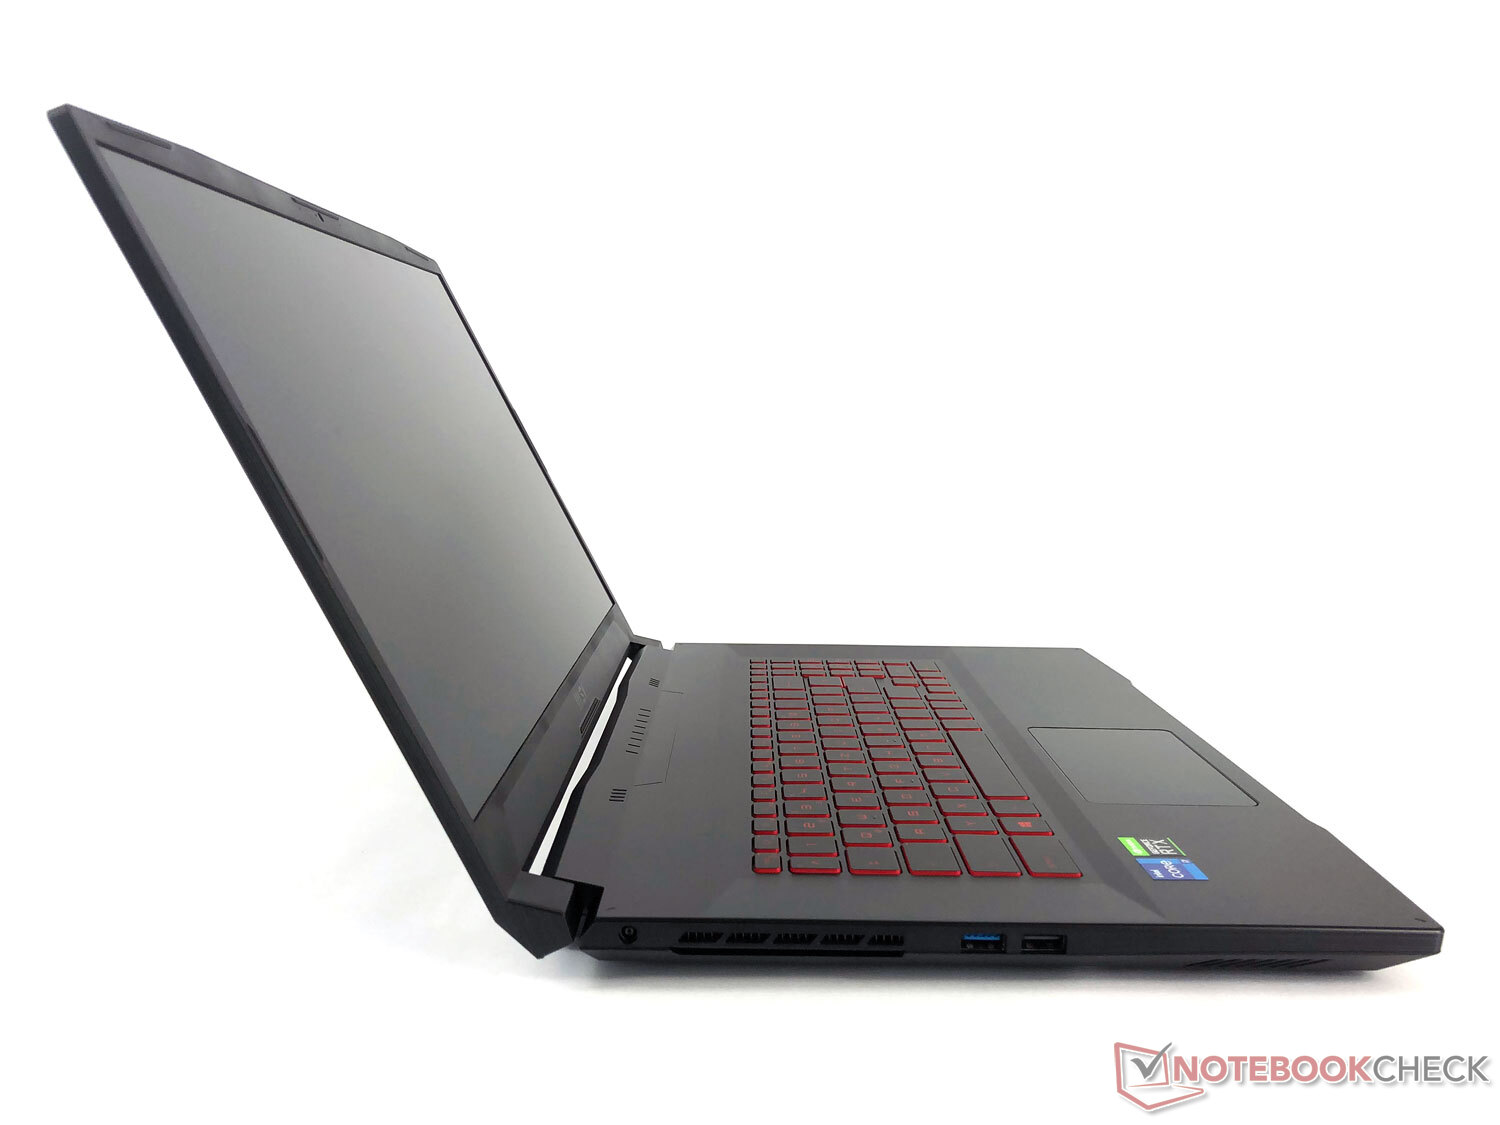
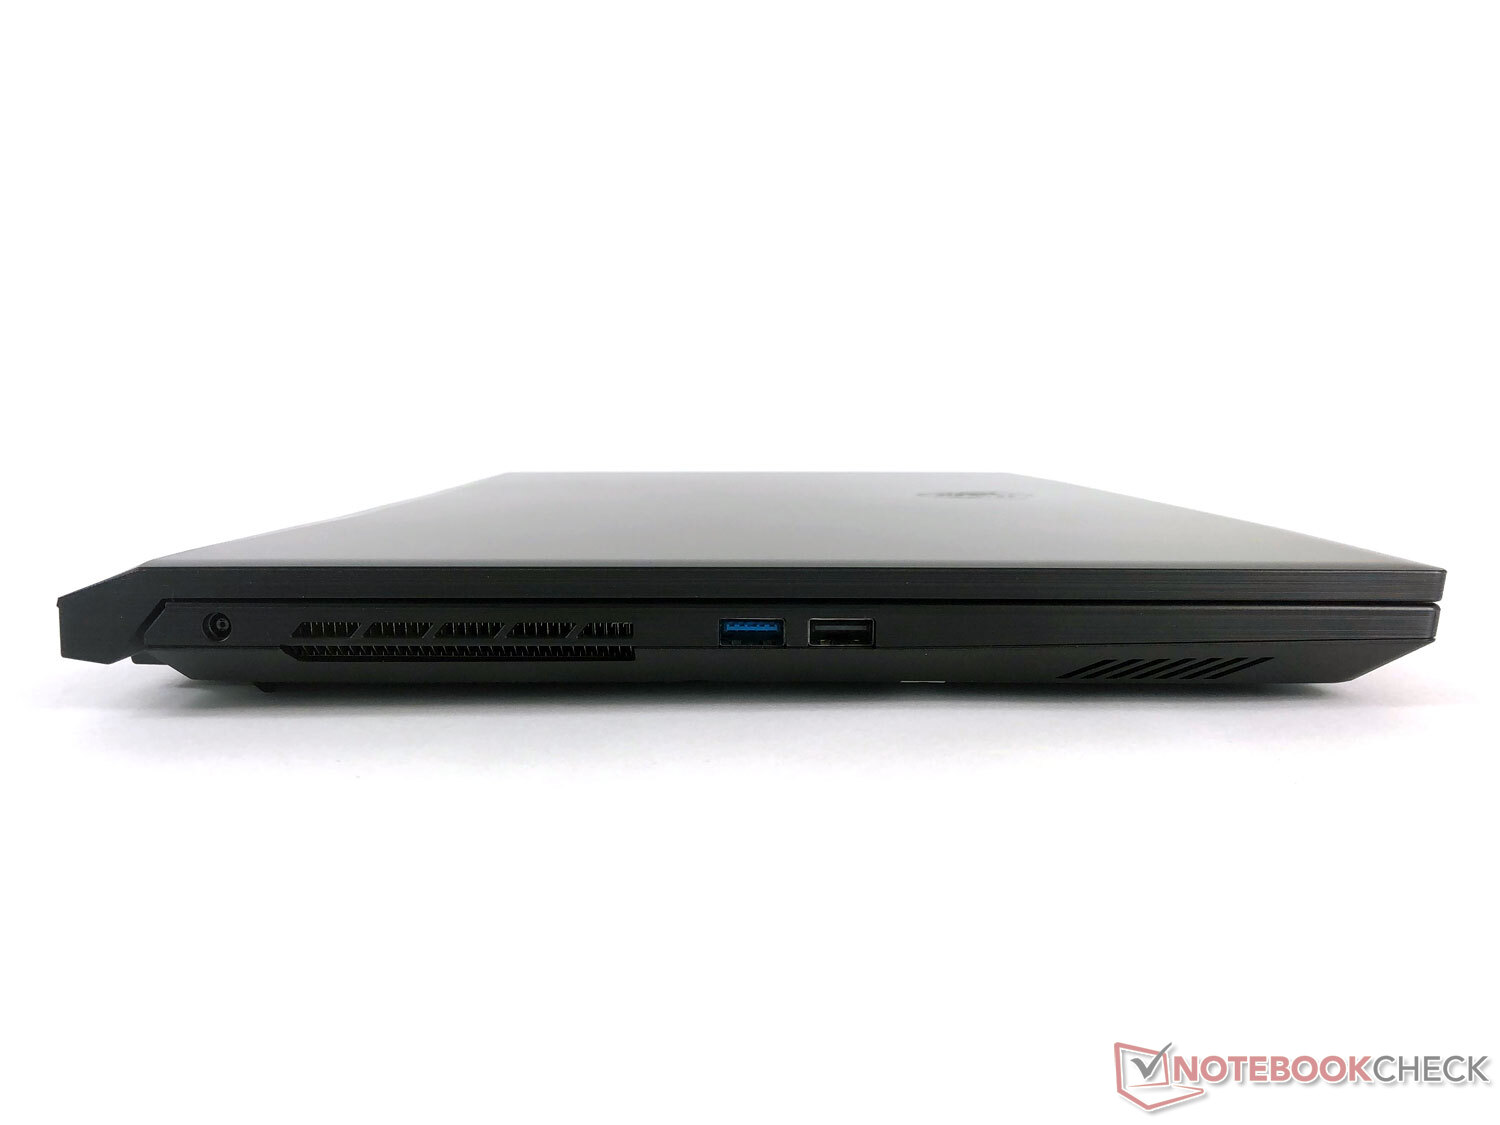
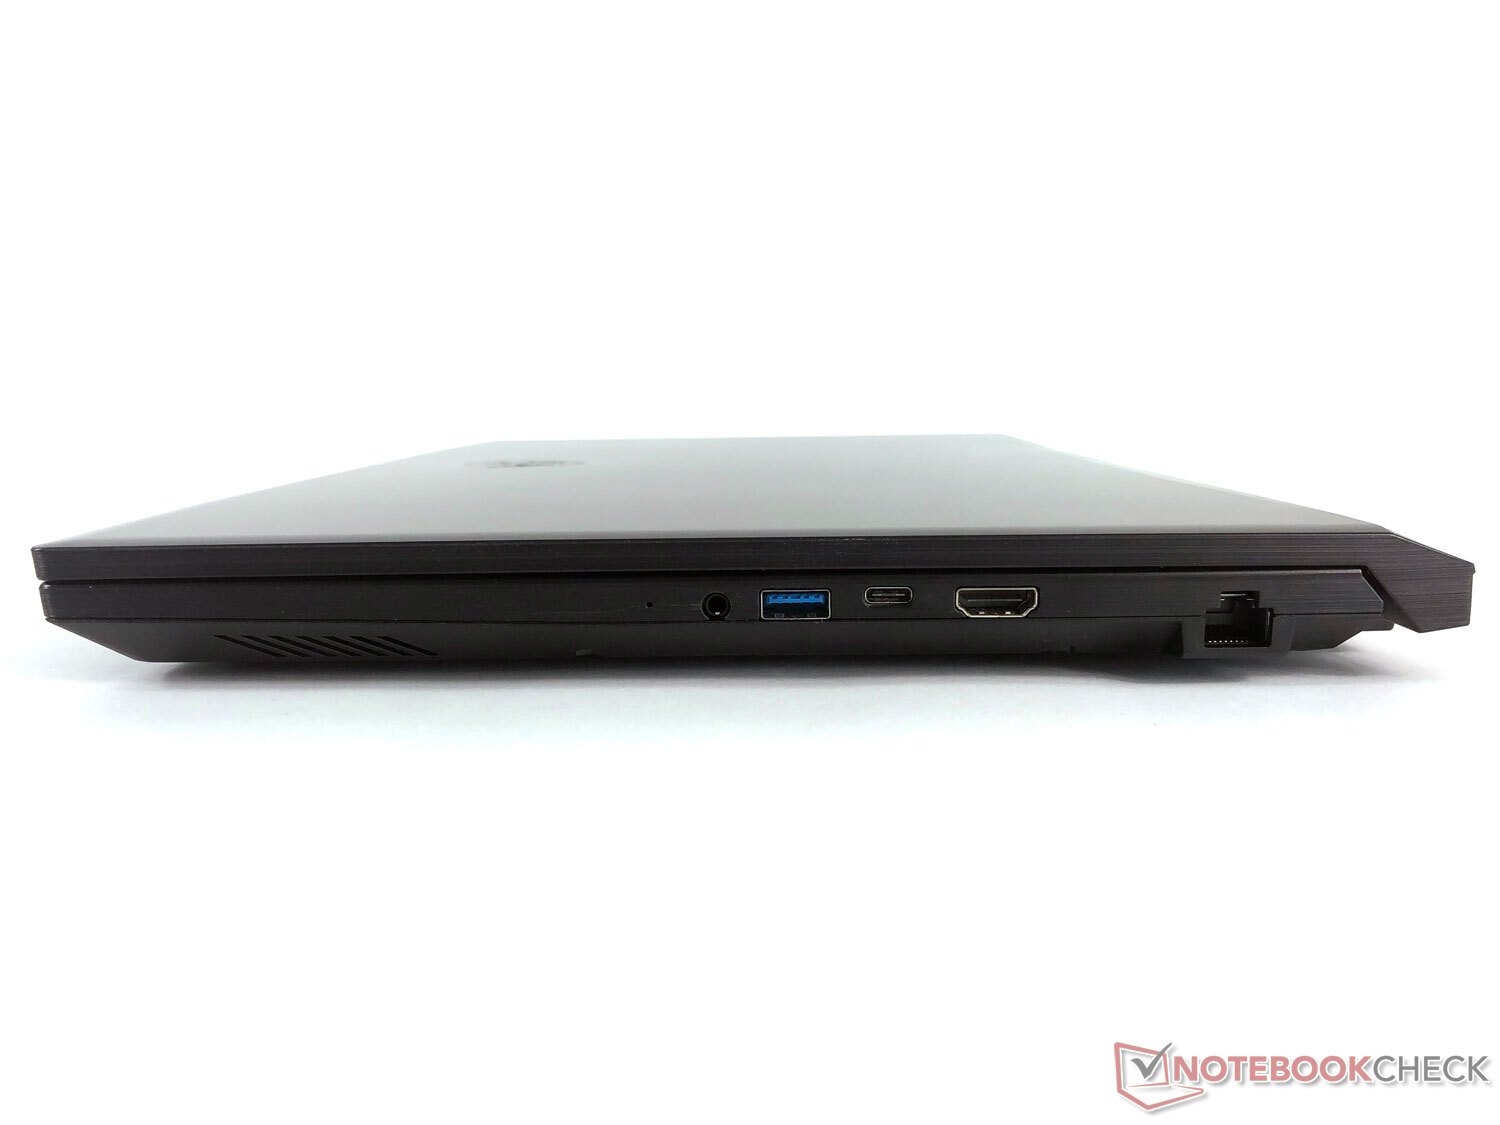
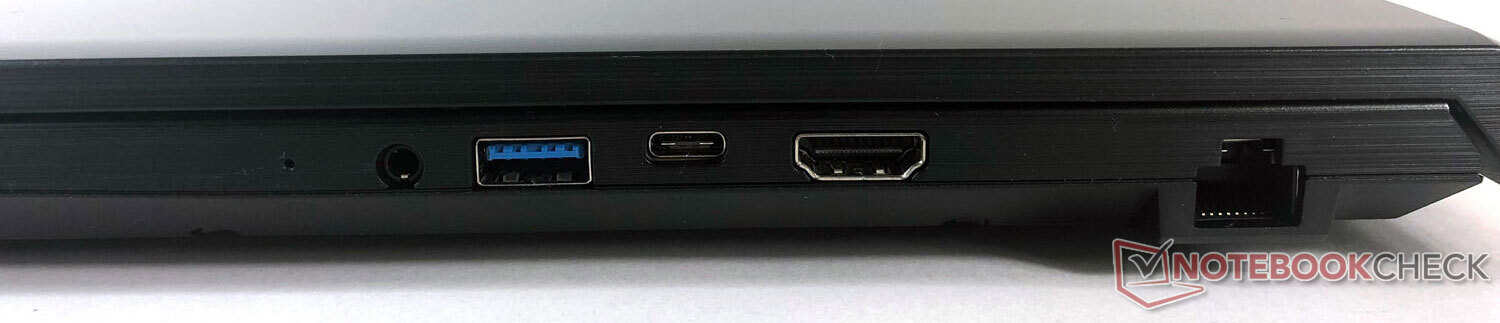
Connectivity: The ports in the Katana GF76 leave room for criticism
MSI hasn't placed any ports at the back, so that everything is located on the left and right sides. Although the number of ports is relatively generous, connectivity could still be improved. There's only one USB-C port, and it doesn't support DisplayPort. Thunderbolt is not available either. External monitors can only be connected to the gaming laptop using the HDMI port that outputs 4K UHD content at up to 60 Hz.
The ports are all easy to reach, but they could have been provided with a bit more space between them on the right side of the case.
Communication
In addition to the Gigabit LAN port, the latest 802.11ax Wi-Fi standard is on board thanks to Intel's Wi-Fi 6 AX201 module. The Wi-Fi connection is very fast in the test, and it can position itself very far ahead in the comparison field.
Webcam
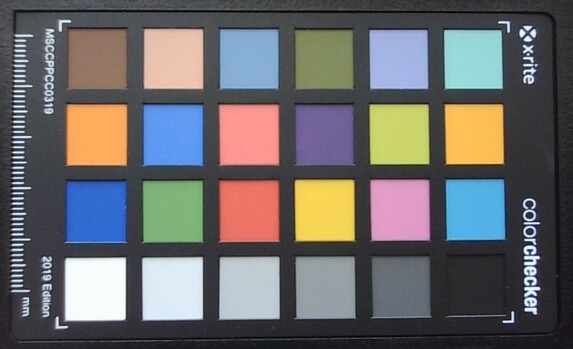
The webcam serves its purpose, but that's it. It has a resolution of 720p and shows relatively large color deviations in the test (∆E of 13.15).


Accessories
Apart from the 180-watt power adapter, which has sufficient capacity, MSI doesn't include anything else. No accessories tailored to the device are offered as an option either.
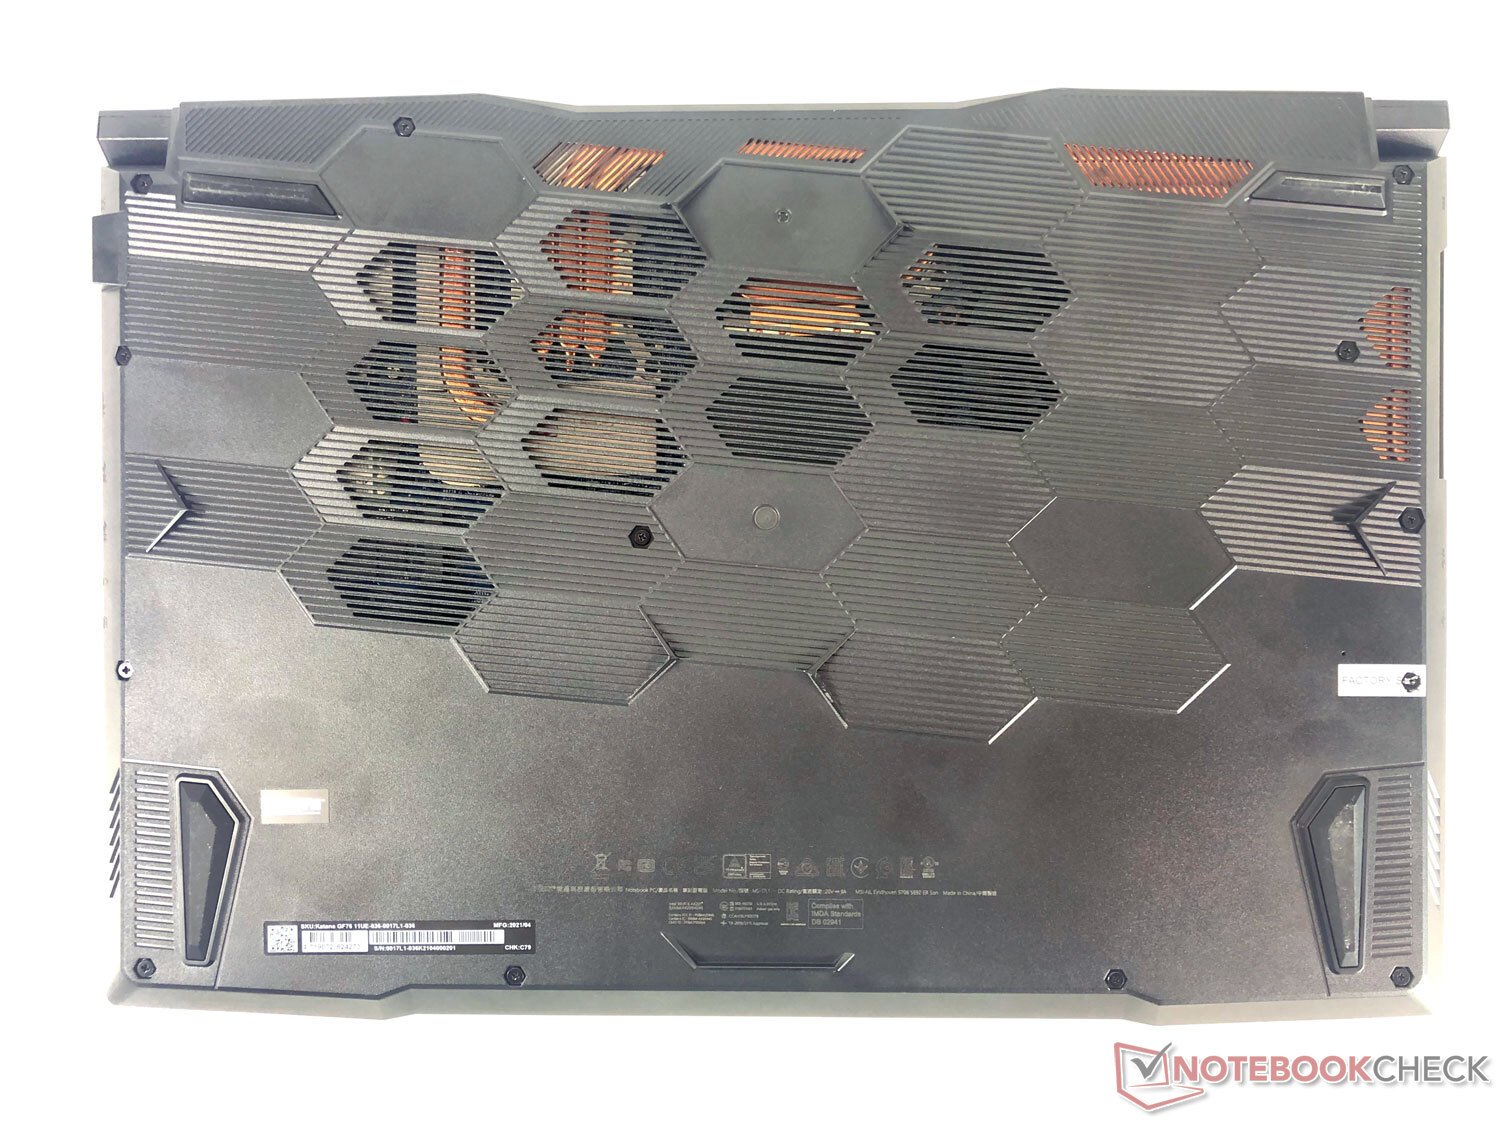
Maintenance
11 small cross-head screws block the way into the interior. This makes it possible for the user to carry out maintenance, replacement, and upgrade procedures. The SO-DIMM slots can accommodate a maximum of 64 GB of RAM. In addition, there's a free M.2 slot for another SSD.
Warranty
MSI offers the usual two-year manufacturer's warranty including Collect & Return. There's no warranty extension available.
Input devices: Keyboard with number pad and Gaming Hotkey
Keyboard
MSI uses the 17.3-inch device's space for a keyboard with a solid key size and a number pad crammed to the right. Looking at the case, there would have been more room to the left and right, but this is probably not possible due to the internal components. Especially the number keys, but also the arrow keys, are quite small. On the other hand, the WASD keys, which are important for gamers, have a comfortable size, just like all the other letters. In addition, there are special Gaming Hotkeys for specific functions as well as for the usual double assignment of the F1 to F12 keys. Unfortunately, a fingerprint sensor is not on board.
The key travel is 1.7 mm. That is generally quite a lot for a laptop and solid for a voluminous gaming device. Noise development remains pleasingly moderate when typing quickly. The typing experience is good, allowing the device to be used not only for gaming but also for the occasional typing session. However, there are definitely better alternatives when it comes to office devices.
The keyboard illumination can be adjusted in three levels, and it makes sure that the keys labeled in red are well illuminated and recognizable. It glows exclusively in red. There are no modifiable colors or other gimmicks on the MSI Katana GF76.
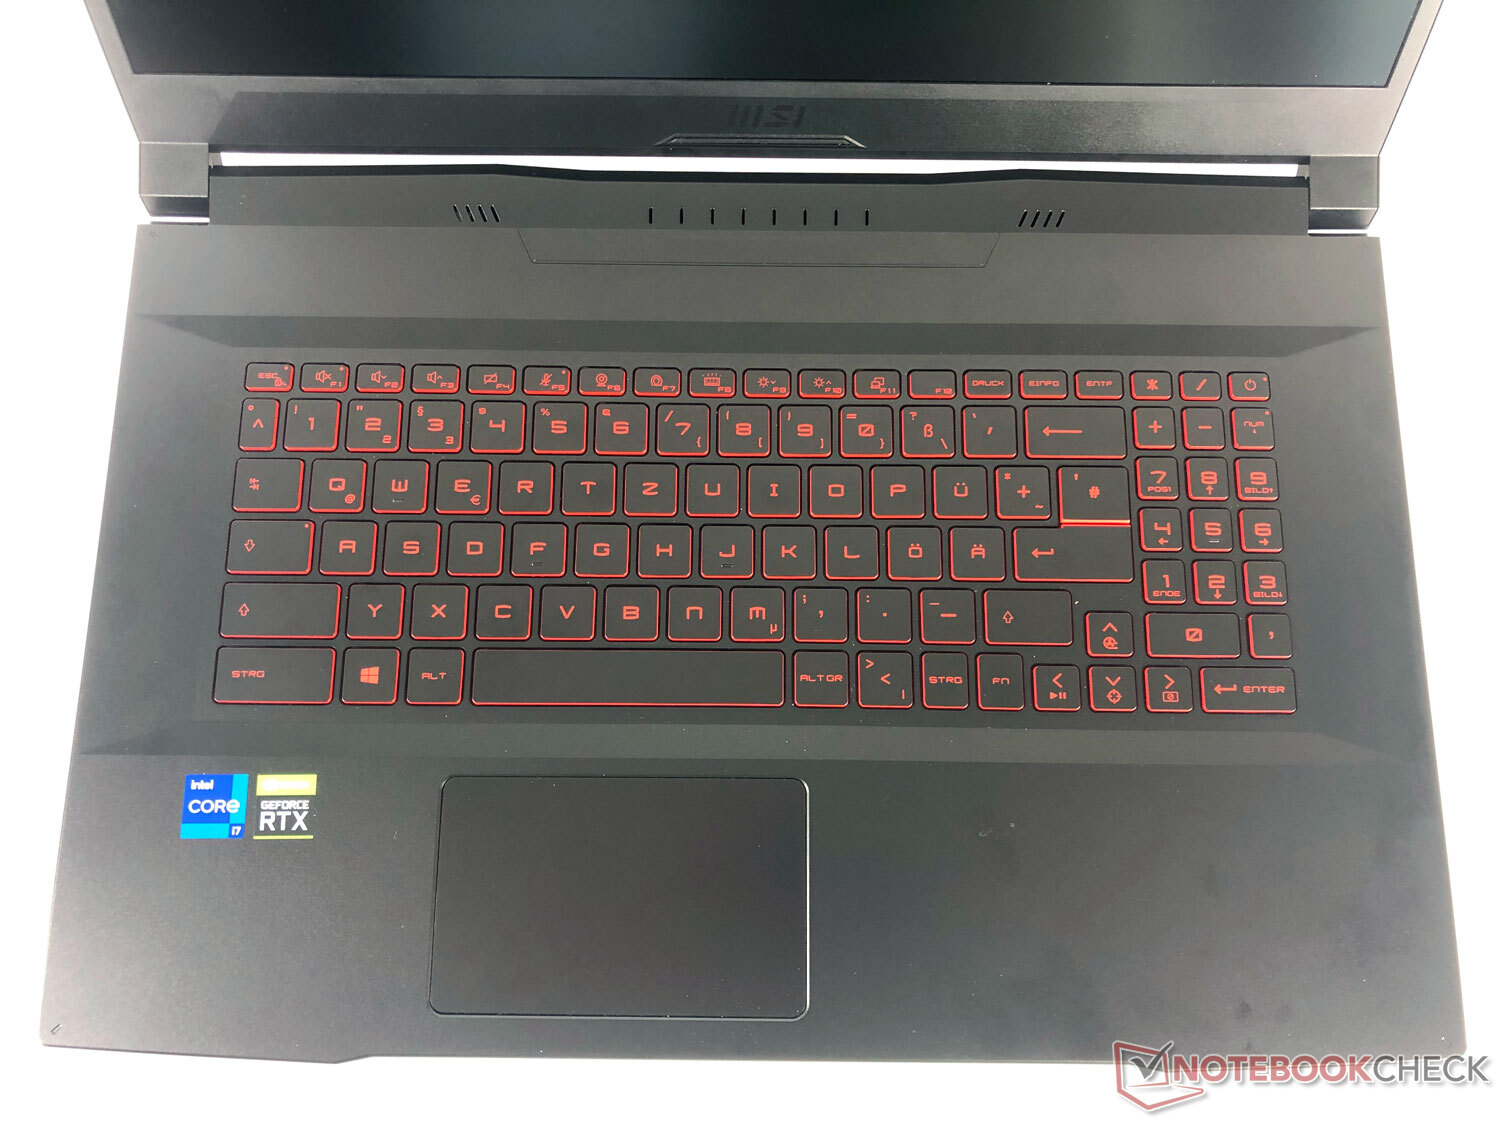
Touchpad
The touchpad, which is only slightly recessed, is placed in the center under the space bar and measures 10.5 x 6.5 cm. It's comfortable to the touch, and the two click surfaces at the bottom left and right aren't noticeably loud. The touchpad works with pleasant precision, so there are hardly any points of criticism in our review of the Katana GF76 in this regard.
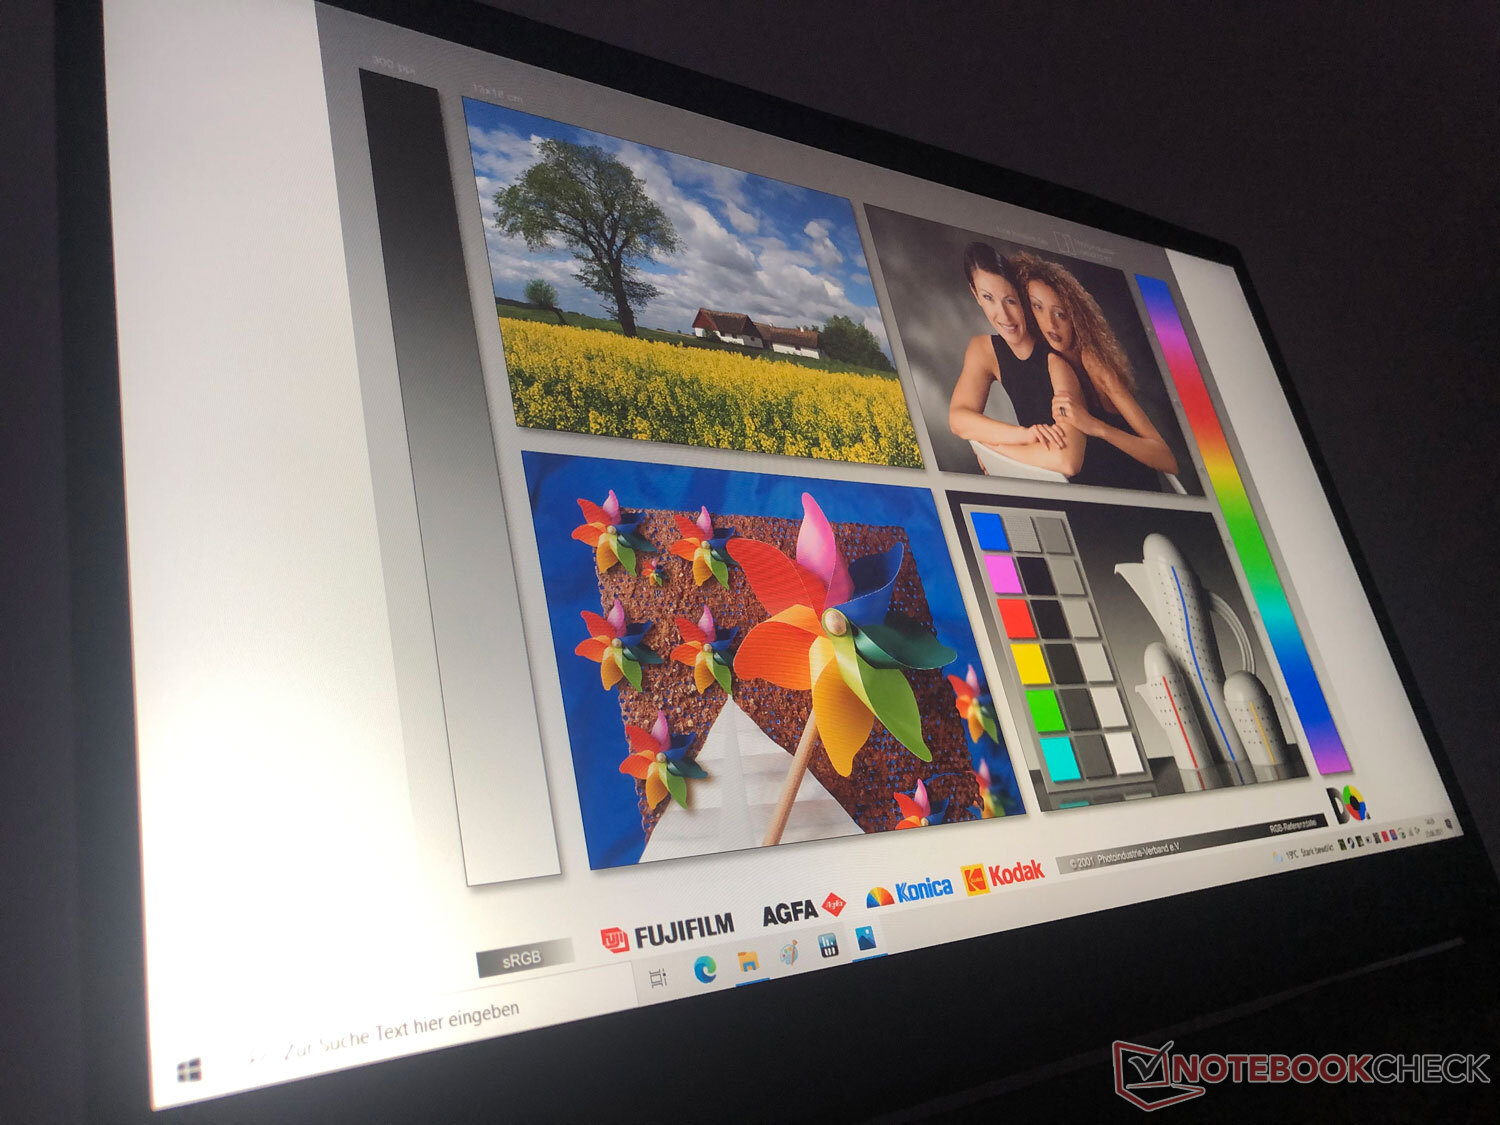
Display: Fast 144 Hz refresh rate but many weaknesses as well
In addition to the powerful hardware, the 17.3-inch display is one of the Katana GF76's highlights according to the manufacturer. It refreshes at a fast 144 Hz, which provides for a smooth gaming experience combined with the performance level. The IPS panel with LED backlight has a resolution of 1920x1080 pixels and a matte surface.
| |||||||||||||||||||||||||
Brightness Distribution: 85 %
Center on Battery: 260 cd/m²
Contrast: 1000:1 (Black: 0.26 cd/m²)
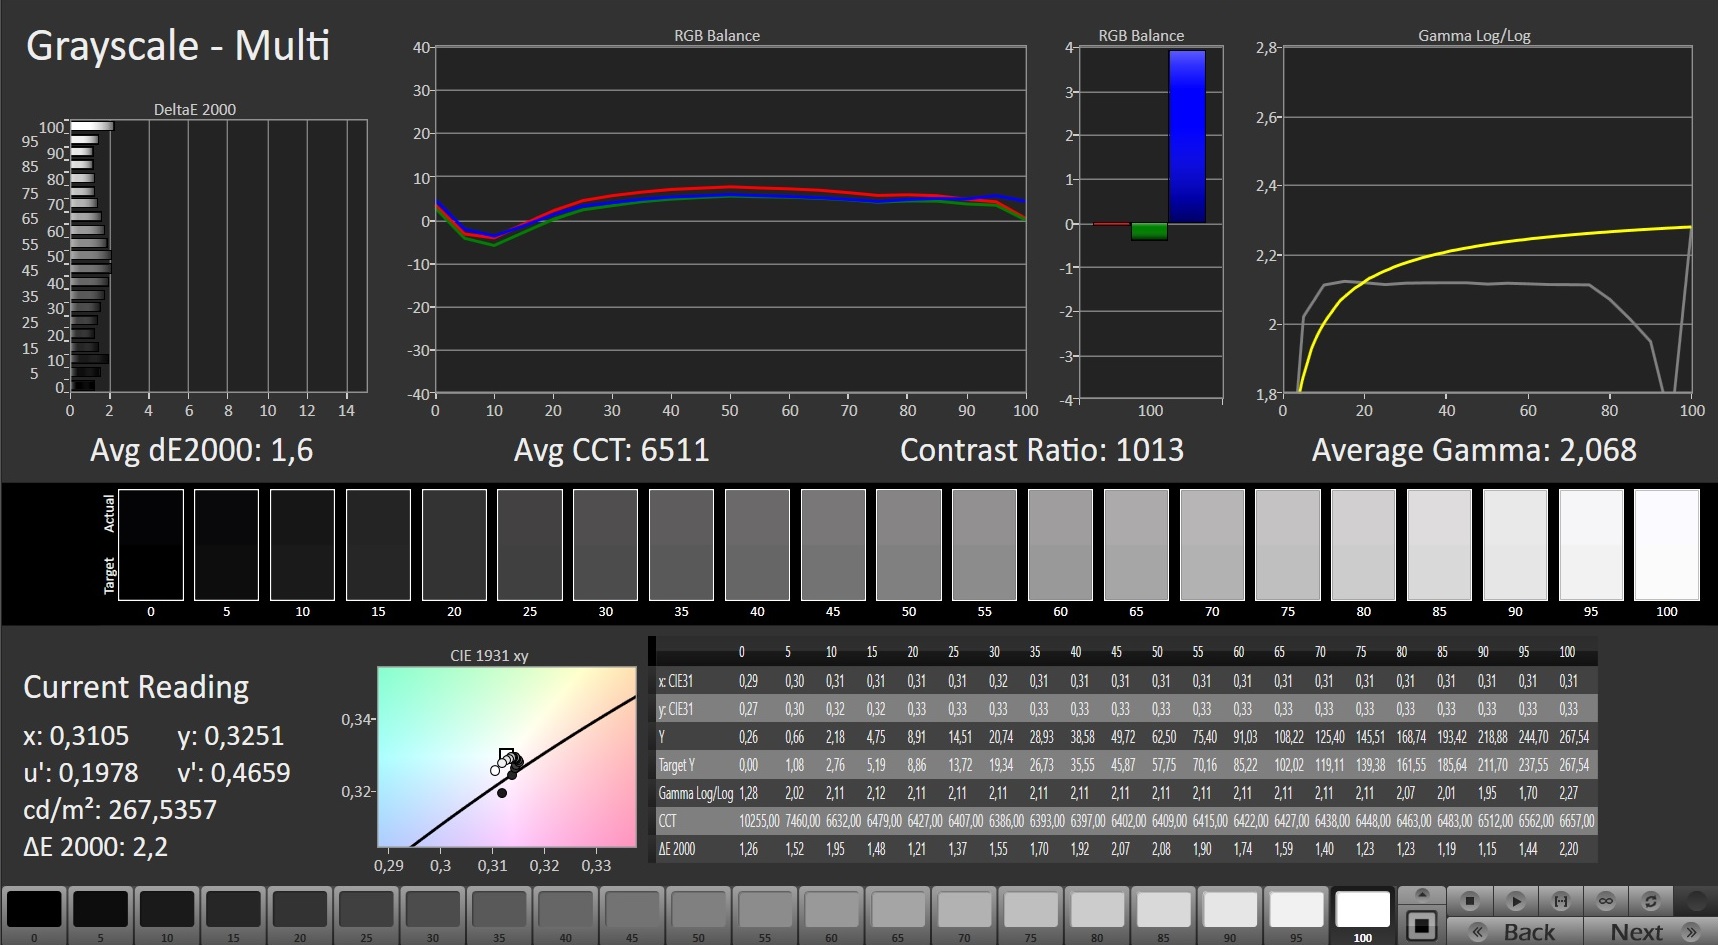
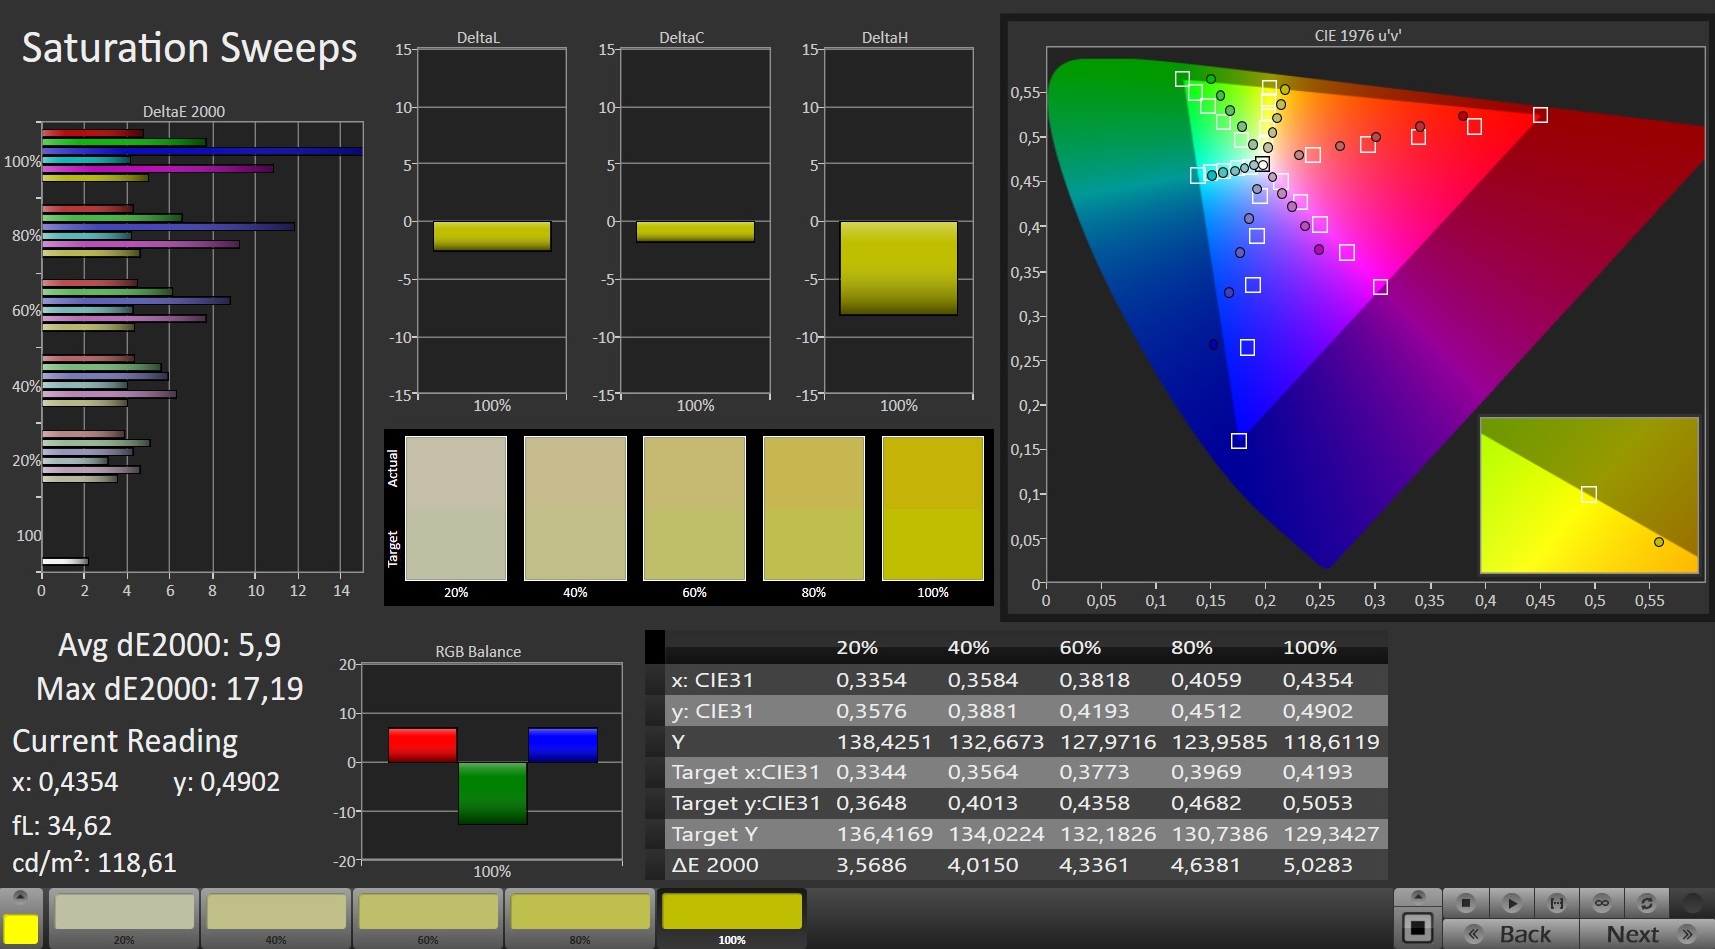
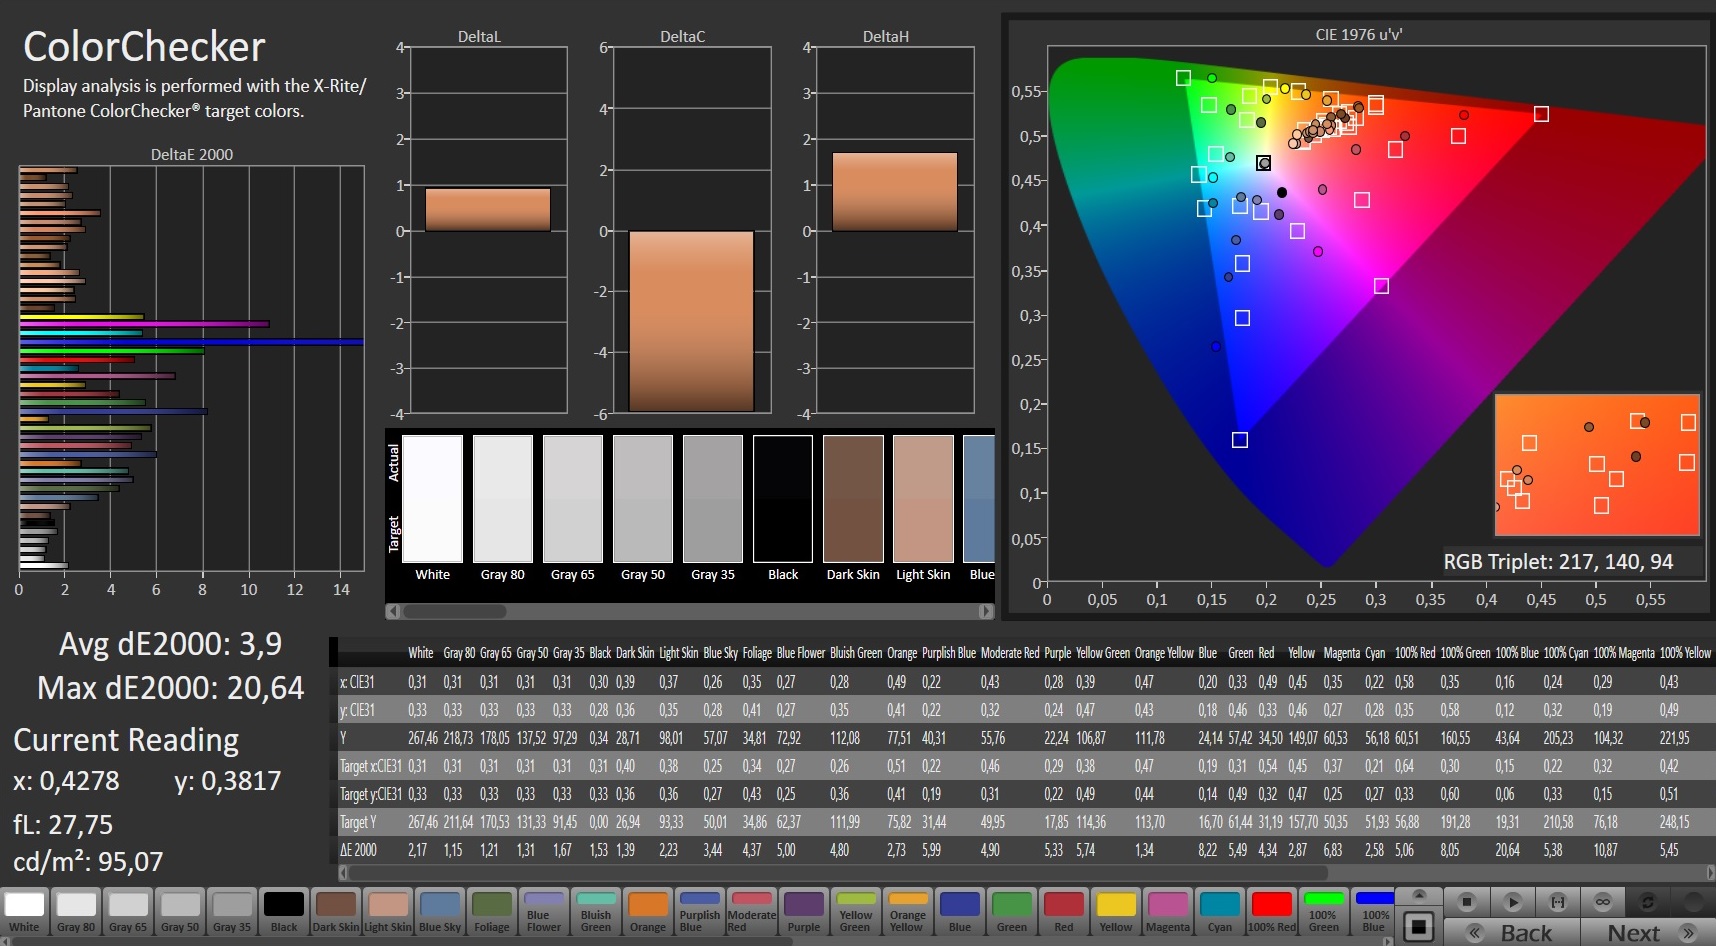
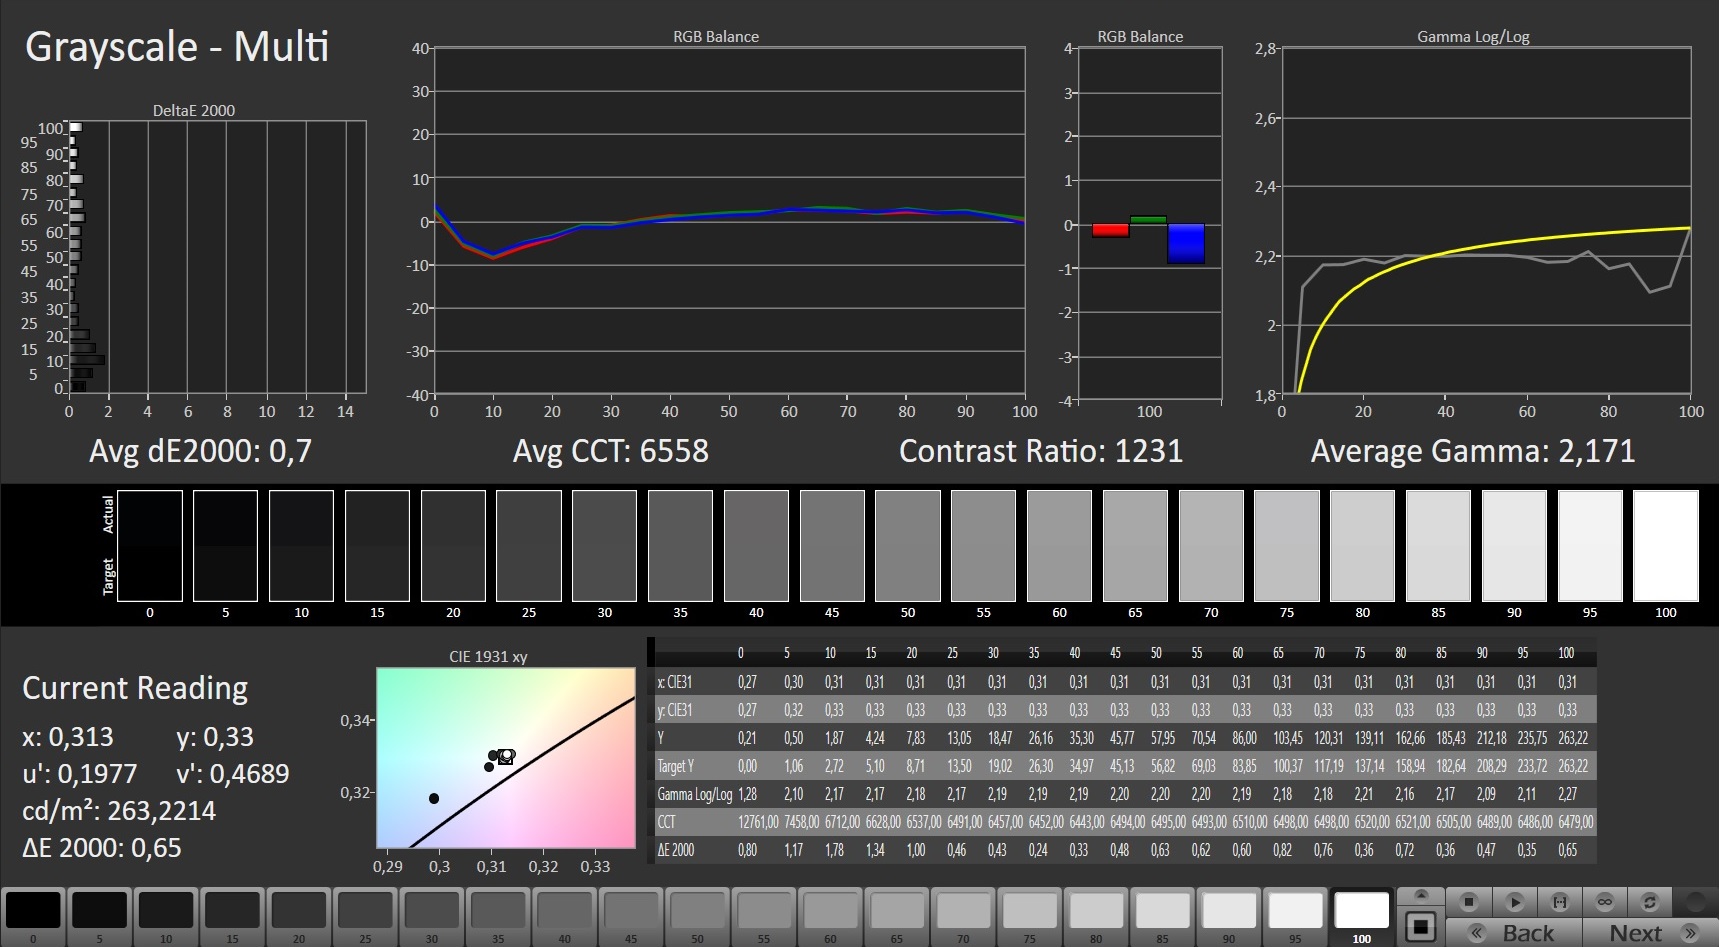
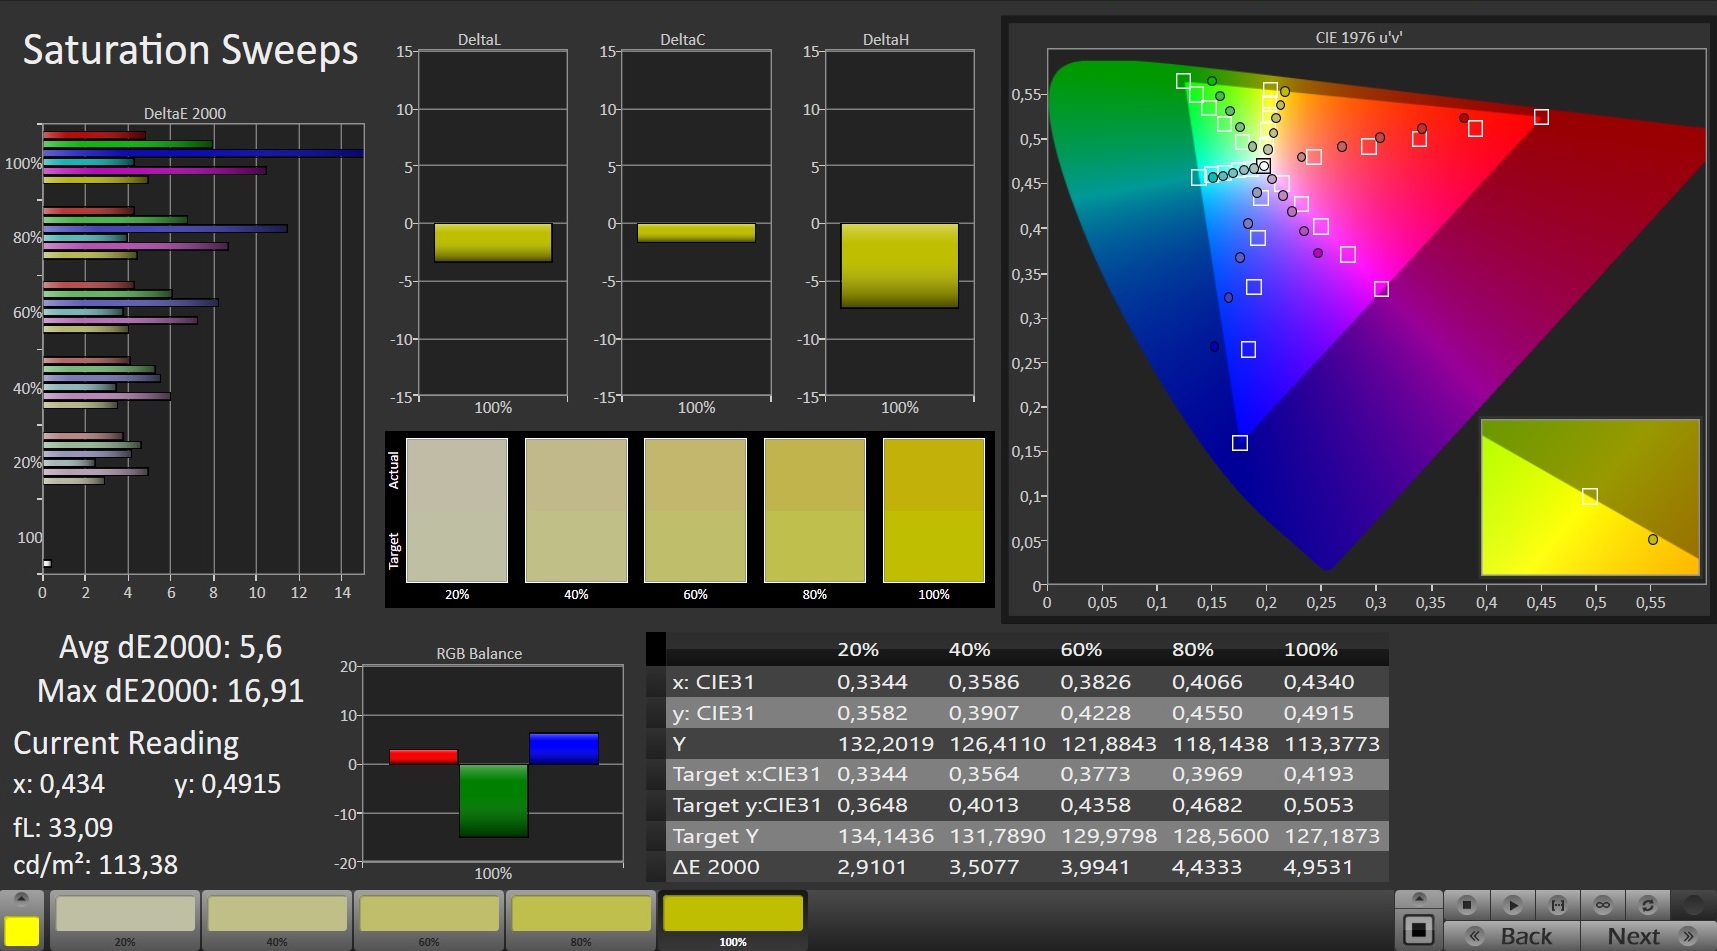
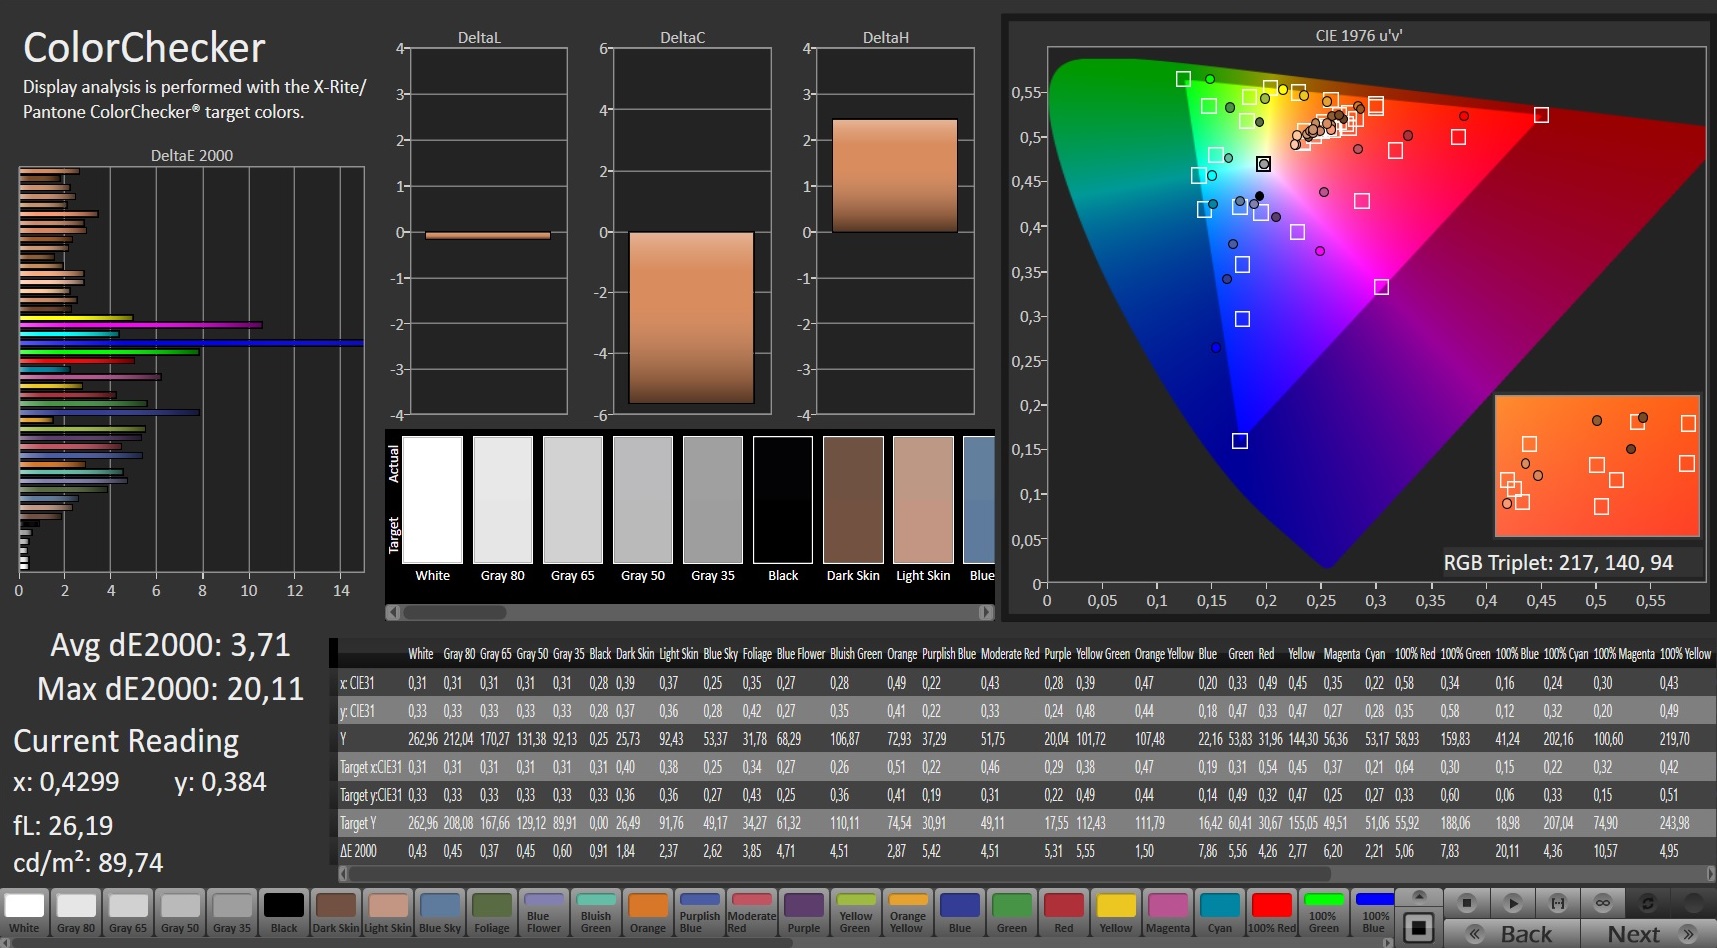
ΔE Color 3.9 | 0.5-29.43 Ø5, calibrated: 3.71
ΔE Greyscale 1.6 | 0.57-98 Ø5.3
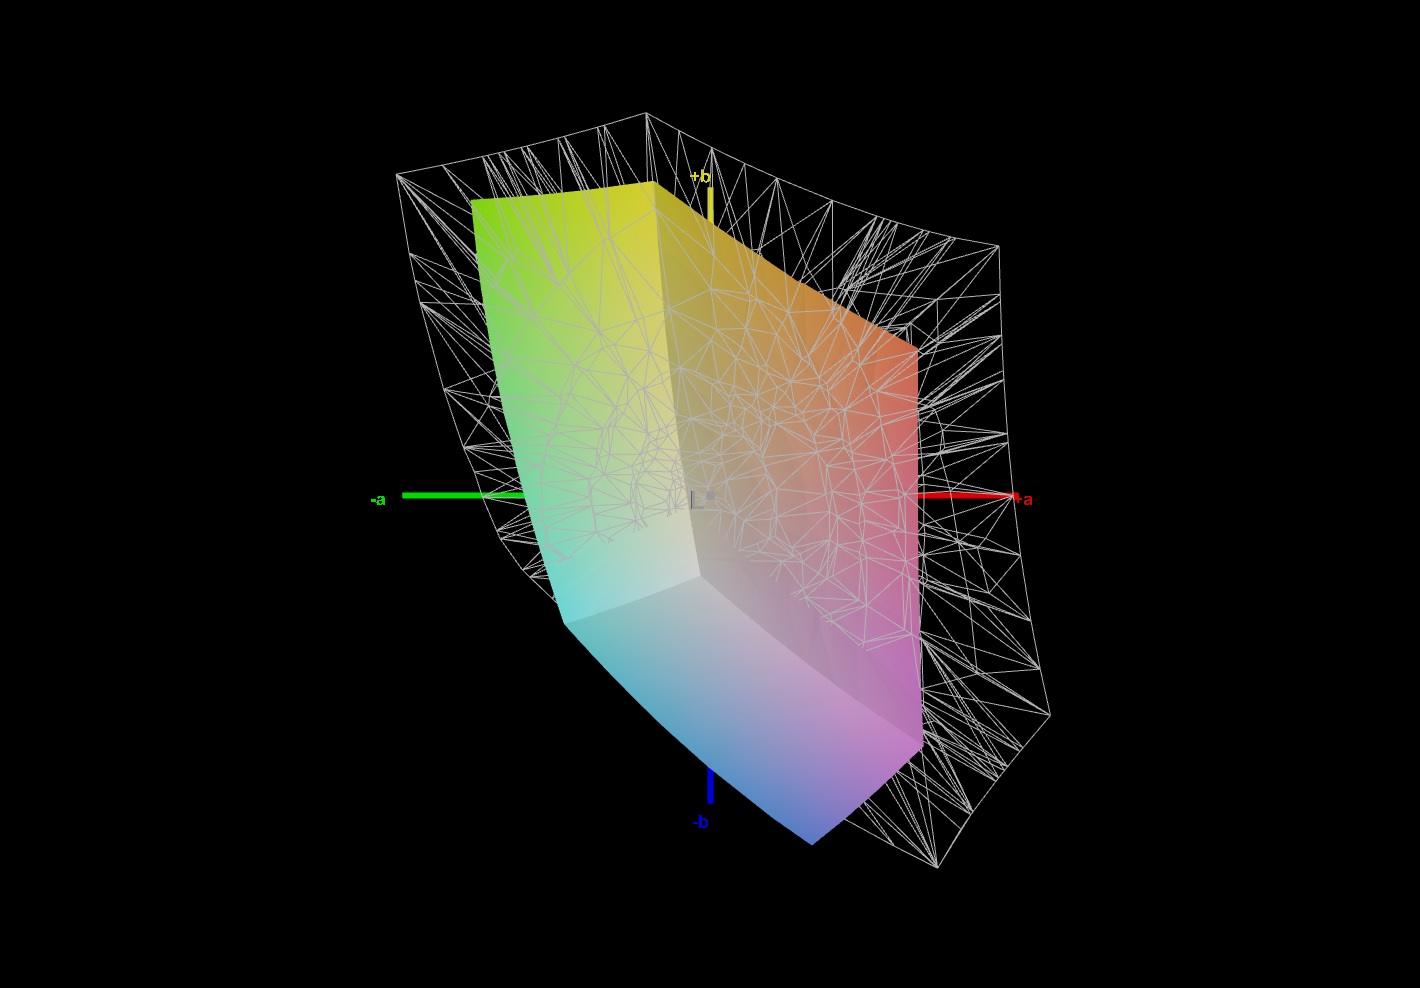
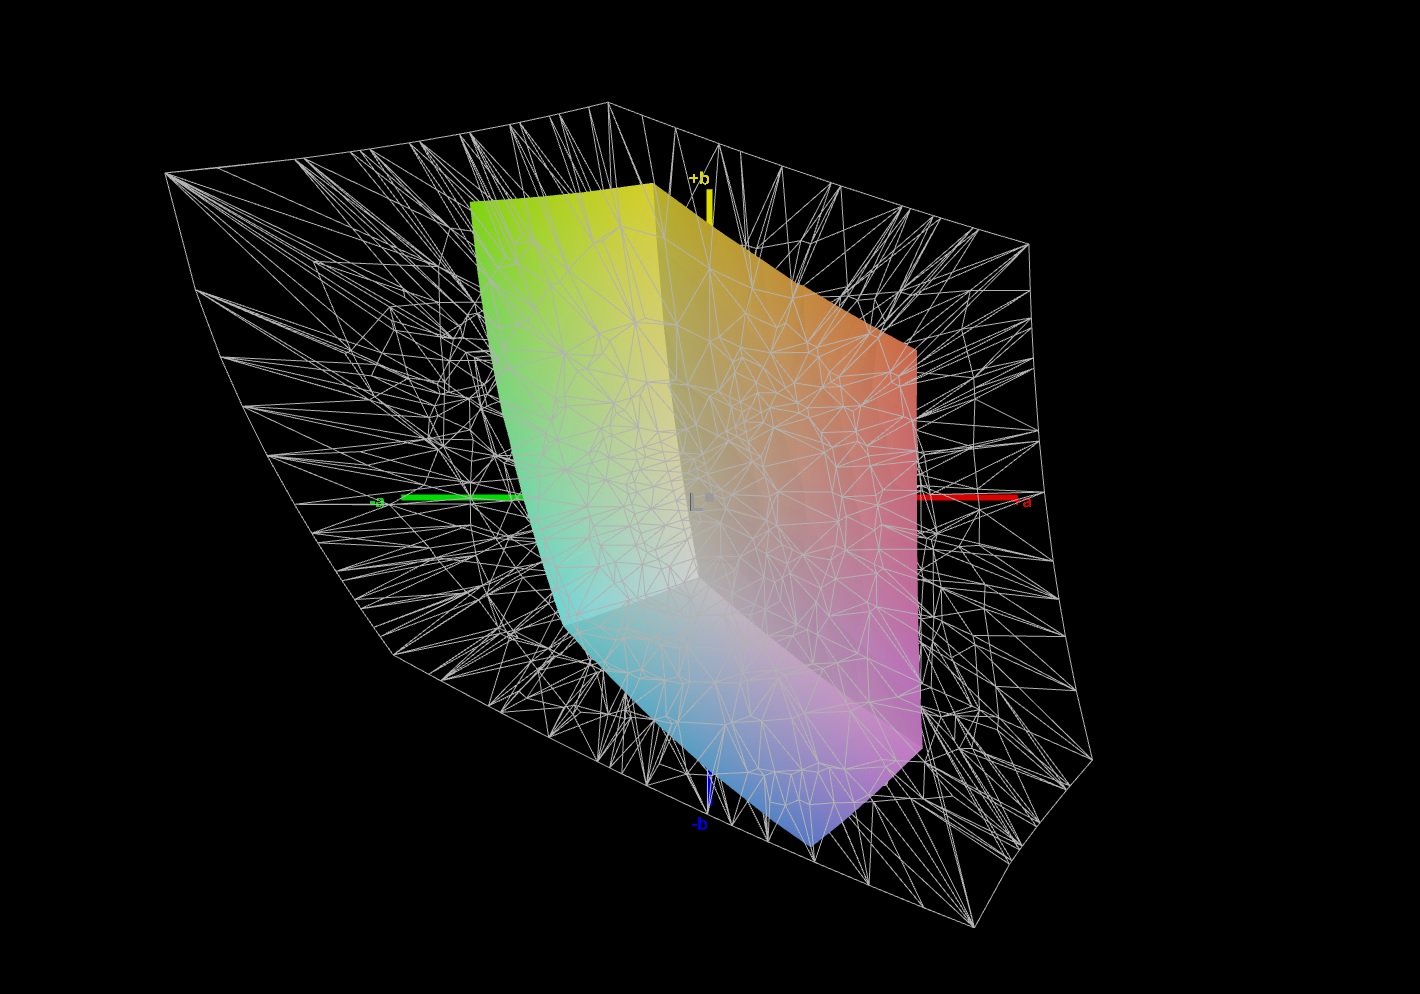
41.12% AdobeRGB 1998 (Argyll 2.2.0 3D)
59.5% sRGB (Argyll 2.2.0 3D)
39.8% Display P3 (Argyll 2.2.0 3D)
Gamma: 2.068
| MSI Katana GF76 11UE AU Optronics B173HAN04.9, IPS, 1920x1080, 17.30 | MSI GP76 Leopard 10UG Chi Mei CMN176E, IPS, 1920x1080, 17.30 | MSI GF65 Thin 10UE AU Optronics B156HAN08.4, IPS, 1920x1080, 15.60 | Alienware m15 R5 Ryzen Edition B156HAN, IPS, 1920x1080, 15.60 | SCHENKER XMG Core 17 (Early 2021) BOE CQ NE173QHM-NY2, IPS, 2560x1440, 17.30 | Aorus 17G YD Sharp LQ173M1JW04, IPS, 1920x1080, 17.30 | |
|---|---|---|---|---|---|---|
| Display | 63% | -5% | 69% | 76% | ||
| Display P3 Coverage | 39.8 | 64.7 63% | 37.65 -5% | 68.1 71% | 72.3 82% | |
| sRGB Coverage | 59.5 | 96.4 62% | 56.3 -5% | 98.5 66% | 100 68% | |
| AdobeRGB 1998 Coverage | 41.12 | 66.9 63% | 38.9 -5% | 69.3 69% | 73.7 79% | |
| Response Times | 69% | -11% | 79% | 58% | 64% | |
| Response Time Grey 50% / Grey 80% * | 36.8 ? | 7.4 ? 80% | 36.8 ? -0% | 4 ? 89% | 16.8 ? 54% | 13.6 ? 63% |
| Response Time Black / White * | 26 ? | 10.8 ? 58% | 31.6 ? -22% | 8.4 ? 68% | 10 ? 62% | 9.2 ? 65% |
| PWM Frequency | 24510 ? | |||||
| Screen | 21% | -15% | 21% | 6% | 10% | |
| Brightness middle | 260 | 328 26% | 266.5 3% | 329 27% | 370 42% | 286 10% |
| Brightness | 251 | 314 25% | 262 4% | 321 28% | 333 33% | 282 12% |
| Brightness Distribution | 85 | 87 2% | 91 7% | 92 8% | 84 -1% | 73 -14% |
| Black Level * | 0.26 | 0.29 -12% | 0.18 31% | 0.27 -4% | 0.38 -46% | 0.24 8% |
| Contrast | 1000 | 1131 13% | 1481 48% | 1219 22% | 974 -3% | 1192 19% |
| Colorchecker dE 2000 * | 3.9 | 1.93 51% | 5.33 -37% | 2.78 29% | 2.41 38% | 2.79 28% |
| Colorchecker dE 2000 max. * | 20.64 | 4.94 76% | 18.28 11% | 4.88 76% | 7.32 65% | 6.23 70% |
| Colorchecker dE 2000 calibrated * | 3.71 | 0.68 82% | 4.36 -18% | 1.63 56% | 1.19 68% | 0.82 78% |
| Greyscale dE 2000 * | 1.6 | 2.8 -75% | 4.5 -181% | 2.5 -56% | 3.9 -144% | 3.5 -119% |
| Gamma | 2.068 106% | 2.18 101% | 2.35 94% | 2.106 104% | 2.287 96% | 2.358 93% |
| CCT | 6511 100% | 7023 93% | 6289 103% | 6201 105% | 7302 89% | 6147 106% |
| Color Space (Percent of AdobeRGB 1998) | 67 | 35.6 | 76 | 69 | 74 | |
| Color Space (Percent of sRGB) | 89 | 55.8 | 99 | 93 | 96 | |
| Total Average (Program / Settings) | 51% /
37% | -10% /
-12% | 50% /
31% | 44% /
27% | 50% /
32% |
* ... smaller is better
In addition to the modest brightness, the remaining values are also rather poor. The display doesn't even cover 60% of the sRGB color space. Response times, which are even more relevant for gamers, aren't all that good either. While we could extend this list by quite a bit, we'll keep it short: The displays of most of the comparison devices are significantly better, and they have refresh rates that are at least as fast.
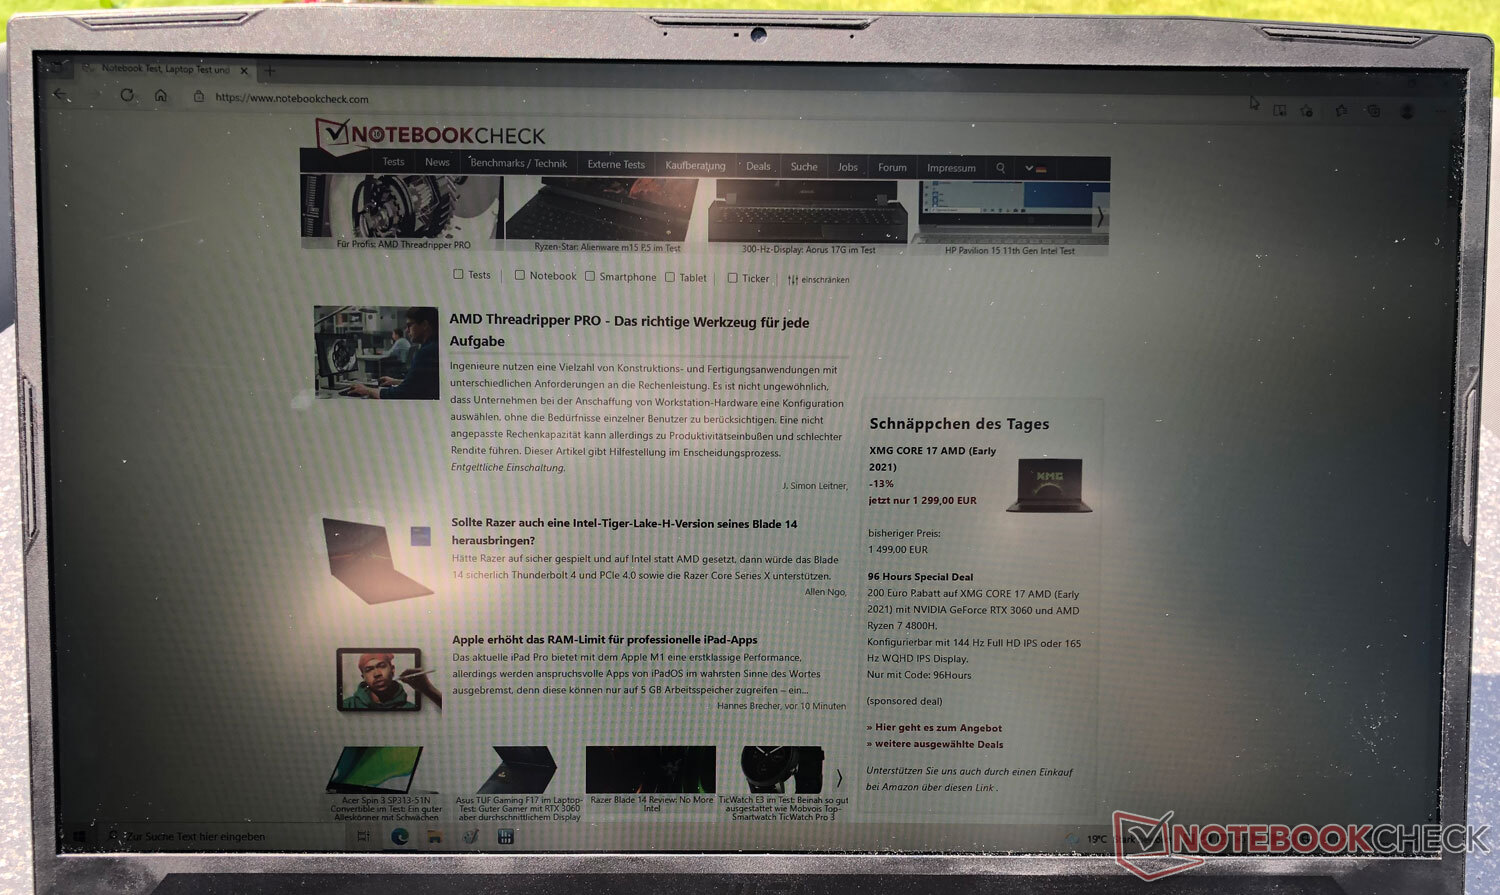
Although the brightness of around 250 cd/m² isn't particularly high, unfortunately, the device is still acceptable for outdoor use - at least when the sun isn't shining too brightly. This is mostly due to the matte and non-reflective display.
However, since the device is relatively bulky by design due to it being a gaming laptop, it's unlikely to be used outdoors. The anti-glare panel also has an advantage when gaming indoors. The matte display hardly reflects any light sources, which means that you always have a good view of the game.
Display Response Times
| ↔ Response Time Black to White | ||
|---|---|---|
| 26 ms ... rise ↗ and fall ↘ combined | ↗ 13.6 ms rise | 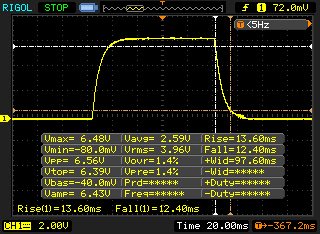 |
| ↘ 12.4 ms fall | ||
| The screen shows relatively slow response rates in our tests and may be too slow for gamers. In comparison, all tested devices range from 0.1 (minimum) to 240 (maximum) ms. » 57 % of all devices are better. This means that the measured response time is worse than the average of all tested devices (21.5 ms). | ||
| ↔ Response Time 50% Grey to 80% Grey | ||
| 36.8 ms ... rise ↗ and fall ↘ combined | ↗ 17.2 ms rise | 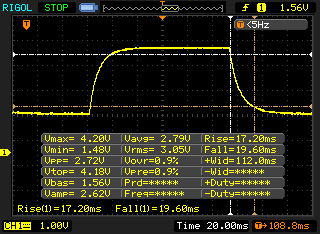 |
| ↘ 19.6 ms fall | ||
| The screen shows slow response rates in our tests and will be unsatisfactory for gamers. In comparison, all tested devices range from 0.2 (minimum) to 636 (maximum) ms. » 47 % of all devices are better. This means that the measured response time is similar to the average of all tested devices (33.7 ms). | ||
Screen Flickering / PWM (Pulse-Width Modulation)
| Screen flickering / PWM not detected | 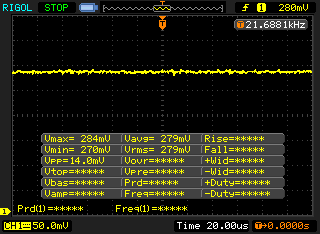 | ||
In comparison: 53 % of all tested devices do not use PWM to dim the display. If PWM was detected, an average of 17900 (minimum: 5 - maximum: 3846000) Hz was measured. | |||
Viewing-angle stability is excellent thanks to the IPS panel, allowing content to be easily recognized even from oblique viewing angles.
Performance: Gaming laptop with fast CPU
MSI offers the Katana GF76 in many different configurations. In addition to two variants (11SC-081 and 11UC-210) with the Intel Core i5-11400H, most models are equipped with the Intel Core i7-11800H from the Tiger Lake generation. These include the Katana 11US-083 that comes with the GeForce RTX 3050 laptop GPU, various models with the GeForce RTX 3050 Ti laptop GPU, and finally, the top model with the GeForce RTX 3070 laptop GPU.
Our MSI Katana GF76 11UE-036 test device is one of the best configuration variants. It's equipped with the Intel Core i7-11800H Tiger Lake CPU, the GeForce RTX 3060 laptop GPU, 16 GB of DDR4-3200 RAM, and a 512 GB M.2 PCIe NVMe SSD.
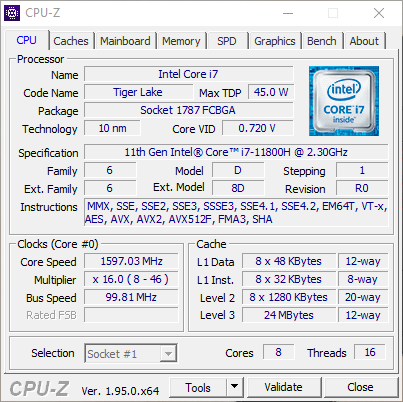
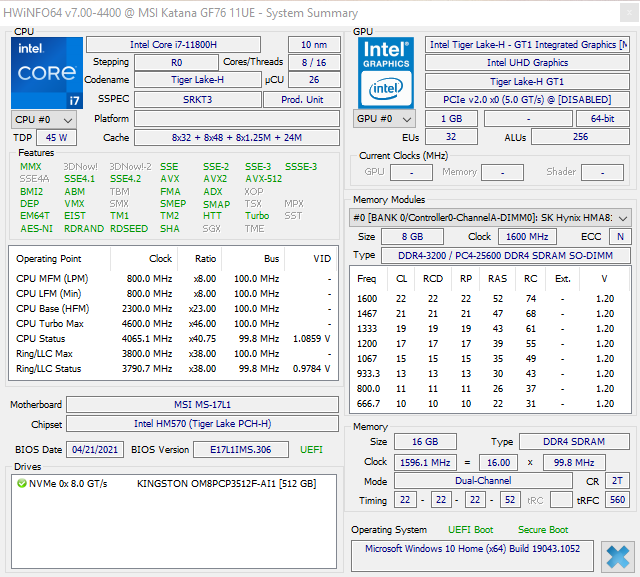
Processor
Intel's Core i7-11800H is a CPU from the Tiger Lake generation specifically designed for gaming laptops and workstations. MSI makes maximum use of the 45-watt TDP and allows a short-term peak of up to 60 watts. The clock rate goes from a minimum of 2.3 GHz to a maximum of 4.6 GHz in single-core Turbo mode as well as 4.2 GHz for all cores. Thanks to the L3 cache that has increased to 24 MB, among other things, the new Tiger Lake CPU offers significantly more performance than the Intel Core i7-10875H (Comet Lake H) predecessor with clock speeds of 2.3 to 5.1 GHz and 16 MB of L3 cache.
In the benchmarks, the MSI Katana GF76 isn't quite able to keep up with the Aorus 17G YD, which has the same CPU but a higher PL2 value, or the CPU average. Thanks to the newer CPU, however, it positions itself clearly ahead of the competitors in our comparison field that are equipped with the Intel Core i7-10750H as well as the Intel Core i7-10870H. Here, the current Tiger Lake H generation shows what it's capable of and its considerable performance gain. Nevertheless, it's well known that the CPU has to give way to the AMD Ryzen 7 5800H from the Alienware m15 R5 Ryzen Edition in some cases. On battery power, the CPU only achieves a good 60% of its performance level when plugged in during the Cinebench benchmark.
* ... smaller is better
System performance
System performance paints the same picture: The Aorus 17G YD usually performs even better, and the Katana GF76 doesn't entirely reach the CPU/GPU average, either. However, compared with the other devices, it performs well, which is mainly thanks to the new CPU generation. Therefore, there are no problems in everyday use, and the laptop runs at a fast speed.
| PCMark 8 Home Score Accelerated v2 | 5458 points | |
| PCMark 8 Creative Score Accelerated v2 | 9135 points | |
| PCMark 8 Work Score Accelerated v2 | 6208 points | |
| PCMark 10 Score | 6505 points | |
Help | ||
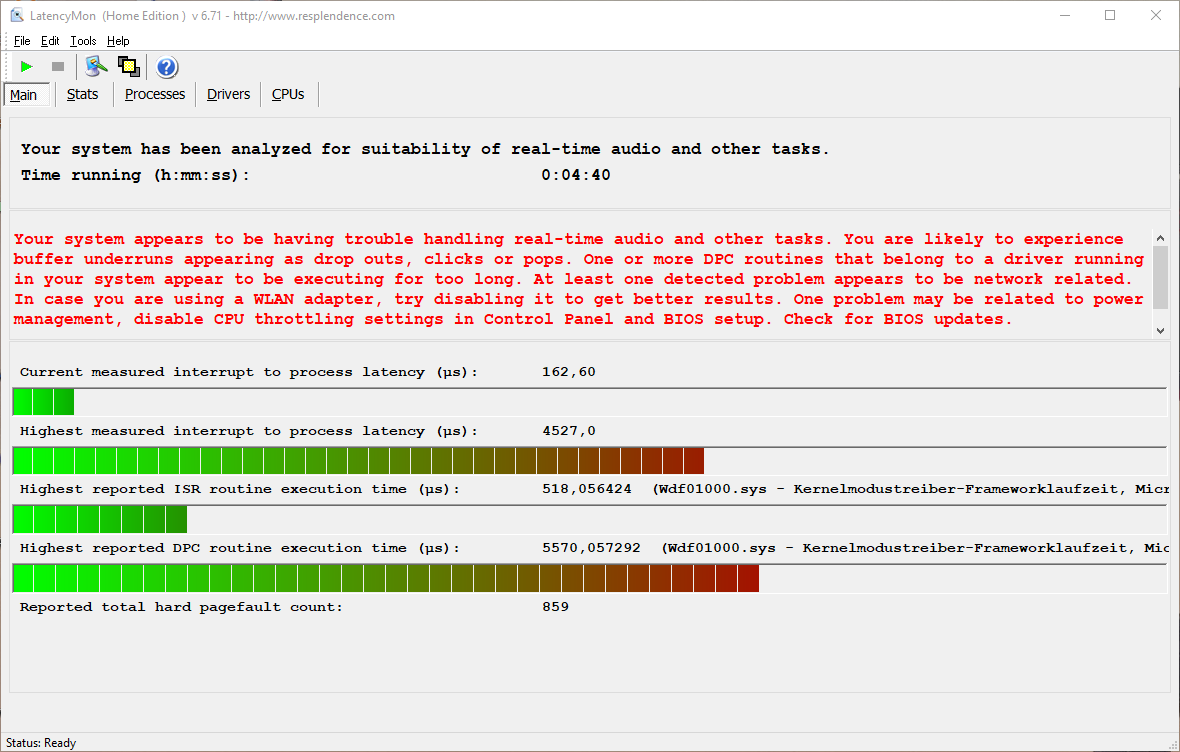
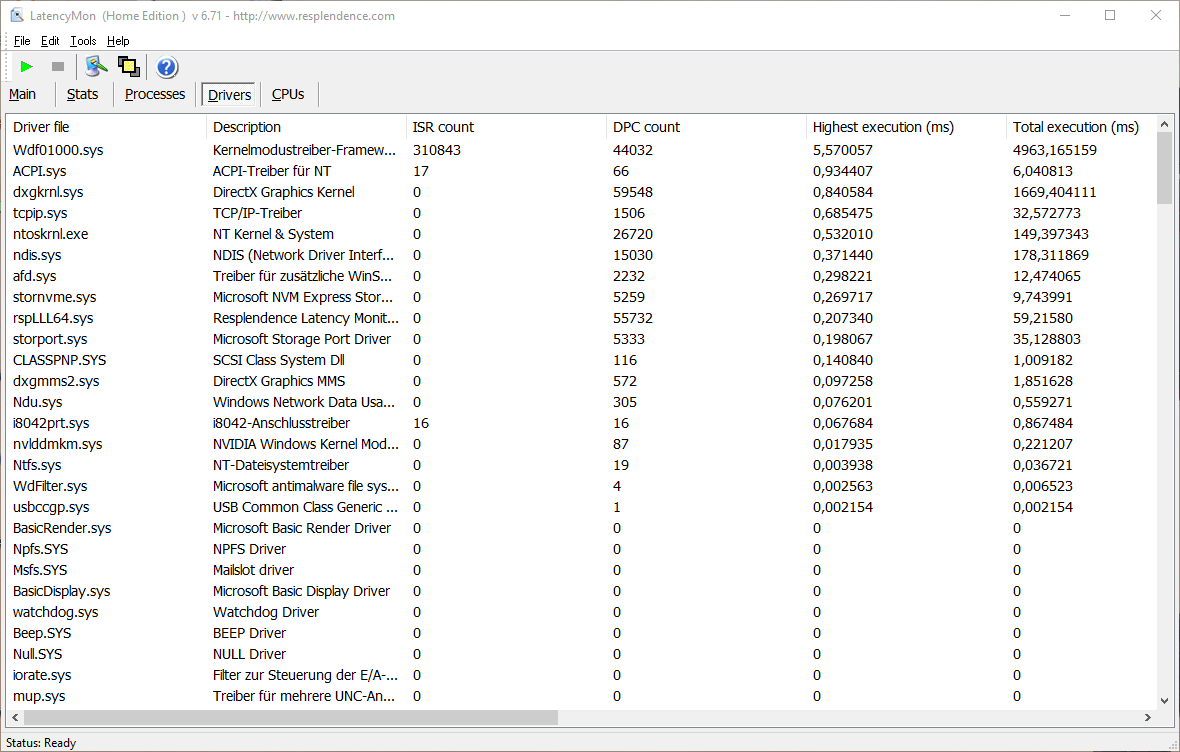
DPC latencies
The Katana GF76 exhibited very high latencies in our test, and these were confirmed over multiple repetitions. This implies that the device isn't ideal for real-time audio and video editing. That said, this always remains a momentary snapshot.
| DPC Latencies / LatencyMon - interrupt to process latency (max), Web, Youtube, Prime95 | |
| MSI Katana GF76 11UE | |
| MSI GP76 Leopard 10UG | |
| Aorus 17G YD | |
| MSI GF65 Thin 10UE | |
| SCHENKER XMG Core 17 (Early 2021) | |
| Alienware m15 R5 Ryzen Edition | |
* ... smaller is better
Storage
The SSD installed in the MSI Katana GF76 is not really able to convince in the test. On one hand, it's relatively small for a gaming device with 512 GB. However, thanks to the free M.2 slot (NVMe PCIe Gen 3), an additional SSD can be added later if necessary. Furthermore, the device is also available with a 1 TB SSD and an otherwise identical configuration for an extra charge in the form of the Katana GF76 11UE-058.
The built-in model's operating speed is modest. In our benchmarks, it predominantly lands at the bottom of the list, it achieves significantly worse rates than most comparison models, and it also scores 10% worse than the average of all devices equipped with this SSD. It's not a clear performance bottleneck in everyday use though. However, copying operations and the like can sometimes take a bit longer than in other gaming laptops.
| MSI Katana GF76 11UE Kingston OM8PCP3512F-AB | MSI GP76 Leopard 10UG Kingston OM8PCP3512F-AB | MSI GF65 Thin 10UE Samsung SSD PM981 MZVLB1T0HALR | Alienware m15 R5 Ryzen Edition Toshiba KBG40ZNS512G NVMe | SCHENKER XMG Core 17 (Early 2021) Samsung SSD 970 EVO Plus 1TB | Aorus 17G YD Samsung PM9A1 MZVL2512HCJQ | Average Kingston OM8PCP3512F-AB | |
|---|---|---|---|---|---|---|---|
| CrystalDiskMark 5.2 / 6 | 2% | 66% | 25% | 98% | 132% | 9% | |
| Write 4K | 107.3 | 143.7 34% | 157.3 47% | 116.9 9% | 145.7 36% | 227.4 112% | 194.5 ? 81% |
| Read 4K | 45.46 | 45.1 -1% | 46.69 3% | 44.56 -2% | 51.3 13% | 91.3 101% | 47.3 ? 4% |
| Write Seq | 978 | 978 0% | 2389 144% | 1552 59% | 3036 210% | 2241 129% | 978 ? 0% |
| Read Seq | 1255 | 1163 -7% | 2196 75% | 1682 34% | 2837 126% | 4496 258% | 1299 ? 4% |
| Write 4K Q32T1 | 579 | 519 -10% | 407.6 -30% | 497.8 -14% | 511 -12% | 661 14% | 505 ? -13% |
| Read 4K Q32T1 | 299.6 | 302.7 1% | 519 73% | 436.8 46% | 582 94% | 712 138% | 301 ? 0% |
| Write Seq Q32T1 | 978 | 981 0% | 2401 146% | 1461 49% | 3294 237% | 1540 57% | 978 ? 0% |
| Read Seq Q32T1 | 1977 | 1983 0% | 3344 69% | 2364 20% | 3522 78% | 6806 244% | 1930 ? -2% |
| AS SSD | 24% | 195% | 83% | 203% | 308% | 41% | |
| Seq Read | 1704 | 1659 -3% | 3002 76% | 2082 22% | 2876 69% | 5150 202% | 1570 ? -8% |
| Seq Write | 716 | 921 29% | 2420 238% | 825 15% | 2803 291% | 3920 447% | 904 ? 26% |
| 4K Read | 37.77 | 51 35% | 48.46 28% | 42.41 12% | 55.3 46% | 46.6 23% | 48.2 ? 28% |
| 4K Write | 66 | 120.1 82% | 114.3 73% | 98.3 49% | 106.9 62% | 145.8 121% | 118.9 ? 80% |
| 4K-64 Read | 441.2 | 463.5 5% | 1873 325% | 1255 184% | 1662 277% | 2071 369% | 415 ? -6% |
| 4K-64 Write | 735 | 909 24% | 1882 156% | 738 0% | 2101 186% | 3267 344% | 829 ? 13% |
| Access Time Read * | 0.191 | 0.179 6% | 0.045 76% | 0.109 43% | 0.067 65% | 0.078 59% | 0.1294 ? 32% |
| Access Time Write * | 0.053 | 0.032 40% | 0.101 -91% | 0.17 -221% | 0.037 30% | 0.029 45% | 0.0371 ? 30% |
| Score Read | 649 | 680 5% | 2221 242% | 1506 132% | 2005 209% | 2633 306% | 619 ? -5% |
| Score Write | 872 | 1121 29% | 2238 157% | 918 5% | 2488 185% | 2805 222% | 1036 ? 19% |
| Score Total | 1816 | 2130 17% | 5565 206% | 3136 73% | 5520 204% | 7716 325% | 1955 ? 8% |
| Copy ISO MB/s | 912 | 2421 165% | 1391 53% | 2029 122% | 3190 250% | 977 ? 7% | |
| Copy Program MB/s | 278.9 | 705 153% | 645 131% | 691 148% | 987 254% | 373 ? 34% | |
| Copy Game MB/s | 144.6 | 1490 930% | 1101 661% | 1513 946% | 2096 1350% | 610 ? 322% | |
| Total Average (Program / Settings) | 13% /
15% | 131% /
148% | 54% /
62% | 151% /
165% | 220% /
244% | 25% /
30% |
* ... smaller is better

Continuous load read: DiskSpd Read Loop, Queue Depth 8
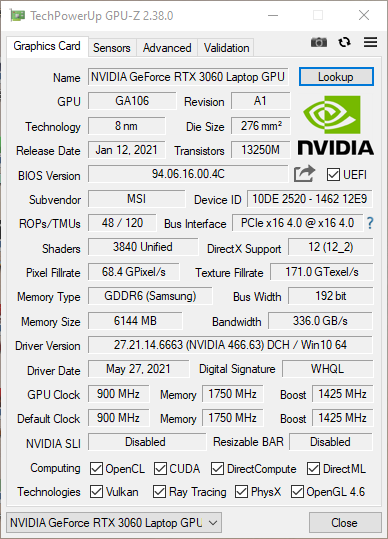
Graphics card
Compared with other gaming laptops using the GeForce RTX 3060 laptop GPU, the MSI Katana GF76 11UE-036 isn't quite able to keep up most of the time. It scores slightly less points in most benchmarks and also ends up below the GPU average. This shows that MSI isn't exploiting the full potential of the graphics solution but is keeping it on a tight leash instead with a TGP of a good 85 watts. MSI restrains the GPU even further on battery power (TGP of around 45 watts).
Needless to say, the Katana GF76 can't really compete with the even more powerful graphics solutions found in the other test devices. Users who need more graphics power than what is offered by the 11UE-036 configuration can get the GeForce RTX 3070 laptop GPU with the 11UG-090 version. If the Nvidia GPU is not needed, the CPU's integrated Intel UHD Graphics takes over.
| 3DMark 11 Performance | 21217 points | |
| 3DMark Ice Storm Standard Score | 113376 points | |
| 3DMark Cloud Gate Standard Score | 44408 points | |
| 3DMark Fire Strike Score | 16909 points | |
| 3DMark Time Spy Score | 7349 points | |
Help | ||
Gaming performance
When it comes to gaming performance, the device delivers an above-average performance under low load. The frame rate then drops below the GPU average as the demand on the GPU increases, which is due to the poor TGP.
| The Witcher 3 | |
| 1366x768 Medium Graphics & Postprocessing | |
| Average of class Gaming (34.2 - 617, n=141, last 2 years) | |
| Aorus 17G YD | |
| Average NVIDIA GeForce RTX 3060 Laptop GPU (204 - 296, n=33) | |
| MSI Katana GF76 11UE | |
| SCHENKER XMG Core 17 (Early 2021) | |
| MSI GF65 Thin 10UE | |
| 1920x1080 High Graphics & Postprocessing (Nvidia HairWorks Off) | |
| Average of class Gaming (17.5 - 449, n=167, last 2 years) | |
| Aorus 17G YD | |
| Average NVIDIA GeForce RTX 3060 Laptop GPU (81 - 186.8, n=41) | |
| SCHENKER XMG Core 17 (Early 2021) | |
| Alienware m15 R5 Ryzen Edition | |
| MSI Katana GF76 11UE | |
| MSI GF65 Thin 10UE | |
| 1920x1080 Ultra Graphics & Postprocessing (HBAO+) | |
| Average of class Gaming (8.61 - 216, n=227, last 2 years) | |
| MSI GP76 Leopard 10UG | |
| Aorus 17G YD | |
| SCHENKER XMG Core 17 (Early 2021) | |
| Average NVIDIA GeForce RTX 3060 Laptop GPU (58.2 - 91.5, n=48) | |
| Alienware m15 R5 Ryzen Edition | |
| MSI Katana GF76 11UE | |
| MSI GF65 Thin 10UE | |
The frame rates in The Witcher 3 are in the lower half of the test field, but they are constant and absolutely sufficient throughout the entire time. All the games that we tested ran without issues and very smoothly at the maximum supported resolution of 1920x1080 pixels and the highest settings. The MSI Katana GF76 doesn't show any weaknesses here yet, but it could eventually reach its limits in future and even more demanding games.
| low | med. | high | ultra | QHD | |
| GTA V (2015) | 178.9 | 171.6 | 146.9 | 81.1 | |
| The Witcher 3 (2015) | 340.9 | 229.4 | 134.4 | 72.6 | |
| Dota 2 Reborn (2015) | 168 | 150 | 140 | 130 | |
| Rise of the Tomb Raider (2016) | 208.5 | 200.3 | 132.9 | 110.2 | |
| Final Fantasy XV Benchmark (2018) | 161 | 98.5 | 74.4 | 54.7 | |
| X-Plane 11.11 (2018) | 121 | 104 | 83.9 | ||
| Far Cry 5 (2018) | 105 | 97 | 91 | ||
| Strange Brigade (2018) | 372 | 179 | 144 | 125 | |
| F1 2020 (2020) | 242 | 169 | 148 | 97.6 | |
| Dirt 5 (2020) | 144 | 92.1 | 77.2 | 65.4 | |
| Days Gone (2021) | 167.2 | 108.3 | 95 | 71.9 |
Emissions: Loud in both ways
Noise emissions
The powerful hardware has its drawbacks as well. At 33 to 35 dB(A), the device only produces a whispering noise in idle usage, but it's already quite audible here. When the device is under stress, the cooling section of the Katana GF76 emits well over 50 decibels.
Although this isn't unusual for a gaming laptop, it's a bit louder compared with some other devices. At least the fan noise remains at a relatively constant level across all load levels, and it doesn't keep fluctuating back and forth. Other unwanted noise, such as transistor whine or the like, didn't occur in our test device.
Noise Level
| Idle |
| 33 / 34 / 35 dB(A) |
| Load |
| 53 / 57 dB(A) |
 | ||
30 dB silent 40 dB(A) audible 50 dB(A) loud |
||
min: | ||
Temperature
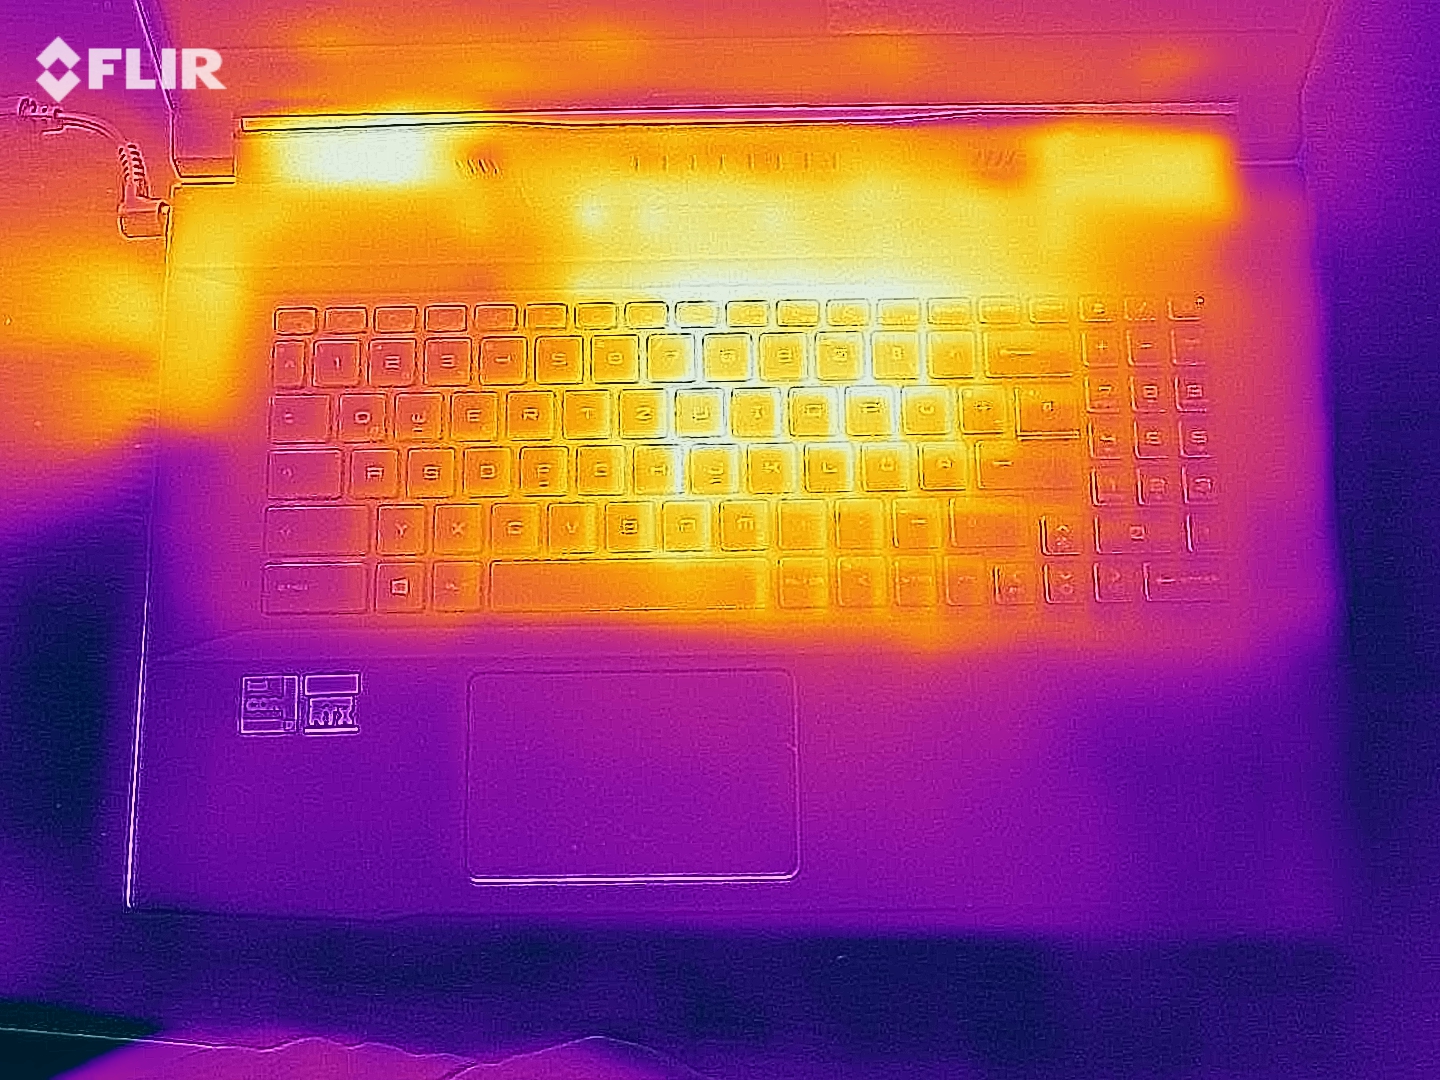
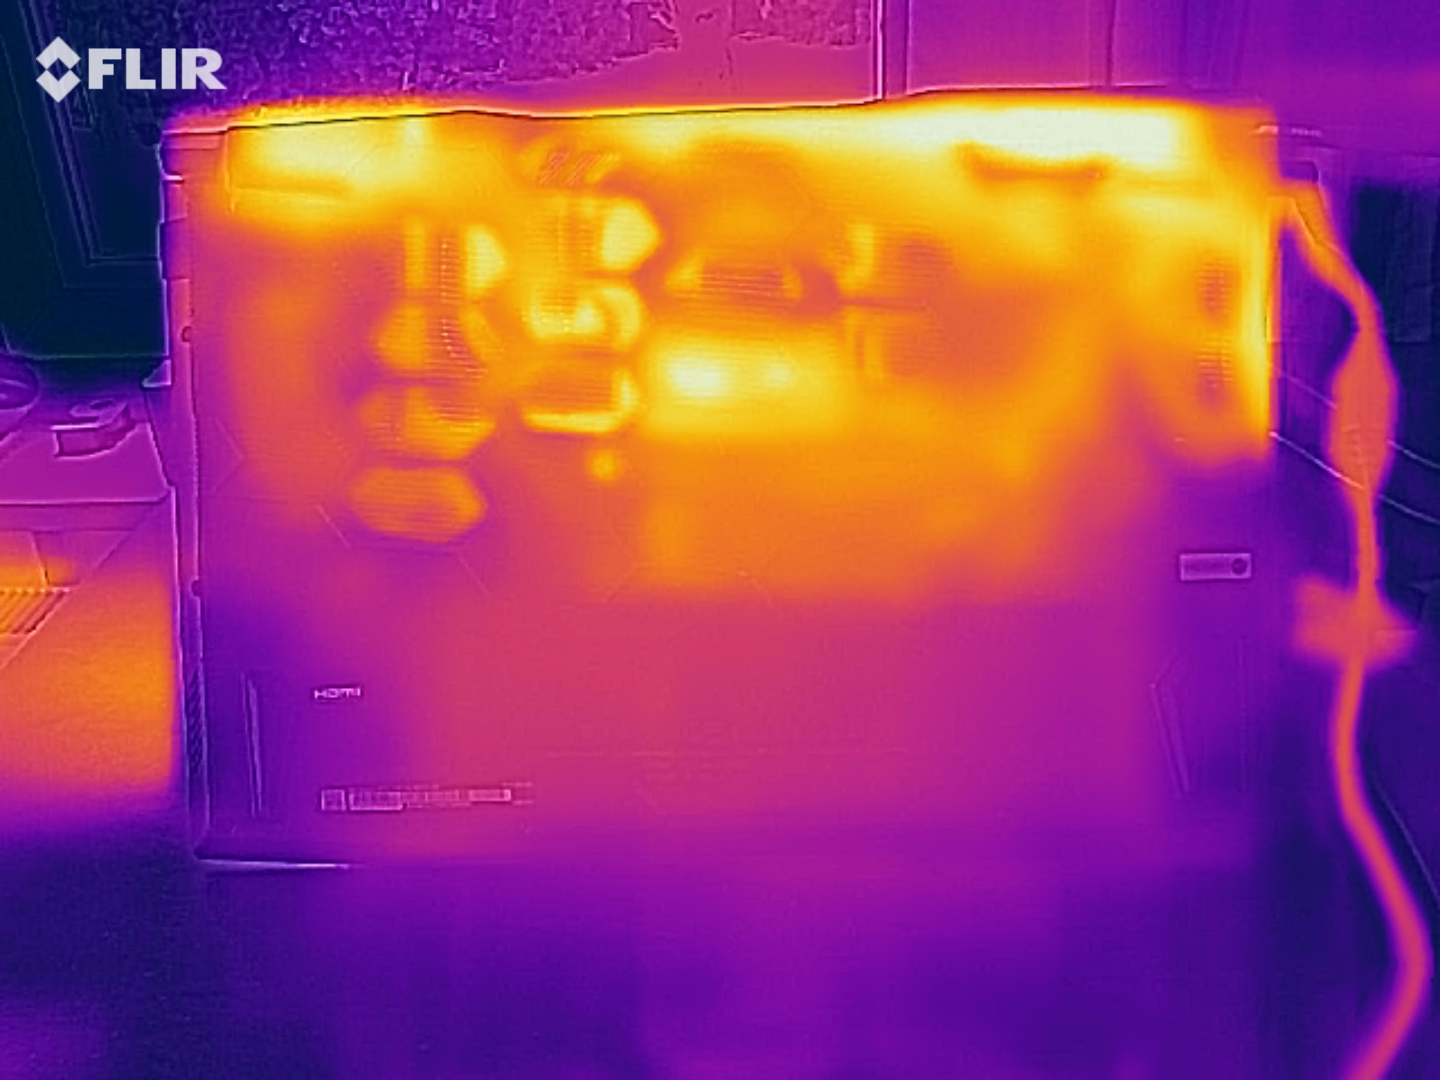
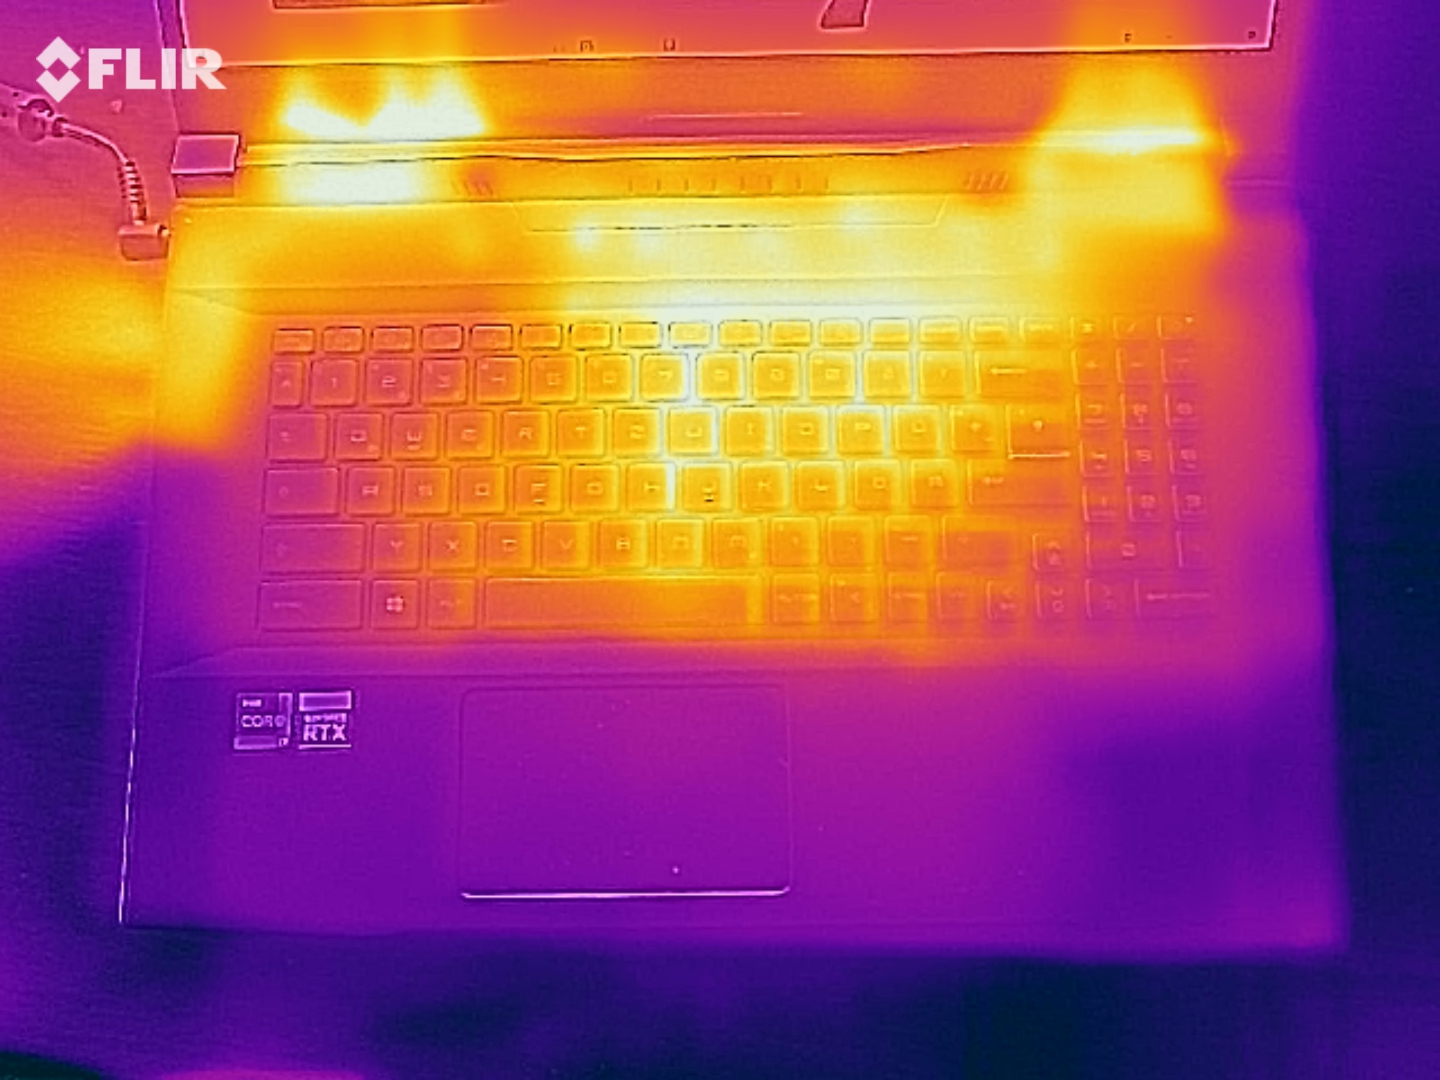
The MSI Katana GF76 sometimes heats up to over 50 °C (~122 °F) under load. Therefore, placing the device on the lap while gaming with shorts is not the best idea. As usual, however, the hottest area is directly in front of the screen.
The keyboard area reaches a reasonable 40 °C (~104 °F) and the touchpad around 35 °C (~95 °F), so that heat development doesn't have a particularly negative impact on the user's hands. The device only heats up marginally above room temperature in idle usage.
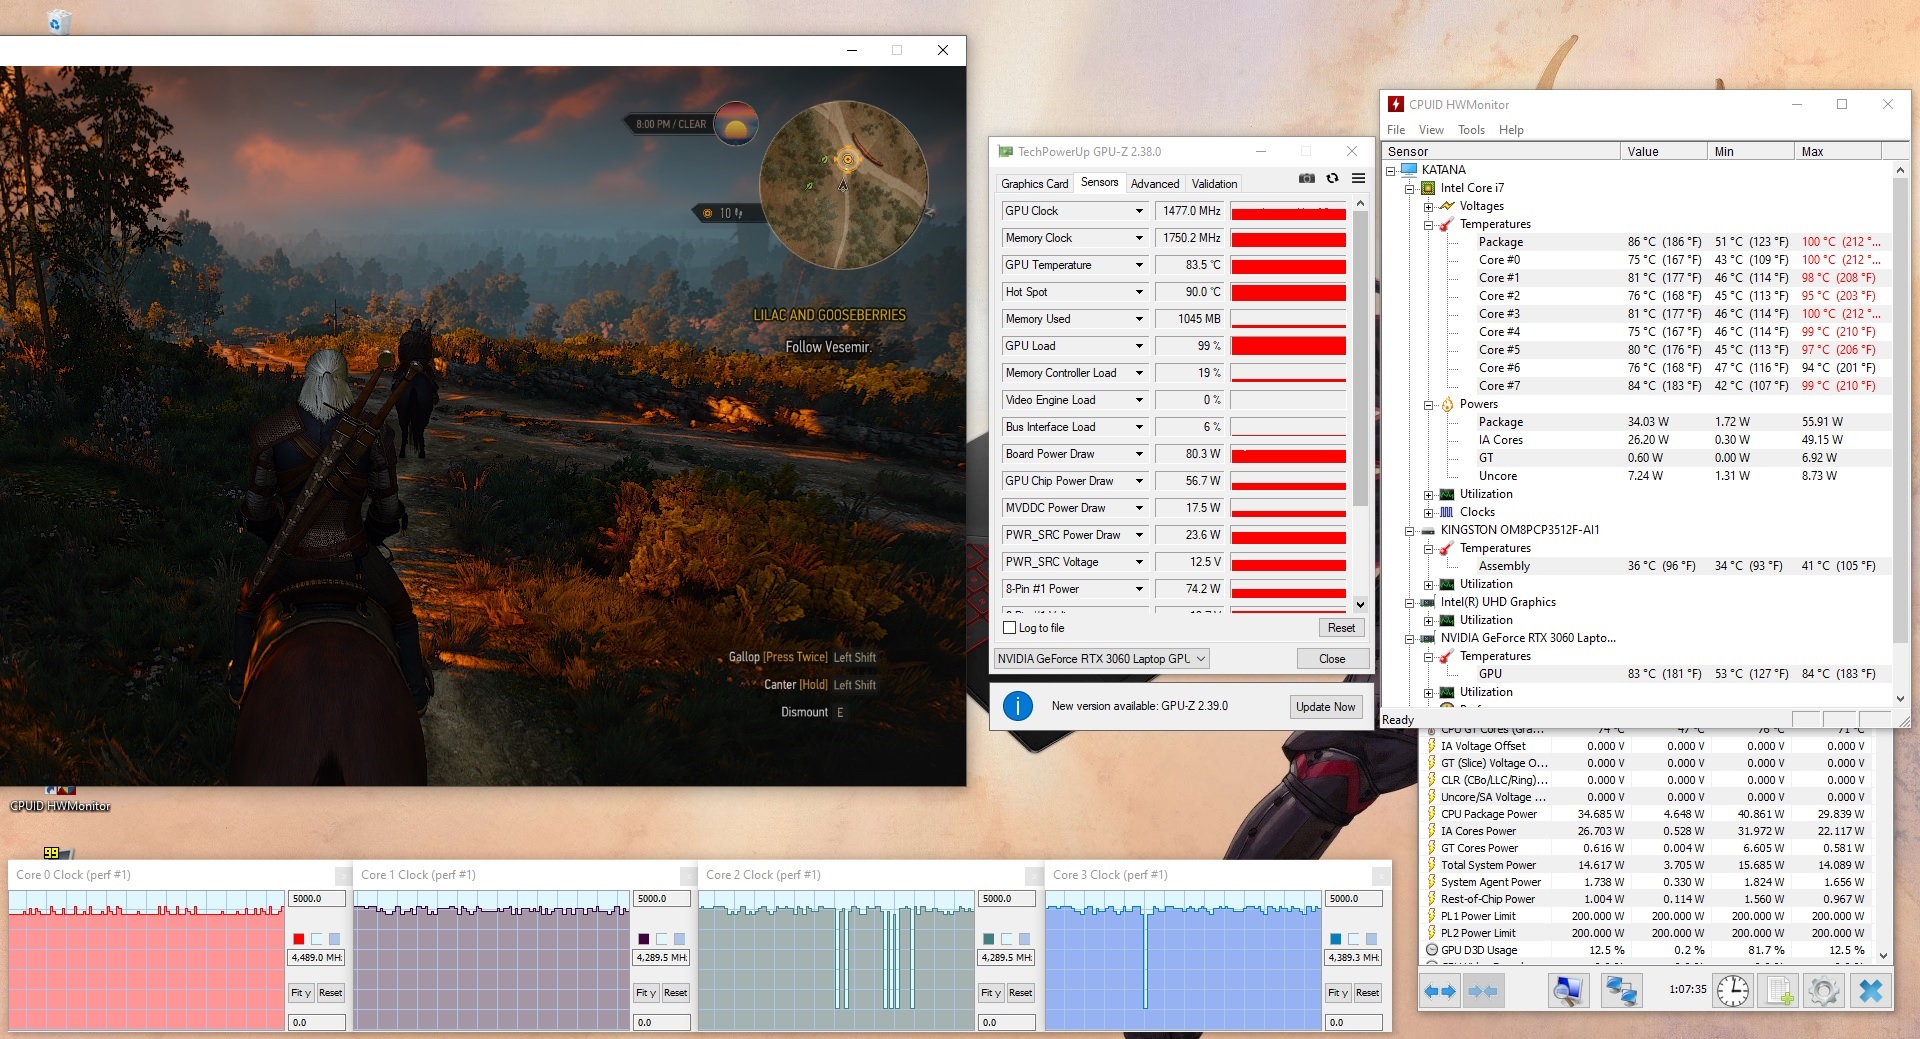
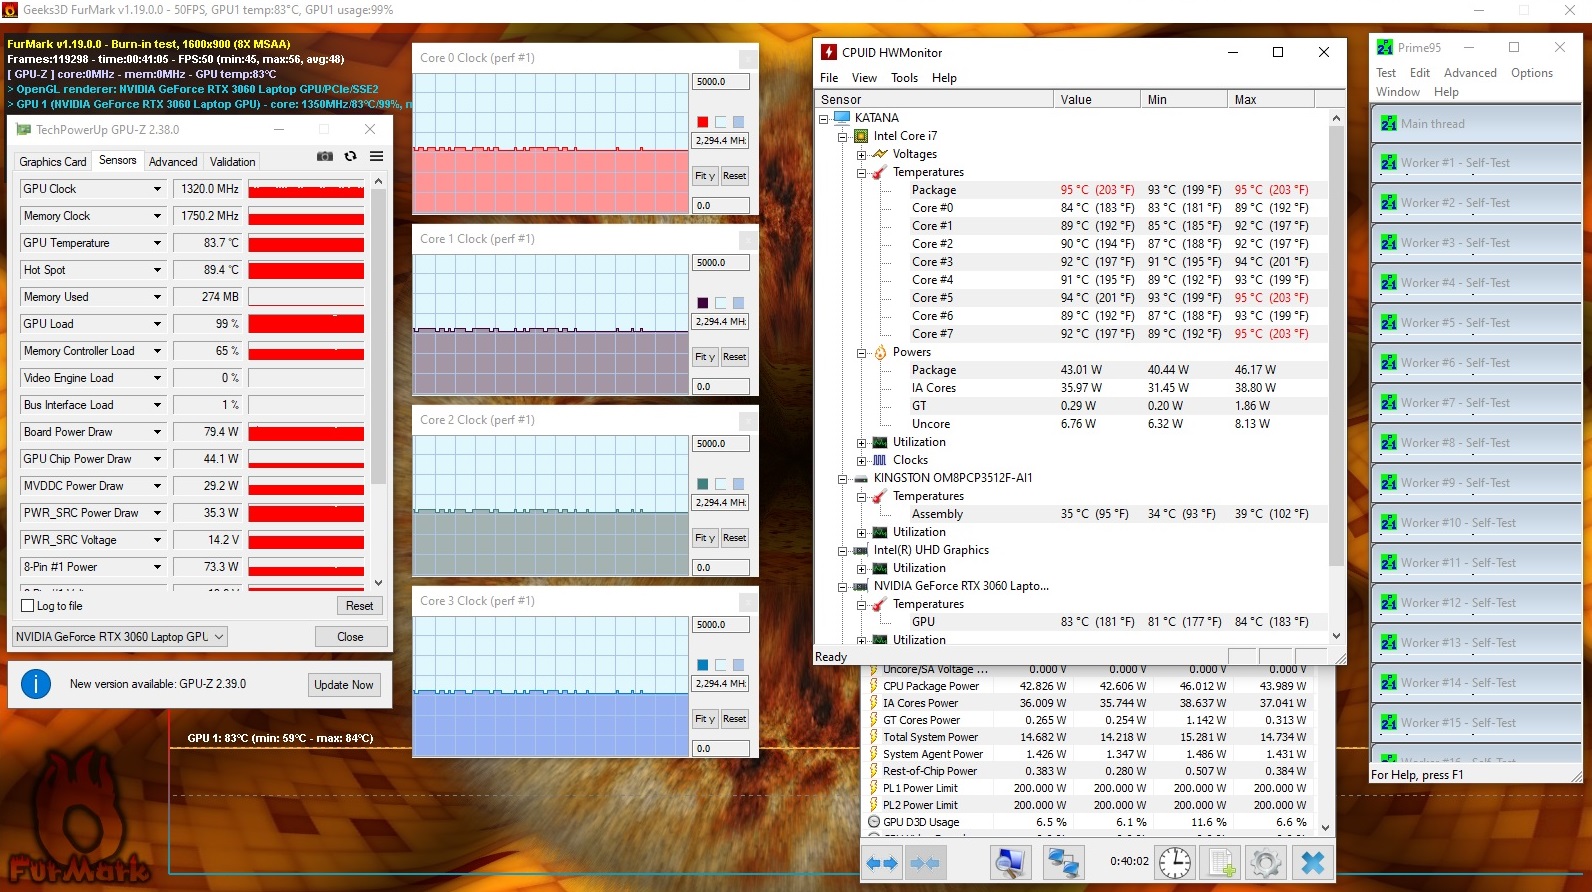
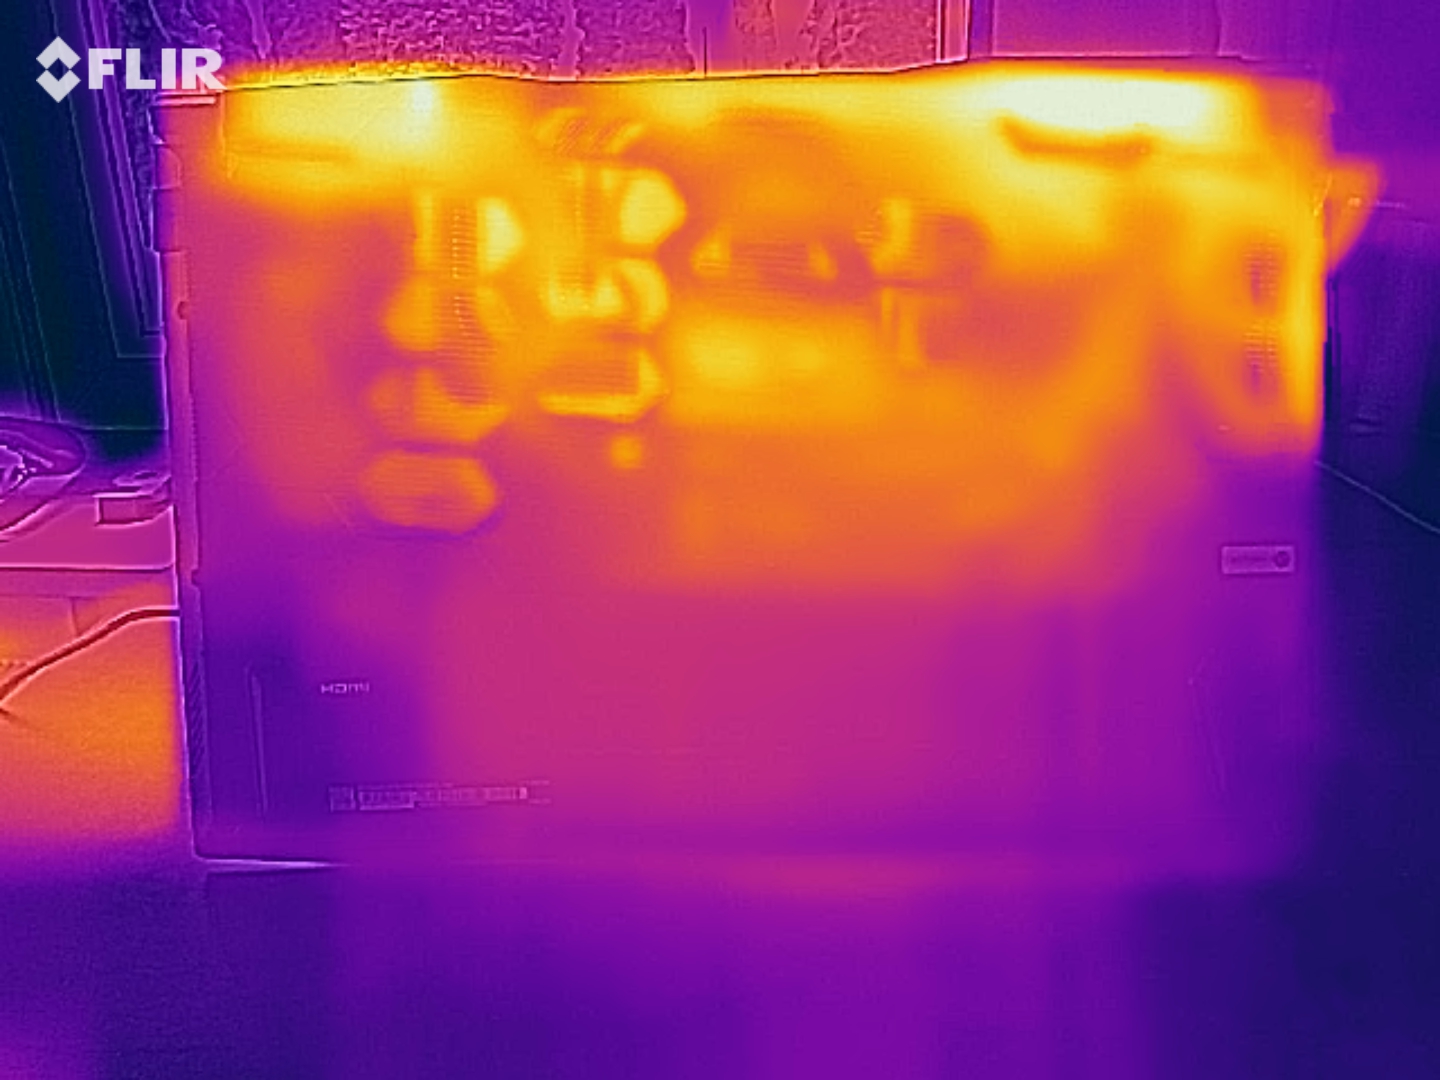
When the CPU and GPU run under full load in our stress test, the Intel Core i7-11800H settles at around 2,300 MHz and about 90 °C (~194 °F). The GPU reaches rates of 1,320 MHz and 83 °C (~181 °F).
The Nvidia GeForce RTX 3060 gains another 150 MHz in The Witcher 3, but it doesn't get hotter. The CPU then runs at around 4,400 MHz and 80 °C (~176 °F). Activating Cooler Boost lowers the temperatures even further, but this has a very negative impact on noise levels.
The device delivers a significantly reduced performance on battery power. When disconnected from a power outlet, the MSI Katana GF76 only achieves 7,142 points in 3DMark 11 under otherwise identical settings. In contrast, it achieves 21,217 points when plugged in.
(-) The maximum temperature on the upper side is 51 °C / 124 F, compared to the average of 40.4 °C / 105 F, ranging from 21.2 to 68.8 °C for the class Gaming.
(-) The bottom heats up to a maximum of 52 °C / 126 F, compared to the average of 43.2 °C / 110 F
(+) In idle usage, the average temperature for the upper side is 27.2 °C / 81 F, compared to the device average of 33.8 °C / 93 F.
(-) Playing The Witcher 3, the average temperature for the upper side is 42.4 °C / 108 F, compared to the device average of 33.8 °C / 93 F.
(±) The palmrests and touchpad can get very hot to the touch with a maximum of 36 °C / 96.8 F.
(-) The average temperature of the palmrest area of similar devices was 28.9 °C / 84 F (-7.1 °C / -12.8 F).
Speakers
The relatively loud stereo speakers of the Katana GF76 are suitable when it comes to drowning out the noise generated by the fans. They reproduce highs well and mids solidly. As in most laptops, however, bass is lacking. Gamers will prefer to use a headset or headphones as an audio solution anyway; they can be connected to the laptop using the combined port (3.5 mm audio jack) or Bluetooth 5.2. This also makes the fan noise less annoying.
MSI Katana GF76 11UE audio analysis
(+) | speakers can play relatively loud (83 dB)
Bass 100 - 315 Hz
(-) | nearly no bass - on average 17.4% lower than median
(±) | linearity of bass is average (12.1% delta to prev. frequency)
Mids 400 - 2000 Hz
(±) | higher mids - on average 5.1% higher than median
(+) | mids are linear (3.6% delta to prev. frequency)
Highs 2 - 16 kHz
(+) | balanced highs - only 2.5% away from median
(+) | highs are linear (5.6% delta to prev. frequency)
Overall 100 - 16.000 Hz
(+) | overall sound is linear (14.2% difference to median)
Compared to same class
» 23% of all tested devices in this class were better, 6% similar, 71% worse
» The best had a delta of 6%, average was 18%, worst was 132%
Compared to all devices tested
» 14% of all tested devices were better, 3% similar, 83% worse
» The best had a delta of 4%, average was 25%, worst was 134%
Apple MacBook 12 (Early 2016) 1.1 GHz audio analysis
(+) | speakers can play relatively loud (83.6 dB)
Bass 100 - 315 Hz
(±) | reduced bass - on average 11.3% lower than median
(±) | linearity of bass is average (14.2% delta to prev. frequency)
Mids 400 - 2000 Hz
(+) | balanced mids - only 2.4% away from median
(+) | mids are linear (5.5% delta to prev. frequency)
Highs 2 - 16 kHz
(+) | balanced highs - only 2% away from median
(+) | highs are linear (4.5% delta to prev. frequency)
Overall 100 - 16.000 Hz
(+) | overall sound is linear (10.2% difference to median)
Compared to same class
» 5% of all tested devices in this class were better, 2% similar, 93% worse
» The best had a delta of 5%, average was 19%, worst was 53%
Compared to all devices tested
» 3% of all tested devices were better, 1% similar, 96% worse
» The best had a delta of 4%, average was 25%, worst was 134%
Aorus 17G YD audio analysis
(+) | speakers can play relatively loud (83 dB)
Bass 100 - 315 Hz
(-) | nearly no bass - on average 31.4% lower than median
(±) | linearity of bass is average (14.2% delta to prev. frequency)
Mids 400 - 2000 Hz
(±) | higher mids - on average 5.4% higher than median
(±) | linearity of mids is average (7.1% delta to prev. frequency)
Highs 2 - 16 kHz
(+) | balanced highs - only 1.4% away from median
(+) | highs are linear (3% delta to prev. frequency)
Overall 100 - 16.000 Hz
(±) | linearity of overall sound is average (20.6% difference to median)
Compared to same class
» 71% of all tested devices in this class were better, 5% similar, 24% worse
» The best had a delta of 6%, average was 18%, worst was 132%
Compared to all devices tested
» 50% of all tested devices were better, 8% similar, 42% worse
» The best had a delta of 4%, average was 25%, worst was 134%
Energy management: Frugal but not enduring
Energy consumption
The Katana GF76 UE11-036 is relatively frugal in terms of energy consumption considering it's a gaming laptop. It requires about 20% less power than most of the comparison models, which are partly also equipped with even more power-hungry components. In idle usage, the test device is satisfied with an average of just 13 watts. Under full load, however, it reaches the limit of the 180-watt power adapter.
| Off / Standby | |
| Idle | |
| Load |
|
| MSI Katana GF76 11UE i7-11800H, GeForce RTX 3060 Laptop GPU | MSI GP76 Leopard 10UG i7-10750H, GeForce RTX 3070 Laptop GPU | MSI GF65 Thin 10UE i7-10750H, GeForce RTX 3060 Laptop GPU | Alienware m15 R5 Ryzen Edition R7 5800H, GeForce RTX 3060 Laptop GPU | SCHENKER XMG Core 17 (Early 2021) i7-10870H, GeForce RTX 3060 Laptop GPU | Aorus 17G YD i7-11800H, GeForce RTX 3080 Laptop GPU | Average of class Gaming | |
|---|---|---|---|---|---|---|---|
| Power Consumption | -22% | 15% | -19% | -23% | -65% | -36% | |
| Idle Minimum * | 9 | 12 -33% | 5.4 40% | 11 -22% | 13 -44% | 24 -167% | 13.8 ? -53% |
| Idle Average * | 13 | 16 -23% | 12.8 2% | 14 -8% | 16 -23% | 26 -100% | 19.2 ? -48% |
| Idle Maximum * | 20 | 28 -40% | 19.5 2% | 25 -25% | 29 -45% | 38 -90% | 27 ? -35% |
| Load Average * | 102 | 92 10% | 86.6 15% | 123 -21% | 100 2% | 101 1% | 111.3 ? -9% |
| Witcher 3 ultra * | 149 | 198 -33% | 115.7 22% | 176 -18% | 173 -16% | 164 -10% | |
| Load Maximum * | 187 | 210 -12% | 175.2 6% | 226 -21% | 213 -14% | 230 -23% | 251 ? -34% |
* ... smaller is better
Battery life
Despite the pretty low energy consumption, the Katana GF76 loses the battle for the best battery life. Almost every other competitor offers much more endurance.
The reason for this is that the battery's capacity of 53 Wh is modest compared to the competition. It's sufficient to play video games for an hour or to stream movies for three hours without using a power outlet. However, the Katana GF76 UE11 is undoubtedly at its best when the power adapter is plugged in.
| MSI Katana GF76 11UE i7-11800H, GeForce RTX 3060 Laptop GPU, 53 Wh | MSI GP76 Leopard 10UG i7-10750H, GeForce RTX 3070 Laptop GPU, 65 Wh | MSI GF65 Thin 10UE i7-10750H, GeForce RTX 3060 Laptop GPU, 51 Wh | Alienware m15 R5 Ryzen Edition R7 5800H, GeForce RTX 3060 Laptop GPU, 86 Wh | SCHENKER XMG Core 17 (Early 2021) i7-10870H, GeForce RTX 3060 Laptop GPU, 62 Wh | Aorus 17G YD i7-11800H, GeForce RTX 3080 Laptop GPU, 99 Wh | Average of class Gaming | |
|---|---|---|---|---|---|---|---|
| Battery Runtime | -2% | 46% | 87% | 29% | 58% | 59% | |
| Reader / Idle | 286 | 337 18% | 667 133% | 881 208% | 462 62% | 541 89% | 542 ? 90% |
| H.264 | 232 | 525 126% | 283 22% | 370 59% | 397 ? 71% | ||
| WiFi v1.3 | 220 | 252 15% | 276 25% | 306 39% | 293 33% | 360 64% | 368 ? 67% |
| Witcher 3 ultra | 50 | 96 92% | 80.6 ? 61% | ||||
| Load | 80 | 49 -39% | 65 -19% | 55 -31% | 80 0% | 96 20% | 84.1 ? 5% |
Pros
Cons
Verdict: The MSI Katana GF76 only convinces to a limited extent in the test
The MSI Katana GF76 gaming laptop, which has a rather restrained look, is convincing on paper with its fast CPU and good GPU. In practice, however, it misses the mark a bit in terms of performance.
Nevertheless, performance is completely sufficient to provide a smooth and impressive gaming experience at Full HD resolution and high details in all tested games.
The fan could be a bit quieter, the battery could last longer, and there's also room for improvement when it comes to the ports. Although the panel refreshes at 144 Hz, it leaves a lot to be desired when it comes to many metrics.
To revisit MSI's own naming associations once again: The Katana GF76 11UE-036 isn't a blunt combat sword, but it could definitely use some sharpening here and there. We would have expected a bit more at an MSRP of $1,499.
MSI offers other configurations as an alternative. If you want to experience the full potential of the built-in CPU and also want higher graphics power but are willing to spend a bit more in return, you'll find a better solution in the Aorus 17G YD, among others. The MSI GP76 Leopard 10UG, which is in a similar price range, also offers more graphics performance but an older CPU.
Price and availability
At the time of writing, the MSI Katana GF76 is only officially available in Micro Center stores. This configuration comes with the Intel Core i7-11800H, the Nvidia GeForce RTX 3060, 16 GB of DDR4-3200 RAM, and a 1 TB SSD, and it will set you back $1,499.99. Alternatively, you can also keep tabs on online stores like Amazon or newegg and wait for the device to pop up here.
MSI Katana GF76 11UE
-
06/26/2021 v7
Marcus Schwarten


Pricecompare

