Lenovo Legion 5 15 G6 AMD Review: Affordable gaming laptop with a lot of power
Lenovo's lineup of Legion models is designed for gaming enthusiasts and the 6th generation of the Legion 5 15 once again offers a choice between Intel and AMD processors as well as Nvidia GeForce RTX GPUs (RTX 3060 or RTX 3070). Our test unit combines the modern AMD processor Ryzen 7 5800H and the fast Nvidia GeForce RTX 3060. The display is a matte 1080p screen with 165 Hz refresh rate, so the overall package should work well. Users with access to Lenovo’s campus program can get this model (no operating system) with 16 GB RAM and 512 GB PCIe-SSD storage for 1120 Euros; regular customers should expect between 1400-1500 Euros.
Possible Competitors
Rating | Date | Model | Weight | Height | Size | Resolution | Price |
|---|---|---|---|---|---|---|---|
| 83.4 % v7 (old) | 09 / 2021 | Lenovo Legion 5 15ACH-82JU00C6GE-FL R7 5800H, GeForce RTX 3060 Laptop GPU | 2.5 kg | 26 mm | 15.60" | 1920x1080 | |
| 82.2 % v7 (old) | 08 / 2021 | Acer Nitro 5 AN515-45-R1JH R7 5800H, GeForce RTX 3070 Laptop GPU | 2.3 kg | 23.9 mm | 15.60" | 2560x1440 | |
| 85.9 % v7 (old) | 06 / 2021 | Asus TUF Gaming F15 FX506HM i7-11800H, GeForce RTX 3060 Laptop GPU | 2.3 kg | 24.9 mm | 15.60" | 1920x1080 | |
| 84.7 % v7 (old) | 06 / 2021 | Alienware m15 R5 Ryzen Edition R7 5800H, GeForce RTX 3060 Laptop GPU | 2.5 kg | 22.85 mm | 15.60" | 1920x1080 | |
| 84.9 % v7 (old) | 03 / 2021 | Schenker XMG Core 15 Ampere R7 4800H, GeForce RTX 3060 Laptop GPU | 2 kg | 22.9 mm | 15.60" | 2560x1440 |
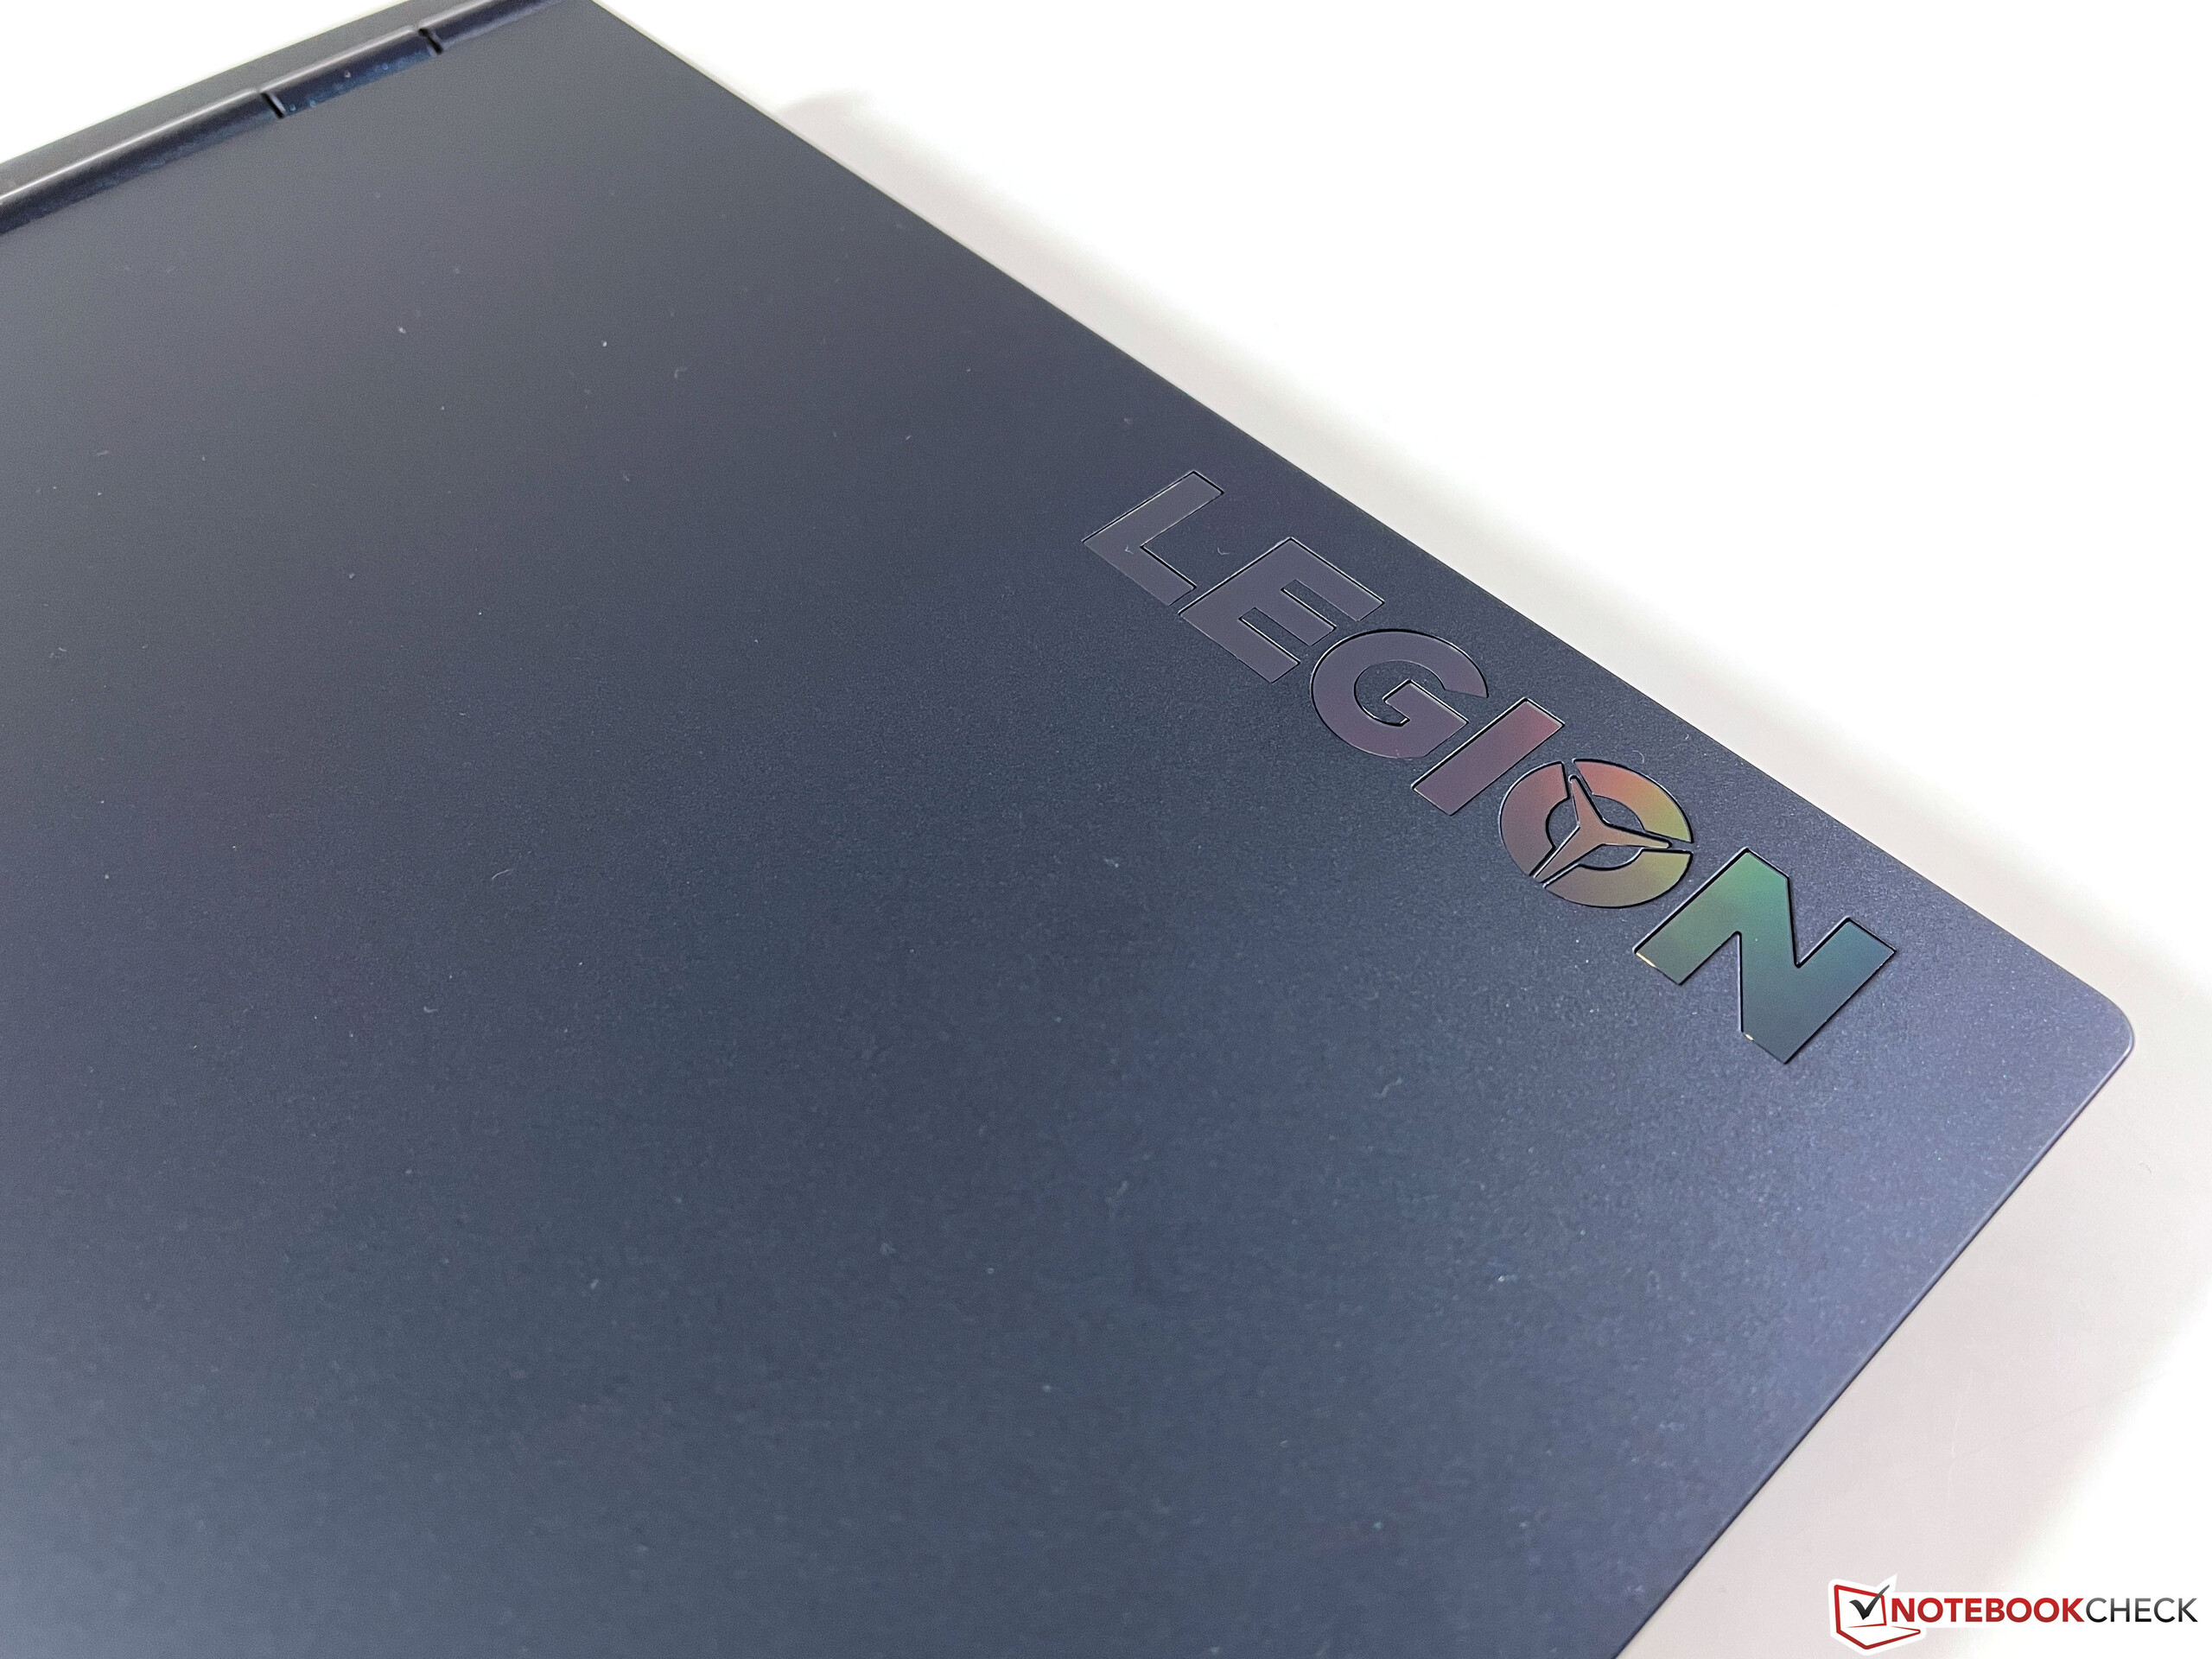
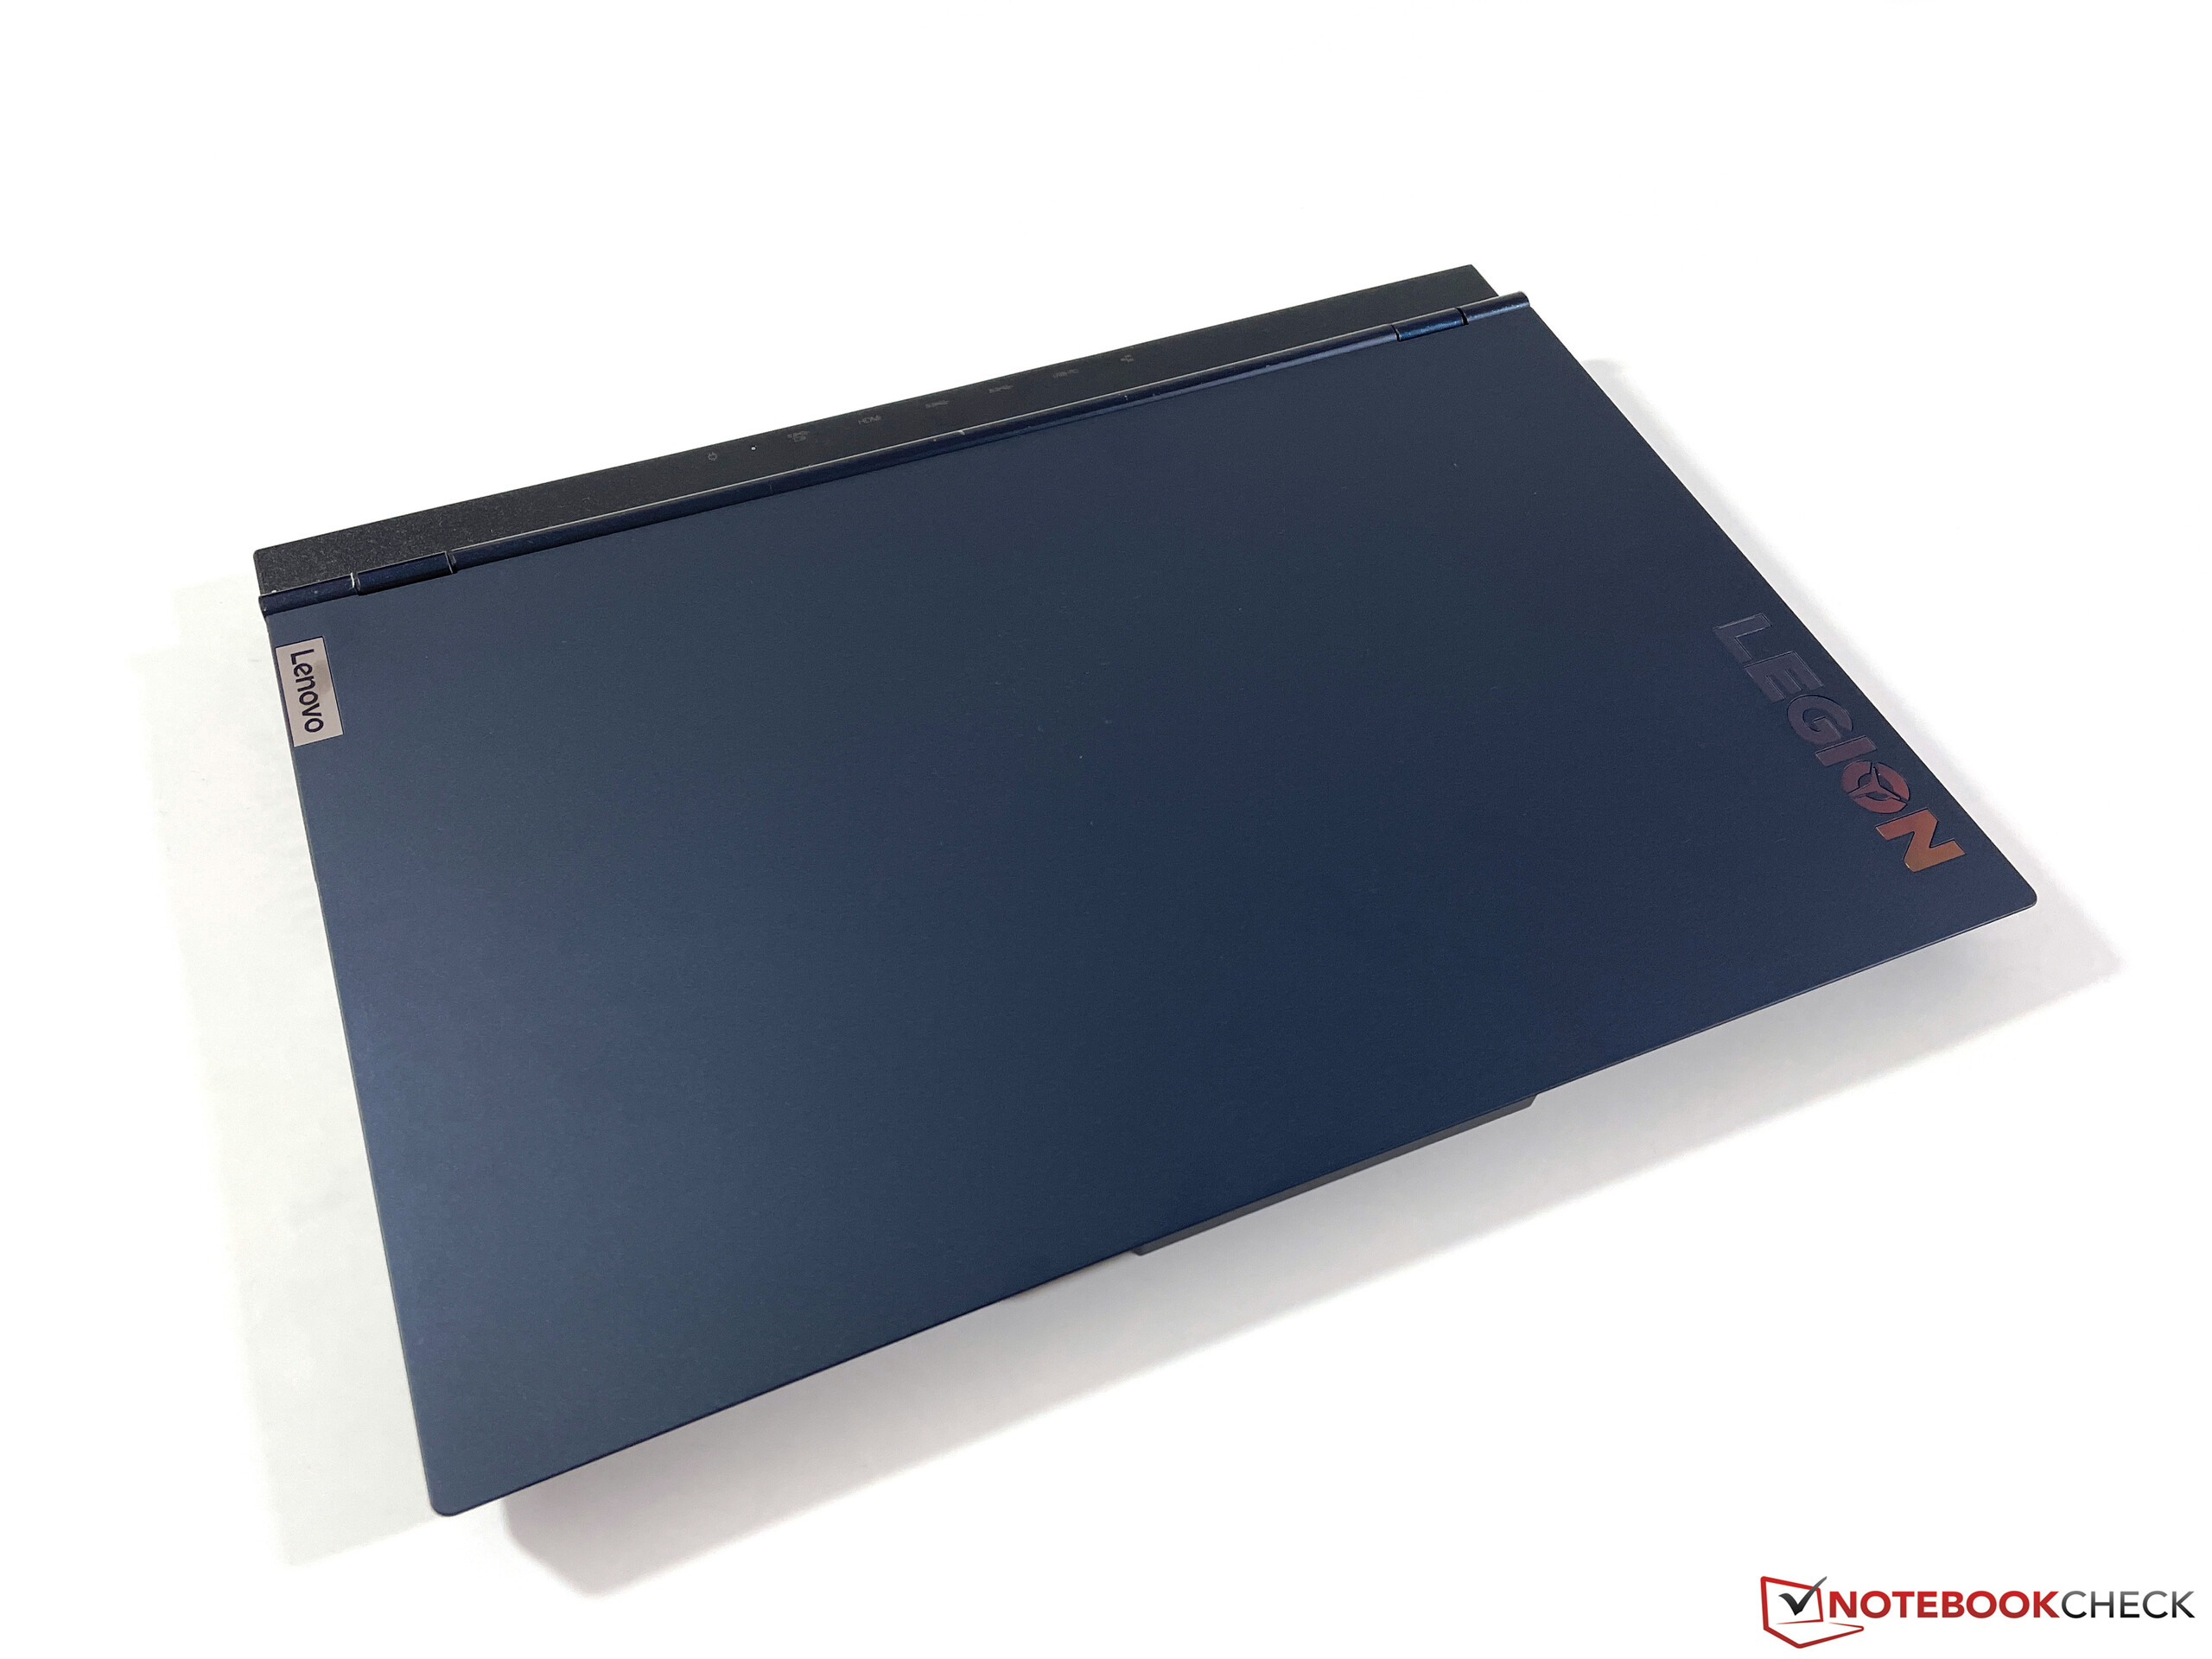
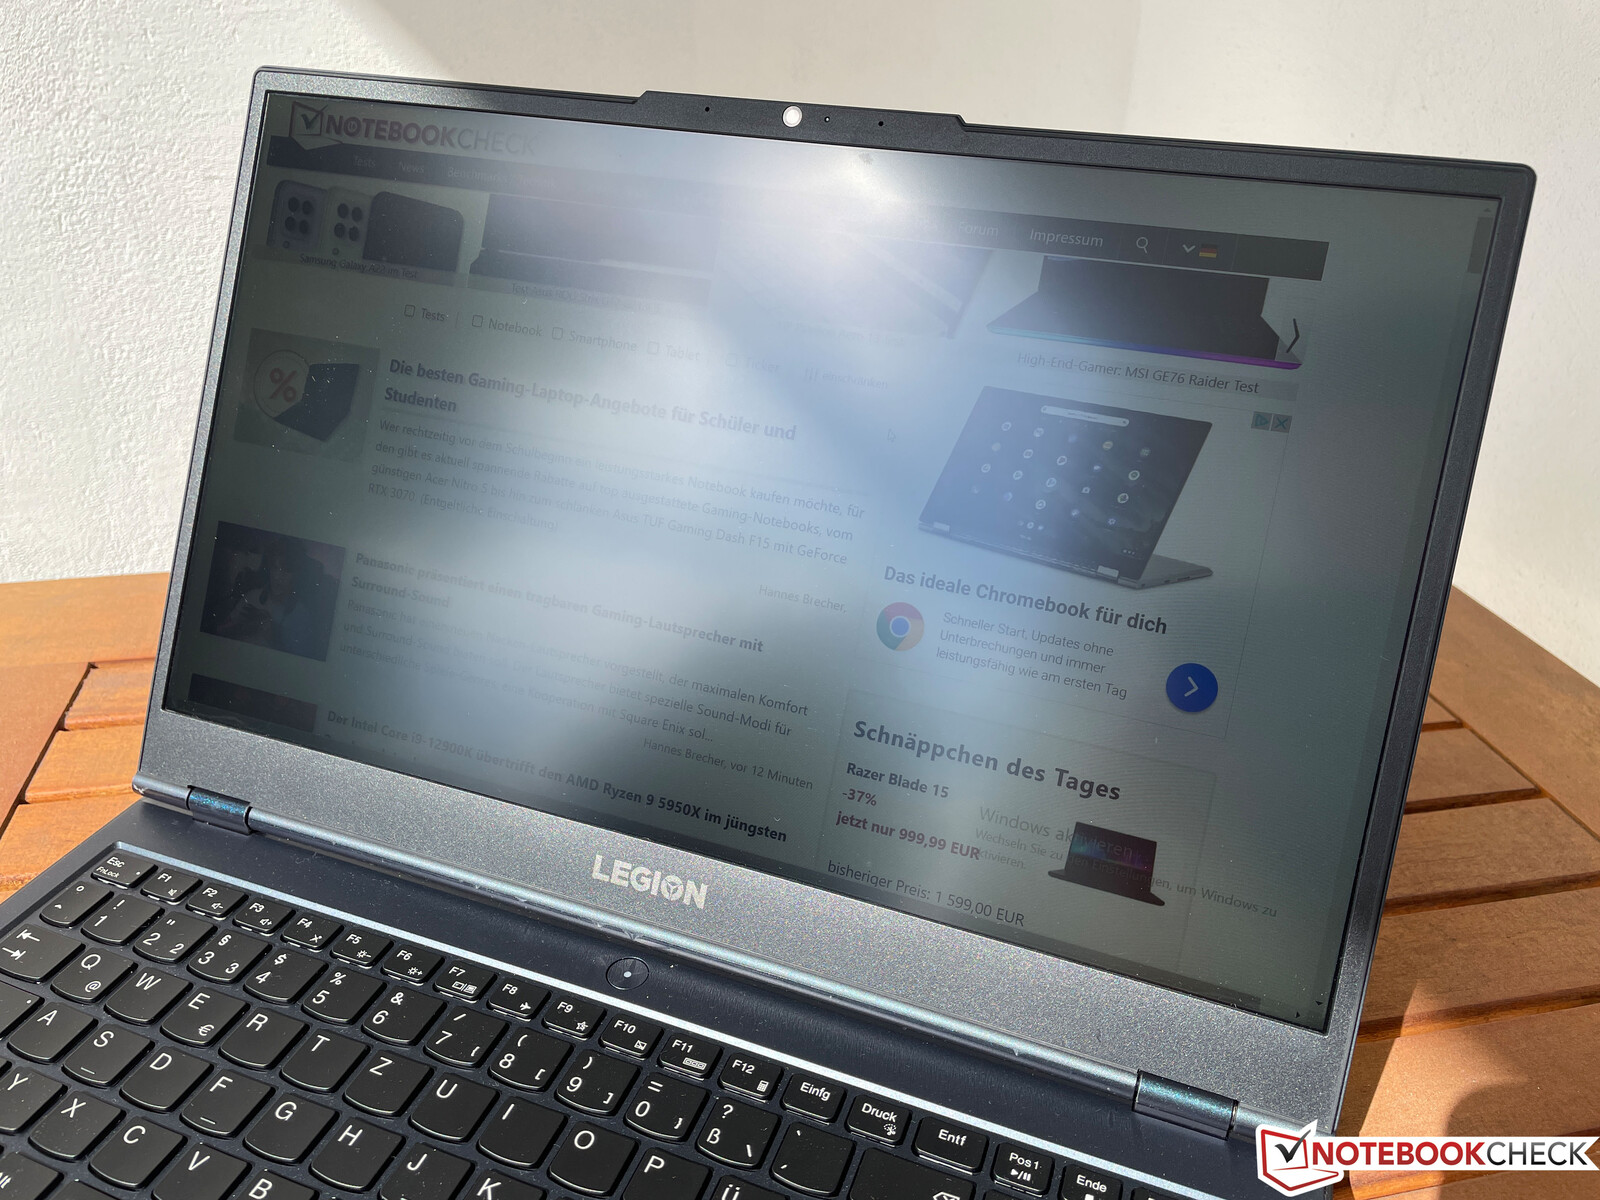
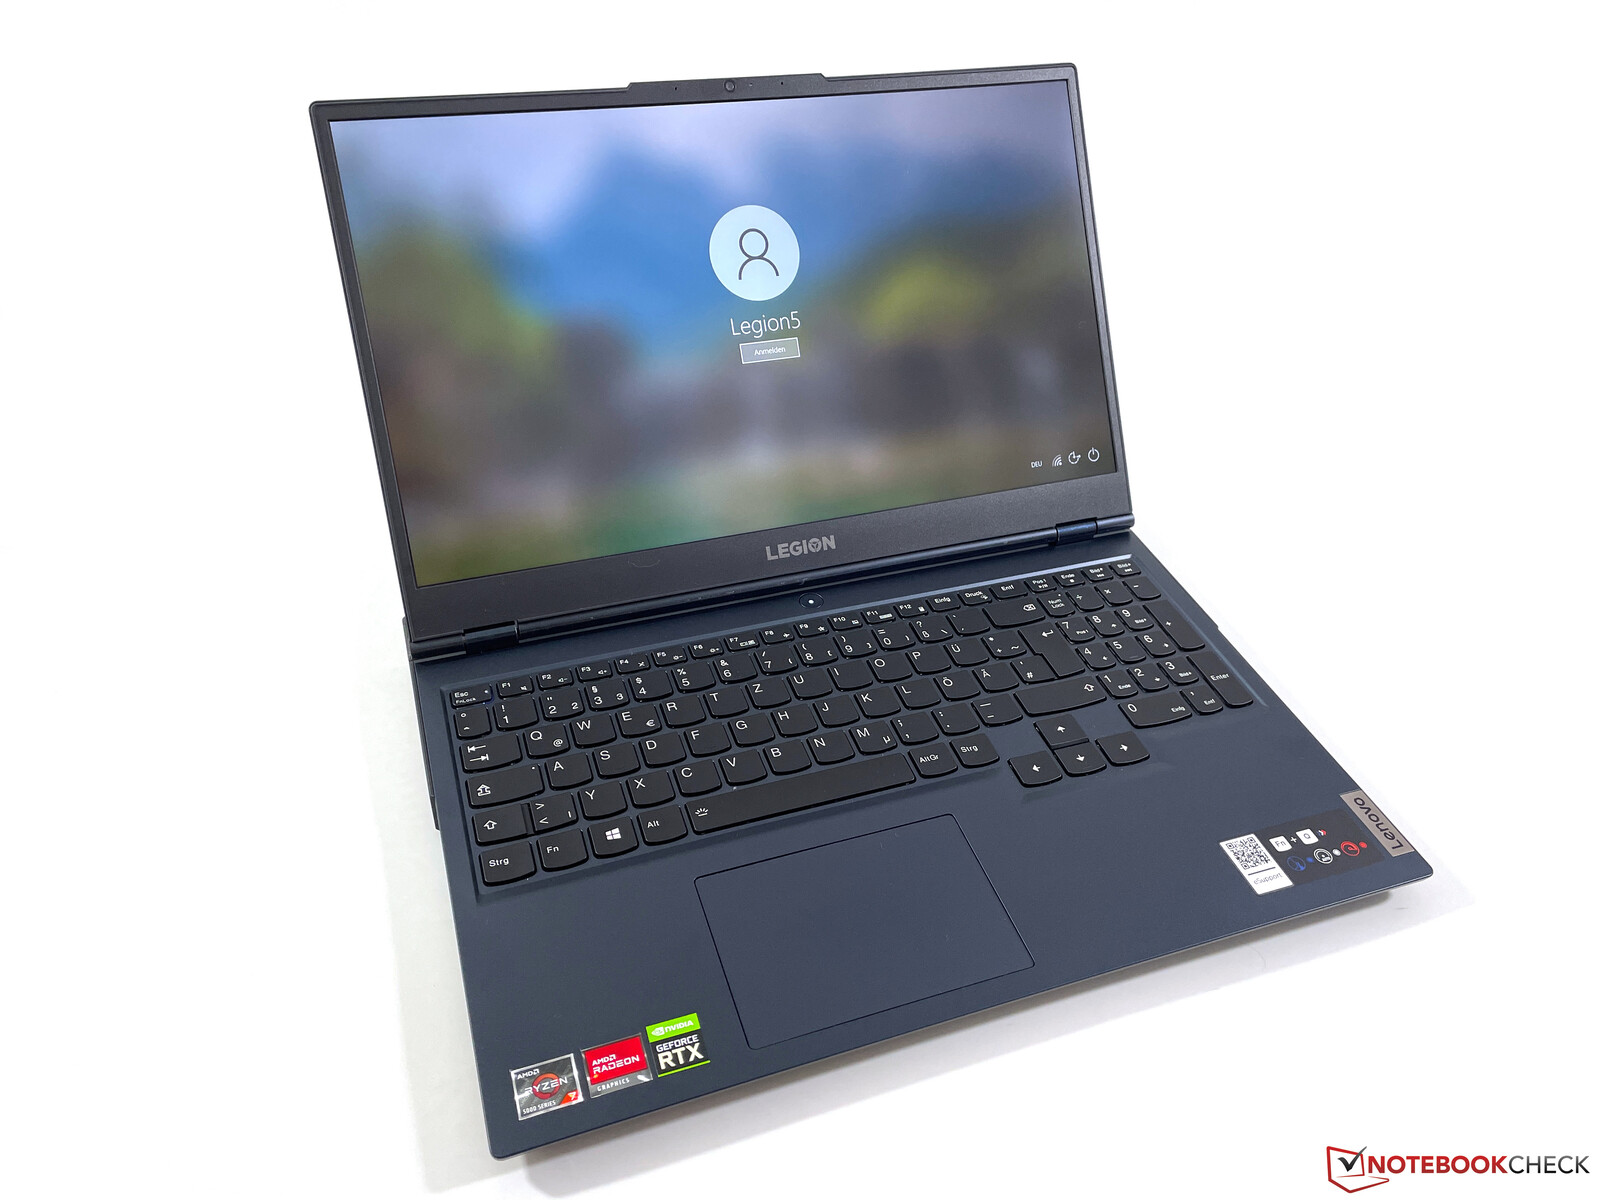
Case - Legion with dark blue plastics
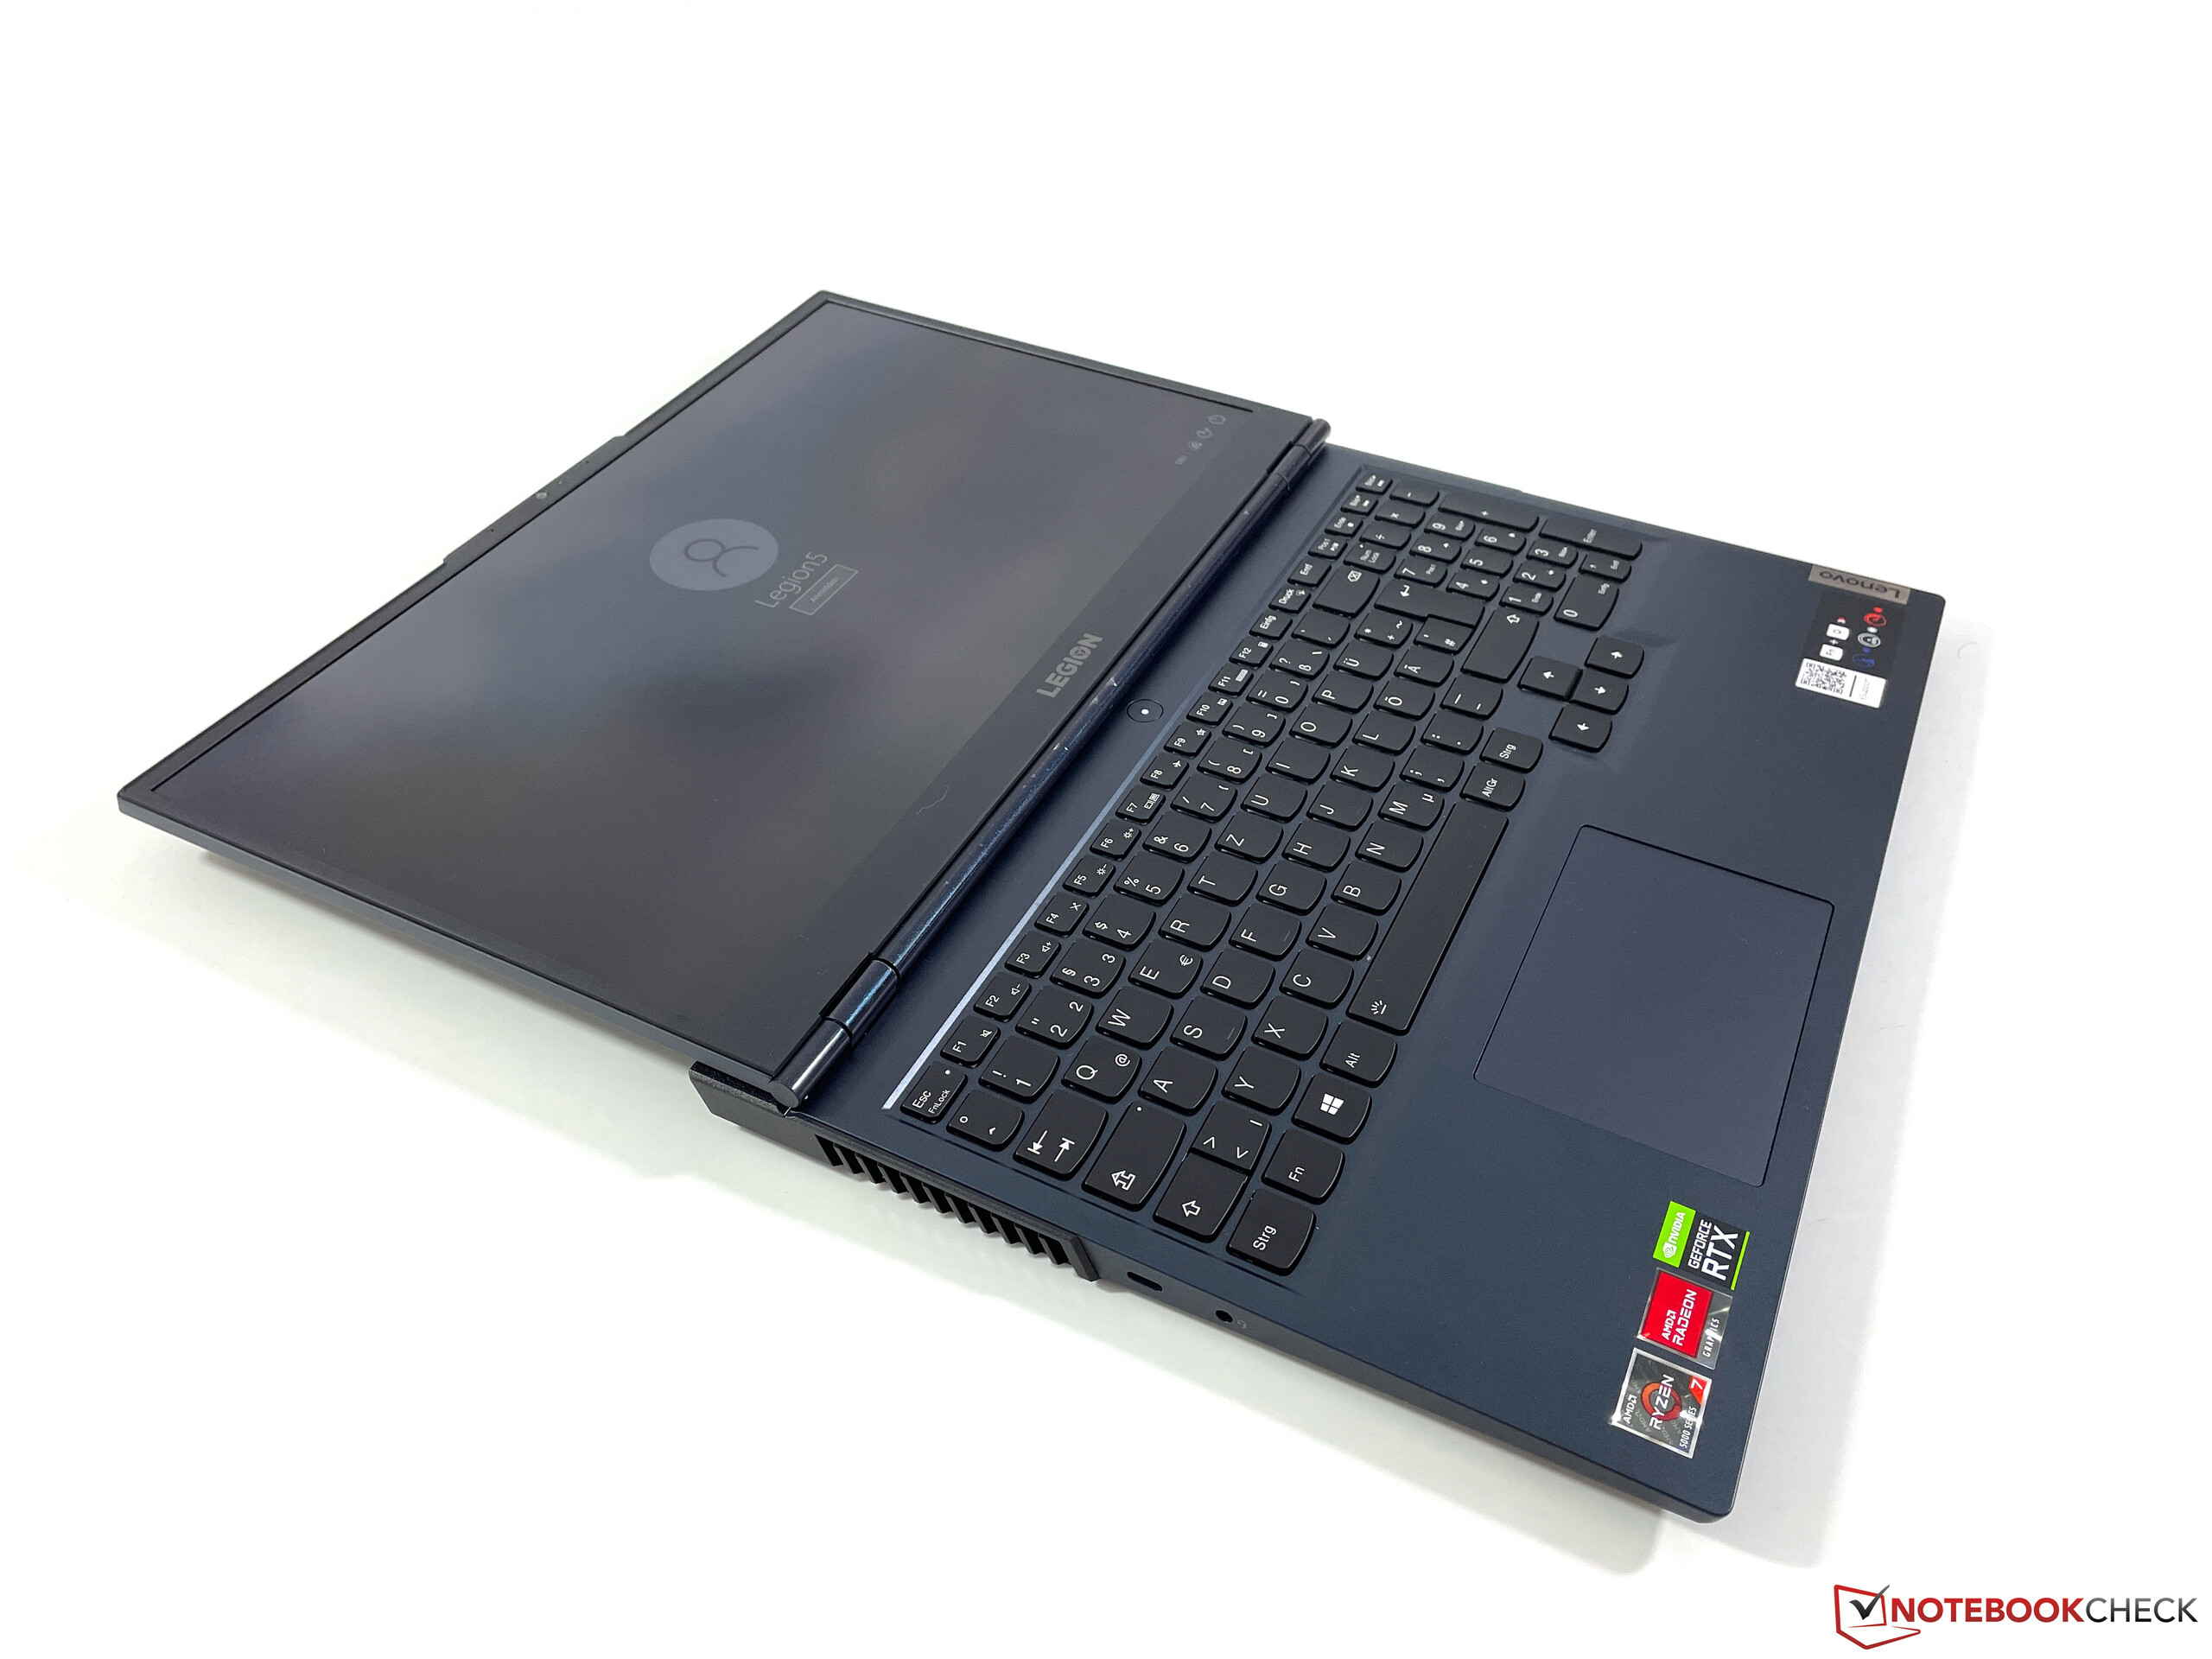
The chassis is pretty much identical to the previous model, but instead of the black surfaces, our test unit now uses dark blue plastic for the majority of the base unit as well as the lid. The smooth surfaces are not really affected by dirt or fingerprints and we like the new color.
The quality of the chassis is probably one of the weakest points of the laptop and you just notice the low price point. The build quality itself is good, but there are some creaking noises when you twist the base unit. The bigger issue in everyday situations is the creaking from the hinges when you adjust the opening angle of the screen (up to 180 degrees). The hinges cannot completely avoid some bouncing. These are hardly limitations when you play games, but you should not expect a high-end chassis. Lenovo did not implement comprehensive illumination options on purpose.
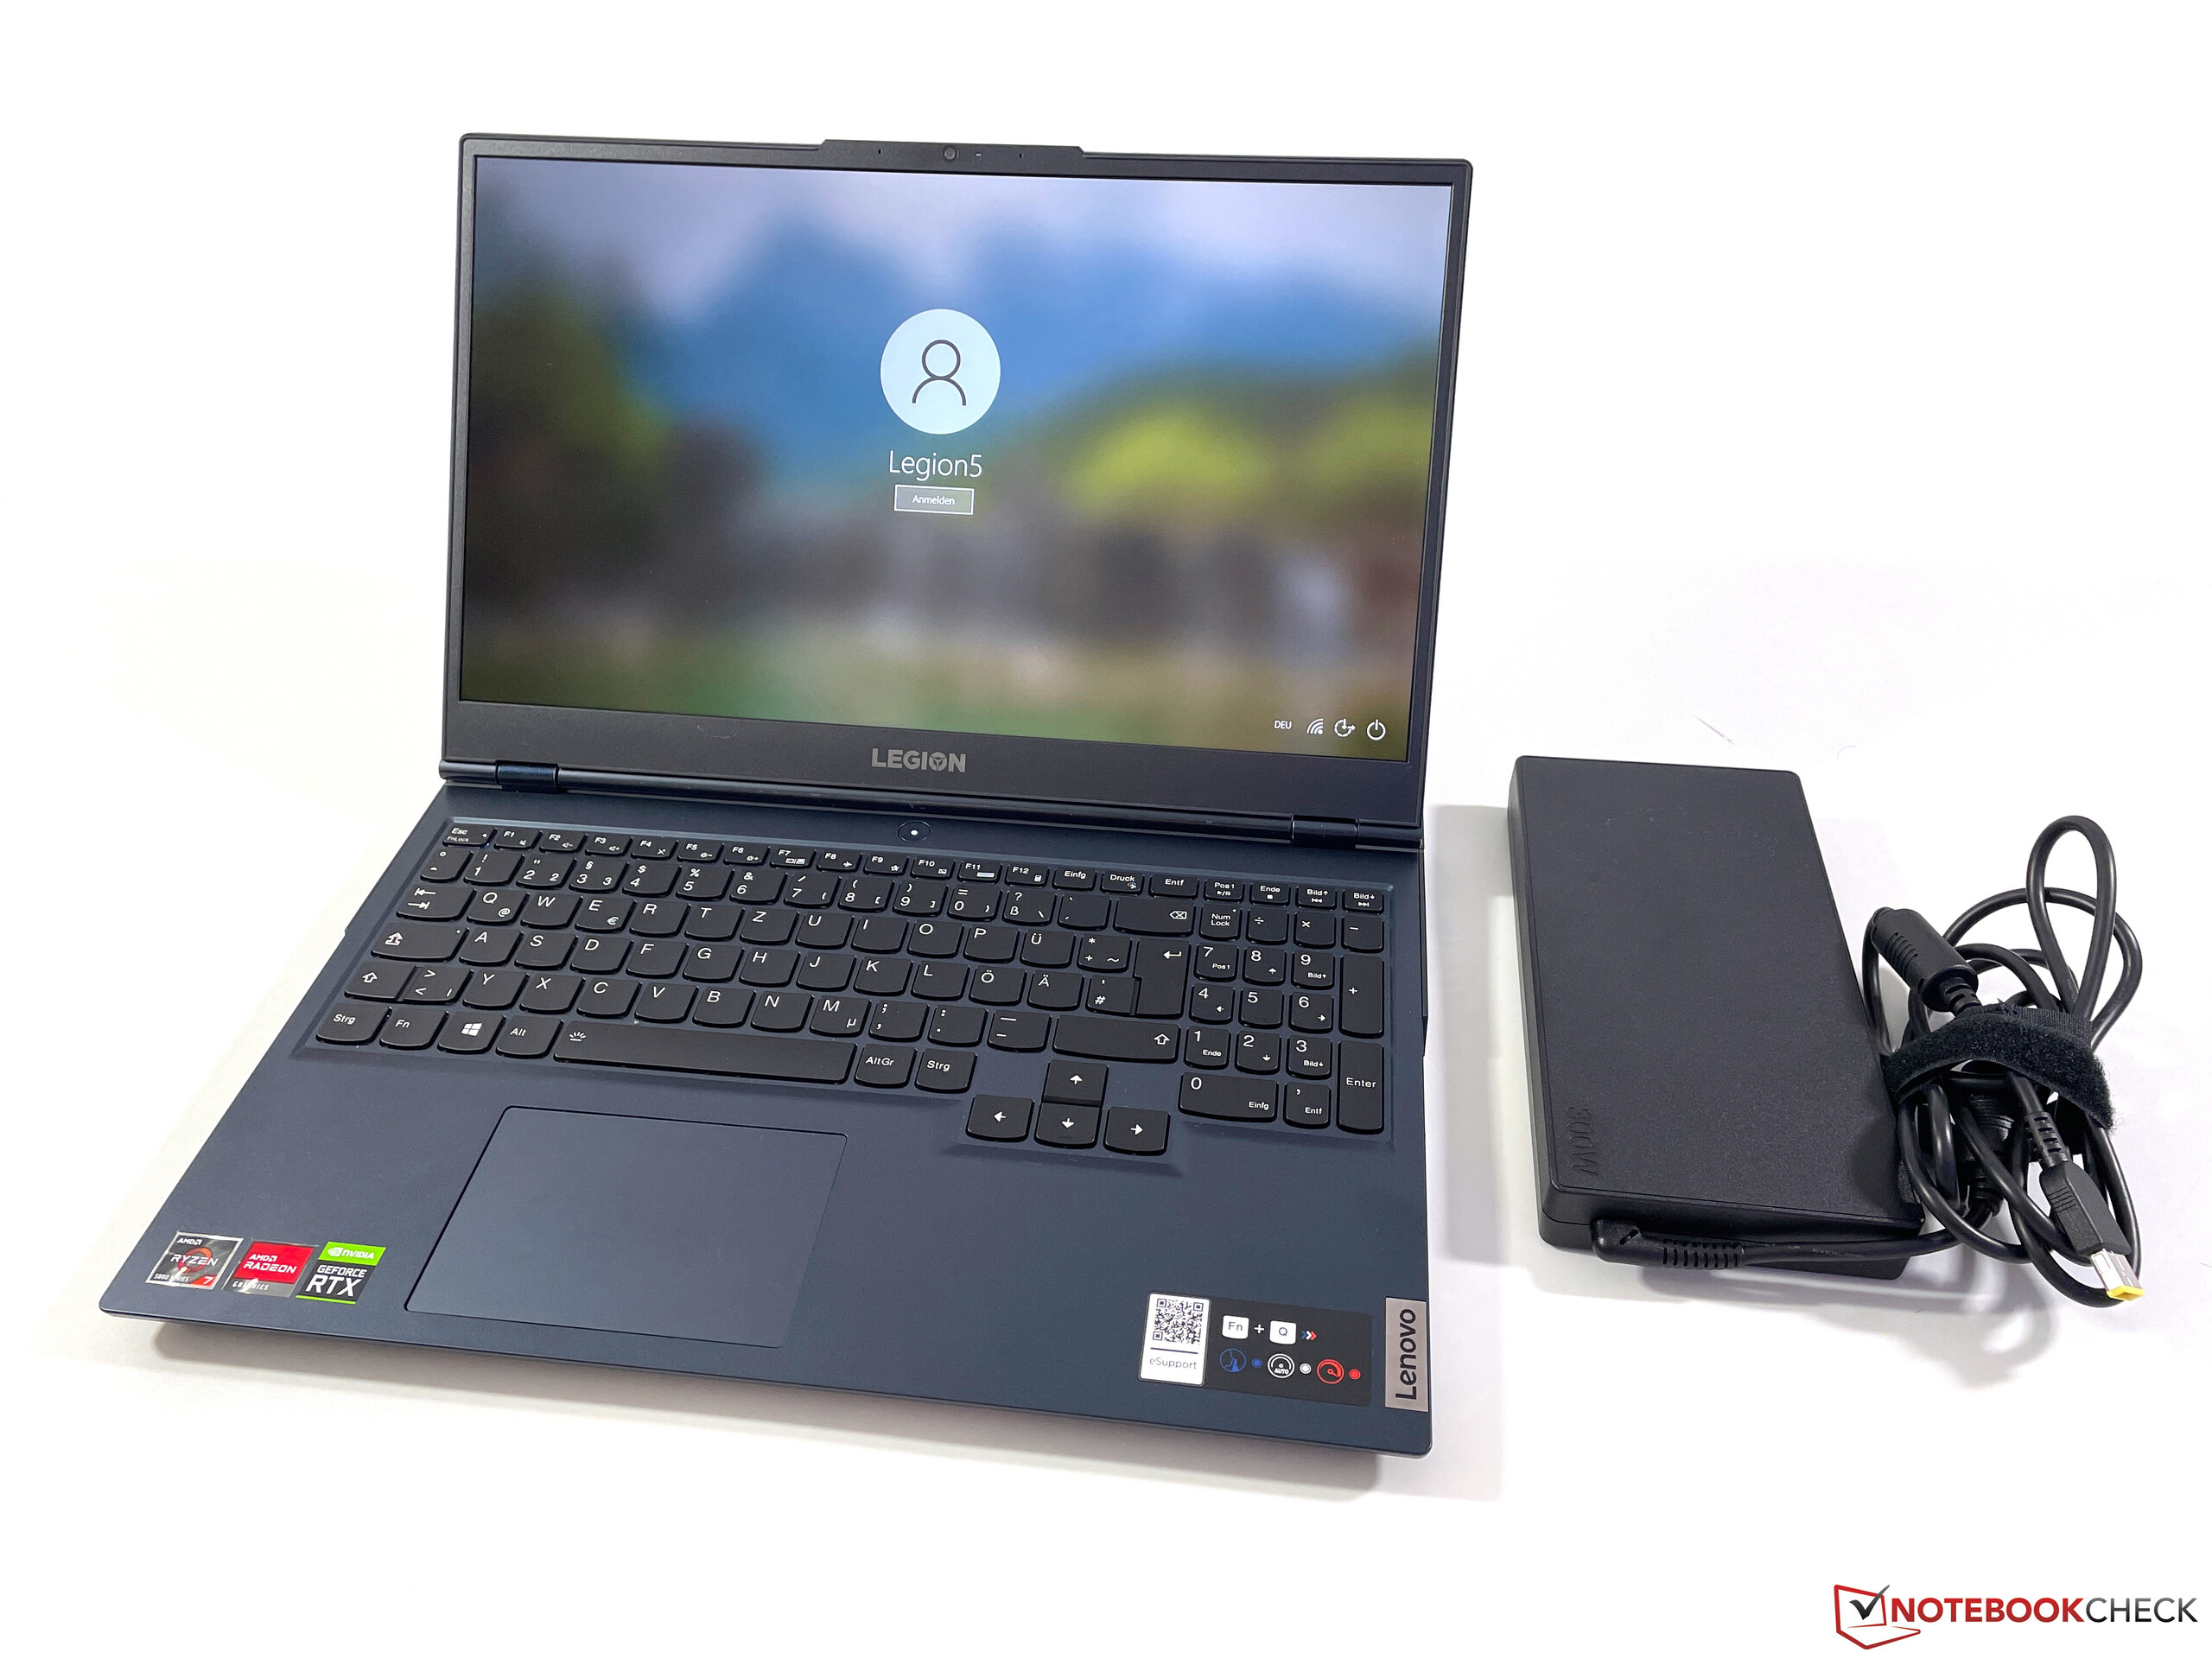
Our test unit of the Legion 5 15 tips the scale at 2.5 kg, which means it is one of the heaviest in our comparison group and you should also consider the massive power adapter (almost 1.1 kg) when you transport the laptop. The footprint on the other hand is very similar on all units.
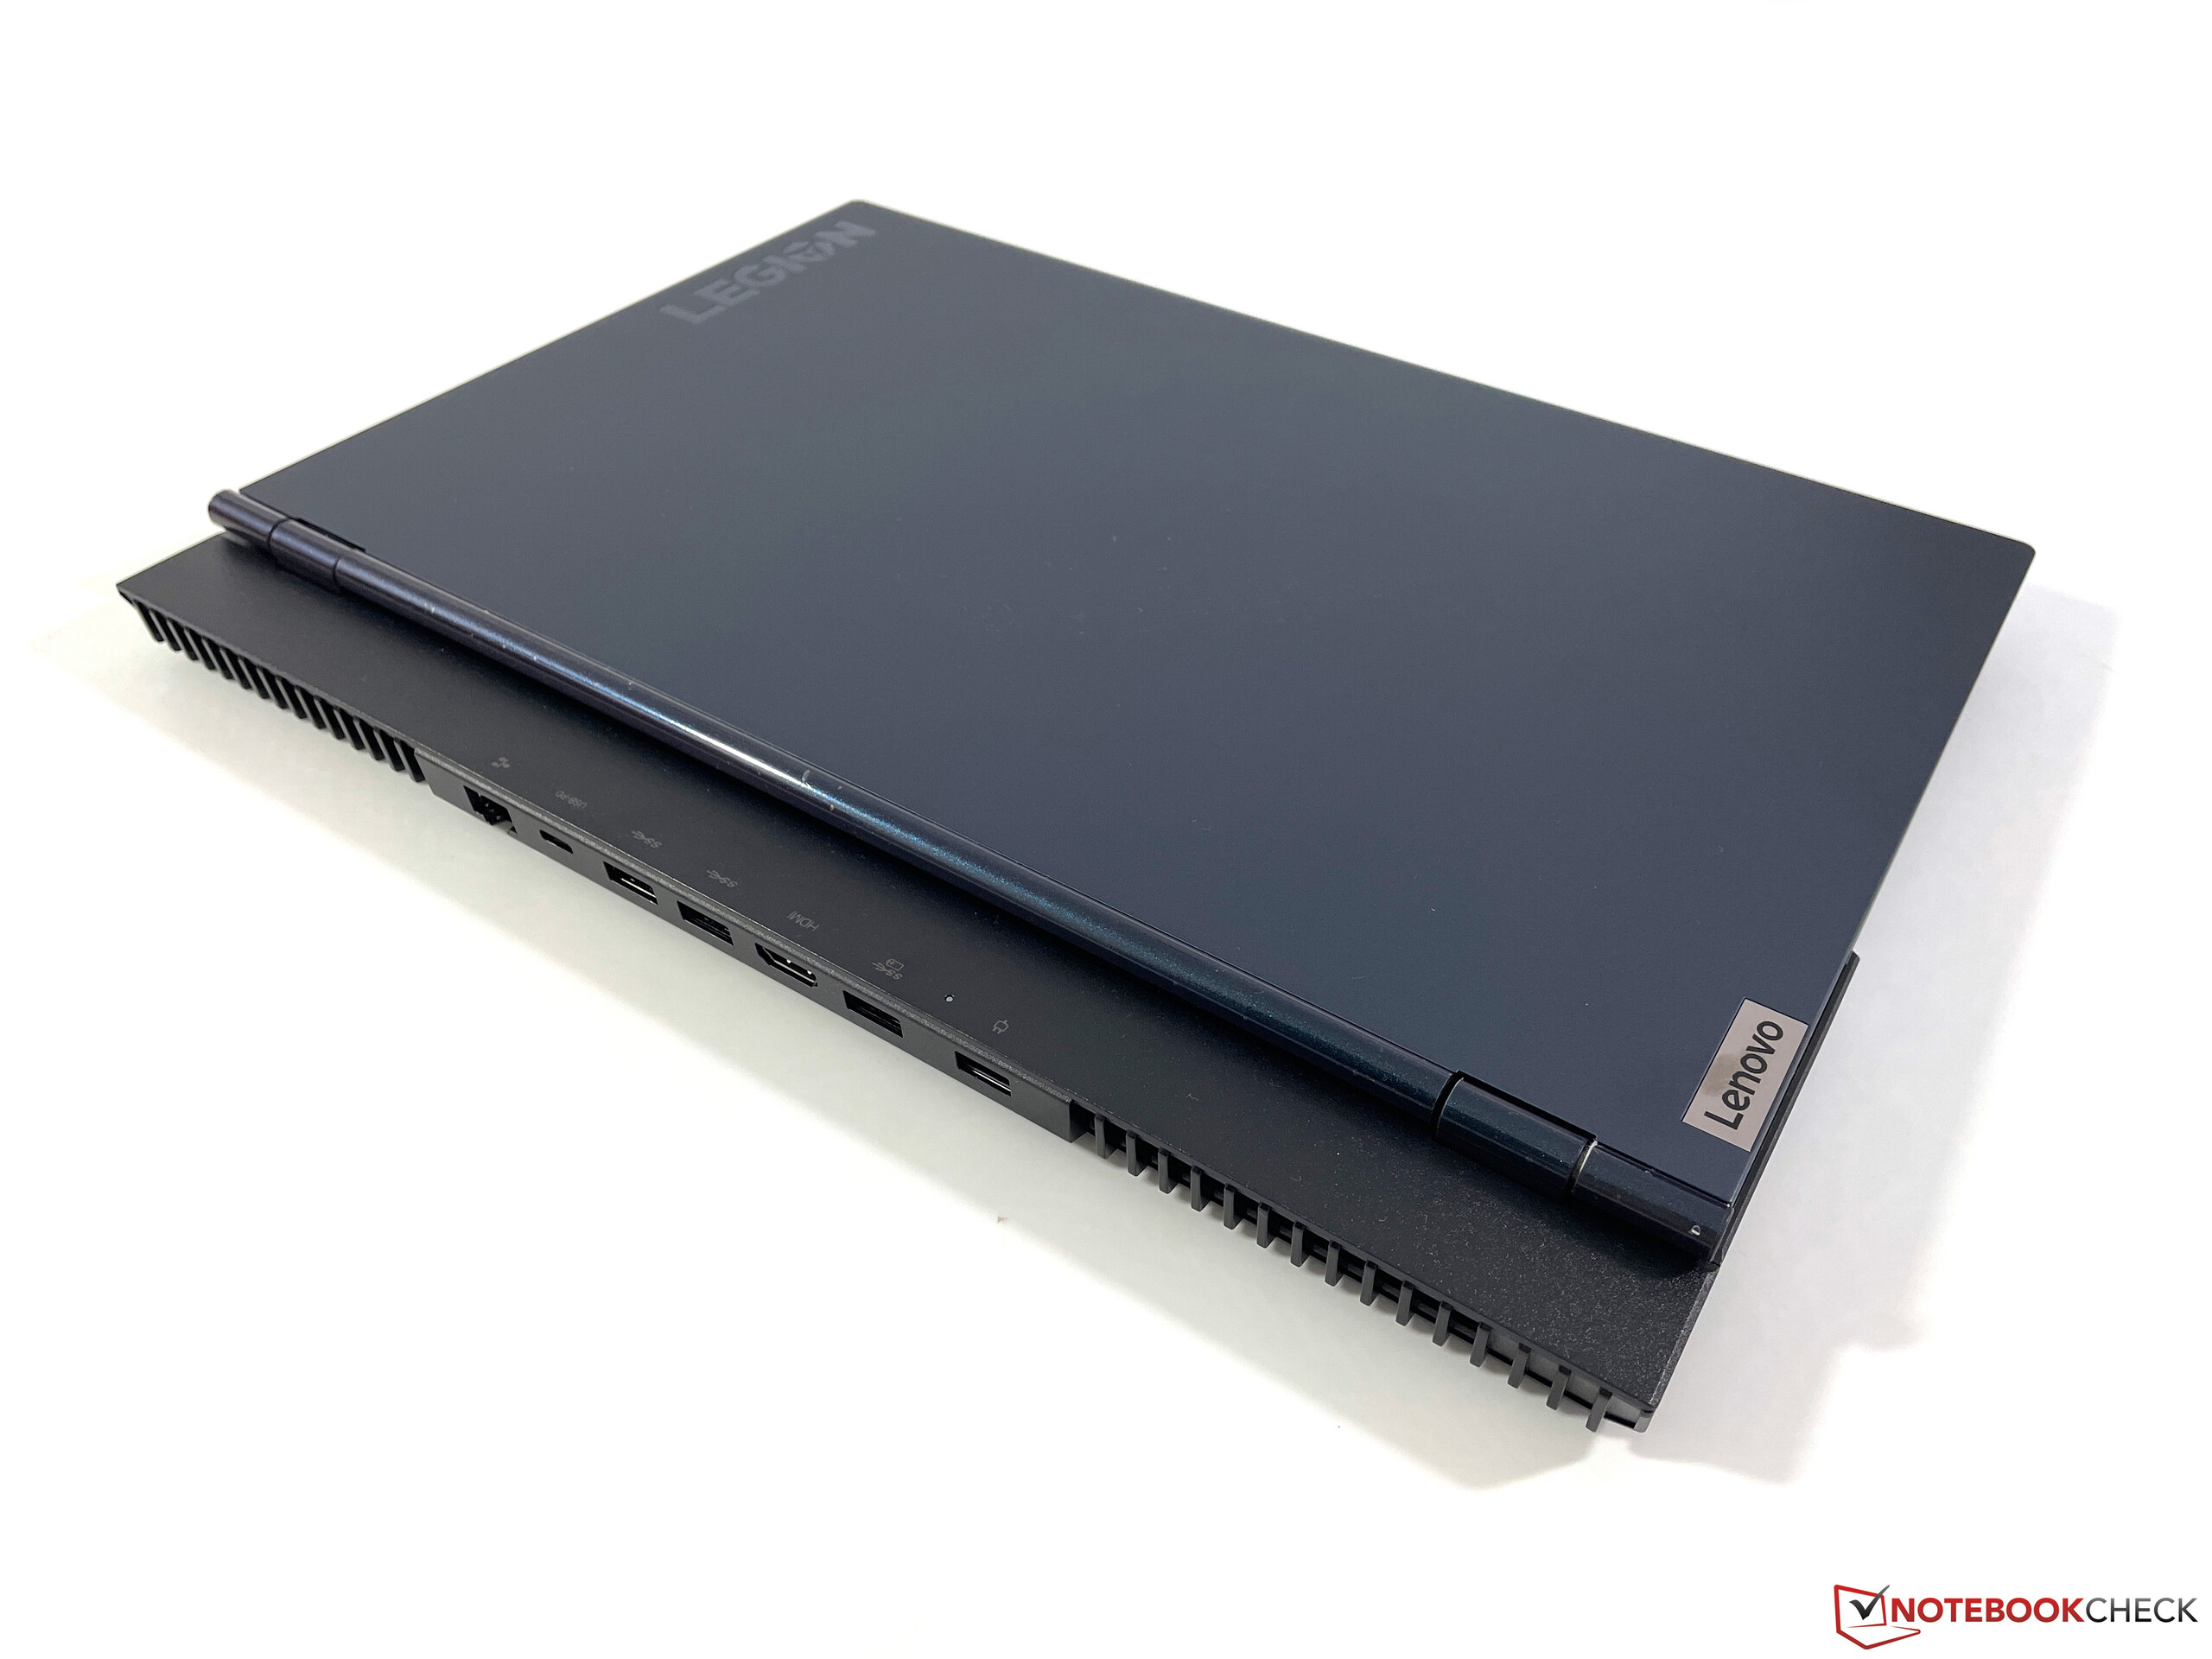
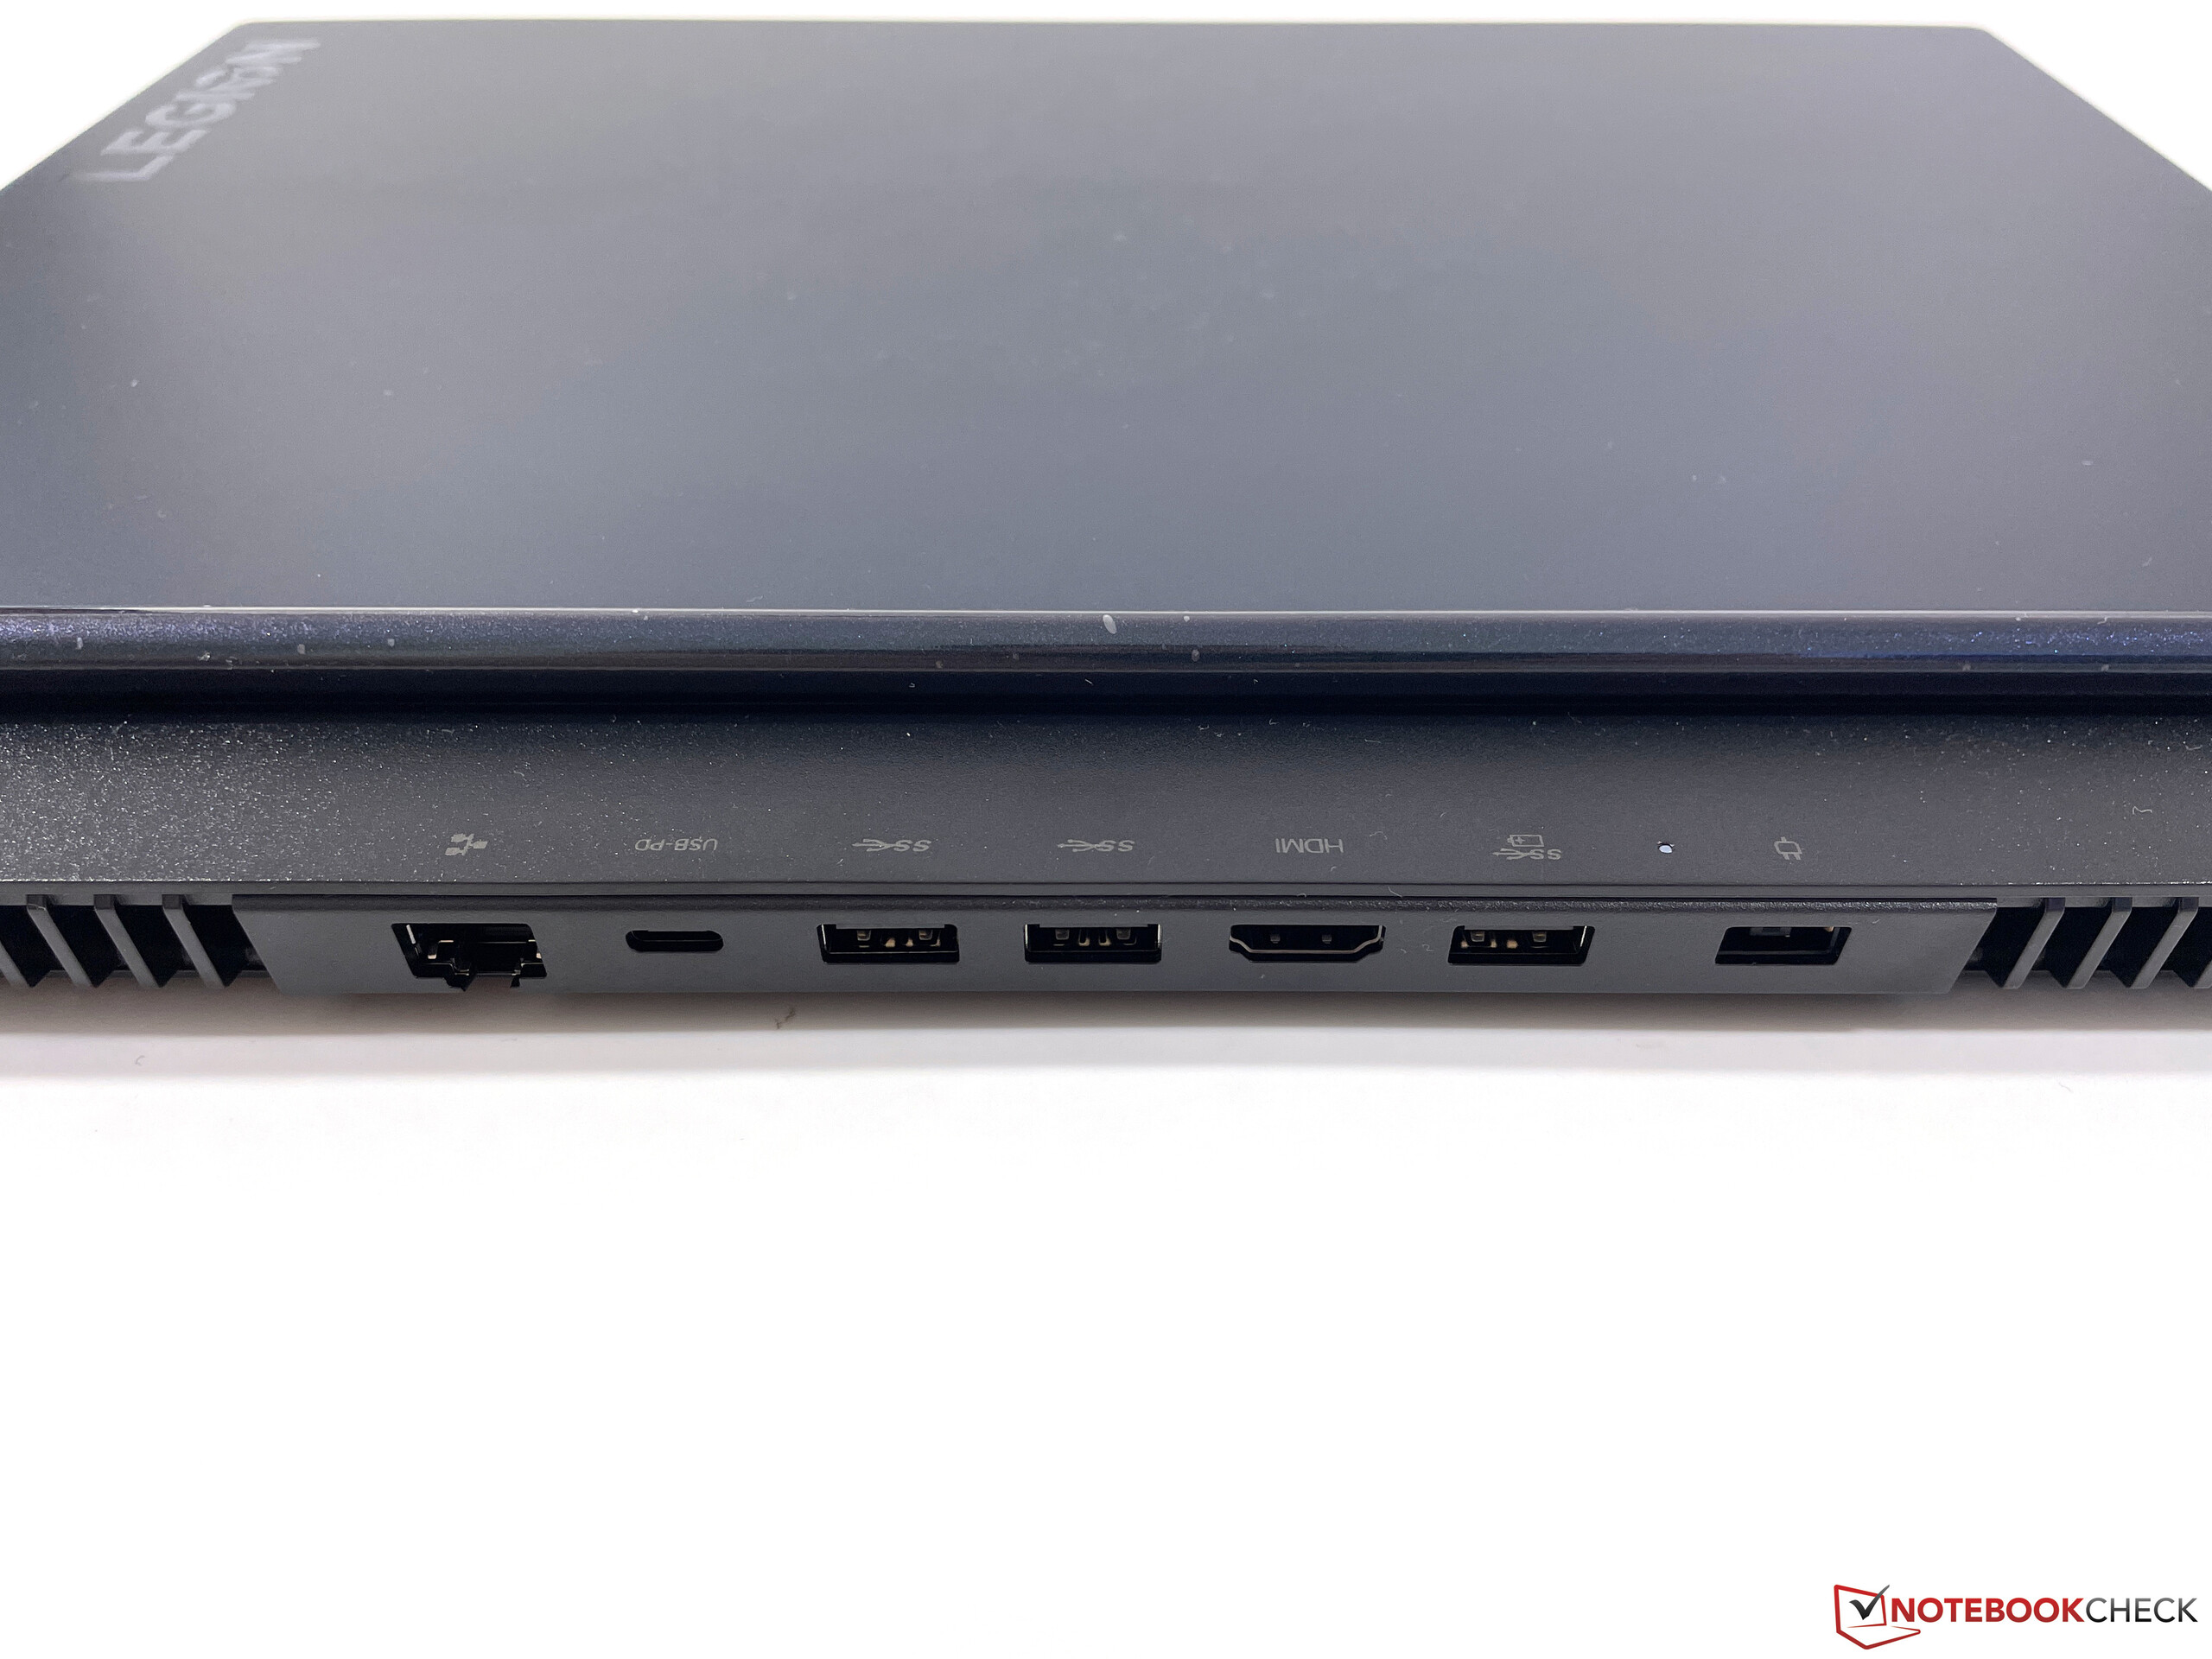
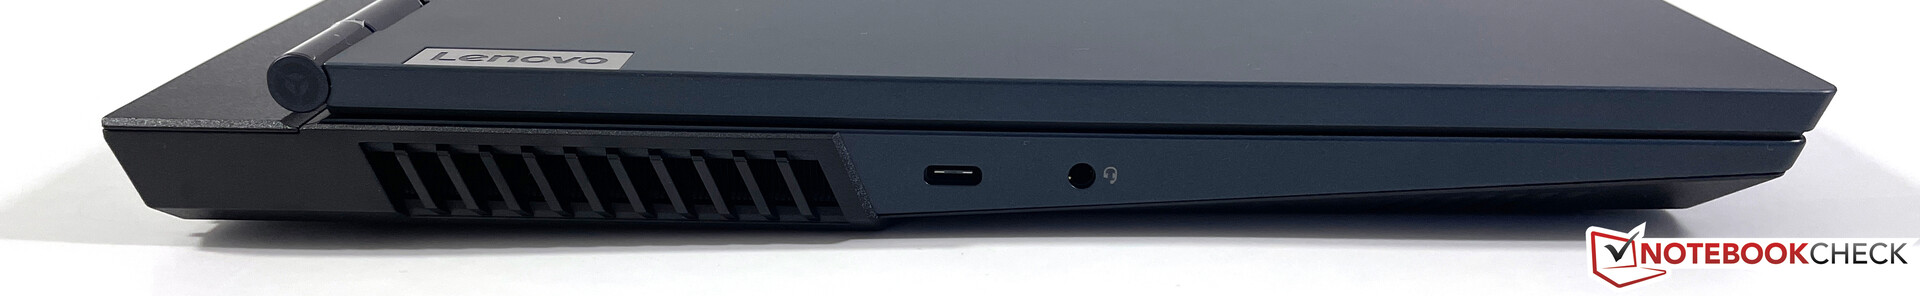
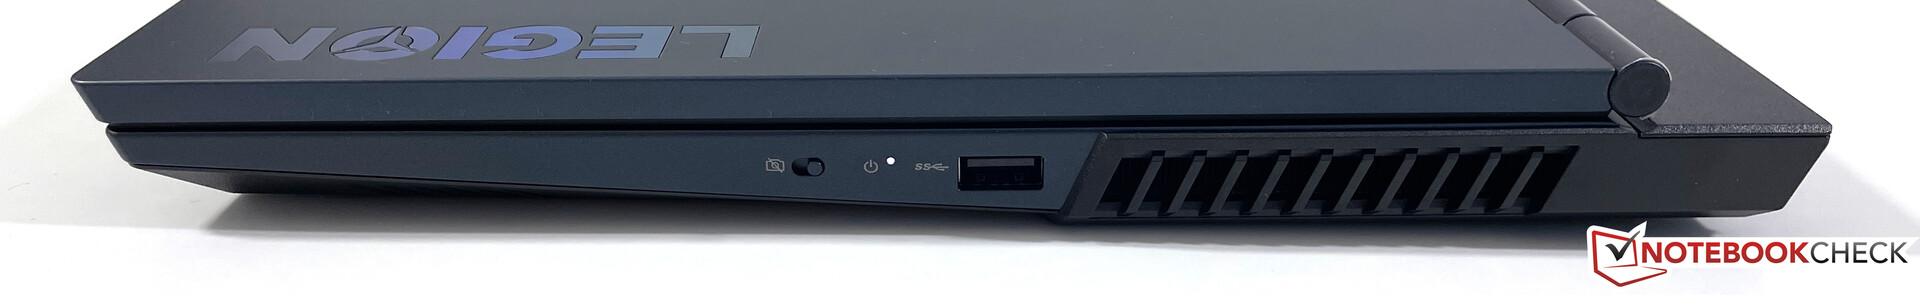
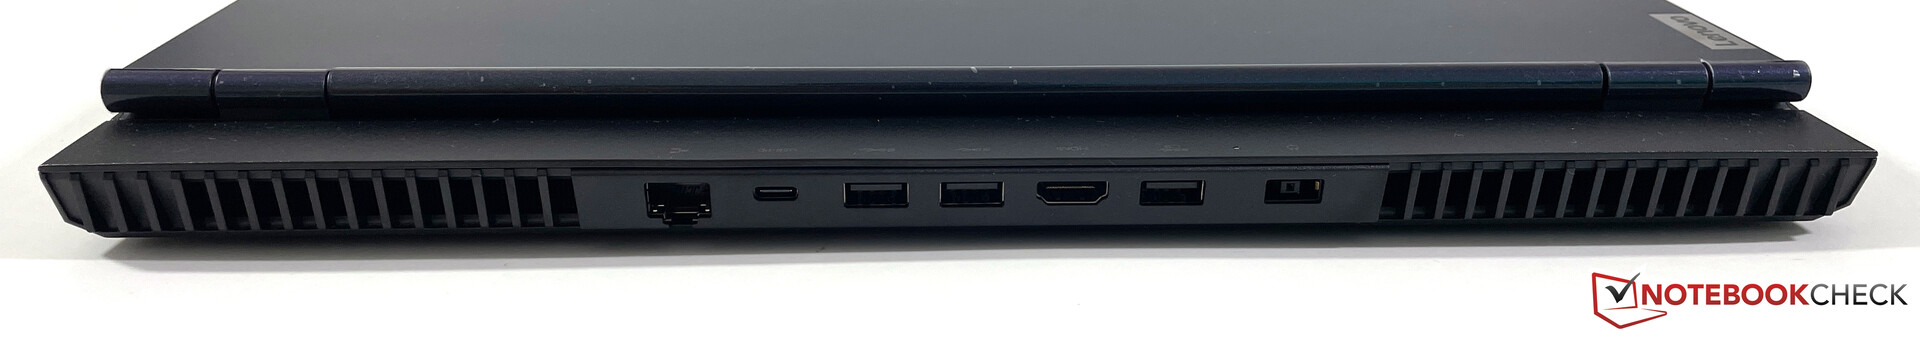
Connectivity - AMD Legion without Thunderbolt
As expected, the Legion 5 15 does not support Thunderbolt, but you get all the other important ports. The majority of connectors is located at the rear, but you get at least one USB port on each side (1x USB-C, 1x USB-A) as well as the headset port.
Communication
The Wi-Fi module is an indicator for the low price point of the laptop. You get a modern Wi-Fi 6 module from RealTek (RTL8852AE), but the maximum transfer rate if limited to 866 Mbps and there are no special functions for gaming, either (like prioritizing of online gaming). Our standardized Wi-Fi test with the router Netgear Nighthawk RAX120 also shows fluctuating transfer rates. However, we did not experience any issues in practice and the download speeds were inconspicuous as well.
Webcam
The 720p offers an electronic shutter, but the picture quality is not good even in good lighting conditions. There is no additional IR camera for Windows Hello.


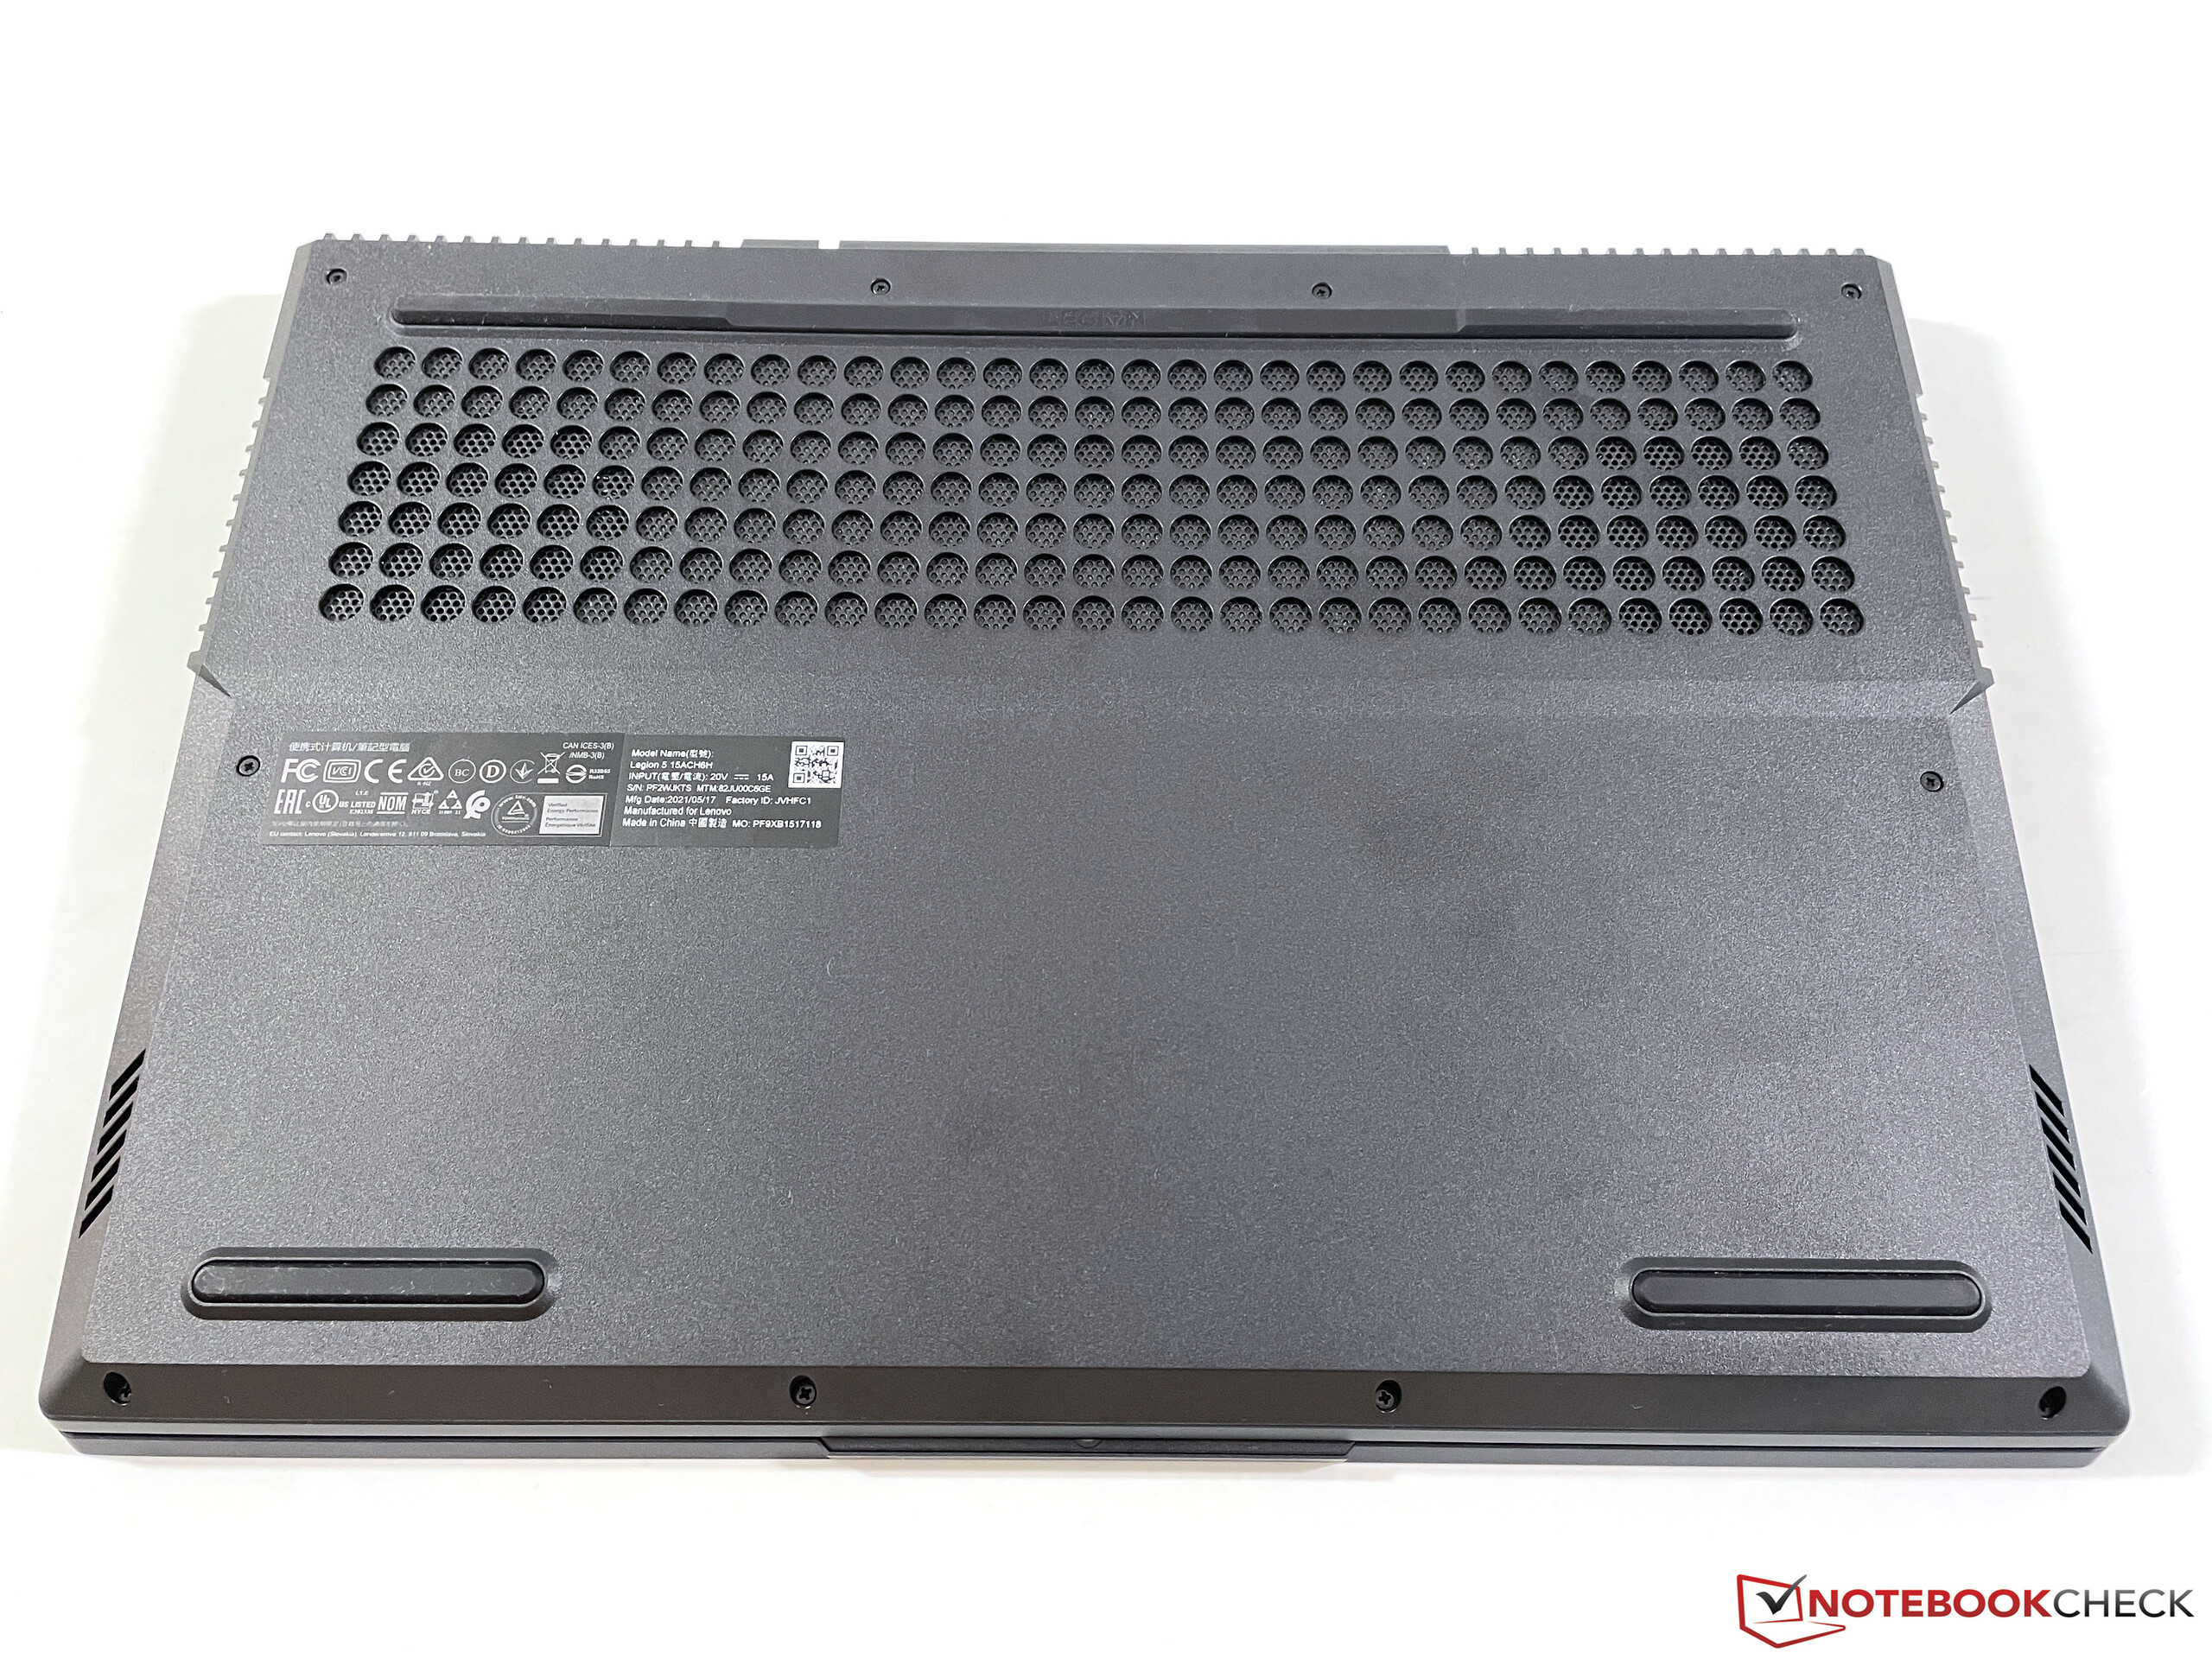
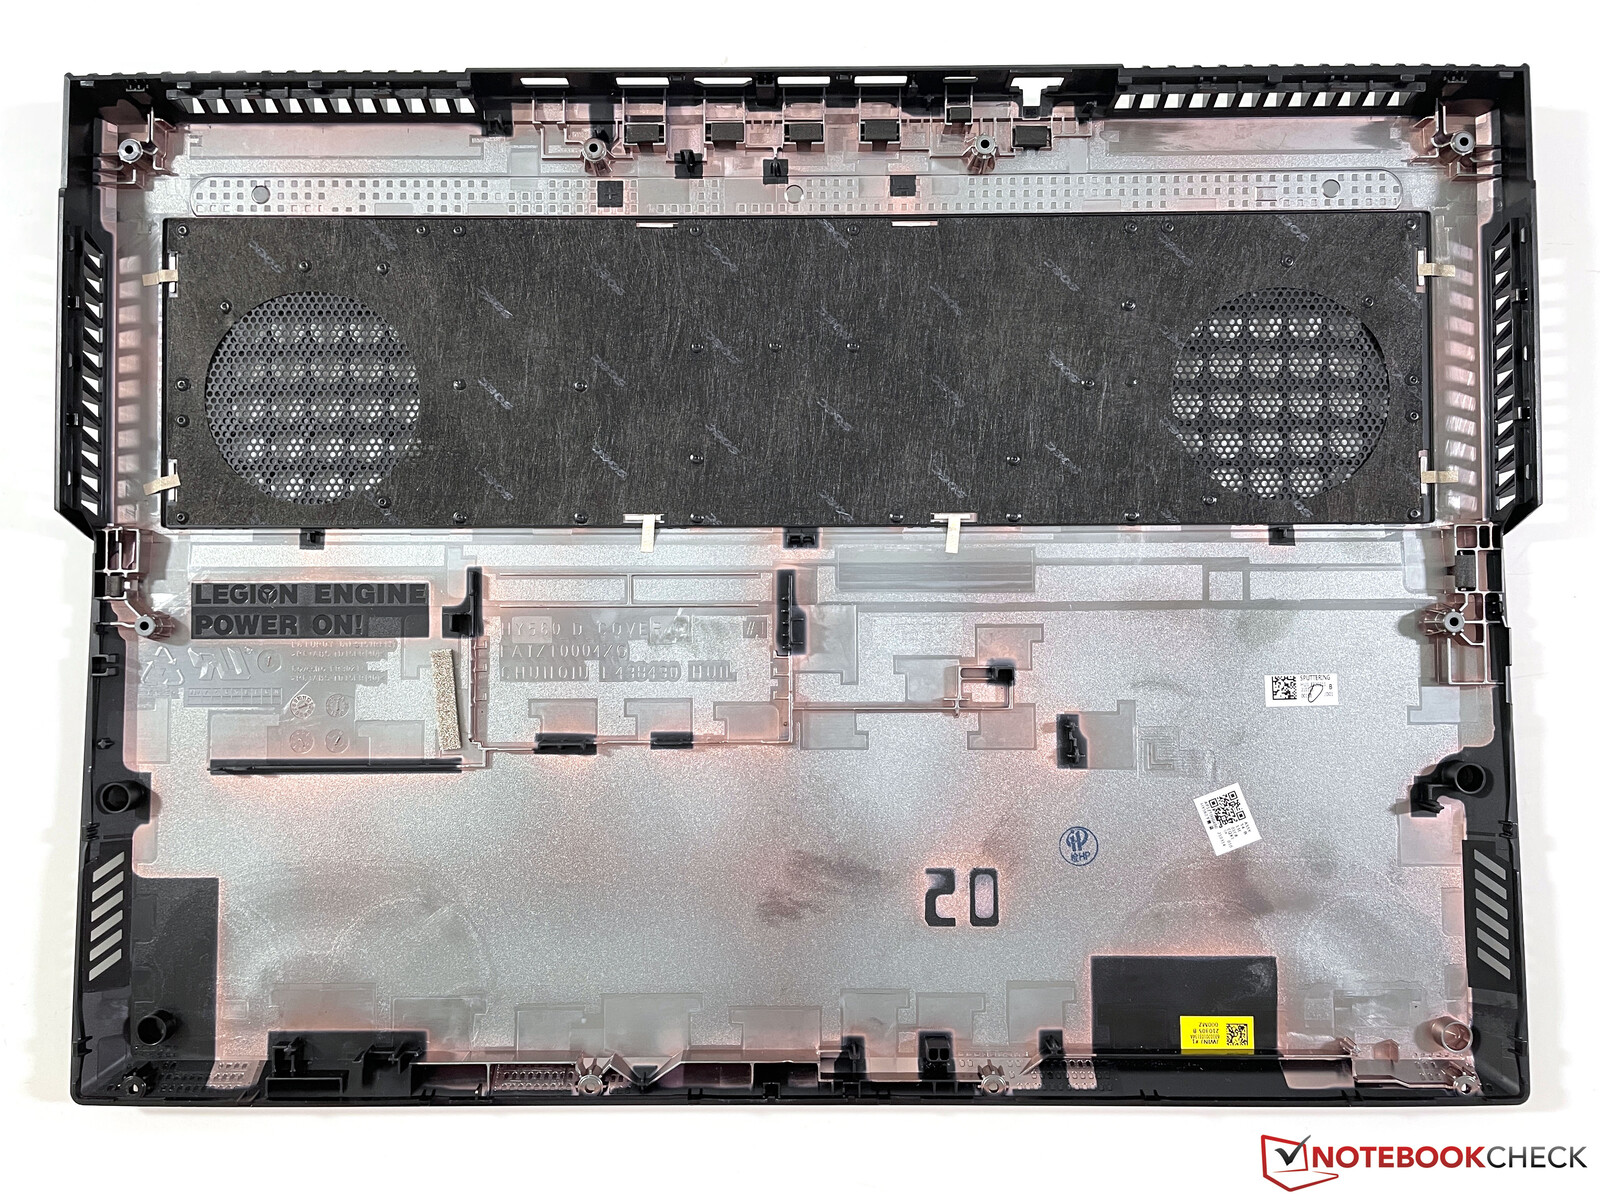
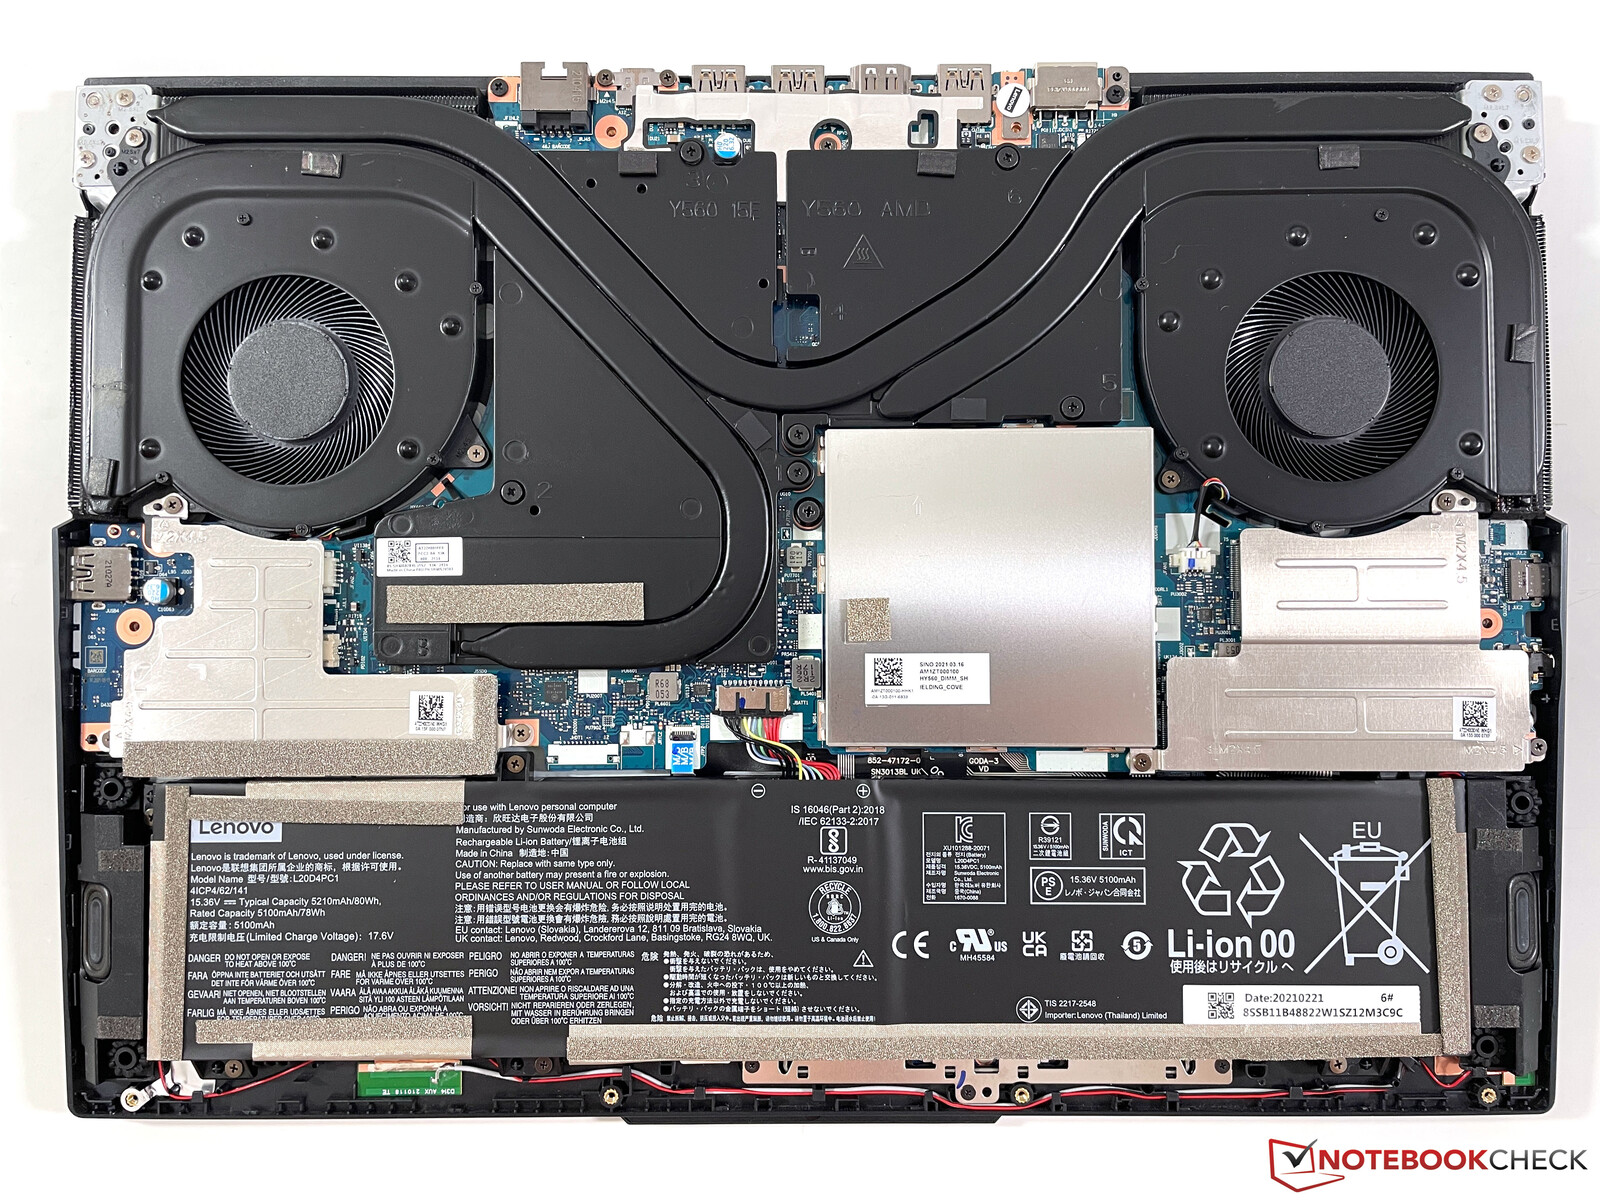
Maintenance
The bottom cover can be removed, but the process is not simple. After the removal of the screws, the panel is still extremely tight and you have to be careful when you remove it. Both memory slots as well as the two M.2-2280 slots are covered by additional panels, but they are easy to remove. It is also possible to replace the Wi-Fi module.
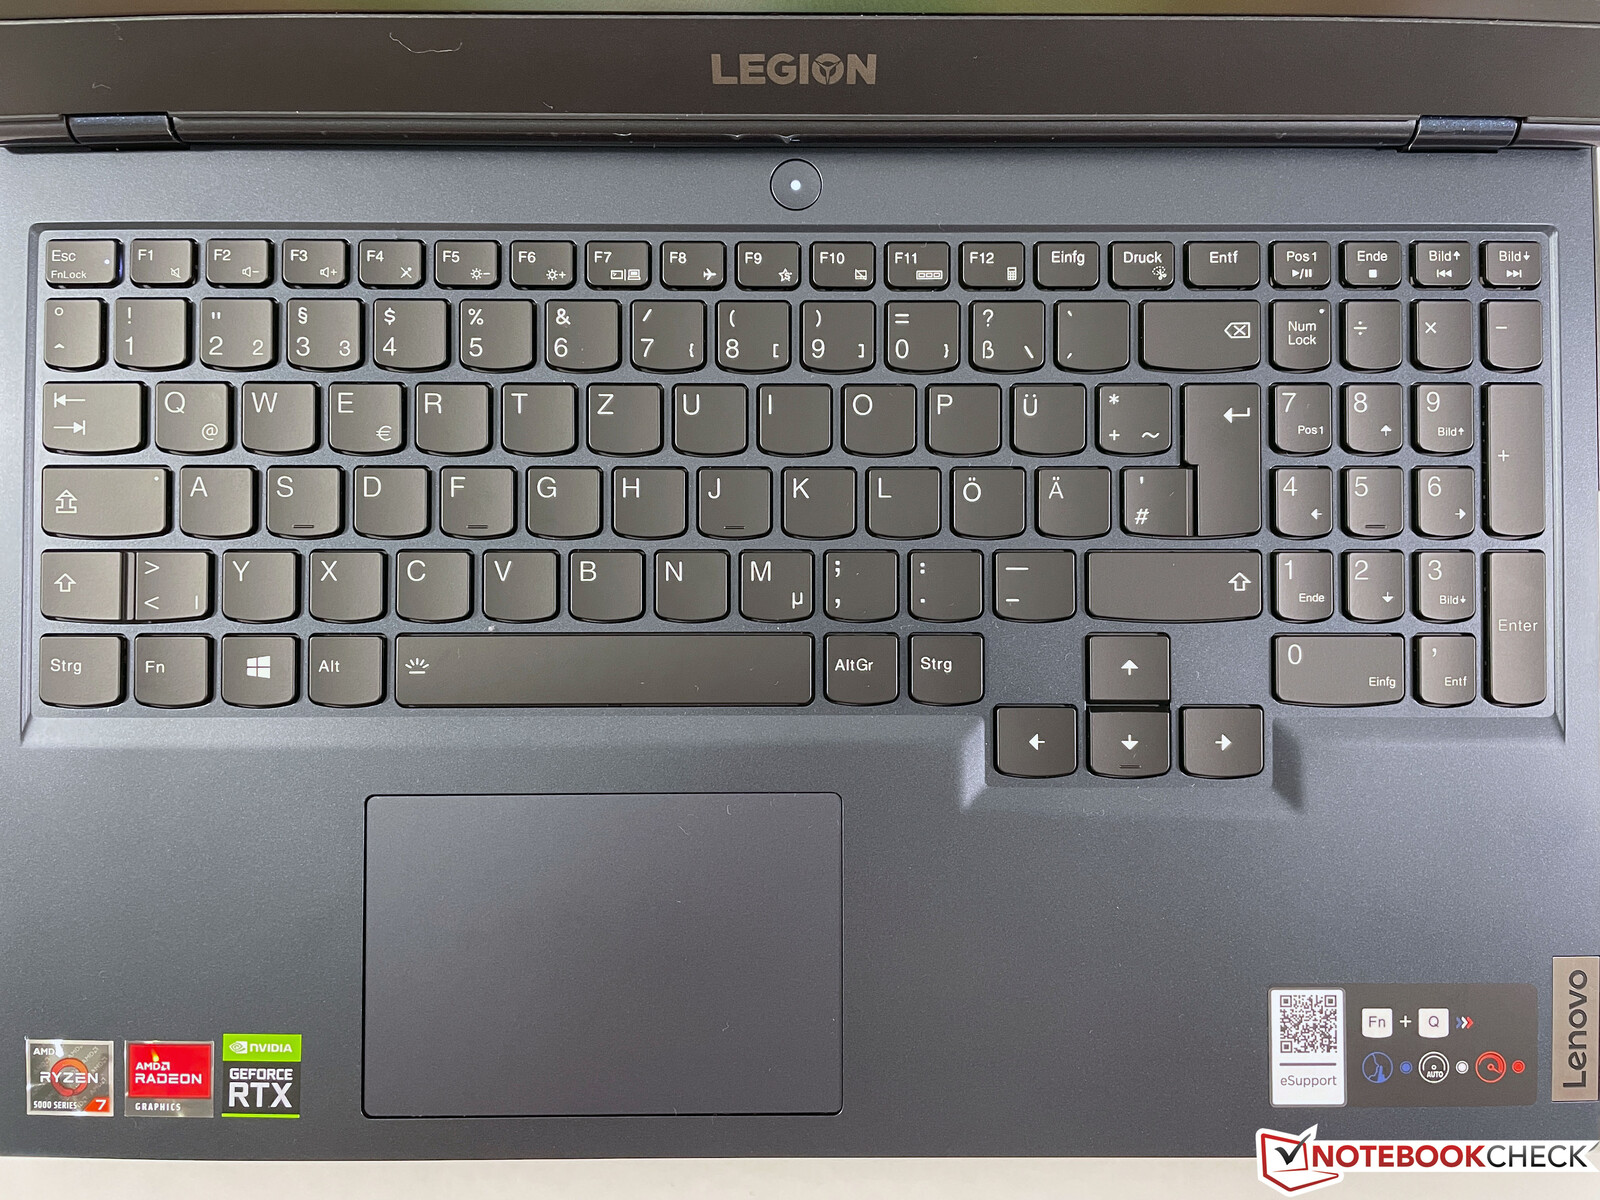
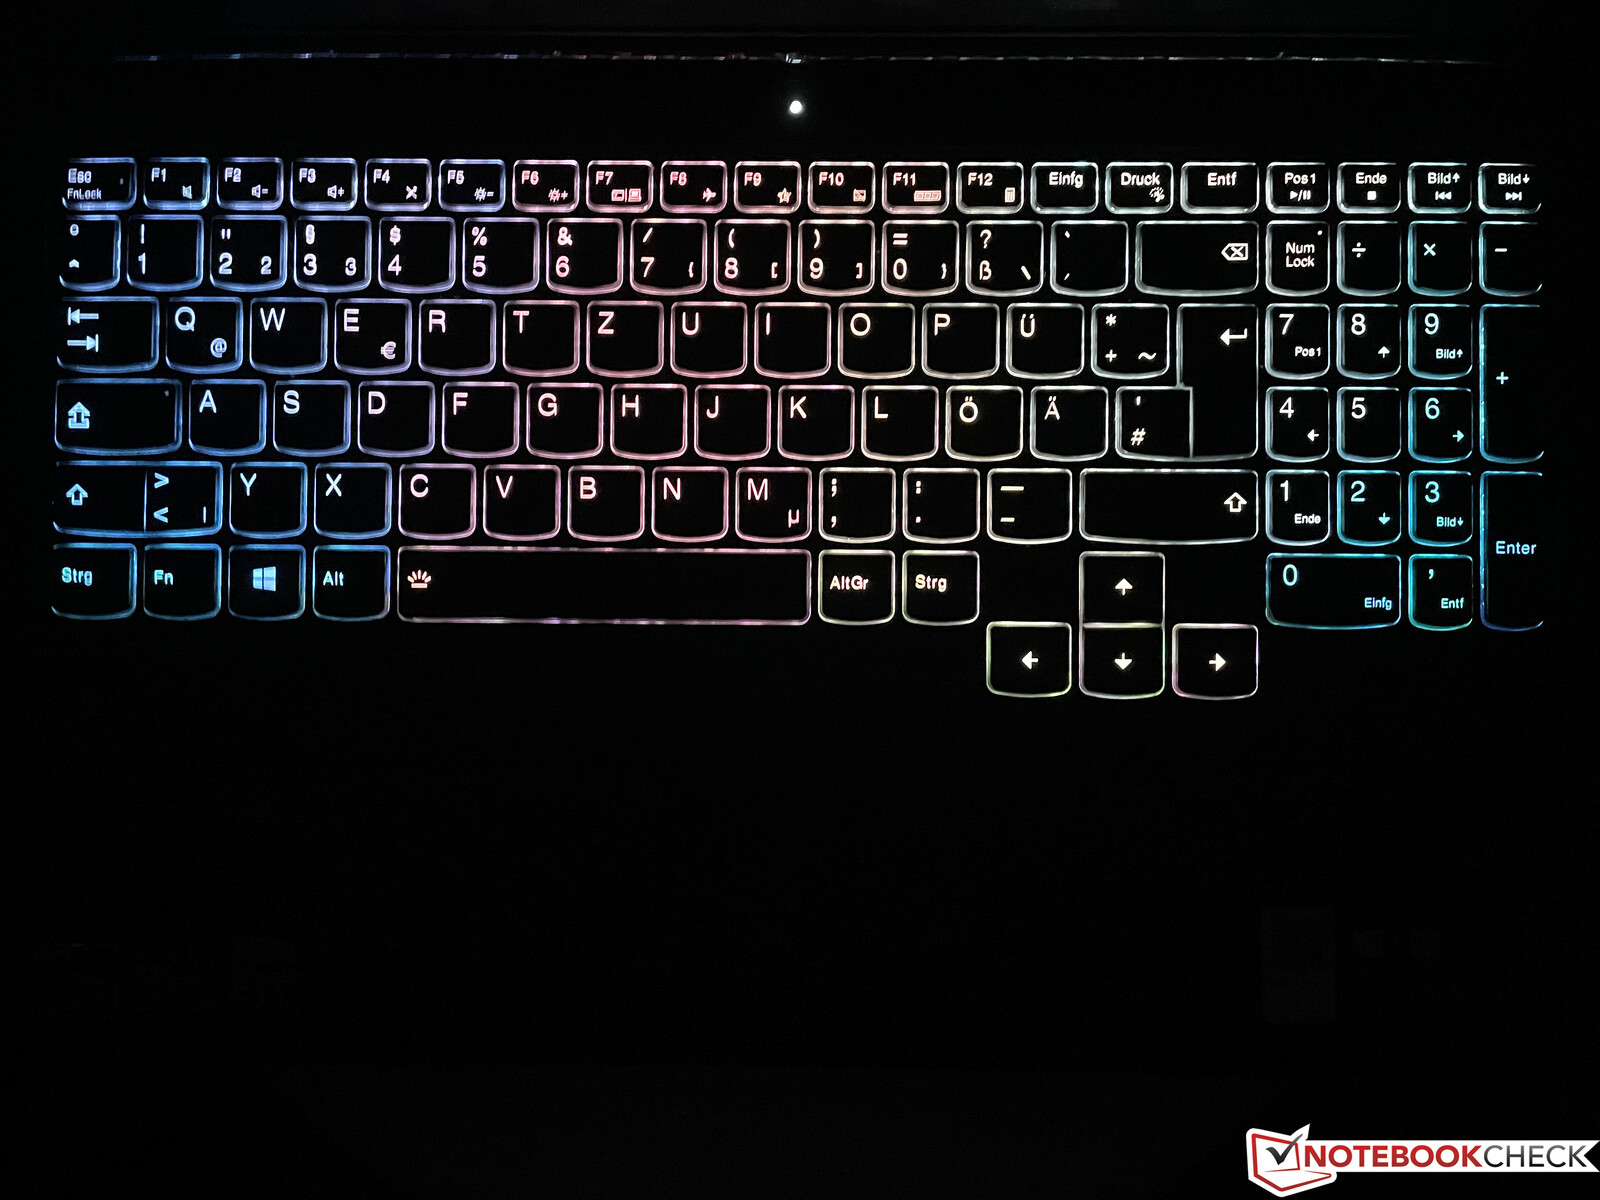
Input Devices - Legion with multi-zone illumination
Lenovo did not change the input devices compared to the previous model. You can type comfortably on the keys and there is a dedicated numpad on the right side, even though the keys are a bit narrower. However, the arrow keys are slightly shifted towards the bottom and they have the identical size, so they are very easy to find without looking. The background illumination is divided into four zones, which can be adjusted separately. You can switch between three profiles via key combination (Fn+space bar), and you can adjust them via Lenovo’s Vantage app (brightness, color, pattern). Cursor movements are no problem with the large clickpad, but most gamers will probably use an external mouse.
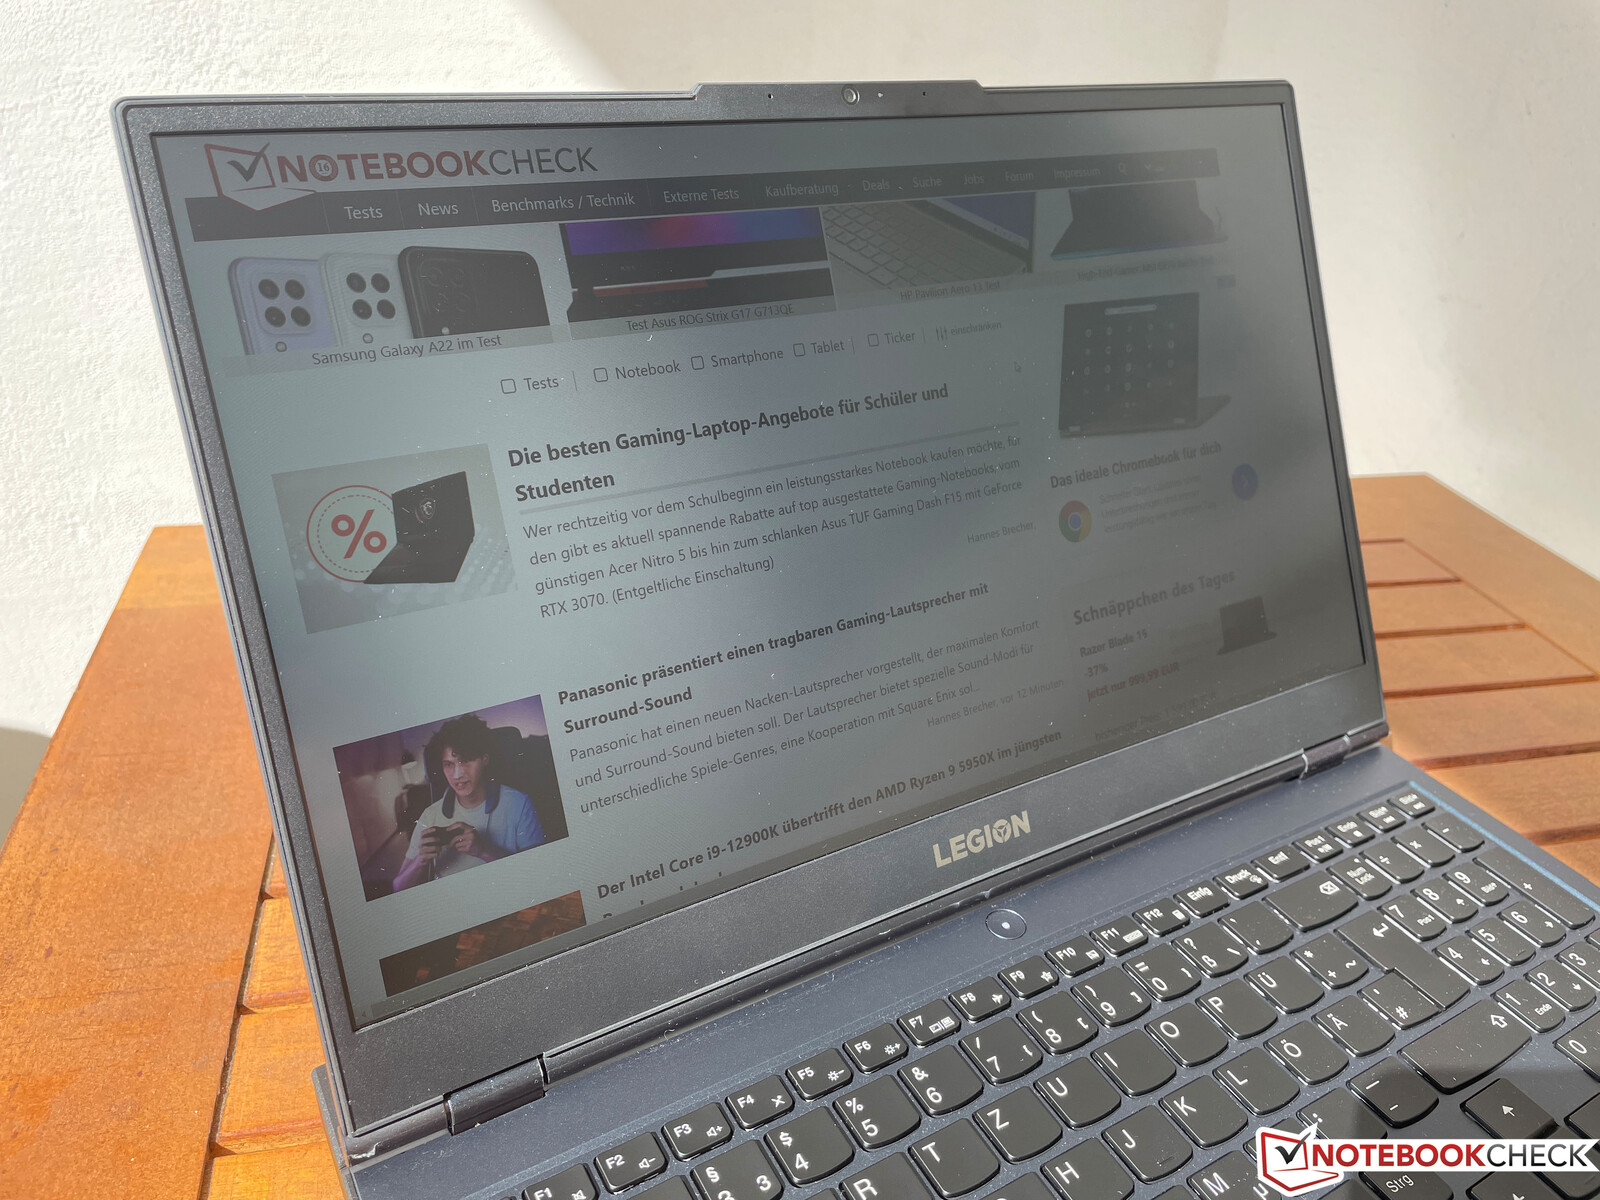
Display - 1080p mit 165 Hz & G-Sync


Lenovo offers different displays starting with a 1080p screen and 120 Hz (250 nits), a 1080p screen with 60 Hz (300 nits), a 1080p panel with 165 Hz (300 nits) all the way up to a WQHD panel with 165 Hz (300 nits). Our test unit is equipped with the fast FHD panel with 165 Hz and G-Sync, which leaves a very good subjective picture impression. Colors are vivid and even bright surface do not look grainy, despite the matte screen surface. The high refresh rate also results in a very smooth impression.
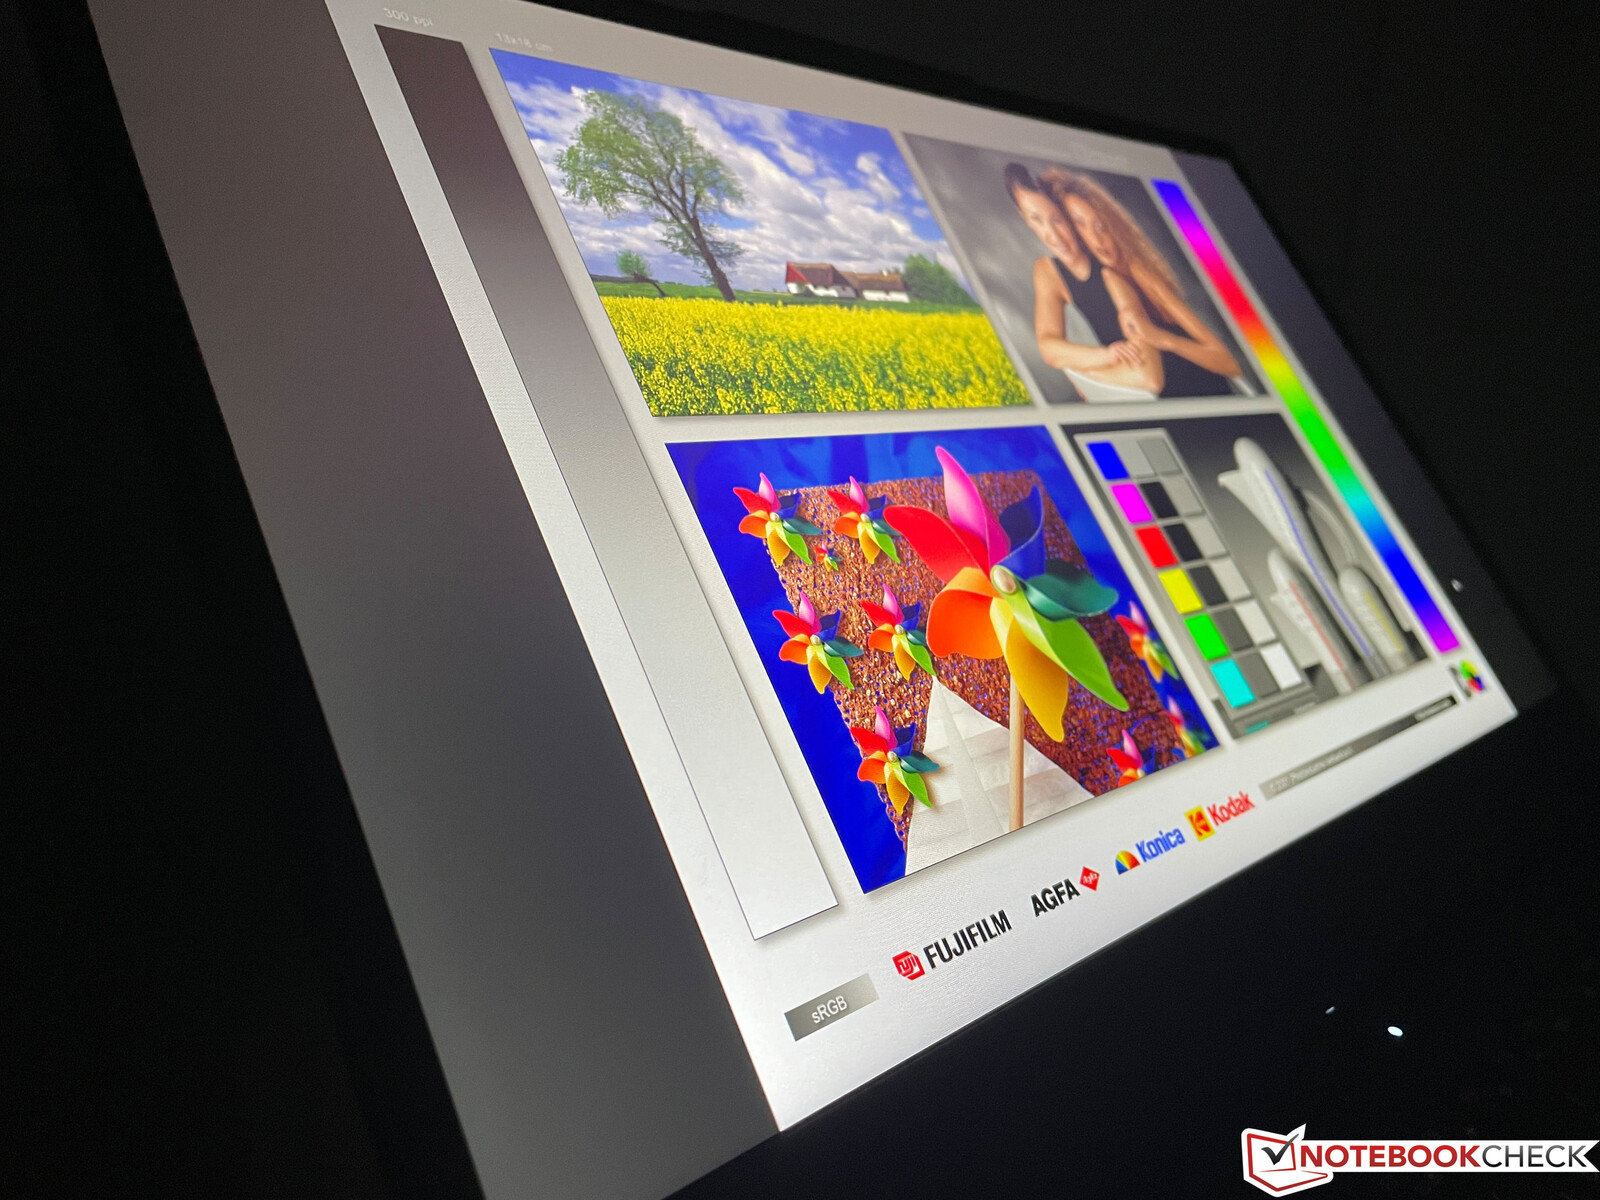
Our test unit easily beats the advertised brightness of 300 nits with an average result of 350 nits and a good contrast ratio of 1200:1. There is just minor backlight bleeding at the lower edge, but it is barely visible in practice. We did not detect PWM and the response times are very fast, so the Legion 5 15 does not have problems with ghosting.
| |||||||||||||||||||||||||
Brightness Distribution: 96 %
Center on Battery: 350 cd/m²
Contrast: 1167:1 (Black: 0.3 cd/m²)
ΔE ColorChecker Calman: 3.9 | ∀{0.5-29.43 Ø4.76}
calibrated: 1.6
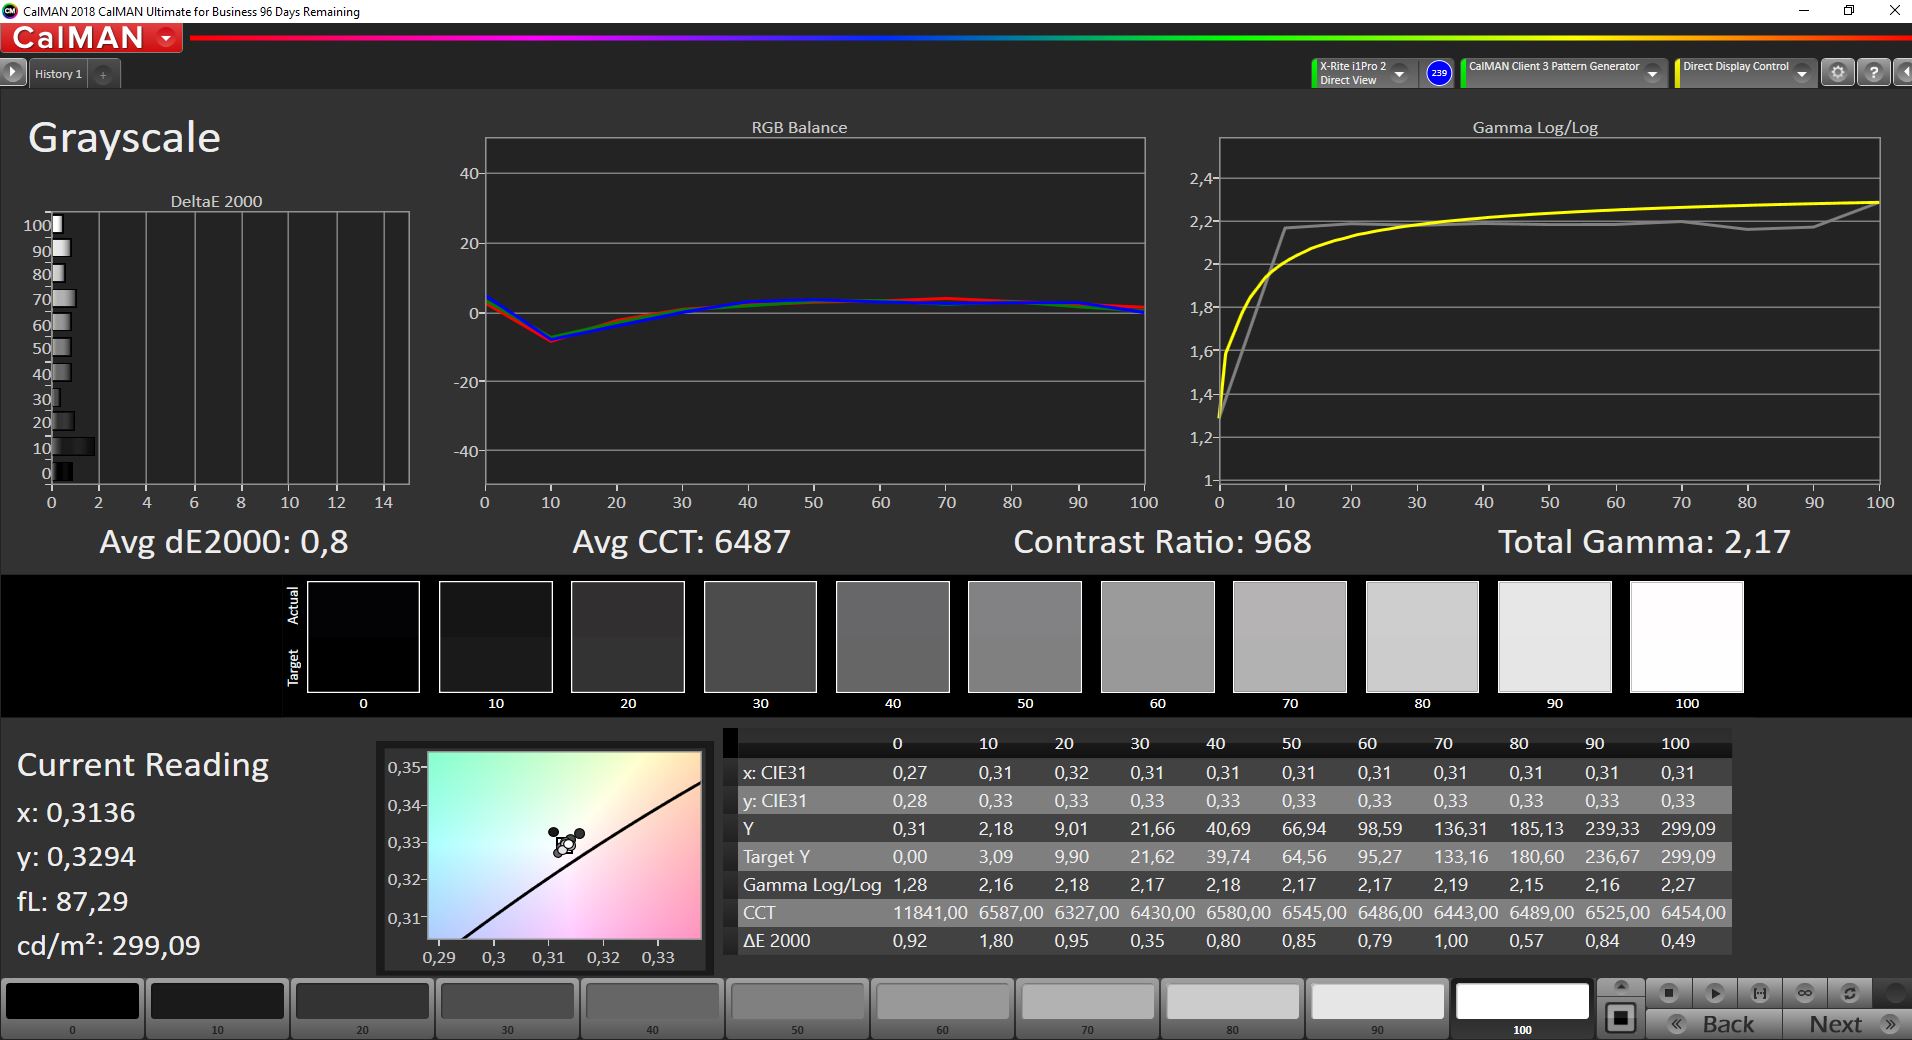
ΔE Greyscale Calman: 5.5 | ∀{0.09-98 Ø5}
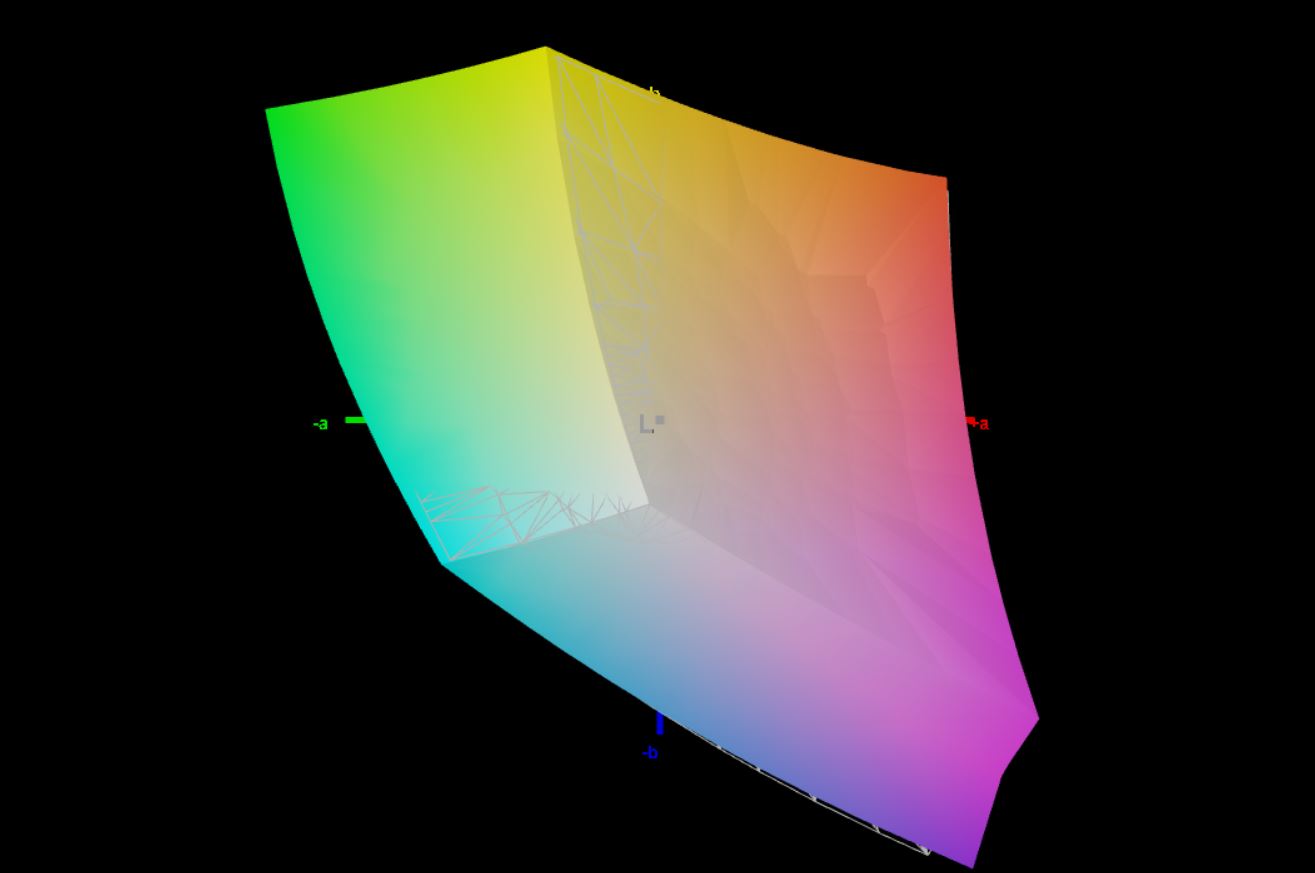
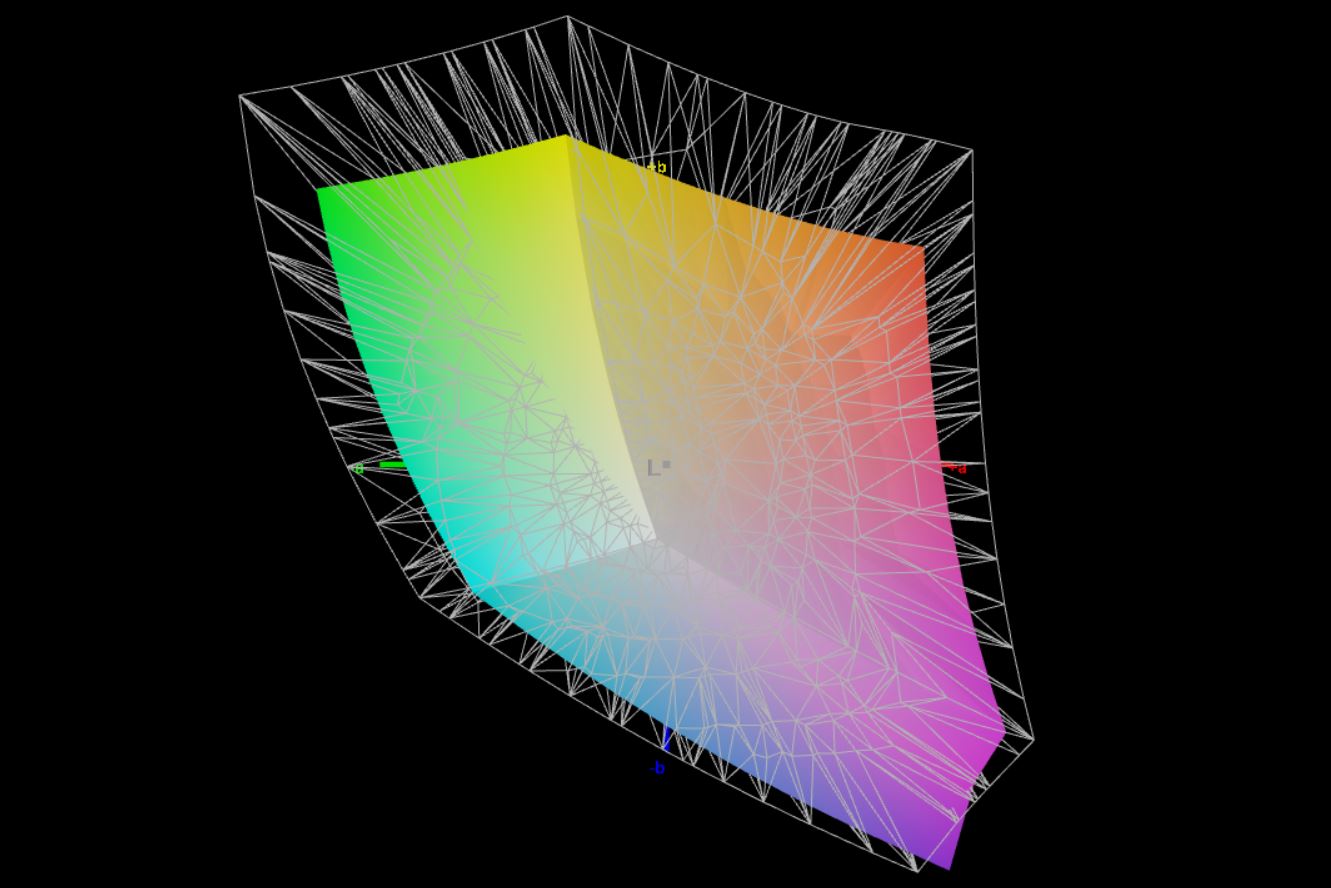
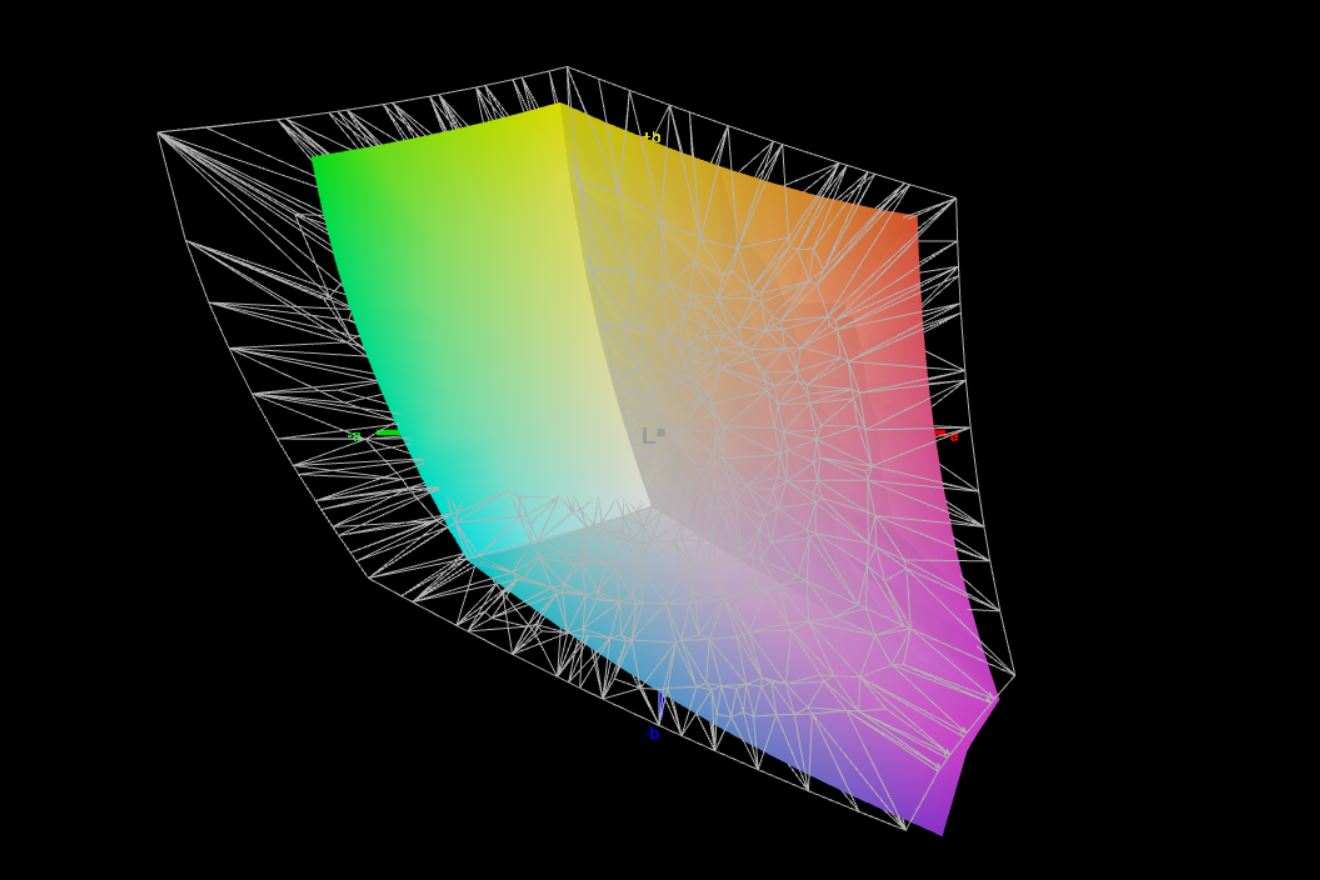
67.5% AdobeRGB 1998 (Argyll 3D)
96.3% sRGB (Argyll 3D)
65.4% Display P3 (Argyll 3D)
Gamma: 2.15
CCT: 7414 K
| Lenovo Legion 5 15ACH-82JU00C6GE-FL B156HAN12.H, , 1920x1080, 15.6" | Acer Nitro 5 AN515-45-R1JH BOE BOE09B8, IPS, 2560x1440, 15.6" | Asus TUF Gaming F15 FX506HM Chi Mei N156HRA-EA1, IPS, 1920x1080, 15.6" | Alienware m15 R5 Ryzen Edition B156HAN, IPS, 1920x1080, 15.6" | Schenker XMG Core 15 Ampere BOE CQ NE156QHM-NY2, IPS, 2560x1440, 15.6" | |
|---|---|---|---|---|---|
| Display | 0% | -36% | 5% | ||
| Display P3 Coverage (%) | 65.4 | 66.2 1% | 41.9 -36% | 69.8 7% | |
| sRGB Coverage (%) | 96.3 | 96.3 0% | 62.9 -35% | 98.8 3% | |
| AdobeRGB 1998 Coverage (%) | 67.5 | 67.1 -1% | 43.3 -36% | 70.7 5% | |
| Response Times | 5% | -122% | 40% | -11% | |
| Response Time Grey 50% / Grey 80% * (ms) | 13.6 ? | 14 ? -3% | 28.4 ? -109% | 4 ? 71% | 14.8 ? -9% |
| Response Time Black / White * (ms) | 9.2 ? | 8 ? 13% | 21.6 ? -135% | 8.4 ? 9% | 10.4 ? -13% |
| PWM Frequency (Hz) | |||||
| Screen | -18% | -36% | 13% | 24% | |
| Brightness middle (cd/m²) | 350 | 349 0% | 268.3 -23% | 329 -6% | 347 -1% |
| Brightness (cd/m²) | 350 | 304 -13% | 257 -27% | 321 -8% | 328 -6% |
| Brightness Distribution (%) | 96 | 79 -18% | 84 -12% | 92 -4% | 89 -7% |
| Black Level * (cd/m²) | 0.3 | 0.535 -78% | 0.34 -13% | 0.27 10% | 0.27 10% |
| Contrast (:1) | 1167 | 652 -44% | 789 -32% | 1219 4% | 1285 10% |
| Colorchecker dE 2000 * | 3.9 | 3.11 20% | 5.05 -29% | 2.78 29% | 1.66 57% |
| Colorchecker dE 2000 max. * | 8.2 | 9.57 -17% | 15.43 -88% | 4.88 40% | 3.03 63% |
| Colorchecker dE 2000 calibrated * | 1.6 | 3.21 -101% | 1.63 -2% | 1.23 23% | |
| Greyscale dE 2000 * | 5.5 | 5 9% | 5.5 -0% | 2.5 55% | 1.6 71% |
| Gamma | 2.15 102% | 2.36 93% | 2.35 94% | 2.106 104% | 2.278 97% |
| CCT | 7414 88% | 6976 93% | 7392 88% | 6201 105% | 6430 101% |
| Color Space (Percent of AdobeRGB 1998) (%) | 76 | 71 | |||
| Color Space (Percent of sRGB) (%) | 99 | 94 | |||
| Total Average (Program / Settings) | -4% /
-10% | -65% /
-48% | 27% /
18% | 6% /
15% |
* ... smaller is better
Our analysis (CalMAN & X-Rite i1 Pro 2) reveals a slight color cast towards green/blue in combination with a cool color temperature. This improves the maximum brightness, which drops to ~300 nits after our own calibration.
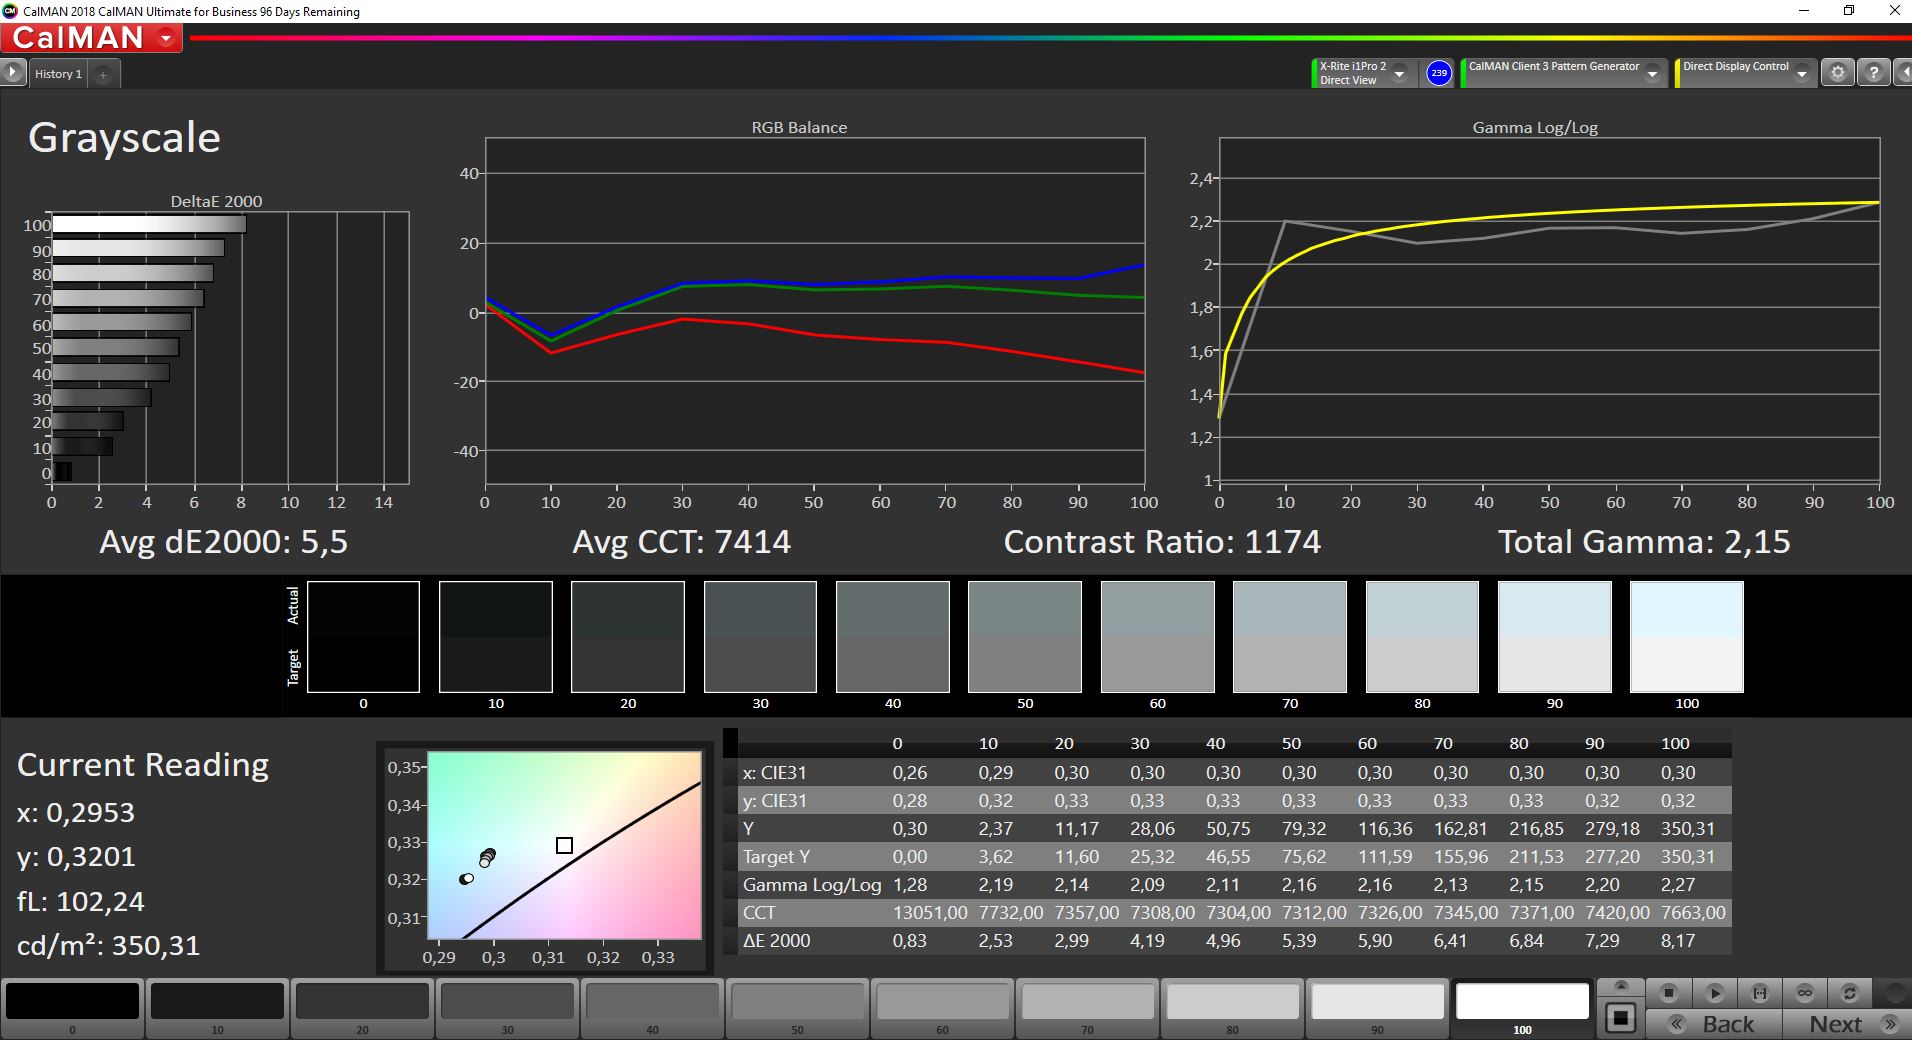
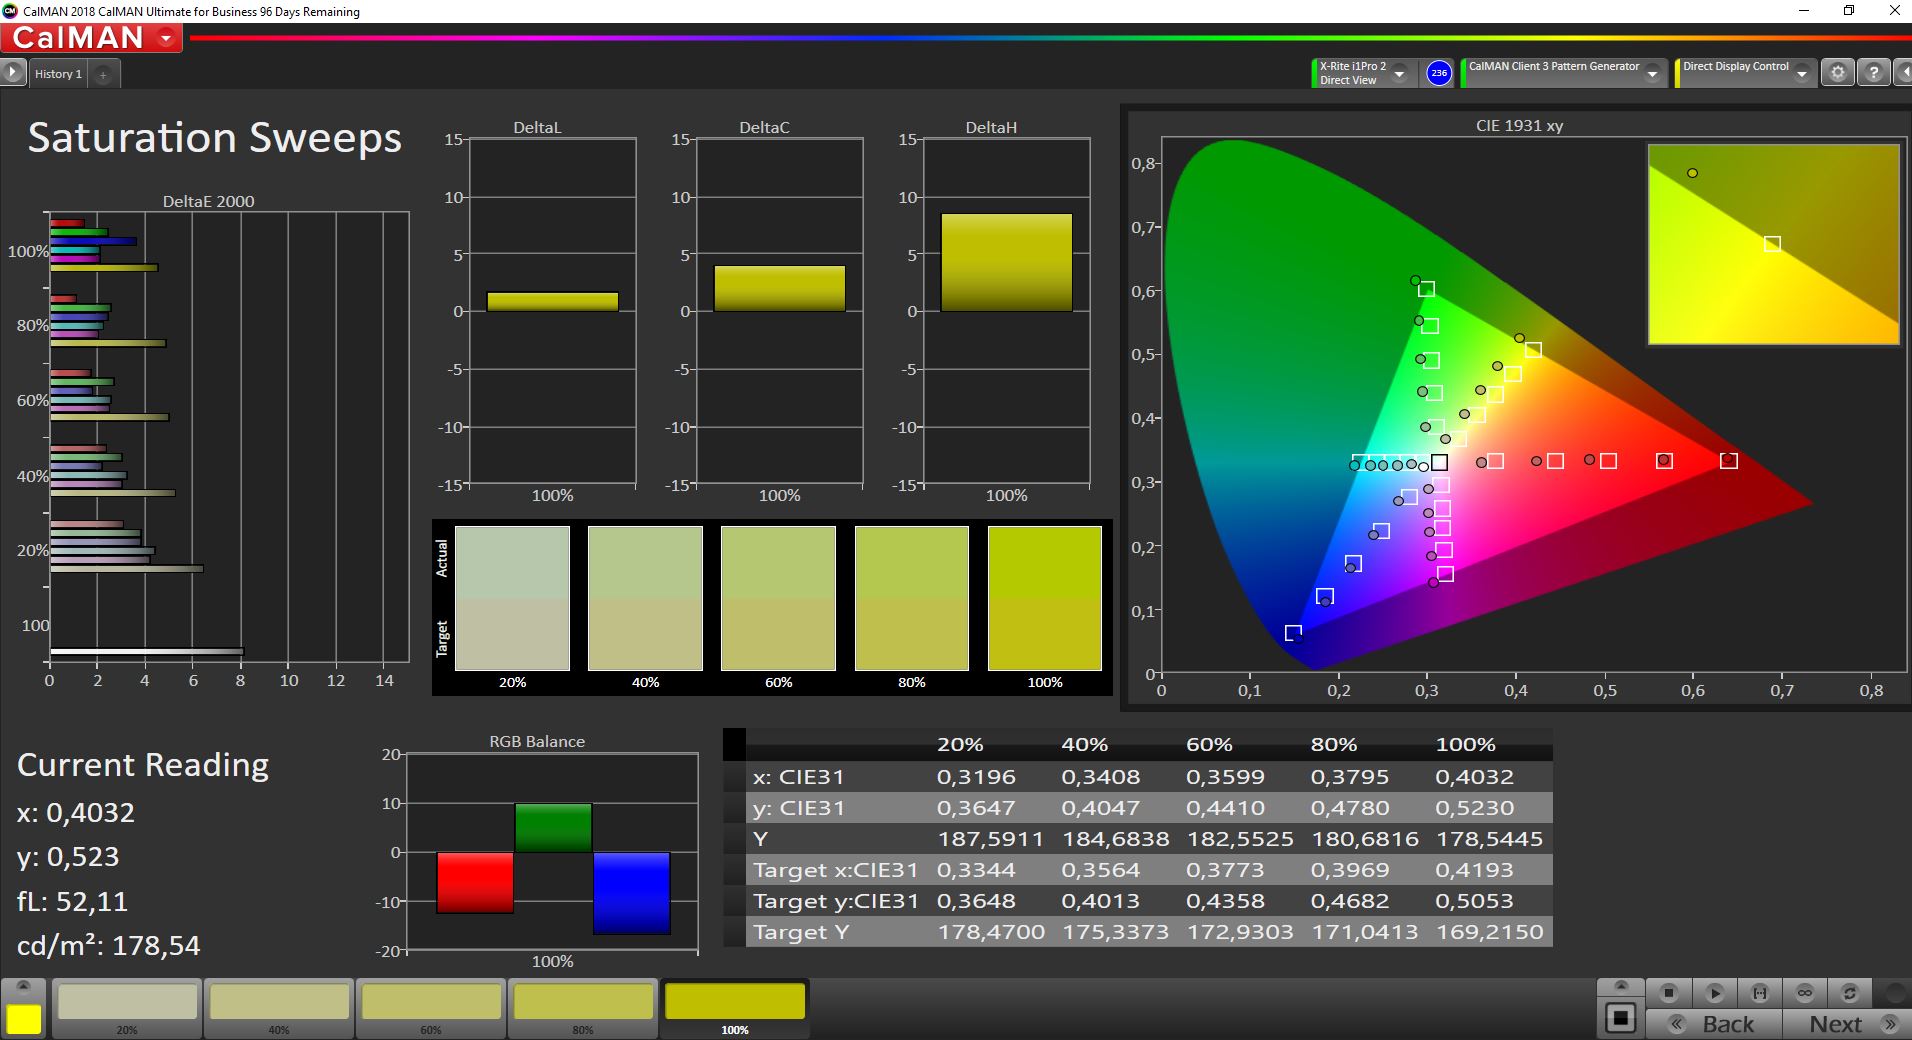
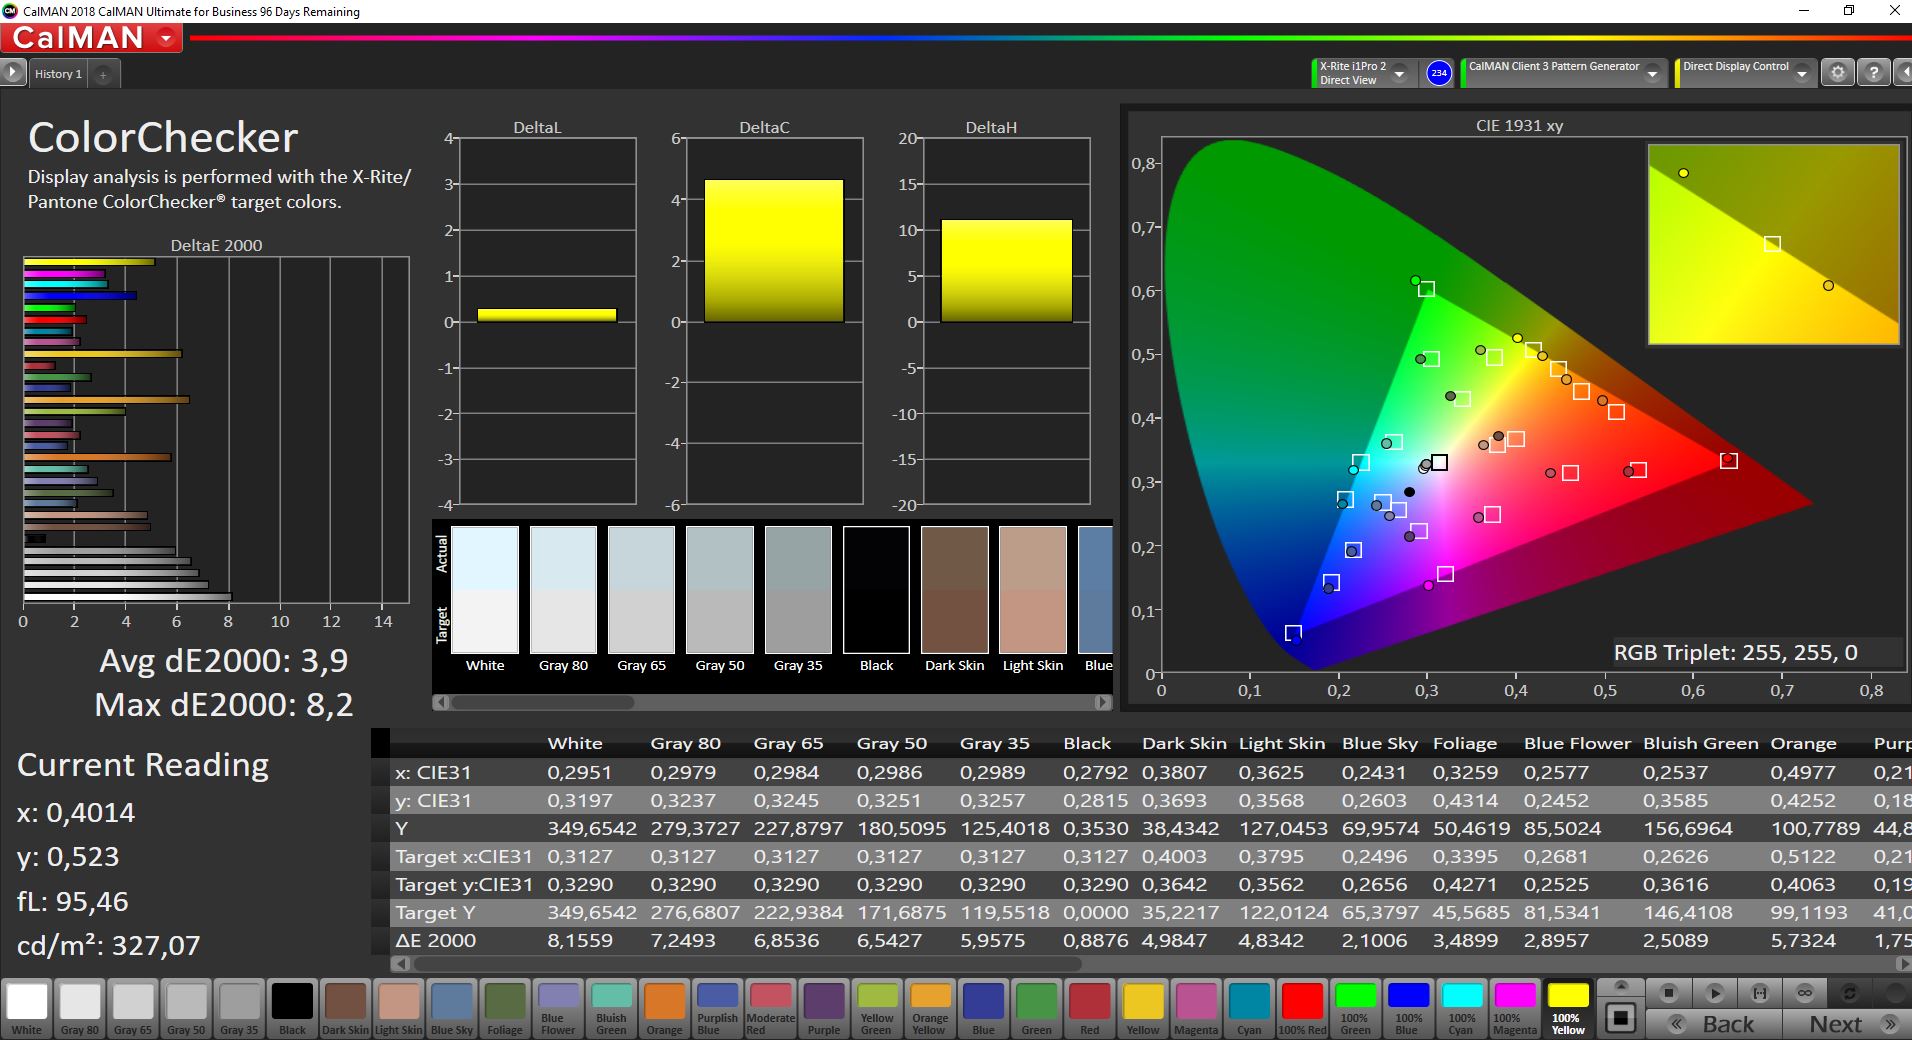
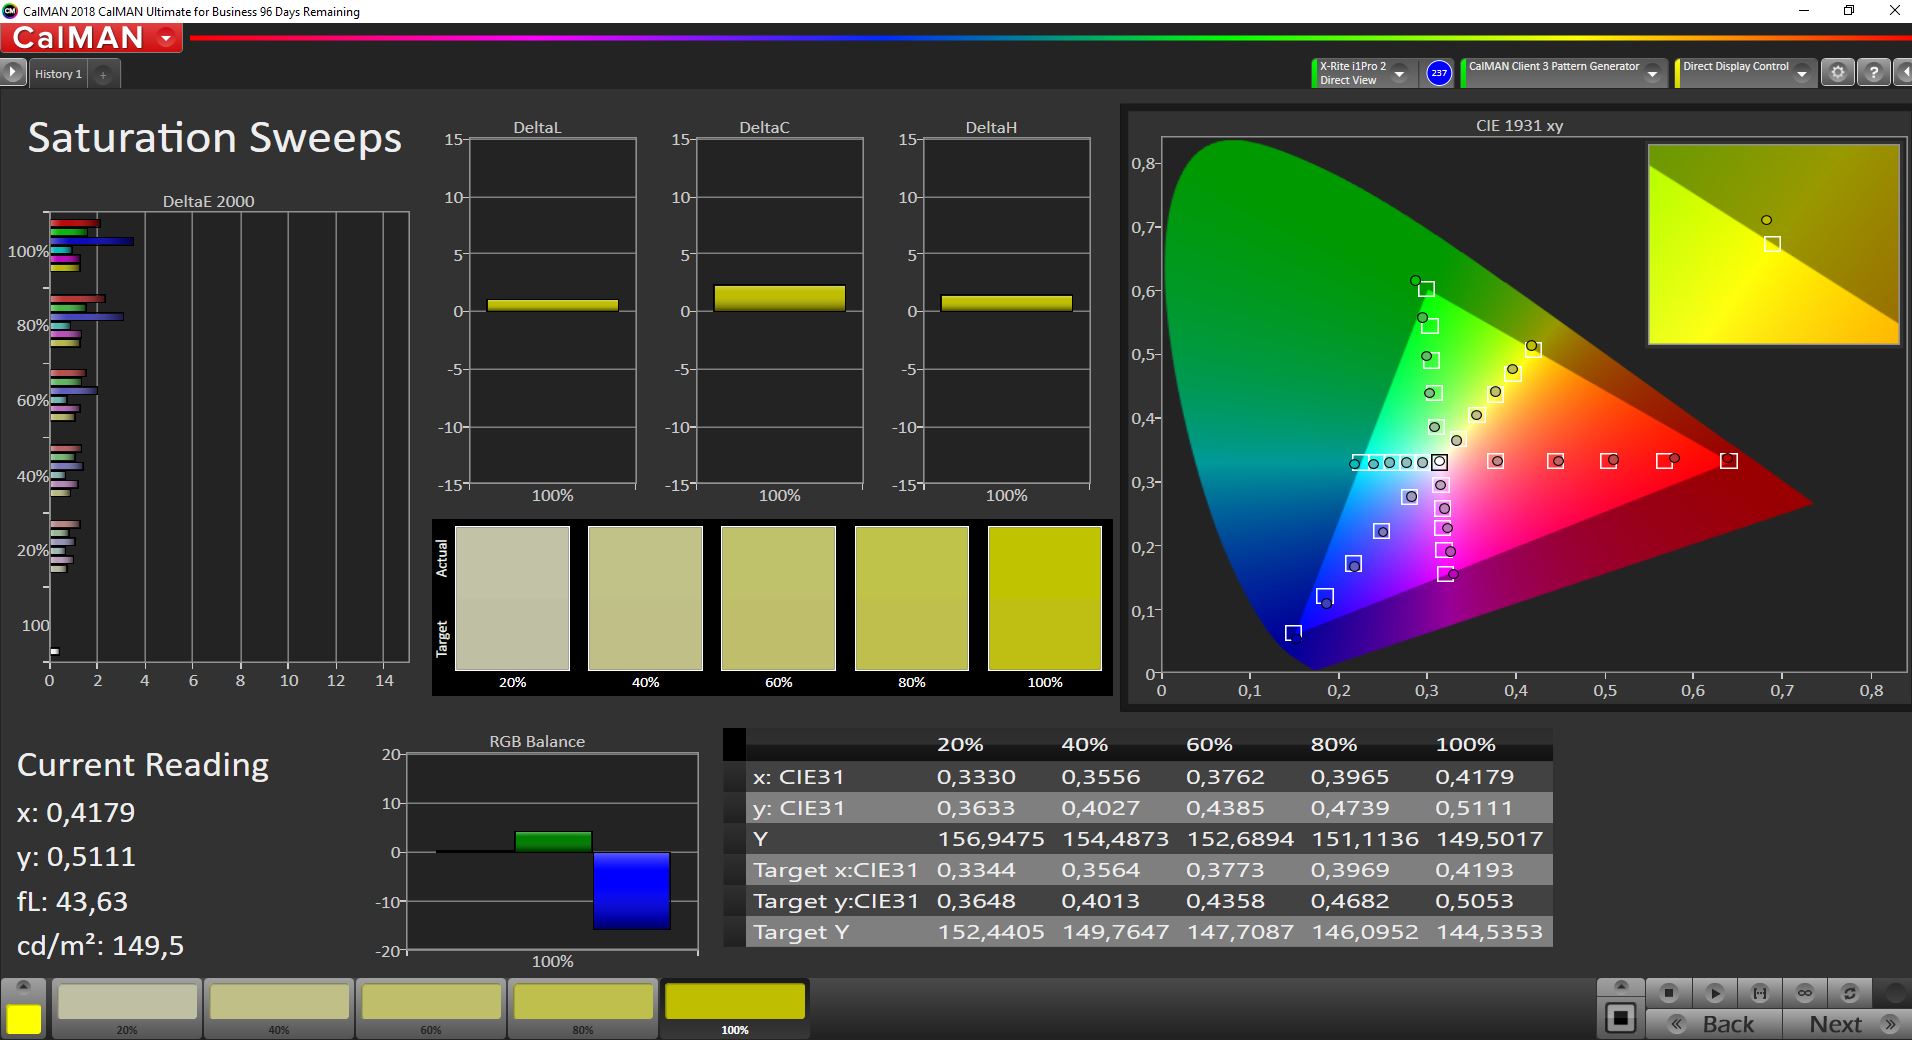
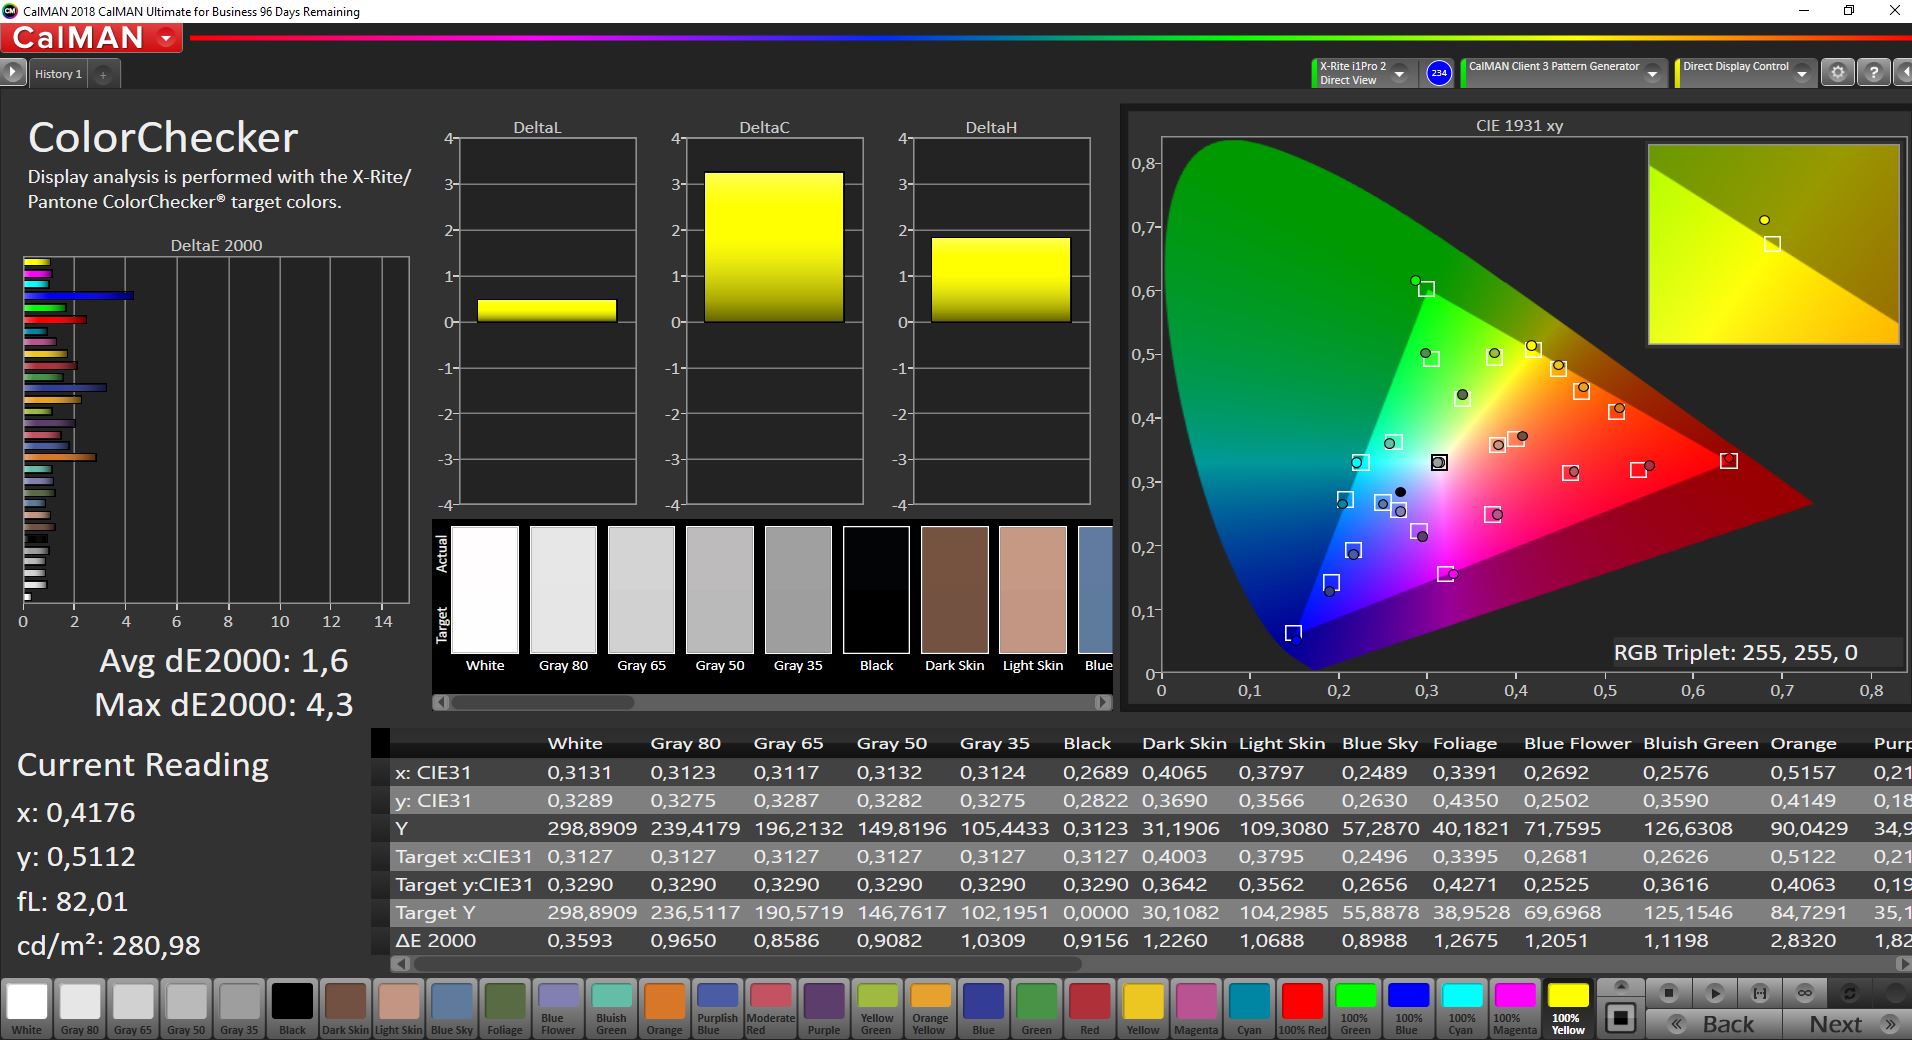
The advantage of the calibration are the significantly lower deviations for the grayscale as well as the colors compared to the sRGB reference color space. Thanks to almost full sRGB coverage, the panel is also suited for picture/video editing.
Display Response Times
| ↔ Response Time Black to White | ||
|---|---|---|
| 9.2 ms ... rise ↗ and fall ↘ combined | ↗ 4.4 ms rise | 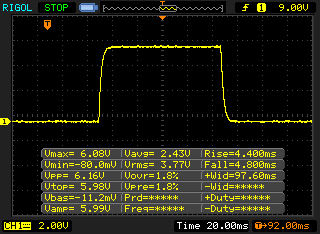 |
| ↘ 4.8 ms fall | ||
| The screen shows fast response rates in our tests and should be suited for gaming. In comparison, all tested devices range from 0.1 (minimum) to 240 (maximum) ms. » 25 % of all devices are better. This means that the measured response time is better than the average of all tested devices (20.1 ms). | ||
| ↔ Response Time 50% Grey to 80% Grey | ||
| 13.6 ms ... rise ↗ and fall ↘ combined | ↗ 6.8 ms rise | 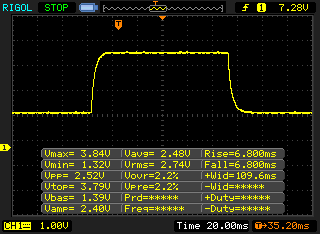 |
| ↘ 6.8 ms fall | ||
| The screen shows good response rates in our tests, but may be too slow for competitive gamers. In comparison, all tested devices range from 0.165 (minimum) to 636 (maximum) ms. » 26 % of all devices are better. This means that the measured response time is better than the average of all tested devices (31.4 ms). | ||
Screen Flickering / PWM (Pulse-Width Modulation)
| Screen flickering / PWM not detected | 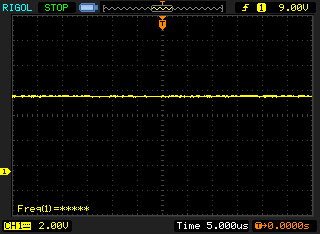 | ||
In comparison: 53 % of all tested devices do not use PWM to dim the display. If PWM was detected, an average of 8002 (minimum: 5 - maximum: 343500) Hz was measured. | |||
You can also use the Legion 5 15 outdoors thanks to the matte display. Very bright environments can be too challenging, but you can at least still see content when you avoid direct sunlight. We recommend a place in the shade for comfortable working/gaming experience though. The viewing angle stability of the IPS screen is very good.
Performance - Lenovo uses fast AMD Ryzen 7
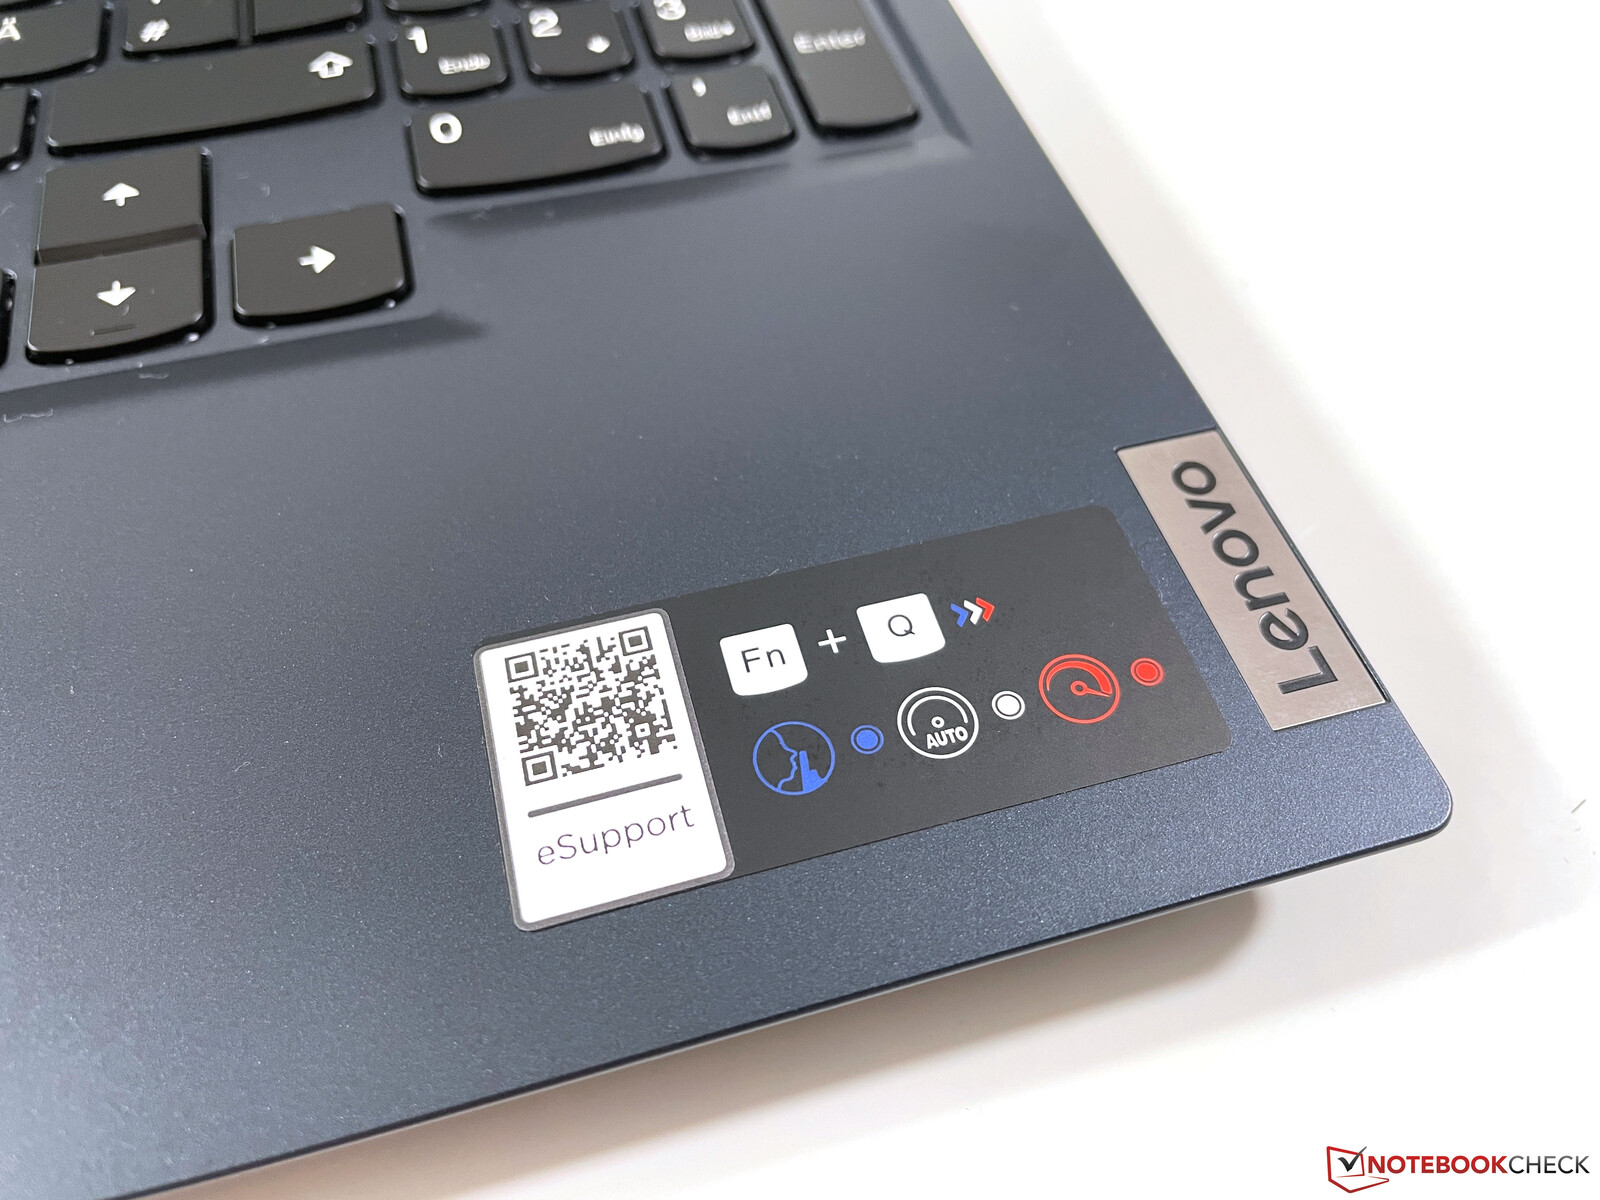
Lenovo implements three performance modes independent of the regular Windows settings. They can either be switched in the manufacturer’s own Vantage app or comfortably via key combination (Fn+Q). The current mode is displayed by the color of the status LED inside the power button (blue: Eco, white: Auto, red: Ultra). We have listed the TDP configuration of each mode in the table below. We used the Ultra performance mode for all our benchmarks. You can only use the modes Auto and Eco when you are running on battery power.
| Performance mode | CPU load | GPU load | combined CPU/GPU load |
|---|---|---|---|
| Ultra | 80 -> 75 | 130 | 62 -> 45 (CPU) & 115 (GPU) |
| Auto | 65 -> 54 -> 45 | 95 | 54 -> 45 (CPU) & 80 (GPU) |
| Eco | 38 -> 25 | 80 | 36 -> 25 (CPU) & 80 (GPU) |
The Vantage app also offers the option hybrid mode, which enables graphics switching between the iGPU and dGPU. However, this caused problems during our review (more on that later), so we deactivated the hybrid mode for our benchmarks and measurements.
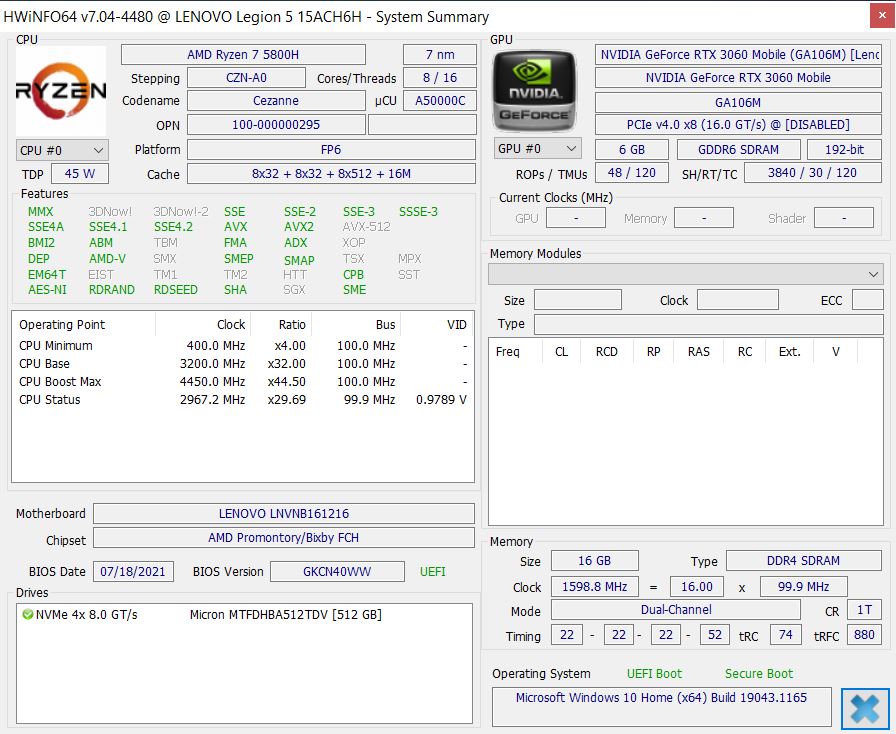
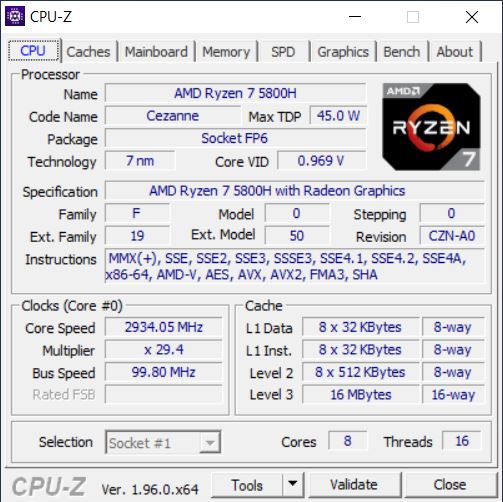
Processor - Ryzen 7 5800H
Our test unit is powered by the current AMD processor Ryzen 7 5800H, which offers a very high performance with its 8 cores (16 threads) and it is a very good chip for gaming. The performance is stable even under sustained workloads and overall it is slightly ahead of the competing Core i7-11800H, even though you will not notice any differences in practice. However, the Ryzen chip is a bit more efficient at the same performance.
The power consumption of the CPU is reduced on battery power and you have to expect a deficit of ~19% (Auto @35W TDP) or ~38% (Eco @19W TDP), respectively. More CPU benchmarks are available in our Tech section.
Cinebench R15 Multi Loop
Cinebench R20: CPU (Single Core) | CPU (Multi Core)
Cinebench R15: CPU Single 64Bit | CPU Multi 64Bit
Blender: v2.79 BMW27 CPU
7-Zip 18.03: 7z b 4 -mmt1 | 7z b 4
Geekbench 5.5: Single-Core | Multi-Core
HWBOT x265 Benchmark v2.2: 4k Preset
LibreOffice : 20 Documents To PDF
R Benchmark 2.5: Overall mean
| Cinebench R23 / Single Core | |
| Average of class Gaming (1166 - 2267, n=131, last 2 years) | |
| Asus TUF Gaming F15 FX506HM | |
| Acer Nitro 5 AN515-45-R1JH | |
| Alienware m15 R5 Ryzen Edition | |
| Lenovo Legion 5 15ACH-82JU00C6GE-FL | |
| Average AMD Ryzen 7 5800H (1294 - 1441, n=29) | |
| Schenker XMG Core 15 Ampere | |
| Cinebench R23 / Multi Core | |
| Average of class Gaming (9107 - 40970, n=131, last 2 years) | |
| Asus TUF Gaming F15 FX506HM | |
| Lenovo Legion 5 15ACH-82JU00C6GE-FL | |
| Alienware m15 R5 Ryzen Edition | |
| Acer Nitro 5 AN515-45-R1JH | |
| Average AMD Ryzen 7 5800H (8812 - 13214, n=29) | |
| Schenker XMG Core 15 Ampere | |
| Cinebench R20 / CPU (Single Core) | |
| Average of class Gaming (442 - 870, n=130, last 2 years) | |
| Asus TUF Gaming F15 FX506HM | |
| Alienware m15 R5 Ryzen Edition | |
| Acer Nitro 5 AN515-45-R1JH | |
| Lenovo Legion 5 15ACH-82JU00C6GE-FL | |
| Average AMD Ryzen 7 5800H (502 - 560, n=30) | |
| Schenker XMG Core 15 Ampere | |
| Cinebench R20 / CPU (Multi Core) | |
| Average of class Gaming (3504 - 16108, n=130, last 2 years) | |
| Asus TUF Gaming F15 FX506HM | |
| Lenovo Legion 5 15ACH-82JU00C6GE-FL | |
| Alienware m15 R5 Ryzen Edition | |
| Acer Nitro 5 AN515-45-R1JH | |
| Average AMD Ryzen 7 5800H (3430 - 5020, n=31) | |
| Schenker XMG Core 15 Ampere | |
| Cinebench R15 / CPU Single 64Bit | |
| Average of class Gaming (188.8 - 343, n=130, last 2 years) | |
| Alienware m15 R5 Ryzen Edition | |
| Acer Nitro 5 AN515-45-R1JH | |
| Asus TUF Gaming F15 FX506HM | |
| Average AMD Ryzen 7 5800H (209 - 234, n=29) | |
| Lenovo Legion 5 15ACH-82JU00C6GE-FL | |
| Schenker XMG Core 15 Ampere | |
| Cinebench R15 / CPU Multi 64Bit | |
| Average of class Gaming (1537 - 6271, n=131, last 2 years) | |
| Lenovo Legion 5 15ACH-82JU00C6GE-FL | |
| Asus TUF Gaming F15 FX506HM | |
| Alienware m15 R5 Ryzen Edition | |
| Acer Nitro 5 AN515-45-R1JH | |
| Average AMD Ryzen 7 5800H (1487 - 2119, n=28) | |
| Schenker XMG Core 15 Ampere | |
| Blender / v2.79 BMW27 CPU | |
| Average AMD Ryzen 7 5800H (237 - 340, n=29) | |
| Acer Nitro 5 AN515-45-R1JH | |
| Alienware m15 R5 Ryzen Edition | |
| Schenker XMG Core 15 Ampere | |
| Lenovo Legion 5 15ACH-82JU00C6GE-FL | |
| Asus TUF Gaming F15 FX506HM | |
| Average of class Gaming (80 - 334, n=127, last 2 years) | |
| 7-Zip 18.03 / 7z b 4 -mmt1 | |
| Average of class Gaming (4199 - 7508, n=128, last 2 years) | |
| Asus TUF Gaming F15 FX506HM | |
| Alienware m15 R5 Ryzen Edition | |
| Acer Nitro 5 AN515-45-R1JH | |
| Average AMD Ryzen 7 5800H (5038 - 5632, n=29) | |
| Lenovo Legion 5 15ACH-82JU00C6GE-FL | |
| Schenker XMG Core 15 Ampere | |
| 7-Zip 18.03 / 7z b 4 | |
| Average of class Gaming (33491 - 148086, n=128, last 2 years) | |
| Average AMD Ryzen 7 5800H (45773 - 59986, n=28) | |
| Acer Nitro 5 AN515-45-R1JH | |
| Alienware m15 R5 Ryzen Edition | |
| Lenovo Legion 5 15ACH-82JU00C6GE-FL | |
| Schenker XMG Core 15 Ampere | |
| Asus TUF Gaming F15 FX506HM | |
| Geekbench 5.5 / Single-Core | |
| Average of class Gaming (986 - 2474, n=128, last 2 years) | |
| Alienware m15 R5 Ryzen Edition | |
| Lenovo Legion 5 15ACH-82JU00C6GE-FL | |
| Acer Nitro 5 AN515-45-R1JH | |
| Average AMD Ryzen 7 5800H (1336 - 1505, n=28) | |
| Schenker XMG Core 15 Ampere | |
| Geekbench 5.5 / Multi-Core | |
| Average of class Gaming (5847 - 27010, n=128, last 2 years) | |
| Schenker XMG Core 15 Ampere | |
| Average AMD Ryzen 7 5800H (6551 - 9062, n=28) | |
| Alienware m15 R5 Ryzen Edition | |
| Lenovo Legion 5 15ACH-82JU00C6GE-FL | |
| Acer Nitro 5 AN515-45-R1JH | |
| HWBOT x265 Benchmark v2.2 / 4k Preset | |
| Average of class Gaming (11 - 44.3, n=128, last 2 years) | |
| Asus TUF Gaming F15 FX506HM | |
| Lenovo Legion 5 15ACH-82JU00C6GE-FL | |
| Alienware m15 R5 Ryzen Edition | |
| Acer Nitro 5 AN515-45-R1JH | |
| Average AMD Ryzen 7 5800H (11.6 - 16.1, n=29) | |
| Schenker XMG Core 15 Ampere | |
| LibreOffice / 20 Documents To PDF | |
| Lenovo Legion 5 15ACH-82JU00C6GE-FL | |
| Acer Nitro 5 AN515-45-R1JH | |
| Average AMD Ryzen 7 5800H (47.4 - 113, n=29) | |
| Schenker XMG Core 15 Ampere | |
| Alienware m15 R5 Ryzen Edition | |
| Average of class Gaming (19 - 88.8, n=128, last 2 years) | |
| Asus TUF Gaming F15 FX506HM | |
| R Benchmark 2.5 / Overall mean | |
| Schenker XMG Core 15 Ampere | |
| Asus TUF Gaming F15 FX506HM | |
| Lenovo Legion 5 15ACH-82JU00C6GE-FL | |
| Average AMD Ryzen 7 5800H (0.511 - 0.559, n=28) | |
| Alienware m15 R5 Ryzen Edition | |
| Acer Nitro 5 AN515-45-R1JH | |
| Average of class Gaming (0.3439 - 0.759, n=129, last 2 years) | |
* ... smaller is better
System Performance
We noticed stutters during our review when the system would switch between the integrated and the dedicated graphics card. It takes about a second before the system will respond and you can also hear the Windows notification sound for the switching of the graphics adapters. This behavior is very annoying and could only be prevented by deactivating the hybrid mode in Lenovo’s Vantage app and therefore avoid the integrated AMD iGPU. You will lose efficiency, but the system now runs extremely smooth and without the stutters. Lenovo will hopefully offer an update to fix the problem.
| PCMark 10 / Score | |
| Average of class Gaming (5828 - 10060, n=110, last 2 years) | |
| Asus TUF Gaming F15 FX506HM | |
| Acer Nitro 5 AN515-45-R1JH | |
| Average AMD Ryzen 7 5800H, NVIDIA GeForce RTX 3060 Laptop GPU (6465 - 6855, n=6) | |
| Lenovo Legion 5 15ACH-82JU00C6GE-FL | |
| Alienware m15 R5 Ryzen Edition | |
| Schenker XMG Core 15 Ampere | |
| PCMark 10 / Essentials | |
| Average of class Gaming (8810 - 12600, n=114, last 2 years) | |
| Asus TUF Gaming F15 FX506HM | |
| Lenovo Legion 5 15ACH-82JU00C6GE-FL | |
| Average AMD Ryzen 7 5800H, NVIDIA GeForce RTX 3060 Laptop GPU (9589 - 10414, n=6) | |
| Acer Nitro 5 AN515-45-R1JH | |
| Alienware m15 R5 Ryzen Edition | |
| Schenker XMG Core 15 Ampere | |
| PCMark 10 / Productivity | |
| Average of class Gaming (6662 - 16716, n=112, last 2 years) | |
| Lenovo Legion 5 15ACH-82JU00C6GE-FL | |
| Acer Nitro 5 AN515-45-R1JH | |
| Average AMD Ryzen 7 5800H, NVIDIA GeForce RTX 3060 Laptop GPU (8798 - 9728, n=6) | |
| Alienware m15 R5 Ryzen Edition | |
| Asus TUF Gaming F15 FX506HM | |
| Schenker XMG Core 15 Ampere | |
| PCMark 10 / Digital Content Creation | |
| Average of class Gaming (7505 - 19351, n=112, last 2 years) | |
| Asus TUF Gaming F15 FX506HM | |
| Acer Nitro 5 AN515-45-R1JH | |
| Average AMD Ryzen 7 5800H, NVIDIA GeForce RTX 3060 Laptop GPU (7884 - 9497, n=6) | |
| Alienware m15 R5 Ryzen Edition | |
| Schenker XMG Core 15 Ampere | |
| Lenovo Legion 5 15ACH-82JU00C6GE-FL | |
| PCMark 10 Score | 6648 points | |
Help | ||
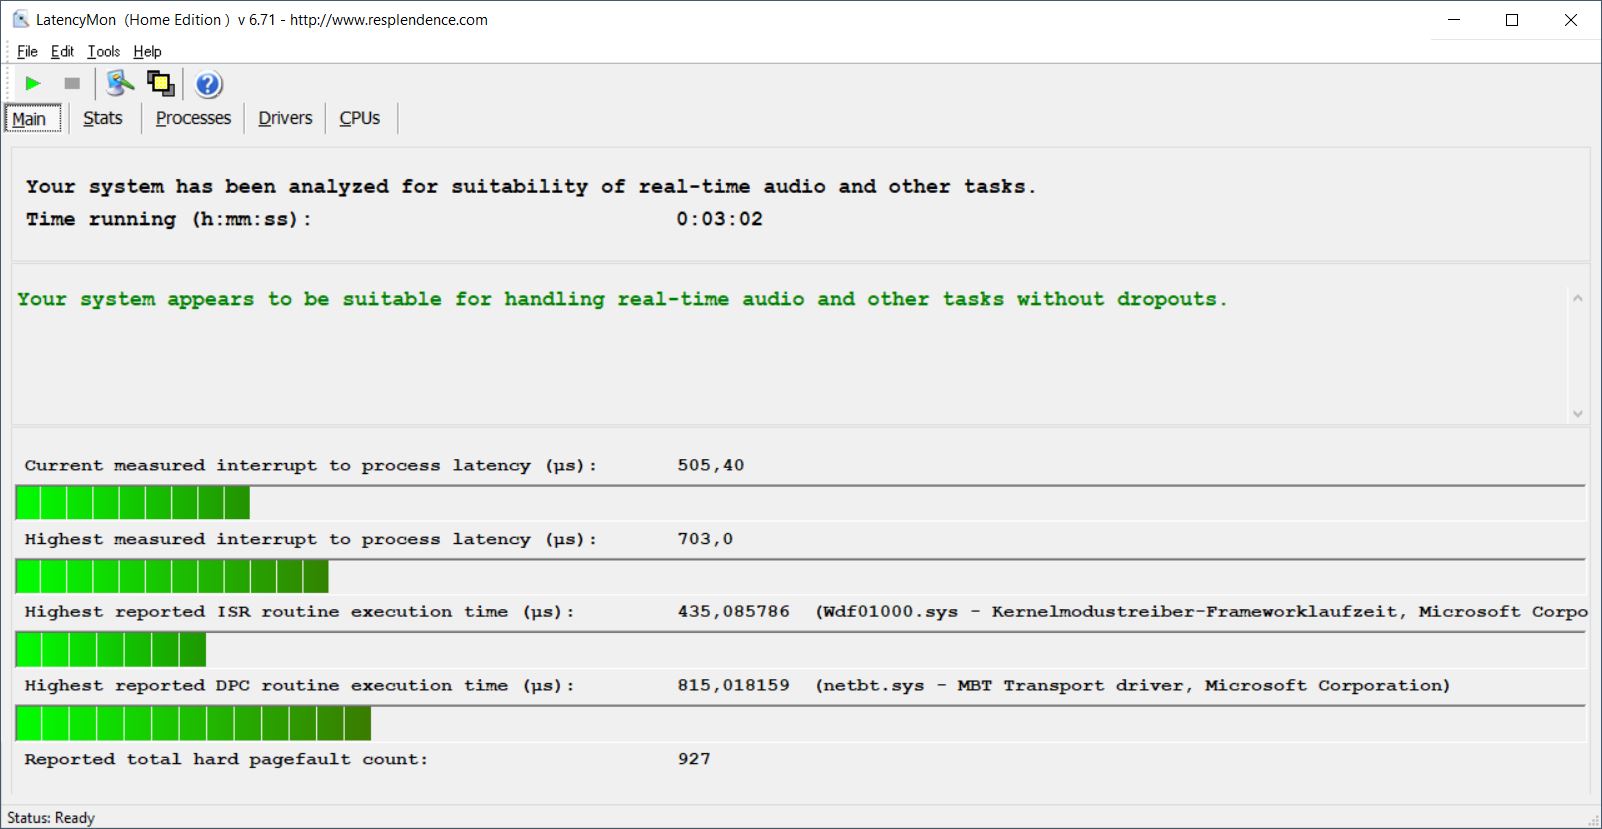
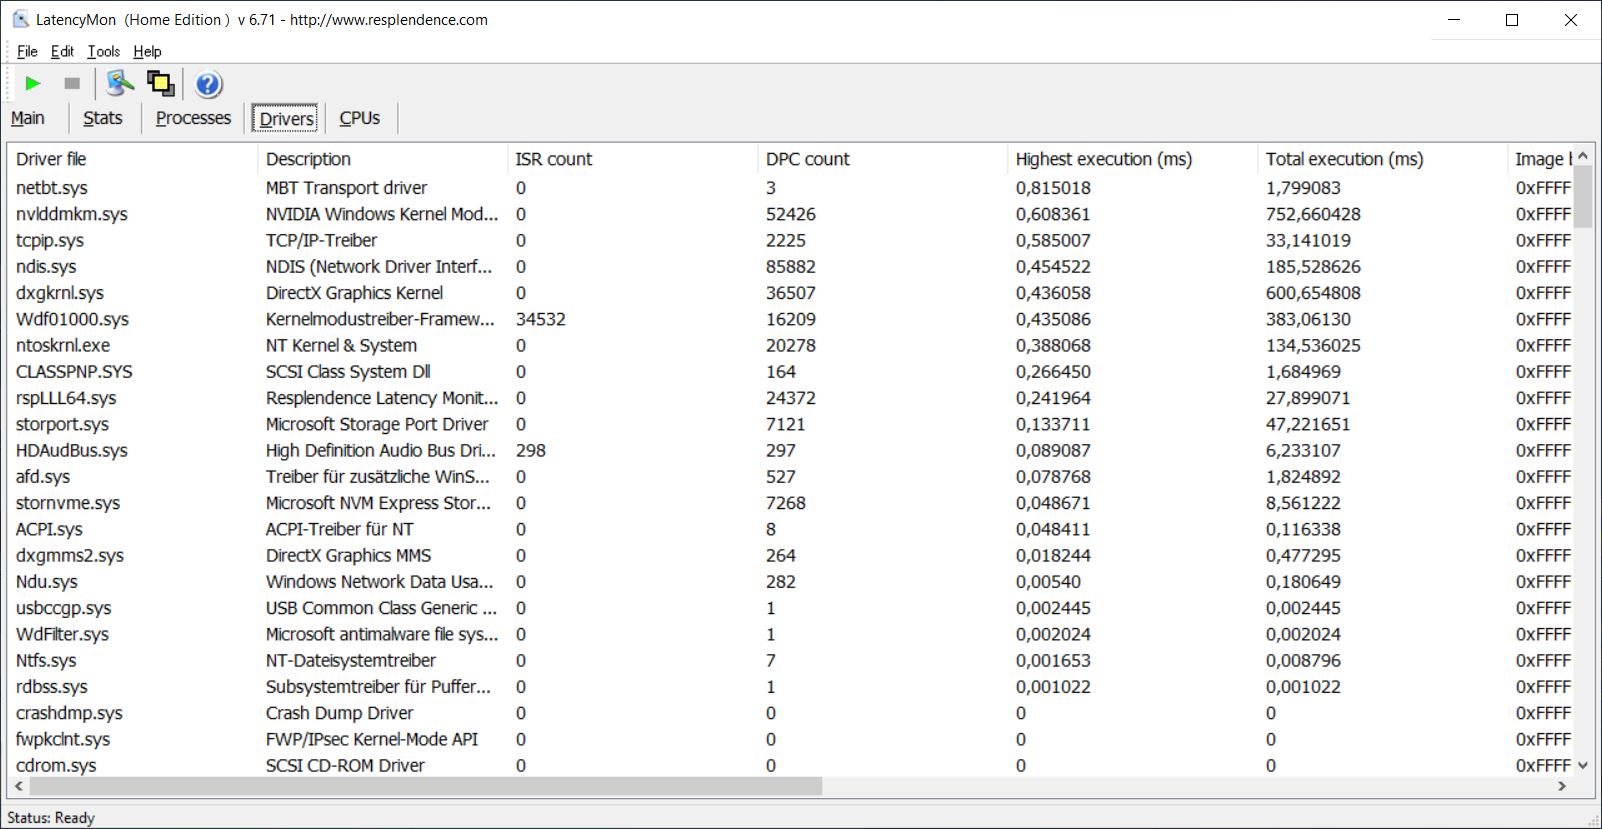
DPC Latency
The Legion 5 does not show any problems in our standardized DPC latency test (web browsing, YouTube 4K playback, CPU load) and it is therefore suited for real-time audio applications. We noticed some dropped frames when we used the Nvidia GPU and the video decoder is not very efficient, either (~60% GPU load). For comparison: The iGPU of the Ryzen processor only shows 9% load for the same task and has no problems with dropped frames.
| DPC Latencies / LatencyMon - interrupt to process latency (max), Web, Youtube, Prime95 | |
| Asus TUF Gaming F15 FX506HM | |
| Lenovo Legion 5 15ACH-82JU00C6GE-FL | |
| Schenker XMG Core 15 Ampere | |
| Alienware m15 R5 Ryzen Edition | |
| Acer Nitro 5 AN515-45-R1JH | |
* ... smaller is better
Storage Devices
Lenovo equips our review unit with a fast NVMe-SSD (PCIe 3.0 x4) from Micron with a storage capacity of 512 GB and you can use around 436 GB for your own files after the initial setup. The transfer rates are very good and except for the capacity, which can quickly become a limiting factor when you have a comprehensive games library, there is no reason to change the drive. More SSD benchmarks are available in our Tech section.
| Lenovo Legion 5 15ACH-82JU00C6GE-FL Micron 2300 512GB MTFDHBA512TDV | Acer Nitro 5 AN515-45-R1JH WDC PC SN530 SDBPNPZ-1T00 | Asus TUF Gaming F15 FX506HM SK Hynix HFM001TD3JX013N | Alienware m15 R5 Ryzen Edition Toshiba KBG40ZNS512G NVMe | Schenker XMG Core 15 Ampere Samsung SSD 970 EVO Plus 1TB | Average Micron 2300 512GB MTFDHBA512TDV | |
|---|---|---|---|---|---|---|
| CrystalDiskMark 5.2 / 6 | -13% | 0% | -25% | 4% | -12% | |
| Write 4K (MB/s) | 124.6 | 161.3 29% | 168.1 35% | 116.9 -6% | 139.1 12% | 105.5 ? -15% |
| Read 4K (MB/s) | 54.2 | 49.49 -9% | 65.1 20% | 44.56 -18% | 47.59 -12% | 51.2 ? -6% |
| Write Seq (MB/s) | 2706 | 1970 -27% | 2124 -22% | 1552 -43% | 2917 8% | 2041 ? -25% |
| Read Seq (MB/s) | 2298 | 2007 -13% | 2204 -4% | 1682 -27% | 2586 13% | 1845 ? -20% |
| Write 4K Q32T1 (MB/s) | 499.7 | 416.8 -17% | 455.3 -9% | 497.8 0% | 511 2% | 494 ? -1% |
| Read 4K Q32T1 (MB/s) | 570 | 554 -3% | 465.6 -18% | 436.8 -23% | 571 0% | 445 ? -22% |
| Write Seq Q32T1 (MB/s) | 2999 | 1965 -34% | 2911 -3% | 1461 -51% | 3263 9% | 2867 ? -4% |
| Read Seq Q32T1 (MB/s) | 3461 | 2369 -32% | 3519 2% | 2364 -32% | 3567 3% | 3272 ? -5% |
| AS SSD | -35% | 9% | -34% | 28% | -21% | |
| Seq Read (MB/s) | 2960 | 2217 -25% | 2873 -3% | 2082 -30% | 2829 -4% | 2300 ? -22% |
| Seq Write (MB/s) | 2586 | 1929 -25% | 1619 -37% | 825 -68% | 2646 2% | 1550 ? -40% |
| 4K Read (MB/s) | 46.84 | 28.71 -39% | 57.5 23% | 42.41 -9% | 54.8 17% | 45 ? -4% |
| 4K Write (MB/s) | 96.1 | 146.3 52% | 149.6 56% | 98.3 2% | 179.1 86% | 106.6 ? 11% |
| 4K-64 Read (MB/s) | 854 | 215.9 -75% | 1252 47% | 1255 47% | 1734 103% | 676 ? -21% |
| 4K-64 Write (MB/s) | 2015 | 1475 -27% | 2196 9% | 738 -63% | 2396 19% | 1616 ? -20% |
| Access Time Read * (ms) | 0.048 | 0.04 17% | 0.109 -127% | 0.033 31% | 0.059 ? -23% | |
| Access Time Write * (ms) | 0.094 | 0.105 -12% | 0.082 13% | 0.17 -81% | 0.021 78% | 0.1807 ? -92% |
| Score Read (Points) | 1197 | 466 -61% | 1597 33% | 1506 26% | 2072 73% | 952 ? -20% |
| Score Write (Points) | 2370 | 814 -66% | 2508 6% | 918 -61% | 2839 20% | 1877 ? -21% |
| Score Total (Points) | 4170 | 2513 -40% | 4869 17% | 3136 -25% | 5965 43% | 3290 ? -21% |
| Copy ISO MB/s (MB/s) | 2064 | 1698 -18% | 1583 -23% | 1391 -33% | 2119 3% | 1603 ? -22% |
| Copy Program MB/s (MB/s) | 873 | 284.7 -67% | 964 10% | 645 -26% | 406.1 -53% | 843 ? -3% |
| Copy Game MB/s (MB/s) | 1503 | 786 -48% | 943 -37% | 1101 -27% | 1086 -28% | 1570 ? 4% |
| Total Average (Program / Settings) | -24% /
-27% | 5% /
6% | -30% /
-31% | 16% /
19% | -17% /
-18% |
* ... smaller is better

Disk Throttling: DiskSpd Read Loop, Queue Depth 8
GPU Performance - RTX 3060 with 130 Watts
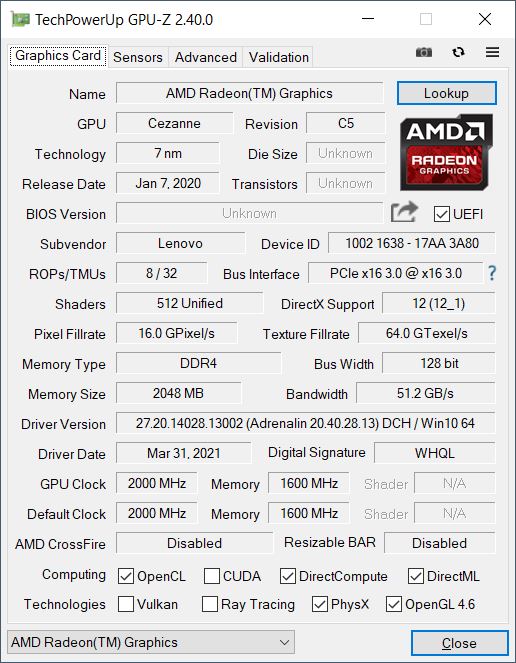
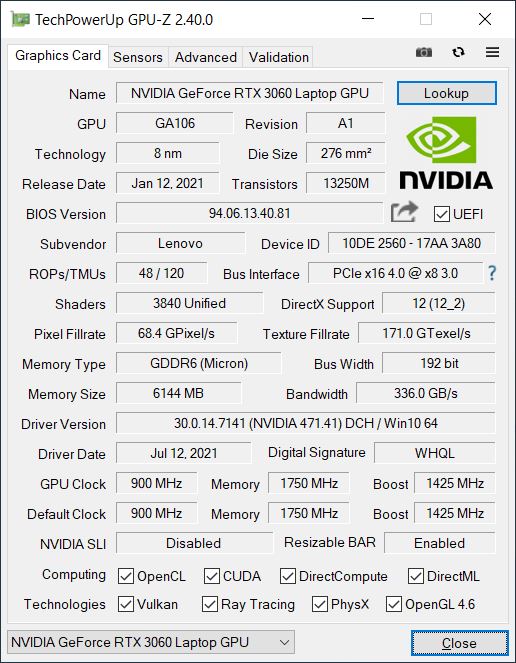
Nvidia’s GeForce RTX 3060 is a powerful graphics card and Lenovo uses the fastest model with a TGP of up to 130 Watts and a maximum core clock of 1935 MHz. Thanks to the high TGP, the results in the synthetic benchmarks are excellent and sometimes even ahead of laptops with slower versions of the RTX 3070. The advantage over the old Legion 5 15 with the RTX 2060 Mobile is around 30-40% depending on the benchmark.
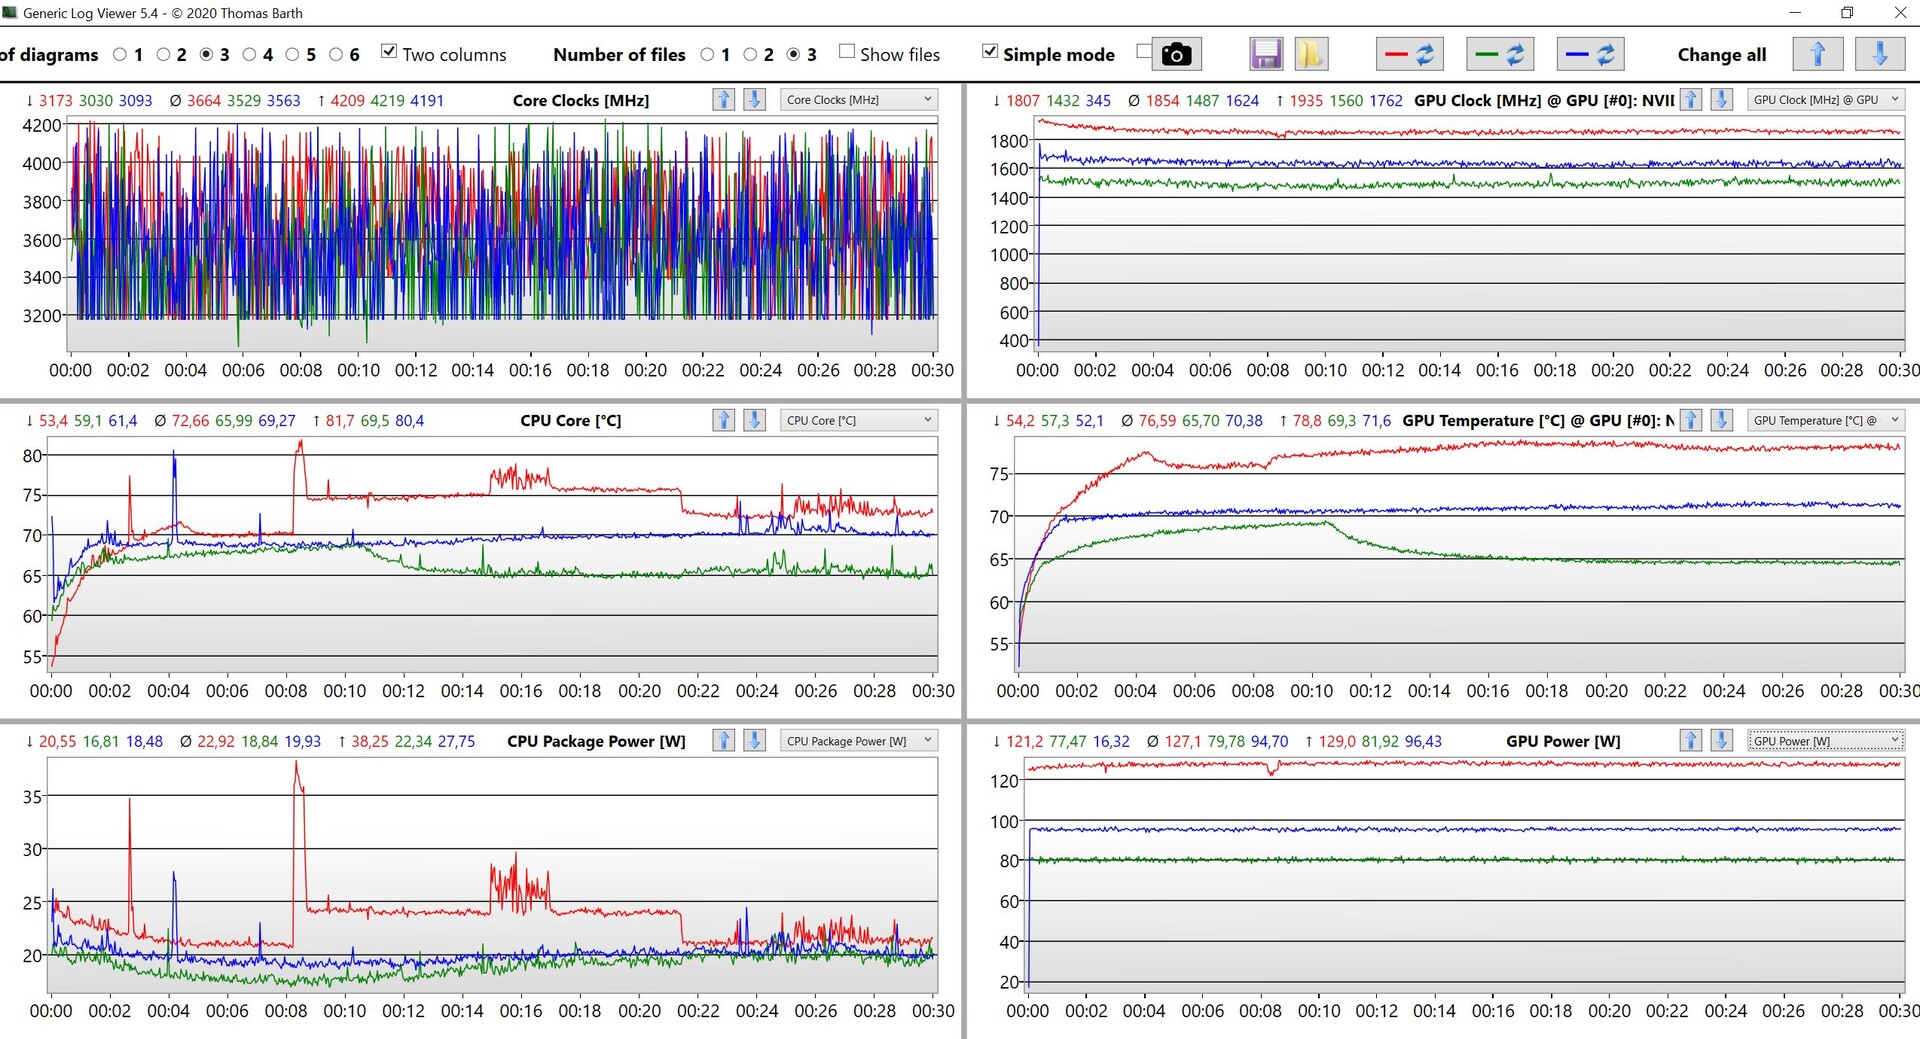
The performance is stable under sustained workloads (in all performance modes), but the GPU is heavily throttled on battery power (see table below). More GPU benchmarks are available here.
| Performance mode | Time Spy Graphics | Difference |
|---|---|---|
| Ultra | 8844 points | / |
| Auto | 7708 points | -13% |
| Eco | 7171 points | -19% |
| Auto (battery) | 2076 points | -76% |
| Eco (battery) | 734 points | -92% |
| 3DMark 11 Performance | 23146 points | |
| 3DMark Cloud Gate Standard Score | 53687 points | |
| 3DMark Fire Strike Score | 19980 points | |
| 3DMark Time Spy Score | 8863 points | |
Help | ||
Gaming Performance
The gaming performance of the Legion 5 15 is very good and even demanding titles runs smoothly at the highest settings. We would recommend the optional RTX 3070 (140W) if you want the optional WQHD panel, though. You will get the highest fps numbers with the Ultra performance mode, but we recommend you check if the other performance modes are sufficient as well so you can benefit from quieter fans. Our Witcher 3 long-term test shows that the fps numbers are lower, but the behavior is identical. The performance is significantly lower on battery power (Witcher 3 Ultra only 22 fps), so you would have to reduce the details. More gaming benchmarks with the RTX 3060 are available here.
| F1 2020 | |
| 1920x1080 Ultra High Preset AA:T AF:16x | |
| Lenovo Legion 5 15ACH-82JU00C6GE-FL | |
| Alienware m15 R5 Ryzen Edition | |
| Average NVIDIA GeForce RTX 3060 Laptop GPU (97.6 - 142, n=7) | |
| 1920x1080 High Preset AA:T AF:16x | |
| Lenovo Legion 5 15ACH-82JU00C6GE-FL | |
| Average NVIDIA GeForce RTX 3060 Laptop GPU (138 - 193, n=7) | |
| Alienware m15 R5 Ryzen Edition | |
| 1920x1080 Medium Preset AF:16x | |
| Lenovo Legion 5 15ACH-82JU00C6GE-FL | |
| Average NVIDIA GeForce RTX 3060 Laptop GPU (150 - 204, n=6) | |
| Alienware m15 R5 Ryzen Edition | |
| 1280x720 Ultra Low Preset | |
| Lenovo Legion 5 15ACH-82JU00C6GE-FL | |
| Average NVIDIA GeForce RTX 3060 Laptop GPU (215 - 260, n=6) | |
| Alienware m15 R5 Ryzen Edition | |
Witcher 3 FPS Diagram
| low | med. | high | ultra | |
|---|---|---|---|---|
| GTA V (2015) | 170 | 164 | 142 | 81.3 |
| The Witcher 3 (2015) | 280 | 216 | 146 | 67 |
| Dota 2 Reborn (2015) | 124 | 128 | 106 | 102 |
| Final Fantasy XV Benchmark (2018) | 151 | 106 | 78.9 | |
| X-Plane 11.11 (2018) | 87.1 | 80.7 | 66.2 | |
| Far Cry 5 (2018) | 102 | 88 | 85 | 80 |
| F1 2020 (2020) | 243 | 200 | 183 | 131 |
| Cyberpunk 2077 1.0 (2020) | 101 | 81 | 68 | 58 |
| F1 2021 (2021) | 236 | 210 | 179 | 67 |
Emissions - Good cooling, but loud fans
System Noise
The two fans are running all the time, independent of the power settings (also on battery power) and you can hear the murmur in quiet environments. We would have liked to see deactivated fans, especially in Eco mode. They are at least pretty quiet in Eco mode even under load; pure CPU load does not result in louder fans, and we can measure around 43 dB(A) after two minutes of GPU load. Gaming in Auto mode will result in 48-53.5 dB(A), which is also the noise level you reach in the Ultra mode. Both the Auto as well as the Ultra performance mode result in very loud fans and we definitely recommend headphones, otherwise you will not hear the gaming sound. We did not detect any electronic noises.
Noise level
| Idle |
| 29 / 29 / 29 dB(A) |
| Load |
| 53.5 / 53.5 dB(A) |
 | ||
30 dB silent 40 dB(A) audible 50 dB(A) loud |
||
min: | ||
| Lenovo Legion 5 15ACH-82JU00C6GE-FL GeForce RTX 3060 Laptop GPU, R7 5800H, Micron 2300 512GB MTFDHBA512TDV | Acer Nitro 5 AN515-45-R1JH GeForce RTX 3070 Laptop GPU, R7 5800H, WDC PC SN530 SDBPNPZ-1T00 | Asus TUF Gaming F15 FX506HM GeForce RTX 3060 Laptop GPU, i7-11800H, SK Hynix HFM001TD3JX013N | Alienware m15 R5 Ryzen Edition GeForce RTX 3060 Laptop GPU, R7 5800H, Toshiba KBG40ZNS512G NVMe | Schenker XMG Core 15 Ampere GeForce RTX 3060 Laptop GPU, R7 4800H, Samsung SSD 970 EVO Plus 1TB | |
|---|---|---|---|---|---|
| Noise | 6% | 16% | 7% | 6% | |
| off / environment * (dB) | 24.2 | 25 -3% | 24.8 -2% | 24 1% | 24 1% |
| Idle Minimum * (dB) | 29 | 25 14% | 24.6 15% | 24 17% | 26 10% |
| Idle Average * (dB) | 29 | 25 14% | 24.9 14% | 25 14% | 28 3% |
| Idle Maximum * (dB) | 29 | 32.2 -11% | 24.9 14% | 35 -21% | 30 -3% |
| Load Average * (dB) | 53.5 | 45.8 14% | 27.1 49% | 44 18% | 42 21% |
| Witcher 3 ultra * (dB) | 53.5 | 46.4 13% | 48 10% | 50 7% | |
| Load Maximum * (dB) | 53.5 | 49.1 8% | 49 8% | 50 7% | 52 3% |
* ... smaller is better
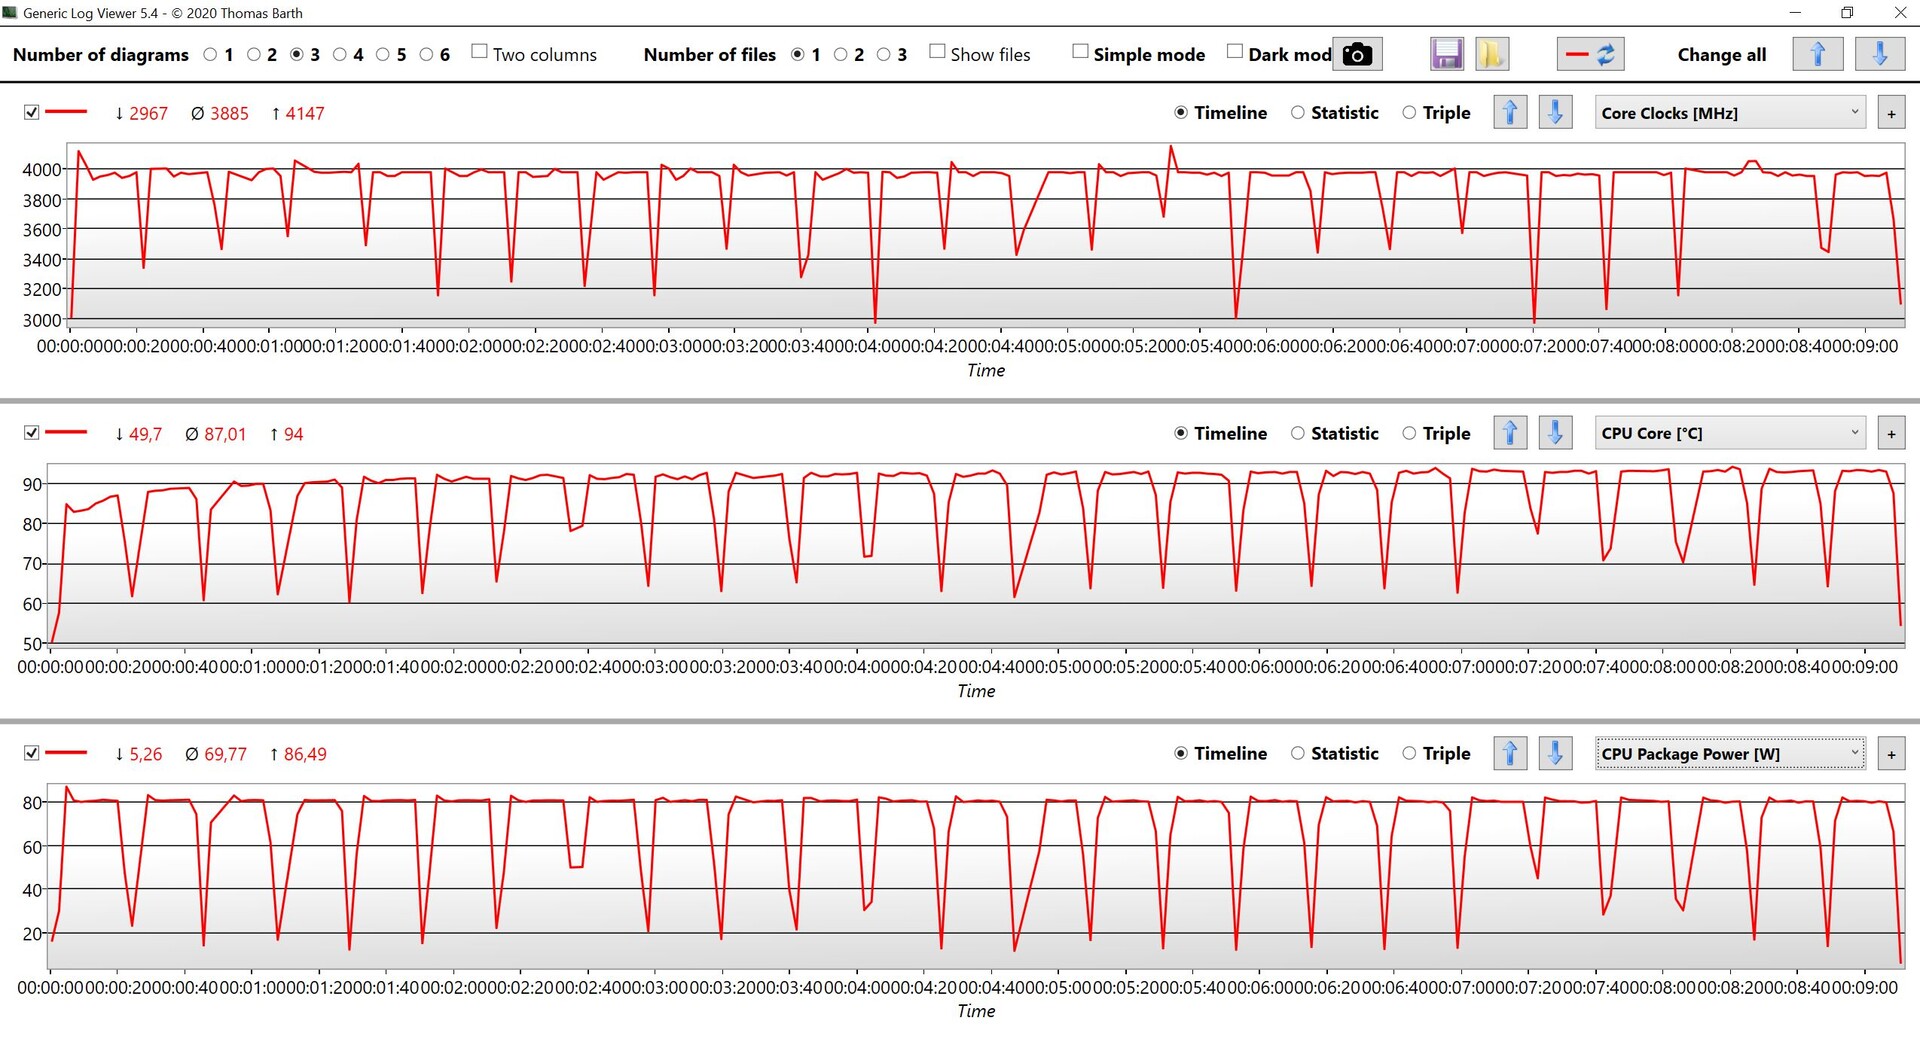
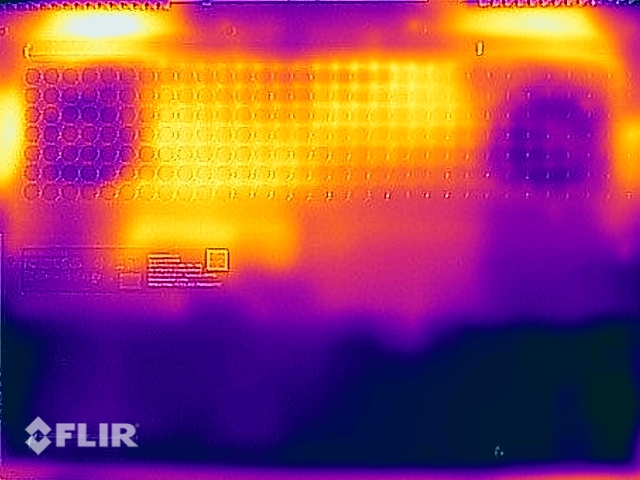
Temperature
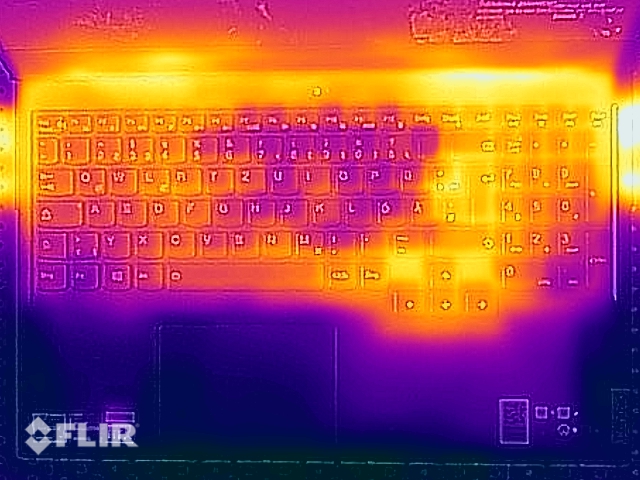
The cooling solution is working pretty hard, but there are no temperature problems in return. There is only one spot during gaming (bottom left) where we measure around 50 °C. This means you should not put it on your lap, but this is not very likely for such a big laptop anyway. The top of the base unit is pretty cool and there are no limitations when you use the keyboard.
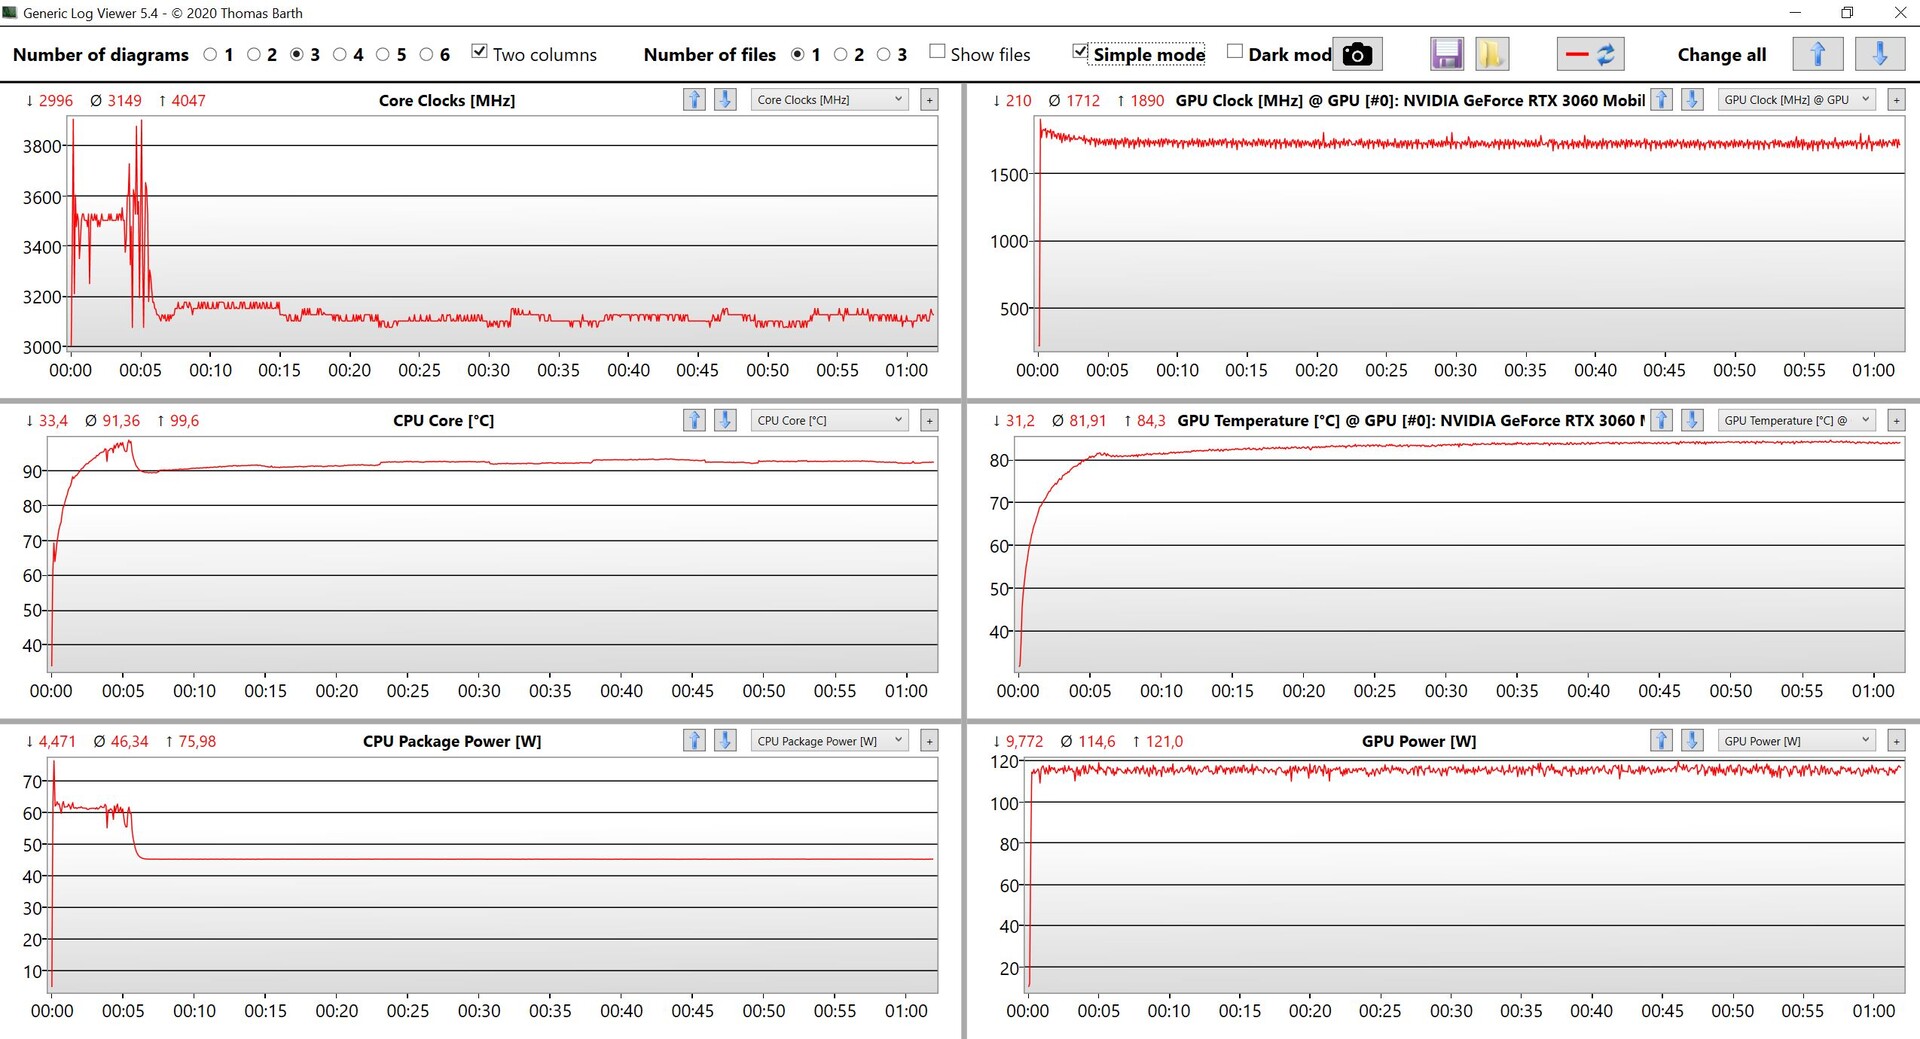
The Legion 5 15 cannot keep up the high performance figures during the stress test with Prime95 and FurMark, but the system still handles it very well. The processor drops from 60 to 45W after ~5 minutes and the graphics card is limited to 115W, and there is no further drop over the course of the test. This means there are no performance issues even in very demanding scenarios.
(±) The maximum temperature on the upper side is 42.6 °C / 109 F, compared to the average of 40.4 °C / 105 F, ranging from 21.2 to 68.8 °C for the class Gaming.
(-) The bottom heats up to a maximum of 52.2 °C / 126 F, compared to the average of 43.3 °C / 110 F
(+) In idle usage, the average temperature for the upper side is 24.2 °C / 76 F, compared to the device average of 33.9 °C / 93 F.
(±) Playing The Witcher 3, the average temperature for the upper side is 34.8 °C / 95 F, compared to the device average of 33.9 °C / 93 F.
(+) The palmrests and touchpad are reaching skin temperature as a maximum (34.8 °C / 94.6 F) and are therefore not hot.
(-) The average temperature of the palmrest area of similar devices was 28.8 °C / 83.8 F (-6 °C / -10.8 F).
Speakers
The speaker system (2x 2W) could have been better; there is hardly any bass and the overall sound quality is just average. They are sufficient for videos and some background music, but we definitely recommend external speakers or headphones for blockbuster movies. The speakers are also pretty useless during gaming since the fans are way too loud.
Lenovo Legion 5 15ACH-82JU00C6GE-FL audio analysis
(±) | speaker loudness is average but good (81 dB)
Bass 100 - 315 Hz
(-) | nearly no bass - on average 22.1% lower than median
(±) | linearity of bass is average (11.4% delta to prev. frequency)
Mids 400 - 2000 Hz
(+) | balanced mids - only 4.5% away from median
(+) | mids are linear (5% delta to prev. frequency)
Highs 2 - 16 kHz
(+) | balanced highs - only 2.9% away from median
(+) | highs are linear (4.5% delta to prev. frequency)
Overall 100 - 16.000 Hz
(±) | linearity of overall sound is average (17.8% difference to median)
Compared to same class
» 53% of all tested devices in this class were better, 10% similar, 38% worse
» The best had a delta of 6%, average was 18%, worst was 132%
Compared to all devices tested
» 35% of all tested devices were better, 8% similar, 57% worse
» The best had a delta of 4%, average was 24%, worst was 134%
Acer Nitro 5 AN515-45-R1JH audio analysis
(±) | speaker loudness is average but good (75.5 dB)
Bass 100 - 315 Hz
(-) | nearly no bass - on average 33.4% lower than median
(±) | linearity of bass is average (12.8% delta to prev. frequency)
Mids 400 - 2000 Hz
(+) | balanced mids - only 3.4% away from median
(±) | linearity of mids is average (8.6% delta to prev. frequency)
Highs 2 - 16 kHz
(±) | higher highs - on average 5% higher than median
(±) | linearity of highs is average (7.3% delta to prev. frequency)
Overall 100 - 16.000 Hz
(±) | linearity of overall sound is average (25.1% difference to median)
Compared to same class
» 90% of all tested devices in this class were better, 3% similar, 7% worse
» The best had a delta of 6%, average was 18%, worst was 132%
Compared to all devices tested
» 76% of all tested devices were better, 5% similar, 18% worse
» The best had a delta of 4%, average was 24%, worst was 134%
Asus TUF Gaming F15 FX506HM audio analysis
(±) | speaker loudness is average but good (77.1 dB)
Bass 100 - 315 Hz
(±) | reduced bass - on average 13.8% lower than median
(±) | linearity of bass is average (7.9% delta to prev. frequency)
Mids 400 - 2000 Hz
(+) | balanced mids - only 2.9% away from median
(+) | mids are linear (5.9% delta to prev. frequency)
Highs 2 - 16 kHz
(+) | balanced highs - only 1.8% away from median
(+) | highs are linear (2.7% delta to prev. frequency)
Overall 100 - 16.000 Hz
(+) | overall sound is linear (13.1% difference to median)
Compared to same class
» 18% of all tested devices in this class were better, 4% similar, 78% worse
» The best had a delta of 6%, average was 18%, worst was 132%
Compared to all devices tested
» 13% of all tested devices were better, 3% similar, 85% worse
» The best had a delta of 4%, average was 24%, worst was 134%
Energy Management - Battery runtime depends on GPU
Power Consumption
The overall power consumption of the Legion 5 15 is inconspicuous. The maximum consumption under load is ~230W for a brief period, which quickly levels off at around 200W. The 300W power adapter is almost too powerful, but it has one advantage: Lenovo’s Vantage app offers a feature called express charge, which improves the charging performance significantly. The overall charging time is reduced by 40 minutes and 50% of the battery capacity are available after 20 minutes when the device is turned on (80% after 44 minutes).

| Off / Standby | |
| Idle | |
| Load |
|
Key:
min: | |
| Lenovo Legion 5 15ACH-82JU00C6GE-FL R7 5800H, GeForce RTX 3060 Laptop GPU, Micron 2300 512GB MTFDHBA512TDV, , 1920x1080, 15.6" | Acer Nitro 5 AN515-45-R1JH R7 5800H, GeForce RTX 3070 Laptop GPU, WDC PC SN530 SDBPNPZ-1T00, IPS, 2560x1440, 15.6" | Asus TUF Gaming F15 FX506HM i7-11800H, GeForce RTX 3060 Laptop GPU, SK Hynix HFM001TD3JX013N, IPS, 1920x1080, 15.6" | Alienware m15 R5 Ryzen Edition R7 5800H, GeForce RTX 3060 Laptop GPU, Toshiba KBG40ZNS512G NVMe, IPS, 1920x1080, 15.6" | Schenker XMG Core 15 Ampere R7 4800H, GeForce RTX 3060 Laptop GPU, Samsung SSD 970 EVO Plus 1TB, IPS, 2560x1440, 15.6" | Average NVIDIA GeForce RTX 3060 Laptop GPU | Average of class Gaming | |
|---|---|---|---|---|---|---|---|
| Power Consumption | -2% | -8% | -26% | -17% | -21% | -49% | |
| Idle Minimum * (Watt) | 7.3 | 8.8 -21% | 9.5 -30% | 11 -51% | 11 -51% | 10.4 ? -42% | 13.6 ? -86% |
| Idle Average * (Watt) | 10.5 | 13 -24% | 12.1 -15% | 14 -33% | 14 -33% | 14.5 ? -38% | 19.3 ? -84% |
| Idle Maximum * (Watt) | 15.7 | 14.6 7% | 22.5 -43% | 25 -59% | 20 -27% | 21.4 ? -36% | 25.1 ? -60% |
| Load Average * (Watt) | 108 | 133 -23% | 99.5 8% | 123 -14% | 94 13% | 109.3 ? -1% | 110.3 ? -2% |
| Witcher 3 ultra * (Watt) | 175 | 134 23% | 157 10% | 176 -1% | 167 5% | ||
| Load Maximum * (Watt) | 228 | 164 28% | 173.5 24% | 226 1% | 251 -10% | 206 ? 10% | 257 ? -13% |
* ... smaller is better
Power Consumption Witcher 3 / Stress test
Battery Runtime
The 80 Wh battery can manage decent battery runtimes, but it depends on the GPU. When the Nvidia GPU is running and the hybrid mode is deactivated, we record up to 5 hours in our Wi-Fi test and 1:45 hours under maximum load. Competitors with working graphics switching obviously have an advantage in this respect.
If you need longer battery runtimes, you should definitely activate the hybrid mode. In some scenarios, the runtime can even double.
| Scenario | Hybrid Mode activated | Hybrid Mode deactivated |
|---|---|---|
| Wi-Fi test max. brightness | 396 minutes | 262 minutes |
| Wi-Fi test 150 cd/m² | 477 minutes | 290 minutes |
| Video test 150 cd/m² | 537 minutes | 259 minutes |
| Lenovo Legion 5 15ACH-82JU00C6GE-FL R7 5800H, GeForce RTX 3060 Laptop GPU, 80 Wh | Acer Nitro 5 AN515-45-R1JH R7 5800H, GeForce RTX 3070 Laptop GPU, 57.5 Wh | Asus TUF Gaming F15 FX506HM i7-11800H, GeForce RTX 3060 Laptop GPU, 90 Wh | Alienware m15 R5 Ryzen Edition R7 5800H, GeForce RTX 3060 Laptop GPU, 86 Wh | Schenker XMG Core 15 Ampere R7 4800H, GeForce RTX 3060 Laptop GPU, 62 Wh | Average of class Gaming | |
|---|---|---|---|---|---|---|
| Battery runtime | 12% | 38% | 20% | 9% | 36% | |
| H.264 (h) | 4.3 | 6.9 60% | 8.8 105% | 6 40% | 7.93 ? 84% | |
| WiFi v1.3 (h) | 4.8 | 5.7 19% | 7.9 65% | 5.1 6% | 5.8 21% | 6.7 ? 40% |
| Load (h) | 1.8 | 1 -44% | 2 11% | 0.9 -50% | 1.2 -33% | 1.502 ? -17% |
| Reader / Idle (h) | 9.2 | 11 | 14.7 | 7.8 | 8.99 ? | |
| Witcher 3 ultra (h) | 1.6 | 0.958 ? |
Pros
Cons
Verdict - Legion 5 15 convinces with display and high performance
The new Legion 5 15 Gen.6 is once again a good gaming laptop with a comparatively low price and powerful components. The new AMD processor Ryzen 7 5800H offers plenty of performance and it is also very efficient. The combination with the fast 130W version of the GeForce RTX 3060 ensures high gaming performance. We also like the fast 165 Hz display with the 1080p resolution.
The automatic graphics switching causes some problems with stutters, which are very annoying. If you do not need long battery runtimes, you should definitely deactivate the hybrid graphics mode in Lenovo's Vantage app. Lenovo's additional power settings make sense and you can quickly switch between them, but we would have liked to see deactivated fans, at least when you use the Eco mode. The Legion 5 15 is never silent.
The Legion 5 15 Gen.6 focuses on the core components of a gaming laptops and offers plenty of performance with a fast 165 Hz display. The problems with the automatic graphics switching are annoying though and should be fixed as soon as possible.
Compared to its closes rivals like the Acer Nitro 5 or the Asus TUF Gaming F15, the Legion primarily stands out with the powerful graphics card. There is no comprehensive illumination you get with the Alienware m15, but Lenovo's notebook is more affordable in return
Price and Availability
You can configure the Legion 5 15 AMD in Lenovo's online shop currently starting at $949 with Ryzen 5 5600H, GeForce RTX 3050 and 1080p 120 Hz display. A configuration similar to our review unit is available for ~$1800.
Lenovo Legion 5 15ACH-82JU00C6GE-FL
- 09/06/2021 v7 (old)
Andreas Osthoff
Price comparison
