

Lenovo IdeaPad Slim 7i Pro laptop review: 90 Hz makes all the difference
Thin-and-light subnotebooks almost always come with Intel or AMD U-series CPUs due to size constraints. If you want Core-H options for more performance, then you would typically have to settle for thicker and heavier models instead. The Lenovo IdeaPad Slim 7i Pro is unique in that it is one of the few Ultrabooks to carry Tiger Lake H35 CPUs for a high level of performance relative to its thin-and-light size.
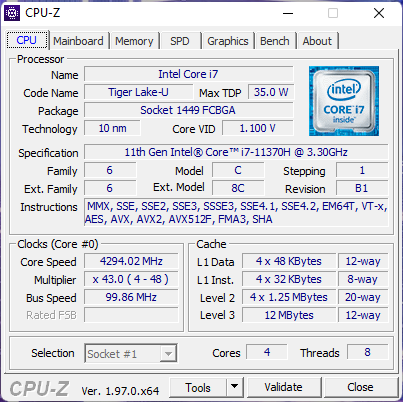
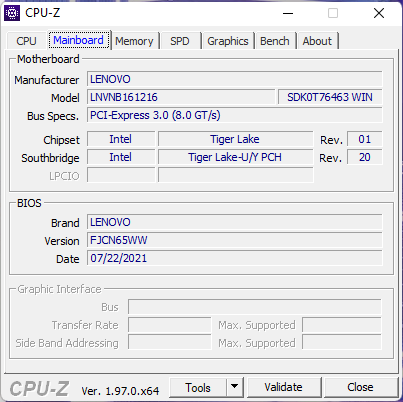
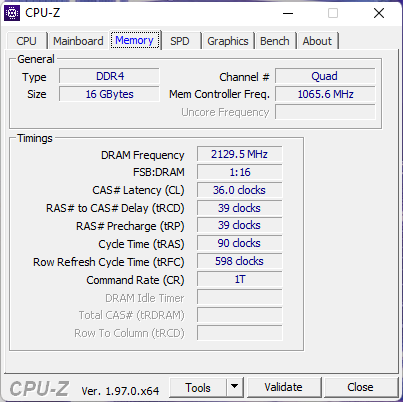
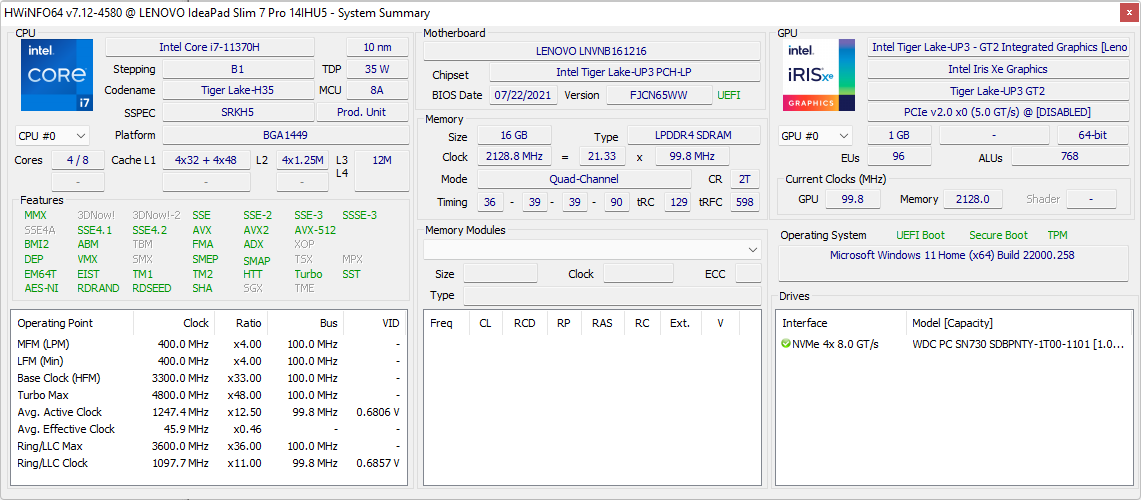
Our specific review configuration comes with the Core i7-11370H CPU, 16 GB of RAM, and 1 TB PCIe SSD for approximately $1300 USD retail. All SKUs come with the same 16:10 2880 x 1800 glossy touchscreen with a native refresh rate of 90 Hz.
Competitors in this space include other high-end 14-inch subnotebooks like the MSI Summit E14, Huawei MateBook 14s, Asus ZenBook 14X, or the 13.4-inch Dell XPS 13.
More Lenovo reviews:
Potential Competitors in Comparison
Rating | Date | Model | Weight | Height | Size | Resolution | Price |
|---|---|---|---|---|---|---|---|
| 86.9 % v7 (old) | 10 / 2021 | Lenovo IdeaPad Slim 7i Pro 14IHU5 i7-11370H, Iris Xe G7 96EUs | 1.4 kg | 16.9 mm | 14.00" | 2880x1800 | |
| 86.4 % v7 (old) | 10 / 2021 | Lenovo Yoga Slim 7 14ITL05 82A300CNGE i5-1135G7, Iris Xe G7 80EUs | 1.4 kg | 14.9 mm | 14.00" | 1920x1080 | |
| 88.6 % v7 (old) | 10 / 2021 | Huawei MateBook 14s i7 i7-11370H, Iris Xe G7 96EUs | 1.4 kg | 16.7 mm | 14.20" | 2520x1680 | |
v (old) | 10 / 2021 | Asus Zenbook 14X UX5400E i7-1165G7, GeForce MX450 | 1.4 kg | 16.9 mm | 14.00" | 2880x1800 | |
| 82.3 % v7 (old) | 07 / 2021 | MSI Summit E14 A11SCS i7-1185G7, GeForce GTX 1650 Ti Max-Q | 1.3 kg | 16 mm | 14.00" | 3840x2160 | |
| 87.5 % v7 (old) | 06 / 2021 | Razer Blade 14 Ryzen 9 RTX 3070 R9 5900HX, GeForce RTX 3070 Laptop GPU | 1.8 kg | 16.8 mm | 14.00" | 2560x1440 |
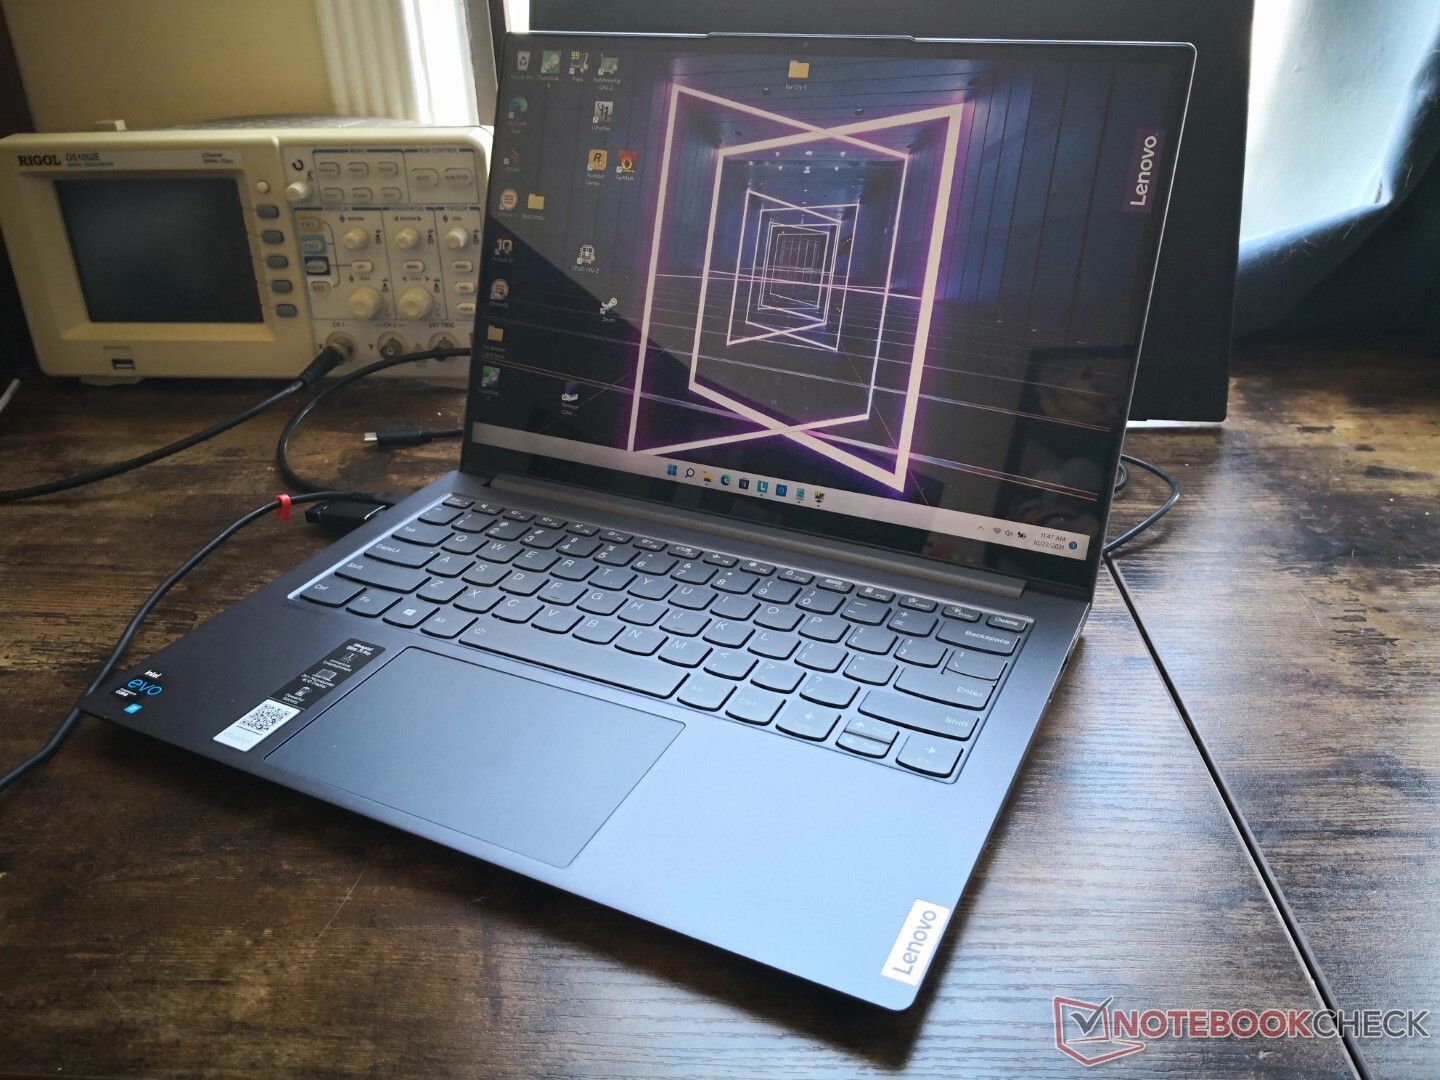
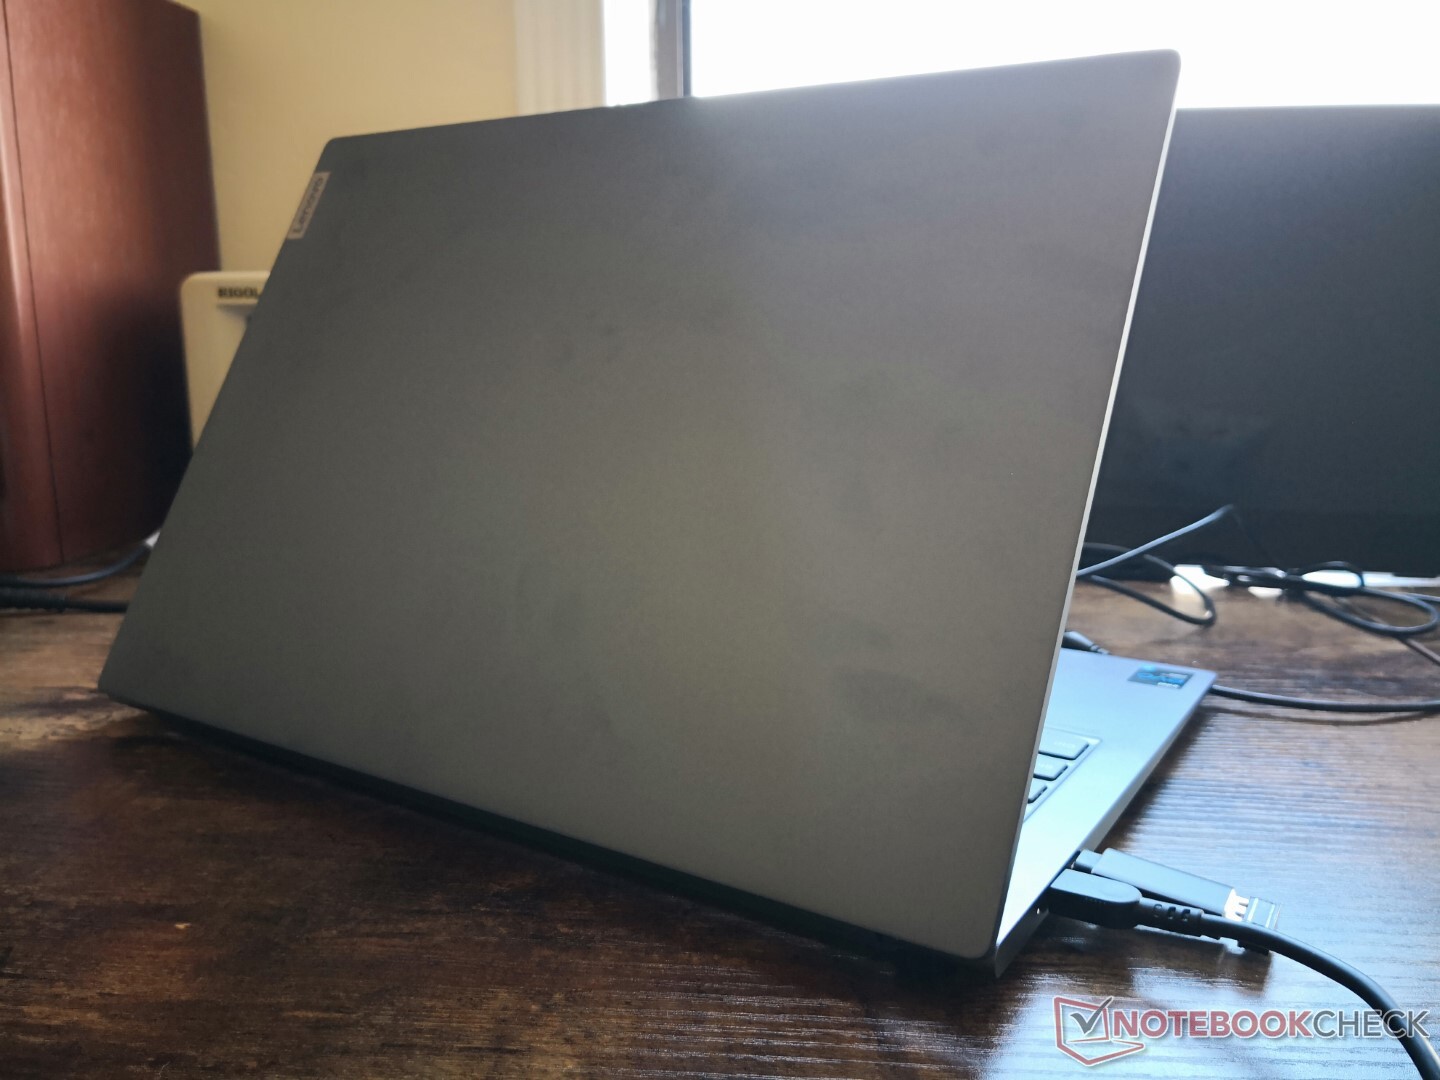
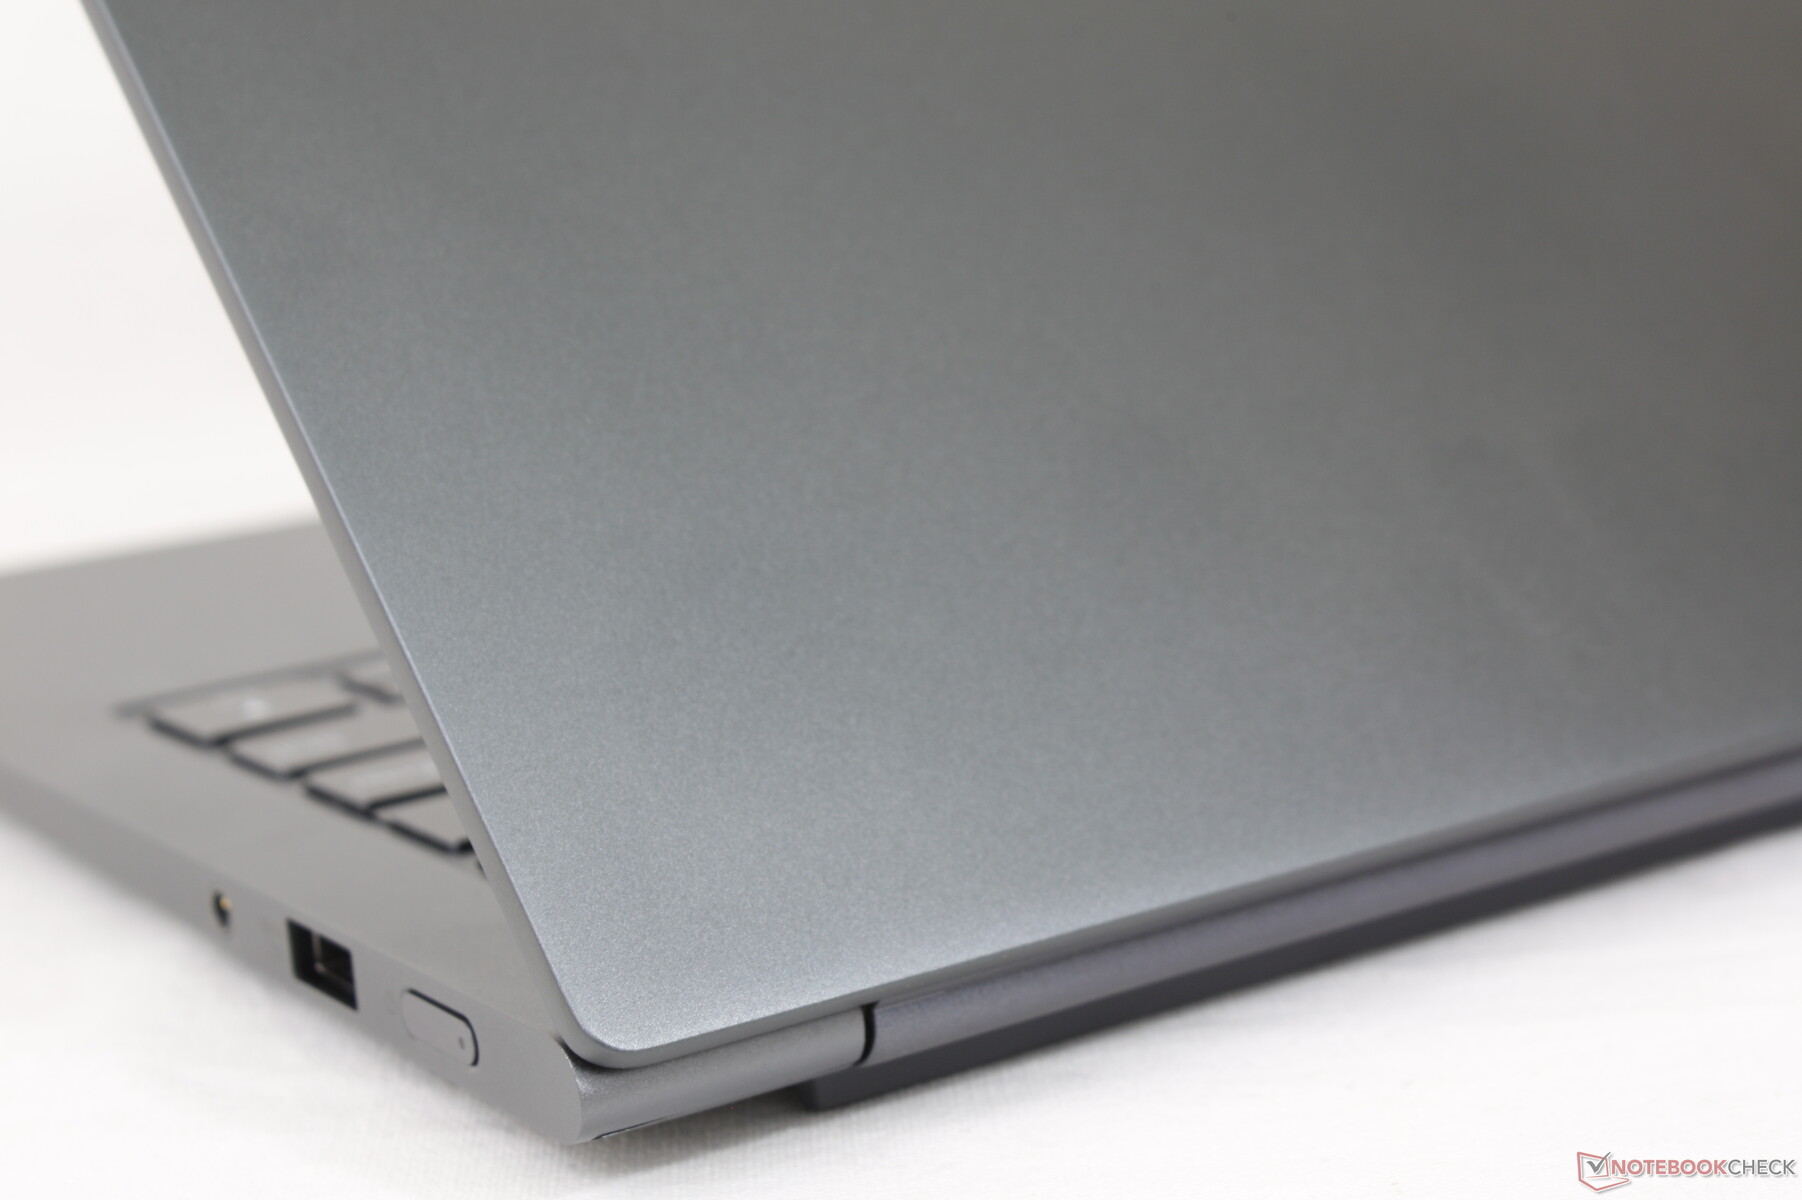
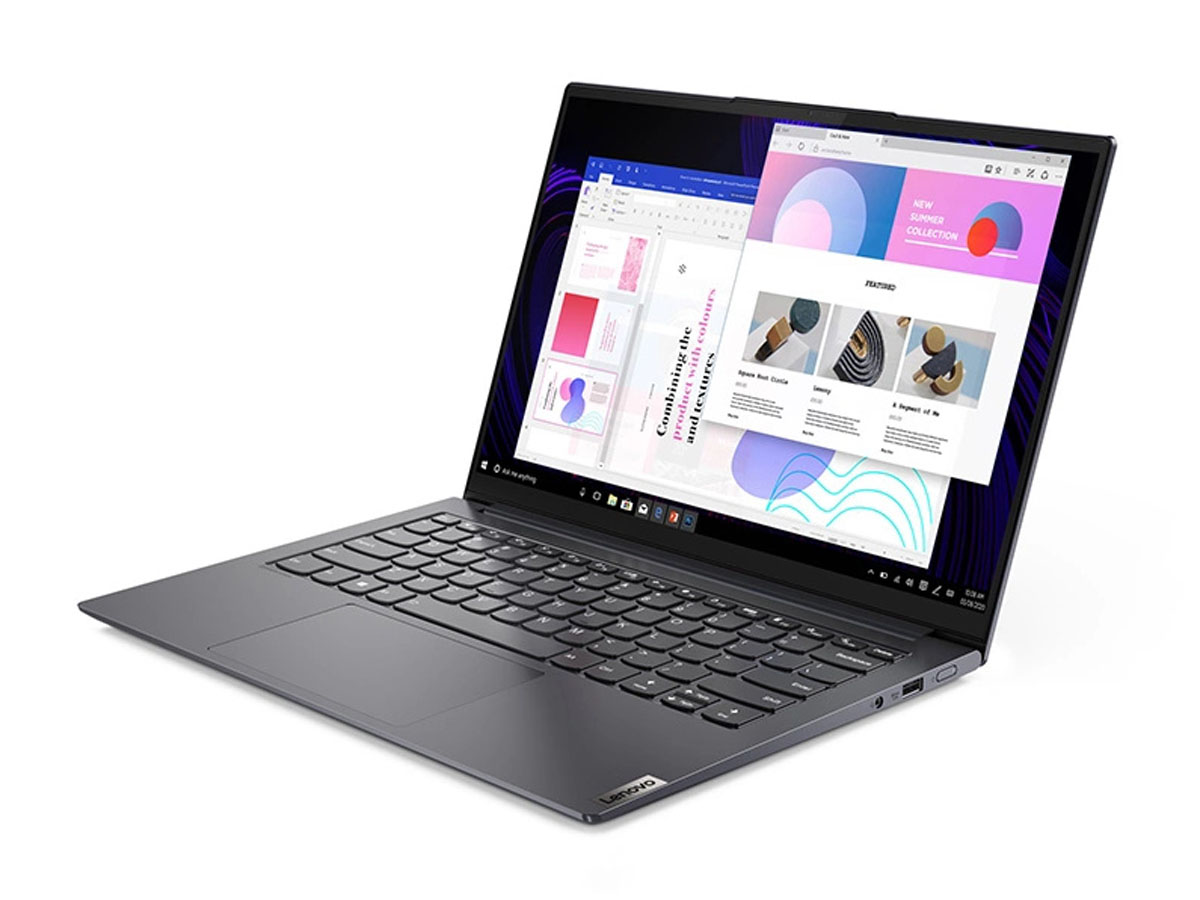
Case — It's Actually a Yoga
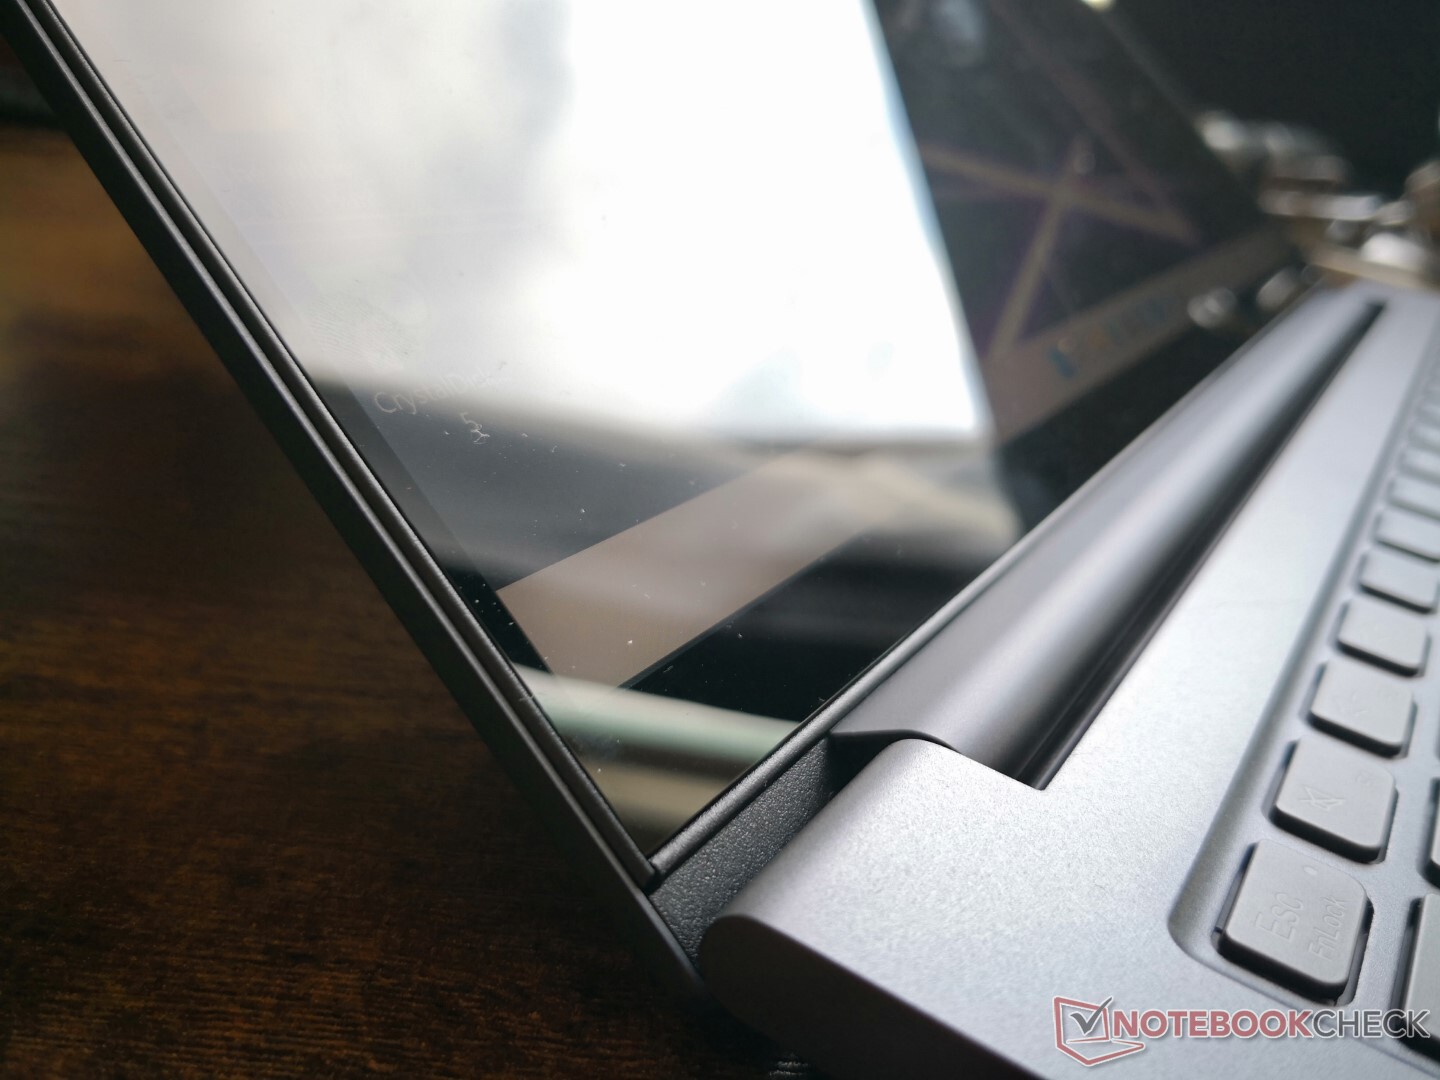
The aluminum alloy chassis is identical to the Yoga Slim 7 Pro which is the AMD version of our Intel-powered IdeaPad Slim 7i Pro. Both the base and lid exhibit minimal flexing for stronger first impressions than the Vaio Z and cheaper alternatives like the Asus VivoBook S13 or Dell Inspiron. However, the hinges could have been tighter at wider angles for a better sense of longevity.
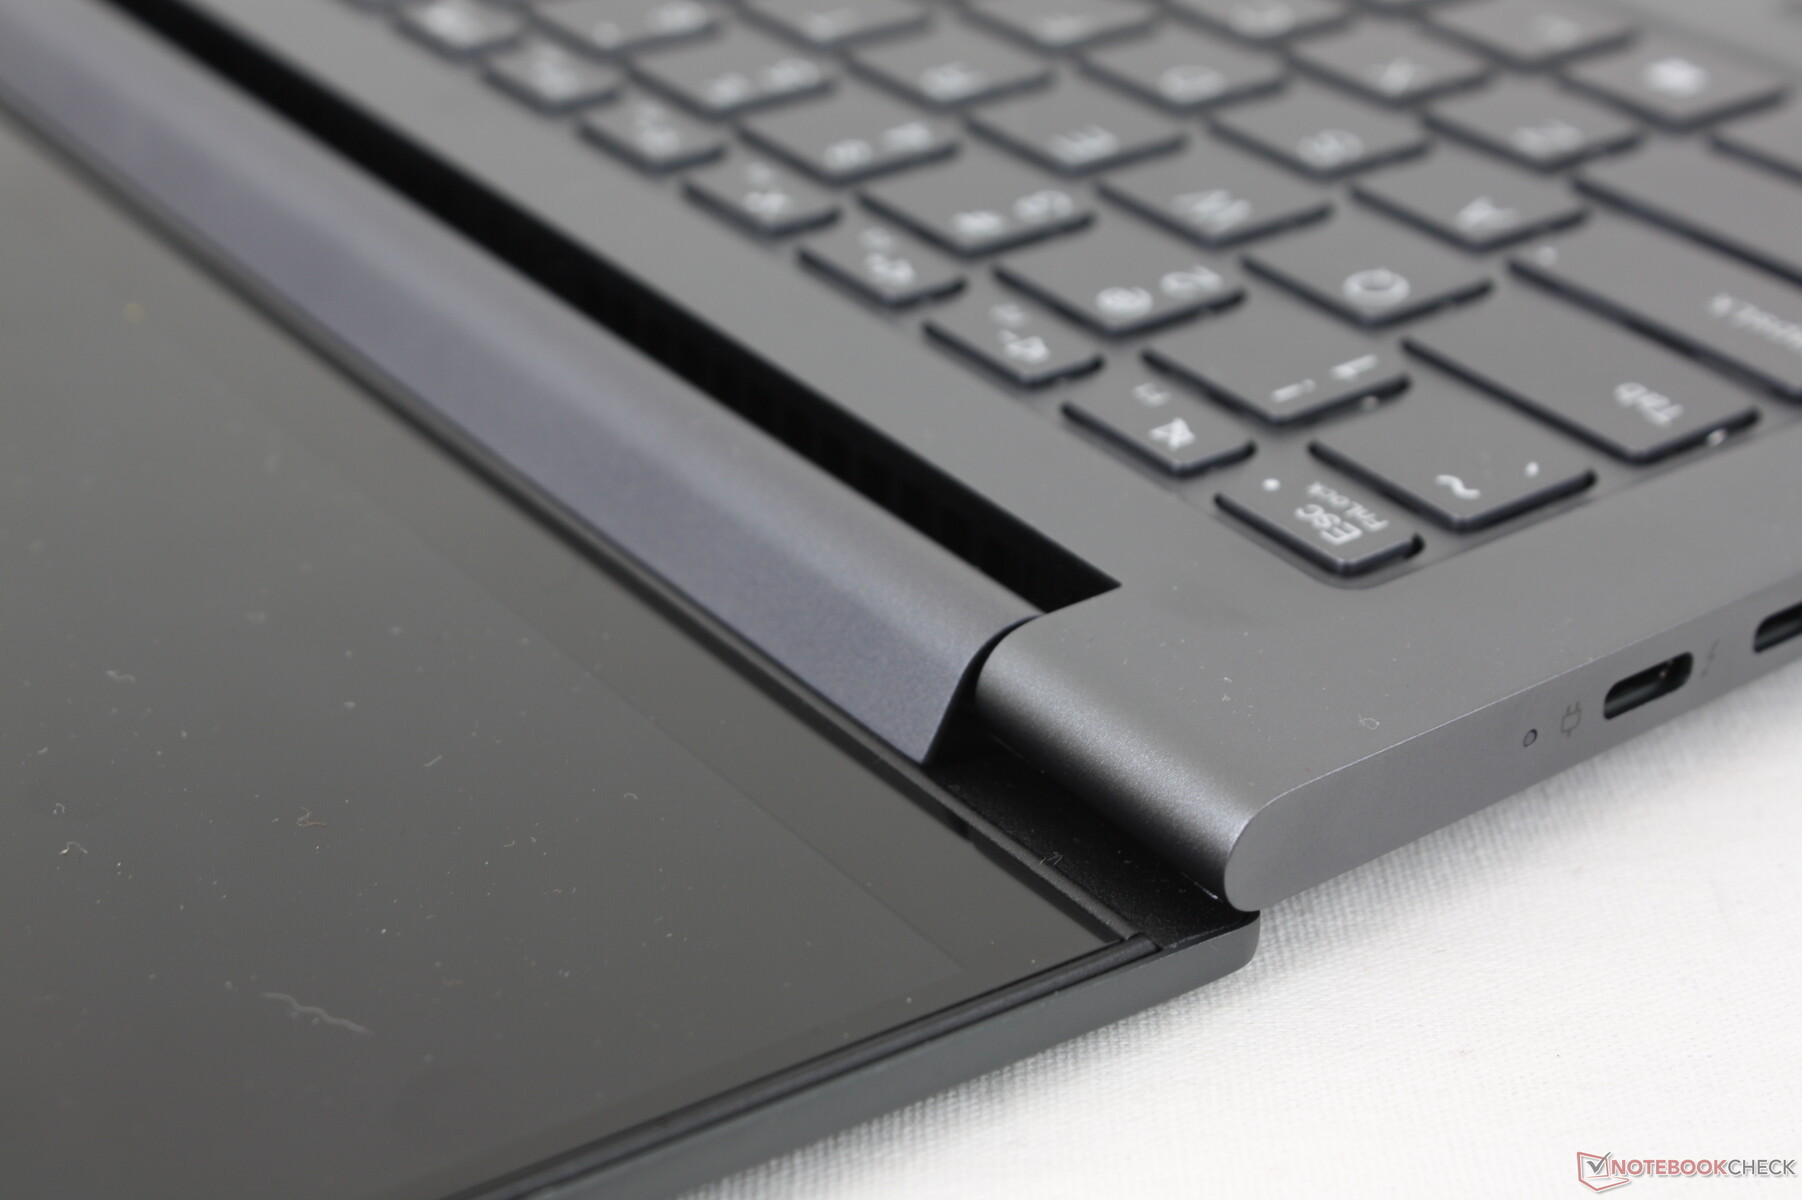
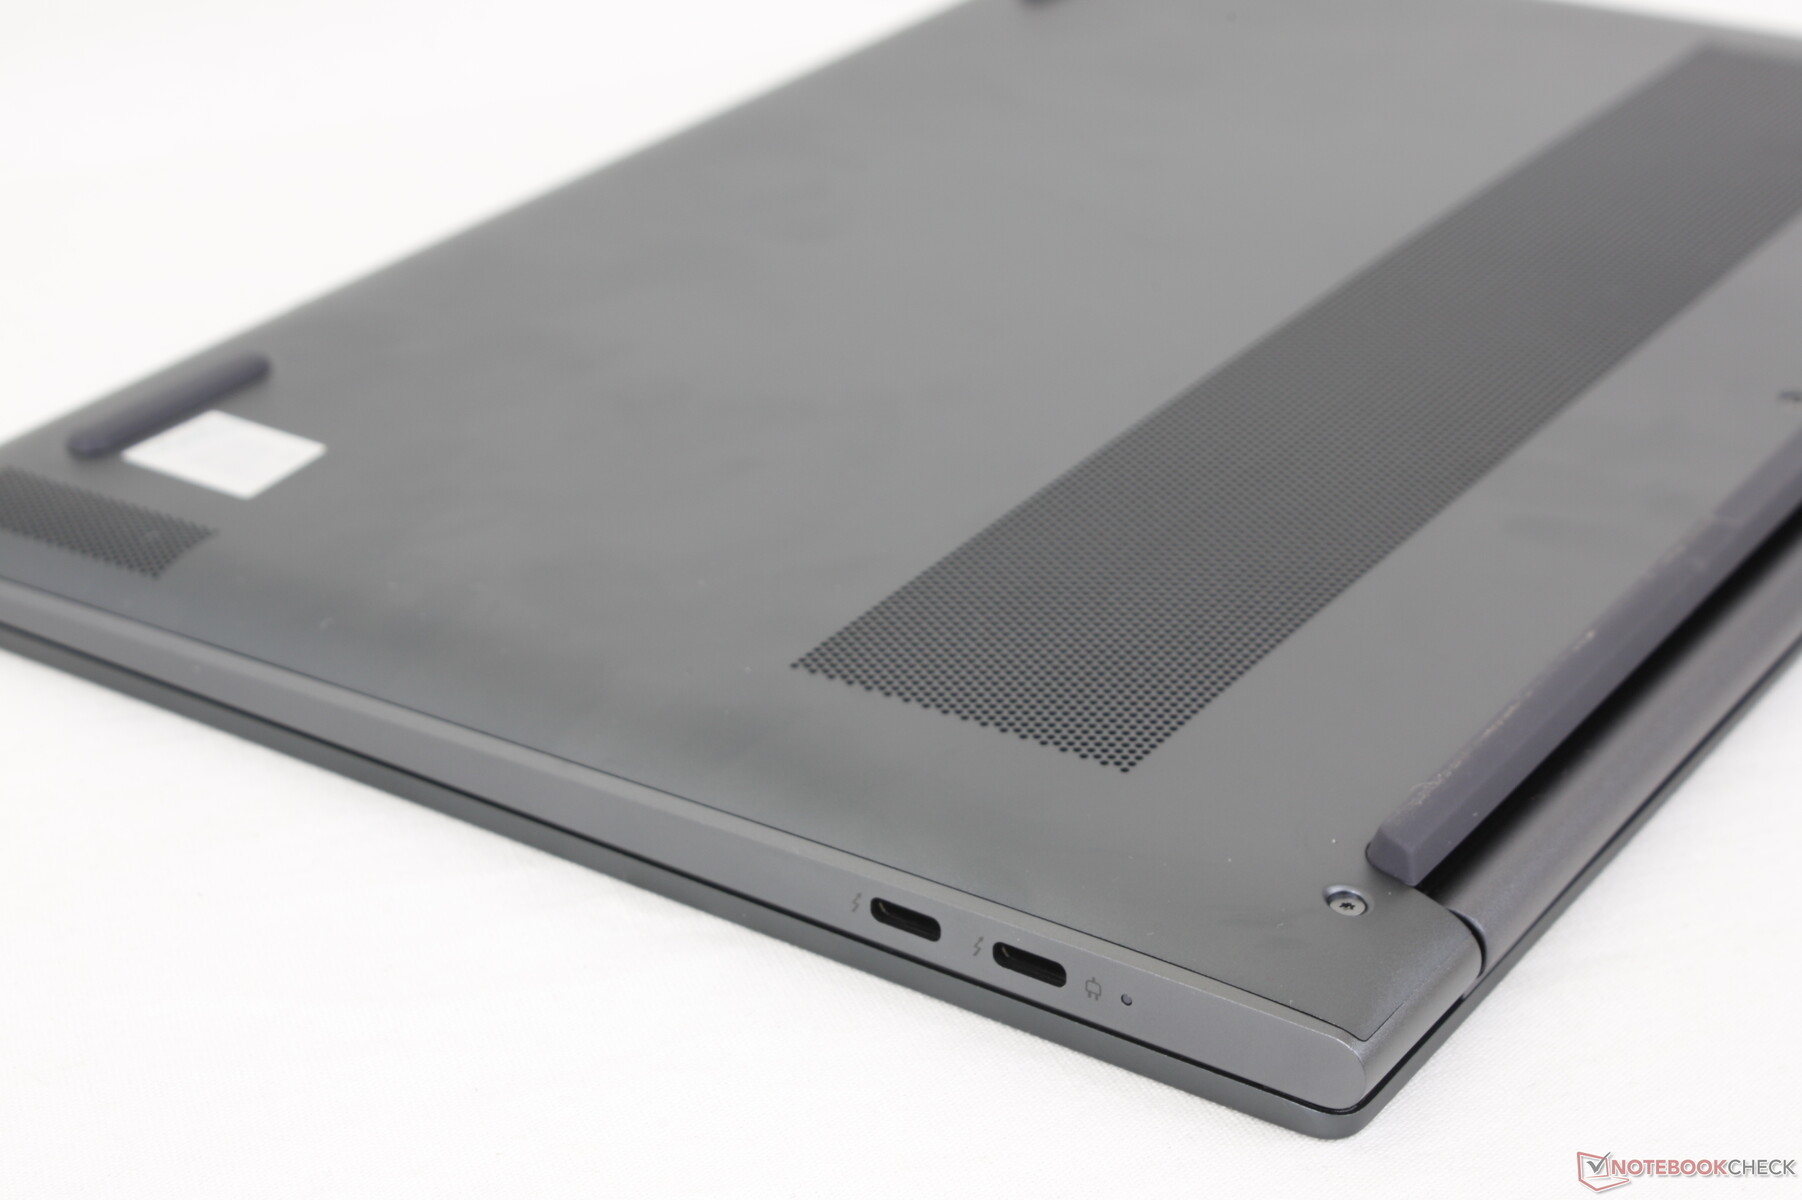
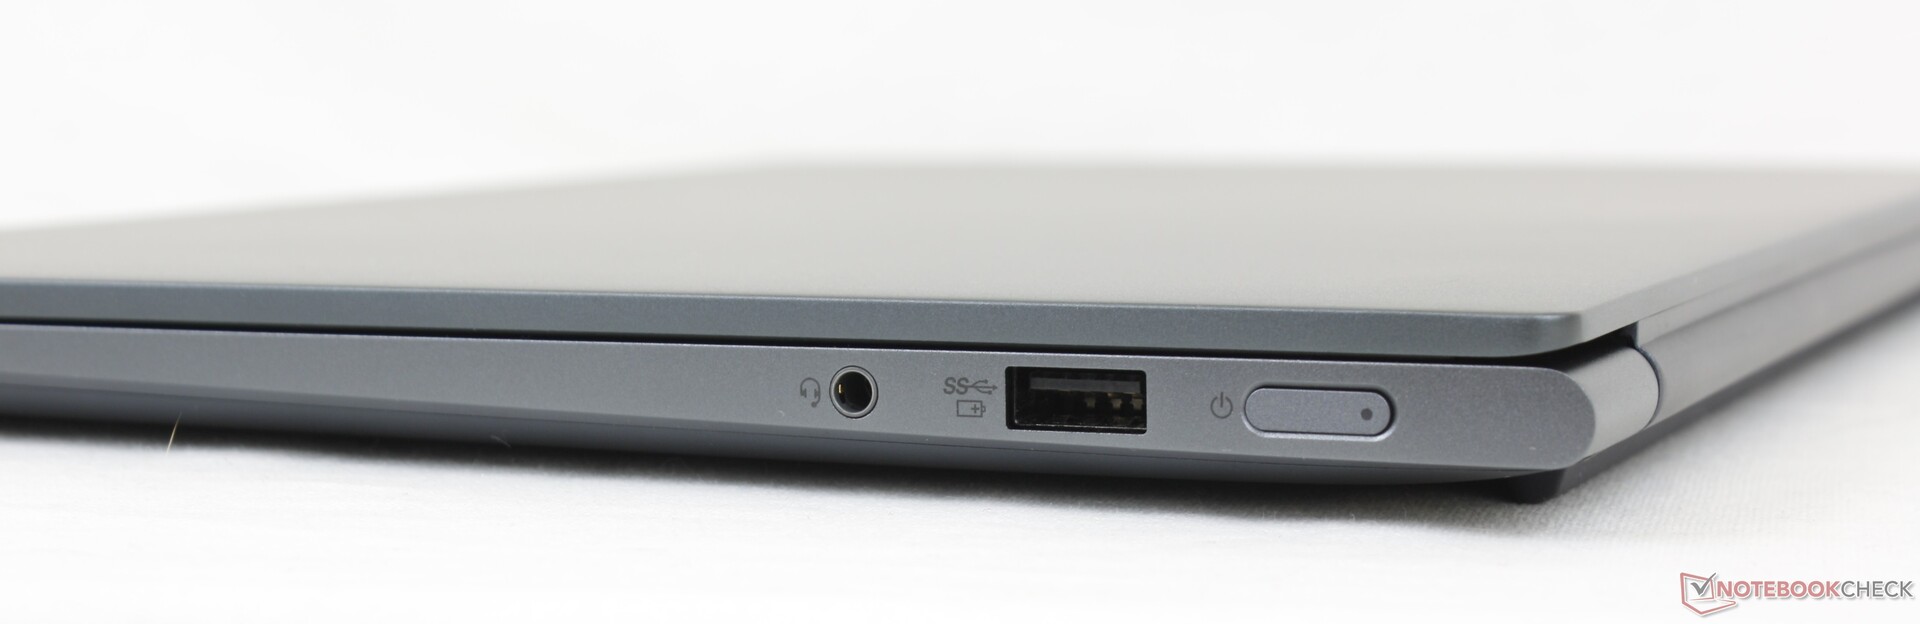
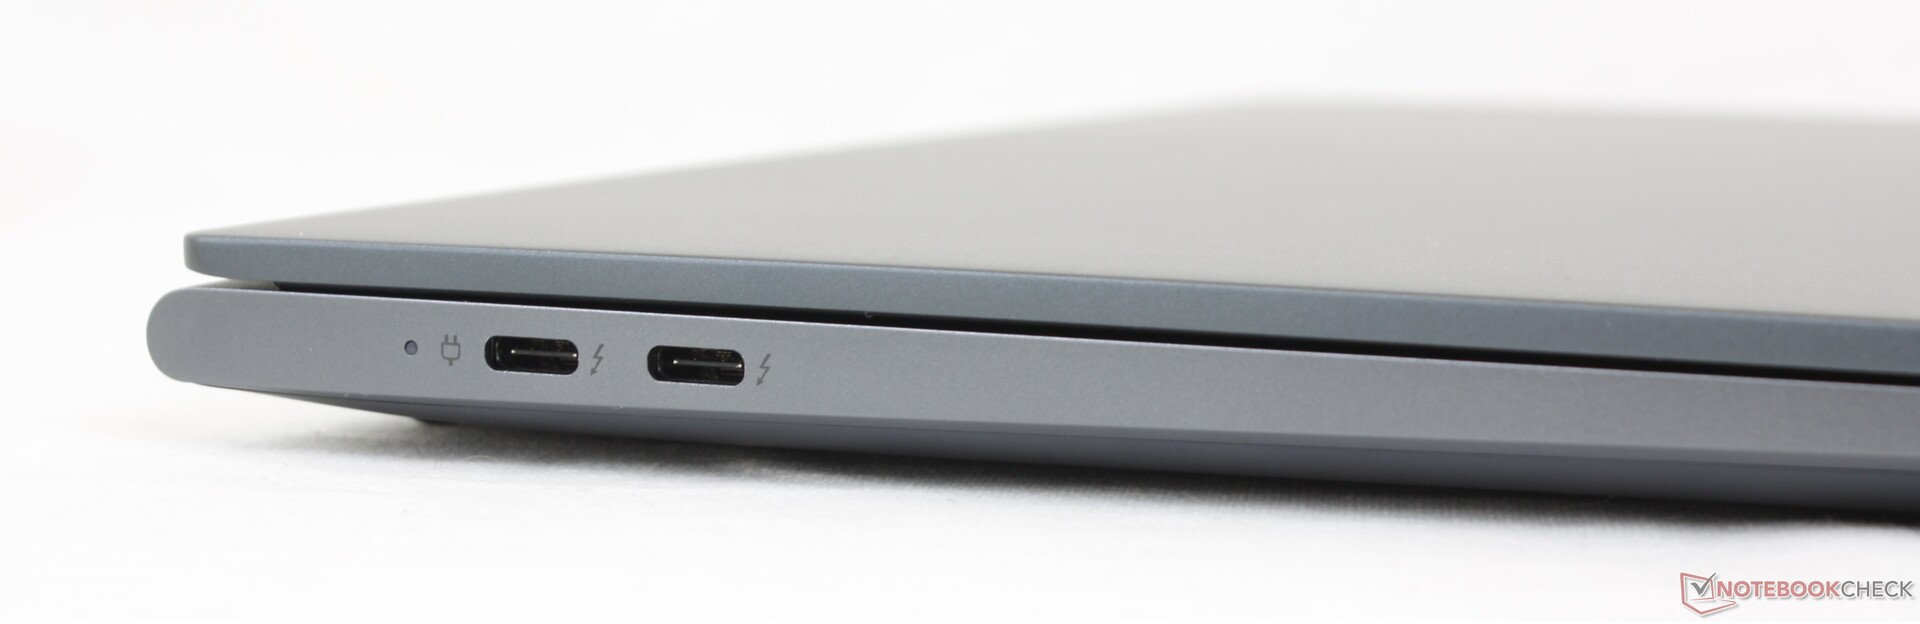
Connectivity — Thunderbolt 4 Support
Ports are physically identical to the ports on the AMD-powered Yoga Slim 7 Pro. However, the two USB-C ports on our IdeaPad Slim 7i Pro each support Thunderbolt 4 while the ones on the AMD version have no Thunderbolt support at all.
Webcam


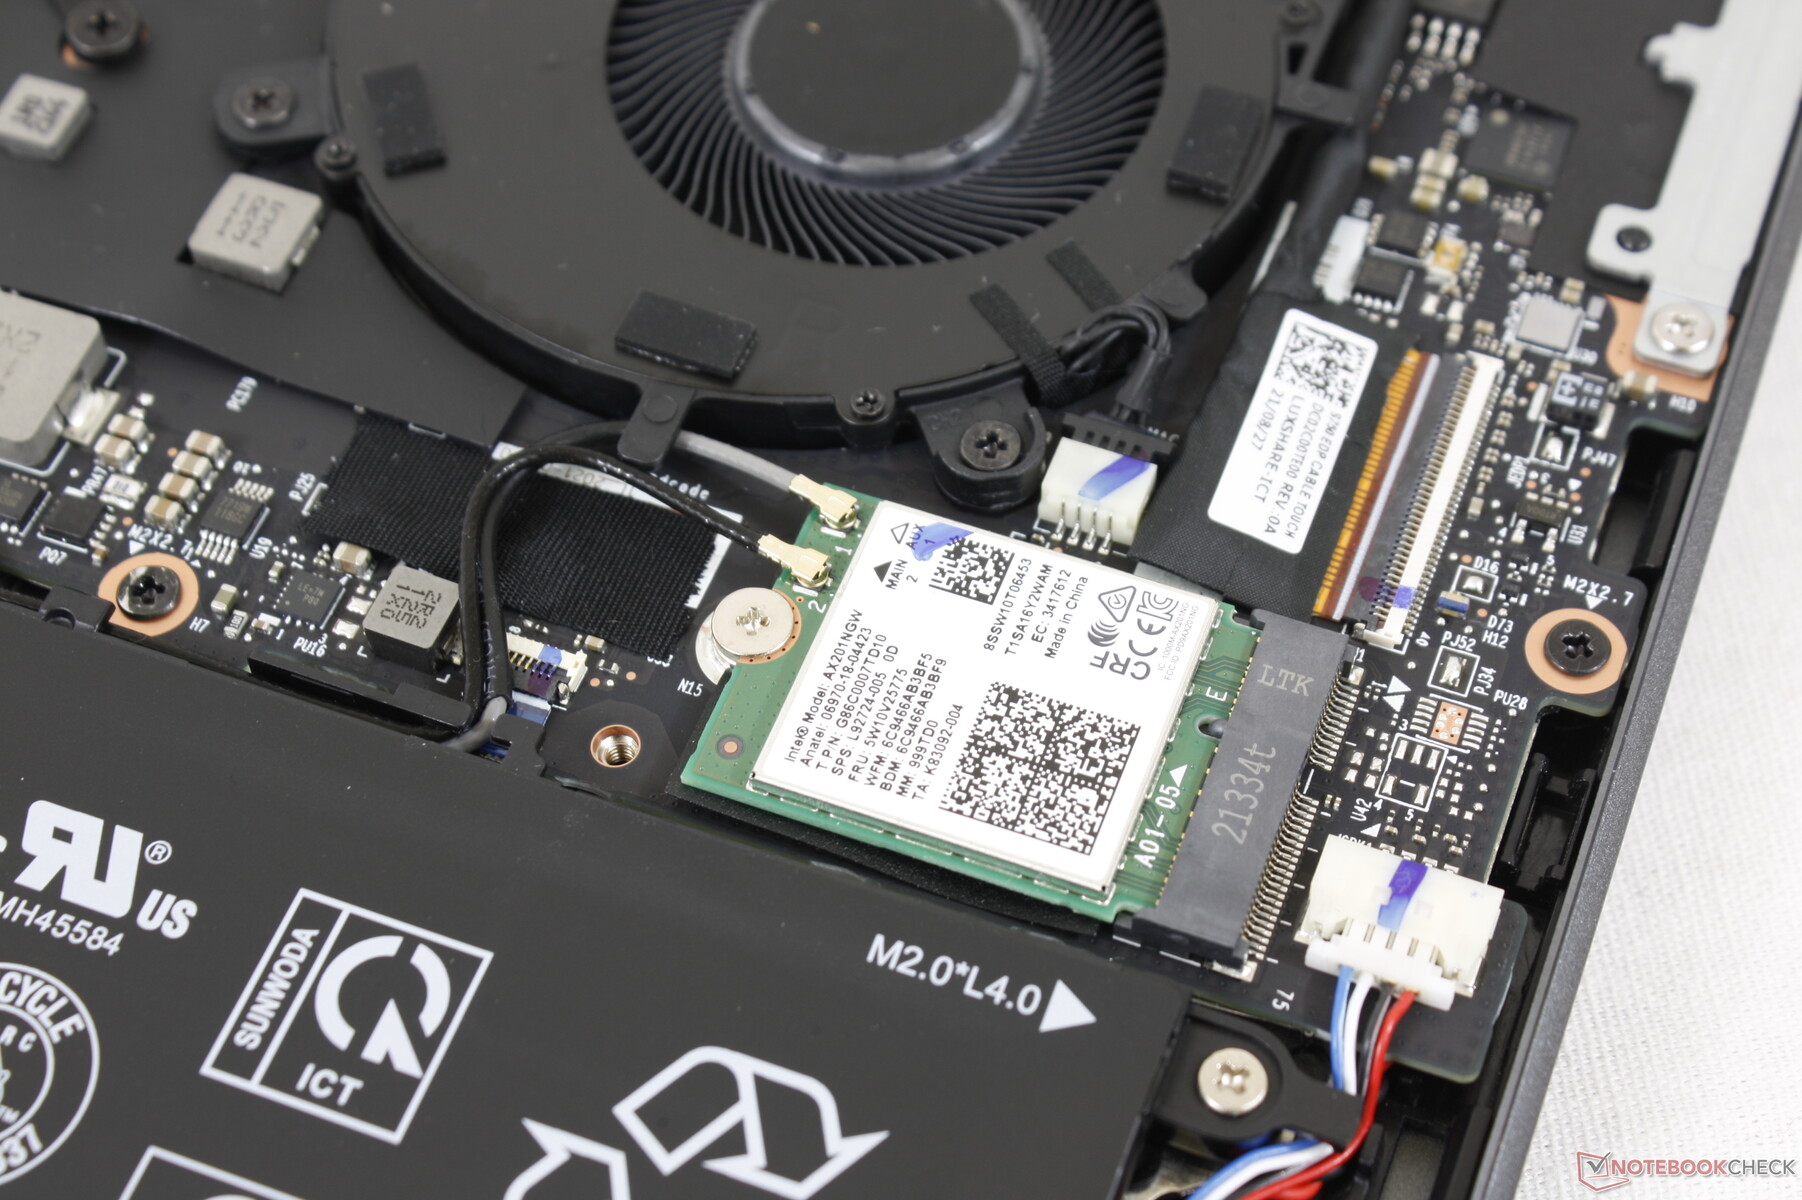
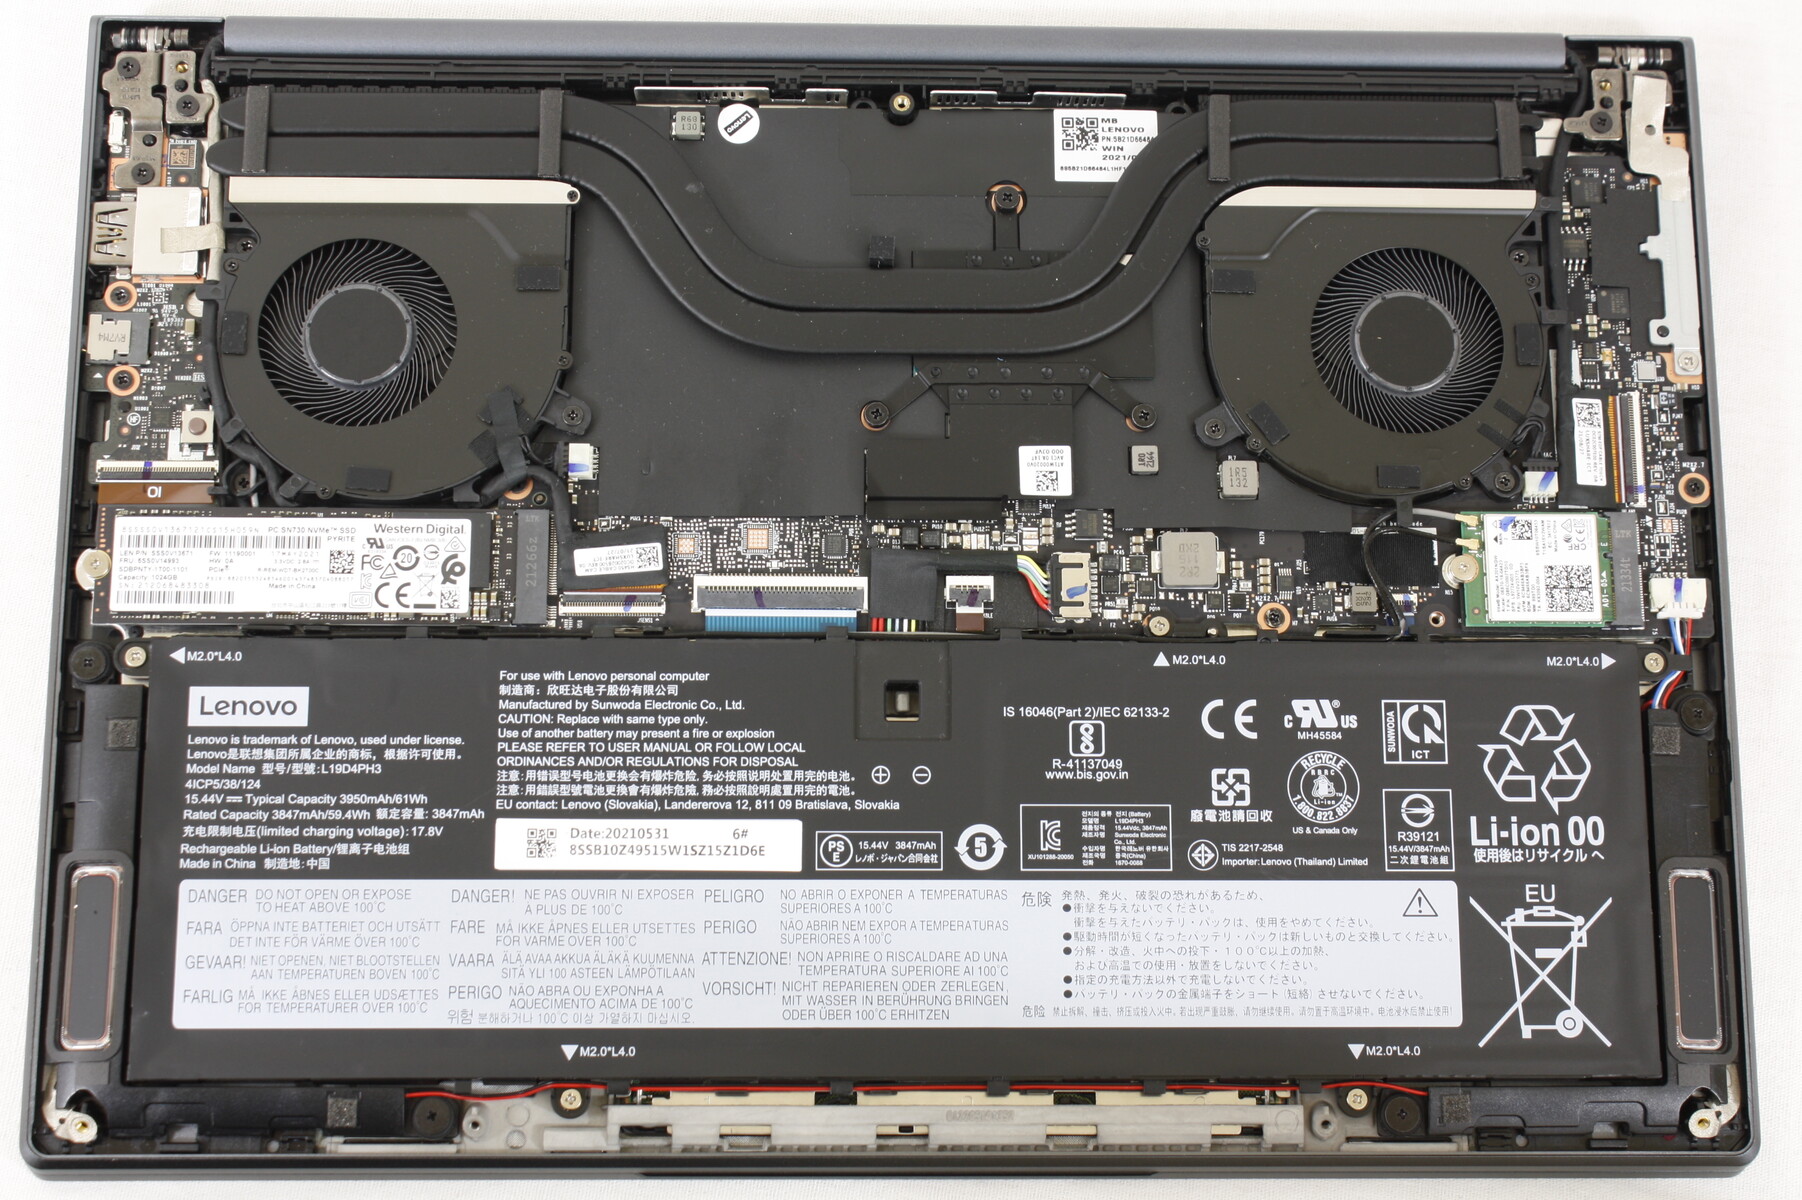
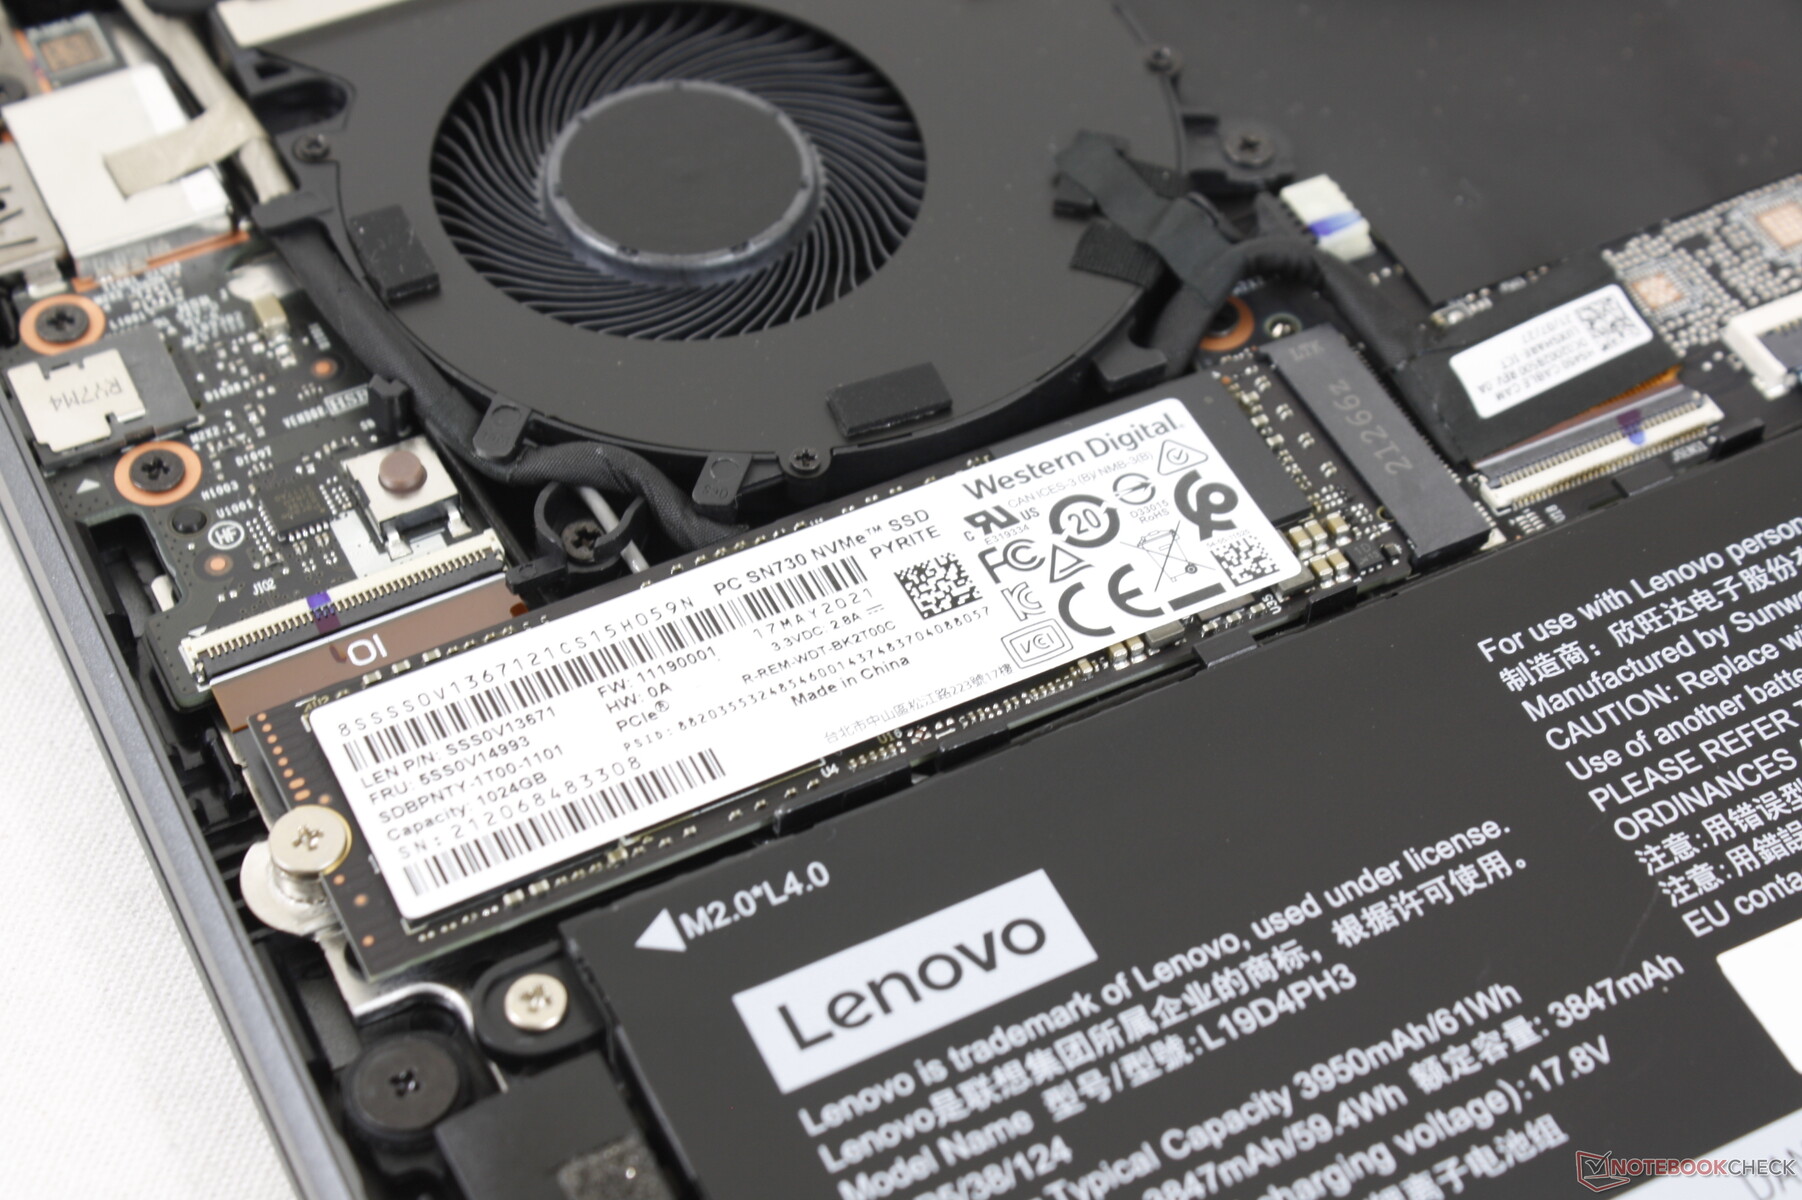
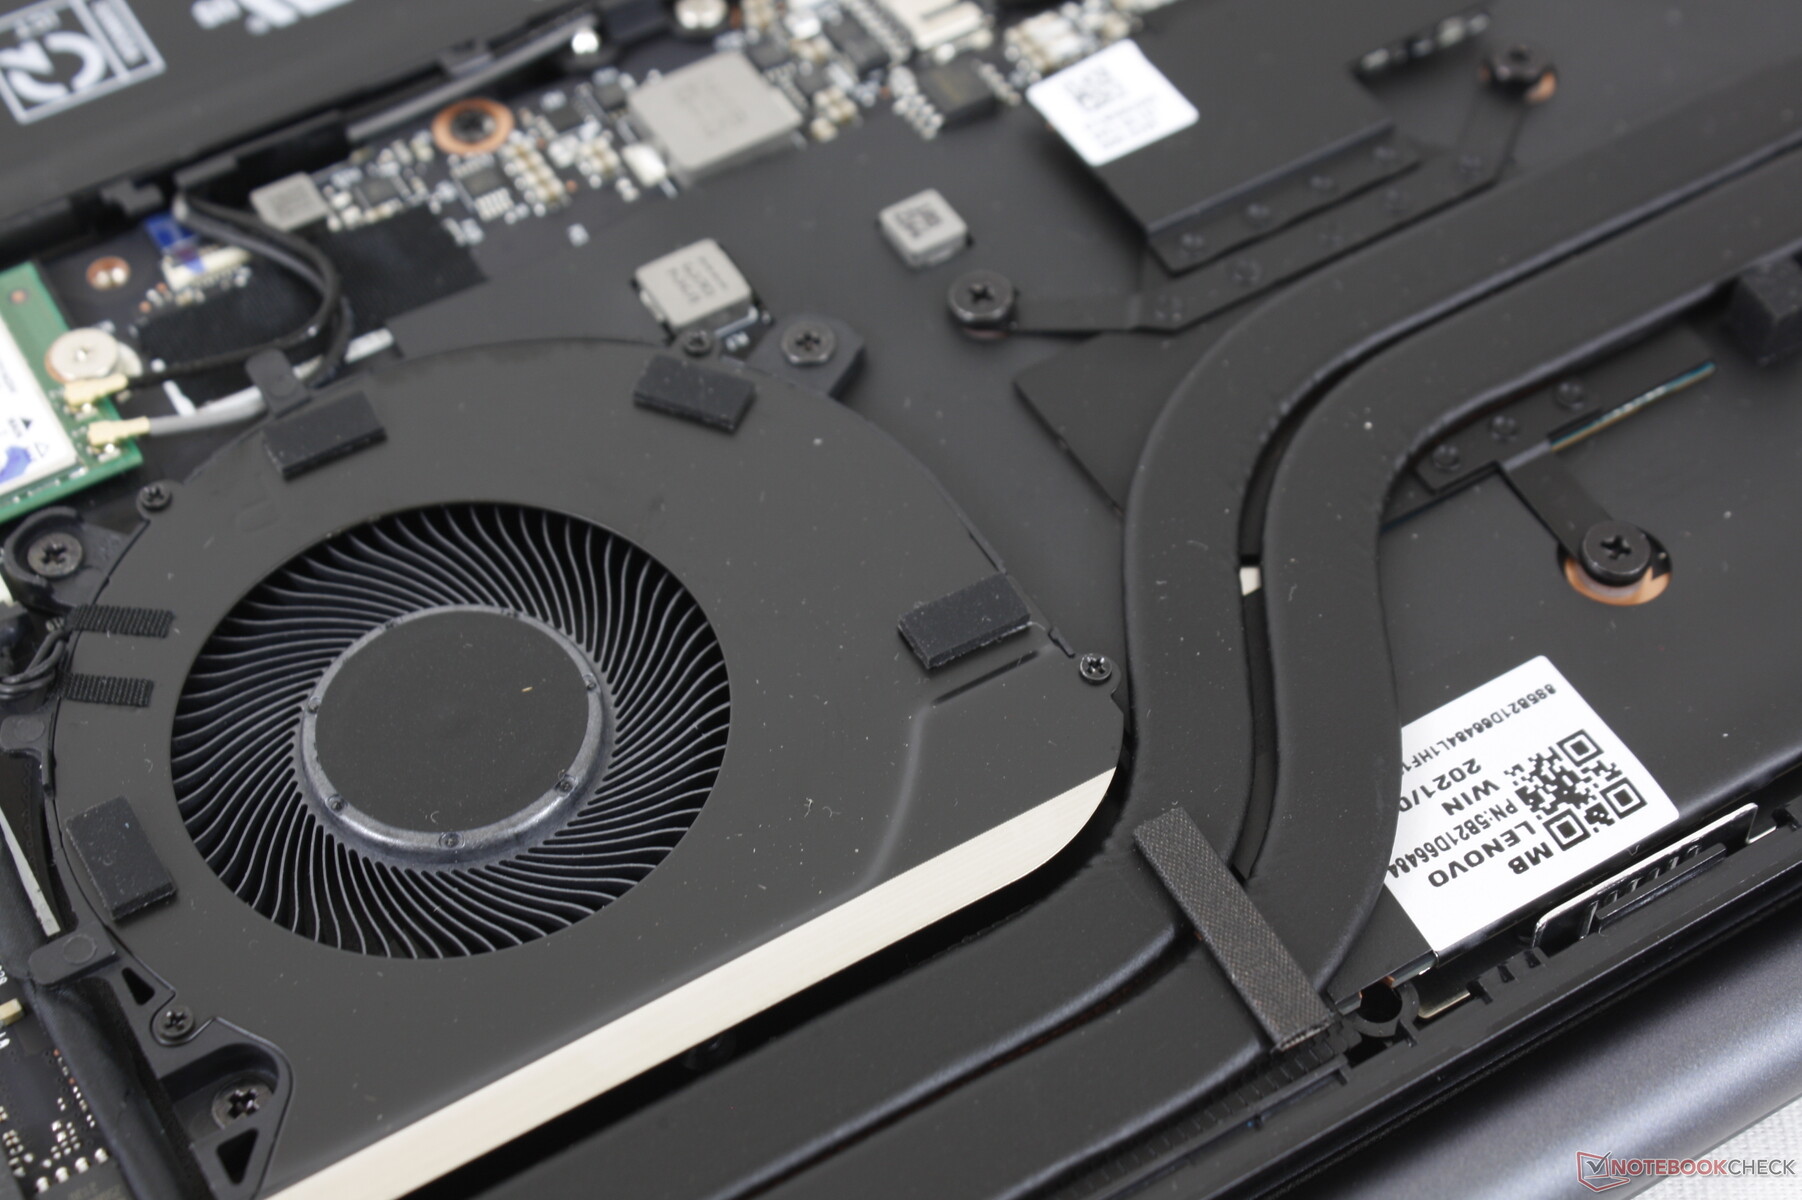
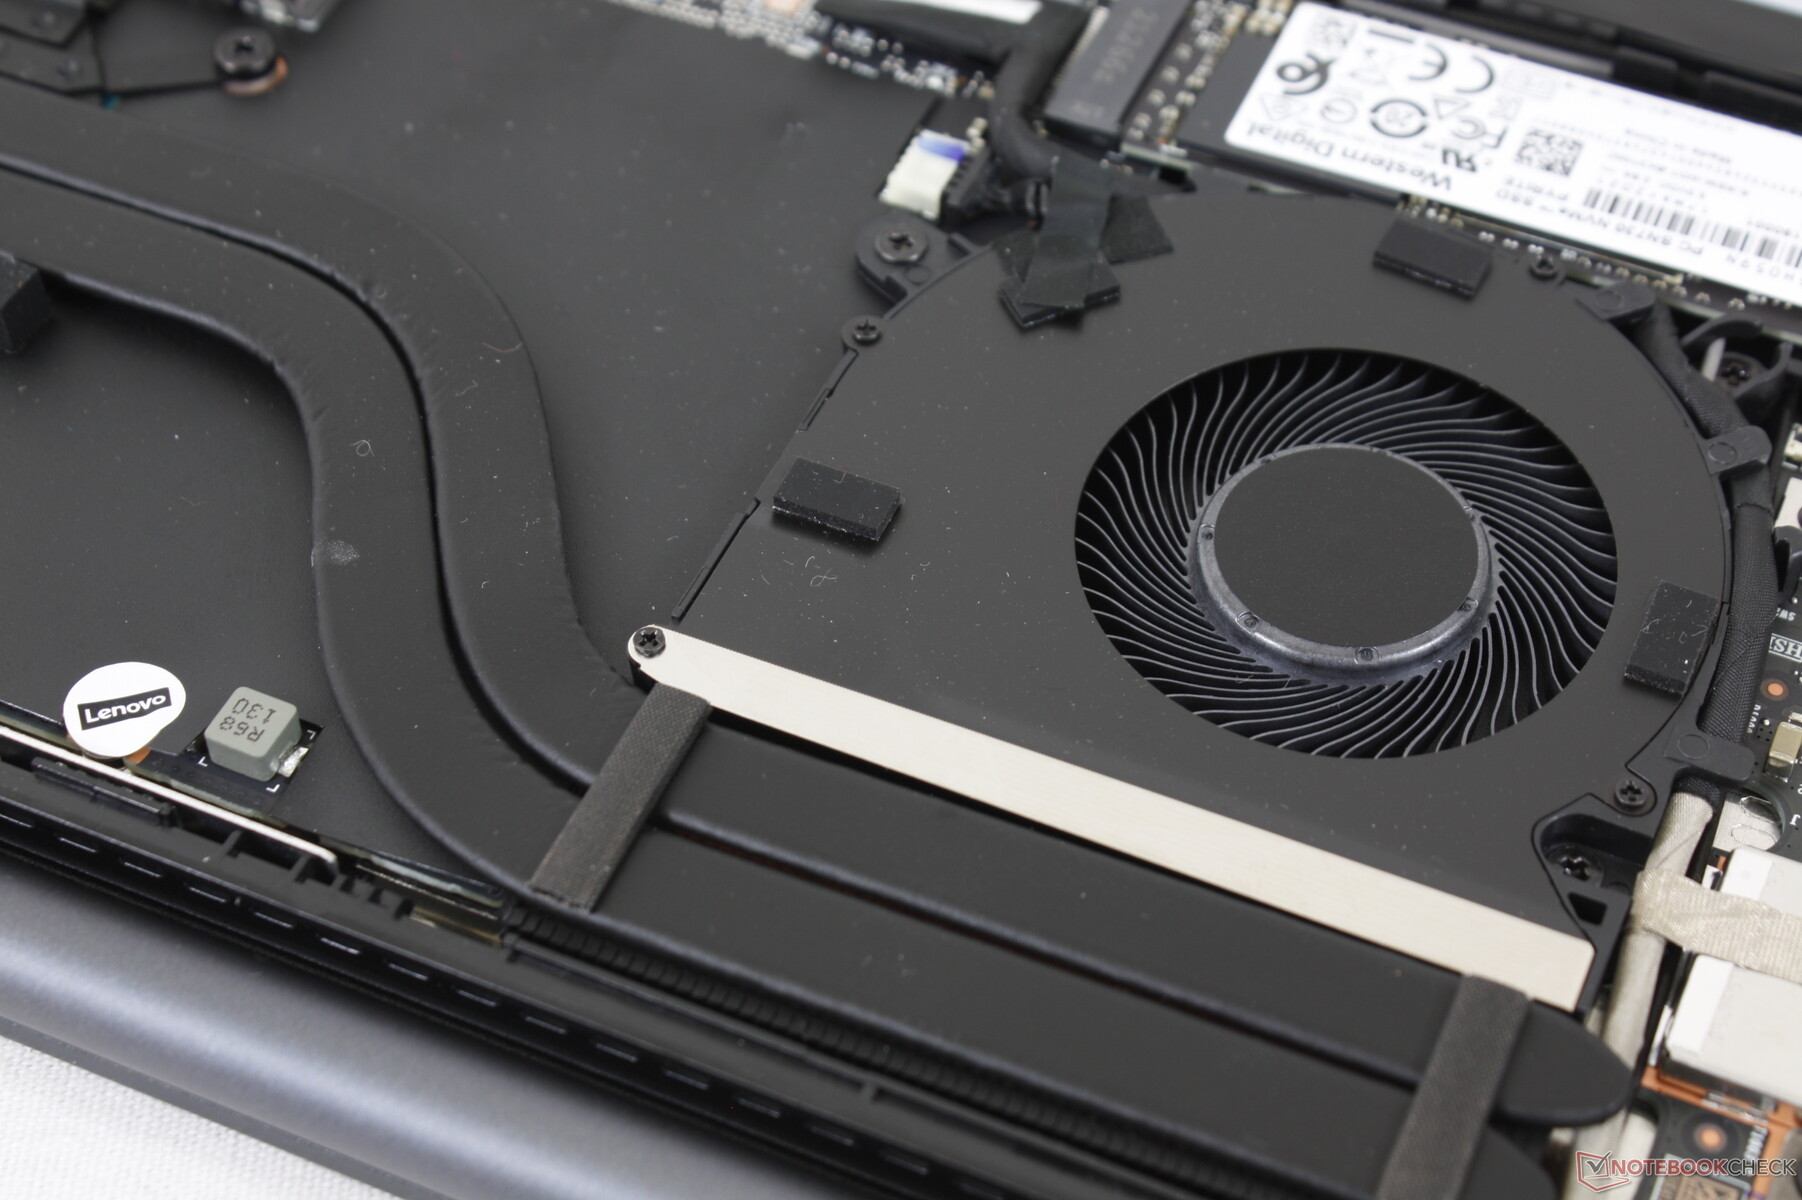
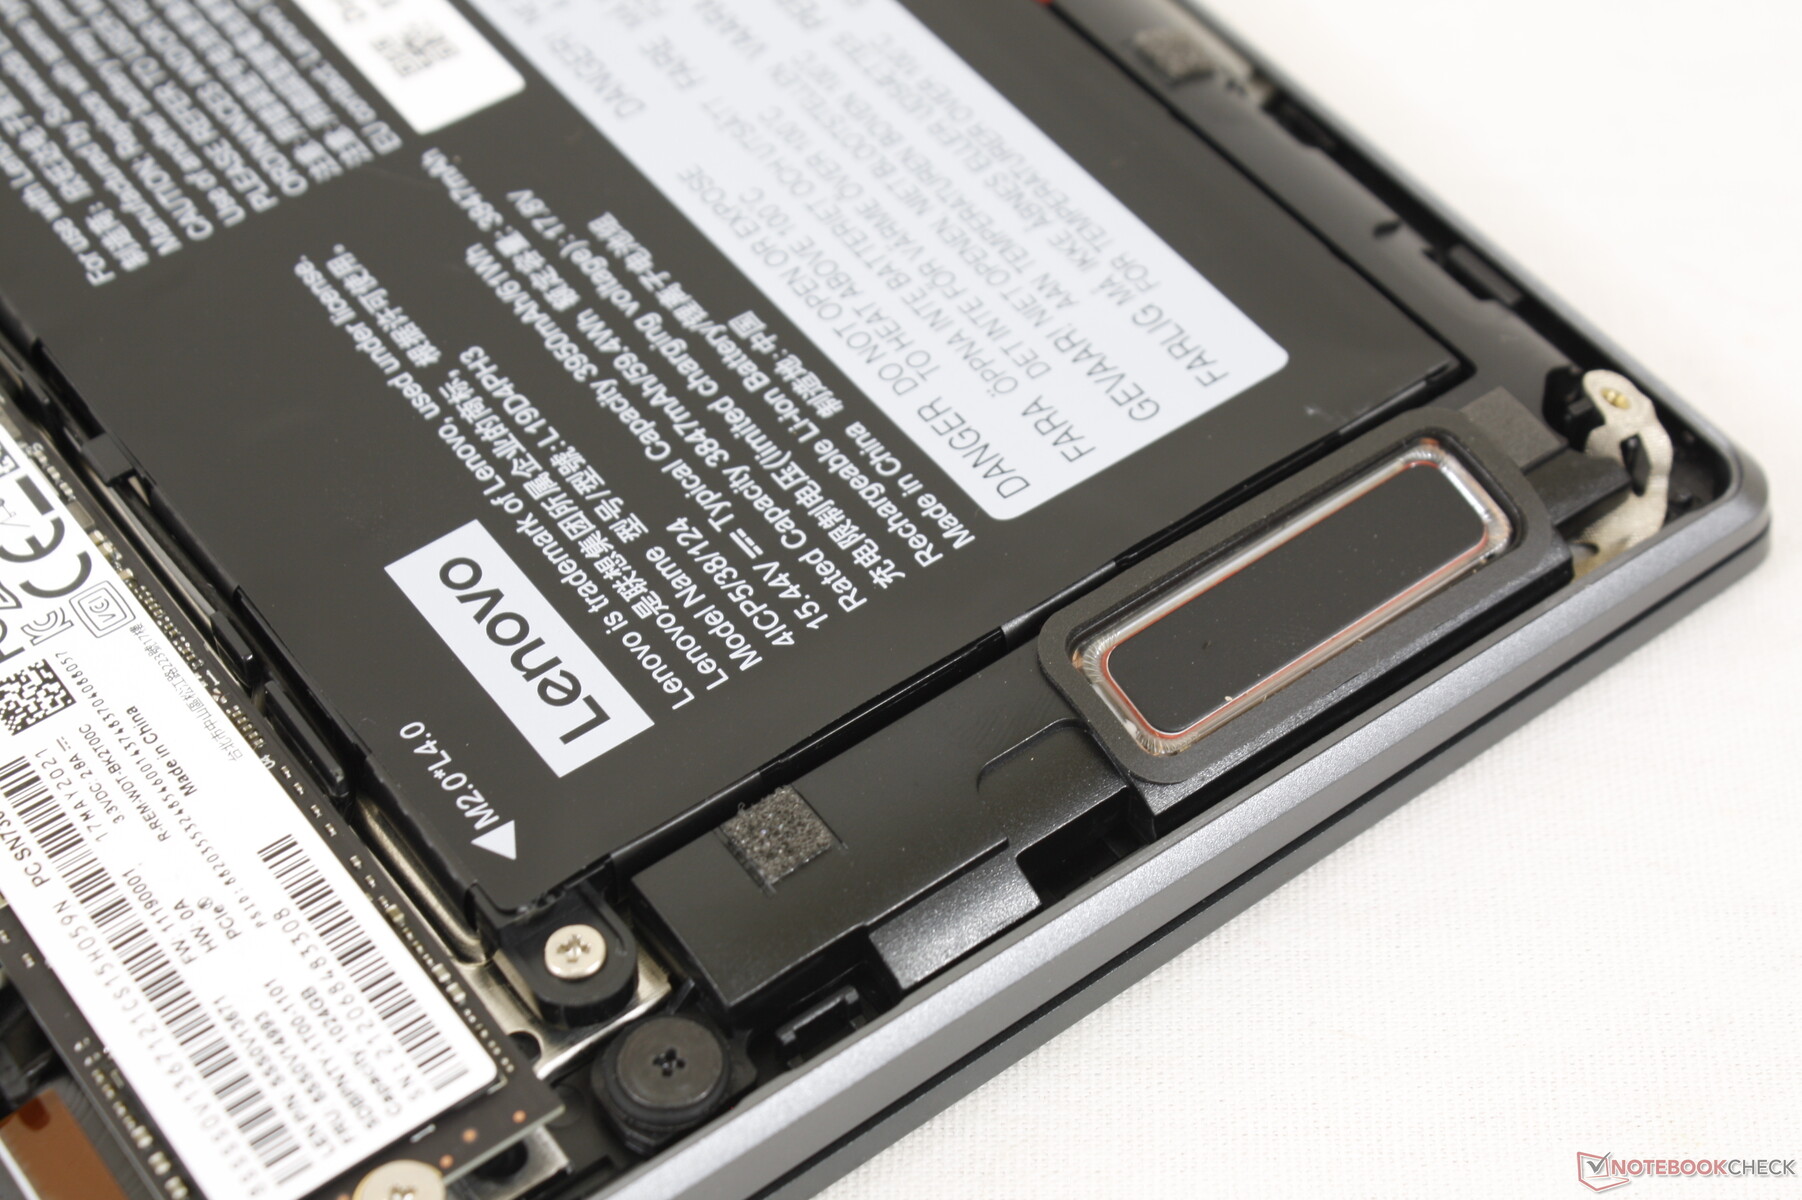
Maintenance — Easy to Open
The bottom panel can be easily removed with a T5 Torx wrench. RAM is soldered and so users can only service the battery, M.2 2280 storage slot, and WLAN module.
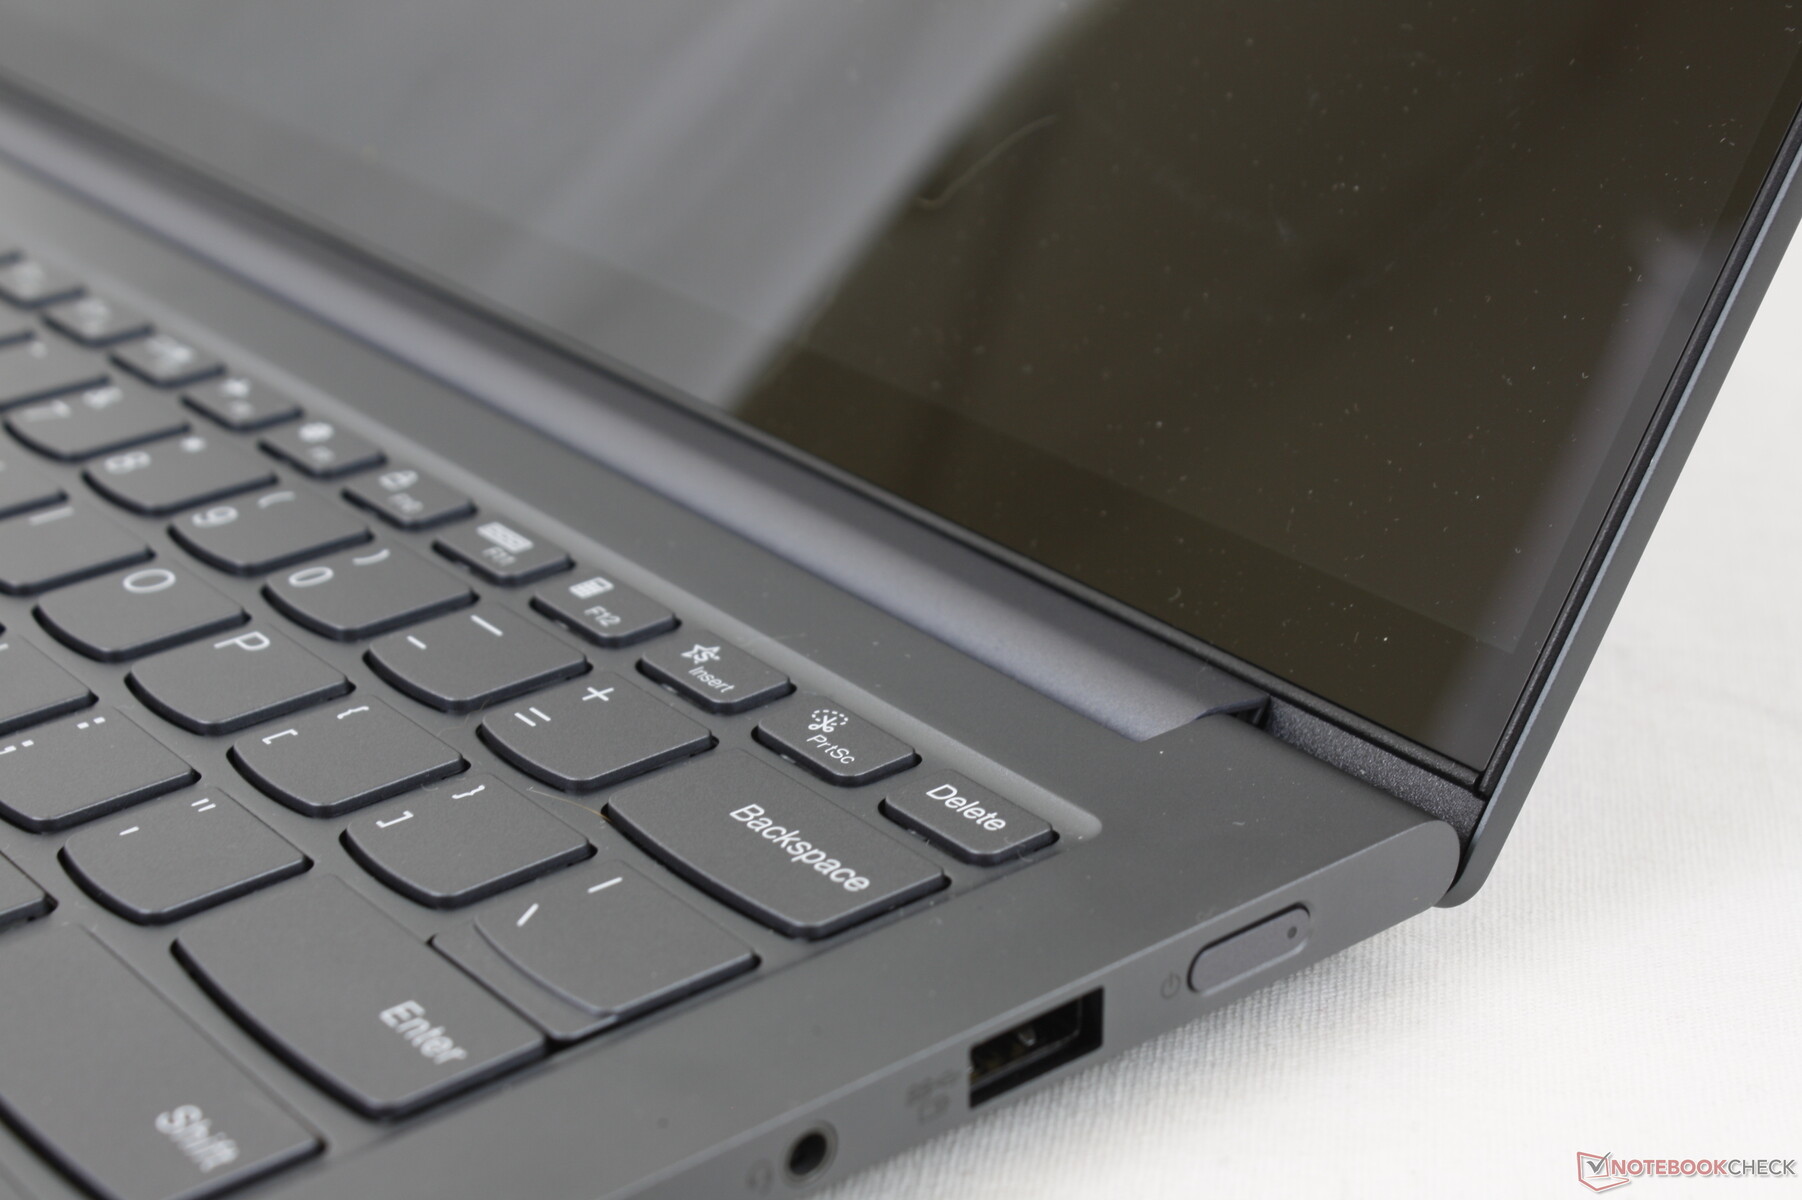
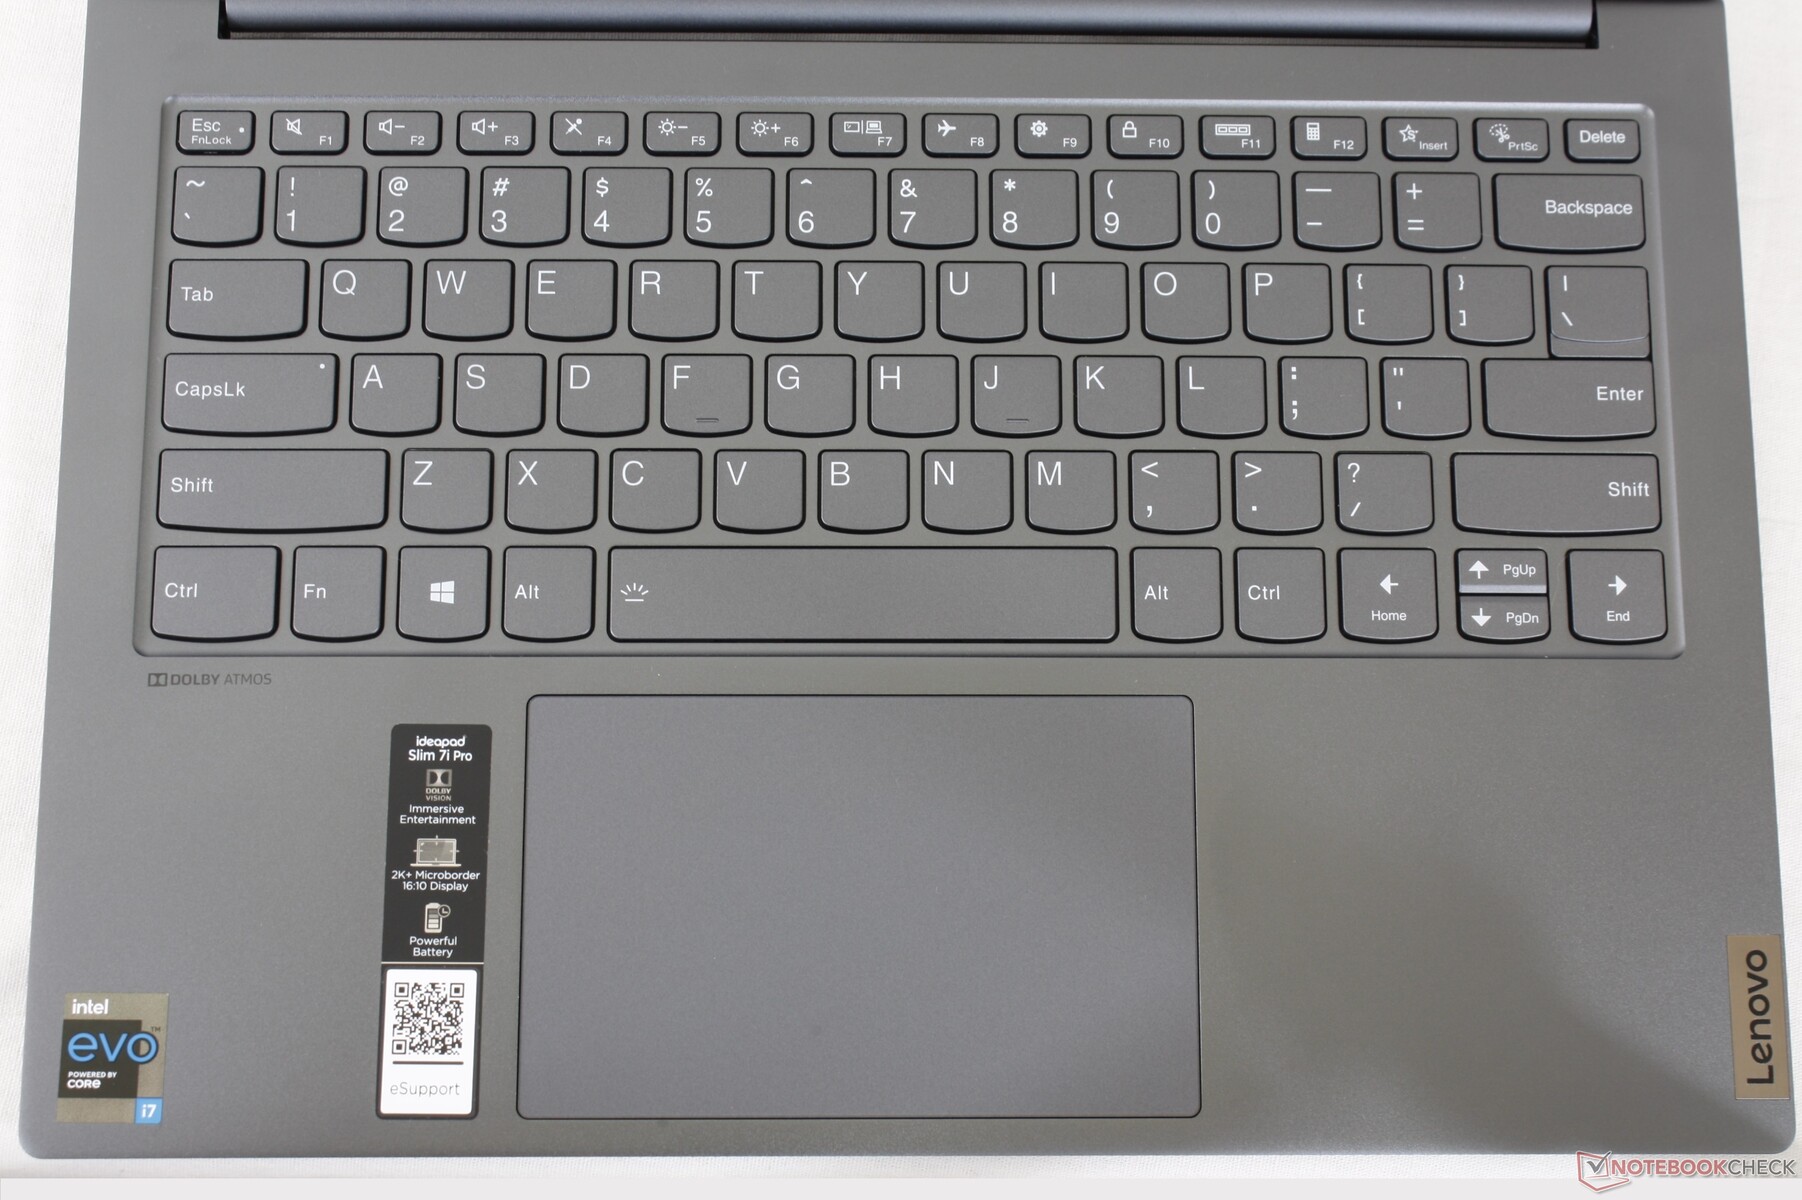
Input Devices — Spongy Feedback
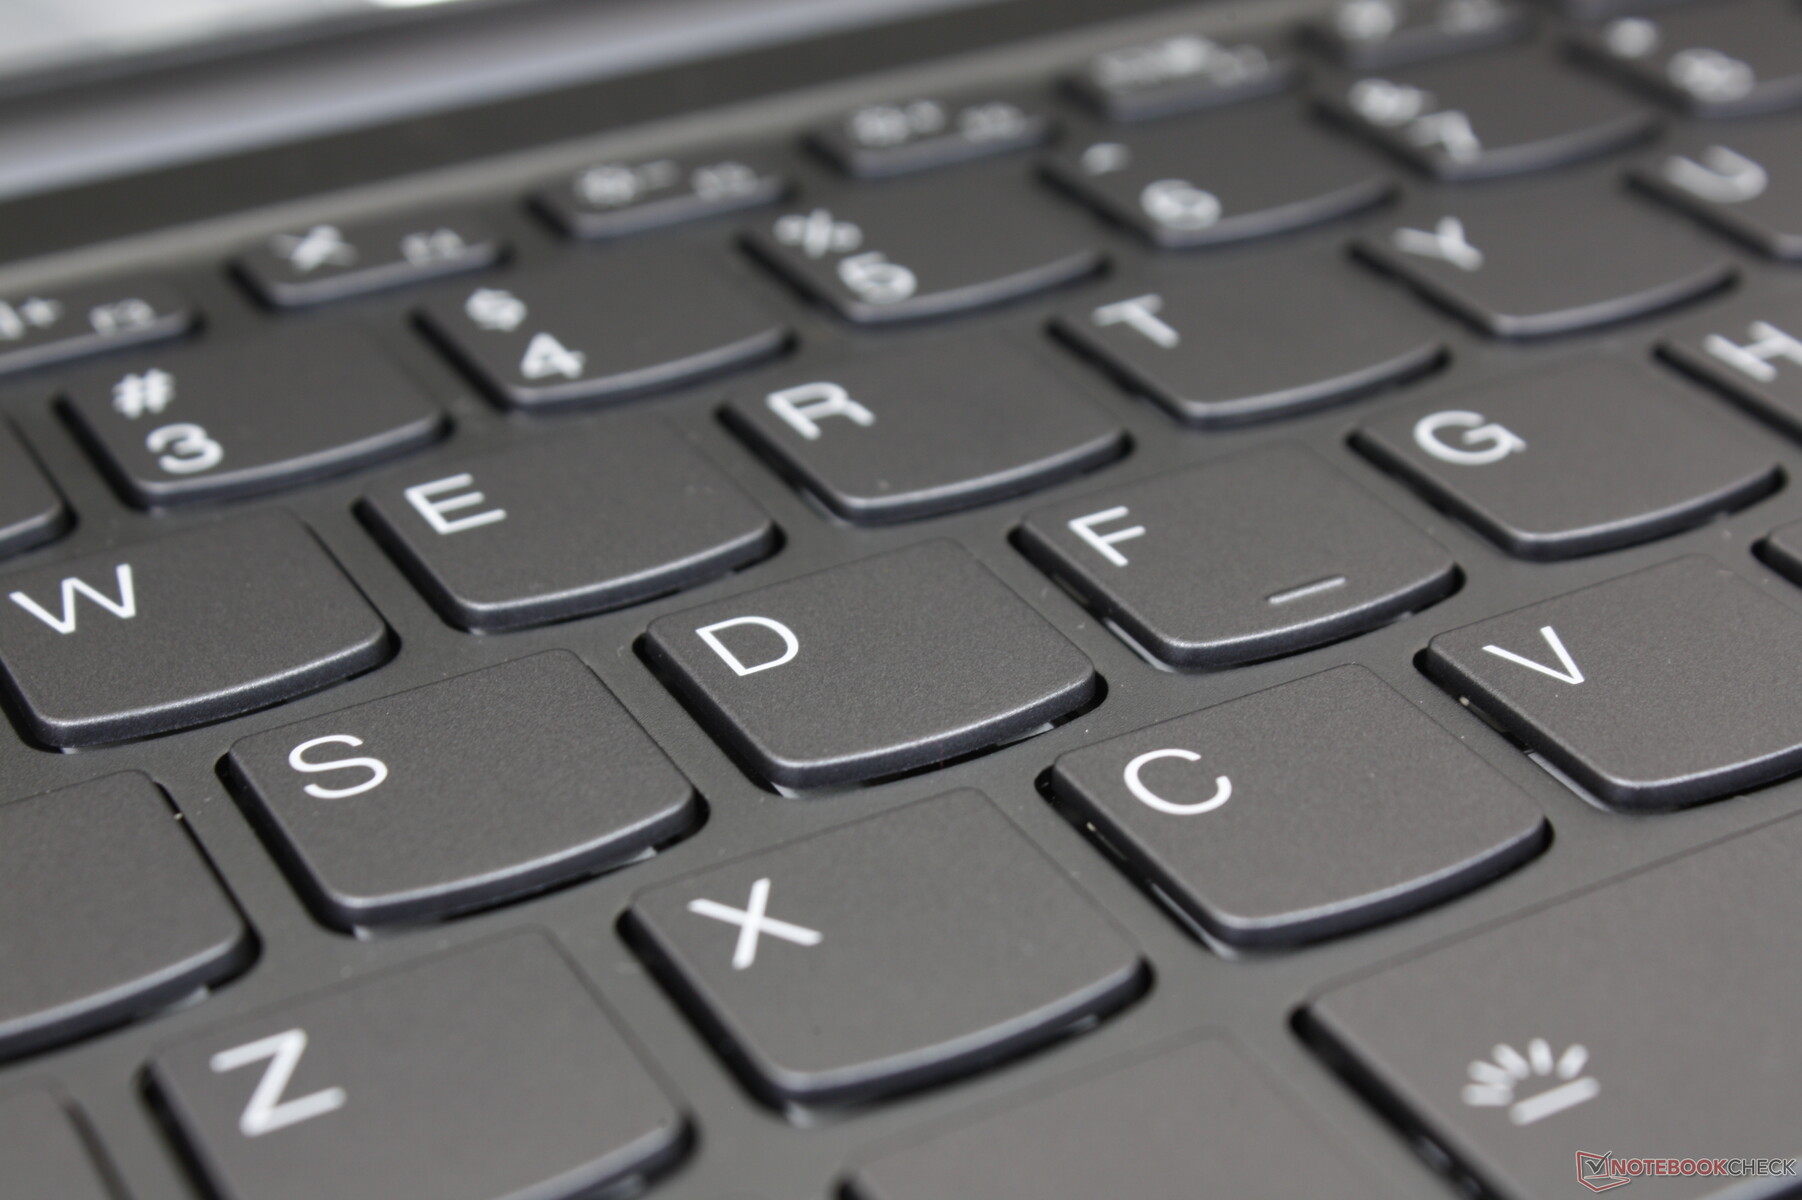
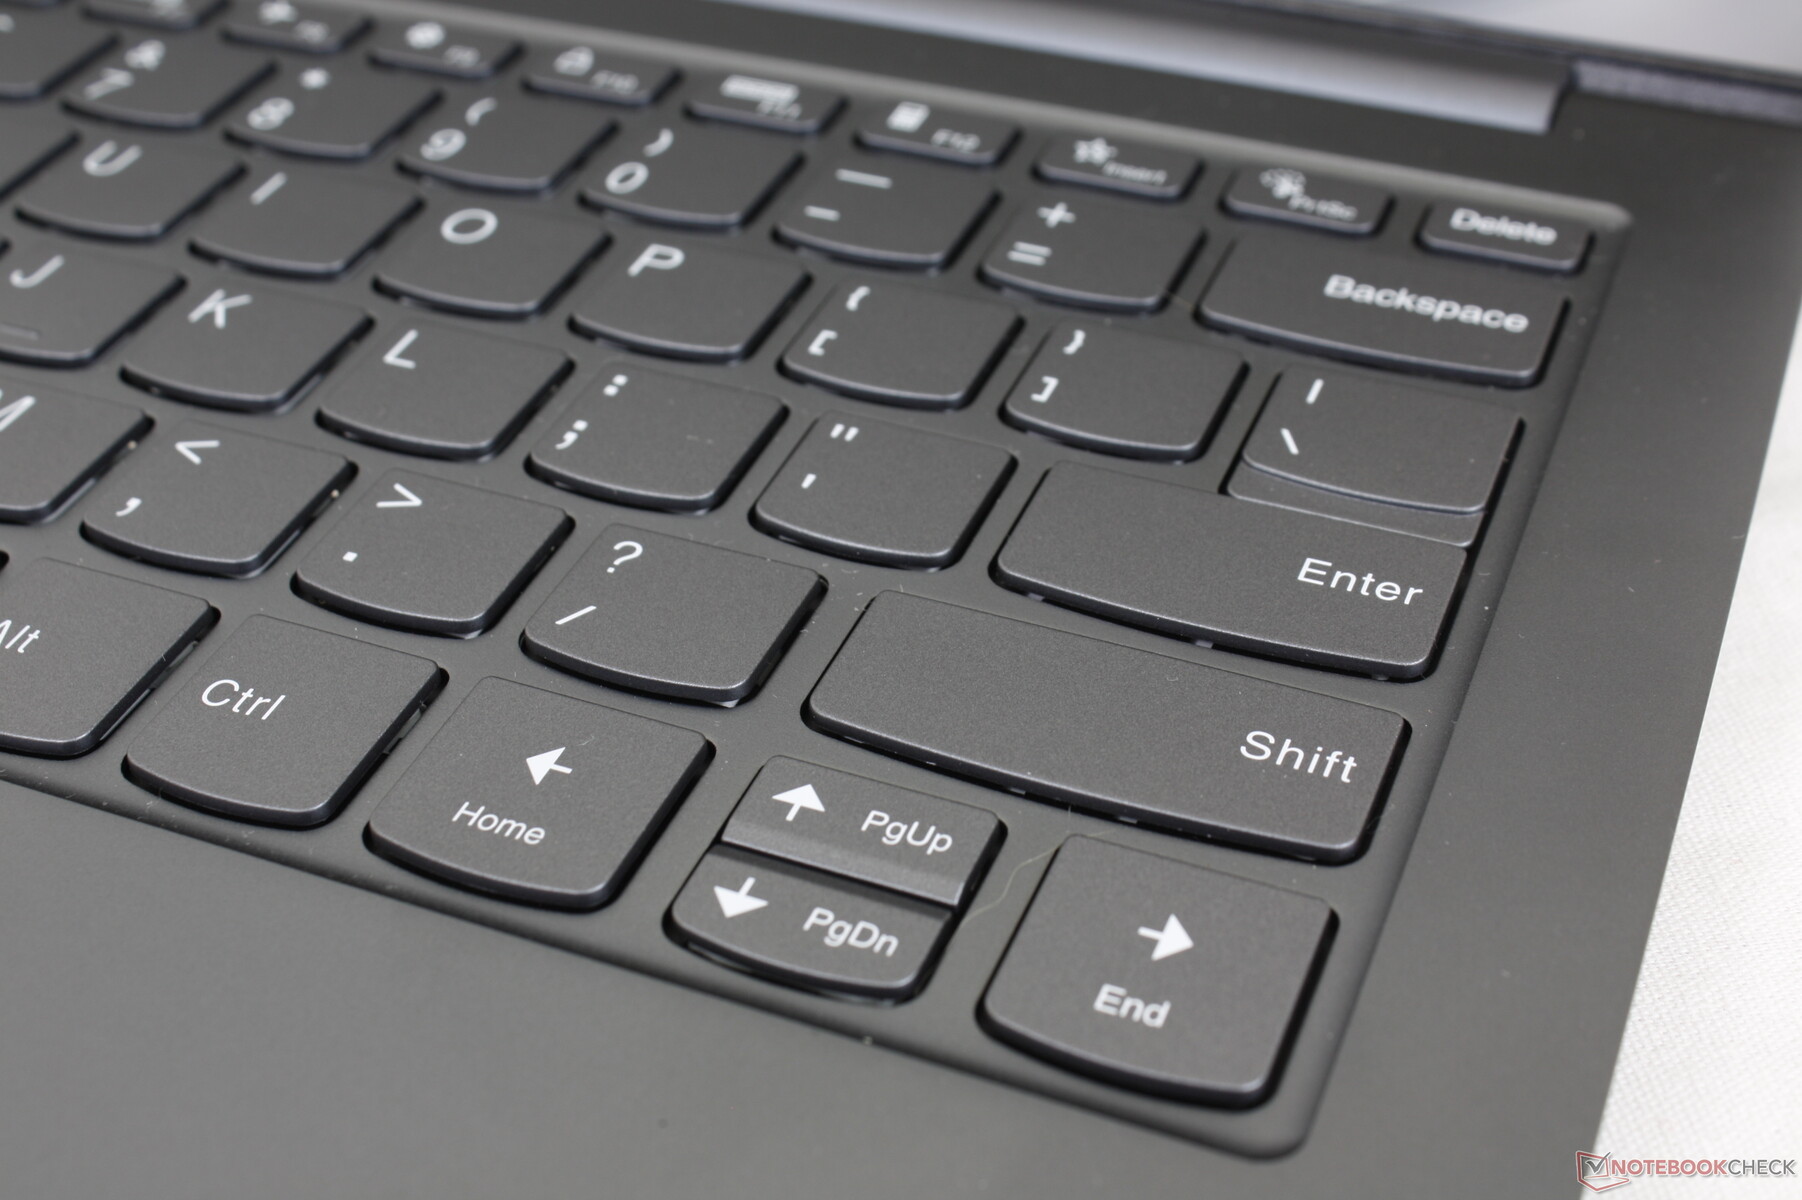
Most IdeaPad and Yoga laptops come with similar keyboard layouts and key feedback. Though we appreciate the consistency, Lenovo IdeaPad/Yoga keyboards are generally more budget-oriented despite the often $1000+ asking price. Feedback is both spongier and shallower than the firmer and deeper keys on competing models like the HP Envy or Spectre or the Huawei MateBook 14. We know Lenovo is capable of producing much better keyboards as exemplified by their ThinkPad T or X series of laptops.
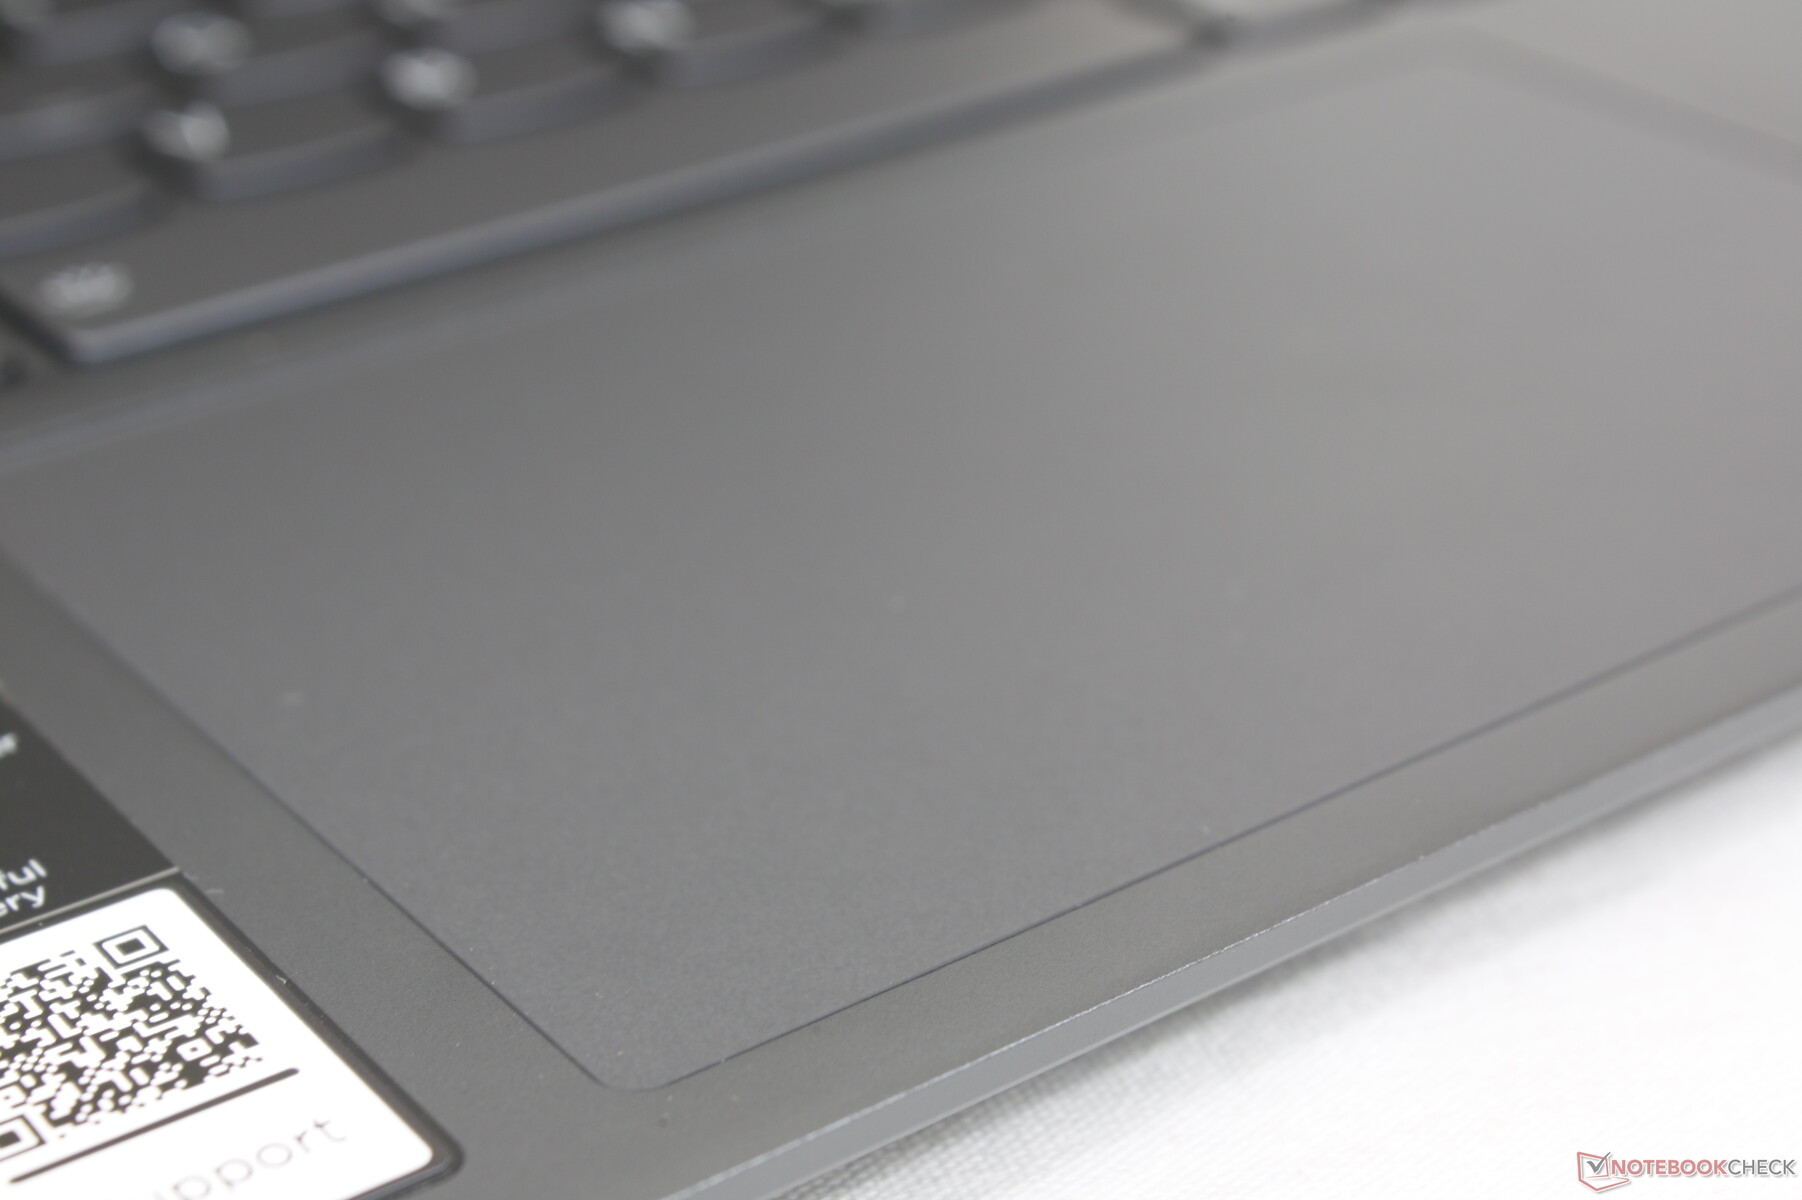
The clickpad is large and with minimal sticking even when gliding at slower speeds. Unfortunately, its integrated click keys are very shallow and spongy for unsatisfying feedback.
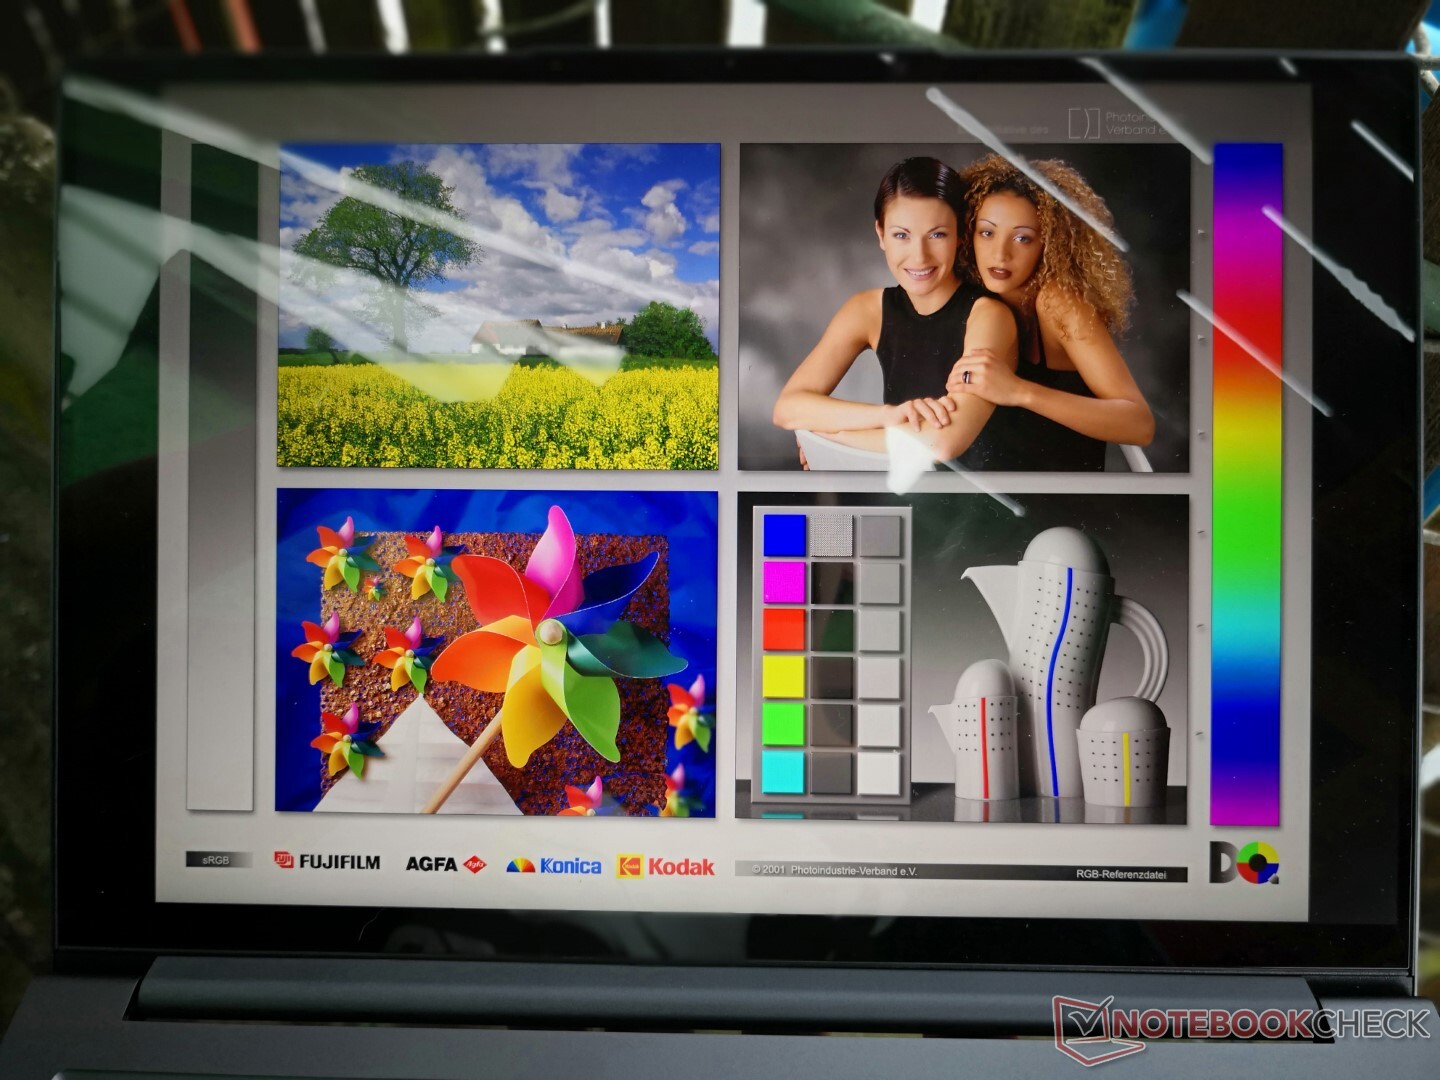
Display — 90 Hz is the New 60 Hz
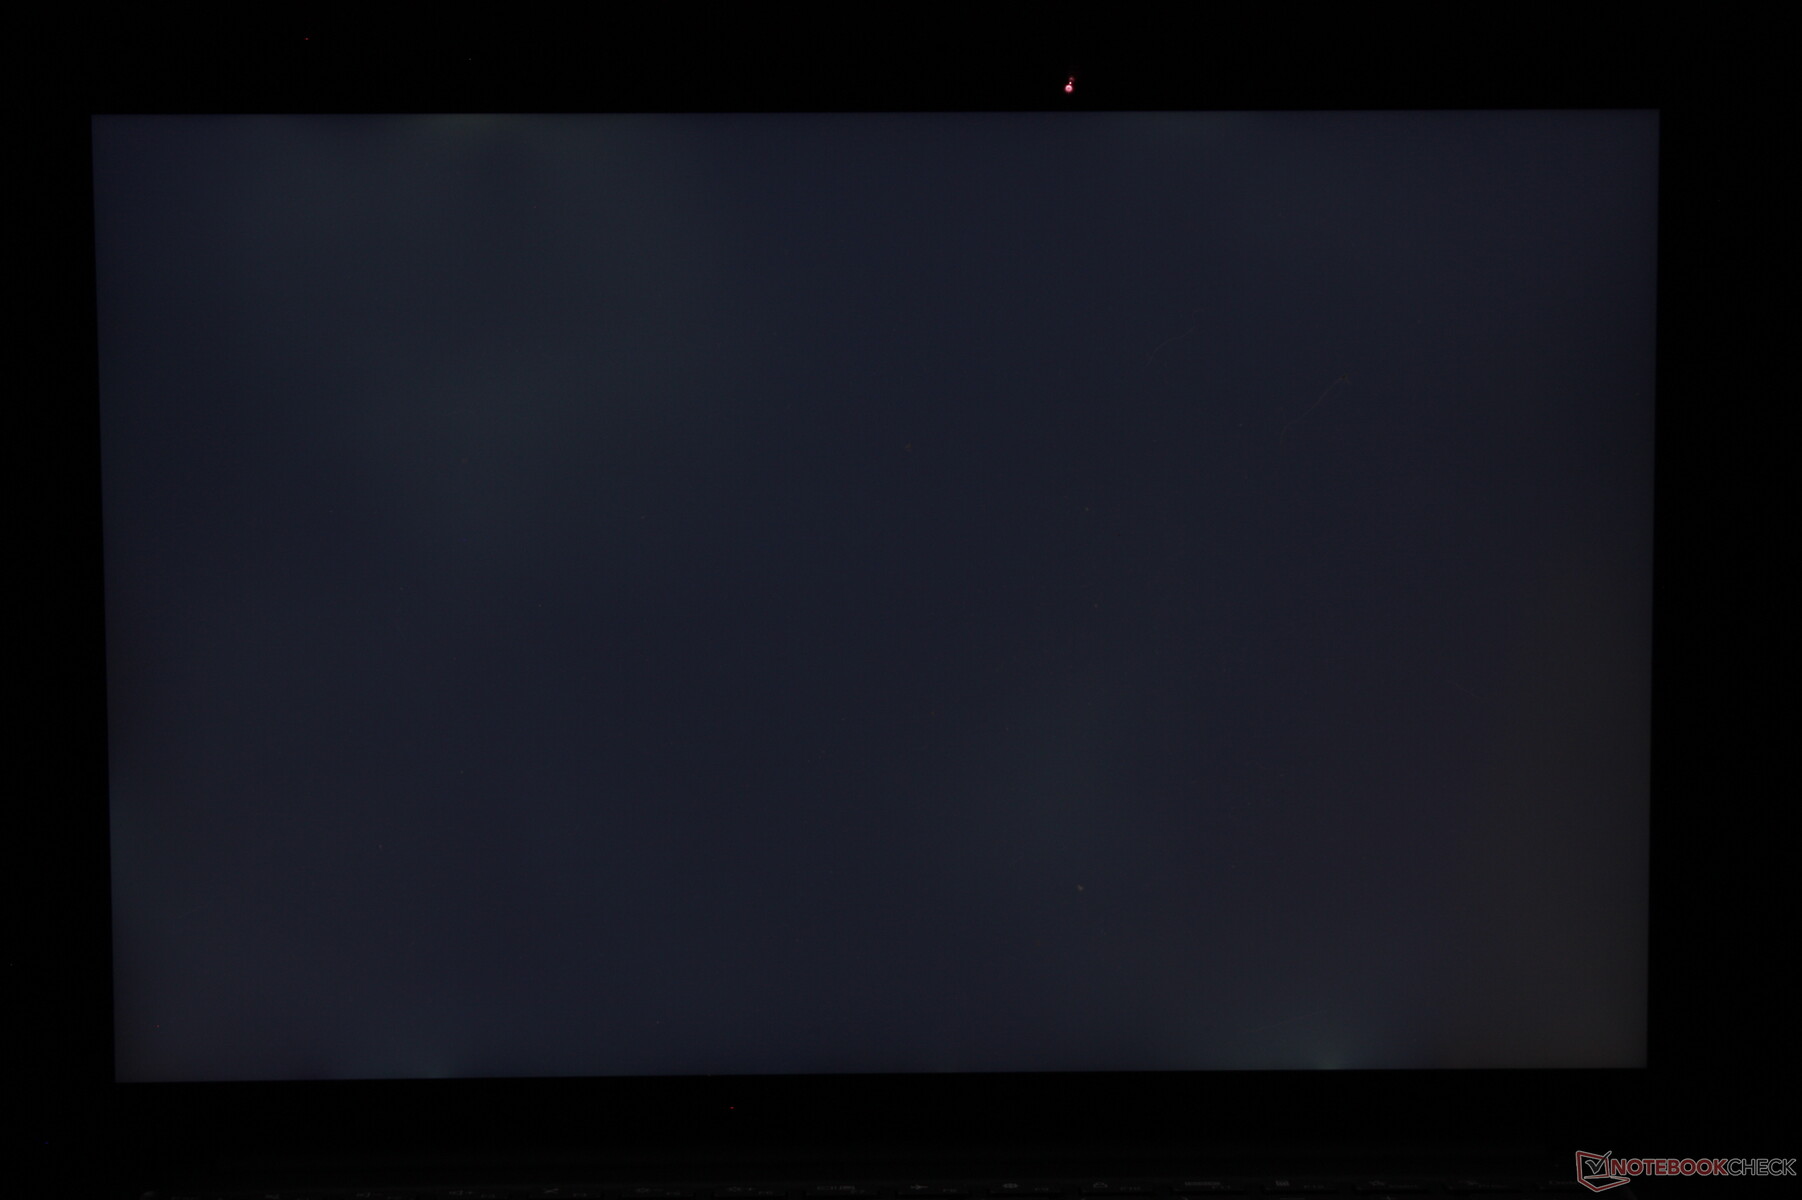
Lenovo uses the same high quality 1800p LEN140WQ+ IPS panel and LEN8A90 display controller between the IdeaPad Slim 7i Pro and Yoga Slim 7 Pro. Thus, both laptops share similar attributes including their wide sRGB gamut, 400-nit brightness, and decent black-white and gray-gray response times. This is also one of the few (if not only) 16:10 1800p touchscreens with a native 90 Hz refresh rate for smoother movements than the usual 60 Hz panels on other Ultrabooks. A 60 Hz setting is available should users prefer that mode for certain applications such as games.


| |||||||||||||||||||||||||
Brightness Distribution: 91 %
Center on Battery: 410 cd/m²
Contrast: 1414:1 (Black: 0.29 cd/m²)
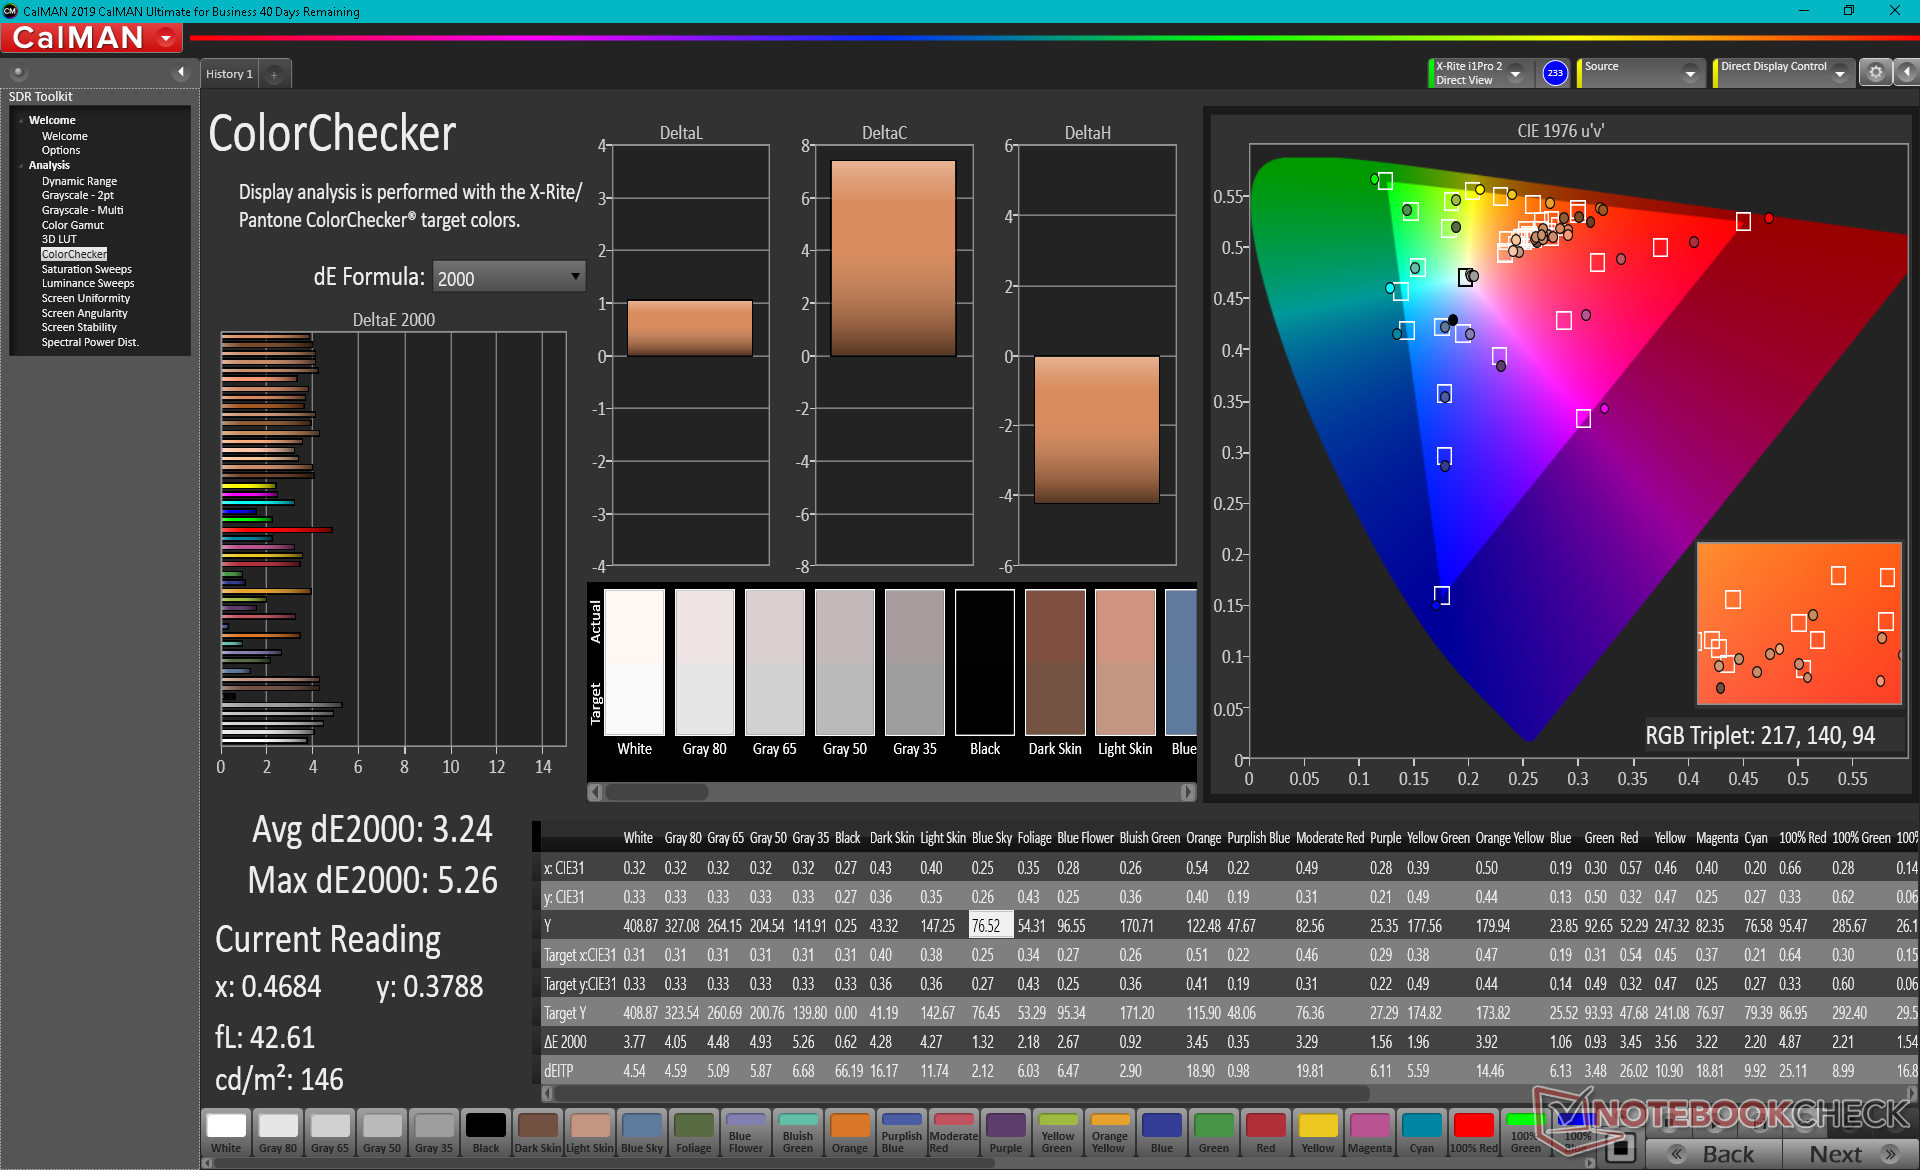
ΔE ColorChecker Calman: 3.24 | ∀{0.5-29.43 Ø4.78}
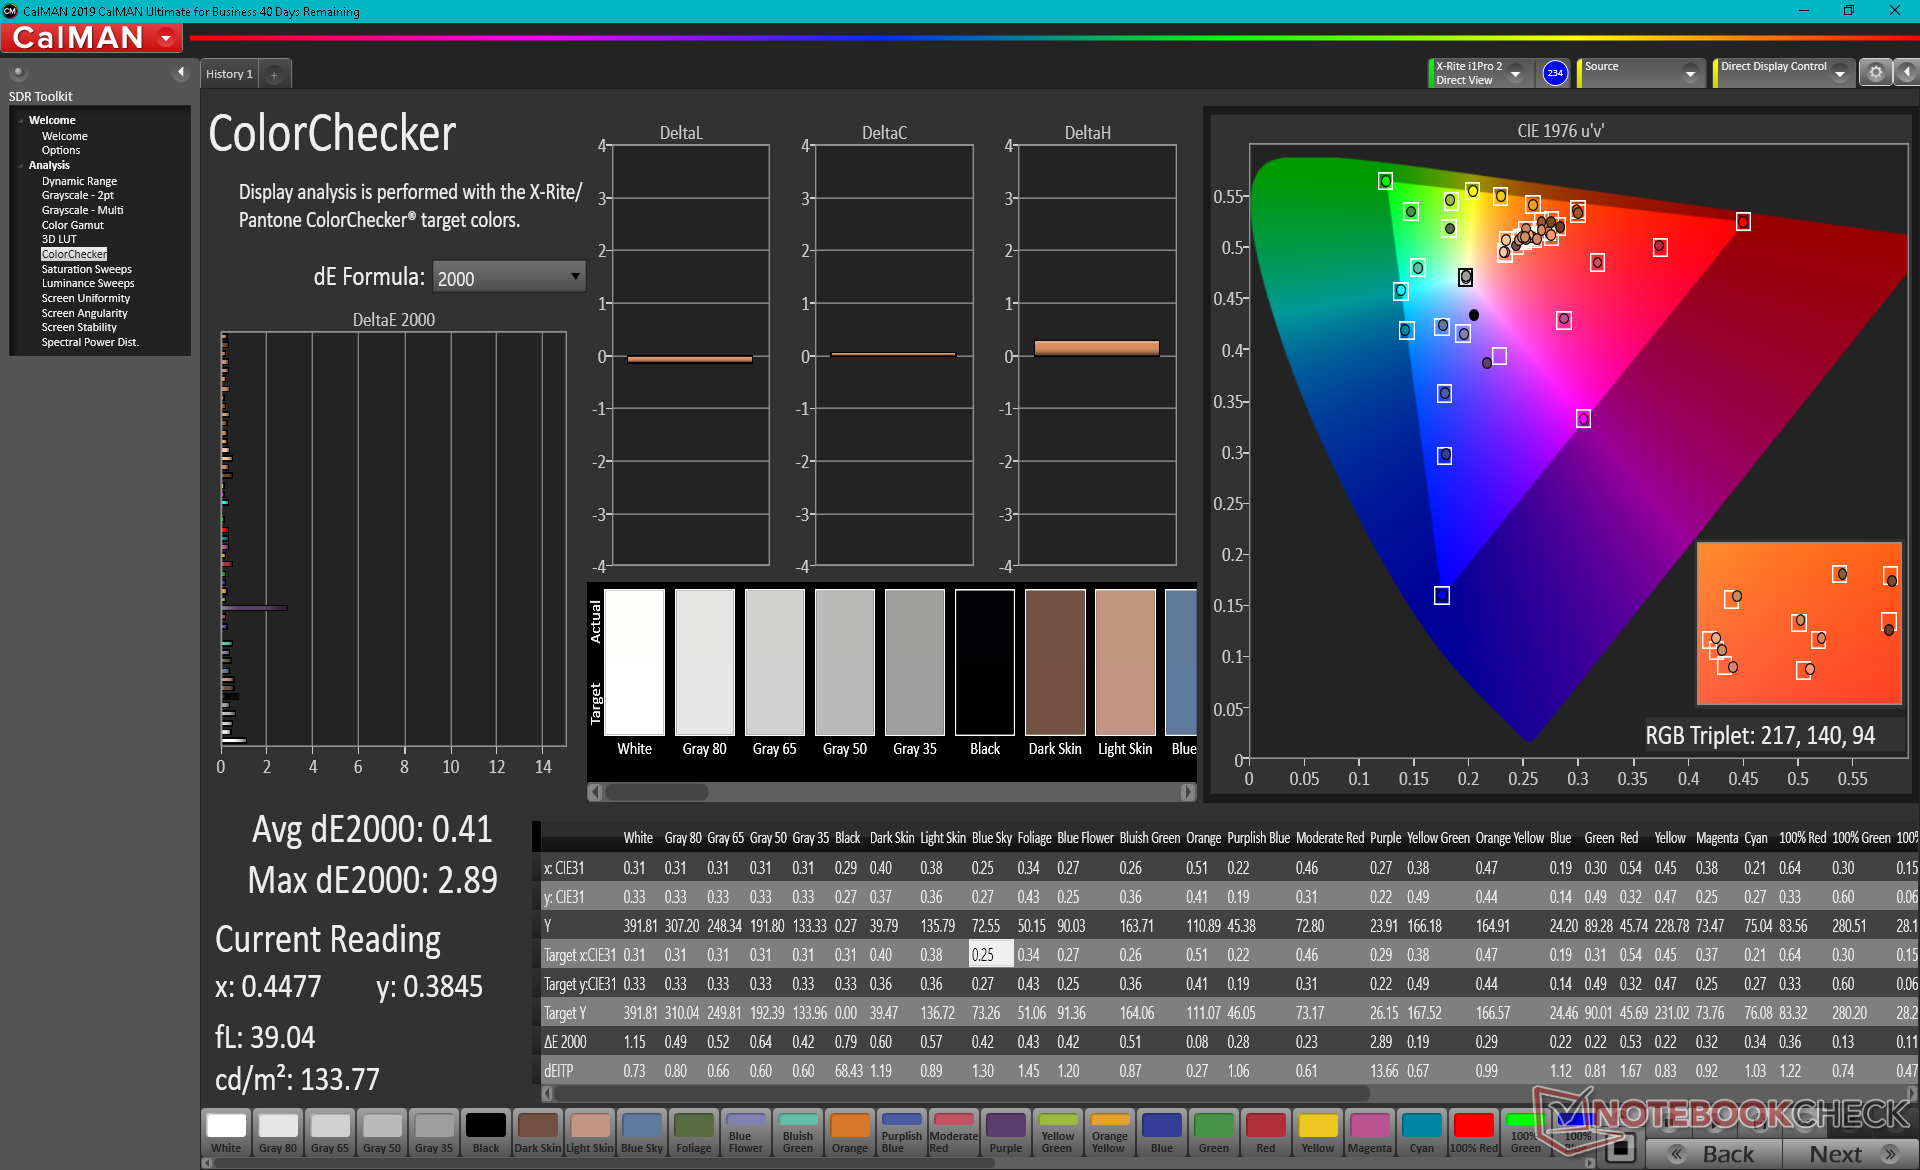
calibrated: 0.41
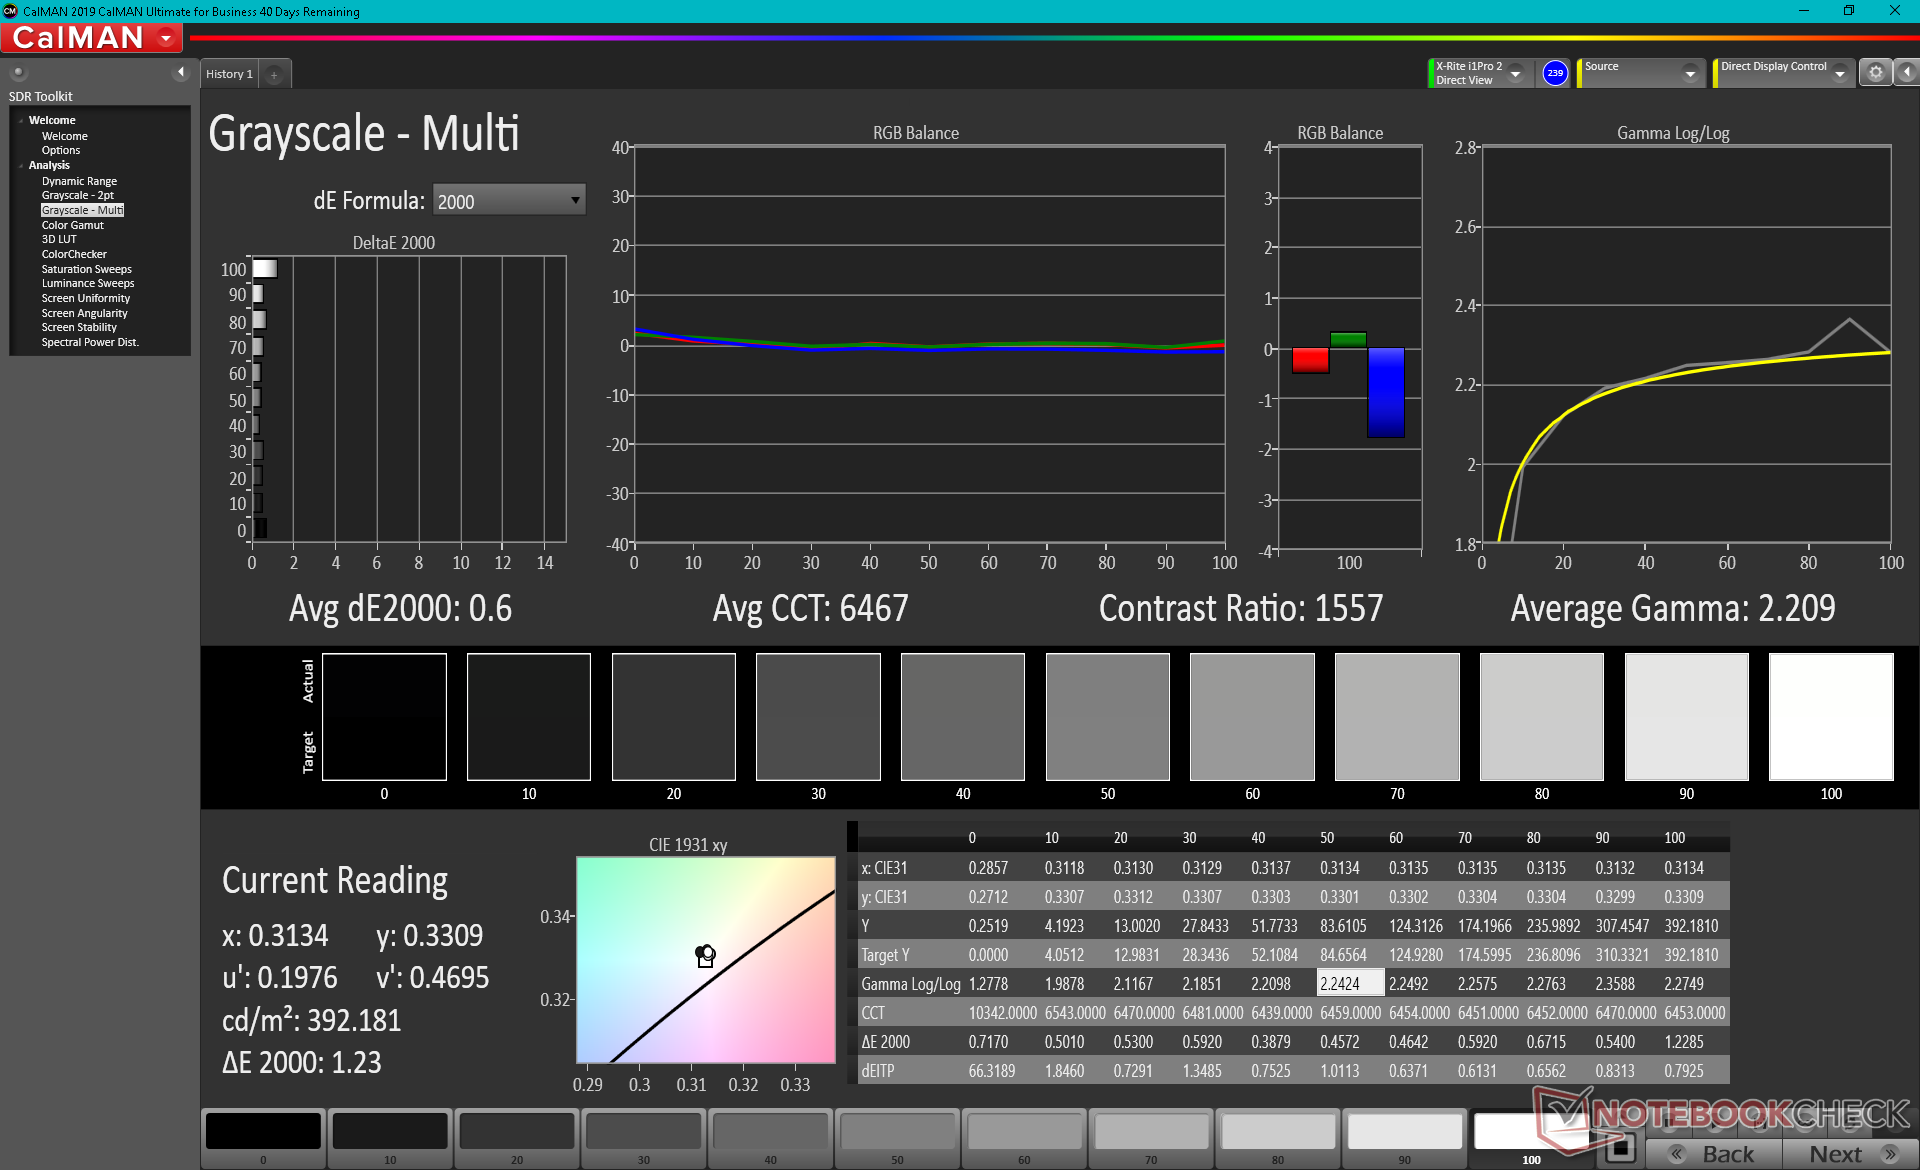
ΔE Greyscale Calman: 4.2 | ∀{0.09-98 Ø5}
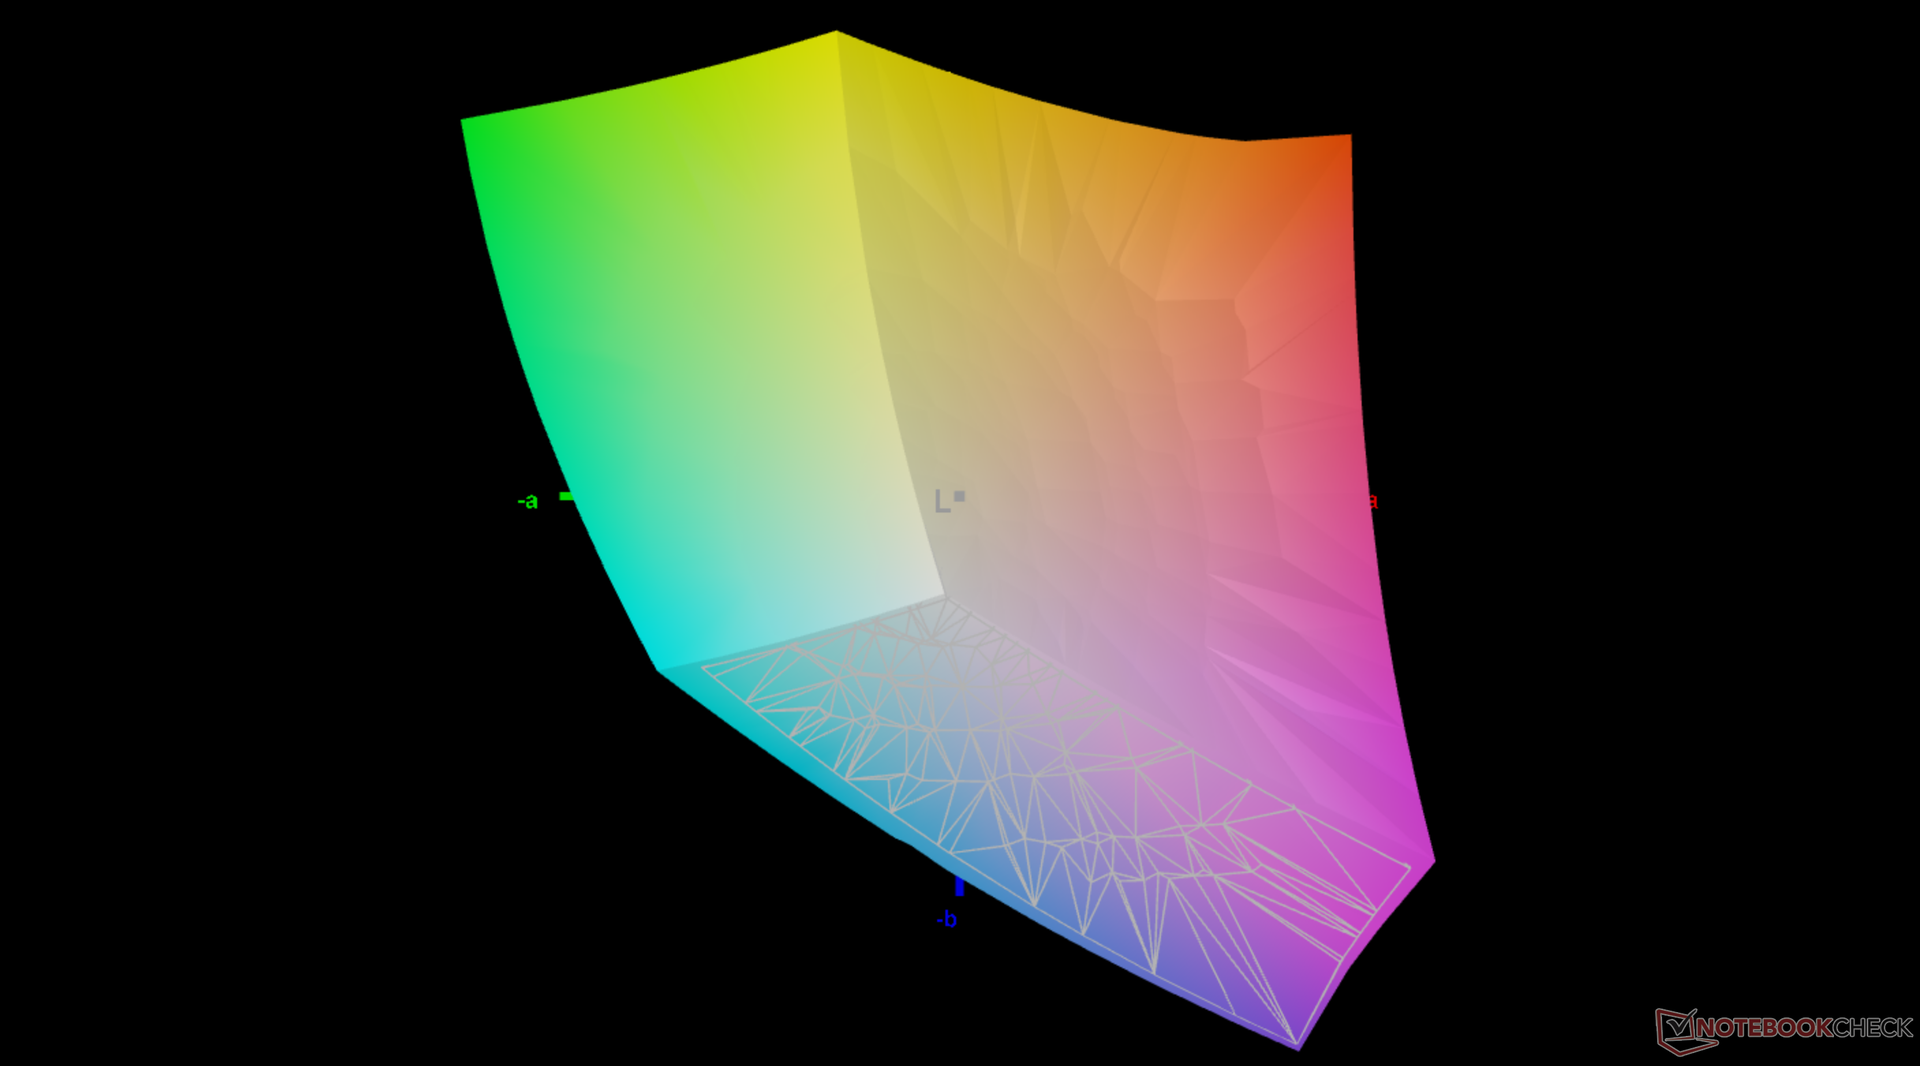
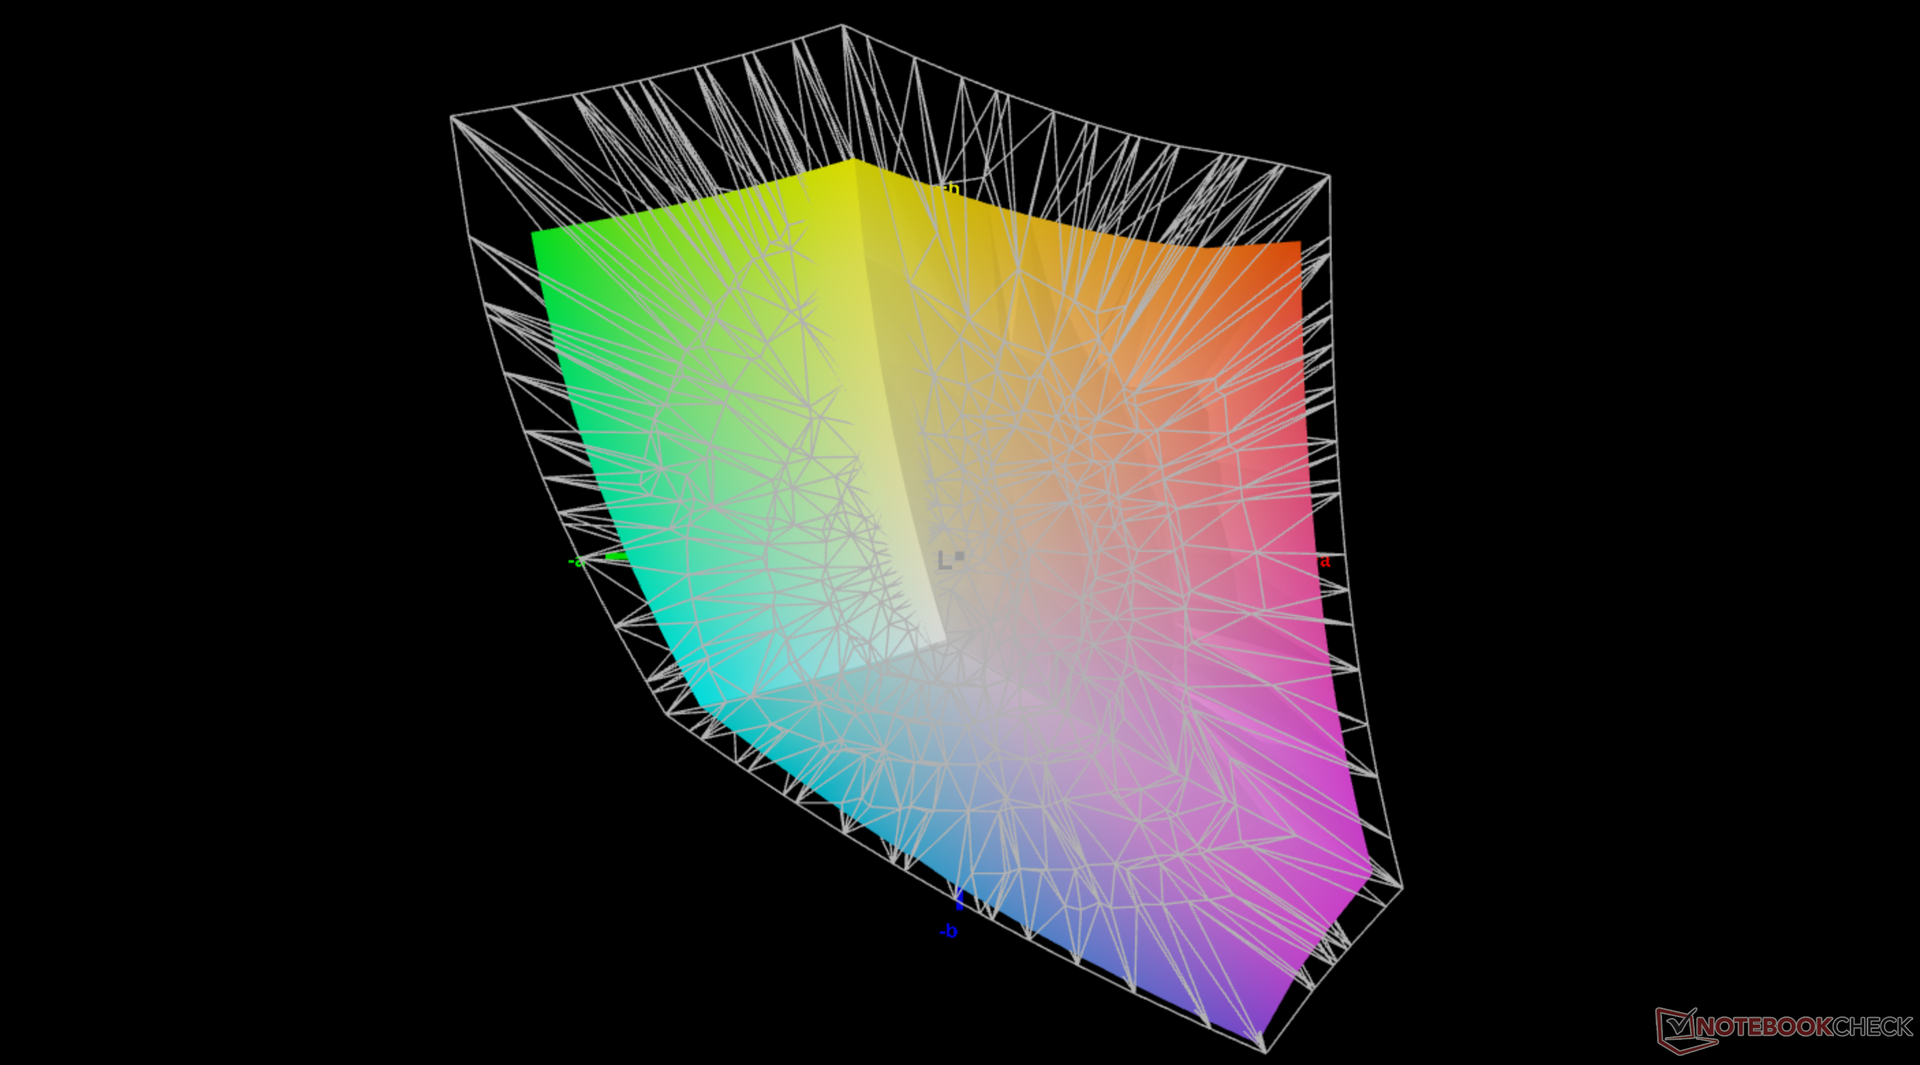
76.7% AdobeRGB 1998 (Argyll 3D)
99.8% sRGB (Argyll 3D)
76.9% Display P3 (Argyll 3D)
Gamma: 2.18
CCT: 6012 K
| Lenovo IdeaPad Slim 7i Pro 14IHU5 LEN140WQ+, IPS, 2880x1800, 14" | Lenovo Yoga Slim 7 14ITL05 82A300CNGE AU Optronics B140HAN06.8, IPS, 1920x1080, 14" | Huawei MateBook 14s i7 CSOTT3 U17B MNE208ZA1-3, LTPS, 2520x1680, 14.2" | Asus Zenbook 14X UX5400E Samsung SDC4154, OLED, 2880x1800, 14" | MSI Summit E14 A11SCS AU Optronics AUO123B, IPS, 3840x2160, 14" | Razer Blade 14 Ryzen 9 RTX 3070 TL140BDXP02-2, IPS, 2560x1440, 14" | |
|---|---|---|---|---|---|---|
| Display | -9% | -8% | 18% | 15% | 12% | |
| Display P3 Coverage (%) | 76.9 | 66.3 -14% | 67.8 -12% | 100 30% | 87.5 14% | 97.2 26% |
| sRGB Coverage (%) | 99.8 | 97.4 -2% | 98.3 -2% | 100 0% | 100 0% | 99.9 0% |
| AdobeRGB 1998 Coverage (%) | 76.7 | 68.1 -11% | 70.1 -9% | 96 25% | 99.4 30% | 85.4 11% |
| Response Times | -45% | 1% | 93% | -41% | 54% | |
| Response Time Grey 50% / Grey 80% * (ms) | 36.4 ? | 52 ? -43% | 37.6 ? -3% | 2 ? 95% | 52 ? -43% | 16.4 ? 55% |
| Response Time Black / White * (ms) | 22.4 ? | 33 ? -47% | 21.6 ? 4% | 2 ? 91% | 30.8 ? -38% | 10.8 ? 52% |
| PWM Frequency (Hz) | 143 ? | 27780 ? | ||||
| Screen | -28% | 5% | -18% | -113% | 1% | |
| Brightness middle (cd/m²) | 410 | 344 -16% | 419 2% | 379 -8% | 593.3 45% | 331.1 -19% |
| Brightness (cd/m²) | 395 | 340 -14% | 407 3% | 381 -4% | 571 45% | 318 -19% |
| Brightness Distribution (%) | 91 | 88 -3% | 93 2% | 93 2% | 87 -4% | 91 0% |
| Black Level * (cd/m²) | 0.29 | 0.13 55% | 0.23 21% | 0.1 66% | 0.53 -83% | 0.36 -24% |
| Contrast (:1) | 1414 | 2646 87% | 1822 29% | 3790 168% | 1119 -21% | 920 -35% |
| Colorchecker dE 2000 * | 3.24 | 3.29 -2% | 1.9 41% | 2.3 29% | 4.42 -36% | 2.25 31% |
| Colorchecker dE 2000 max. * | 5.26 | 7.48 -42% | 3.6 32% | 4.16 21% | 7.16 -36% | 4.62 12% |
| Colorchecker dE 2000 calibrated * | 0.41 | 1.79 -337% | 0.9 -120% | 2.42 -490% | 4.3 -949% | |
| Greyscale dE 2000 * | 4.2 | 3.25 23% | 2.9 31% | 2.12 50% | 3.2 24% | 1.7 60% |
| Gamma | 2.18 101% | 2.29 96% | 2.14 103% | 2.42 91% | 2.04 108% | 2.3 96% |
| CCT | 6012 108% | 6358 102% | 6733 97% | 6737 96% | 6751 96% | |
| Total Average (Program / Settings) | -27% /
-26% | -1% /
1% | 31% /
5% | -46% /
-75% | 22% /
12% |
* ... smaller is better
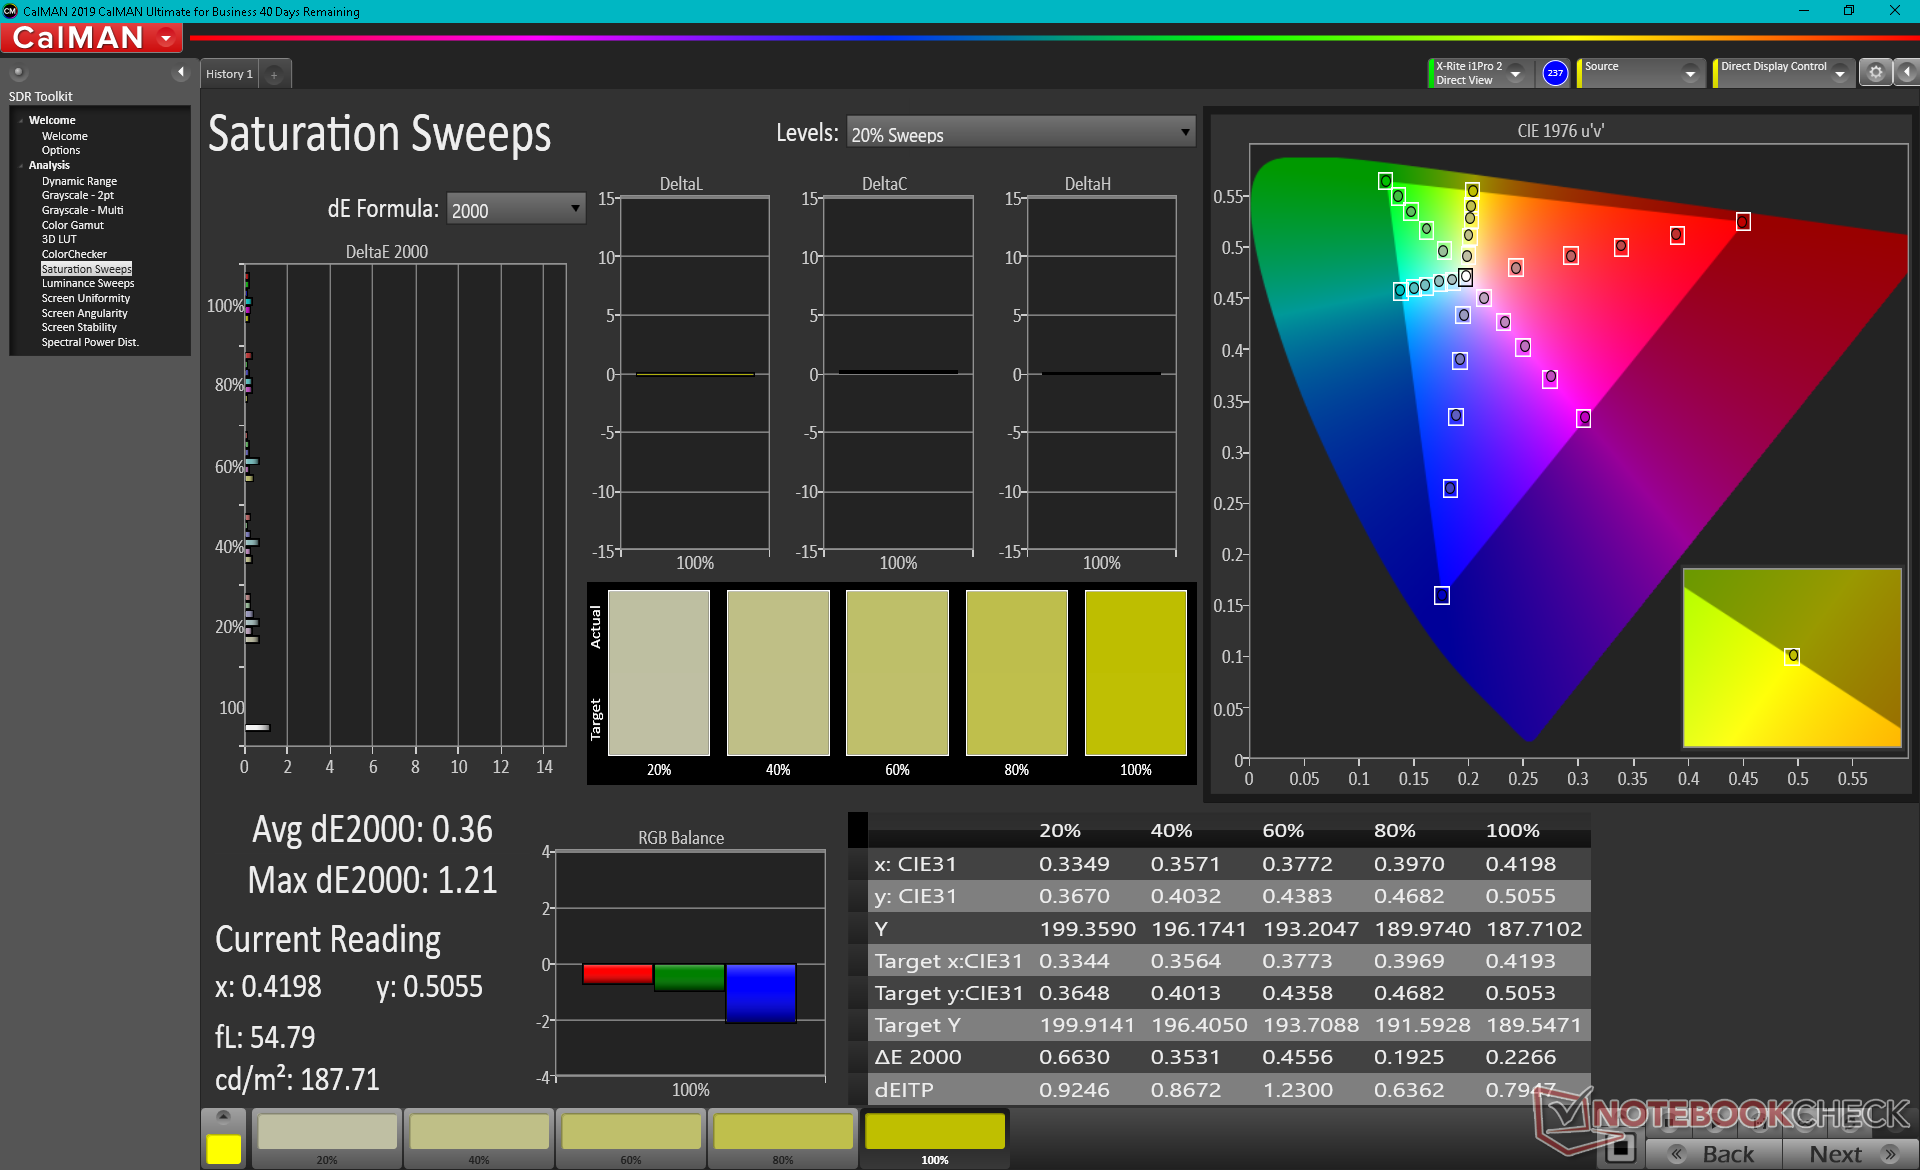
Color coverage is wider than the 1080p panel on the Yoga Slim 7 (77% vs. 66% DCI-P3) while being narrower than the 1440p panel on the Razer Blade 14 (97%). Nonetheless, the 100% sRGB coverage should satisfy most users who want a panel for both gaming and content creation.
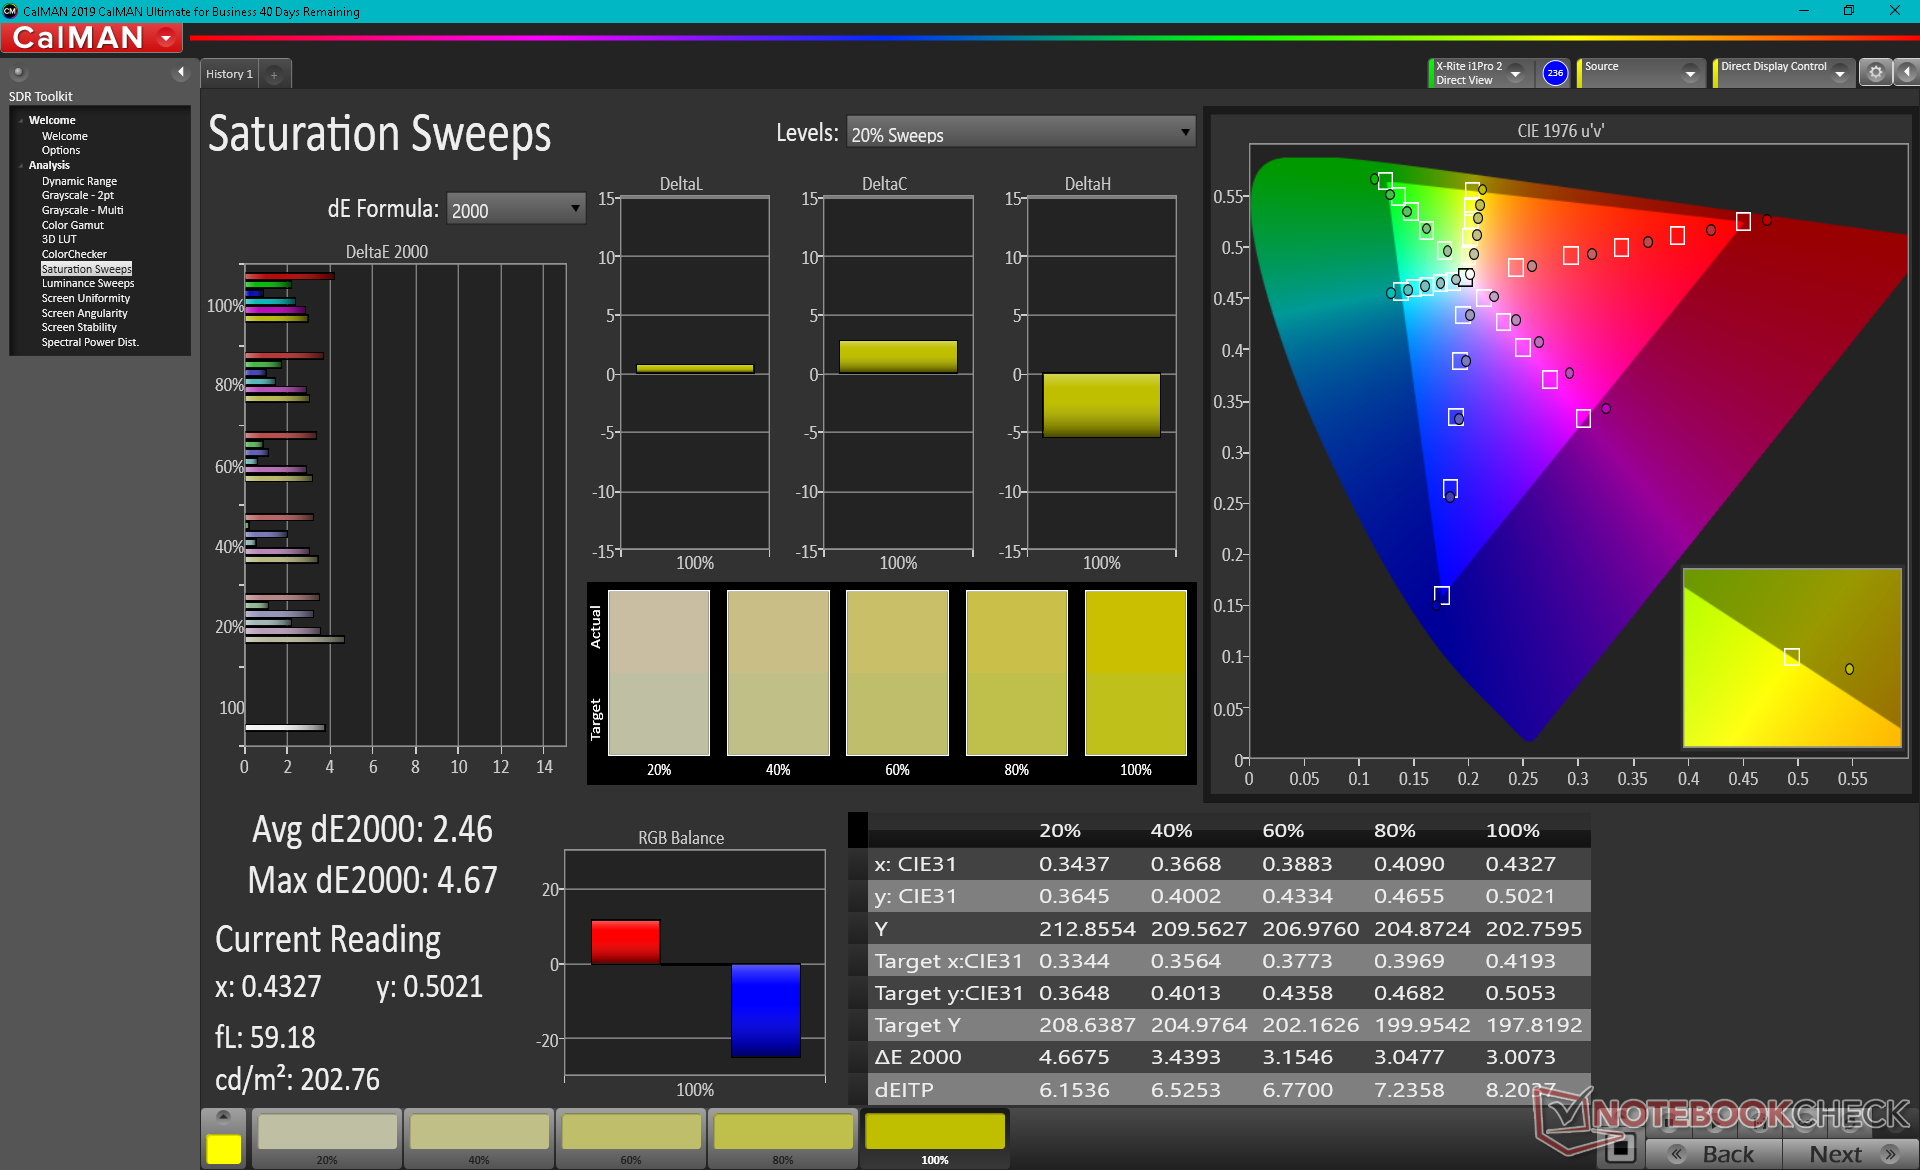
X-Rite colorimeter measurements reveal an overly warm color temperature out of the box. Once properly calibrated, average grayscale and color deltaE values would dip to just 0.6 and 0.41, respectively, to better exploit the wide colors and deep contrast levels of the panel.

Display Response Times
| ↔ Response Time Black to White | ||
|---|---|---|
| 22.4 ms ... rise ↗ and fall ↘ combined | ↗ 10 ms rise | 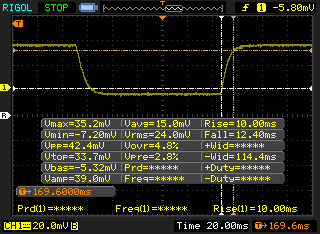 |
| ↘ 12.4 ms fall | ||
| The screen shows good response rates in our tests, but may be too slow for competitive gamers. In comparison, all tested devices range from 0.1 (minimum) to 240 (maximum) ms. » 49 % of all devices are better. This means that the measured response time is worse than the average of all tested devices (20.2 ms). | ||
| ↔ Response Time 50% Grey to 80% Grey | ||
| 36.4 ms ... rise ↗ and fall ↘ combined | ↗ 18 ms rise | 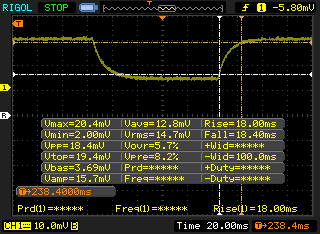 |
| ↘ 18.4 ms fall | ||
| The screen shows slow response rates in our tests and will be unsatisfactory for gamers. In comparison, all tested devices range from 0.165 (minimum) to 636 (maximum) ms. » 51 % of all devices are better. This means that the measured response time is worse than the average of all tested devices (31.6 ms). | ||
Screen Flickering / PWM (Pulse-Width Modulation)
| Screen flickering / PWM not detected | 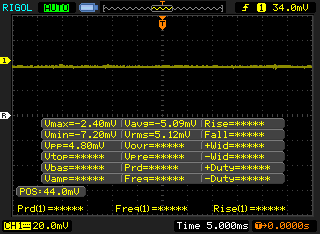 | ||
In comparison: 53 % of all tested devices do not use PWM to dim the display. If PWM was detected, an average of 8111 (minimum: 5 - maximum: 343500) Hz was measured. | |||
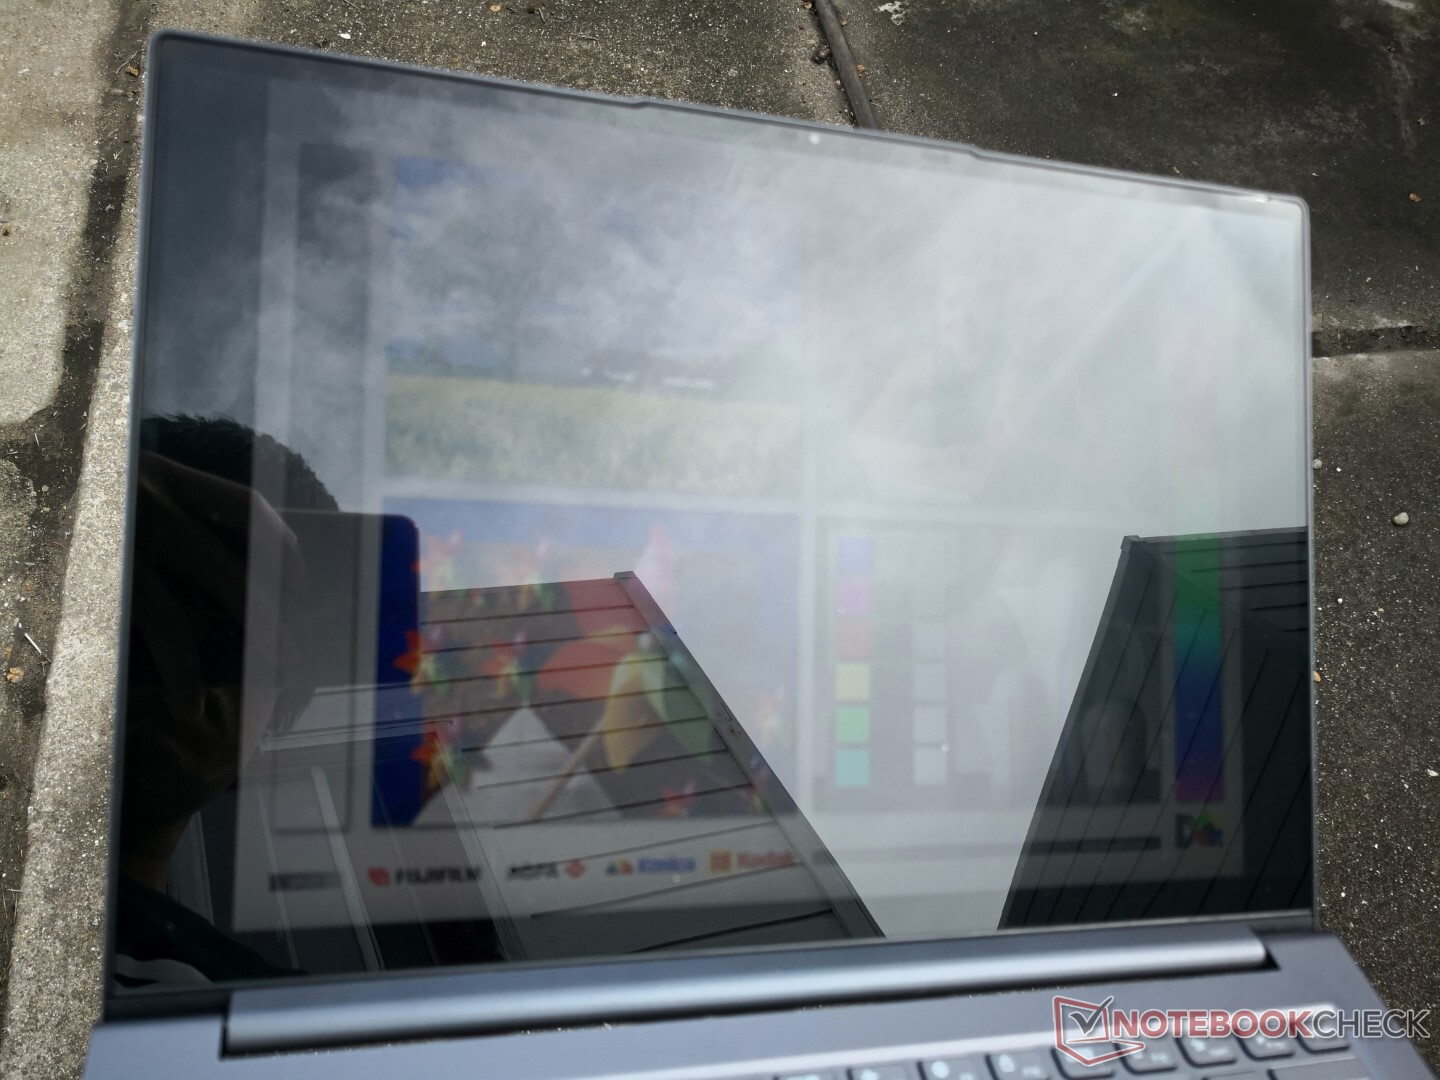
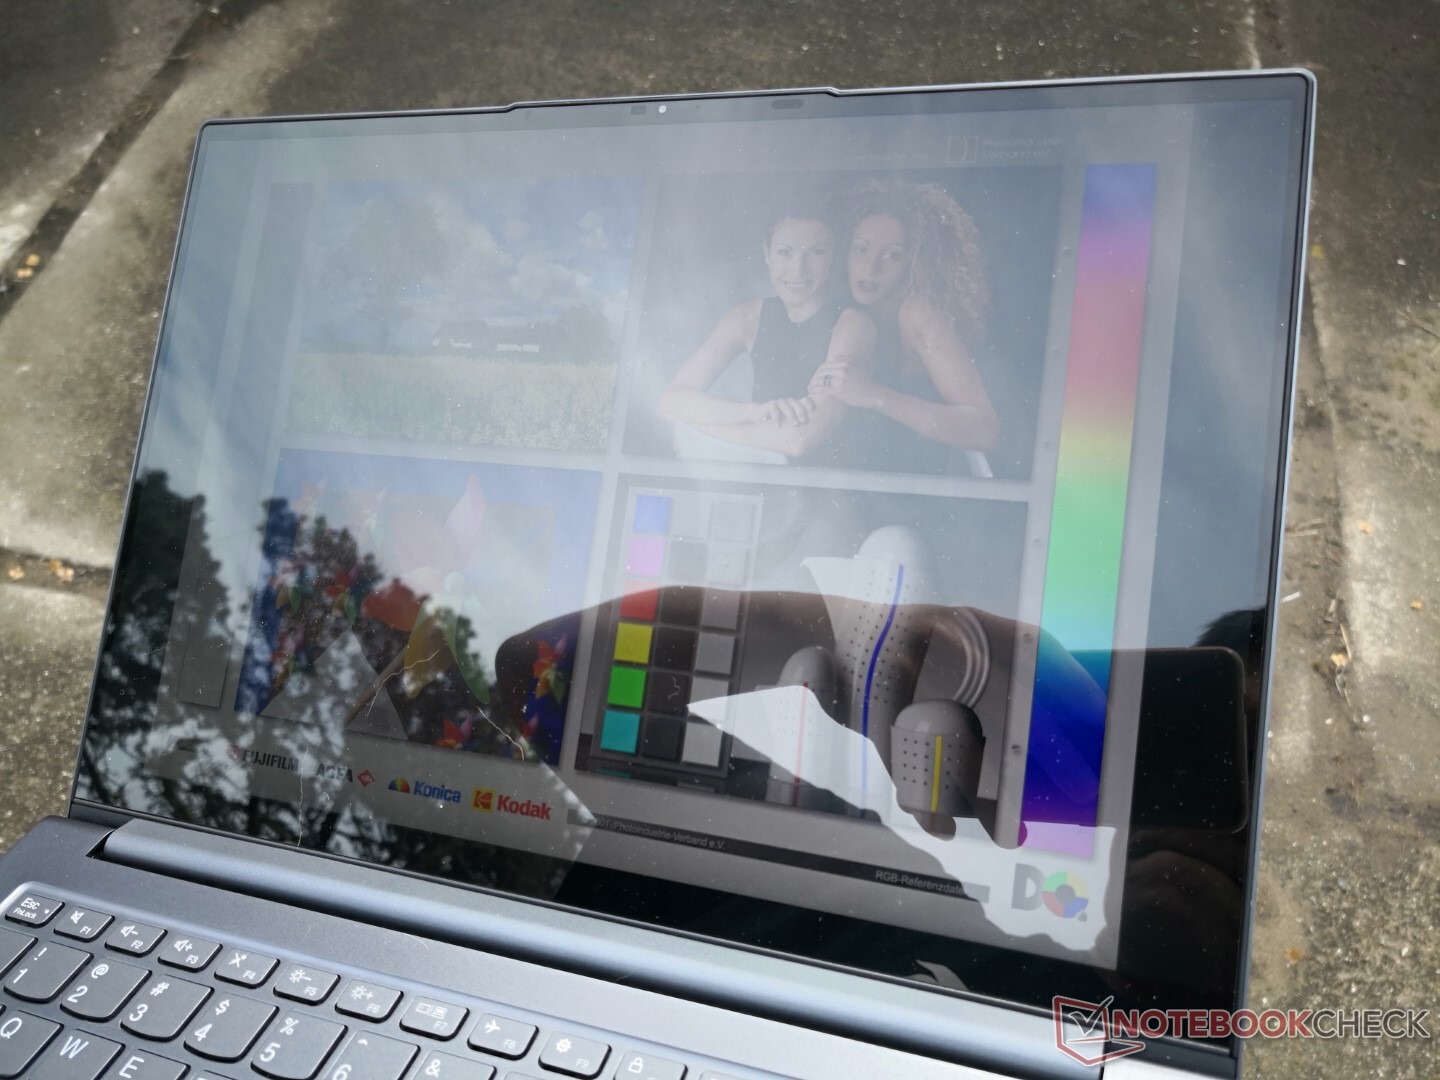
Outdoor visibility is good when under shade but poor when under brighter conditions due to the heavy glare from the glossy touchscreen. The MSI Summit E14 or Dell XPS 13 series come with brighter displays to reduce glare for improved visibility when outdoors.
Performance
Testing Conditions
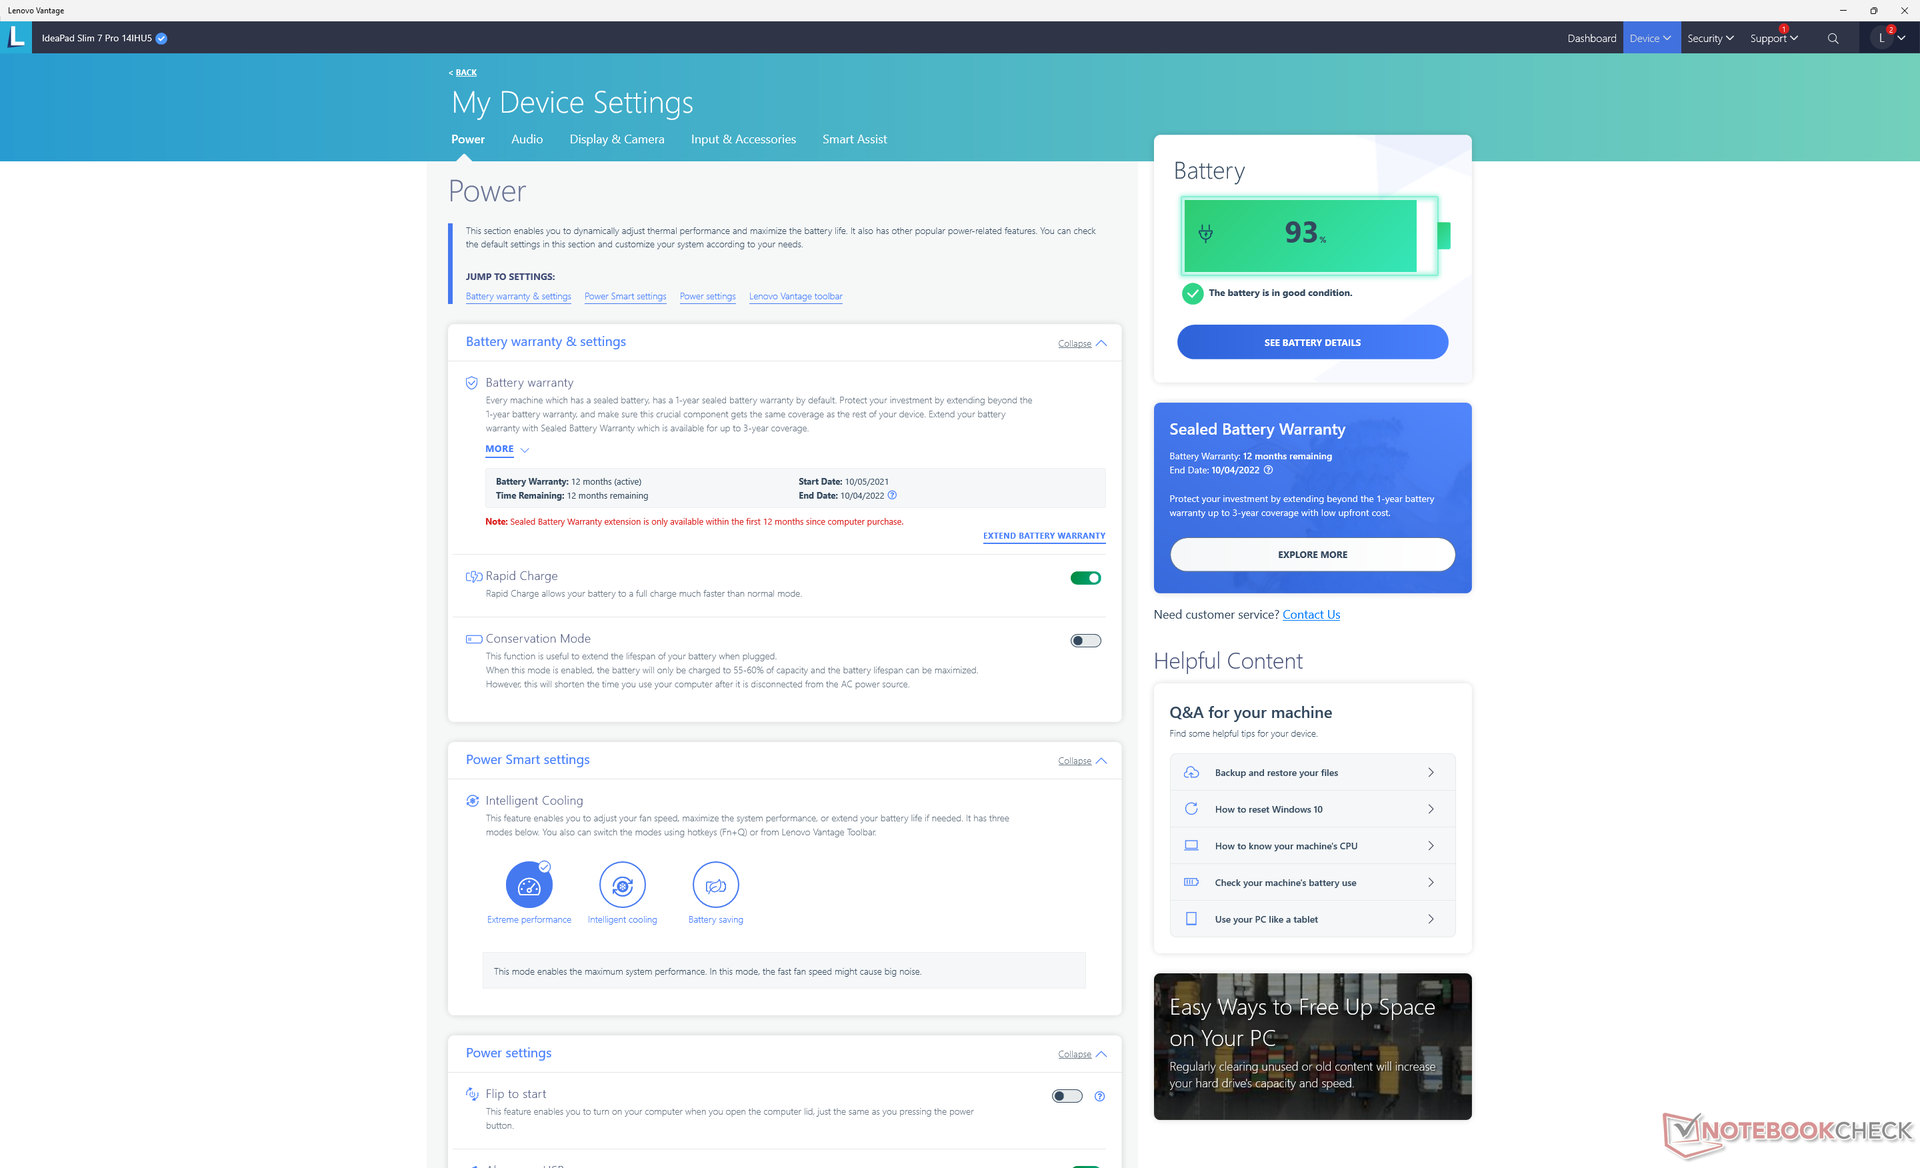
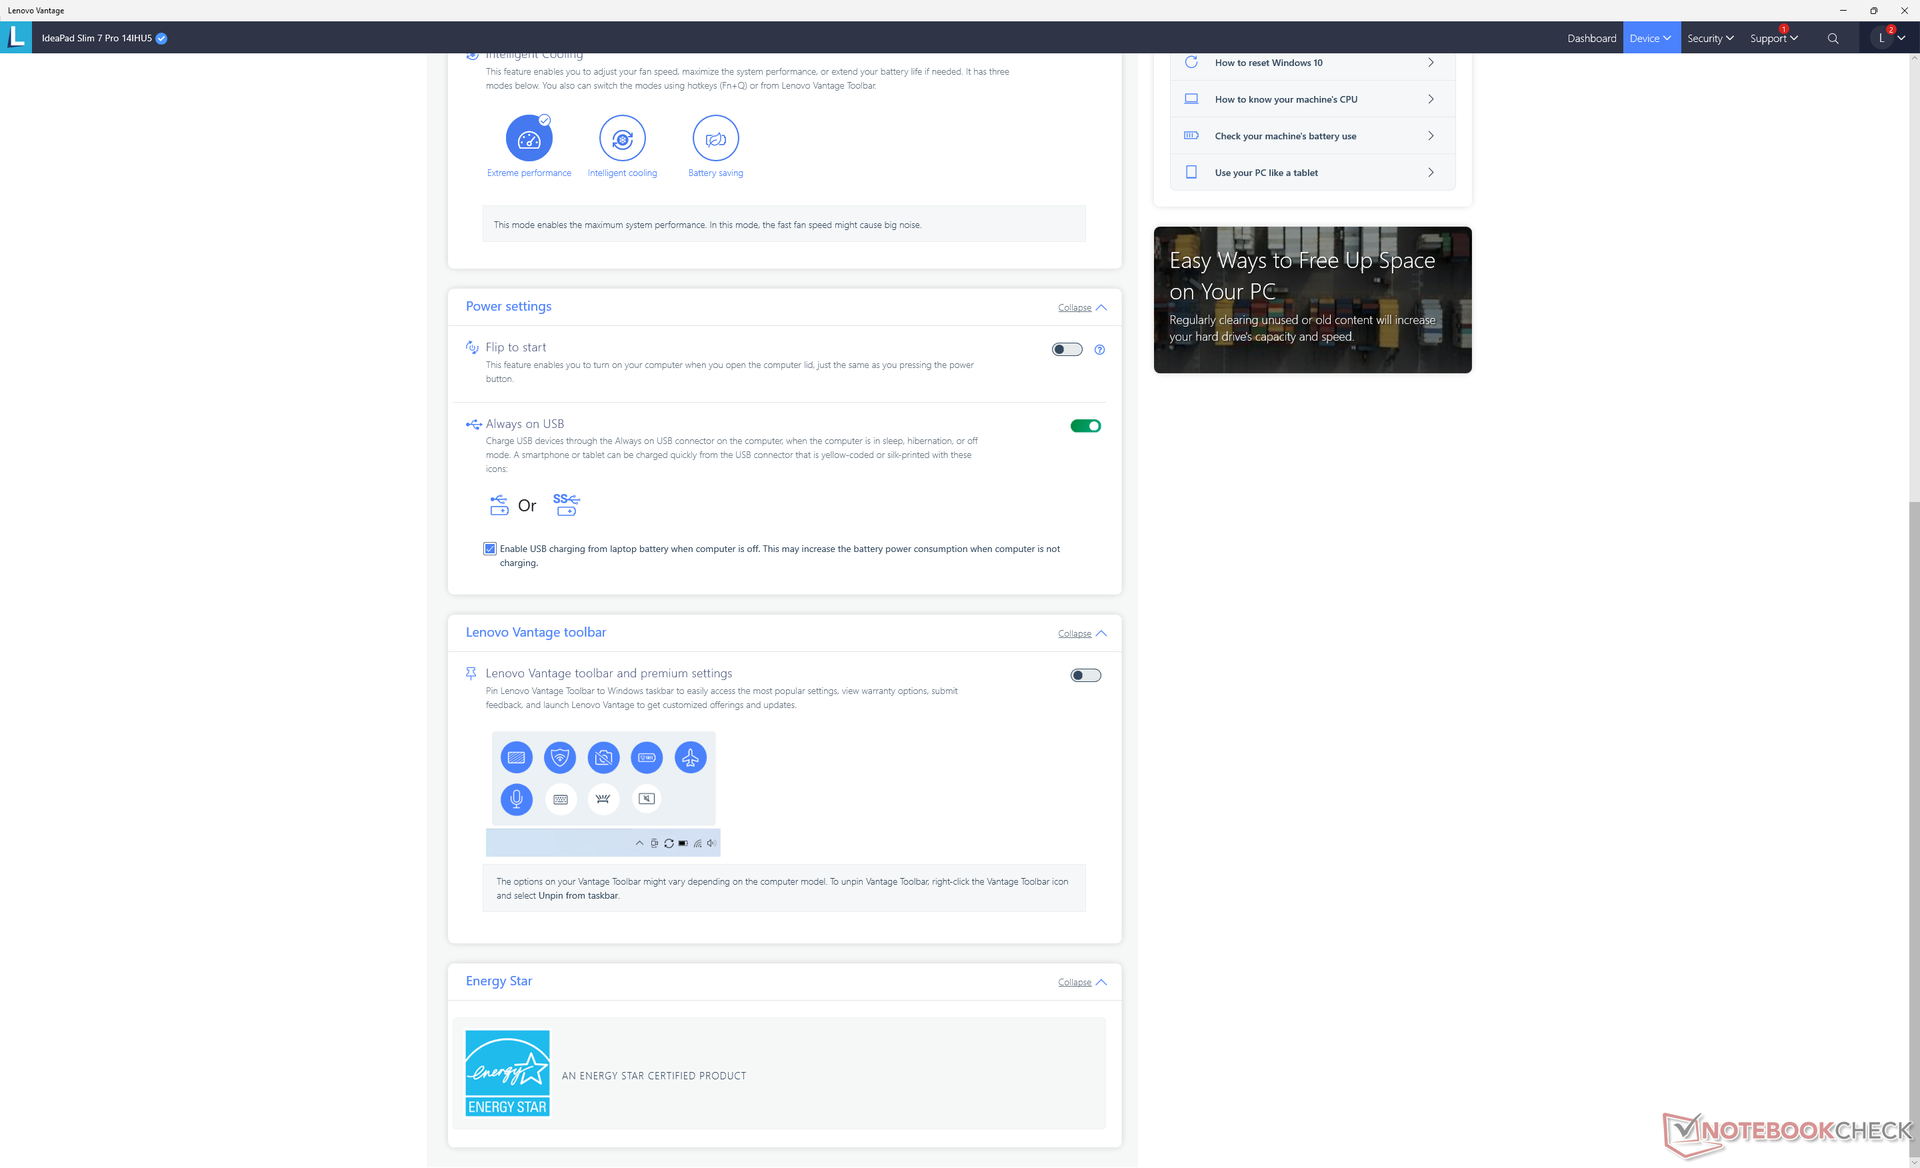
Our unit was set to Extreme performance mode prior to running any performance benchmarks below for the highest possible scores. We recommend users become familiar with the pre-installed Lenovo Vantage software which acts as a control center for the laptop.
Though the processor targets a 64 W TDP, it is only able to maintain a draw of 45 W when at 100 percent utilization for long periods as our stress test section below will show.
Processor — Not that much Better than the Core i7-1165G7
Raw processor performance is generally faster than the cheaper and more power-efficient Core i7-1165G7. However, there are many examples where certain Core i7-1165G7/1195G7 laptops can come within just a few percentage points of our Core i7-11370H such as the Framework Laptop, MSI Prestige 14 Evo, or ADATA XPG Xenia 14. The Core i7-11370H is nothing more than an overclocked Core i7-1165G7 in many respects.
The 8-core Ryzen 9 5900HX offers about 80 percent faster multi-thread performance over our 4-core Core i7-11370H while maintaining comparable single-thread performance.
Cinebench R15 Multi Loop
Cinebench R23: Multi Core | Single Core
Cinebench R20: CPU (Multi Core) | CPU (Single Core)
Cinebench R15: CPU Multi 64Bit | CPU Single 64Bit
Blender: v2.79 BMW27 CPU
7-Zip 18.03: 7z b 4 | 7z b 4 -mmt1
Geekbench 5.5: Multi-Core | Single-Core
HWBOT x265 Benchmark v2.2: 4k Preset
LibreOffice : 20 Documents To PDF
R Benchmark 2.5: Overall mean
* ... smaller is better
AIDA64: FP32 Ray-Trace | FPU Julia | CPU SHA3 | CPU Queen | FPU SinJulia | FPU Mandel | CPU AES | CPU ZLib | FP64 Ray-Trace | CPU PhotoWorxx
| Performance rating | |
| Razer Blade 14 Ryzen 9 RTX 3070 | |
| Lenovo IdeaPad Slim 7i Pro 14IHU5 | |
| Huawei MateBook 14s i7 | |
| Asus Zenbook 14X UX5400E | |
| MSI Summit E14 A11SCS | |
| Average Intel Core i7-11370H | |
| Lenovo Yoga Slim 7 14ITL05 82A300CNGE | |
| AIDA64 / FP32 Ray-Trace | |
| Razer Blade 14 Ryzen 9 RTX 3070 | |
| Lenovo IdeaPad Slim 7i Pro 14IHU5 | |
| Huawei MateBook 14s i7 | |
| Lenovo Yoga Slim 7 14ITL05 82A300CNGE | |
| Asus Zenbook 14X UX5400E | |
| Average Intel Core i7-11370H (5204 - 8413, n=10) | |
| MSI Summit E14 A11SCS | |
| AIDA64 / FPU Julia | |
| Razer Blade 14 Ryzen 9 RTX 3070 | |
| Lenovo IdeaPad Slim 7i Pro 14IHU5 | |
| Huawei MateBook 14s i7 | |
| Lenovo Yoga Slim 7 14ITL05 82A300CNGE | |
| Asus Zenbook 14X UX5400E | |
| Average Intel Core i7-11370H (23958 - 34020, n=10) | |
| MSI Summit E14 A11SCS | |
| AIDA64 / CPU SHA3 | |
| Razer Blade 14 Ryzen 9 RTX 3070 | |
| Lenovo IdeaPad Slim 7i Pro 14IHU5 | |
| Huawei MateBook 14s i7 | |
| Lenovo Yoga Slim 7 14ITL05 82A300CNGE | |
| Average Intel Core i7-11370H (1656 - 2297, n=10) | |
| Asus Zenbook 14X UX5400E | |
| MSI Summit E14 A11SCS | |
| AIDA64 / CPU Queen | |
| Razer Blade 14 Ryzen 9 RTX 3070 | |
| Huawei MateBook 14s i7 | |
| Lenovo IdeaPad Slim 7i Pro 14IHU5 | |
| Average Intel Core i7-11370H (42086 - 52930, n=10) | |
| Asus Zenbook 14X UX5400E | |
| MSI Summit E14 A11SCS | |
| Lenovo Yoga Slim 7 14ITL05 82A300CNGE | |
| AIDA64 / FPU SinJulia | |
| Razer Blade 14 Ryzen 9 RTX 3070 | |
| Huawei MateBook 14s i7 | |
| Lenovo IdeaPad Slim 7i Pro 14IHU5 | |
| Asus Zenbook 14X UX5400E | |
| Average Intel Core i7-11370H (3755 - 5027, n=10) | |
| MSI Summit E14 A11SCS | |
| Lenovo Yoga Slim 7 14ITL05 82A300CNGE | |
| AIDA64 / FPU Mandel | |
| Razer Blade 14 Ryzen 9 RTX 3070 | |
| Lenovo IdeaPad Slim 7i Pro 14IHU5 | |
| Huawei MateBook 14s i7 | |
| Lenovo Yoga Slim 7 14ITL05 82A300CNGE | |
| MSI Summit E14 A11SCS | |
| Average Intel Core i7-11370H (14433 - 20417, n=10) | |
| Asus Zenbook 14X UX5400E | |
| AIDA64 / CPU AES | |
| Razer Blade 14 Ryzen 9 RTX 3070 | |
| Lenovo IdeaPad Slim 7i Pro 14IHU5 | |
| Huawei MateBook 14s i7 | |
| Asus Zenbook 14X UX5400E | |
| Average Intel Core i7-11370H (44267 - 76866, n=10) | |
| Lenovo Yoga Slim 7 14ITL05 82A300CNGE | |
| MSI Summit E14 A11SCS | |
| AIDA64 / CPU ZLib | |
| Razer Blade 14 Ryzen 9 RTX 3070 | |
| Lenovo IdeaPad Slim 7i Pro 14IHU5 | |
| Huawei MateBook 14s i7 | |
| Asus Zenbook 14X UX5400E | |
| Average Intel Core i7-11370H (289 - 422, n=10) | |
| Lenovo Yoga Slim 7 14ITL05 82A300CNGE | |
| MSI Summit E14 A11SCS | |
| AIDA64 / FP64 Ray-Trace | |
| Razer Blade 14 Ryzen 9 RTX 3070 | |
| Lenovo IdeaPad Slim 7i Pro 14IHU5 | |
| Huawei MateBook 14s i7 | |
| Lenovo Yoga Slim 7 14ITL05 82A300CNGE | |
| Average Intel Core i7-11370H (2756 - 4551, n=10) | |
| Asus Zenbook 14X UX5400E | |
| MSI Summit E14 A11SCS | |
| AIDA64 / CPU PhotoWorxx | |
| MSI Summit E14 A11SCS | |
| Lenovo IdeaPad Slim 7i Pro 14IHU5 | |
| Huawei MateBook 14s i7 | |
| Asus Zenbook 14X UX5400E | |
| Average Intel Core i7-11370H (15892 - 40069, n=10) | |
| Lenovo Yoga Slim 7 14ITL05 82A300CNGE | |
| Razer Blade 14 Ryzen 9 RTX 3070 | |
System Performance
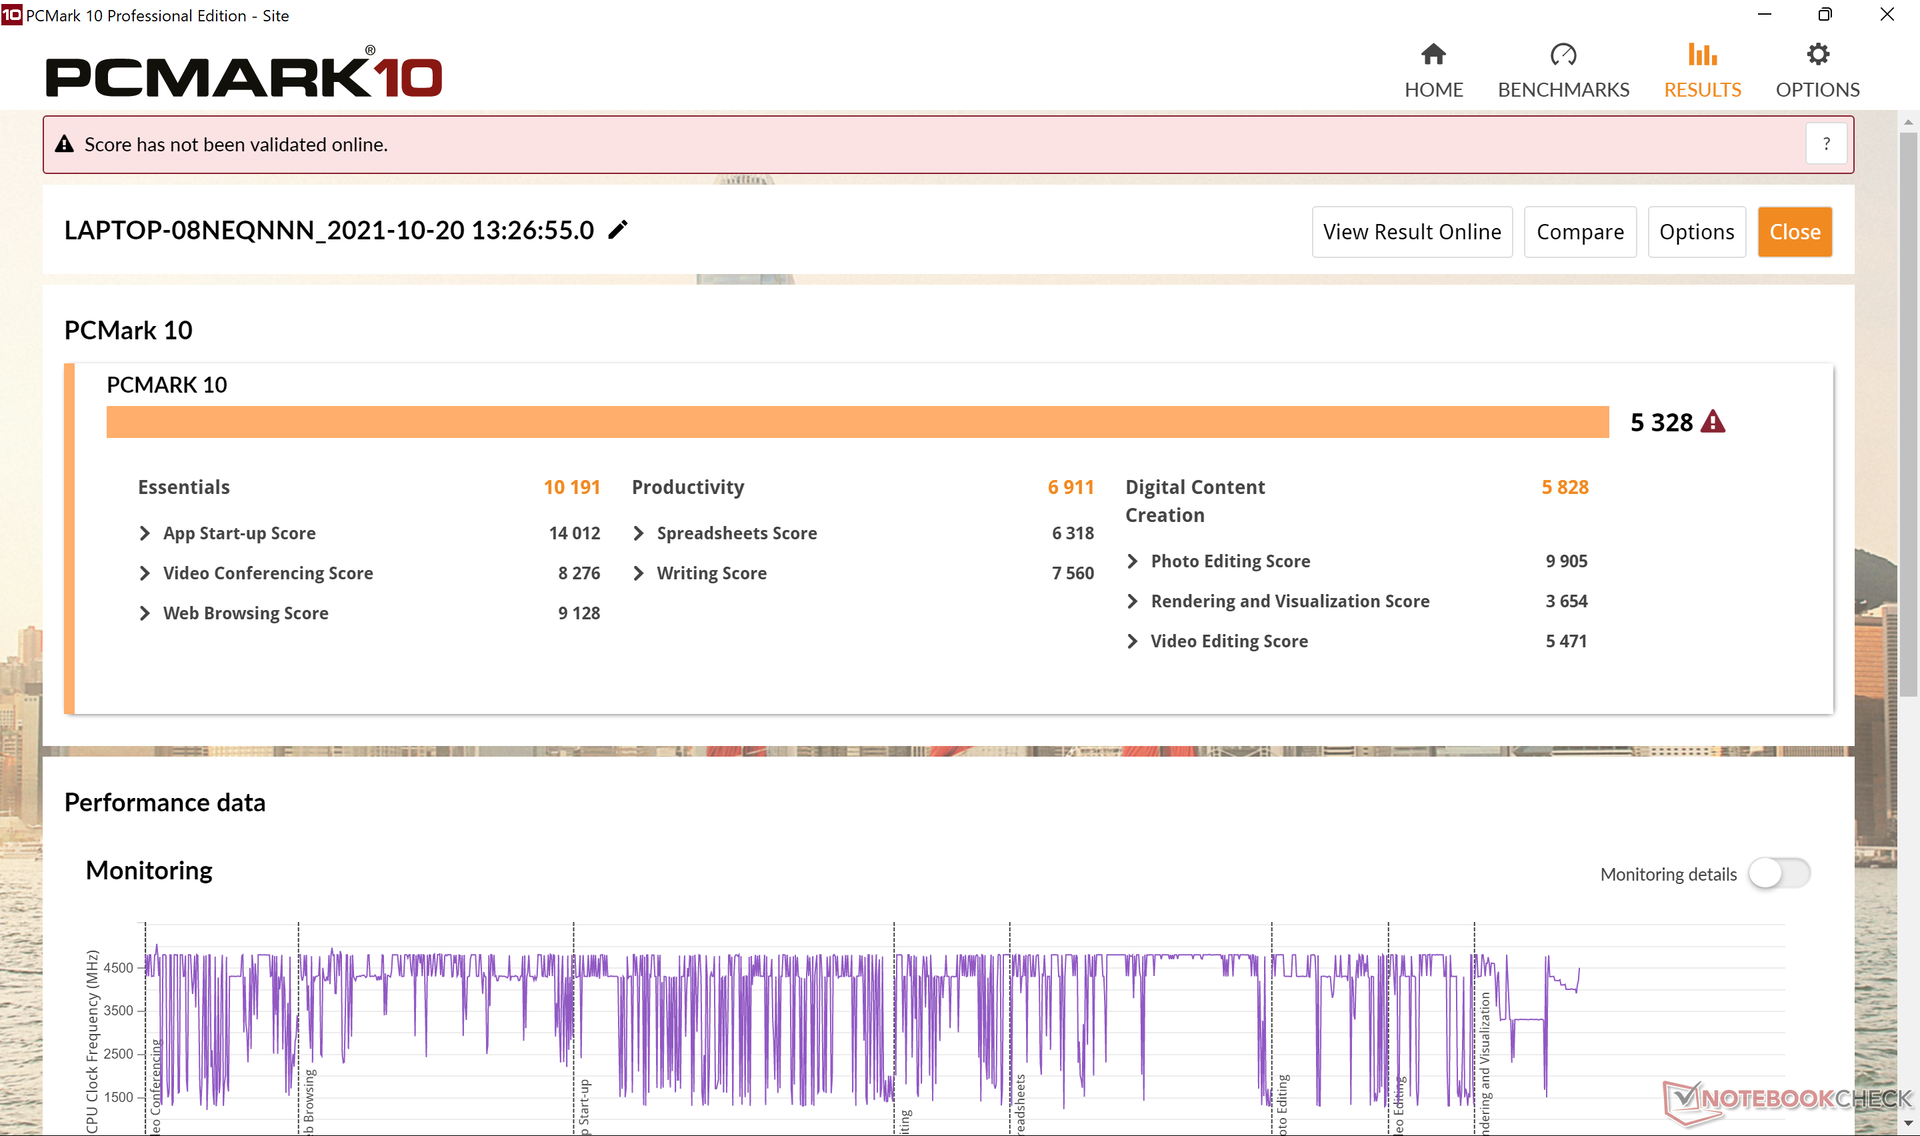
PCMark 10 scores are consistently behind the AMD-powered Yoga Slim 7 Pro even though our Iris Xe is generally the faster GPU. The extra physical cores of the Ryzen 9 5900HX are likely partly responsible for the higher overall PCMark scores.
| PCMark 10 / Score | |
| Razer Blade 14 Ryzen 9 RTX 3070 | |
| Huawei MateBook 14s i7 | |
| Lenovo IdeaPad Slim 7i Pro 14IHU5 | |
| MSI Summit E14 A11SCS | |
| Asus Zenbook 14X UX5400E | |
| Lenovo Yoga Slim 7 14ITL05 82A300CNGE | |
| PCMark 10 / Essentials | |
| Huawei MateBook 14s i7 | |
| Razer Blade 14 Ryzen 9 RTX 3070 | |
| Lenovo IdeaPad Slim 7i Pro 14IHU5 | |
| Lenovo Yoga Slim 7 14ITL05 82A300CNGE | |
| MSI Summit E14 A11SCS | |
| Asus Zenbook 14X UX5400E | |
| PCMark 10 / Productivity | |
| Razer Blade 14 Ryzen 9 RTX 3070 | |
| Asus Zenbook 14X UX5400E | |
| MSI Summit E14 A11SCS | |
| Huawei MateBook 14s i7 | |
| Lenovo IdeaPad Slim 7i Pro 14IHU5 | |
| Lenovo Yoga Slim 7 14ITL05 82A300CNGE | |
| PCMark 10 Score | 5328 points | |
Help | ||
| AIDA64 / Memory Copy | |
| Lenovo IdeaPad Slim 7i Pro 14IHU5 | |
| MSI Summit E14 A11SCS | |
| Asus Zenbook 14X UX5400E | |
| Huawei MateBook 14s i7 | |
| Average Intel Core i7-11370H (32035 - 64524, n=10) | |
| Razer Blade 14 Ryzen 9 RTX 3070 | |
| Lenovo Yoga Slim 7 14ITL05 82A300CNGE | |
| AIDA64 / Memory Read | |
| Lenovo IdeaPad Slim 7i Pro 14IHU5 | |
| MSI Summit E14 A11SCS | |
| Asus Zenbook 14X UX5400E | |
| Huawei MateBook 14s i7 | |
| Average Intel Core i7-11370H (37216 - 62417, n=10) | |
| Lenovo Yoga Slim 7 14ITL05 82A300CNGE | |
| Razer Blade 14 Ryzen 9 RTX 3070 | |
| AIDA64 / Memory Write | |
| Lenovo IdeaPad Slim 7i Pro 14IHU5 | |
| Asus Zenbook 14X UX5400E | |
| MSI Summit E14 A11SCS | |
| Huawei MateBook 14s i7 | |
| Average Intel Core i7-11370H (36920 - 65610, n=10) | |
| Lenovo Yoga Slim 7 14ITL05 82A300CNGE | |
| Razer Blade 14 Ryzen 9 RTX 3070 | |
| AIDA64 / Memory Latency | |
| Asus Zenbook 14X UX5400E | |
| MSI Summit E14 A11SCS | |
| Huawei MateBook 14s i7 | |
| Average Intel Core i7-11370H (73.4 - 103, n=10) | |
| Lenovo IdeaPad Slim 7i Pro 14IHU5 | |
| Razer Blade 14 Ryzen 9 RTX 3070 | |
| Lenovo Yoga Slim 7 14ITL05 82A300CNGE | |
* ... smaller is better
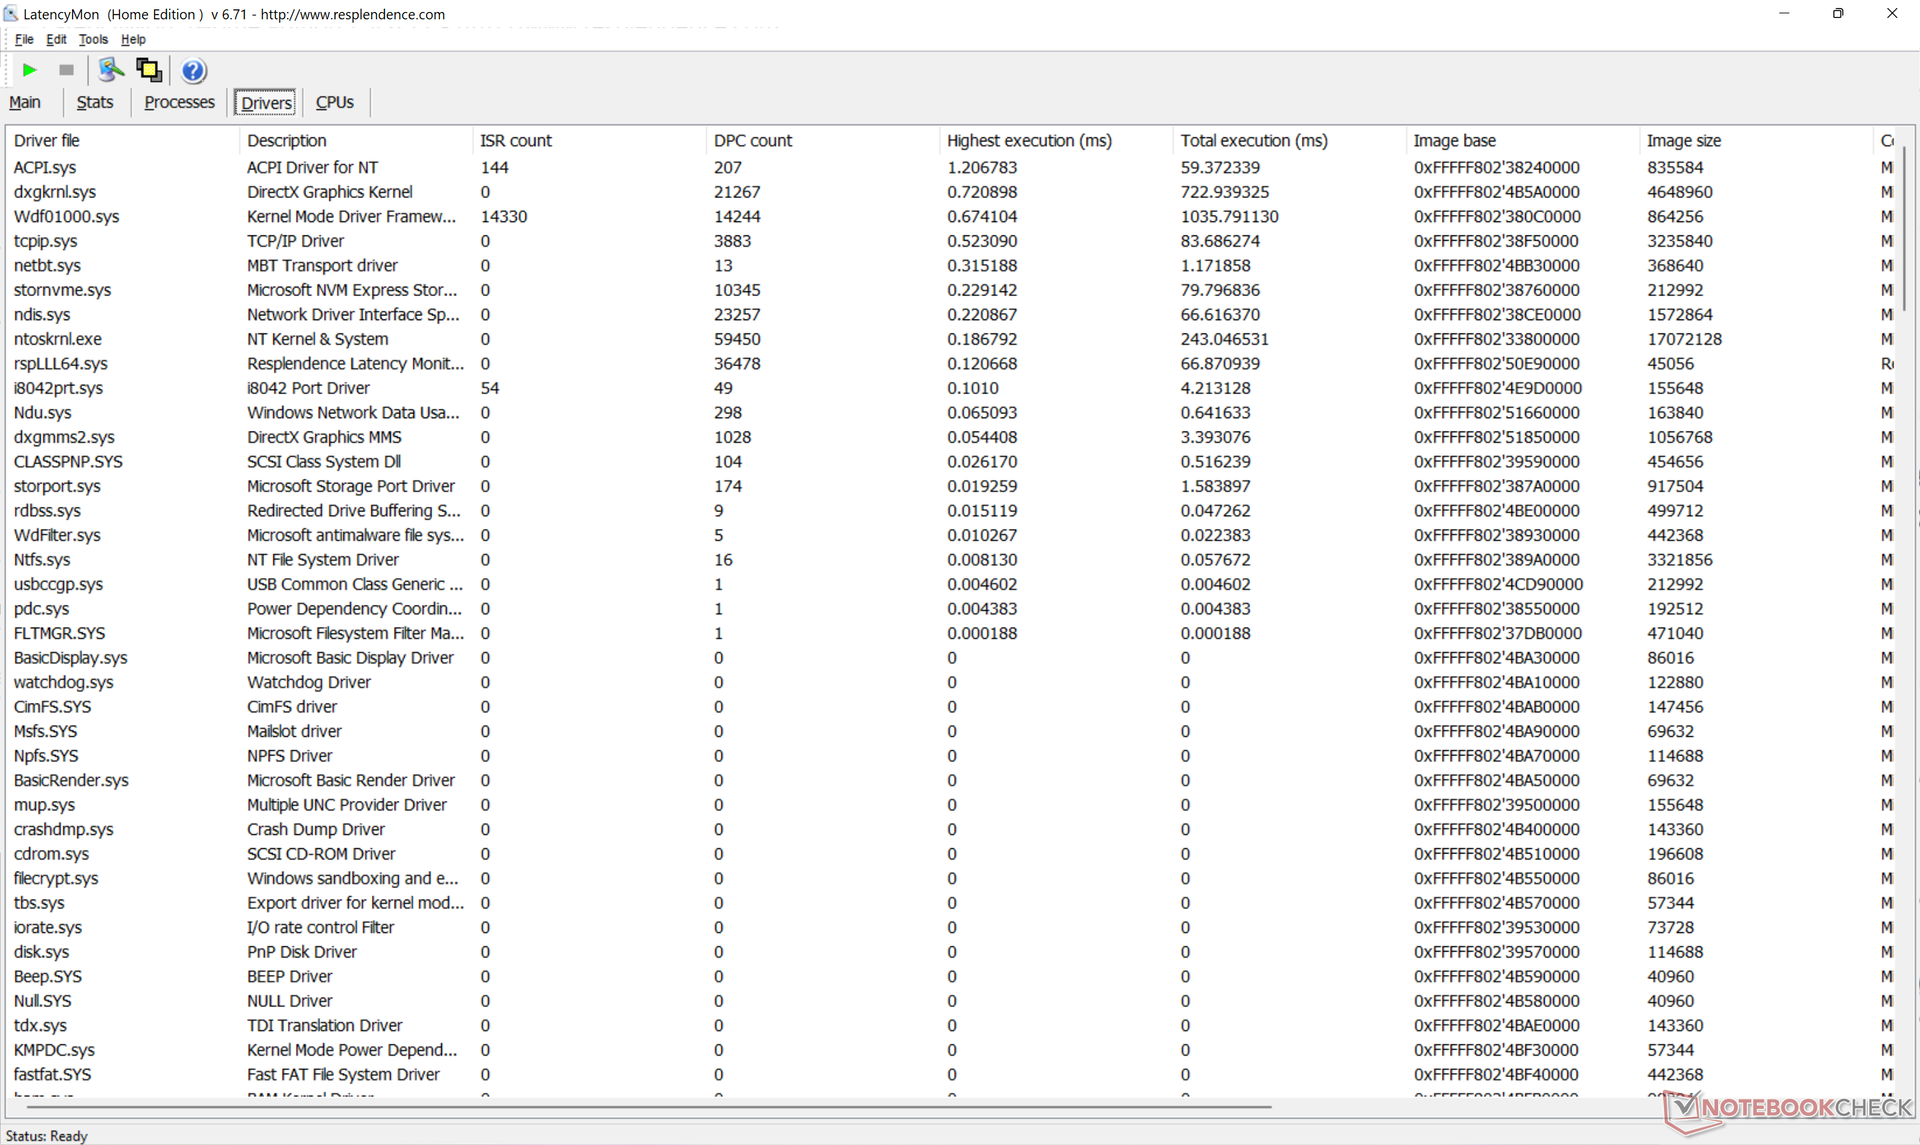
DPC Latency
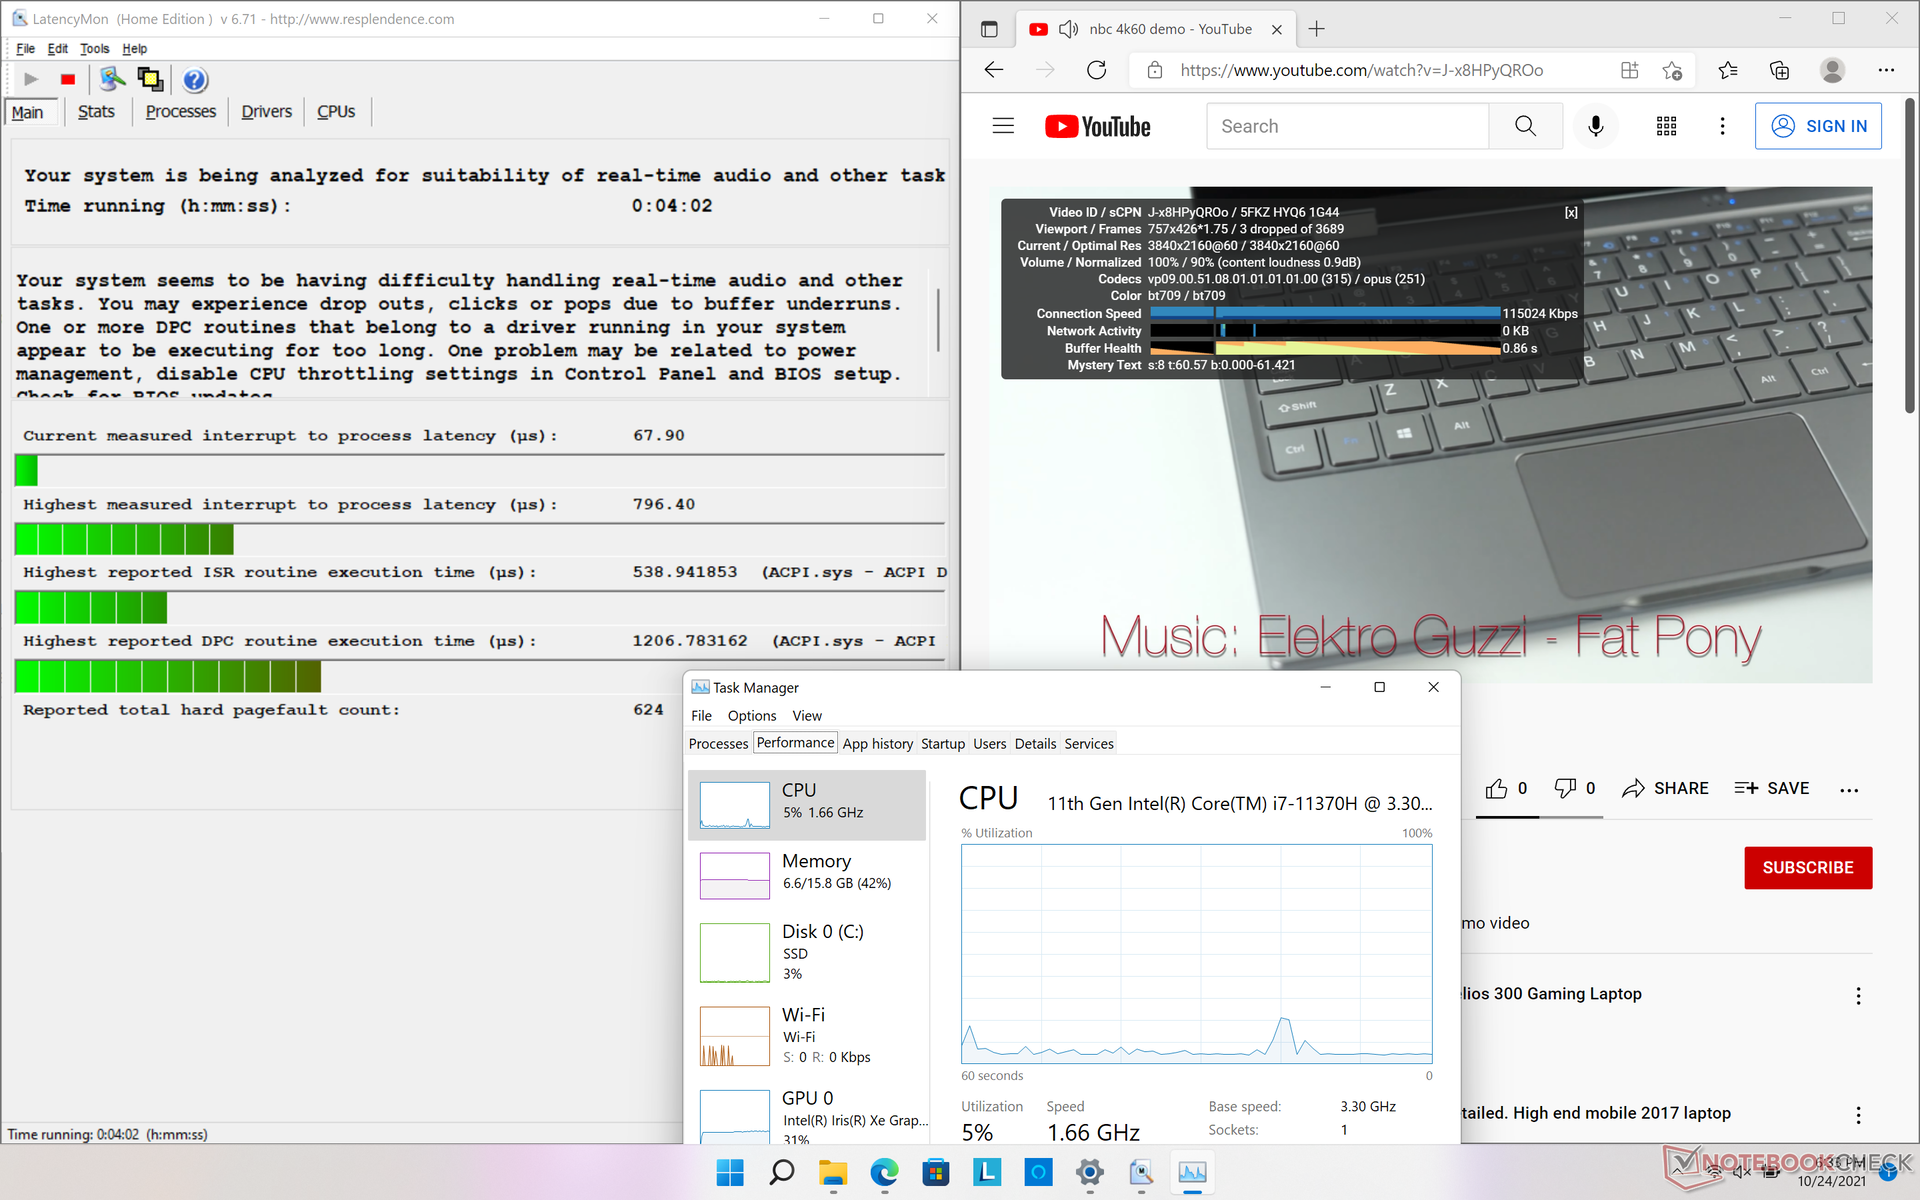
LatencyMon reveals DPC issues when opening multiple browser tabs on our homepage while our AMD-powered Yoga Slim 7 would have no issues at all. 4K UHD playback at 60 FPS is otherwise smooth with just 3 dropped frames during our minute-long video test.
| DPC Latencies / LatencyMon - interrupt to process latency (max), Web, Youtube, Prime95 | |
| Lenovo Yoga Slim 7 14ITL05 82A300CNGE | |
| MSI Summit E14 A11SCS | |
| Asus Zenbook 14X UX5400E | |
| Lenovo IdeaPad Slim 7i Pro 14IHU5 | |
| Huawei MateBook 14s i7 | |
| Razer Blade 14 Ryzen 9 RTX 3070 | |
* ... smaller is better
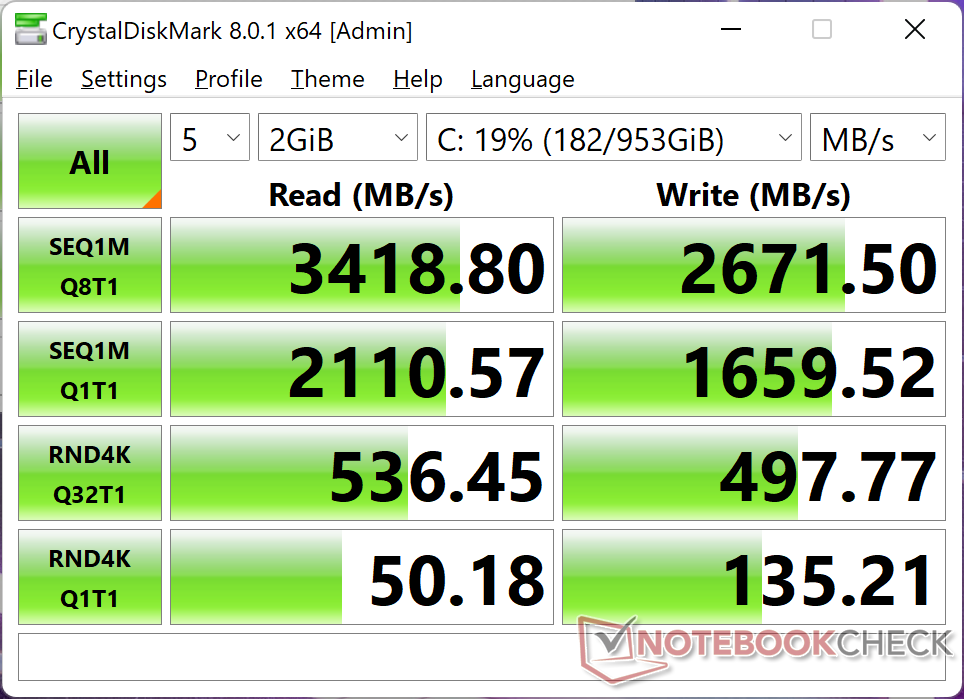
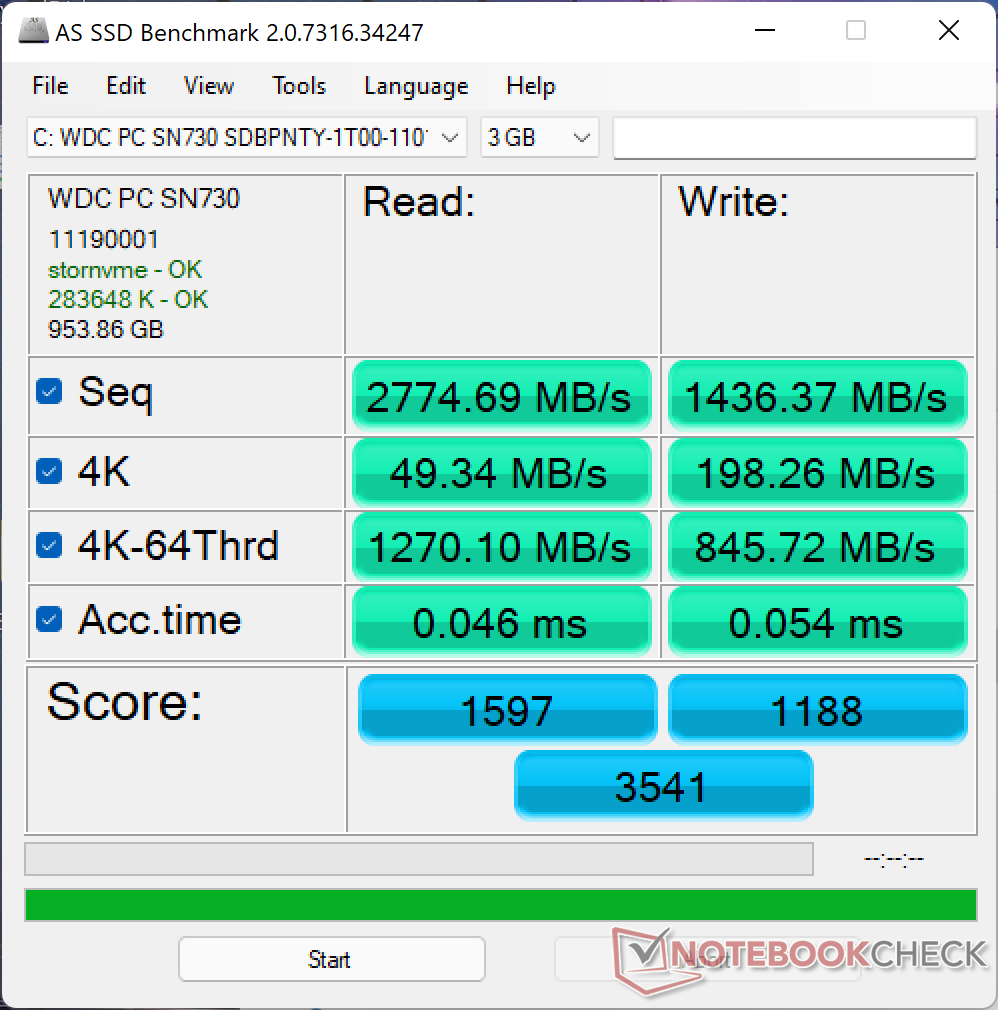
Storage Devices — PCIe3 NVMe SSD
Lenovo is only shipping PCIe3 NVMe SSDs with its IdeaPad Slim 7i Pro at the moment even though the system should technically support PCIe4 drives. Nonetheless, the 1 TB WD SN730 in our test unit is a high-end PCIe3 drive with sequential read and write rates approaching 3400 MB/s and 3100 MB/s, respectively.

* ... smaller is better
Disk Throttling: DiskSpd Read Loop, Queue Depth 8
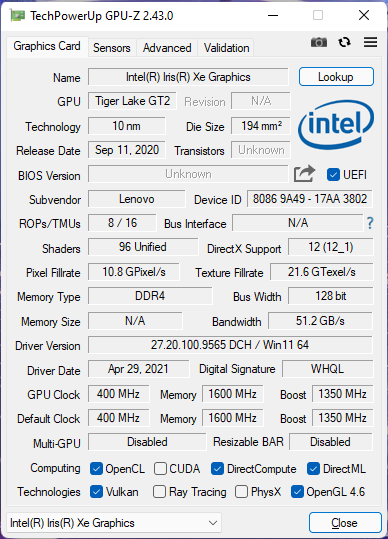
GPU Performance — Better than the Average Iris Xe
Graphics performance is about 15 percent faster than the average laptop in our database with the same integrated Iris Xe 96 EUs GPU. When gaming, results are comparable to the GeForce MX450 at best but many games will still favor the discrete Nvidia GPU by wider margins including GTA V.
When compared to the Yoga Slim 7 Pro and its Radeon RX Vega 8 GPU, our IdeaPad is much faster in a few games (Final Fantasy XV, Witcher 3) while being slightly slower in others (DOTA 2 Reborn, X-Plane).
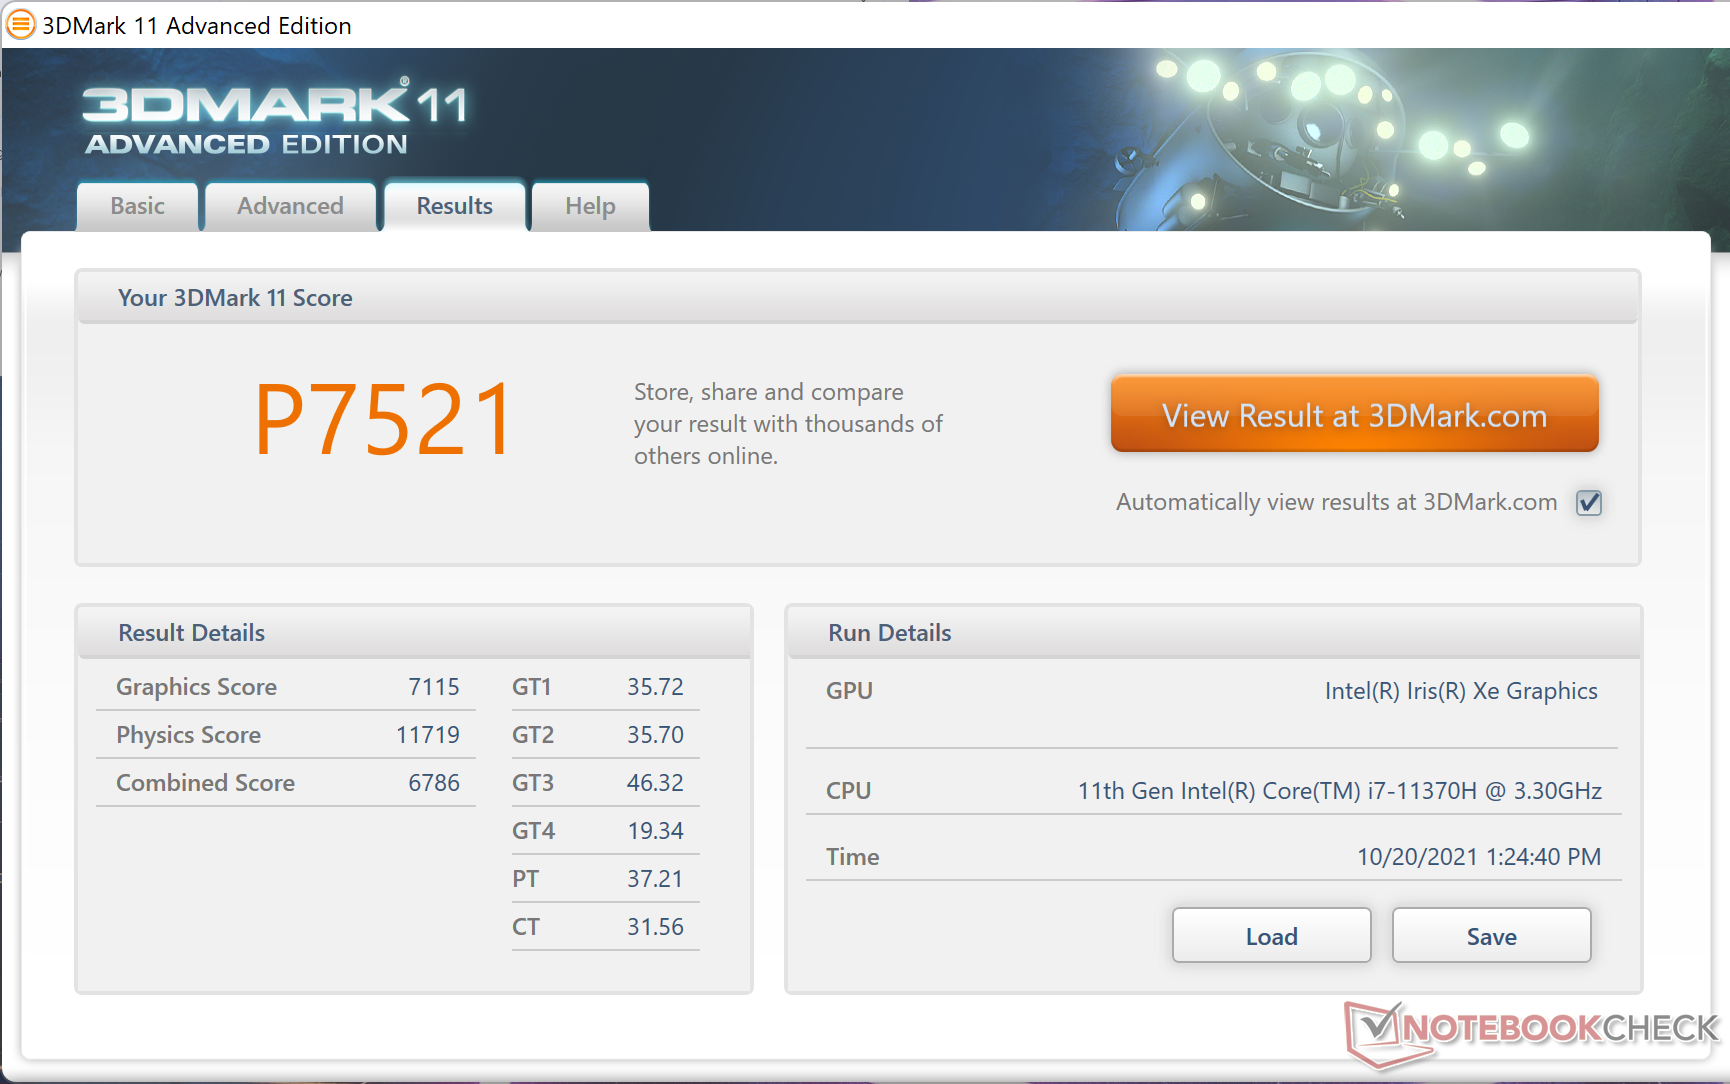
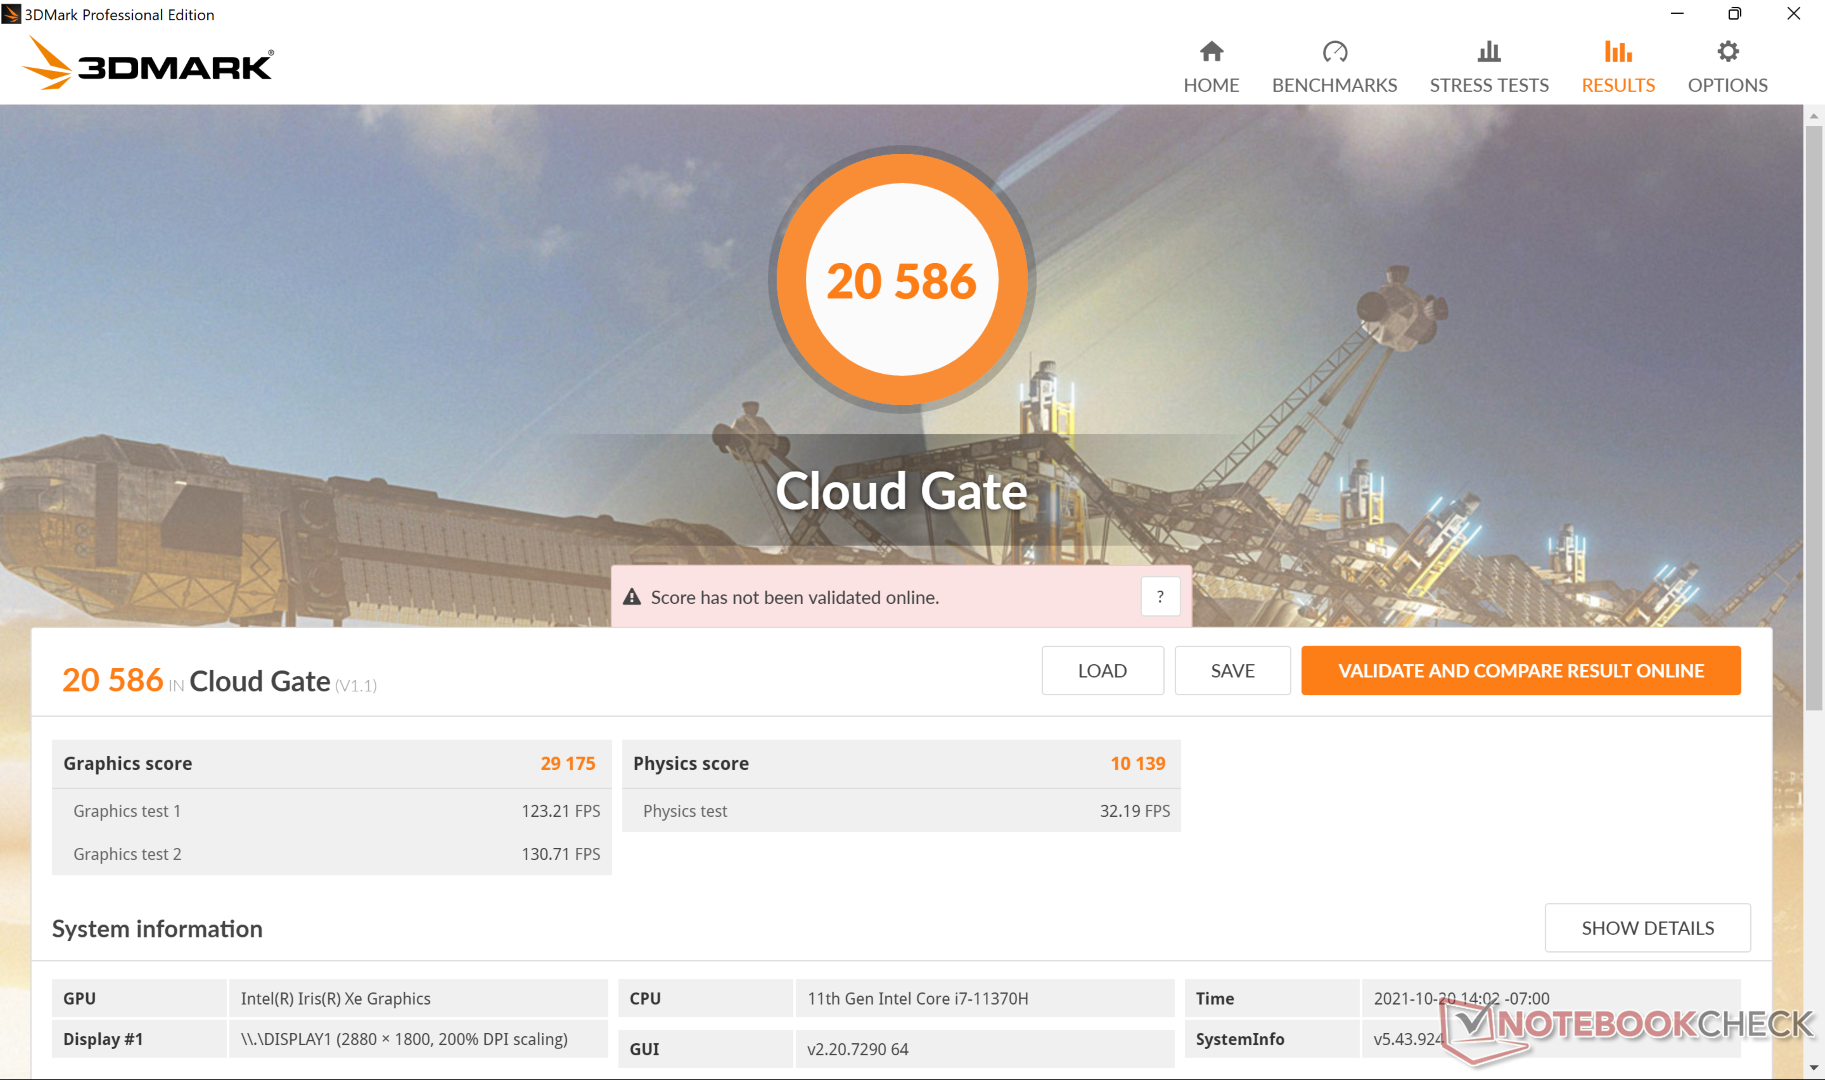
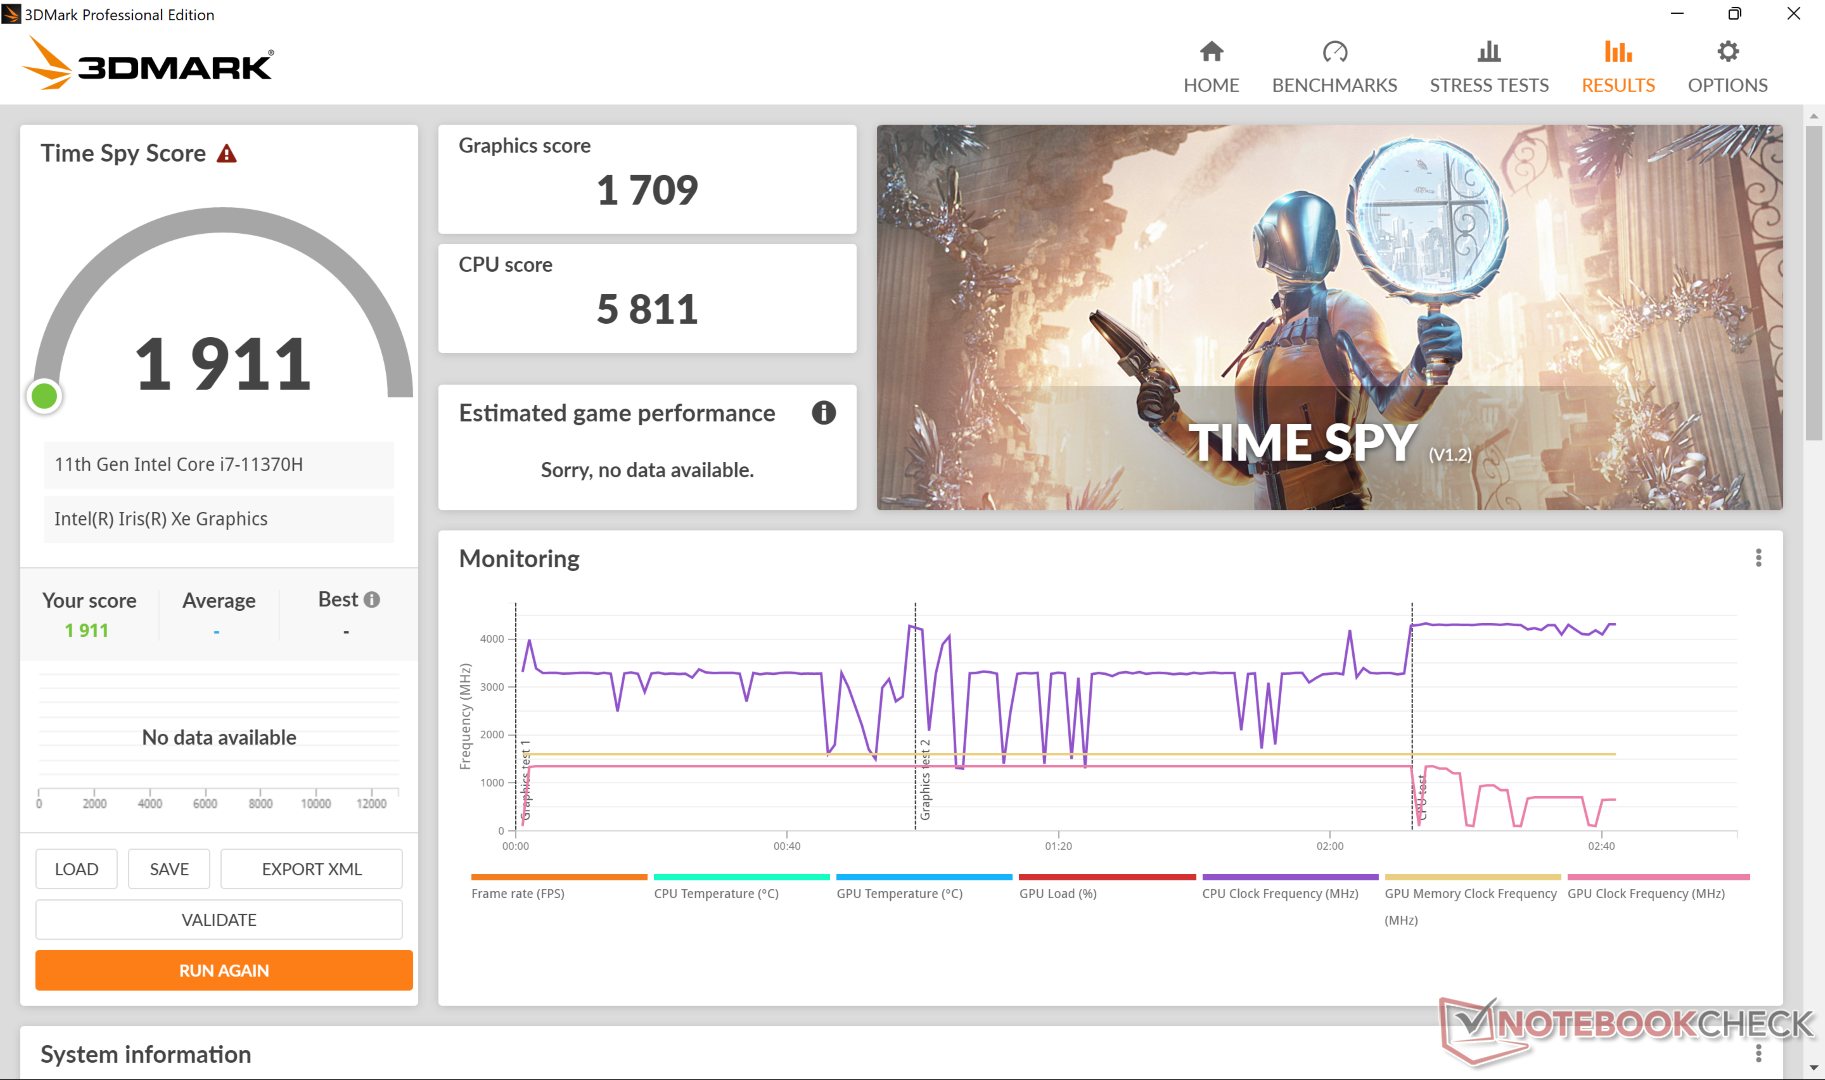
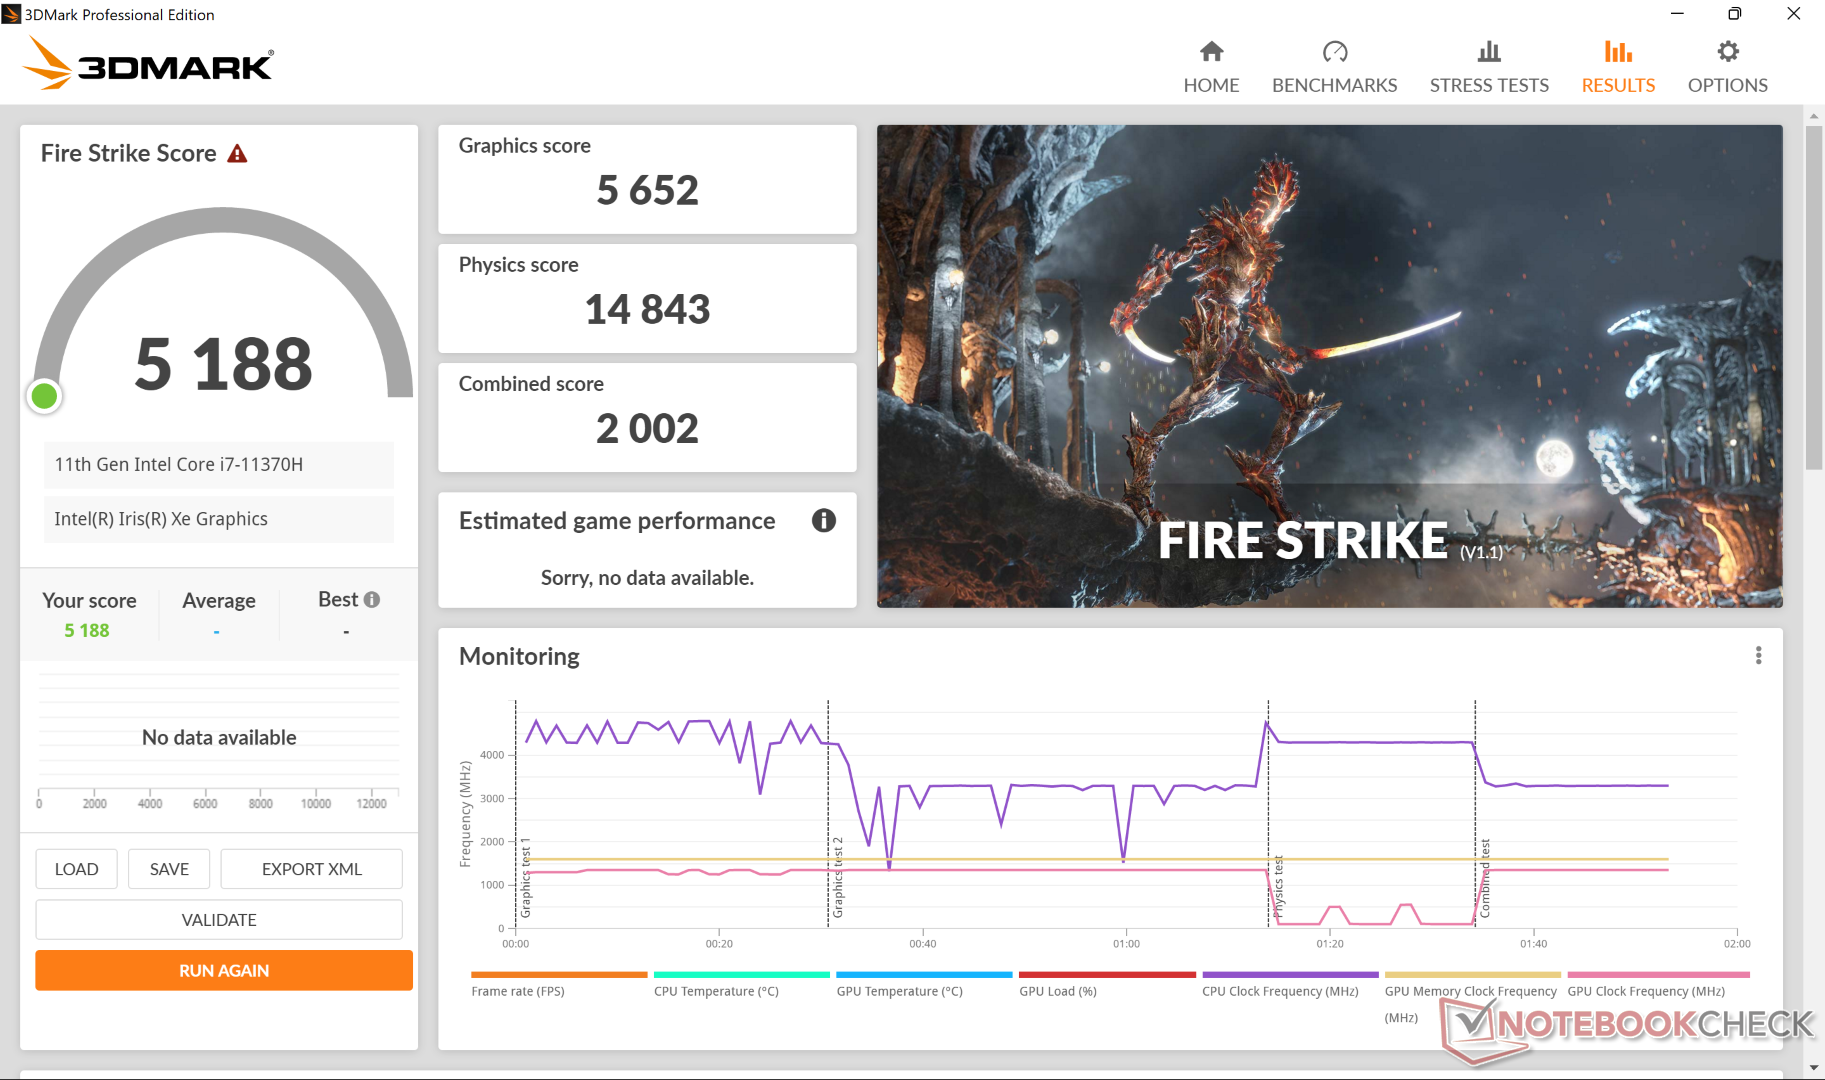
| 3DMark 11 Performance | 7521 points | |
| 3DMark Cloud Gate Standard Score | 20586 points | |
| 3DMark Fire Strike Score | 5188 points | |
| 3DMark Time Spy Score | 1911 points | |
Help | ||
Witcher 3 FPS Chart
| low | med. | high | ultra | |
|---|---|---|---|---|
| GTA V (2015) | 110 | 98.9 | 30.4 | 12.1 |
| The Witcher 3 (2015) | 100.5 | 61.1 | 34.8 | 16.8 |
| Dota 2 Reborn (2015) | 87.2 | 104 | 59.6 | 54 |
| Final Fantasy XV Benchmark (2018) | 49.4 | 27.3 | 27.3 | |
| X-Plane 11.11 (2018) | 48.1 | 46.2 | 36.4 | |
| Far Cry 5 (2018) | 64 | 31 | 29 | 27 |
| Strange Brigade (2018) | 94.9 | 42.4 | 32.8 | 26.7 |
System Noise — Loud Only When it Needs to be
The system is excellent at remaining quiet for long periods even when set to Extreme performance mode. When running 3DMark 06, for example, the fans would top out at just under 31 dB(A) toward the end of the 90-second benchmark scene against a silent background of 24.7 dB(A). Results are similar to the MateBook 14s i7 while being quieter than the GeForce MX-powered Zenbook 14X.
Fan noise when gaming can range between 33 to 47 dB(A) depending on the load of the game. Anything above 40 dB(A) is typical when running such demanding loads, but 47 dB(A) is still on the high side especially for an ultrathin subnotebook. Users can lower the fan noise ceiling (and performance) by selecting 'intelligent cooling' or 'battery saving' via the Lenovo Vantage software.
Noise level
| Idle |
| 24.7 / 24.7 / 24.7 dB(A) |
| Load |
| 30.8 / 46.4 dB(A) |
 | ||
30 dB silent 40 dB(A) audible 50 dB(A) loud |
||
min: | ||
| Lenovo IdeaPad Slim 7i Pro 14IHU5 Iris Xe G7 96EUs, i7-11370H, WDC PC SN730 SDBPNTY-1T00 | Lenovo Yoga Slim 7 14ITL05 82A300CNGE Iris Xe G7 80EUs, i5-1135G7, WDC PC SN730 SDBPNTY-512G | Huawei MateBook 14s i7 Iris Xe G7 96EUs, i7-11370H, Toshiba XG6 KXG60ZNV512G | Asus Zenbook 14X UX5400E GeForce MX450, i7-1165G7, SK Hynix HFM001TD3JX013N | MSI Summit E14 A11SCS GeForce GTX 1650 Ti Max-Q, i7-1185G7, Phison 1TB SM2801T24GKBB4S-E162 | Razer Blade 14 Ryzen 9 RTX 3070 GeForce RTX 3070 Laptop GPU, R9 5900HX, Samsung PM981a MZVLB1T0HBLR | |
|---|---|---|---|---|---|---|
| Noise | 3% | -1% | -4% | -15% | -8% | |
| off / environment * (dB) | 24.6 | 26 -6% | 24.3 1% | 26 -6% | 23.9 3% | 25.1 -2% |
| Idle Minimum * (dB) | 24.7 | 26 -5% | 24.3 2% | 26 -5% | 24.2 2% | 25.2 -2% |
| Idle Average * (dB) | 24.7 | 26 -5% | 24.3 2% | 26 -5% | 24.2 2% | 25.2 -2% |
| Idle Maximum * (dB) | 24.7 | 26 -5% | 28.4 -15% | 26.3 -6% | 24.2 2% | 25.2 -2% |
| Load Average * (dB) | 30.8 | 30.2 2% | 31.7 -3% | 37.1 -20% | 50.2 -63% | 31 -1% |
| Witcher 3 ultra * (dB) | 33 | 31.7 4% | 47 -42% | 44 -33% | ||
| Load Maximum * (dB) | 46.4 | 29 37% | 46.8 -1% | 38 18% | 51.7 -11% | 51.7 -11% |
* ... smaller is better
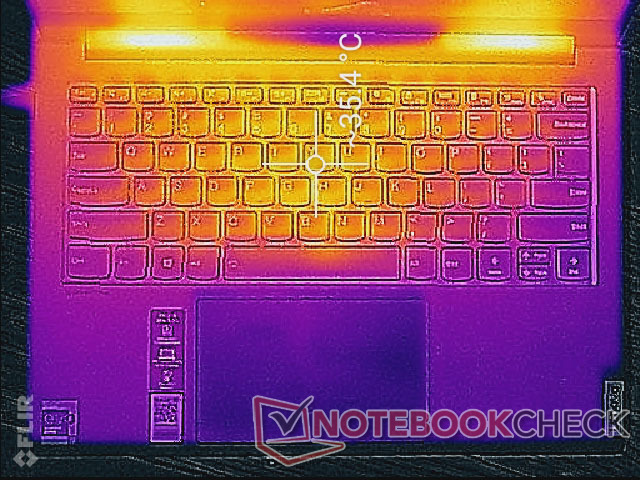
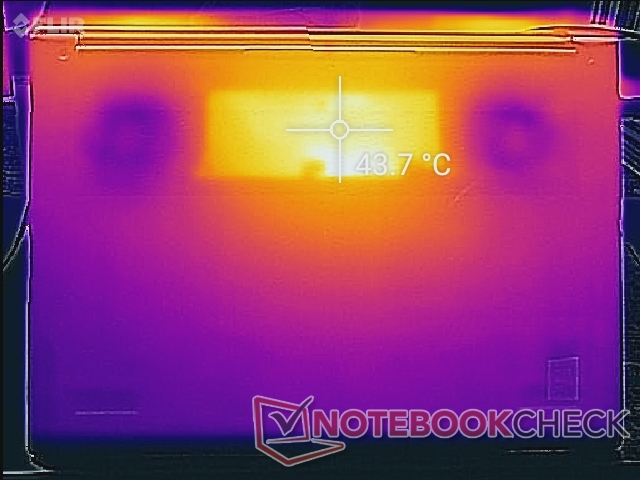
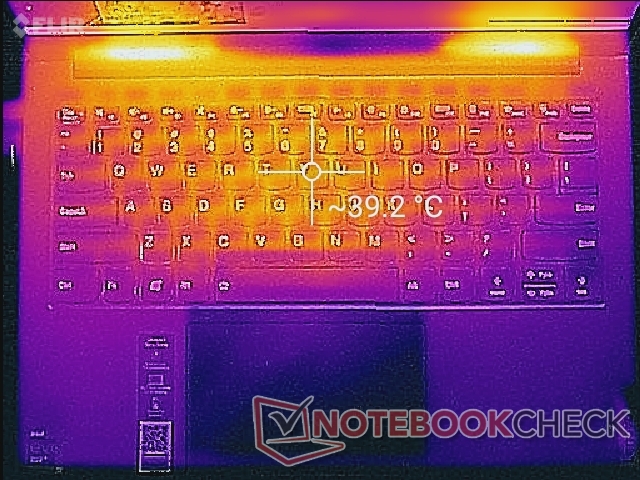
Temperature
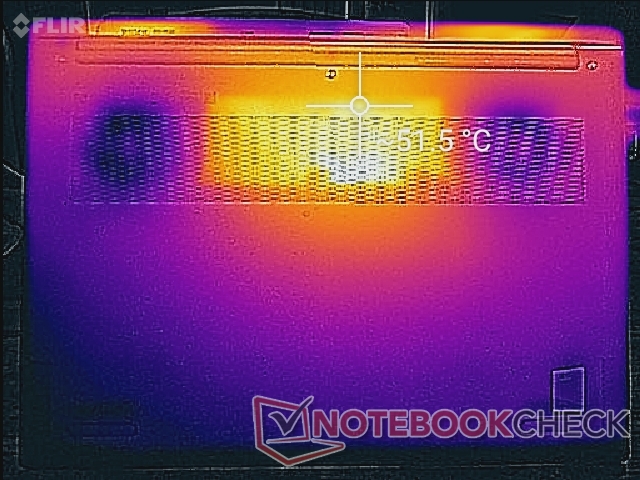
Surface temperatures are cool all around when idling on desktop. If gaming or running higher loads, hot spots can be as warm as 40 C and 50 C on the top and bottom, respectively, compared to 41 C and 45 C on the Huawei MateBook 14s equipped with the same Core i7-11370H CPU. The MSI Summit E14 can become even warmer at 50 C to 60 C, but it comes with a much faster discrete Nvidia GPU. Hot spots on the Lenovo are thankfully toward the rear of the chassis and away from the palm rests and keyboard edges.
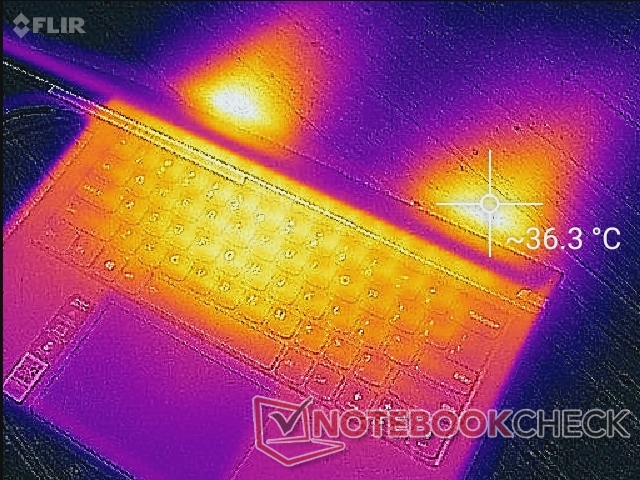
(+) The maximum temperature on the upper side is 39.4 °C / 103 F, compared to the average of 35.9 °C / 97 F, ranging from 21.4 to 59 °C for the class Subnotebook.
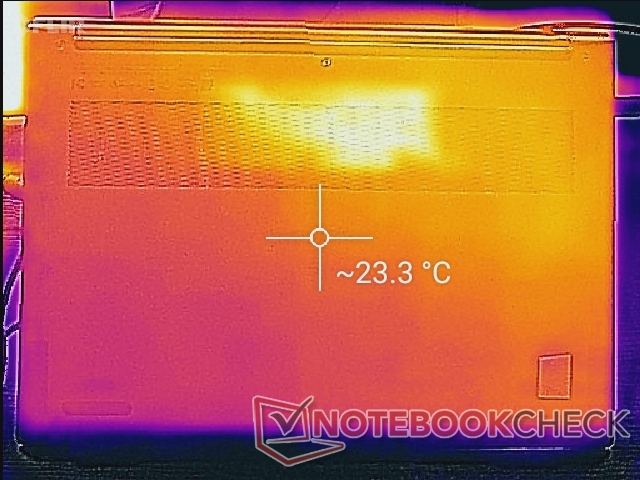
(-) The bottom heats up to a maximum of 51.4 °C / 125 F, compared to the average of 39.3 °C / 103 F
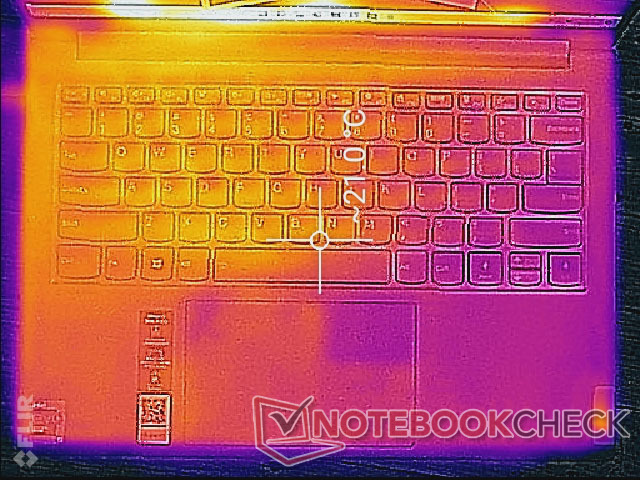
(+) In idle usage, the average temperature for the upper side is 20.8 °C / 69 F, compared to the device average of 30.8 °C / 87 F.
(+) Playing The Witcher 3, the average temperature for the upper side is 29.8 °C / 86 F, compared to the device average of 30.8 °C / 87 F.
(+) The palmrests and touchpad are cooler than skin temperature with a maximum of 27.4 °C / 81.3 F and are therefore cool to the touch.
(±) The average temperature of the palmrest area of similar devices was 28.2 °C / 82.8 F (+0.8 °C / 1.5 F).
| Lenovo IdeaPad Slim 7i Pro 14IHU5 Intel Core i7-11370H, Intel Iris Xe Graphics G7 96EUs | Lenovo Yoga Slim 7 14ITL05 82A300CNGE Intel Core i5-1135G7, Intel Iris Xe Graphics G7 80EUs | Huawei MateBook 14s i7 Intel Core i7-11370H, Intel Iris Xe Graphics G7 96EUs | Asus Zenbook 14X UX5400E Intel Core i7-1165G7, NVIDIA GeForce MX450 | MSI Summit E14 A11SCS Intel Core i7-1185G7, NVIDIA GeForce GTX 1650 Ti Max-Q | Razer Blade 14 Ryzen 9 RTX 3070 AMD Ryzen 9 5900HX, NVIDIA GeForce RTX 3070 Laptop GPU | |
|---|---|---|---|---|---|---|
| Heat | -10% | -4% | -20% | -34% | -36% | |
| Maximum Upper Side * (°C) | 39.4 | 40 -2% | 41.1 -4% | 42.4 -8% | 49.4 -25% | 45 -14% |
| Maximum Bottom * (°C) | 51.4 | 43.3 16% | 45.4 12% | 47.7 7% | 60.6 -18% | 44.4 14% |
| Idle Upper Side * (°C) | 21.6 | 28.4 -31% | 25.3 -17% | 32.3 -50% | 30.6 -42% | 40.2 -86% |
| Idle Bottom * (°C) | 24.6 | 30.4 -24% | 26.5 -8% | 31.9 -30% | 37.4 -52% | 39.2 -59% |
* ... smaller is better
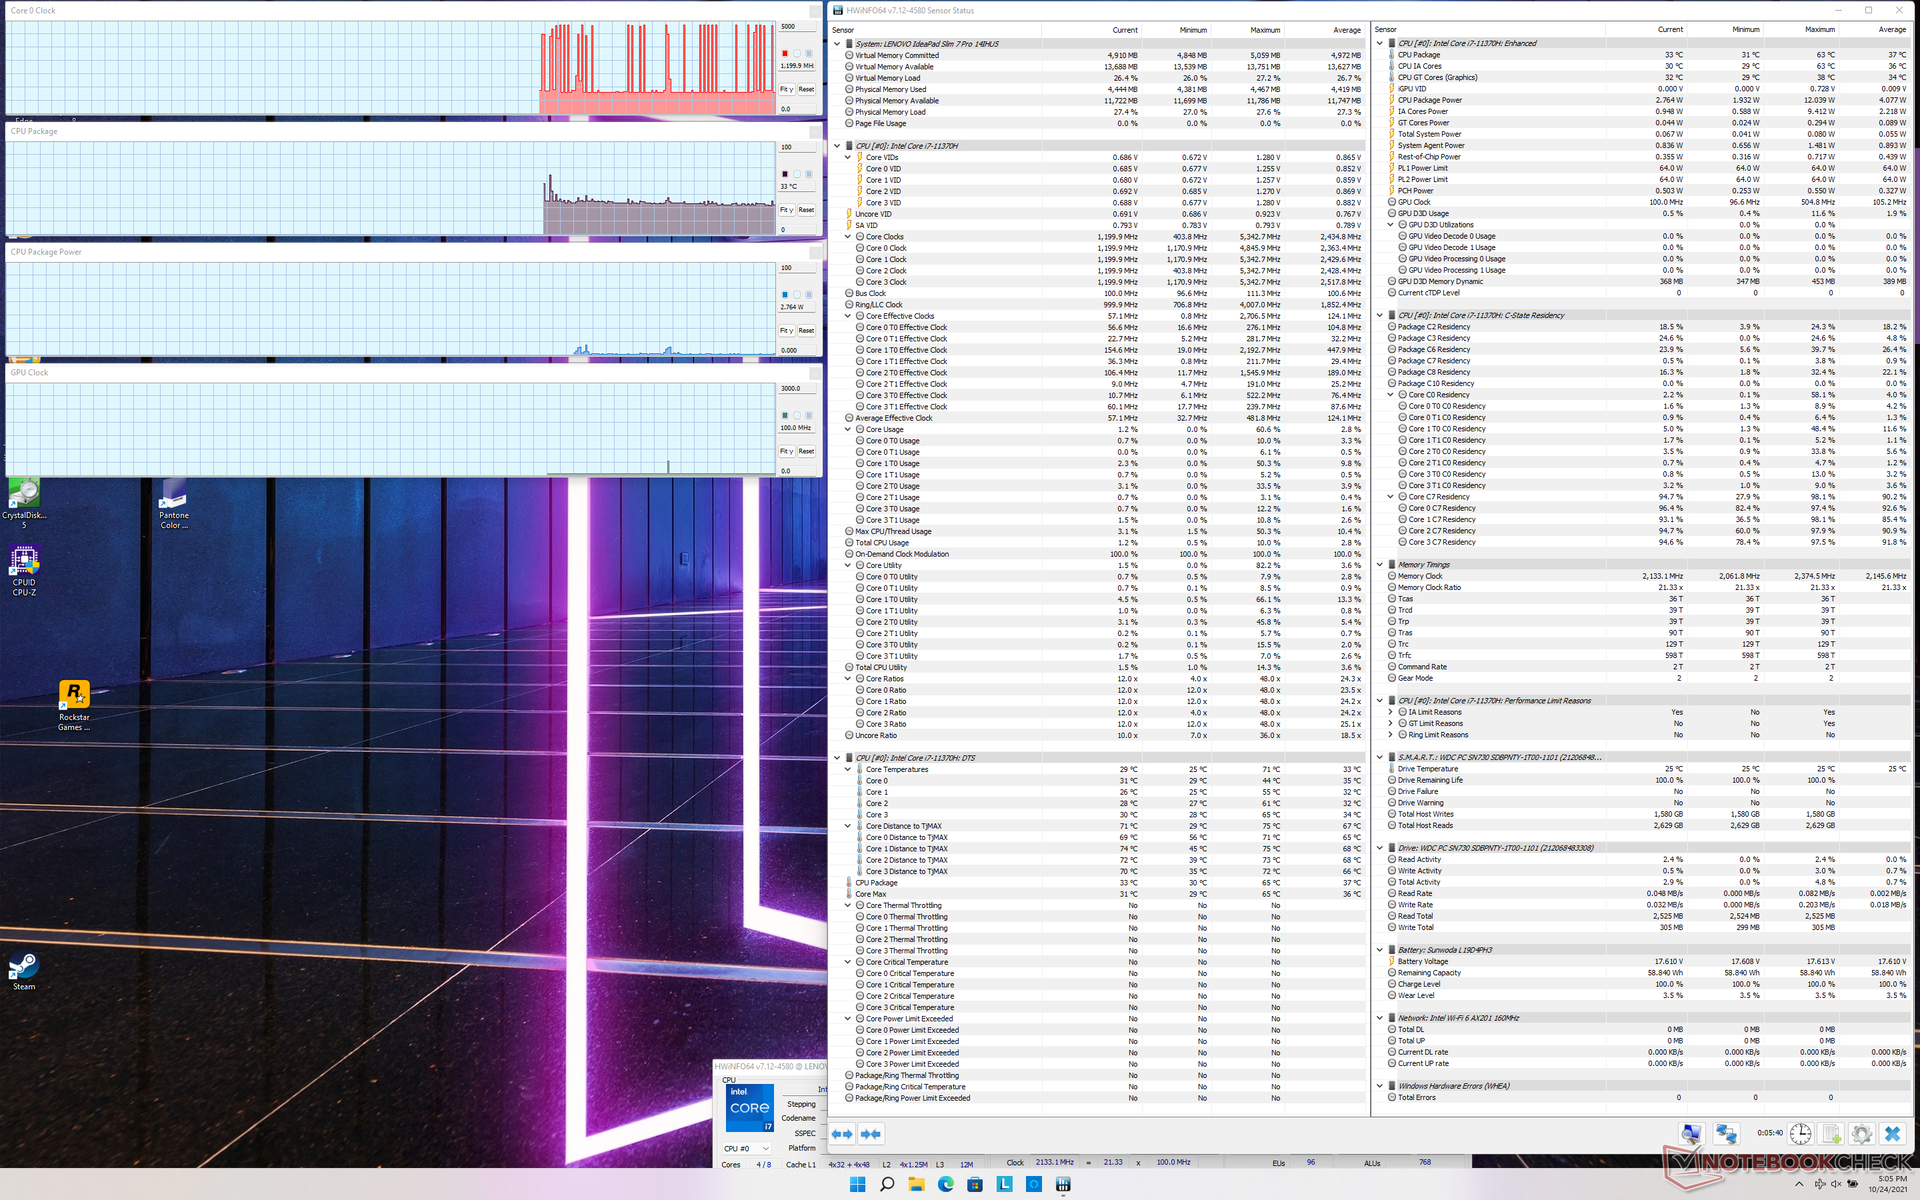
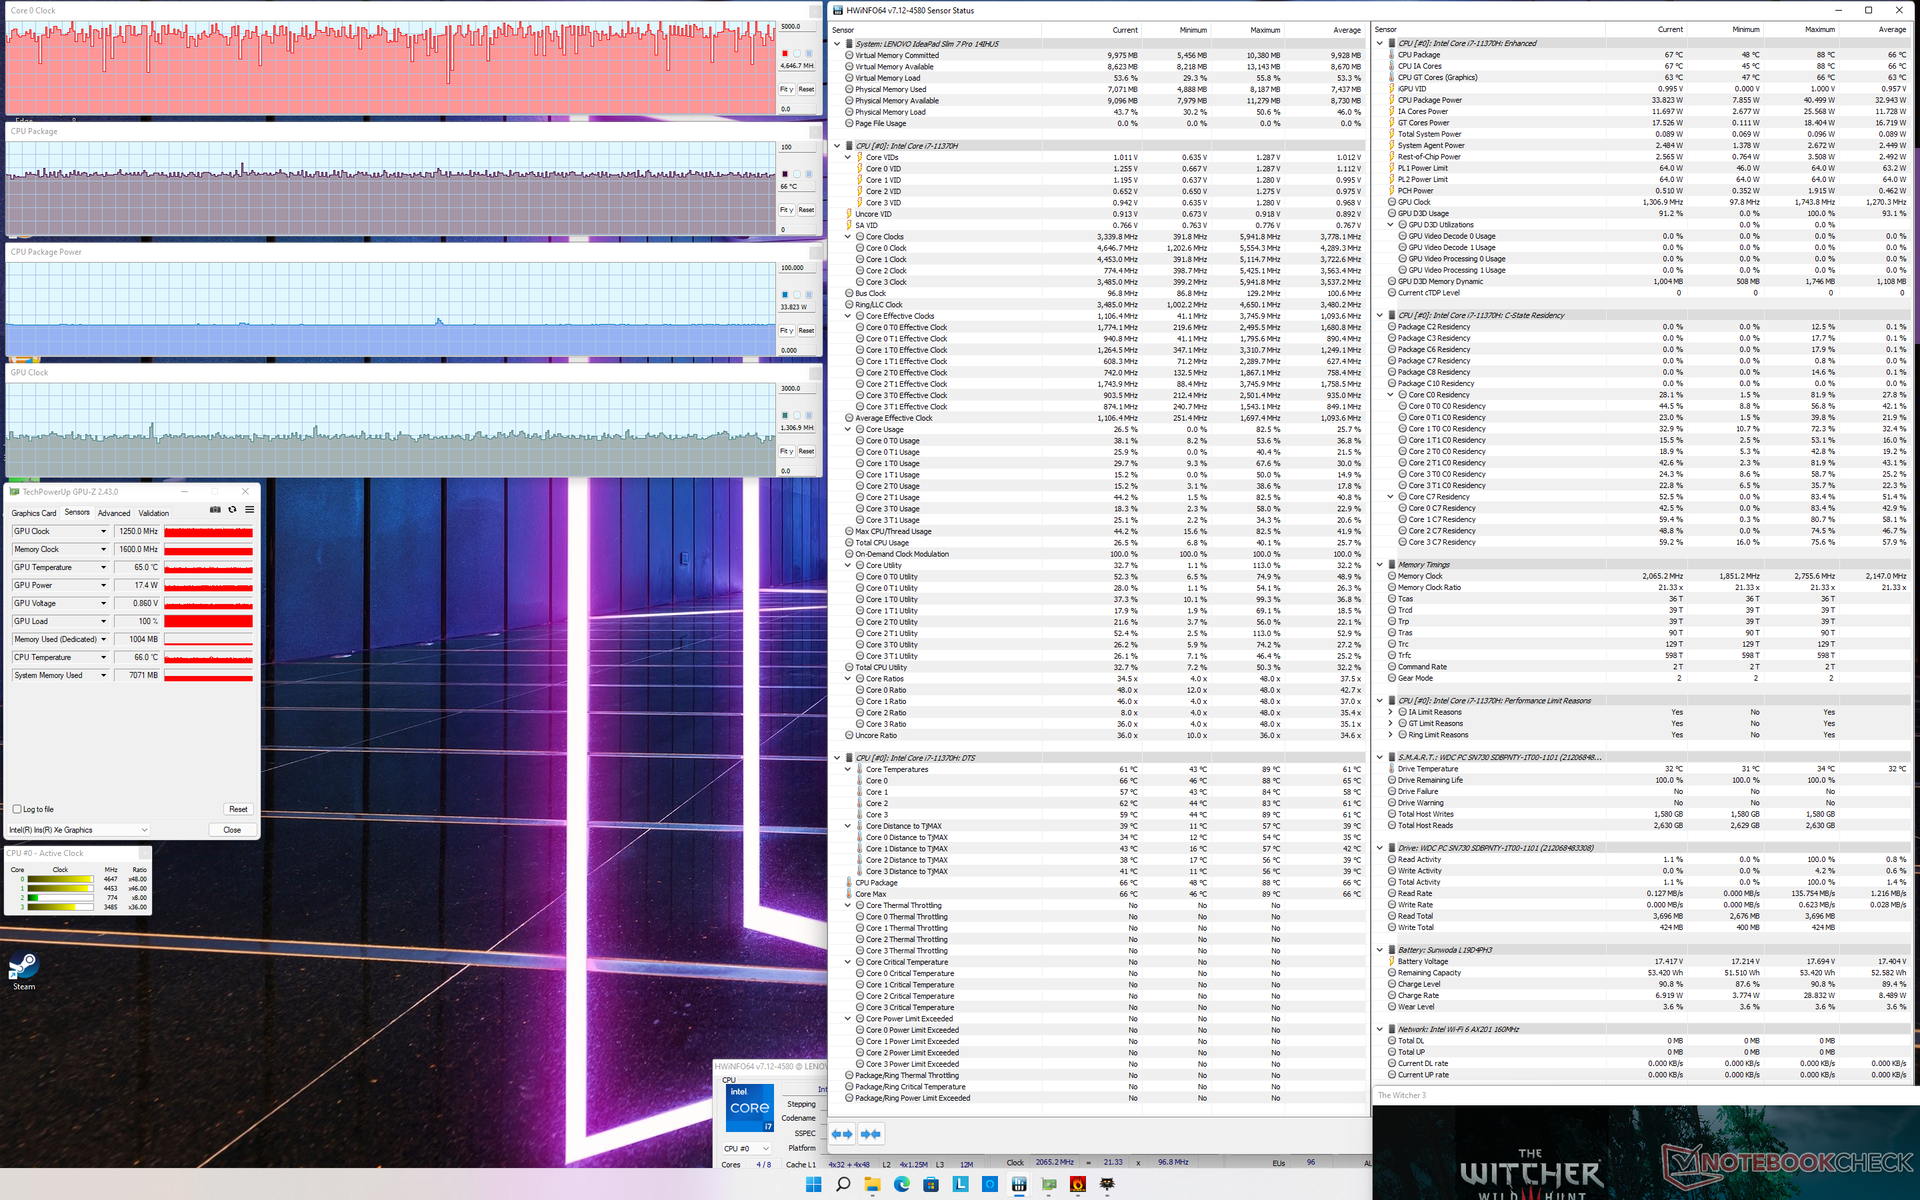
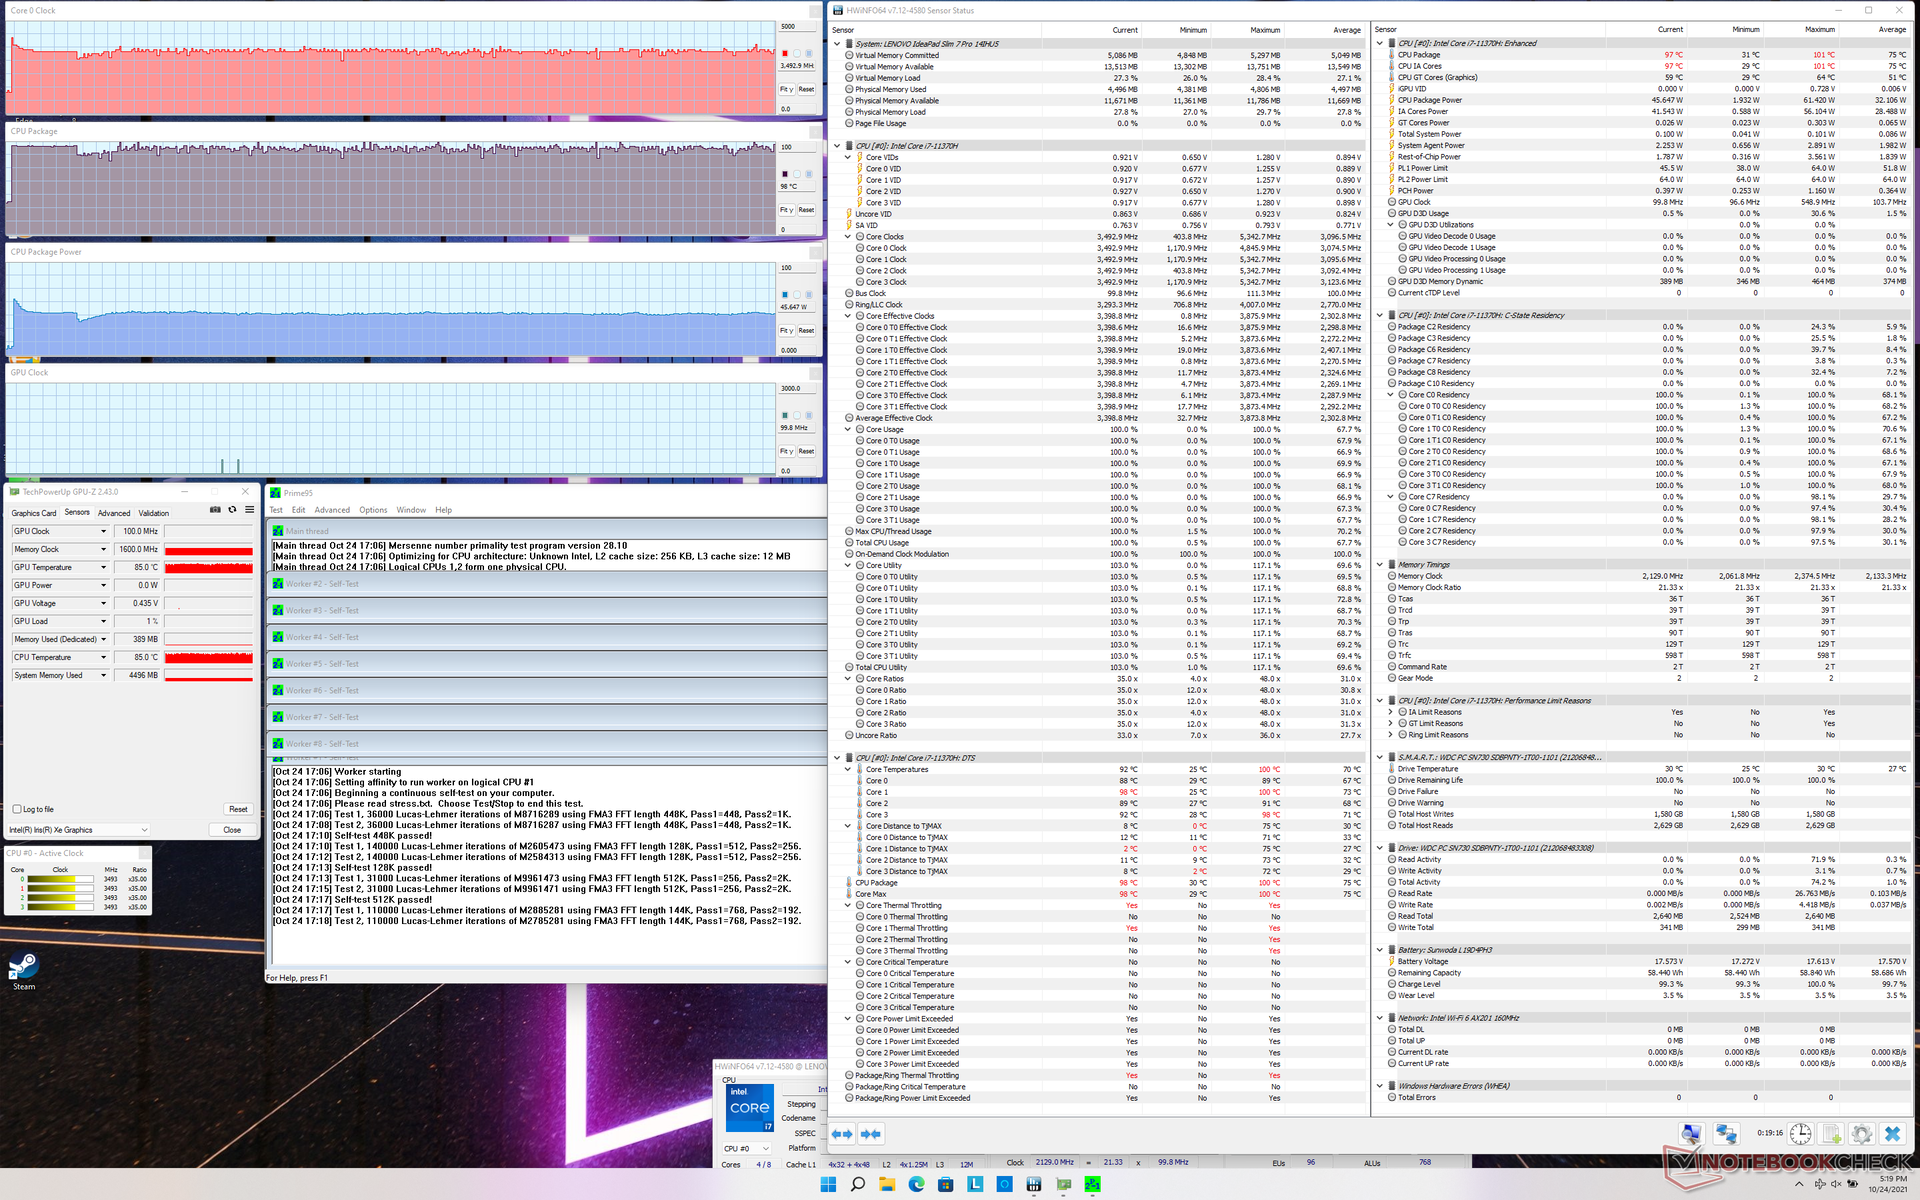
Stress Test — Warmer than Expected
When running Prime95 to stress the CPU, clock rates would boost to 4.2 GHz for just the first split second until dropping to 3.4 GHz and 97 C for the next 60 to 70 seconds. Thereafter, clock rates would range between 3.2 and 3.5 GHz while maintaining a core temperature in the 88 C to 100 C range. Running this same test on the Vaio Z equipped with the nearly identical Core i7-11375H CPU would result in a stable clock rate of 3.4 GHz and a lower core temperature of 81 C. If gaming, core temperature, GPU clock rate, and memory clock rate would stabilize at 66 C, 1250 MHz, and 1600 MHz, respectively, compared to 62 C, 1350 MHz, and 2000 MHz on the aforementioned Vaio. In other words, users can get more performance and at lower core temperatures with the Vaio.
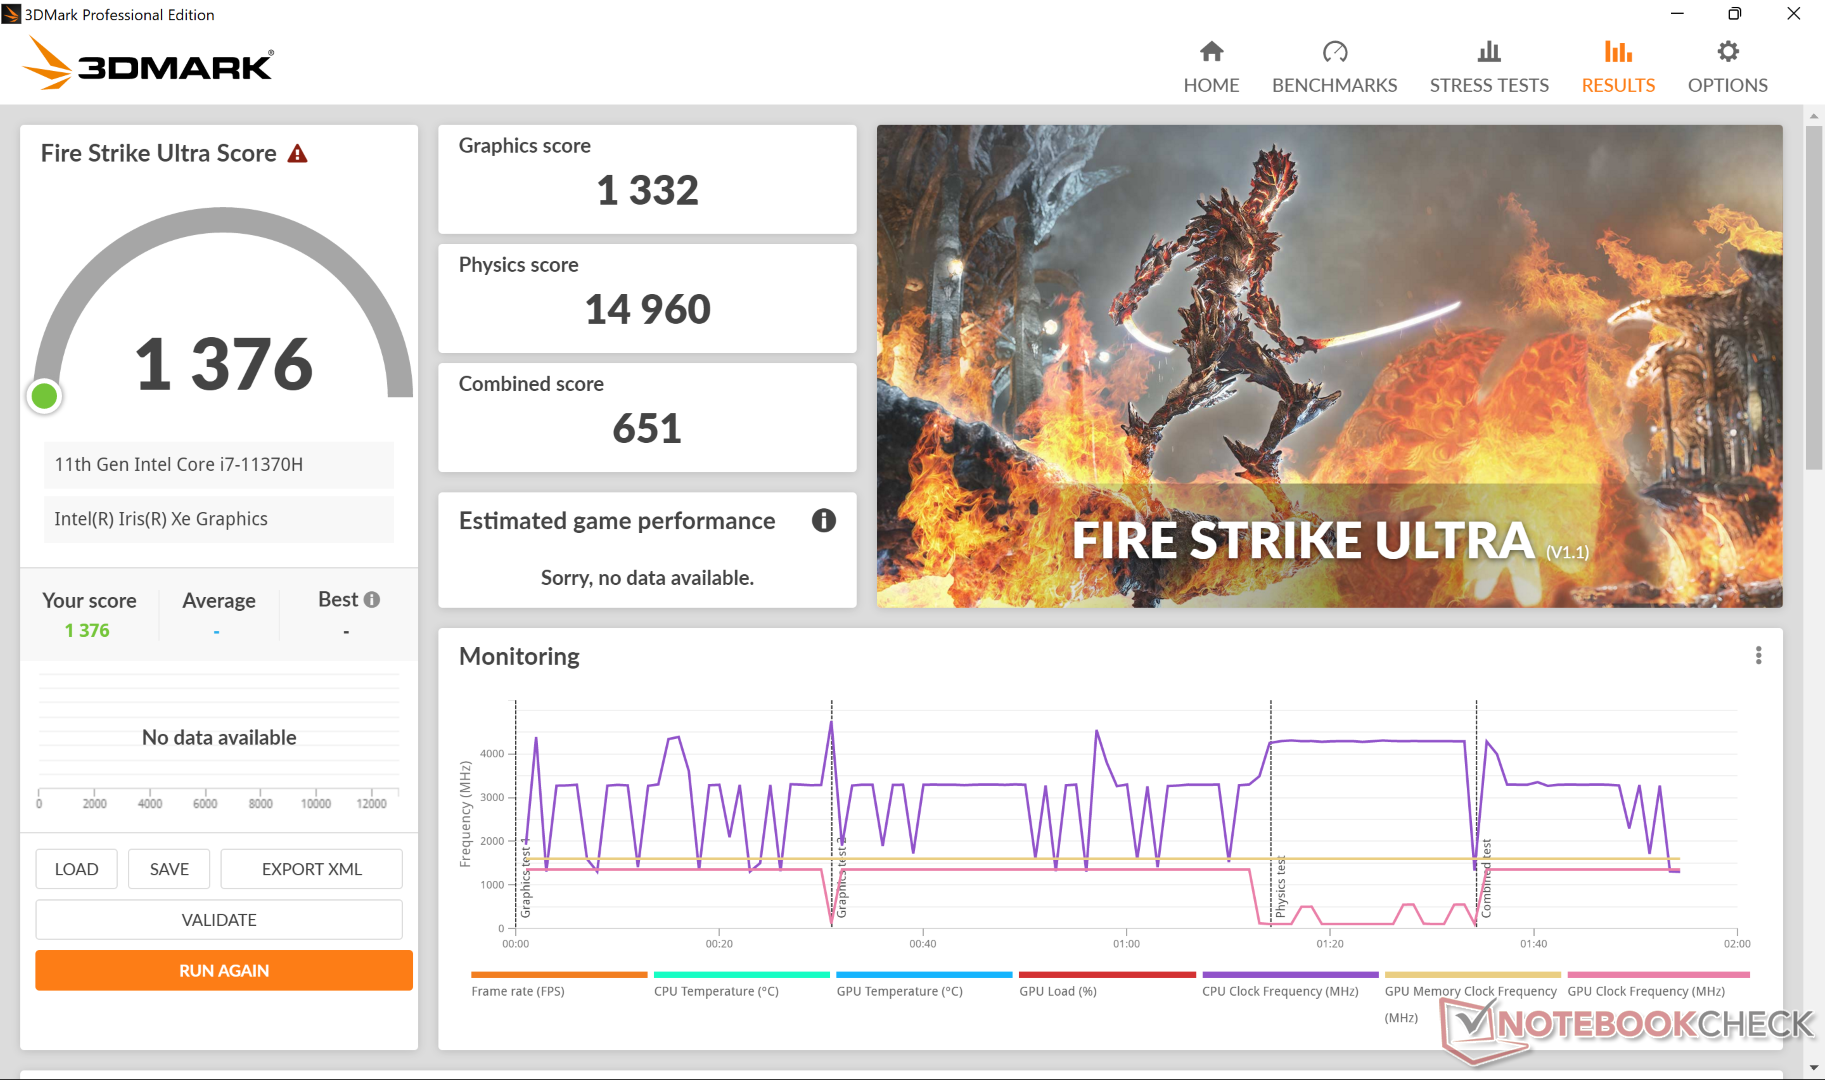
Running on battery power will impact performance slightly. A 3DMark 11 test on batteries would return Physics and graphics scores of 11586 and 6691 points, respectively, compared to 11719 and 7115 points when on mains.
| CPU Clock (GHz) | GPU Clock (MHz) | Average CPU Temperature (°C) | |
| System Idle | -- | -- | 33 |
| Prime95 Stress | 3.2 - 3.5 | -- | 88 - 100 |
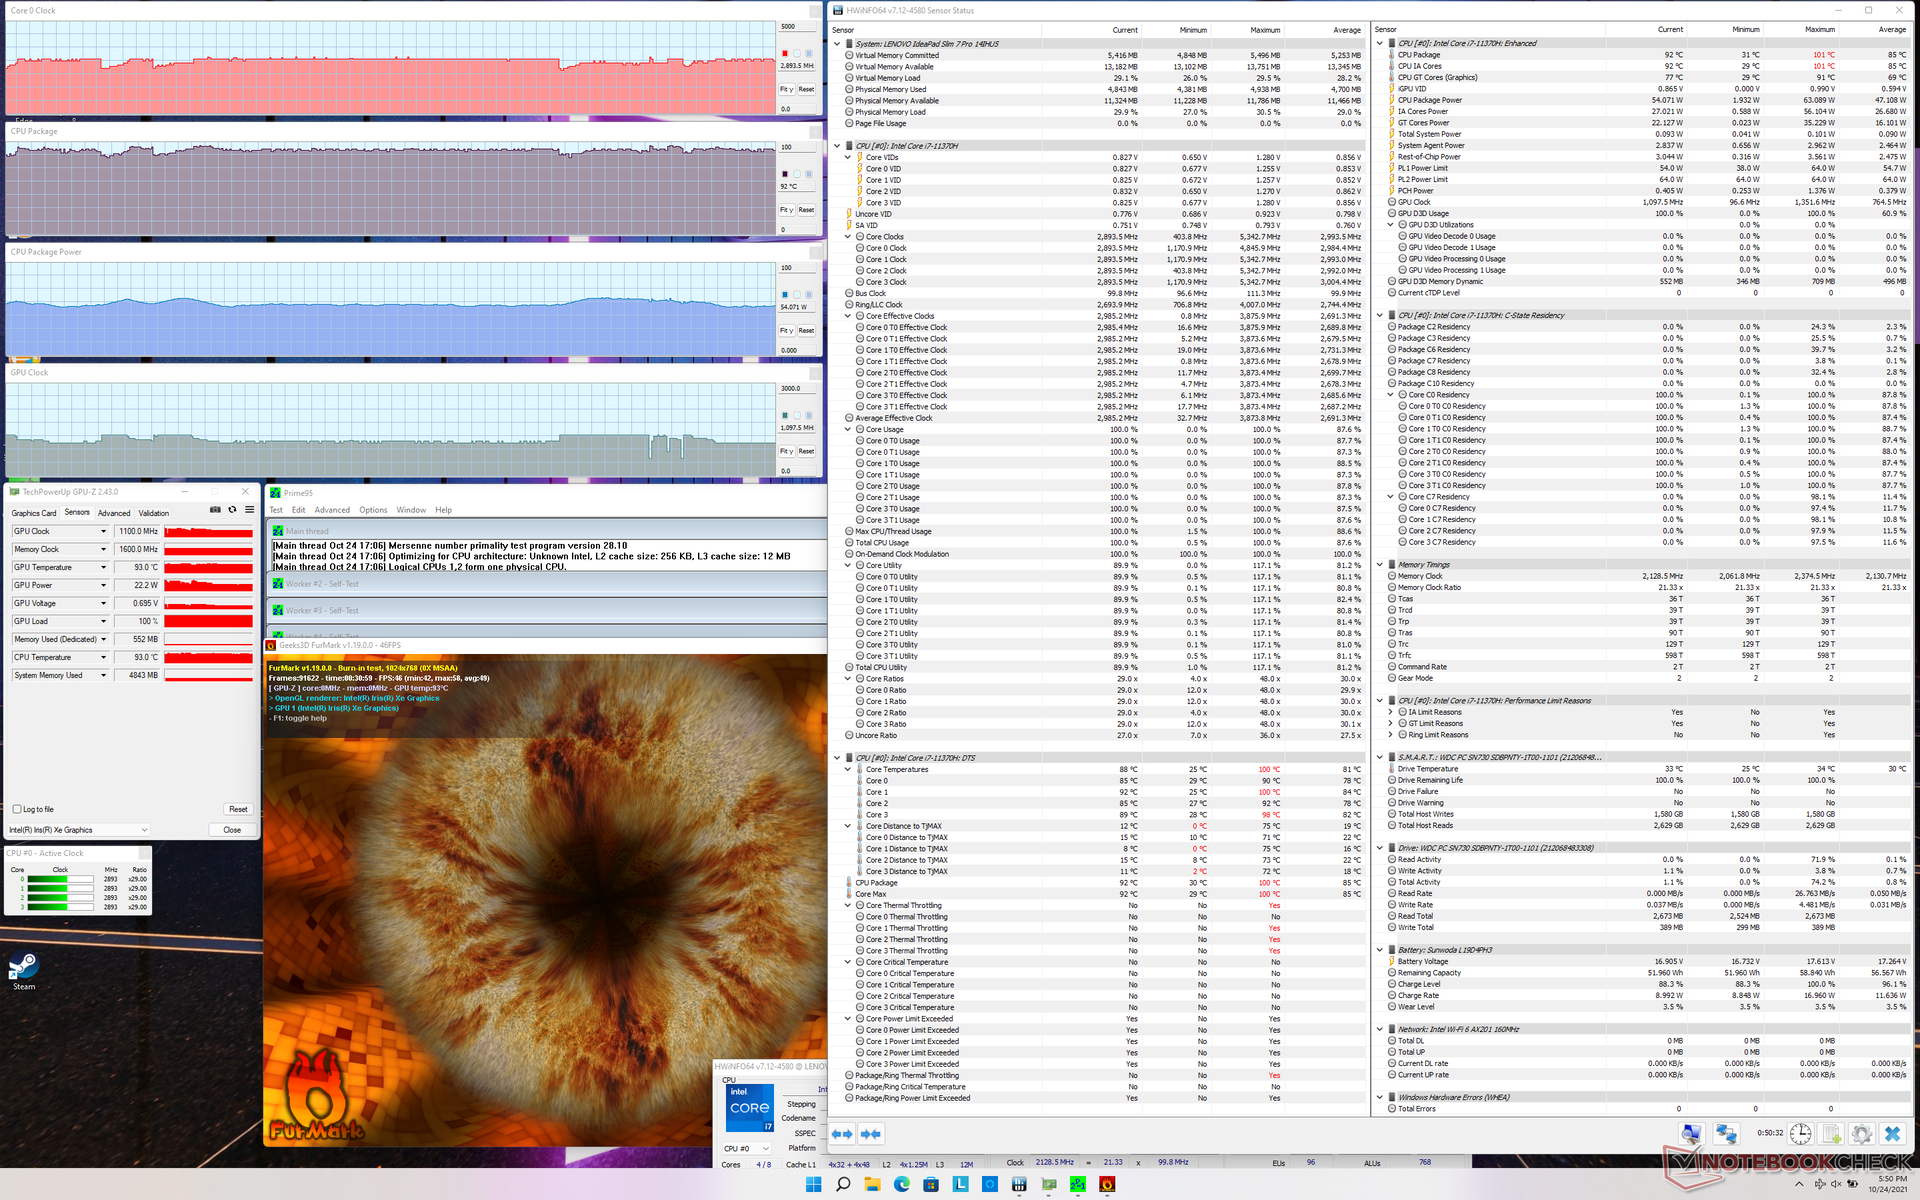
| Prime95 + FurMark Stress | 2.4 - 3.0 | 1100 - 1350 | 88 - 97 |
| Witcher 3 Stress | 0.8 - 1.8 | ~1250 | 66 |
Speakers
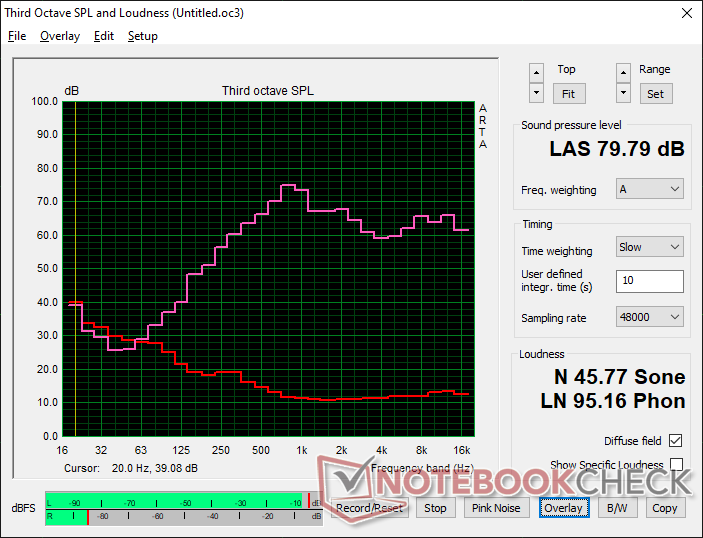
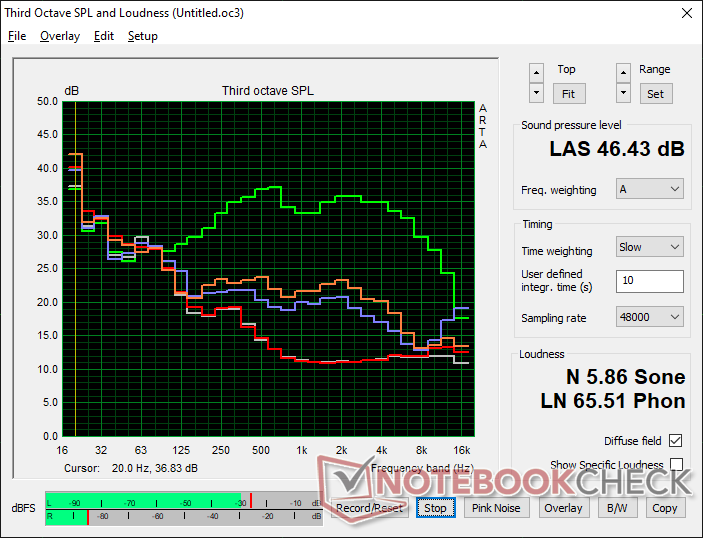
Lenovo IdeaPad Slim 7i Pro 14IHU5 audio analysis
(±) | speaker loudness is average but good (79.8 dB)
Bass 100 - 315 Hz
(±) | reduced bass - on average 14.8% lower than median
(±) | linearity of bass is average (8.9% delta to prev. frequency)
Mids 400 - 2000 Hz
(±) | higher mids - on average 5.2% higher than median
(+) | mids are linear (5.7% delta to prev. frequency)
Highs 2 - 16 kHz
(+) | balanced highs - only 2.3% away from median
(+) | highs are linear (4.7% delta to prev. frequency)
Overall 100 - 16.000 Hz
(+) | overall sound is linear (14.5% difference to median)
Compared to same class
» 28% of all tested devices in this class were better, 6% similar, 66% worse
» The best had a delta of 5%, average was 18%, worst was 53%
Compared to all devices tested
» 18% of all tested devices were better, 4% similar, 78% worse
» The best had a delta of 4%, average was 24%, worst was 134%
Apple MacBook 12 (Early 2016) 1.1 GHz audio analysis
(+) | speakers can play relatively loud (83.6 dB)
Bass 100 - 315 Hz
(±) | reduced bass - on average 11.3% lower than median
(±) | linearity of bass is average (14.2% delta to prev. frequency)
Mids 400 - 2000 Hz
(+) | balanced mids - only 2.4% away from median
(+) | mids are linear (5.5% delta to prev. frequency)
Highs 2 - 16 kHz
(+) | balanced highs - only 2% away from median
(+) | highs are linear (4.5% delta to prev. frequency)
Overall 100 - 16.000 Hz
(+) | overall sound is linear (10.2% difference to median)
Compared to same class
» 7% of all tested devices in this class were better, 2% similar, 91% worse
» The best had a delta of 5%, average was 18%, worst was 53%
Compared to all devices tested
» 4% of all tested devices were better, 1% similar, 94% worse
» The best had a delta of 4%, average was 24%, worst was 134%
Energy Management
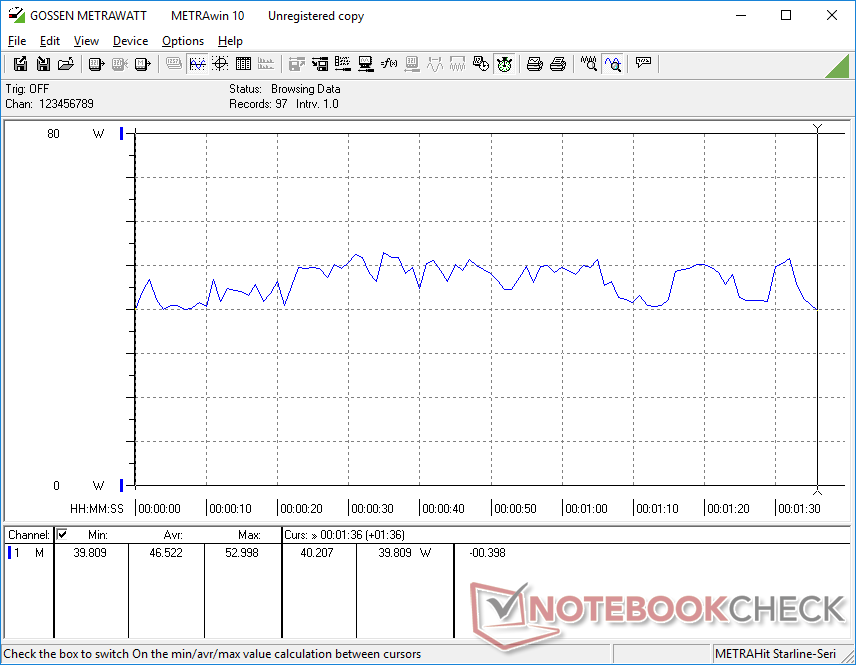
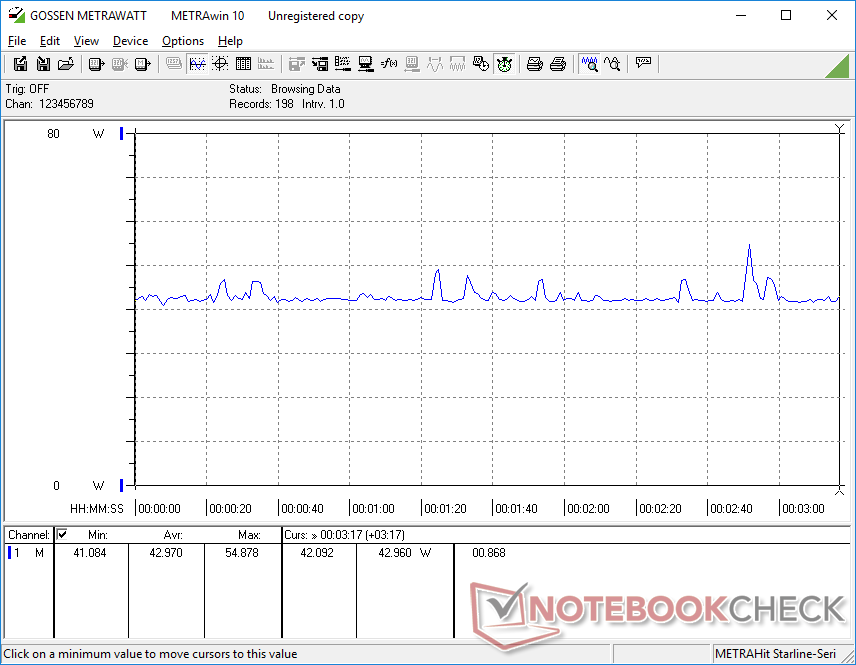
Power Consumption — On the High Side
Overall power consumption is higher than the average Core i7-1165G7 laptop due to our more power-hungry Core-H part. Running games on the HP EliteBook 850 G8 would draw about 33 W compared to 43 to 47 W on our Lenovo. Thus, the higher-then-average Iris Xe performance of our Core i7-11370H recorded above doesn't exactly come free.
The Ryzen H-powered Yoga Slim 7 Pro alternative would actually draw more power than our IdeaPad Slim 7i Pro when gaming (54 W vs. 43 W) even though our IdeaPad comes with faster graphics performance across the board.
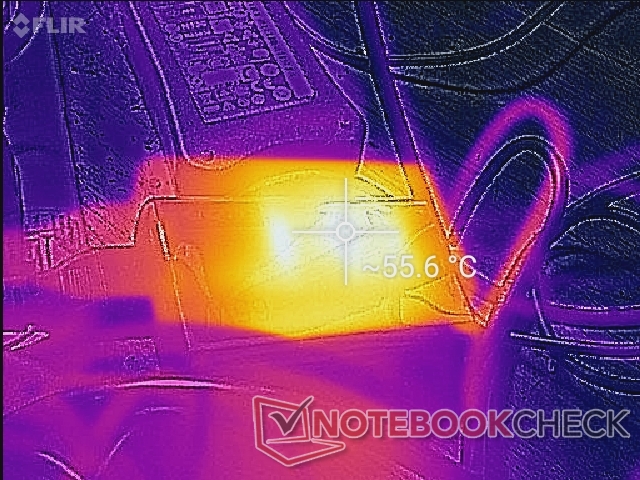
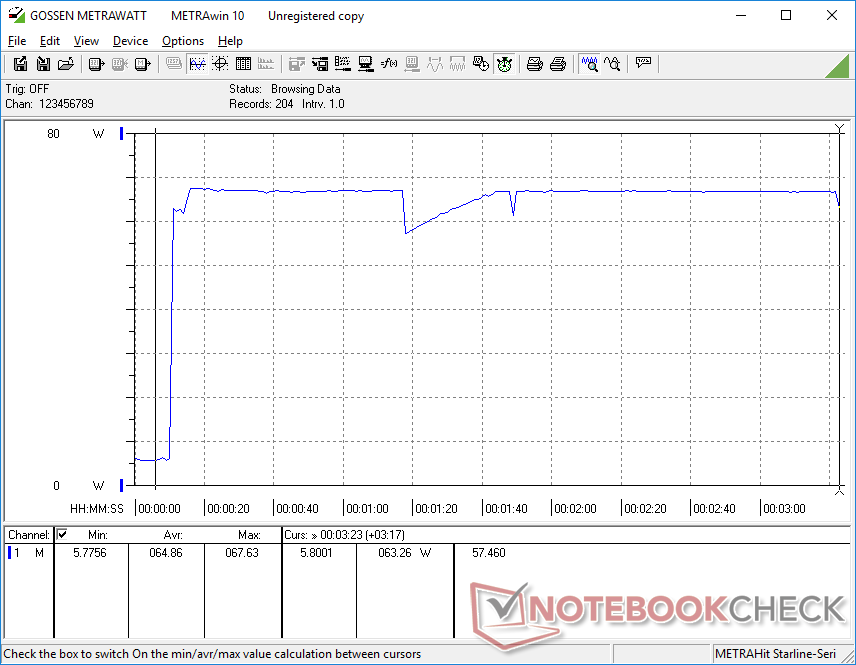
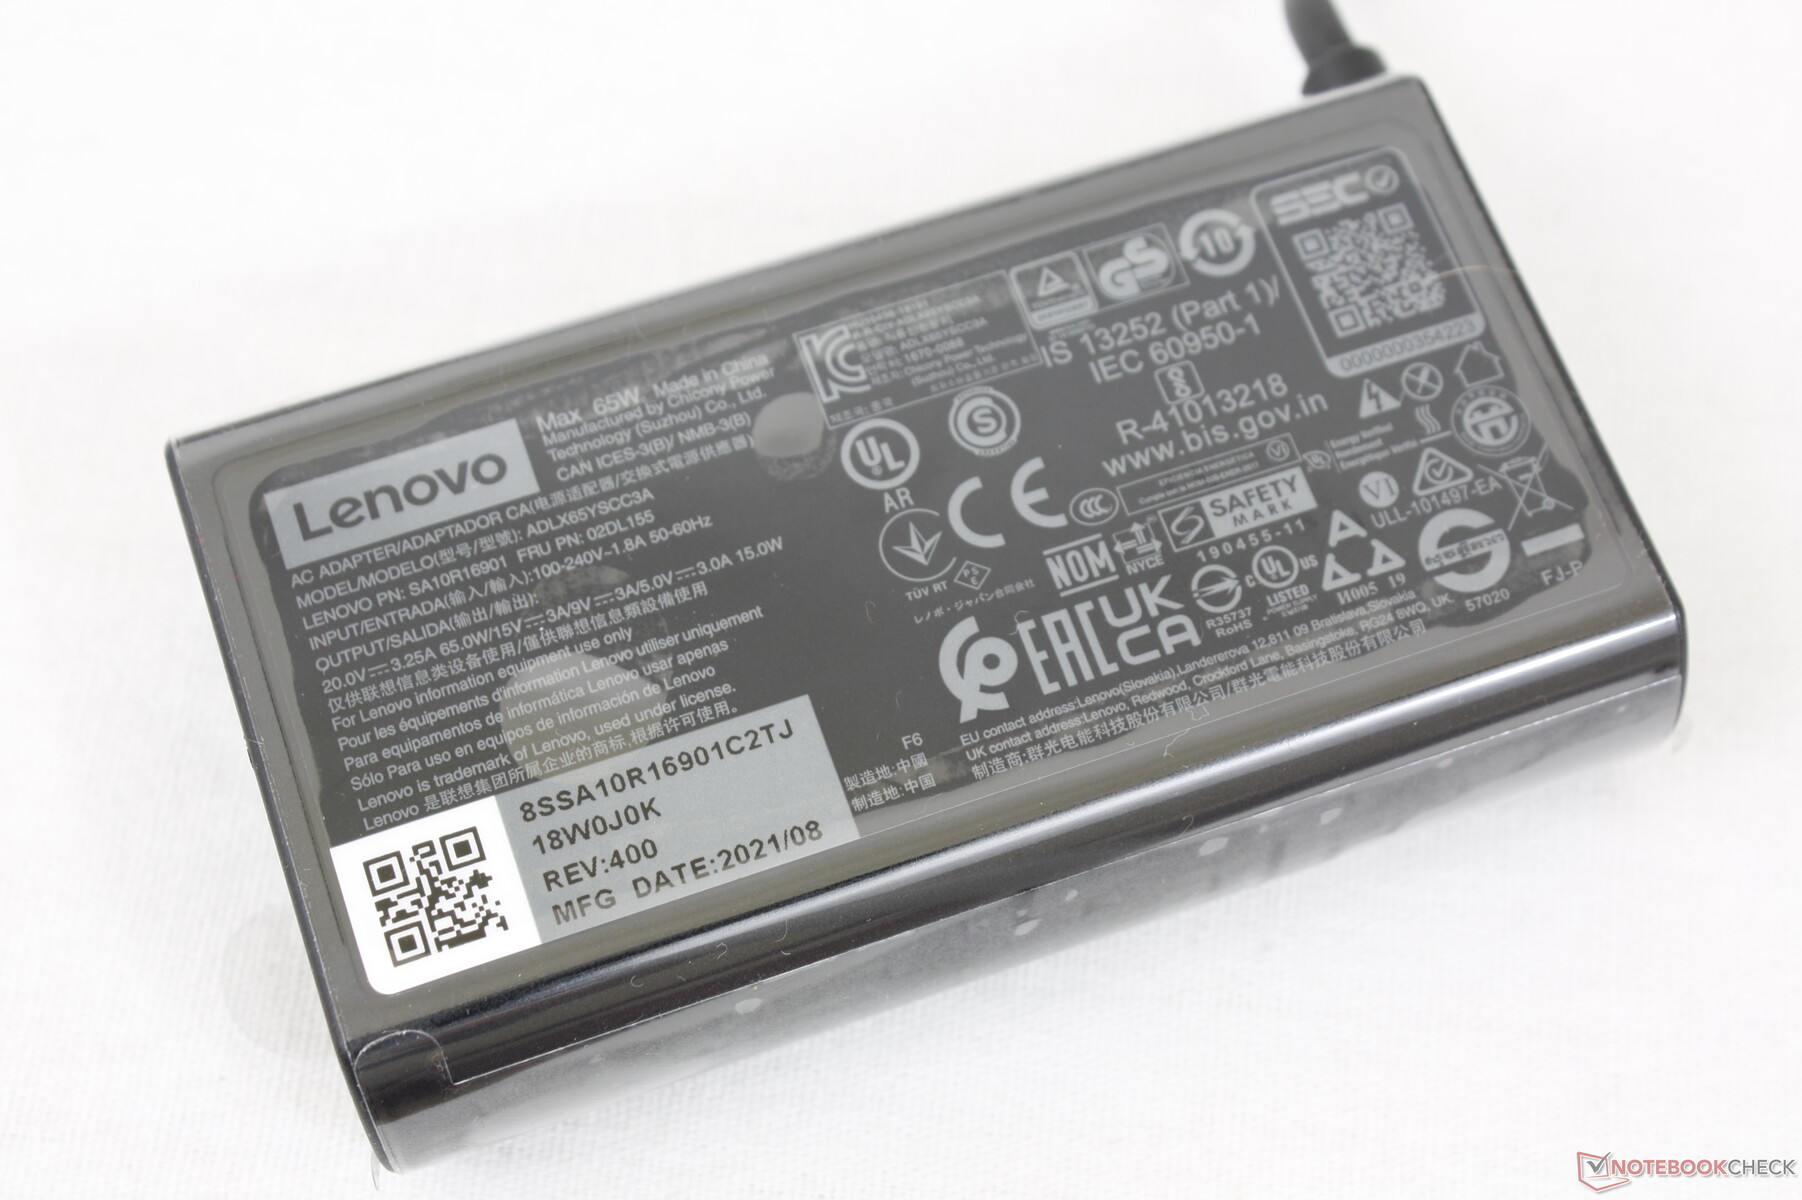
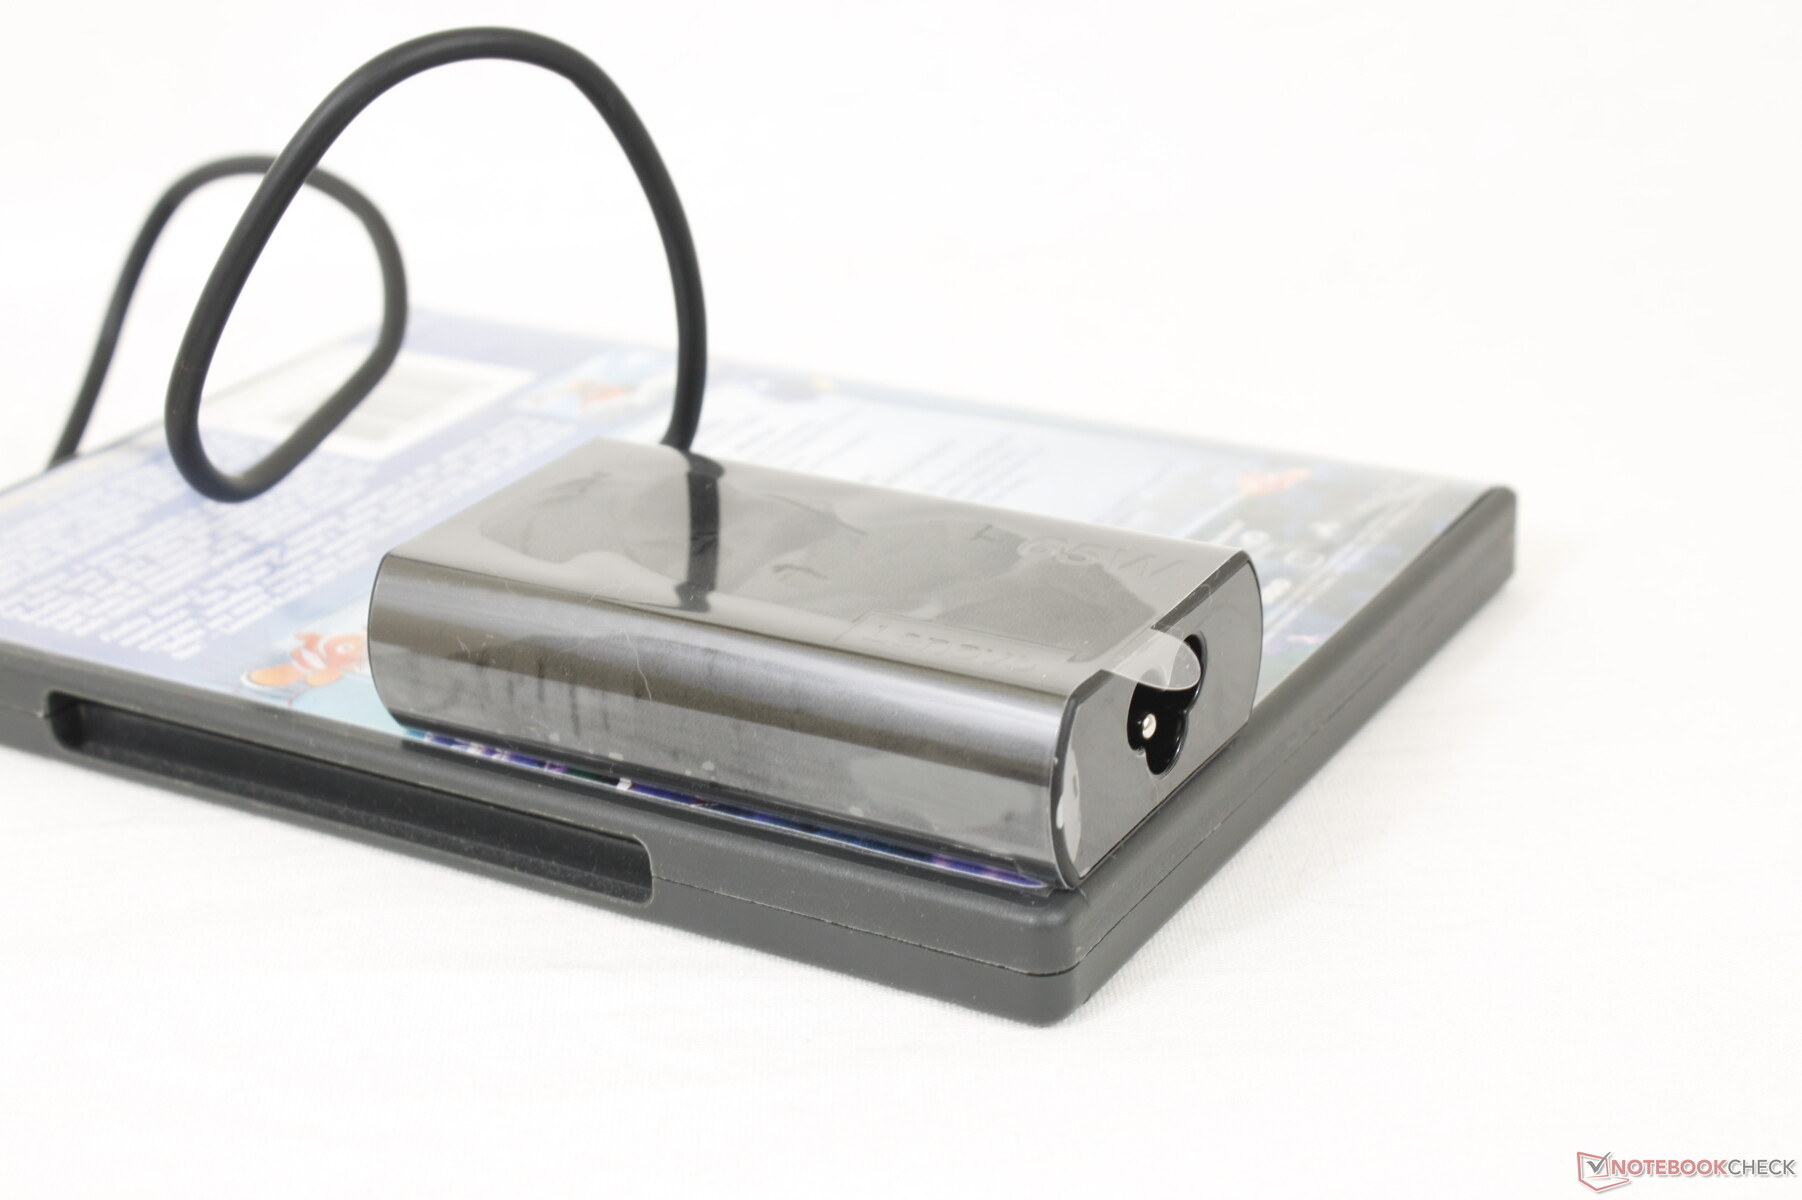
We're able to reach a maximum draw of 67.4 W from the small (~8.8 x 5 x 2.2 cm) 65 W AC adapter when running Prime95 and FurMark simultaneously. Consequently, the system will not recharge at a decent rate when under such extreme processing loads. Lenovo could have potentially shipped a more capable 80 W or 100 W AC adapter instead, but it would have likely been larger and heavier than the 65 W one.

| Lenovo IdeaPad Slim 7i Pro 14IHU5 Iris Xe G7 96EUs, i7-11370H, WDC PC SN730 SDBPNTY-1T00 | Lenovo Yoga Slim 7 14ITL05 82A300CNGE Iris Xe G7 80EUs, i5-1135G7, WDC PC SN730 SDBPNTY-512G | Huawei MateBook 14s i7 Iris Xe G7 96EUs, i7-11370H, Toshiba XG6 KXG60ZNV512G | Asus Zenbook 14X UX5400E GeForce MX450, i7-1165G7, SK Hynix HFM001TD3JX013N | MSI Summit E14 A11SCS GeForce GTX 1650 Ti Max-Q, i7-1185G7, Phison 1TB SM2801T24GKBB4S-E162 | Razer Blade 14 Ryzen 9 RTX 3070 GeForce RTX 3070 Laptop GPU, R9 5900HX, Samsung PM981a MZVLB1T0HBLR | |
|---|---|---|---|---|---|---|
| Power Consumption | 29% | -7% | -35% | -95% | -147% | |
| Idle Minimum * (Watt) | 4.8 | 3.3 31% | 4.4 8% | 7.2 -50% | 9.9 -106% | 9.4 -96% |
| Idle Average * (Watt) | 7.9 | 5 37% | 8.7 -10% | 10.4 -32% | 17.4 -120% | 15.8 -100% |
| Idle Maximum * (Watt) | 8.6 | 7.5 13% | 9.6 -12% | 11 -28% | 22.5 -162% | 24.1 -180% |
| Load Average * (Watt) | 46.5 | 28 40% | 46 1% | 61.7 -33% | 85.6 -84% | 76.8 -65% |
| Witcher 3 ultra * (Watt) | 43 | 28.8 33% | 42.2 2% | 53.6 -25% | 70.9 -65% | 154 -258% |
| Load Maximum * (Watt) | 67.4 | 56 17% | 87.6 -30% | 96 -42% | 91.1 -35% | 189.7 -181% |
* ... smaller is better
| Off / Standby | |
| Idle | |
| Load |
|
Key:
min: | |
Power Consumption Witcher 3 / Stresstest
Battery Life — Good for a Full Day
We're able to squeeze almost 8.5 hours from the integrated 61 Wh battery when browsing the web at 150 nit brightness. The Core U-powered Yoga Slim 7 can last for a few hours longer while the Ryzen-H powered Yoga Slim 7 Pro would return similar results to our Core H-powered IdeaPad Slim 7i Pro.
Charging from empty to full capacity takes about 90 minutes with the included AC adapter. As noted above, the charging rate would slow significantly if the CPU is at 100 percent utilization.
| Lenovo IdeaPad Slim 7i Pro 14IHU5 i7-11370H, Iris Xe G7 96EUs, 61 Wh | Lenovo Yoga Slim 7 14ITL05 82A300CNGE i5-1135G7, Iris Xe G7 80EUs, 60.7 Wh | Huawei MateBook 14s i7 i7-11370H, Iris Xe G7 96EUs, 60 Wh | Asus Zenbook 14X UX5400E i7-1165G7, GeForce MX450, 63 Wh | MSI Summit E14 A11SCS i7-1185G7, GeForce GTX 1650 Ti Max-Q, 52 Wh | Razer Blade 14 Ryzen 9 RTX 3070 R9 5900HX, GeForce RTX 3070 Laptop GPU, 62 Wh | |
|---|---|---|---|---|---|---|
| Battery runtime | 39% | 28% | 31% | -39% | -4% | |
| Reader / Idle (h) | 14.8 | 34 130% | 6.6 -55% | 13.8 -7% | ||
| WiFi v1.3 (h) | 8.4 | 11.7 39% | 10.3 23% | 5.4 -36% | 4.5 -46% | 7.3 -13% |
| Load (h) | 1.2 | 1.6 33% | 1.2 0% | 1 -17% | 1.3 8% | |
| H.264 (h) | 11.6 |
Pros
Cons
Verdict — 90 Hz is where it's at
The main selling point of the IdeaPad Slim 7i Pro versus a regular IdeaPad Slim 7 is its faster Core H-series CPU. In reality, the Core i7-11370H is only marginally faster than the U-series Core i7-1165G7 to the point where most users are not likely to notice the benefits. The slight performance uptick comes at the cost of slightly higher power consumption as well meaning owners will have to deal with potentially warmer temperatures or louder fans to compensate. Unless if you happen to be a power user, then the regular non-Pro model will be more than enough.
Once you go 90 Hz, you can't go back. The higher refresh rate panel is more noticeable than the move to the Tiger Lake H35 Core i7-11370H processor.
The most tangible feature of the IdeaPad Slim 7i Pro that's not found on most other subnotebooks is its 90 Hz display. Gaming laptops have enjoyed high refresh rate panels for several years now while consumer Ultrabooks have been stuck with 60 Hz. The higher refresh rate allows for a noticeably smoother user experience that anyone can appreciate — not just gamers. 90 Hz panels are something we'd love to see become more common on Ultrabooks moving forward.
Users who can't choose between the Intel-powered IdeaPad Slim 7i Pro or AMD-powered Yoga Slim 7 Pro should first decide if they want more CPU or GPU performance. The Intel version can offer faster integrated graphics performance or even eGPU performance since it supports Thunderbolt 4. Meanwhile, the AMD version can offer faster multi-thread CPU performance since it has double the cores and threads. Either way, all versions come with the same great 90 Hz display and average keyboard and clickpad.
Price and Availability
Lenovo IdeaPad Slim 7i Pro 14IHU5
- 10/27/2021 v7 (old)
Allen Ngo
Price comparison
