Dell XPS 13 9310 OLED Laptop Review: Is It Better Than IPS?
The XPS 13 9310 launched late last year alongside Intel's 11th gen Tiger Lake series. Configurations at the time included FHD (1920 x 1200) and 4K (3840 x 2400) options all with IPS panels. Dell had promised OLED to come at a later date to supplement the existing IPS SKUs.
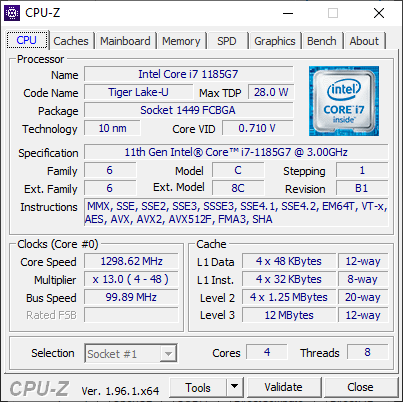
Now that halfway through 2021, the promised OLED SKU is finally shipping to customers for about $1650 USD complete with the Core i7-1185G7 CPU, 16 GB of soldered RAM, and 3.5K (3456 x 2160) resolution touchscreen. It's true that other flagship laptops have had OLED options for much longer, but this is the first time we're seeing it on a 16:10 13.4-inch form factor.
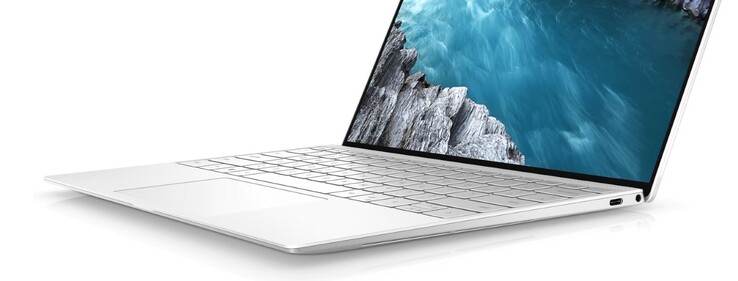
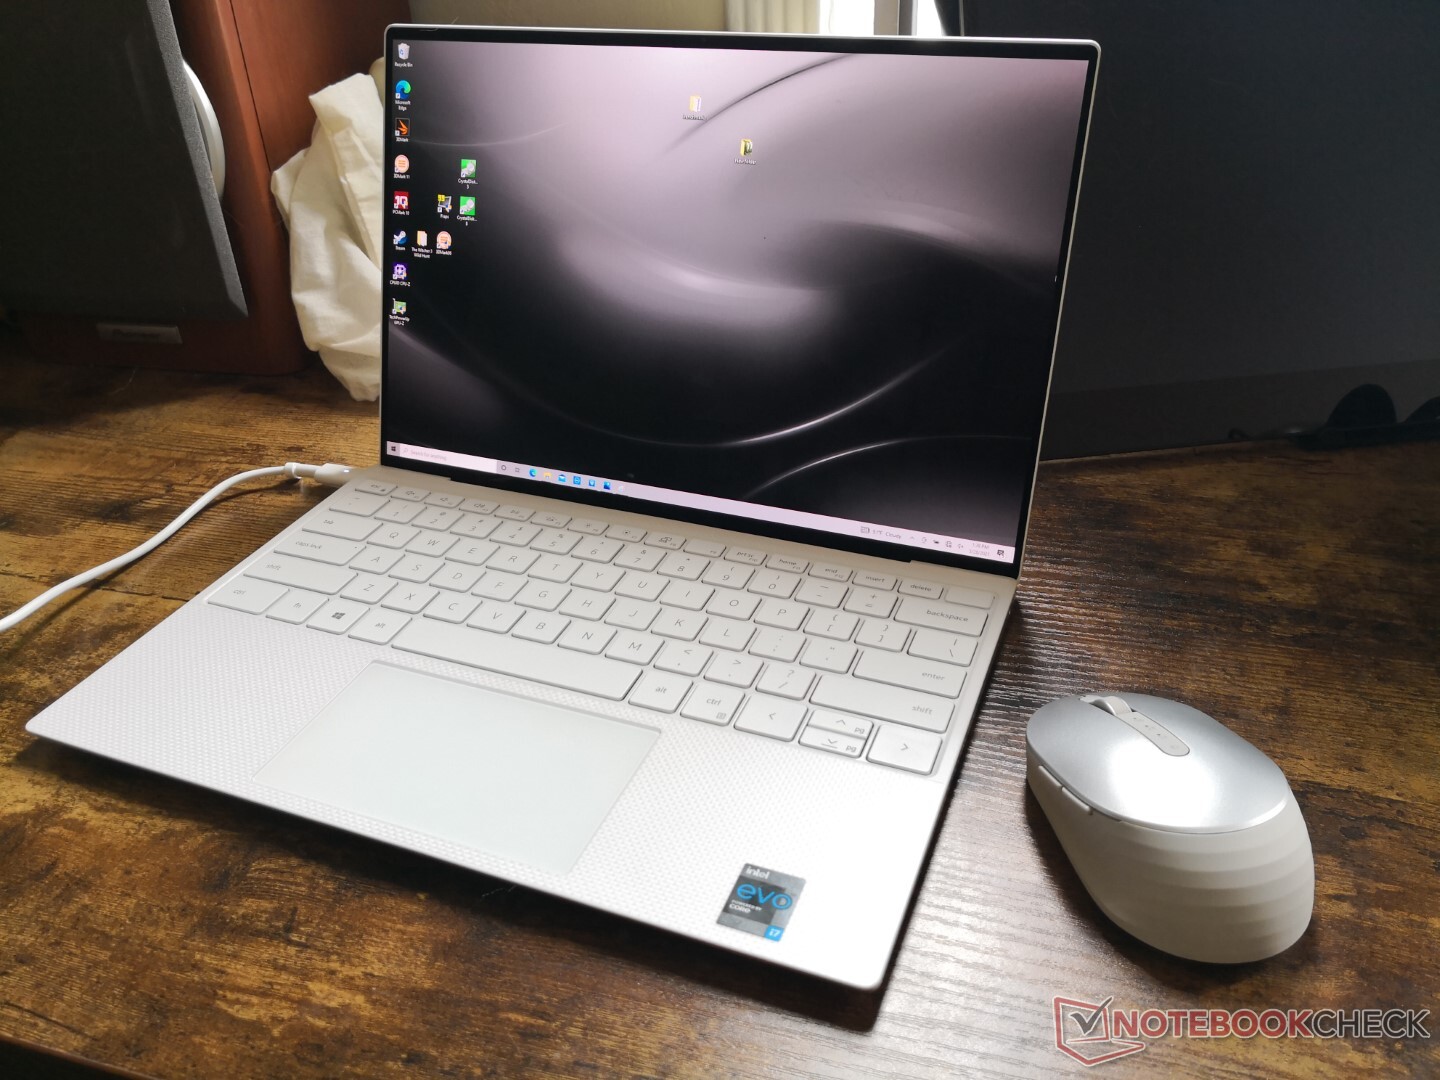
We recommend checking out our existing three reviews on the XPS 13 9310 FHD, XPS 13 9310 4K, and XPS 13 9300 to learn more about the chassis and its features as the XPS 13 9310 OLED is visually identical to these configurations. This review will focus more on the OLED touchscreen and what users can expect from it when compared to the usual XPS 13 IPS options.
More Dell reviews:
potential competitors in comparison
Rating | Date | Model | Weight | Height | Size | Resolution | Price |
|---|---|---|---|---|---|---|---|
| 88.3 % v7 (old) | 05 / 2021 | Dell XPS 13 9310 OLED i7-1185G7, Iris Xe G7 96EUs | 1.2 kg | 14.8 mm | 13.40" | 3456x2160 | |
| 87.4 % v7 (old) | 12 / 2020 | Dell XPS 13 9310 Core i7 4K i7-1185G7, Iris Xe G7 96EUs | 1.3 kg | 14.8 mm | 13.40" | 3840x2400 | |
| 88.1 % v7 (old) | 10 / 2020 | Dell XPS 13 9310 Core i7 FHD i7-1165G7, Iris Xe G7 96EUs | 1.3 kg | 14.8 mm | 13.40" | 1920x1200 | |
| 85.9 % v7 (old) | 11 / 2019 | Dell XPS 13 7390 Core i7-10710U i7-10710U, UHD Graphics 620 | 1.2 kg | 11.6 mm | 13.30" | 3840x2160 | |
| 86.9 % v7 (old) | 04 / 2021 | MSI Summit E13 Flip Evo A11MT i7-1185G7, Iris Xe G7 96EUs | 1.4 kg | 14.9 mm | 13.40" | 1920x1200 | |
v (old) | 09 / 2021 | Asus ZenBook 13 OLED UM325UA R7 5700U, Vega 8 | 1.1 kg | 14.8 mm | 13.30" | 1920x1080 |
Case
SD Card Reader
| SD Card Reader | |
| average JPG Copy Test (av. of 3 runs) | |
| Dell XPS 13 9310 Core i7 FHD (Toshiba Exceria Pro M501 64 GB UHS-II) | |
| Dell XPS 13 9310 Core i7 4K (Toshiba Exceria Pro M501 32 GB UHS-II) | |
| Dell XPS 13 9310 OLED (AV PRO microSD 128 GB V60) | |
| Dell XPS 13 7390 Core i7-10710U (Toshiba Exceria Pro M501 64 GB UHS-II) | |
| MSI Summit E13 Flip Evo A11MT (AV PRO microSD 128 GB V60) | |
| maximum AS SSD Seq Read Test (1GB) | |
| Dell XPS 13 9310 Core i7 4K (Toshiba Exceria Pro M501 32 GB UHS-II) | |
| Dell XPS 13 9310 Core i7 FHD (Toshiba Exceria Pro M501 64 GB UHS-II) | |
| Dell XPS 13 7390 Core i7-10710U (Toshiba Exceria Pro M501 64 GB UHS-II) | |
| Dell XPS 13 9310 OLED (AV PRO microSD 128 GB V60) | |
| MSI Summit E13 Flip Evo A11MT (AV PRO microSD 128 GB V60) | |
Communication
Transmit rates are slower than what we experienced on our older XPS 13 test units even after repeating this test several times. In practice, however, the connection remains stable and reliable for streaming and browsing.
Webcam


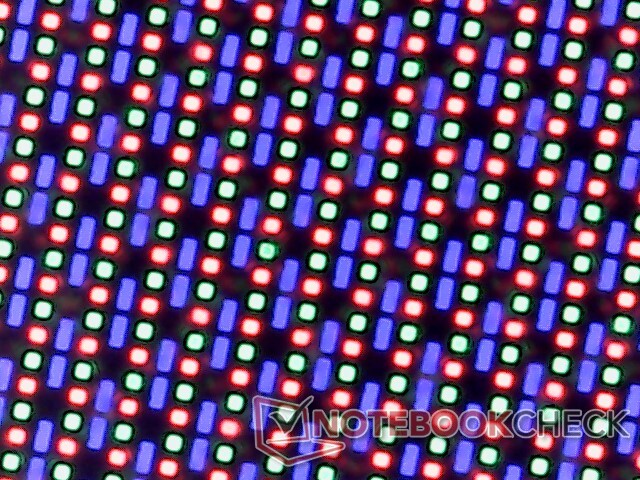
Display
Since the native resolution is 3.5K (3456 x 2160) instead of 4K (3840 x 2400), PPI is slightly lower than on the 4K XPS 13 IPS configuration (304 vs. 338). We suspect that the resolution is lower because there are currently no 4K OLED panels available in the 13.4-inch 16:10 form factor. Nonetheless, this can work in favor of OLED in some cases since text can be too tiny on the 4K 338 PPI screen.
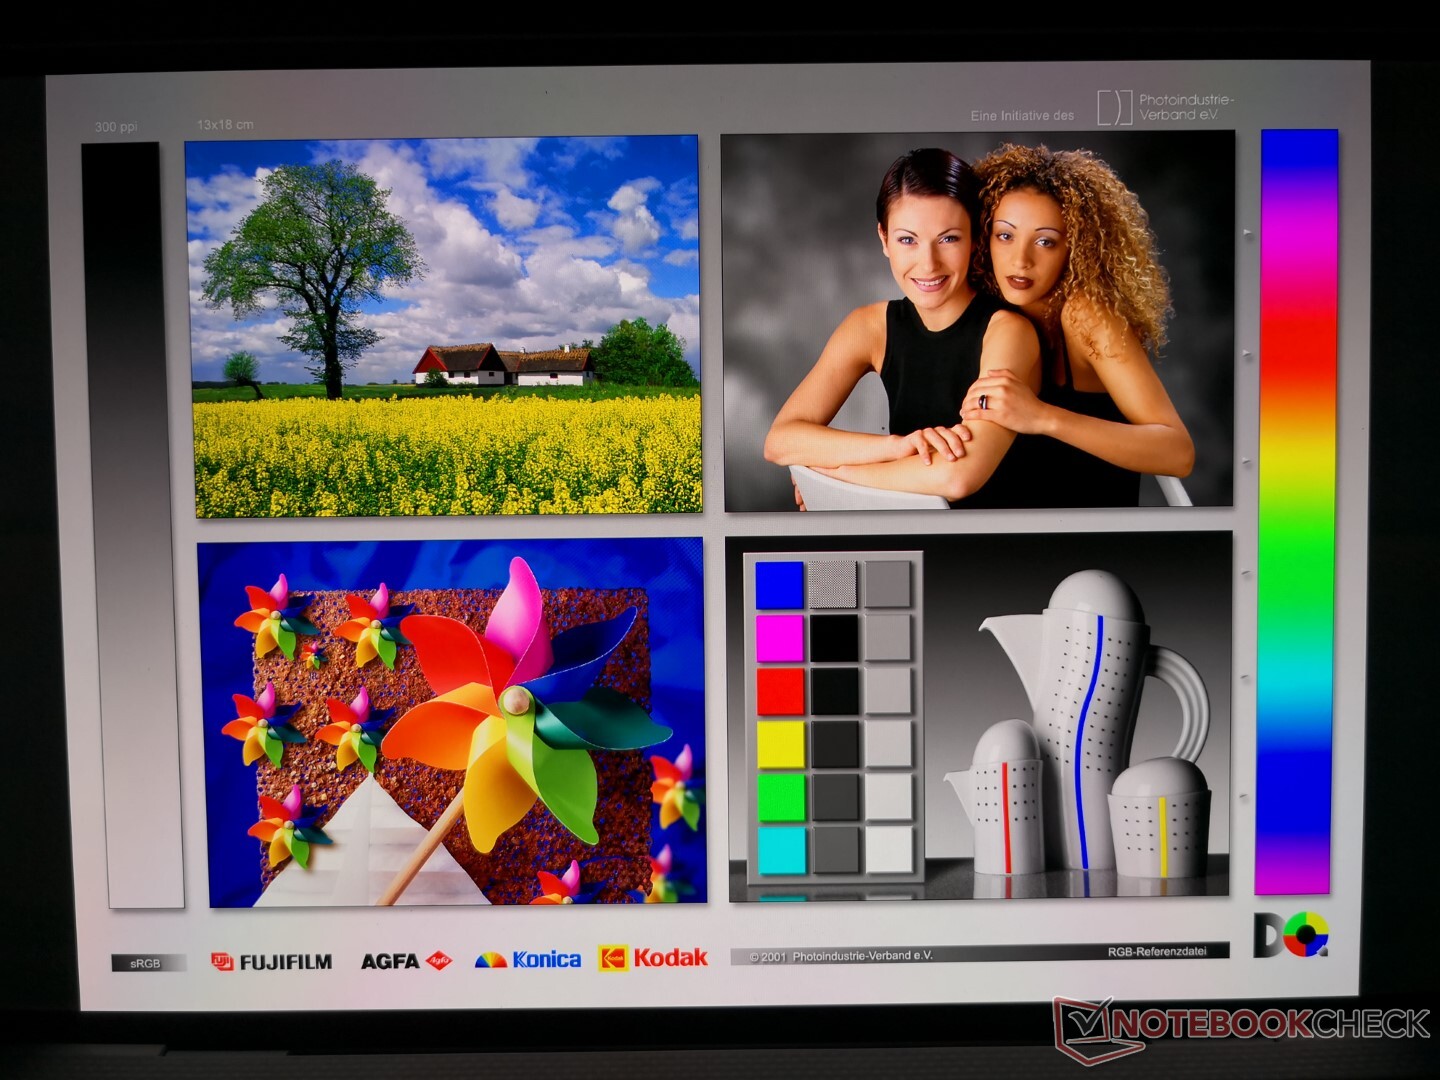
The three biggest advantages of our OLED SKU vs. the other XPS 13 IPS SKUs are the faster black-white response times, infinite contrast ratio, and higher DCI-P3 color coverage. Colors pop with almost no ghosting for an amazing picture quality especially during movie playback.
Though the display supports HDR, the default Windows 10 settings will automatically disable HDR when running on battery to extend battery life. This transition from HDR to non-HDR or vice versa involves a momentary screen flicker whenever the laptop is connected to disconnected to an outlet. Fortunately, users can easily toggle the default settings by entering "Windows HD Color" in the Start menu search bar, making sure "Use HDR" is set to "On", and then setting the Battery options to "Optimize for image quality" instead of "Optimize for battery life". You'll know the settings are working when the screen stocks flickering when changing between AC adapter power and battery power.
| |||||||||||||||||||||||||
Brightness Distribution: 97 %
Center on Battery: 384 cd/m²
Contrast: ∞:1 (Black: 0 cd/m²)
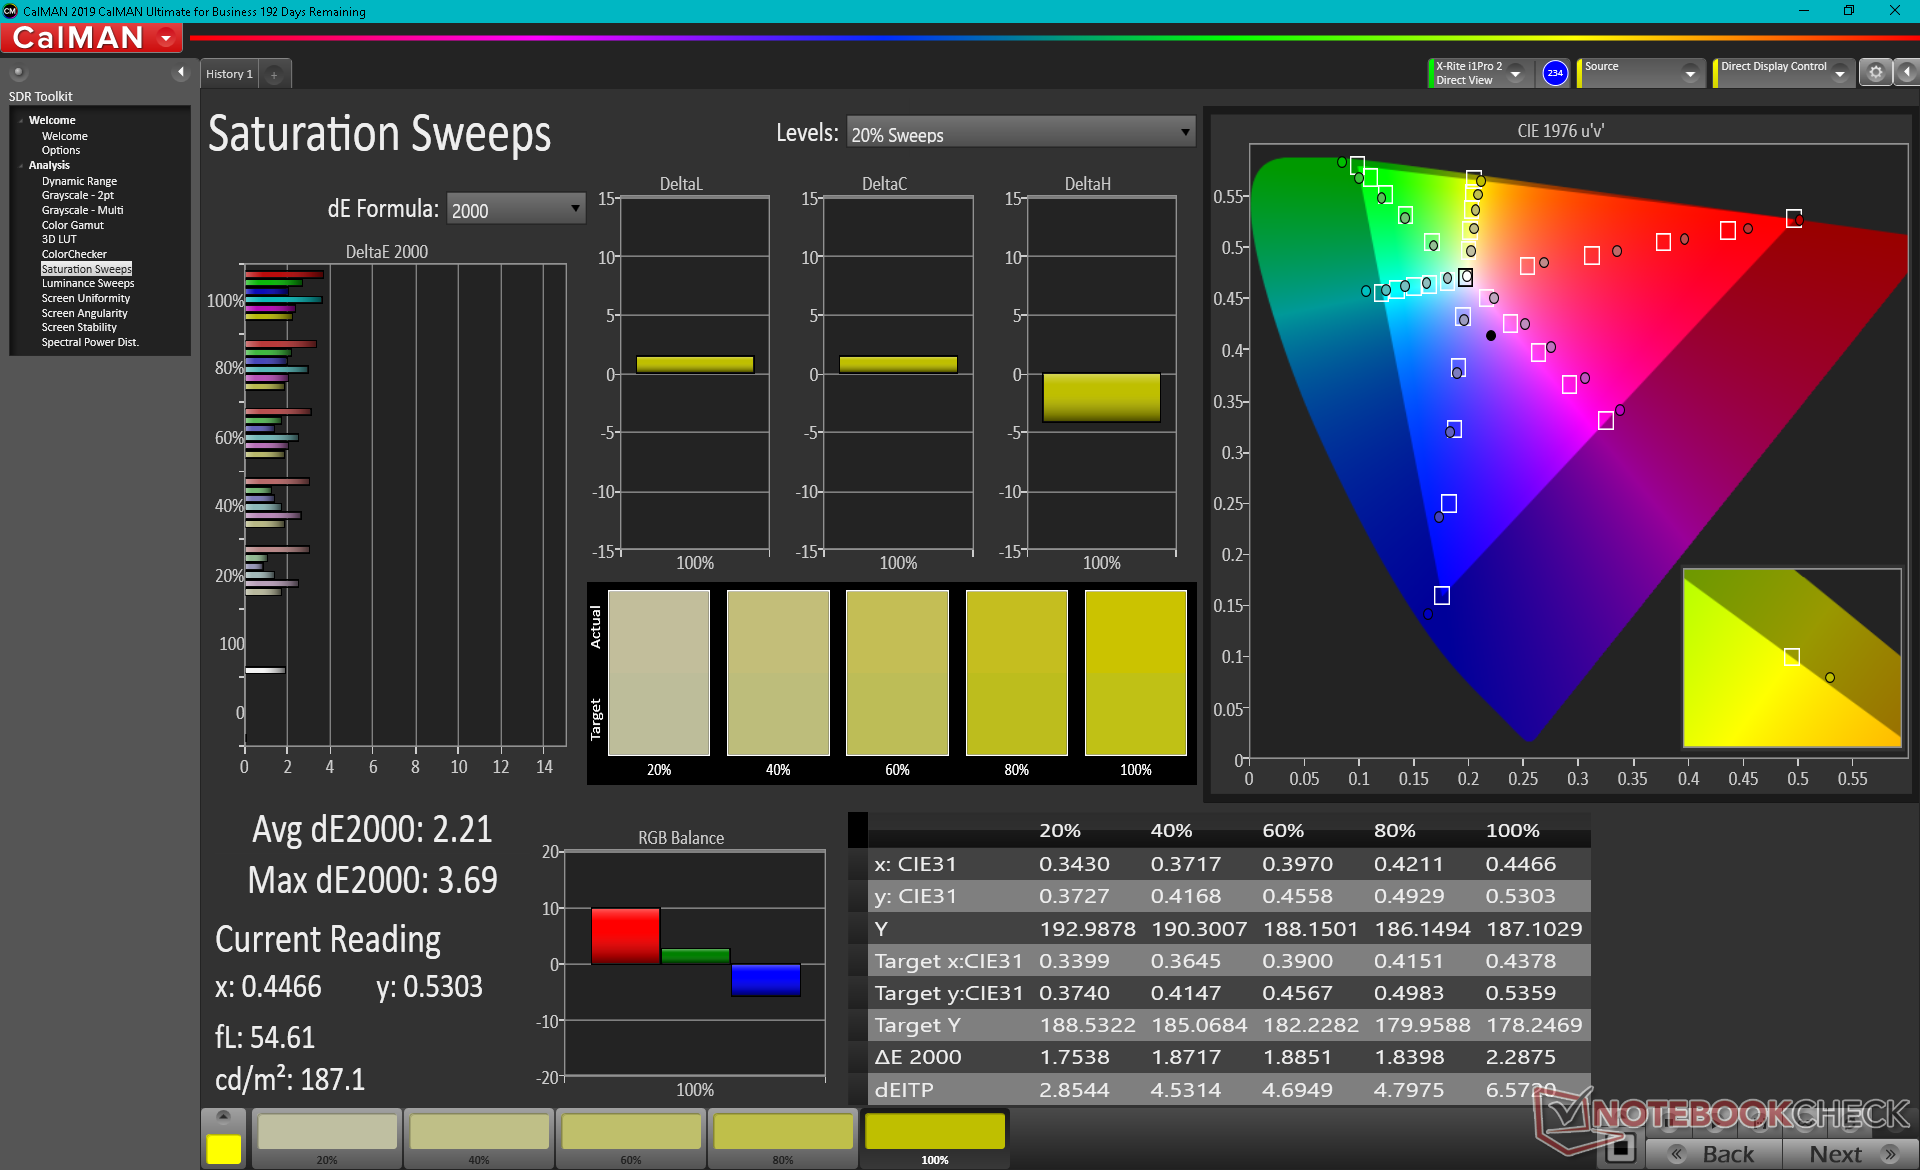
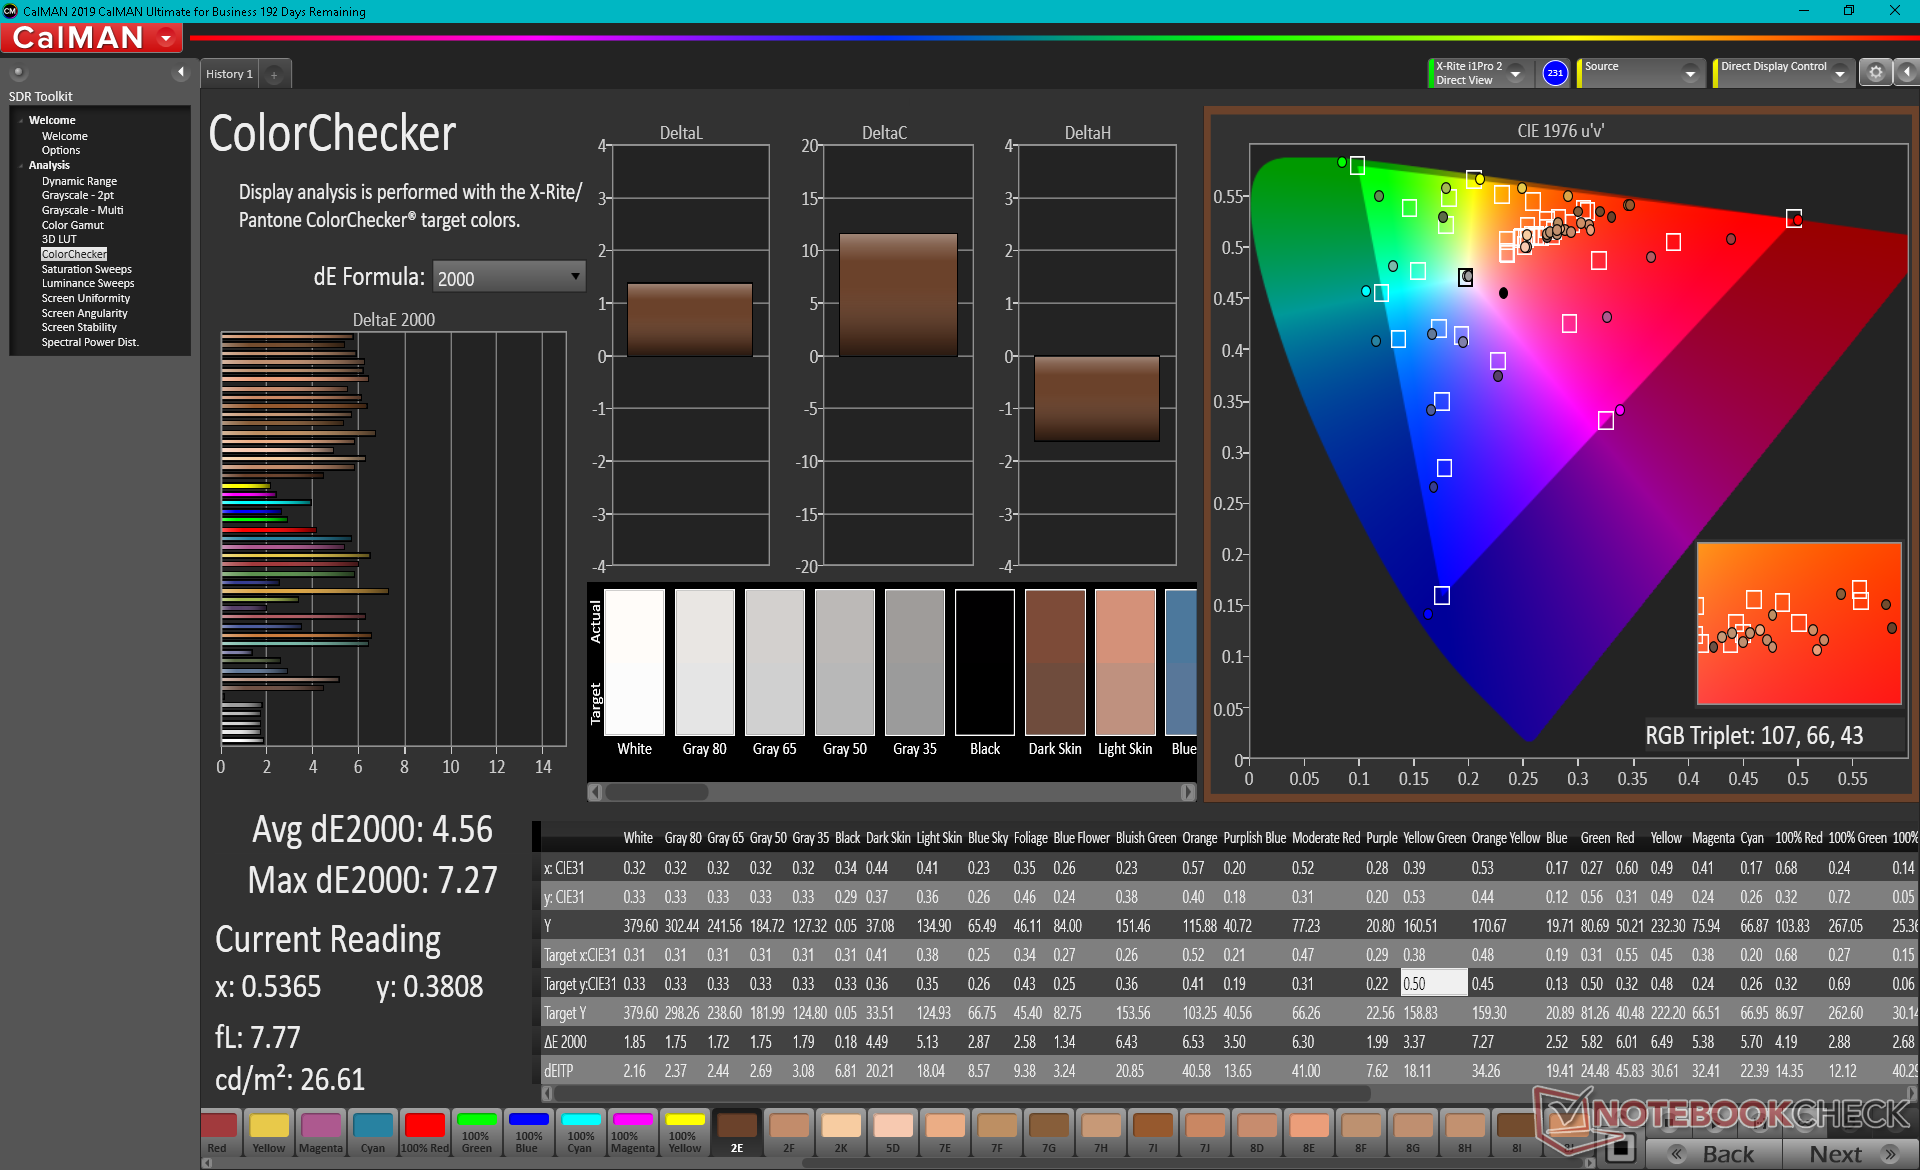
ΔE ColorChecker Calman: 4.56 | ∀{0.5-29.43 Ø4.73}
calibrated: 4.52
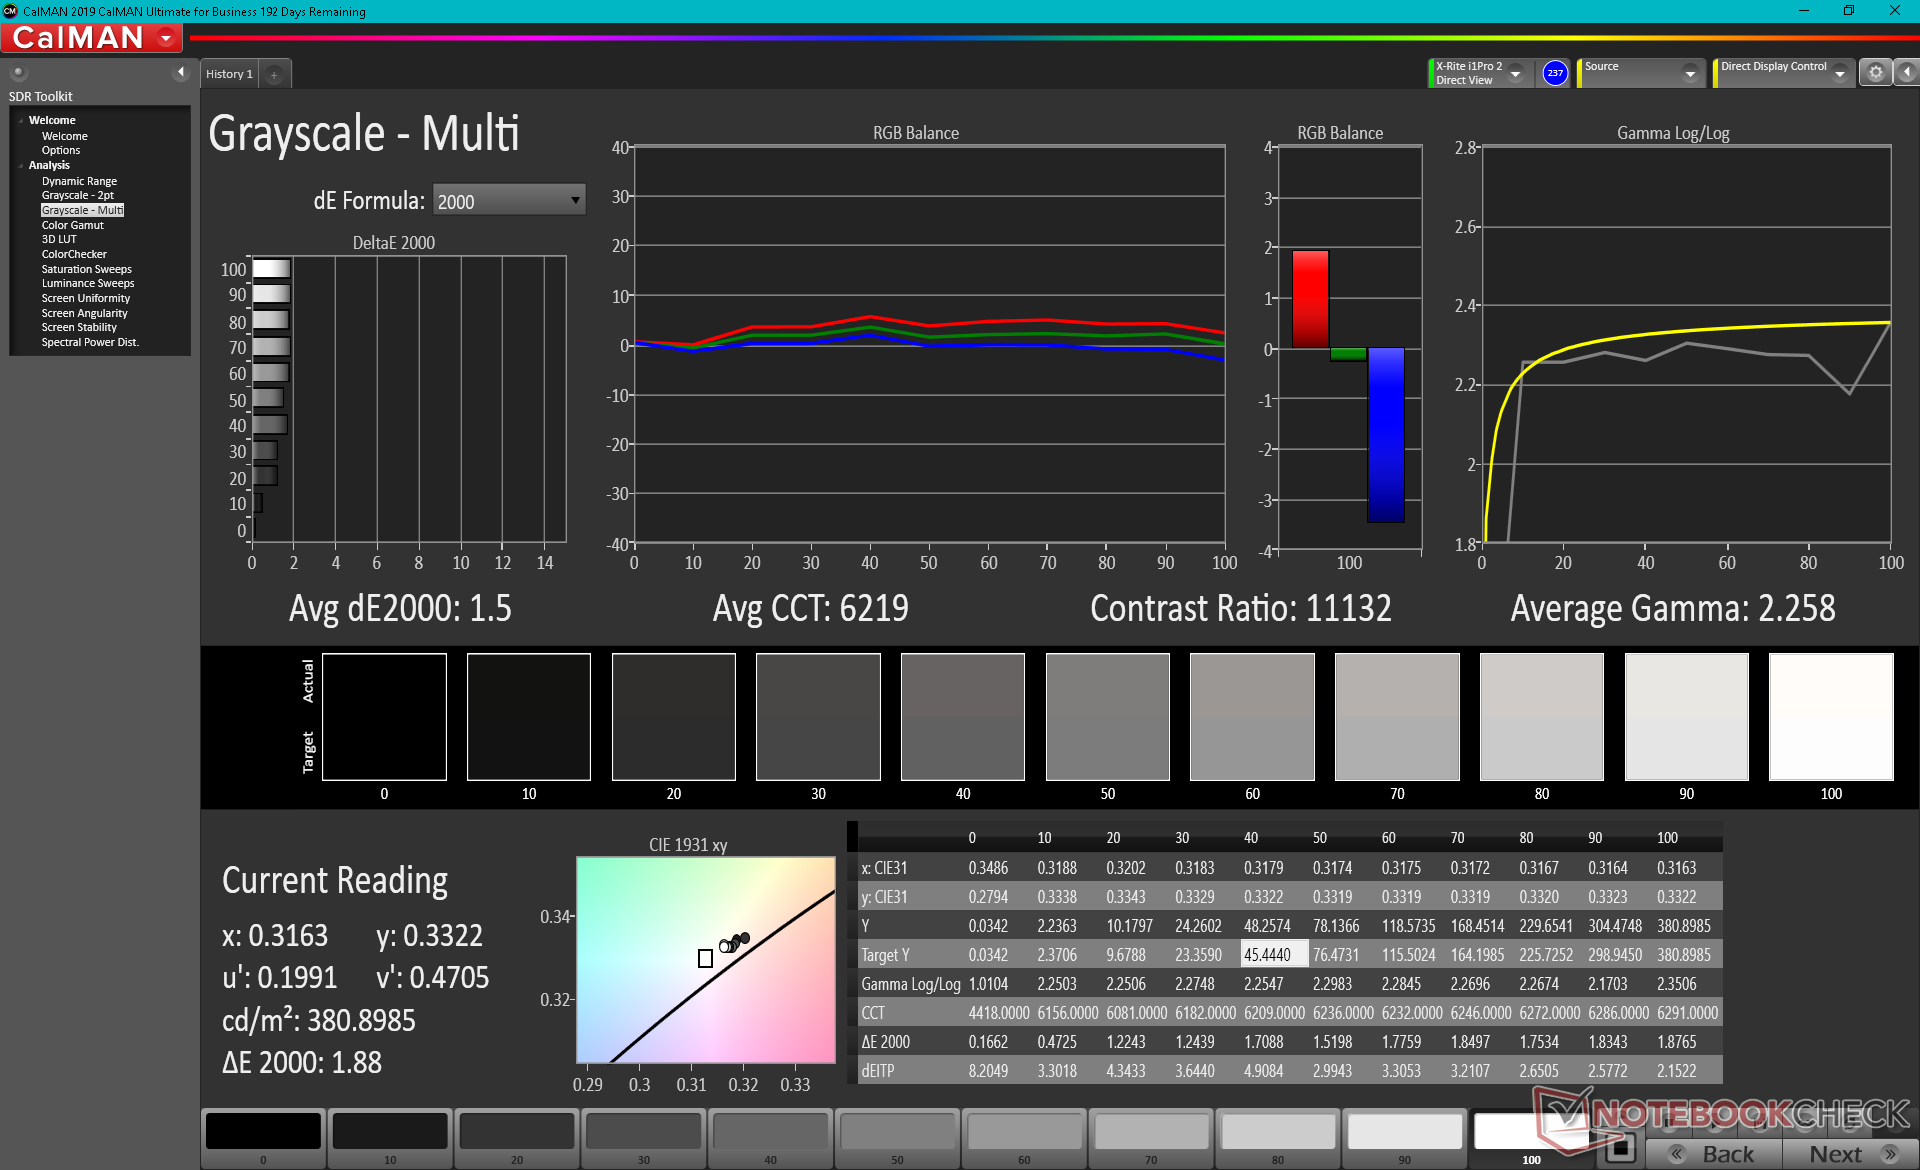
ΔE Greyscale Calman: 1.5 | ∀{0.09-98 Ø4.97}
100% sRGB (Argyll 1.6.3 3D)
87.1% AdobeRGB 1998 (Argyll 1.6.3 3D)
97.7% AdobeRGB 1998 (Argyll 3D)
100% sRGB (Argyll 3D)
99.7% Display P3 (Argyll 3D)
Gamma: 2.26
CCT: 6219 K
| Dell XPS 13 9310 OLED Samsung 134XK01, OLED, 13.4", 3456x2160 | Dell XPS 13 9310 Core i7 4K Sharp LQ134R1, IPS, 13.4", 3840x2400 | Dell XPS 13 9310 Core i7 FHD Sharp LQ134N1, IPS, 13.4", 1920x1200 | Dell XPS 13 7390 Core i7-10710U AU Optronics B133ZAN, Dell P/N: 90NTH, IPS, 13.3", 3840x2160 | MSI Summit E13 Flip Evo A11MT Sharp LQ134N1JW53, IPS, 13.4", 1920x1200 | |
|---|---|---|---|---|---|
| Display | -13% | -18% | -25% | -20% | |
| Display P3 Coverage (%) | 99.7 | 80.2 -20% | 70.9 -29% | 63.4 -36% | 69.8 -30% |
| sRGB Coverage (%) | 100 | 100 0% | 99.1 -1% | 93.7 -6% | 98.8 -1% |
| AdobeRGB 1998 Coverage (%) | 97.7 | 78.9 -19% | 72.9 -25% | 64.3 -34% | 70.6 -28% |
| Response Times | -2164% | -1837% | -1836% | -2355% | |
| Response Time Grey 50% / Grey 80% * (ms) | 2.2 ? | 59.2 ? -2591% | 52 ? -2264% | 51.6 ? -2245% | 64 ? -2809% |
| Response Time Black / White * (ms) | 2.2 ? | 40.4 ? -1736% | 33.2 ? -1409% | 33.6 ? -1427% | 44 ? -1900% |
| PWM Frequency (Hz) | 240.4 ? | 2137 ? | 2475 ? | ||
| Screen | 3% | -9% | -50% | 28% | |
| Brightness middle (cd/m²) | 384 | 508.7 32% | 543.3 41% | 408.2 6% | 551.3 44% |
| Brightness (cd/m²) | 387 | 479 24% | 524 35% | 399 3% | 517 34% |
| Brightness Distribution (%) | 97 | 84 -13% | 92 -5% | 89 -8% | 91 -6% |
| Black Level * (cd/m²) | 0.3 | 0.38 | 0.39 | 0.37 | |
| Colorchecker dE 2000 * | 4.56 | 2.72 40% | 3.02 34% | 4.6 -1% | 1.45 68% |
| Colorchecker dE 2000 max. * | 7.27 | 4.7 35% | 7.61 -5% | 11.84 -63% | 2.86 61% |
| Colorchecker dE 2000 calibrated * | 4.52 | 1.92 58% | 1.23 73% | 2.03 55% | 1.7 62% |
| Greyscale dE 2000 * | 1.5 | 3.4 -127% | 5 -233% | 7.5 -400% | 1.3 13% |
| Gamma | 2.26 97% | 2.11 104% | 2.02 109% | 2.12 104% | 2.14 103% |
| CCT | 6219 105% | 6245 104% | 6550 99% | 7966 82% | 6580 99% |
| Color Space (Percent of AdobeRGB 1998) (%) | 87.1 | 70.7 -19% | 66.8 -23% | 59.5 -32% | 65 -25% |
| Color Space (Percent of sRGB) (%) | 100 | 100 0% | 99.6 0% | 93.5 -6% | 99 -1% |
| Contrast (:1) | 1696 | 1430 | 1047 | 1490 | |
| Total Average (Program / Settings) | -725% /
-310% | -621% /
-272% | -637% /
-300% | -782% /
-323% |
* ... smaller is better
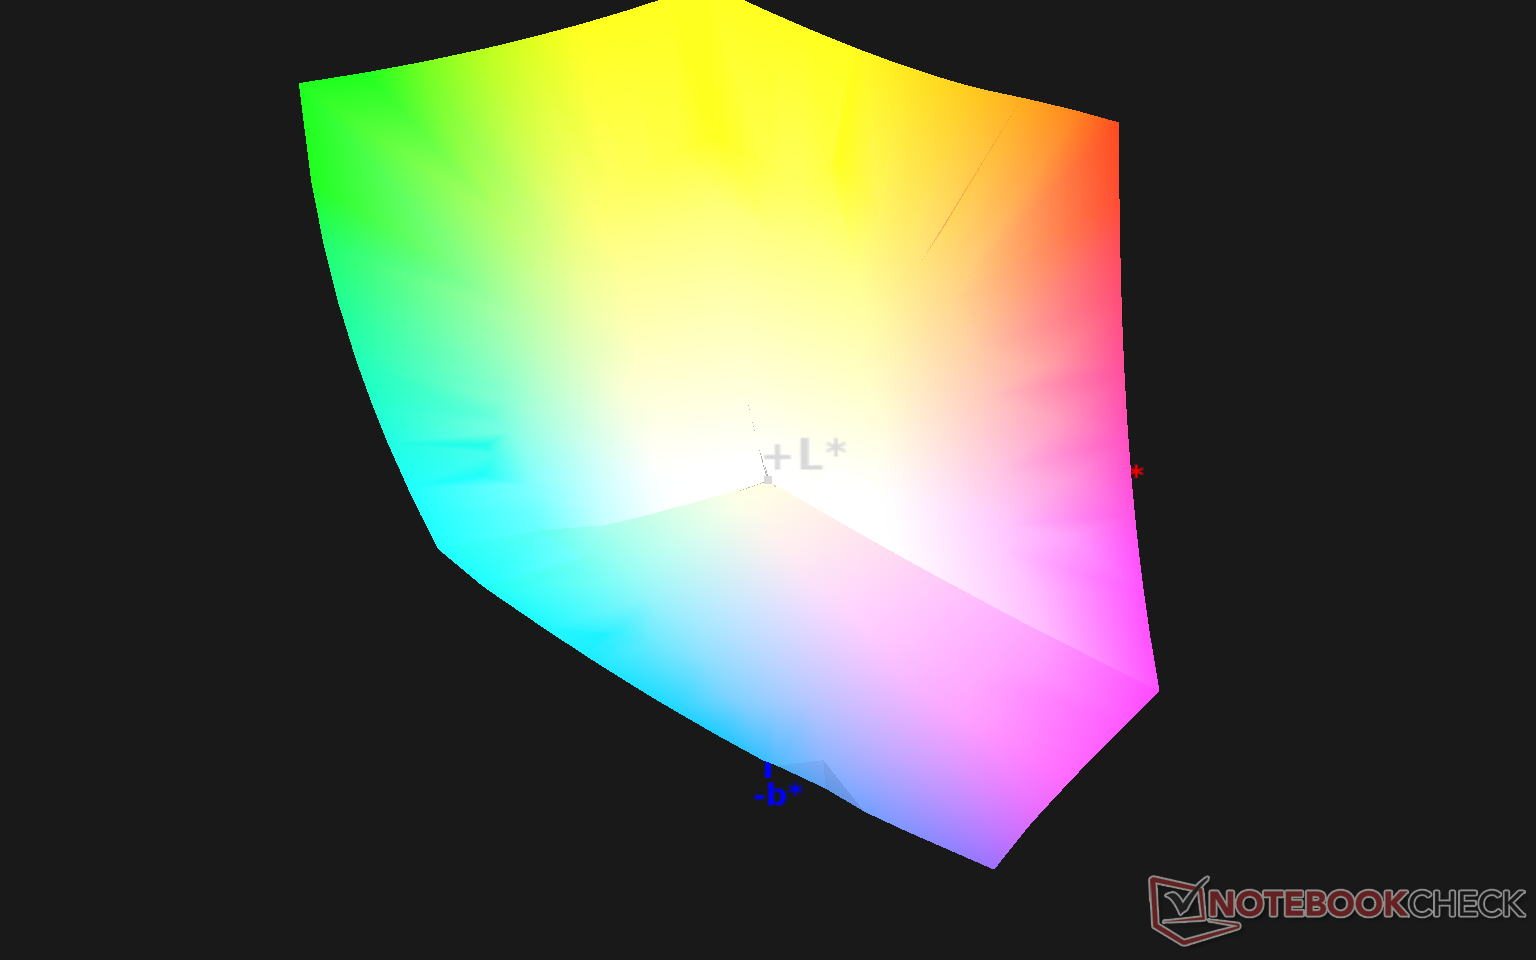
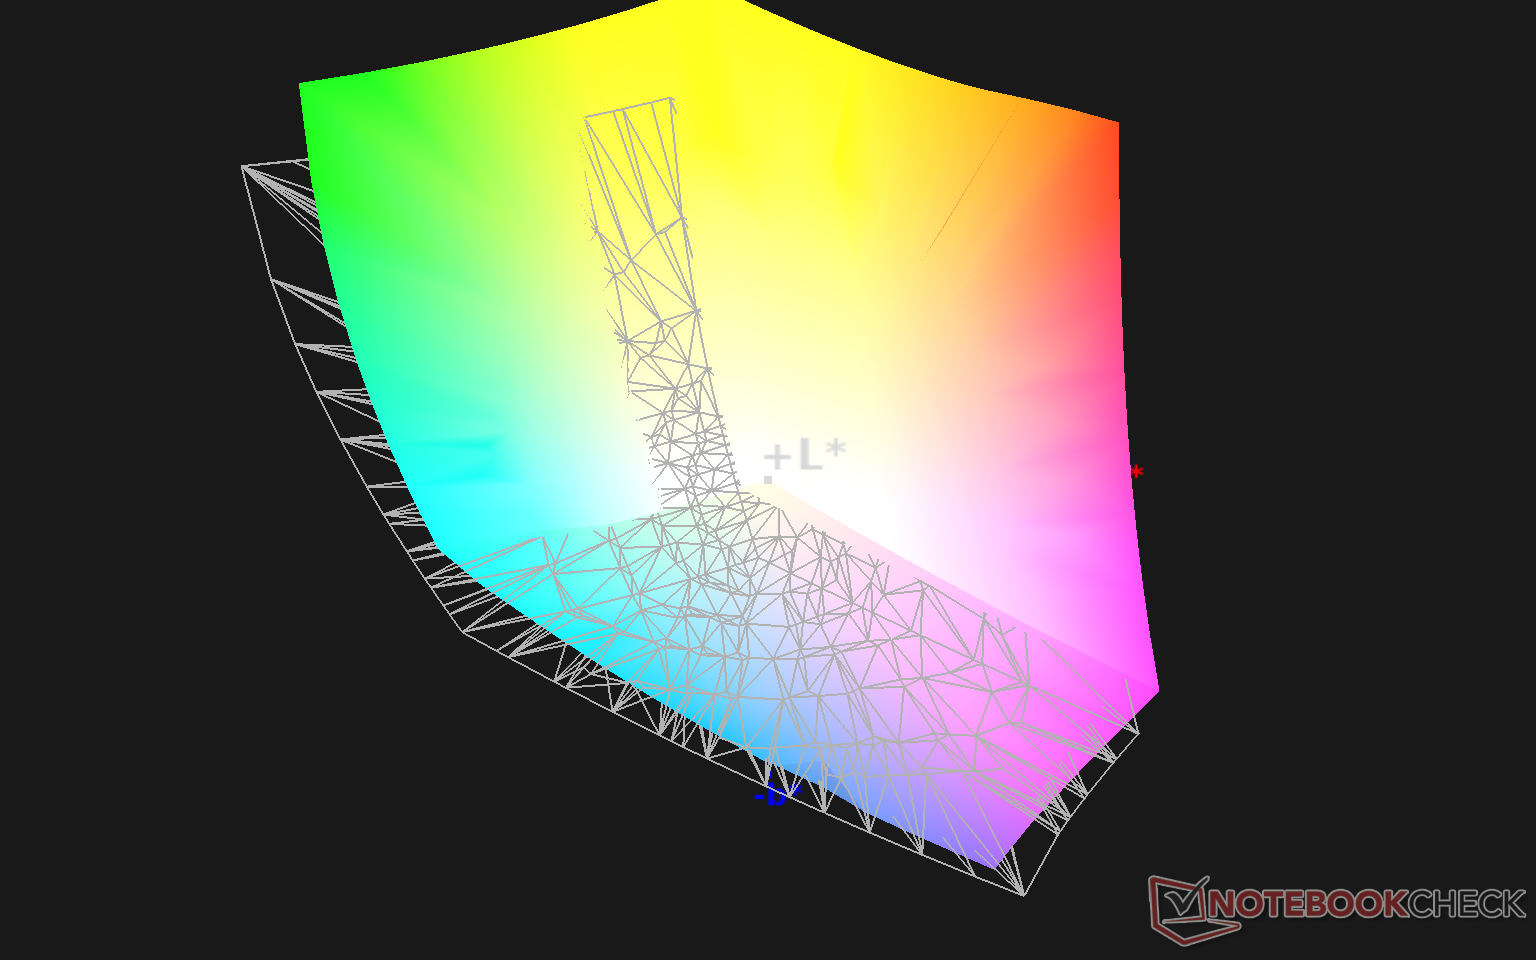
Color space covers all of sRGB (or approximately 158 percent) and 87 percent of AdobeRGB. Its volume extends further into the red, yellow, and green spaces than AdobeRGB which is exactly what we would expect from a DCI-P3-compliant panel.
Display Response Times
| ↔ Response Time Black to White | ||
|---|---|---|
| 2.2 ms ... rise ↗ and fall ↘ combined | ↗ 1 ms rise | 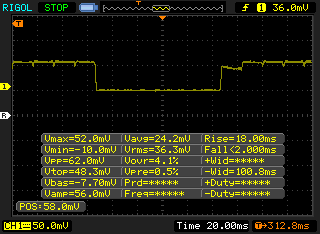 |
| ↘ 1.2 ms fall | ||
| The screen shows very fast response rates in our tests and should be very well suited for fast-paced gaming. In comparison, all tested devices range from 0.1 (minimum) to 240 (maximum) ms. » 12 % of all devices are better. This means that the measured response time is better than the average of all tested devices (19.9 ms). | ||
| ↔ Response Time 50% Grey to 80% Grey | ||
| 2.2 ms ... rise ↗ and fall ↘ combined | ↗ 1.2 ms rise | 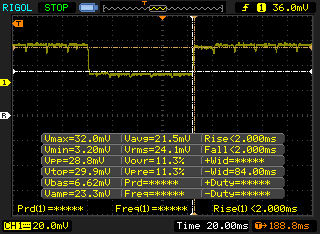 |
| ↘ 1 ms fall | ||
| The screen shows very fast response rates in our tests and should be very well suited for fast-paced gaming. In comparison, all tested devices range from 0.165 (minimum) to 636 (maximum) ms. » 11 % of all devices are better. This means that the measured response time is better than the average of all tested devices (31.1 ms). | ||
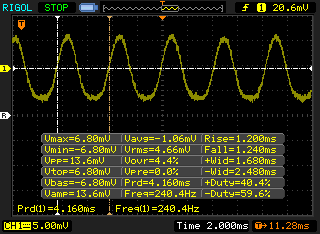
Screen Flickering / PWM (Pulse-Width Modulation)
| Screen flickering / PWM detected | 240.4 Hz | ≤ 51 % brightness setting |  |
The display backlight flickers at 240.4 Hz (worst case, e.g., utilizing PWM) Flickering detected at a brightness setting of 51 % and below. There should be no flickering or PWM above this brightness setting. The frequency of 240.4 Hz is relatively low, so sensitive users will likely notice flickering and experience eyestrain at the stated brightness setting and below. In comparison: 52 % of all tested devices do not use PWM to dim the display. If PWM was detected, an average of 7794 (minimum: 5 - maximum: 343500) Hz was measured. | |||
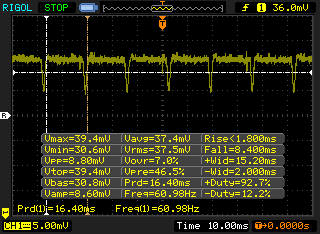
Whereas IPS panels would typically exhibit just one pulse-width modulation frequency, this OLED panel exhibits two discrete pulse-width modulation frequencies depending on the brightness level setting. We're able to record a frequency of 240.4 Hz and 61 Hz from 0 percent to 51 percent brightness and 52 percent to maximum brightness, respectively. In comparison, the XPS 13 4K IPS panel would exhibit a higher PWM of 2137 MHz only from 0 percent to 31 percent brightness. The XPS 13 IPS SKUs may therefore be the better option if your eyes are sensitive to screen flickering.
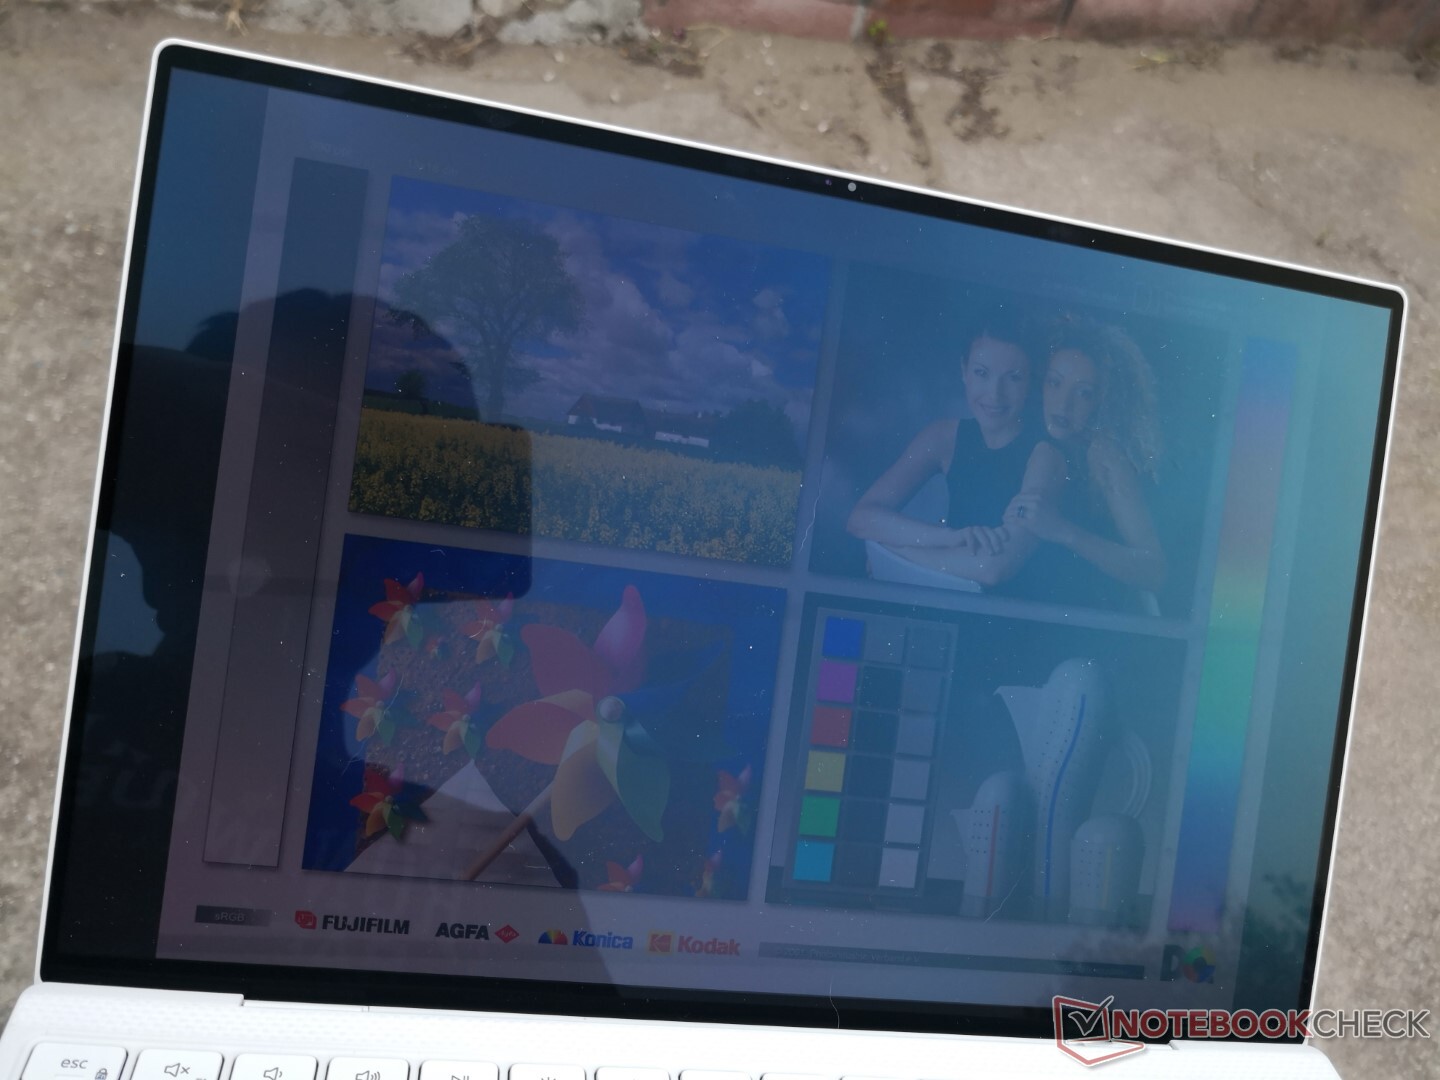
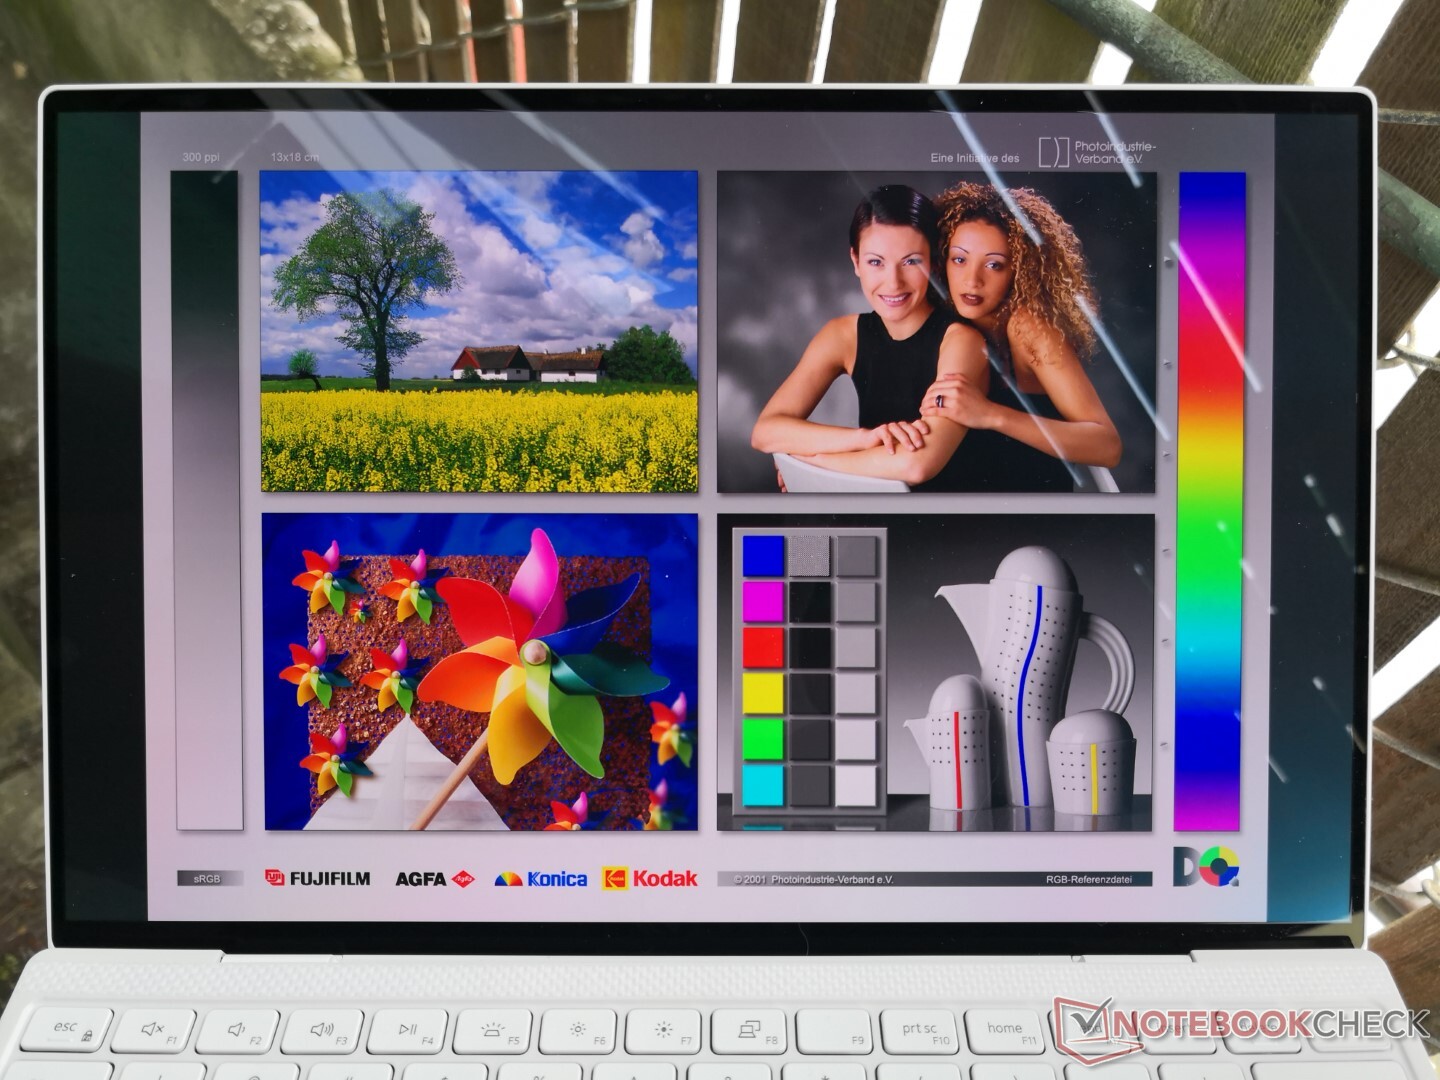
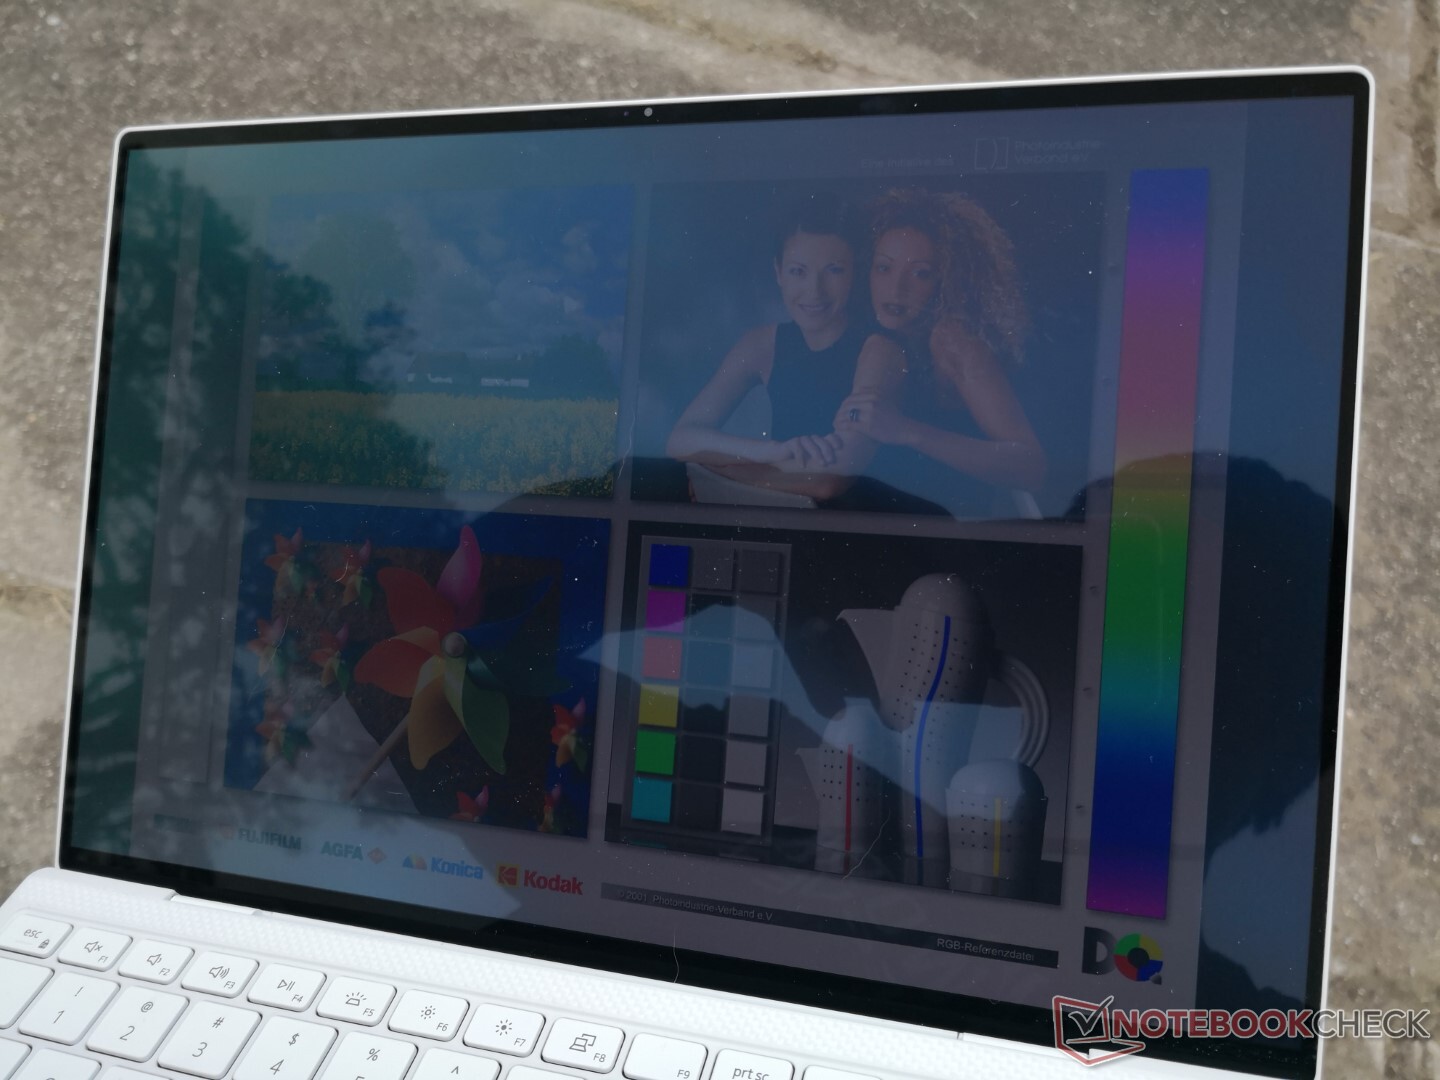
Outdoor visibility is a mixed bag. While OLED offers deeper contrast for easier readability, it's not as bright as the typical XPS 13 IPS display (384 nits vs. >500 nits). Thus, glare remains as much of an issue under most conditions. It's also worth noting that the display has a blue-green hue when reflections are heavy which is another unique characteristic not observed on IPS.
Performance
Processor
As noted in our earlier XPS 13 reviews, CPU clock rates cycle heavily when running benchmarks or games due to Dell's Dynamic Power policy. This can be observed when running CineBench R15 xT in a loop or when playing games as scores and frame rates tend to cycle to reflect the unsteady clock rates. For example, CineBench R15 xT scores would be anywhere between 609 and 765 points while Witcher 3 frame rates would be anywhere between 66 and 95 simply by idling on the world map.
Cinebench R23: Multi Core | Single Core
Cinebench R15: CPU Multi 64Bit | CPU Single 64Bit
Blender: v2.79 BMW27 CPU
7-Zip 18.03: 7z b 4 -mmt1 | 7z b 4
Geekbench 5.5: Single-Core | Multi-Core
HWBOT x265 Benchmark v2.2: 4k Preset
LibreOffice : 20 Documents To PDF
R Benchmark 2.5: Overall mean
| Cinebench R23 / Multi Core | |
| Asus ZenBook 13 UM325S | |
| Lenovo Yoga Slim 7 14ARE05 82A20008GE | |
| Asus ZenBook 13 OLED UM325UA | |
| Dell XPS 13 9305 Core i5 FHD | |
| Average Intel Core i7-1185G7 (3610 - 6383, n=24) | |
| Dell XPS 13 9310 OLED | |
| HP Envy 13-ba1475ng | |
| Asus VivoBook S13 S333JA-DS51 | |
| Cinebench R23 / Single Core | |
| Dell XPS 13 9310 OLED | |
| Average Intel Core i7-1185G7 (1251 - 1532, n=24) | |
| Asus ZenBook 13 UM325S | |
| HP Envy 13-ba1475ng | |
| Dell XPS 13 9305 Core i5 FHD | |
| Asus ZenBook 13 OLED UM325UA | |
| Lenovo Yoga Slim 7 14ARE05 82A20008GE | |
| Asus VivoBook S13 S333JA-DS51 | |
| HWBOT x265 Benchmark v2.2 / 4k Preset | |
| Asus ZenBook 13 UM325S | |
| Lenovo Yoga Slim 7 14ARE05 82A20008GE | |
| Asus ZenBook 13 OLED UM325UA | |
| Average Intel Core i7-1185G7 (5.02 - 8.13, n=27) | |
| Dell XPS 13 9310 OLED | |
| Dell XPS 13 7390 Core i7-10710U | |
| HP Envy 13-ba1475ng | |
| Asus VivoBook S13 S333JA-DS51 | |
| HP Envy 13-ba0001ng | |
| Asus ZenBook 13 UX325JA | |
| LibreOffice / 20 Documents To PDF | |
| Lenovo Yoga Slim 7 14ARE05 82A20008GE | |
| Asus VivoBook S13 S333JA-DS51 | |
| Asus ZenBook 13 OLED UM325UA | |
| Dell XPS 13 9305 Core i5 FHD | |
| HP Envy 13-ba0001ng | |
| HP Envy 13-ba1475ng | |
| Asus ZenBook 13 UM325S | |
| Asus ZenBook 13 UX325JA | |
| Average Intel Core i7-1185G7 (41.3 - 61.7, n=26) | |
| Dell XPS 13 9310 OLED | |
| R Benchmark 2.5 / Overall mean | |
| Asus VivoBook S13 S333JA-DS51 | |
| Asus ZenBook 13 UX325JA | |
| HP Envy 13-ba0001ng | |
| Dell XPS 13 9305 Core i5 FHD | |
| Lenovo Yoga Slim 7 14ARE05 82A20008GE | |
| HP Envy 13-ba1475ng | |
| Asus ZenBook 13 OLED UM325UA | |
| Dell XPS 13 9310 OLED | |
| Average Intel Core i7-1185G7 (0.55 - 0.615, n=27) | |
| Asus ZenBook 13 UM325S | |
Cinebench R23: Multi Core | Single Core
Cinebench R15: CPU Multi 64Bit | CPU Single 64Bit
Blender: v2.79 BMW27 CPU
7-Zip 18.03: 7z b 4 -mmt1 | 7z b 4
Geekbench 5.5: Single-Core | Multi-Core
HWBOT x265 Benchmark v2.2: 4k Preset
LibreOffice : 20 Documents To PDF
R Benchmark 2.5: Overall mean
* ... smaller is better
System Performance
| PCMark 10 Score | 5226 points | |
Help | ||
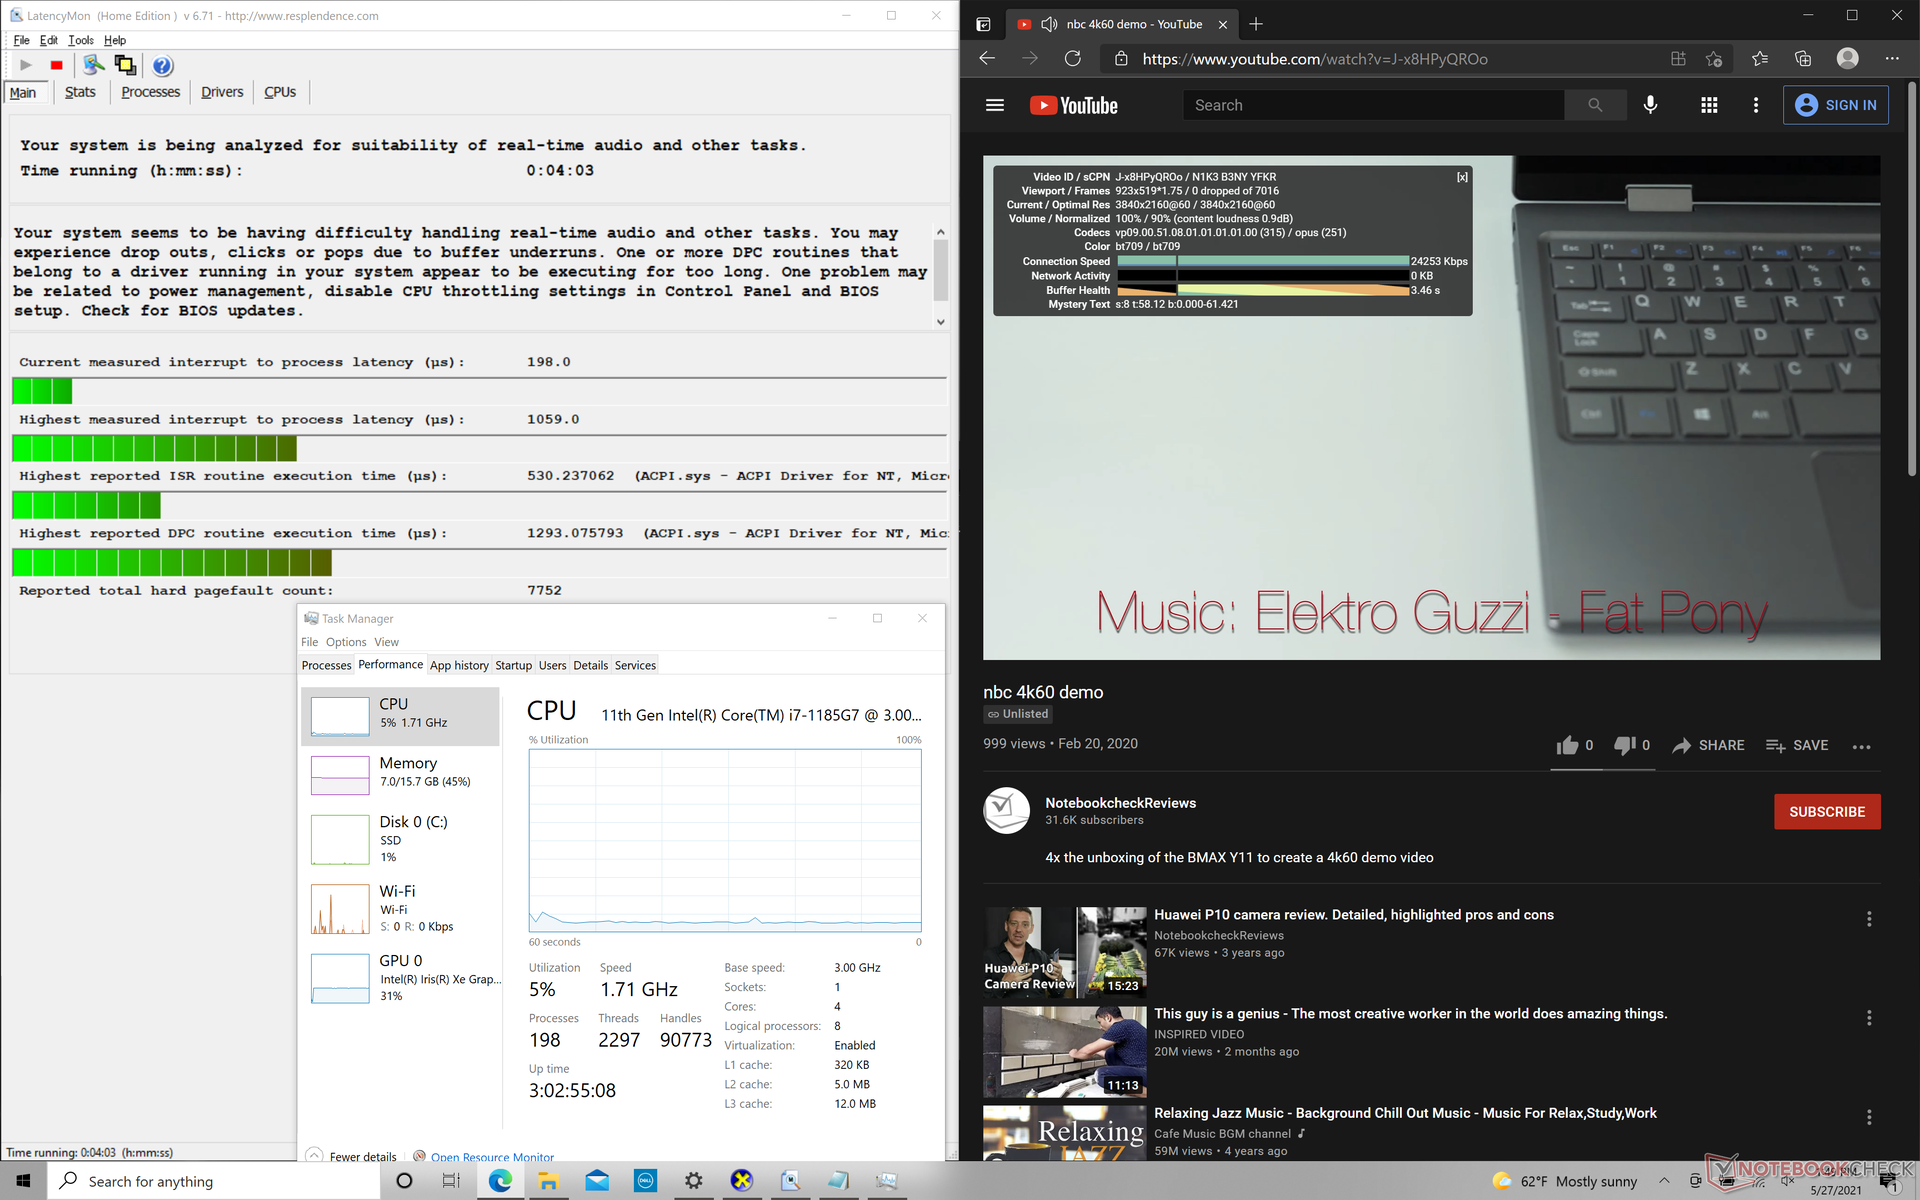
DPC Latency
The series continues to exhibit slight DPC latency issues. 4K video playback at 60 FPS thankfully remains smooth with no dropped frames.
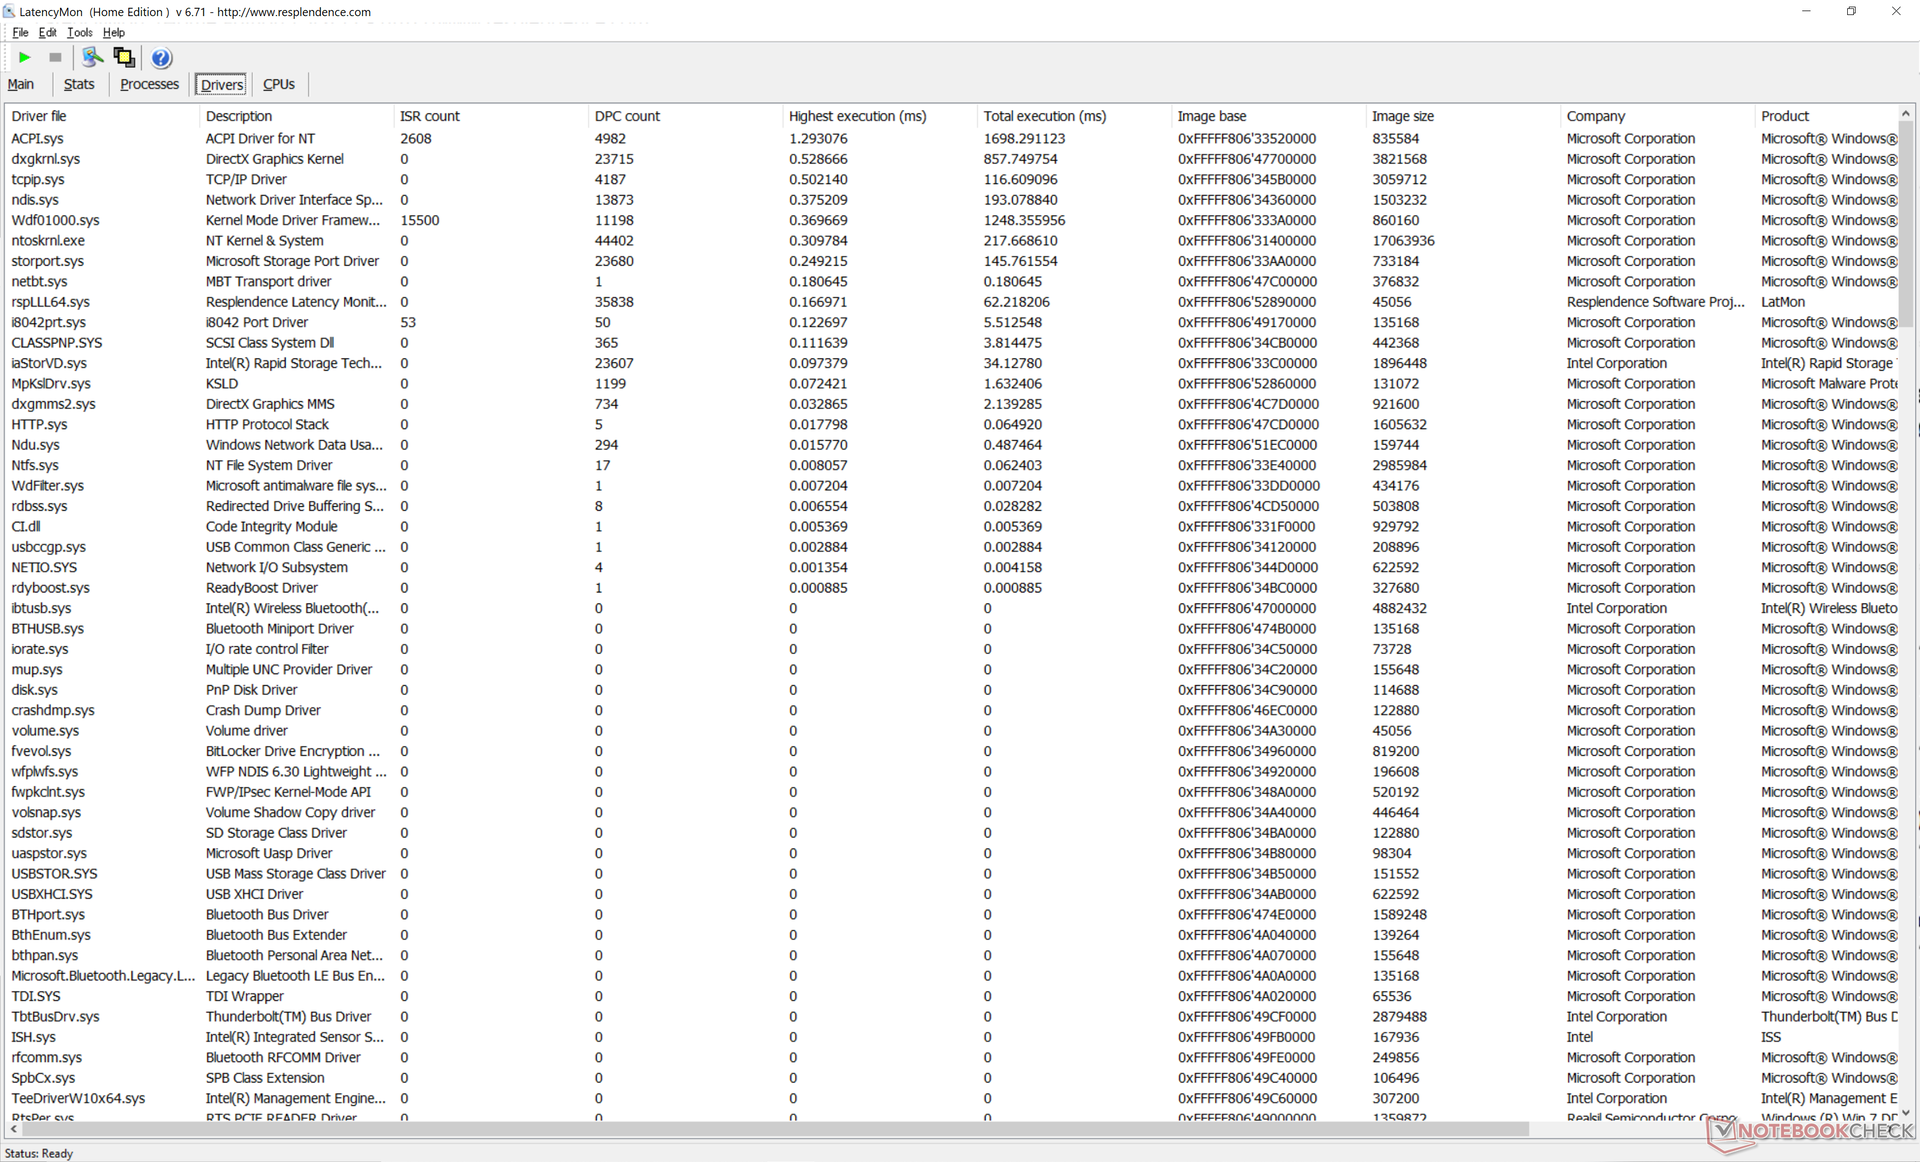
| DPC Latencies / LatencyMon - interrupt to process latency (max), Web, Youtube, Prime95 | |
| MSI Summit E13 Flip Evo A11MT | |
| Dell XPS 13 9310 Core i7 4K | |
| Dell XPS 13 9310 OLED | |
| Dell XPS 13 9310 Core i7 FHD | |
* ... smaller is better
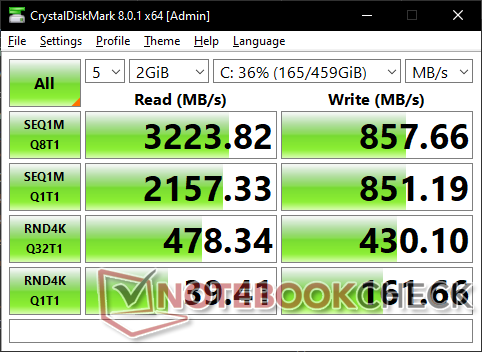
Storage Devices
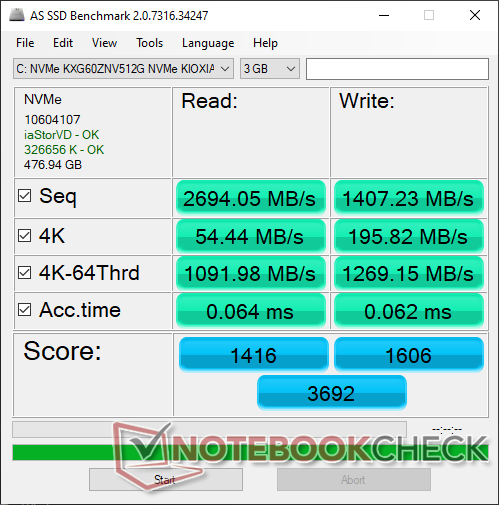
| Dell XPS 13 9310 OLED Toshiba XG6 KXG60ZNV512G | Dell XPS 13 9310 Core i7 FHD Micron 2300 512GB MTFDHBA512TDV | Dell XPS 13 7390 Core i7-10710U SK Hynix PC601 NVMe 512 GB | MSI Summit E13 Flip Evo A11MT Phison 1TB SM2801T24GKBB4S-E162 | |
|---|---|---|---|---|
| AS SSD | -43% | -25% | 23% | |
| Seq Read (MB/s) | 2694 | 2091 -22% | 1804 -33% | 3789 41% |
| Seq Write (MB/s) | 1407 | 1396 -1% | 1000 -29% | 2257 60% |
| 4K Read (MB/s) | 54.4 | 49.29 -9% | 45.1 -17% | 54.2 0% |
| 4K Write (MB/s) | 195.8 | 104.2 -47% | 115 -41% | 78.7 -60% |
| 4K-64 Read (MB/s) | 1092 | 827 -24% | 893 -18% | 1330 22% |
| 4K-64 Write (MB/s) | 1269 | 1636 29% | 732 -42% | 2038 61% |
| Access Time Read * (ms) | 0.064 | 0.066 -3% | 0.044 31% | 0.042 34% |
| Access Time Write * (ms) | 0.062 | 0.365 -489% | 0.095 -53% | 0.04 35% |
| Score Read (Points) | 1416 | 1086 -23% | 1119 -21% | 1763 25% |
| Score Write (Points) | 1606 | 1880 17% | 947 -41% | 2343 46% |
| Score Total (Points) | 3692 | 3499 -5% | 2608 -29% | 4938 34% |
| Copy ISO MB/s (MB/s) | 1782 | 1544 -13% | 1515 -15% | 2270 27% |
| Copy Program MB/s (MB/s) | 1023 | 613 -40% | 535 -48% | 670 -35% |
| Copy Game MB/s (MB/s) | 1148 | 1451 26% | 1211 5% | 1525 33% |
| CrystalDiskMark 5.2 / 6 | 41% | 30% | 95% | |
| Write 4K (MB/s) | 156.8 | 97.5 -38% | 134 -15% | 311.1 98% |
| Read 4K (MB/s) | 39.66 | 50.9 28% | 42.91 8% | 56.6 43% |
| Write Seq (MB/s) | 854 | 1811 112% | 1841 116% | 2397 181% |
| Read Seq (MB/s) | 2167 | 1836 -15% | 1707 -21% | 2277 5% |
| Write 4K Q32T1 (MB/s) | 441.1 | 521 18% | 394.7 -11% | 803 82% |
| Read 4K Q32T1 (MB/s) | 395.5 | 357.5 -10% | 398.5 1% | 849 115% |
| Write Seq Q32T1 (MB/s) | 858 | 2879 236% | 2250 162% | 2410 181% |
| Read Seq Q32T1 (MB/s) | 3258 | 3204 -2% | 3265 0% | 4954 52% |
| Total Average (Program / Settings) | -1% /
-13% | 3% /
-5% | 59% /
49% |
* ... smaller is better

Disk Throttling: DiskSpd Read Loop, Queue Depth 8
GPU Performance
| 3DMark 11 Performance | 6398 points | |
| 3DMark Cloud Gate Standard Score | 15019 points | |
| 3DMark Fire Strike Score | 4449 points | |
| 3DMark Time Spy Score | 1526 points | |
Help | ||
| low | med. | high | ultra | QHD | 4K | |
|---|---|---|---|---|---|---|
| The Witcher 3 (2015) | 98.6 | 61.1 | 32 | 13.9 | ||
| Dota 2 Reborn (2015) | 76.1 | 74.7 | 41.6 | 43.4 | 21.5 | |
| Final Fantasy XV Benchmark (2018) | 35 | 19.9 | 15.1 | 15.1 | 15.1 | |
| X-Plane 11.11 (2018) | 25.1 | 35.2 | 29.4 | 17.1 | ||
| Strange Brigade (2018) | 88.4 | 33.2 | 29.7 | 22.3 | 16.9 |
Emissions
System Noise
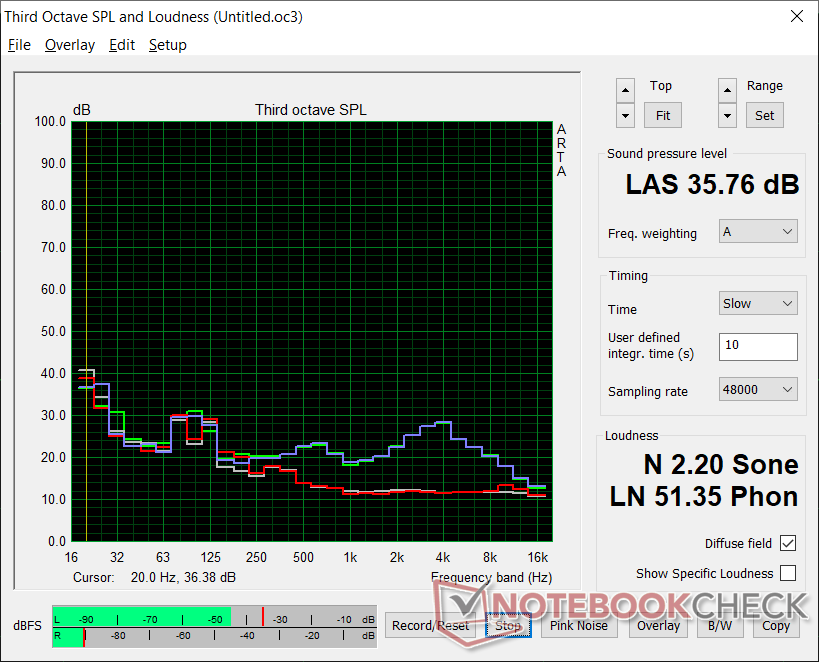
| Dell XPS 13 9310 OLED Iris Xe G7 96EUs, i7-1185G7, Toshiba XG6 KXG60ZNV512G | Dell XPS 13 9310 Core i7 4K Iris Xe G7 96EUs, i7-1185G7, Micron 2300 512GB MTFDHBA512TDV | Dell XPS 13 9310 Core i7 FHD Iris Xe G7 96EUs, i7-1165G7, Micron 2300 512GB MTFDHBA512TDV | Dell XPS 13 7390 Core i7-10710U UHD Graphics 620, i7-10710U, SK Hynix PC601 NVMe 512 GB | MSI Summit E13 Flip Evo A11MT Iris Xe G7 96EUs, i7-1185G7, Phison 1TB SM2801T24GKBB4S-E162 | |
|---|---|---|---|---|---|
| Noise | -7% | -3% | -19% | -15% | |
| off / environment * (dB) | 24.8 | 27.7 -12% | 25.7 -4% | 28 -13% | 24.5 1% |
| Idle Minimum * (dB) | 25 | 27.8 -11% | 25.7 -3% | 28 -12% | 24.7 1% |
| Idle Average * (dB) | 25 | 27.8 -11% | 25.7 -3% | 28 -12% | 24.7 1% |
| Idle Maximum * (dB) | 25 | 27.8 -11% | 25.9 -4% | 28 -12% | 26.4 -6% |
| Load Average * (dB) | 25.3 | 27.9 -10% | 26.2 -4% | 33.7 -33% | 37.8 -49% |
| Witcher 3 ultra * (dB) | 35.8 | 32.8 8% | 36.5 -2% | 41.4 -16% | |
| Load Maximum * (dB) | 35.8 | 37 -3% | 36.6 -2% | 46.5 -30% | 48.8 -36% |
* ... smaller is better
Noise level
| Idle |
| 25 / 25 / 25 dB(A) |
| Load |
| 25.3 / 35.8 dB(A) |
 | ||
30 dB silent 40 dB(A) audible 50 dB(A) loud |
||
min: | ||
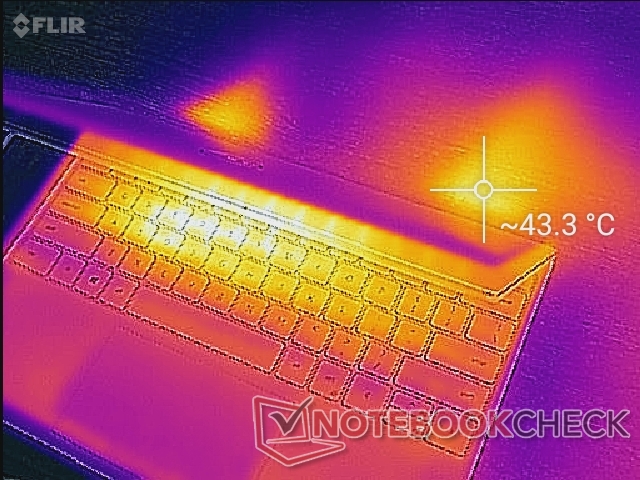
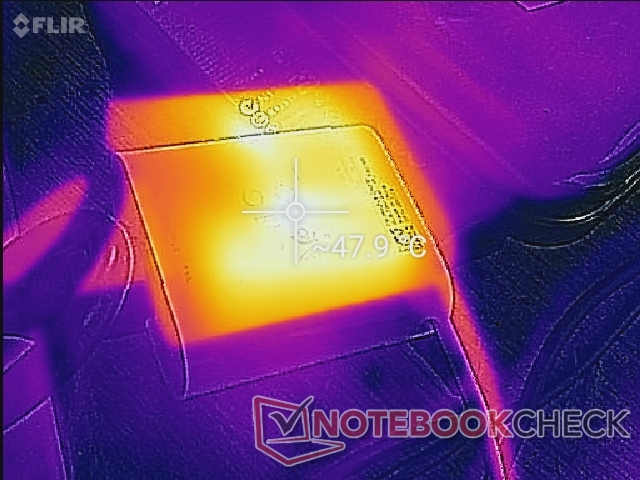
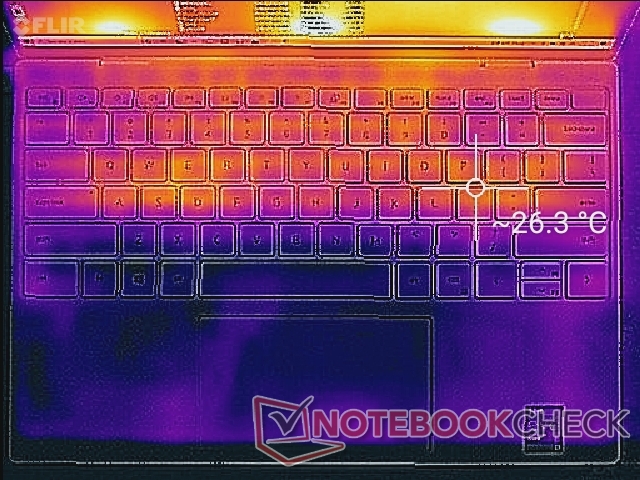
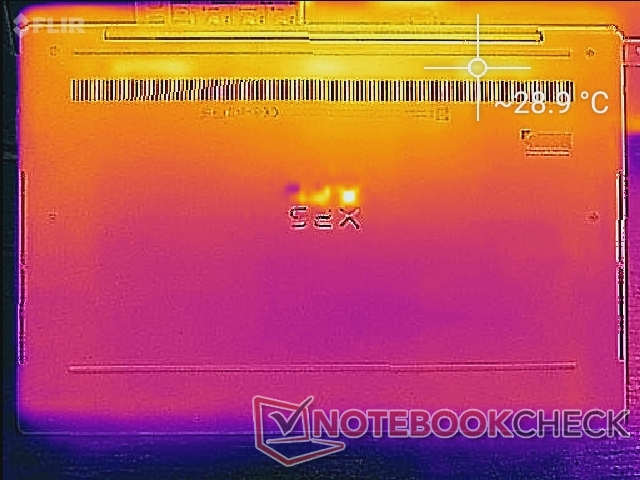
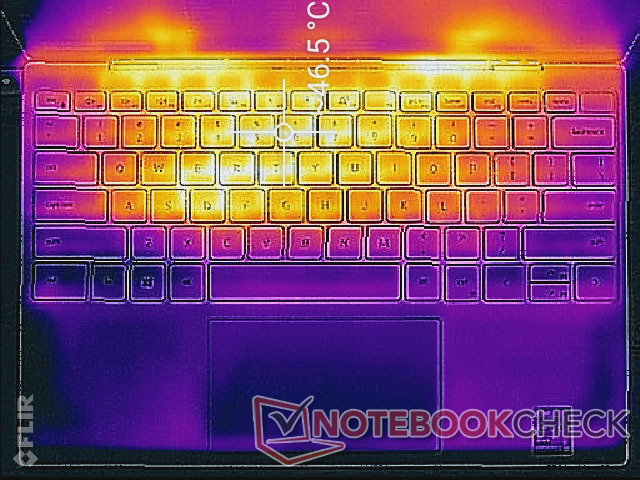
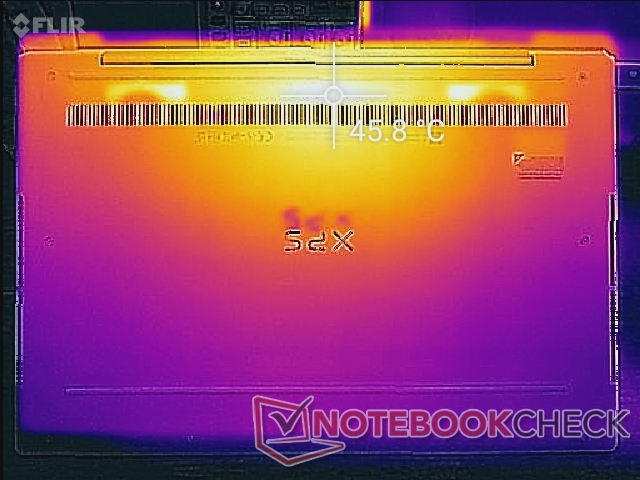
Temperature
Speakers

Energy Management
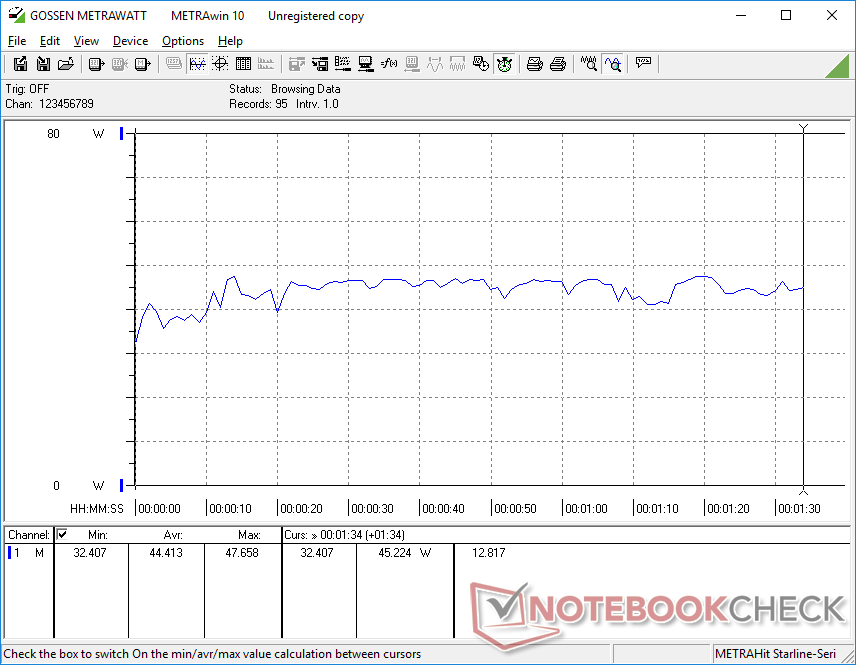
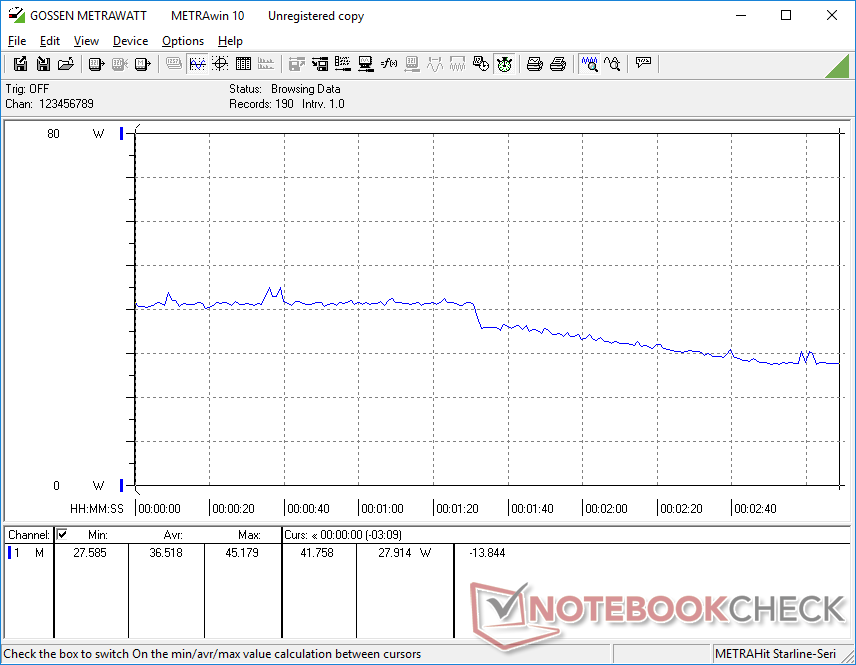
Power Consumption
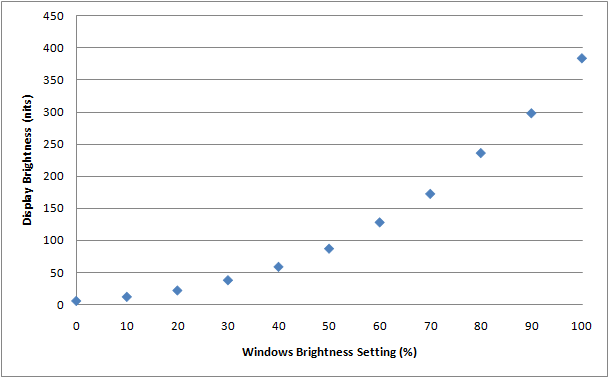
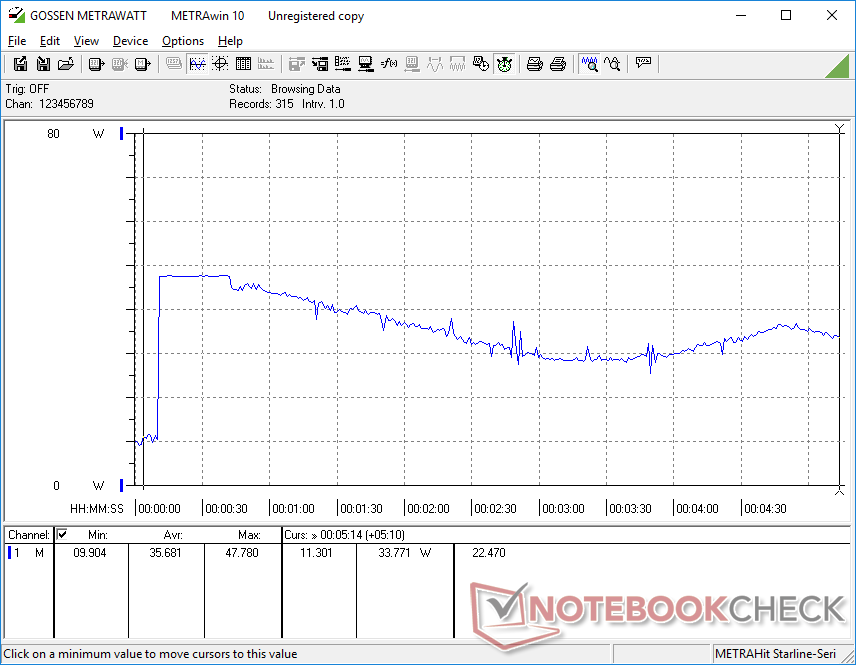
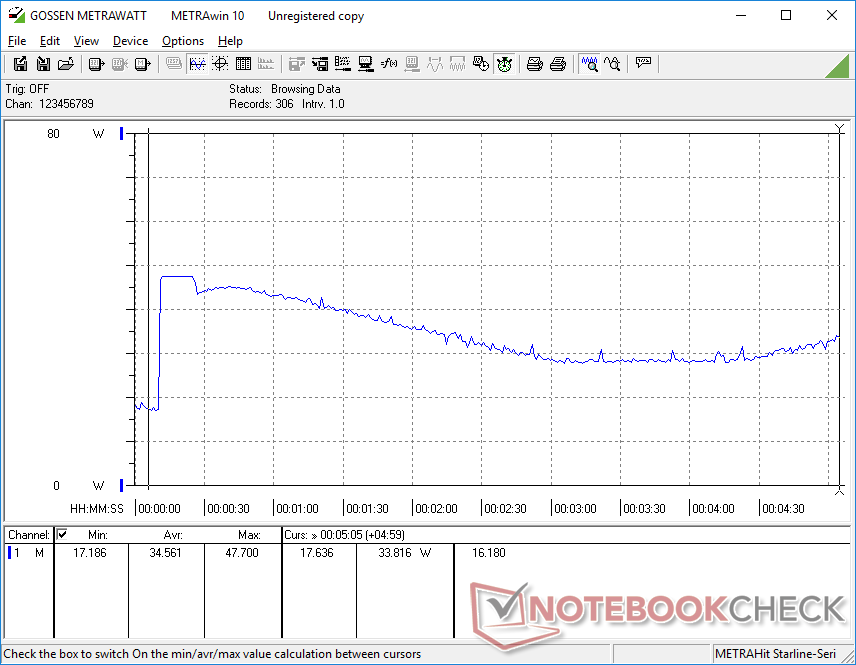
Power consumption behavior is exactly like what we observed on the Razer Blade 15 OLED. In summary, it takes more power to run the OLED display at brighter settings and brighter colors than on an IPS panel. Conversely, it takes less power to run an OLED display at dimmer settings and darker colors. For example, displaying all white at the maximum brightness setting on our XPS 13 OLED consumes 6.2 W more than the minimum brightness setting whereas the difference would only be 2 W and 4 W on the XPS 13 FHD IPS and XPS 13 4K IPS SKUs, respectively. That's about 3x more power for OLED than a typical IPS FHD solution.
Displaying all black consumes the same amount of power no matter the brightness setting since the individual OLED pixels are essentially turned off for infinite contrast. We're able to measure a consumption of just 6 W when under such conditions as shown by the table below.
| Color On Full Display | Brightness Setting | Power Consumption (W) |
|---|---|---|
| White | 0% | 6.1 |
| White | 100% | 12.3 |
| Black | 0% | 6 |
| Black | 100% | 6 |
| Off / Standby | |
| Idle | |
| Load |
|
Key:
min: | |
| Dell XPS 13 9310 OLED i7-1185G7, Iris Xe G7 96EUs, Toshiba XG6 KXG60ZNV512G, OLED, 3456x2160, 13.4" | Dell XPS 13 9310 Core i7 4K i7-1185G7, Iris Xe G7 96EUs, Micron 2300 512GB MTFDHBA512TDV, IPS, 3840x2400, 13.4" | Dell XPS 13 9310 Core i7 FHD i7-1165G7, Iris Xe G7 96EUs, Micron 2300 512GB MTFDHBA512TDV, IPS, 1920x1200, 13.4" | Dell XPS 13 7390 Core i7-10710U i7-10710U, UHD Graphics 620, SK Hynix PC601 NVMe 512 GB, IPS, 3840x2160, 13.3" | MSI Summit E13 Flip Evo A11MT i7-1185G7, Iris Xe G7 96EUs, Phison 1TB SM2801T24GKBB4S-E162, IPS, 1920x1200, 13.4" | |
|---|---|---|---|---|---|
| Power Consumption | -1% | 17% | 2% | -13% | |
| Idle Minimum * (Watt) | 5.7 | 4.3 25% | 3.9 32% | 4.7 18% | 4.8 16% |
| Idle Average * (Watt) | 6 | 8.3 -38% | 5.9 2% | 8.3 -38% | 8.4 -40% |
| Idle Maximum * (Watt) | 12.3 | 8.8 28% | 6.3 49% | 9 27% | 8.6 30% |
| Load Average * (Watt) | 44.4 | 46.2 -4% | 39.7 11% | 42 5% | 47.1 -6% |
| Witcher 3 ultra * (Watt) | 36.5 | 42.2 -16% | 34.8 5% | 51.6 -41% | |
| Load Maximum * (Watt) | 47.8 | 47.3 1% | 47.5 1% | 49 -3% | 65.9 -38% |
* ... smaller is better
Battery Life
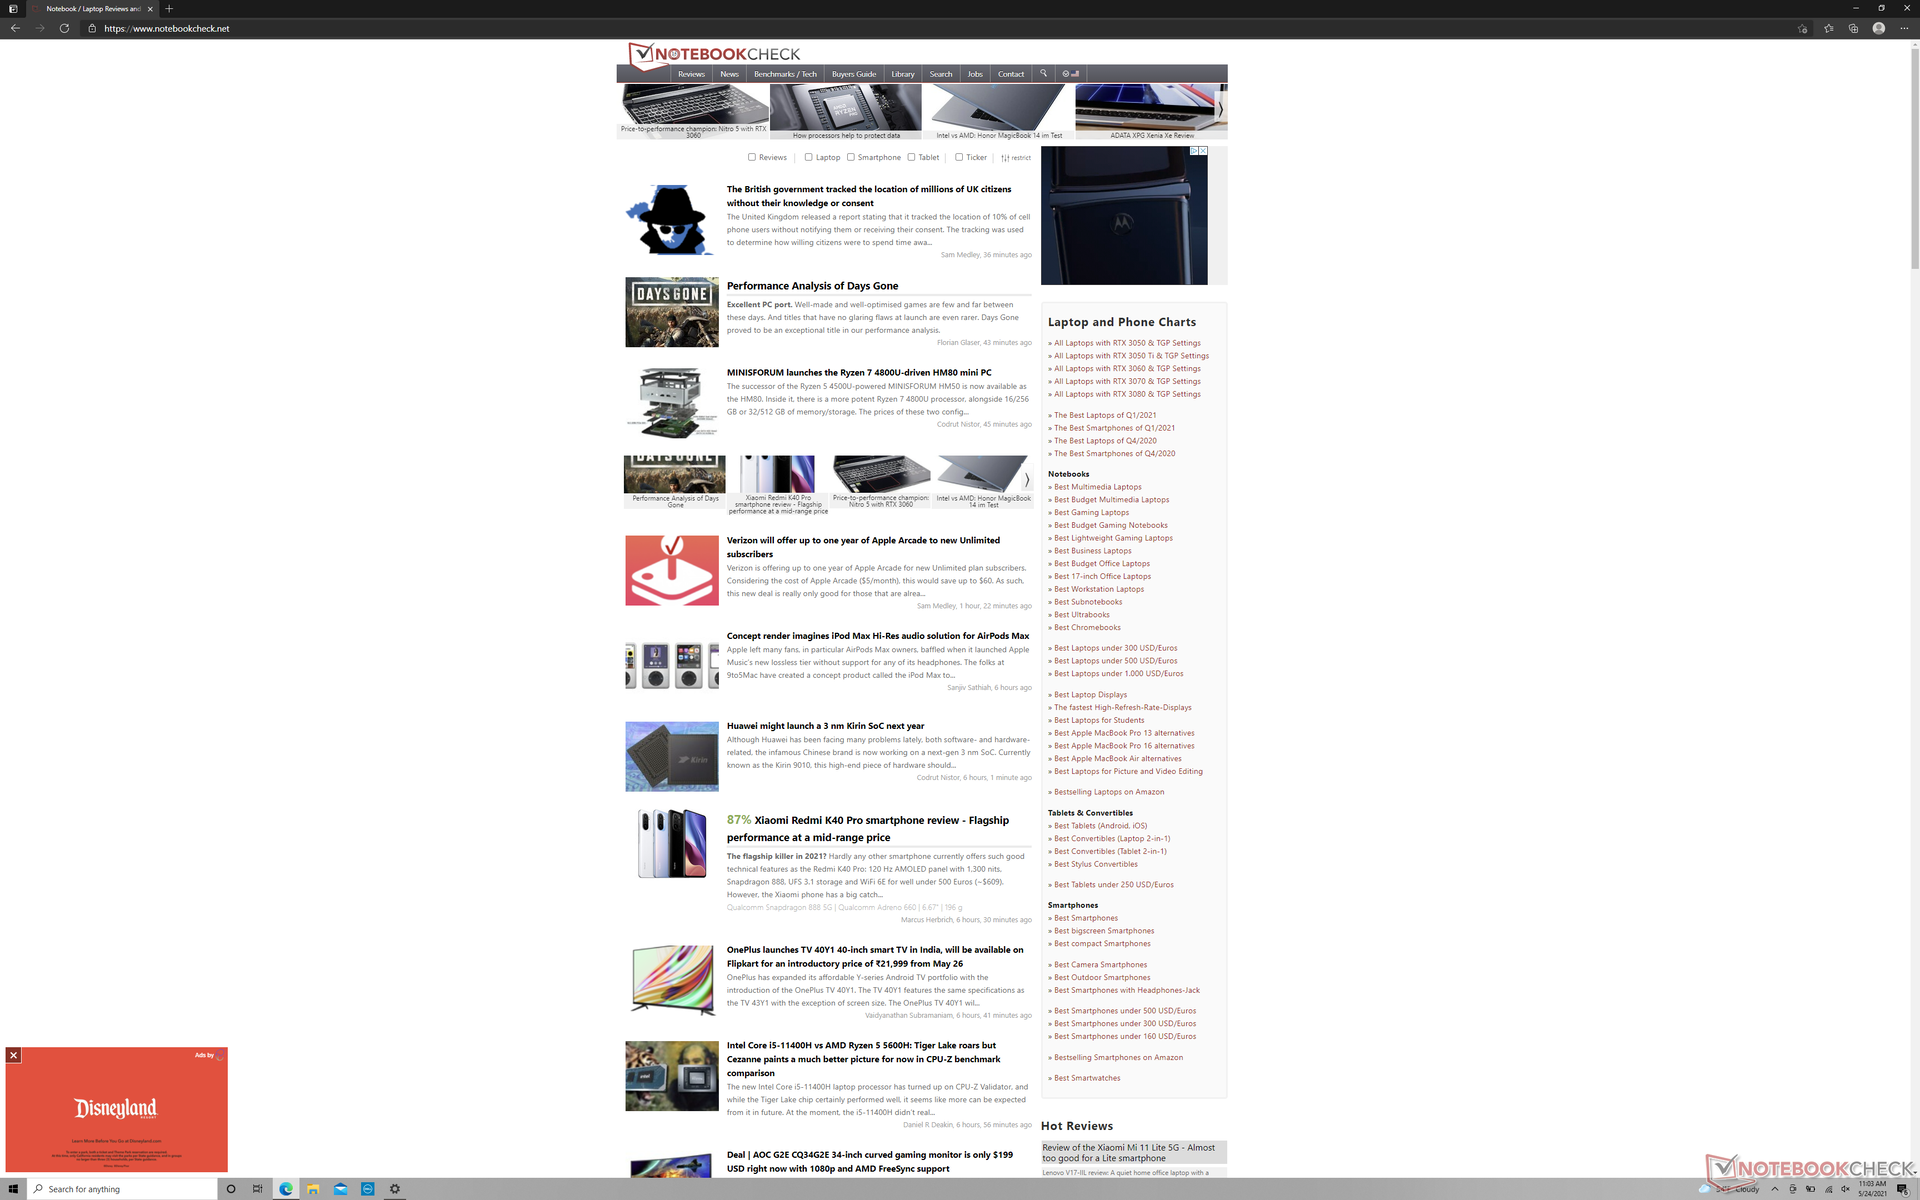
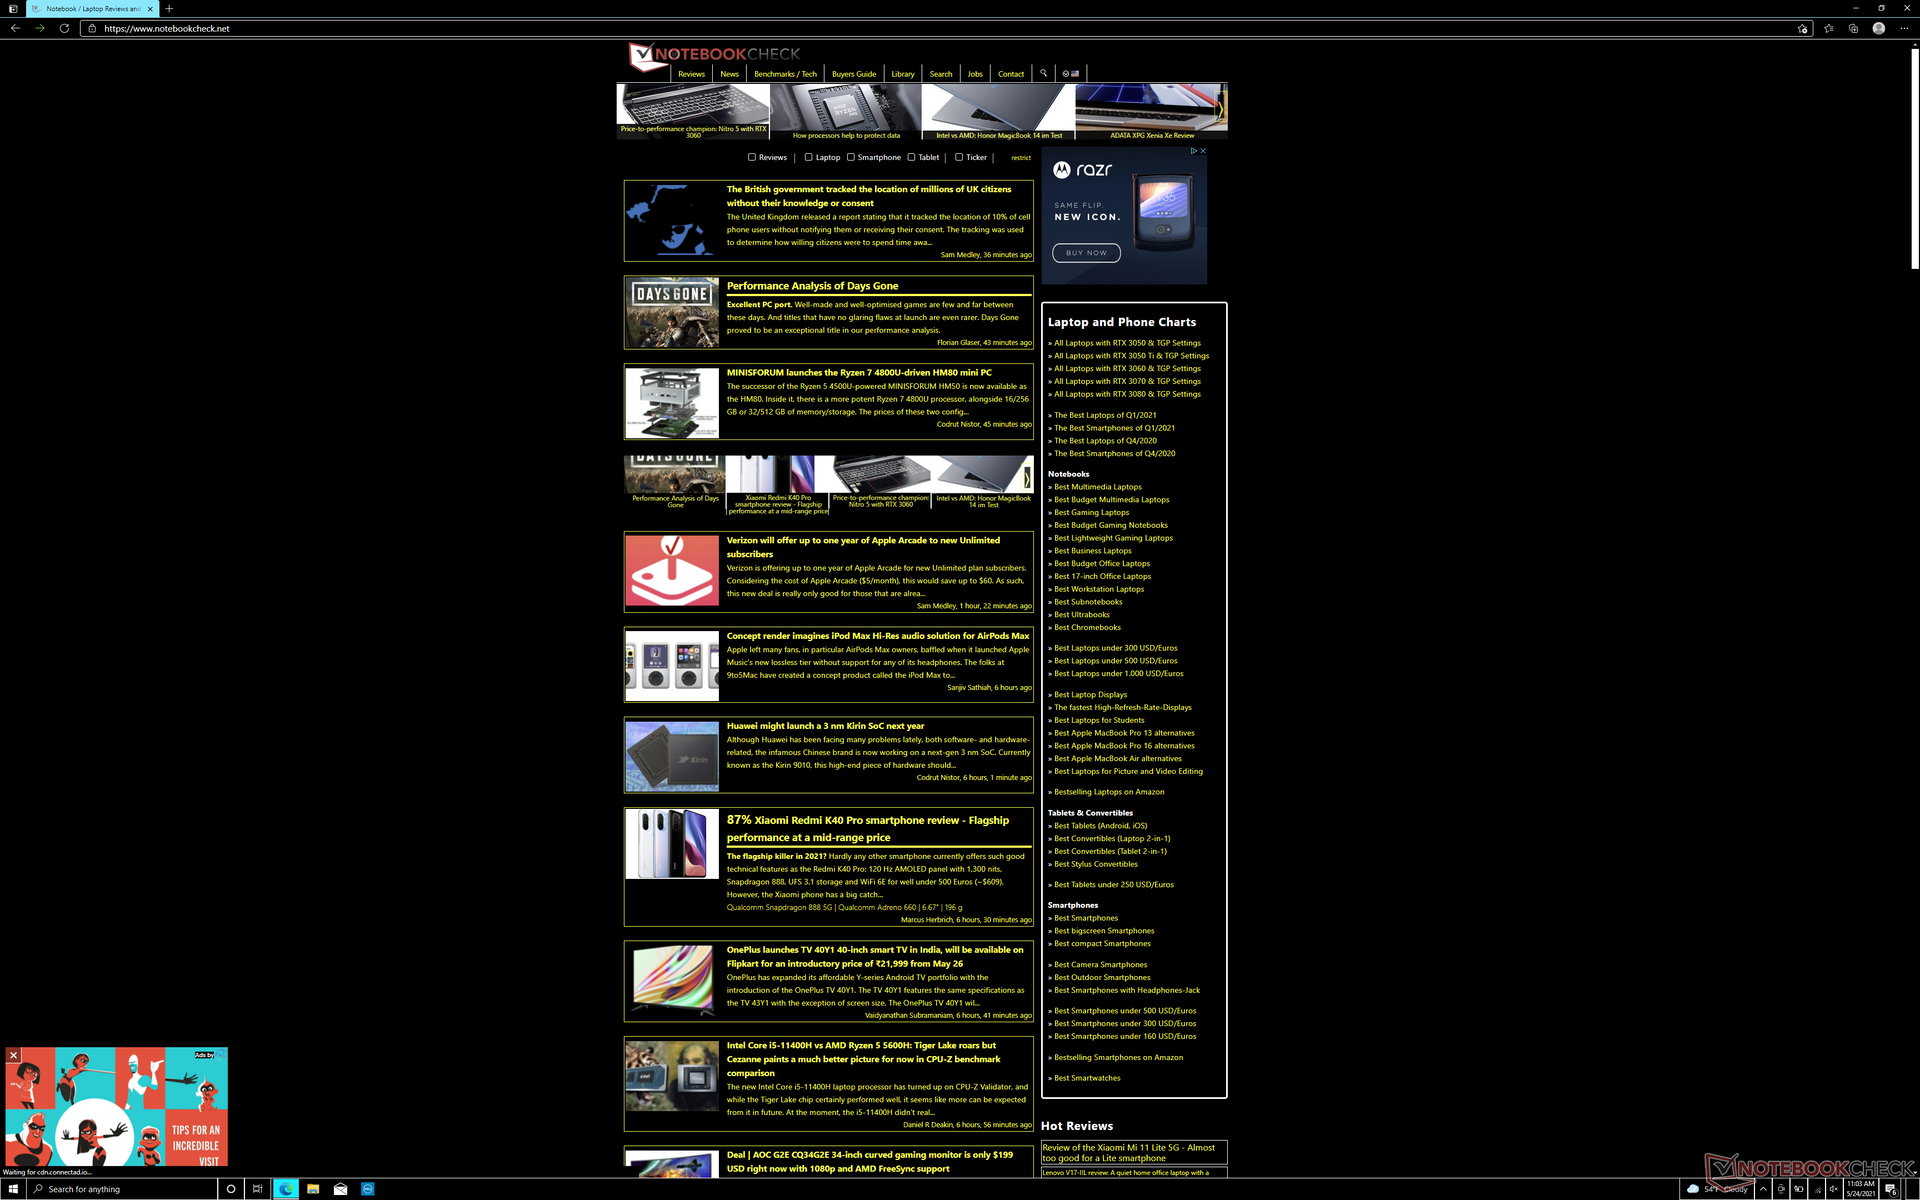
Runtimes are highly dependent on brightness and color as proven by our power consumption findings above. When browsing the web on Balanced mode with the display set to 150 nits, we were able to record a runtime of 6 hours and 31 minutes on a full charge. When running this same test with Windows High Contrast Mode toggled on instead, runtimes would double to be as long as 13 hours and 40 minutes. High contrast mode isn't always ideal, of course, but it helps illustrate how long battery life can be extended by simply changing the screen to darker colors. This is especially true when browsing the web or word processing since most of the screen is white in these scenarios.
Battery life is noticeably shorter than on the XPS 13 4K IPS SKU and especially the XPS 13 FHD IPS SKU where the difference can be several hours. Darker or grayer color themes are recommended if long runtimes are important. Perhaps not coincidentally, Dell has set the default Windows wallpaper and explorer windows to gray instead of the usual bright blue and white that we always see on the regular XPS 13 IPS SKUs and most other laptops.
| Dell XPS 13 9310 OLED i7-1185G7, Iris Xe G7 96EUs, 52 Wh | Dell XPS 13 9310 Core i7 4K i7-1185G7, Iris Xe G7 96EUs, 52 Wh | Dell XPS 13 9310 Core i7 FHD i7-1165G7, Iris Xe G7 96EUs, 52 Wh | Dell XPS 13 7390 Core i7-10710U i7-10710U, UHD Graphics 620, 52 Wh | MSI Summit E13 Flip Evo A11MT i7-1185G7, Iris Xe G7 96EUs, 70 Wh | |
|---|---|---|---|---|---|
| Battery runtime | 11% | 69% | 29% | 72% | |
| WiFi v1.3 (h) | 6.5 | 7.2 11% | 11 69% | 8.4 29% | 11.2 72% |
| Reader / Idle (h) | 30 | 21.1 | |||
| Load (h) | 3.2 | 1.8 |
Pros
Cons
Verdict
Much like what we concluded with the recent HP Spectre x360 13, OLED isn't the be all end all technology when it comes to displays. It certainly has its advantages over IPS, but its list of disadvantages are arguably just as important.
The biggest and most obvious advantages relate to picture quality. There's no arguing that OLED offers superior colors, black levels, and black-white/gray-gray response times for a noticeably better viewing experience. If this is an important luxury for your daily workloads, then OLED will look much more compelling than IPS.
The visual advantages of OLED are easy to notice, but it doesn't come without a few compromises in other areas.
OLED drawbacks are generally less obvious and not as noticeable at first glance. Firstly, both brightness and resolution are dimmer and lower, respectively, than the XPS 13 4K option. Secondly, pulse-width modulation is present at lower frequencies for potentially more noticeable flickering. And lastly, power consumption will vary more wildly depending on current colors and brightness for potentially shorter battery life than IPS.
Keep in mind that the XPS 13 OLED costs about the same as the XPS 13 4K IPS. Thus, users are no longer required to pay hefty premiums just for the luxury of an OLED panel unlike on many earlier OLED laptops. This makes OLED easier to recommend nowadays so long as users are educated on its pros and cons.
Price and availability
Dell XPS 13 9310 OLED
- 08/31/2022 v7 (old)
Allen Ngo
Price comparison
