 Deutsch
 English
 Español
 Français
 Italiano
 Nederlands
 Polski
 Português
 Русский
 Türkçe
 Svenska
 Chinese
 Magyar
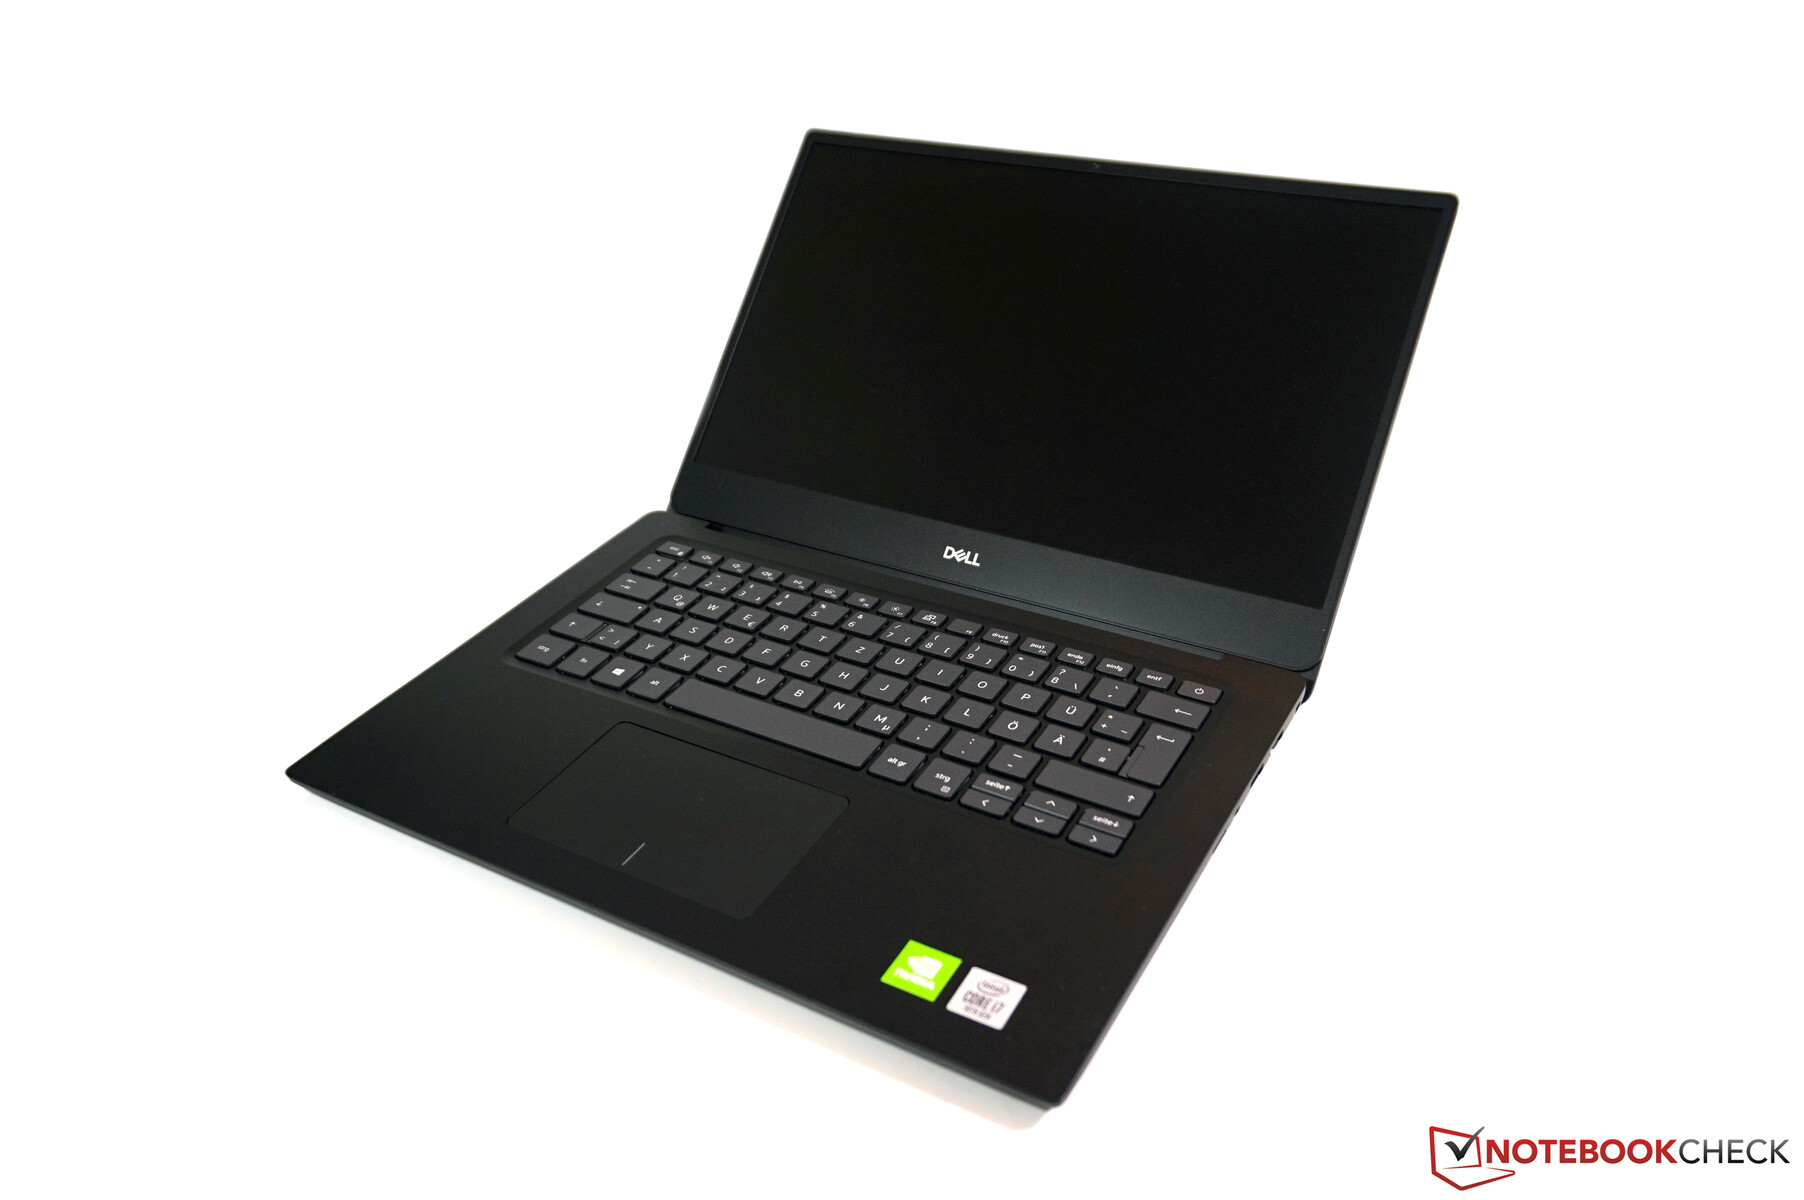
Dell Vostro 14 5490: Business laptop with dedicated GPU in review
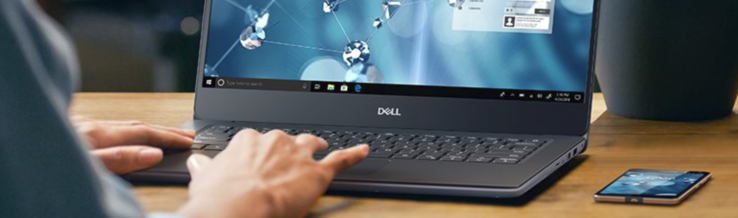
The entry-level business range of Dell's laptops starts with the Vostro series. The name of our test device is Vostro 14 5490, and it thus belongs to the mid-range 5000 series. According to Dell, the laptops are primarily aimed at small businesses looking for reasonable performance in combination with some security solutions. For 809 Euros (~$913) (plus VAT), our configuration comes with a Core i7 processor, 16 GB of RAM, 512 GB of fast SSD storage (NVMe), and even a dedicated graphics card from Nvidia (GeForce MX250). However, there are also optional models without a dGPU, in which case the entry-level price is 639 Euros (~$777) (plus VAT).
Rating | Date | Model | Weight | Height | Size | Resolution | Best Price |
|---|---|---|---|---|---|---|---|
| 82.1 % | 01/2021 | Dell Vostro 14 5490 i7-10510U, GeForce MX250 | 1.5 kg | 17.9 mm | 14.00" | 1920x1080 | |
| 85 % | 12/2020 | Lenovo ThinkPad L14-20U50003GE R5 4500U, Vega 6 | 1.7 kg | 20.4 mm | 14.00" | 1920x1080 | |
| 83.2 % | 07/2020 | HP ProBook 445 G7 175W4EA R5 4500U, Vega 6 | 1.6 kg | 18 mm | 14.00" | 1920x1080 | |
| 87 % | 08/2020 | Acer TravelMate P6 P614-51T-G2-72ZU i7-10510U, UHD Graphics 620 | 1.2 kg | 16.6 mm | 14.00" | 1920x1080 | |
| 85.3 % | 10/2020 | Dell Latitude 14 5410-RJ80D i5-10310U, UHD Graphics 620 | 1.6 kg | 20.7 mm | 14.00" | 1920x1080 |
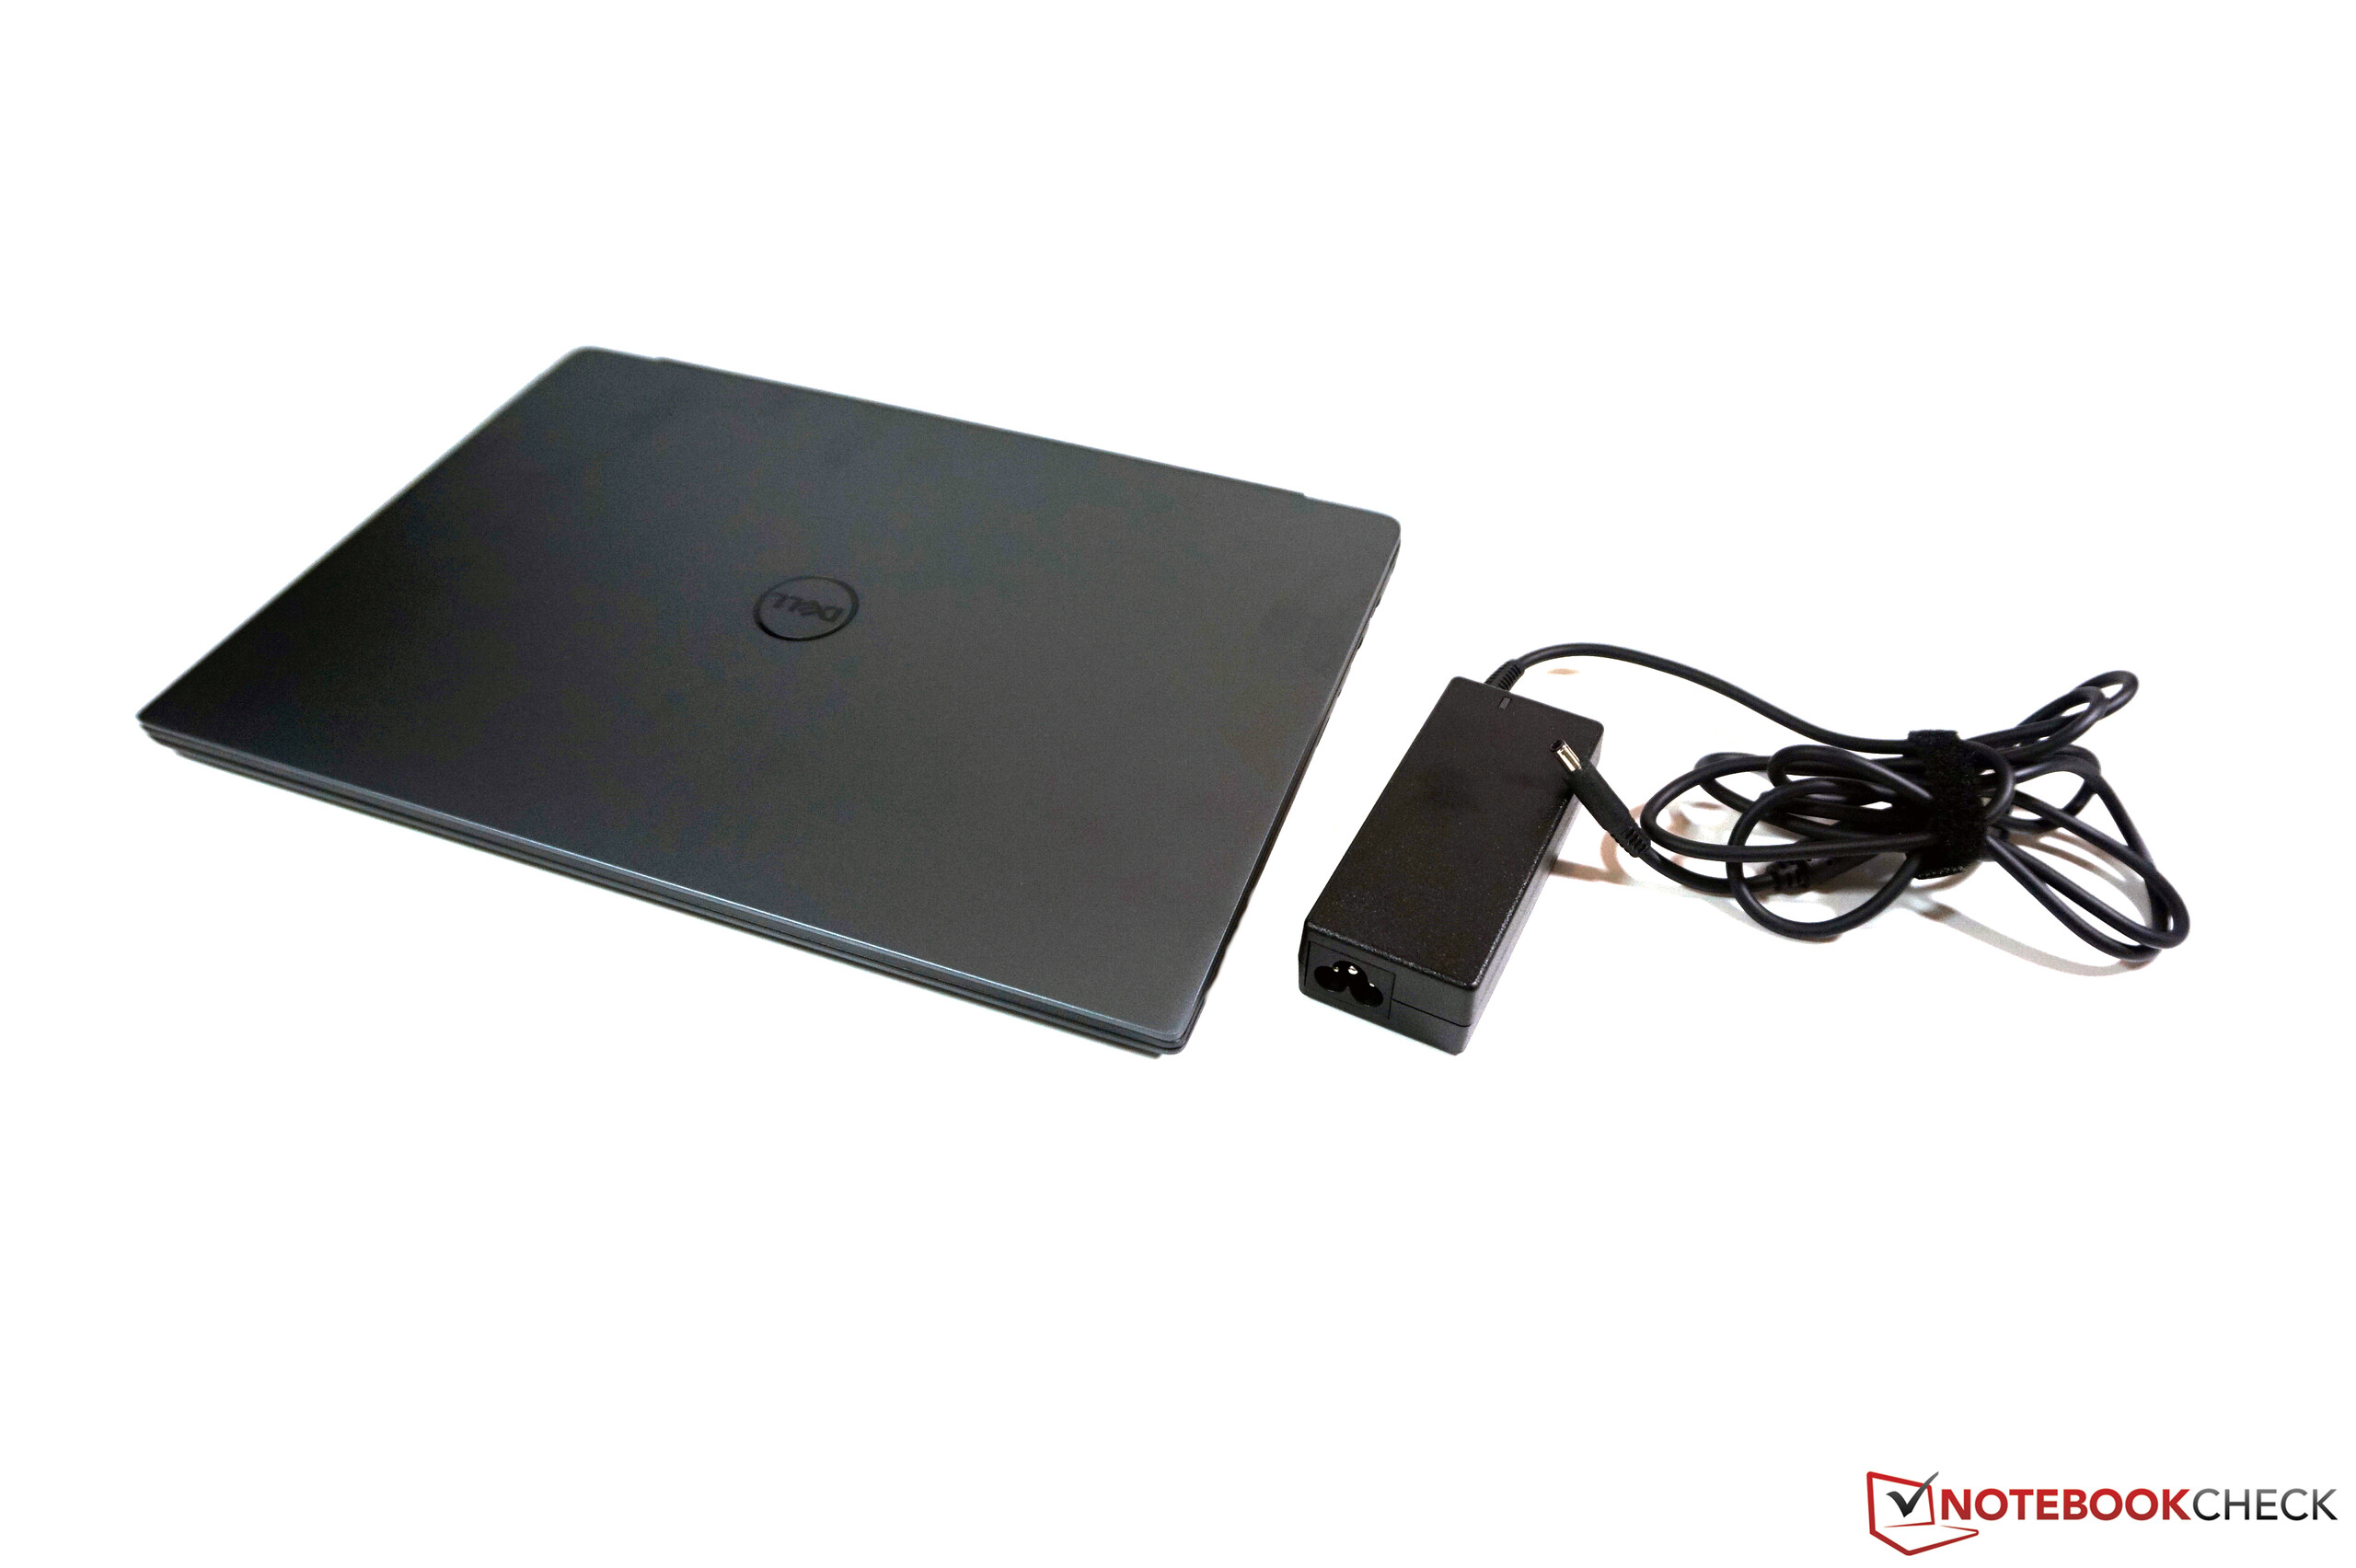
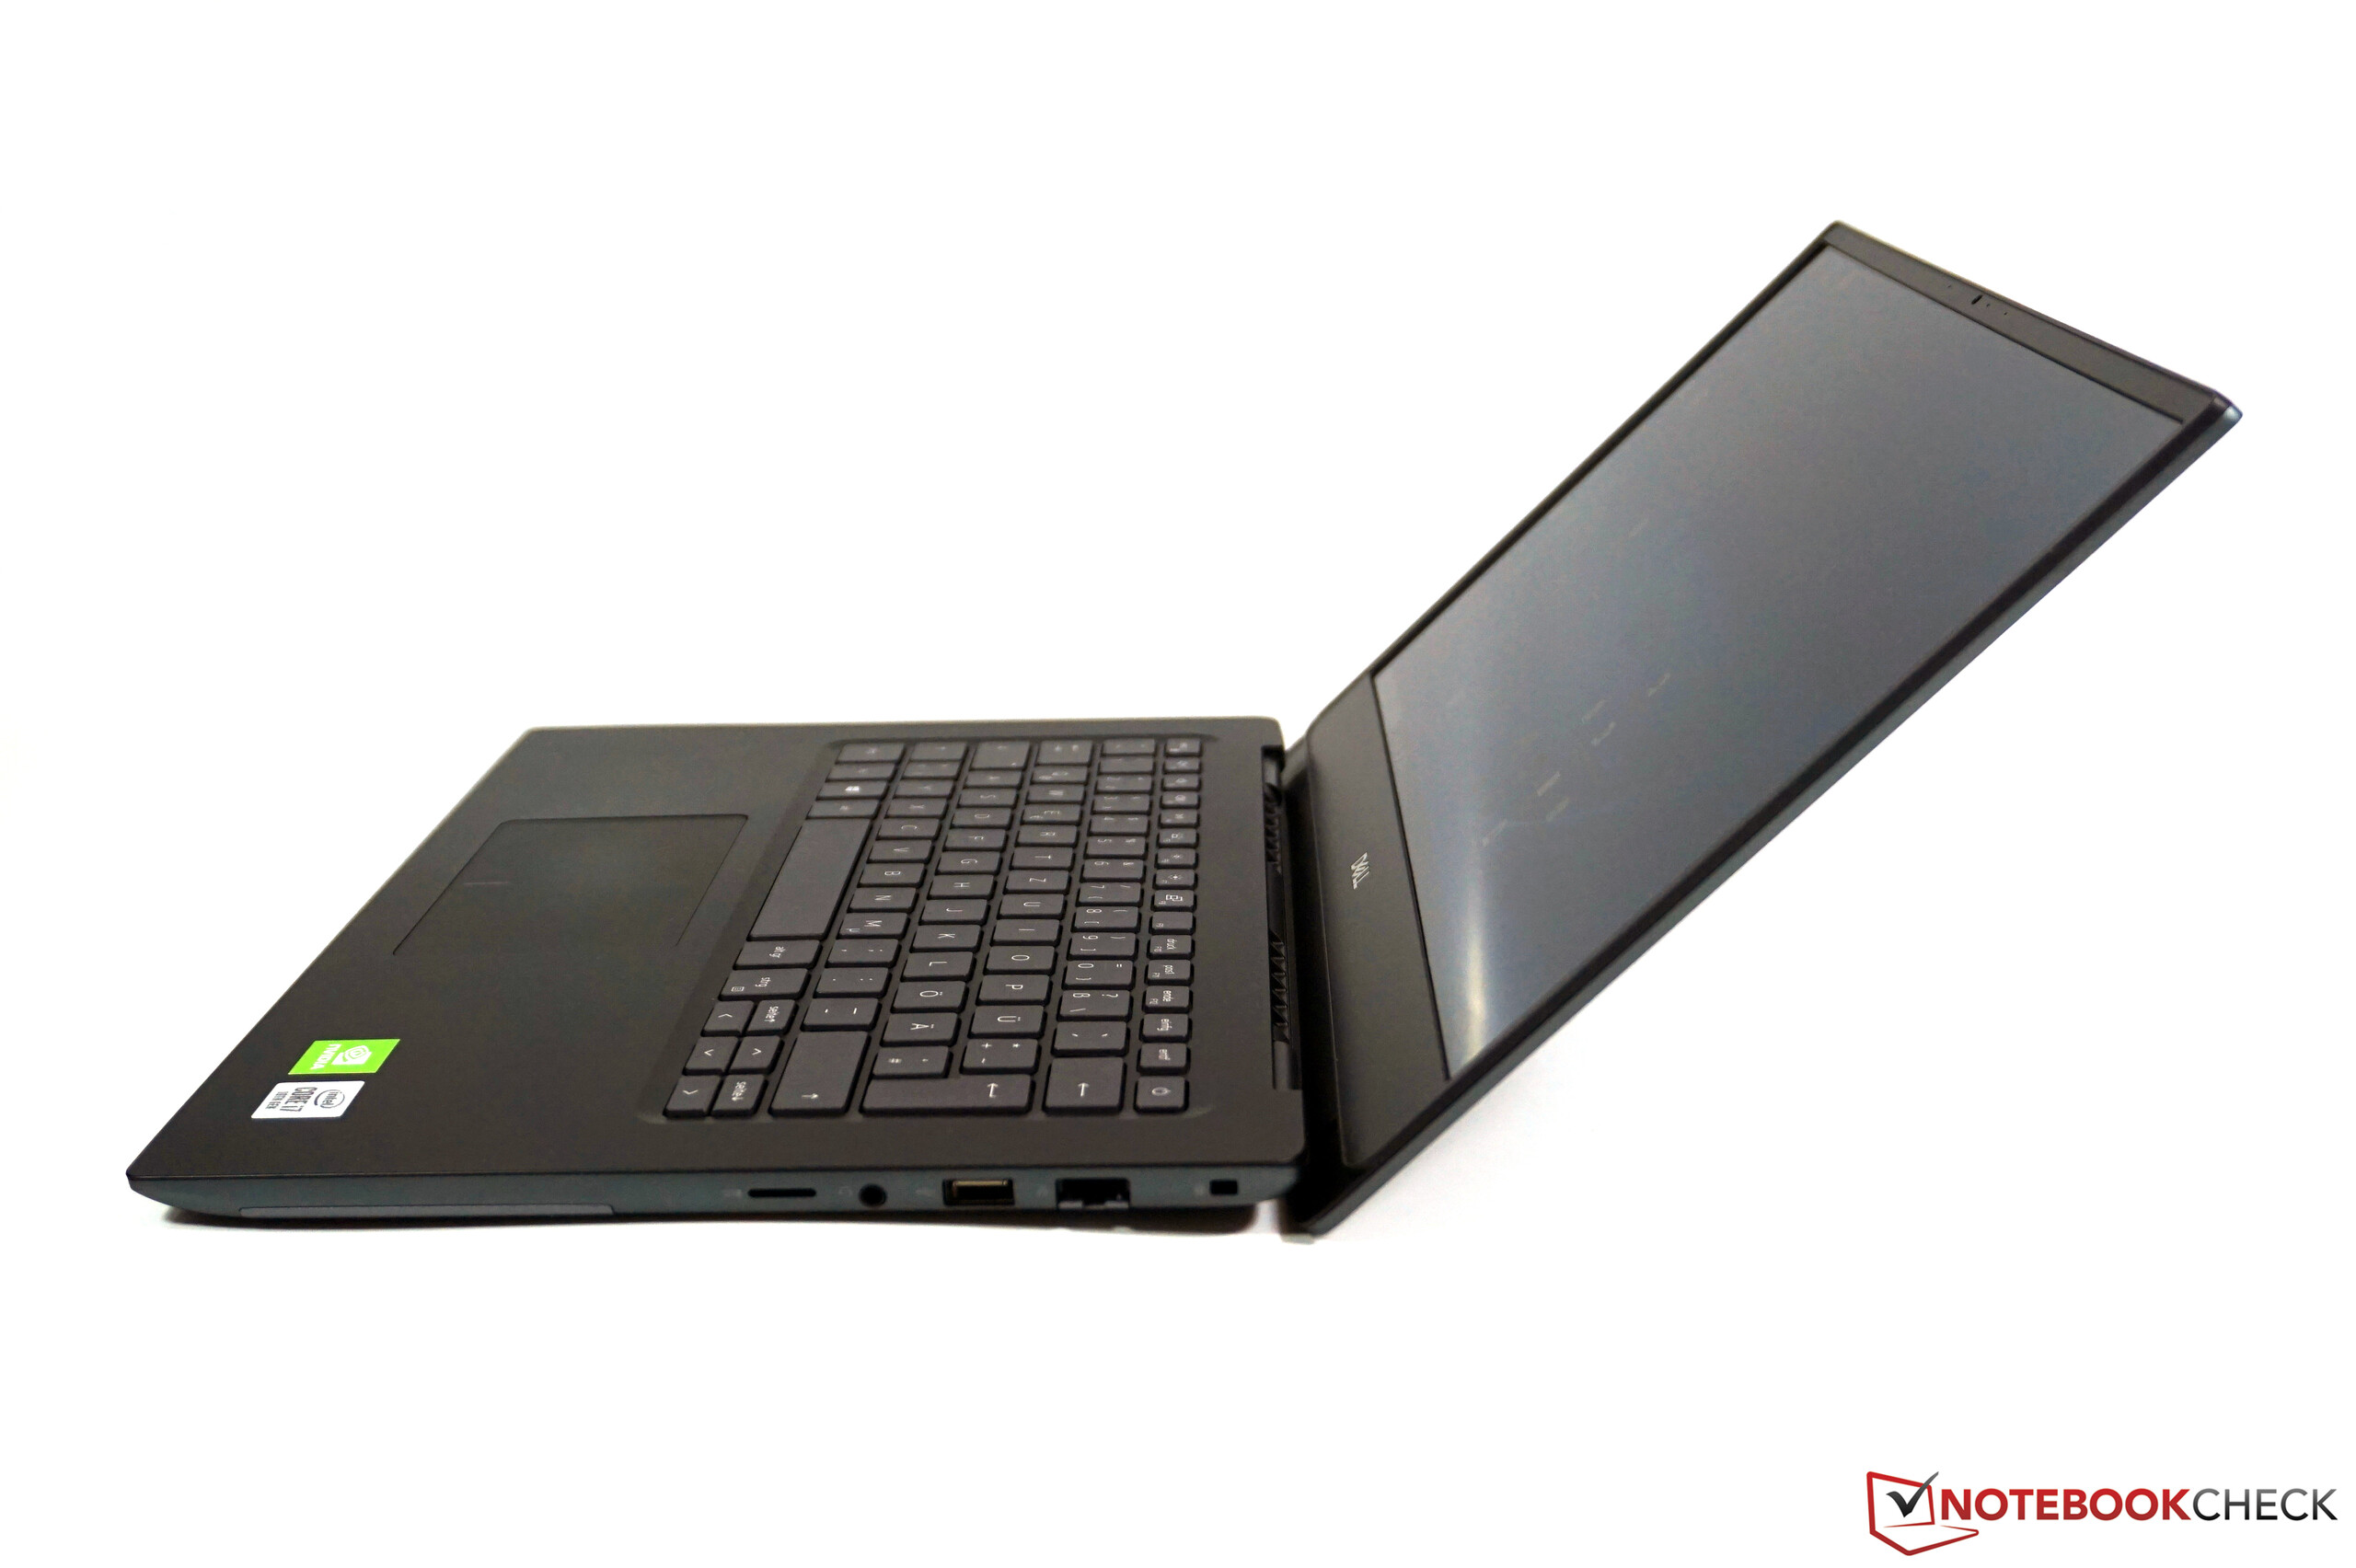
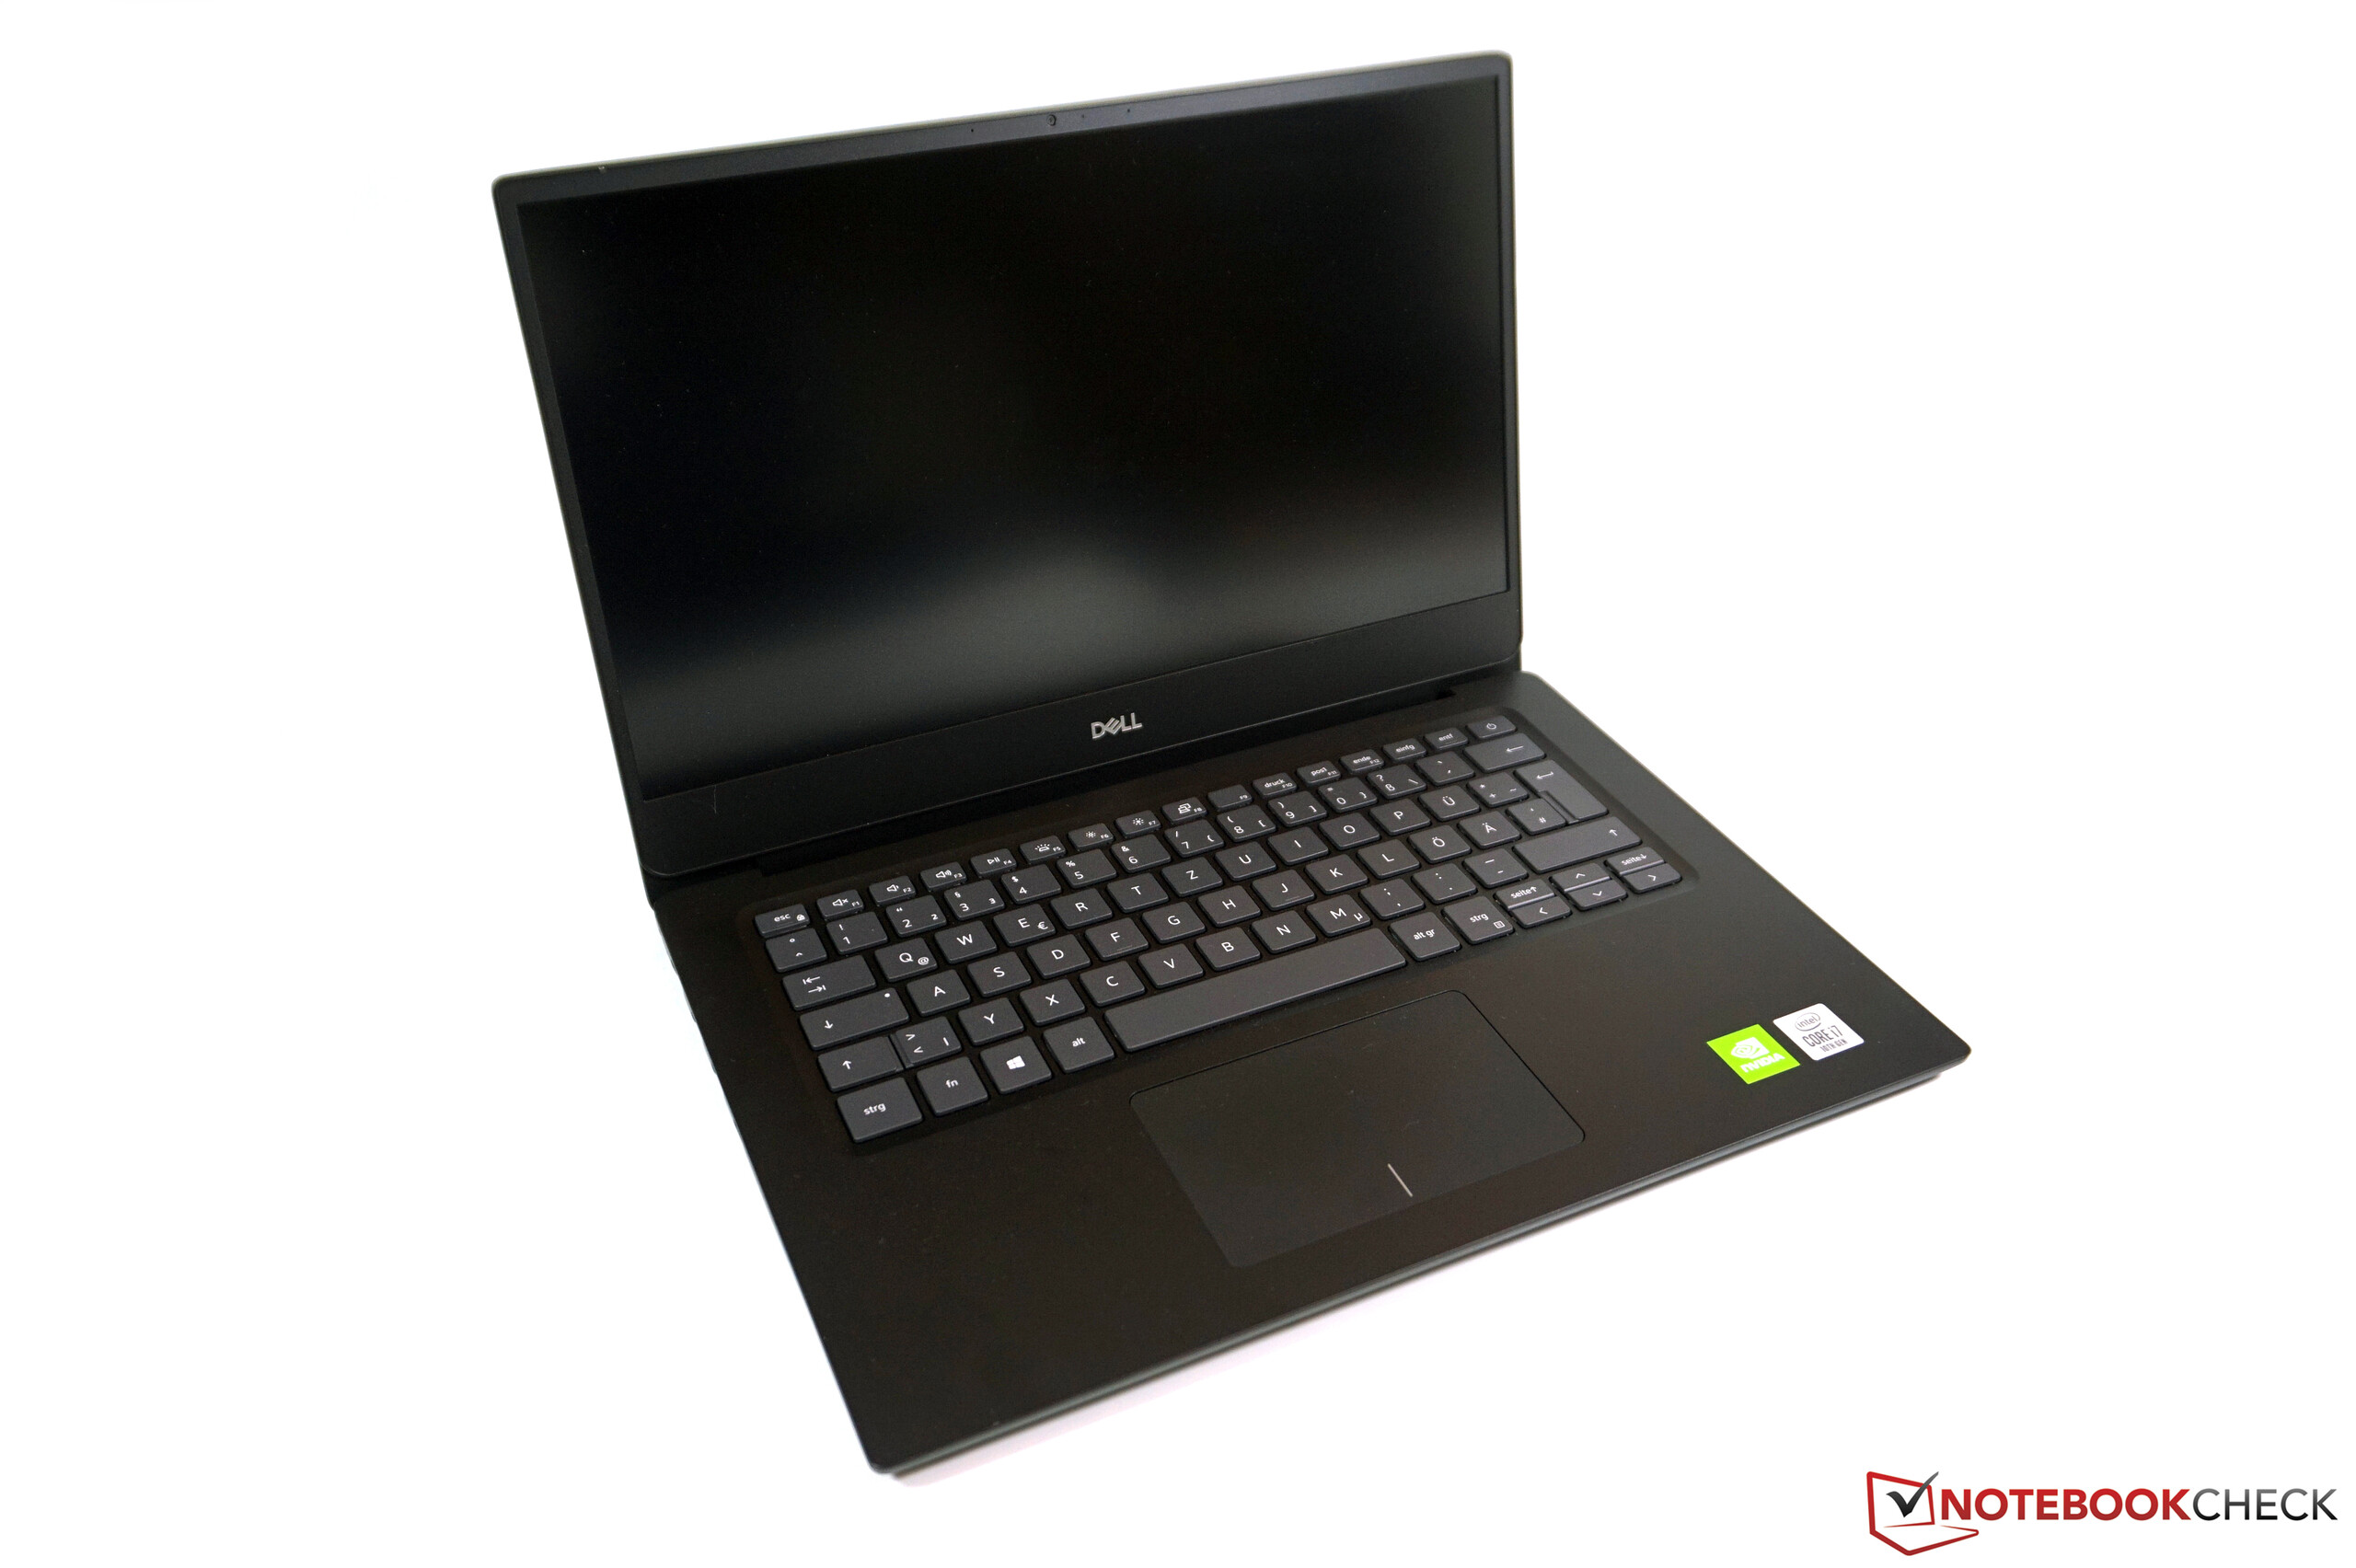
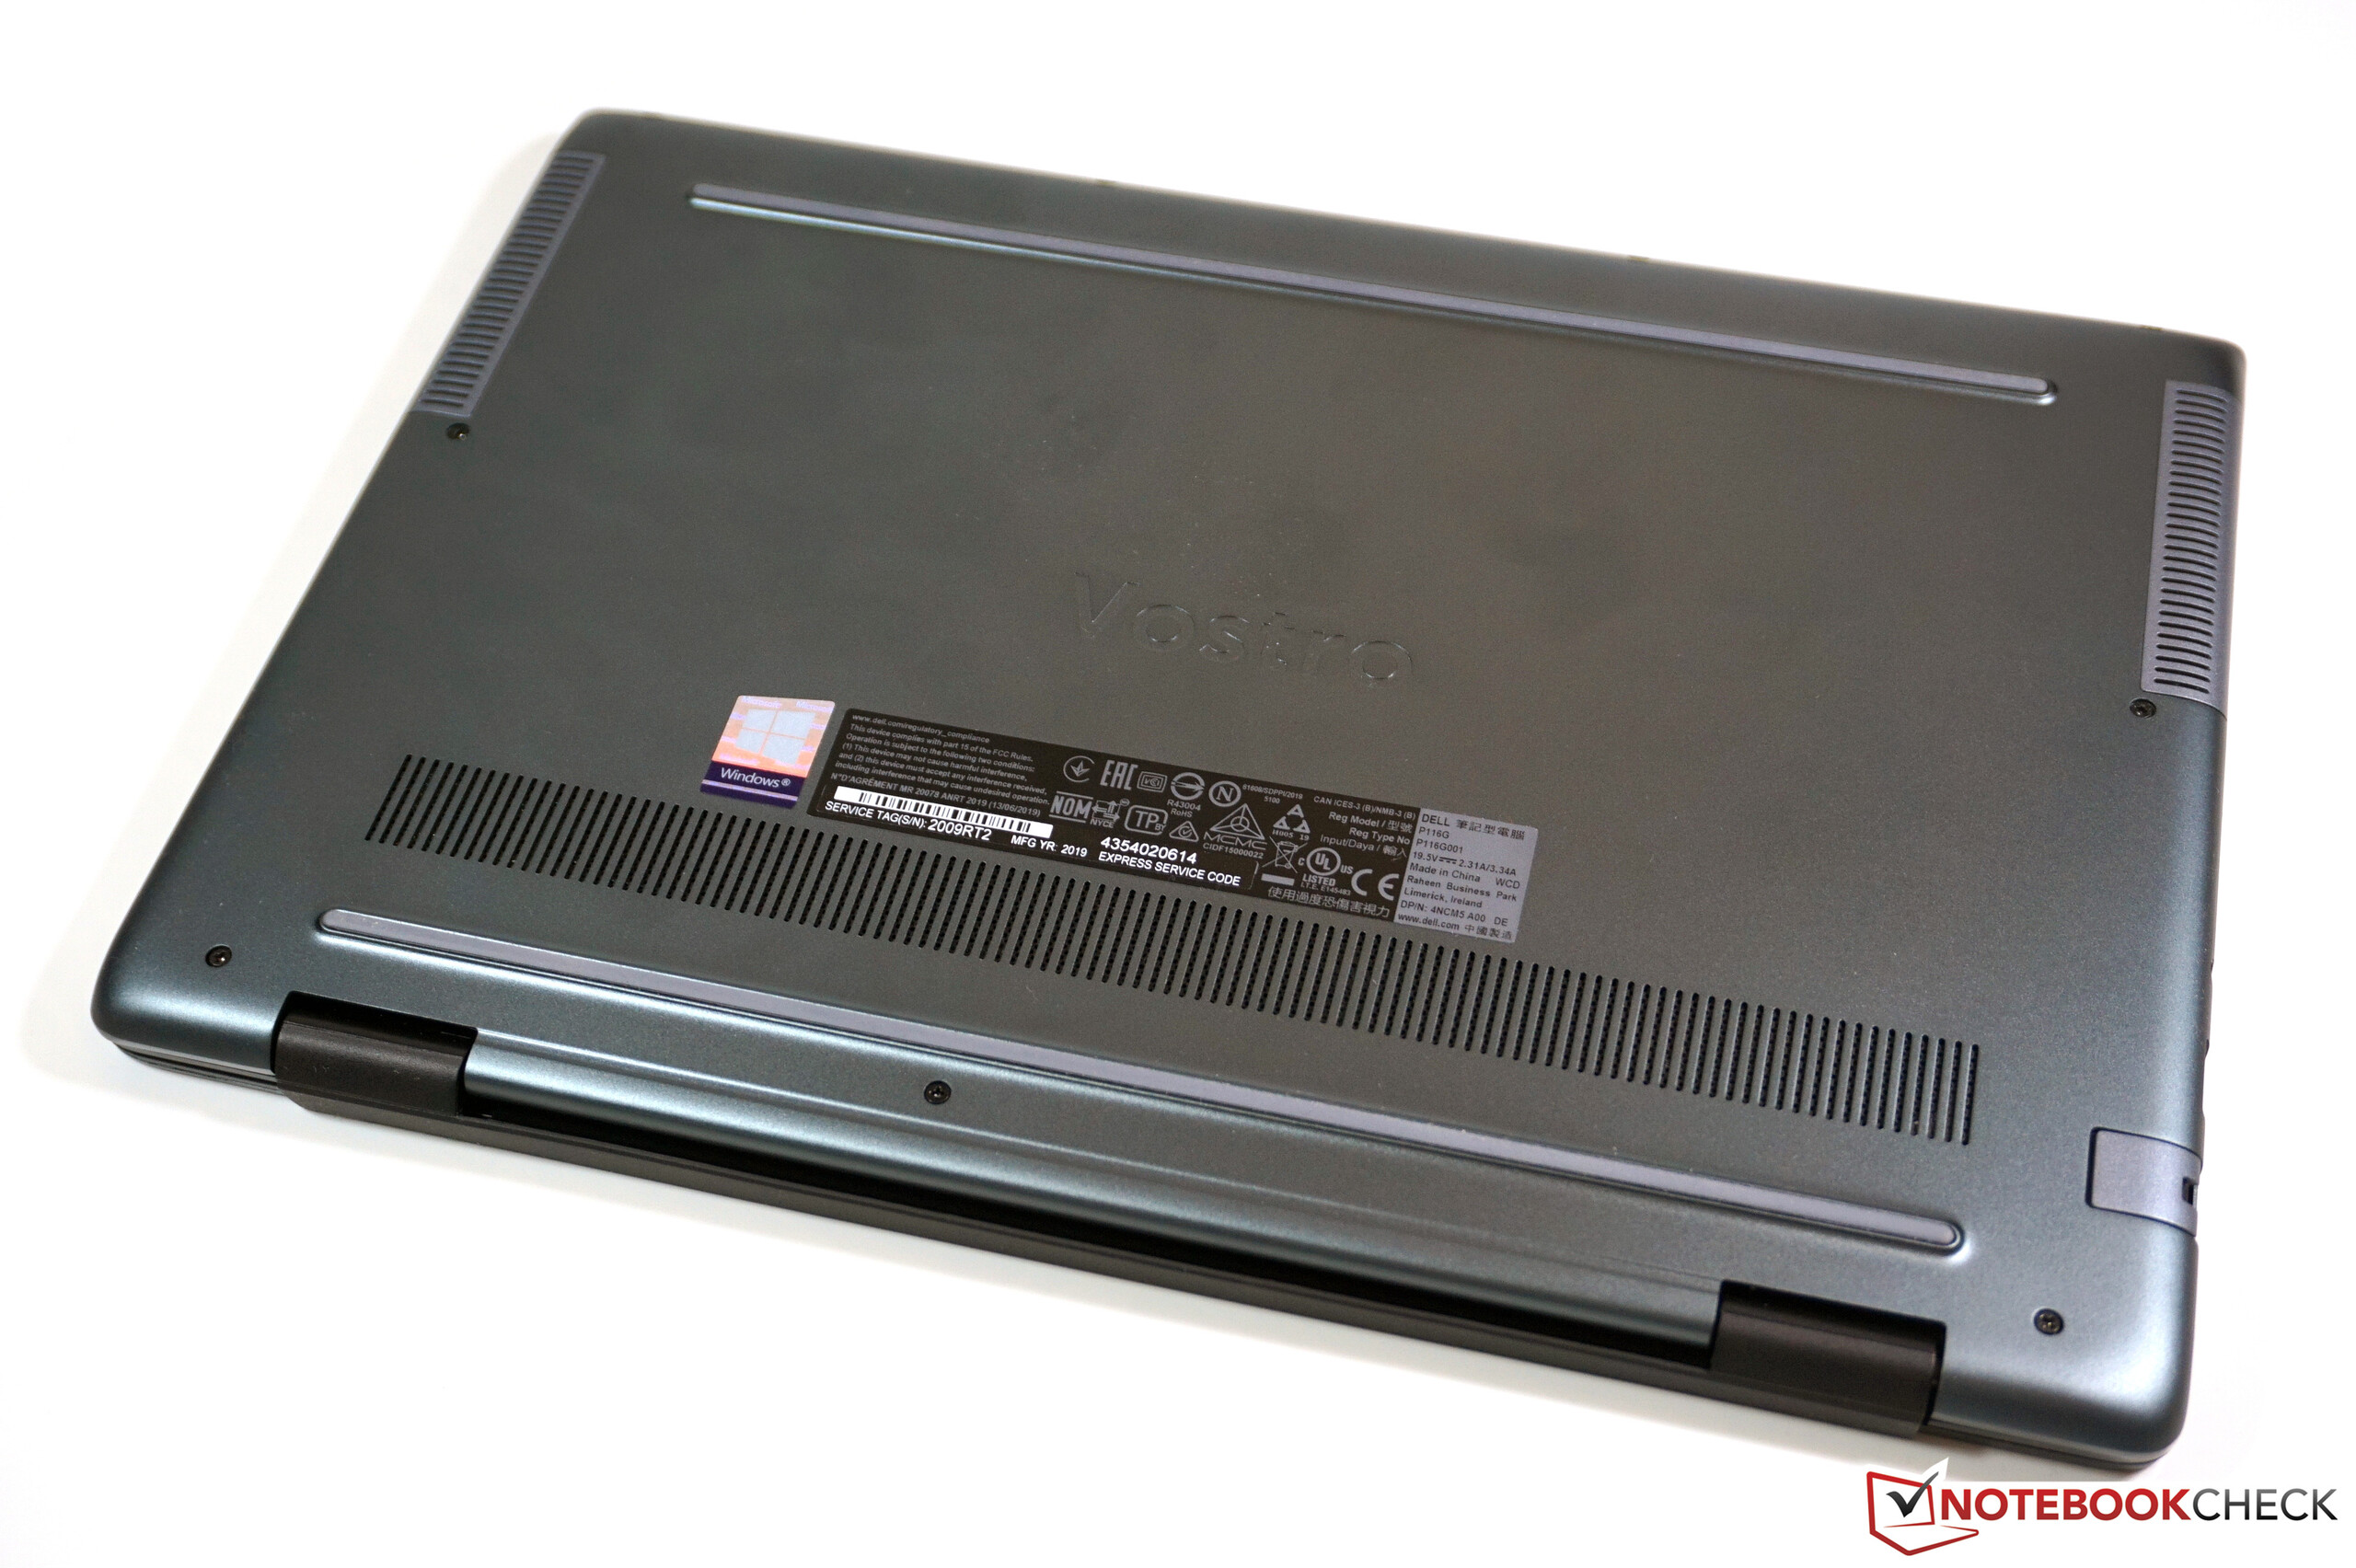
Case and connectivity
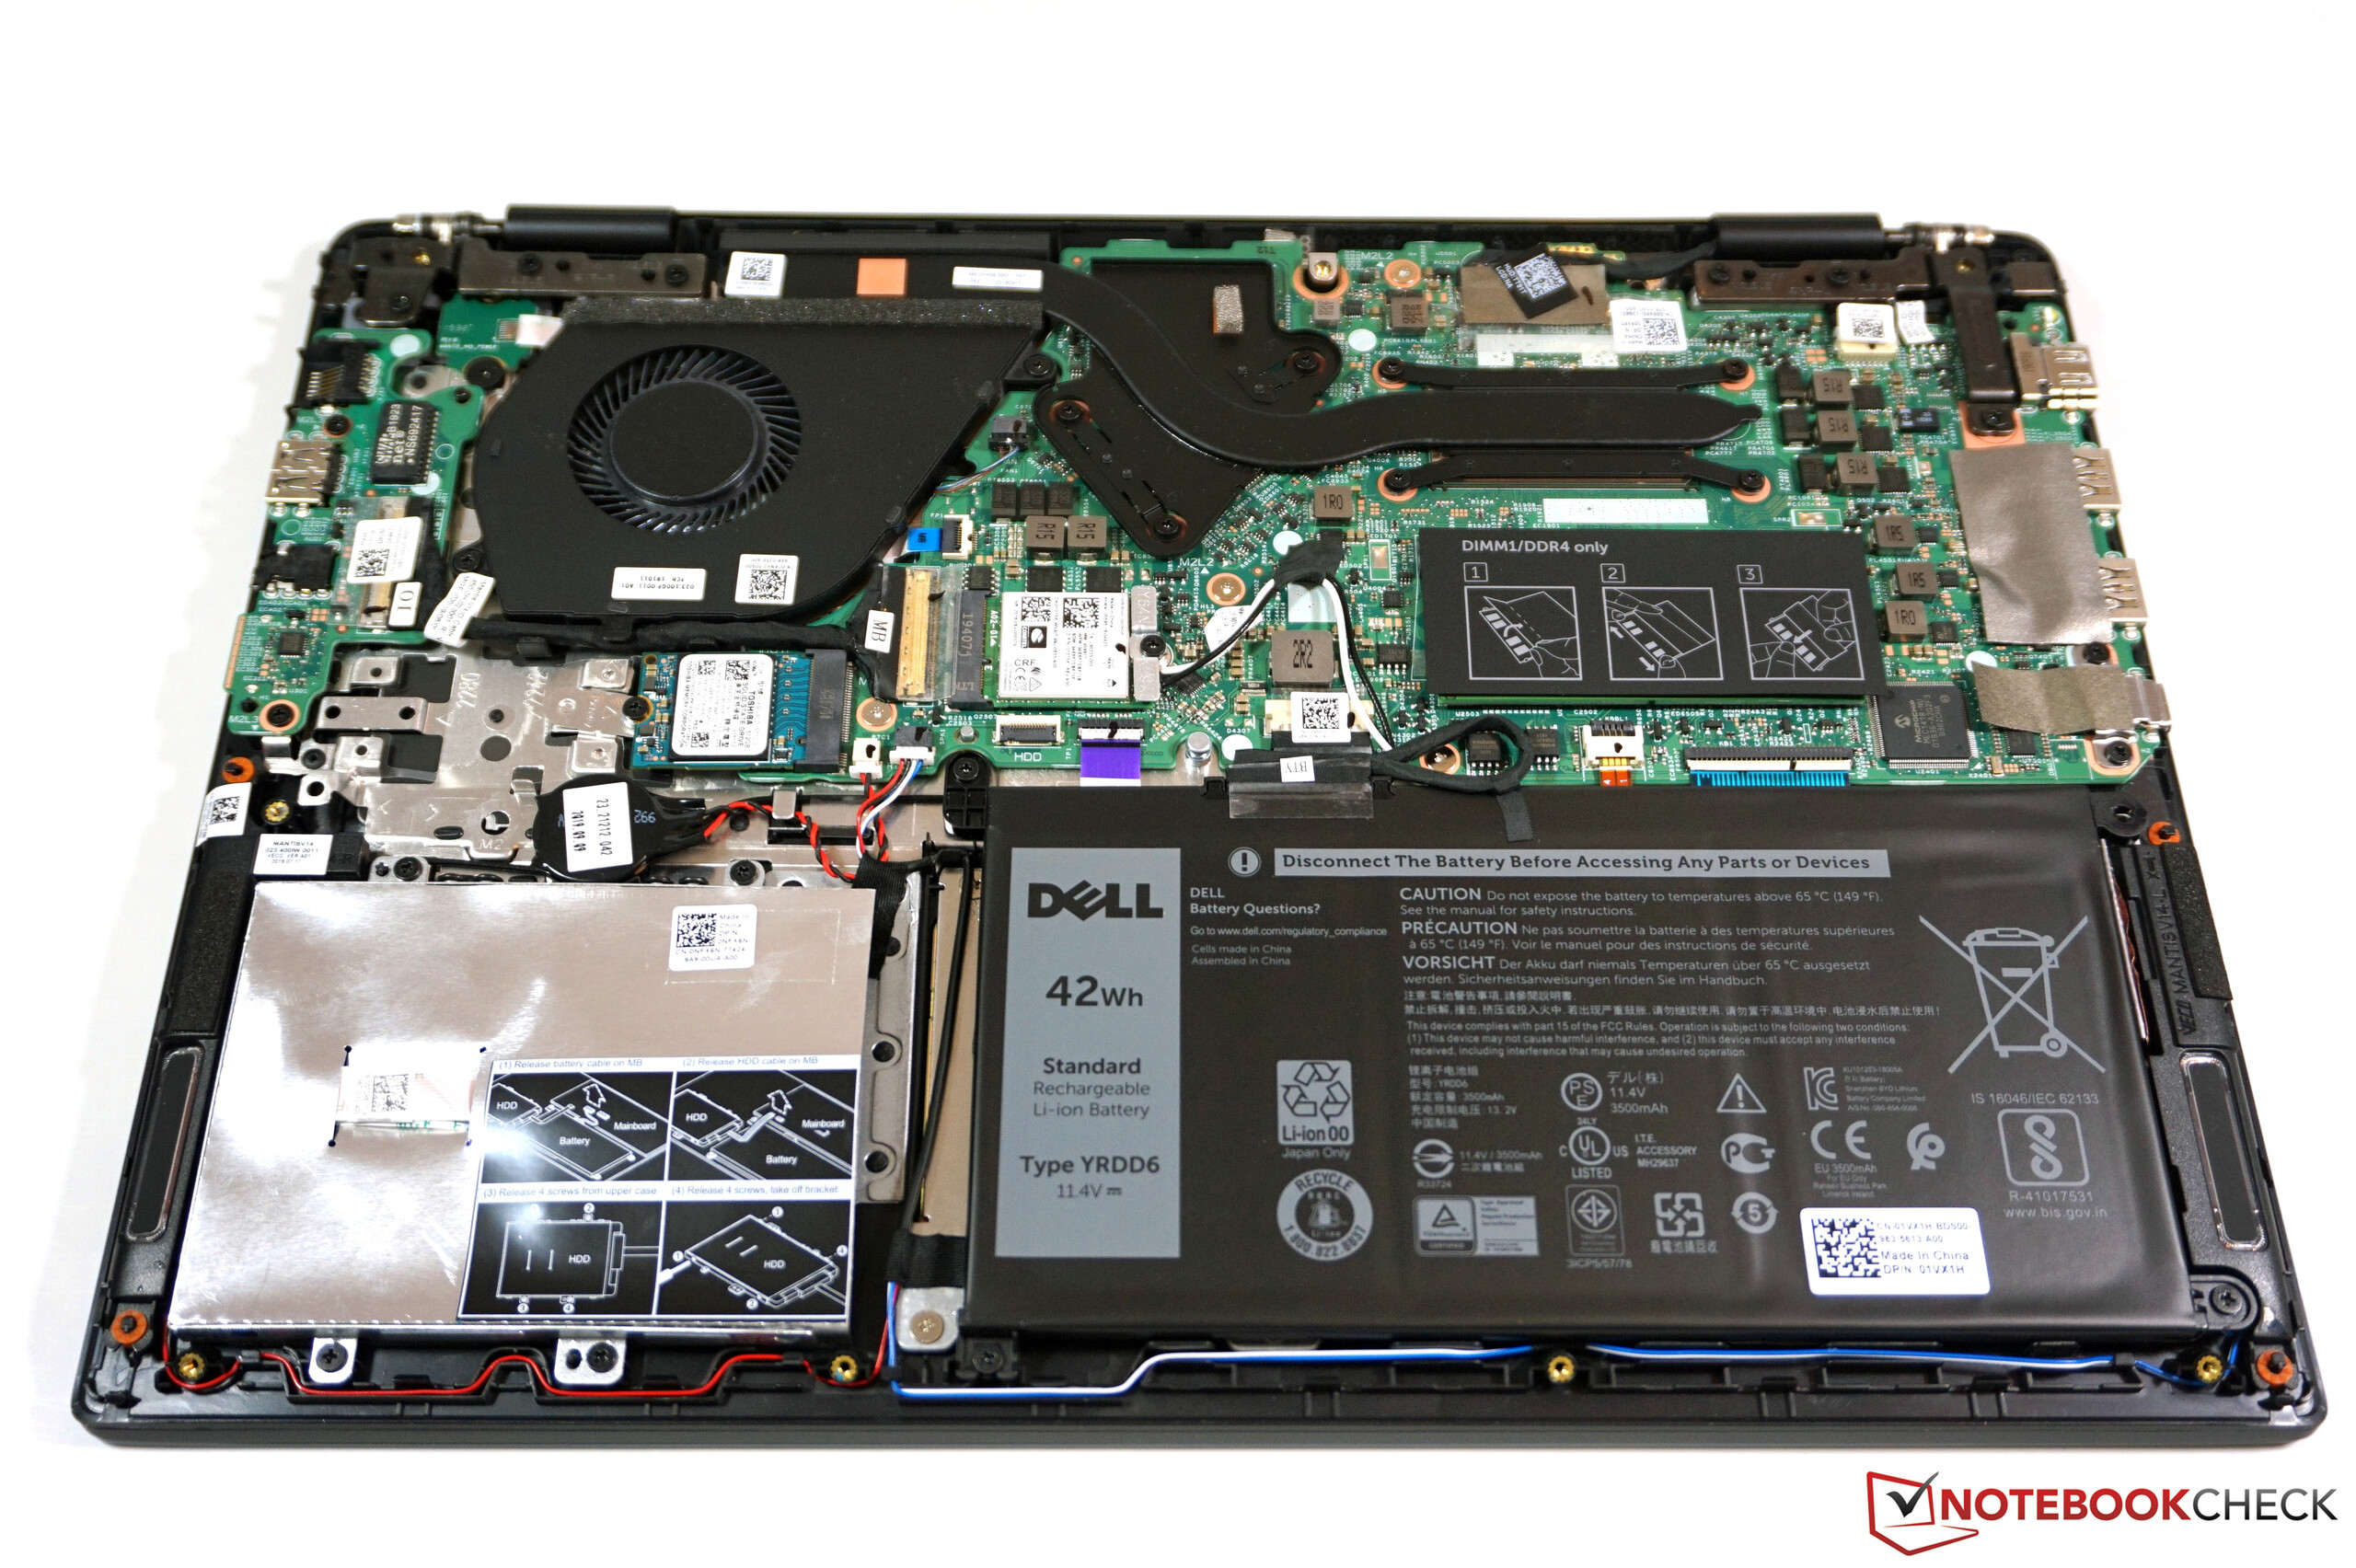
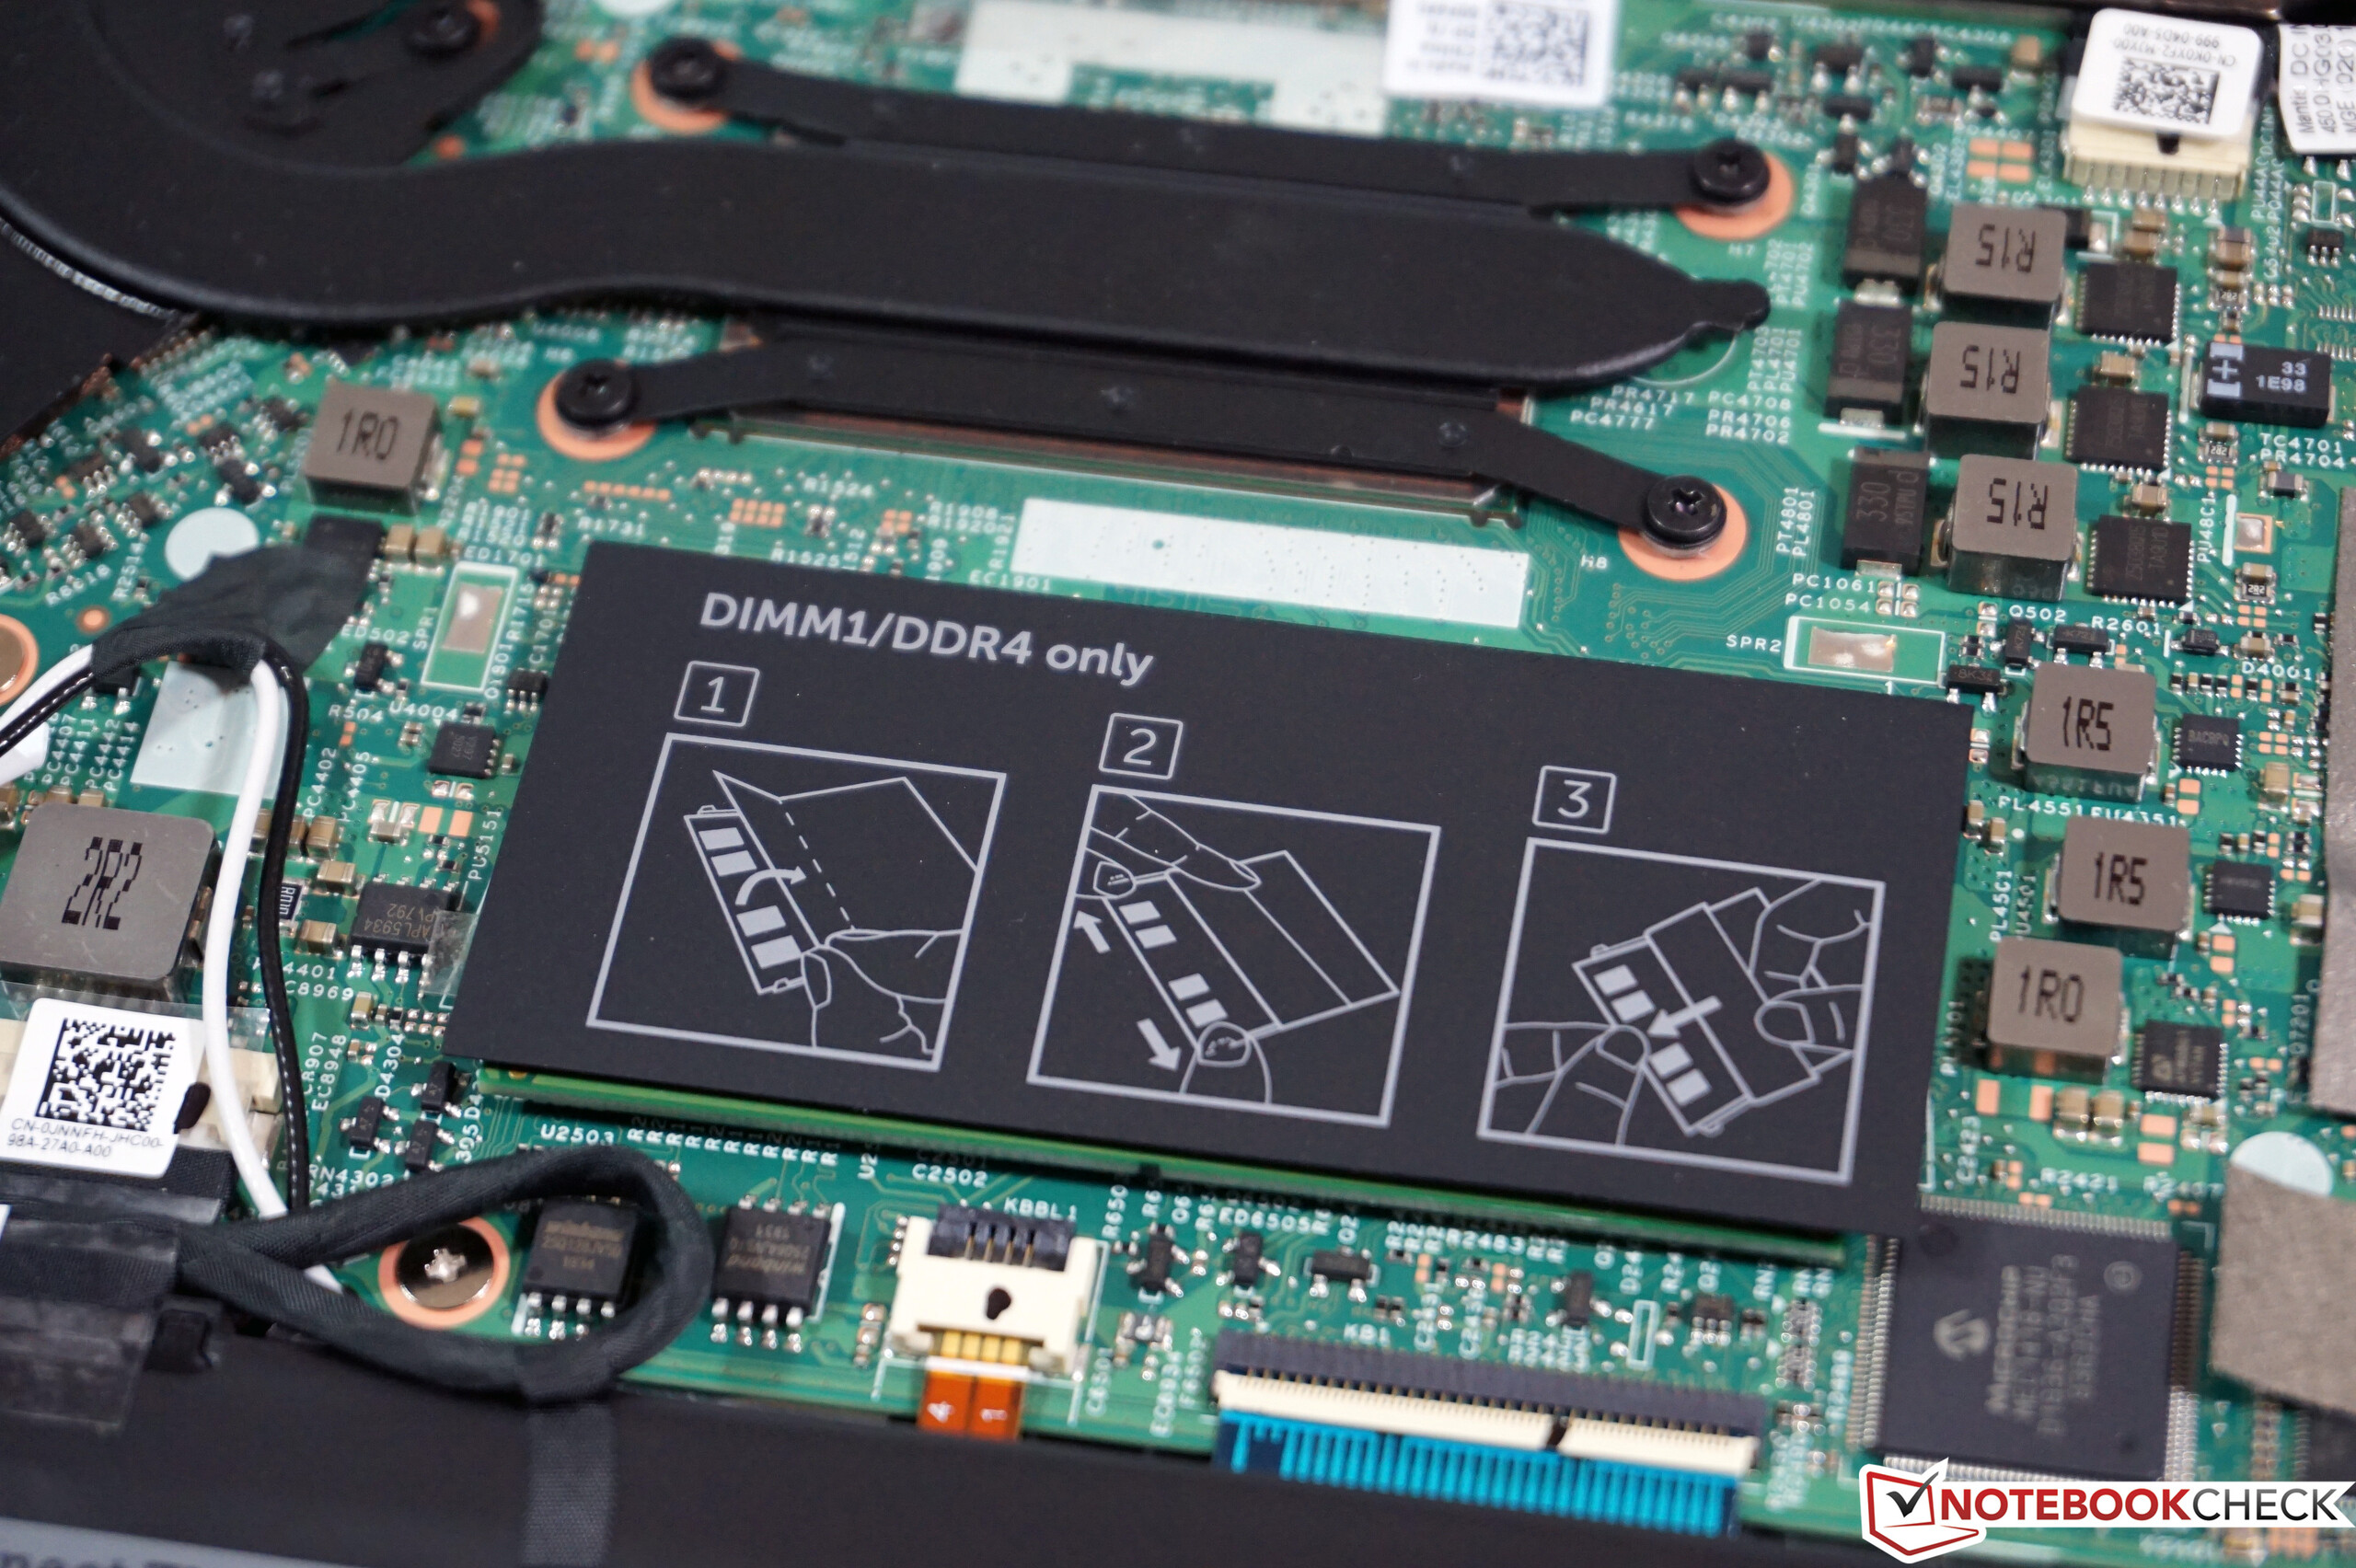
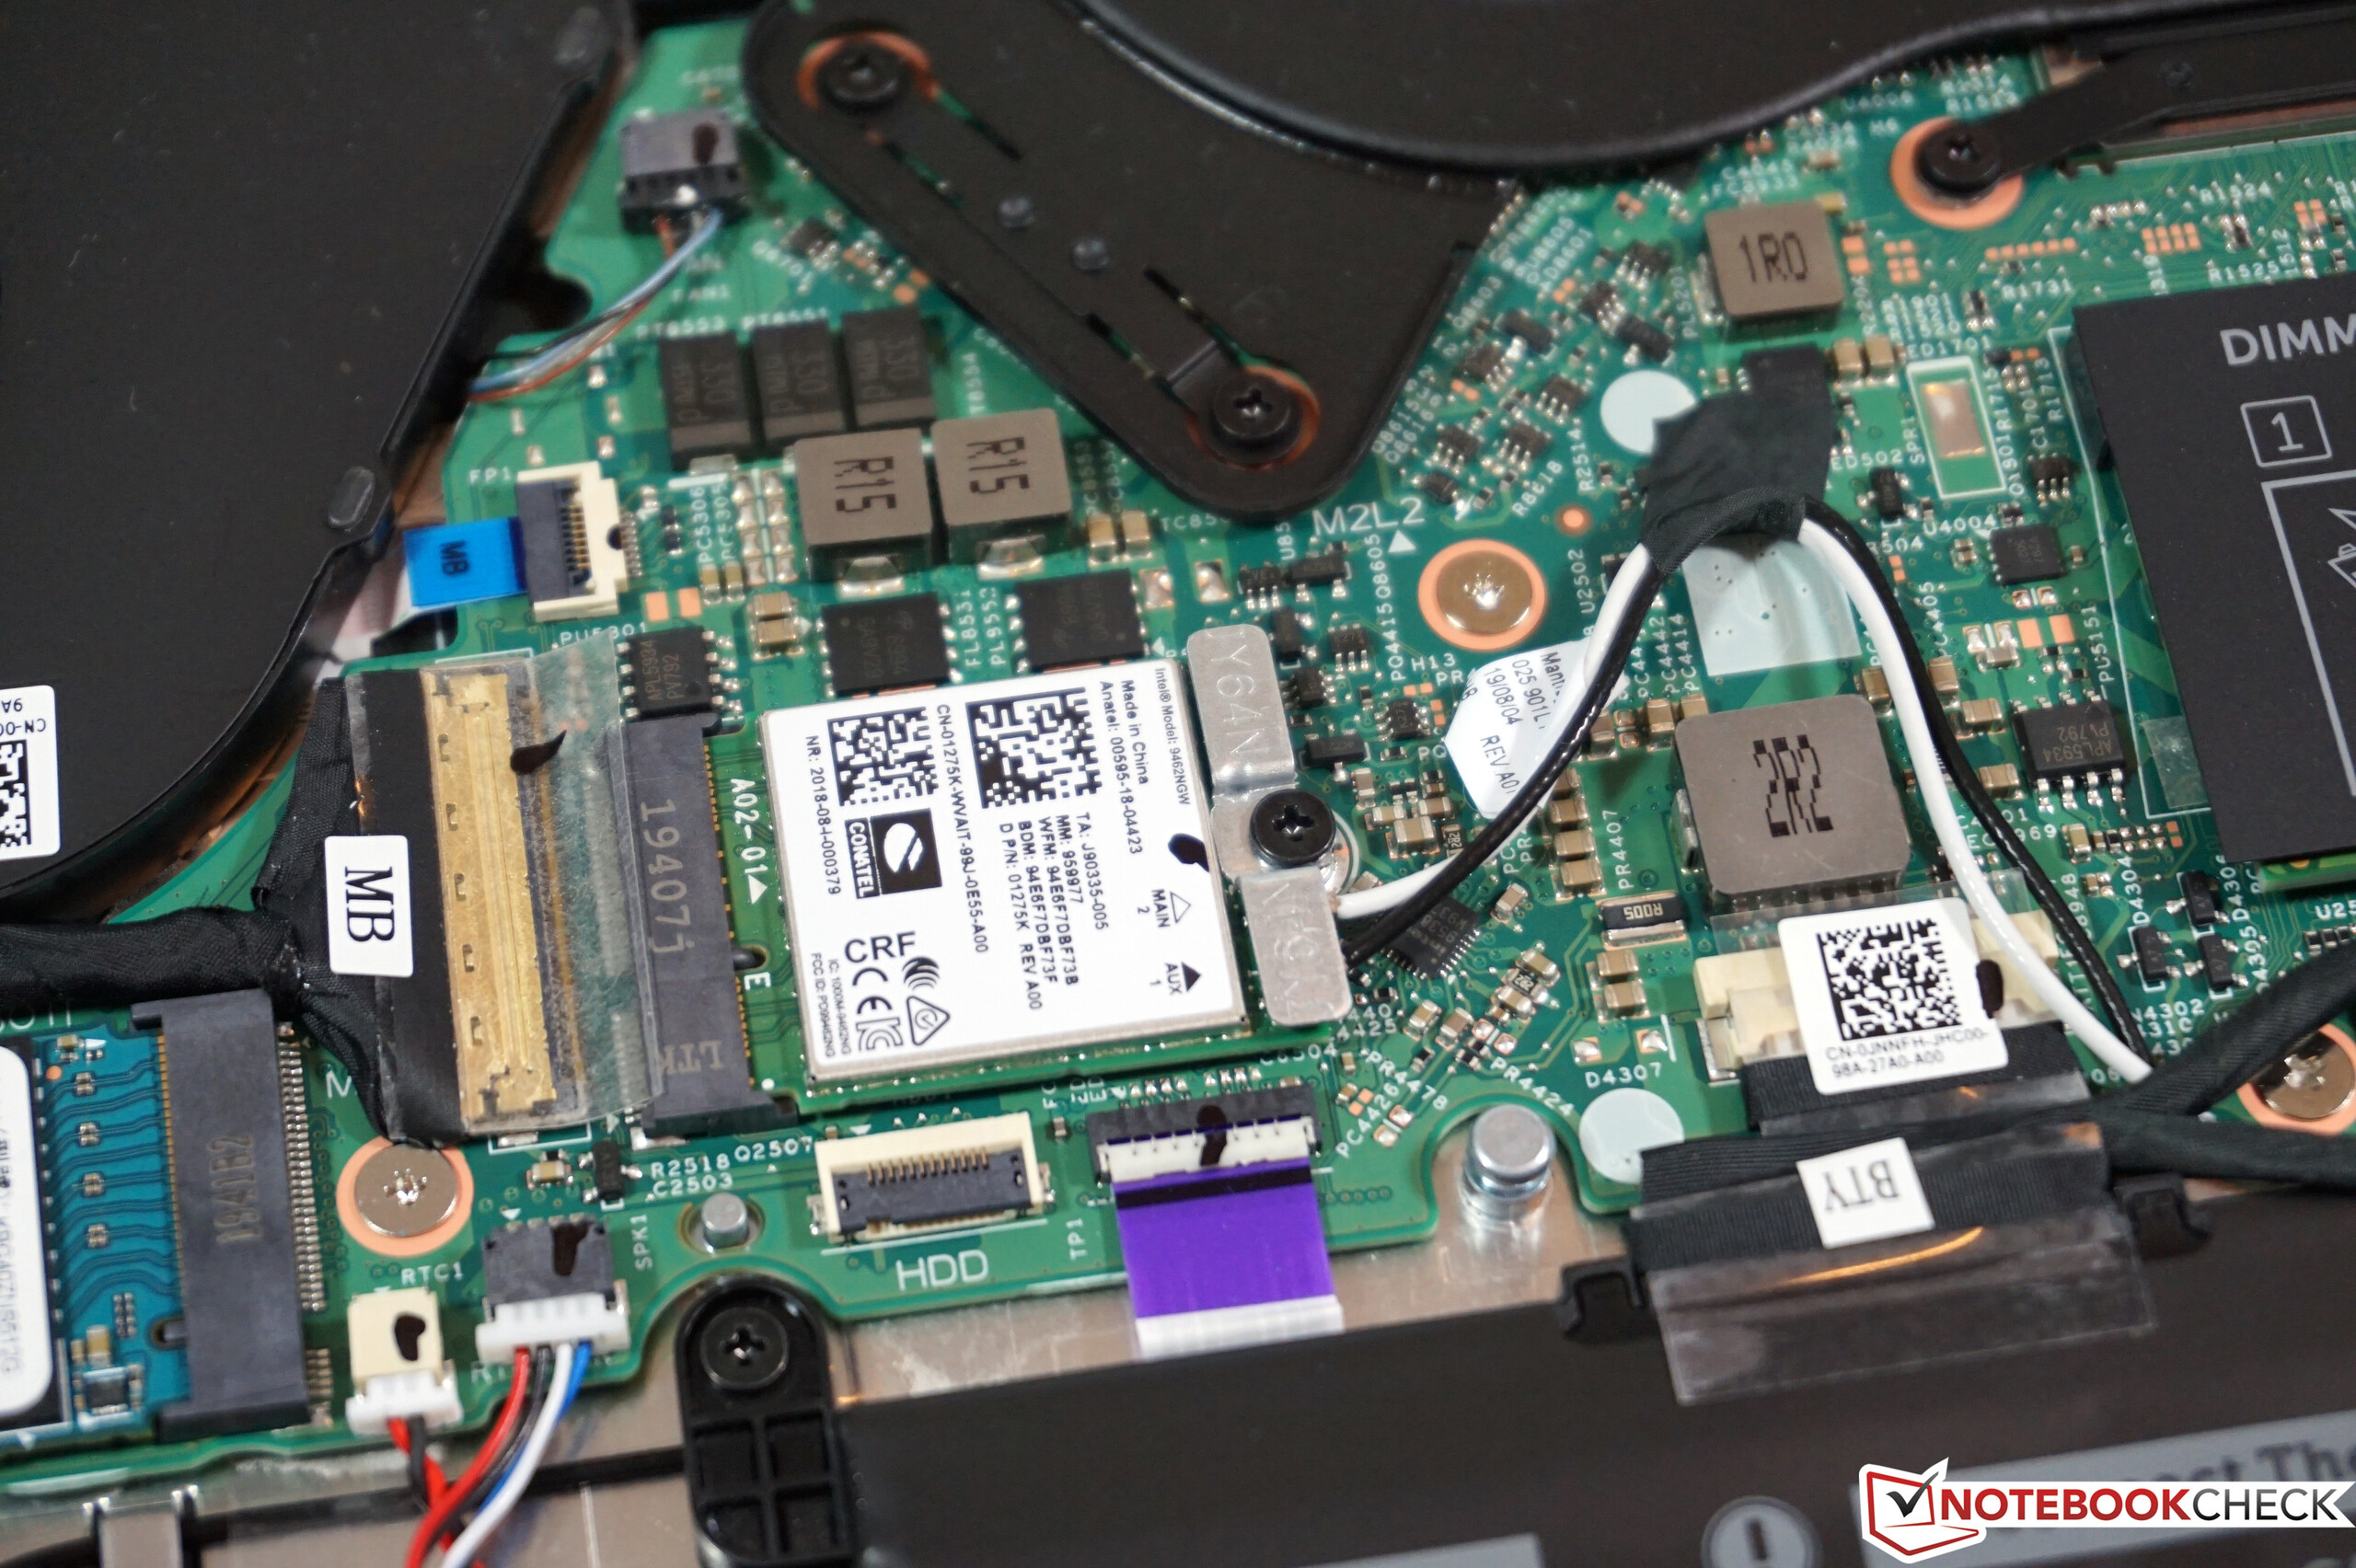
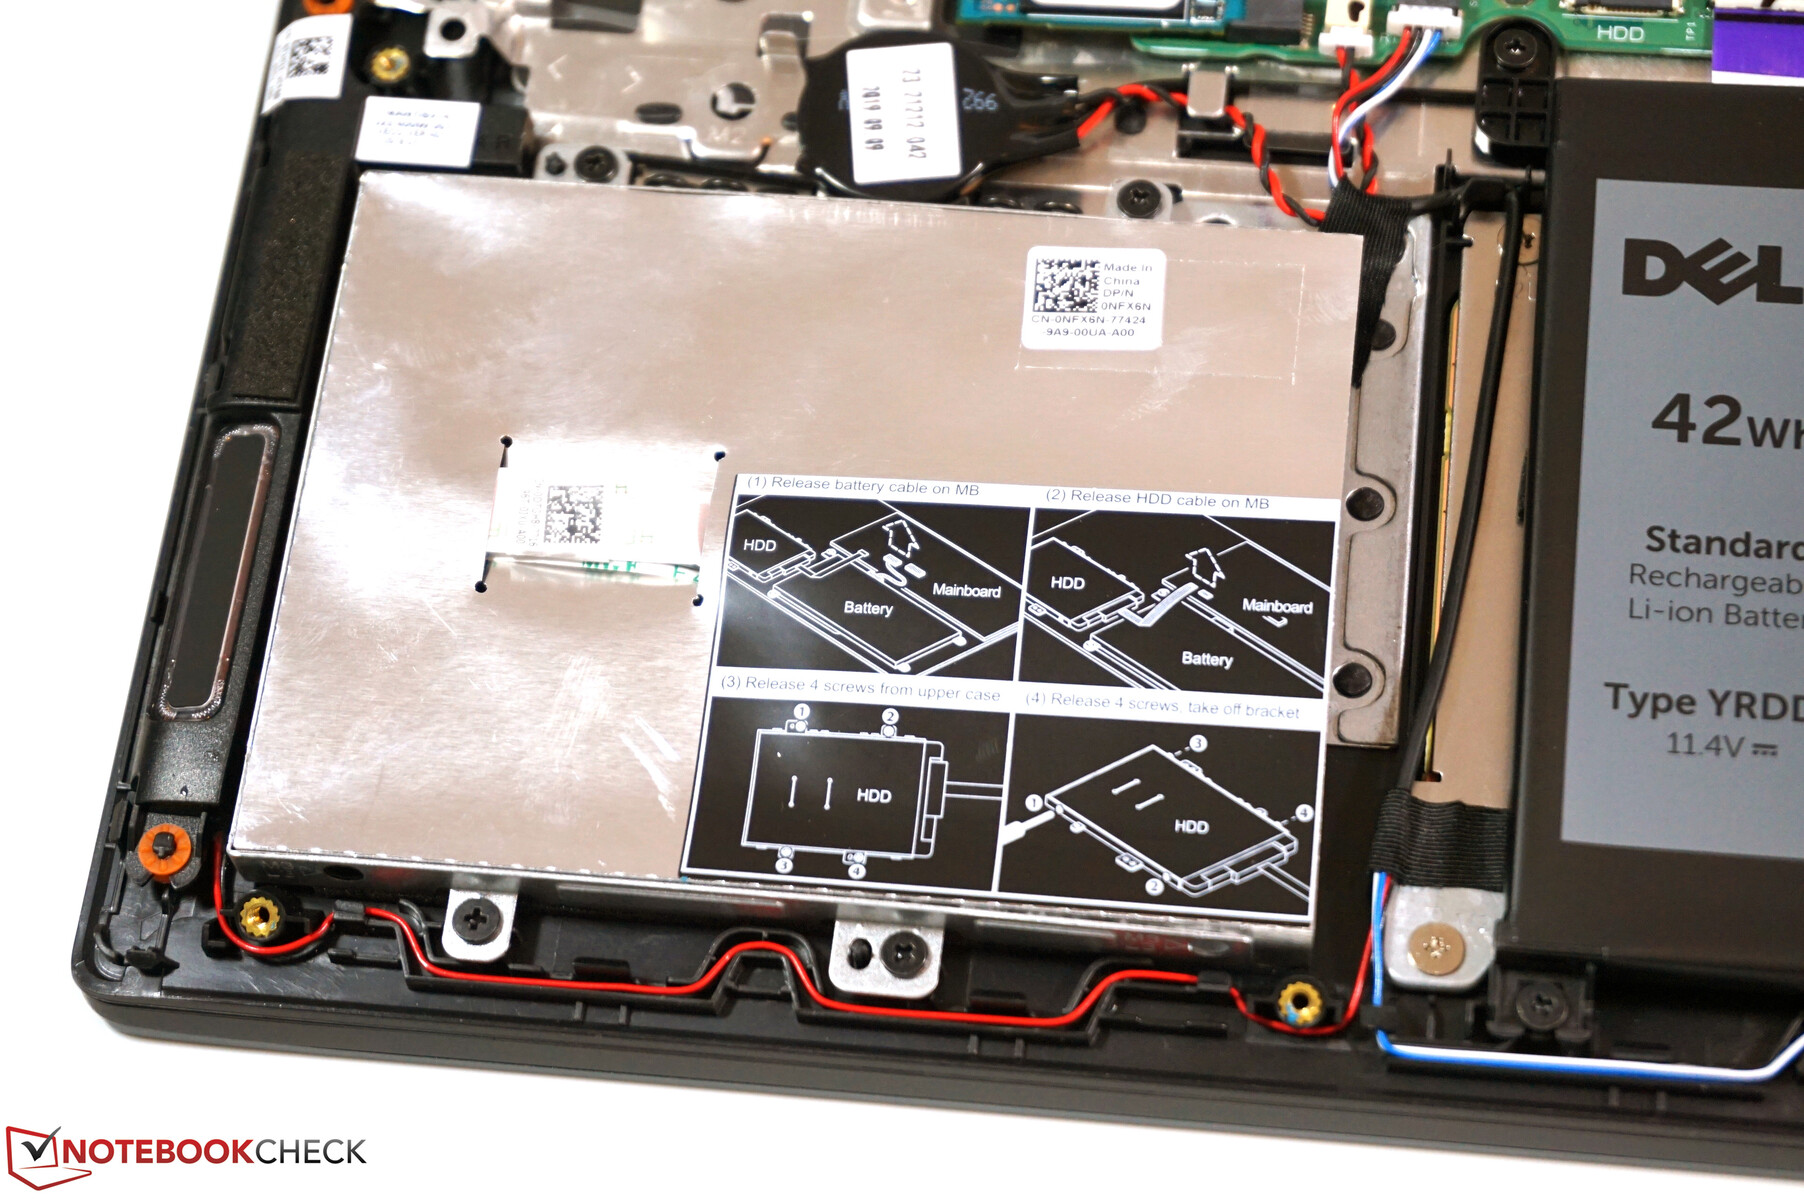
The dark gray case is visually very discreet, but it's very well made and doesn't feel cheap at all. We can't complain about stability in this price range either. The bottom cover is only secured with a few cross-head screws. Besides the RAM modules, you can also access the M.2 2280 SSD as well as a 2.5-inch hard drive. The WLAN module is also only plugged in and can consequently be replaced.
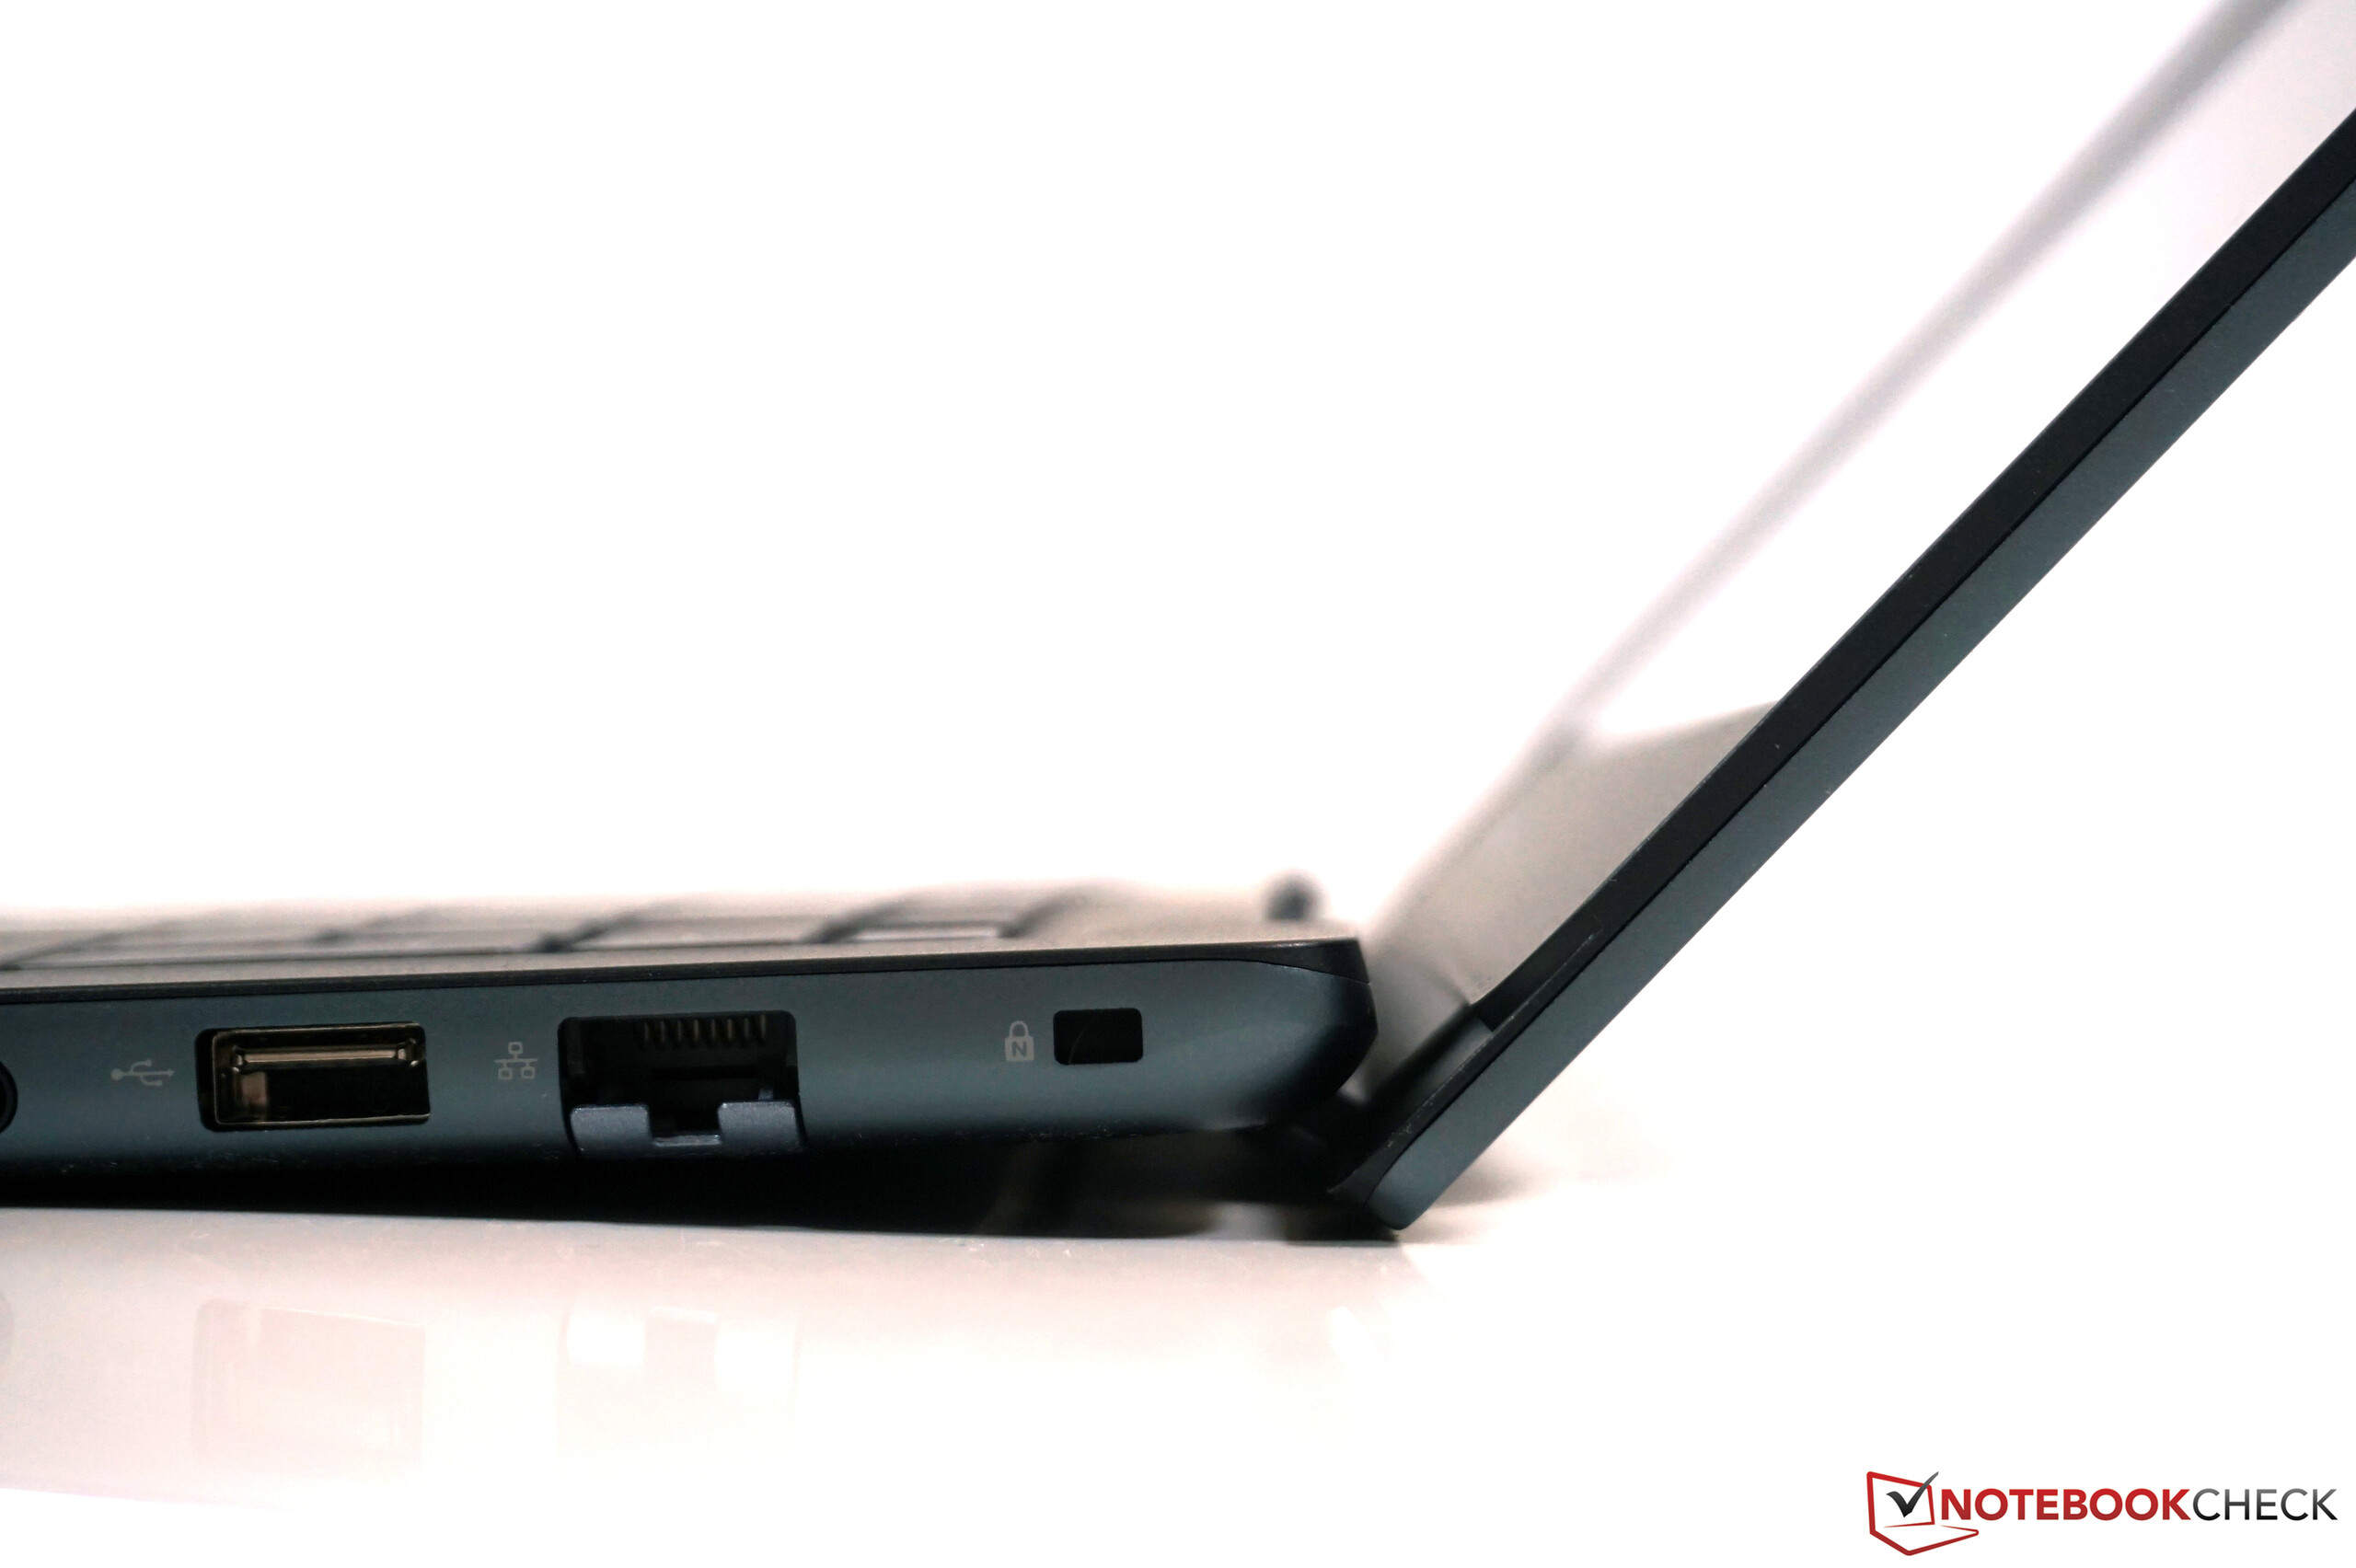
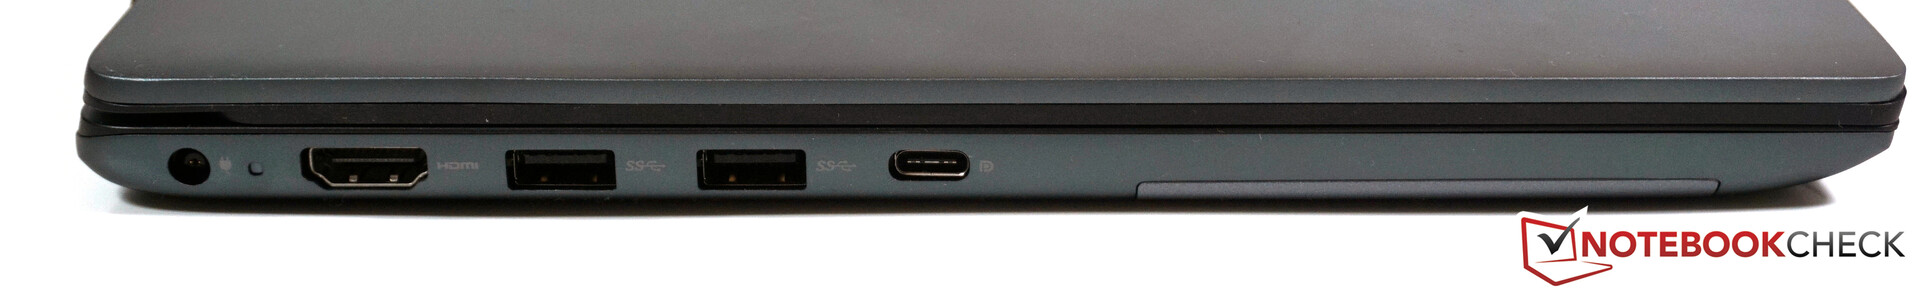
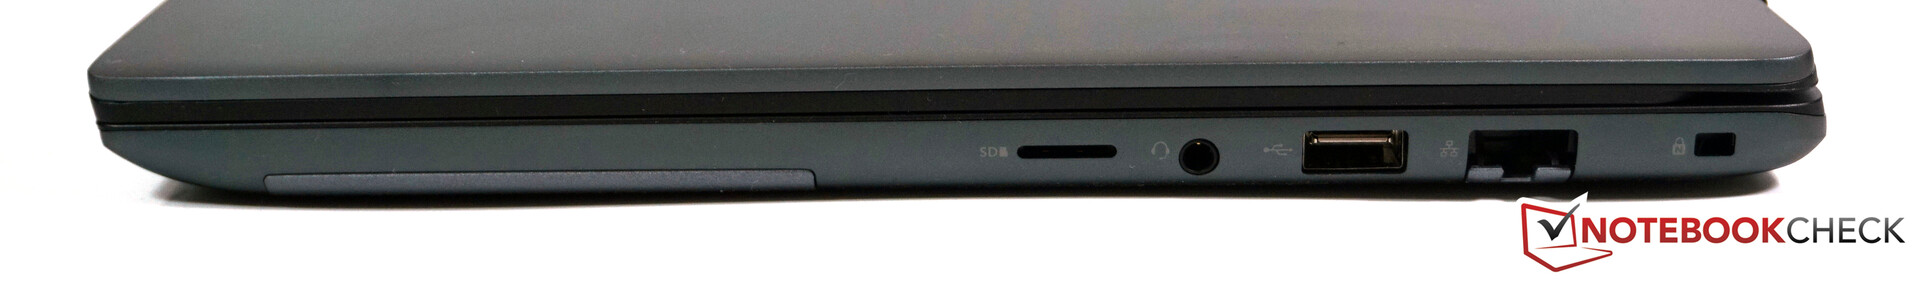
The Vostro 5490 offers many ports including a modern USB-C connector that can also be used for charging or connecting external monitors. However, Thunderbolt 3 is not integrated. Dell has skimped a bit on the WLAN module (1X1) and the microSD reader, because they are very slow.
Port configuration
| SD Card Reader | |
| average JPG Copy Test (av. of 3 runs) | |
| Dell Latitude 14 5410-RJ80D (Toshiba Exceria Pro M501 microSDXC 64GB) | |
| Lenovo ThinkPad L14-20U50003GE (Toshiba Exceria Pro M501 64 GB UHS-II) | |
| HP ProBook 445 G7 175W4EA (Toshiba Exceria Pro SDXC 64 GB UHS-II) | |
| Average of class Office (8 - 82.7, n=49, last 2 years) | |
| Acer TravelMate P6 P614-51T-G2-72ZU (Toshiba Exceria Pro M501 microSDXC 64GB) | |
| Dell Vostro 14 5490 (Toshiba Exceria Pro M501 64 GB UHS-II) | |
| maximum AS SSD Seq Read Test (1GB) | |
| Dell Latitude 14 5410-RJ80D (Toshiba Exceria Pro M501 microSDXC 64GB) | |
| HP ProBook 445 G7 175W4EA (Toshiba Exceria Pro SDXC 64 GB UHS-II) | |
| Lenovo ThinkPad L14-20U50003GE (Toshiba Exceria Pro M501 64 GB UHS-II) | |
| Average of class Office (25 - 90.5, n=43, last 2 years) | |
| Dell Vostro 14 5490 (Toshiba Exceria Pro M501 64 GB UHS-II) | |
| Acer TravelMate P6 P614-51T-G2-72ZU (Toshiba Exceria Pro M501 microSDXC 64GB) | |
Input devices
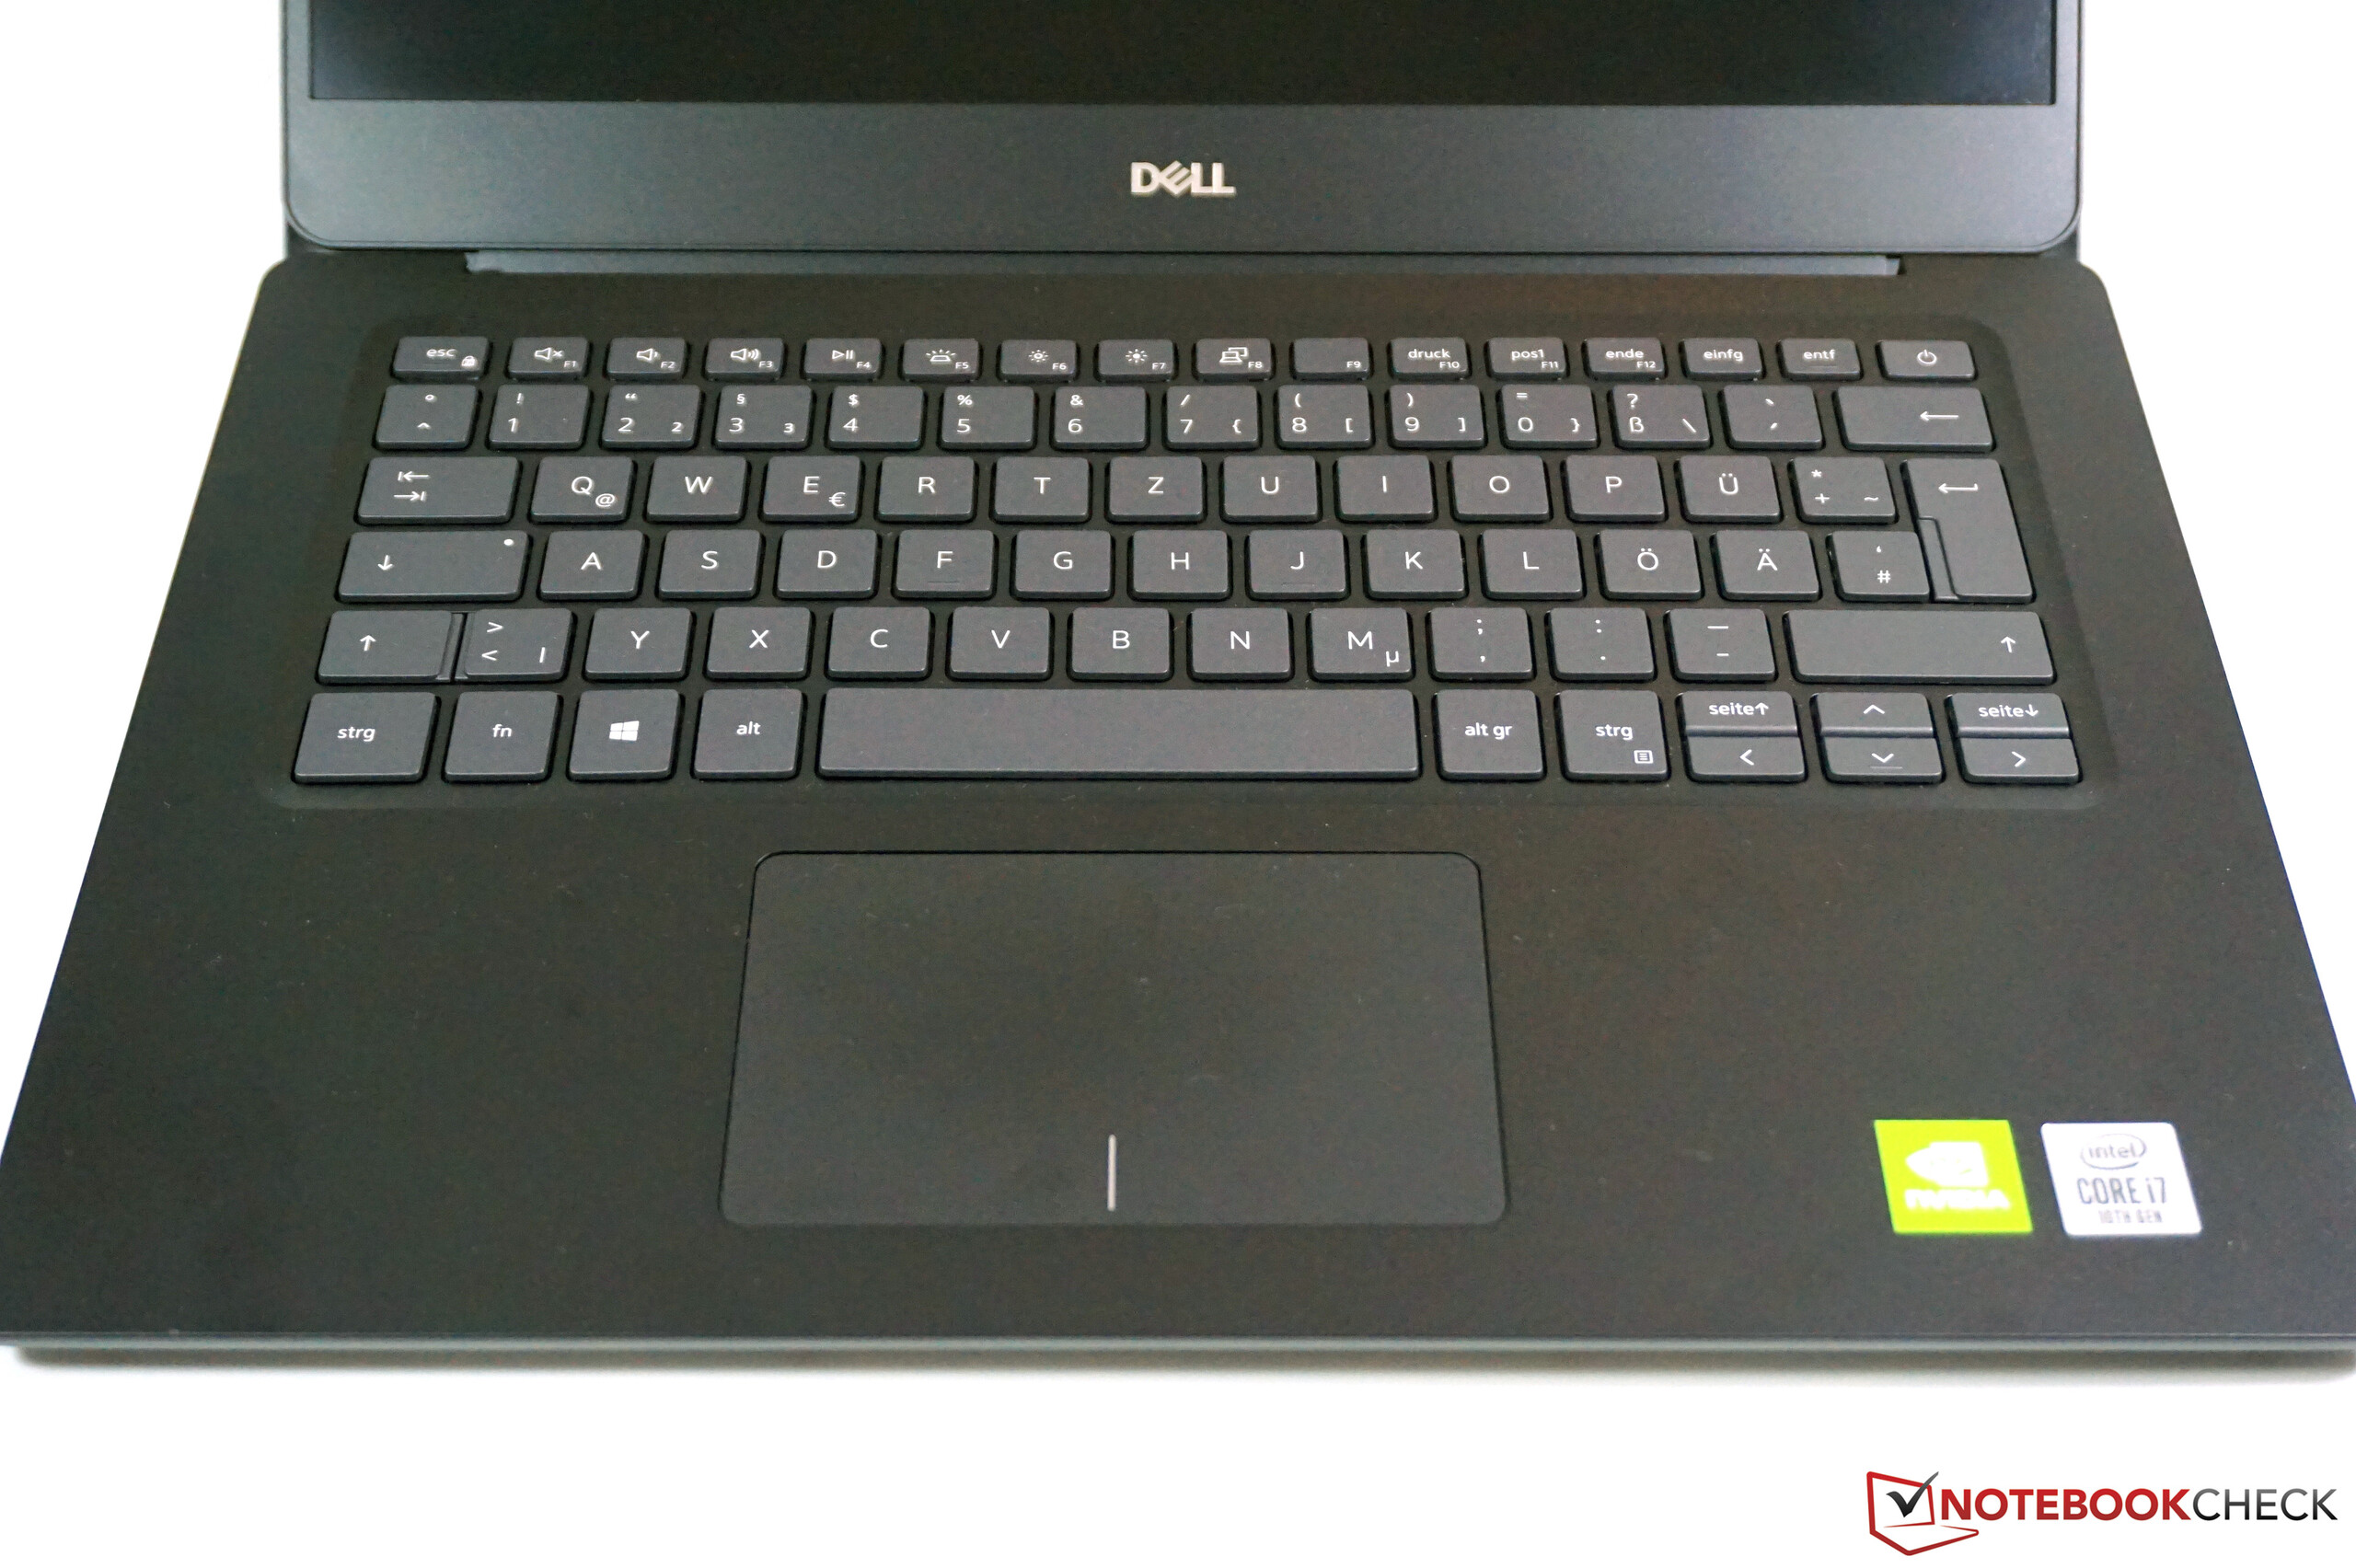
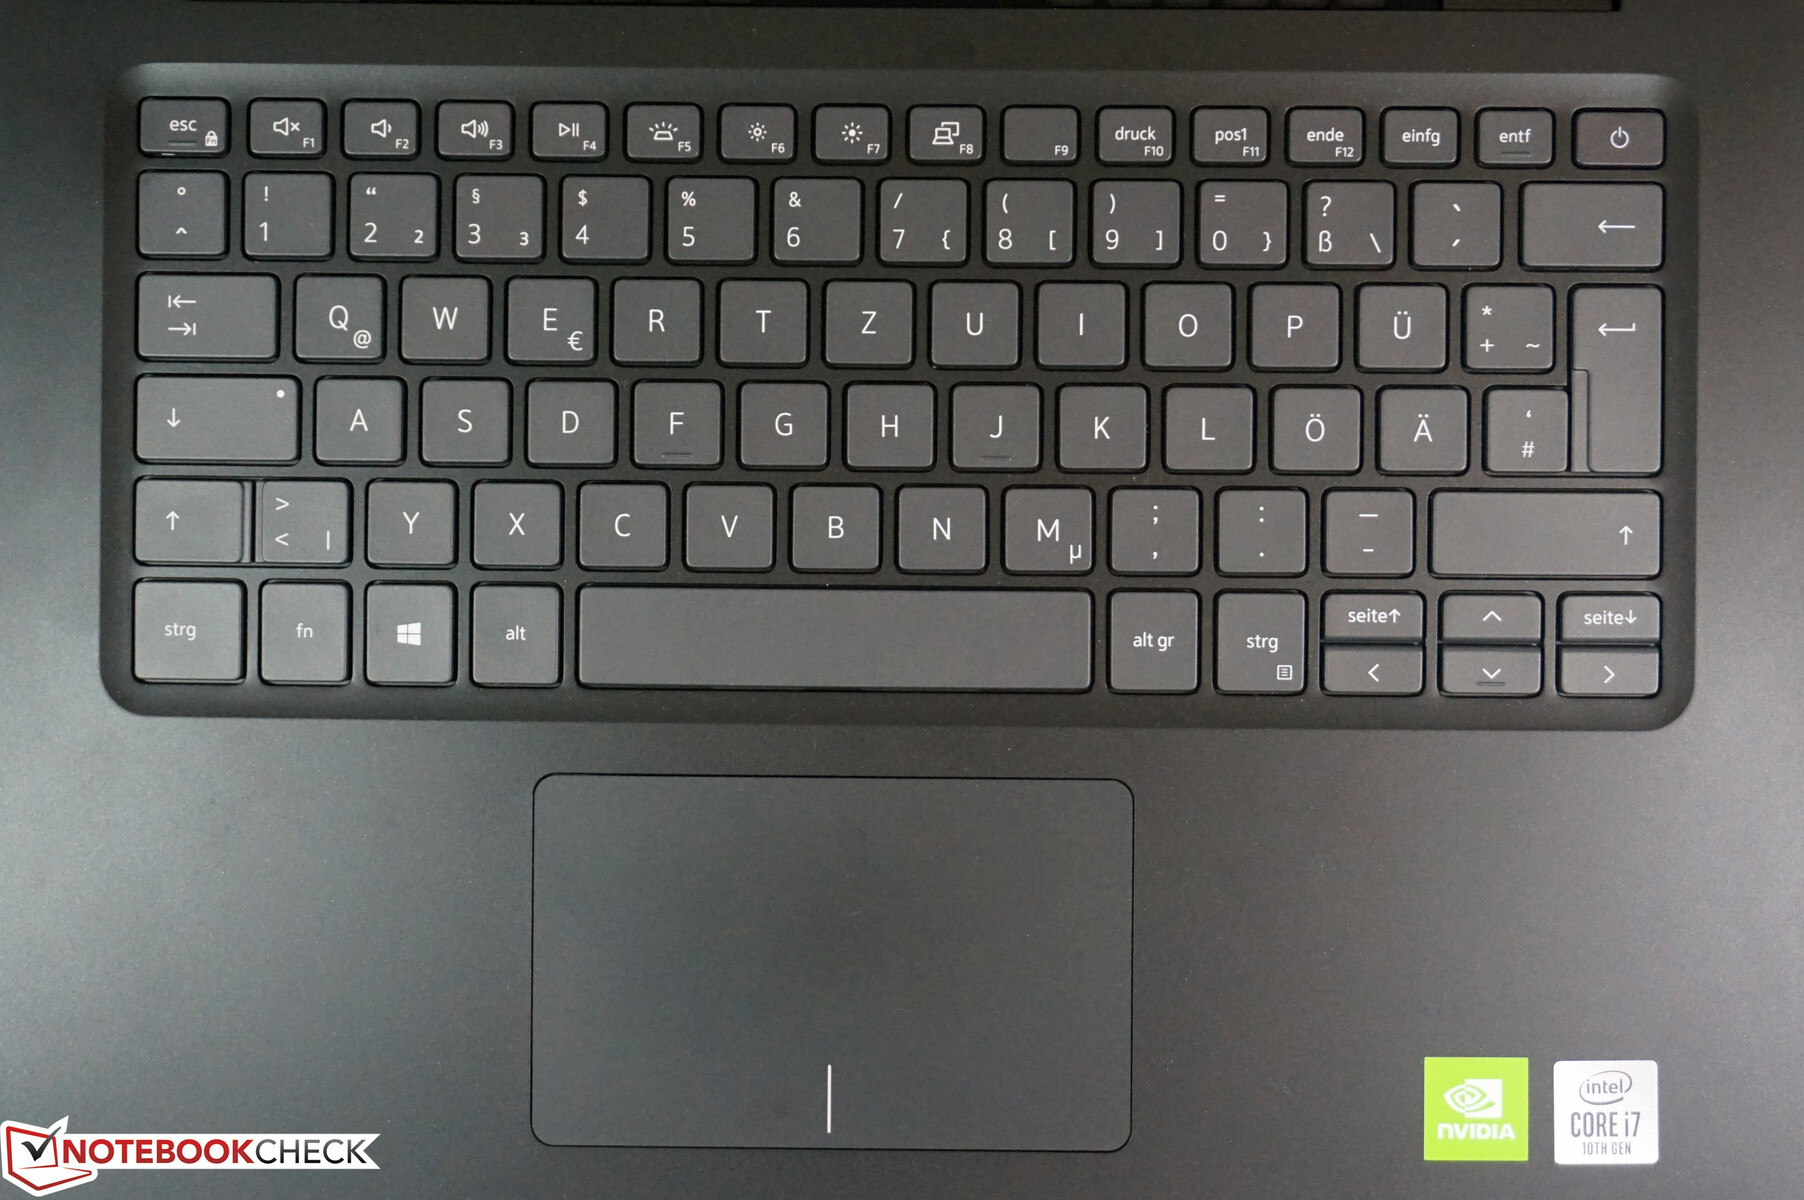
The keyboard of the Vostro 5490 leaves a very decent impression. The keys are sufficiently large (~18 x 18 mm) and offer a pleasant and precise stroke. There are certainly better keyboards, but even longer text can be entered without problems. Only the arrow keys are quite small. There's a three-stage white backlight for dark environments.
Dell doesn't implement a TrackPoint, so only the smooth touchpad is available for cursor movements. The size of 105 x 65 mm is still sufficient, and the ClickPad did not cause any problems during use. Gestures with up to four fingers are also supported (Microsoft Precision Standard).
Display - Vostro with matte IPS panel
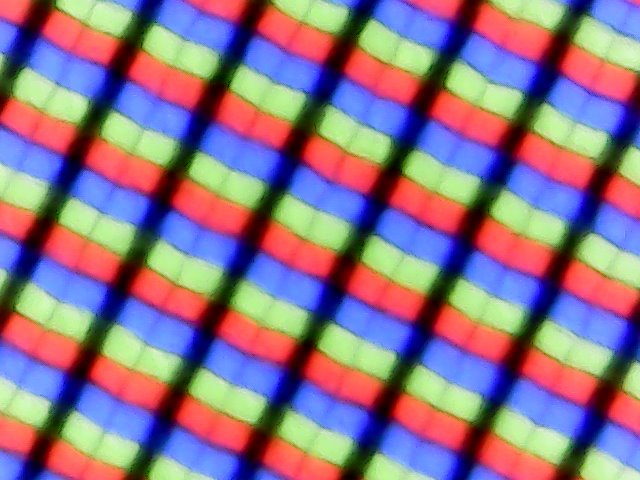
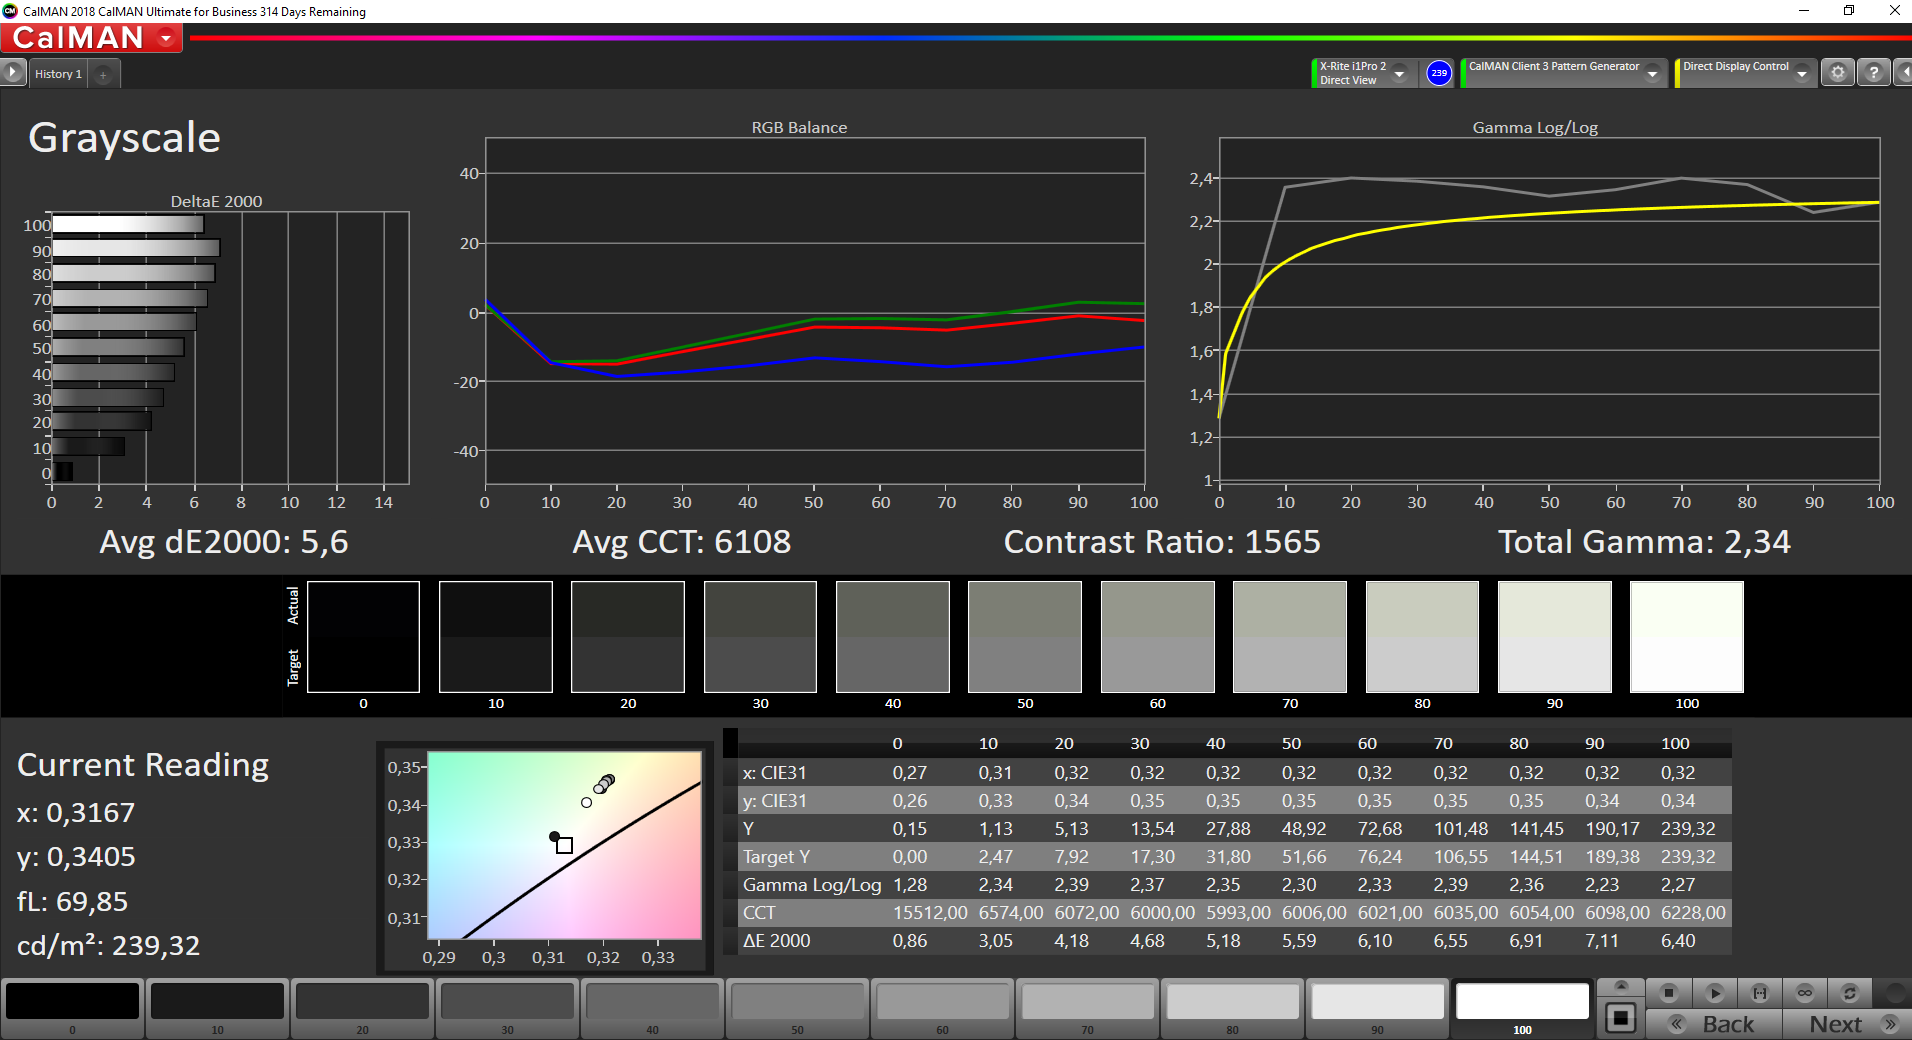
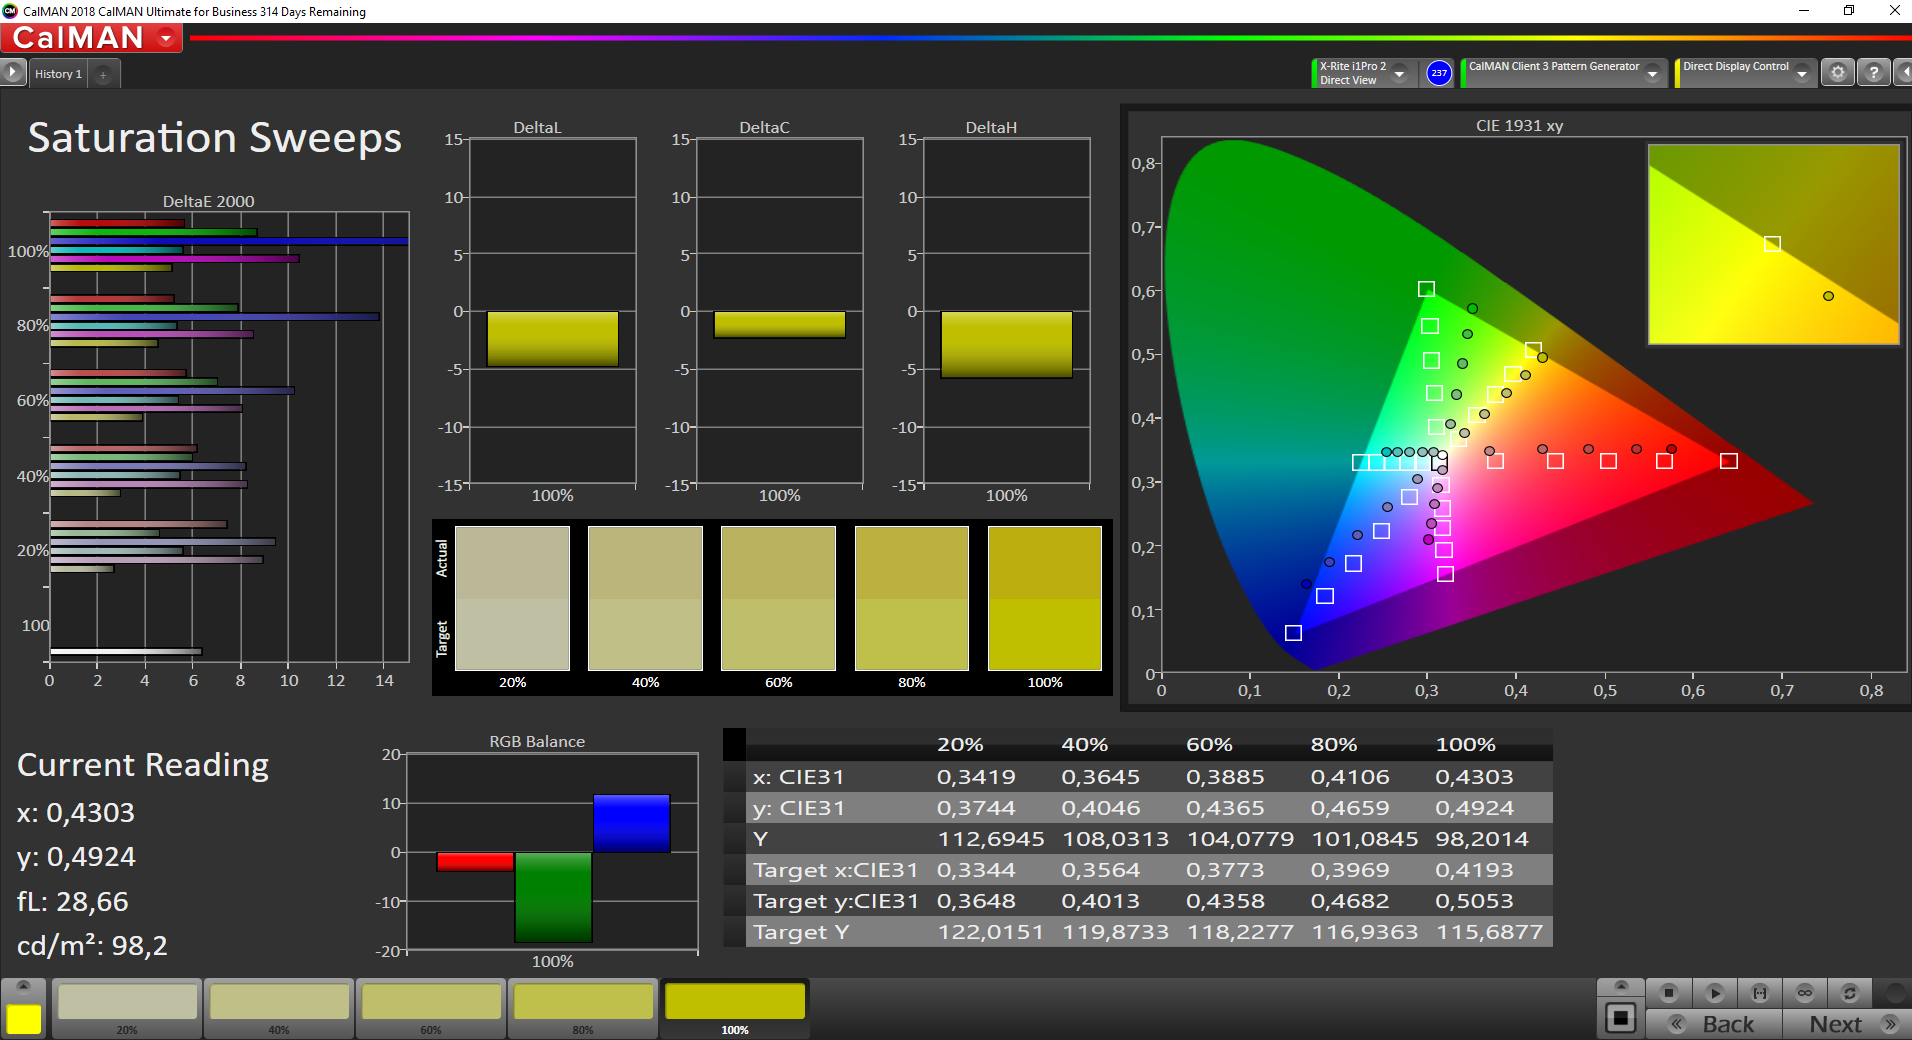
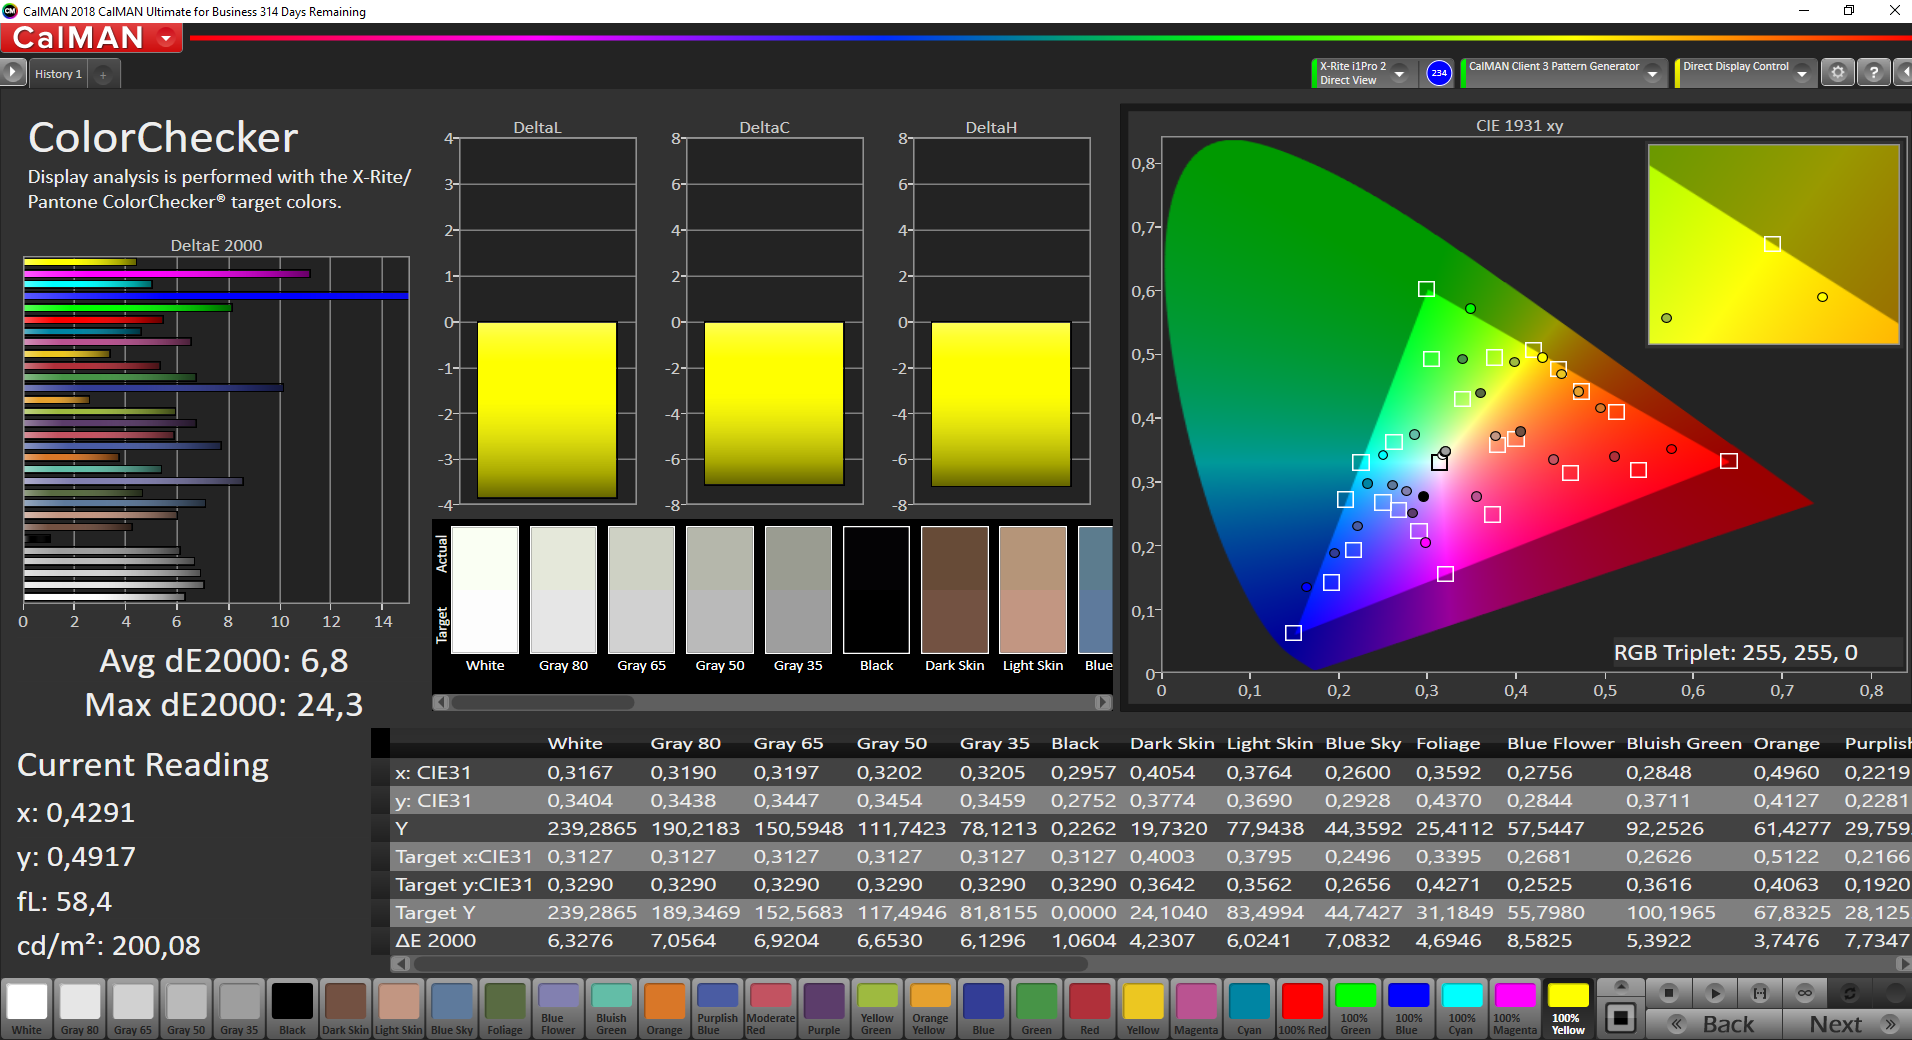
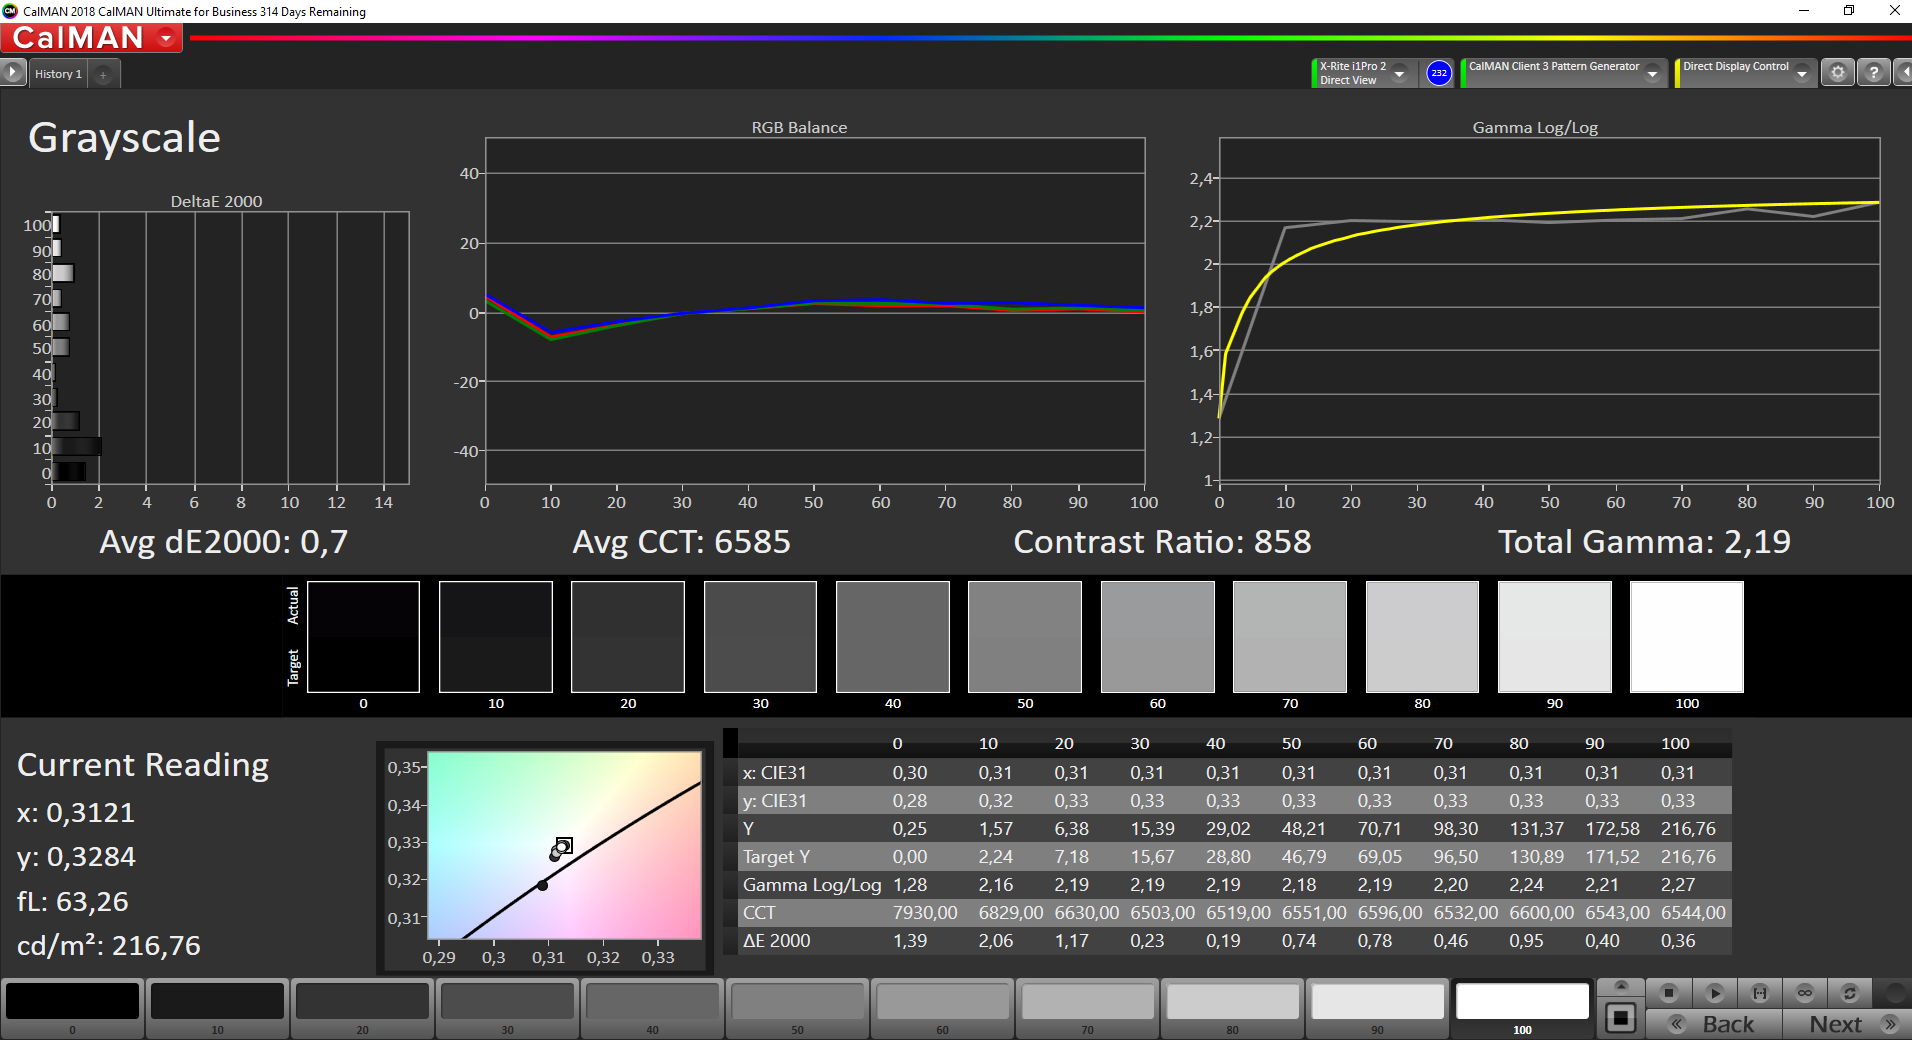
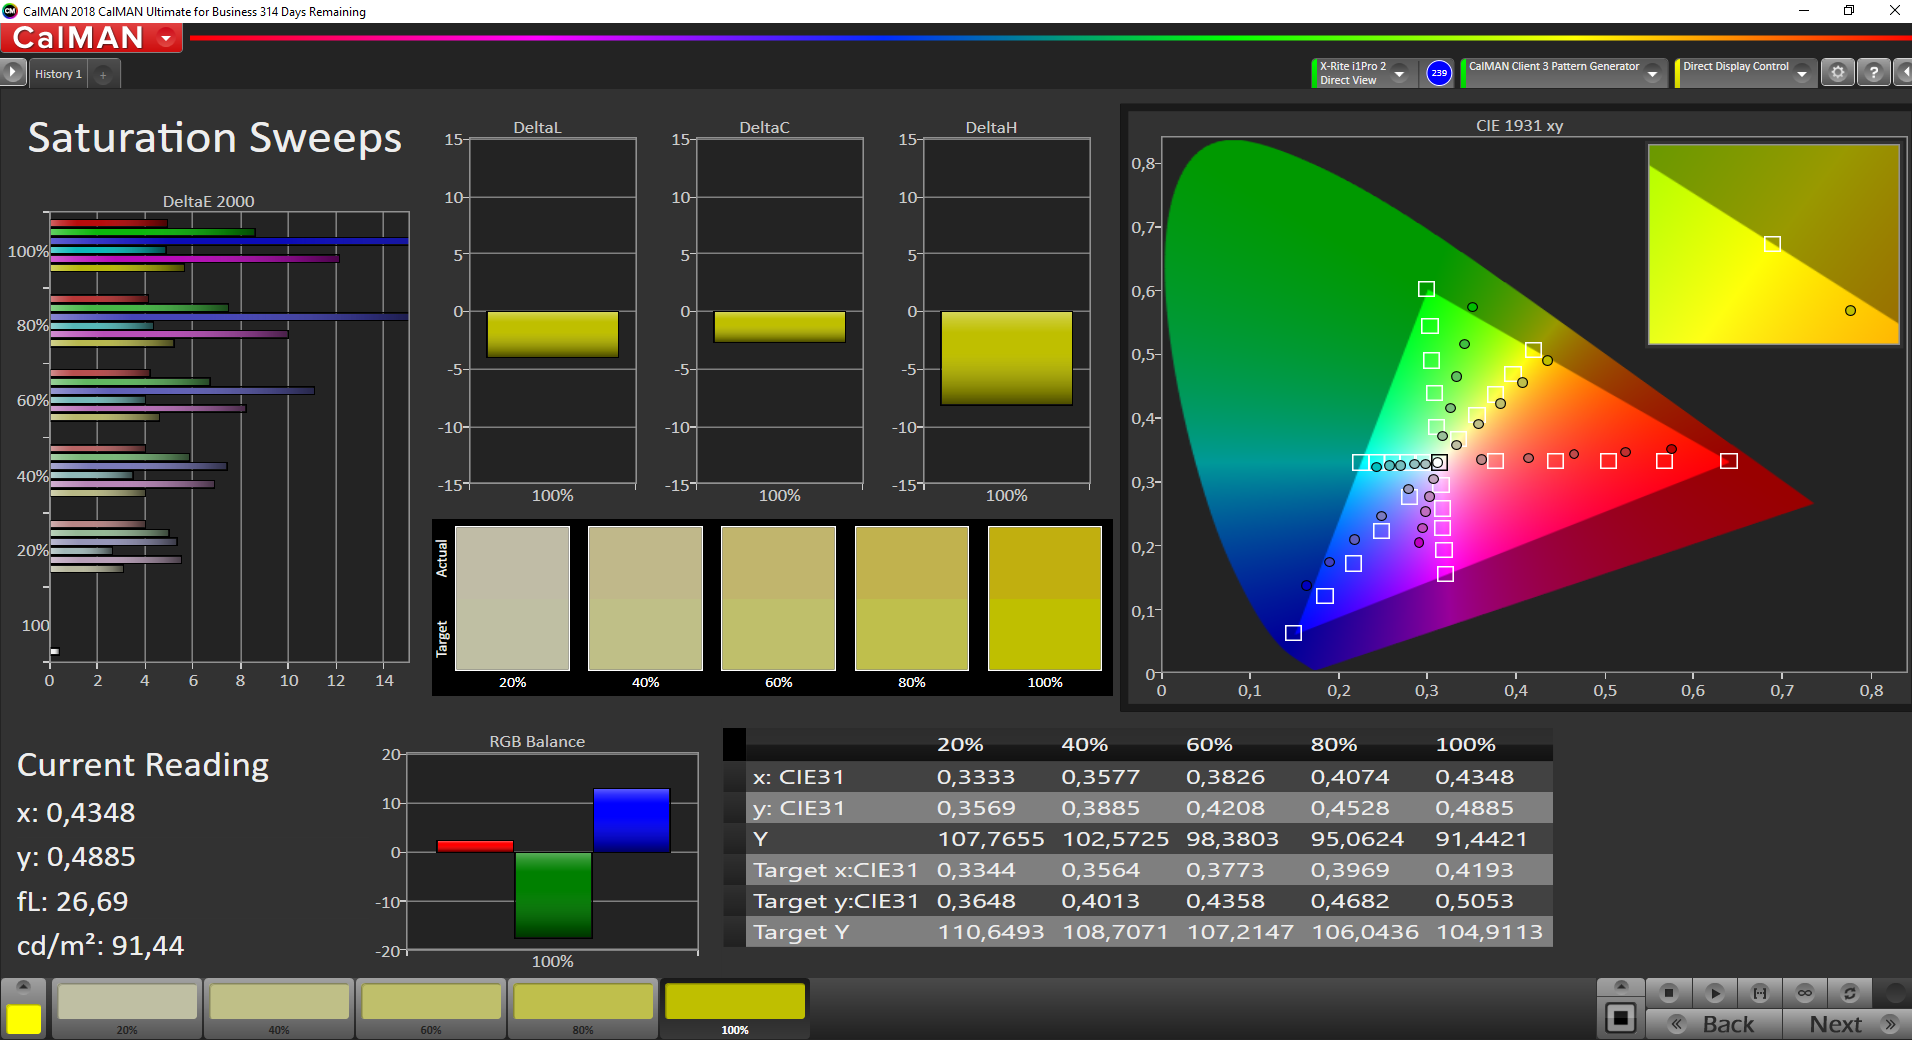
The matte IPS display comes from the AU Optronics supplier and offers Full HD resolution (1920x1080 pixels). As with many other inexpensive office laptops, brightness is the biggest shortcoming. An average of less than 230 cd/m² is not very much, so that you will find yourself wishing for stronger backlighting even in bright indoor environments. In return, however, the black level (0.15) is very low, which leads to a high contrast ratio.
As a result, the subjective image impression is alright, but bright areas look a bit grainy. There is no PWM, and screen bleeding is not an issue in our test device.
| |||||||||||||||||||||||||
Brightness Distribution: 84 %
Center on Battery: 239 cd/m²
Contrast: 1600:1 (Black: 0.15 cd/m²)
ΔE Color 6.8 | 0.5-29.43 Ø5, calibrated: 5.3
ΔE Greyscale 5.6 | 0.57-98 Ø5.3
57% sRGB (Argyll 1.6.3 3D)
36.4% AdobeRGB 1998 (Argyll 1.6.3 3D)
39.68% AdobeRGB 1998 (Argyll 2.2.0 3D)
57.4% sRGB (Argyll 2.2.0 3D)
38.4% Display P3 (Argyll 2.2.0 3D)
Gamma: 2.34
| Dell Vostro 14 5490 B140HAN, LED, 1920x1080, 14.00 | Lenovo ThinkPad L14-20U50003GE N140HCA-EAC, IPS, 1920x1080, 14.00 | HP ProBook 445 G7 175W4EA BOE0868, IPS, 1920x1080, 14.00 | Acer TravelMate P6 P614-51T-G2-72ZU AU Optronics B140HAK02.5, IPS, 1920x1080, 14.00 | Dell Latitude 14 5410-RJ80D BOE NV14N4F, a-Si IPS LED, 1920x1080, 14.00 | |
|---|---|---|---|---|---|
| Display | 9% | 4% | 72% | 2% | |
| Display P3 Coverage | 38.4 | 41.96 9% | 39.92 4% | 69.2 80% | 39.02 2% |
| sRGB Coverage | 57.4 | 63 10% | 59.6 4% | 93.7 63% | 58 1% |
| AdobeRGB 1998 Coverage | 39.68 | 43.37 9% | 41.25 4% | 68.6 73% | 40.32 2% |
| Response Times | 4% | 6% | 16% | -5% | |
| Response Time Grey 50% / Grey 80% * | 48 ? | 42 ? 12% | 40 ? 17% | 37 ? 23% | 46 ? 4% |
| Response Time Black / White * | 28.4 ? | 29.6 ? -4% | 30 ? -6% | 26 ? 8% | 32 ? -13% |
| PWM Frequency | 192 ? | 1000 ? | |||
| Screen | 13% | -0% | 23% | -3% | |
| Brightness middle | 240 | 259 8% | 277 15% | 323 35% | 235 -2% |
| Brightness | 228 | 244 7% | 270 18% | 308 35% | 219 -4% |
| Brightness Distribution | 84 | 92 10% | 88 5% | 90 7% | 81 -4% |
| Black Level * | 0.15 | 0.21 -40% | 0.285 -90% | 0.35 -133% | 0.21 -40% |
| Contrast | 1600 | 1233 -23% | 972 -39% | 923 -42% | 1119 -30% |
| Colorchecker dE 2000 * | 6.8 | 4.3 37% | 5.53 19% | 3.07 55% | 6.11 10% |
| Colorchecker dE 2000 max. * | 24.3 | 17.7 27% | 10.68 56% | 5.8 76% | 16.6 32% |
| Colorchecker dE 2000 calibrated * | 5.3 | 3.8 28% | 4.43 16% | 3.07 42% | |
| Greyscale dE 2000 * | 5.6 | 1.5 73% | 6.2 -11% | 2.99 47% | 5.52 1% |
| Gamma | 2.34 94% | 2.04 108% | 2.34 94% | 2.32 95% | 2.33 94% |
| CCT | 6108 106% | 6609 98% | 7342 89% | 6097 107% | 6680 97% |
| Color Space (Percent of AdobeRGB 1998) | 36.4 | 40 10% | 38 4% | 61 68% | 37 2% |
| Color Space (Percent of sRGB) | 57 | 62.9 10% | 59 4% | 93 63% | 58 2% |
| Total Average (Program / Settings) | 9% /
11% | 3% /
1% | 37% /
31% | -2% /
-2% |
* ... smaller is better
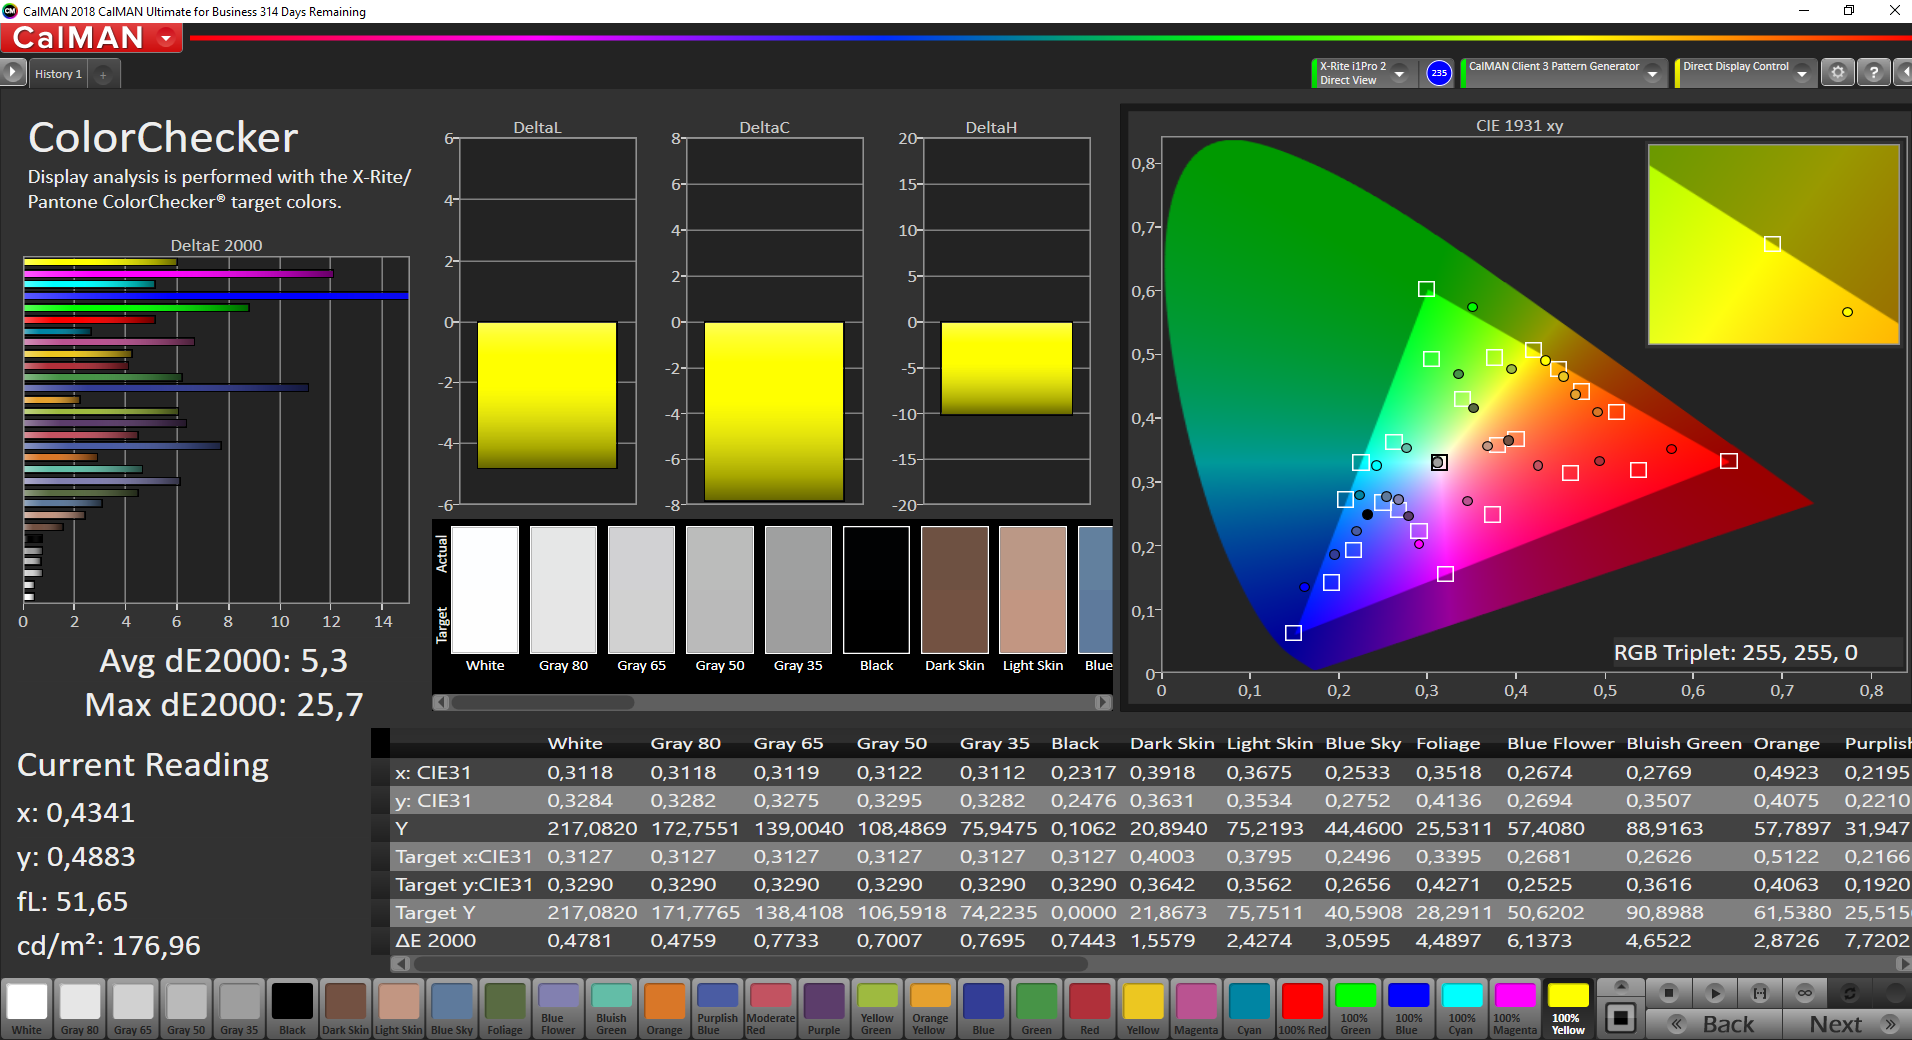
We use the professional CalMAN software in combination with the X-Rite i1 Pro 2 spectrophotometer to analyze the display. Out of the box, there's a minimal color tint towards yellow, but it's hardly noticeable. However, this can be improved significantly with our calibration, just like the deviations of the grayscales. What can't be improved, however, are the high color deviations. This display simply can't reproduce colors more accurately. Nevertheless, this is also a low-priced business laptop where image-editing using the internal display is not a priority. In addition, only 57% of the small sRGB color space is covered as well.
Display Response Times
| ↔ Response Time Black to White | ||
|---|---|---|
| 28.4 ms ... rise ↗ and fall ↘ combined | ↗ 15.6 ms rise | 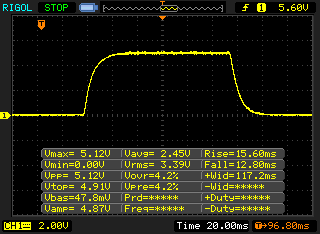 |
| ↘ 12.8 ms fall | ||
| The screen shows relatively slow response rates in our tests and may be too slow for gamers. In comparison, all tested devices range from 0.1 (minimum) to 240 (maximum) ms. » 72 % of all devices are better. This means that the measured response time is worse than the average of all tested devices (21.5 ms). | ||
| ↔ Response Time 50% Grey to 80% Grey | ||
| 48 ms ... rise ↗ and fall ↘ combined | ↗ 23.6 ms rise | 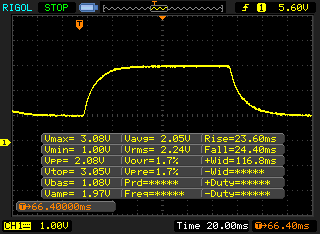 |
| ↘ 24.4 ms fall | ||
| The screen shows slow response rates in our tests and will be unsatisfactory for gamers. In comparison, all tested devices range from 0.2 (minimum) to 636 (maximum) ms. » 80 % of all devices are better. This means that the measured response time is worse than the average of all tested devices (33.7 ms). | ||
Screen Flickering / PWM (Pulse-Width Modulation)
| Screen flickering / PWM not detected | 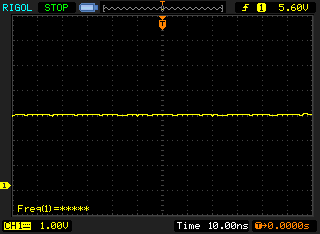 | ||
In comparison: 53 % of all tested devices do not use PWM to dim the display. If PWM was detected, an average of 17900 (minimum: 5 - maximum: 3846000) Hz was measured. | |||
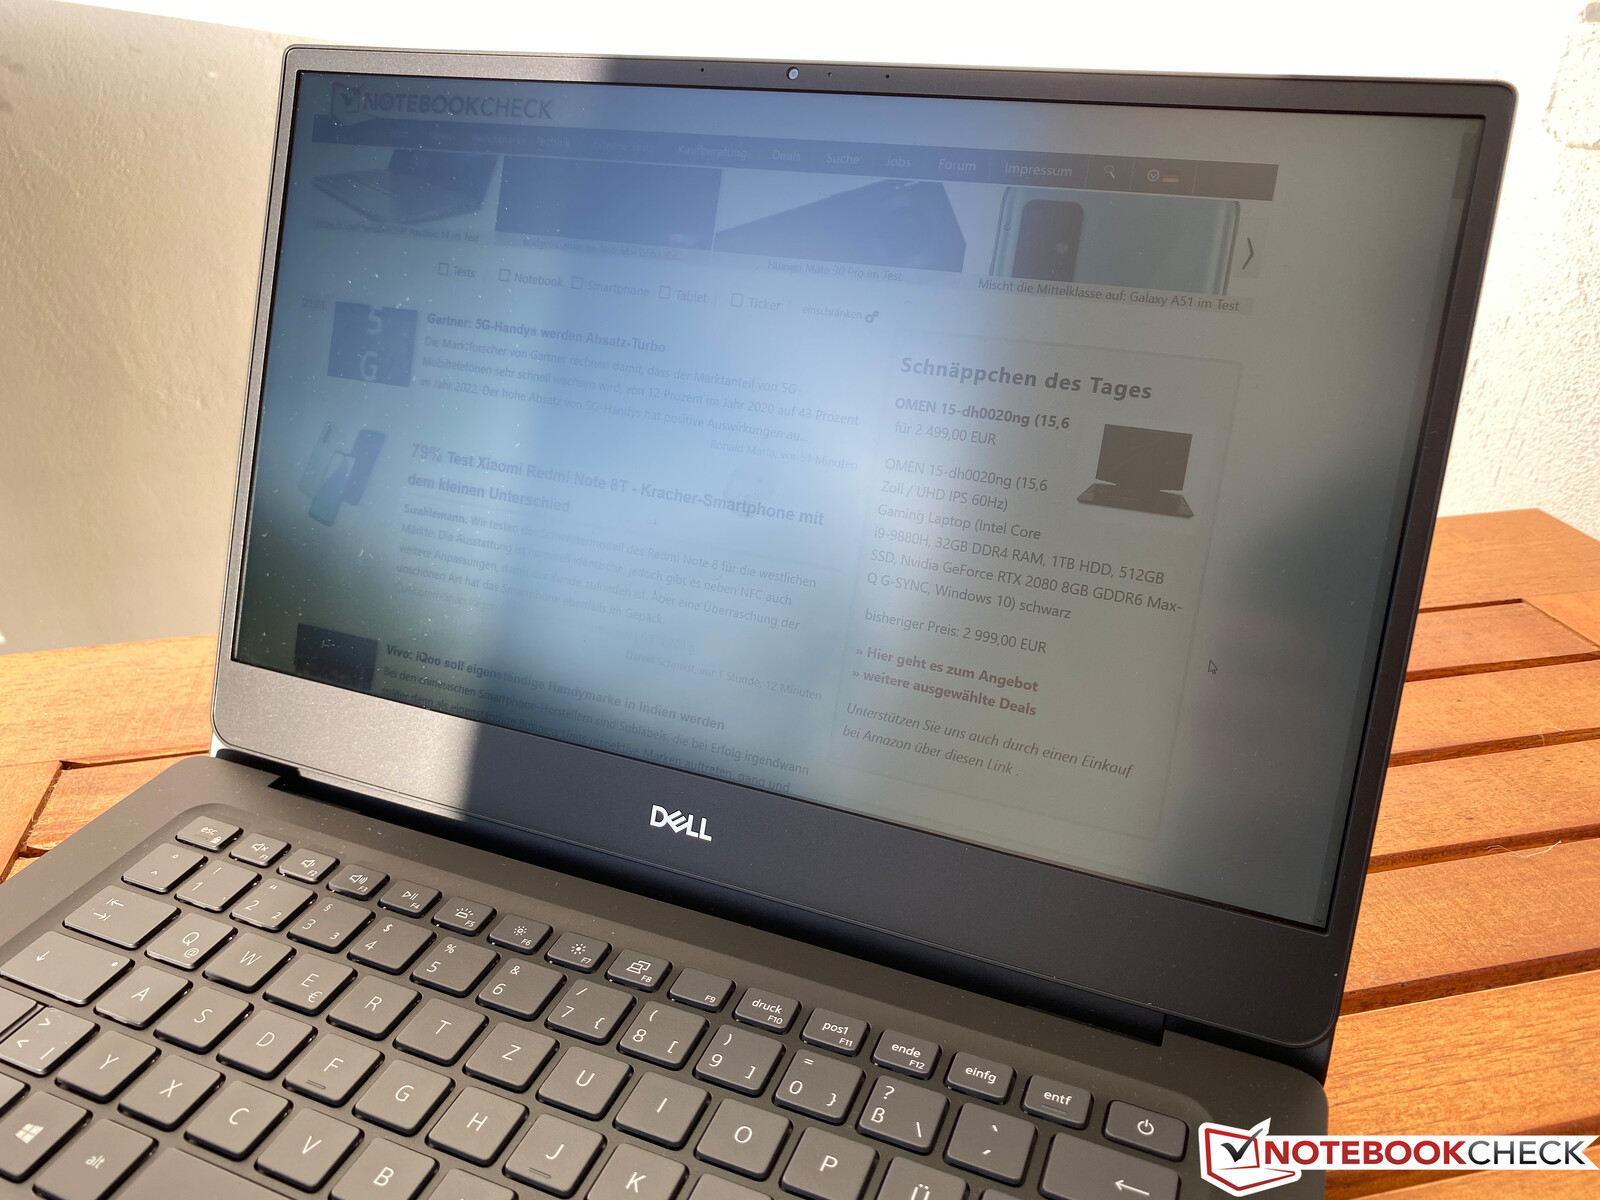
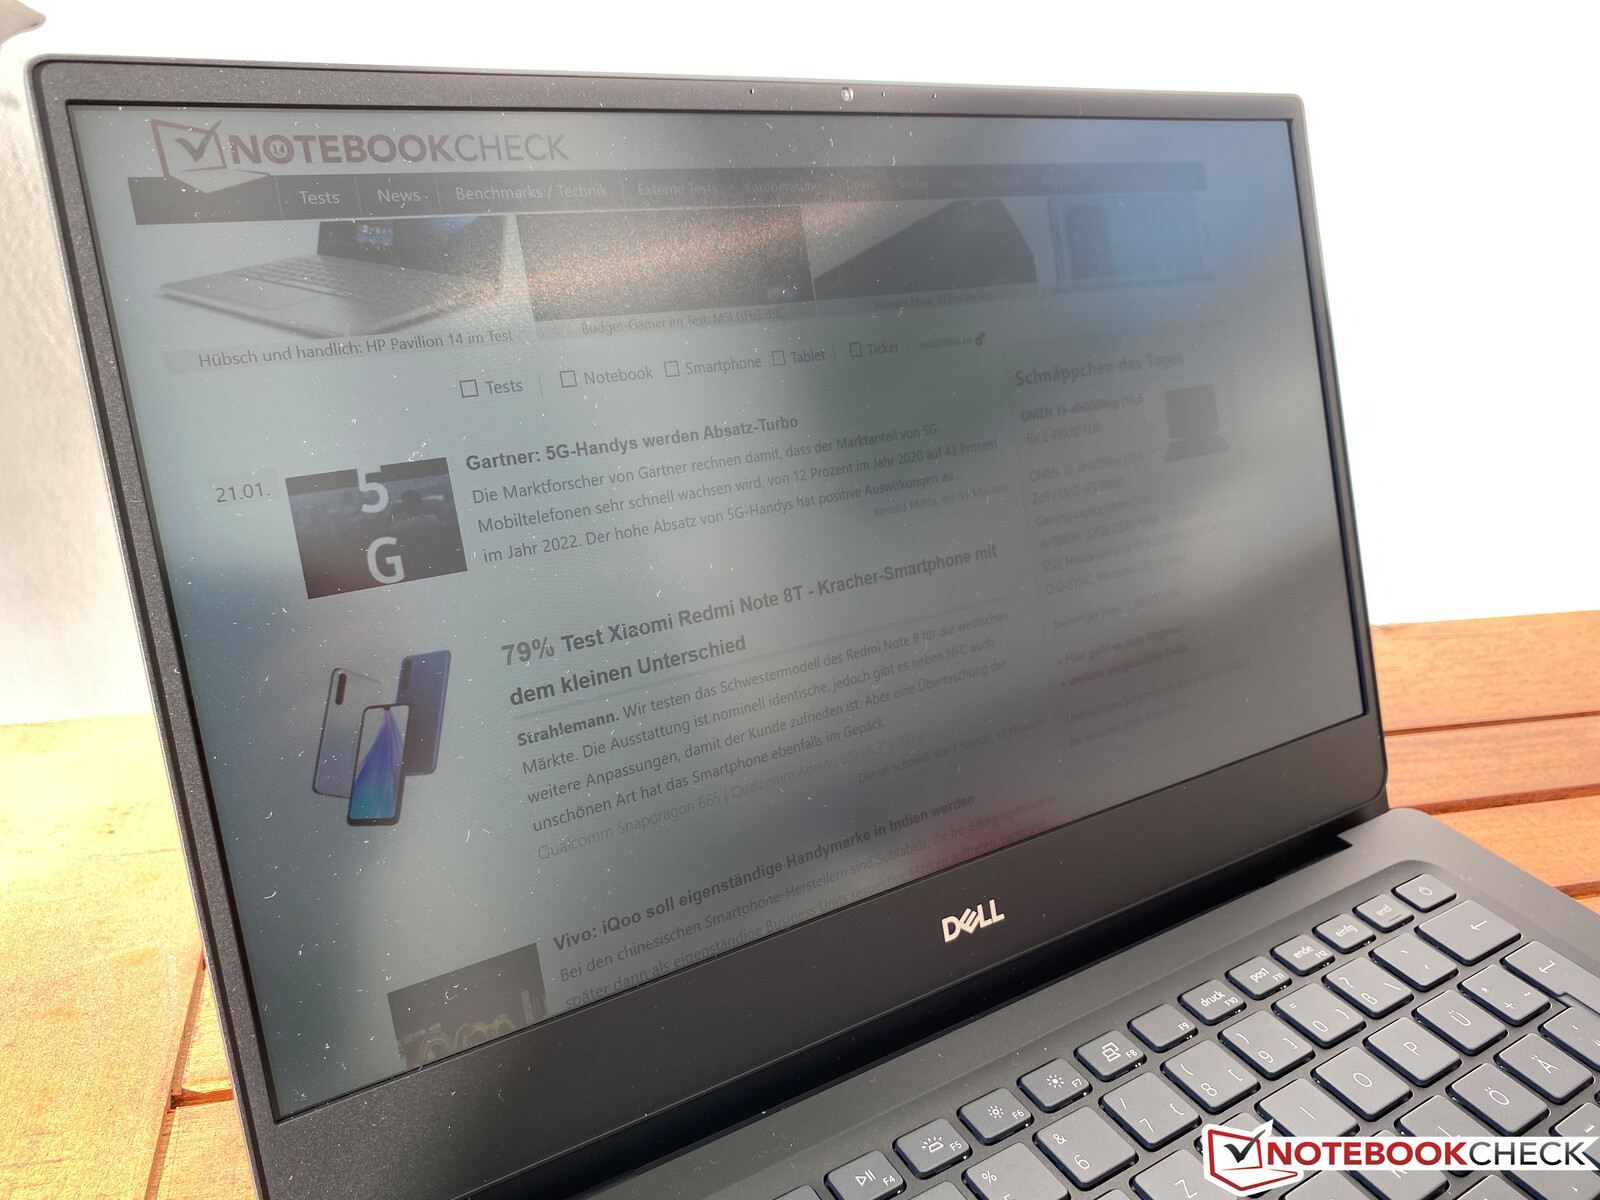
Viewing-angle stability is good. Despite the matte screen surface, outdoor usability is severely limited, because the display is simply too dim to work comfortably.
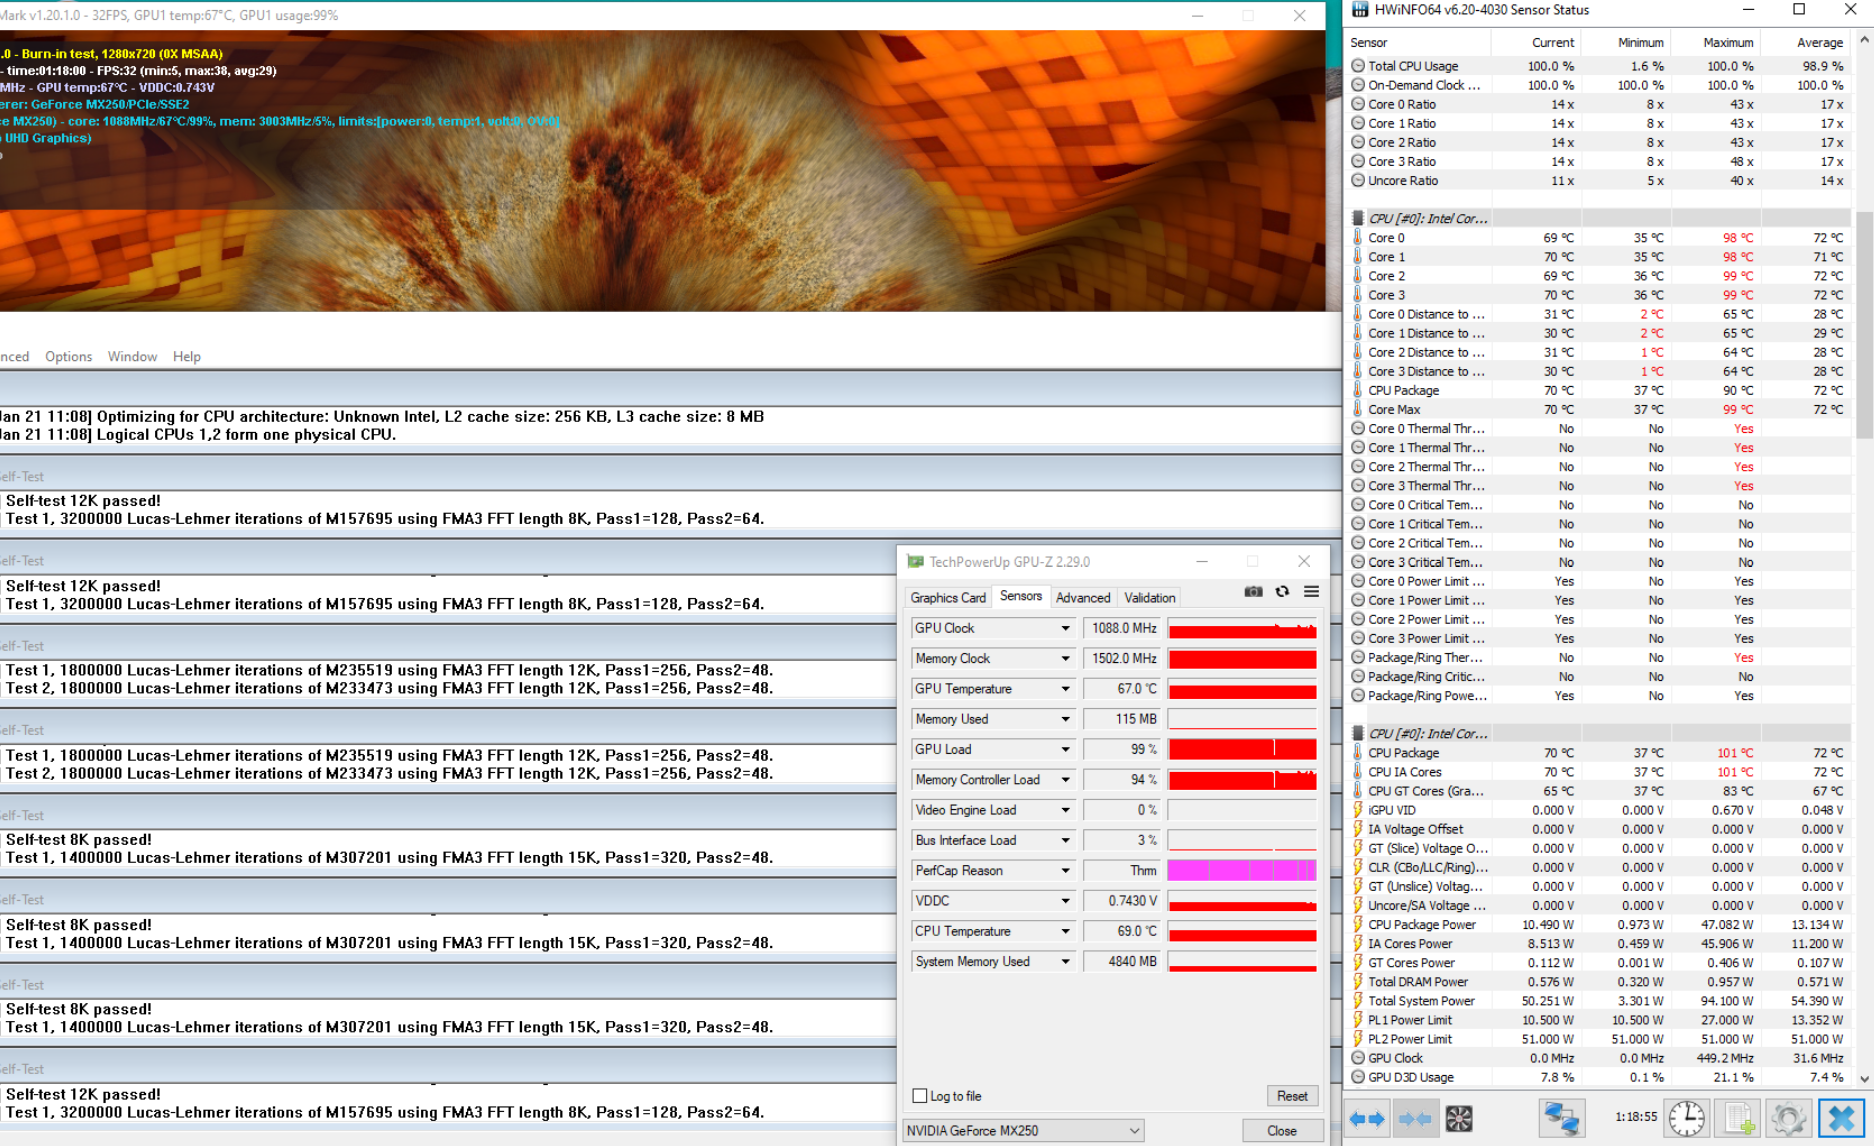
Performance - Dell laptop with i7 and MX250
Processor - Quad-core i7
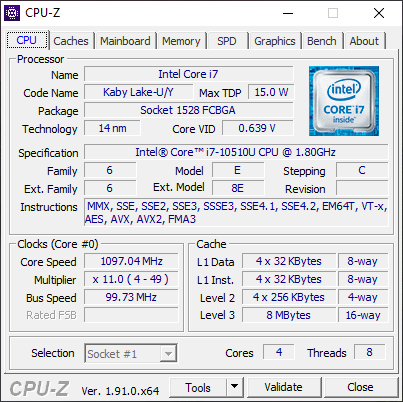
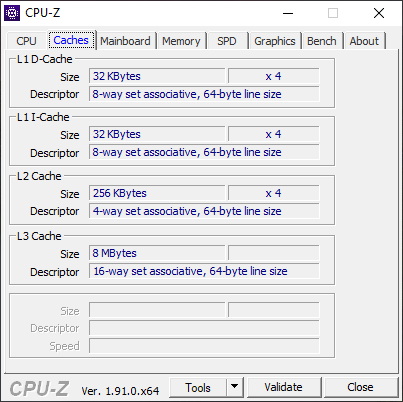
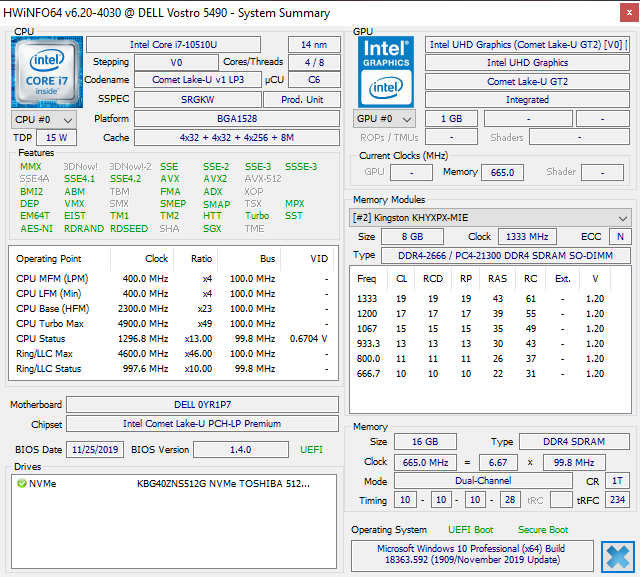
The Intel Core i7-10510U processor is based on the Comet Lake generation and offers 4 cores (8 threads) with a maximum clock speed of up to 4.8 GHz. More technical information about the processor is available here.
Dell has set the Power Limits very generously at 27/51 watts, which also leads to high clock rates at the beginning of the benchmarks. However, as can be clearly seen in our Cinebench R15 Multi loop, performance then drops under prolonged load. At around 10%, however, the deficit remains within the limits, and the Vostro can also utilize the i7's performance better than Acer does in the TravelMate P6, for example. Nevertheless, the two AMD Ryzen CPUs in the comparison group are clearly superior when you can make use of all cores. The big advantage of the i7 is its good single-core performance thanks to the high maximum Turbo Boost clock speed.
Cinebench R11.5 or R15 analysis, comparison with the competition;
System performance
The subjective performance impression in everyday use is very good, which is primarily due to the PCIe SSD alongside the fast processor. All commands are executed without noticeable delays, and there were no other problems in the test. The benchmark results support this impression.
| PCMark 10 Score | 4418 points | |
Help | ||
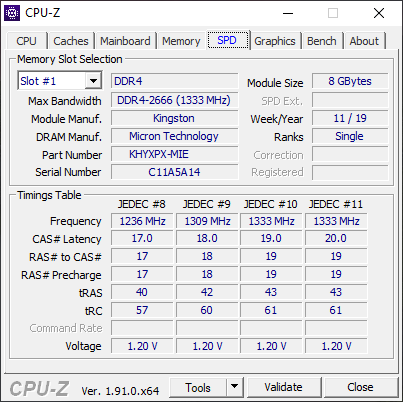
Storage - NVMe SSD from Toshiba
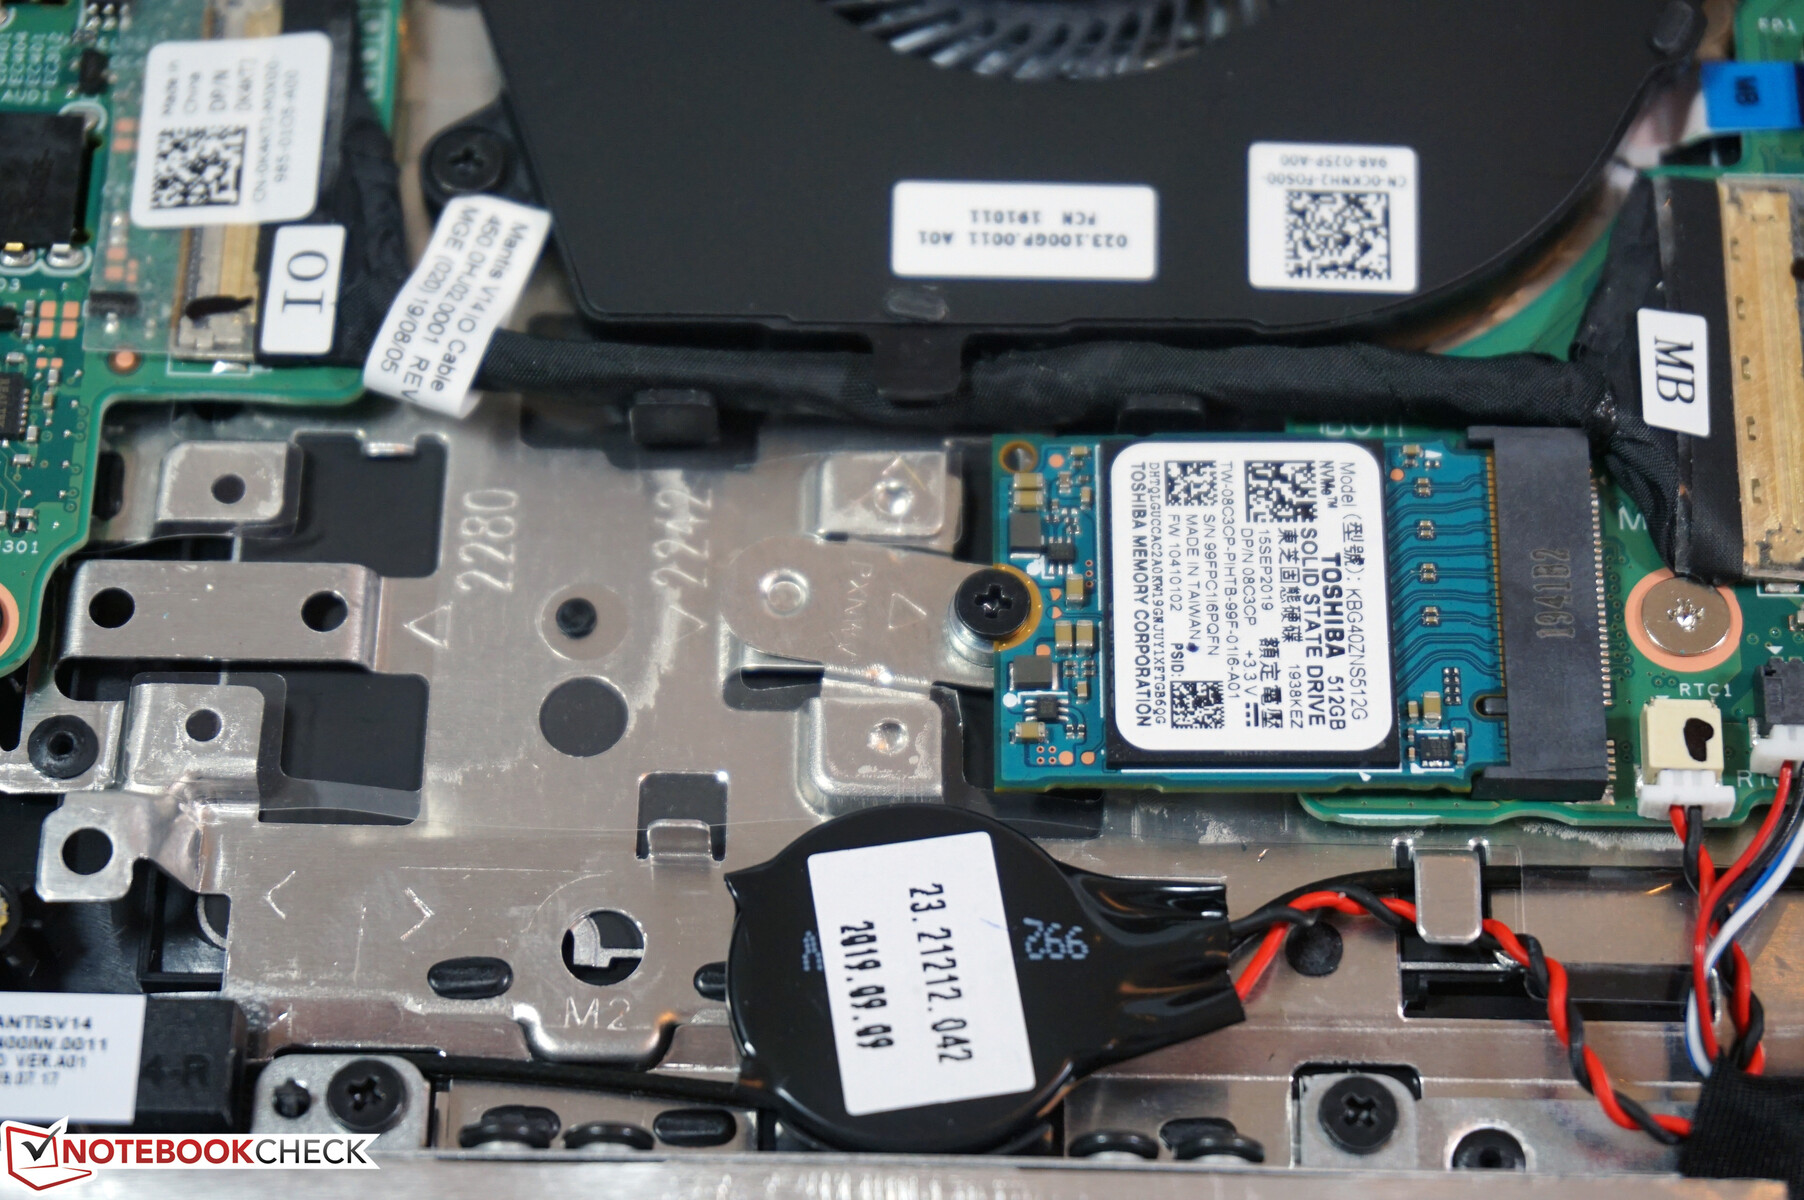
Despite the fairly low price, Dell installs a fast PCIe SSD from Toshiba with a storage capacity of 512 GB. Surprisingly, when we opened the case, only a small M.2 2242 SSD awaited us, which was screwed tight with a small adapter. However, a normal M.2 2280 SSD will also fit. Next to the battery, there's also a slot for a normal 2.5-inch hard drive including the required mounting material.
| Dell Vostro 14 5490 Toshiba KBG40ZNS512G NVMe | Lenovo ThinkPad L14-20U50003GE WDC PC SN730 SDBQNTY-512GB | HP ProBook 445 G7 175W4EA Samsung PM991 MZVLQ512HALU | Acer TravelMate P6 P614-51T-G2-72ZU Samsung PM991 MZVLQ512HALU | Dell Latitude 14 5410-RJ80D Toshiba KBG40ZNS256G NVMe | Average Toshiba KBG40ZNS512G NVMe | Average of class Office | |
|---|---|---|---|---|---|---|---|
| CrystalDiskMark 5.2 / 6 | -2% | 2% | 12% | -5% | 2% | 63% | |
| Write 4K | 107.3 | 76.7 -29% | 144.6 35% | 151.8 41% | 95.5 -11% | 126.4 ? 18% | 158.7 ? 48% |
| Read 4K | 47.61 | 32.04 -33% | 38.08 -20% | 55 16% | 47.14 -1% | 50 ? 5% | 61.7 ? 30% |
| Write Seq | 1294 | 1019 -21% | 1320 2% | 1292 0% | 1251 -3% | 1207 ? -7% | 2427 ? 88% |
| Read Seq | 1652 | 2014 22% | 1397 -15% | 1668 1% | 1624 -2% | 1567 ? -5% | 2611 ? 58% |
| Write 4K Q32T1 | 351 | 415.6 18% | 324.2 -8% | 440.7 26% | 333.5 -5% | 347 ? -1% | 400 ? 14% |
| Read 4K Q32T1 | 399.7 | 367.1 -8% | 434.8 9% | 477.4 19% | 335.2 -16% | 425 ? 6% | 519 ? 30% |
| Write Seq Q32T1 | 1230 | 1337 9% | 1382 12% | 1169 -5% | 1234 0% | 1224 ? 0% | 3062 ? 149% |
| Read Seq Q32T1 | 2315 | 2850 23% | 2354 2% | 2245 -3% | 2247 -3% | 2278 ? -2% | 4260 ? 84% |
| AS SSD | 50% | 15% | 29% | -21% | -17% | 74% | |
| Seq Read | 1973 | 2247 14% | 1936 -2% | 2057 4% | 1837 -7% | 1871 ? -5% | 3168 ? 61% |
| Seq Write | 795 | 1079 36% | 1213 53% | 1244 56% | 700 -12% | 810 ? 2% | 2085 ? 162% |
| 4K Read | 44.87 | 42.52 -5% | 44.09 -2% | 48.07 7% | 44.5 -1% | 45.8 ? 2% | 56.3 ? 25% |
| 4K Write | 102.5 | 129.1 26% | 118.5 16% | 125.8 23% | 90.1 -12% | 110.9 ? 8% | 158.6 ? 55% |
| 4K-64 Read | 992 | 1316 33% | 867 -13% | 875 -12% | 905 -9% | 997 ? 1% | 1069 ? 8% |
| 4K-64 Write | 472.8 | 1332 182% | 838 77% | 785 66% | 447.8 -5% | 452 ? -4% | 1482 ? 213% |
| Access Time Read * | 0.059 | 0.086 -46% | 0.122 -107% | 0.16 -171% | 0.1024 ? -74% | 0.08014 ? -36% | |
| Access Time Write * | 0.183 | 0.029 84% | 0.034 81% | 0.031 83% | 0.175 4% | 0.4026 ? -120% | 0.06444 ? 65% |
| Score Read | 1234 | 1583 28% | 1105 -10% | 1129 -9% | 1133 -8% | 1232 ? 0% | 1442 ? 17% |
| Score Write | 655 | 1569 140% | 1078 65% | 1035 58% | 608 -7% | 644 ? -2% | 1850 ? 182% |
| Score Total | 2469 | 3907 58% | 2721 10% | 2712 10% | 2273 -8% | 2461 ? 0% | 3986 ? 61% |
| Copy ISO MB/s | 1600 | 1785 ? | 1677 ? | ||||
| Copy Program MB/s | 517 | 388 ? | 515 ? | ||||
| Copy Game MB/s | 1009 | 715 ? | 1186 ? | ||||
| Total Average (Program / Settings) | 24% /
28% | 9% /
10% | 21% /
21% | -13% /
-15% | -8% /
-9% | 69% /
69% |
* ... smaller is better

Graphics card - Vostro with MX250
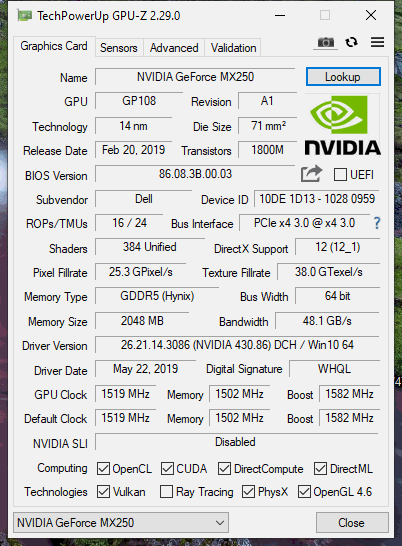
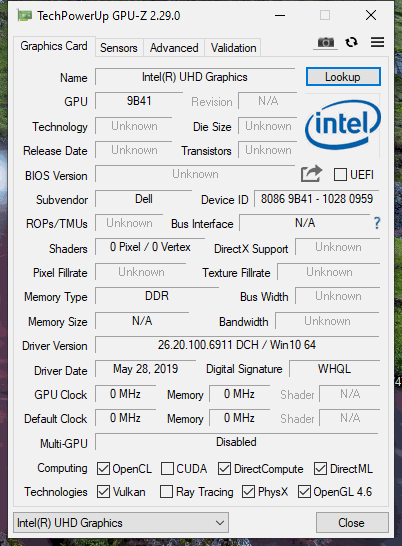
Besides the processor's integrated UHD Graphics 620, Dell also installs the dedicated Nvidia GeForce MX250 with a maximum core clock speed of 1,582 MHz and 2 GB of GDDR5 VRAM. This is an entry-level GPU that has a slight lead in the benchmarks compared to the modern iGPUs. More technical information on the MX250 can be found here.
The performance output of the MX250 in our test device is good, and the benchmark results are also slightly above those that we have for other laptops with the MX250 in our database. Furthermore, performance also remains stable in the Fire Strike stress test.
| 3DMark 11 Performance | 4912 points | |
| 3DMark Ice Storm Standard Score | 81722 points | |
| 3DMark Cloud Gate Standard Score | 15582 points | |
| 3DMark Fire Strike Score | 3340 points | |
| 3DMark Time Spy Score | 1270 points | |
Help | ||
Gaming performance
Naturally, the dedicated GeForce MX250 doesn't make the Vostro a gaming laptop, but you can definitely play a bit after work. More demanding titles, such as The Witcher 3, run smoothly at least on medium details.
| low | med. | high | ultra | |
| The Witcher 3 (2015) | 65 | 36.9 | 20.8 | 12 |
| Dota 2 Reborn (2015) | 77 | 36.5 | 35.8 | 12.8 |
| X-Plane 11.11 (2018) | 59.9 | 39.8 | 37.9 |
Emissions and energy
Noise emissions
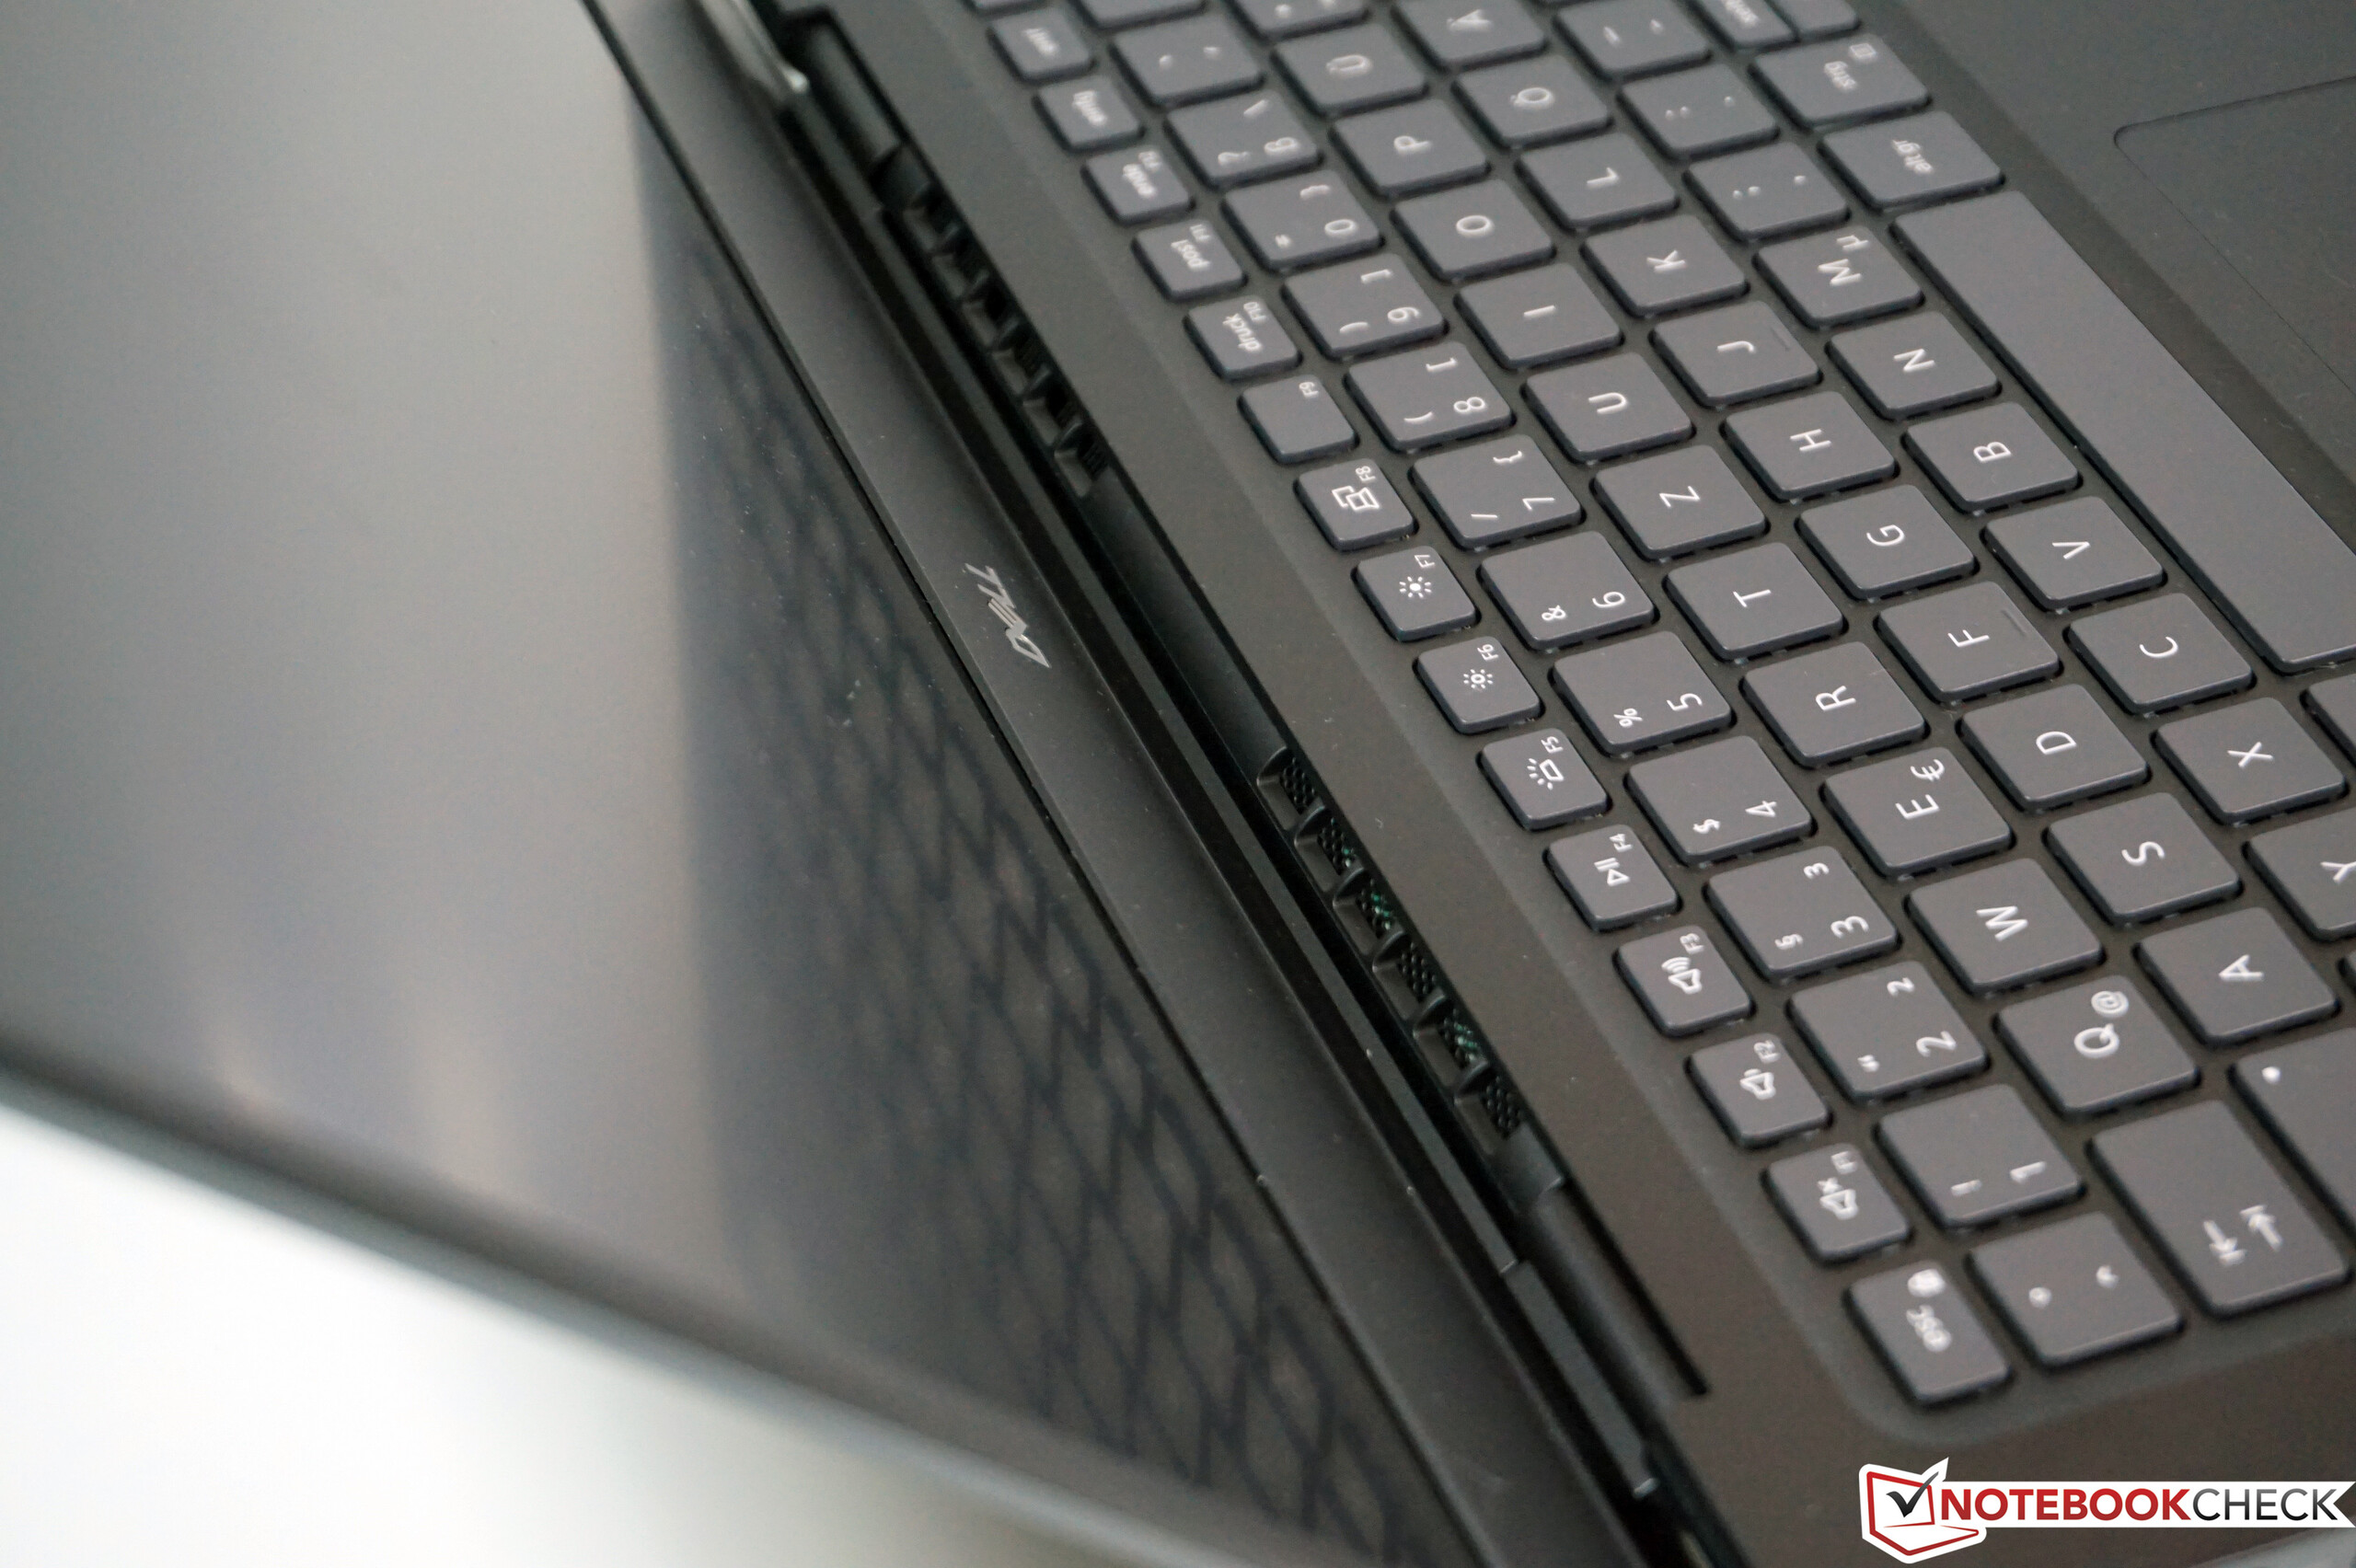
The single fan has its hands full with the additional graphics card. In idle usage and under low load, the fan remains disabled, and there are no other electronic noises either. However, as soon as you put either the processor or the graphics card (or both together) under a bit of stress, the fan immediately jumps to its maximum noise level of 41 dB(A). Dell could have certainly optimized the fan control better here.
Noise Level
| Idle |
| 29.1 / 29.1 / 29.1 dB(A) |
| Load |
| 41.1 / 41.1 dB(A) |
 | ||
30 dB silent 40 dB(A) audible 50 dB(A) loud |
||
min: | ||
| Dell Vostro 14 5490 GeForce MX250, i7-10510U, Toshiba KBG40ZNS512G NVMe | Lenovo ThinkPad L14-20U50003GE Vega 6, R5 4500U, WDC PC SN730 SDBQNTY-512GB | HP ProBook 445 G7 175W4EA Vega 6, R5 4500U, Samsung PM991 MZVLQ512HALU | Acer TravelMate P6 P614-51T-G2-72ZU UHD Graphics 620, i7-10510U, Samsung PM991 MZVLQ512HALU | Dell Latitude 14 5410-RJ80D UHD Graphics 620, i5-10310U, Toshiba KBG40ZNS256G NVMe | |
|---|---|---|---|---|---|
| Noise | 9% | 3% | 11% | 11% | |
| off / environment * | 29.1 | 29.2 -0% | 30.7 -5% | 27 7% | 24.9 14% |
| Idle Minimum * | 29.1 | 29.2 -0% | 30.7 -5% | 27 7% | 24.9 14% |
| Idle Average * | 29.1 | 29.2 -0% | 30.7 -5% | 27 7% | 24.9 14% |
| Idle Maximum * | 29.1 | 29.7 -2% | 30.7 -5% | 27 7% | 24.9 14% |
| Load Average * | 41.1 | 30.5 26% | 32.3 21% | 35 15% | 38.7 6% |
| Witcher 3 ultra * | 41.1 | 32.8 20% | |||
| Load Maximum * | 41.1 | 32.8 20% | 34.8 15% | 32.8 20% | 39.2 5% |
* ... smaller is better
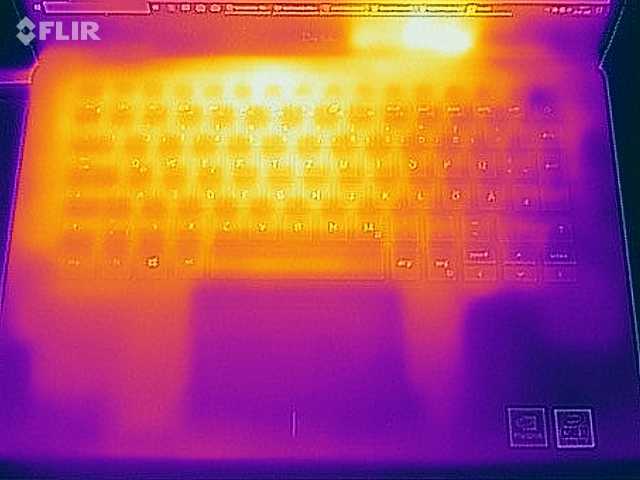
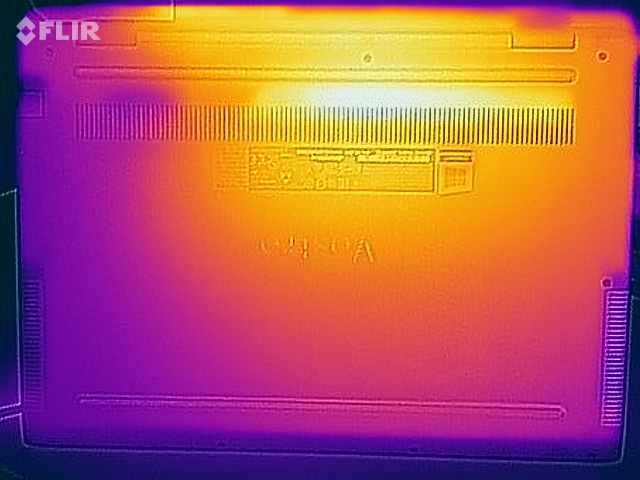
Temperature
Looking at the surface temperatures under load, the high fan speed definitely makes sense. The laptop heats up noticeably in the stress test, and we measure over 45 °C (~113 °F) in some places, but this is by no means critical. The device also stays significantly cooler during everyday tasks.
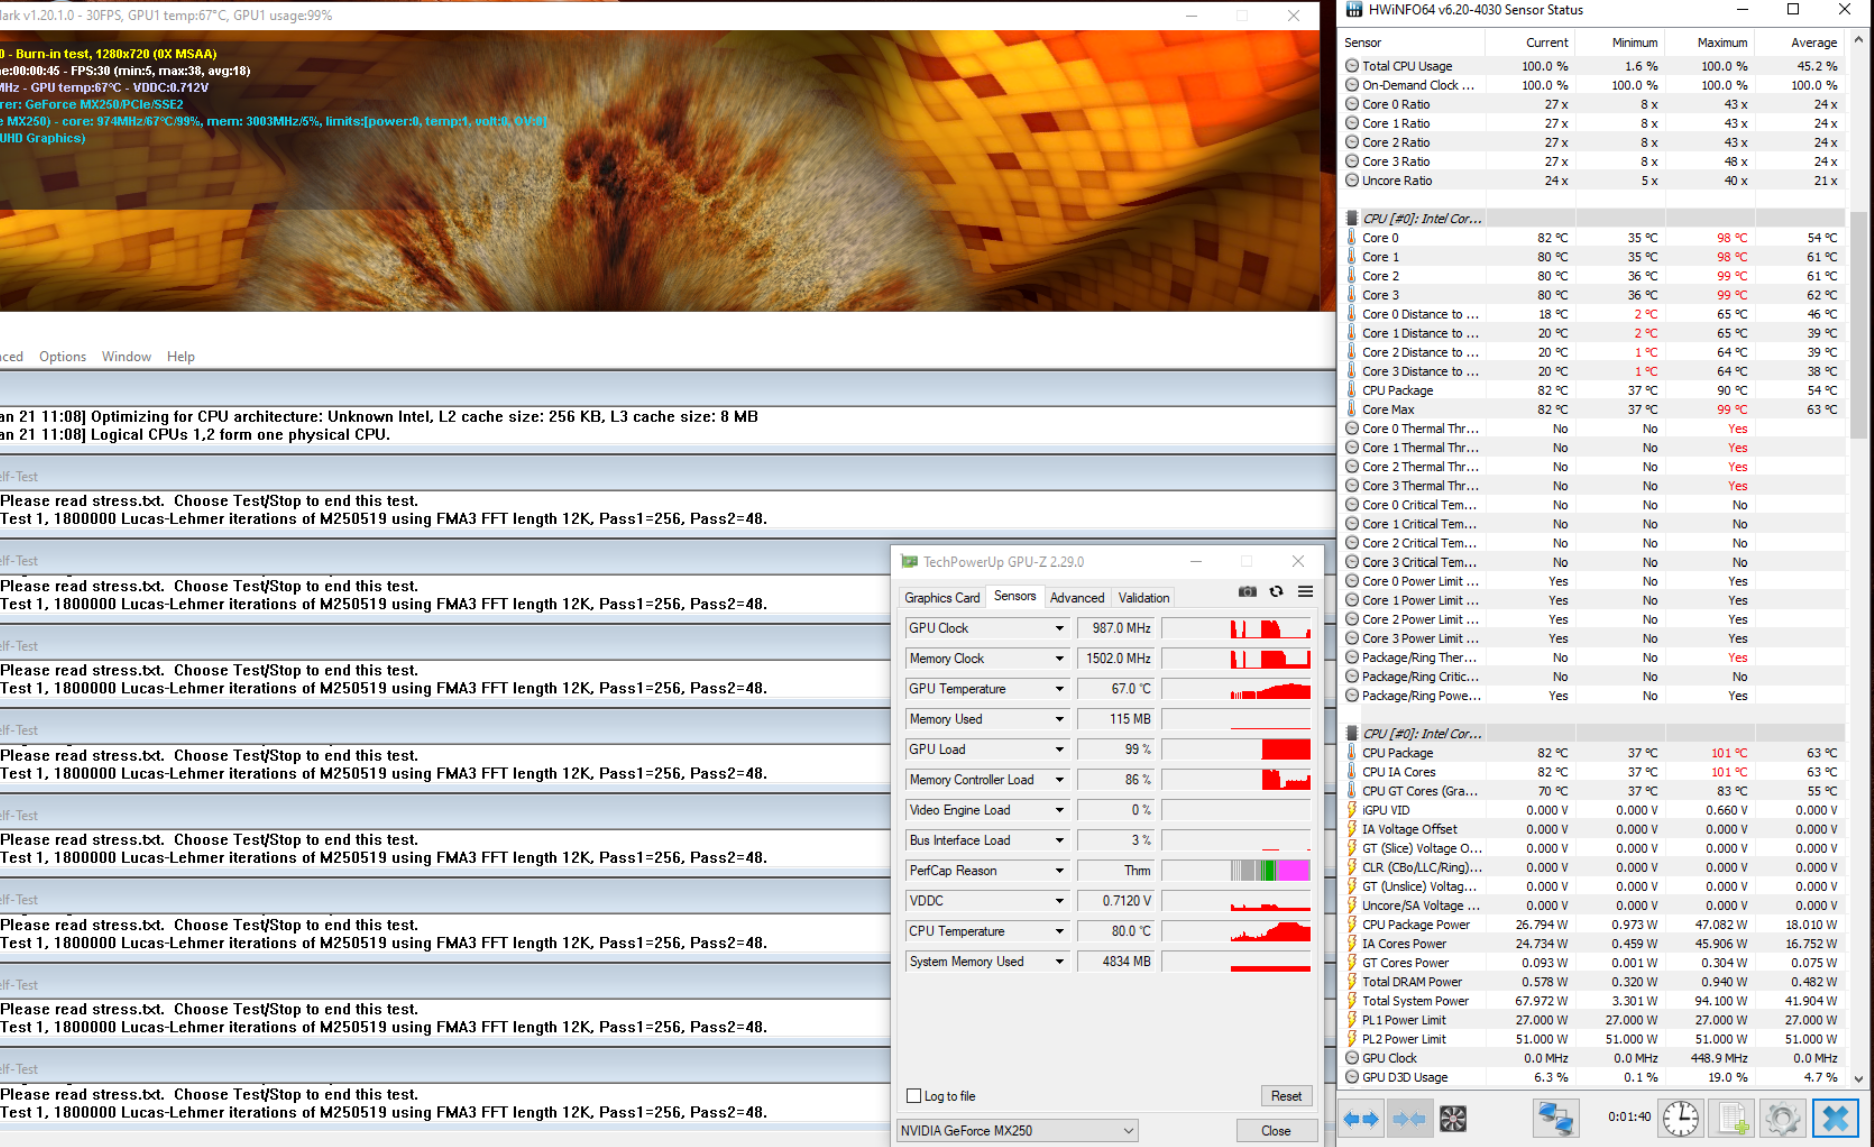
The graphics card's performance is definitely prioritized in the stress test. The processor only operates at around 10 watts under combined load, which is enough for 4x 1.4 GHz. The GPU, on the other hand, stays at 1,000-1,100 MHz. Following the stress test, however, there is no performance reduction.
(±) The maximum temperature on the upper side is 44.6 °C / 112 F, compared to the average of 34.2 °C / 94 F, ranging from 21.2 to 62.5 °C for the class Office.
(-) The bottom heats up to a maximum of 46.9 °C / 116 F, compared to the average of 36.7 °C / 98 F
(+) In idle usage, the average temperature for the upper side is 22.5 °C / 73 F, compared to the device average of 29.5 °C / 85 F.
(+) The palmrests and touchpad are cooler than skin temperature with a maximum of 31.2 °C / 88.2 F and are therefore cool to the touch.
(-) The average temperature of the palmrest area of similar devices was 27.7 °C / 81.9 F (-3.5 °C / -6.3 F).
Speakers
Speakers are often not the focus of development in office computers, and the Vostro 5490 also only offers average performance in this regard. Our measurement shows that the device has a very clean output of trebles, which is good for the reproduction of voices. Therefore, the modules are well suited for conferences or meetings.
Dell Vostro 14 5490 audio analysis
(±) | speaker loudness is average but good (79.5 dB)
Bass 100 - 315 Hz
(-) | nearly no bass - on average 17.5% lower than median
(±) | linearity of bass is average (8.8% delta to prev. frequency)
Mids 400 - 2000 Hz
(±) | higher mids - on average 5.4% higher than median
(±) | linearity of mids is average (8% delta to prev. frequency)
Highs 2 - 16 kHz
(+) | balanced highs - only 4% away from median
(+) | highs are linear (5.1% delta to prev. frequency)
Overall 100 - 16.000 Hz
(±) | linearity of overall sound is average (20.6% difference to median)
Compared to same class
» 41% of all tested devices in this class were better, 10% similar, 48% worse
» The best had a delta of 7%, average was 22%, worst was 53%
Compared to all devices tested
» 50% of all tested devices were better, 8% similar, 42% worse
» The best had a delta of 4%, average was 25%, worst was 134%
Lenovo ThinkPad L14-20U50003GE audio analysis
(-) | not very loud speakers (68.7 dB)
Bass 100 - 315 Hz
(±) | reduced bass - on average 10.8% lower than median
(±) | linearity of bass is average (11.4% delta to prev. frequency)
Mids 400 - 2000 Hz
(±) | higher mids - on average 6.1% higher than median
(+) | mids are linear (5.1% delta to prev. frequency)
Highs 2 - 16 kHz
(+) | balanced highs - only 3% away from median
(±) | linearity of highs is average (9.5% delta to prev. frequency)
Overall 100 - 16.000 Hz
(±) | linearity of overall sound is average (23.8% difference to median)
Compared to same class
» 65% of all tested devices in this class were better, 10% similar, 26% worse
» The best had a delta of 7%, average was 22%, worst was 53%
Compared to all devices tested
» 67% of all tested devices were better, 7% similar, 26% worse
» The best had a delta of 4%, average was 25%, worst was 134%
Energy consumption
Dell has optimized the Vostro's power consumption well, because the idle rates in particular are very low, but the dim display naturally also plays a role here. The additional dedicated graphics card is, of course, noticeable under load, but the included 65-watt power adapter is sufficient in any case.
| Off / Standby | |
| Idle | |
| Load |
|
Battery life
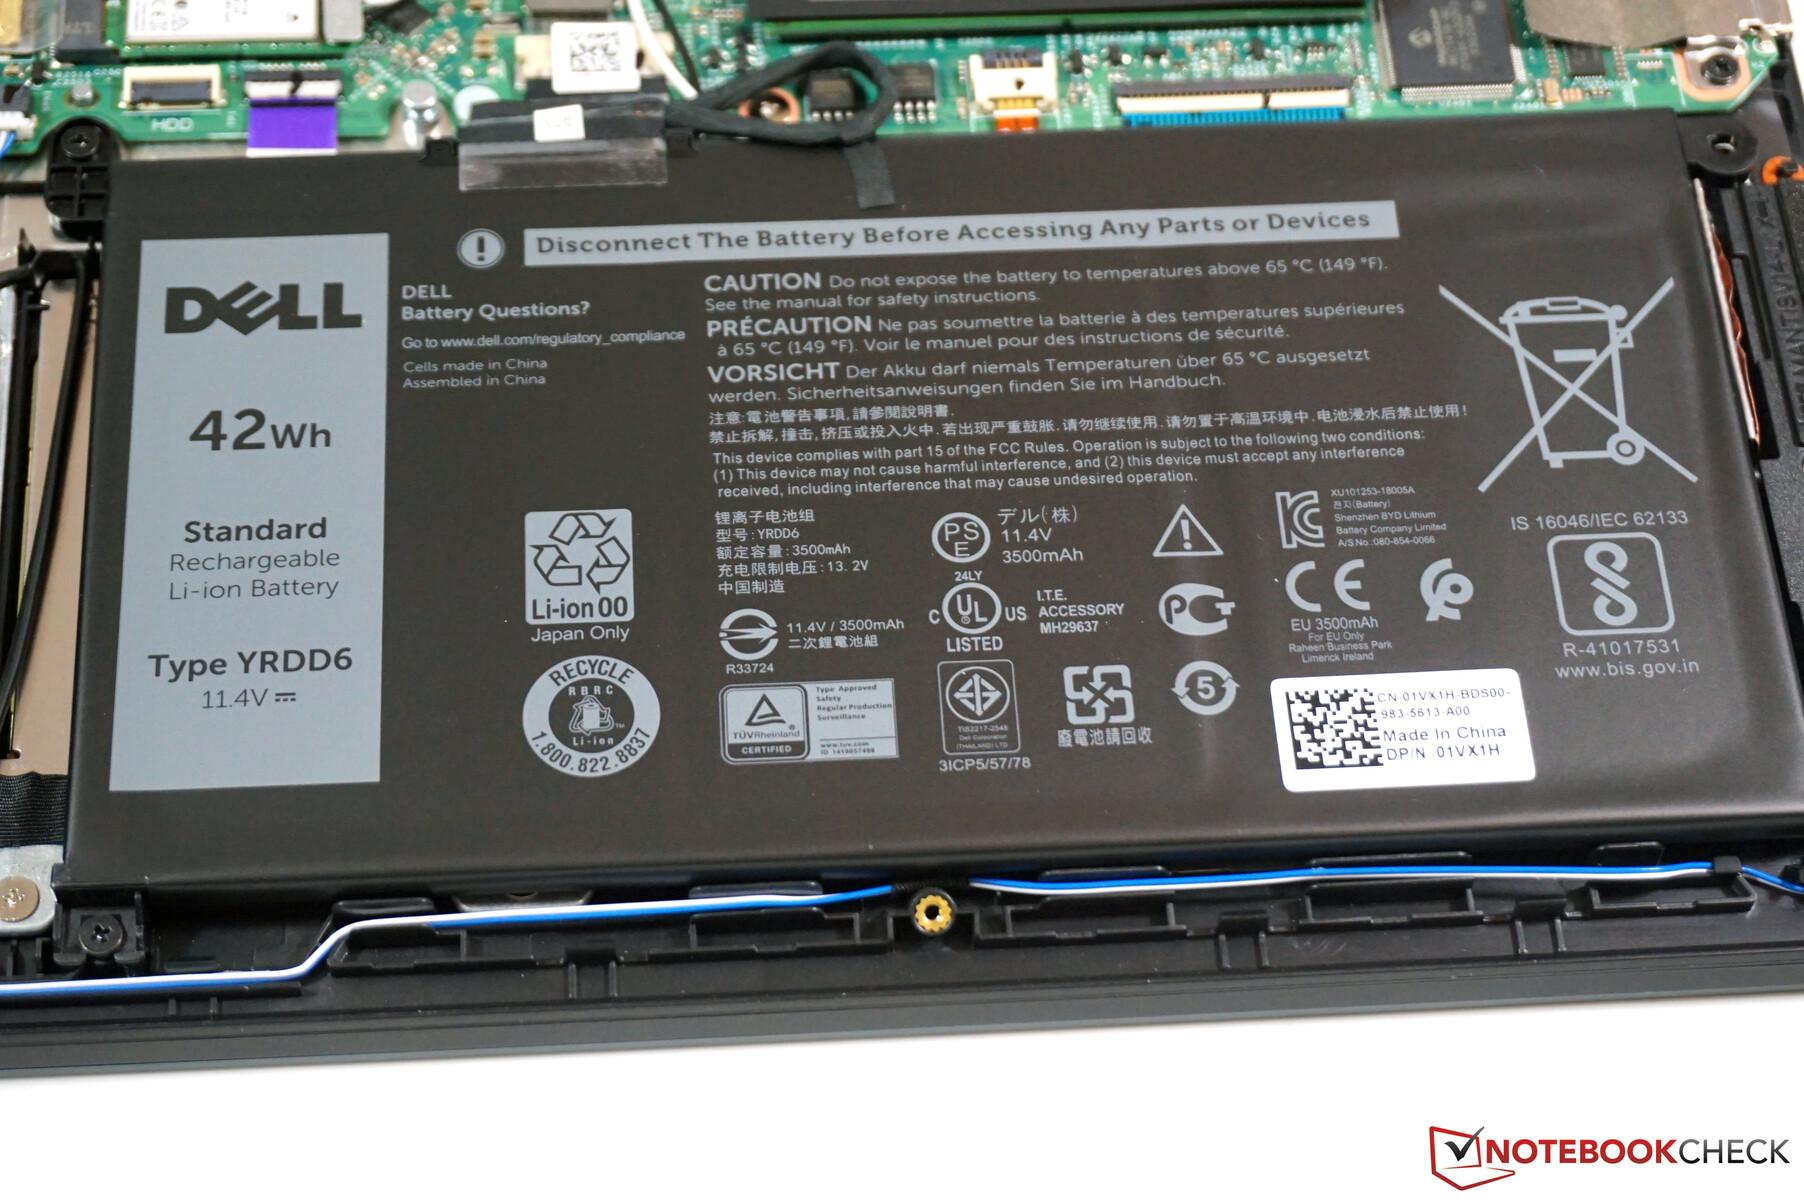
The battery capacity is comparatively low at 42 watt-hours, which is why the battery life is also below that of the comparison devices. Nevertheless, about 7 hours in our WLAN test at 150 cd/m² is not bad, and some meetings can certainly be held without the power adapter. The rate drops to ~6 hours at full brightness.
Pros
Cons
Verdict - Office laptop with some weaknesses
Dell offers an inexpensive office laptop with the Vostro 5490. Important things like the case and the input devices are very decent, and performance is also perfectly sufficient for normal office tasks. The additional dedicated graphics card can also develop its performance well and even allows playing some games after work, but the single fan is a bit overwhelmed with the additional heat. Even under little load, it immediately jumps up to the maximum noise level of 41 dB(A).
Unfortunately, as is common in inexpensive office computers, the display is still a weak point. Nowadays, almost all models have IPS panels with stable viewing angles, but the brightness is problematic, and you often wish for a somewhat brighter panel even in bright indoor environments. In companies, laptops are often connected to large external monitors, which is why companies frequently don't place much value on this.
The Vostro 5490 is a solid office laptop, but the additional graphics card is a challenge for the fan, and it doesn't really make sense in everyday office use.
You can also notice that money has been saved in other areas such as with the slow microSD reader or the slow WLAN module. On the other hand, battery life is okay. The direct competitors often have similar problems, especially with the screen. We would definitely recommend a configuration of the Vostro without a dedicated GPU.
Dell Vostro 14 5490
-
01/08/2021 v7
Andreas Osthoff
Pricecompare

