 Deutsch
 English
 Español
 Français
 Italiano
 Nederlands
 Polski
 Português
 Русский
 Türkçe
 Svenska
 Chinese
 Magyar
Dell XPS 13 9300 Laptop Review – Smaller, but slower CPU
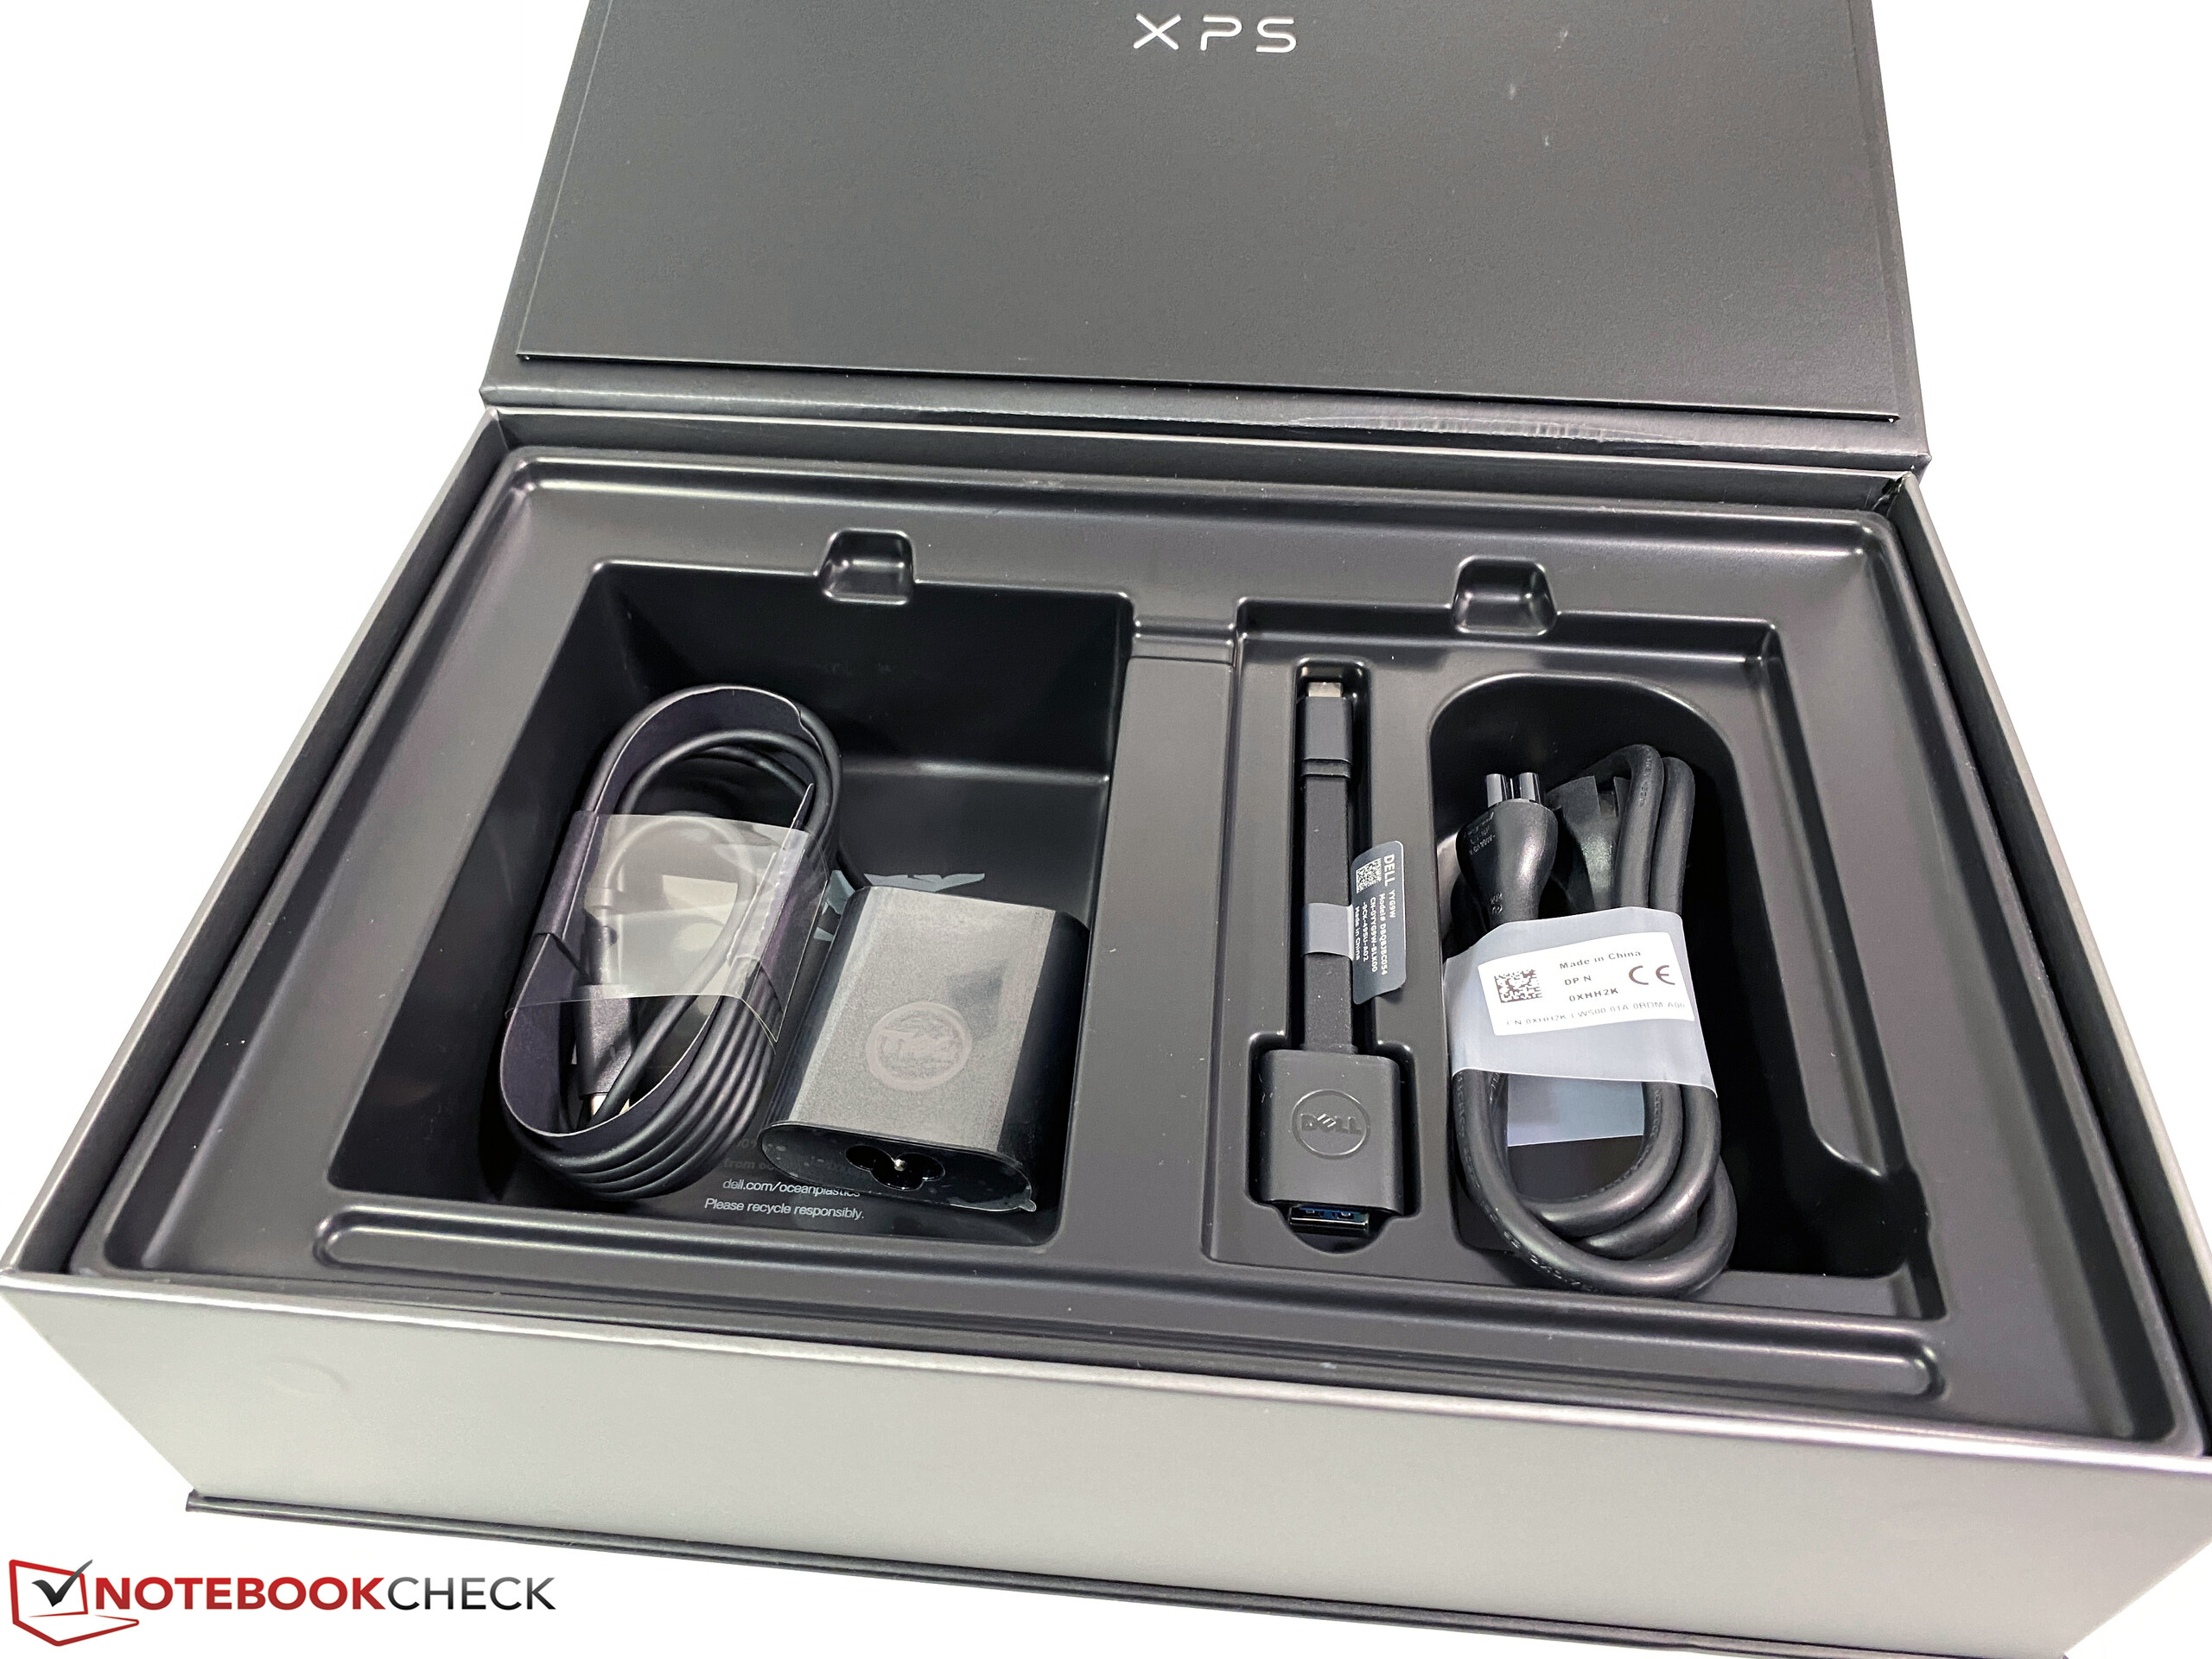
The new 2020 Dell XPS 13 carries the designation XPS 13 9300 and is the first major redesign of Dell's popular subnotebook in the last couple of years. We review the entry-level spec for 1499 Euros (~$1613), so the new model is about 200 Euros (~$215) more expensive than the previous model. You get a modern Core i5 processor from Intel and 512 GB SSD storage, which should be sufficient for many users, which is also the case for the matte Full HD panel. The latter is also one of the biggest new features, because Dell returns to the 16:10 aspect ratio. We purchased our unit in Dell's German online shop; it is not a preselected press sample. Dell also offers the XPS 13 9300 with Linux.
Rating | Date | Model | Weight | Height | Size | Resolution | Best Price |
|---|---|---|---|---|---|---|---|
| 88.8 % | 03/2020 | Dell XPS 13 9300 i5 FHD i5-1035G1, UHD Graphics G1 (Ice Lake 32 EU) | 1.2 kg | 14.8 mm | 13.40" | 1920x1200 | |
| 90.6 % | 02/2020 | Apple MacBook Pro 13 2019 2TB3 i5-8257U, Iris Plus Graphics 645 | 1.4 kg | 14.9 mm | 13.30" | 2560x1600 | |
| 87 % | 02/2020 | Acer Swift 3 SF313-52-71Y7 i7-1065G7, Iris Plus Graphics G7 (Ice Lake 64 EU) | 1.2 kg | 16.6 mm | 13.50" | 2256x1504 | |
| 90.3 % | 05/2019 | Lenovo ThinkPad X390-20Q1S02M00 i5-8265U, UHD Graphics 620 | 1.3 kg | 16.9 mm | 13.30" | 1920x1080 | |
| 88 % | 01/2019 | Dell XPS 13 9380 2019 i5-8265U, UHD Graphics 620 | 1.2 kg | 11.6 mm | 13.30" | 3840x2160 | |
| 86.3 % | 10/2019 | Dell XPS 13 7390 2-in-1 Core i7 i7-1065G7, Iris Plus Graphics G7 (Ice Lake 64 EU) | 1.3 kg | 13 mm | 13.40" | 1920x1200 |
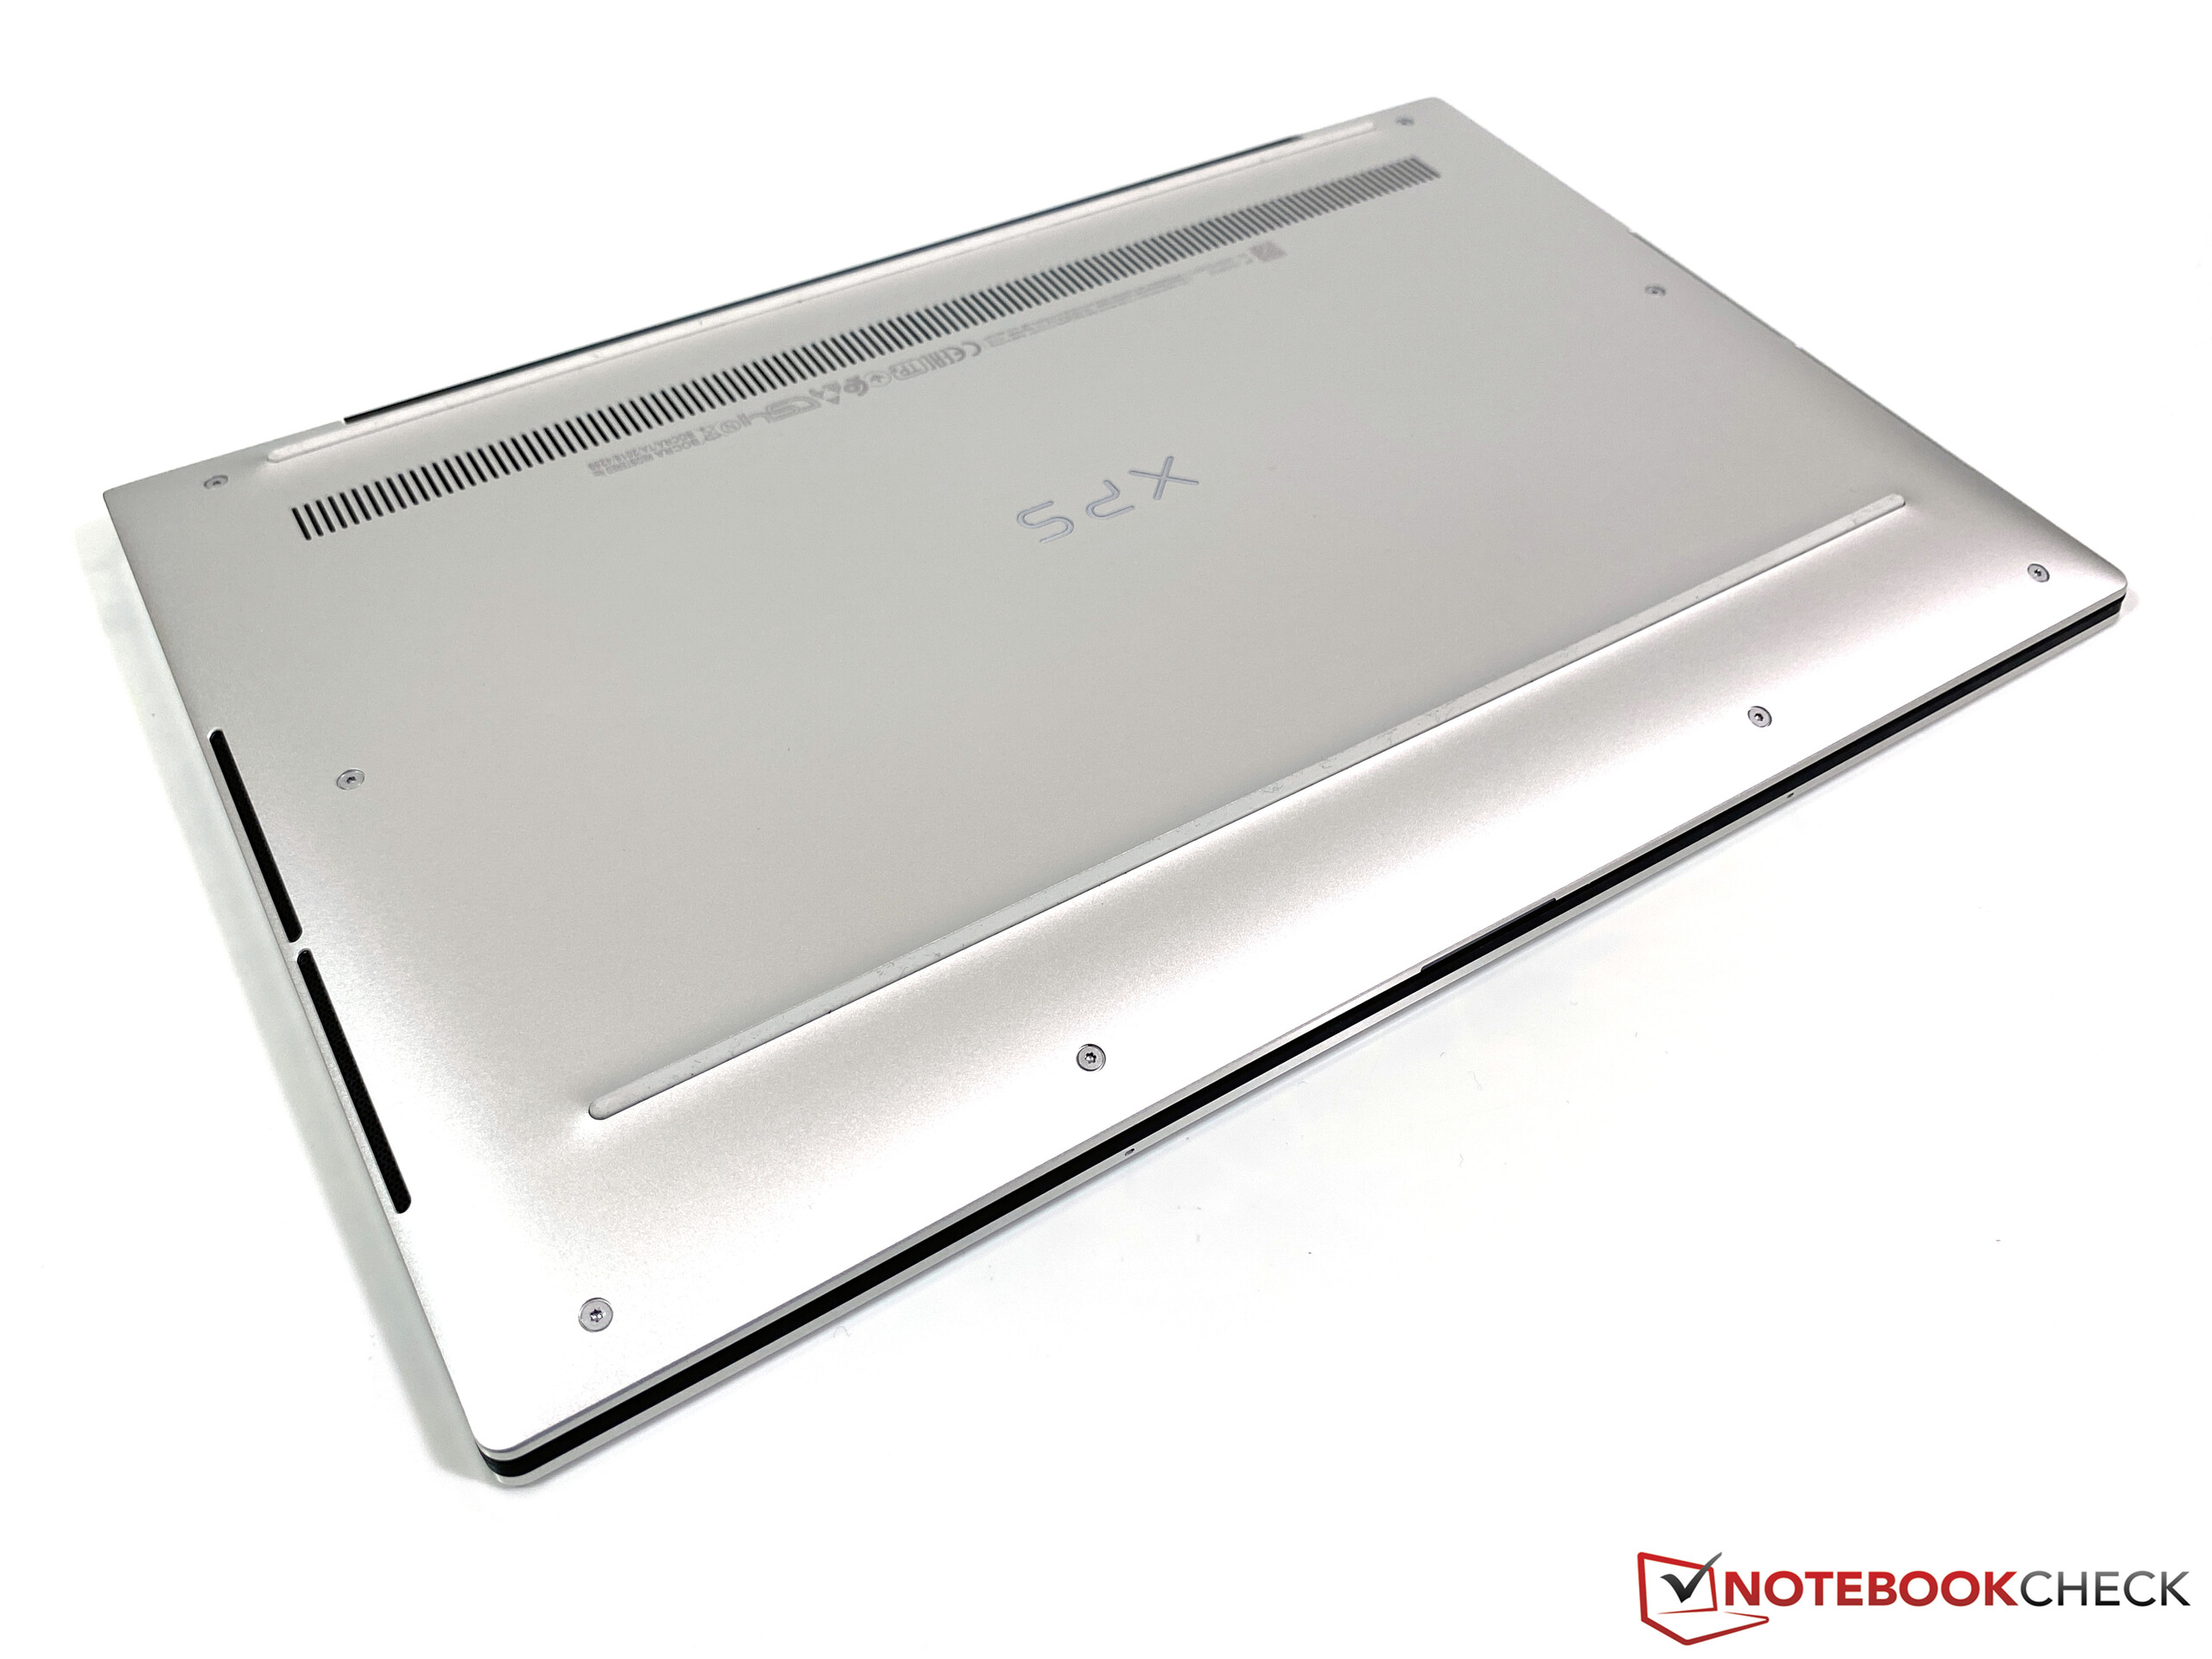
Case – XPS 13 in a familiar metal look
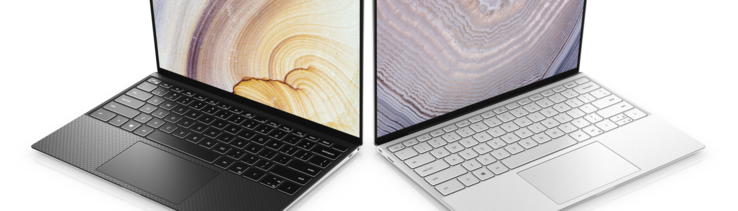
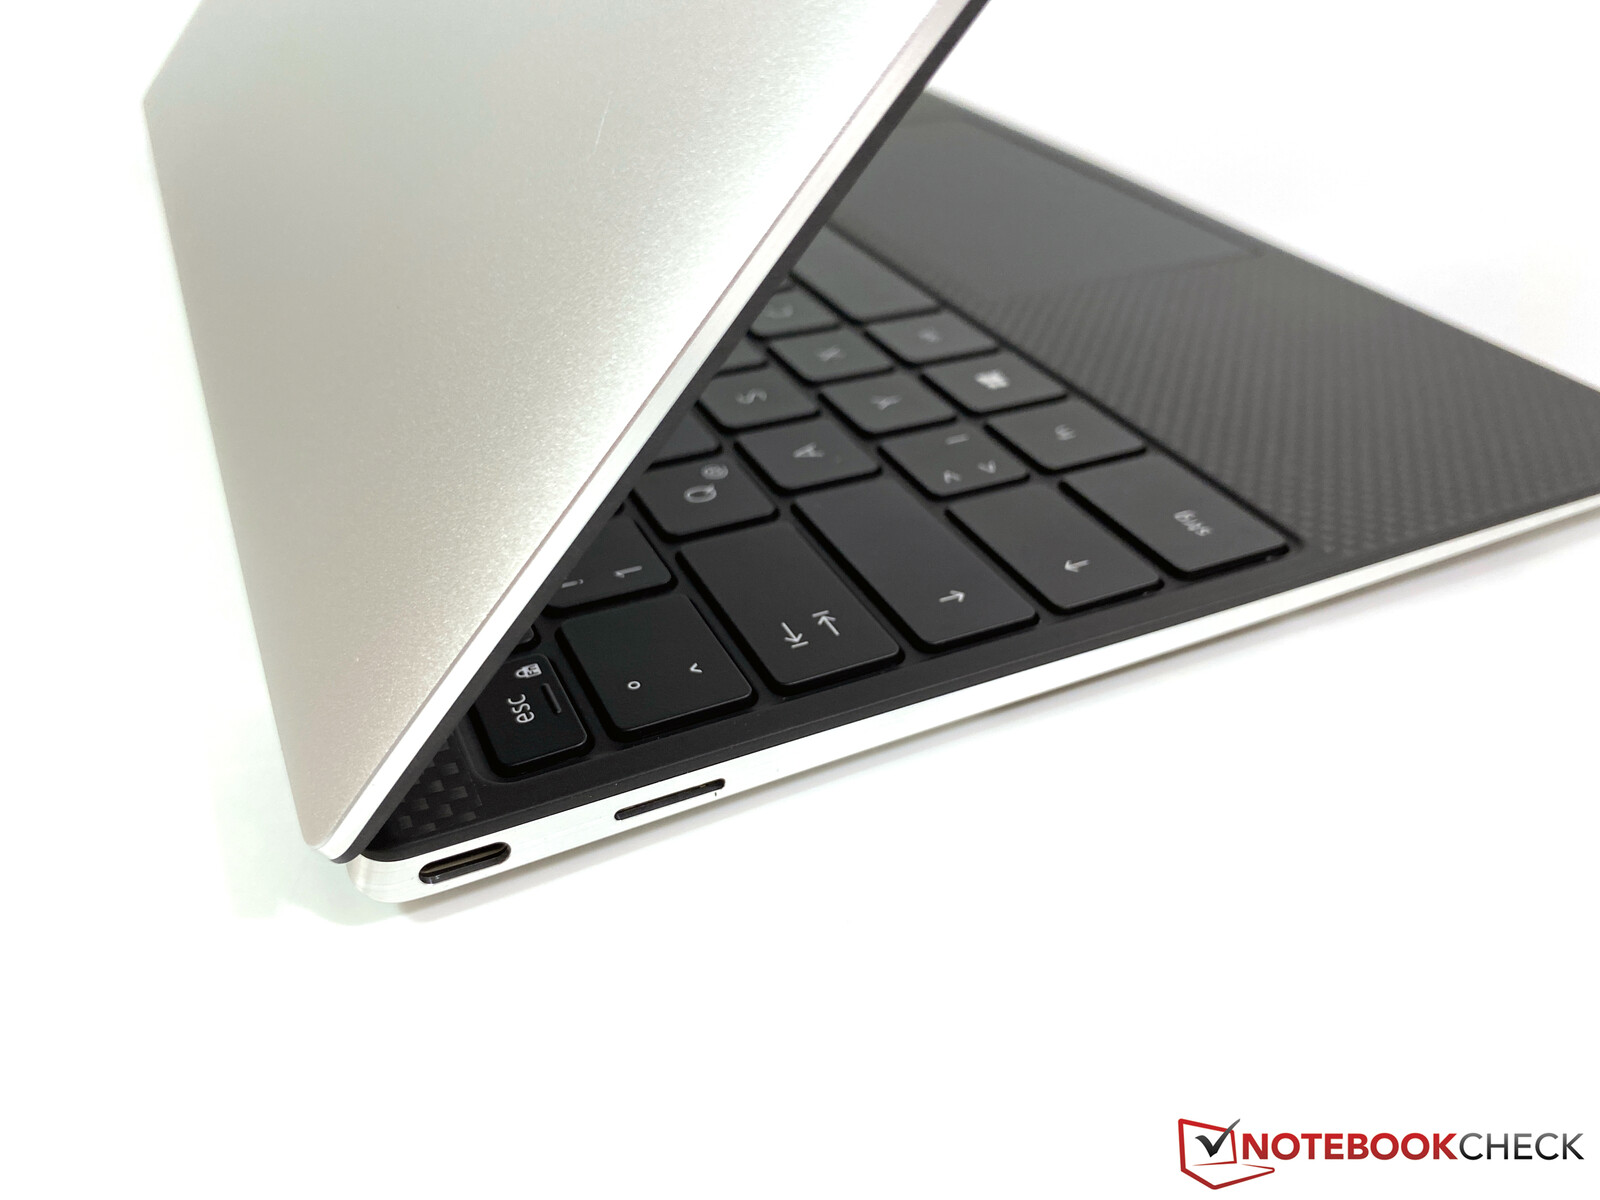
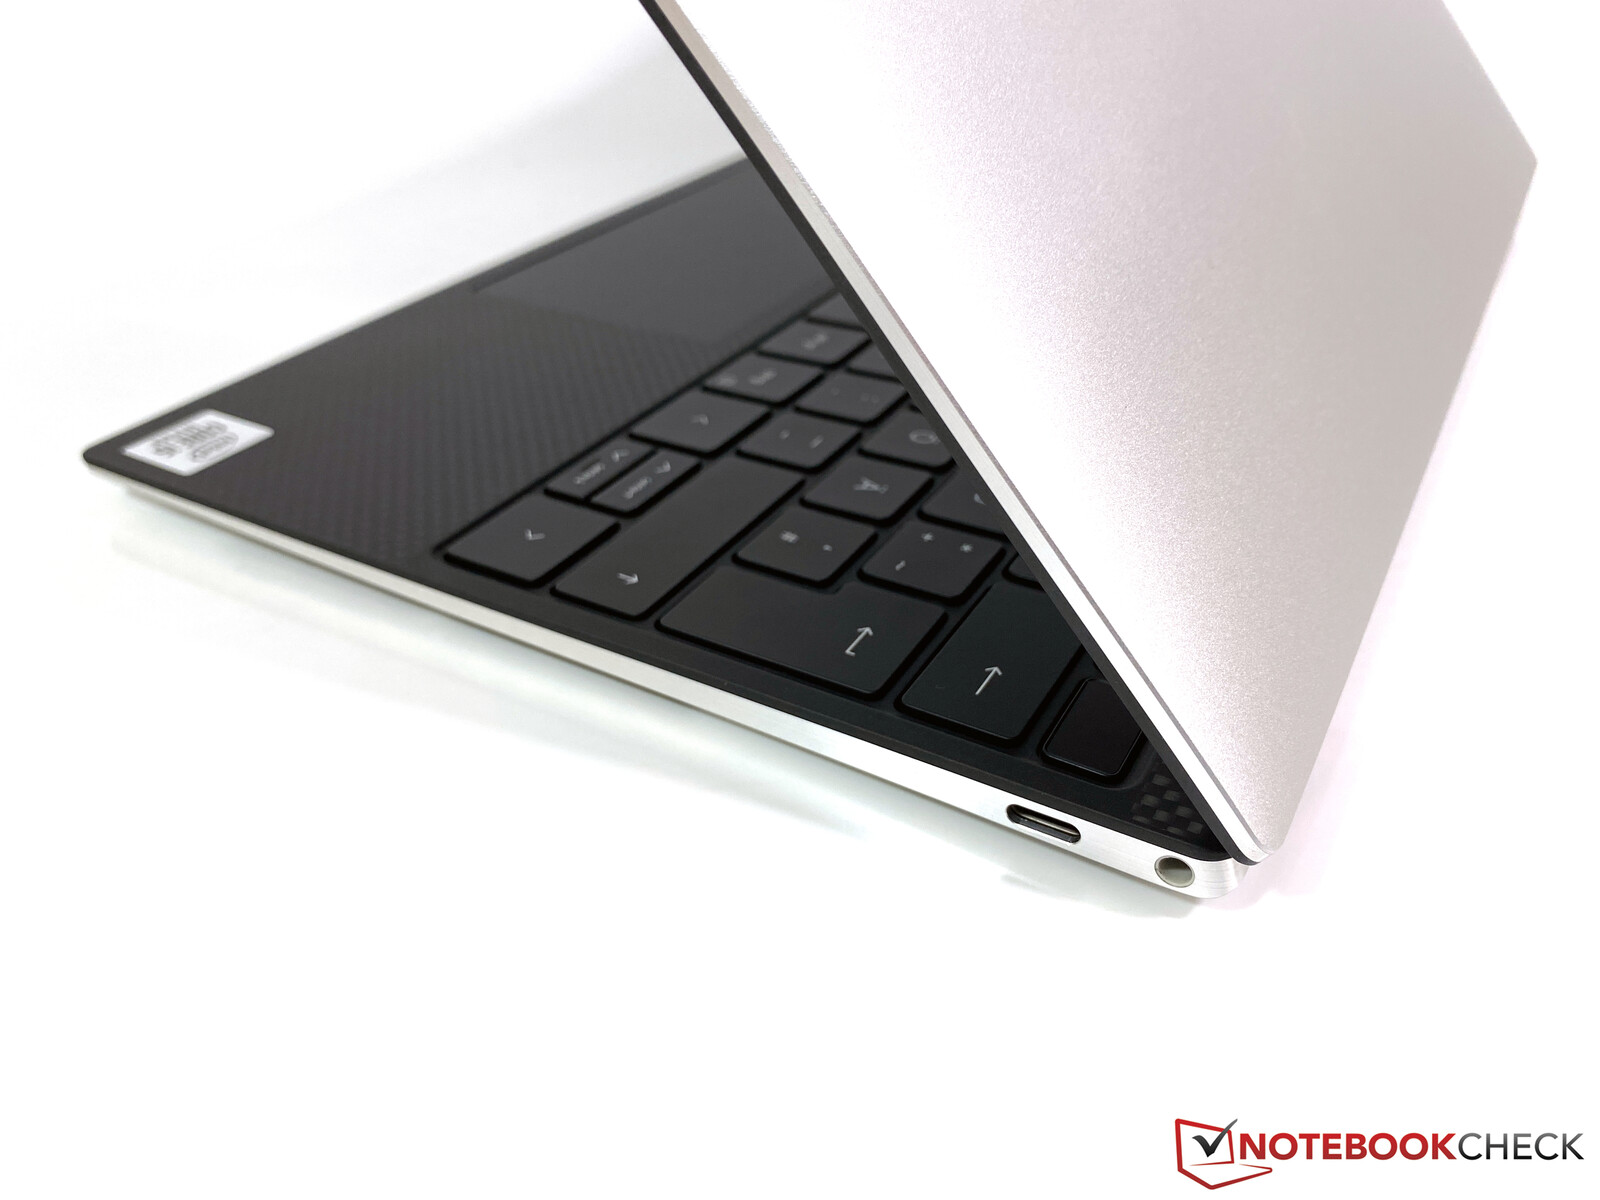
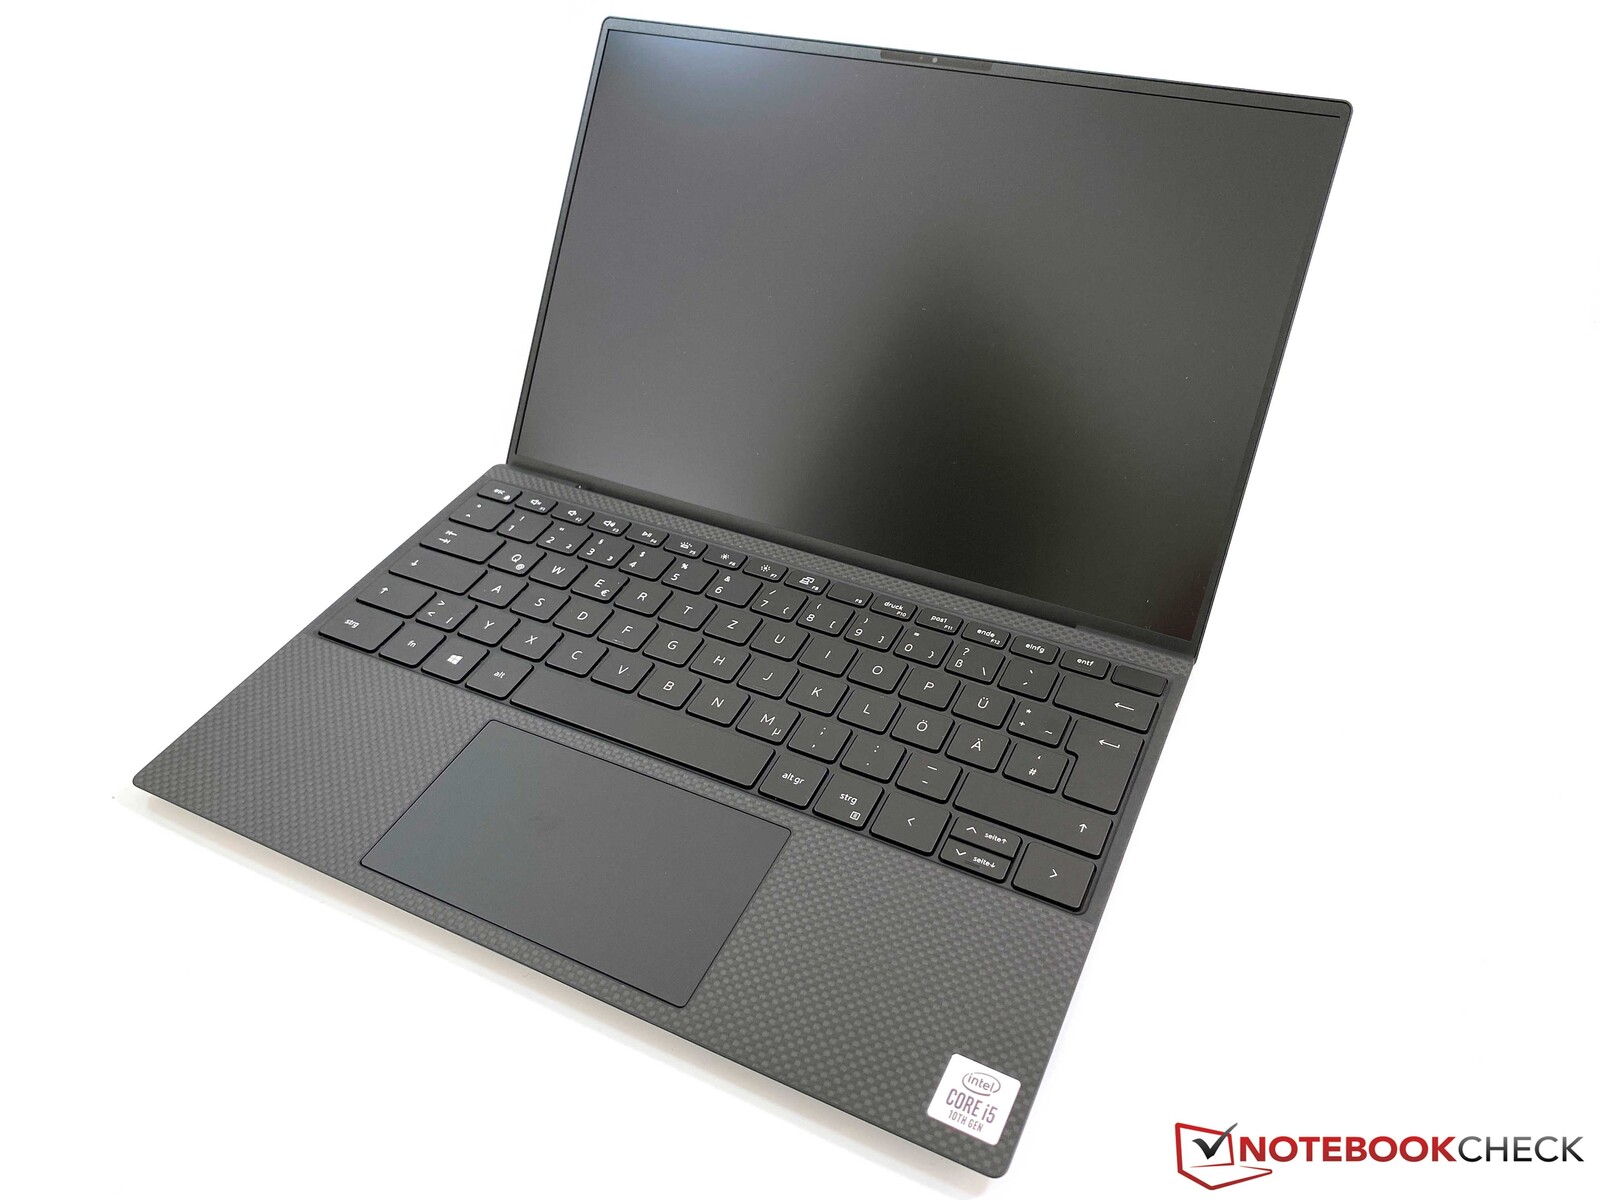
The Dell XPS 13 9300 uses a completely revised chassis compared to the previous model, but the design language is pretty much still the same. One new feature is the almost borderless keyboard and the very slim bezels (especially at the bottom), but the wedge design is familiar. In addition to our black unit, you can also get a white version.
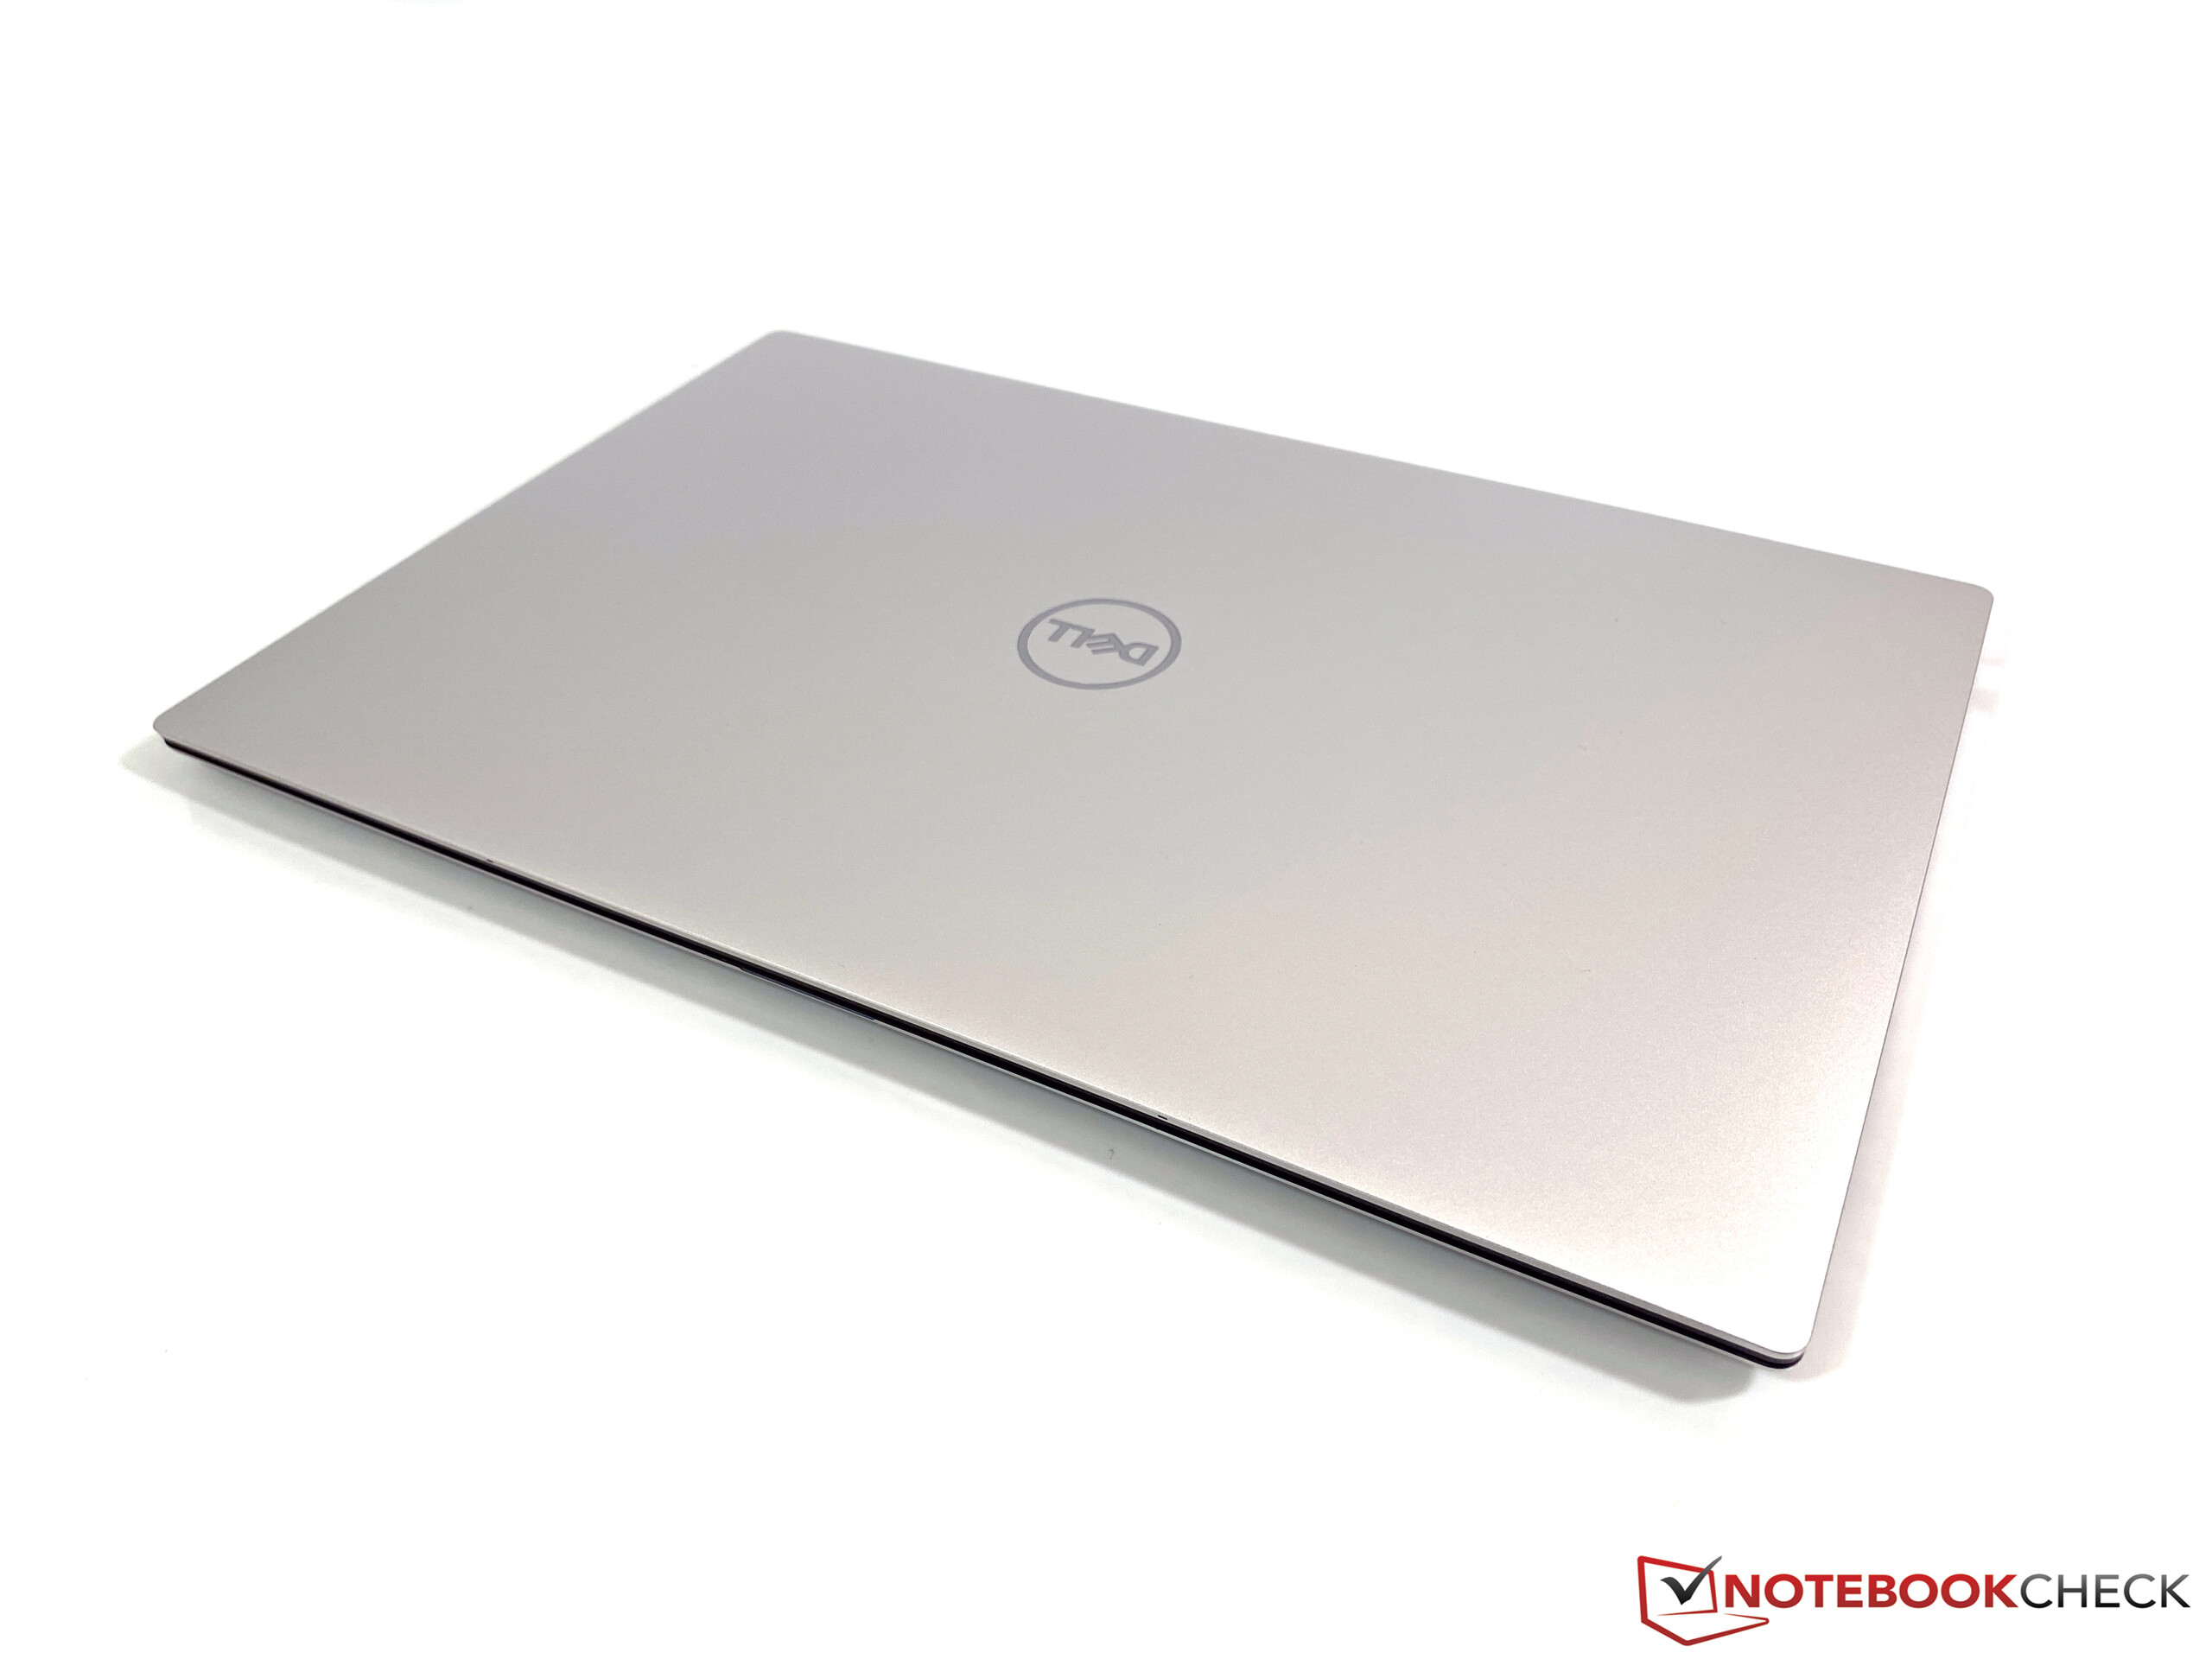
Both the lid and the bottom are made of silver aluminum, while the top of the base unit is matte black with the familiar rubberized carbon fiber pattern we know from previous models. The white unit uses glass fiber for the top of the base instead. Overall, the materials leave a very sophisticated impression and the device is well built. We did not notice any problems with fingerprints or grease during our review period, either. The surfaces along the sides are anodized and are extremely smooth. The stability of the slim lid is very good, because there are no creaking sounds and even concentrated pressure does not result in ripples on the screen. The stability of the base unit is also very good, because the surface does not move under pressure. However, there is one small issue when you try to twist the base unit, because you can hear a noise from the clickpad. The latter was not perfectly integrated into the palm rest on our unit and the lower right corner was sitting slightly deeper in the palm rest. The functionality was not affected though.

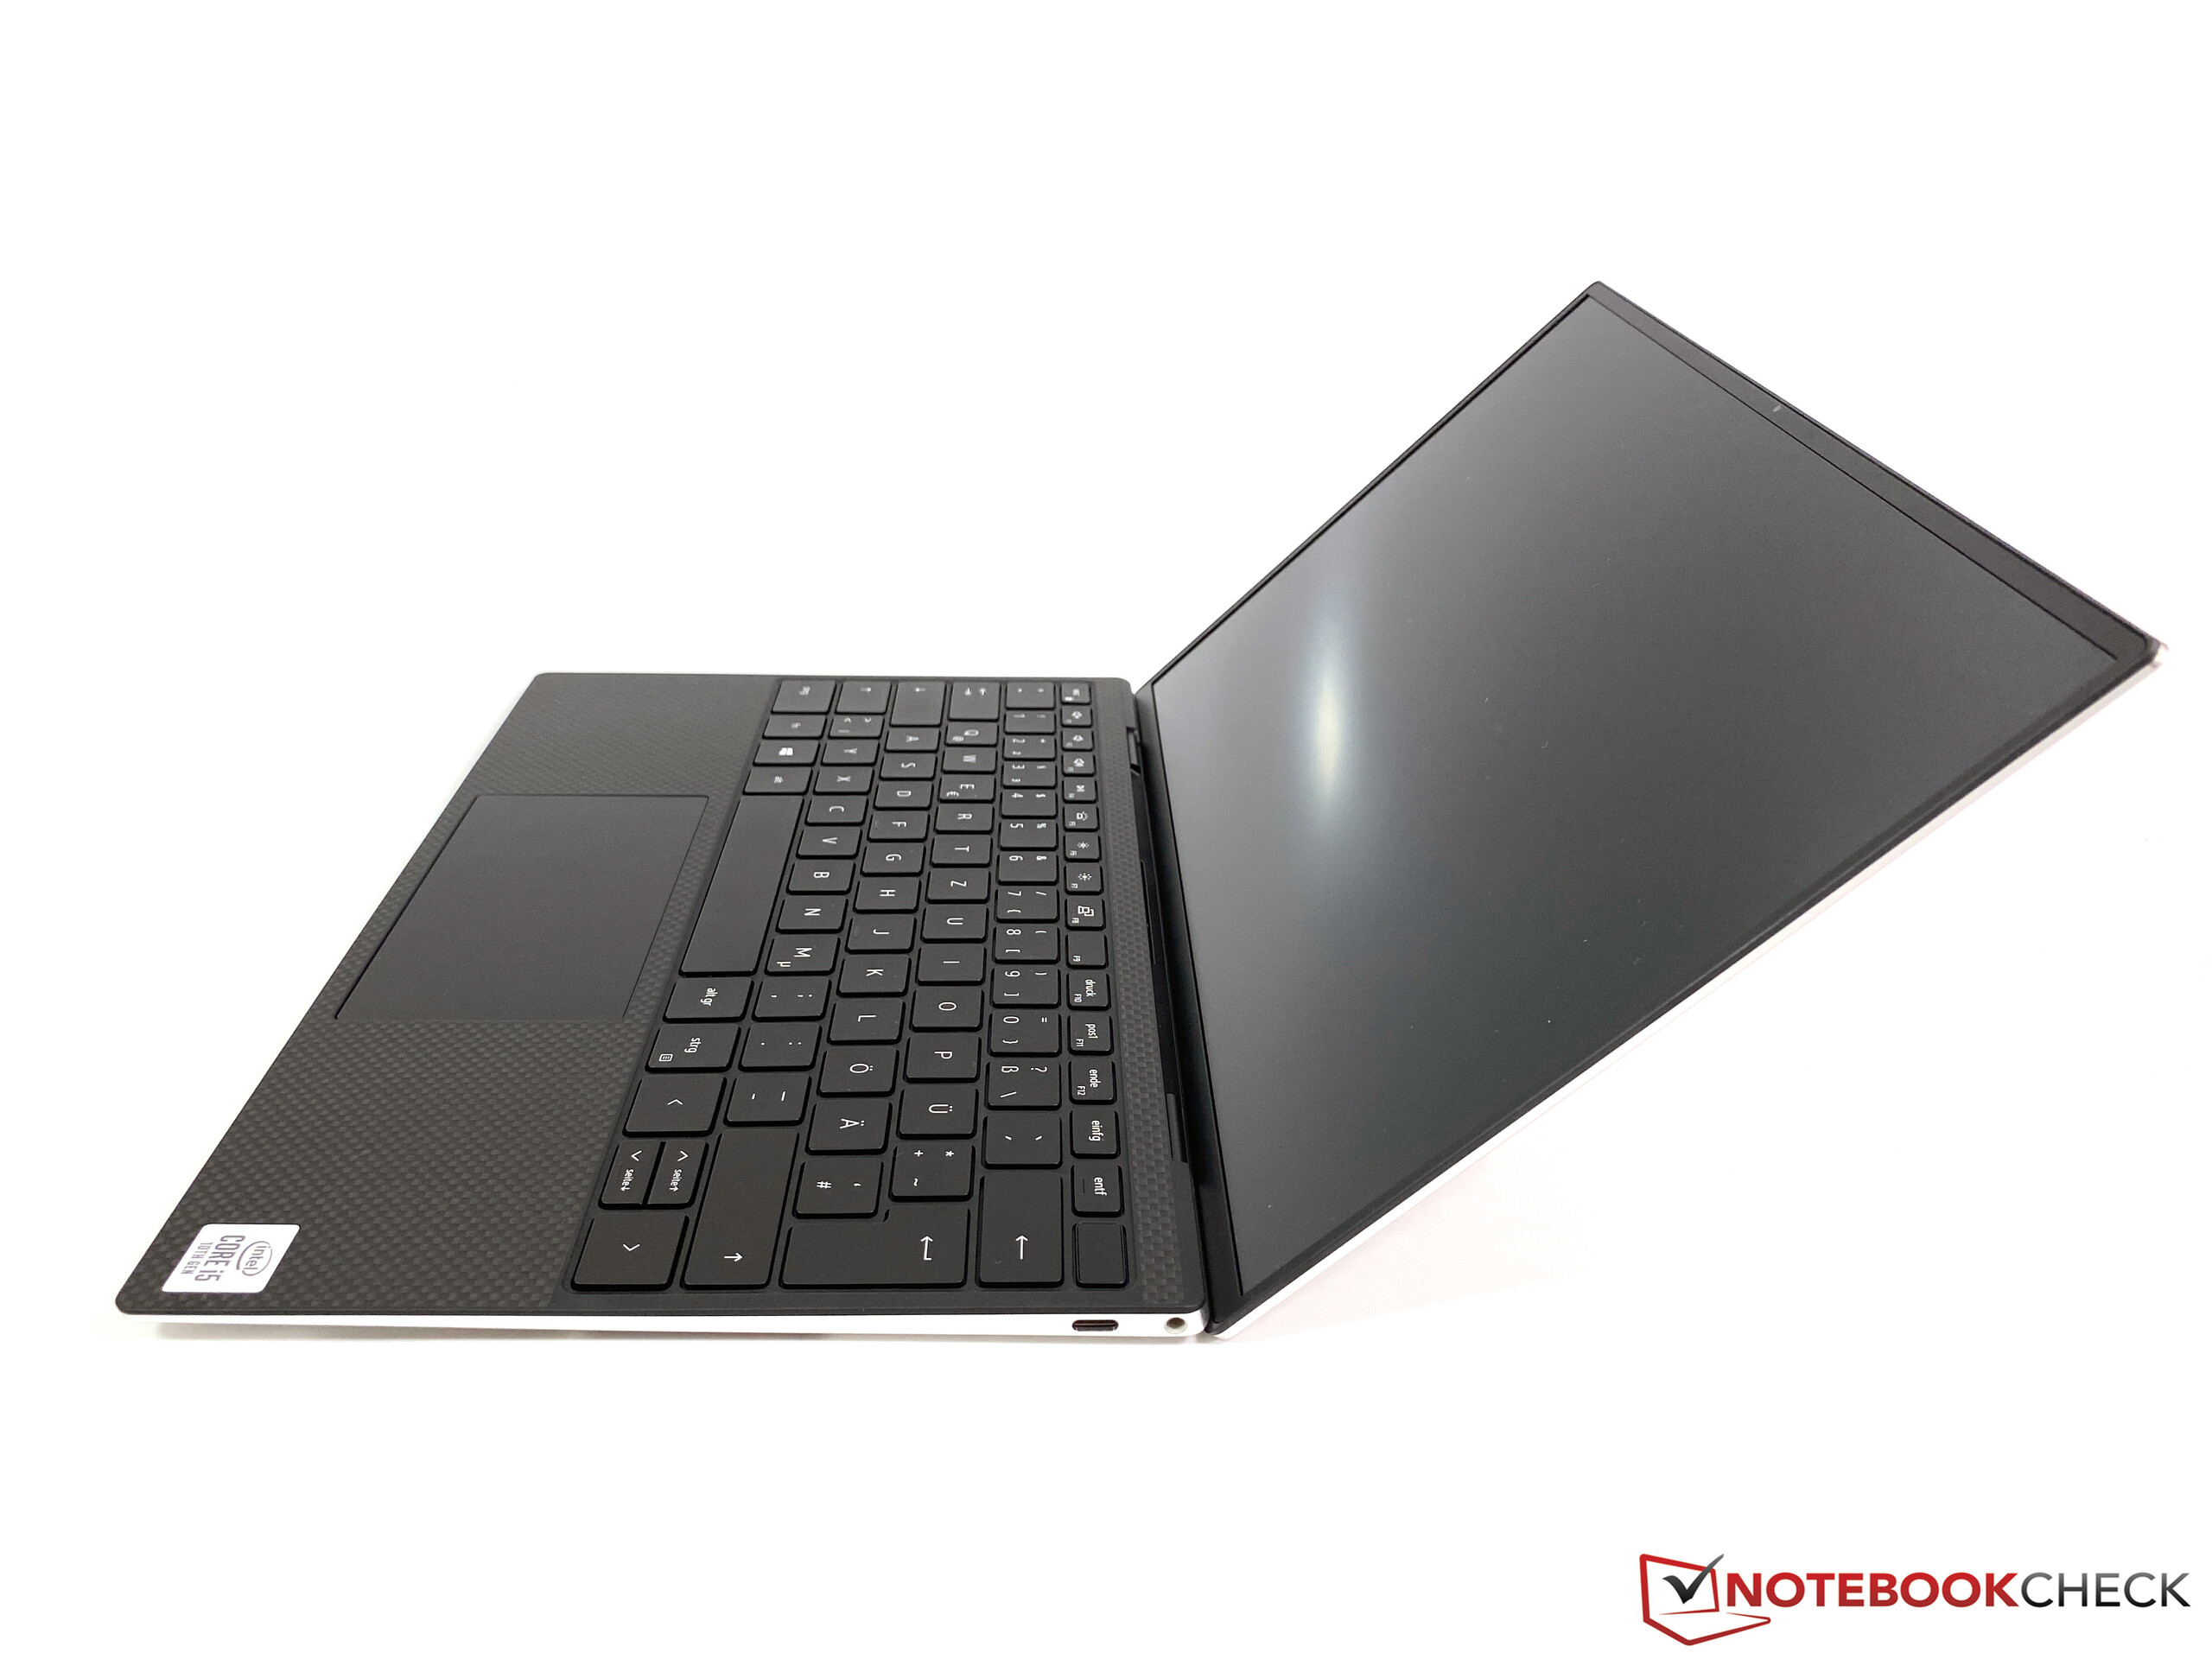
It is no problem to open the lid with one hand and the maximum opening angle is about 135 degrees. The central hinge is well adjusted and keeps the display in position without bouncing. The new hinge construction allowed for a much slimmer bottom bezel.
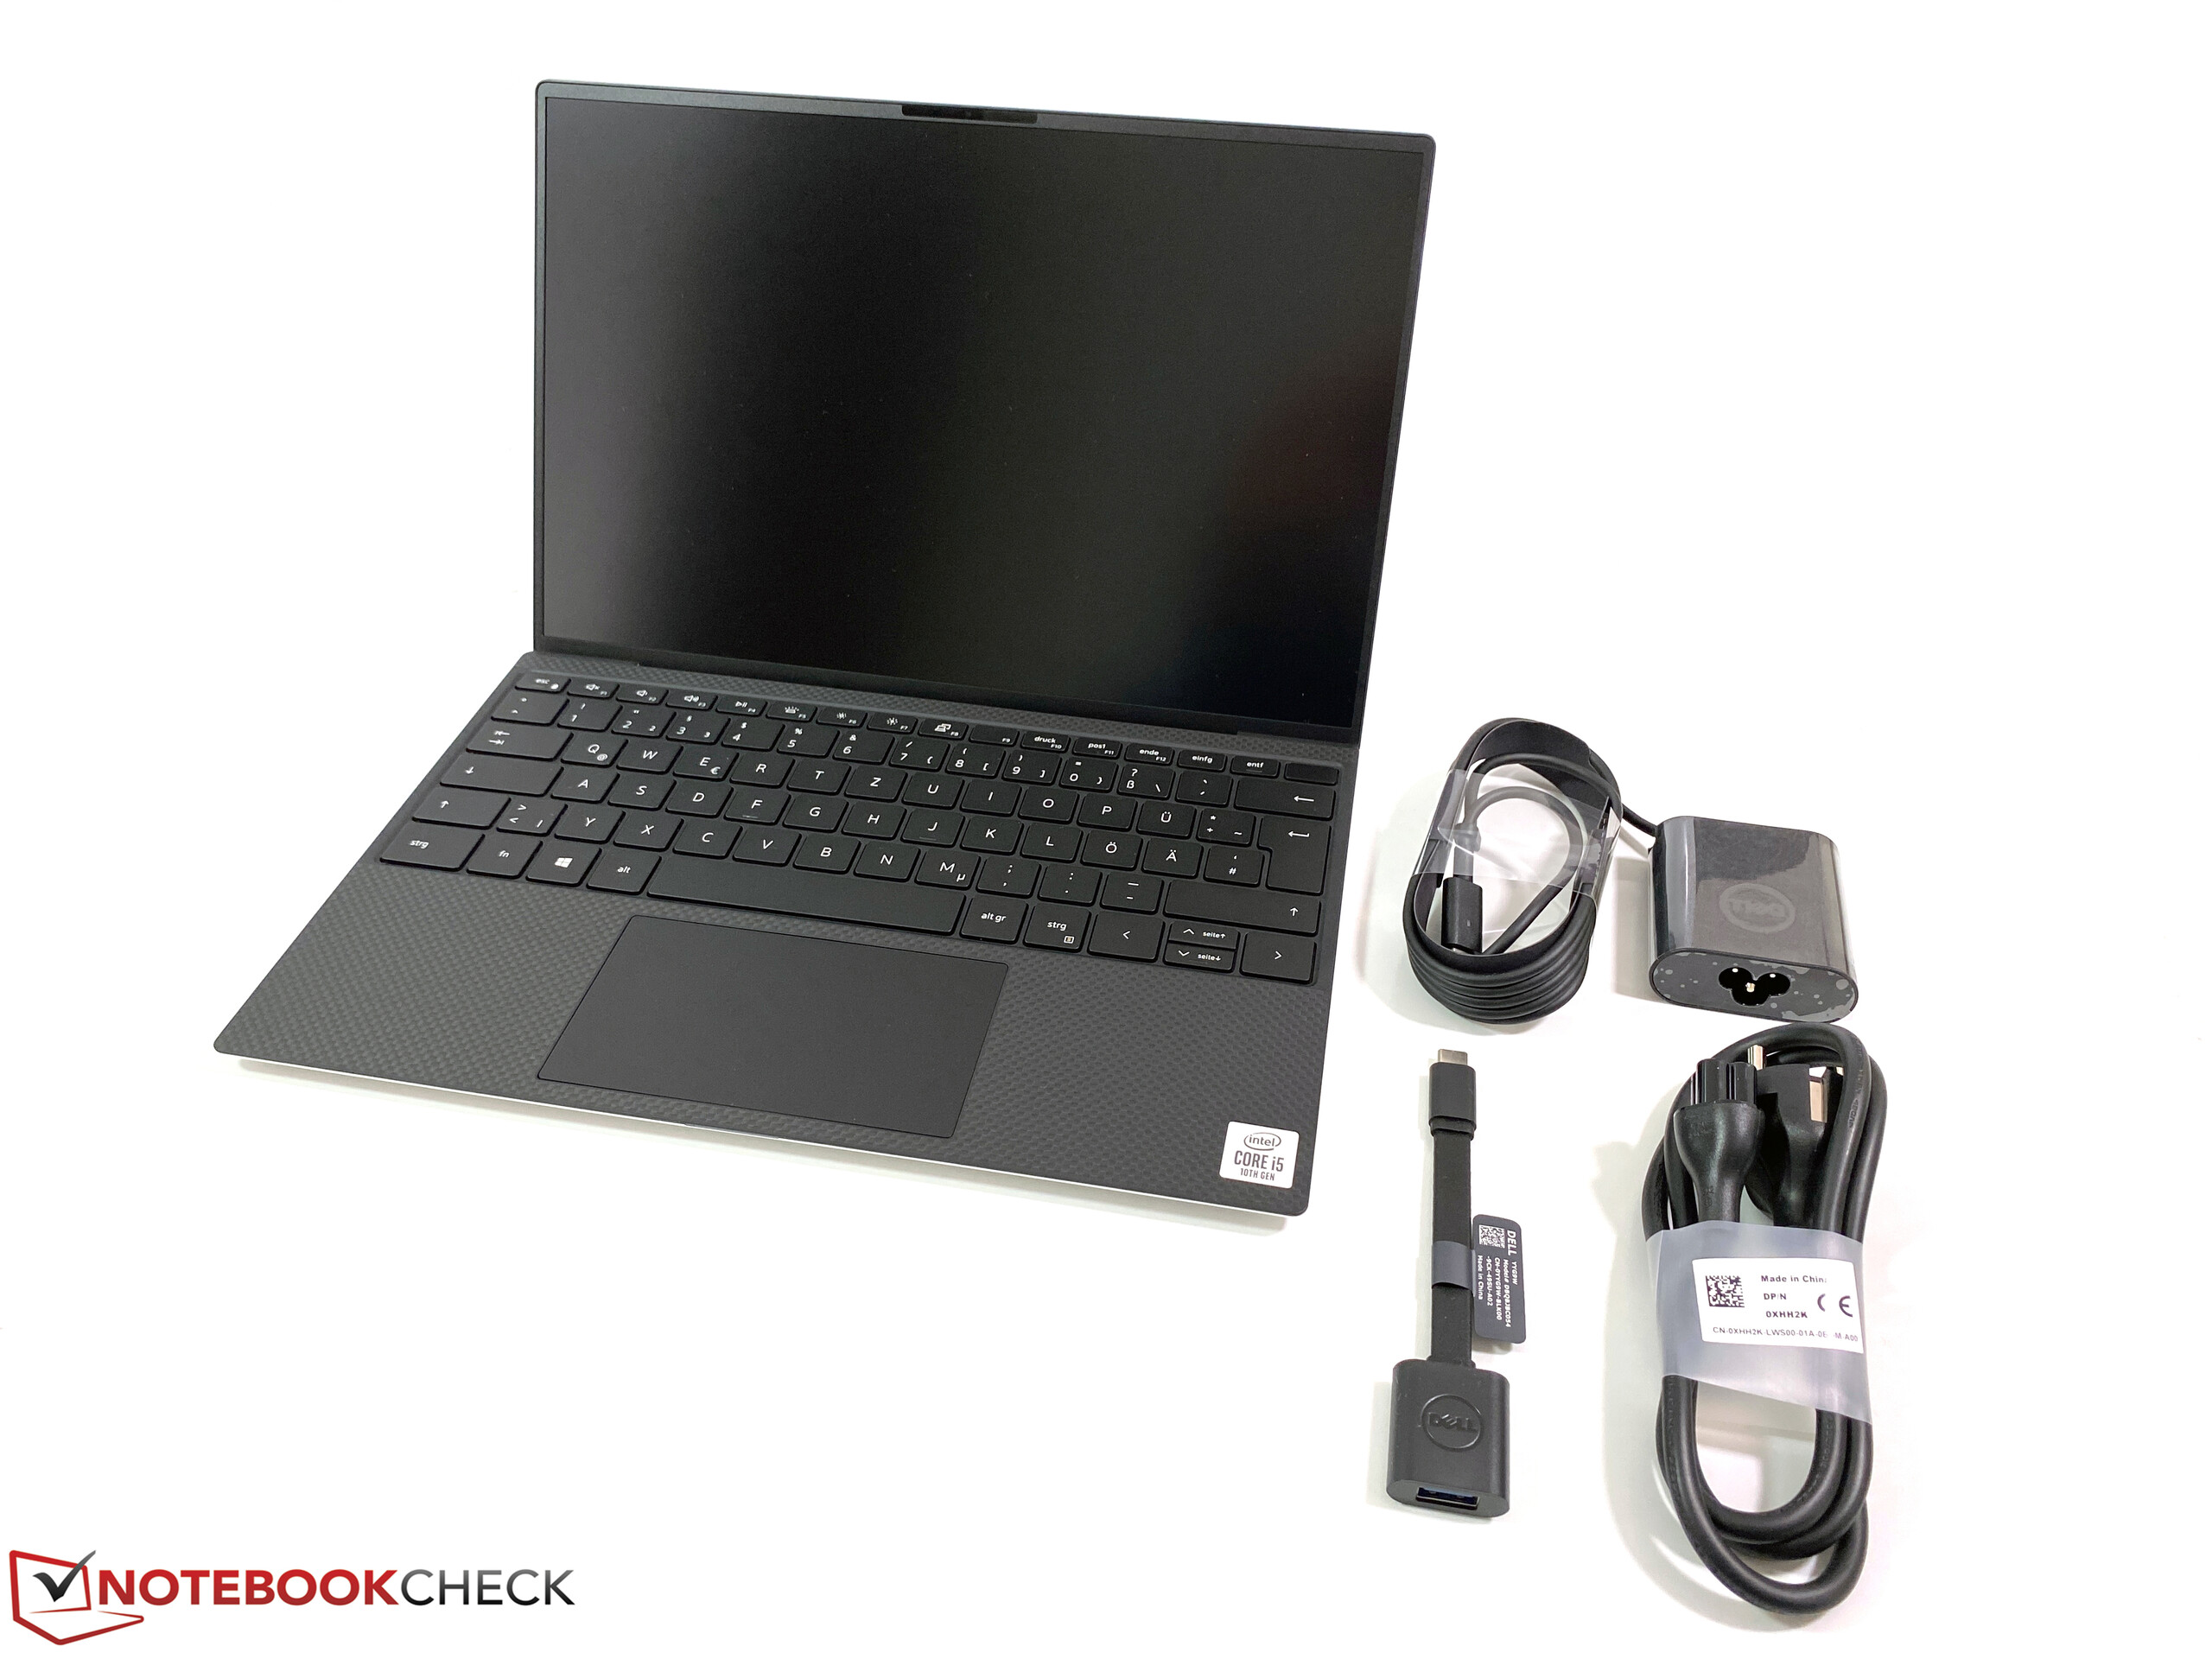

Connectivity – XPS 13 with fewer USB-C ports
Similar to the last model of the XPS 13, you only get USB-C ports (with Thunderbolt 3, full PCIe x4 interface), but this time you only get two of them. Dell also puts a USB-A adapter in the box, but since one port is automatically blocked by the power adapter, you can only use one of the two USB ports on mains. The slot for a security lock was waived as well.
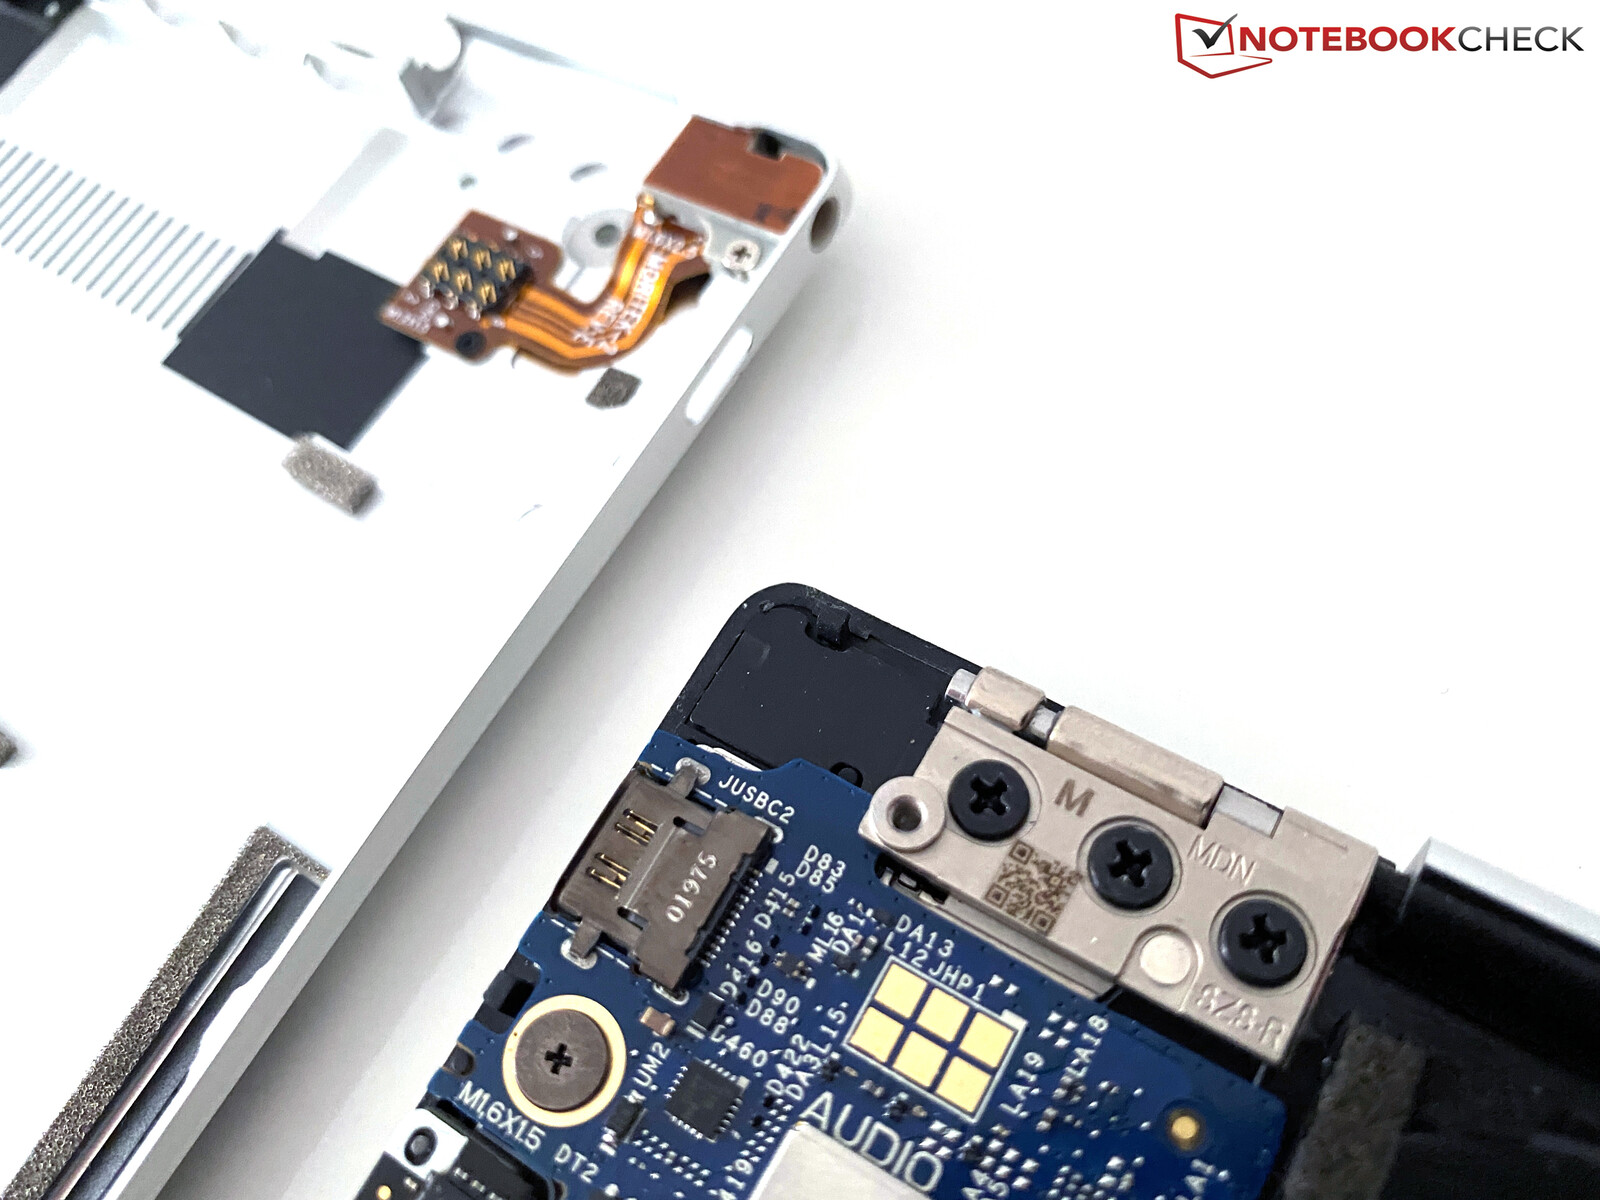
We were a bit surprised about the stereo jack once we opened the case, because the jack is integrated into the bottom cover. The attached, the contacts are just lying on the corresponding part on the mainboard. This obviously works, but we cannot comment on the long-term reliability.
SDCardreader
Dell does not remove the microSD reader, and it is once again a very fast unit. We managed transfer rates of up to 195 MB/s in combination with our reference card from Toshiba (Exceria Pro M501).
| SD Card Reader | |
| average JPG Copy Test (av. of 3 runs) | |
| Dell XPS 13 9380 2019 (Toshiba Exceria Pro SDXC 64 GB UHS-II) | |
| Dell XPS 13 9300 i5 FHD (Toshiba Exceria Pro M501 64 GB UHS-II) | |
| Dell XPS 13 7390 2-in-1 Core i7 (Toshiba Exceria Pro M501 64 GB UHS-II) | |
| Lenovo ThinkPad X390-20Q1S02M00 (Toshiba Exceria Pro M501) | |
| Average of class Subnotebook (18.9 - 193.9, n=17, last 2 years) | |
| maximum AS SSD Seq Read Test (1GB) | |
| Dell XPS 13 9300 i5 FHD (Toshiba Exceria Pro M501 64 GB UHS-II) | |
| Dell XPS 13 9380 2019 (Toshiba Exceria Pro SDXC 64 GB UHS-II) | |
| Dell XPS 13 7390 2-in-1 Core i7 (Toshiba Exceria Pro M501 64 GB UHS-II) | |
| Lenovo ThinkPad X390-20Q1S02M00 (Toshiba Exceria Pro M501) | |
| Average of class Subnotebook (23.6 - 239, n=17, last 2 years) | |
Communication – Dell's Subnotebook with fast Wi-Fi 6
There is currently only one WLAN module for the XPS 13, which is provided by Killer (AX1650s) and also supports fast Wi-Fi 6. In our standardized test with the router Netgear Nighthawk RAX120, we managed to utilize the full potential of the card, at least when it receives data. Here we can measure almost 1.5 Gbps, while the send performance topped out at about 900 Mbps. All in all, the results are still very good and we did not experience any stability issues during the review period, neither with the router from Netgear, nor a Fritz!Box 7490.
Webcam – Above the screen, but poor quality
Dell managed to locate the webcam above the screen, despite the very slim bezel. The manufacturer also advertises an improved quality, but we cannot really confirm that. There is plenty of picture noise, even in good lighting conditions. The webcam is sufficient for simple Skype calls, for example, but decent smartphone front cameras are superior by quite a margin.
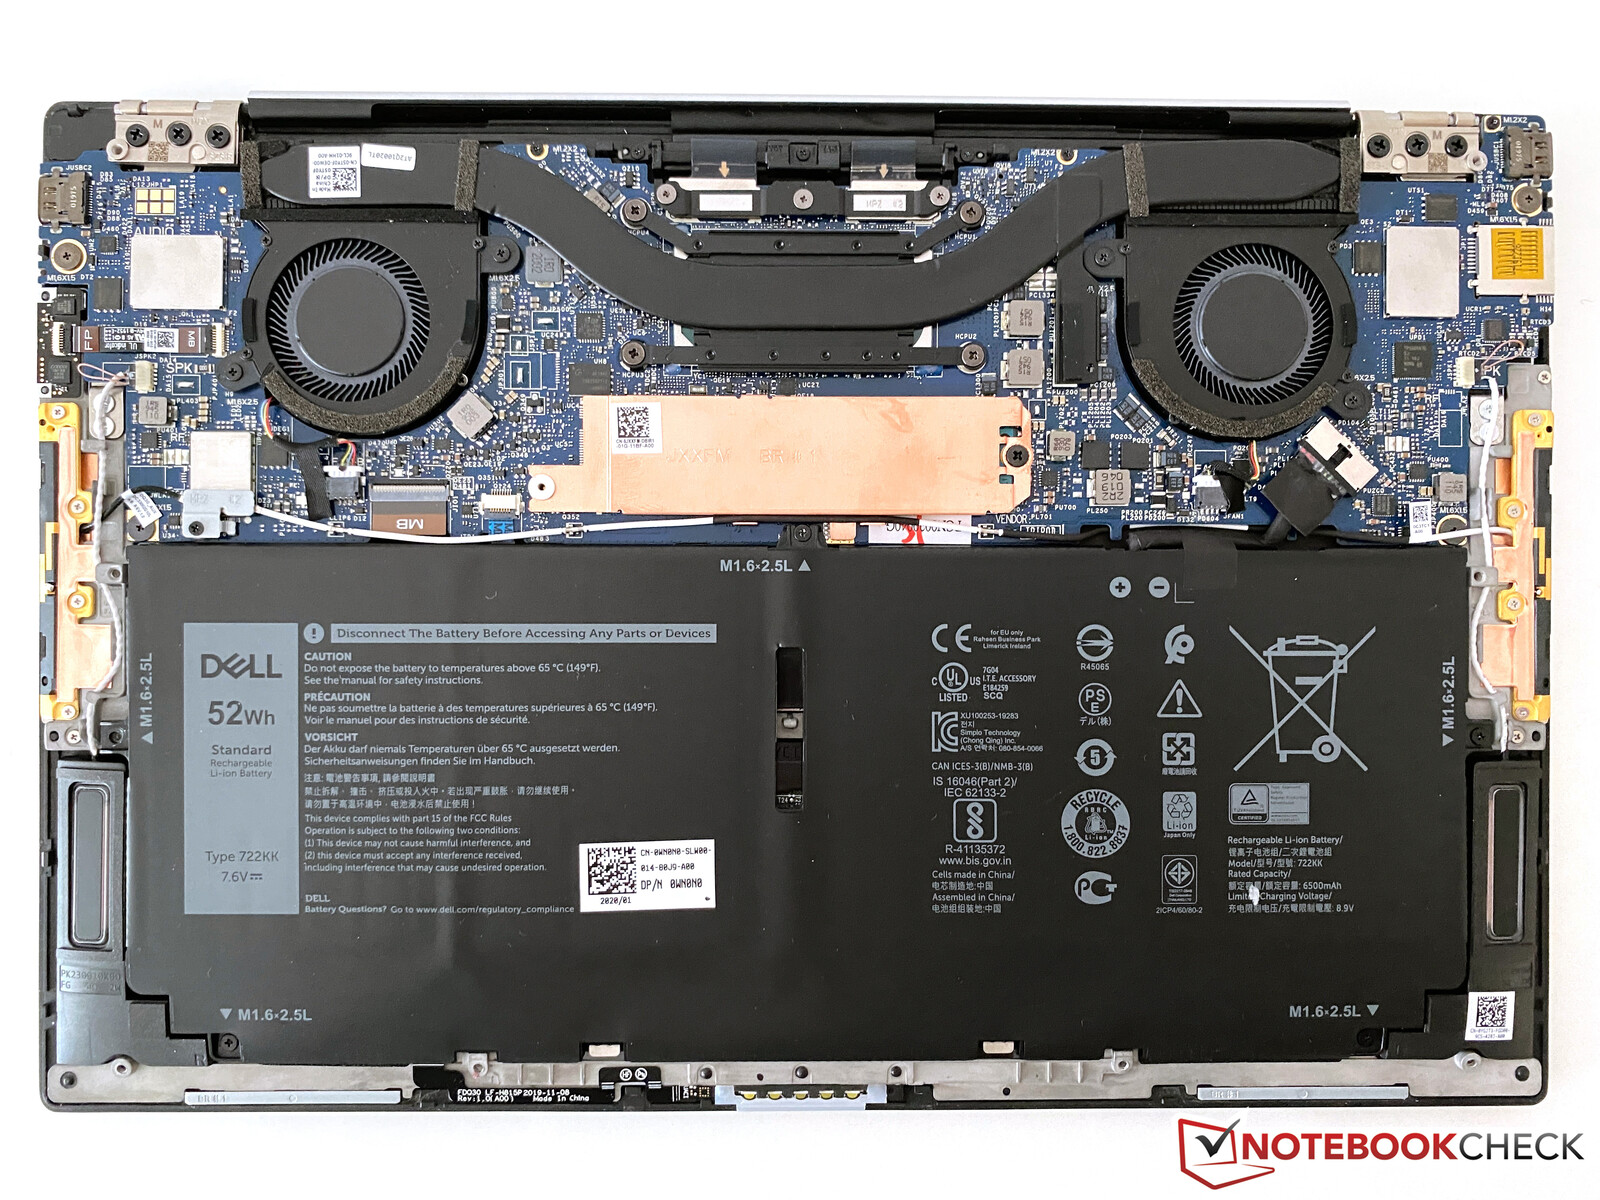
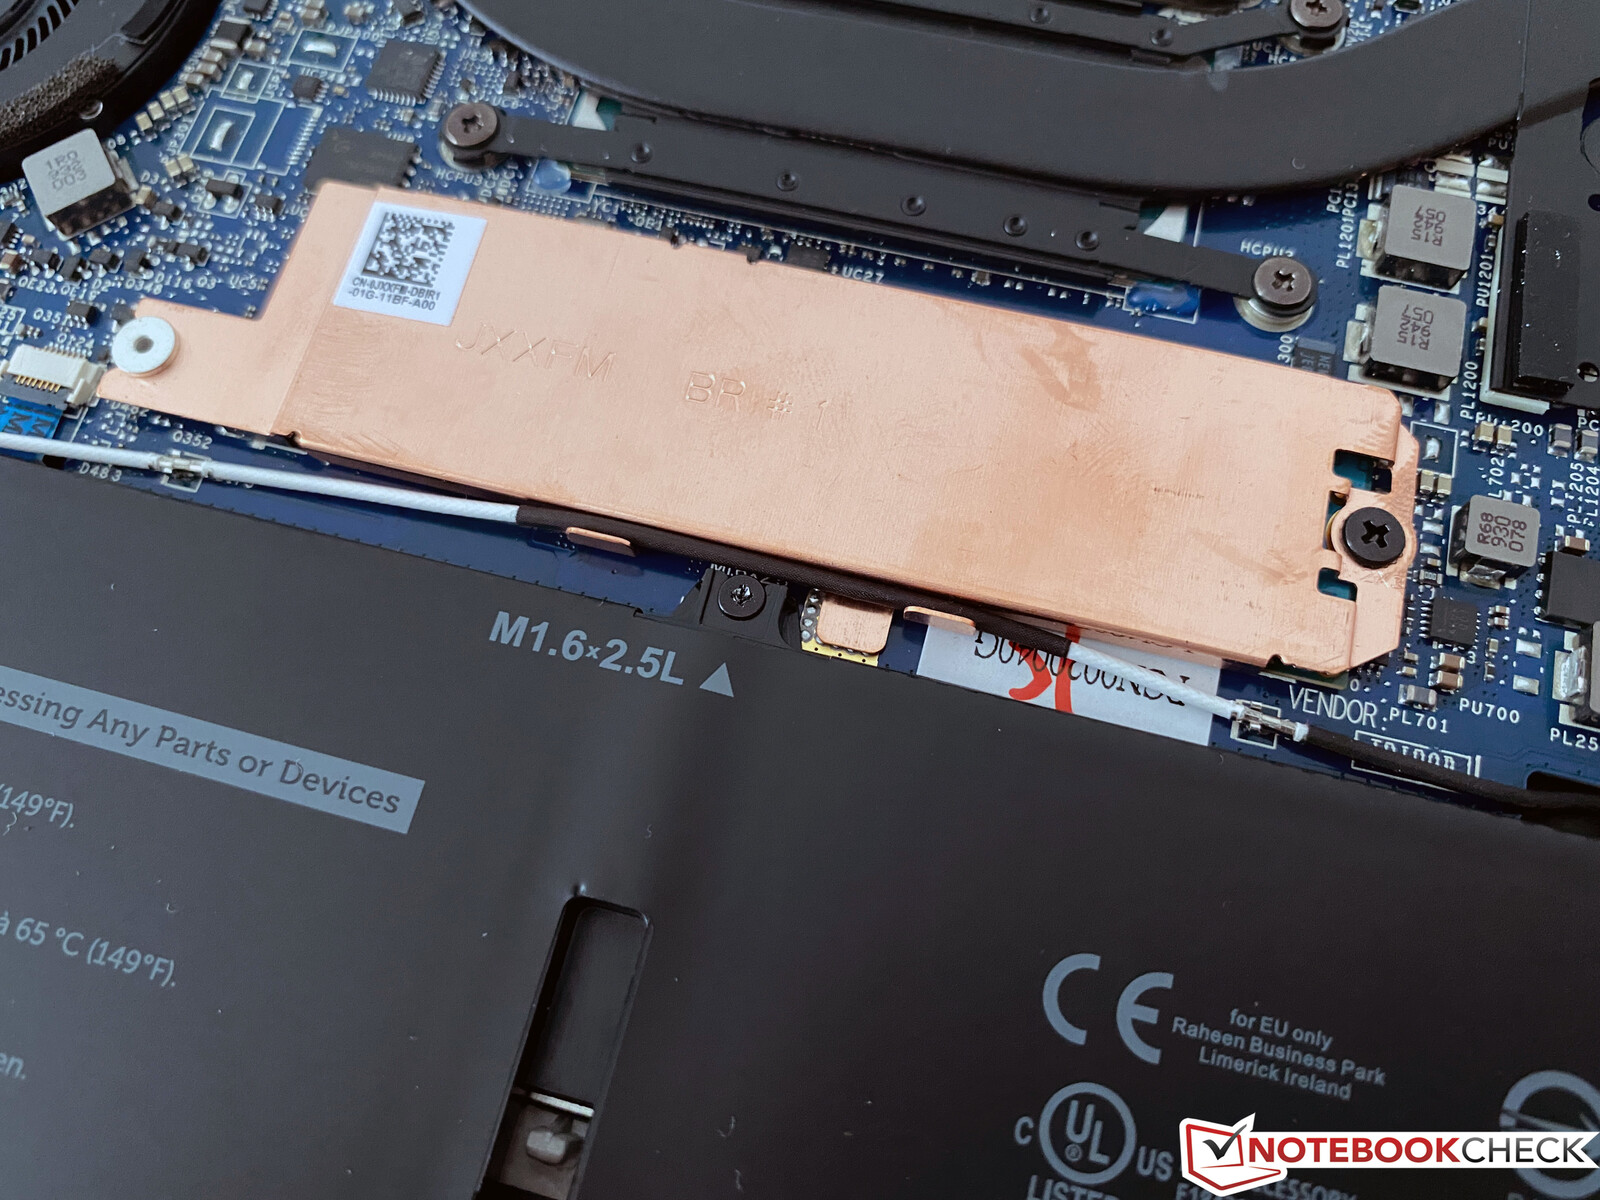
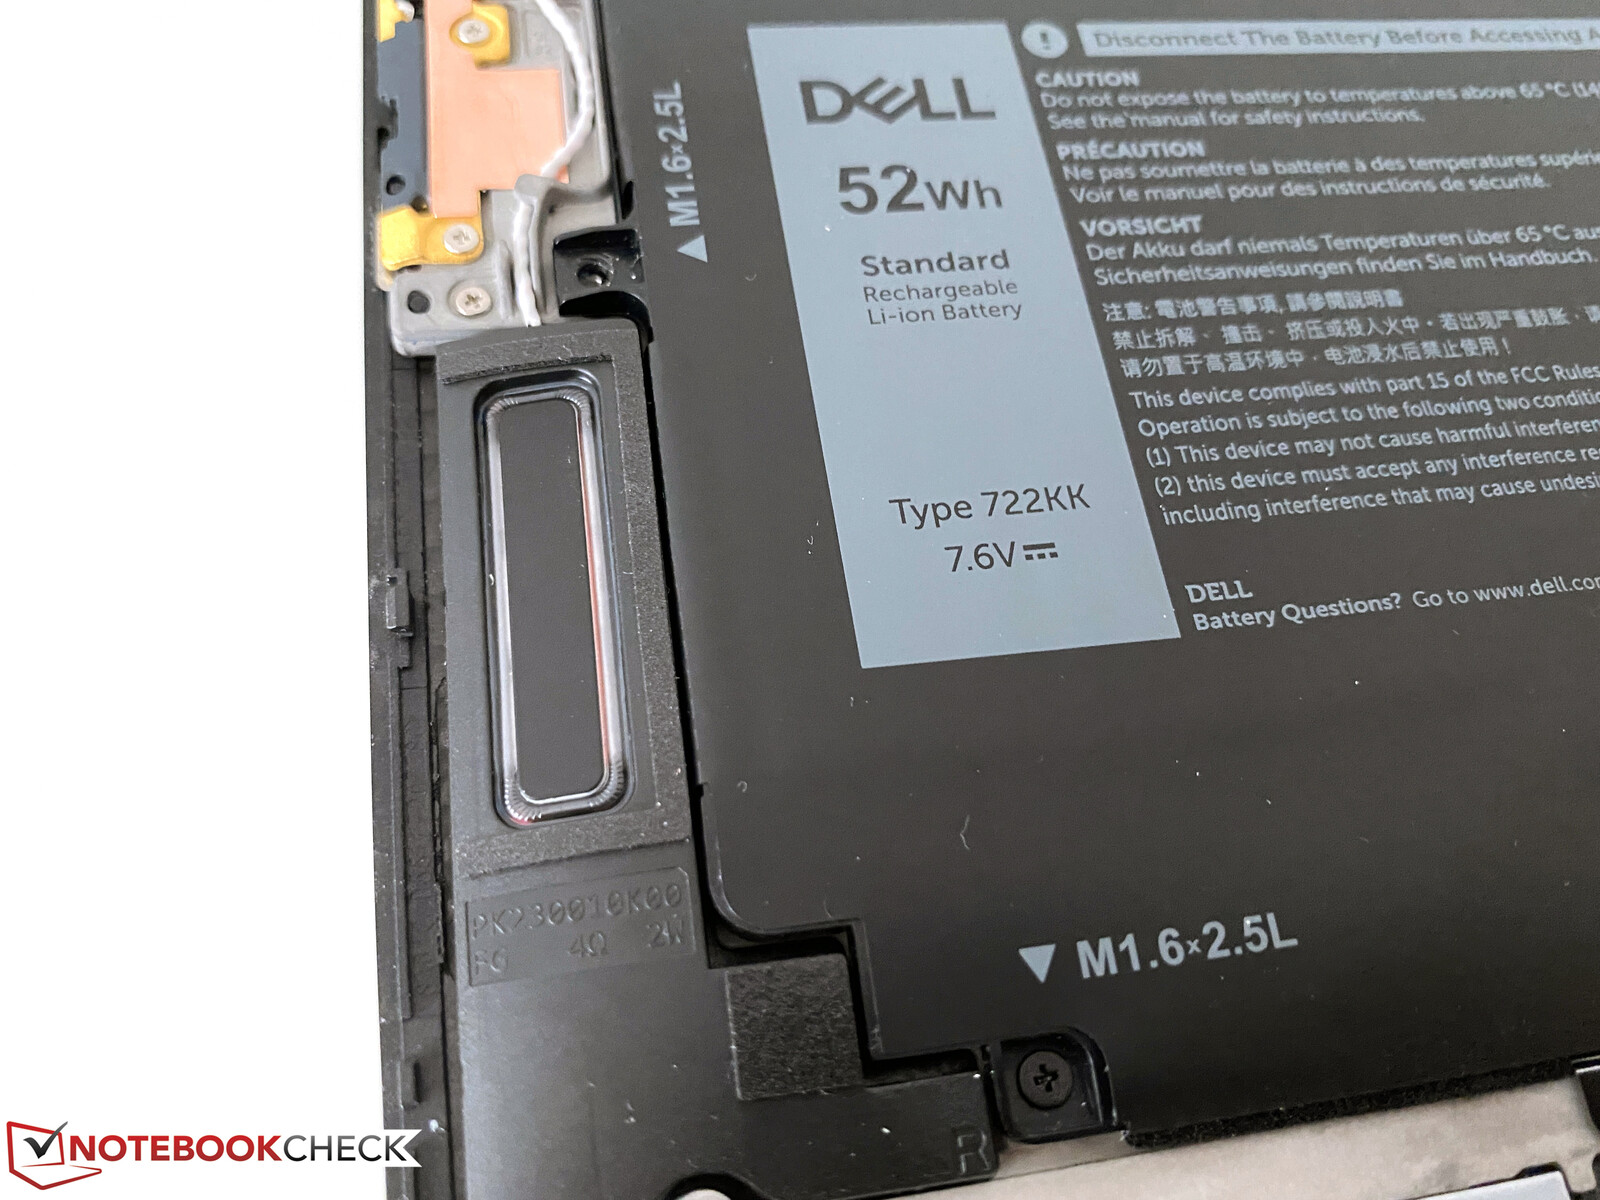
Maintenance
The bottom cover can be removed with a corresponding screw driver (Torx T5). Inside you see the two fans and the M.2-2280 SSD, which is located underneath a metal plate. It is also possible to replace the battery in theory, but that is about it.
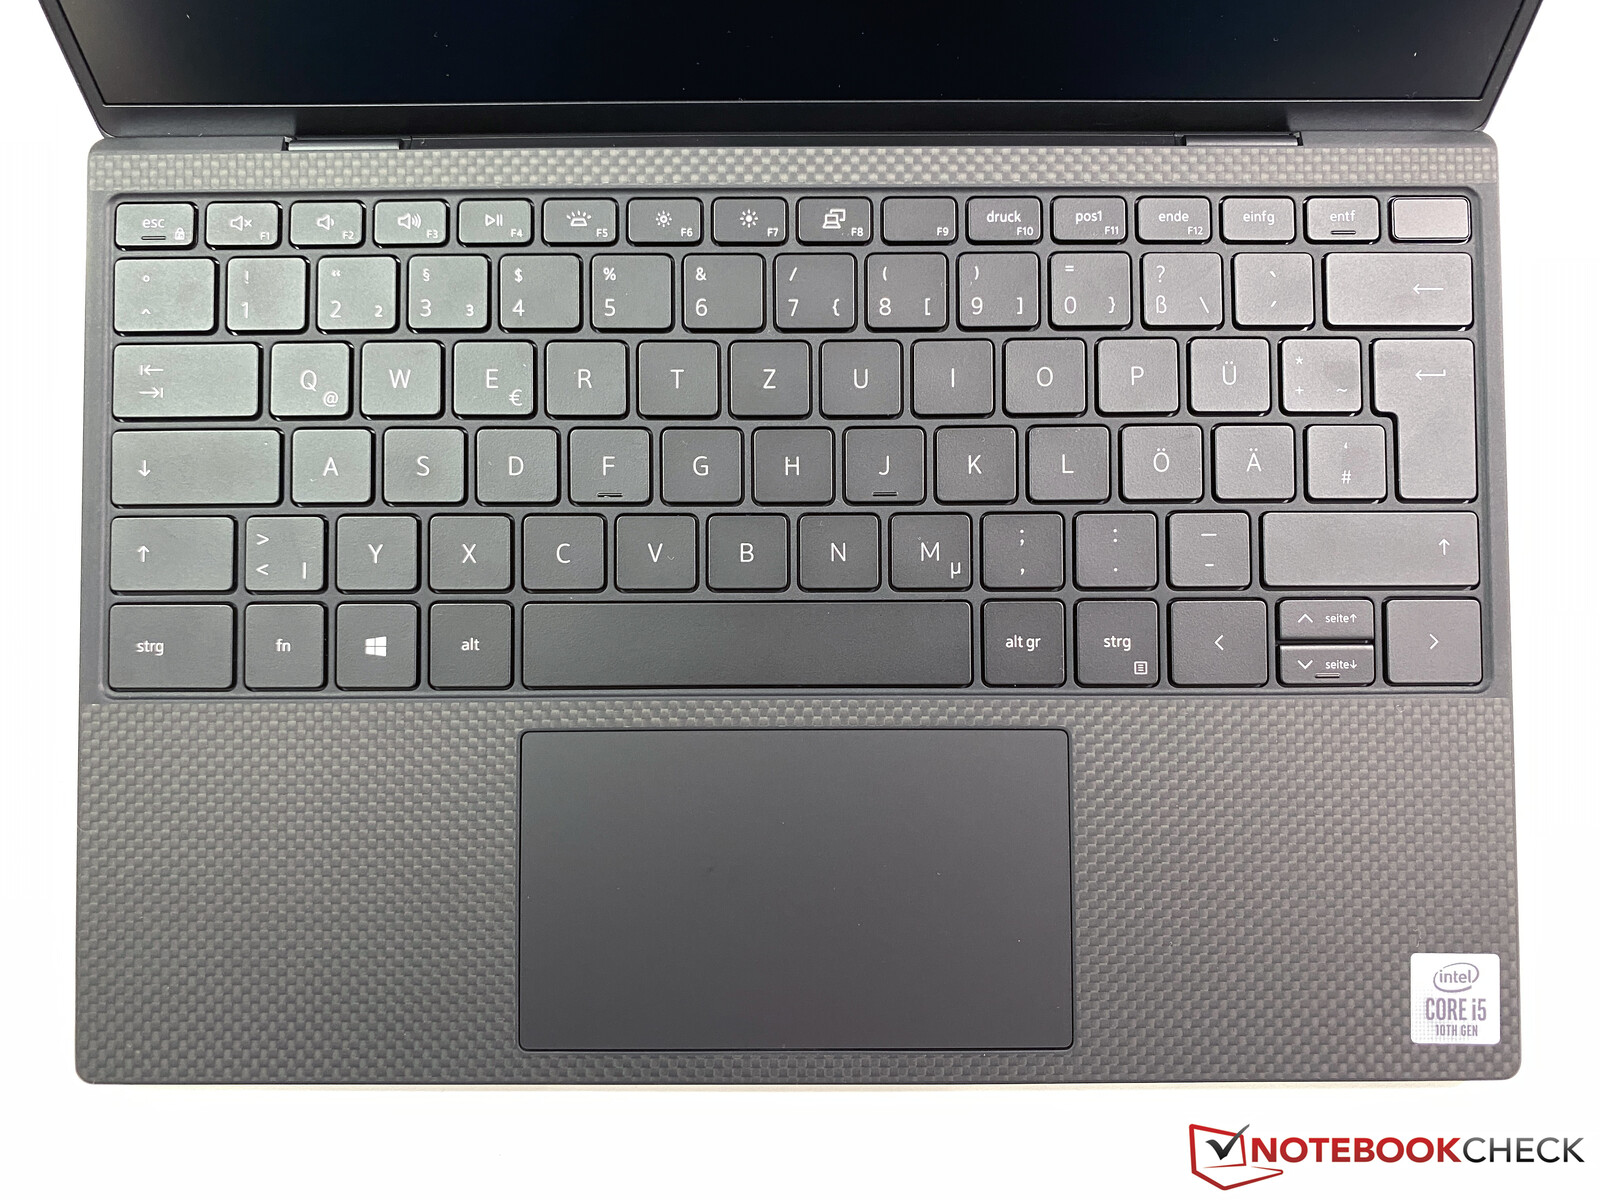
Input Devices – XPS 13 with decent, but loud keyboard
Keyboard
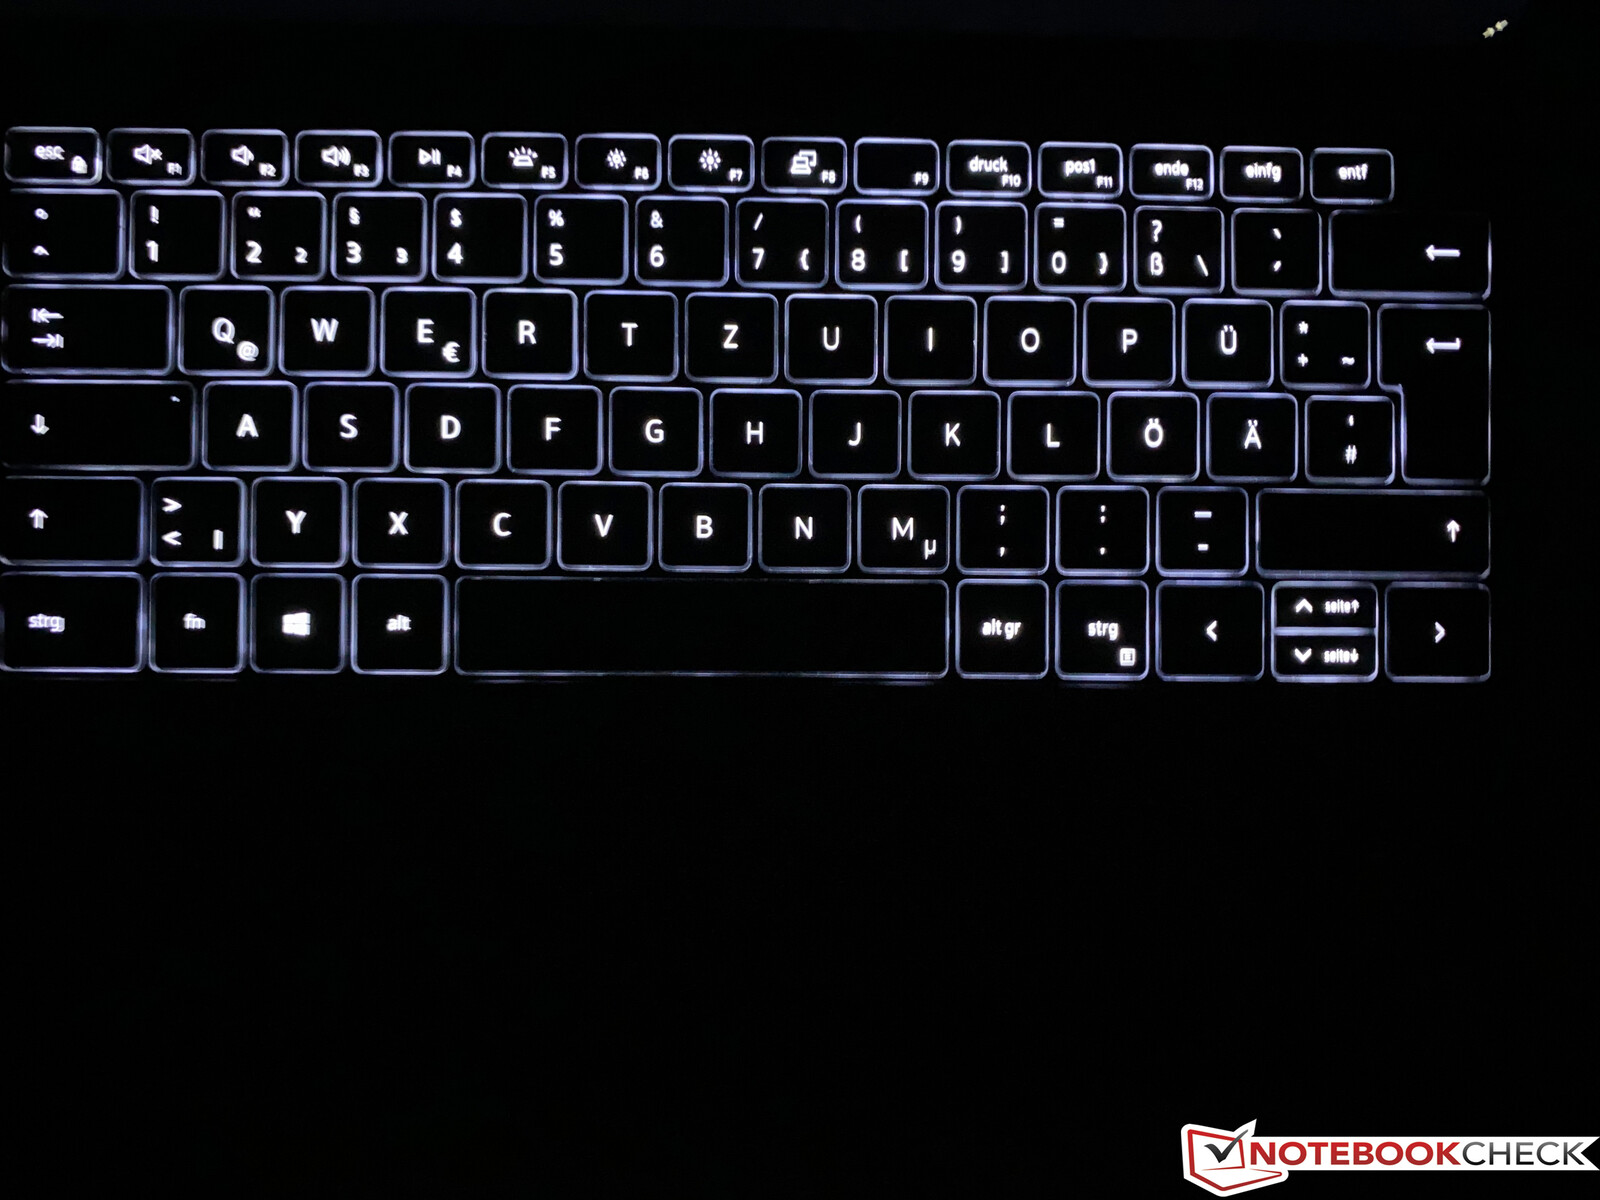
The keyboard has changed, and the subjective typing experience is now a bit richer. Even longer texts can be entered very comfortably. The power button is now integrated into the upper right corner of the keyboard, which can result in wrong inputs at first if you expect the Del-key at this spot. The power button also accommodates a fingerprint scanner, which works reliably. The biggest drawback of this keyboard is the pretty loud typing noise.
You still get a two-stage white background illumination. It will turn off after a couple of seconds by default, but you can change the duration in the BIOS or even activate it permanently.
We prefer the input over the previous XPS 13 as well as the current MacBook Pro 13 (Butterfly keyboard) and it is comparable to the current Apple keyboard in the MacBook Pro 16, which will soon be available in Apple's smaller laptops as well. However, it is not quite in the same ballpark as serious business laptops like HP's EliteBook series or Lenovo's ThinkPads.
Touchpad
The touchpad of the XPS 13 is 11.2 x 6.5 cm (~4.4 x 2.6 inches) and offers plenty of space for inputs. We like the gliding capabilities and basic inputs are well executed, but we had some issues with drag-and-dop gestures and our inputs were sometimes not executed reliably. Apple's trackpads are still superior in this respect.
As we have already mentioned in the section Case, the touchpad of our unit was not perfectly integrated into the base unit. The lower right corner was sitting a bit deeper, but it did not affect the functionality.
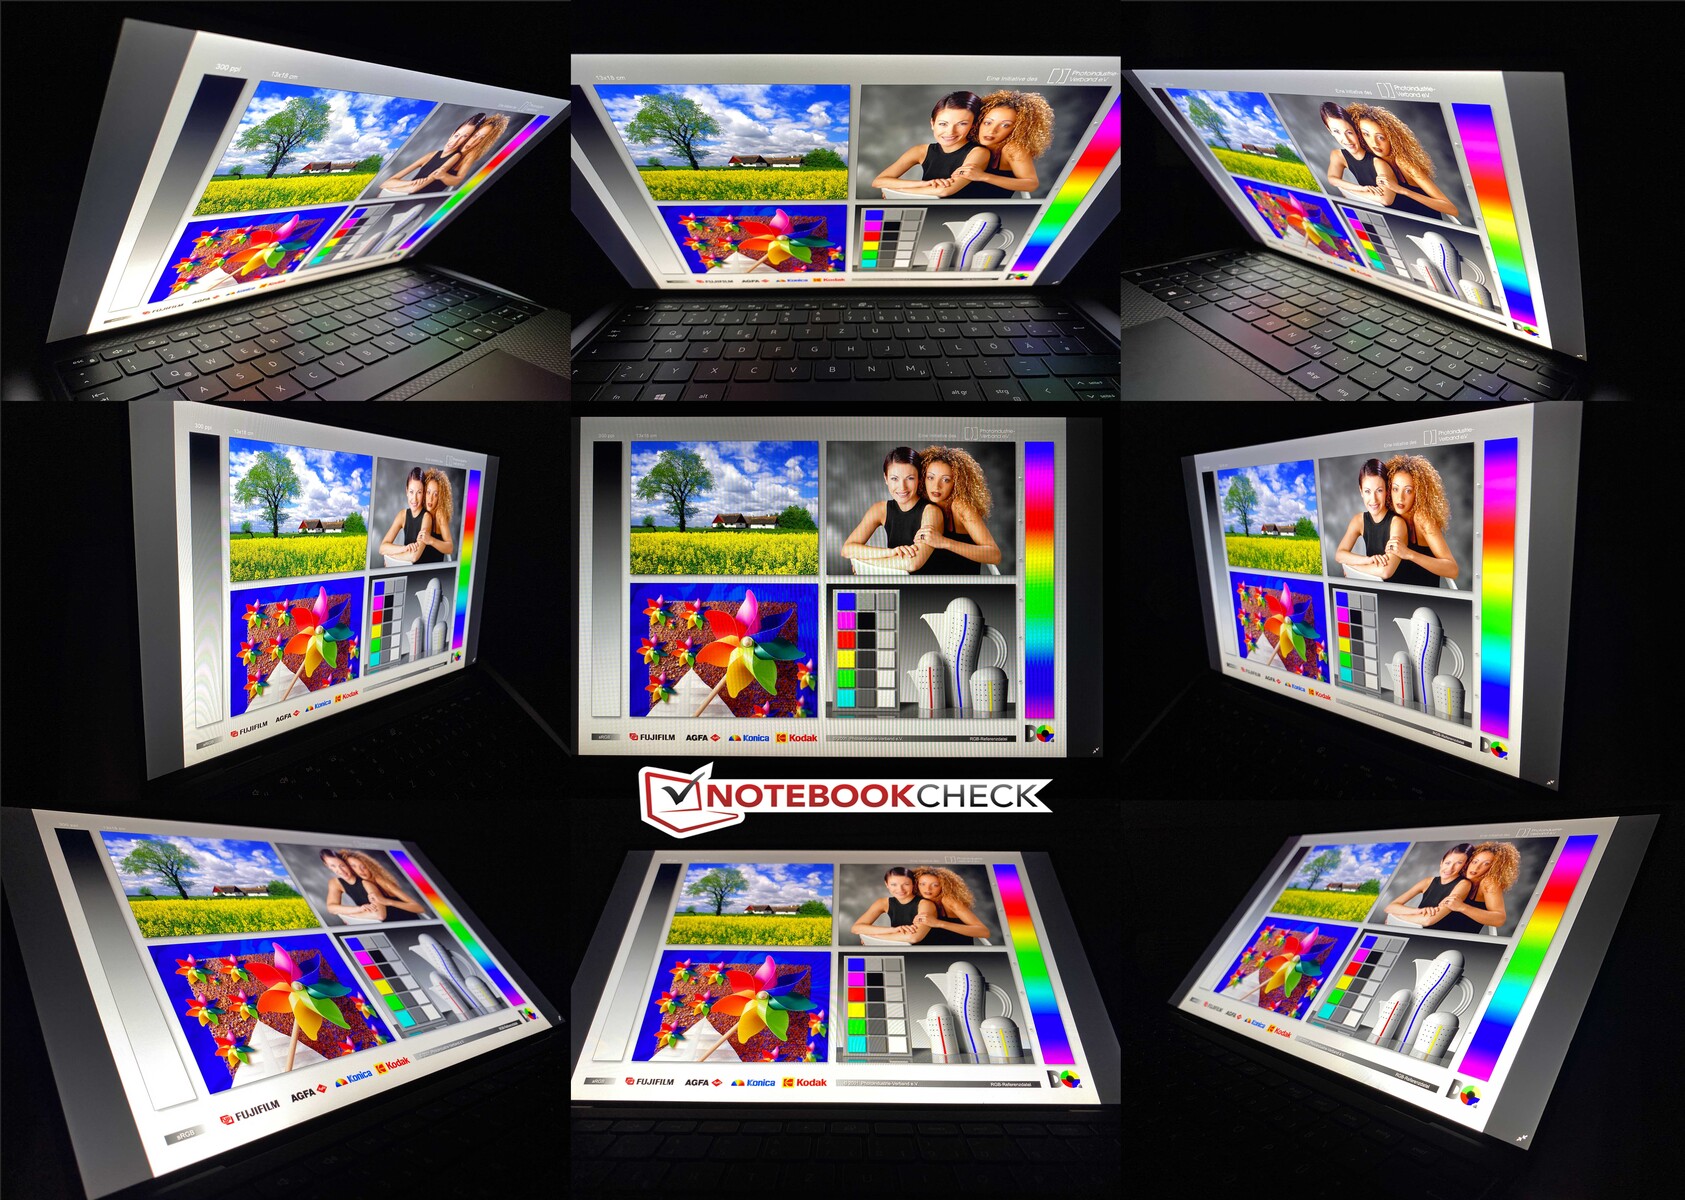
Display – XPS 13 with matte IPS screen
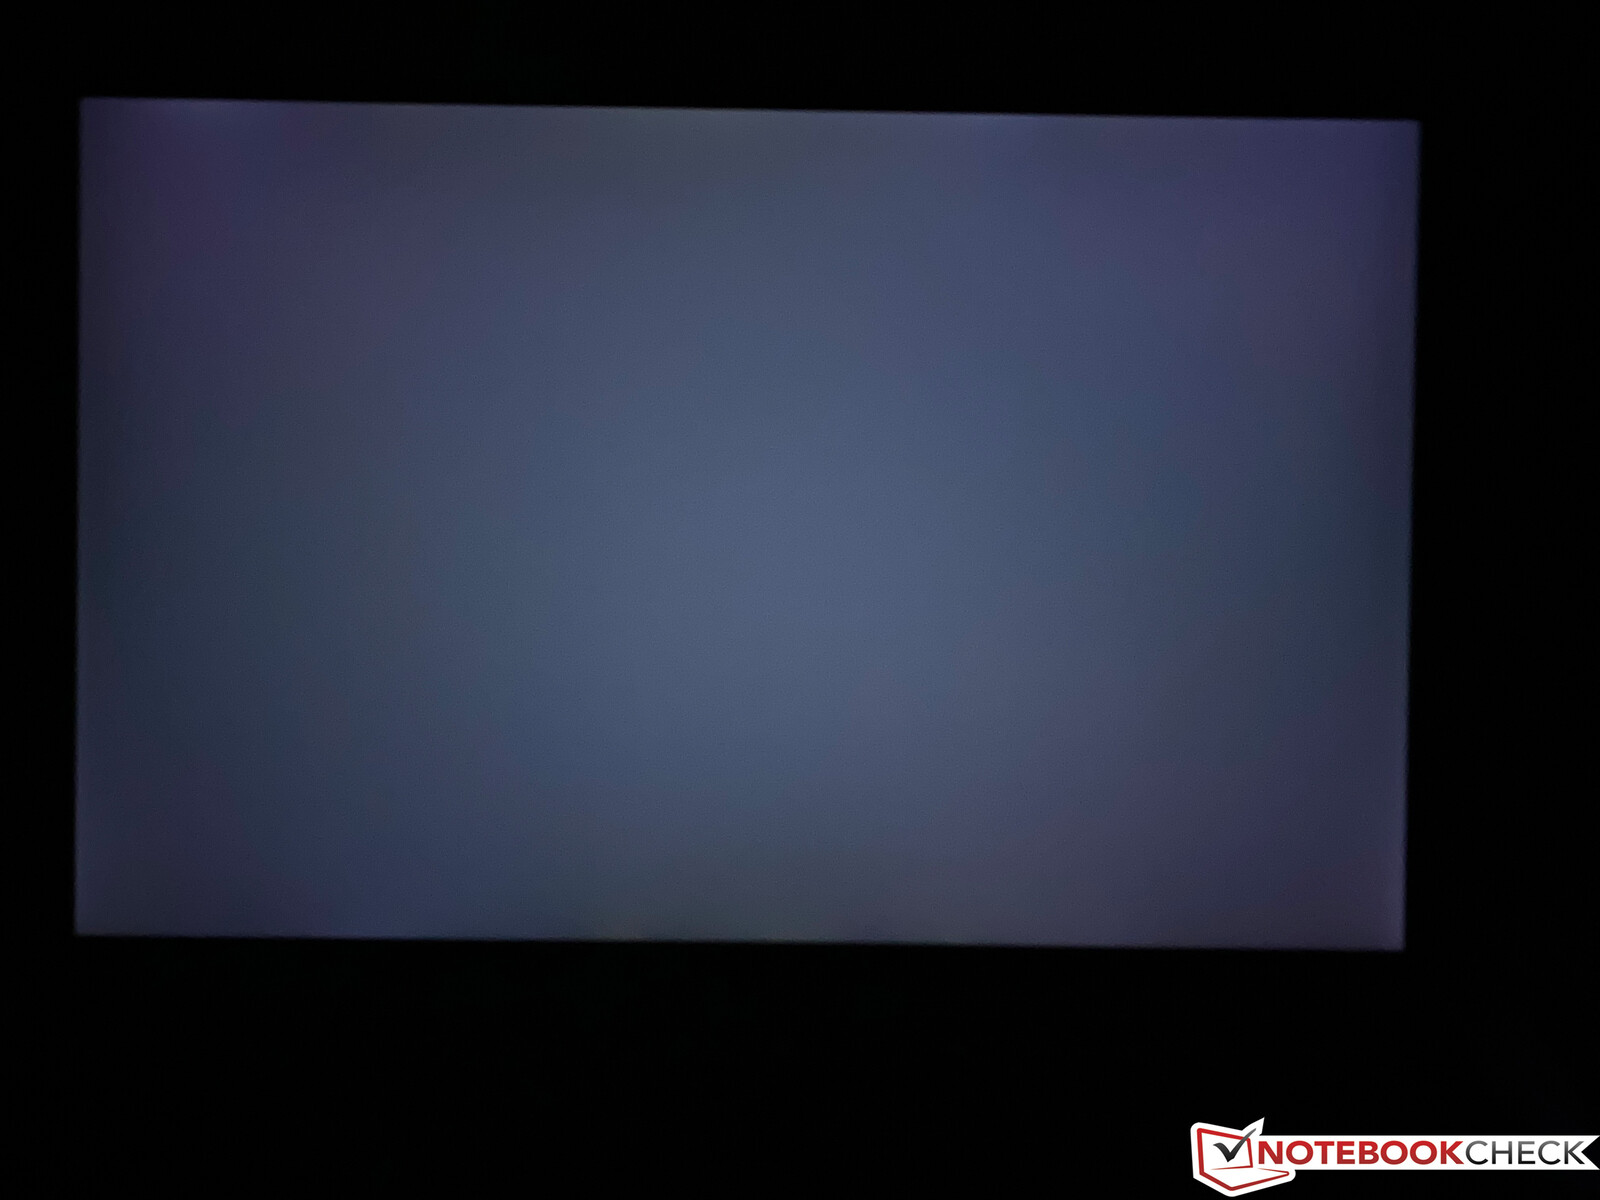
The 16:10 panel in our test model is the base screen with a resolution of 1920 x 1200 pixels and it has a matte surface. The subjective picture impression is very good and bright areas do not appear grainy, despite the matte surface. Dell advertises a luminance of 500 Nits, and our panel easily manages that at all measuring spots; the average luminance is even 590 Nits. The black value is not too high at 0.35 considering the high brightness, which results in a very good contrast ratio of more than 1700:1.
At a brightness level of 20% or lower we can detect a flickering at 2500 Hz, but this should not result in problems. Screen bleeding is hardly noticeable, and you will only see slightly brighter spots on a completely black picture. However, you can notice the comparatively long response times, for example, the ghosting of the cursor. You will get used to this in practice and we know this issue from many laptops with very narrow bezels.
| |||||||||||||||||||||||||
Brightness Distribution: 91 %
Center on Battery: 528 cd/m²
Contrast: 1769:1 (Black: 0.35 cd/m²)
ΔE Color 3 | 0.5-29.43 Ø5, calibrated: 1
ΔE Greyscale 5.2 | 0.57-98 Ø5.3
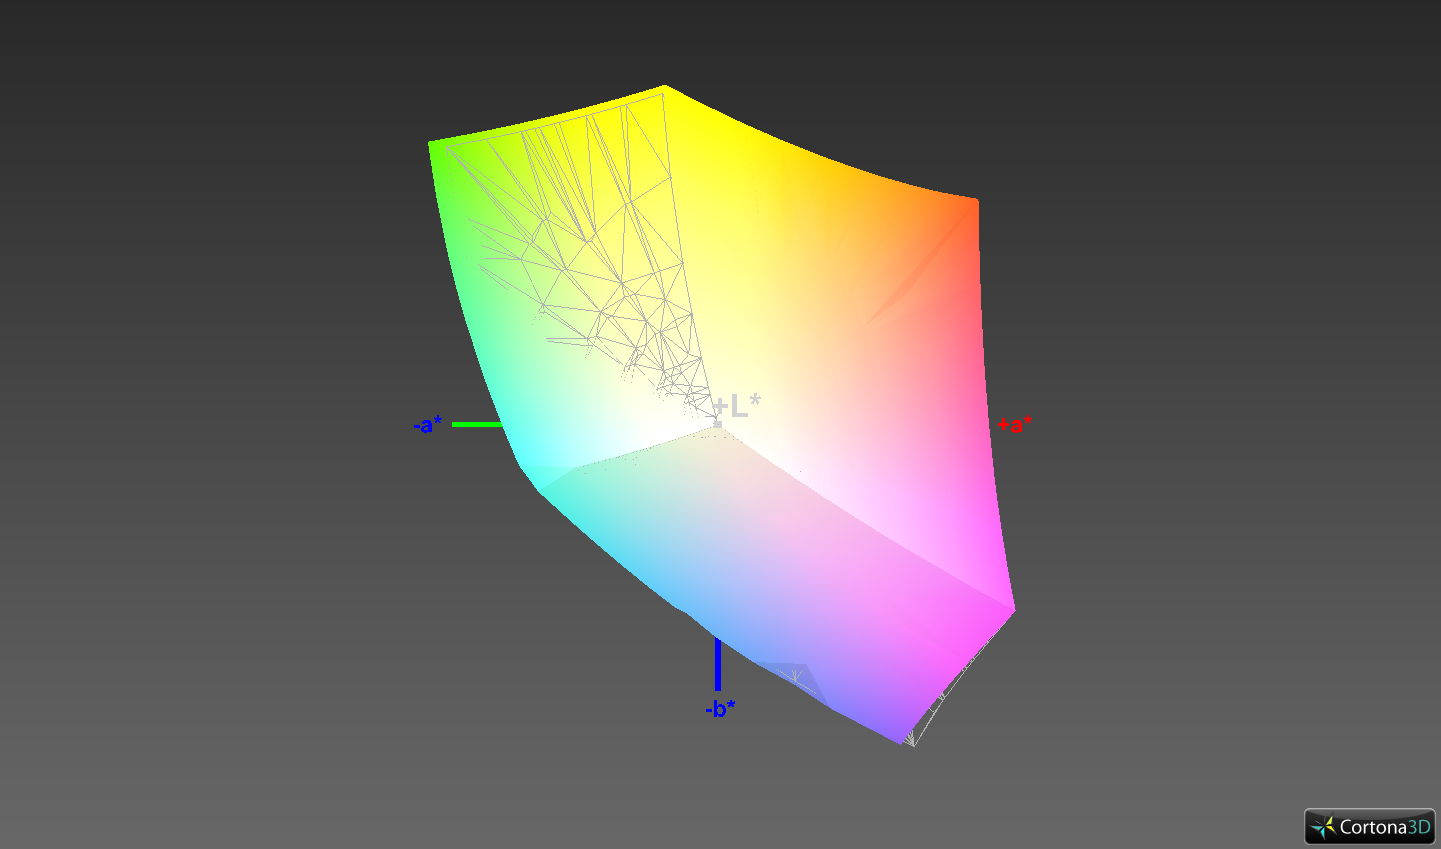
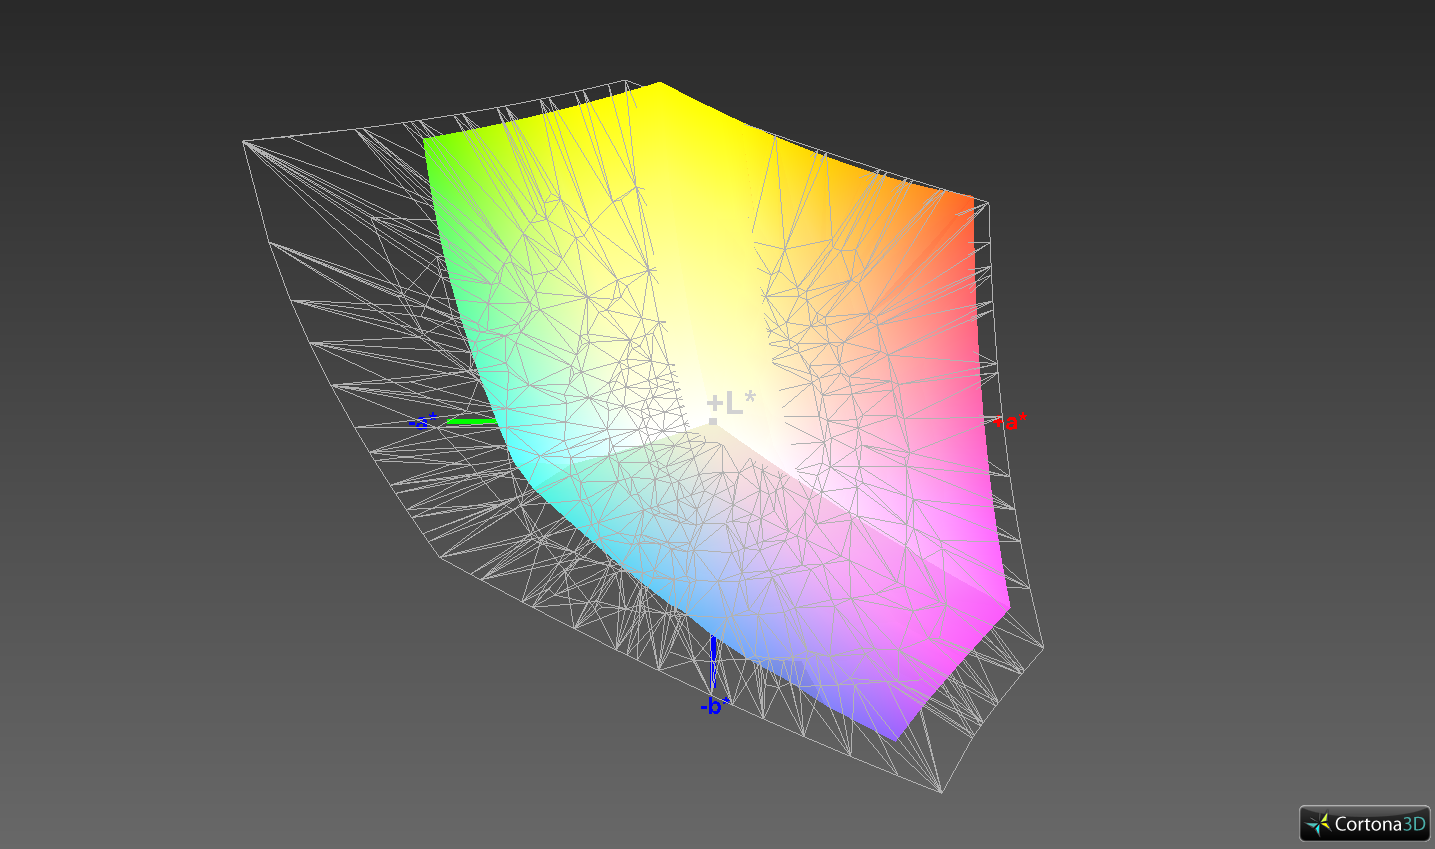
99.3% sRGB (Argyll 1.6.3 3D)
66.9% AdobeRGB 1998 (Argyll 1.6.3 3D)
73.5% AdobeRGB 1998 (Argyll 2.2.0 3D)
99.4% sRGB (Argyll 2.2.0 3D)
71.5% Display P3 (Argyll 2.2.0 3D)
Gamma: 2.14
| Dell XPS 13 9300 i5 FHD SHP14CB, IPS, 1920x1200, 13.40 | Apple MacBook Pro 13 2019 2TB3 APPA03D, IPS, 2560x1600, 13.30 | Acer Swift 3 SF313-52-71Y7 BOE, NE135FBM-N41, IPS, 2256x1504, 13.50 | Lenovo ThinkPad X390-20Q1S02M00 LP133WF7-SPB1, IPS LED, 1920x1080, 13.30 | Dell XPS 13 9380 2019 ID: AUO 282B B133ZAN Dell: 90NTH, IPS, 3840x2160, 13.30 | Dell XPS 13 7390 2-in-1 Core i7 Sharp LQ134N1, IPS, 1920x1200, 13.40 | |
|---|---|---|---|---|---|---|
| Display | 17% | -2% | -7% | -9% | -2% | |
| Display P3 Coverage | 71.5 | 96.1 34% | 70.1 -2% | 65.3 -9% | 64.7 -10% | 69.9 -2% |
| sRGB Coverage | 99.4 | 99.4 0% | 99.8 0% | 95.9 -4% | 93.1 -6% | 99.2 0% |
| AdobeRGB 1998 Coverage | 73.5 | 85.6 16% | 71.2 -3% | 66.6 -9% | 65.3 -11% | 71.5 -3% |
| Response Times | 1521% | -26% | 1% | -3% | 11% | |
| Response Time Grey 50% / Grey 80% * | 60 ? | 50.4 ? 16% | 55 ? 8% | 57.6 ? 4% | 58 ? 3% | 47.6 ? 21% |
| Response Time Black / White * | 33.2 ? | 35.2 ? -6% | 31 ? 7% | 34 ? -2% | 36 ? -8% | 29.2 ? 12% |
| PWM Frequency | 2500 ? | 116300 ? 4552% | 208 ? -92% | 2500 ? 0% | ||
| Screen | 18% | -13% | -1% | -22% | 3% | |
| Brightness middle | 619 | 603 -3% | 474 -23% | 356 -42% | 404 -35% | 549.8 -11% |
| Brightness | 591 | 577 -2% | 426 -28% | 336 -43% | 389 -34% | 520 -12% |
| Brightness Distribution | 91 | 92 1% | 82 -10% | 88 -3% | 85 -7% | 86 -5% |
| Black Level * | 0.35 | 0.35 -0% | 0.29 17% | 0.16 54% | 0.37 -6% | 0.39 -11% |
| Contrast | 1769 | 1723 -3% | 1634 -8% | 2225 26% | 1092 -38% | 1410 -20% |
| Colorchecker dE 2000 * | 3 | 1.7 43% | 2.38 21% | 3.6 -20% | 3.72 -24% | 2.12 29% |
| Colorchecker dE 2000 max. * | 8.2 | 3.1 62% | 5.88 28% | 5.5 33% | 7.38 10% | 3.66 55% |
| Colorchecker dE 2000 calibrated * | 1 | 0.7 30% | 2.69 -169% | 1.1 -10% | 2.06 -106% | 1.37 -37% |
| Greyscale dE 2000 * | 5.2 | 2.1 60% | 3.75 28% | 4.7 10% | 4.44 15% | 2.6 50% |
| Gamma | 2.14 103% | 2.18 101% | 2.37 93% | 2.48 89% | 2.34 94% | 2.3 96% |
| CCT | 6340 103% | 6843 95% | 6466 101% | 6374 102% | 7095 92% | 6884 94% |
| Color Space (Percent of AdobeRGB 1998) | 66.9 | 76.7 15% | 65 -3% | 61.3 -8% | 60 -10% | 65.4 -2% |
| Color Space (Percent of sRGB) | 99.3 | 99.4 0% | 100 1% | 95.7 -4% | 93 -6% | 99.7 0% |
| Total Average (Program / Settings) | 519% /
283% | -14% /
-13% | -2% /
-2% | -11% /
-17% | 4% /
4% |
* ... smaller is better
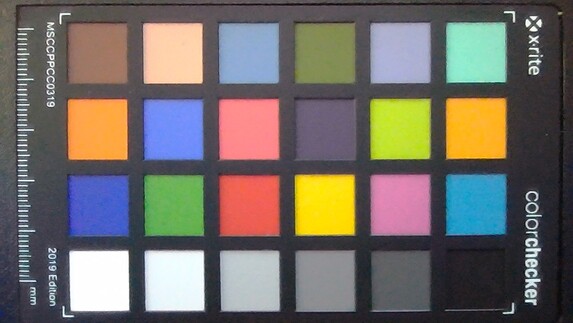
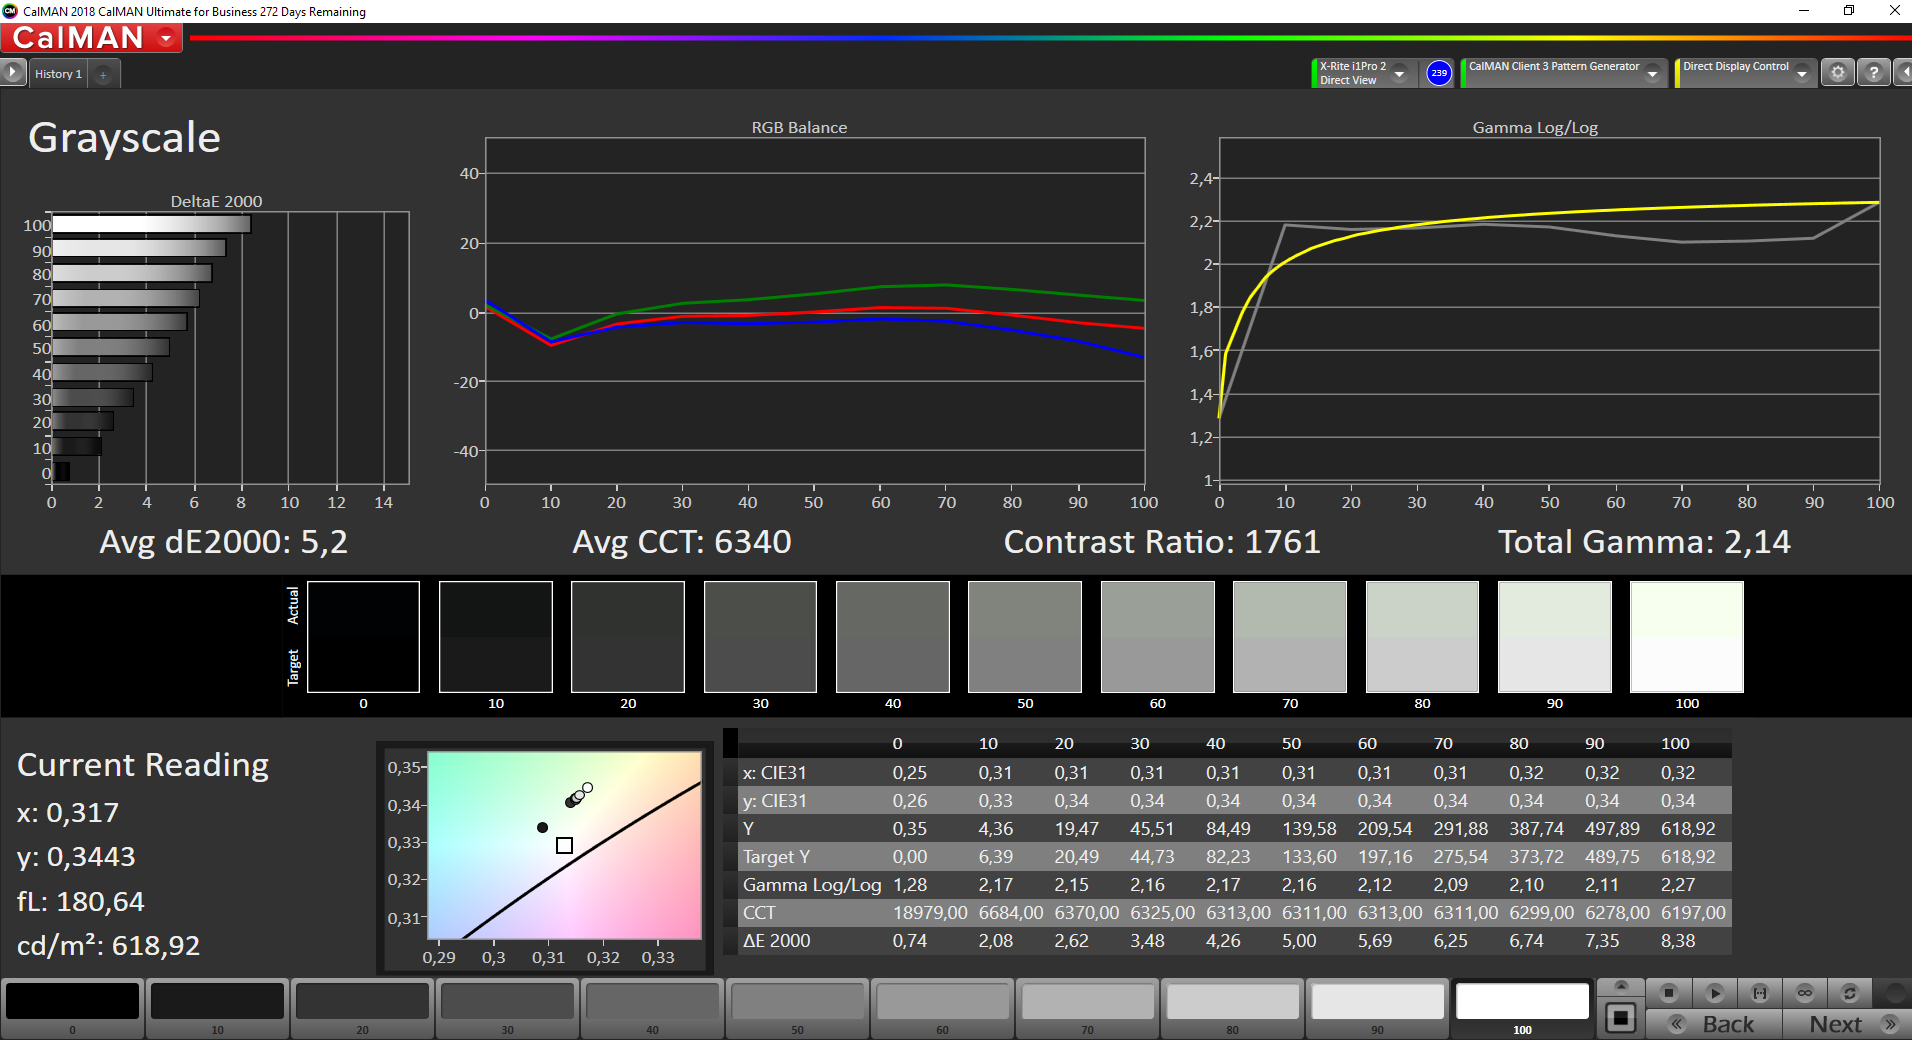
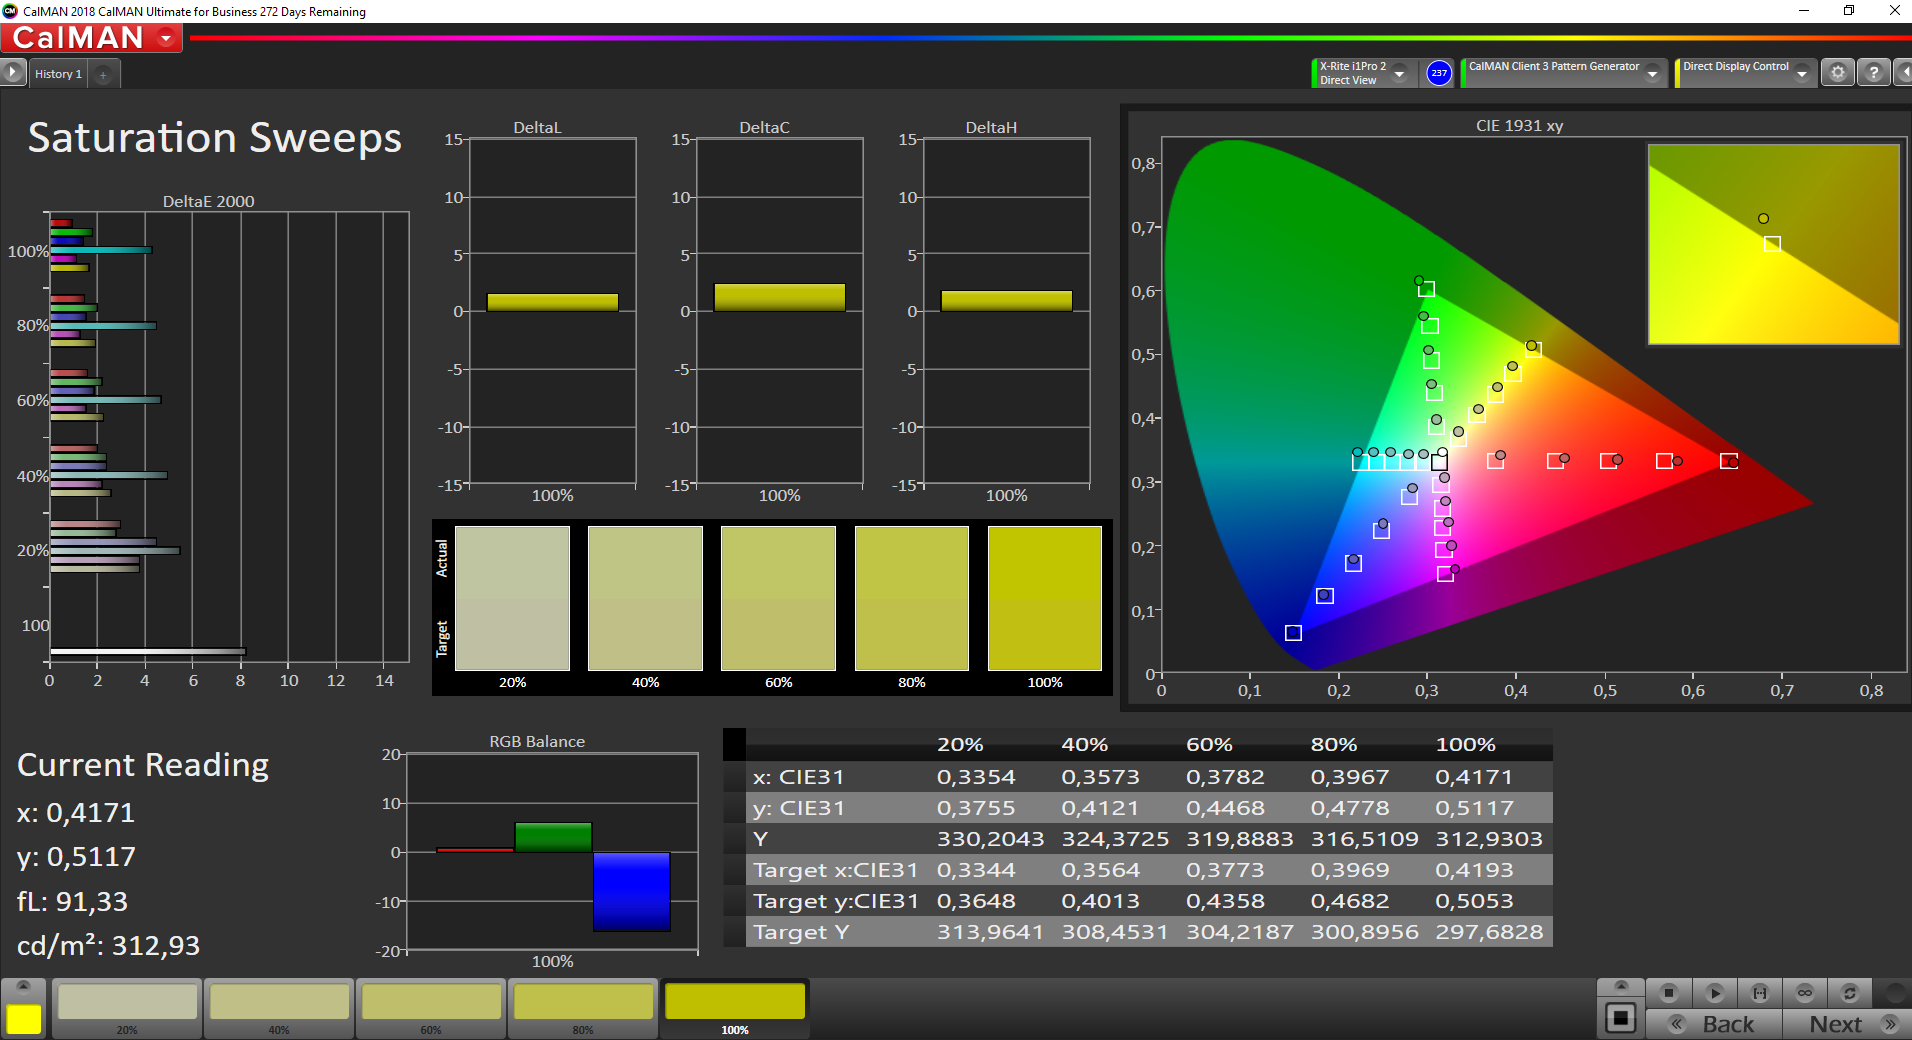
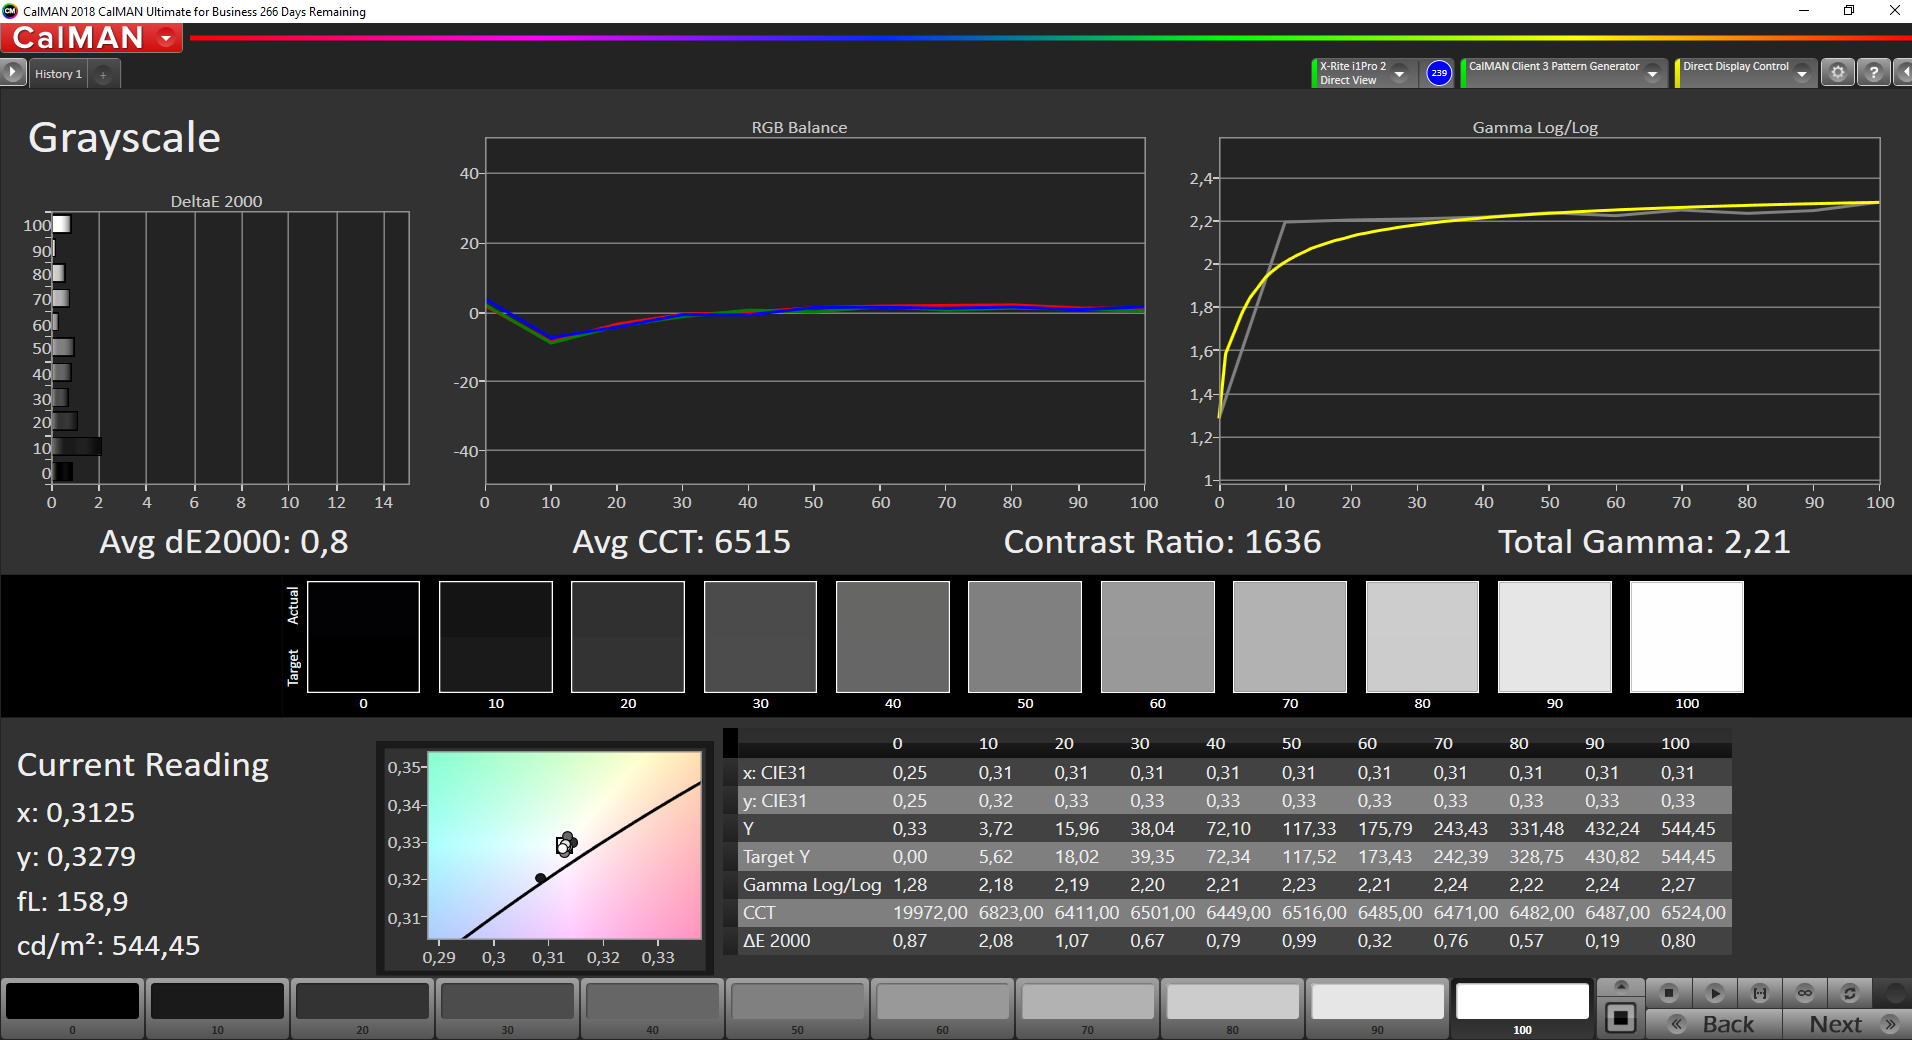
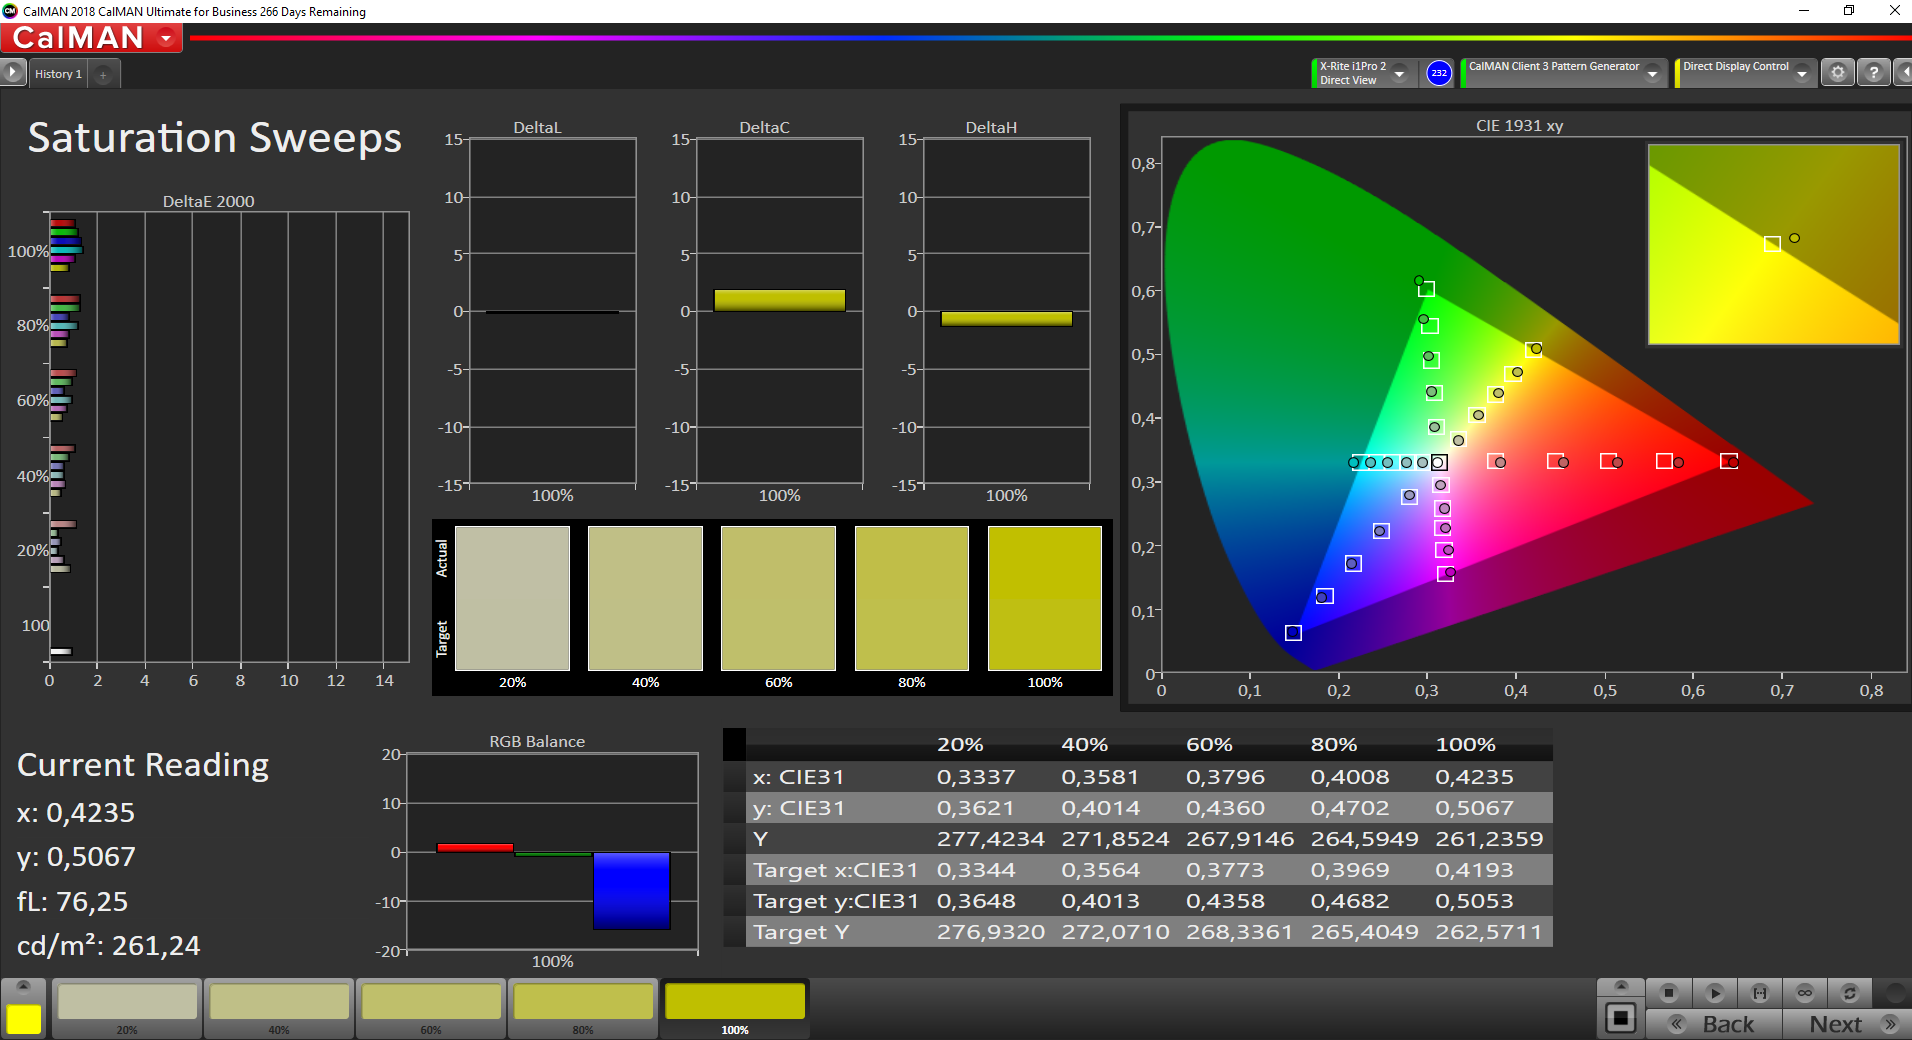
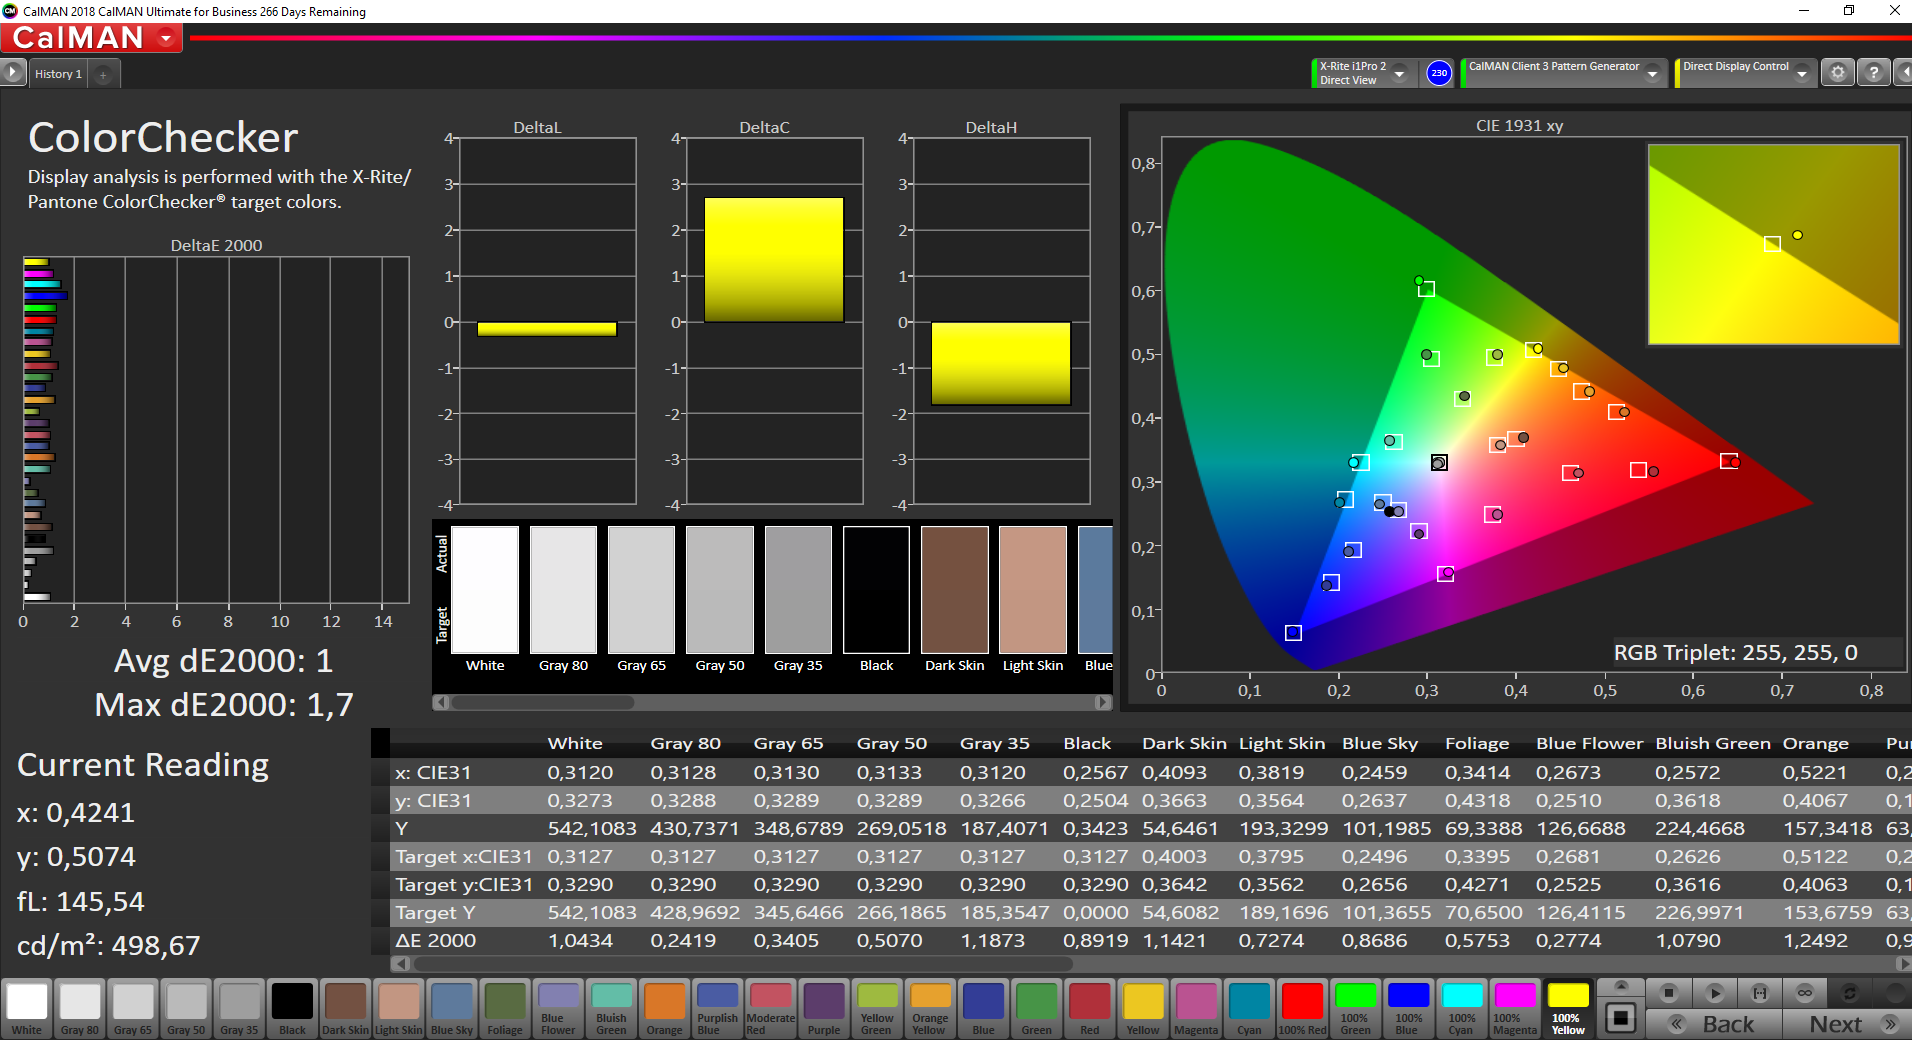
Our analysis with the professional CalMAN software and the X-Rite i1 Pro 2 spectrophotometer reveals a slight color cast towards yellow in combination with a slightly too warm color temperature. The average deviations for the grayscale and the colors are also comparatively high. Still, the panel from Sharp has a lot of potential, which is evident after our calibration. All values are within the target of 3 without any outliers. In combination with the full sRGB color gamut, this means the panel is suited for picture editing (sRGB). The calibrated profile can be downloaded for free in the box above.

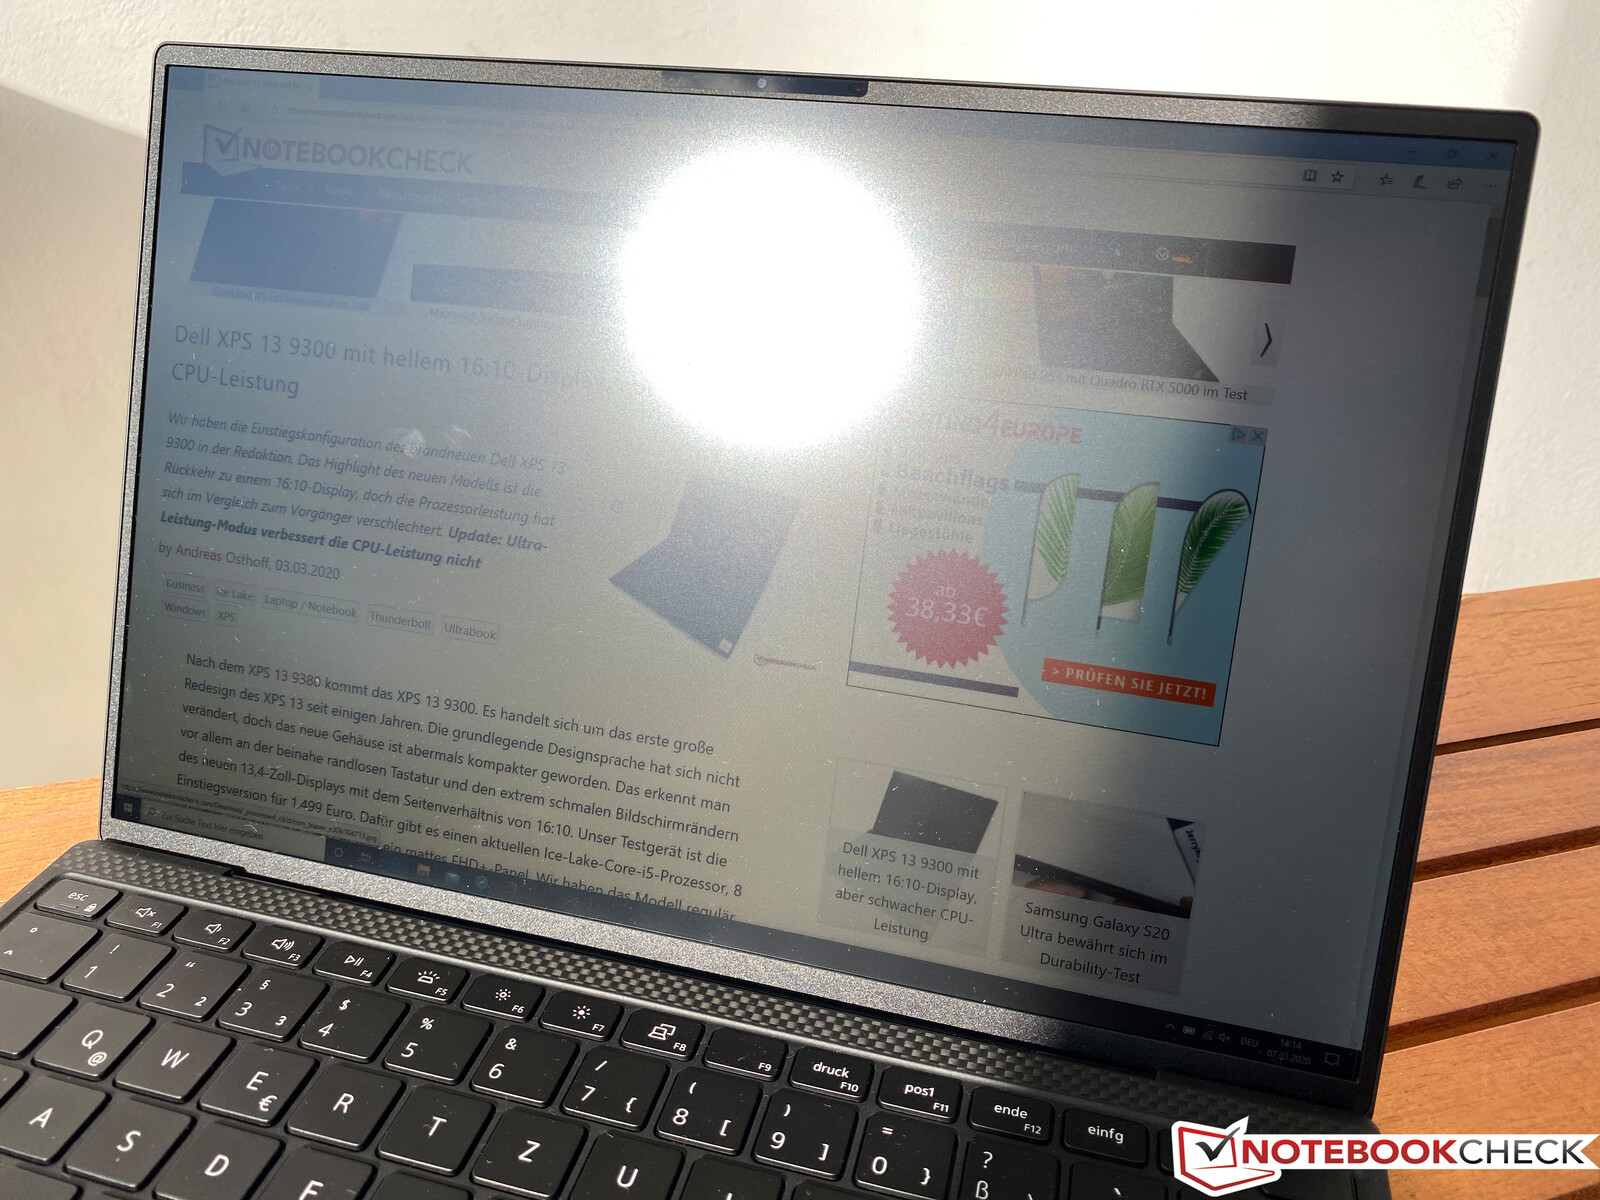
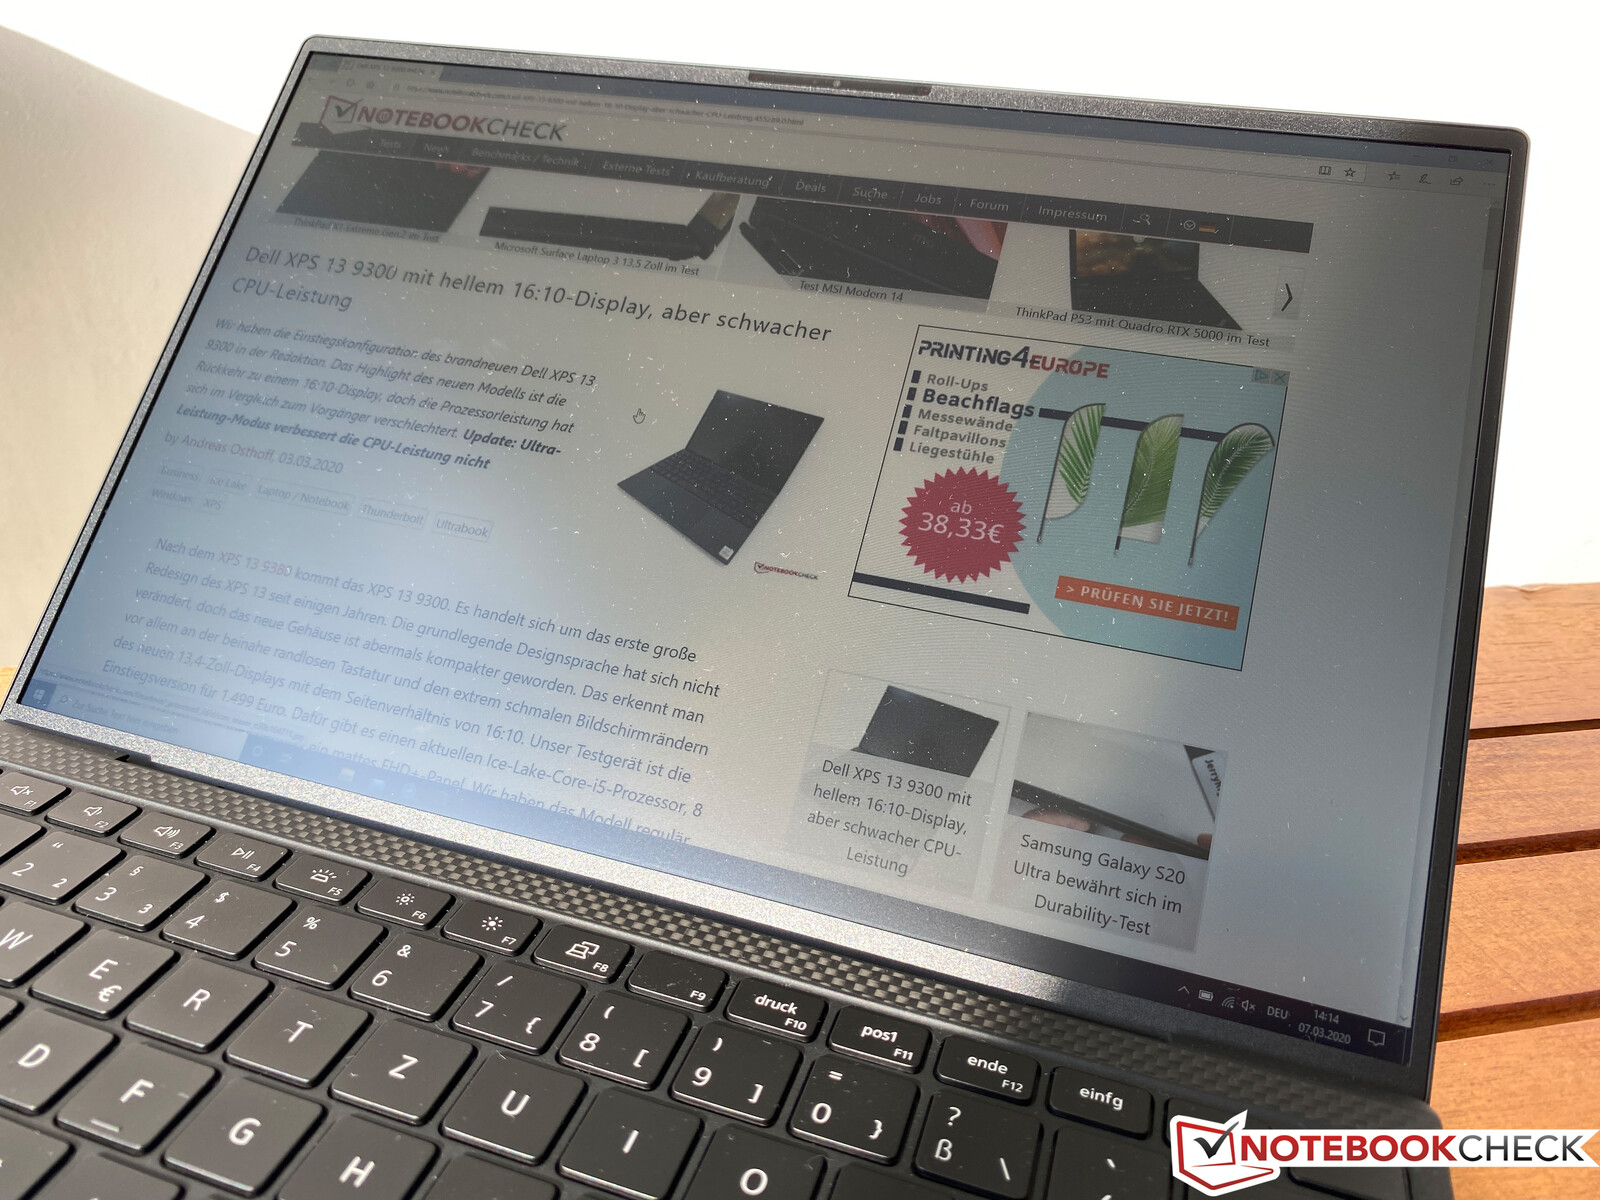
The matte panel is well suited for outdoor use. Even bright environments are no problem as long as you can avoid direct reflections from light sources. We were a bit surprised by the fact that Dell slightly reduces the brightness on battery power (by about 90 Nits). We could not change this behavior, neither in the drivers, nor the BIOS.
Display Response Times
| ↔ Response Time Black to White | ||
|---|---|---|
| 33.2 ms ... rise ↗ and fall ↘ combined | ↗ 16.4 ms rise | 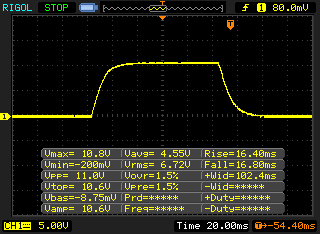 |
| ↘ 16.8 ms fall | ||
| The screen shows slow response rates in our tests and will be unsatisfactory for gamers. In comparison, all tested devices range from 0.1 (minimum) to 240 (maximum) ms. » 88 % of all devices are better. This means that the measured response time is worse than the average of all tested devices (21.5 ms). | ||
| ↔ Response Time 50% Grey to 80% Grey | ||
| 60 ms ... rise ↗ and fall ↘ combined | ↗ 28.4 ms rise | 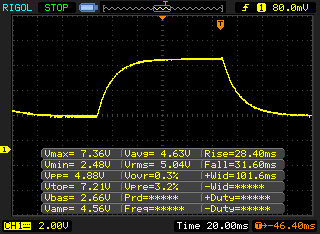 |
| ↘ 31.6 ms fall | ||
| The screen shows slow response rates in our tests and will be unsatisfactory for gamers. In comparison, all tested devices range from 0.2 (minimum) to 636 (maximum) ms. » 95 % of all devices are better. This means that the measured response time is worse than the average of all tested devices (33.7 ms). | ||
Screen Flickering / PWM (Pulse-Width Modulation)
| Screen flickering / PWM detected | 2500 Hz | ≤ 20 % brightness setting | 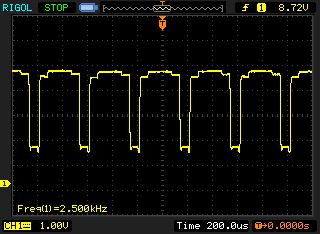 |
The display backlight flickers at 2500 Hz (worst case, e.g., utilizing PWM) Flickering detected at a brightness setting of 20 % and below. There should be no flickering or PWM above this brightness setting. The frequency of 2500 Hz is quite high, so most users sensitive to PWM should not notice any flickering. In comparison: 53 % of all tested devices do not use PWM to dim the display. If PWM was detected, an average of 17909 (minimum: 5 - maximum: 3846000) Hz was measured. | |||
Performance – XPS with less CPU performance, but faster GPU
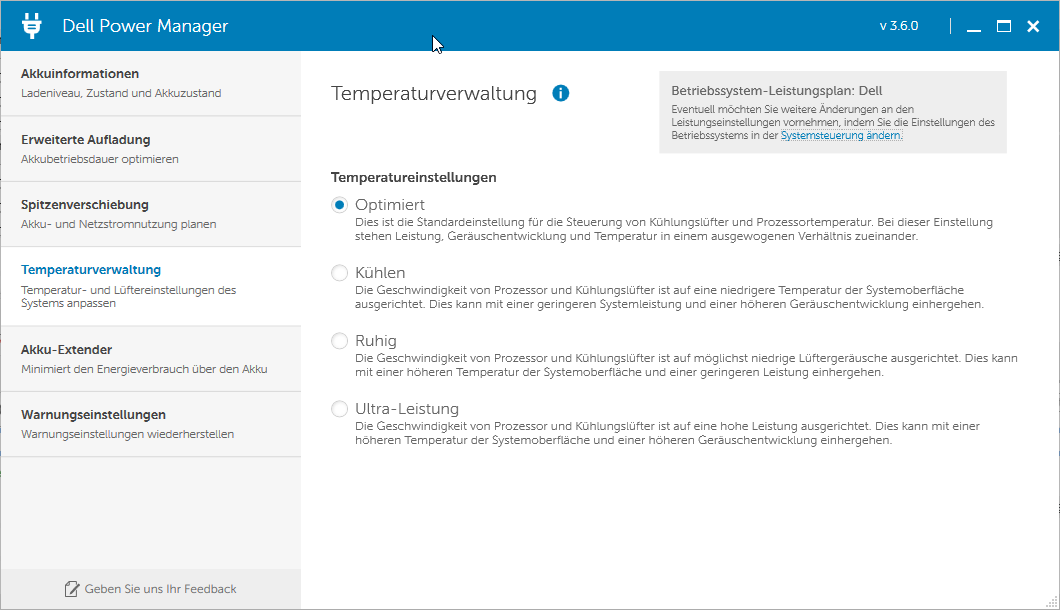
Dell ships the XPS 13 with the so-called Power Manager. It also includes profiles for the temperature management with the default setting "Optimized". We have also used this profile for our following benchmarks and measurements. The selection of "Ultra-Performance" did not improve the scores in our tests.
The memory is soldered onto the mainboard. If you want more than the default 8 GB LPDDR4-RAM, you also have to get the optional Core i7 processor. More than 16 GB RAM (in this case LPDDR4x), however, is not available as of this moment.
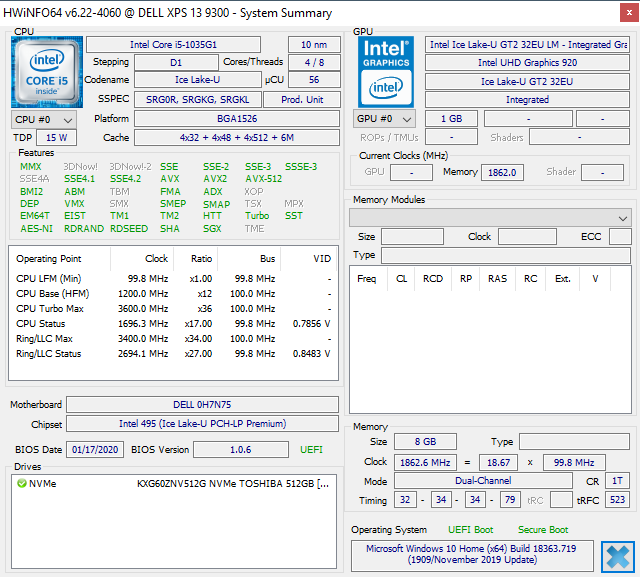
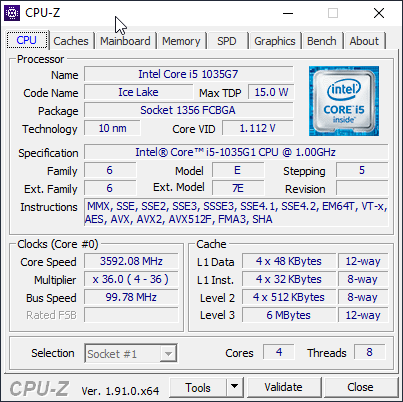
Processor: Intel Ice Lake Core i5
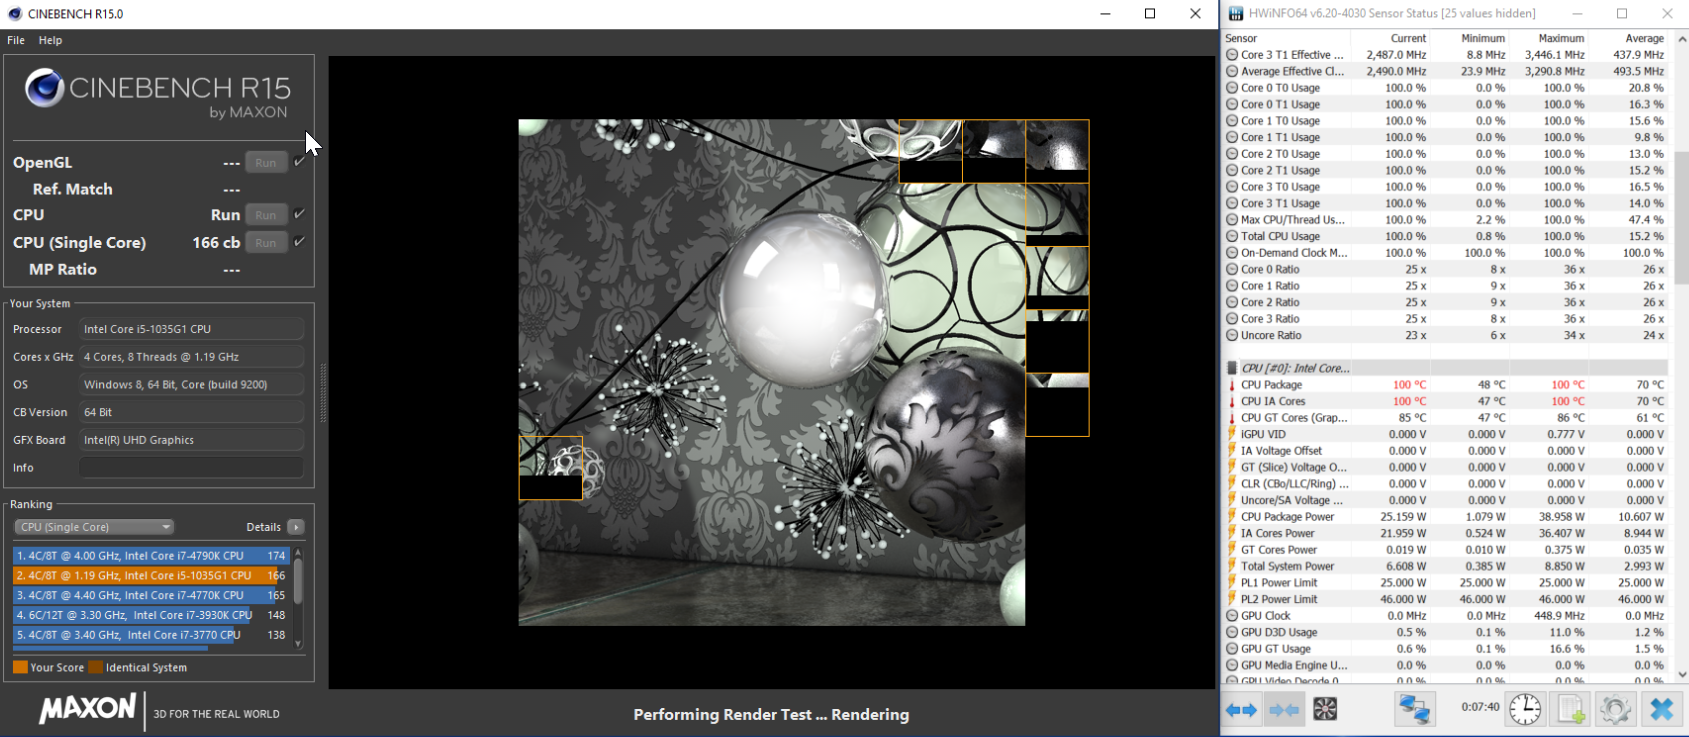
The German Dell shop only lists two processors, and both are from Intel's latest Ice Lake generation. In addition to the Core i5-1035G1, you can also get the Core i7-1065G7. Our Core i5 can reach up to 3.6 GHz or 3.3 GHz when you stress all four cores, respectively. The Core i5 offers plenty of performance for everyday tasks, so the i7 is not really necessary.
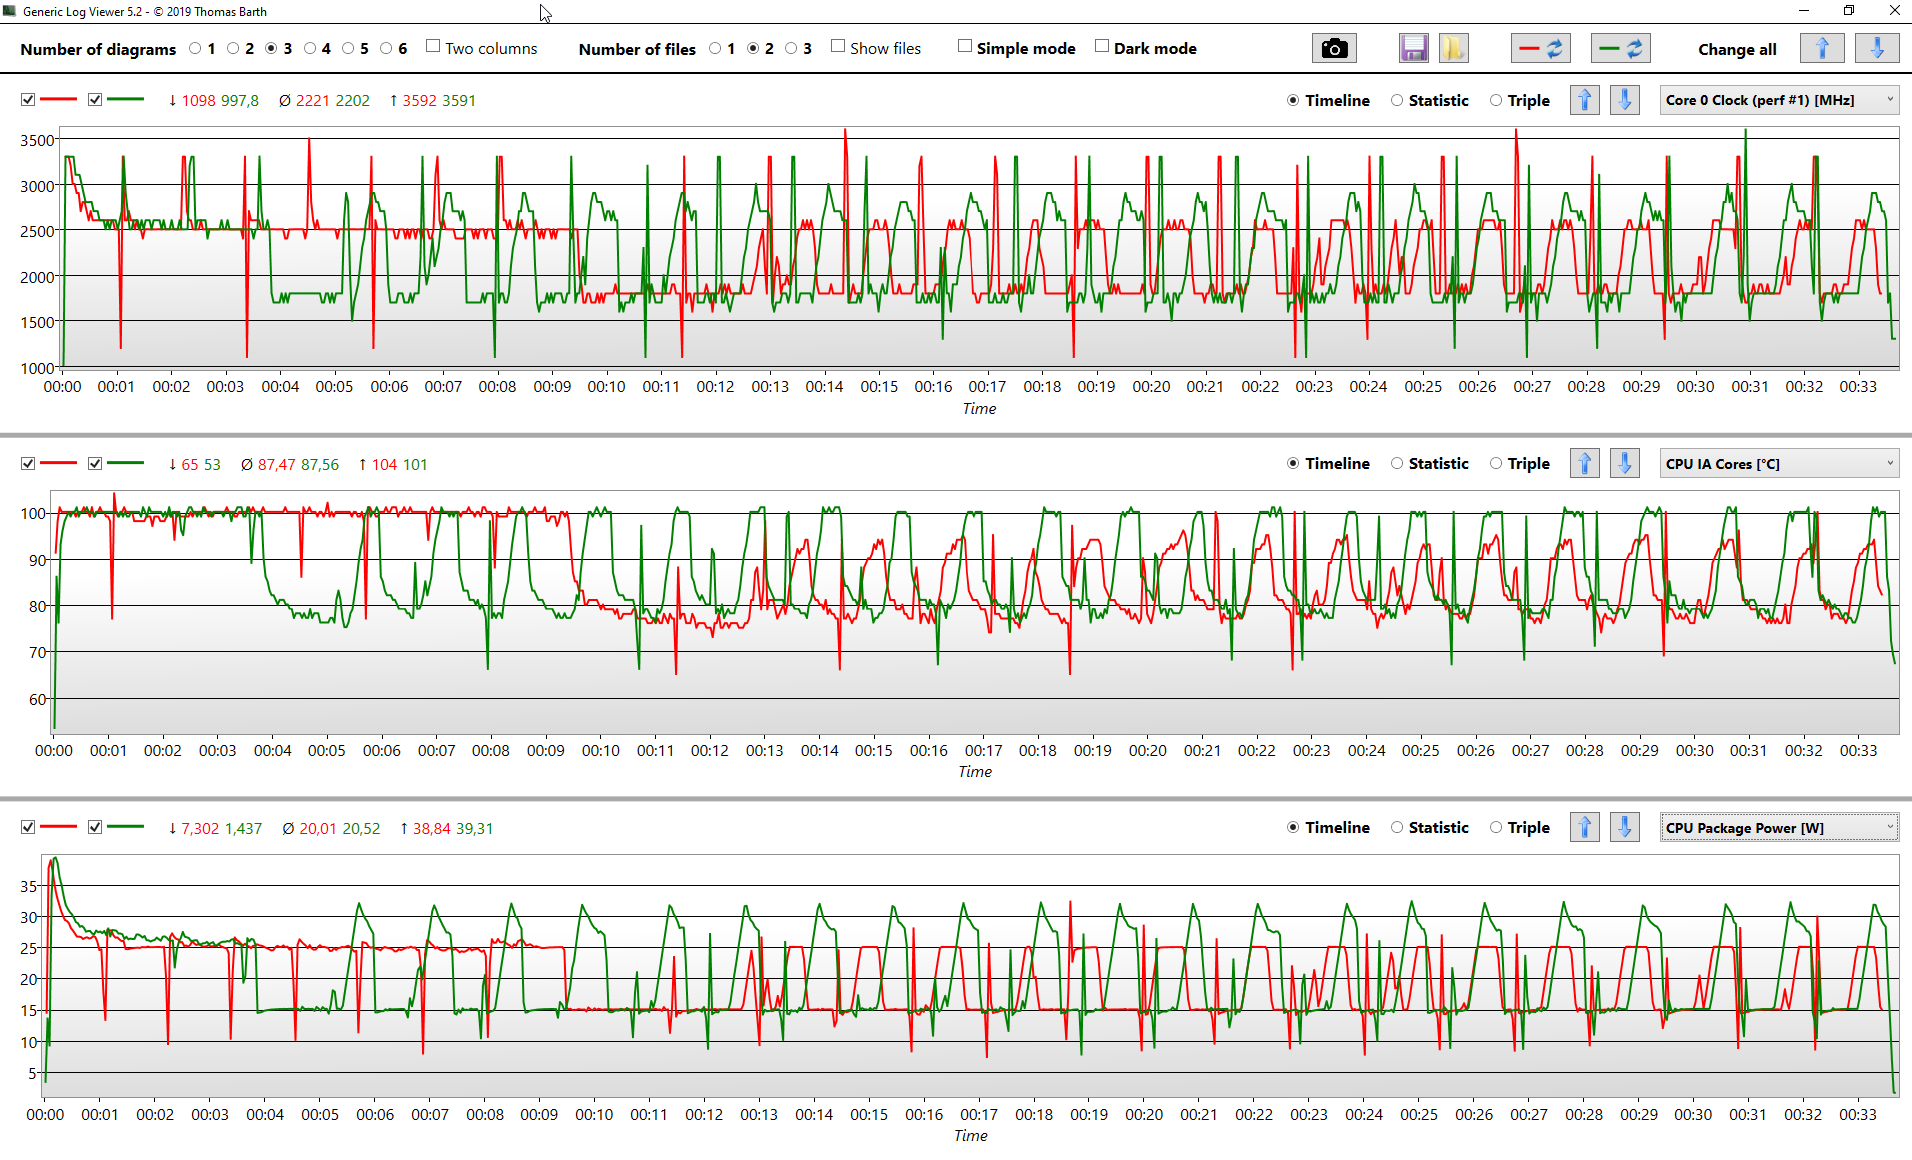
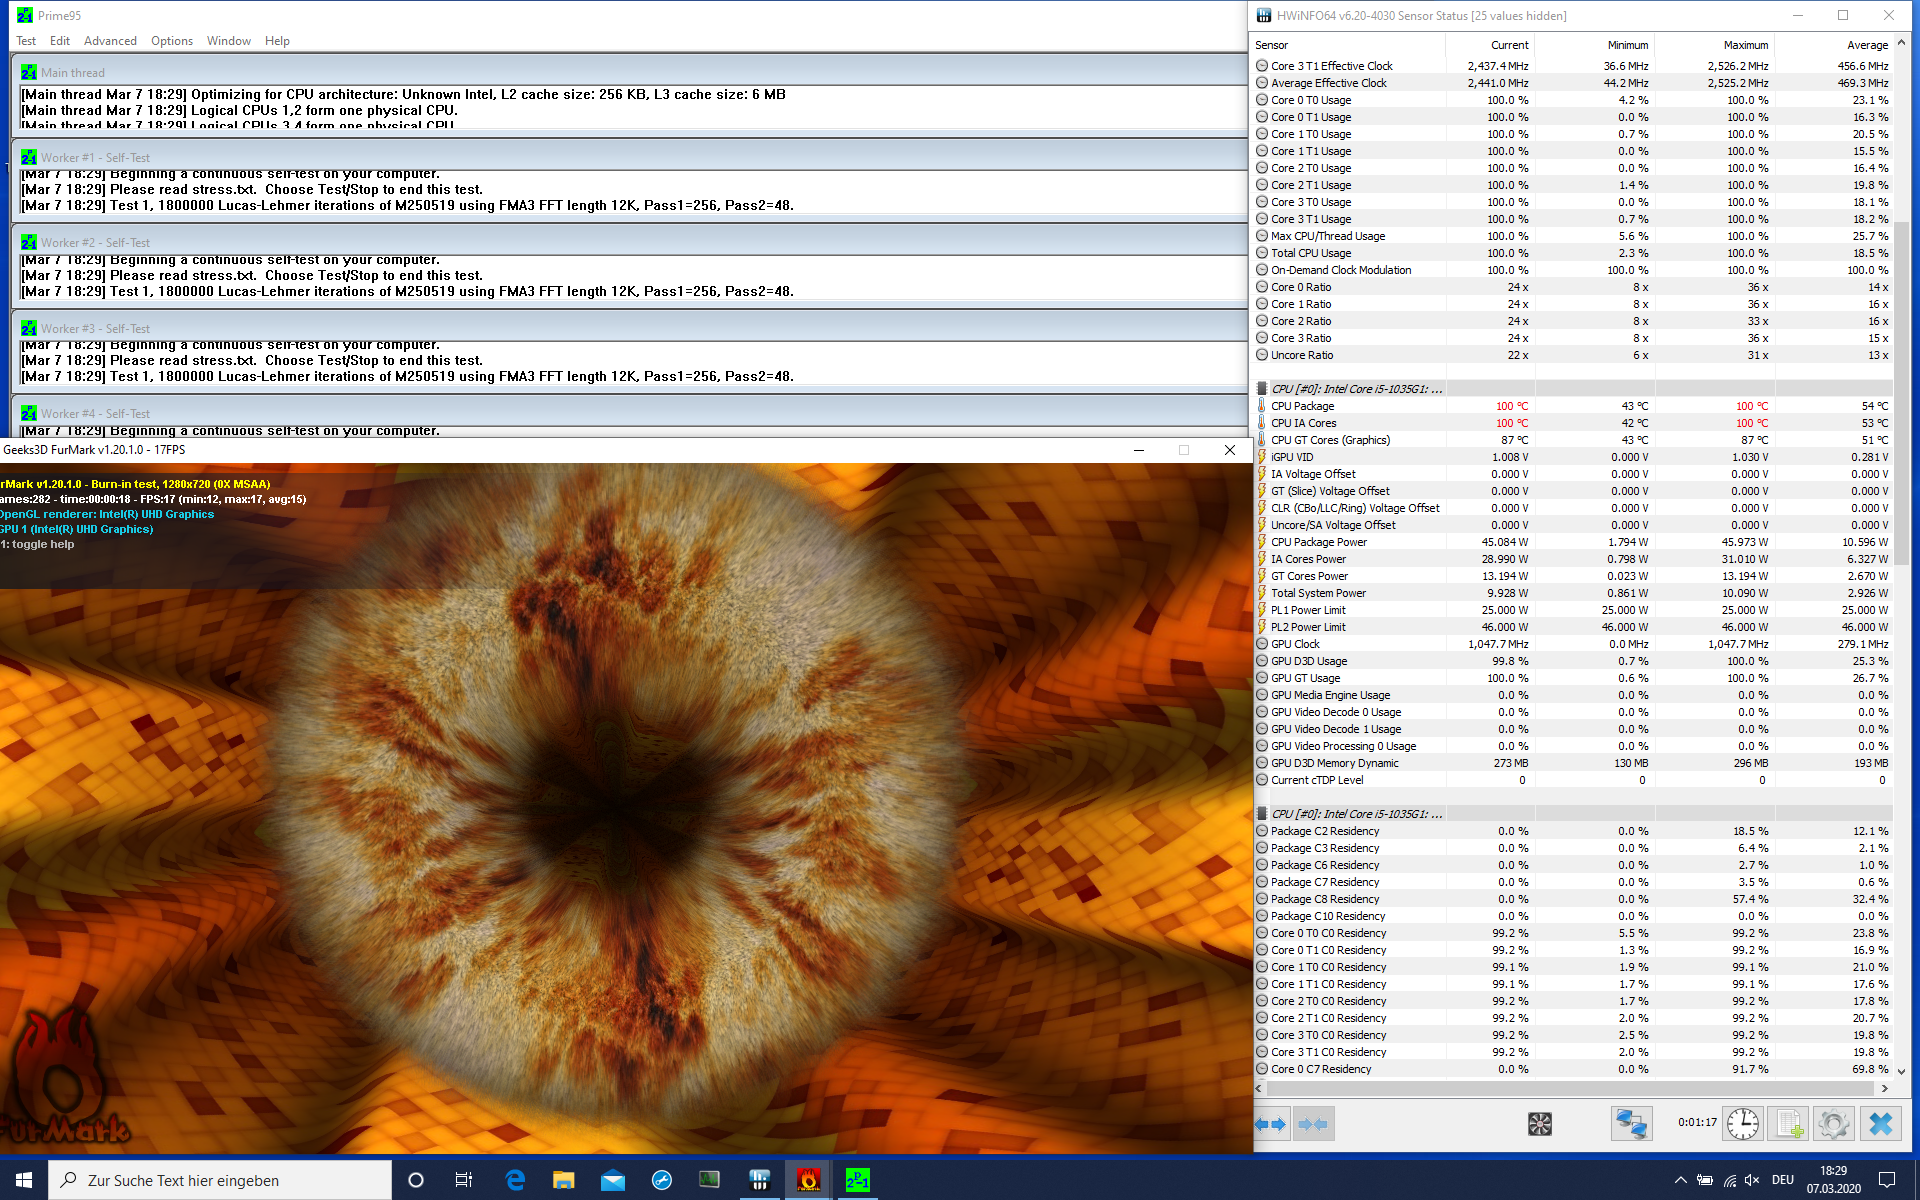
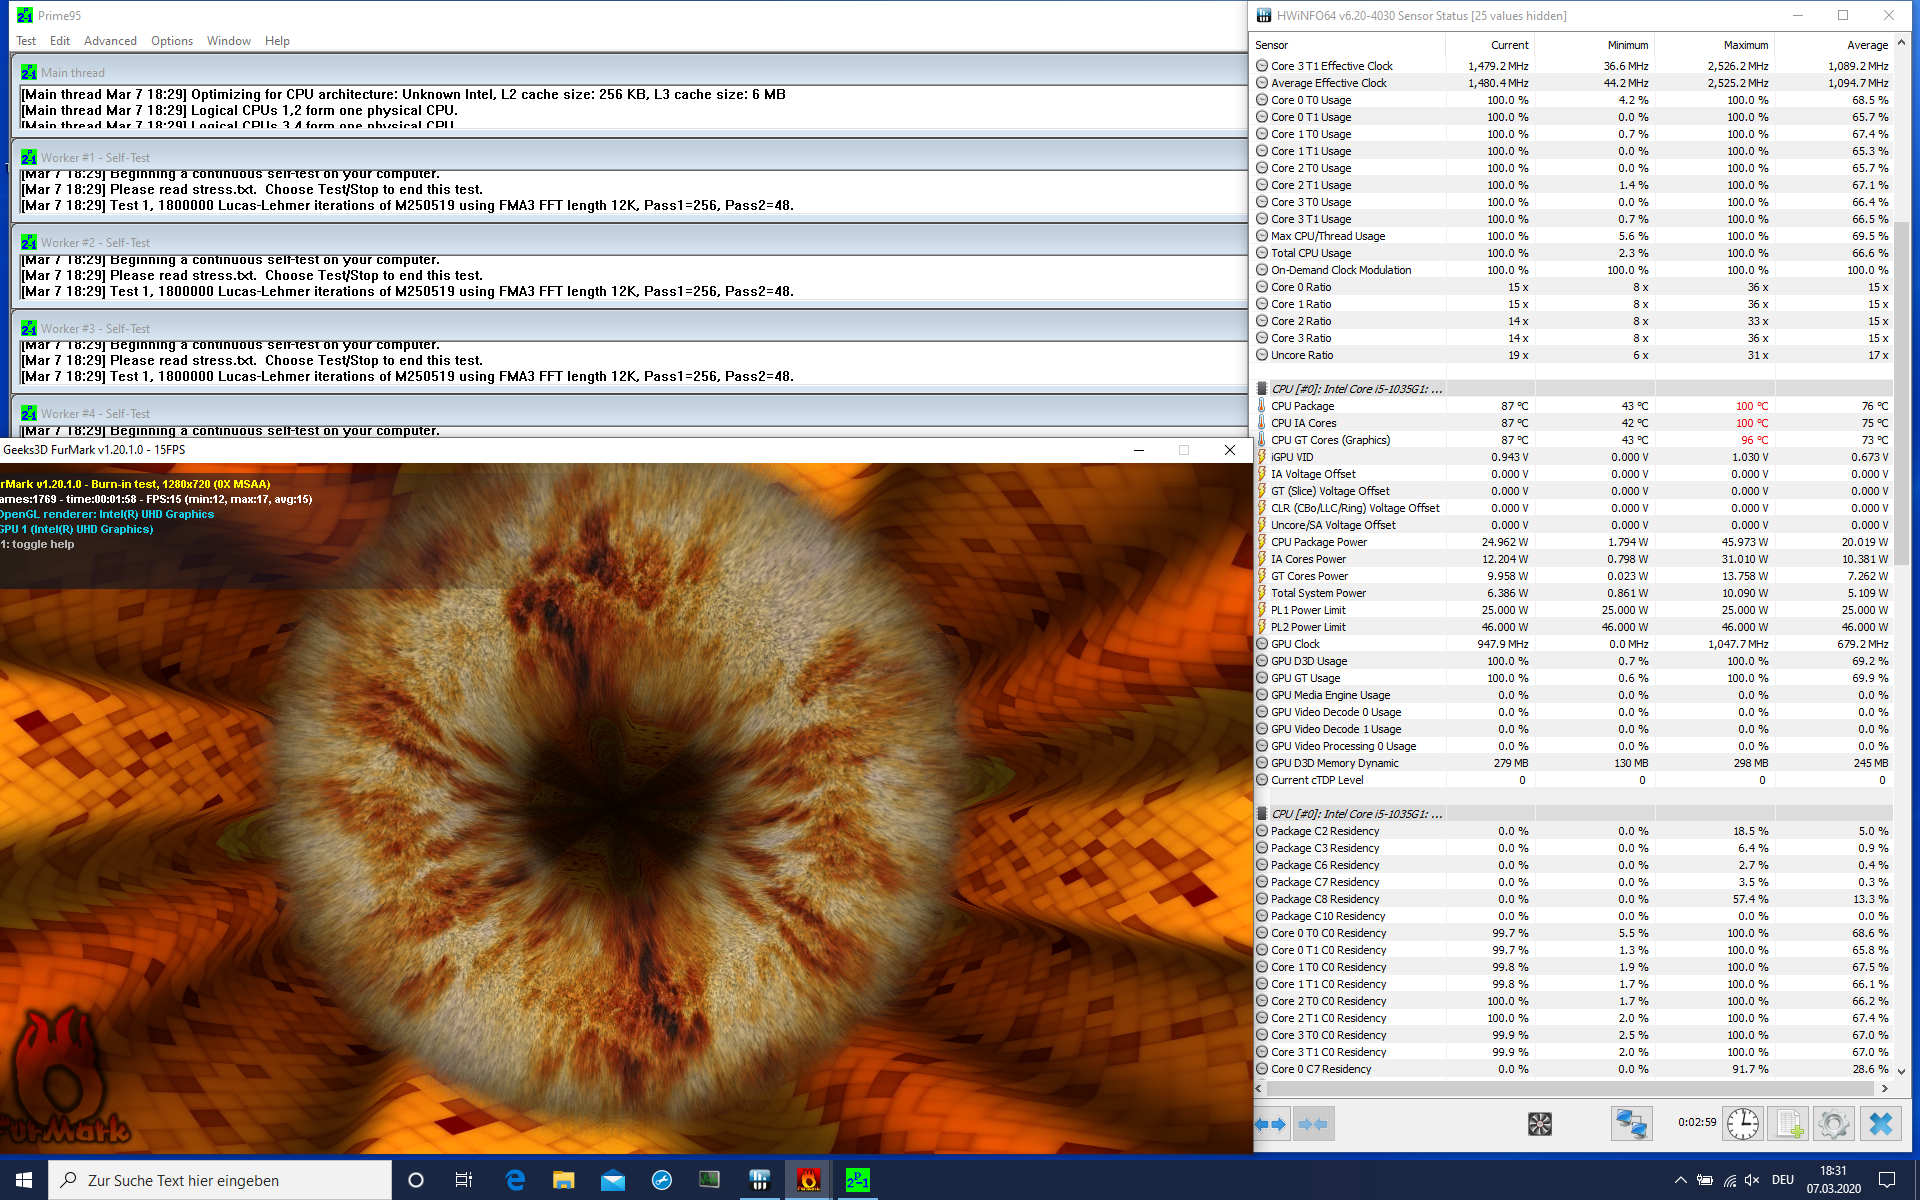
It is always interesting to see how the cooling solution performs in such a slim laptop and how much CPU performance you can use. Dell sets the PowerLimits for the processor at 46W (short-term) and 25W (long-term). These are our results of the Cinebench R15 loop, which repeats the Multi test 25 times.
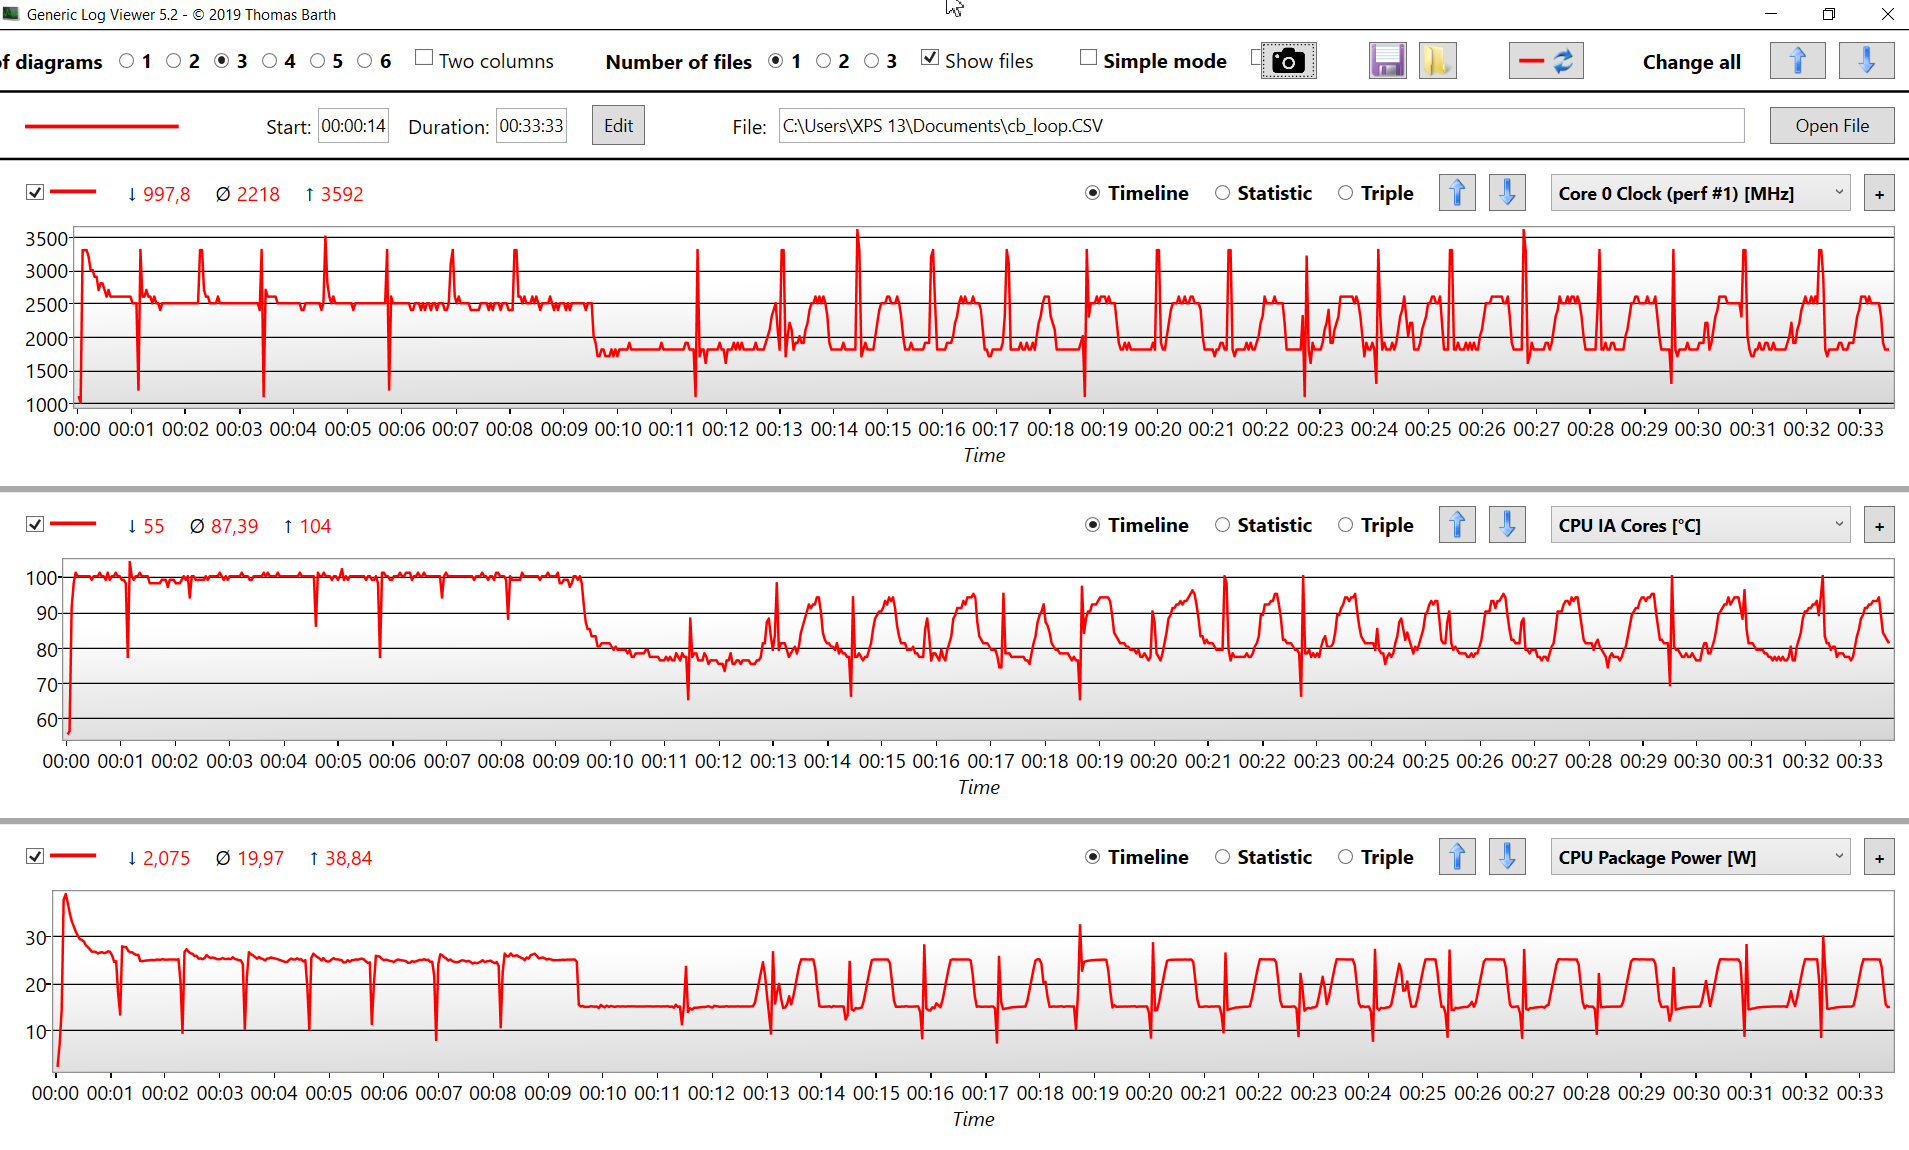
The Core i5 consumes around 38-39W running at the maximum 4x 3.3 GHz, but this level can only be maintained for a couple of seconds. The XPS 13 then settles at the 25W limit, which is still enough for 4x 2.5 GHz. This level is maintained for about 10 minutes, before the XPS 13 gets too warm. At this time, we can measure a surface temperature of almost 48 °C (118.4 °F) at the top of the base unit around the "5" key.
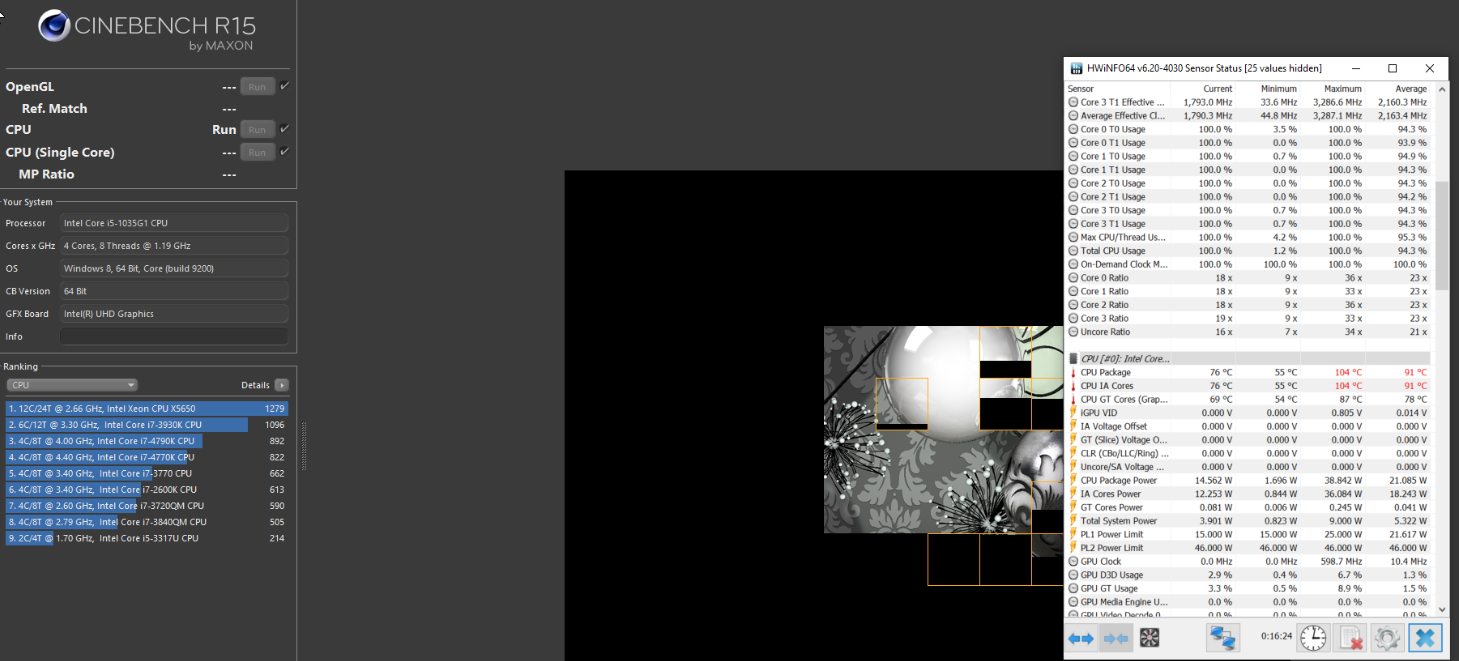
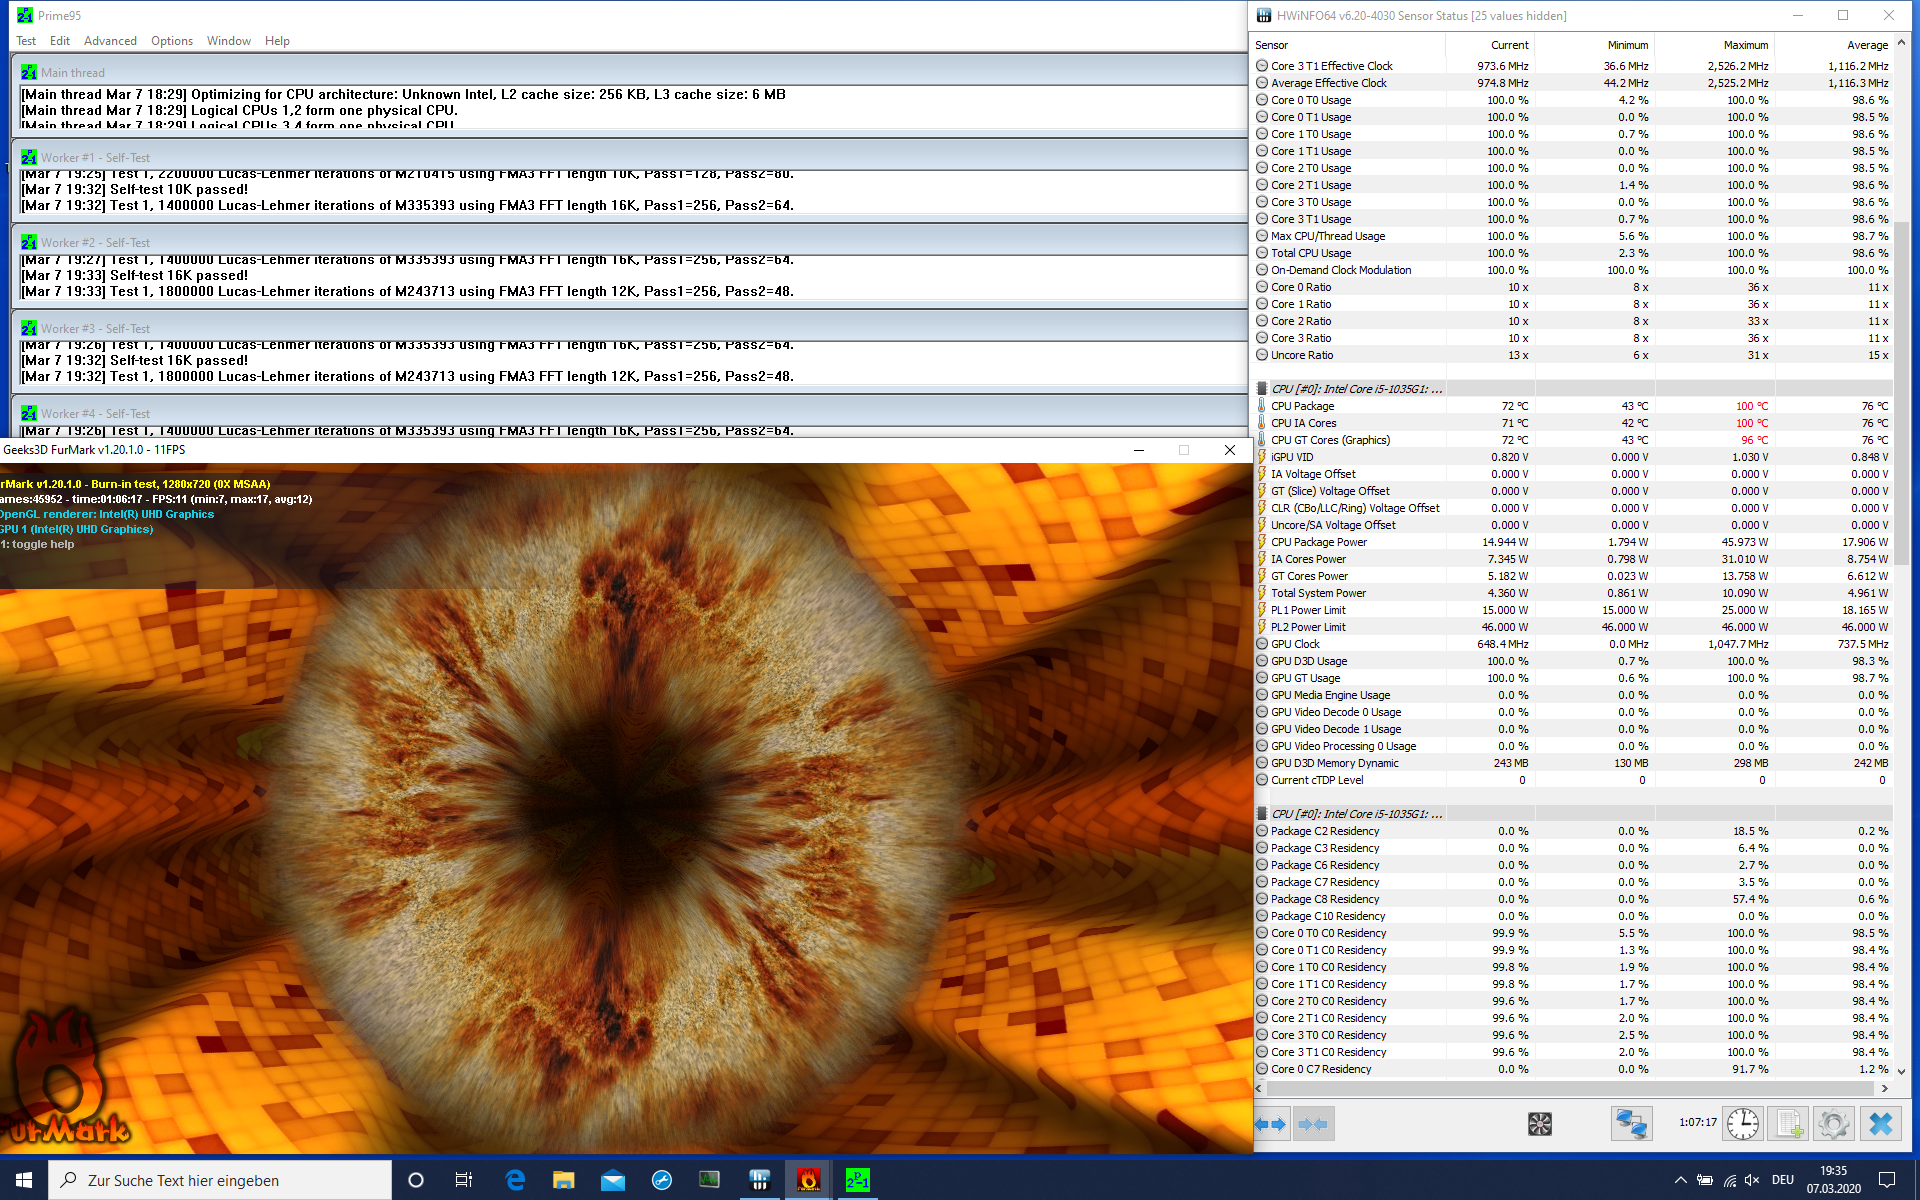
The laptop has to reduce the performance to reduce the temperature. The TDP limit is now 15W, which results in 4x 1.8-1.9 GHz. The processor will try to increase the performance over the course of the test (next 20 minutes), but the TDP is pretty much stable at 15W. The surface temperatures are also lower at around 43 °C (109.4 °F).
We are already familiar with these fluctuations from the previous models, but the new XPS 13 9300 is clearly beaten by both the XPS 13 9380 and the XPS 13 7390. This is a disappointing result for the new XPS 13. All the other competitors are faster as well.
System Performance
The subjective performance impression of the Dell XPS 13 is very good, and the fast PCIe-SSD obviously plays its role. The SSD is located underneath a metal cover and can be replaced if necessary. However, the performance of the SSD is very good, so this is only necessary when you need more storage capacity.
We did not notice any problems during our review period and the results of the XPS 13 in the synthetic benchmarks are also very good.
| PCMark 8 Home Score Accelerated v2 | 3988 points | |
| PCMark 8 Creative Score Accelerated v2 | 5194 points | |
| PCMark 8 Work Score Accelerated v2 | 4832 points | |
| PCMark 10 Score | 4122 points | |
Help | ||

GPU Performance
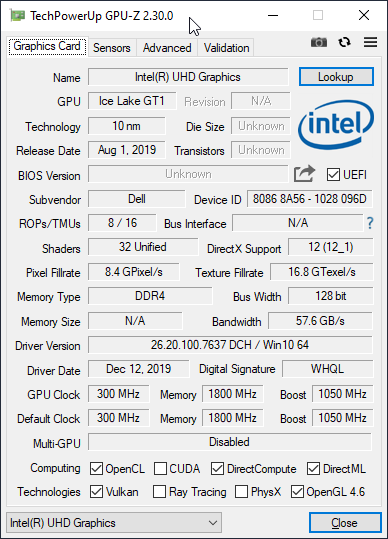
The biggest advantage if the Ice Lake processors is the faster integrated graphics unit. In combination with the Core i5 CPU, you get the UHD Graphics G1 with 32 Execution Units.
Compared to the old XPS 13 9380, the new iGPU is between 30-40% faster, but the optional Core i7 processor with the more powerful iGPU and 64 EUs (Iris Plus Graphics G7) is much faster. We would also recommend this CPU if you plan to play games from time to time on the XPS 13. The smaller iGPU is sufficient for simple titles, but more demanding games are limited to the lowest settings. More gaming benchmarks are available here.
| 3DMark 11 Performance | 2875 points | |
| 3DMark Ice Storm Standard Score | 60637 points | |
| 3DMark Cloud Gate Standard Score | 11119 points | |
| 3DMark Fire Strike Score | 1673 points | |
| 3DMark Time Spy Score | 542 points | |
Help | ||
| low | med. | high | ultra | |
| BioShock Infinite (2013) | 74.3 | 46.8 | 40.4 | 14.4 |
| The Witcher 3 (2015) | 35 | 21.6 | 11.5 | |
| Dota 2 Reborn (2015) | 83.4 | 49.7 | 26.2 | 24.2 |
| X-Plane 11.11 (2018) | 21.9 | 14.7 | 14.2 | |
| F1 2019 (2019) | 43 | 17 | 15 |
Emissions – XPS 13 without coil whine
System Noise
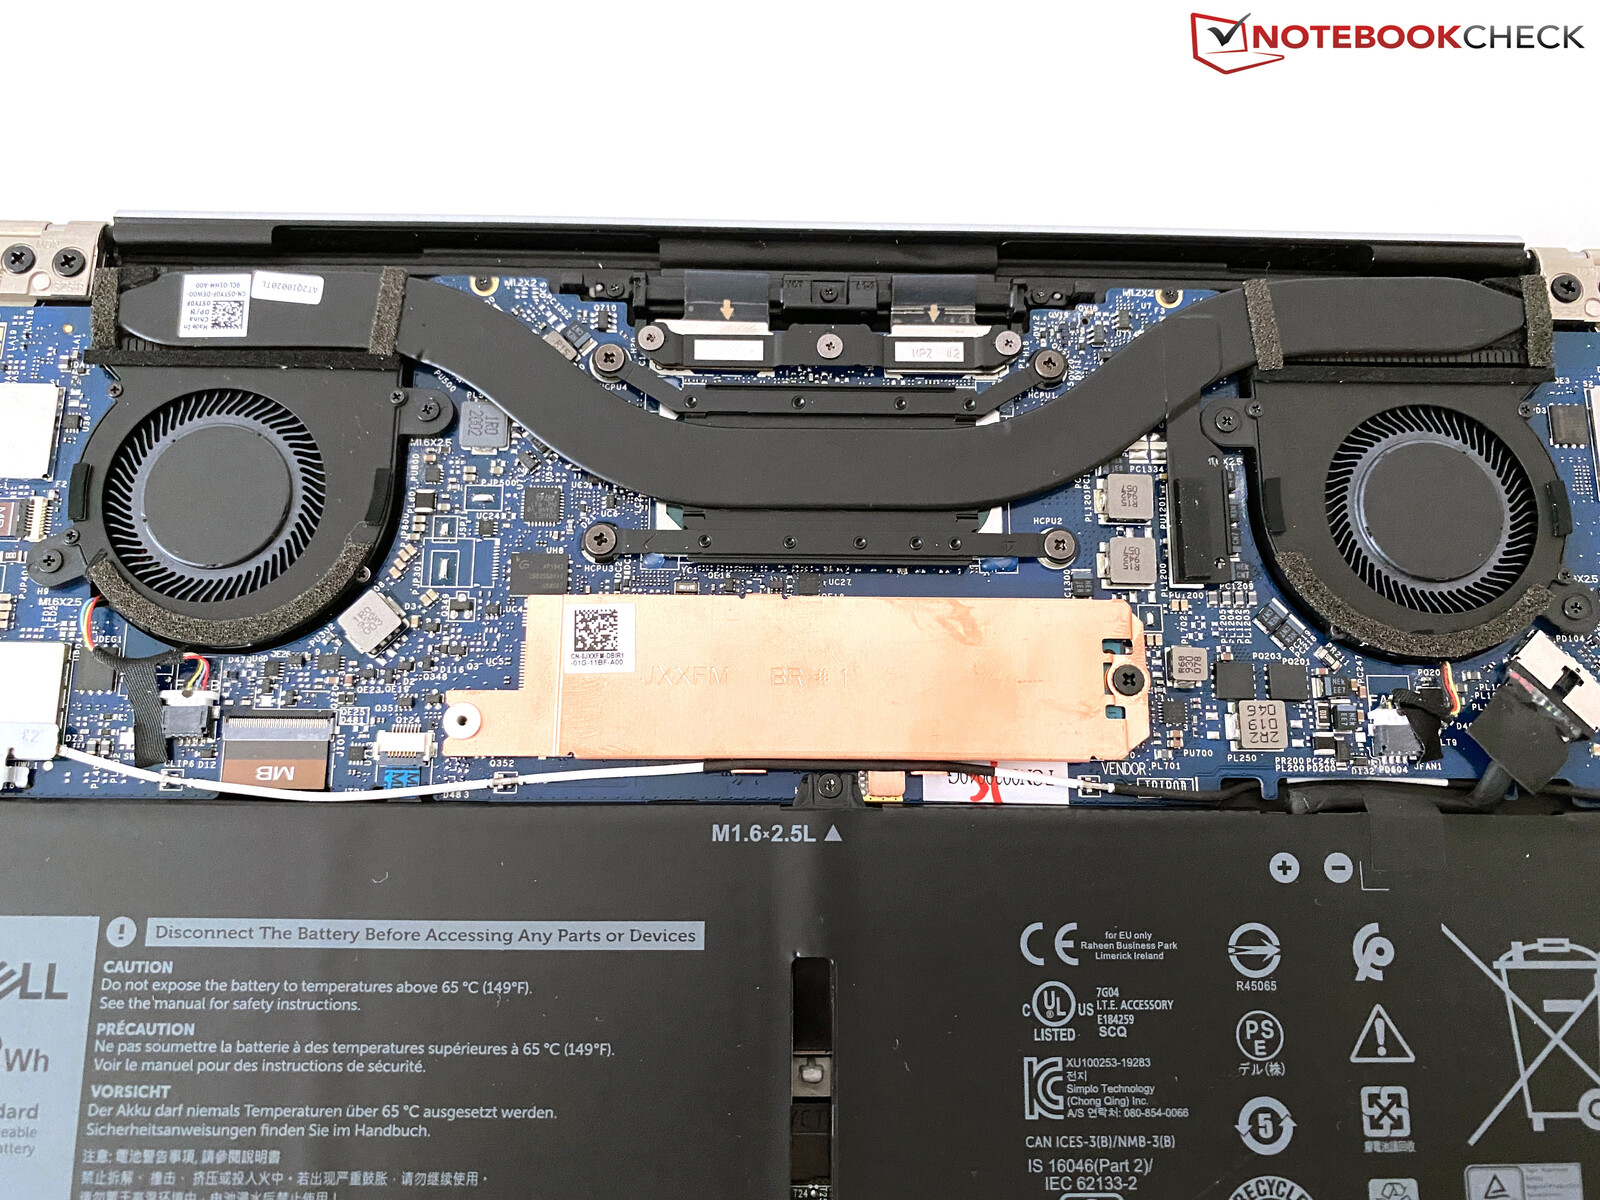
Contrary to the previous models, Dell now uses a symmetrical cooling solution with two small fans. Overall, the new XPS 13 9300 is a very quiet laptop, which is often completely silent in everyday situations. Moderate workloads only result, if at all, in a quiet murmur, which should not be noticeable in a normal working environment. Only full load (like our stress test or during gaming), you can clearly hear the two fans. 32.4 dB(A) is objectively not very loud, but you can hear a pretty high pitched sound from the small fans, so the subjective noise is definitely audible under load. Still, we would not call it an annoying noise.
It seems Dell learned from the past when it comes to electronic sounds/coil whine, because we could not hear any from our test unit, neither in everyday use, nor the benchmarks.
Noise Level
| Idle |
| 29.3 / 29.3 / 29.3 dB(A) |
| Load |
| 30 / 32.4 dB(A) |
 | ||
30 dB silent 40 dB(A) audible 50 dB(A) loud |
||
min: | ||
| Dell XPS 13 9300 i5 FHD UHD Graphics G1 (Ice Lake 32 EU), i5-1035G1, Toshiba XG6 KXG60ZNV512G | Apple MacBook Pro 13 2019 2TB3 Iris Plus Graphics 645, i5-8257U, Apple SSD AP0256 | Acer Swift 3 SF313-52-71Y7 Iris Plus Graphics G7 (Ice Lake 64 EU), i7-1065G7, Intel SSD 660p 1TB SSDPEKNW010T8 | Lenovo ThinkPad X390-20Q1S02M00 UHD Graphics 620, i5-8265U, Intel SSD Pro 7600p SSDPEKKF512G8L | Dell XPS 13 9380 2019 UHD Graphics 620, i5-8265U, SK hynix PC401 HFS256GD9TNG | Dell XPS 13 7390 2-in-1 Core i7 Iris Plus Graphics G7 (Ice Lake 64 EU), i7-1065G7, Toshiba BG4 KBG40ZPZ512G | |
|---|---|---|---|---|---|---|
| Noise | -5% | -3% | -4% | -7% | -4% | |
| off / environment * | 29.3 | 29.5 -1% | 30.3 -3% | 29.2 -0% | 30.4 -4% | 28.1 4% |
| Idle Minimum * | 29.3 | 29.5 -1% | 30.3 -3% | 29.2 -0% | 30.4 -4% | 28.1 4% |
| Idle Average * | 29.3 | 29.5 -1% | 30.3 -3% | 29.2 -0% | 30.4 -4% | 28.1 4% |
| Idle Maximum * | 29.3 | 29.5 -1% | 30.3 -3% | 29.2 -0% | 30.4 -4% | 28.1 4% |
| Load Average * | 30 | 31.1 -4% | 31.7 -6% | 34.8 -16% | 31.7 -6% | 31.7 -6% |
| Load Maximum * | 32.4 | 39.3 -21% | 32.7 -1% | 34.8 -7% | 38.1 -18% | 43.4 -34% |
| Witcher 3 ultra * | 43.4 |
* ... smaller is better
Temperature
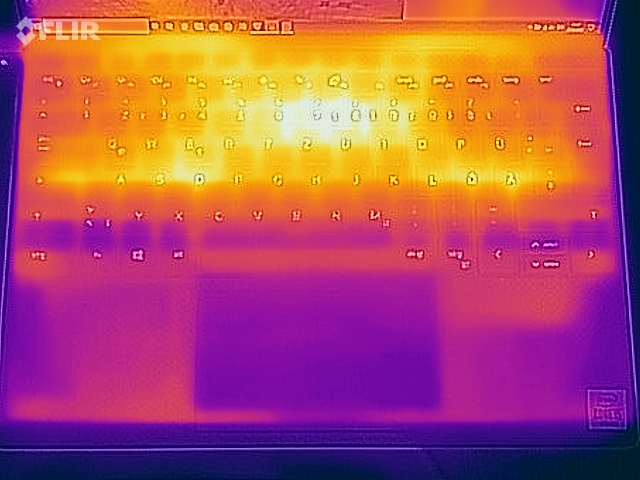
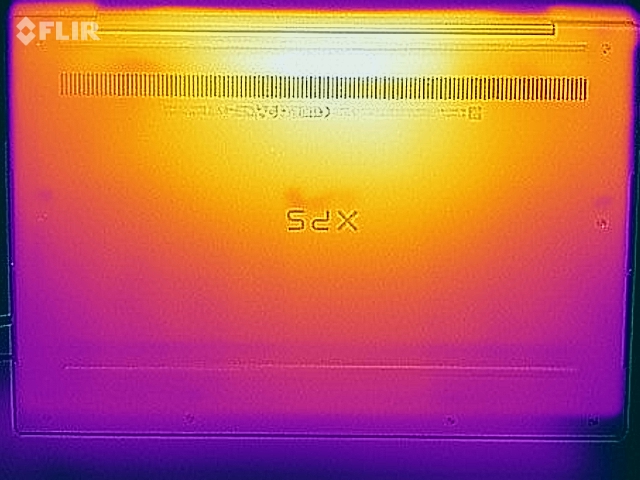
The XPS 13 9300 can get pretty warm under load and we measure up to 50 °C (122 °F) in the central upper keyboard area. Both the palm rests and the bottom of the base unit stay noticeably cooler though, so it is still possible to use the device on the lap. There are no problems in everyday situations.
During the stress test with combined CPU and GPU load, the system can maintain the 25W consumption for the processor a bit longer, but it eventually drops to 15W as well. At the beginning of the test, we can see up to 46W for a couple of seconds. After the stress test, there are no performance limitations.
(-) The maximum temperature on the upper side is 50.8 °C / 123 F, compared to the average of 35.9 °C / 97 F, ranging from 21.4 to 59 °C for the class Subnotebook.
(±) The bottom heats up to a maximum of 42.2 °C / 108 F, compared to the average of 39.4 °C / 103 F
(+) In idle usage, the average temperature for the upper side is 23.6 °C / 74 F, compared to the device average of 30.7 °C / 87 F.
(+) The palmrests and touchpad are cooler than skin temperature with a maximum of 30.1 °C / 86.2 F and are therefore cool to the touch.
(±) The average temperature of the palmrest area of similar devices was 28.3 °C / 82.9 F (-1.8 °C / -3.3 F).
Speakers
The two stereo speakers are very good, especially for such a compact system like the XPS 13. The sound is very spatial and rich when you watch videos or movies, only the bass is very limited. Music playback (like web radio) is no problem, although you should not expect a serious Hi-Fi replacement.
We are also convinced by the speakers in conference calls with clear voices and we did not notice any problems with the microphones during the review. As we have mentioned before, the contacts of the stereo jack are just lying on the mainboard. We cannot say whether this will result in long-term issues.
Dell XPS 13 9300 i5 FHD audio analysis
(±) | speaker loudness is average but good (78.4 dB)
Bass 100 - 315 Hz
(±) | reduced bass - on average 9.4% lower than median
(±) | linearity of bass is average (12.5% delta to prev. frequency)
Mids 400 - 2000 Hz
(±) | higher mids - on average 6.7% higher than median
(+) | mids are linear (5.6% delta to prev. frequency)
Highs 2 - 16 kHz
(+) | balanced highs - only 4% away from median
(+) | highs are linear (5% delta to prev. frequency)
Overall 100 - 16.000 Hz
(±) | linearity of overall sound is average (19.8% difference to median)
Compared to same class
» 57% of all tested devices in this class were better, 7% similar, 36% worse
» The best had a delta of 5%, average was 19%, worst was 53%
Compared to all devices tested
» 45% of all tested devices were better, 7% similar, 48% worse
» The best had a delta of 4%, average was 25%, worst was 134%
Apple MacBook Pro 13 2019 2TB3 audio analysis
(±) | speaker loudness is average but good (79.1 dB)
Bass 100 - 315 Hz
(±) | reduced bass - on average 10.7% lower than median
(±) | linearity of bass is average (8.7% delta to prev. frequency)
Mids 400 - 2000 Hz
(+) | balanced mids - only 4.6% away from median
(+) | mids are linear (3.8% delta to prev. frequency)
Highs 2 - 16 kHz
(+) | balanced highs - only 2.3% away from median
(+) | highs are linear (4.7% delta to prev. frequency)
Overall 100 - 16.000 Hz
(±) | linearity of overall sound is average (15.6% difference to median)
Compared to same class
» 30% of all tested devices in this class were better, 5% similar, 65% worse
» The best had a delta of 5%, average was 19%, worst was 53%
Compared to all devices tested
» 19% of all tested devices were better, 4% similar, 77% worse
» The best had a delta of 4%, average was 25%, worst was 134%
Energy Management – XPS 13 runs and runs and runs
Power Consumption
The XPS 13 9300 is a very efficient laptops with light workloads, but you should be a bit careful with the keyboard illumination. It increases the consumption by 1.8W on the first stage, and another 1.5W on the second stage. This can have an effect, especially if you are on the road without the possibility to charge the device. The 45W power adapter is sufficient since the maximum consumption of 50W is limited to a couple of seconds. A pretty small power adapter also means a long charging time though, because it takes 161 minutes before the laptop is fully charged again.
| Off / Standby | |
| Idle | |
| Load |
|
| Dell XPS 13 9300 i5 FHD i5-1035G1, UHD Graphics G1 (Ice Lake 32 EU), Toshiba XG6 KXG60ZNV512G, IPS, 1920x1200, 13.40 | Apple MacBook Pro 13 2019 2TB3 i5-8257U, Iris Plus Graphics 645, Apple SSD AP0256, IPS, 2560x1600, 13.30 | Acer Swift 3 SF313-52-71Y7 i7-1065G7, Iris Plus Graphics G7 (Ice Lake 64 EU), Intel SSD 660p 1TB SSDPEKNW010T8, IPS, 2256x1504, 13.50 | Lenovo ThinkPad X390-20Q1S02M00 i5-8265U, UHD Graphics 620, Intel SSD Pro 7600p SSDPEKKF512G8L, IPS LED, 1920x1080, 13.30 | Dell XPS 13 9380 2019 i5-8265U, UHD Graphics 620, SK hynix PC401 HFS256GD9TNG, IPS, 3840x2160, 13.30 | Dell XPS 13 7390 2-in-1 Core i7 i7-1065G7, Iris Plus Graphics G7 (Ice Lake 64 EU), Toshiba BG4 KBG40ZPZ512G, IPS, 1920x1200, 13.40 | Average Intel UHD Graphics G1 (Ice Lake 32 EU) | Average of class Subnotebook | |
|---|---|---|---|---|---|---|---|---|
| Power Consumption | 0% | 36% | -6% | -18% | 10% | 1% | -29% | |
| Idle Minimum * | 3.4 | 2.1 38% | 1.8 47% | 3.4 -0% | 4.8 -41% | 2.6 24% | 4.13 ? -21% | 4.9 ? -44% |
| Idle Average * | 6 | 6.9 -15% | 4.6 23% | 5.6 7% | 8.6 -43% | 5.3 12% | 7.07 ? -18% | 8.36 ? -39% |
| Idle Maximum * | 10.2 | 7.8 24% | 6.1 40% | 8.7 15% | 10.4 -2% | 7 31% | 8.36 ? 18% | 10.4 ? -2% |
| Load Average * | 36.6 | 42 -15% | 27.4 25% | 43.6 -19% | 37.9 -4% | 43.1 -18% | 30.6 ? 16% | 45.9 ? -25% |
| Load Maximum * | 49.3 | 64.5 -31% | 27 45% | 65 -32% | 48.5 2% | 49 1% | 45.6 ? 8% | 66 ? -34% |
| Witcher 3 ultra * | 43.1 |
* ... smaller is better
Battery Runtime
The battery capacity is still 52 Wh, and the recorded battery runtimes are very good. Our practical WLAN test runs for almost 12 hours and still 8.5 hours with the maximum display brightness. Our video test at 150 Nits even runs for around 14.5 hours.
We expect similar battery runtimes for the optional 1200p touchscreen, only the UHD panel should consume significantly more power.
| Dell XPS 13 9300 i5 FHD i5-1035G1, UHD Graphics G1 (Ice Lake 32 EU), 52 Wh | Apple MacBook Pro 13 2019 2TB3 i5-8257U, Iris Plus Graphics 645, 58.2 Wh | Acer Swift 3 SF313-52-71Y7 i7-1065G7, Iris Plus Graphics G7 (Ice Lake 64 EU), 54.5 Wh | Lenovo ThinkPad X390-20Q1S02M00 i5-8265U, UHD Graphics 620, 48 Wh | Dell XPS 13 9380 2019 i5-8265U, UHD Graphics 620, 52 Wh | Dell XPS 13 7390 2-in-1 Core i7 i7-1065G7, Iris Plus Graphics G7 (Ice Lake 64 EU), 51 Wh | Average of class Subnotebook | |
|---|---|---|---|---|---|---|---|
| Battery Runtime | 11% | -24% | -32% | -30% | -24% | -21% | |
| H.264 | 866 | 627 -28% | 764 -12% | 794 ? -8% | |||
| WiFi v1.3 | 703 | 777 11% | 620 -12% | 499 -29% | 498 -29% | 537 -24% | 629 ? -11% |
| Load | 205 | 139 -32% | 94 -54% | 141 -31% | 115.4 ? -44% | ||
| Reader / Idle | 1281 | 1032 | 1252 ? |
Pros
Cons
Verdict – XPS 13 9300 is overall better than before, but also more expensive
Overall, the new XPS 13 9300 leaves a very good impression in our review. The case is well built, extremely compact, and sturdy at the same time. The matte 16:10 display can convince us expect for the slow response times, but we recommend to calibrate it. The two speakers are also completely sufficient.
The performance is a double-edged sword, because the CPU performance is lower compared to the predecessor. This is certainly not an ideal development, but to be fair, the performance of the Core i5 will still be more than sufficient for many users, especially in combination with the fast SSD. The performance of the iGPU has increased as well, so you can play some games. This brings us to the optional Core i7 with the even faster iGPU. There should not be an advantage in terms of raw CPU performance, but the iGPU is a significant upgrade and worth a look.
Dell's new XPS 13 9300 is a very good successor for the popular subnotebook. We did not find any serious drawbacks during our review, but the new model is no bargain at an entry-level price of 1500 Euros (~$1614).
The return to the 16:10 display is an appreciated move and we also like the fast card reader, but we would have liked to see one more USB port. We will also review the XPS 13 9300 with the faster Core i7 and the UHD panel soon.
Dell XPS 13 9300 i5 FHD
-
03/19/2020 v7
Andreas Osthoff
More articles related to this device
Dell XPS 13 9300 i5 FHD (XPS 13 9300 Series)Related Articles


Pricecompare
