 Deutsch
 English
 Español
 Français
 Italiano
 Nederlands
 Polski
 Português
 Русский
 Türkçe
 Svenska
 Chinese
 Magyar
Dell XPS 17 9700 Review - Multimedia laptop with bright matte FHD panel and long battery runtime
Multimedia laptops are often jack of all trades in the mobile segment, and devices with screens bigger than 15 inches are usually equipped with dedicated GPUs to provide decent gaming performance. However, if you are looking for a big multimedia laptop and do not plan on gaming, you do not really need an expensive dGPU.
Dell is one of the exceptions, because both the XPS 15 as well as the new XPS 17 are also offered without dedicated GPUs. While the base spec of the XPS 15 starts at around 1400 Euros, Dell still charges almost 2000 Euros (starting from $1349 in the US). In return, you get a Core i5 including iGPU, 8 GB RAM, 512 GB NVMe- storage as well as a matte FHD panel. The specs are not really overwhelming, so we want to find out whether the high retail price of the XPS 17 is still justified.
Topics like the case, the ports, the input devices, and the speakers are identical to the previously tested unit, so please see our comprehensive review of the XPS 17 9700 with the i7 CPU, RTX 2060 Max-Q GPU, and 4K touchscreen for more information:
Rating | Date | Model | Weight | Height | Size | Resolution | Best Price |
|---|---|---|---|---|---|---|---|
| 85.8 % | 11/2020 | Dell XPS 17 9700 i5-10300H i5-10300H, UHD Graphics 630 | 2.3 kg | 19.5 mm | 17.30" | 1920x1200 | |
| 85.2 % | 08/2020 | LG Gram 17 17Z90N-V.AA77G i7-1065G7, Iris Plus Graphics G7 (Ice Lake 64 EU) | 1.4 kg | 17.4 mm | 17.00" | 2560x1600 | |
| 87.9 % | 07/2020 | Dell XPS 17 9700 Core i7 RTX 2060 Max-Q i7-10875H, GeForce RTX 2060 Max-Q | 2.5 kg | 19.5 mm | 17.00" | 3840x2400 | |
| 84.5 % | 11/2020 | Honor MagicBook Pro (AMD) R5 4600H, Vega 6 | 1.7 kg | 16.9 mm | 16.10" | 1920x1080 | |
| 86.8 % | 05/2020 | Dell XPS 15 9500 Core i5 i5-10300H, UHD Graphics 630 | 1.8 kg | 18 mm | 15.60" | 1920x1200 |
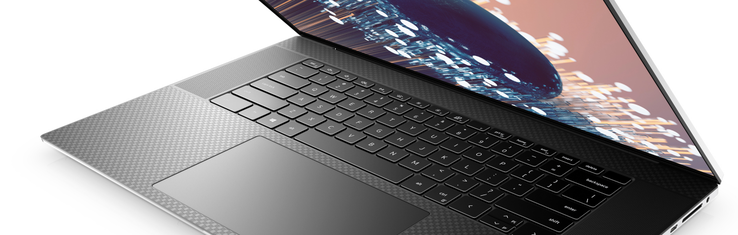
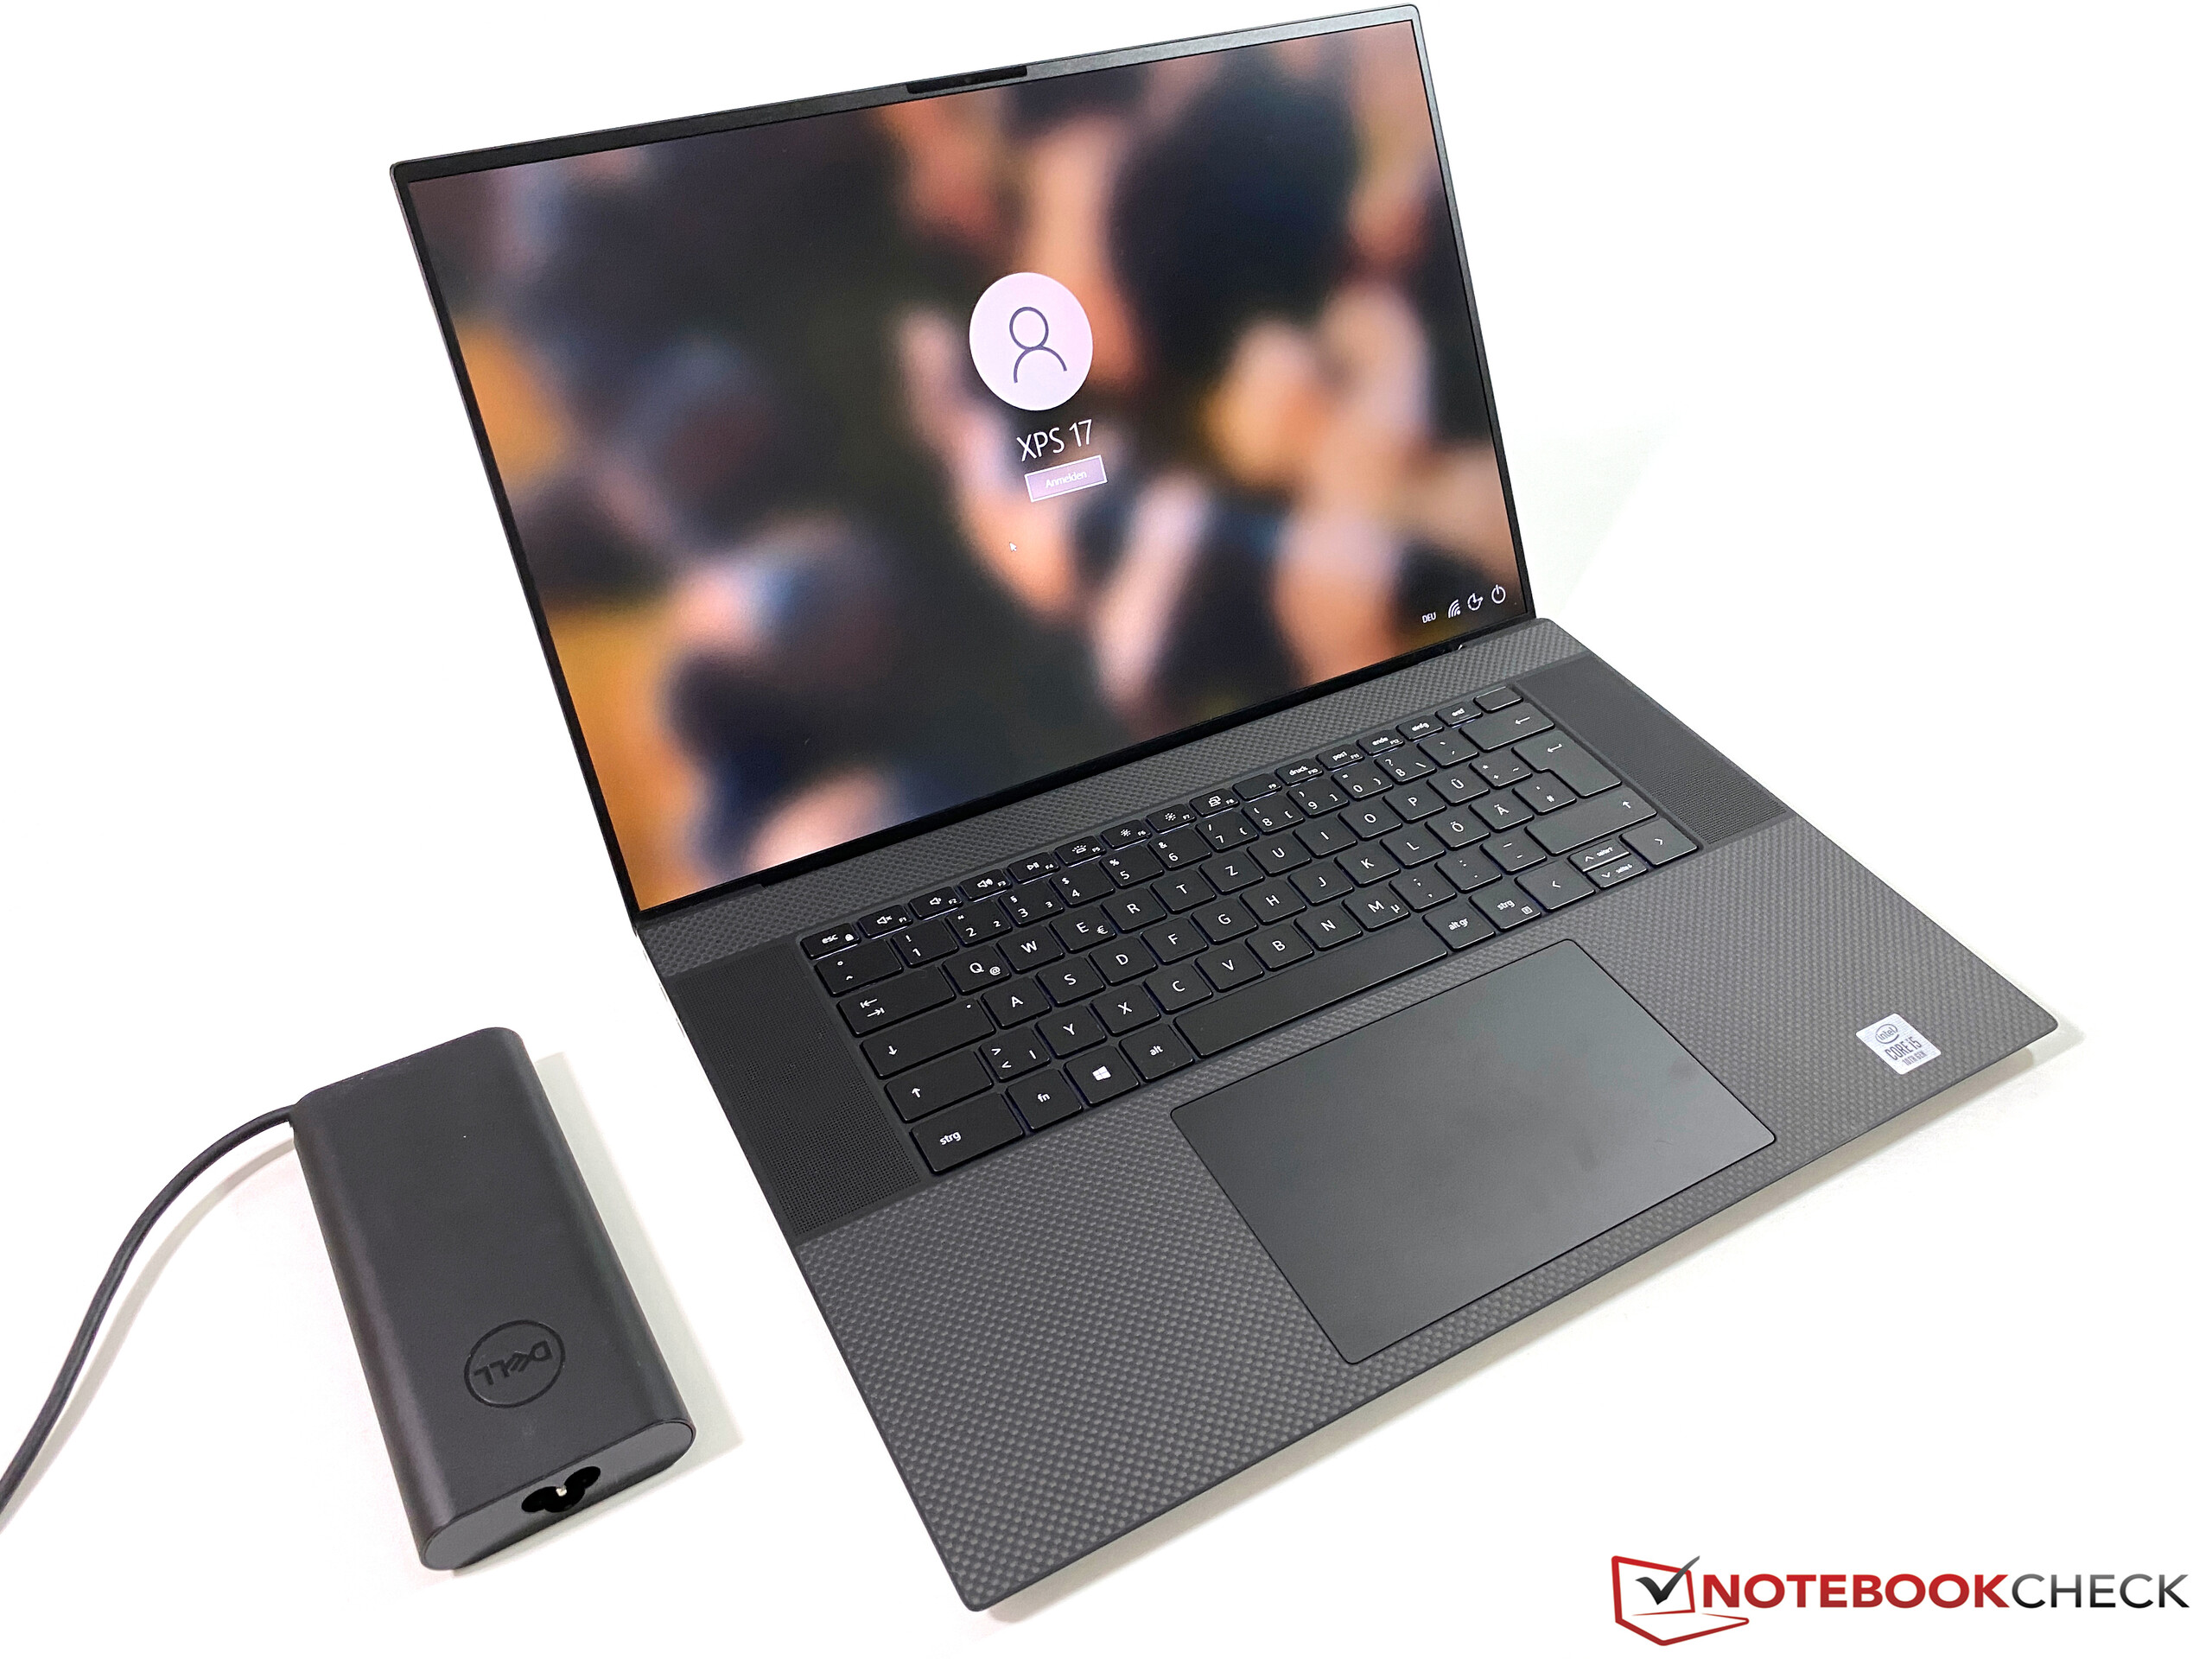
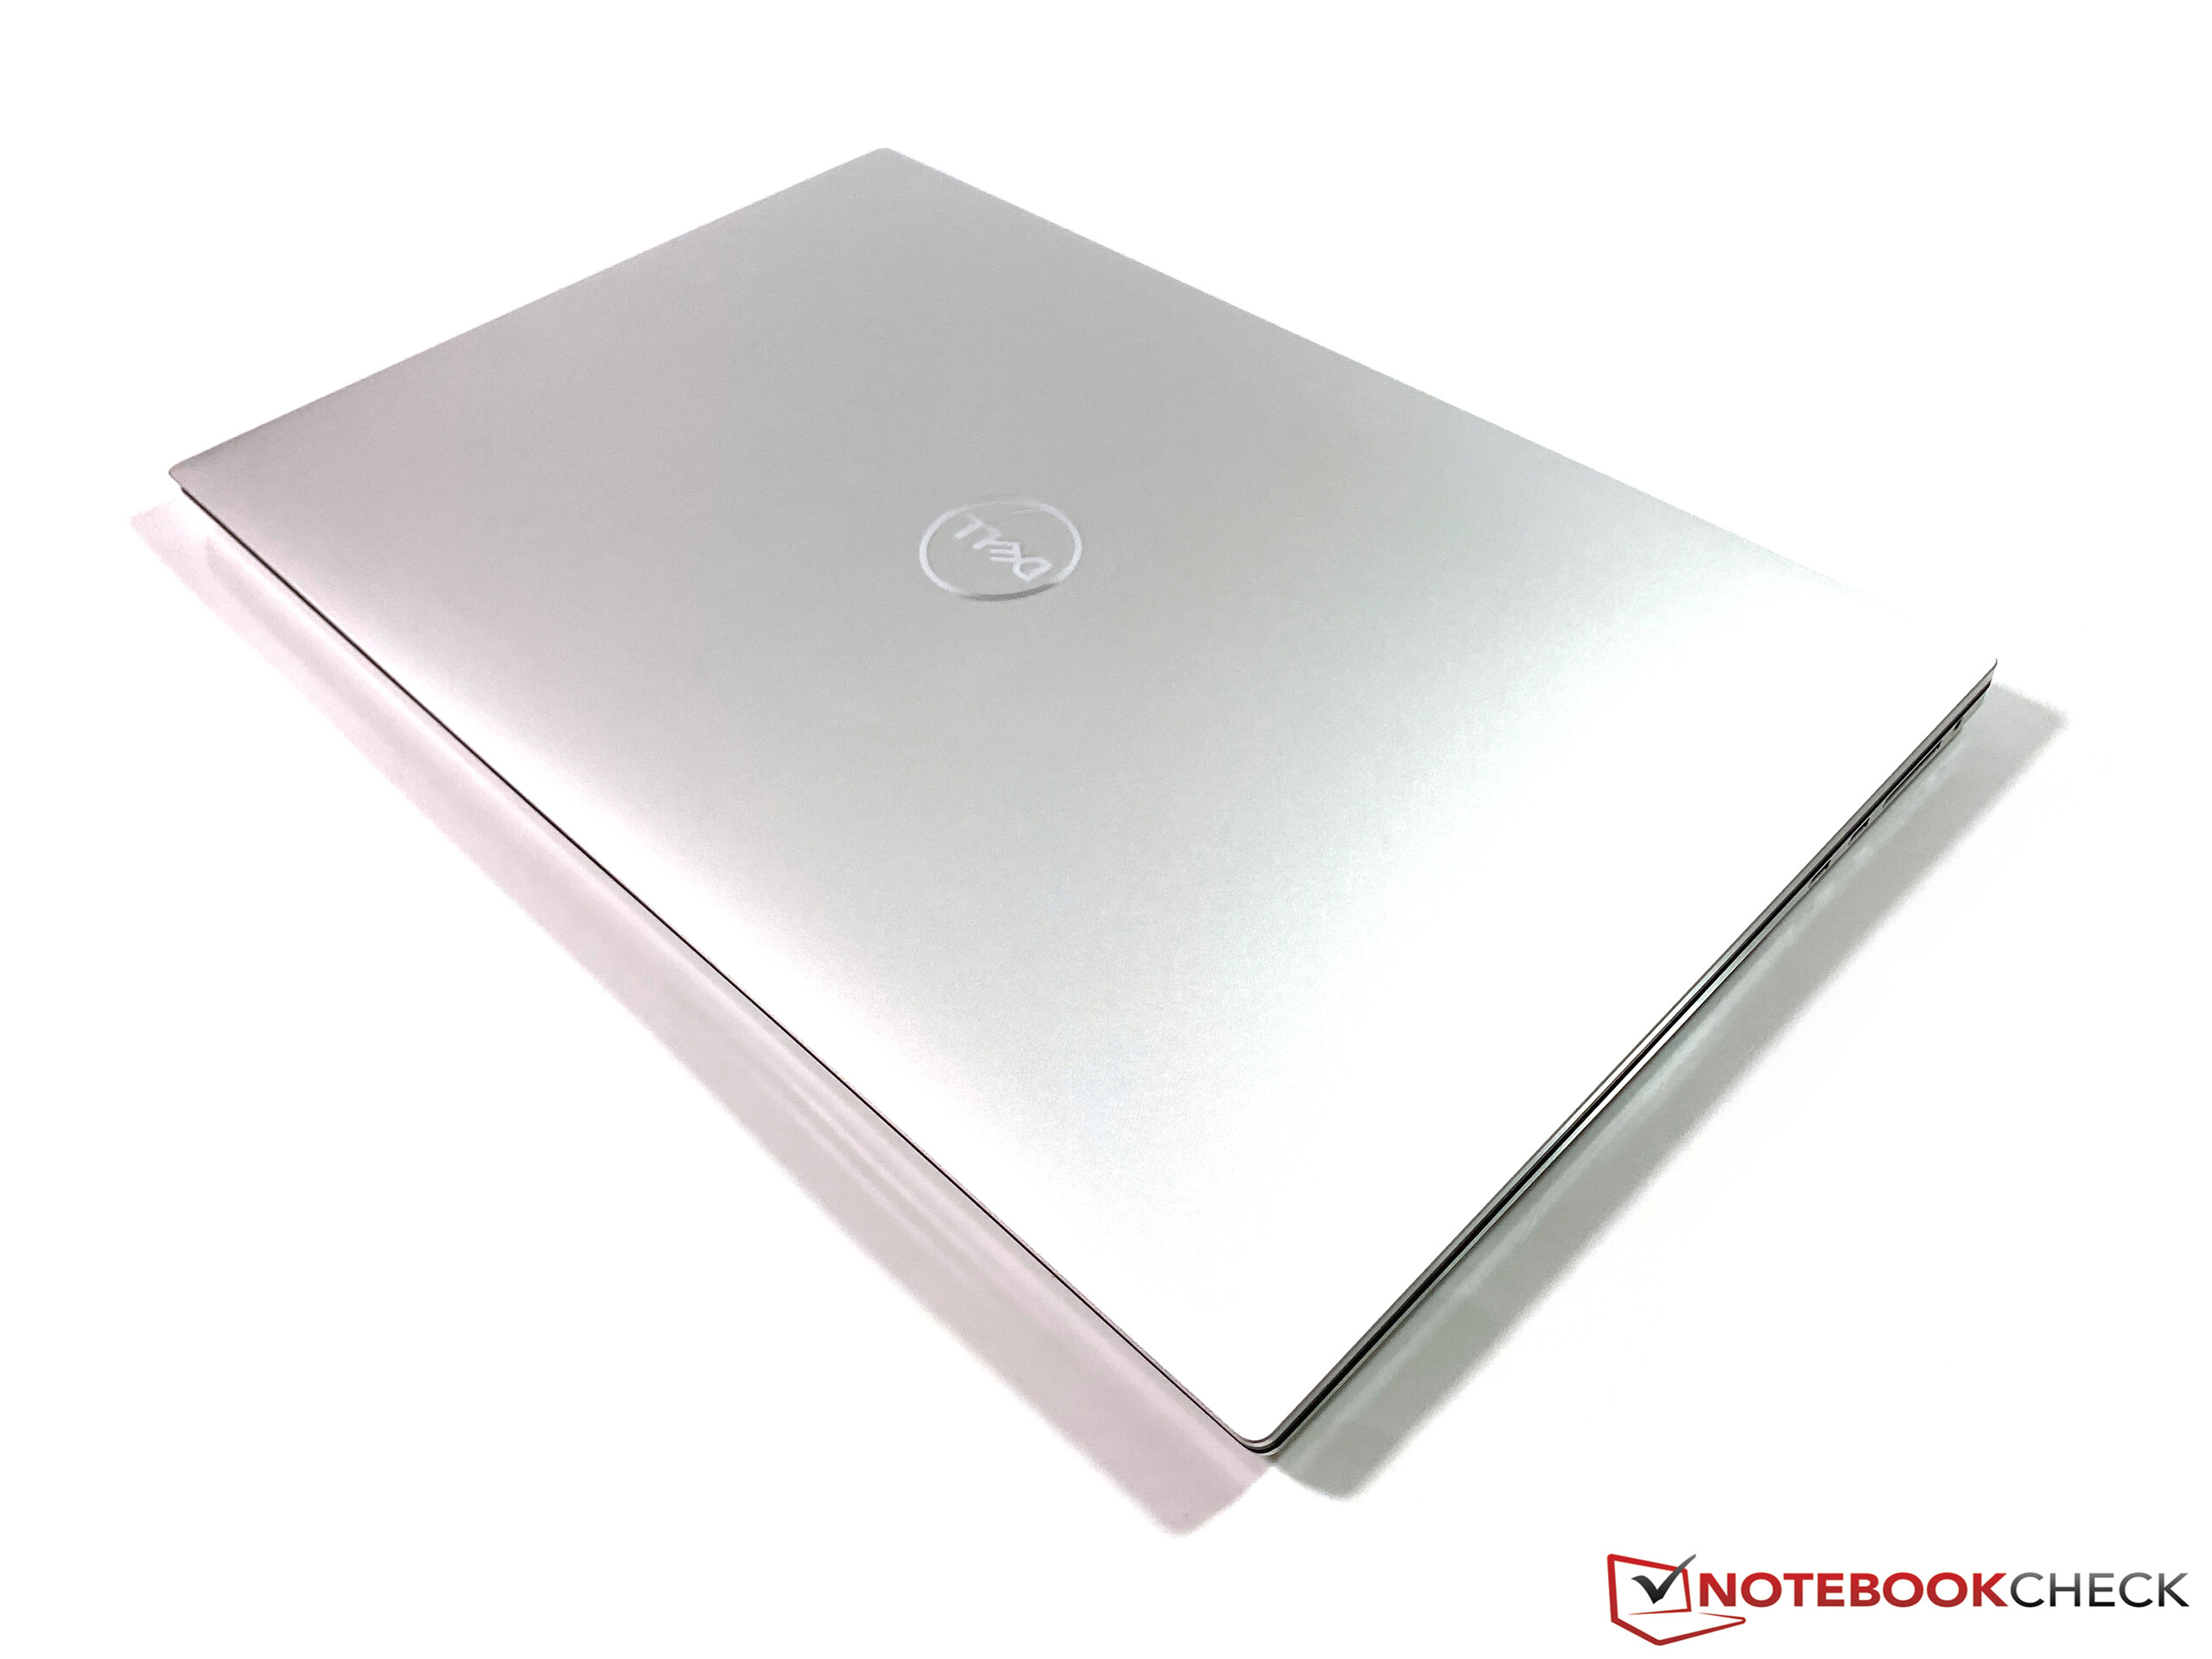
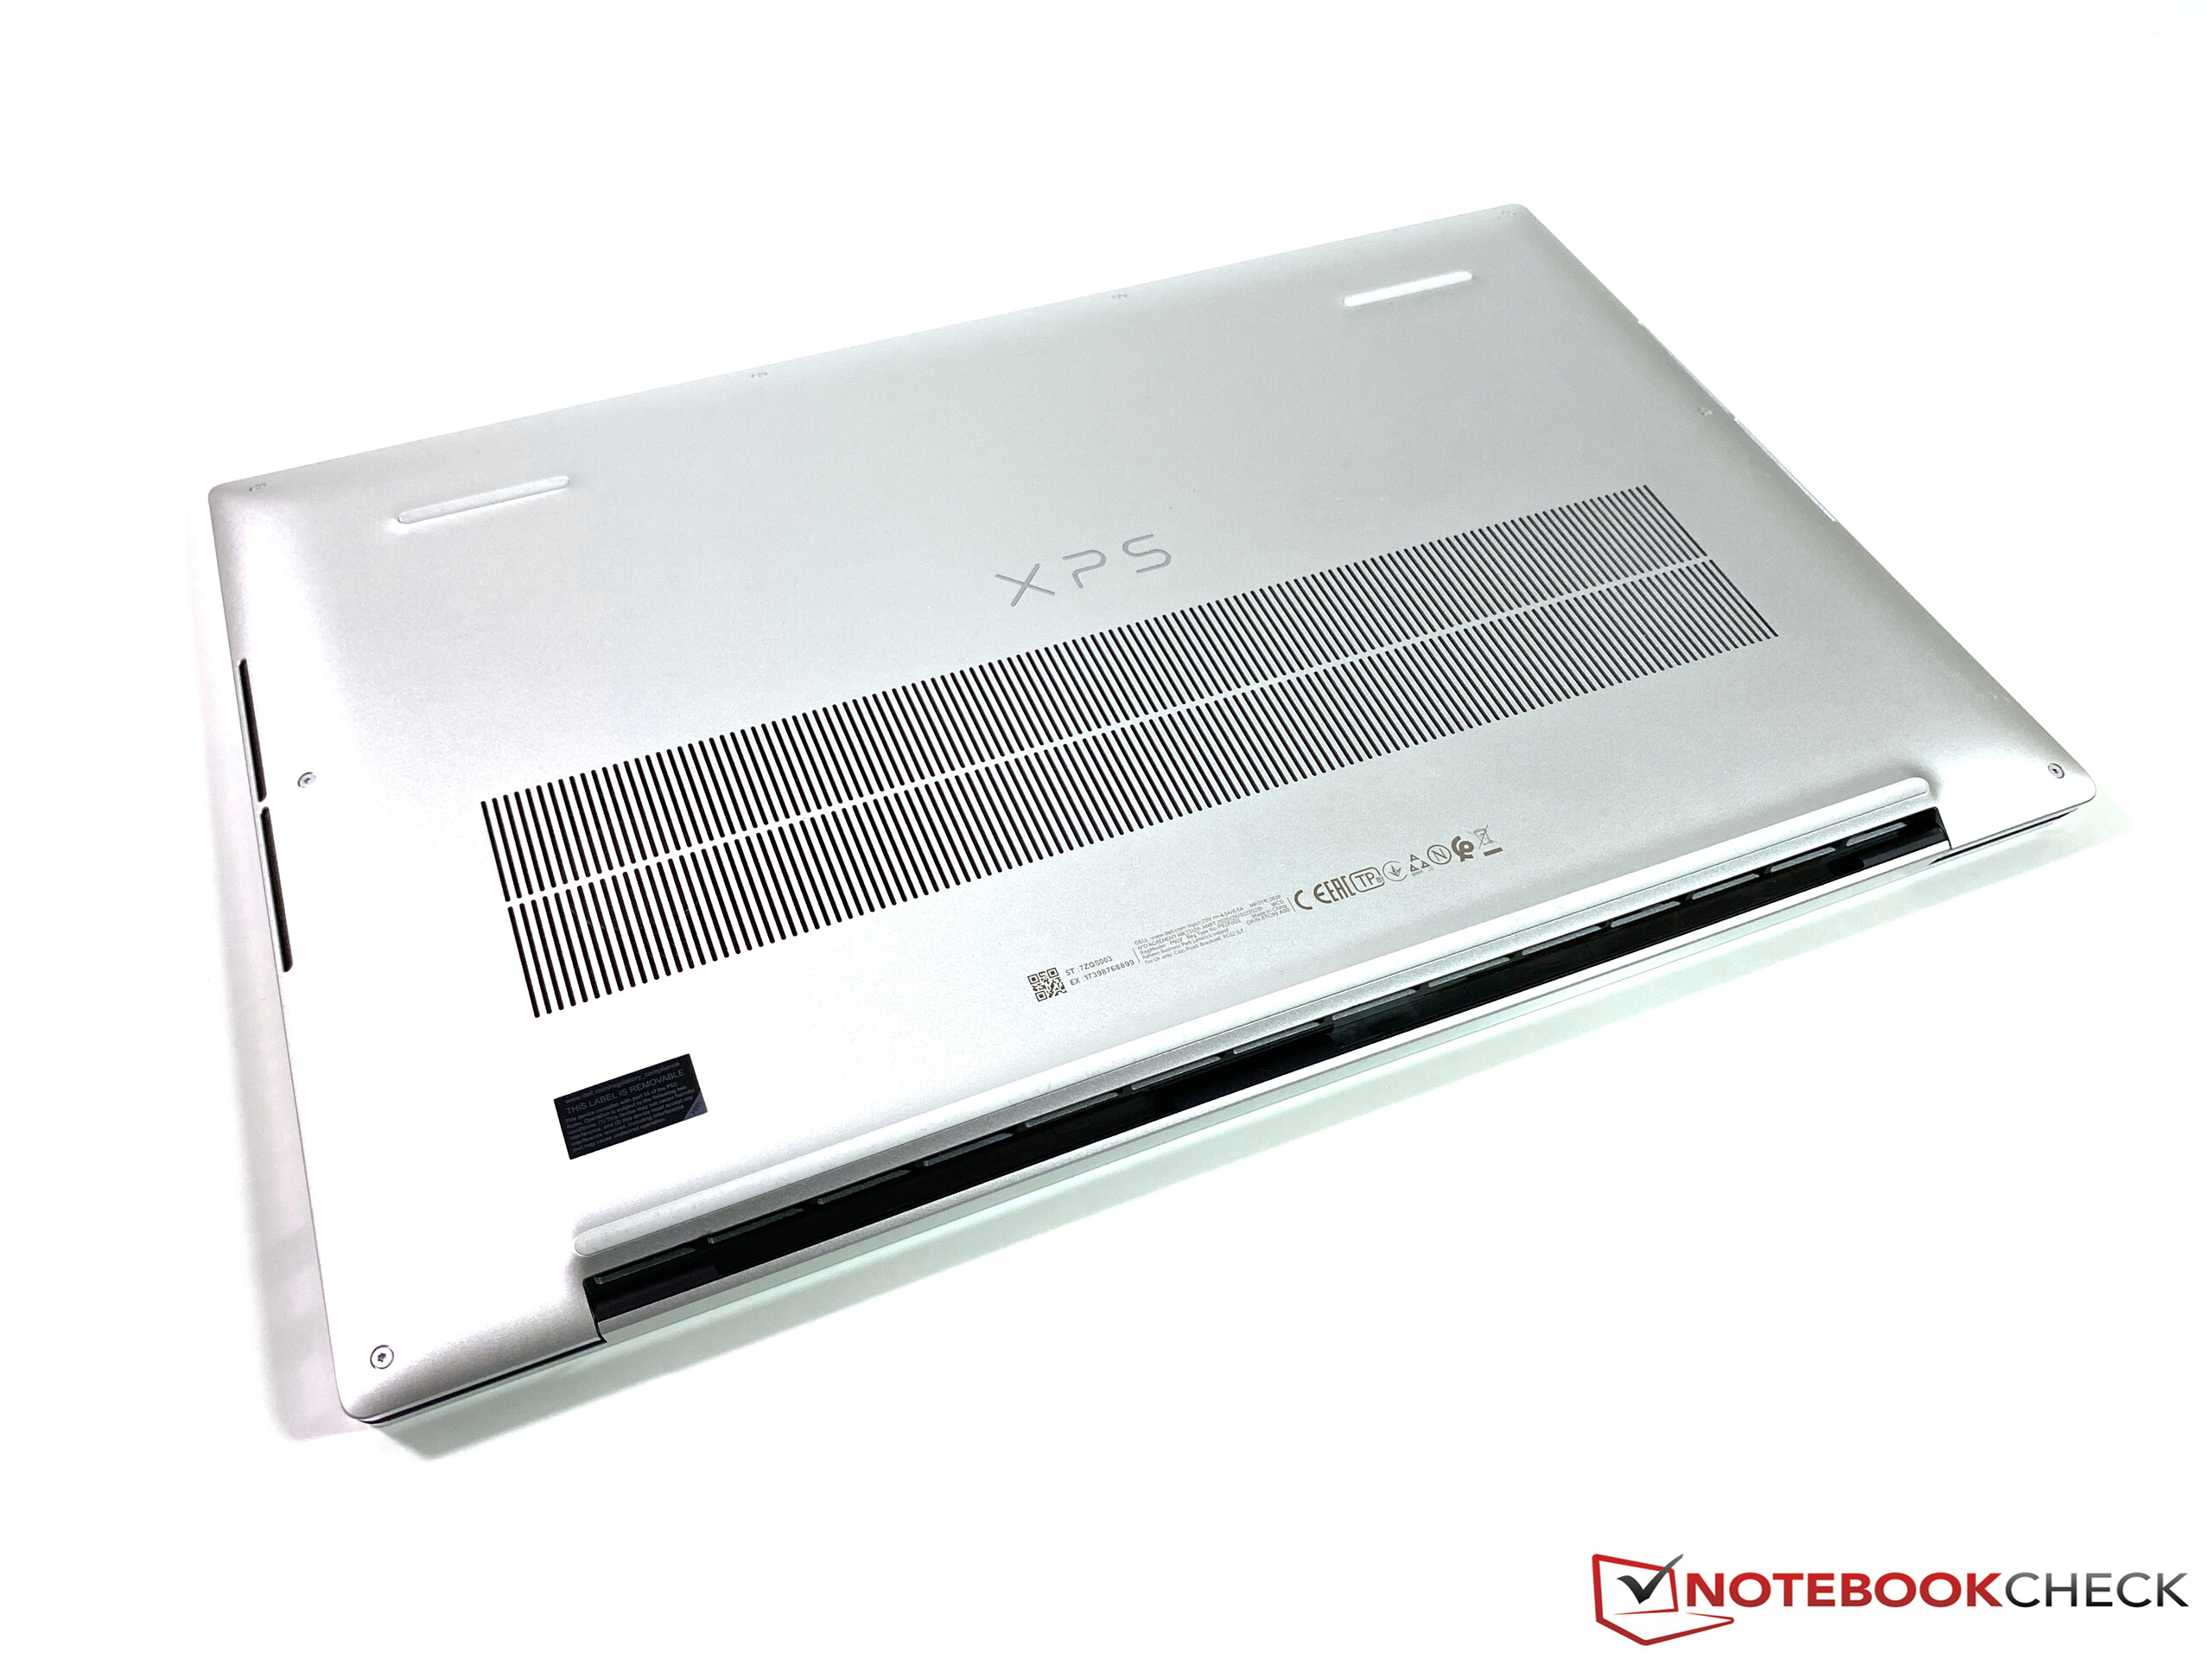
Case - XPS with high-quality but heavy chassis
There is obviously no visual difference between XPS 17 9700 systems with or without dedicated GPUs. You get a case with a very high build quality and the XPS 17 just looks good, even though the dark surfaces of the palm rests are very prone to fingerprints.
A quick comparison of the weight reveals that the lack of the Nvidia GPU, 4K panel, and the vapor chamber cooling reduces the total weight by around 170 grams. However, the XPS 17 is still comparatively heavy; the LG Gram 17 is almost 1 kg lighter.
| SD Card Reader | |
| average JPG Copy Test (av. of 3 runs) | |
| Dell XPS 15 9500 Core i5 (Toshiba Exceria Pro SDXC 64 GB UHS-II) | |
| Dell XPS 17 9700 i5-10300H (Toshiba Exceria Pro SDXC 64 GB UHS-II) | |
| Dell XPS 17 9700 Core i7 RTX 2060 Max-Q (Toshiba Exceria Pro SDXC 64 GB UHS-II) | |
| Average of class Multimedia (17.6 - 205, n=66, last 2 years) | |
| LG Gram 17 17Z90N-V.AA77G (Toshiba Exceria Pro M501 microSDXC 64GB) | |
| maximum AS SSD Seq Read Test (1GB) | |
| Dell XPS 17 9700 i5-10300H (Toshiba Exceria Pro SDXC 64 GB UHS-II) | |
| Dell XPS 15 9500 Core i5 (Toshiba Exceria Pro SDXC 64 GB UHS-II) | |
| Dell XPS 17 9700 Core i7 RTX 2060 Max-Q (Toshiba Exceria Pro SDXC 64 GB UHS-II) | |
| Average of class Multimedia (16.8 - 266, n=62, last 2 years) | |
| LG Gram 17 17Z90N-V.AA77G (Toshiba Exceria Pro M501 microSDXC 64GB) | |
Webcam


Display - XPS 17 with matte FHD screen
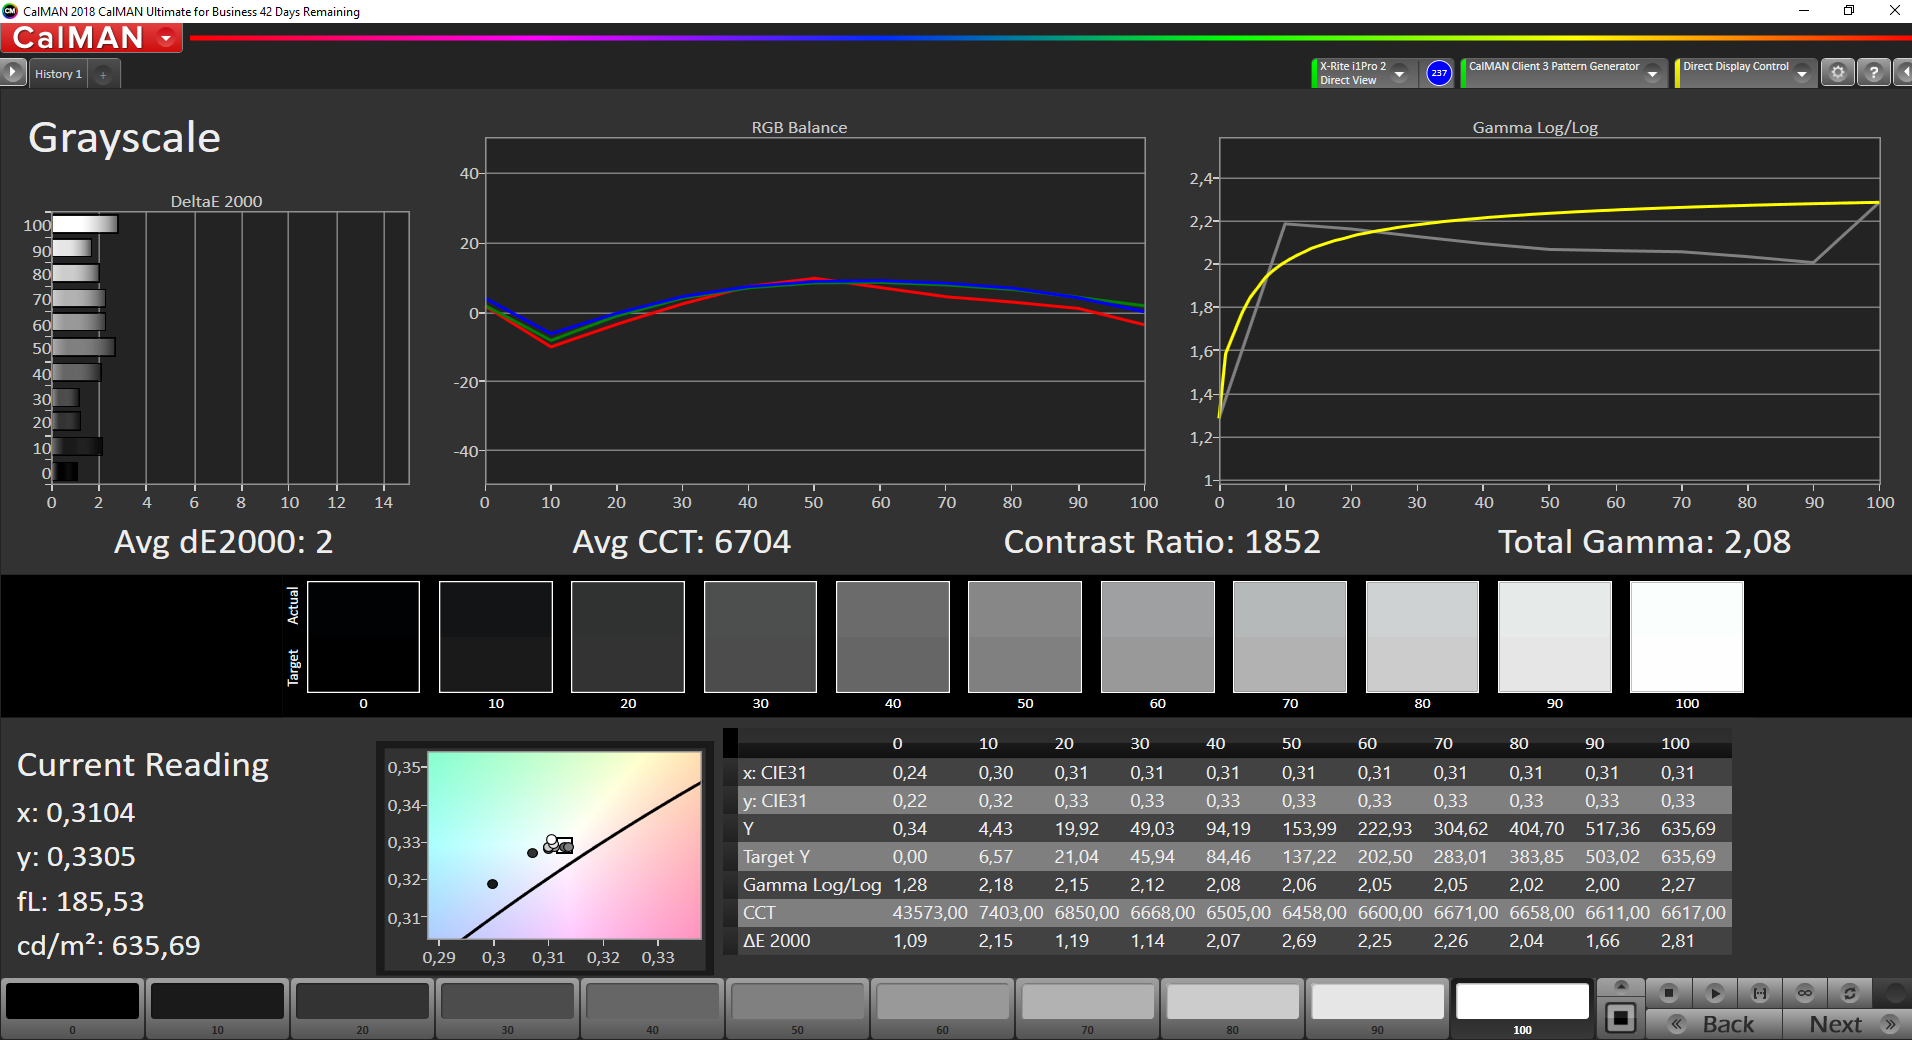
Dell offers two different 16:10 screens for the XPS 17. In addition to the glossy 4K touchscreen, you can also get a matte FHD+ panel that we have in our test unit. The resolution of 1920 x 1200 pixels is much lower compared to the optional 4K SKU, but contents are still sufficiently sharp. The subjective picture impression is very good and bright surfaces do not look too grainy, which is often an issue of matte panels.
Our measurements show that the panel can easily meet the advertised 500 nits with an average luminance of 580 nits. Considering the high brightness, the black value is still decent at 0.34 cd/m² and the result is an excellent contrast ratio of more than 1800:1.
We can still detect two minor issues, because we can measure PWM flickering at a brightness of 30% or lower. However, the frequency of 2500 Hz is very high and should not cause any trouble. A much more noticeable problem is the slow response time of the panel, and you can see ghosting when you move the cursor, for example. Even though this is a known issue on many panels with very slim bezels, there are also faster units.
| |||||||||||||||||||||||||
Brightness Distribution: 86 %
Center on Battery: 638 cd/m²
Contrast: 1871:1 (Black: 0.34 cd/m²)
ΔE Color 2.4 | 0.5-29.43 Ø5, calibrated: 1.5
ΔE Greyscale 2 | 0.57-98 Ø5.3
100% sRGB (Argyll 1.6.3 3D)
67.5% AdobeRGB 1998 (Argyll 1.6.3 3D)
76.6% AdobeRGB 1998 (Argyll 2.2.0 3D)
100% sRGB (Argyll 2.2.0 3D)
77.4% Display P3 (Argyll 2.2.0 3D)
Gamma: 2.08
| Dell XPS 17 9700 i5-10300H SHP14D7, IPS, 1920x1200, 17.30 | LG Gram 17 17Z90N-V.AA77G LG Display LP170WQ1-SPA1, IPS, 2560x1600, 17.00 | Dell XPS 17 9700 Core i7 RTX 2060 Max-Q Sharp LQ170R1, IPS, 3840x2400, 17.00 | Honor MagicBook Pro (AMD) N161HCA-EA3, IPS, 1920x1080, 16.10 | Dell XPS 15 9500 Core i5 Sharp LQ156N1, IPS, 1920x1200, 15.60 | |
|---|---|---|---|---|---|
| Display | -14% | 16% | -17% | 3% | |
| Display P3 Coverage | 77.4 | 62.9 -19% | 90.5 17% | 67.5 -13% | 81.5 5% |
| sRGB Coverage | 100 | 92.7 -7% | 100 0% | 69.7 -30% | 100 0% |
| AdobeRGB 1998 Coverage | 76.6 | 63.6 -17% | 99.8 30% | 69.7 -9% | 79.6 4% |
| Response Times | 32% | 15% | 327% | 27% | |
| Response Time Grey 50% / Grey 80% * | 60.4 ? | 43 ? 29% | 51.2 ? 15% | 37.6 ? 38% | 42 ? 30% |
| Response Time Black / White * | 37.6 ? | 25 ? 34% | 32 ? 15% | 25.6 ? 32% | 28.8 ? 23% |
| PWM Frequency | 2500 ? | 25250 ? 910% | |||
| Screen | -66% | -30% | 16% | -26% | |
| Brightness middle | 636 | 393 -38% | 539.4 -15% | 337 -47% | 592 -7% |
| Brightness | 580 | 354 -39% | 494 -15% | 312 -46% | 565 -3% |
| Brightness Distribution | 86 | 84 -2% | 84 -2% | 89 3% | 85 -1% |
| Black Level * | 0.34 | 0.365 -7% | 0.32 6% | 0.2 41% | 0.46 -35% |
| Contrast | 1871 | 1077 -42% | 1686 -10% | 1685 -10% | 1287 -31% |
| Colorchecker dE 2000 * | 2.4 | 4.83 -101% | 4.12 -72% | 0.8 67% | 3.19 -33% |
| Colorchecker dE 2000 max. * | 3.5 | 11.6 -231% | 7.65 -119% | 1.1 69% | 5.45 -56% |
| Colorchecker dE 2000 calibrated * | 1.5 | 1.22 19% | 3.91 -161% | 0.7 53% | 2.03 -35% |
| Greyscale dE 2000 * | 2 | 7.37 -269% | 1.5 25% | 1 50% | 3.9 -95% |
| Gamma | 2.08 106% | 2.36 93% | 2.15 102% | 2.2 100% | 2.25 98% |
| CCT | 6704 97% | 6668 97% | 6438 101% | 6538 99% | 6522 100% |
| Color Space (Percent of AdobeRGB 1998) | 67.5 | 59 -13% | 90.4 34% | 63.8 -5% | 71.6 6% |
| Color Space (Percent of sRGB) | 100 | 93 -7% | 100 0% | 99.5 0% | 100 0% |
| Total Average (Program / Settings) | -16% /
-44% | 0% /
-16% | 109% /
65% | 1% /
-14% |
* ... smaller is better
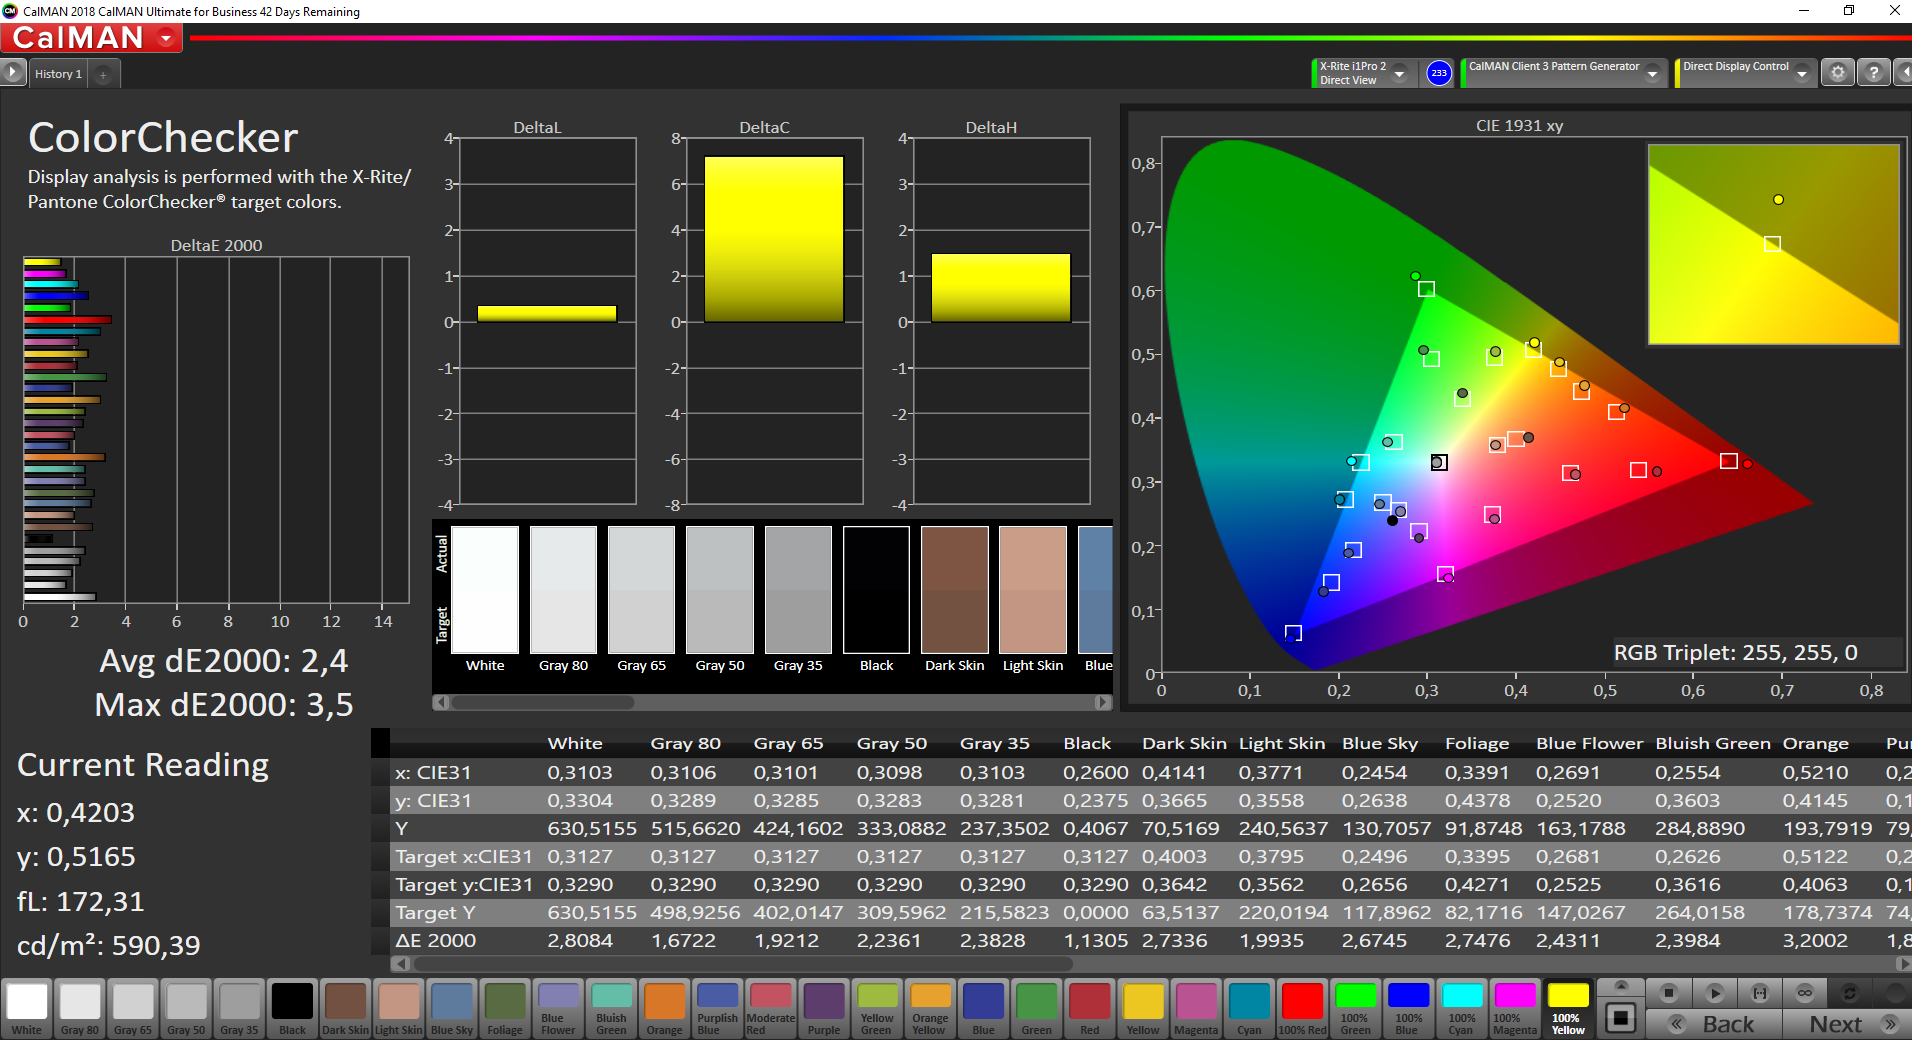

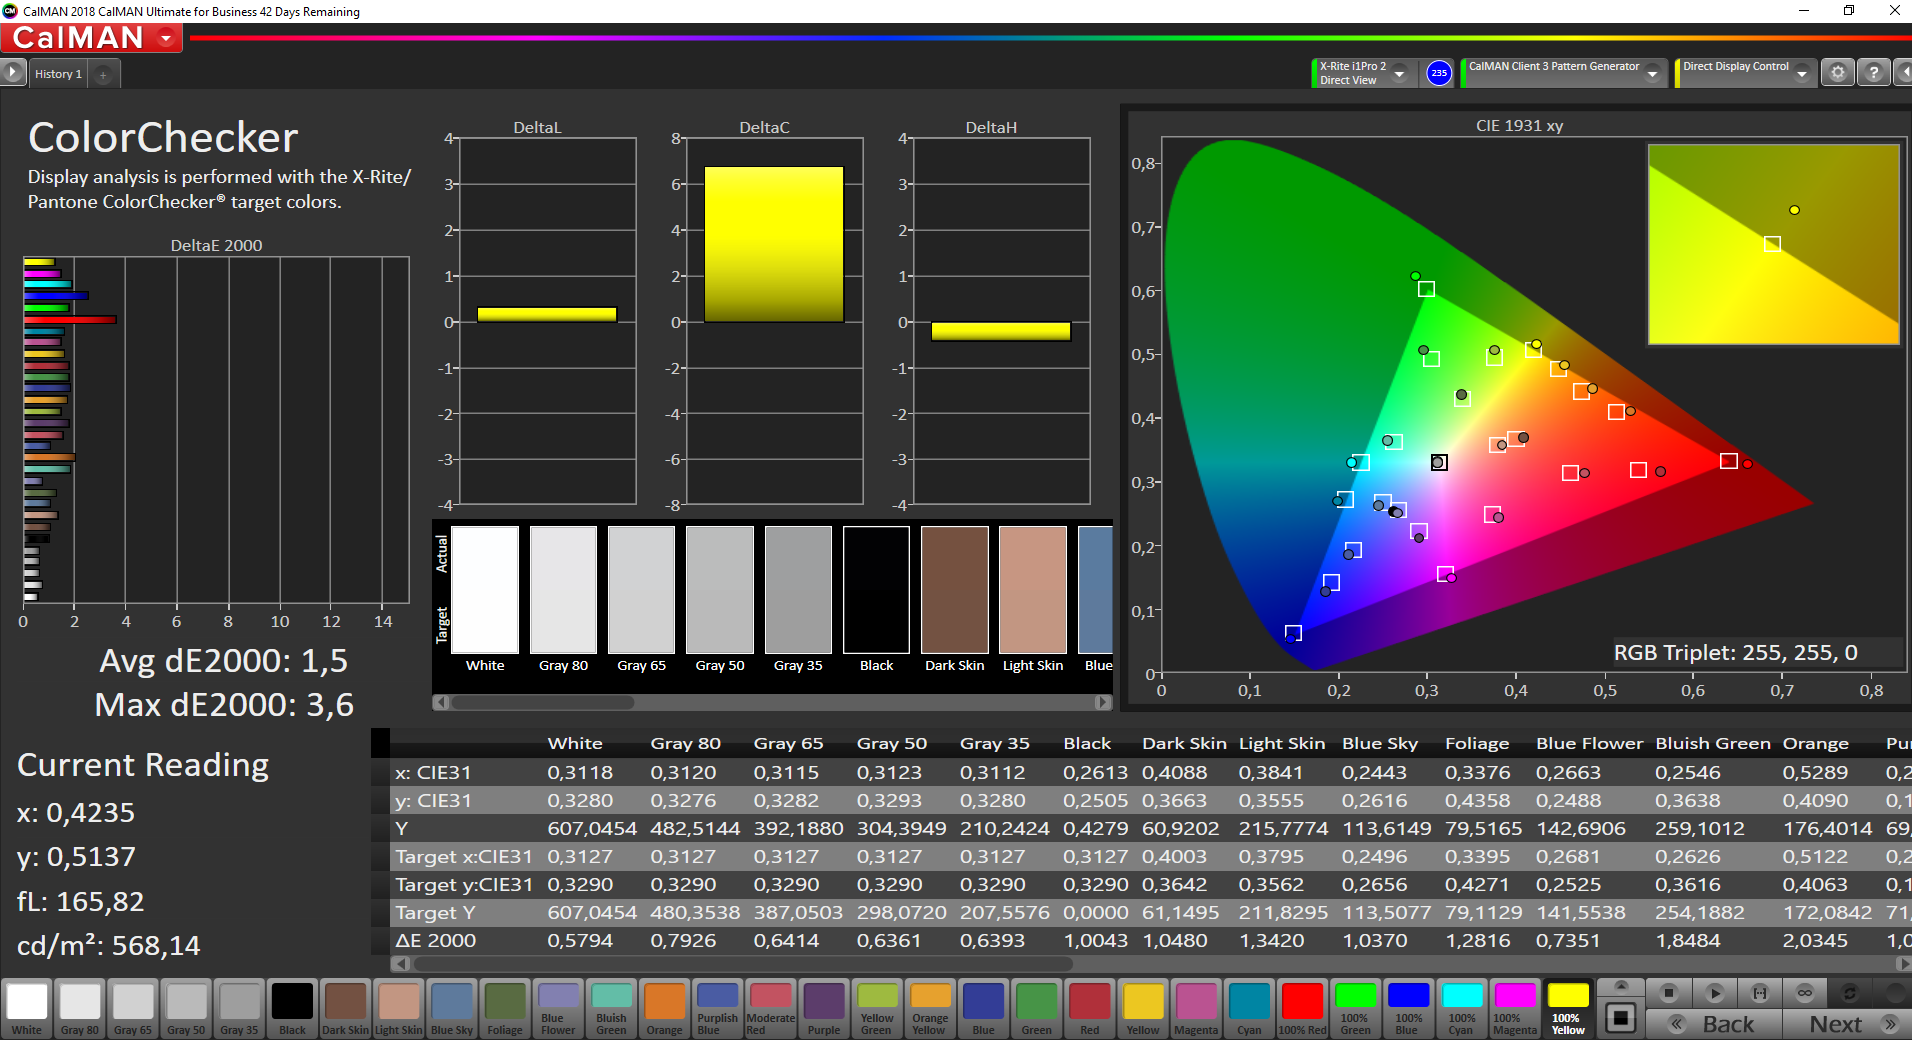
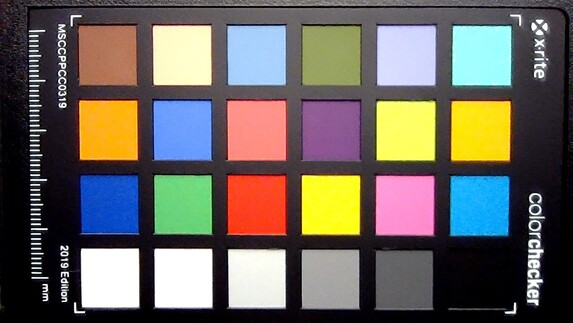
We use the professional CalMAN software in combination with the X-Rite i1 Pro 2 spectrophotometer for our tests. Most values are already very good out of the box and only a few colors exceed a deviation of 3 (compared to the sRGB reference color gamut). There is no visible color cast, so calibration is only really necessary when you want to edit pictures or videos in the sRGB gamut, which is covered completely by the panel. Our calibration (free to download in the box above) improves the panel performance even further.
Display Response Times
| ↔ Response Time Black to White | ||
|---|---|---|
| 37.6 ms ... rise ↗ and fall ↘ combined | ↗ 20 ms rise | 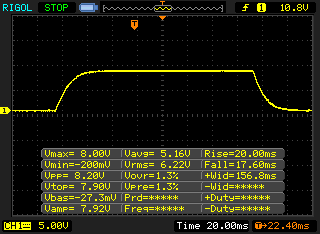 |
| ↘ 17.6 ms fall | ||
| The screen shows slow response rates in our tests and will be unsatisfactory for gamers. In comparison, all tested devices range from 0.1 (minimum) to 240 (maximum) ms. » 95 % of all devices are better. This means that the measured response time is worse than the average of all tested devices (21.5 ms). | ||
| ↔ Response Time 50% Grey to 80% Grey | ||
| 60.4 ms ... rise ↗ and fall ↘ combined | ↗ 30.8 ms rise | 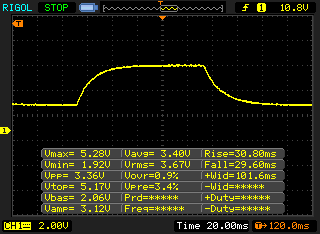 |
| ↘ 29.6 ms fall | ||
| The screen shows slow response rates in our tests and will be unsatisfactory for gamers. In comparison, all tested devices range from 0.2 (minimum) to 636 (maximum) ms. » 96 % of all devices are better. This means that the measured response time is worse than the average of all tested devices (33.7 ms). | ||
Screen Flickering / PWM (Pulse-Width Modulation)
| Screen flickering / PWM detected | 2500 Hz | ≤ 30 % brightness setting | 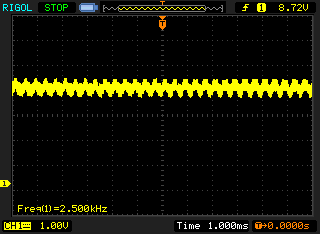 |
The display backlight flickers at 2500 Hz (worst case, e.g., utilizing PWM) Flickering detected at a brightness setting of 30 % and below. There should be no flickering or PWM above this brightness setting. The frequency of 2500 Hz is quite high, so most users sensitive to PWM should not notice any flickering. In comparison: 53 % of all tested devices do not use PWM to dim the display. If PWM was detected, an average of 17900 (minimum: 5 - maximum: 3846000) Hz was measured. | |||
Thanks to the high brightness and the matte panel surface, the FHD screen performs very well outdoors. Direct sunlight is obviously still a challenge, but you should be able to find a suitable position for a comfortable viewing experience in most situations. The viewing-angle stability of the IPS panel is also very good.


Performance - Quad-core with NVMe-SSD
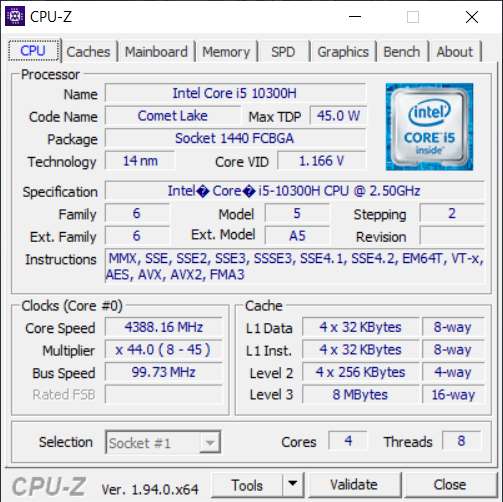
Processor - Intel Comet Lake Quad-core
The base model of the XPS 17 is equipped with a quad-core processor from Intel. The Core i5-10300H (Comet Lake, 10th Gen.) has a specified TDP of 45 W and the 4 cores (8 threads) can run at up to 4.5 GHz (4.2 when all cores are stressed at the same time). The performance is obviously more than sufficient for common everyday tasks, but we have to say that we would have liked to see at least a modern 6-core CPU for the high price.
The comparison with AMD's 45 W CPUs is another problem for the XPS 17, which is evident when you compare the results with the Honor MagicBook Pro. Its Ryzen 5 4600H (6 cores) is a tad slower in the single-core tests but is clearly superior in all multi-core benchmarks.
The performance utilization of the XPS 17 is generally good and levels off at 45 W, but we think Dell could have increased the limits since there is no dedicated GPU that requires cooling. The consumption of the CPU is immediately limited to 45 W in battery, but this does not really affect the performance.
Cinebench R15: CPU Single 64Bit | CPU Multi 64Bit
Blender: v2.79 BMW27 CPU
7-Zip 18.03: 7z b 4 -mmt1 | 7z b 4
Geekbench 5.5: Single-Core | Multi-Core
HWBOT x265 Benchmark v2.2: 4k Preset
LibreOffice : 20 Documents To PDF
R Benchmark 2.5: Overall mean
| Cinebench R20 / CPU (Single Core) | |
| Average of class Multimedia (341 - 812, n=97, last 2 years) | |
| Dell XPS 17 9700 Core i7 RTX 2060 Max-Q | |
| Asus ROG Zephyrus M15 GU502LU-BI7N4 | |
| Dell XPS 17 9700 i5-10300H | |
| Honor MagicBook Pro (AMD) | |
| Dell XPS 15 9500 Core i5 | |
| Average Intel Core i5-10300H (312 - 470, n=15) | |
| LG Gram 17 17Z90N-V.AA77G | |
| Cinebench R20 / CPU (Multi Core) | |
| Average of class Multimedia (1783 - 11768, n=97, last 2 years) | |
| Dell XPS 17 9700 Core i7 RTX 2060 Max-Q | |
| Asus ROG Zephyrus M15 GU502LU-BI7N4 | |
| Honor MagicBook Pro (AMD) | |
| Dell XPS 17 9700 i5-10300H | |
| Dell XPS 15 9500 Core i5 | |
| Average Intel Core i5-10300H (1397 - 2240, n=15) | |
| LG Gram 17 17Z90N-V.AA77G | |
| Cinebench R15 / CPU Single 64Bit | |
| Average of class Multimedia (142.6 - 308, n=99, last 2 years) | |
| Dell XPS 17 9700 Core i7 RTX 2060 Max-Q | |
| Asus ROG Zephyrus M15 GU502LU-BI7N4 | |
| Dell XPS 17 9700 i5-10300H | |
| Dell XPS 15 9500 Core i5 | |
| Honor MagicBook Pro (AMD) | |
| Average Intel Core i5-10300H (108 - 194, n=17) | |
| LG Gram 17 17Z90N-V.AA77G | |
| Cinebench R15 / CPU Multi 64Bit | |
| Average of class Multimedia (785 - 4703, n=106, last 2 years) | |
| Dell XPS 17 9700 Core i7 RTX 2060 Max-Q | |
| Honor MagicBook Pro (AMD) | |
| Asus ROG Zephyrus M15 GU502LU-BI7N4 | |
| Dell XPS 17 9700 i5-10300H | |
| Dell XPS 15 9500 Core i5 | |
| Average Intel Core i5-10300H (536 - 921, n=17) | |
| LG Gram 17 17Z90N-V.AA77G | |
| Blender / v2.79 BMW27 CPU | |
| LG Gram 17 17Z90N-V.AA77G | |
| Dell XPS 17 9700 i5-10300H | |
| Average Intel Core i5-10300H (479 - 555, n=14) | |
| Dell XPS 15 9500 Core i5 | |
| Honor MagicBook Pro (AMD) | |
| Asus ROG Zephyrus M15 GU502LU-BI7N4 | |
| Dell XPS 17 9700 Core i7 RTX 2060 Max-Q | |
| Average of class Multimedia (107 - 662, n=95, last 2 years) | |
| 7-Zip 18.03 / 7z b 4 -mmt1 | |
| Average of class Multimedia (3398 - 7163, n=90, last 2 years) | |
| Dell XPS 17 9700 Core i7 RTX 2060 Max-Q | |
| Asus ROG Zephyrus M15 GU502LU-BI7N4 | |
| Dell XPS 17 9700 i5-10300H | |
| Dell XPS 15 9500 Core i5 | |
| Average Intel Core i5-10300H (2945 - 4956, n=14) | |
| Honor MagicBook Pro (AMD) | |
| LG Gram 17 17Z90N-V.AA77G | |
| 7-Zip 18.03 / 7z b 4 | |
| Average of class Multimedia (20166 - 119900, n=90, last 2 years) | |
| Dell XPS 17 9700 Core i7 RTX 2060 Max-Q | |
| Honor MagicBook Pro (AMD) | |
| Asus ROG Zephyrus M15 GU502LU-BI7N4 | |
| Dell XPS 15 9500 Core i5 | |
| Dell XPS 17 9700 i5-10300H | |
| Average Intel Core i5-10300H (15146 - 24841, n=14) | |
| LG Gram 17 17Z90N-V.AA77G | |
| Geekbench 5.5 / Single-Core | |
| Average of class Multimedia (926 - 2342, n=100, last 2 years) | |
| LG Gram 17 17Z90N-V.AA77G | |
| Dell XPS 17 9700 Core i7 RTX 2060 Max-Q | |
| Dell XPS 17 9700 i5-10300H | |
| Asus ROG Zephyrus M15 GU502LU-BI7N4 | |
| Dell XPS 15 9500 Core i5 | |
| Average Intel Core i5-10300H (703 - 1241, n=16) | |
| Honor MagicBook Pro (AMD) | |
| Geekbench 5.5 / Multi-Core | |
| Average of class Multimedia (3828 - 23059, n=100, last 2 years) | |
| Dell XPS 17 9700 Core i7 RTX 2060 Max-Q | |
| Asus ROG Zephyrus M15 GU502LU-BI7N4 | |
| Honor MagicBook Pro (AMD) | |
| Dell XPS 15 9500 Core i5 | |
| Dell XPS 17 9700 i5-10300H | |
| Average Intel Core i5-10300H (2783 - 4728, n=16) | |
| LG Gram 17 17Z90N-V.AA77G | |
| HWBOT x265 Benchmark v2.2 / 4k Preset | |
| Average of class Multimedia (4.99 - 30.5, n=88, last 2 years) | |
| Dell XPS 17 9700 Core i7 RTX 2060 Max-Q | |
| Asus ROG Zephyrus M15 GU502LU-BI7N4 | |
| Honor MagicBook Pro (AMD) | |
| Dell XPS 15 9500 Core i5 | |
| Average Intel Core i5-10300H (6.13 - 7.78, n=14) | |
| Dell XPS 17 9700 i5-10300H | |
| LG Gram 17 17Z90N-V.AA77G | |
| LibreOffice / 20 Documents To PDF | |
| Dell XPS 15 9500 Core i5 | |
| Honor MagicBook Pro (AMD) | |
| LG Gram 17 17Z90N-V.AA77G | |
| Average Intel Core i5-10300H (23.9 - 94, n=14) | |
| Dell XPS 17 9700 i5-10300H | |
| Asus ROG Zephyrus M15 GU502LU-BI7N4 | |
| Average of class Multimedia (6.7 - 84.9, n=92, last 2 years) | |
| Dell XPS 17 9700 Core i7 RTX 2060 Max-Q | |
| R Benchmark 2.5 / Overall mean | |
| LG Gram 17 17Z90N-V.AA77G | |
| Average Intel Core i5-10300H (0.625 - 1.088, n=14) | |
| Dell XPS 17 9700 i5-10300H | |
| Dell XPS 15 9500 Core i5 | |
| Honor MagicBook Pro (AMD) | |
| Asus ROG Zephyrus M15 GU502LU-BI7N4 | |
| Dell XPS 17 9700 Core i7 RTX 2060 Max-Q | |
| Average of class Multimedia (0.3826 - 0.723, n=90, last 2 years) | |
* ... smaller is better
System Performance
The XPS 17 9700 is also a very responsive system in the base configuration and we did not experience any issues during our review period.
| PCMark 8 Home Score Accelerated v2 | 3976 points | |
| PCMark 8 Creative Score Accelerated v2 | 4522 points | |
| PCMark 8 Work Score Accelerated v2 | 5037 points | |
| PCMark 10 Score | 4162 points | |
Help | ||
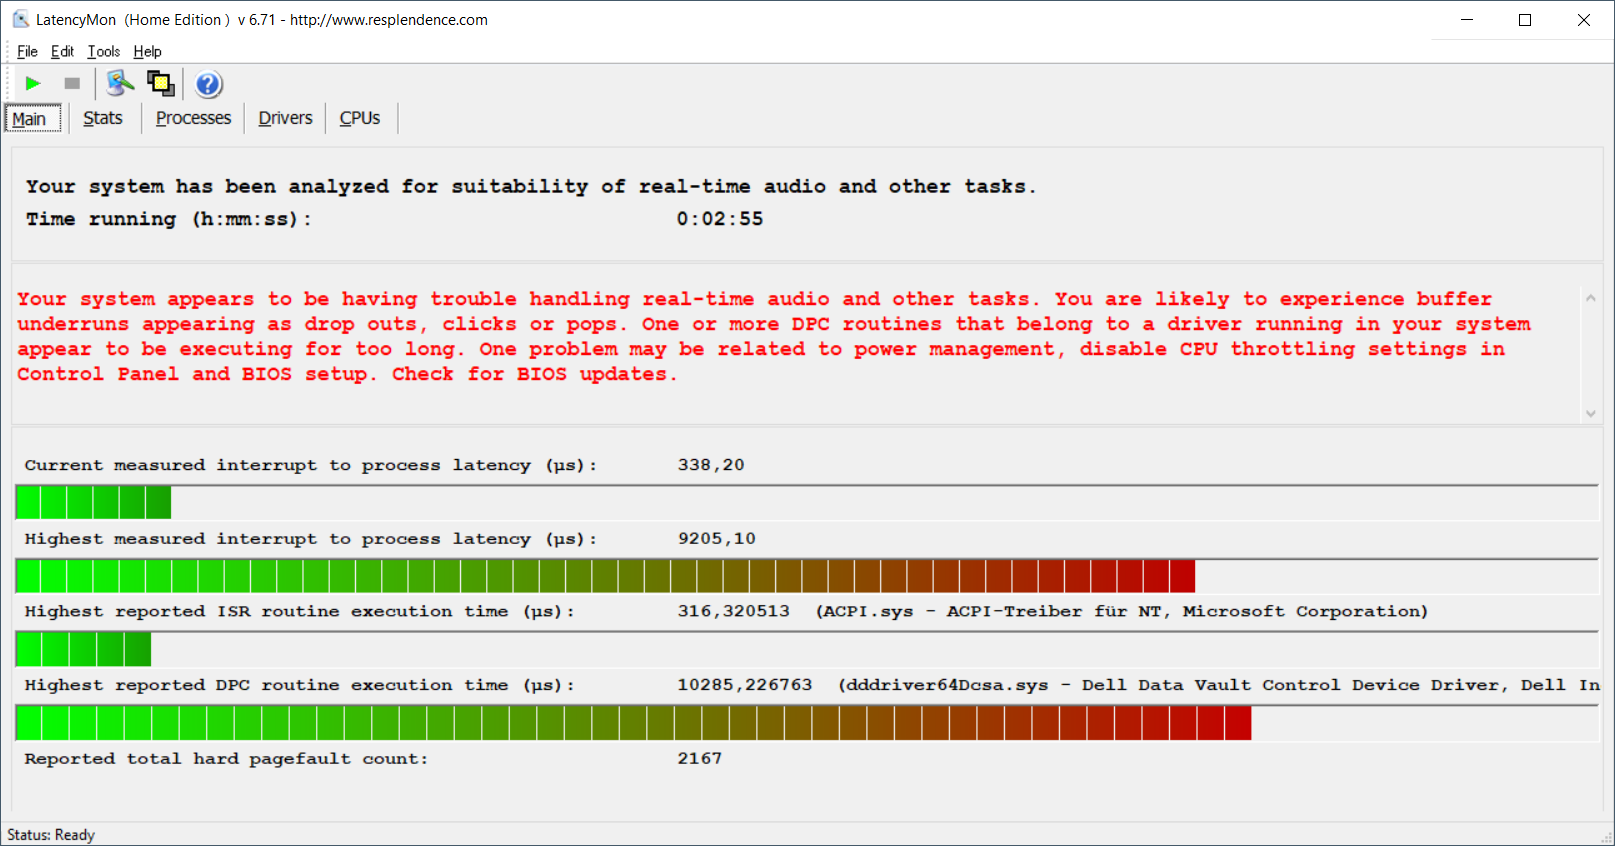
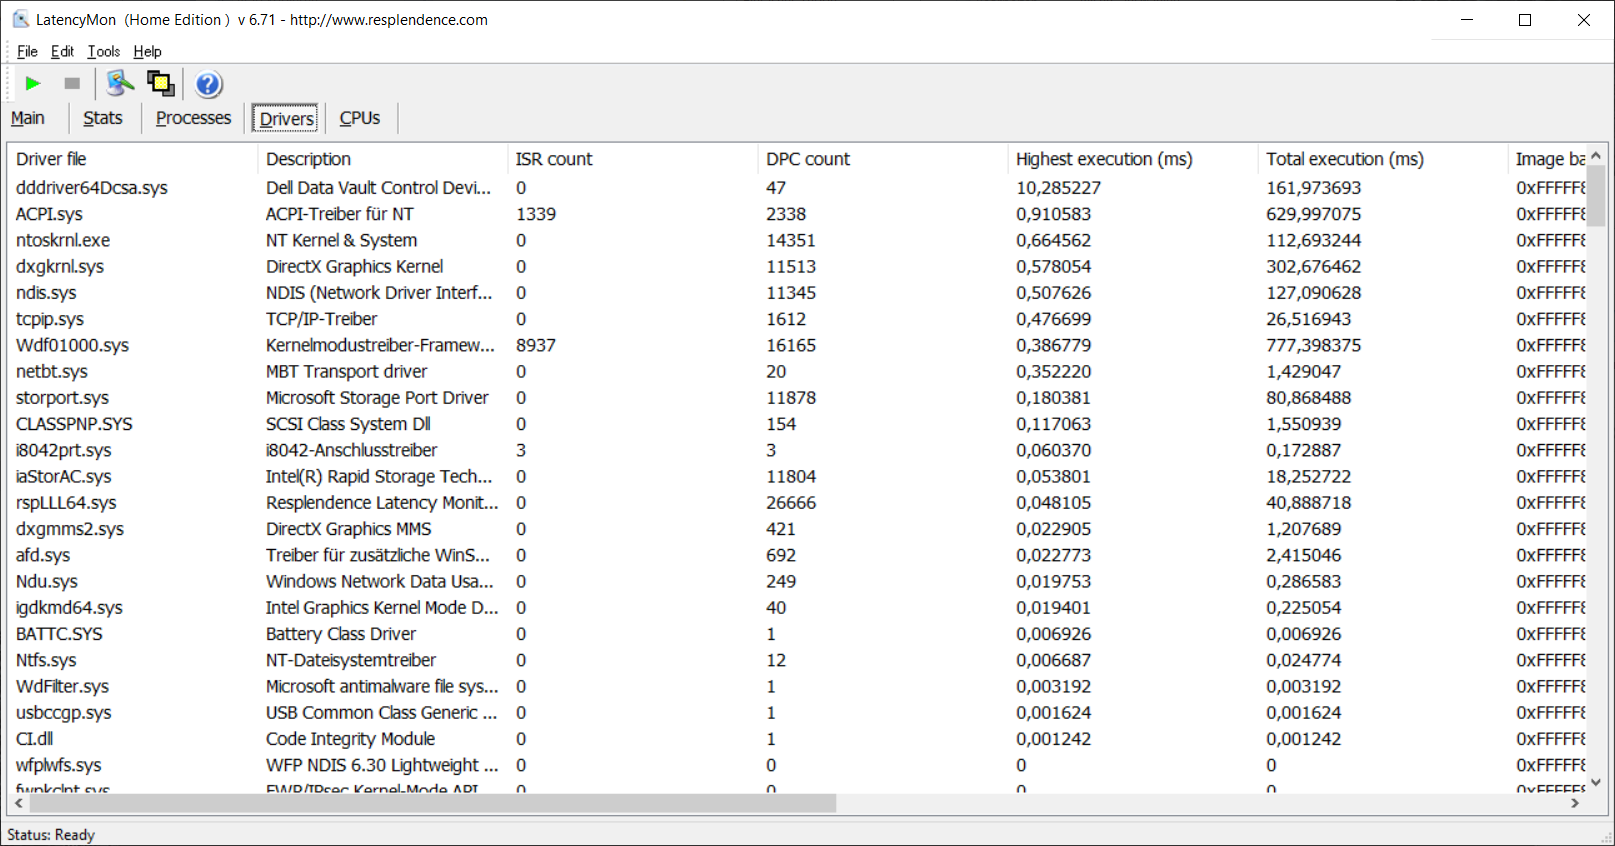
DPC Latencies
We noticed issues during our latency test on the XPS 17. The main problem is a driver from Dell (File Vault).
| DPC Latencies / LatencyMon - interrupt to process latency (max), Web, Youtube, Prime95 | |
| Dell XPS 17 9700 i5-10300H | |
| Dell XPS 15 9500 Core i5 | |
| Honor MagicBook Pro (AMD) | |
| Dell XPS 17 9700 Core i7 RTX 2060 Max-Q | |
| LG Gram 17 17Z90N-V.AA77G | |
* ... smaller is better
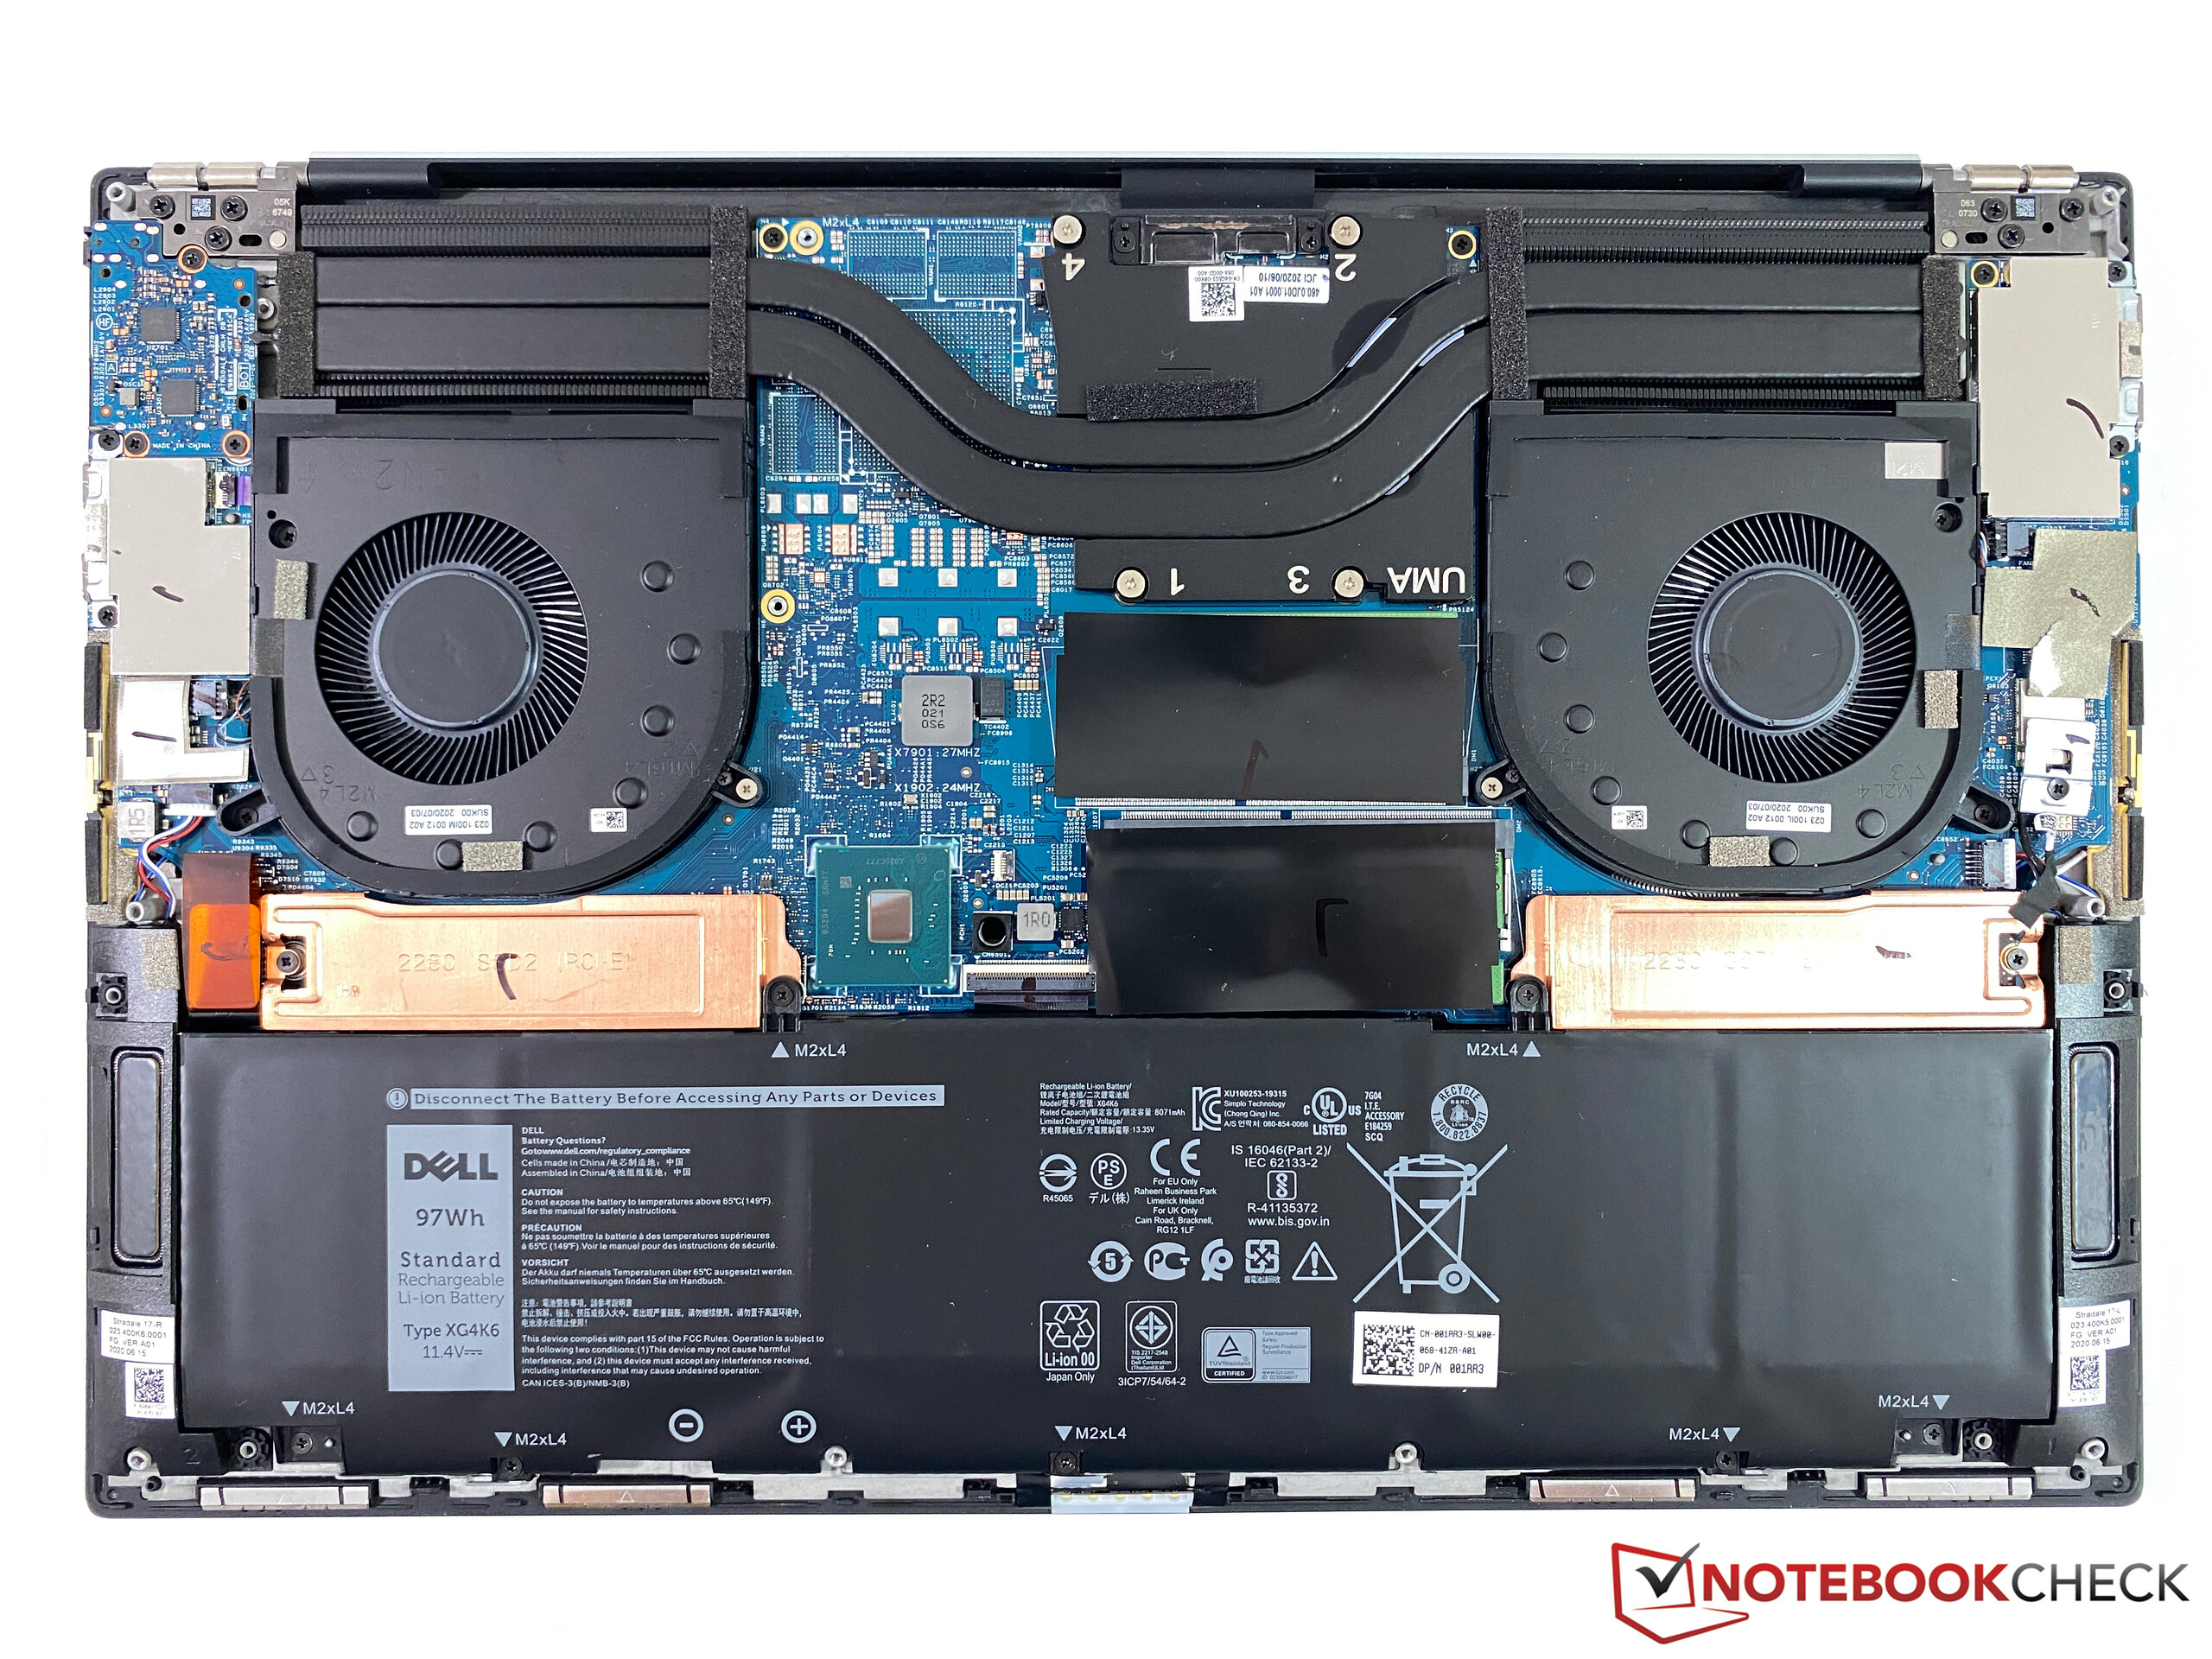
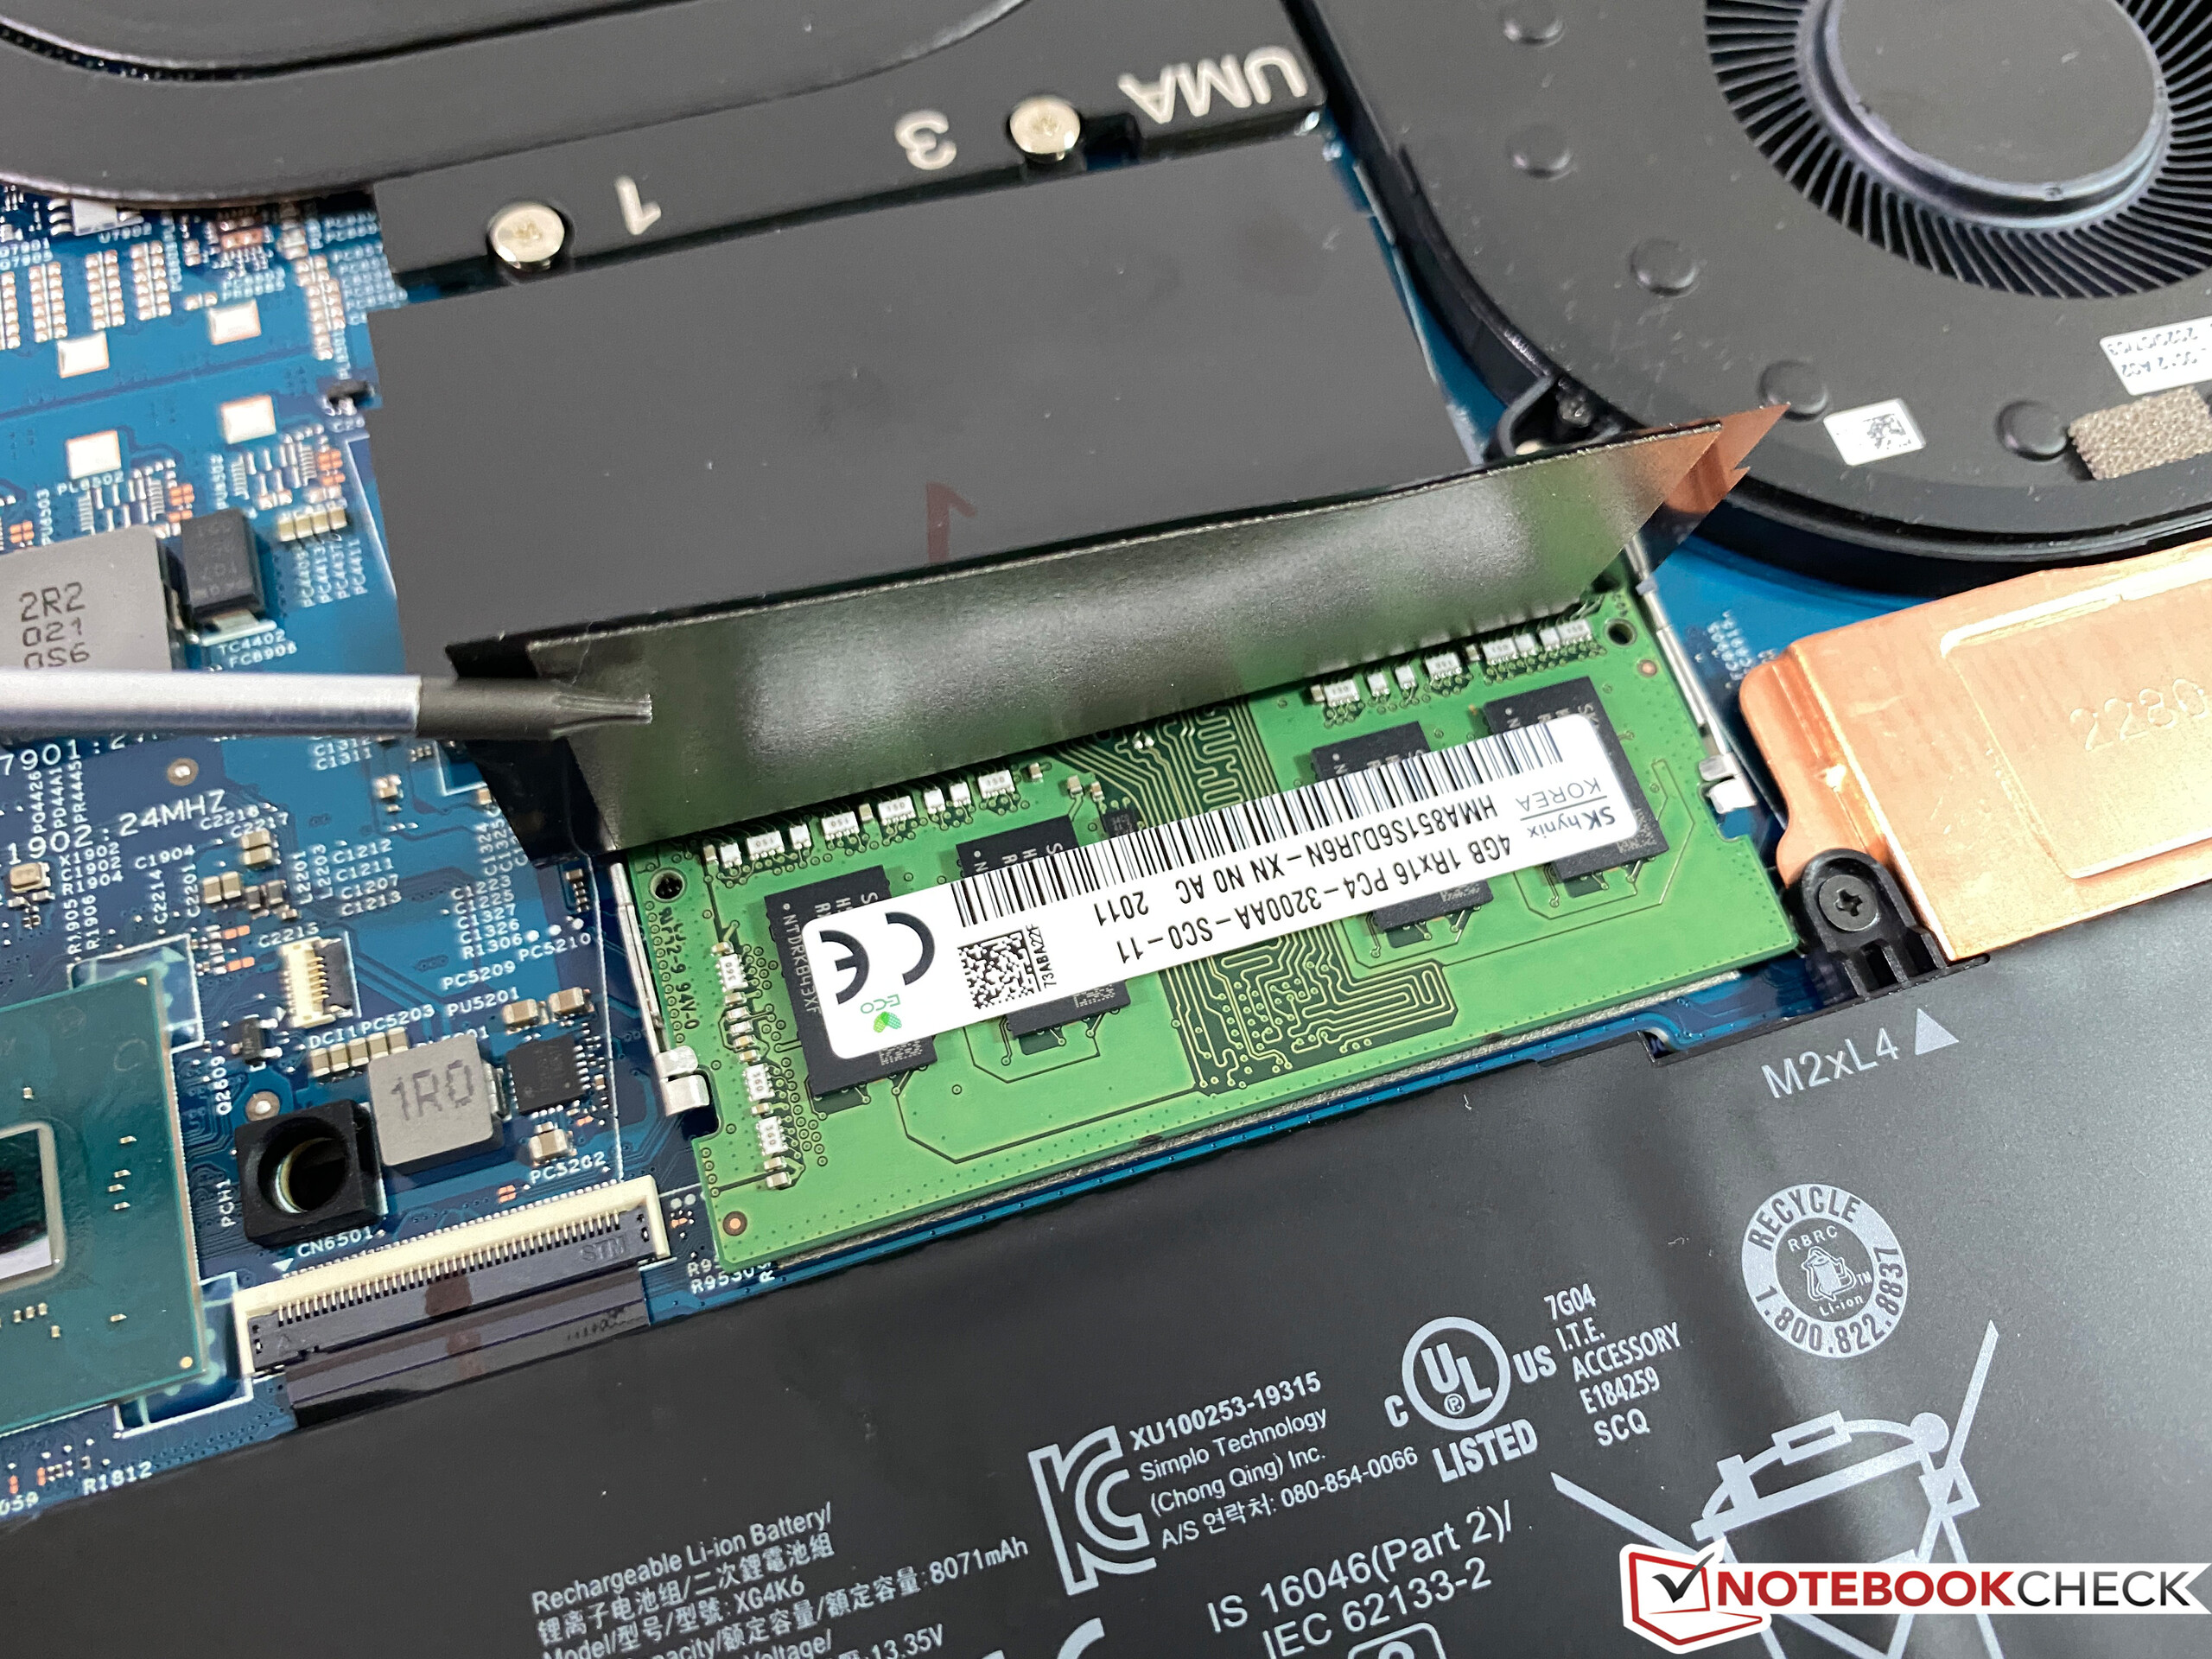
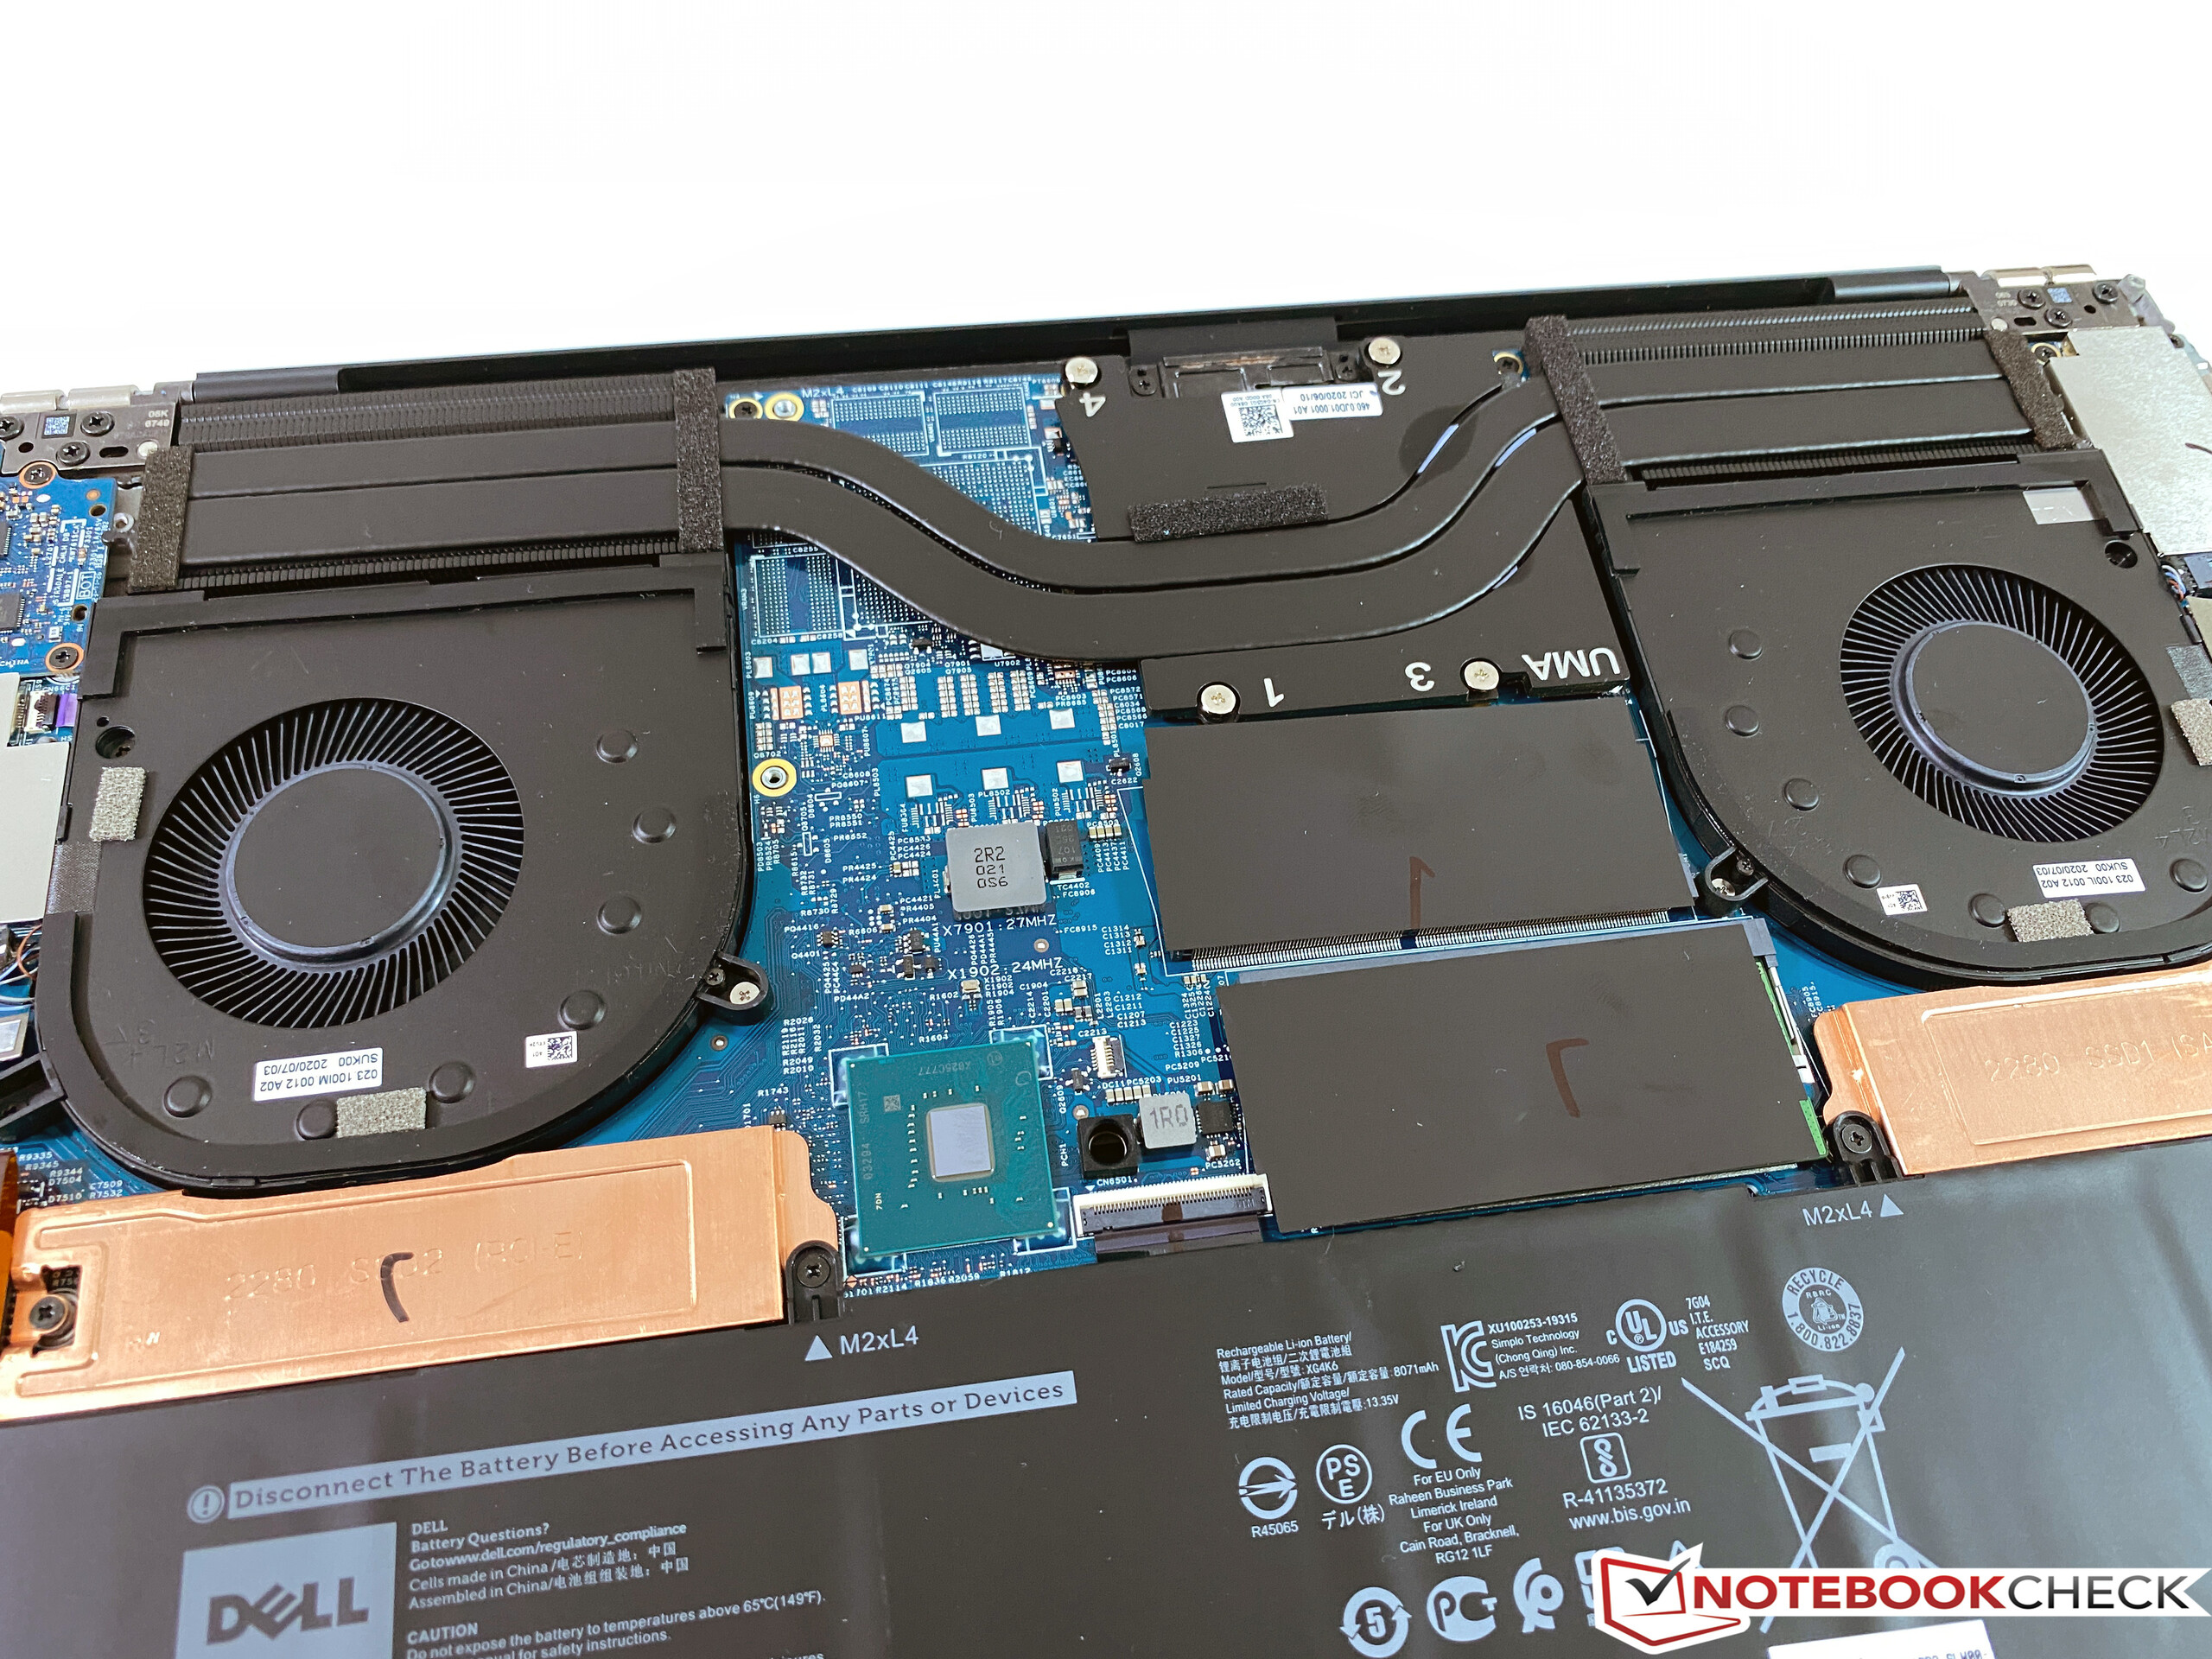
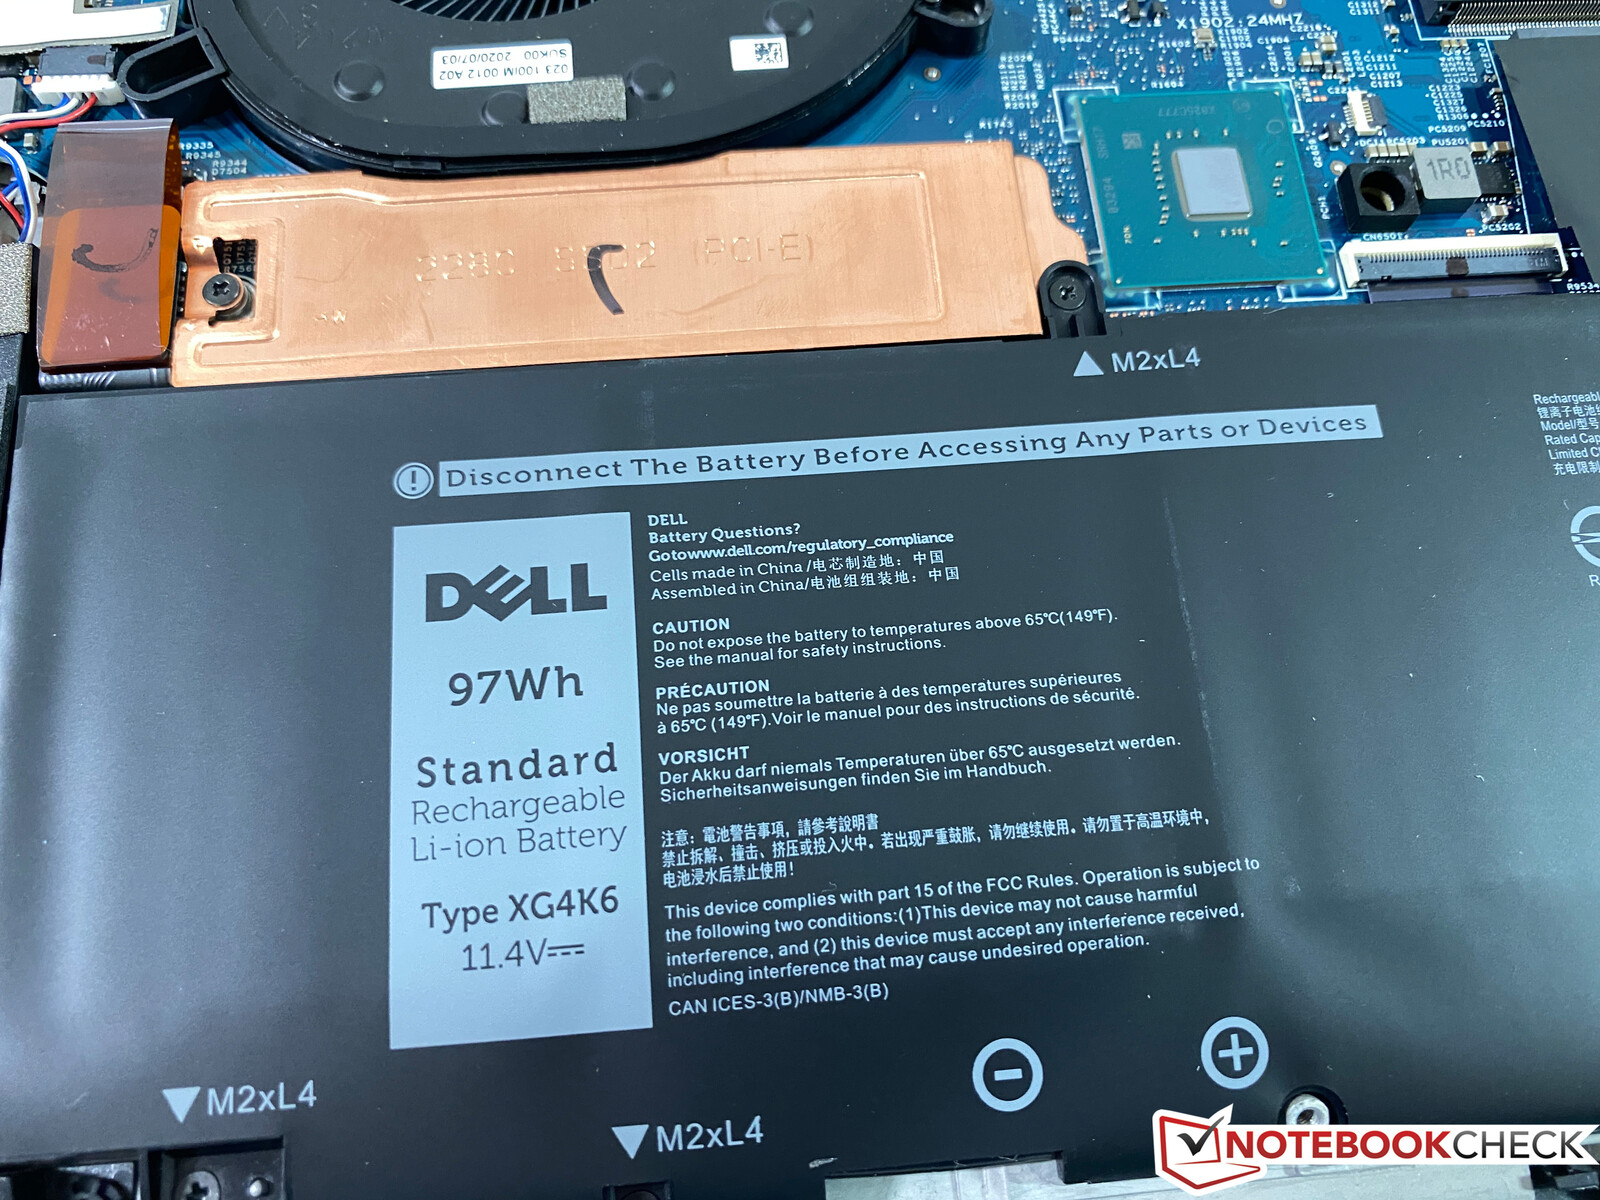
Storage Devices - 2x PCIe-SSD
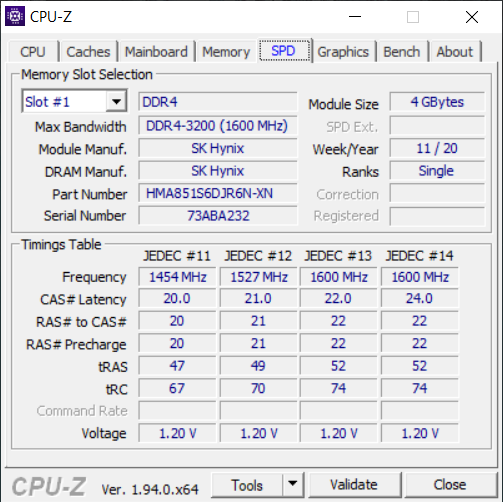
The XPS 17 9700 offers two M.2-2280 slots and our test model is equipped with a single 512 GB drive (416 GB available for the user). The SN730 from Western Digital is a fast NVMe-SSD and performs well in our benchmarks.
| Dell XPS 17 9700 i5-10300H WDC PC SN730 SDBPNTY-512G | LG Gram 17 17Z90N-V.AA77G Samsung PM981a MZVLB1T0HBLR | Dell XPS 17 9700 Core i7 RTX 2060 Max-Q Micron 2200S 1TB MTFDHBA1T0TCK | Honor MagicBook Pro (AMD) WDC PC SN730 SDBPNTY-512G | Dell XPS 15 9500 Core i5 Toshiba KBG40ZNS256G NVMe | Average WDC PC SN730 SDBPNTY-512G | |
|---|---|---|---|---|---|---|
| CrystalDiskMark 5.2 / 6 | 44% | -3% | 21% | -6% | 44% | |
| Write 4K | 106.9 | 162.8 52% | 64.1 -40% | 156.9 47% | 93.3 -13% | 164.3 ? 54% |
| Read 4K | 41.49 | 51 23% | 39.93 -4% | 48.81 18% | 45.9 11% | 48.2 ? 16% |
| Write Seq | 1025 | 2078 103% | 1191 16% | 1050 2% | 1211 18% | 2096 ? 104% |
| Read Seq | 1429 | 1991 39% | 1418 -1% | 2517 76% | 1633 14% | 2123 ? 49% |
| Write 4K Q32T1 | 342.8 | 440.1 28% | 450.3 31% | 408.7 19% | 273.1 -20% | 451 ? 32% |
| Read 4K Q32T1 | 364.2 | 450.1 24% | 365 0% | 504 38% | 356 -2% | 509 ? 40% |
| Write Seq Q32T1 | 1714 | 2998 75% | 1563 -9% | 1087 -37% | 1198 -30% | 2551 ? 49% |
| Read Seq Q32T1 | 3205 | 3562 11% | 2683 -16% | 3407 6% | 2269 -29% | 3330 ? 4% |
| AS SSD | 30% | -130% | 62% | -124% | 29% | |
| Seq Read | 2424 | 2722 12% | 1141 -53% | 2749 13% | 1423 -41% | 2605 ? 7% |
| Seq Write | 1159 | 2649 129% | 994 -14% | 2348 103% | 766 -34% | 1905 ? 64% |
| 4K Read | 34.68 | 52.2 51% | 31.98 -8% | 44.22 28% | 42.21 22% | 45.8 ? 32% |
| 4K Write | 101.7 | 132.4 30% | 61 -40% | 140.5 38% | 74.8 -26% | 155.6 ? 53% |
| 4K-64 Read | 985 | 886 -10% | 790 -20% | 1450 47% | 973 -1% | 1181 ? 20% |
| 4K-64 Write | 956 | 1074 12% | 845 -12% | 2346 145% | 218.8 -77% | 1372 ? 44% |
| Access Time Read * | 0.116 | 0.041 65% | 0.063 46% | 0.079 32% | 0.125 -8% | 0.0801 ? 31% |
| Access Time Write * | 0.036 | 0.03 17% | 0.679 -1786% | 0.027 25% | 0.552 -1433% | 0.04195 ? -17% |
| Score Read | 1262 | 1211 -4% | 966 -23% | 1769 40% | 1157 -8% | 1488 ? 18% |
| Score Write | 1173 | 1471 25% | 1005 -14% | 2721 132% | 370 -68% | 1718 ? 46% |
| Score Total | 3020 | 3309 10% | 2448 -19% | 5376 78% | 2094 -31% | 3938 ? 30% |
| Copy ISO MB/s | 1128 | 2096 86% | 1732 54% | 1151 2% | 1718 ? 52% | |
| Copy Program MB/s | 585 | 395.6 -32% | 717 23% | 499.4 -15% | 536 ? -8% | |
| Copy Game MB/s | 902 | 1096 22% | 1343 49% | 733 -19% | 1193 ? 32% | |
| Total Average (Program / Settings) | 37% /
35% | -67% /
-84% | 42% /
45% | -65% /
-81% | 37% /
34% |
* ... smaller is better

Continuous read: DiskSpd Read Loop, Queue Depth 8
GPU Performance - XPS 17 only with old UHD Graphics 630
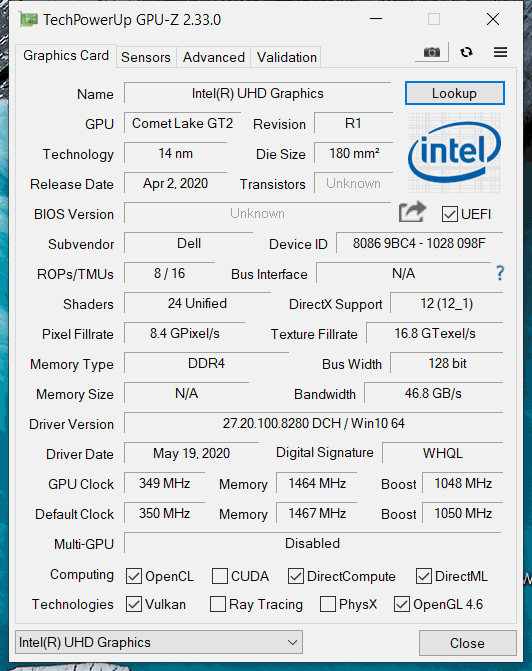
We already mentioned that there is no dedicated GPU, so all the graphics calculations are handled by the integrated UHD Graphics 630. The iGPU is obviously powerful enough for simple tasks and the video decoder has no problems with high-resolution videos, but this is basically a very old iGPU that we have seen for a couple of years now. The performance of the UHD Graphics 630 just does not stand a chance against newer iGPUs from AMD or even Intel.
The LG Gram 17 with the newer Iris GPU is more than twice as fast, and the Vega 6 of the Honor MagicBook Pro is even faster. This means the XPS 17 9700 is hardly suited for gaming; only very old or simple titles run at smooth frame rates.
The performance of the iGPU is stable even during longer load periods, but this is not really a surprise for a 45 W processor.
| 3DMark 11 Performance | 1952 points | |
| 3DMark Ice Storm Standard Score | 68575 points | |
| 3DMark Cloud Gate Standard Score | 9393 points | |
| 3DMark Fire Strike Score | 1068 points | |
| 3DMark Time Spy Score | 431 points | |
Help | ||
| low | med. | high | ultra | |
| The Witcher 3 (2015) | 16 | |||
| Dota 2 Reborn (2015) | 83.1 | 50.1 | 20 | 17.5 |
| X-Plane 11.11 (2018) | 11.6 | 10.7 | 10.3 | |
| Far Cry 5 (2018) | 13 | |||
| F1 2020 (2020) | 23 | 12 |
Emissions - Too loud for the performance
System Noise
The complex (and expensive) vapor chamber cooling solution of the high-end XPS 17 is not used here, but Dell still uses two fans for the iGPU SKU. They are usually deactivated during light workloads. We measured 34-37.4 dB(A) during gaming and also 37.4 dB(A) under maximum load. This means the test unit is much quieter compared to the XPS 17 with the RTX 2060 Max-Q GPU, but it is still a bit loud with two fans considering the low performance.
Noise Level
| Idle |
| 29.7 / 29.7 / 29.7 dB(A) |
| Load |
| 33.1 / 37.4 dB(A) |
 | ||
30 dB silent 40 dB(A) audible 50 dB(A) loud |
||
min: | ||
| Dell XPS 17 9700 i5-10300H UHD Graphics 630, i5-10300H, WDC PC SN730 SDBPNTY-512G | LG Gram 17 17Z90N-V.AA77G Iris Plus Graphics G7 (Ice Lake 64 EU), i7-1065G7, Samsung PM981a MZVLB1T0HBLR | Dell XPS 17 9700 Core i7 RTX 2060 Max-Q GeForce RTX 2060 Max-Q, i7-10875H, Micron 2200S 1TB MTFDHBA1T0TCK | Honor MagicBook Pro (AMD) Vega 6, R5 4600H, WDC PC SN730 SDBPNTY-512G | Dell XPS 15 9500 Core i5 UHD Graphics 630, i5-10300H, Toshiba KBG40ZNS256G NVMe | |
|---|---|---|---|---|---|
| Noise | 10% | -7% | 1% | 5% | |
| off / environment * | 29.7 | 26 12% | 28 6% | 29.7 -0% | 28 6% |
| Idle Minimum * | 29.7 | 26 12% | 28 6% | 29.7 -0% | 28 6% |
| Idle Average * | 29.7 | 26.8 10% | 28 6% | 29.7 -0% | 28 6% |
| Idle Maximum * | 29.7 | 27.5 7% | 28 6% | 30.5 -3% | 28 6% |
| Load Average * | 33.1 | 32.2 3% | 43.2 -31% | 31 6% | 28 15% |
| Load Maximum * | 37.4 | 32.7 13% | 50.5 -35% | 36.7 2% | 41.9 -12% |
| Witcher 3 ultra * | 49 | 31.3 |
* ... smaller is better
Temperature
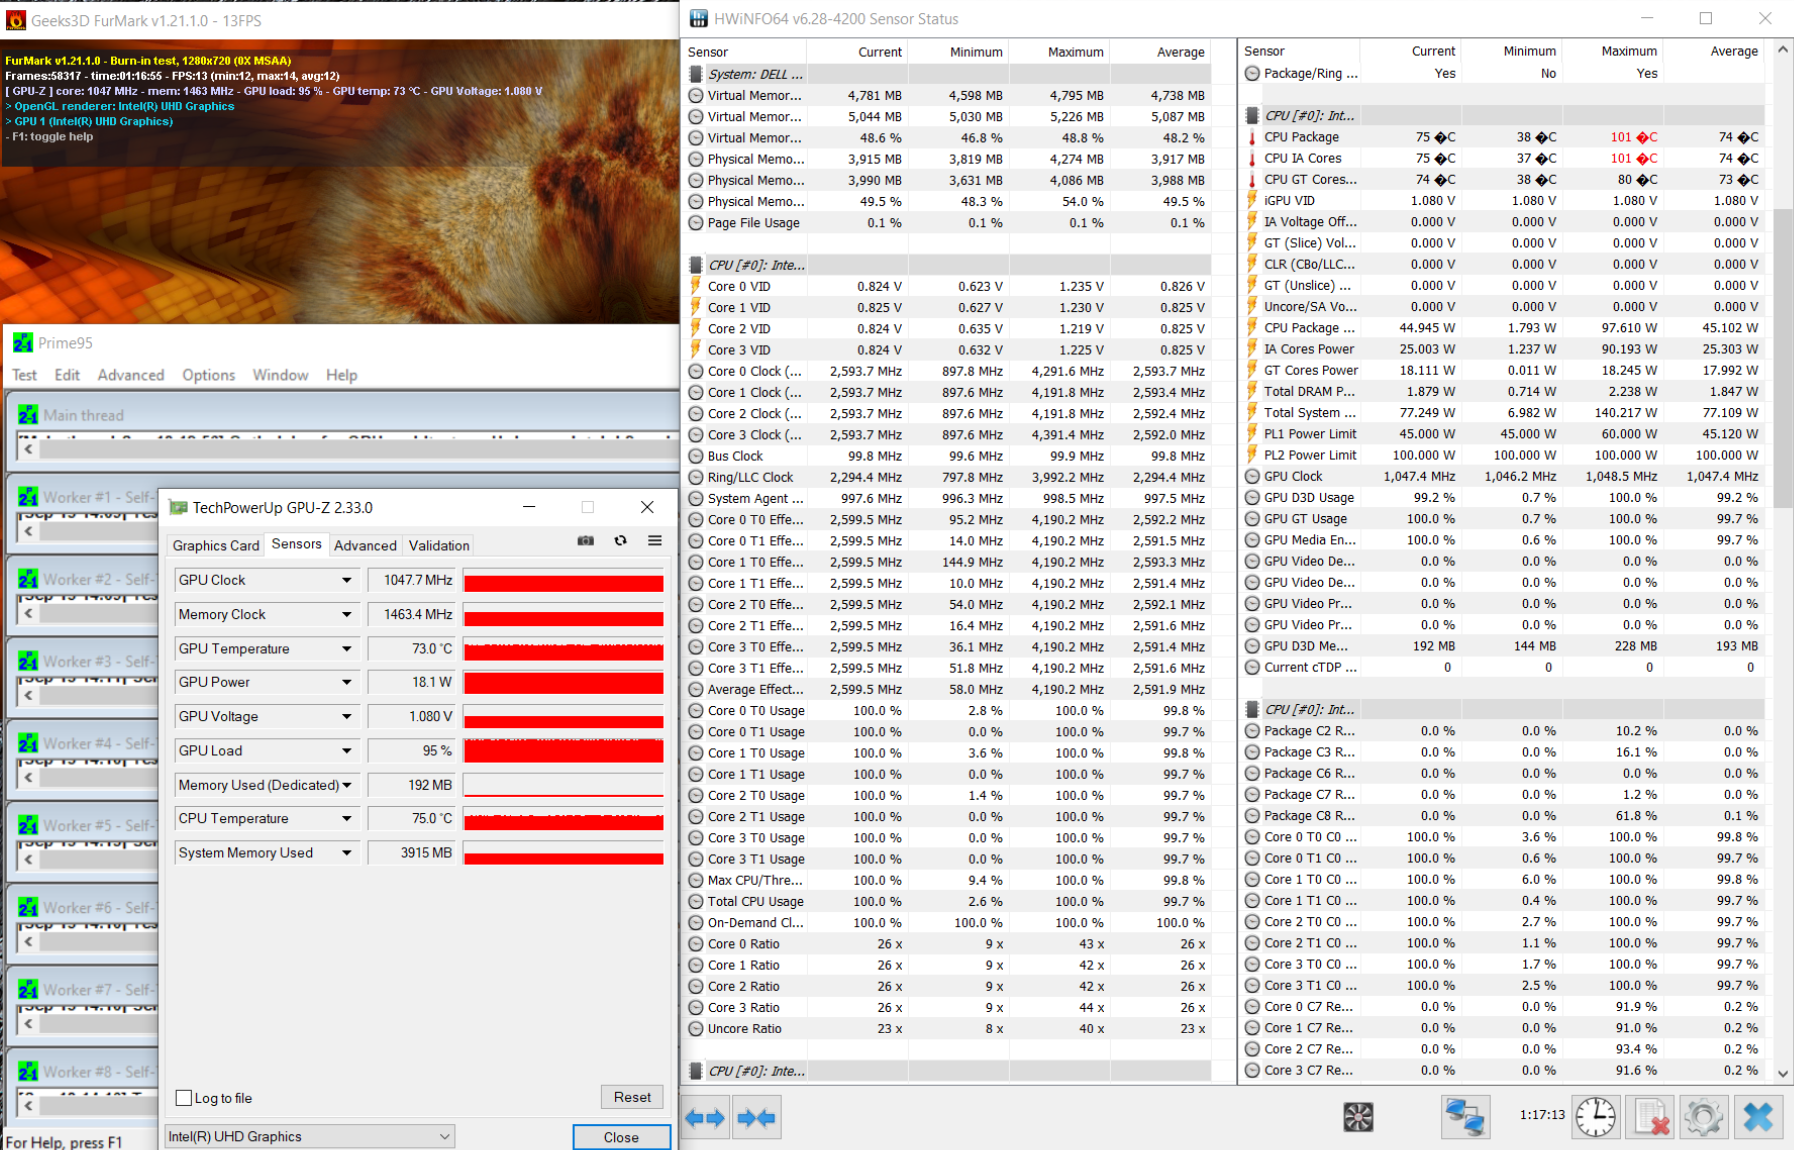
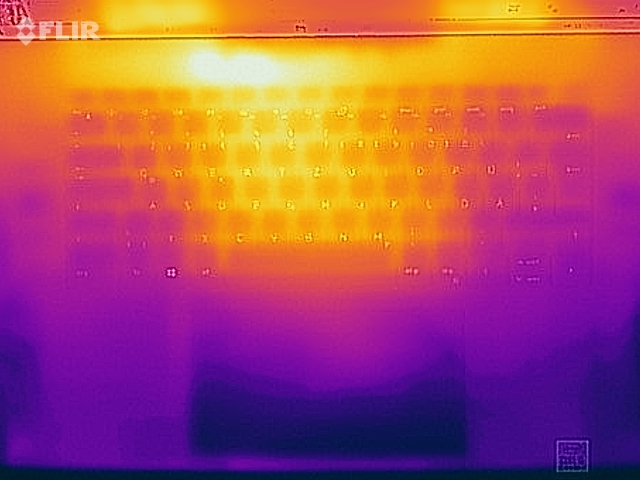
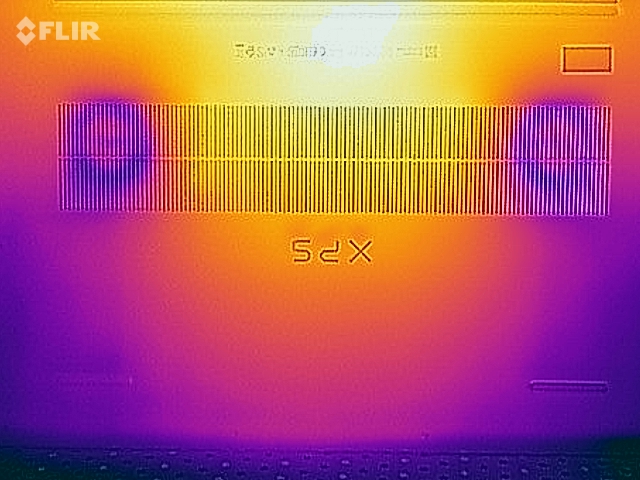
There are no temperature issues on the base SKU of the XPS 17. There are only a few spots where we can detect more than 40 °C under maximum load. The power consumption of the CPU quickly levels off at 45 W during our stress test (up to ~90 W in the first couple of seconds), which is still sufficient for a CPU clock of 4x 2.6 GHz, so it does not drop below the base frequency of 2.5 GHz. The GPU clock on the other hand stays at the maximum 1047 MHz.
(±) The maximum temperature on the upper side is 42.9 °C / 109 F, compared to the average of 36.9 °C / 98 F, ranging from 21.1 to 71 °C for the class Multimedia.
(±) The bottom heats up to a maximum of 40.1 °C / 104 F, compared to the average of 39.1 °C / 102 F
(+) In idle usage, the average temperature for the upper side is 22.9 °C / 73 F, compared to the device average of 31.2 °C / 88 F.
(+) The palmrests and touchpad are cooler than skin temperature with a maximum of 27.8 °C / 82 F and are therefore cool to the touch.
(±) The average temperature of the palmrest area of similar devices was 28.8 °C / 83.8 F (+1 °C / 1.8 F).
Speakers
Dell XPS 17 9700 i5-10300H audio analysis
(+) | speakers can play relatively loud (82.2 dB)
Bass 100 - 315 Hz
(±) | reduced bass - on average 11.8% lower than median
(±) | linearity of bass is average (9% delta to prev. frequency)
Mids 400 - 2000 Hz
(+) | balanced mids - only 4.7% away from median
(+) | mids are linear (6.7% delta to prev. frequency)
Highs 2 - 16 kHz
(±) | higher highs - on average 5.5% higher than median
(±) | linearity of highs is average (8.3% delta to prev. frequency)
Overall 100 - 16.000 Hz
(±) | linearity of overall sound is average (15.9% difference to median)
Compared to same class
» 34% of all tested devices in this class were better, 6% similar, 61% worse
» The best had a delta of 5%, average was 18%, worst was 45%
Compared to all devices tested
» 20% of all tested devices were better, 5% similar, 75% worse
» The best had a delta of 4%, average was 25%, worst was 134%
LG Gram 17 17Z90N-V.AA77G audio analysis
(±) | speaker loudness is average but good (74 dB)
Bass 100 - 315 Hz
(-) | nearly no bass - on average 24.6% lower than median
(±) | linearity of bass is average (11.5% delta to prev. frequency)
Mids 400 - 2000 Hz
(+) | balanced mids - only 3.7% away from median
(+) | mids are linear (6.3% delta to prev. frequency)
Highs 2 - 16 kHz
(+) | balanced highs - only 3.2% away from median
(+) | highs are linear (6% delta to prev. frequency)
Overall 100 - 16.000 Hz
(±) | linearity of overall sound is average (18.1% difference to median)
Compared to same class
» 26% of all tested devices in this class were better, 6% similar, 68% worse
» The best had a delta of 7%, average was 22%, worst was 53%
Compared to all devices tested
» 33% of all tested devices were better, 8% similar, 59% worse
» The best had a delta of 4%, average was 25%, worst was 134%
Energy Management - Dell uses efficient FHD panel
Power Consumption
A look at the power consumption figures quickly shows the big difference in the idle measurements, because the optional 4K screen just draws much more power. The FHD panel of the XPS 17 on the other hand is very efficient despite the large size and the high brightness figures. We record a maximum value of 109 W under load, but this value drops to around 70 W after a couple of seconds. The included 130 W power adapter is therefore completely sufficient.
| Off / Standby | |
| Idle | |
| Load |
|
| Dell XPS 17 9700 i5-10300H i5-10300H, UHD Graphics 630, WDC PC SN730 SDBPNTY-512G, IPS, 1920x1200, 17.30 | LG Gram 17 17Z90N-V.AA77G i7-1065G7, Iris Plus Graphics G7 (Ice Lake 64 EU), Samsung PM981a MZVLB1T0HBLR, IPS, 2560x1600, 17.00 | Dell XPS 17 9700 Core i7 RTX 2060 Max-Q i7-10875H, GeForce RTX 2060 Max-Q, Micron 2200S 1TB MTFDHBA1T0TCK, IPS, 3840x2400, 17.00 | Honor MagicBook Pro (AMD) R5 4600H, Vega 6, WDC PC SN730 SDBPNTY-512G, IPS, 1920x1080, 16.10 | Dell XPS 15 9500 Core i5 i5-10300H, UHD Graphics 630, Toshiba KBG40ZNS256G NVMe, IPS, 1920x1200, 15.60 | Average Intel UHD Graphics 630 | Average of class Multimedia | |
|---|---|---|---|---|---|---|---|
| Power Consumption | 18% | -86% | 9% | 15% | 8% | -51% | |
| Idle Minimum * | 3.7 | 3.2 14% | 5.8 -57% | 4.2 -14% | 2.9 22% | 3.95 ? -7% | 7.29 ? -97% |
| Idle Average * | 8.3 | 8.4 -1% | 20.6 -148% | 8.4 -1% | 7.6 8% | 7.23 ? 13% | 11.8 ? -42% |
| Idle Maximum * | 11.3 | 11.7 -4% | 21 -86% | 9.7 14% | 8 29% | 8.87 ? 22% | 14.6 ? -29% |
| Load Average * | 44 | 39.6 10% | 104.7 -138% | 39.5 10% | 41.7 5% | 45.9 ? -4% | 77.7 ? -77% |
| Load Maximum * | 109 | 34 69% | 107.6 1% | 67.1 38% | 94.8 13% | 93.8 ? 14% | 121 ? -11% |
| Witcher 3 ultra * | 99.2 | 39.1 |
* ... smaller is better
Battery Runtime - XPS keeps on running
The combination of the comparatively low consumption figures and the massive 97 Wh battery results in excellent battery runtimes. At an adjusted brightness of 150 cd/m² (34% of the maximum brightness on our test unit), we can record a video runtime of more than 18 hours and still more than 15 hours in our Wi-Fi test. The Wi-Fi runtime is still more than 10 hours when we use the maximum display brightness. The minimum battery runtime under load is about 2 hours.
The competition does not stand a chance here, and even the LG Gram 17 with the ULV processor is clearly beaten.
| Dell XPS 17 9700 i5-10300H i5-10300H, UHD Graphics 630, 97 Wh | LG Gram 17 17Z90N-V.AA77G i7-1065G7, Iris Plus Graphics G7 (Ice Lake 64 EU), 80 Wh | Dell XPS 17 9700 Core i7 RTX 2060 Max-Q i7-10875H, GeForce RTX 2060 Max-Q, 97 Wh | Honor MagicBook Pro (AMD) R5 4600H, Vega 6, 56 Wh | Dell XPS 15 9500 Core i5 i5-10300H, UHD Graphics 630, 56 Wh | Average of class Multimedia | |
|---|---|---|---|---|---|---|
| Battery Runtime | 8% | -19% | -38% | -31% | -31% | |
| H.264 | 1107 | 742 -33% | 633 -43% | 710 ? -36% | ||
| WiFi v1.3 | 912 | 683 -25% | 580 -36% | 619 -32% | 556 -39% | 572 ? -37% |
| Load | 121 | 219 81% | 120 -1% | 74 -39% | 93 -23% | 97.7 ? -19% |
| Reader / Idle | 1437 | 1425 | 1581 | 933 ? |
Pros
Cons
Verdict - Too slow for the price

It is basically a good idea to offer a large multimedia laptop without a dedicated graphics card. Not every customer wants to play games, so they can save the money for an expensive GPU. However, the current Dell XPS 17 9700 has two major problems. The manufacturer does not use AMD's Ryzen CPUs, so Dell is currently limited to Intel's Comet Lake CPUs with the old integrated GPUs. The performance is therefore not competitive.
The other big problem is the price. You obviously still get the good chassis, but the performance is just too low for almost 2000 Euros (~$2341). The situation might change with the upcoming Intel processors, but as of right now, we cannot recommend the base model of the XPS 17 9700.
Because of the limitation to Intel CPUs, the performance (especially iGPU) is just not competitive right now. Considering the high price, we cannot recommend the base model of the new XPS 17 9700.
The matte FHD panel is definitely a positive aspect. The subjective picture impression is good and the panel can be very bright. Thanks to the full sRGB gamut and the excellent color accuracy, you can also use it for picture/video-editing. It is also much more efficient compared to the 4K touchscreen, so the battery runtime is significantly better. However, it is unfortunate that Dell does not offer the matte FHD screen in combination with the fastest CPU/GPU options in all regions.
Dell XPS 17 9700 i5-10300H
-
10/31/2020 v7
Andreas Osthoff
More articles related to this device
Dell XPS 17 9700 i5-10300H (XPS 17 Series)Related Articles


Pricecompare
