

ADATA XPG Xenia 14 Laptop Review: A New 14-inch Favorite
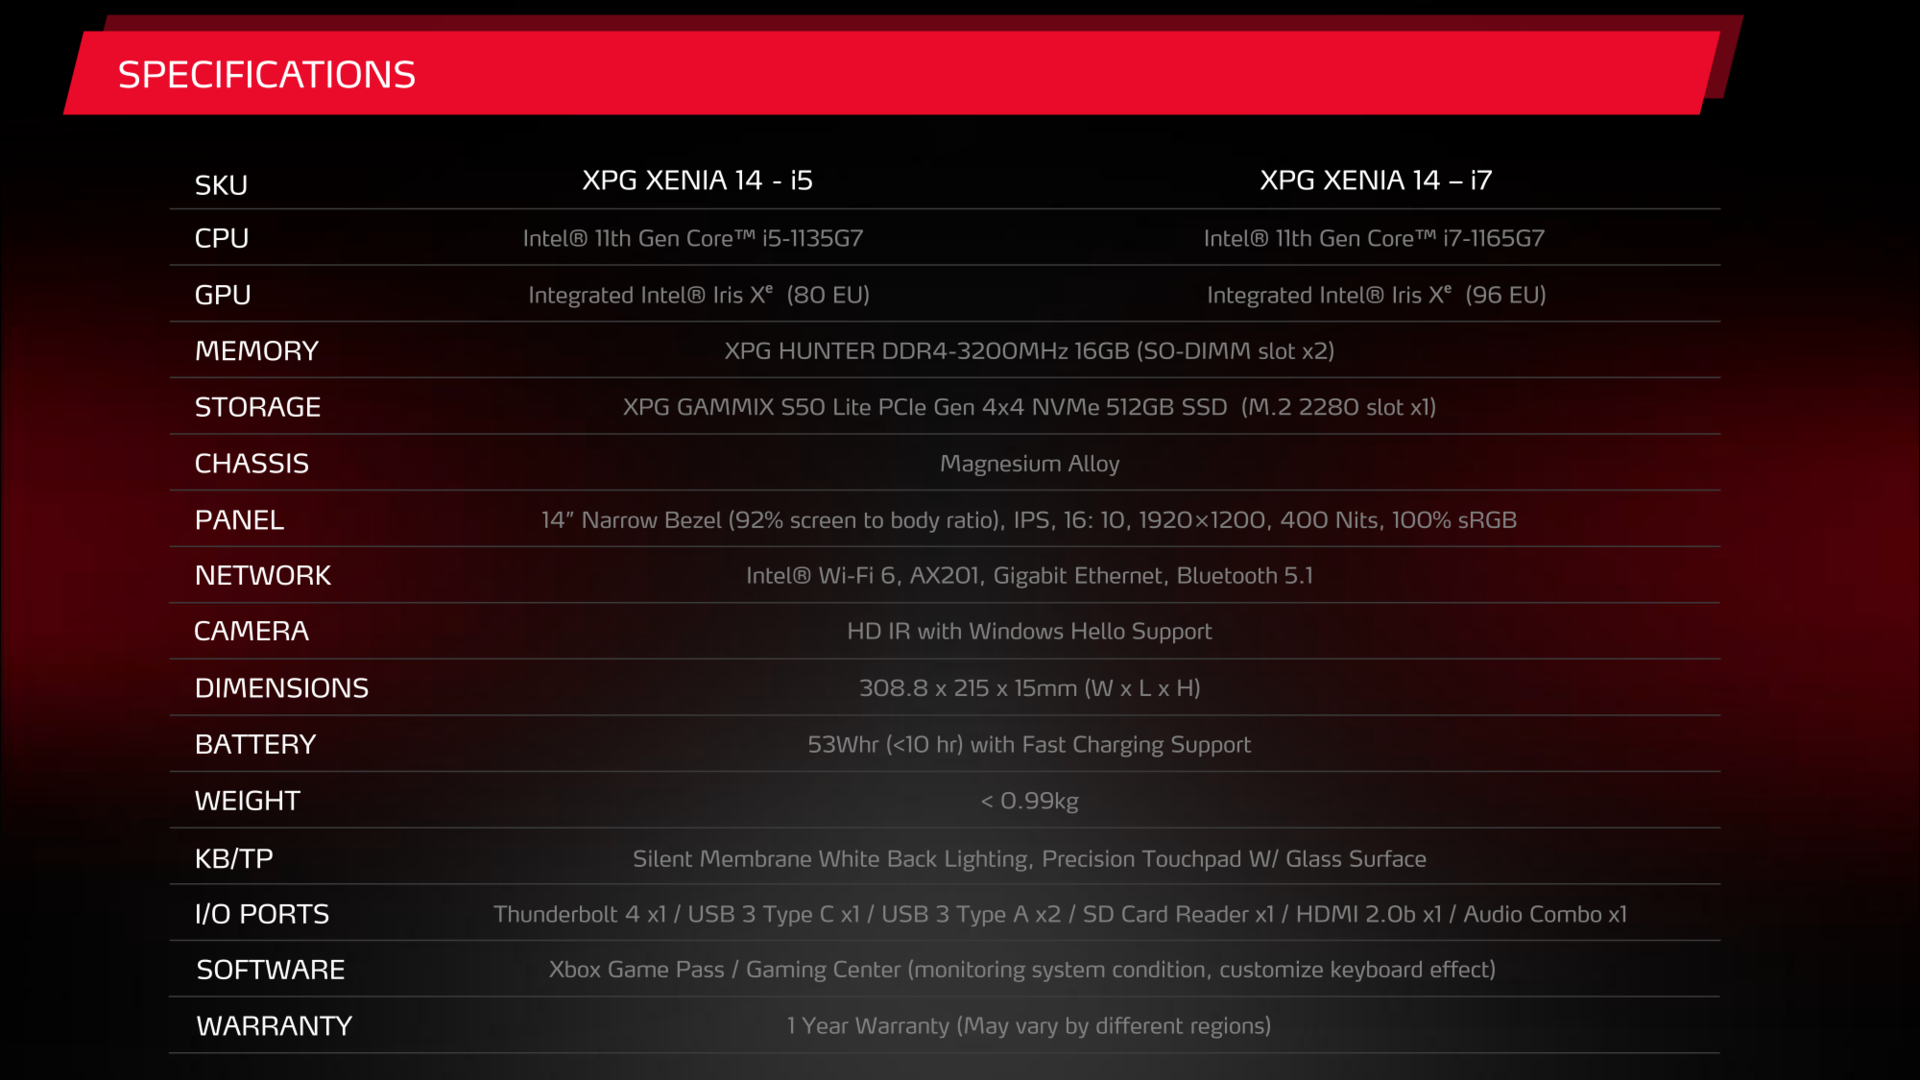
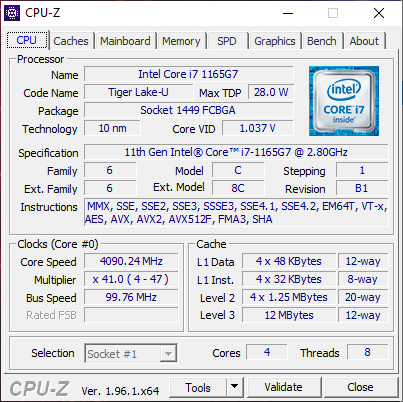
After launching the solid 15.6-inch XPG Xenia Xe just a few months ago, ADATA will soon be launching a 14-inch option called the XPG Xenia 14. The smaller model carries a very different chassis design from its bigger brother which makes the system more than just a "mini me" version of the Xenia Xe. Its display aspect ratio, for example, is 16:10 instead of 16:9. Nonetheless, both models have a number of similarities including the 11th gen Intel Tiger Lake-U Core i7-1165G7 CPU.
Competitors in this space include other thin-and-light 14-inch laptops like the LG Gram 14, Honor MagicBook 14, MSI Prestige 14, or even the classy Vaio Z.
ADATA plans on bundling gifts including headsets, mousepads, and backpacks to sweeten the deal for early adopters. The promotional launch prices range from $1049 to $1149 USD for the Core i5 and i7 SKUs, respectively.
The Xenia 14 shares the same chassis as the Schenker Vision 14 that is available in EU regions. ADATA laptops are based on white label designs similar to the Schenker.
potential competitors in comparison
Rating | Date | Model | Weight | Height | Size | Resolution | Price |
|---|---|---|---|---|---|---|---|
| 87.6 % v7 (old) | 07 / 2021 | ADATA XPG Xenia 14 i7-1165G7, Iris Xe G7 96EUs | 996 g | 15 mm | 14.00" | 1920x1200 | |
| 82.5 % v7 (old) | 12 / 2020 | MSI Prestige 14 Evo A11M-005 i7-1185G7, Iris Xe G7 96EUs | 1.2 kg | 16 mm | 14.00" | 1920x1080 | |
| 80.4 % v7 (old) | 06 / 2021 | Infinix INBook X1 Pro i7-1065G7, Iris Plus Graphics G7 (Ice Lake 64 EU) | 1.5 kg | 16.3 mm | 14.00" | 1920x1080 | |
| 84.9 % v7 (old) | 05 / 2021 | Honor Magicbook 14 i7-1165G7 i7-1165G7, Iris Xe G7 96EUs | 1.4 kg | 15.9 mm | 14.00" | 1920x1080 | |
| 88.3 % v7 (old) | 05 / 2021 | LG Gram 14Z90P-G.AA79G i7-1165G7, Iris Xe G7 96EUs | 967 g | 16.8 mm | 14.00" | 1920x1200 | |
| 83.8 % v7 (old) | 02 / 2021 | VAIO Z VJZ141C11L i7-11375H, Iris Xe G7 96EUs | 1 kg | 16.9 mm | 14.00" | 3840x2160 |
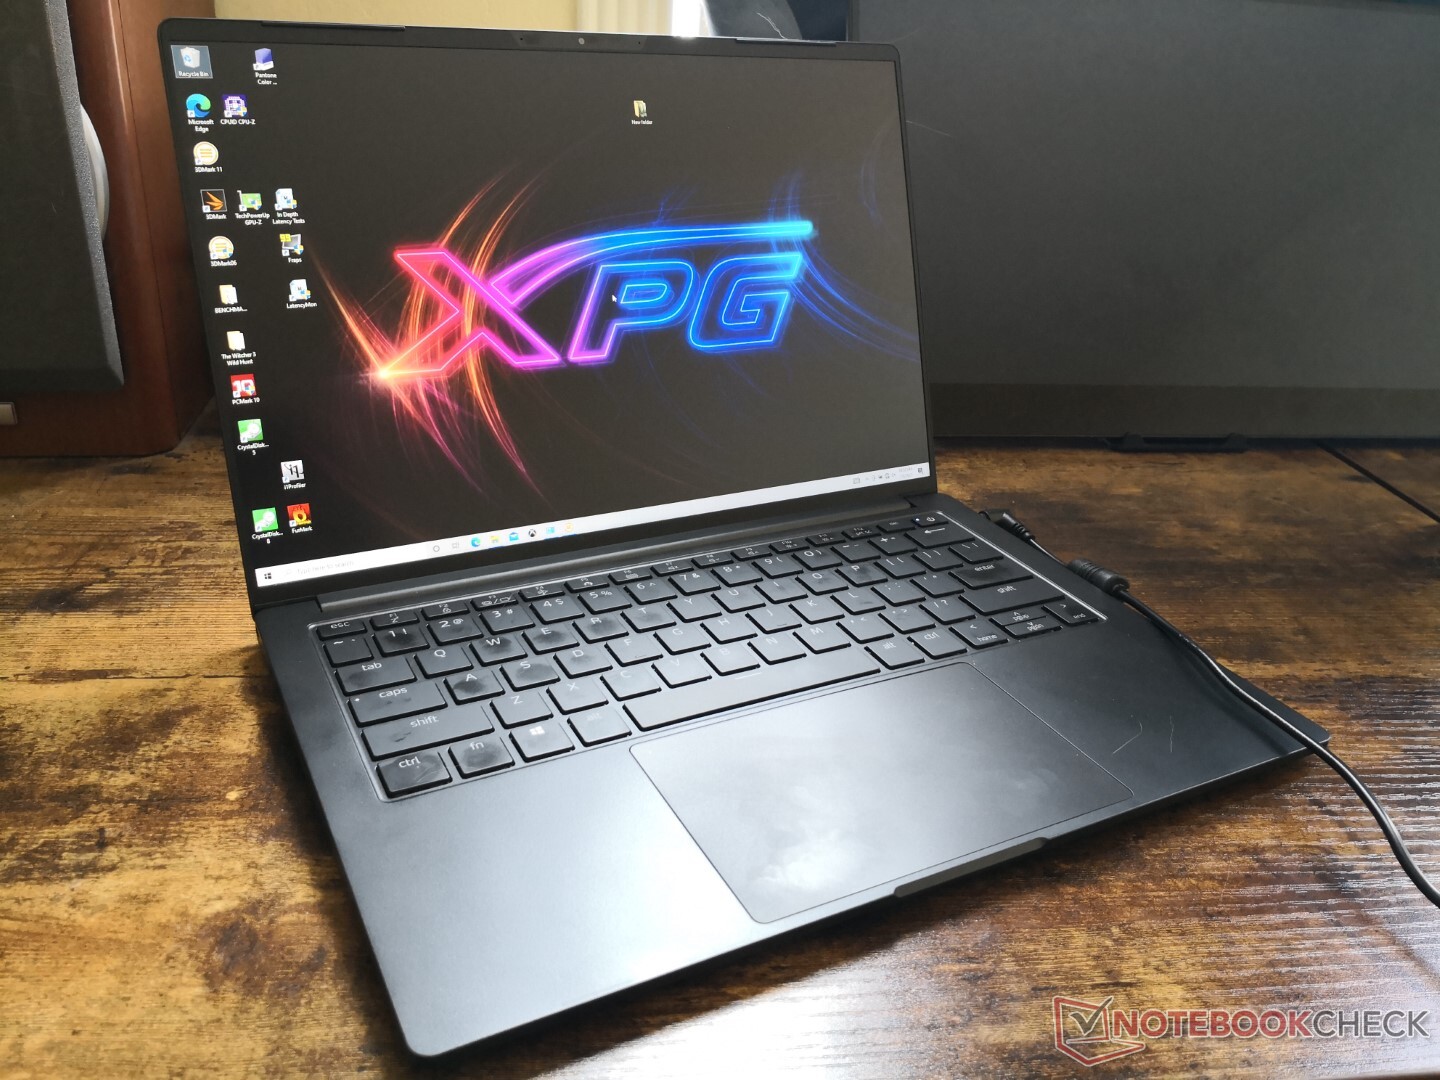
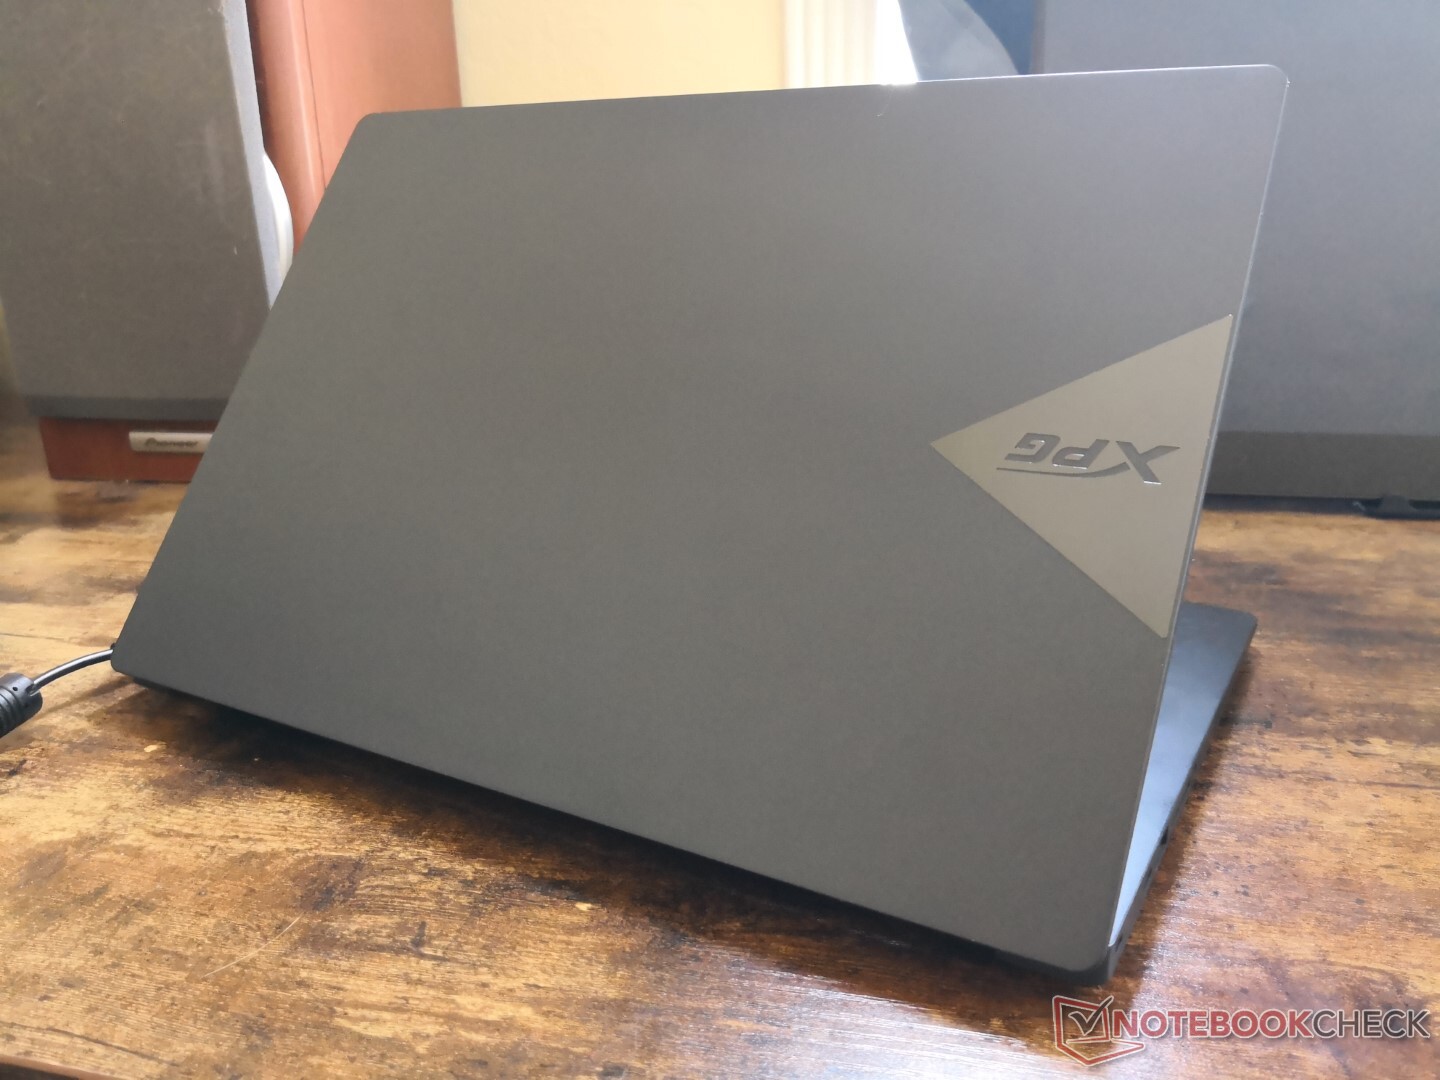
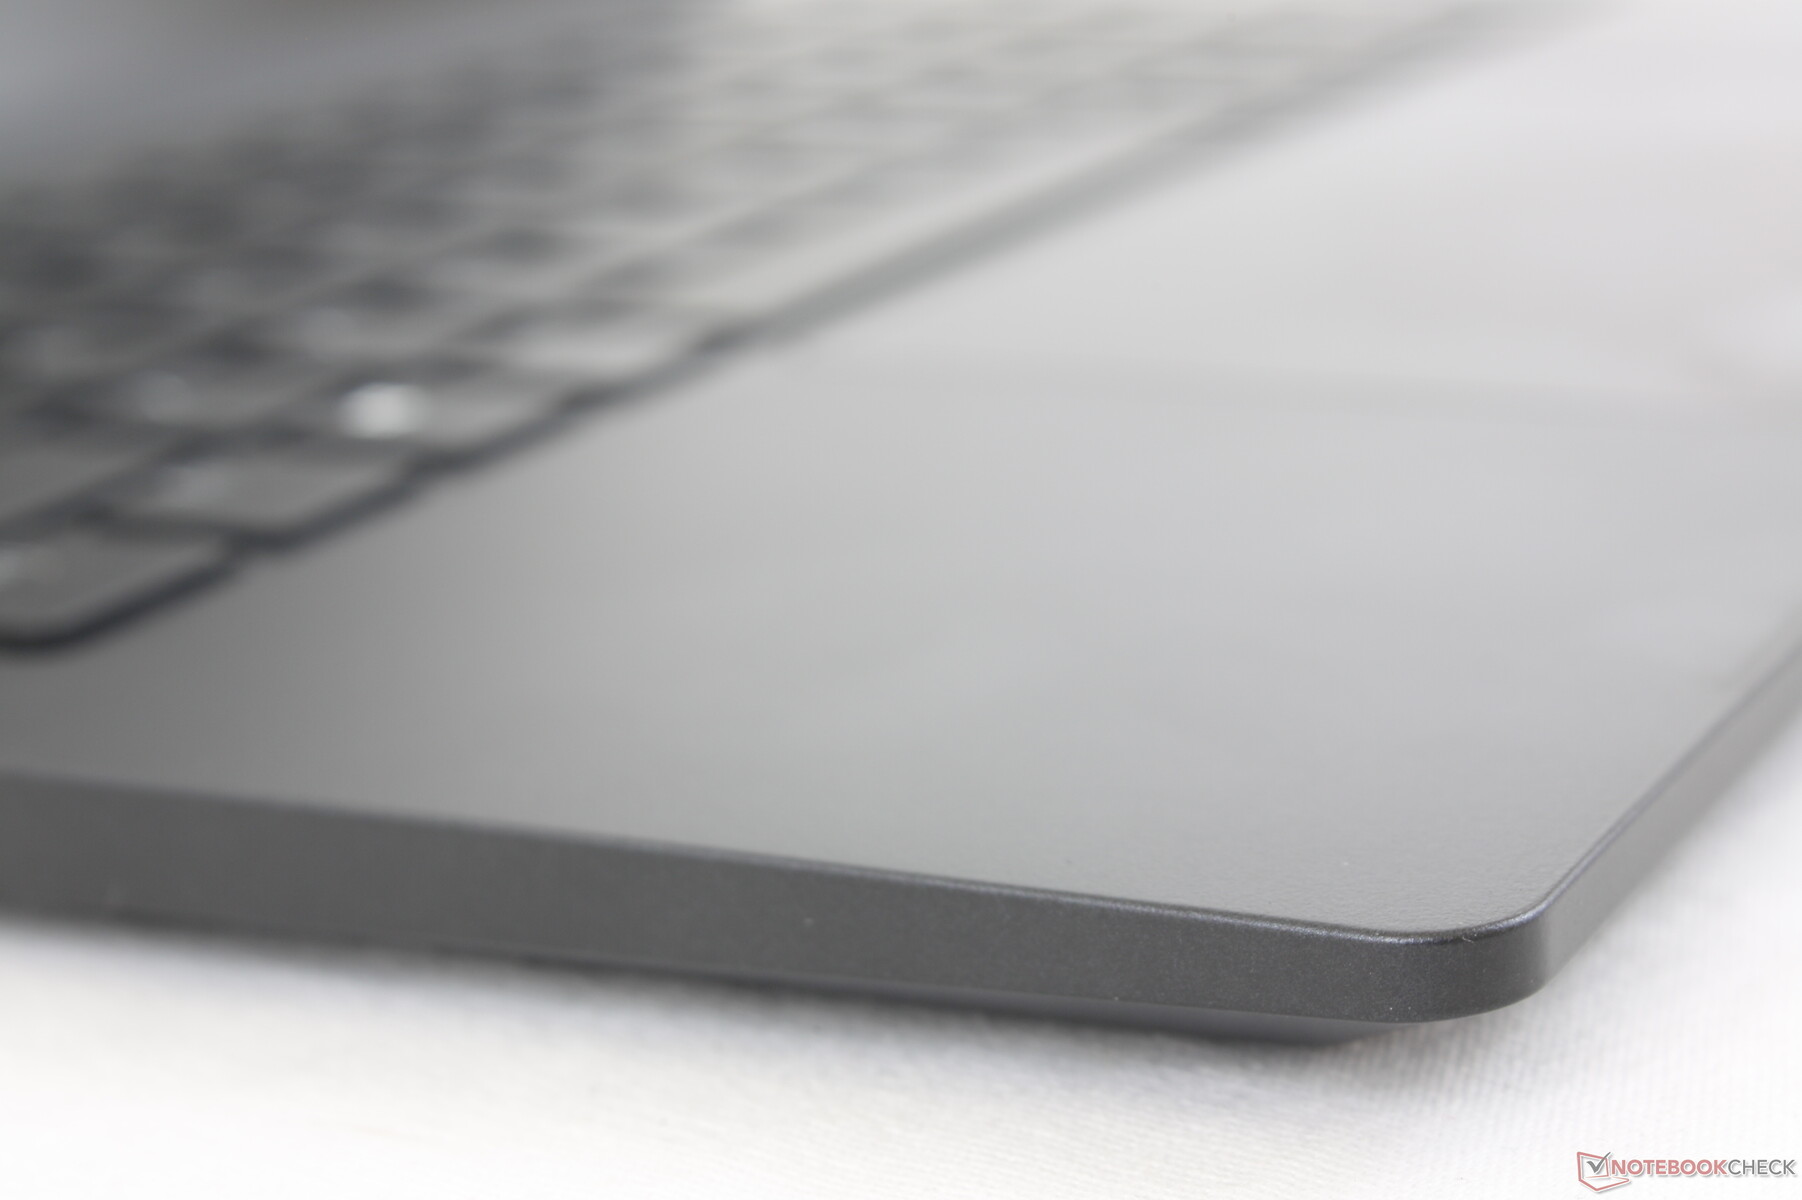
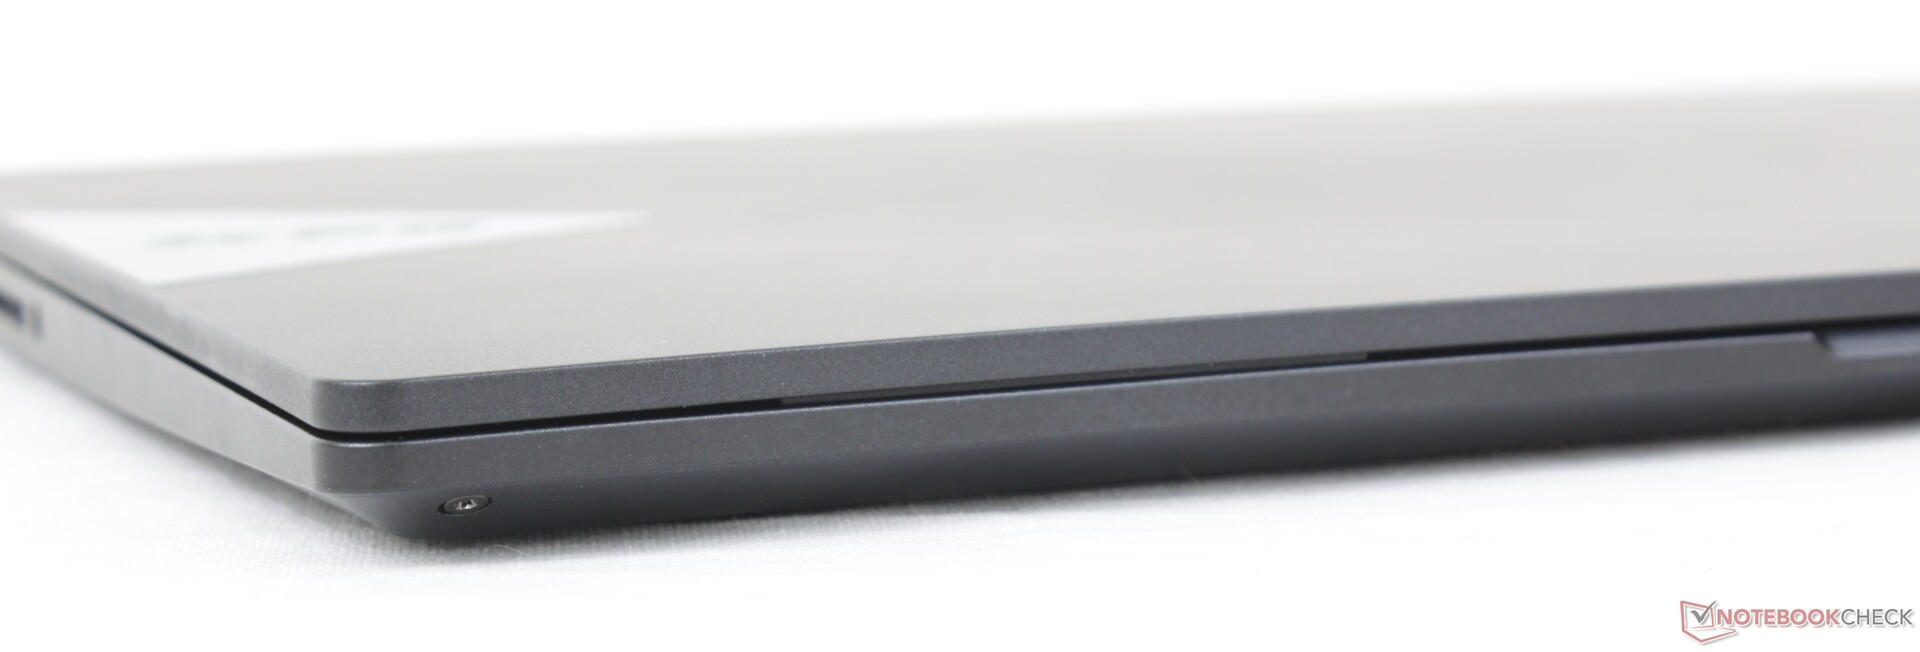
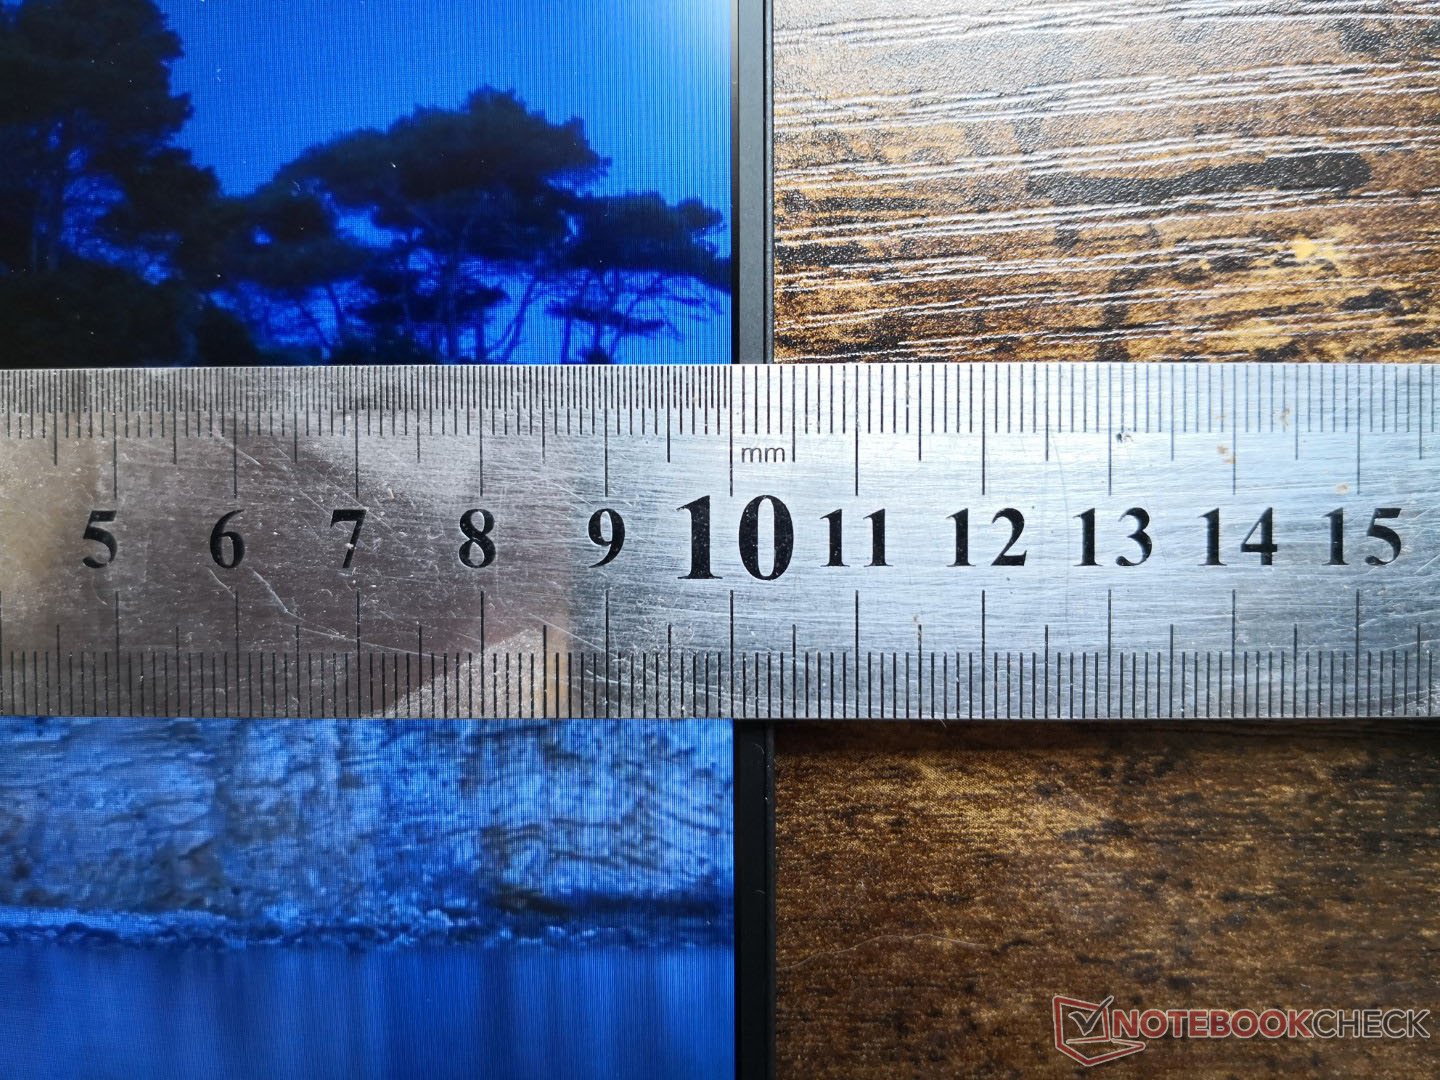
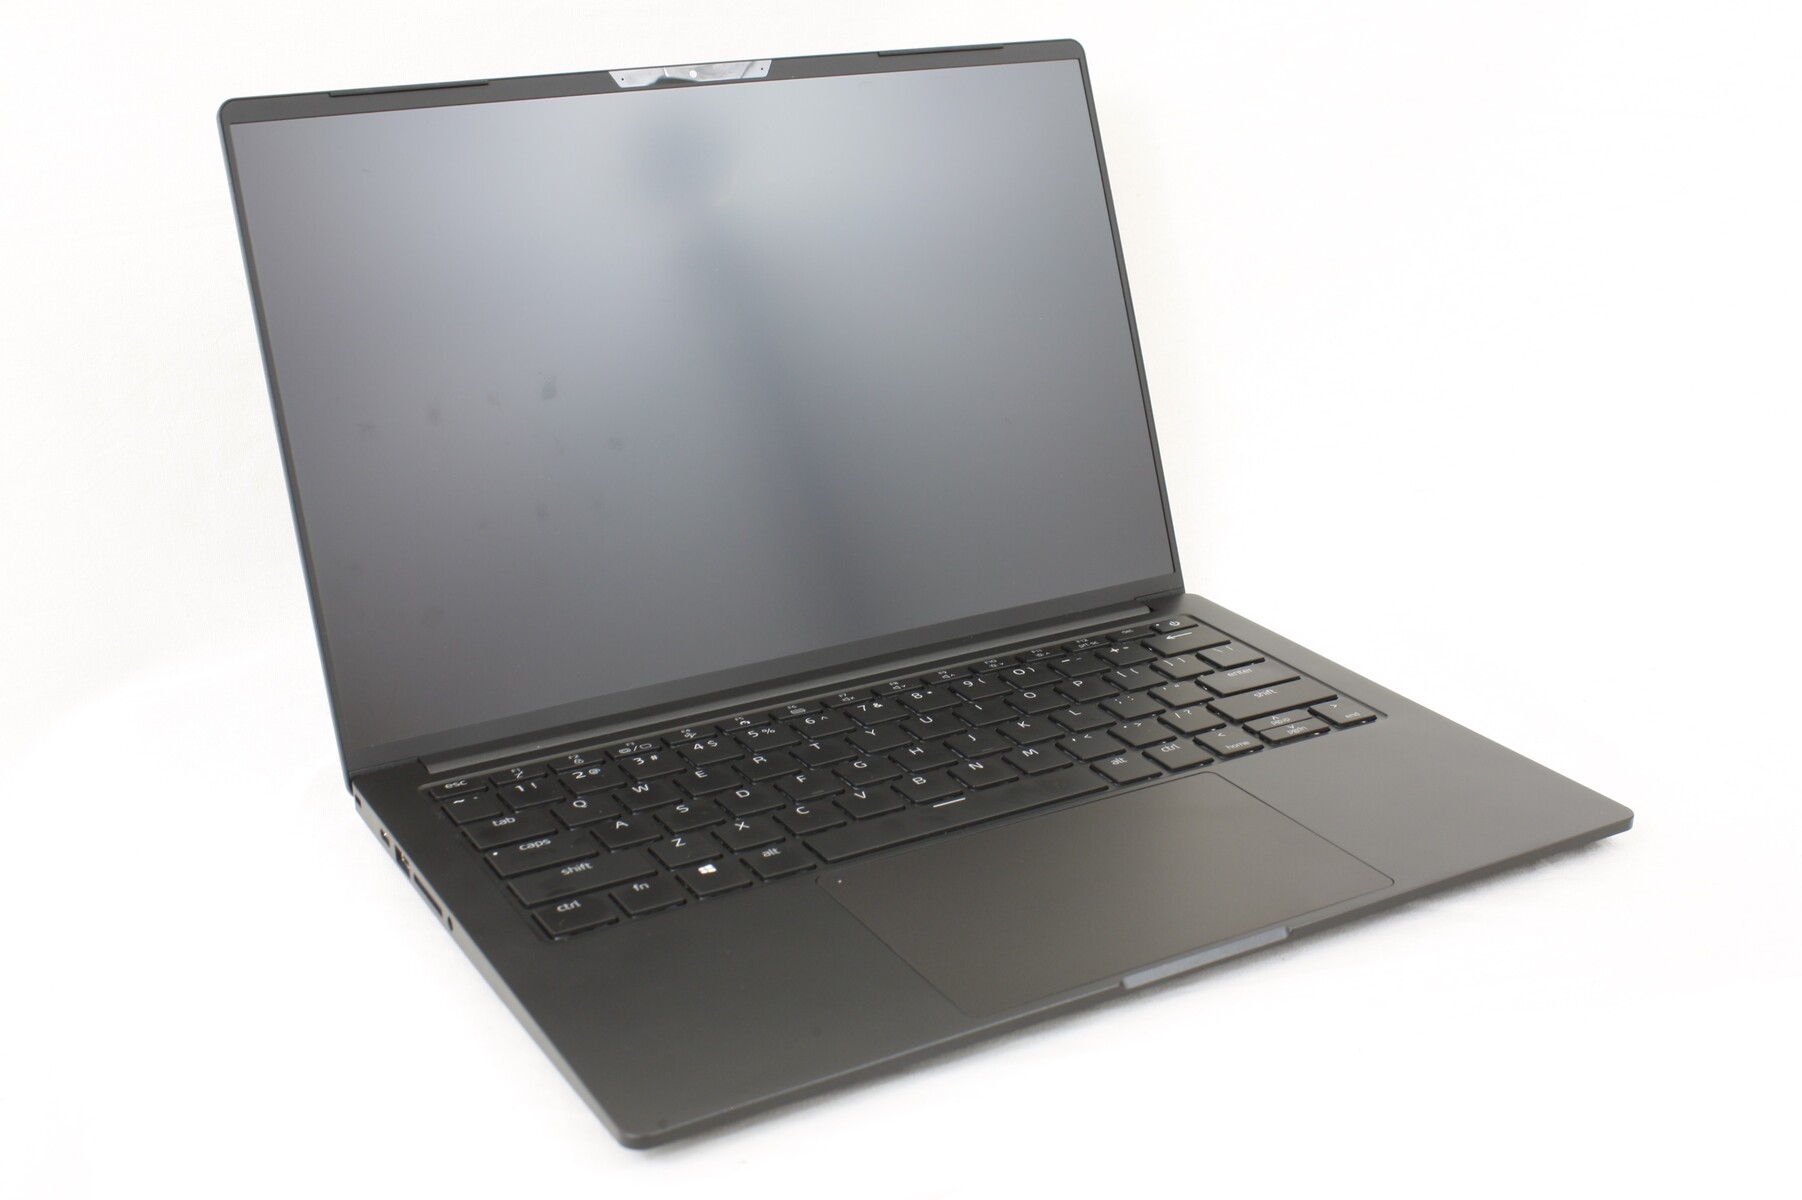
Case — Incredibly Light
In order to reach the low weight of just 996 g, the chassis skeleton had to be made thinner than what was used for the larger and heavier Xenia Xe. Certain features like edge-to-edge glass protection are out the window in order to save on weight. The system is therefore more susceptible to flexing and twisting than most other Ultrabooks including the HP Spectre x360 14 or Asus ZenBook. This isn't to say that the system is poorly built as construction quality is still top notch, but users will be sacrificing rigidity for that increase in portability.
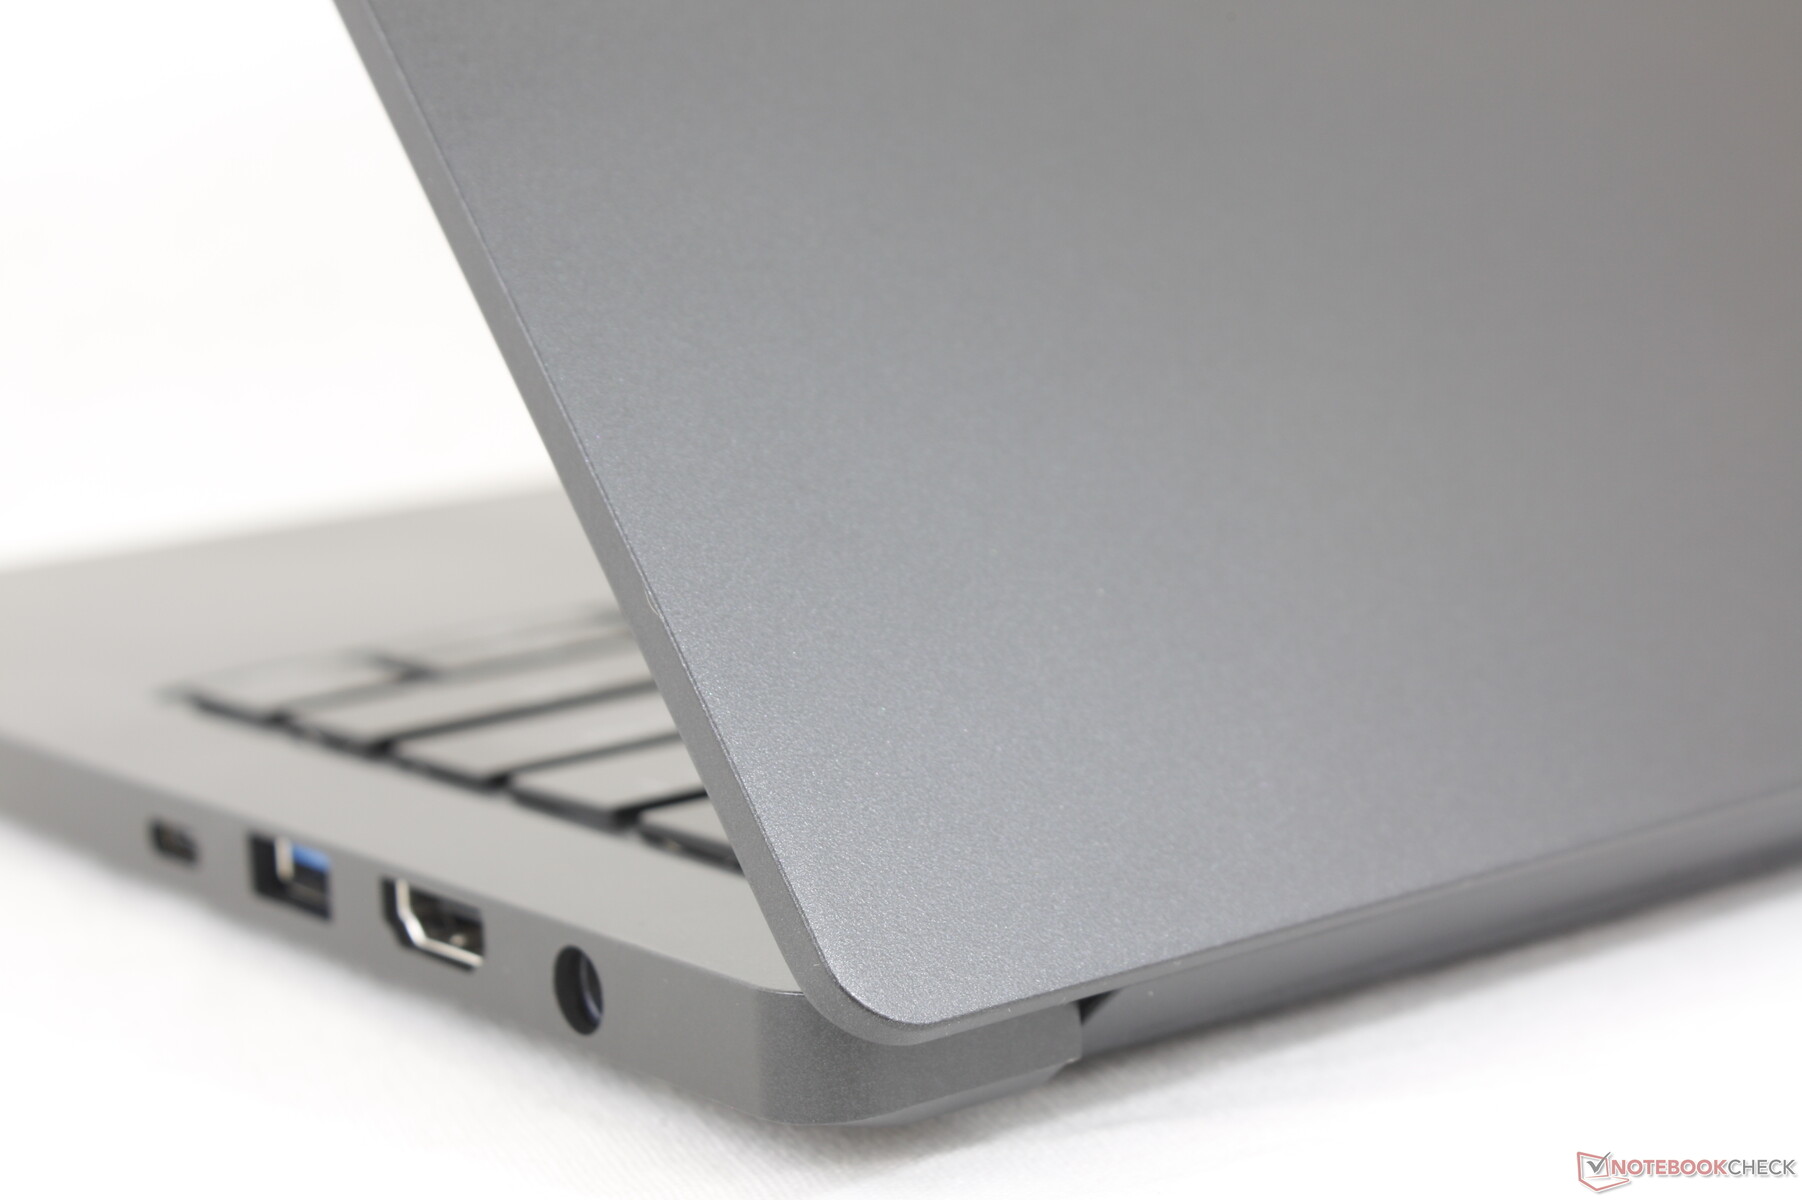
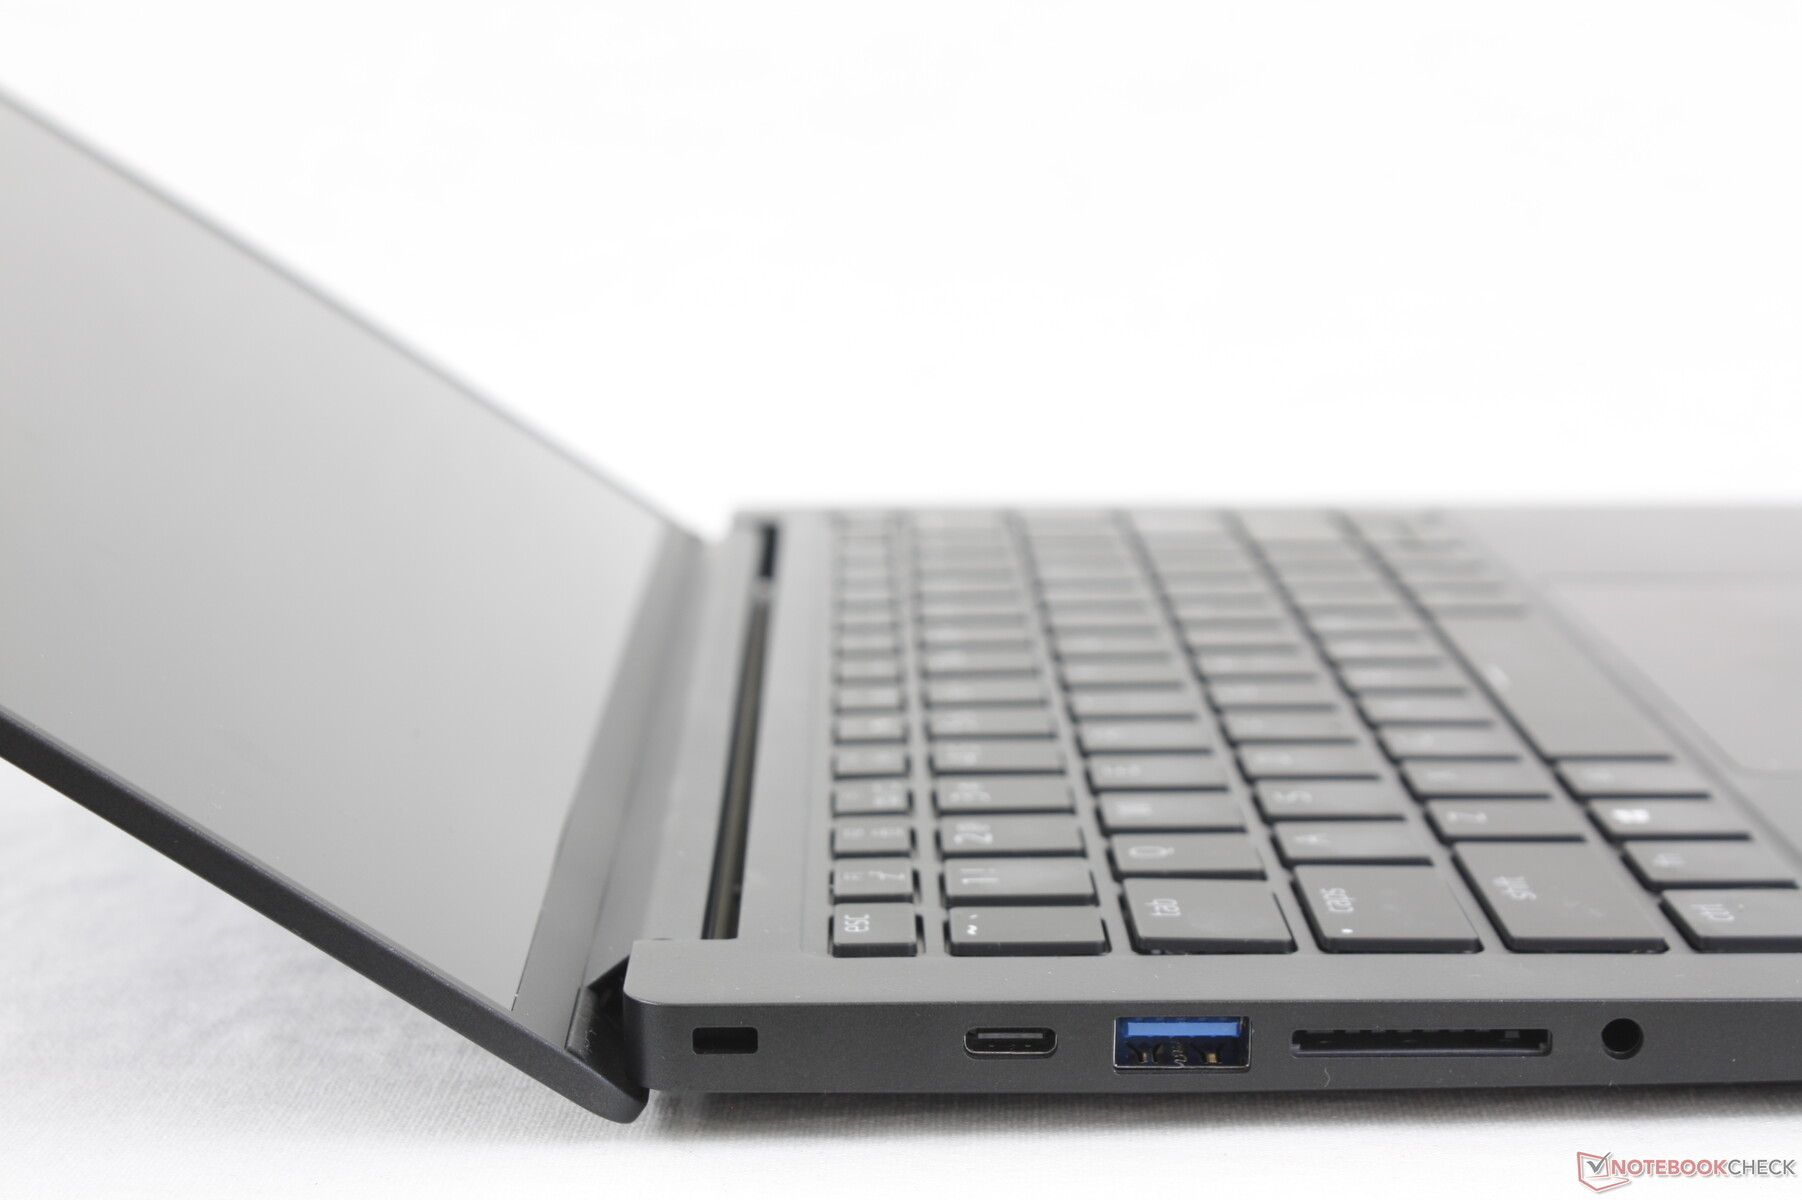
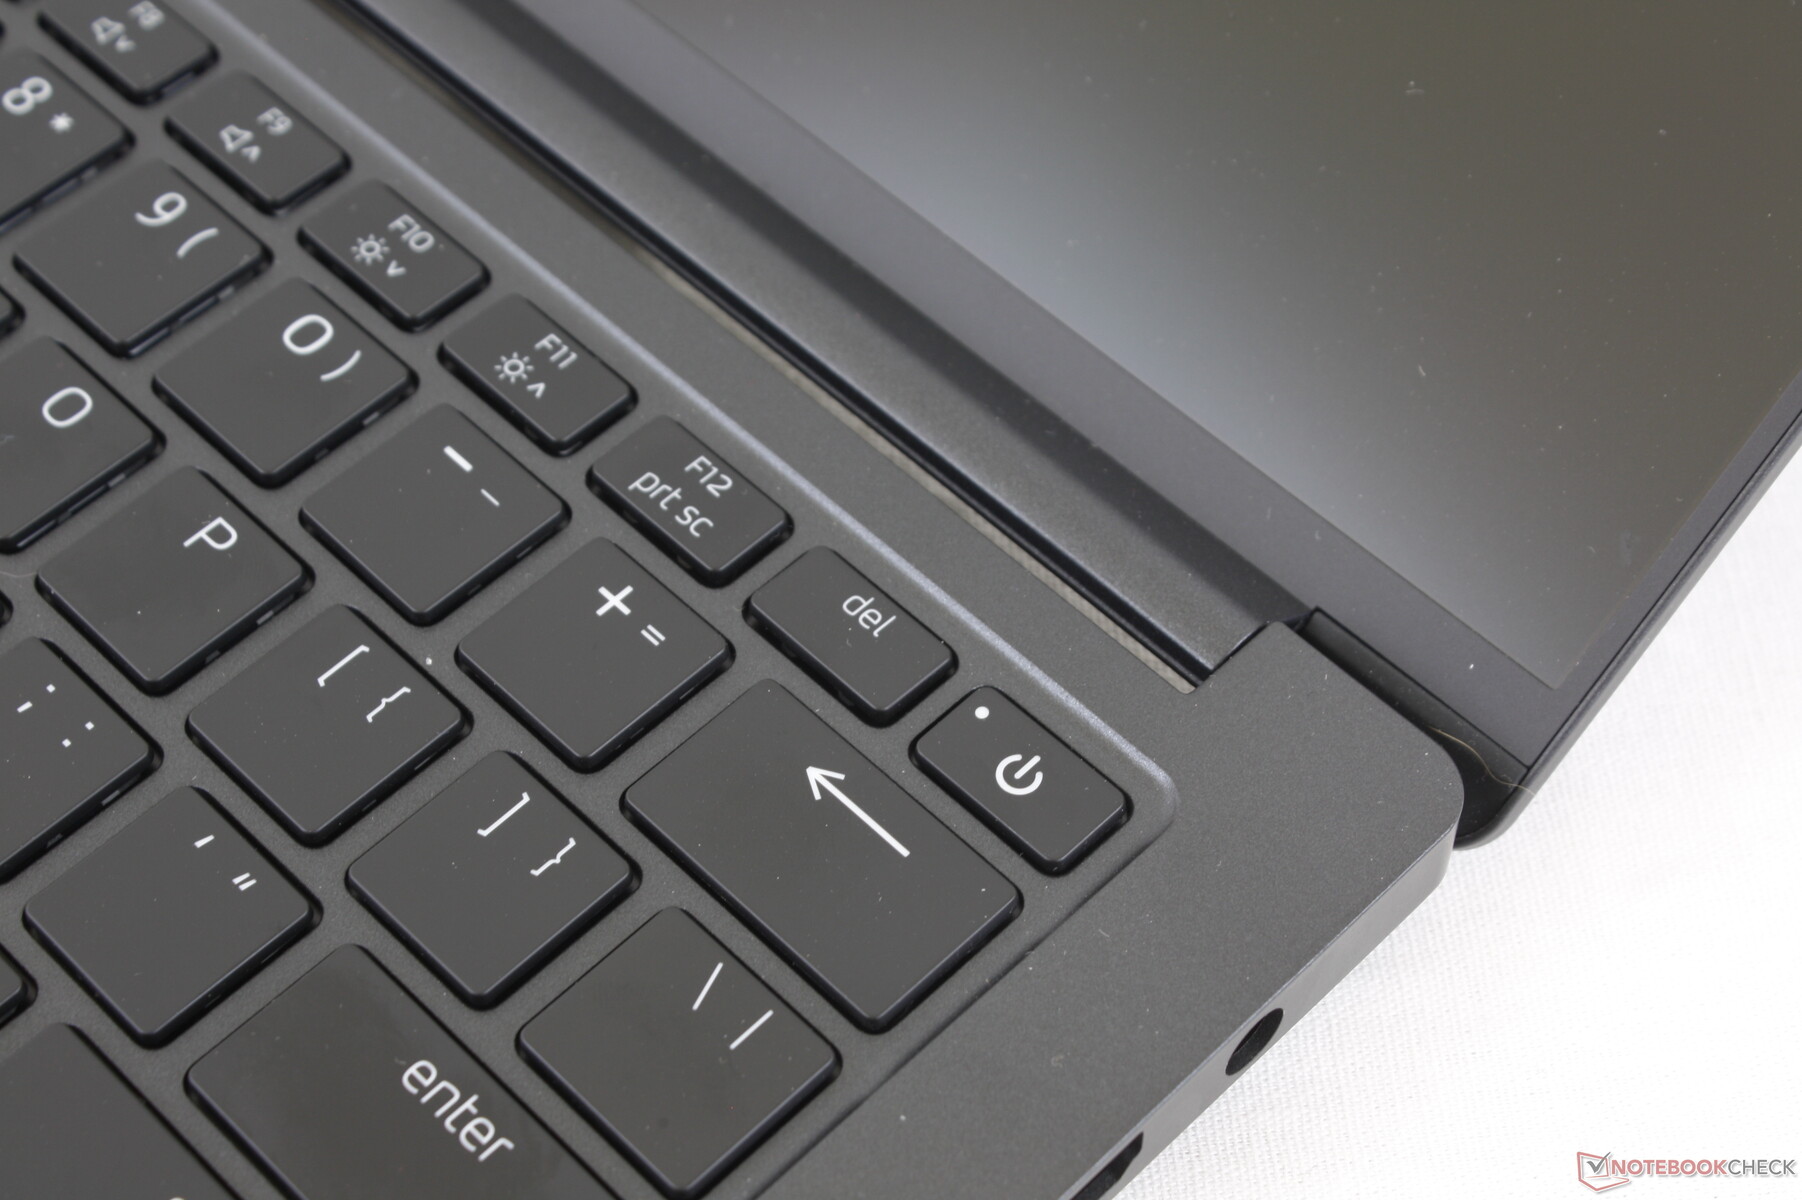
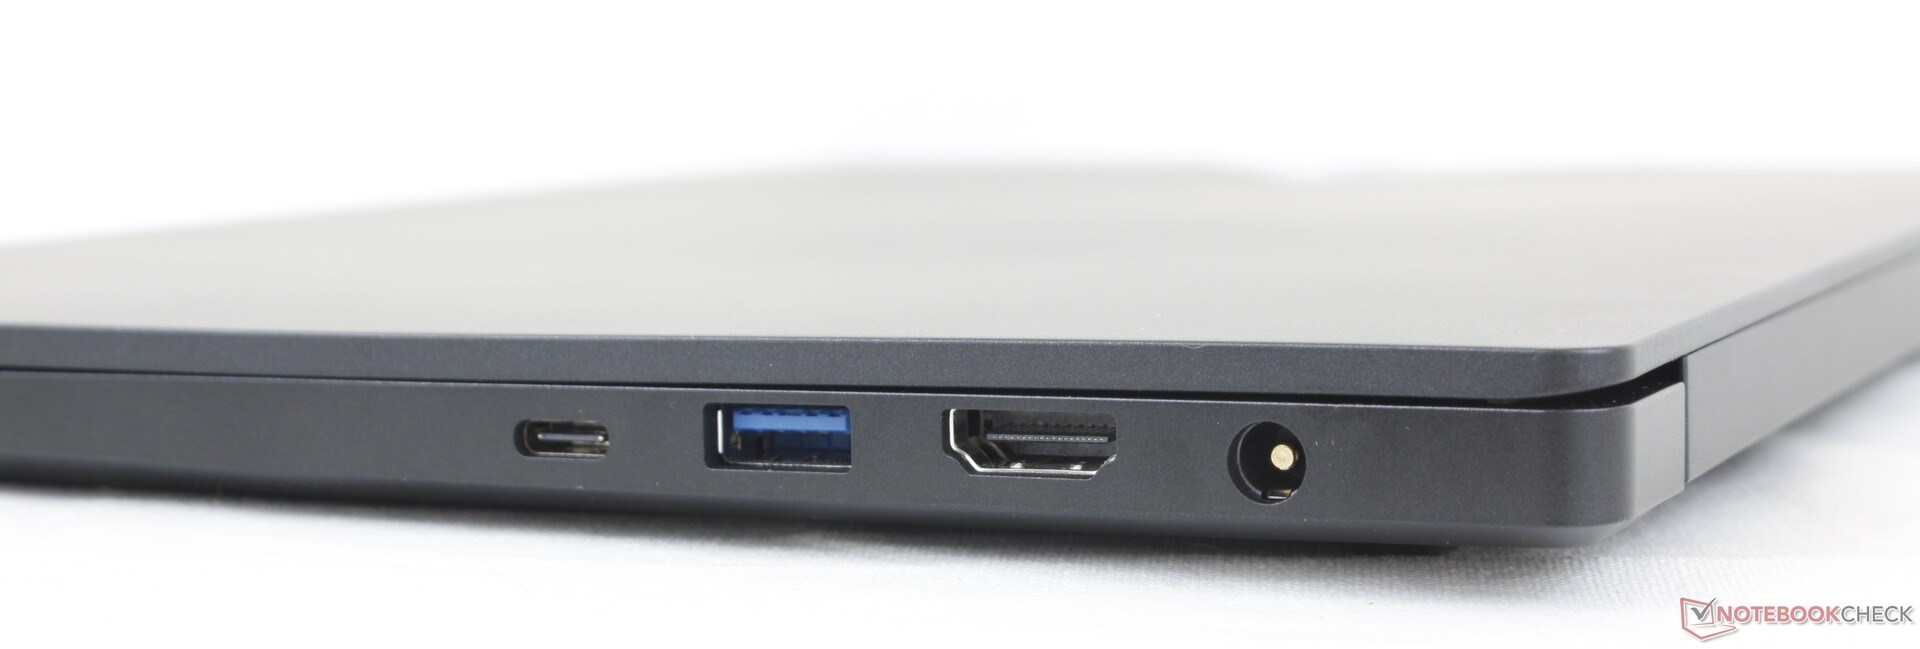
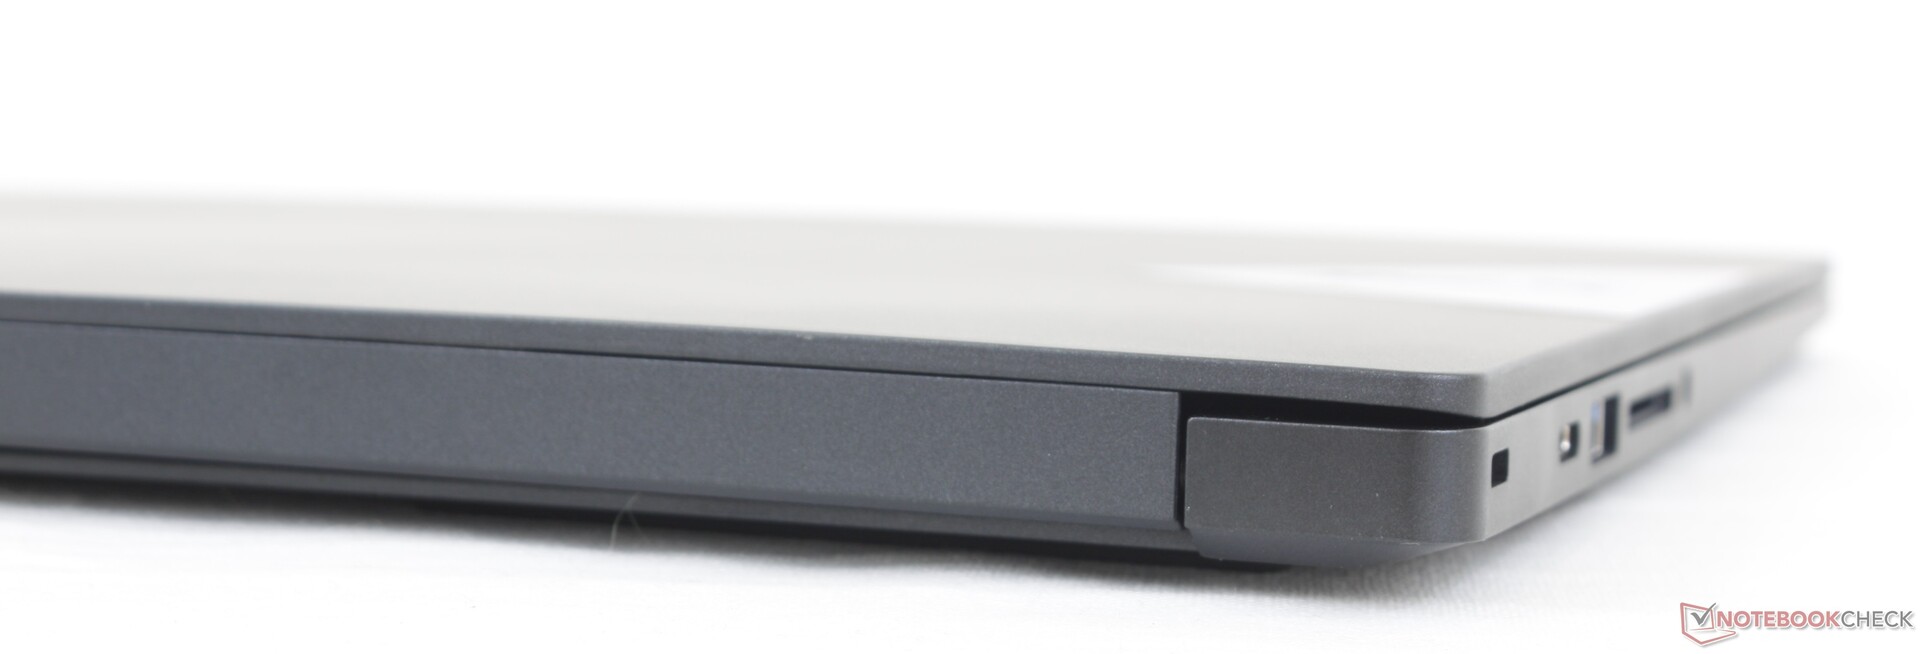
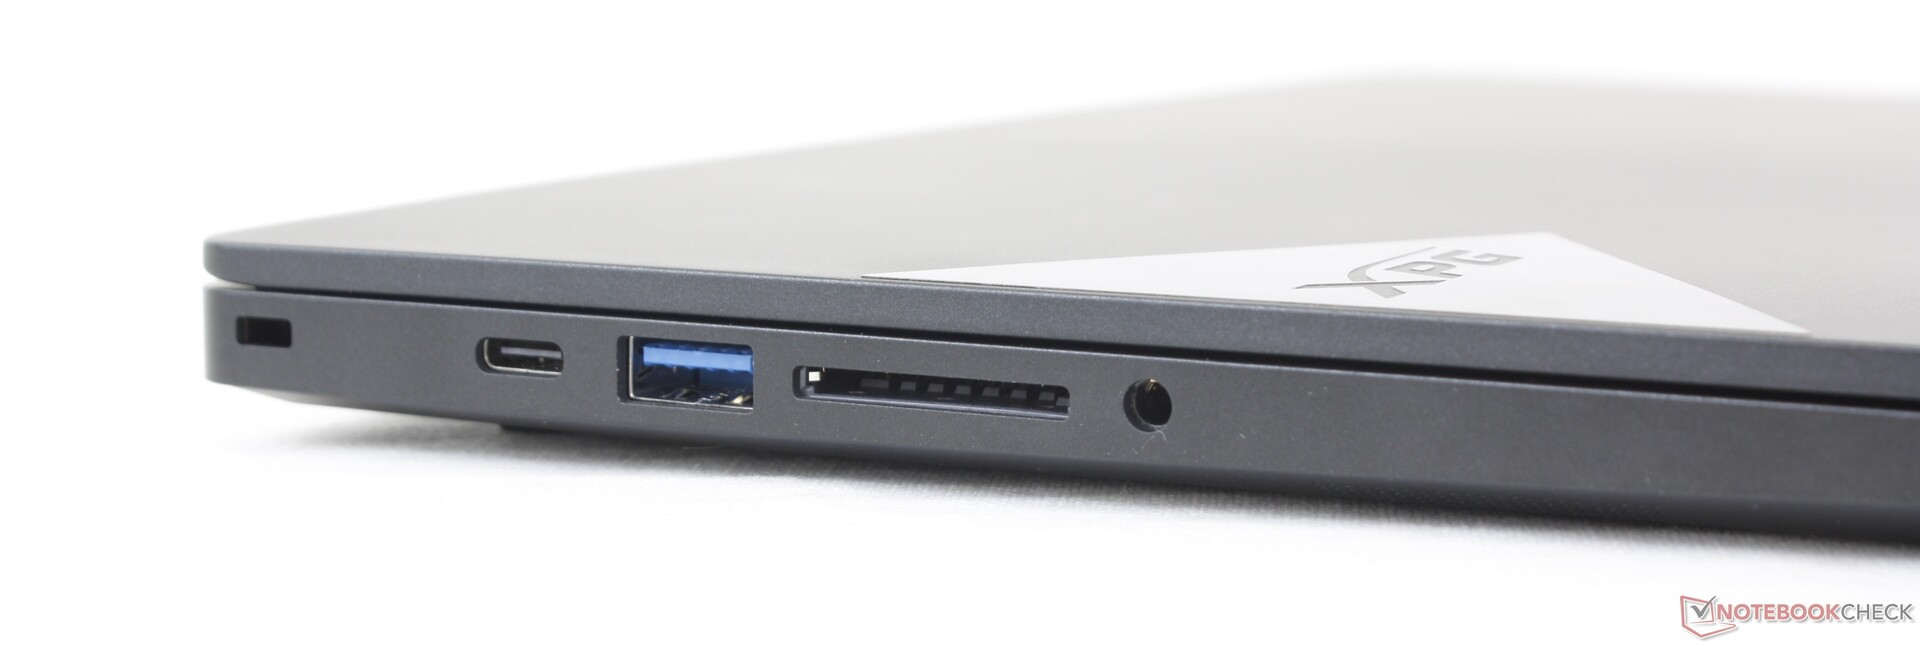
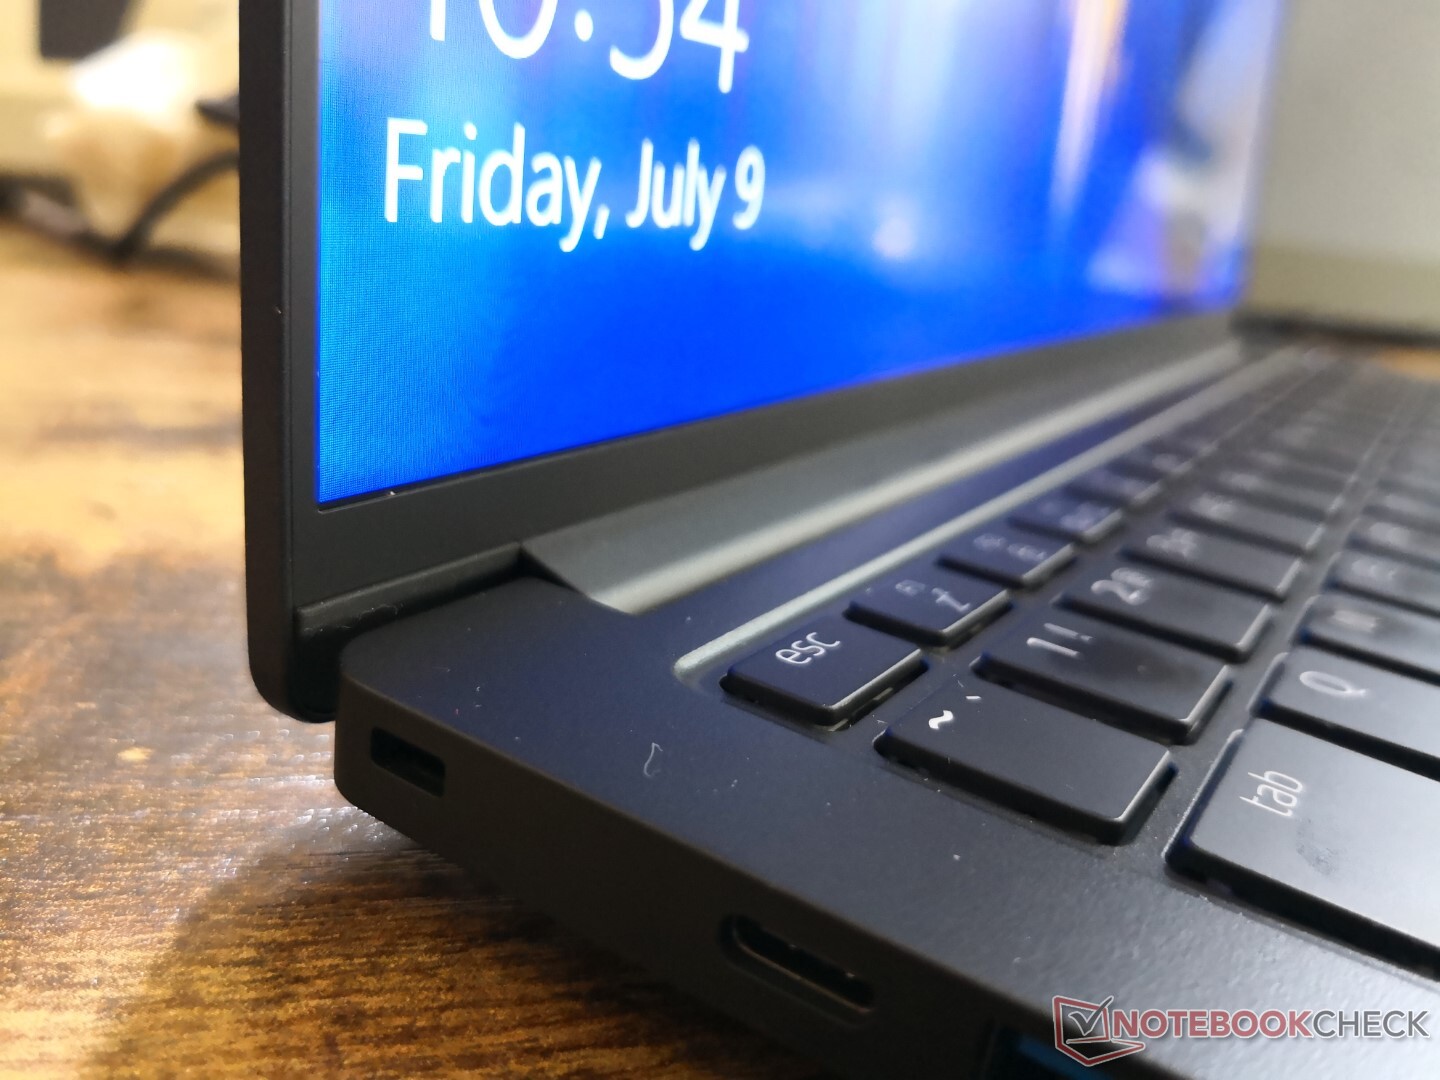
Connectivity — Lots To Choose
The system integrates more ports than most other 14-inch laptops. Both USB-C ports support charging, data, and video-out, but only the right port actually supports Thunderbolt 4. The manufacturer could have dropped the proprietary barrel charger port altogether without really impacting the usability of the model.
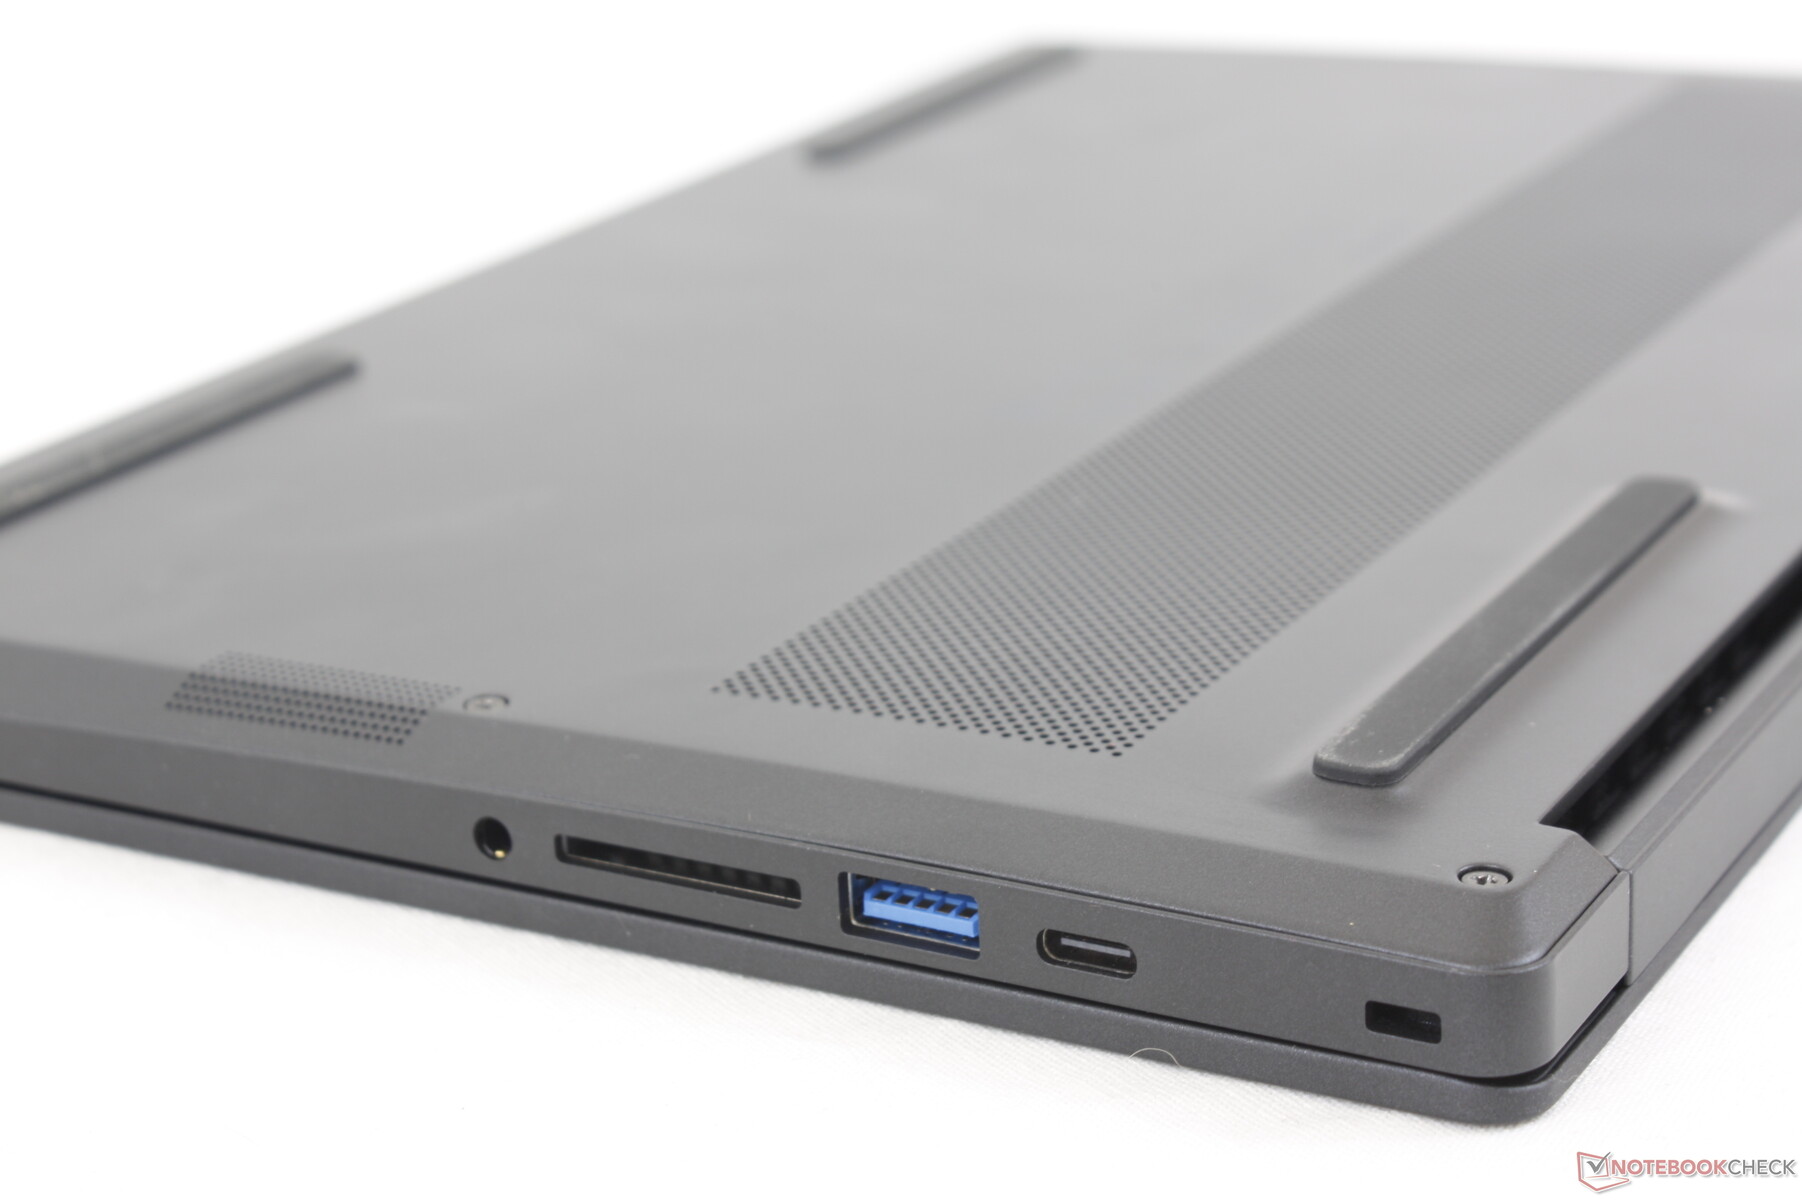
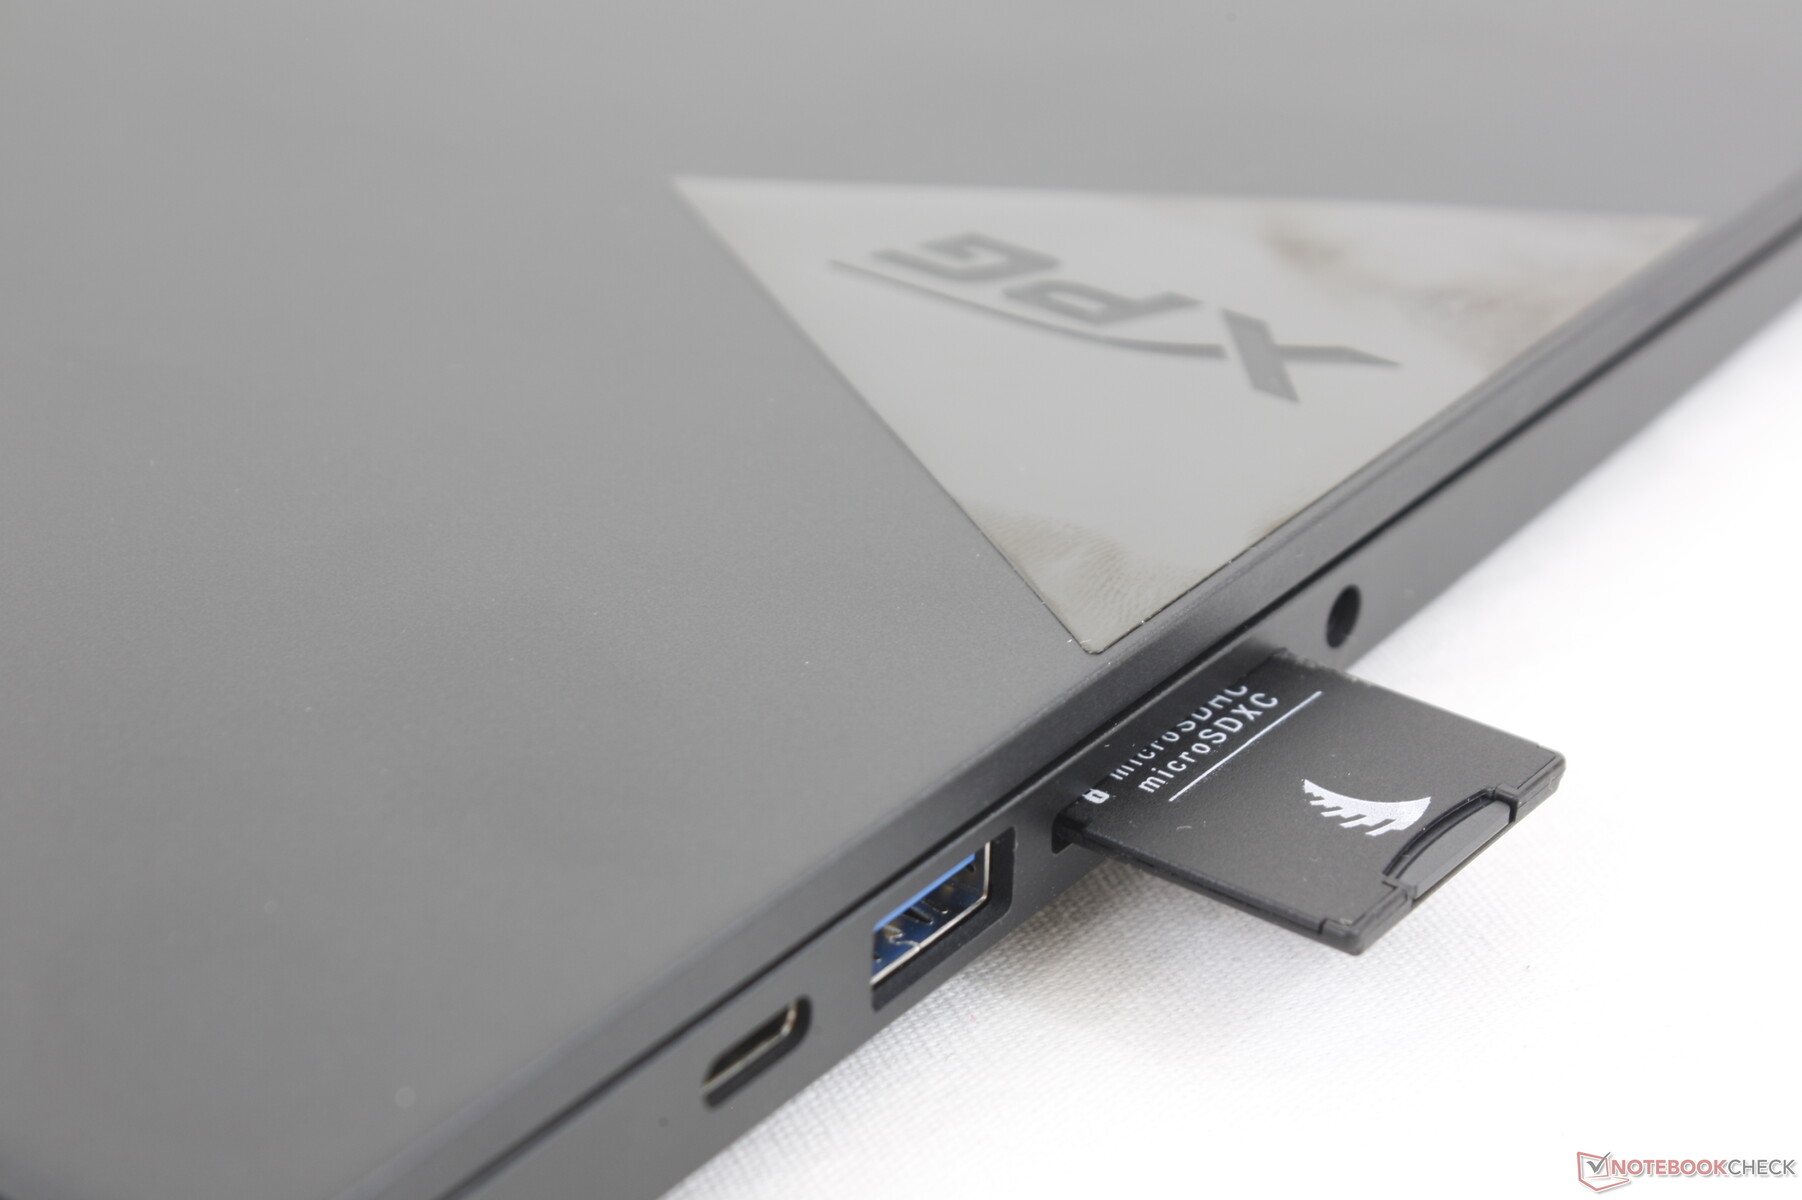
SD Card Reader
Moving 1 GB of pictures from our UHS-II test card to desktop takes about 14 seconds. Note that an inserted SD card still protrudes by over half its length since the SD reader is not spring loaded.
| SD Card Reader | |
| average JPG Copy Test (av. of 3 runs) | |
| LG Gram 14Z90P-G.AA79G (Toshiba Exceria Pro M501 microSDXC 64GB) | |
| ADATA XPG Xenia 14 (AV Pro V60) | |
| Infinix INBook X1 Pro (AV Pro V60) | |
| maximum AS SSD Seq Read Test (1GB) | |
| LG Gram 14Z90P-G.AA79G (Toshiba Exceria Pro M501 microSDXC 64GB) | |
| ADATA XPG Xenia 14 (AV Pro V60) | |
| Infinix INBook X1 Pro (AV Pro V60) | |
Communication
Webcam


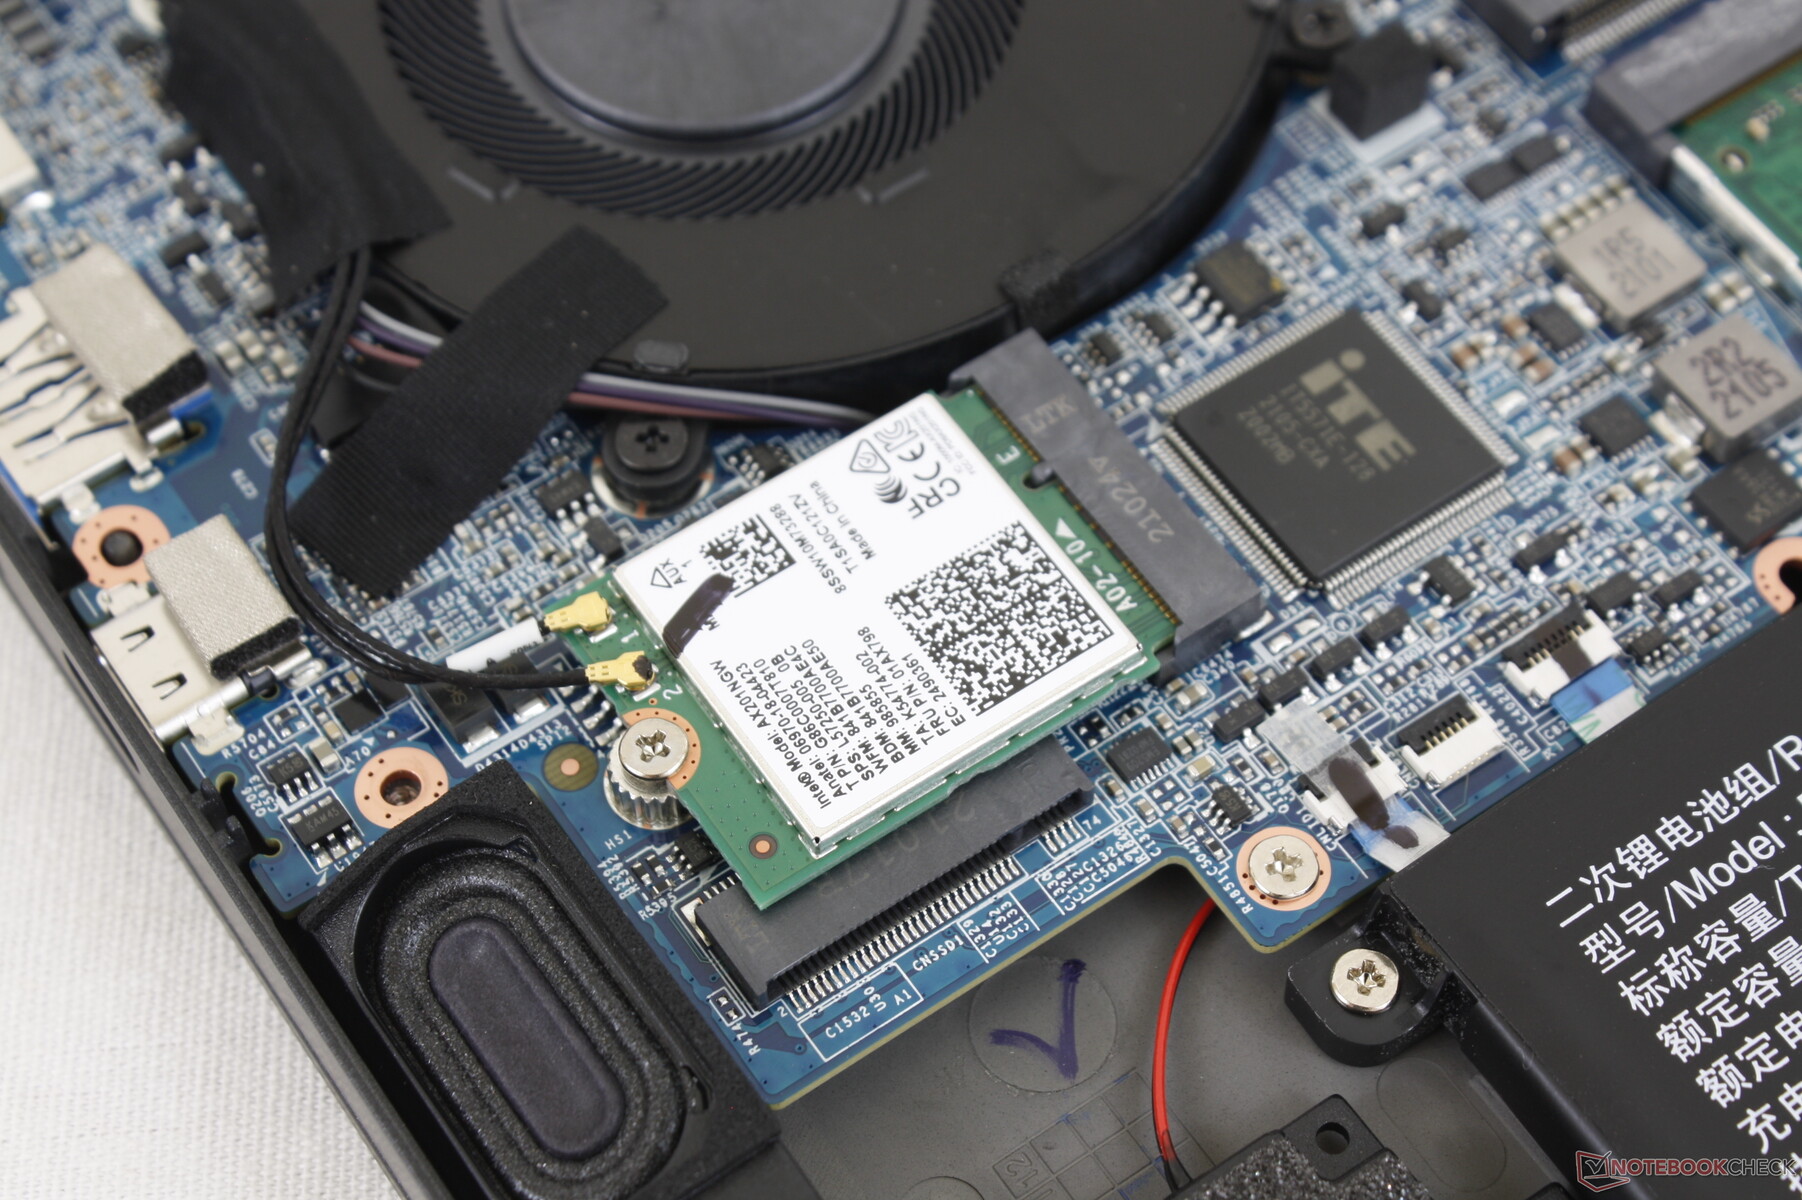
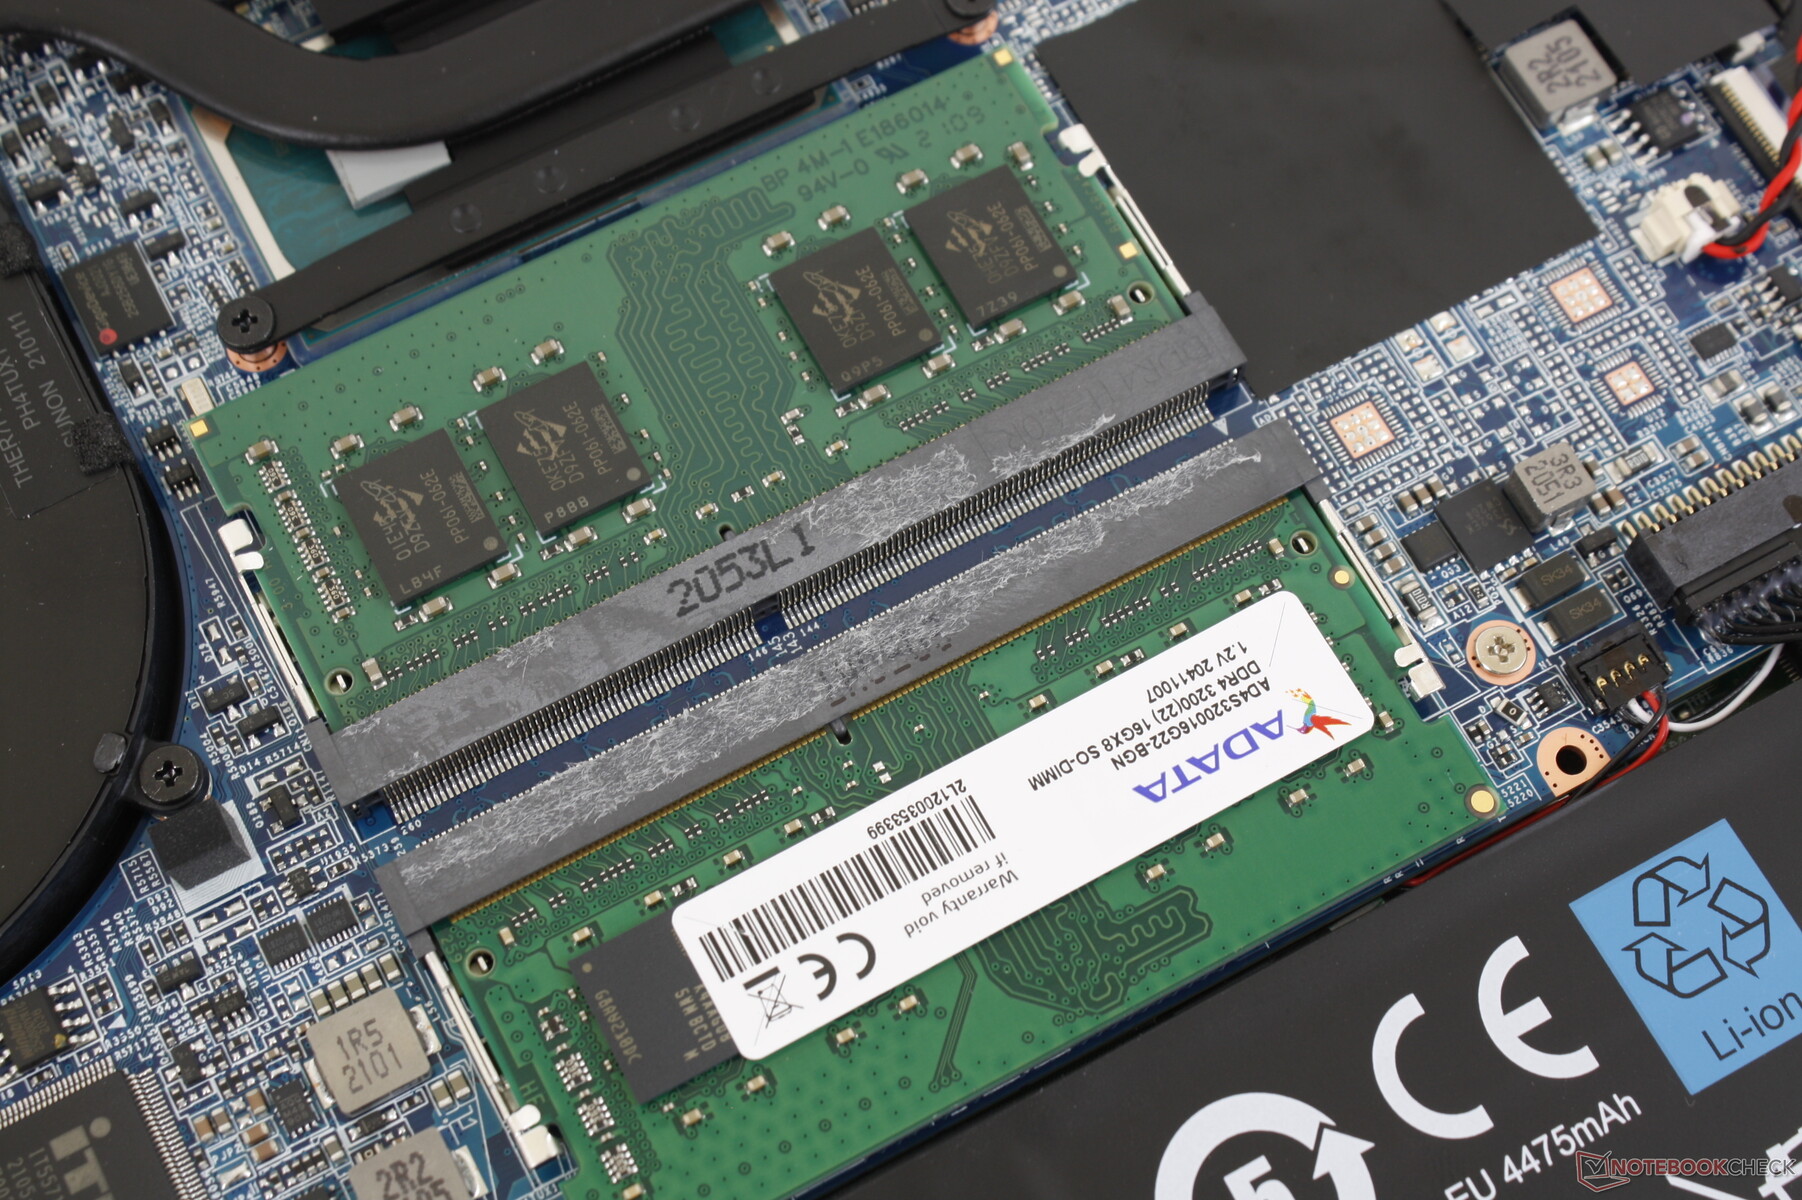
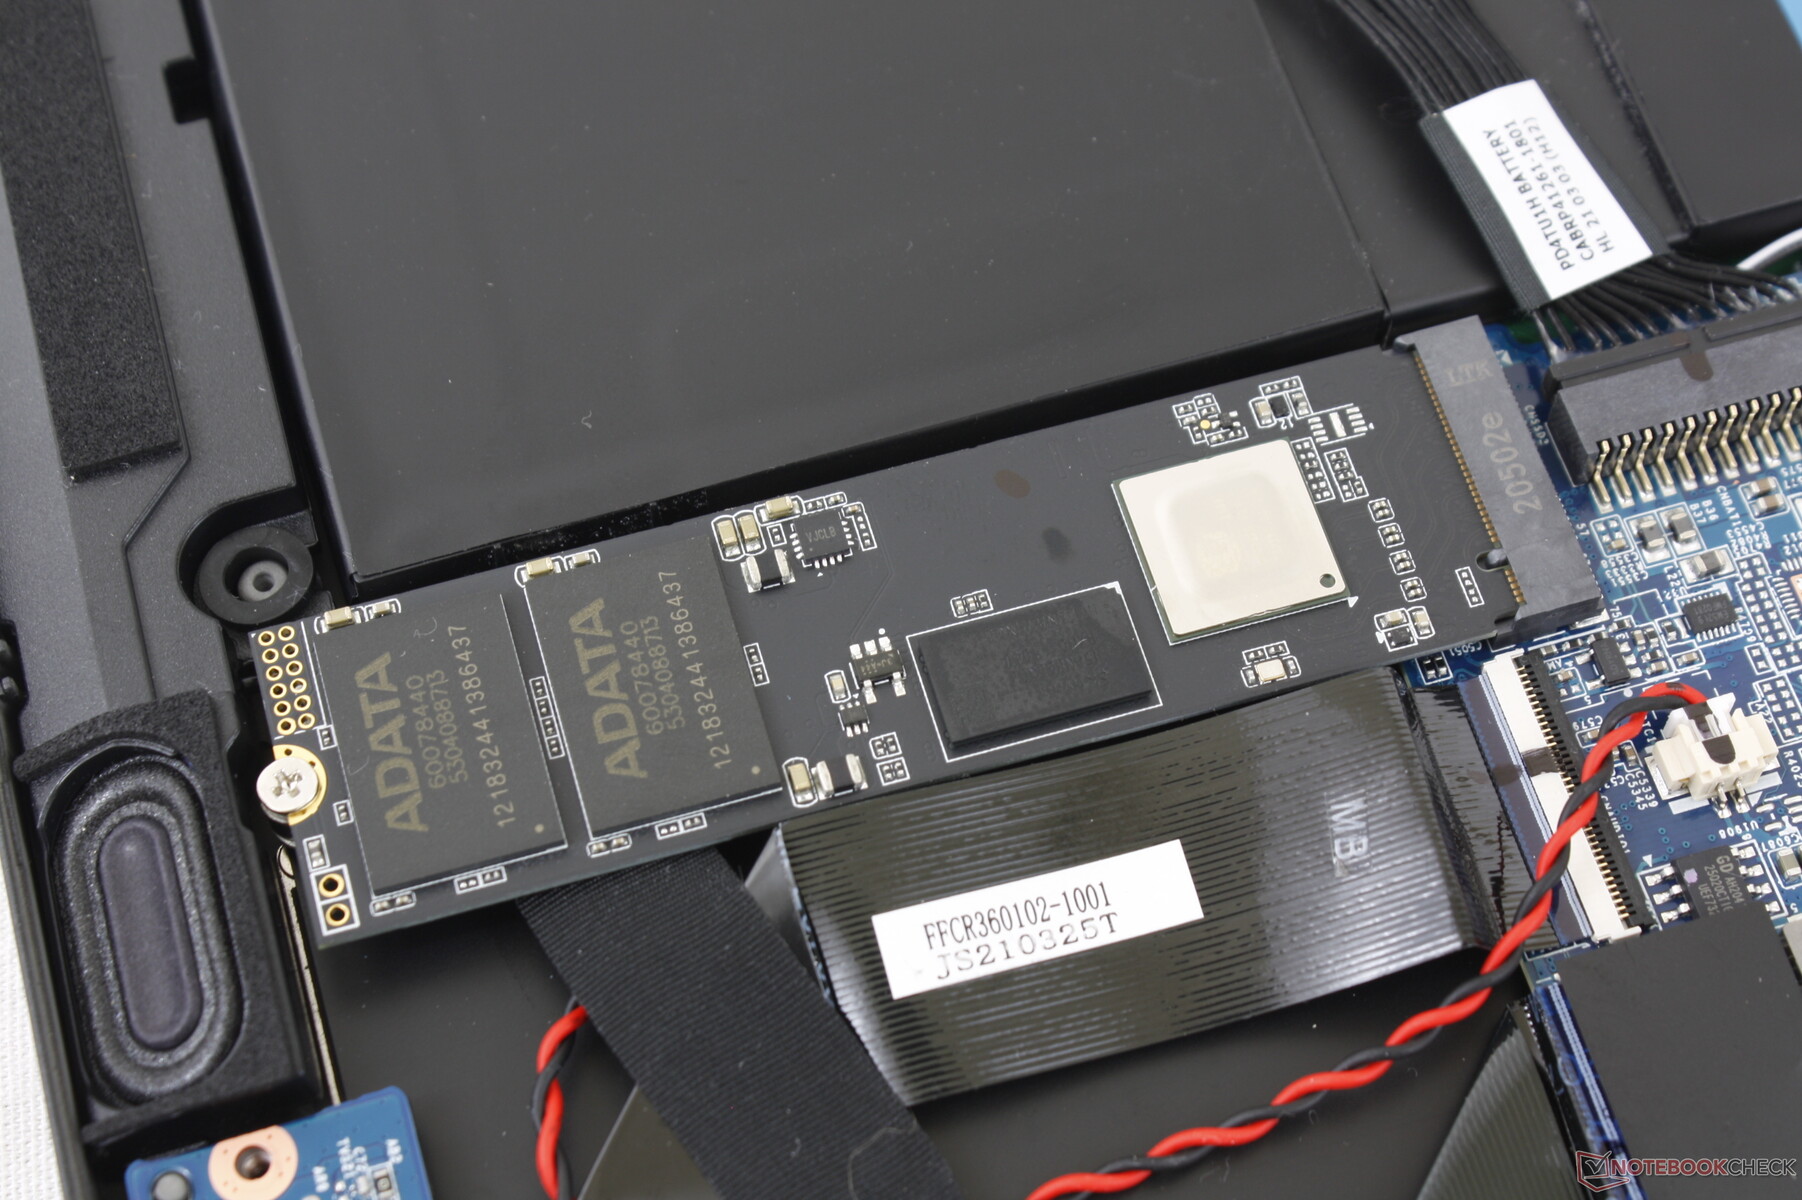
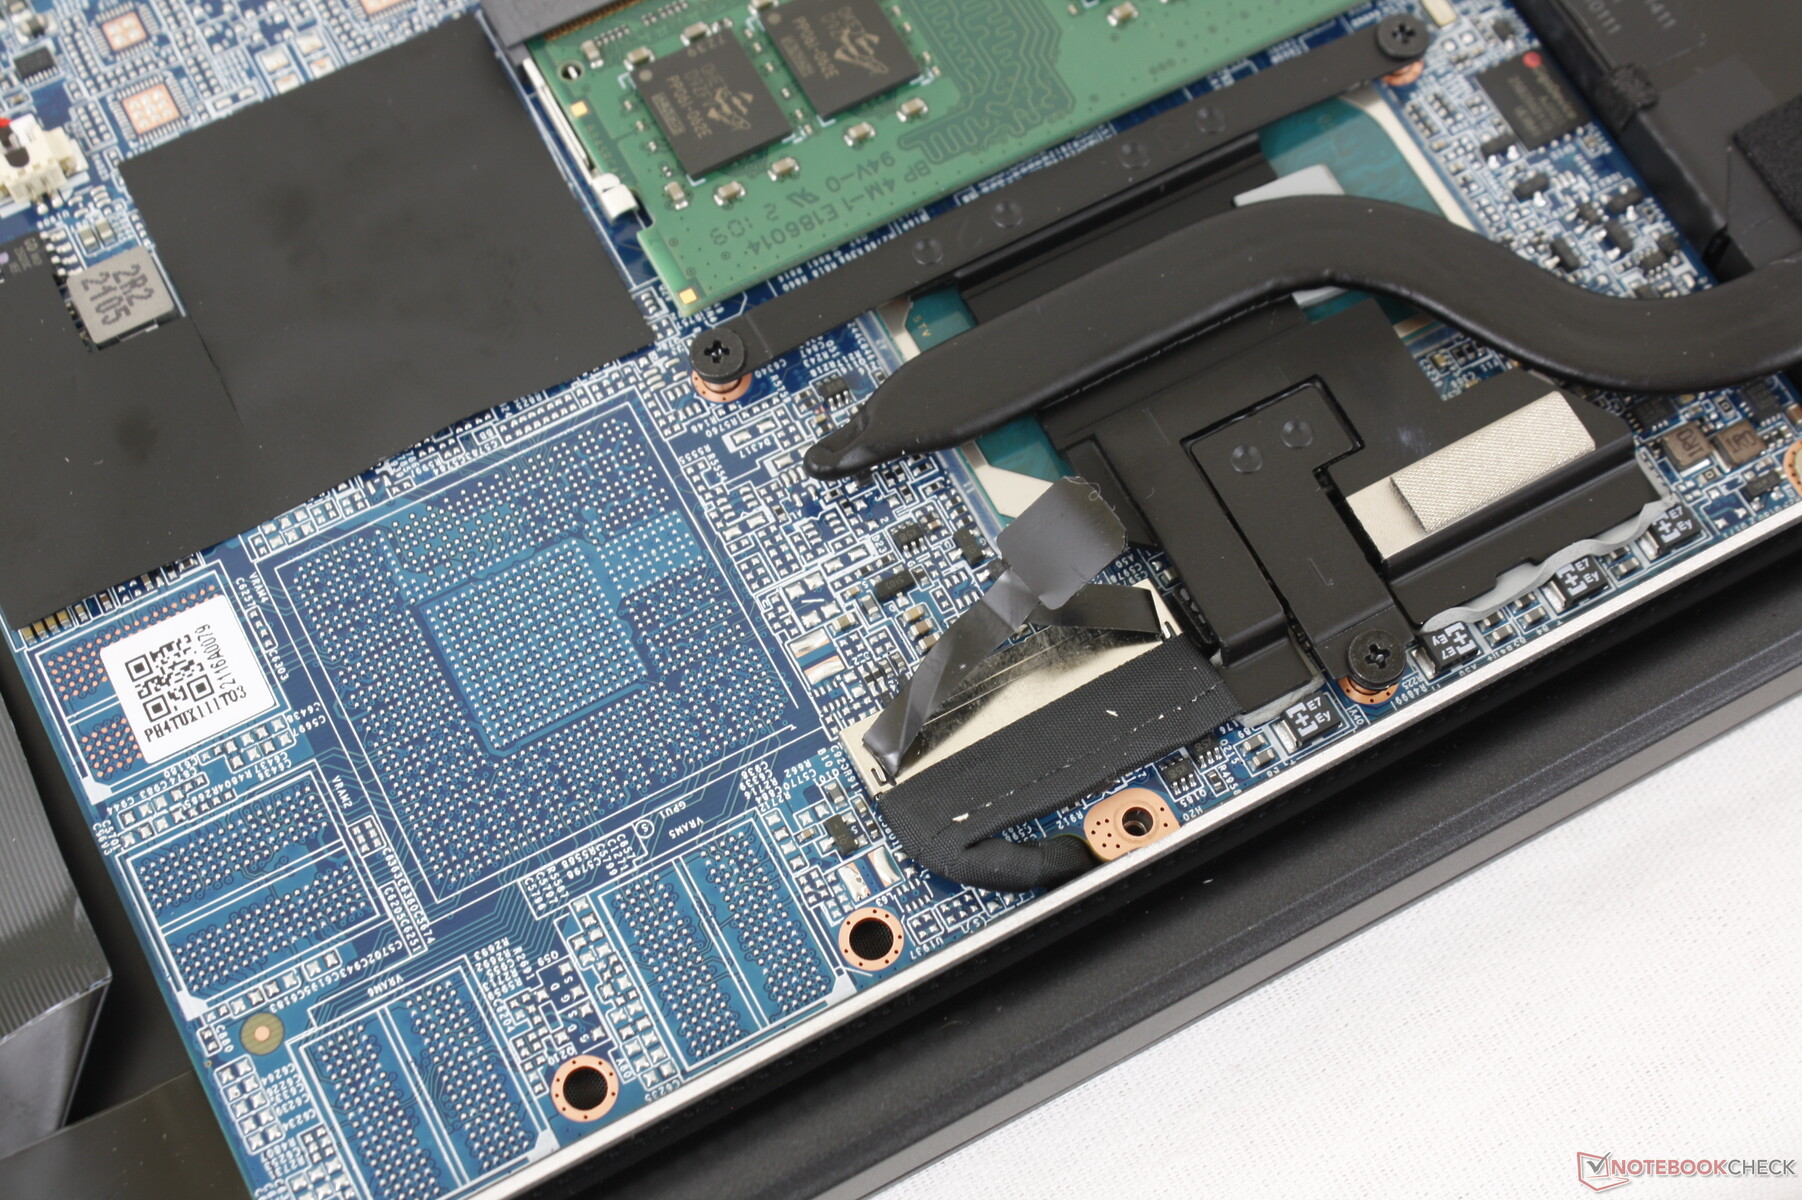
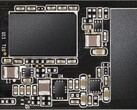
Maintenance
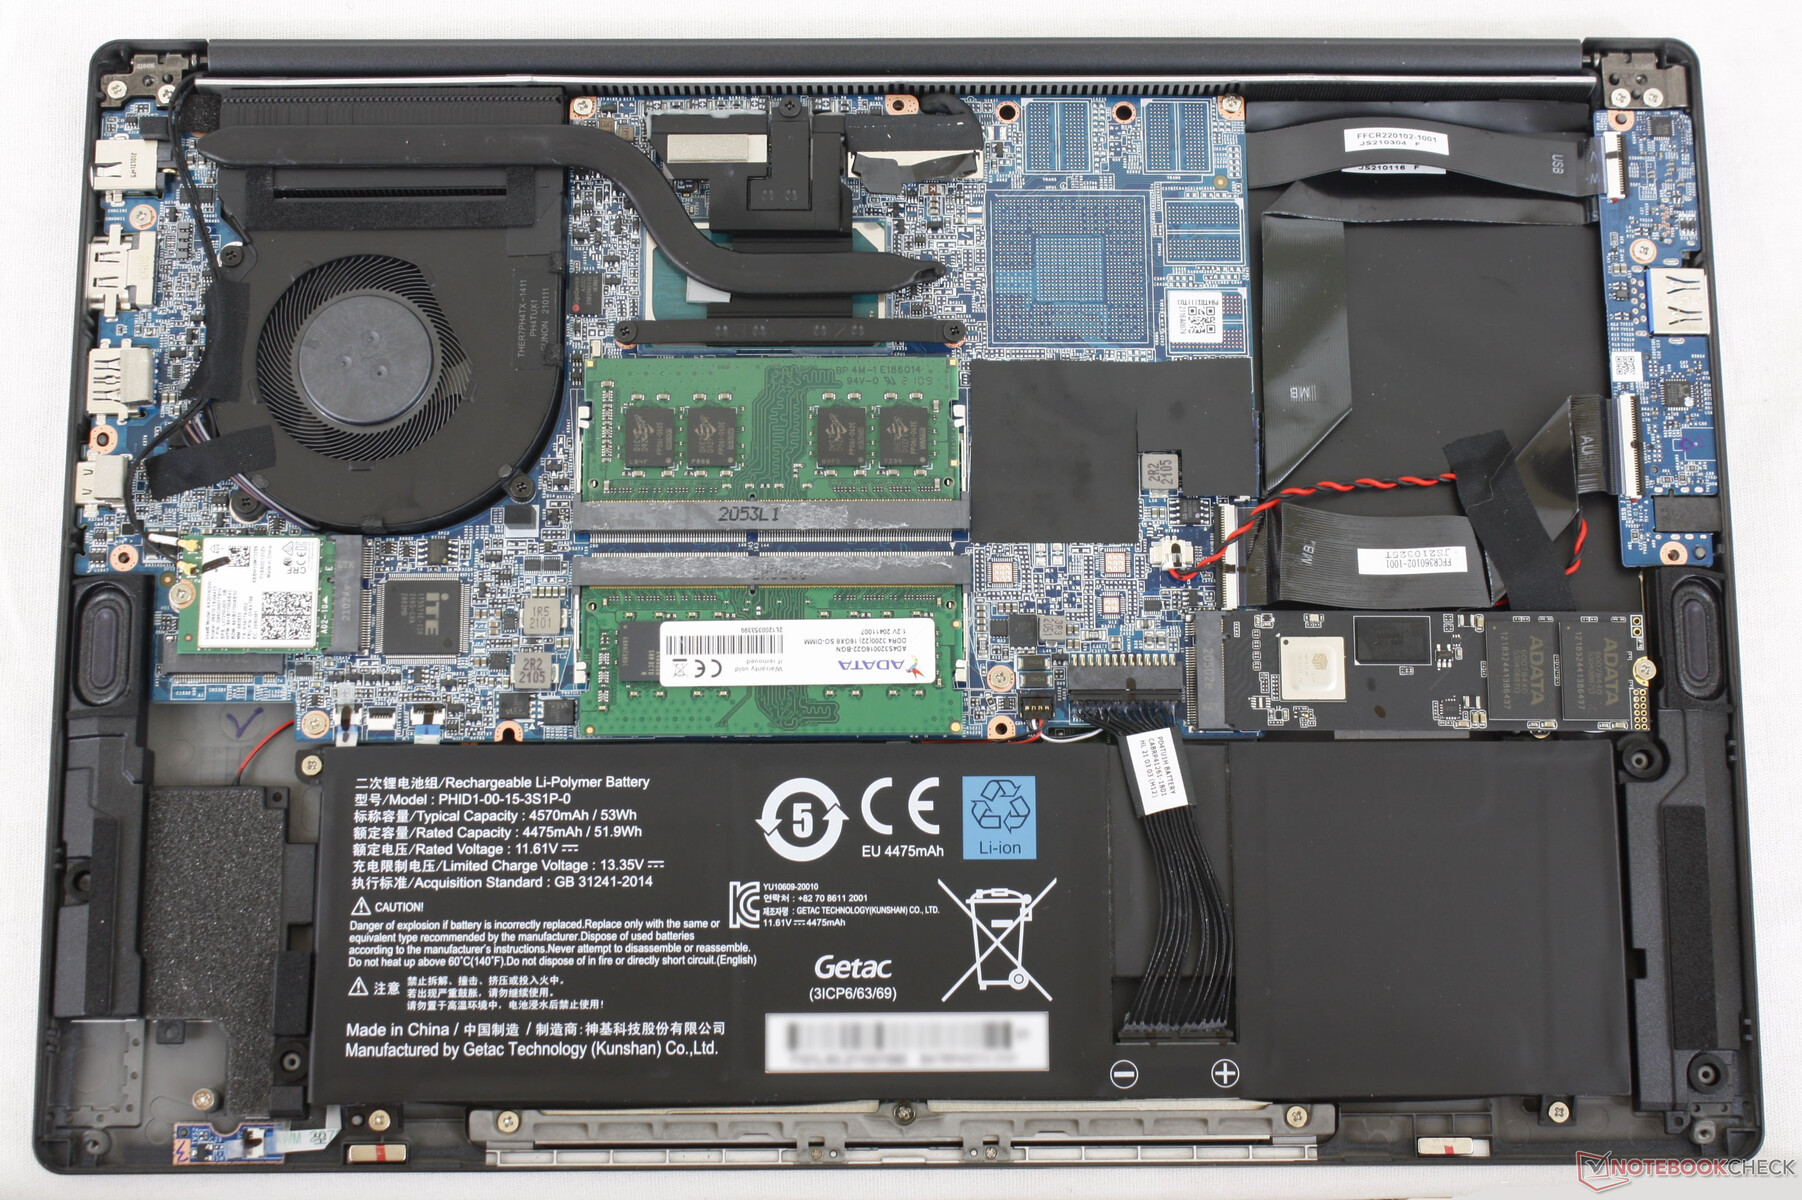
The bottom panel is easily removable with just a Philips screwdriver for simple RAM and storage upgrades. Note the empty spot on the motherboard for a potential discrete GPU and its VRAM modules and the empty M.2 2280 slot near the front corner for expansion.
Accessories and Warranty
A small sticker set of ADATA logos is included with the box. The standard one-year limited warranty applies.
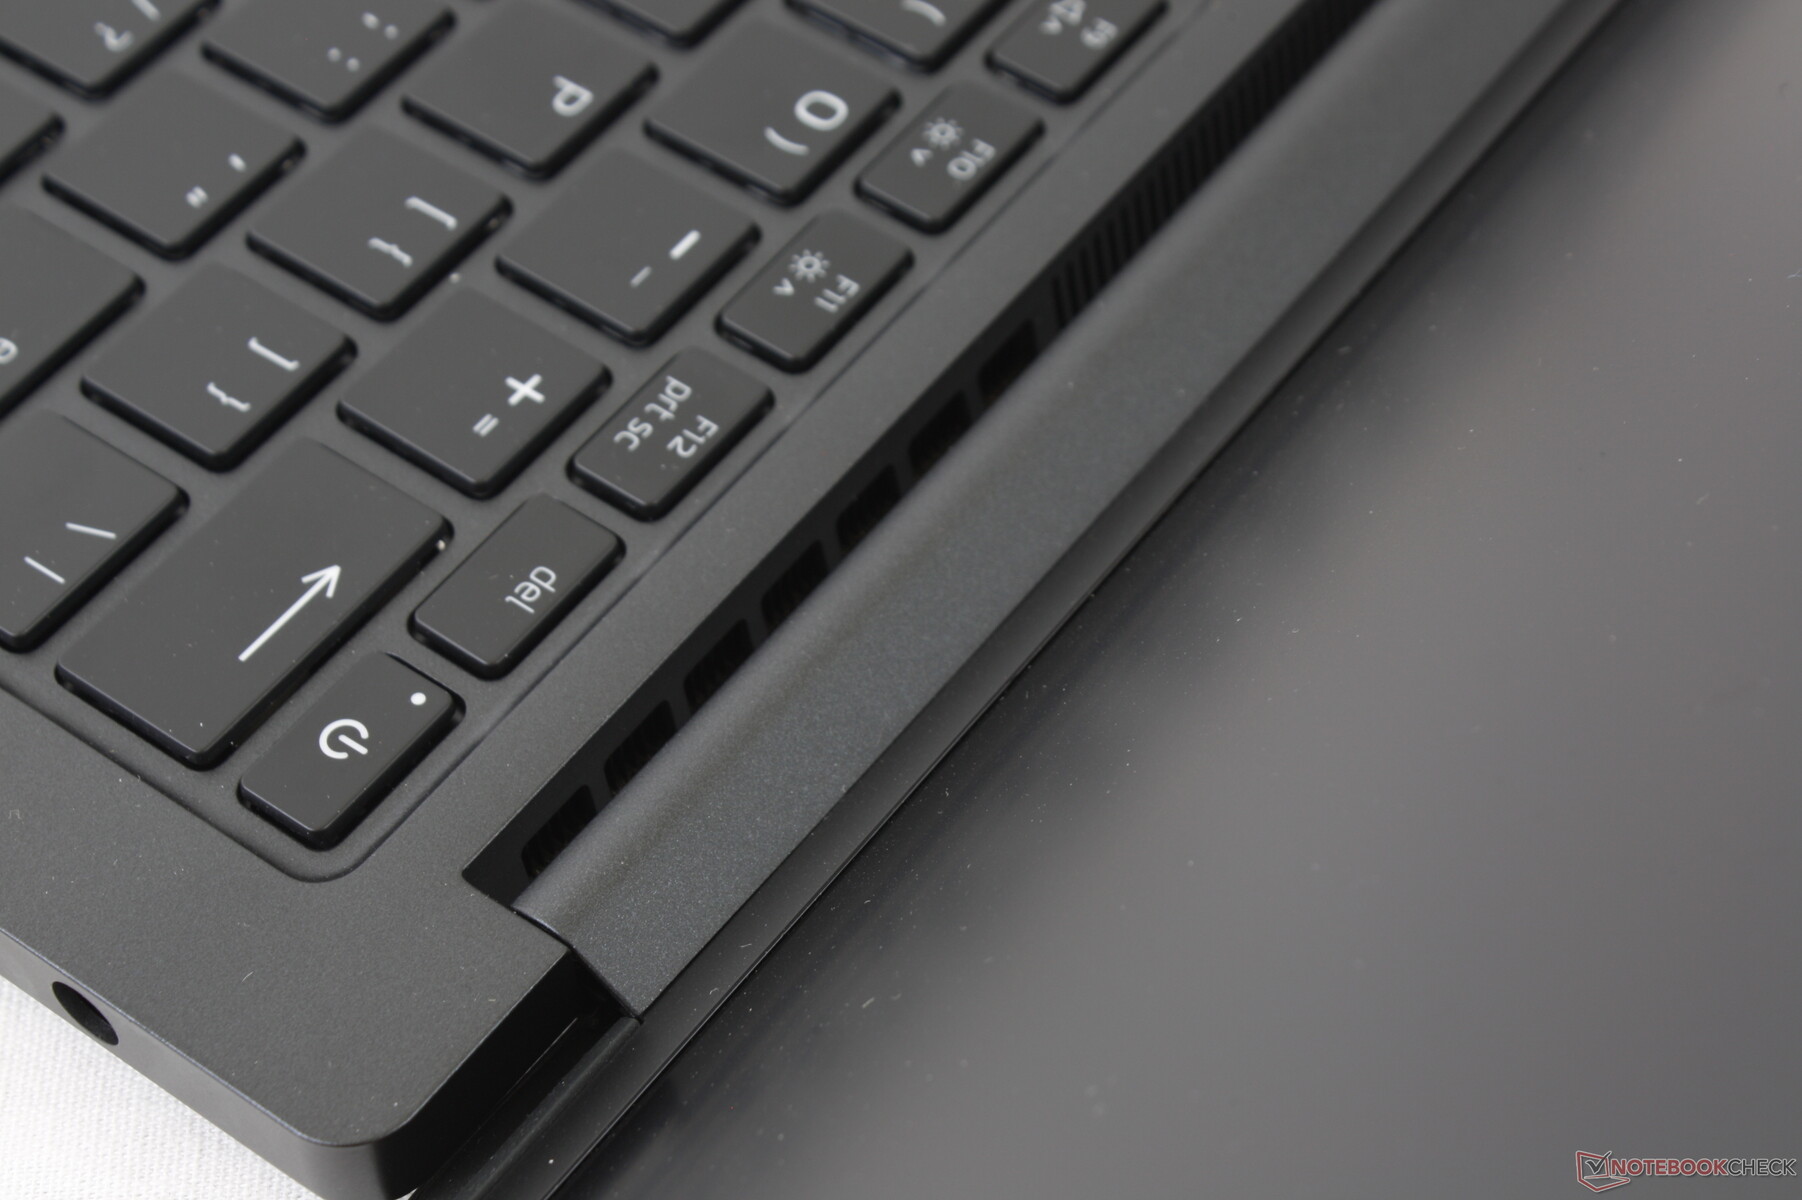
Input Devices — Could Be Firmer
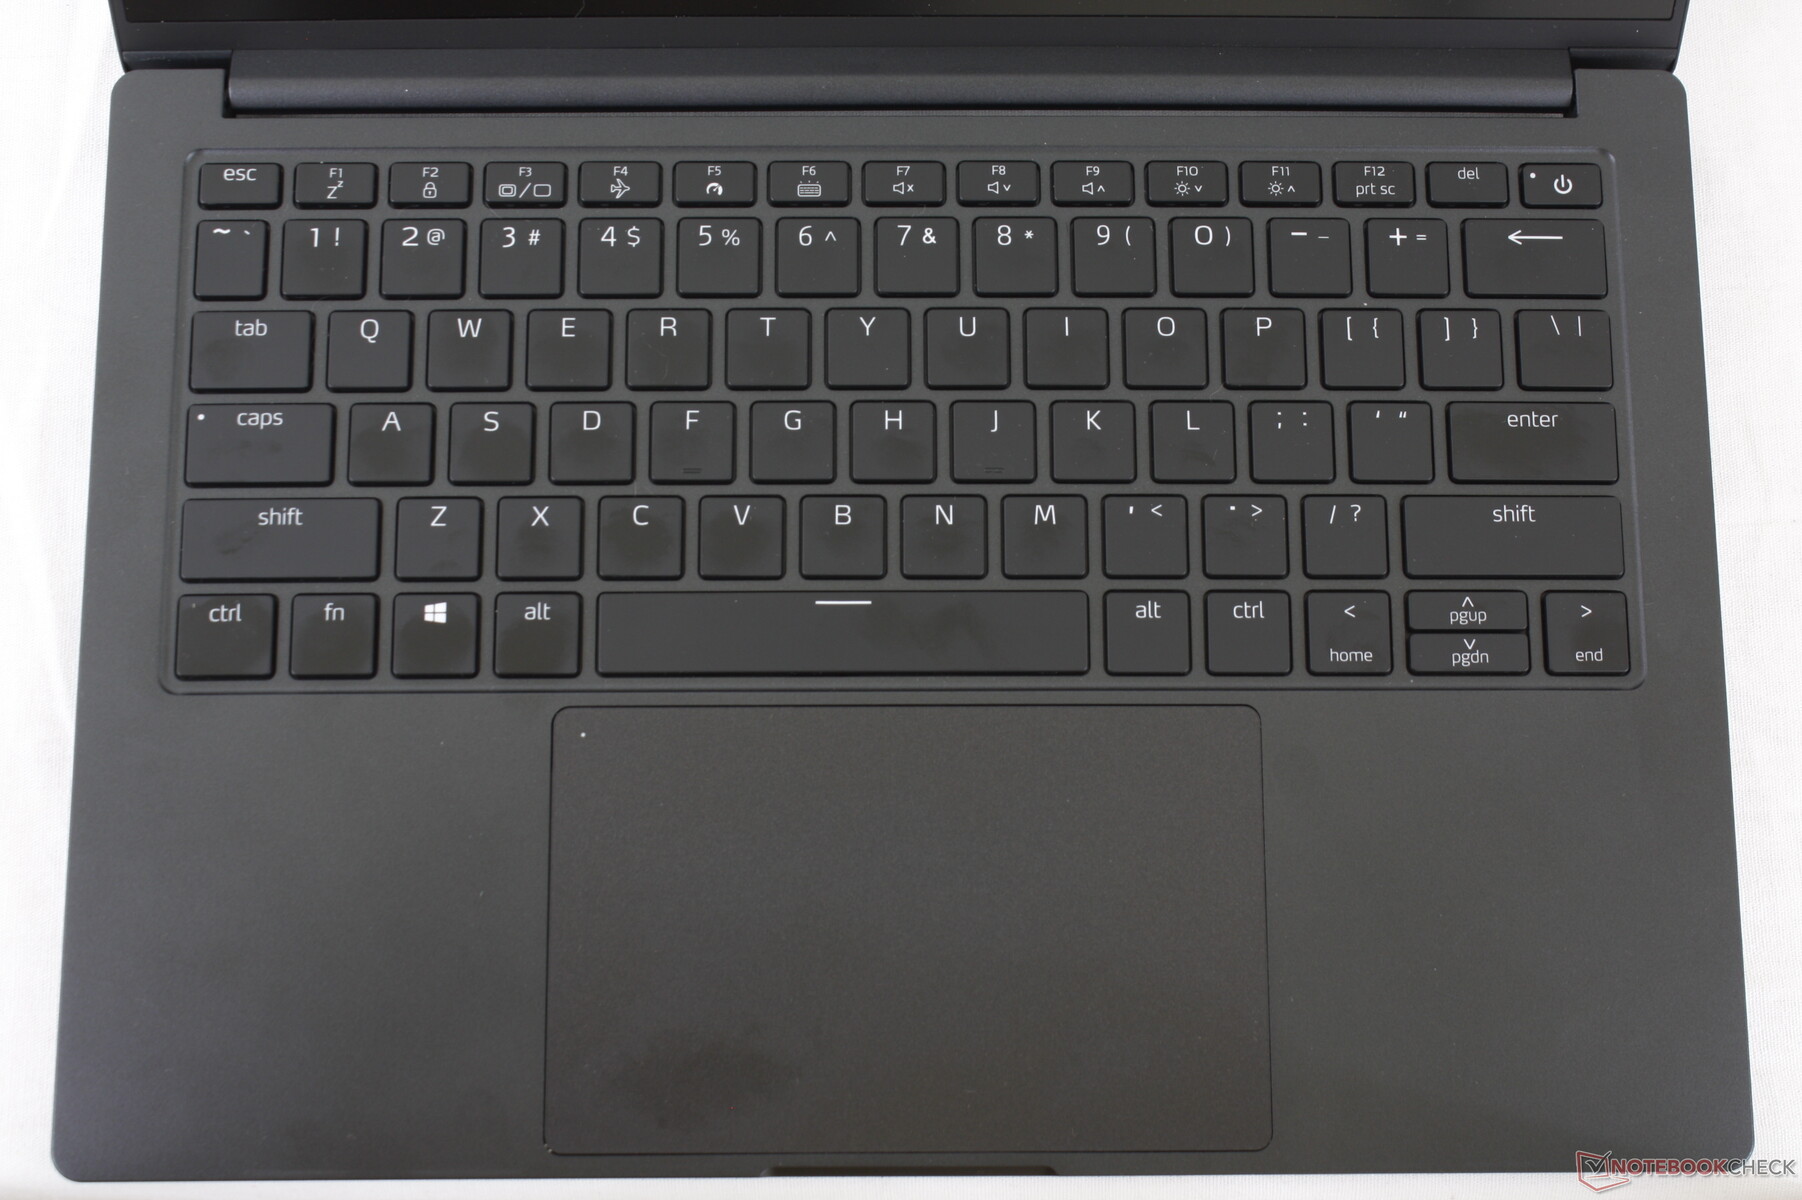
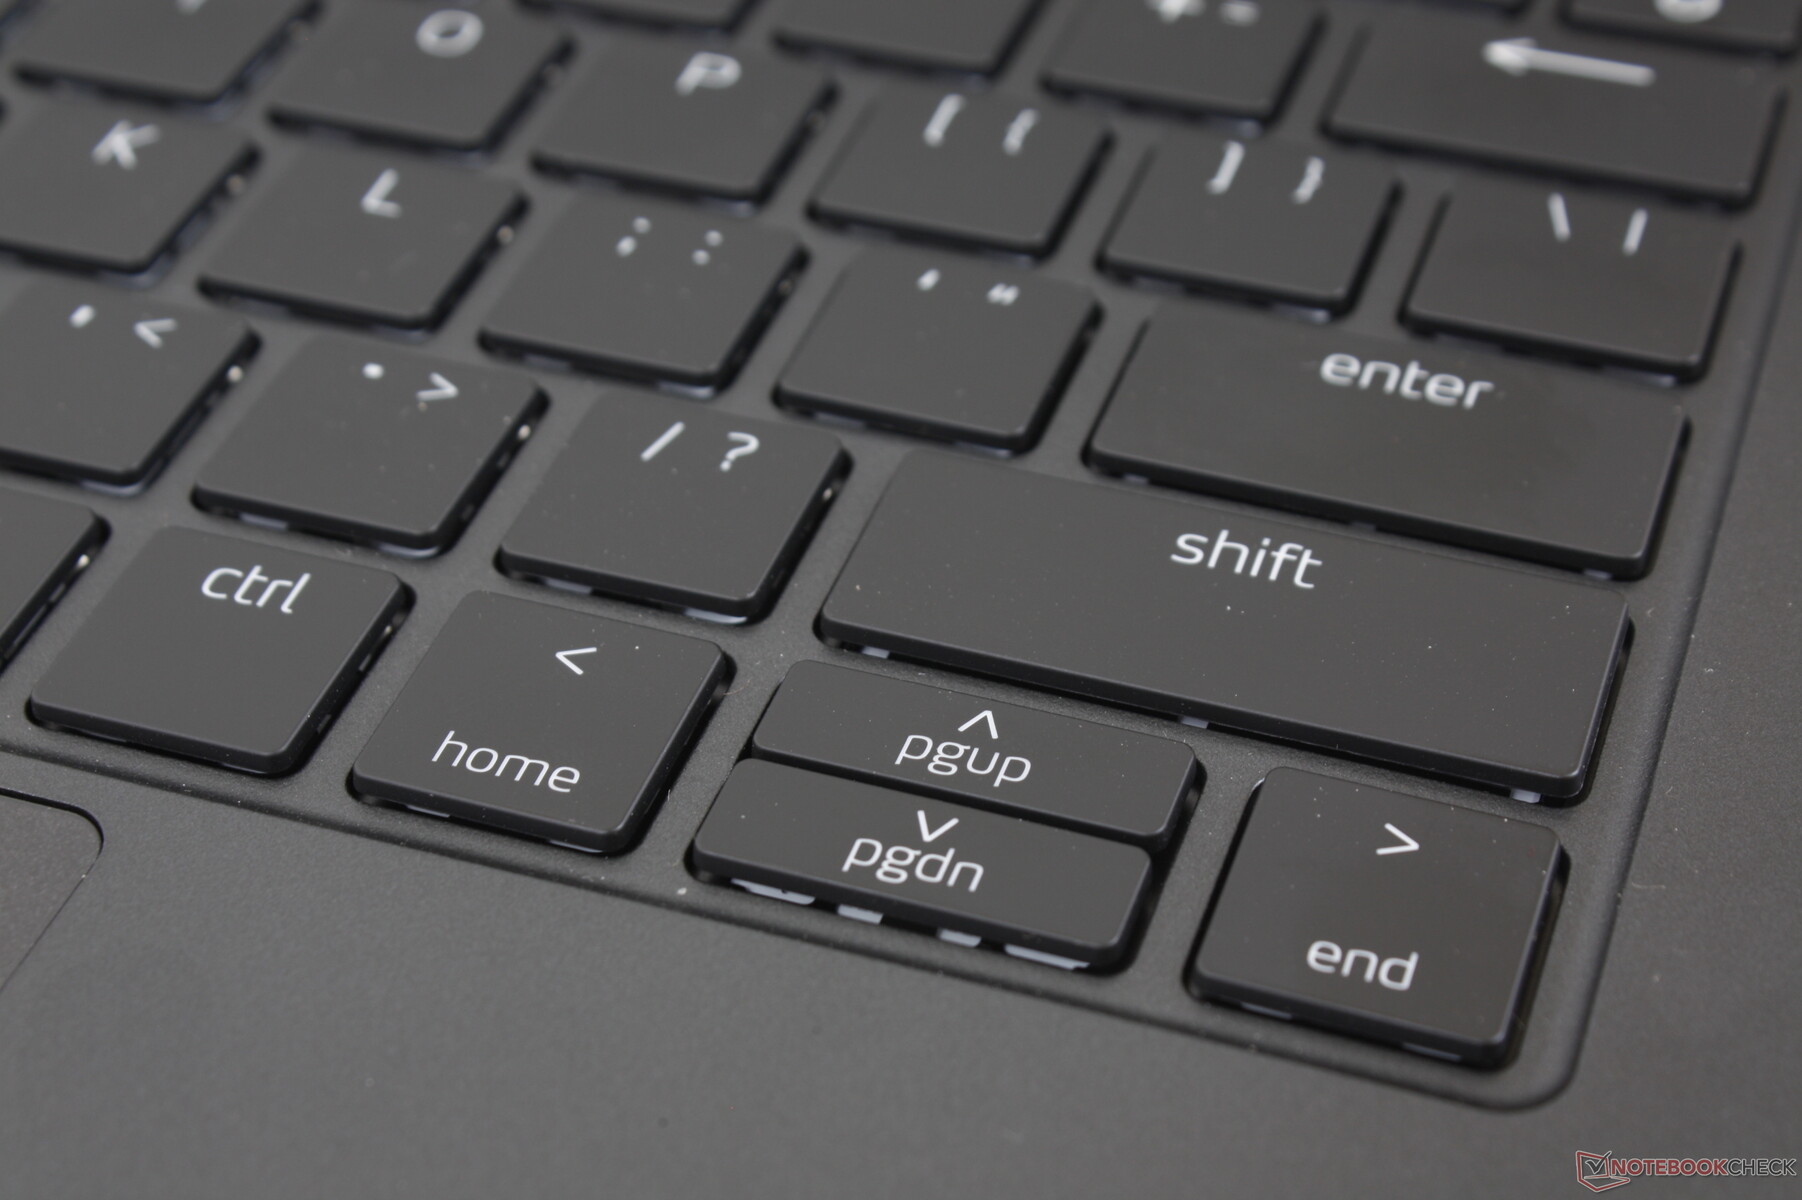
Keyboard
Key feedback is uniform but on the softer and shallower side when compared to the firmer keys of the HP Spectre or Lenovo ThinkPad.
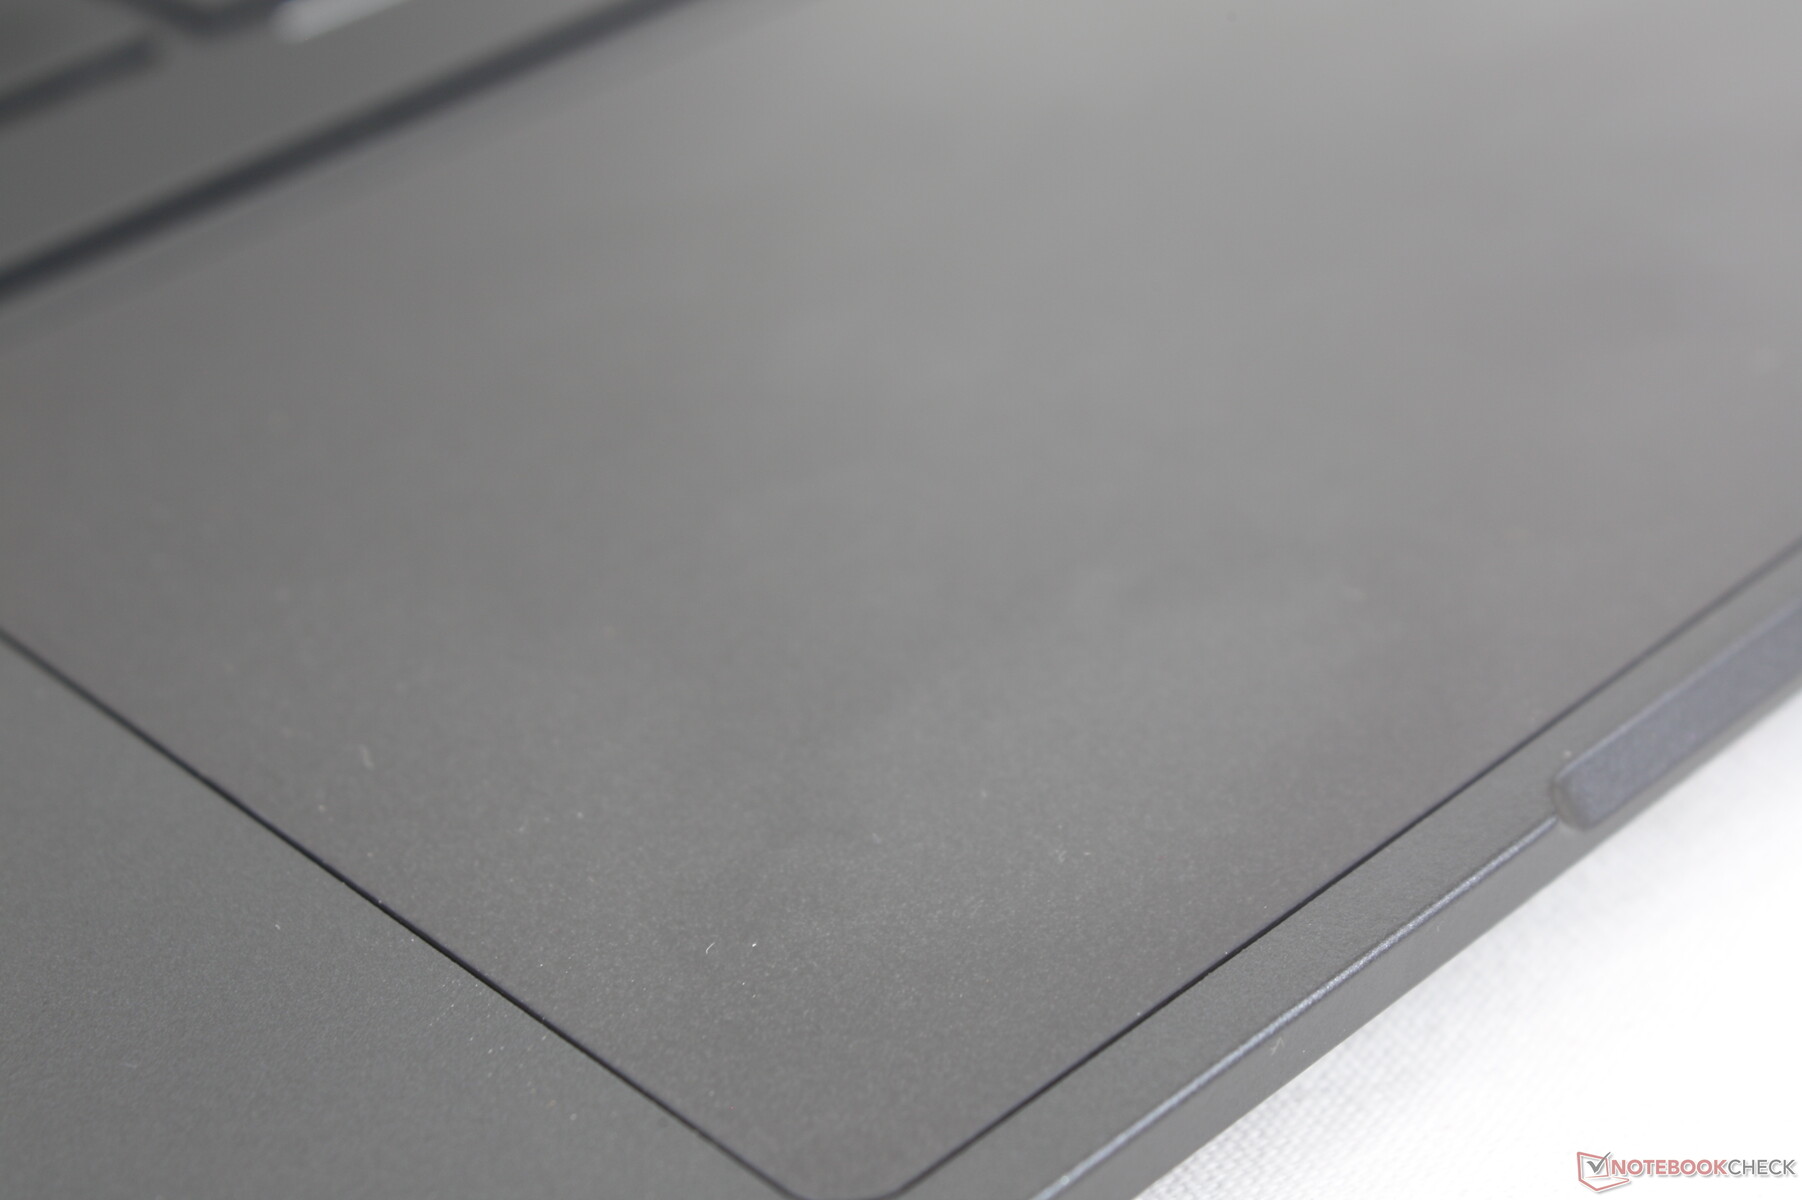
Touchpad
The glass clickpad is relatively large at 13.2 x 8.2 cm. There is very little sticking even when moving at slower speeds. Unfortunately, feedback when clicking on its surface is unsatisfyingly shallow and weak.

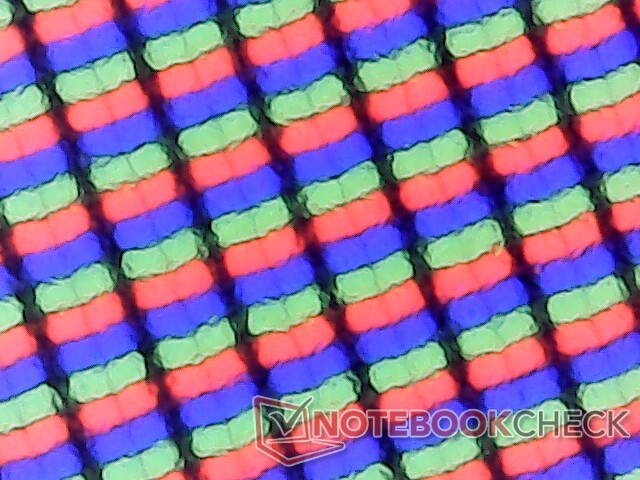
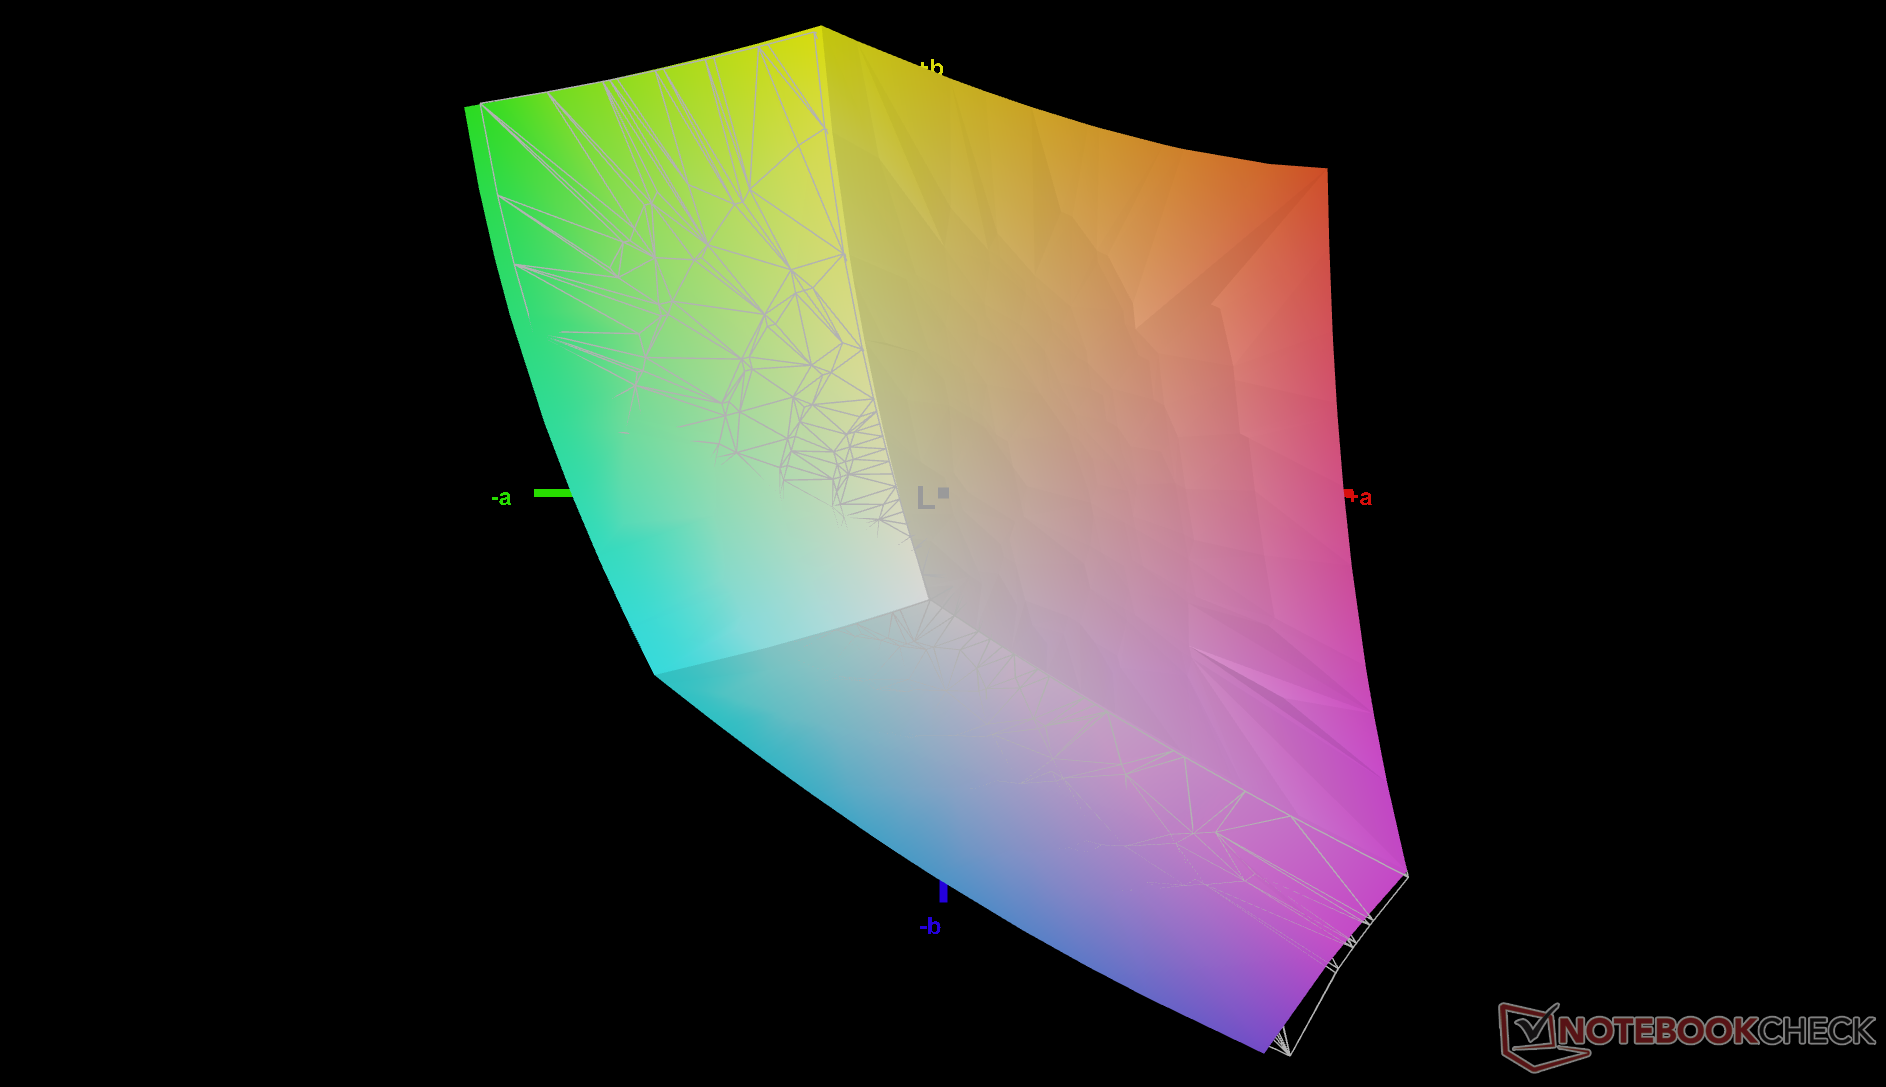
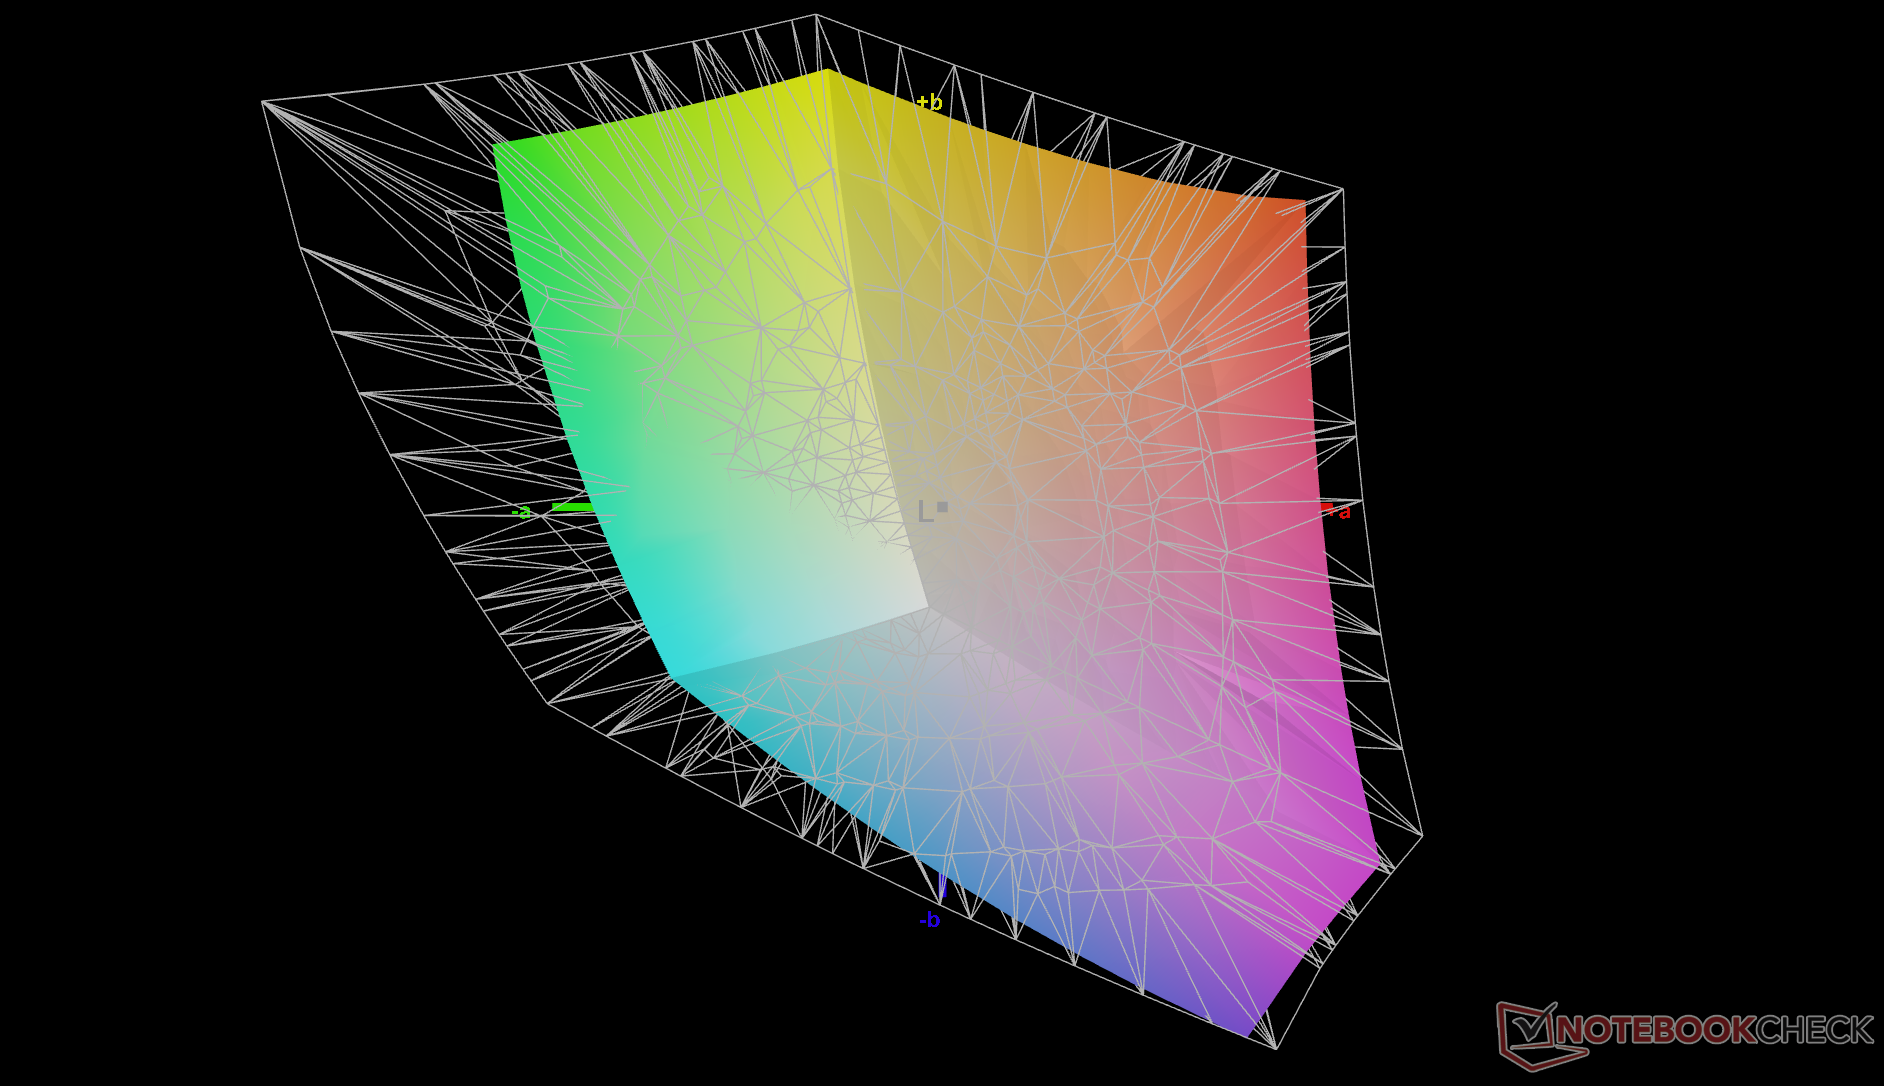
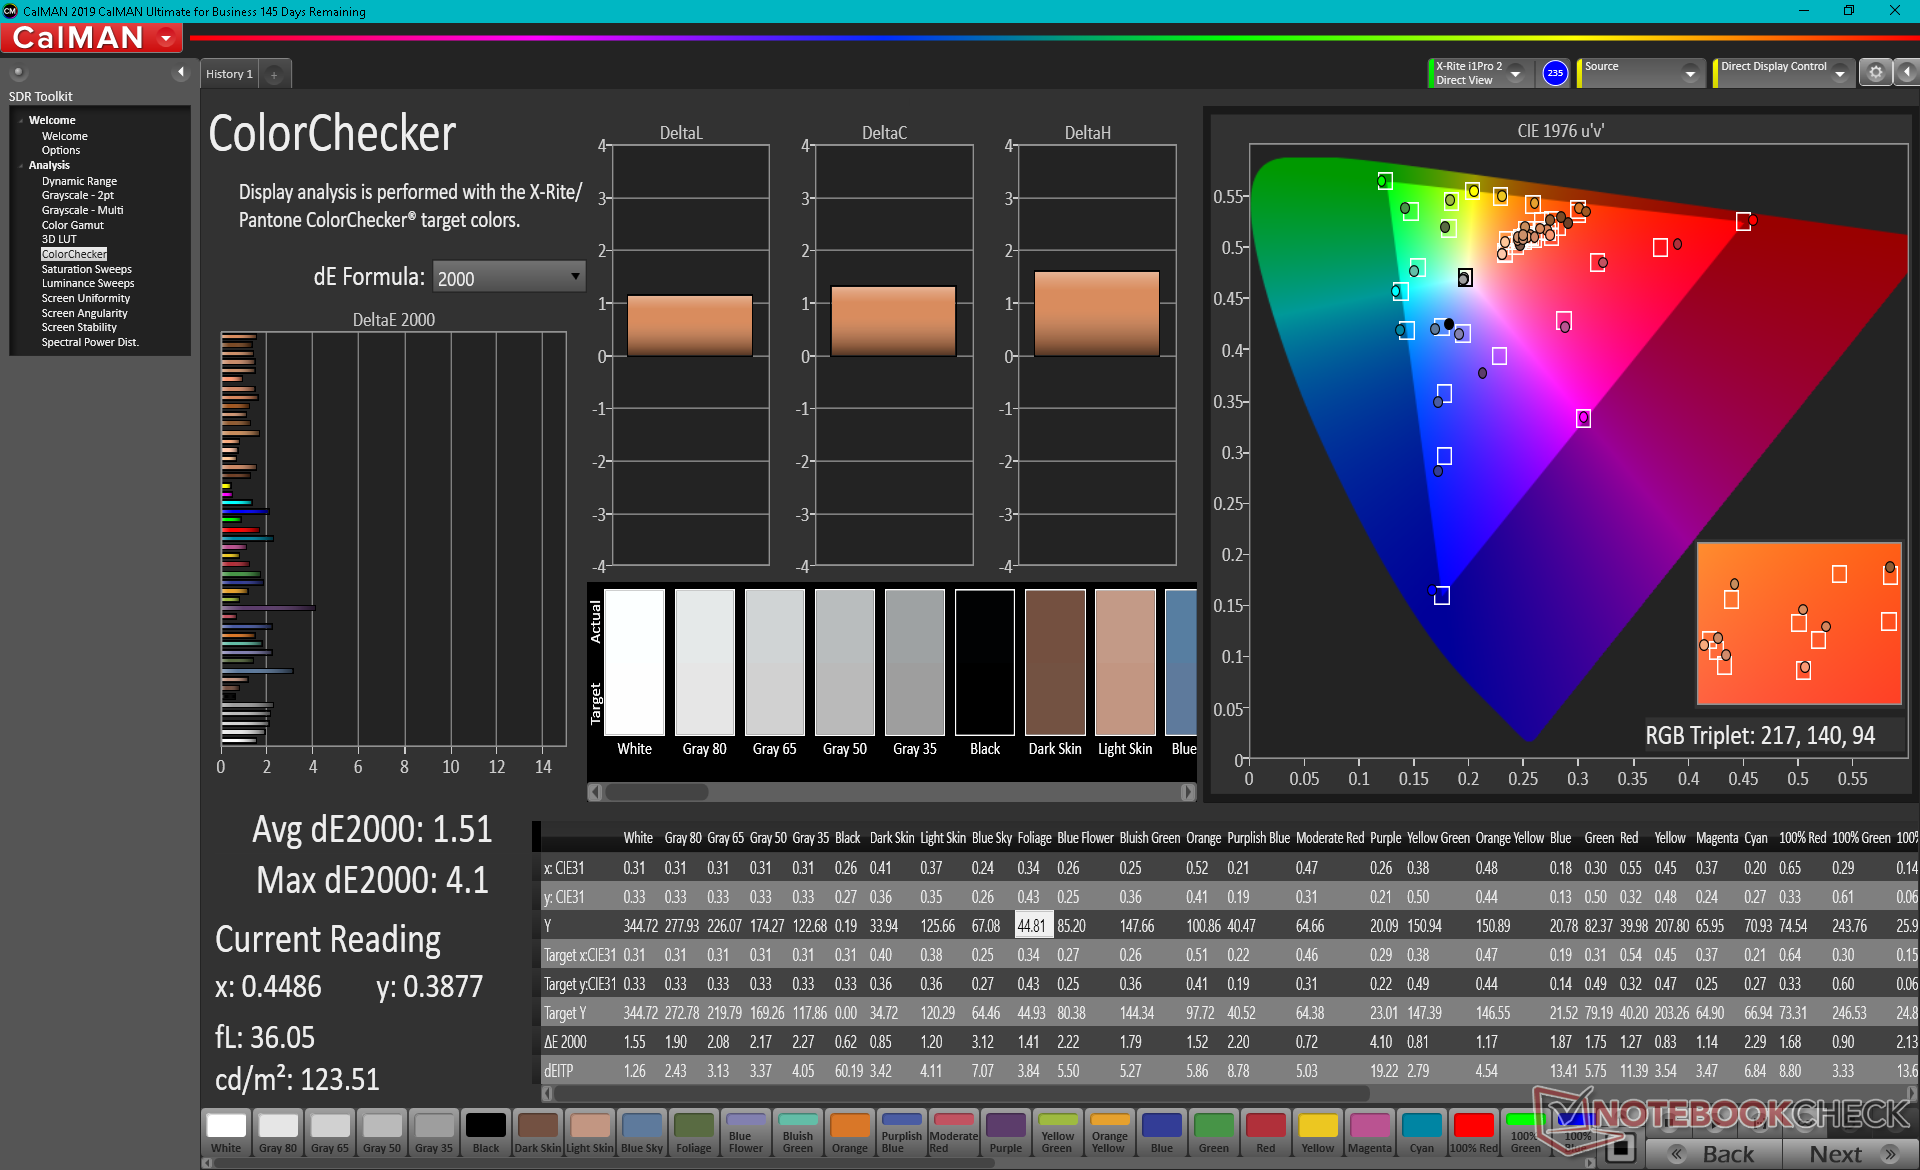
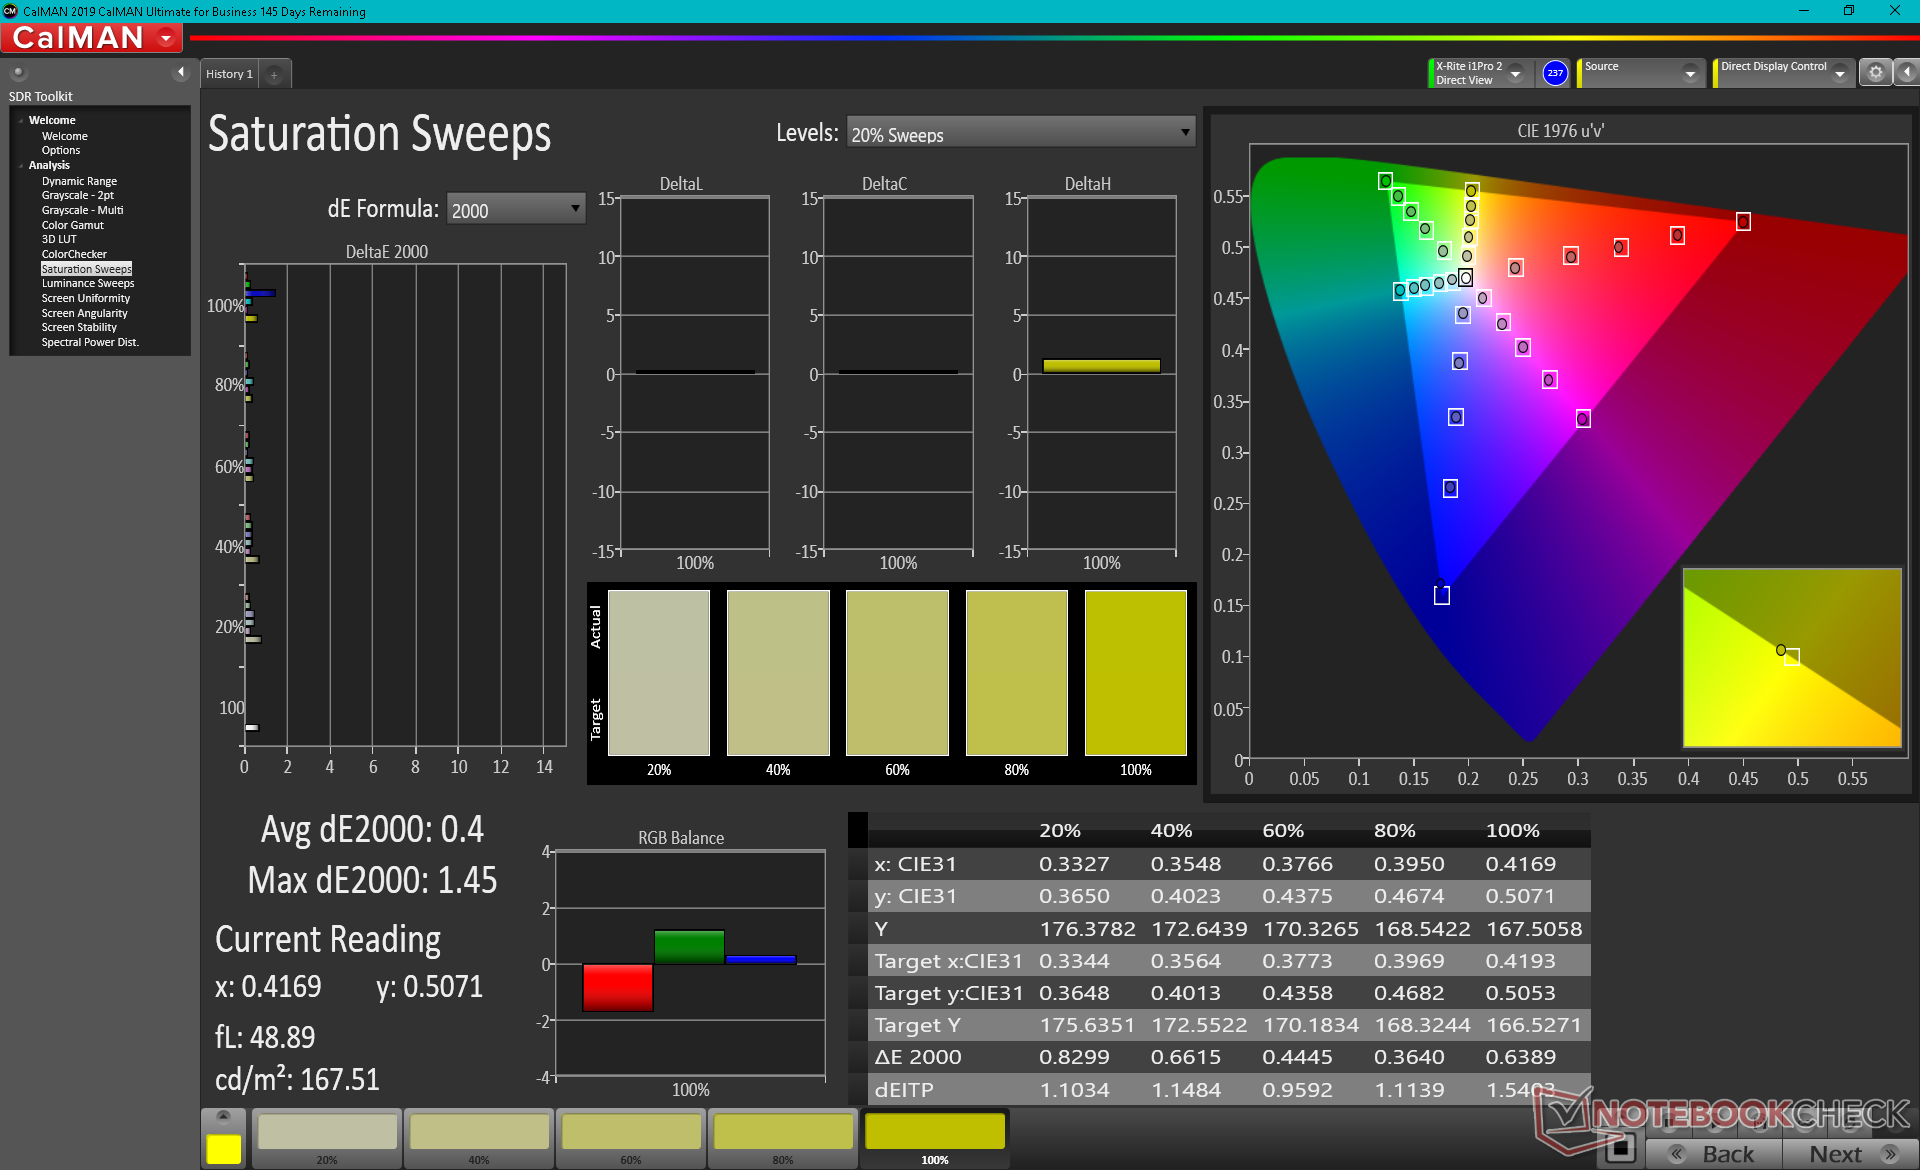
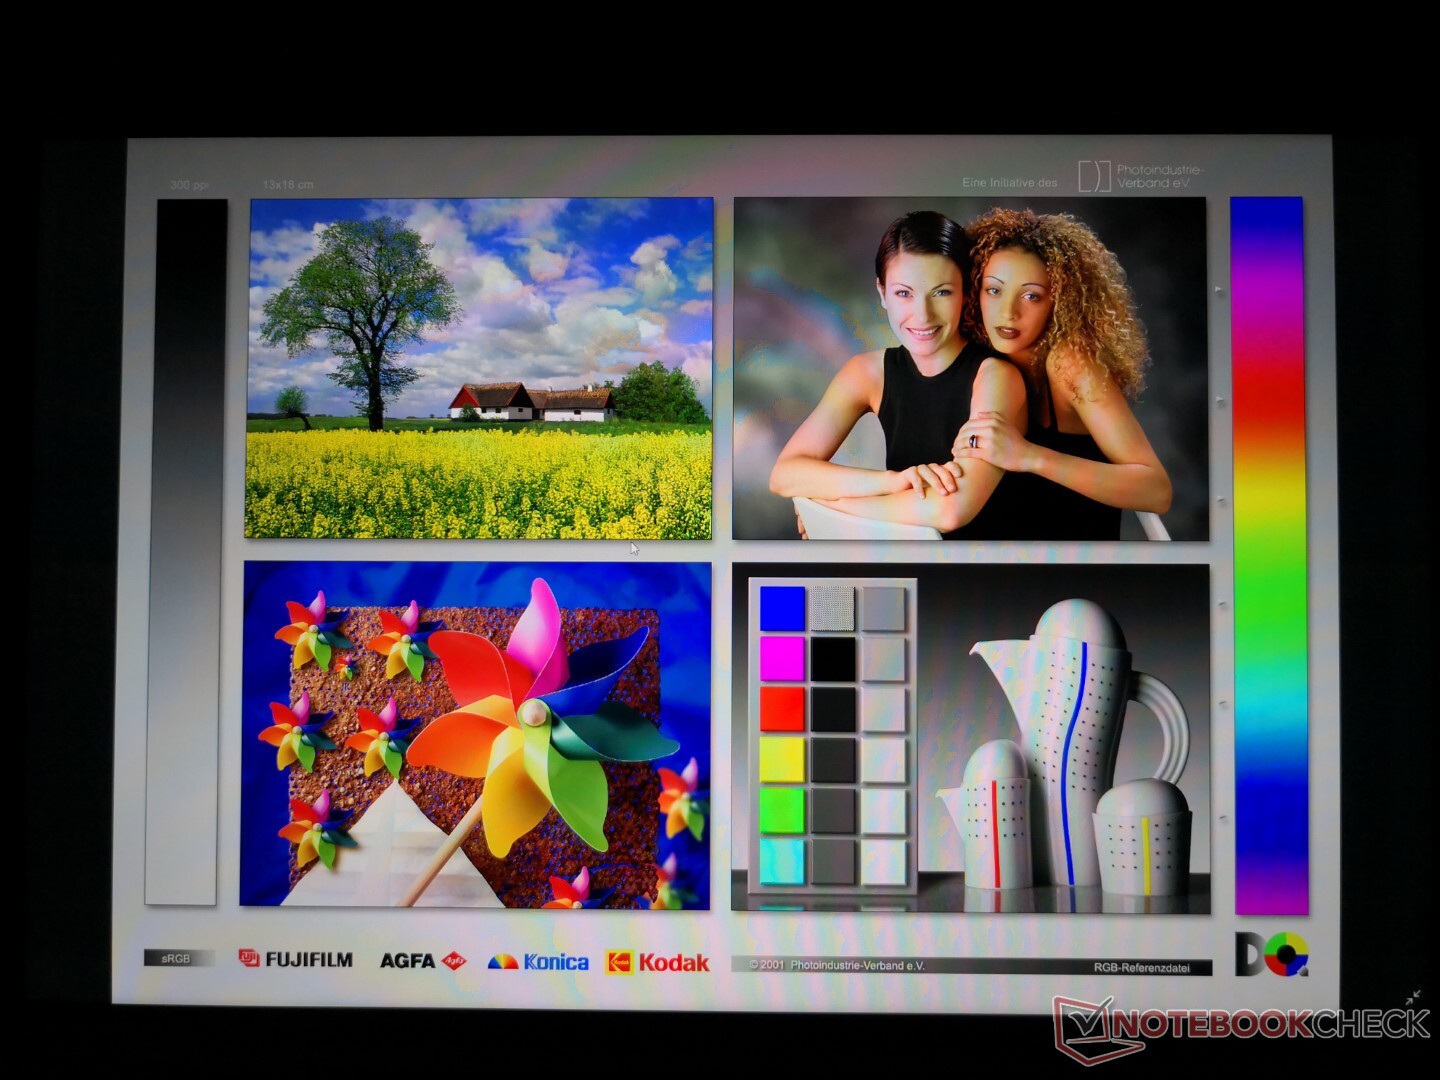
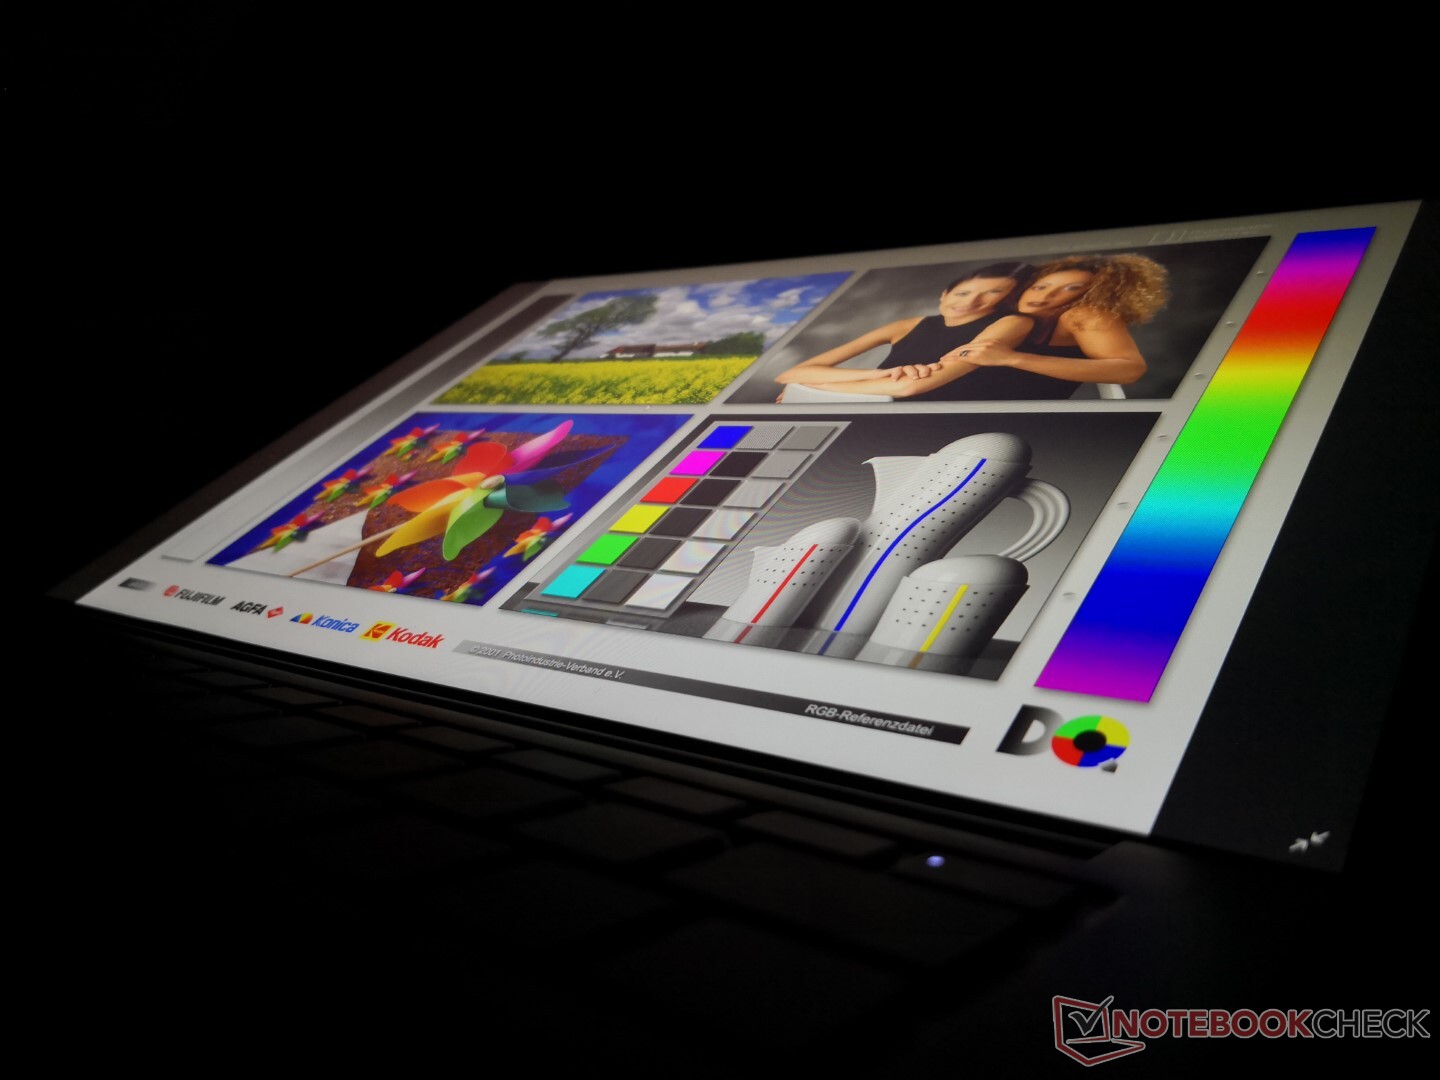
Display — Very Well Calibrated
The BOE NE140WUM IPS panel on the Xenia 14 is the first to appear on our database. Its attributes are representative of a high-end panel including its high contrast ratio and wide gamut with brightness levels that are typical of other upper mid-range Ultrabooks. Its biggest drawback is perhaps the slow black-white and gray-gray response times which make the internal display unfit for many games.
| |||||||||||||||||||||||||
Brightness Distribution: 89 %
Center on Battery: 344.6 cd/m²
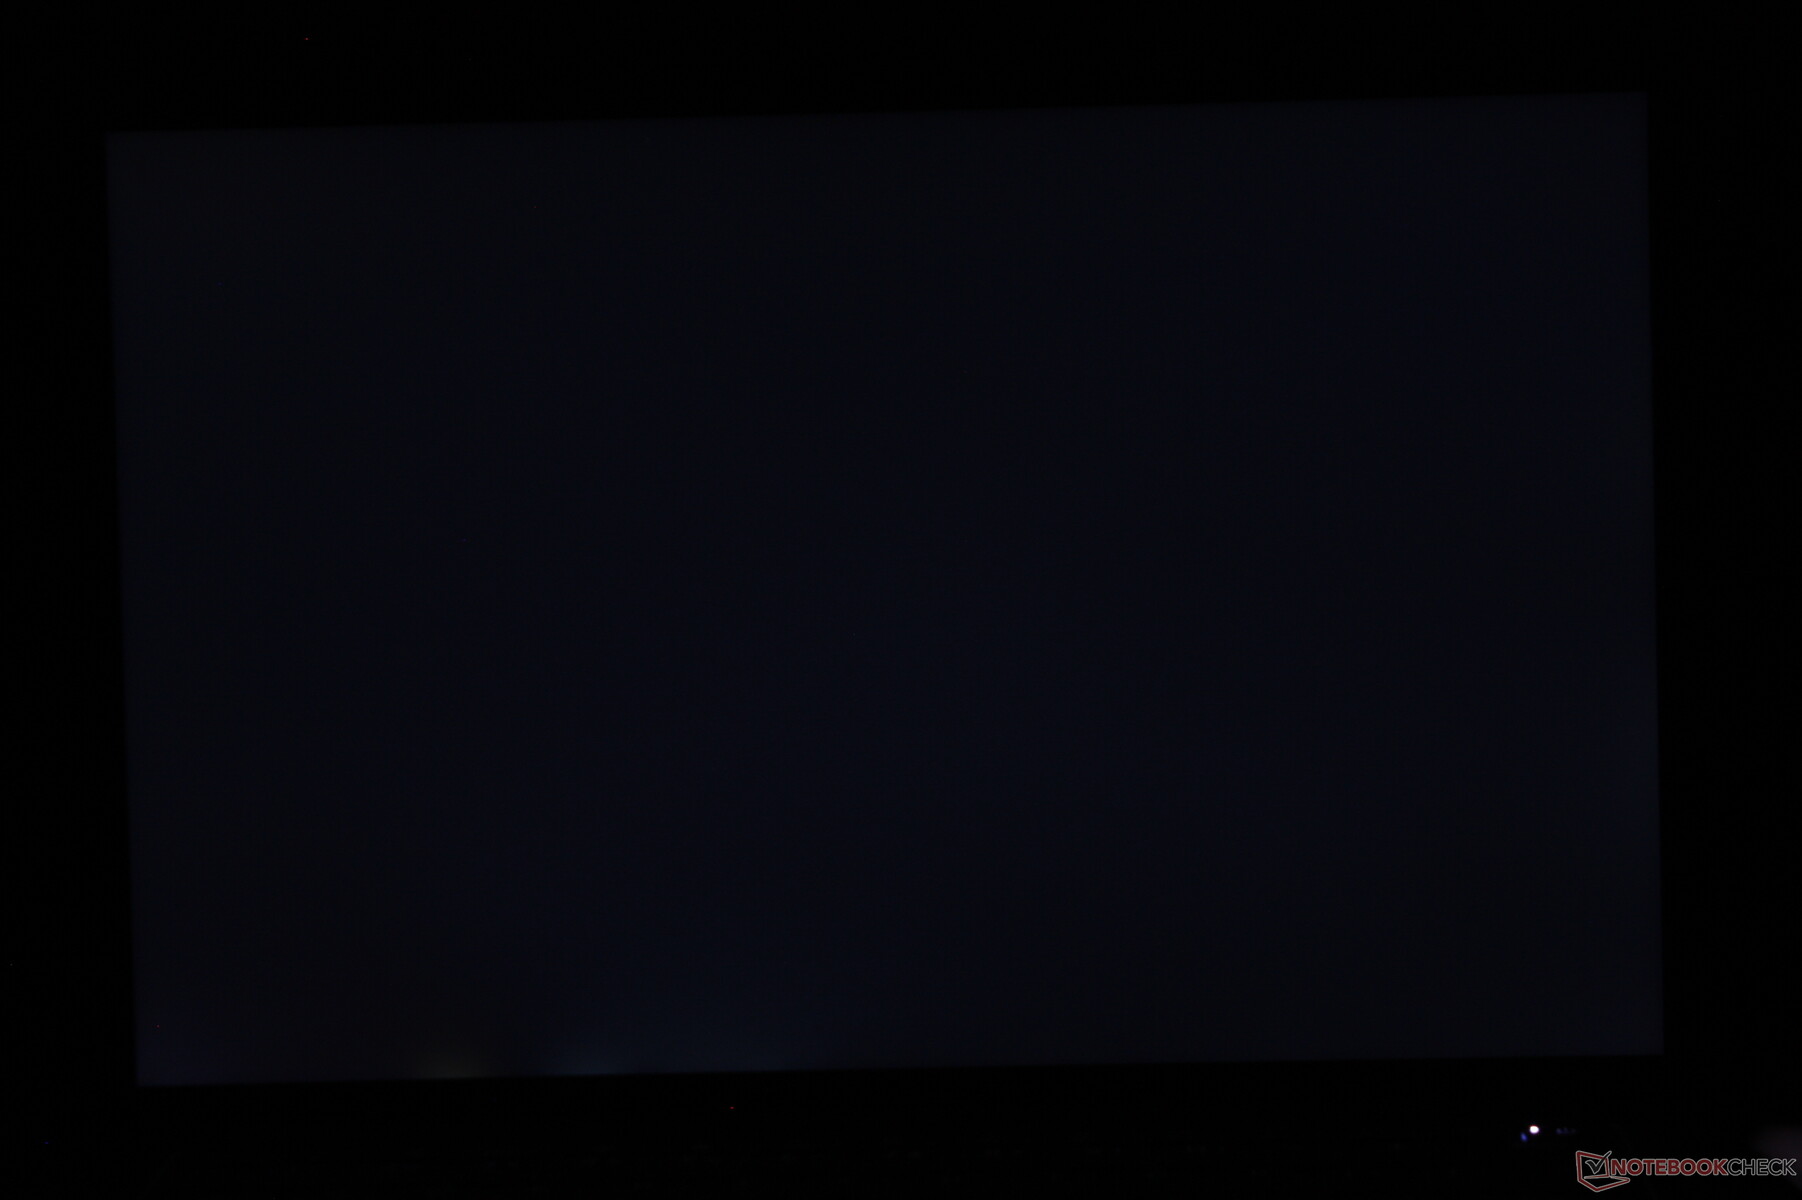
Contrast: 1566:1 (Black: 0.22 cd/m²)
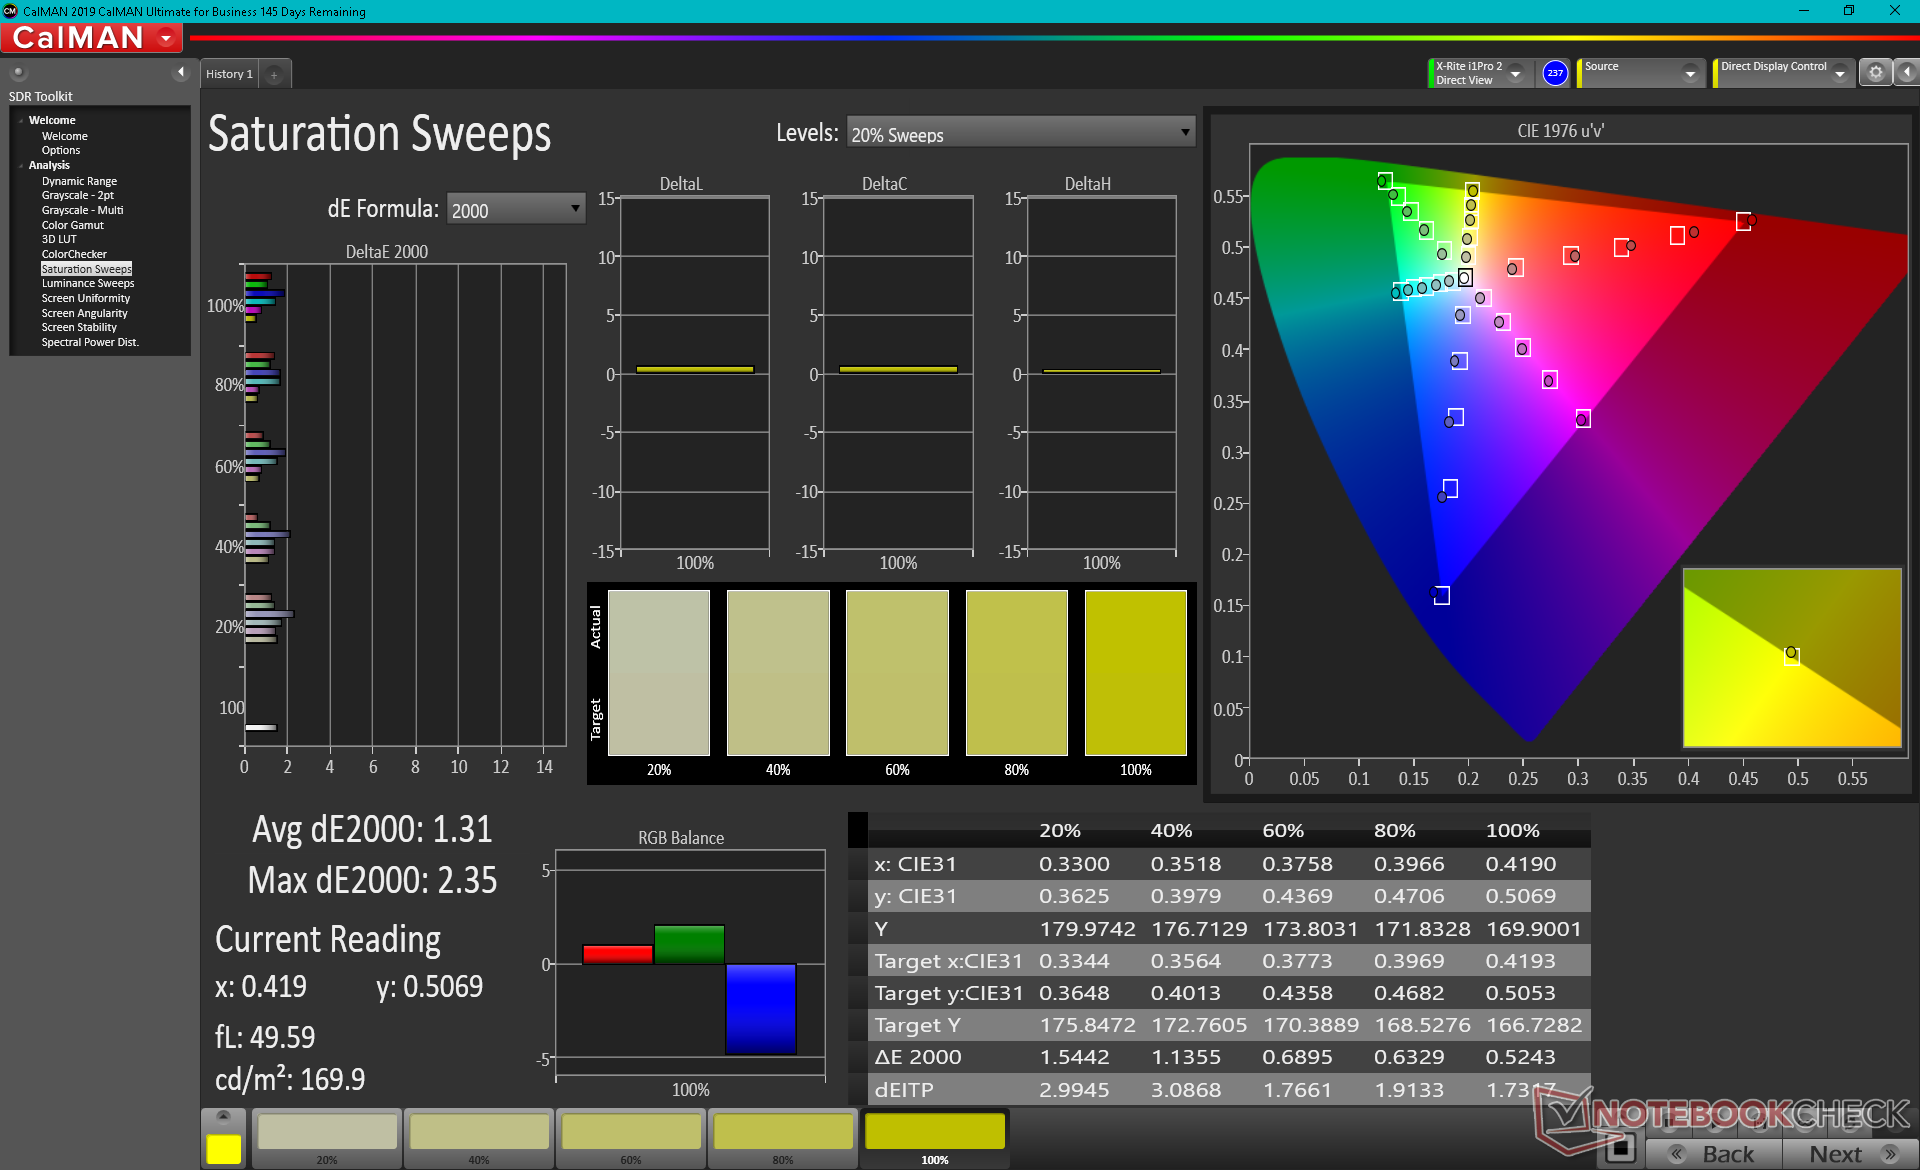
ΔE ColorChecker Calman: 1.51 | ∀{0.5-29.43 Ø4.82}
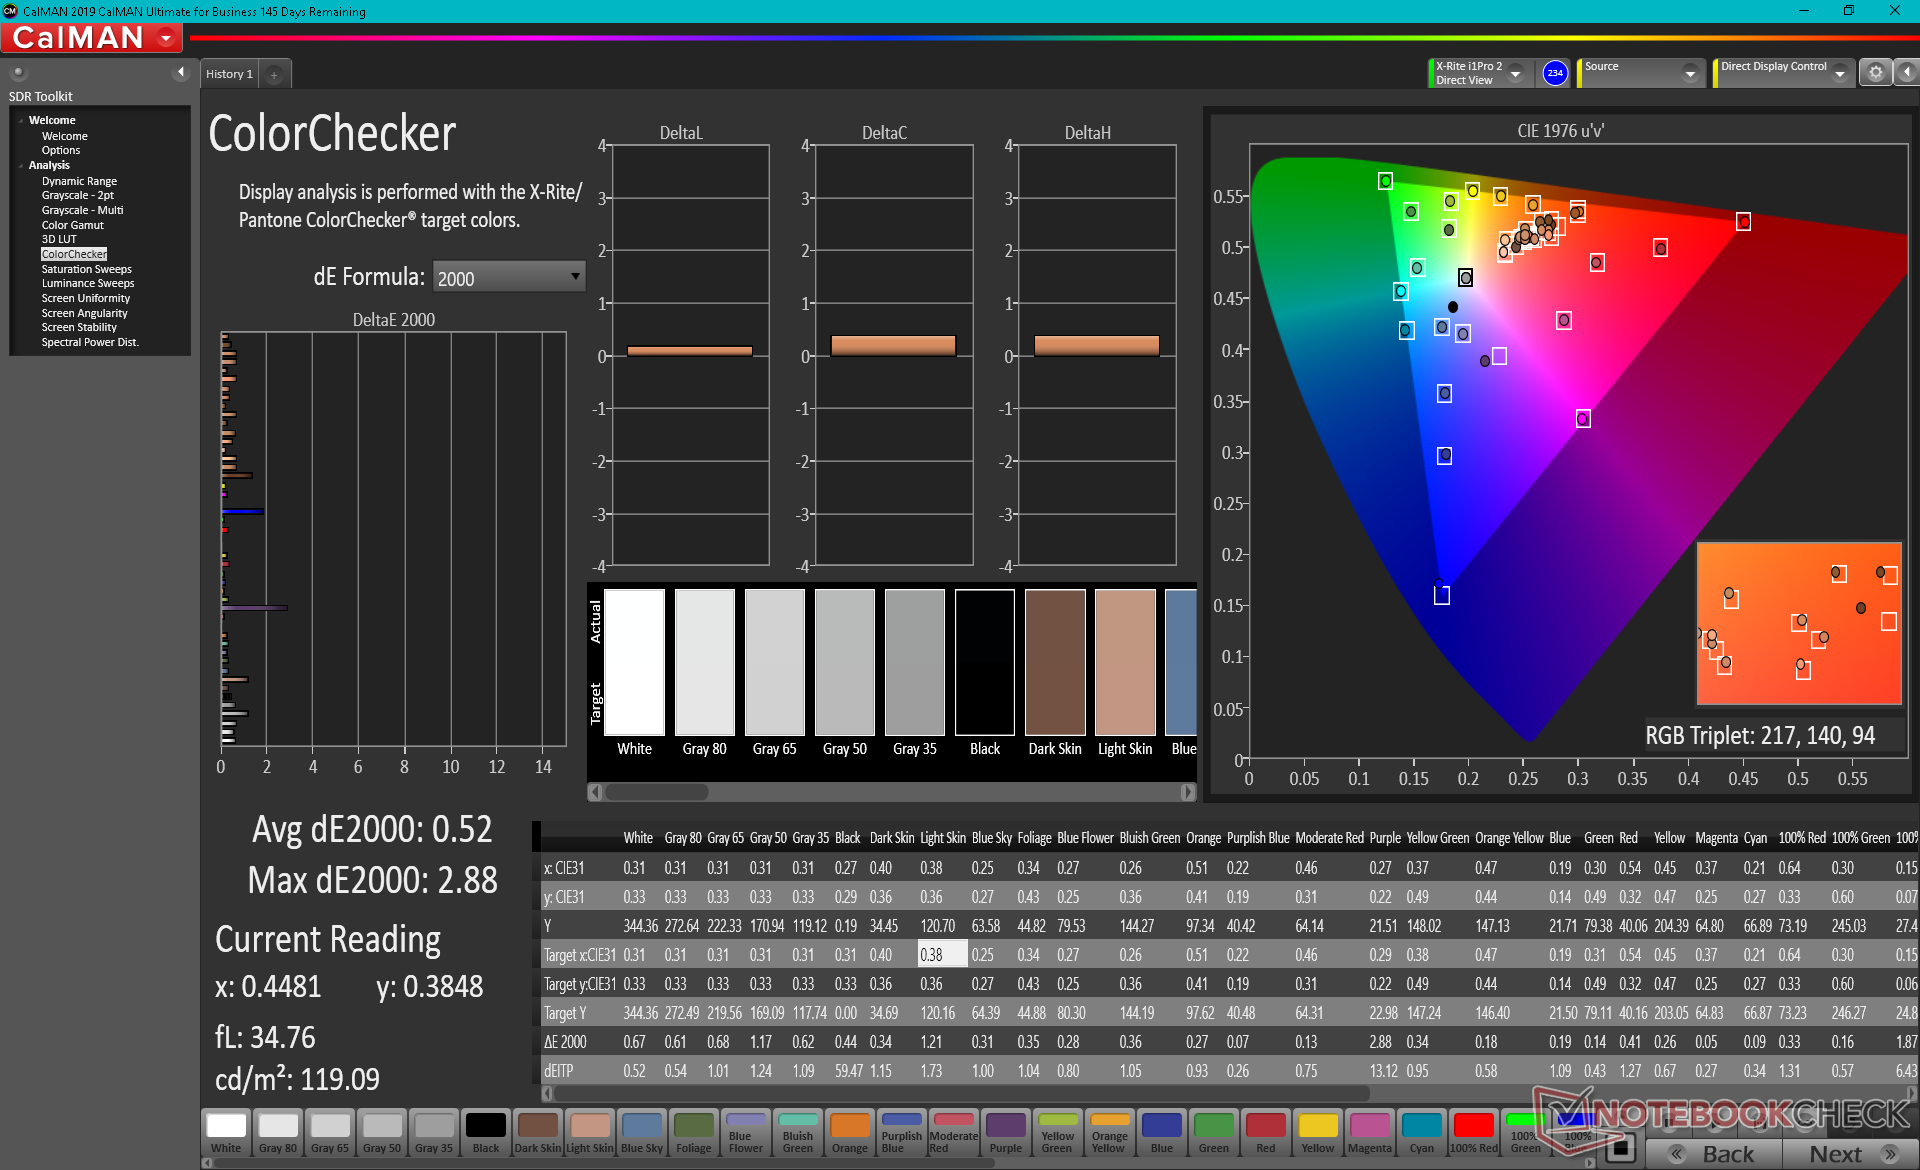
calibrated: 0.52
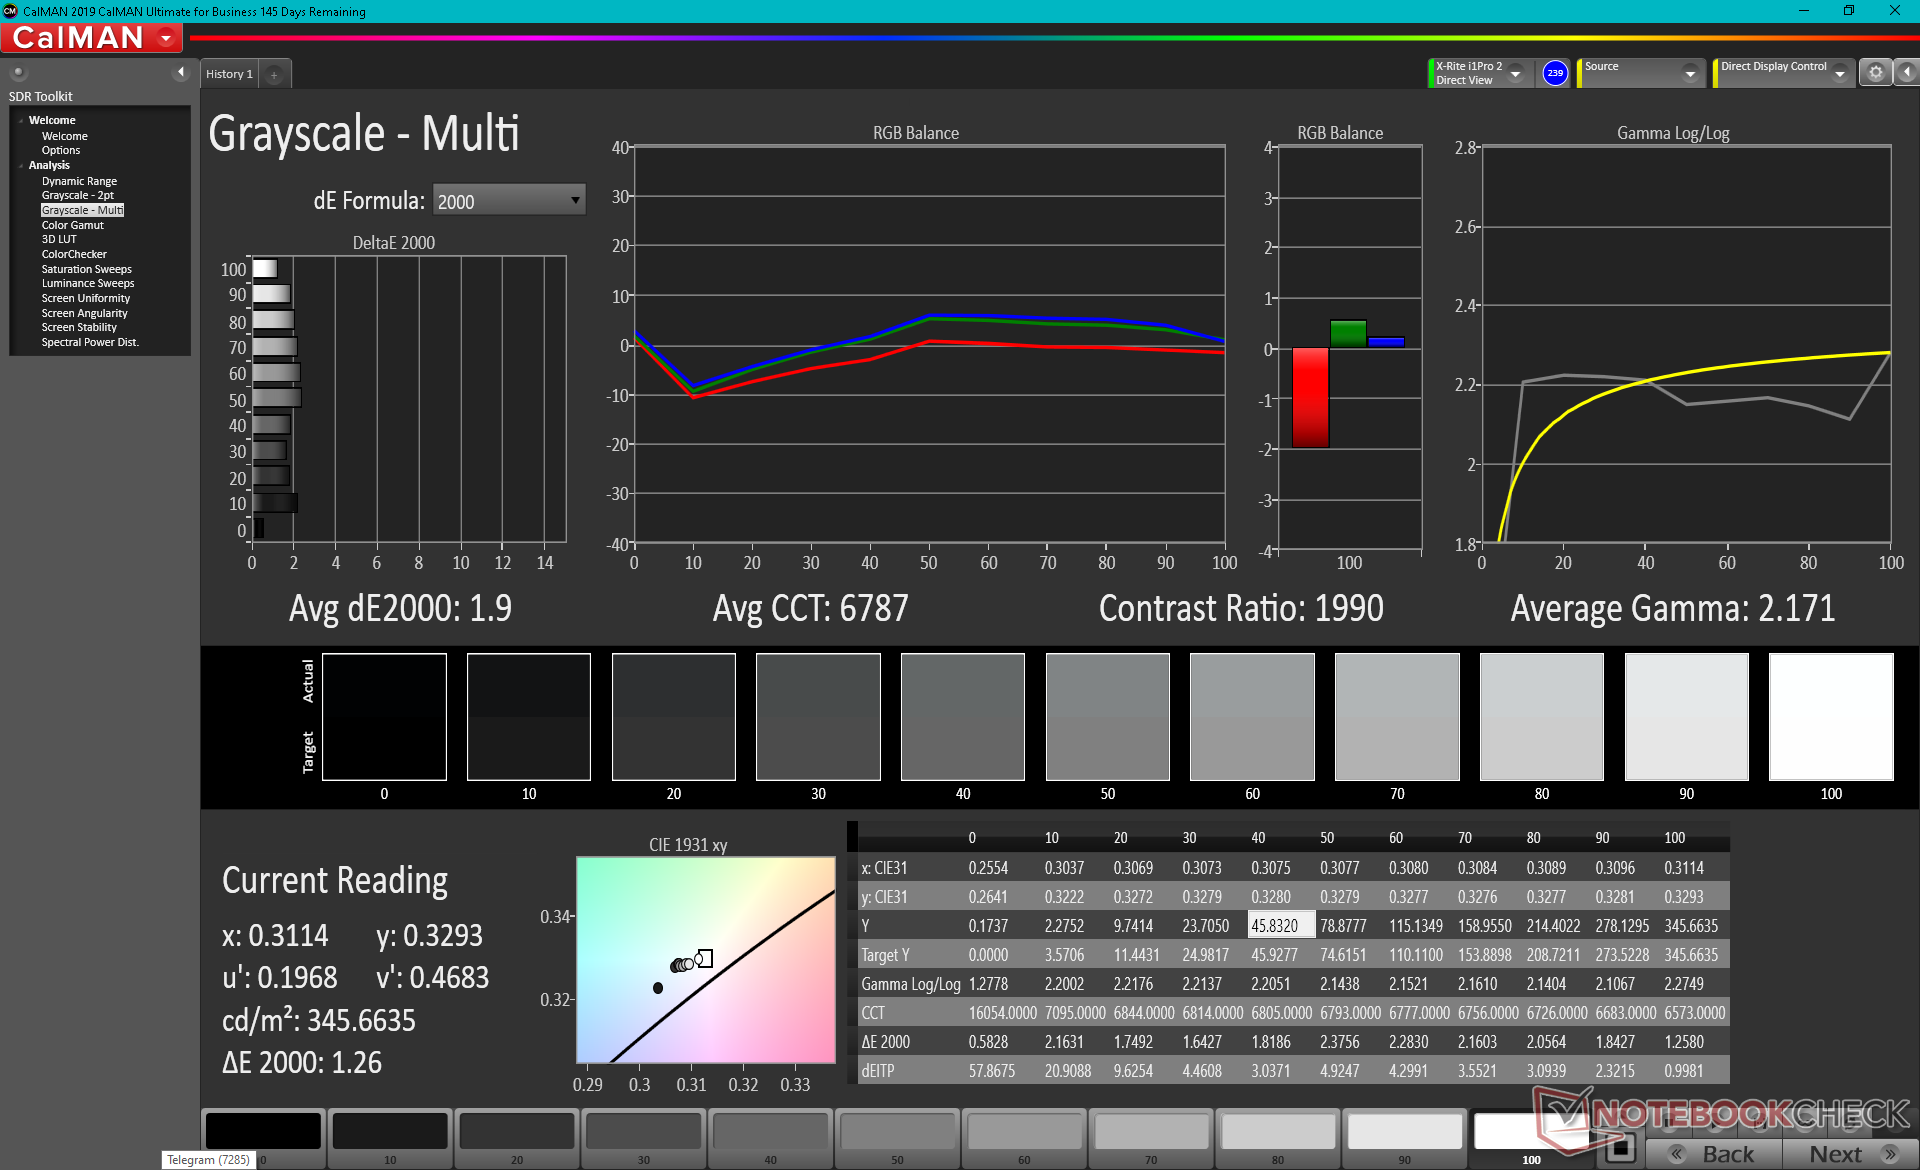
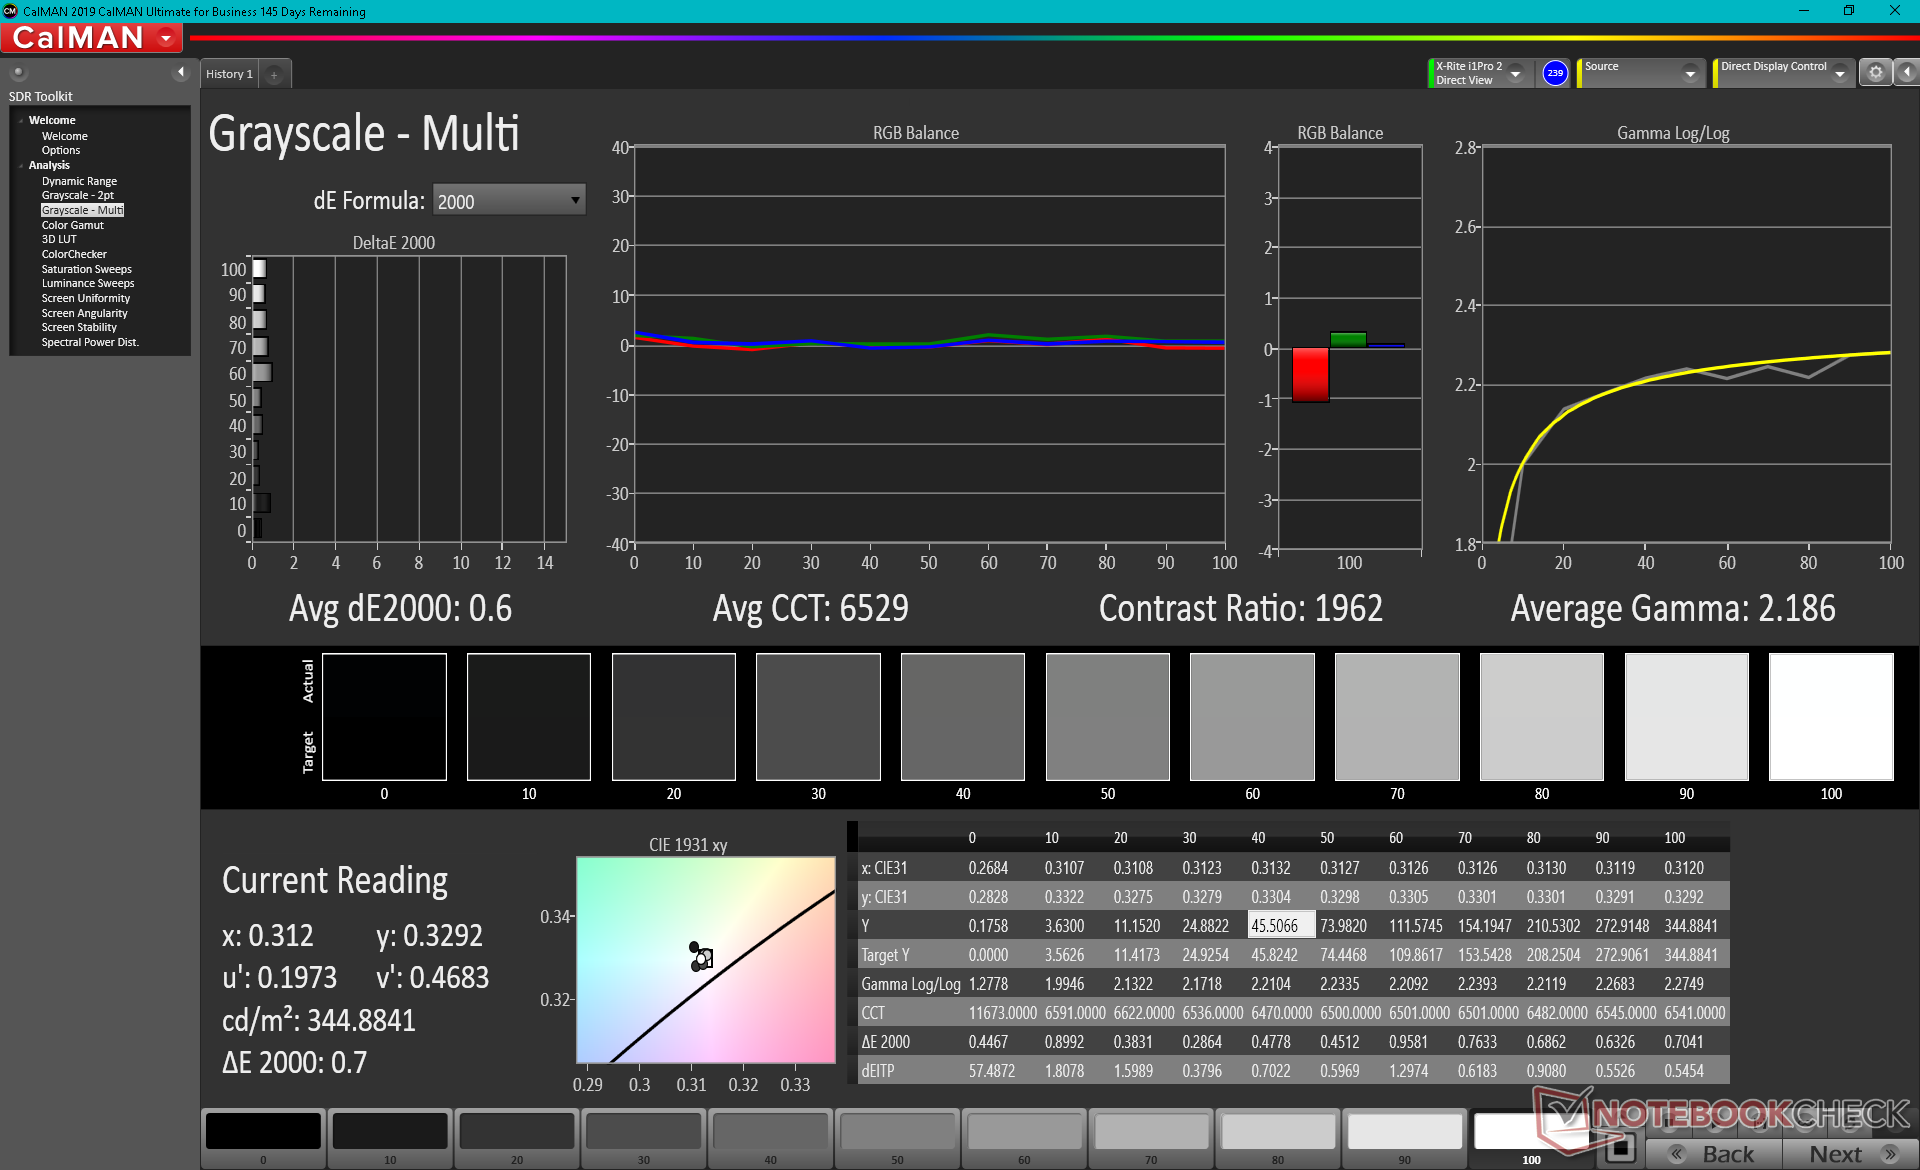
ΔE Greyscale Calman: 1.9 | ∀{0.09-98 Ø5.1}
72% AdobeRGB 1998 (Argyll 3D)
99.1% sRGB (Argyll 3D)
70% Display P3 (Argyll 3D)
Gamma: 2.17
CCT: 6787 K
| ADATA XPG Xenia 14 BOE NE140WUM-N63, IPS, 14", 1920x1200 | MSI Prestige 14 Evo A11M-005 AUO B140HAN06.2 (AUO623D), IPS-Level, 14", 1920x1080 | Infinix INBook X1 Pro BOE NV140FHM-N62, IPS, 14", 1920x1080 | Honor Magicbook 14 i7-1165G7 BOE092E, IPS, 14", 1920x1080 | LG Gram 14Z90P-G.AA79G LG Display LP140WU1-SPA1, IPS, 14", 1920x1200 | VAIO Z VJZ141C11L BOE NE140QUM-N62, IPS, 14", 3840x2160 | |
|---|---|---|---|---|---|---|
| Display | -1% | -10% | -6% | 19% | 19% | |
| Display P3 Coverage | 70 | 68.8 -2% | 65.7 -6% | 64.8 -7% | 97.6 39% | 95.7 37% |
| sRGB Coverage | 99.1 | 99.4 0% | 86.6 -13% | 96.3 -3% | 99.9 1% | 99.5 0% |
| AdobeRGB 1998 Coverage | 72 | 70.9 -2% | 63.3 -12% | 66.1 -8% | 85.3 18% | 86.4 20% |
| Response Times | -14% | 5% | 38% | 17% | 7% | |
| Response Time Grey 50% / Grey 80% * | 50 ? | 59.6 ? -19% | 43.2 ? 14% | 31.2 ? 38% | 45 ? 10% | 46.8 ? 6% |
| Response Time Black / White * | 30.4 ? | 32.8 ? -8% | 32 ? -5% | 19.2 ? 37% | 23 ? 24% | 28 ? 8% |
| PWM Frequency | 200 ? | |||||
| Screen | -38% | -183% | -28% | -86% | -58% | |
| Brightness middle | 344.6 | 293 -15% | 282 -18% | 341 -1% | 352 2% | 368.3 7% |
| Brightness | 321 | 277 -14% | 271 -16% | 313 -2% | 332 3% | 361 12% |
| Brightness Distribution | 89 | 89 0% | 74 -17% | 87 -2% | 91 2% | 90 1% |
| Black Level * | 0.22 | 0.18 18% | 0.24 -9% | 0.27 -23% | 0.22 -0% | 0.22 -0% |
| Contrast | 1566 | 1628 4% | 1175 -25% | 1263 -19% | 1600 2% | 1674 7% |
| Colorchecker dE 2000 * | 1.51 | 2.95 -95% | 6.1 -304% | 1.76 -17% | 2.89 -91% | 3.27 -117% |
| Colorchecker dE 2000 max. * | 4.1 | 6.03 -47% | 14.05 -243% | 4.85 -18% | 4.66 -14% | 5.43 -32% |
| Colorchecker dE 2000 calibrated * | 0.52 | 0.9 -73% | 3.94 -658% | 1.01 -94% | 2.7 -419% | 2.33 -348% |
| Greyscale dE 2000 * | 1.9 | 4.2 -121% | 8.7 -358% | 3.3 -74% | 6.9 -263% | 2.9 -53% |
| Gamma | 2.17 101% | 2.099 105% | 2.14 103% | 2.26 97% | 2.34 94% | 2.2 100% |
| CCT | 6787 96% | 6622 98% | 8672 75% | 7233 90% | 7904 82% | 6071 107% |
| Color Space (Percent of AdobeRGB 1998) | 71 | 66 | 76 | 76.8 | ||
| Color Space (Percent of sRGB) | 93 | 89 | 100 | 99.5 | ||
| Total Average (Program / Settings) | -18% /
-27% | -63% /
-119% | 1% /
-14% | -17% /
-49% | -11% /
-32% |
* ... smaller is better
Color space is excellent with its full sRGB coverage. Cheaper laptops like the Asus VivoBook or Infinix INBook X1 Pro may cover just 60 percent of sRGB instead for noticeably shallower colors.
The panel is well-calibrated out of the box with average grayscale and color DeltaE values of just 1.9 and 1.51, respectively. An end-user calibration is therefore not needed to get the most out of the display. Calibrating the panel ourselves anyway would actually result in marginally better DeltaE values as shown by our screenshots below.
Display Response Times
| ↔ Response Time Black to White | ||
|---|---|---|
| 30.4 ms ... rise ↗ and fall ↘ combined | ↗ 16.4 ms rise | 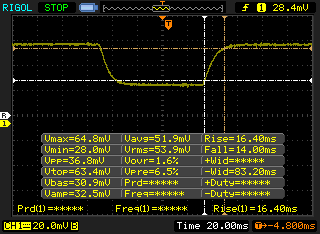 |
| ↘ 14 ms fall | ||
| The screen shows slow response rates in our tests and will be unsatisfactory for gamers. In comparison, all tested devices range from 0.1 (minimum) to 240 (maximum) ms. » 81 % of all devices are better. This means that the measured response time is worse than the average of all tested devices (20.4 ms). | ||
| ↔ Response Time 50% Grey to 80% Grey | ||
| 50 ms ... rise ↗ and fall ↘ combined | ↗ 26.4 ms rise |  |
| ↘ 23.6 ms fall | ||
| The screen shows slow response rates in our tests and will be unsatisfactory for gamers. In comparison, all tested devices range from 0.165 (minimum) to 636 (maximum) ms. » 85 % of all devices are better. This means that the measured response time is worse than the average of all tested devices (31.9 ms). | ||
Screen Flickering / PWM (Pulse-Width Modulation)
| Screen flickering / PWM not detected | 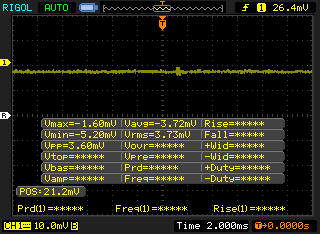 | ||
In comparison: 53 % of all tested devices do not use PWM to dim the display. If PWM was detected, an average of 8276 (minimum: 5 - maximum: 343500) Hz was measured. | |||
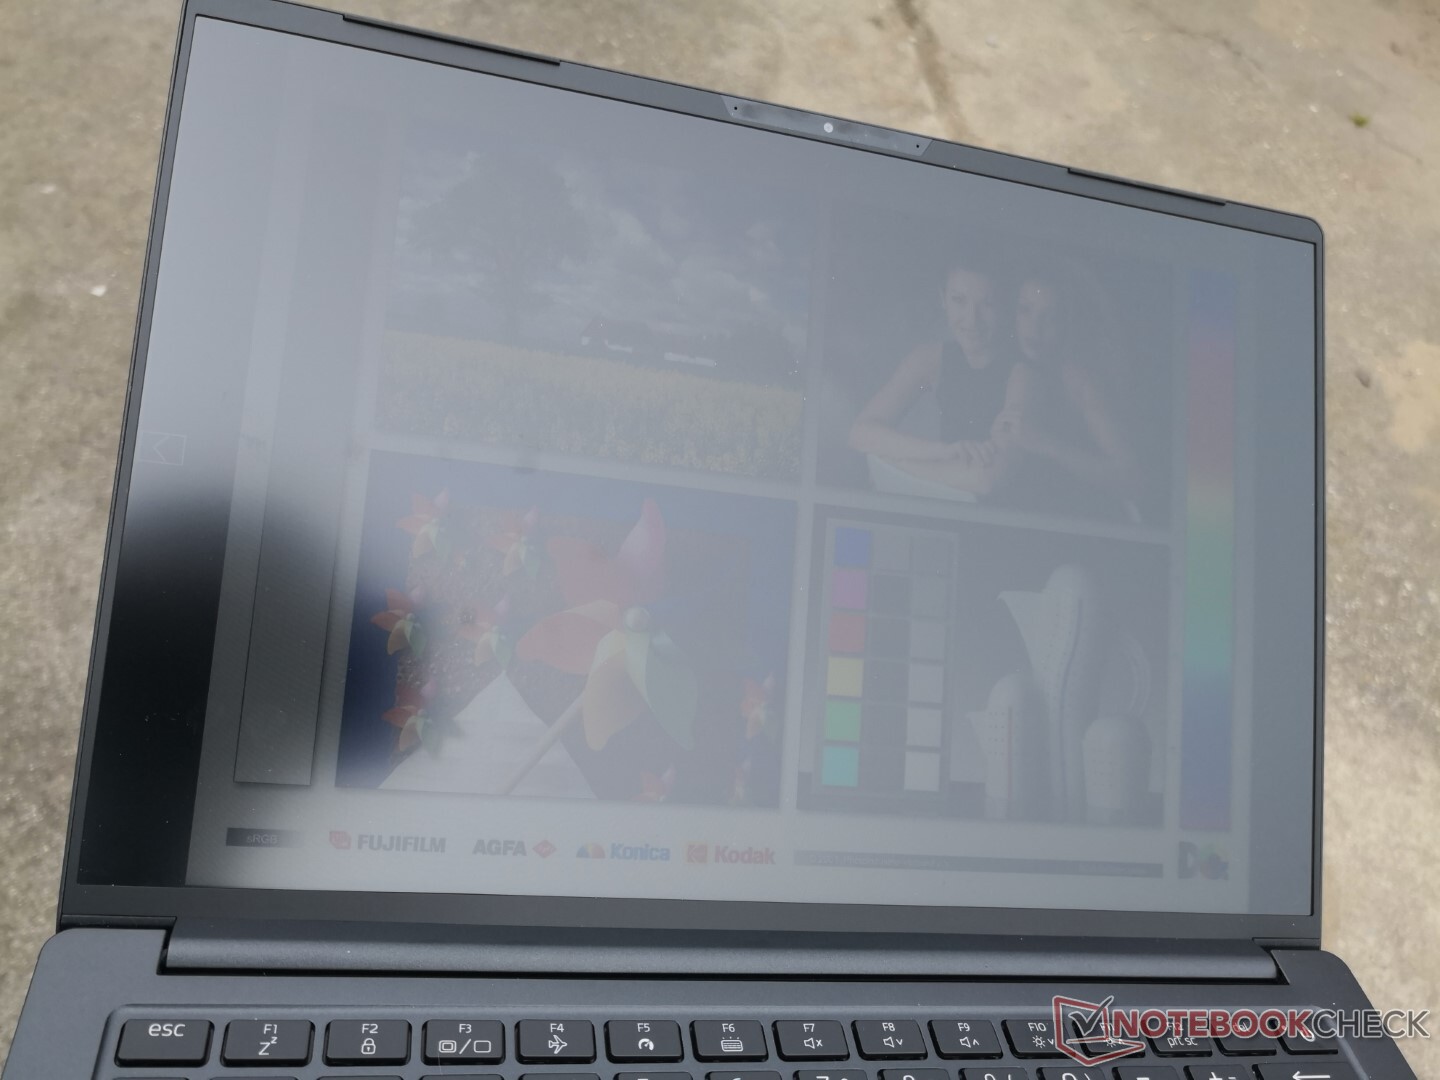
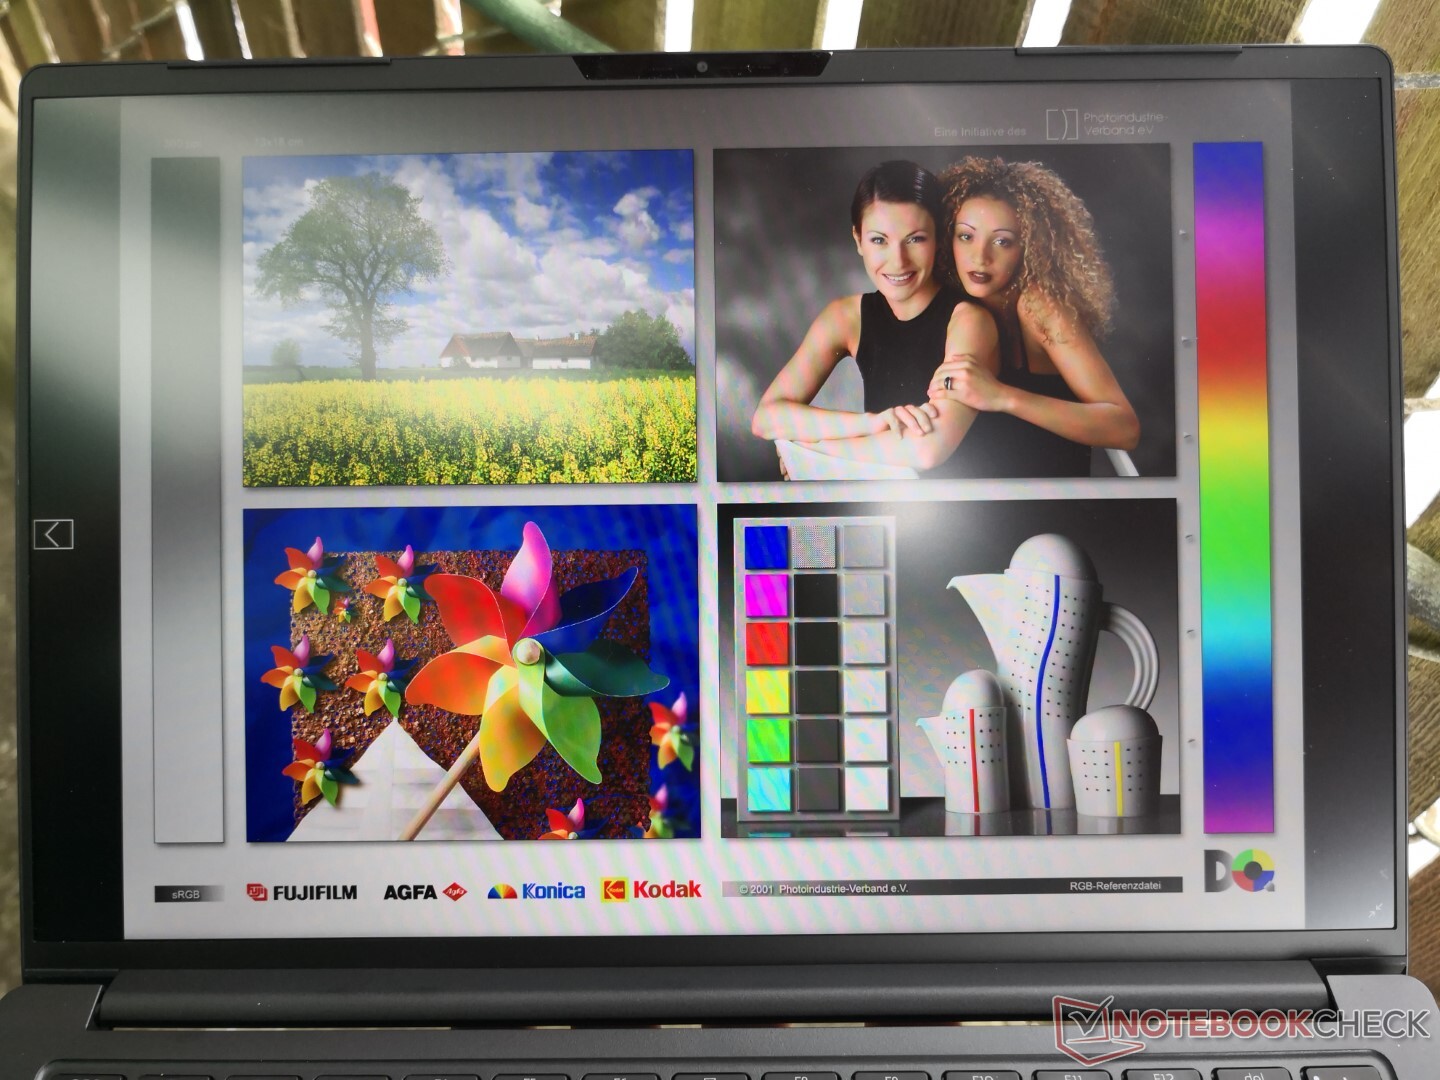
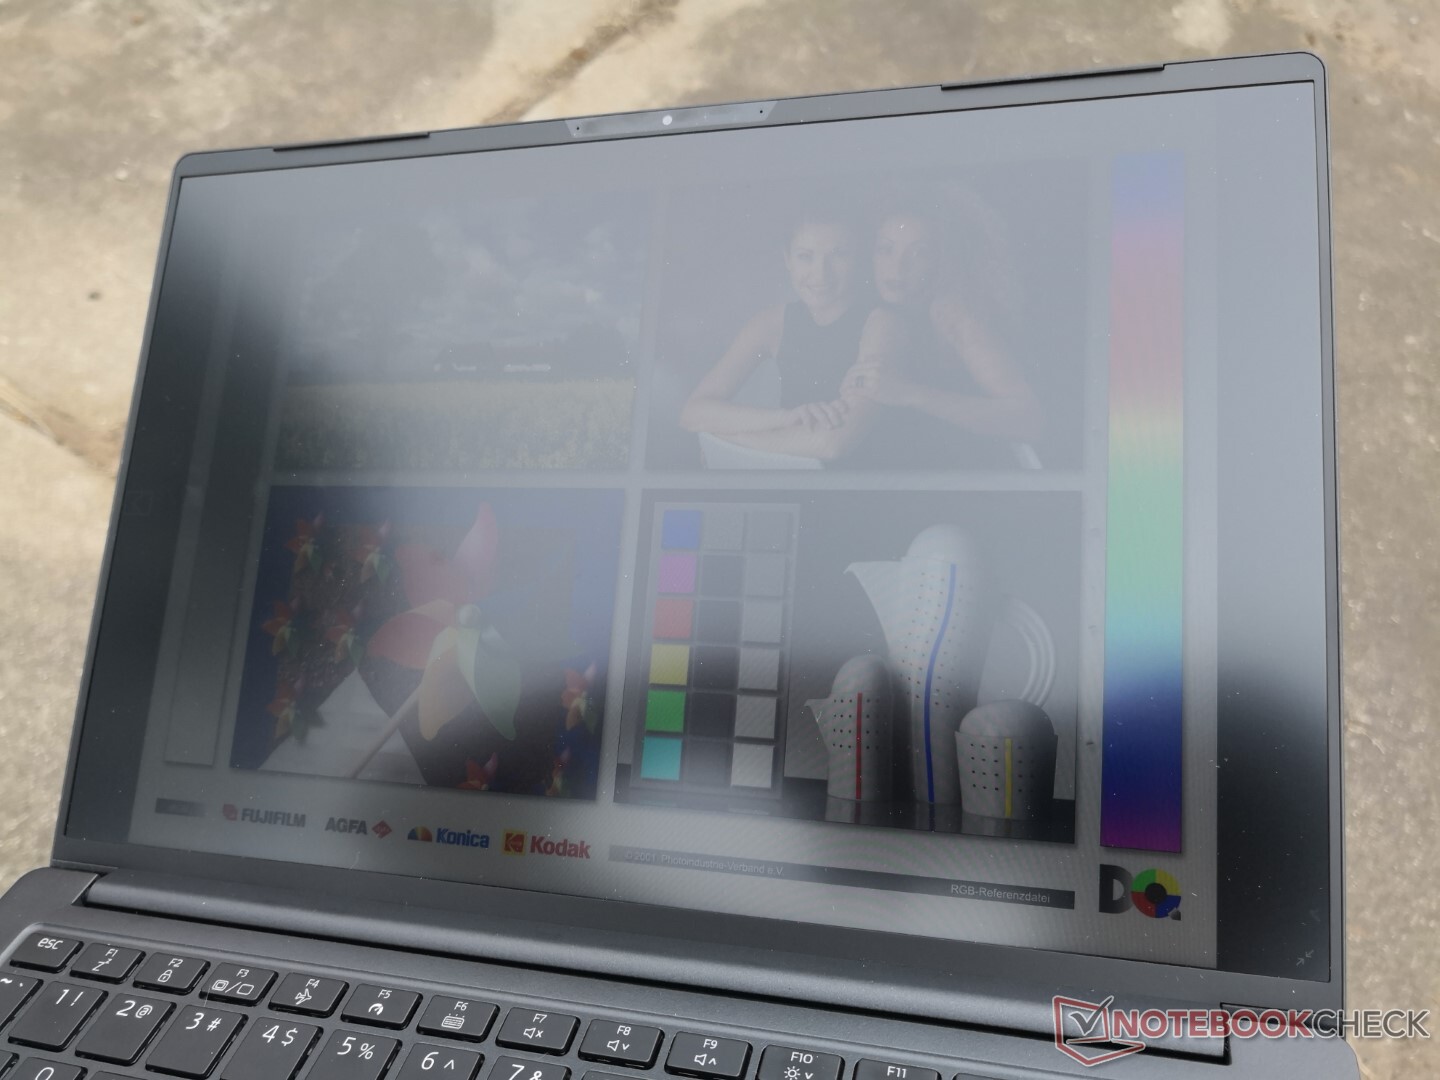
Outdoor visibility is decent when under shade as the display isn't bright enough to overcome sunlight or general daylight. Certain models like the HP EliteBook 1040 or Samsung Notebook 9 offer significantly brighter displays if outdoor visibility is a concern.

Performance — 11th Gen Intel Power
Though our unit comes with the Core i7-1165G7, ADATA is planning on offering a lesser Core i5-1135G7 version as well. Both options will otherwise come with the exact same chassis and hardware.
Our unit was set to High performance mode prior to running any performance benchmarks below for the highest possible scores.

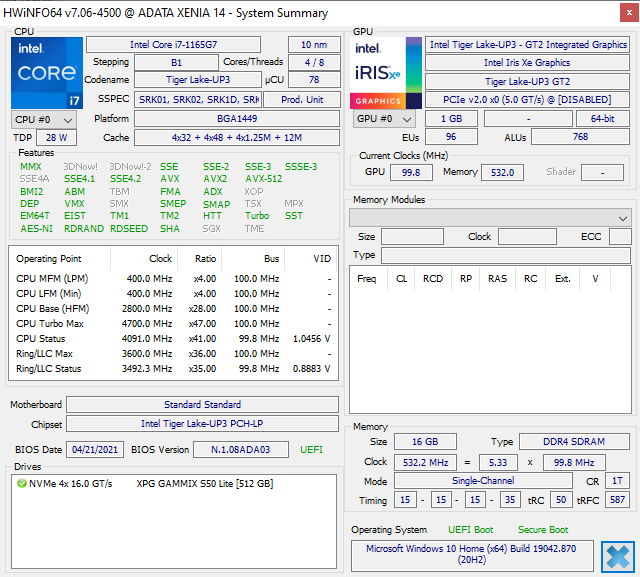
Processor
CPU performance is excellent with multi-thread results that are 12 to 22 percent higher than the average Core i7-1165G7 laptop. In fact, overall performance is just shy of the Core i7-11375H even though the latter is a more power-hungry H-series CPU from the same Tiger Lake family.
Downgrading to the Core i5-1135G7 SKU is expected to incur a 10 to 15 percent deficit in performance.
Cinebench R15 Multi Loop
Cinebench R23: Multi Core | Single Core
Cinebench R15: CPU Multi 64Bit | CPU Single 64Bit
Blender: v2.79 BMW27 CPU
7-Zip 18.03: 7z b 4 -mmt1 | 7z b 4
Geekbench 5.5: Single-Core | Multi-Core
HWBOT x265 Benchmark v2.2: 4k Preset
LibreOffice : 20 Documents To PDF
R Benchmark 2.5: Overall mean
Cinebench R23: Multi Core | Single Core
Cinebench R15: CPU Multi 64Bit | CPU Single 64Bit
Blender: v2.79 BMW27 CPU
7-Zip 18.03: 7z b 4 -mmt1 | 7z b 4
Geekbench 5.5: Single-Core | Multi-Core
HWBOT x265 Benchmark v2.2: 4k Preset
LibreOffice : 20 Documents To PDF
R Benchmark 2.5: Overall mean
* ... smaller is better
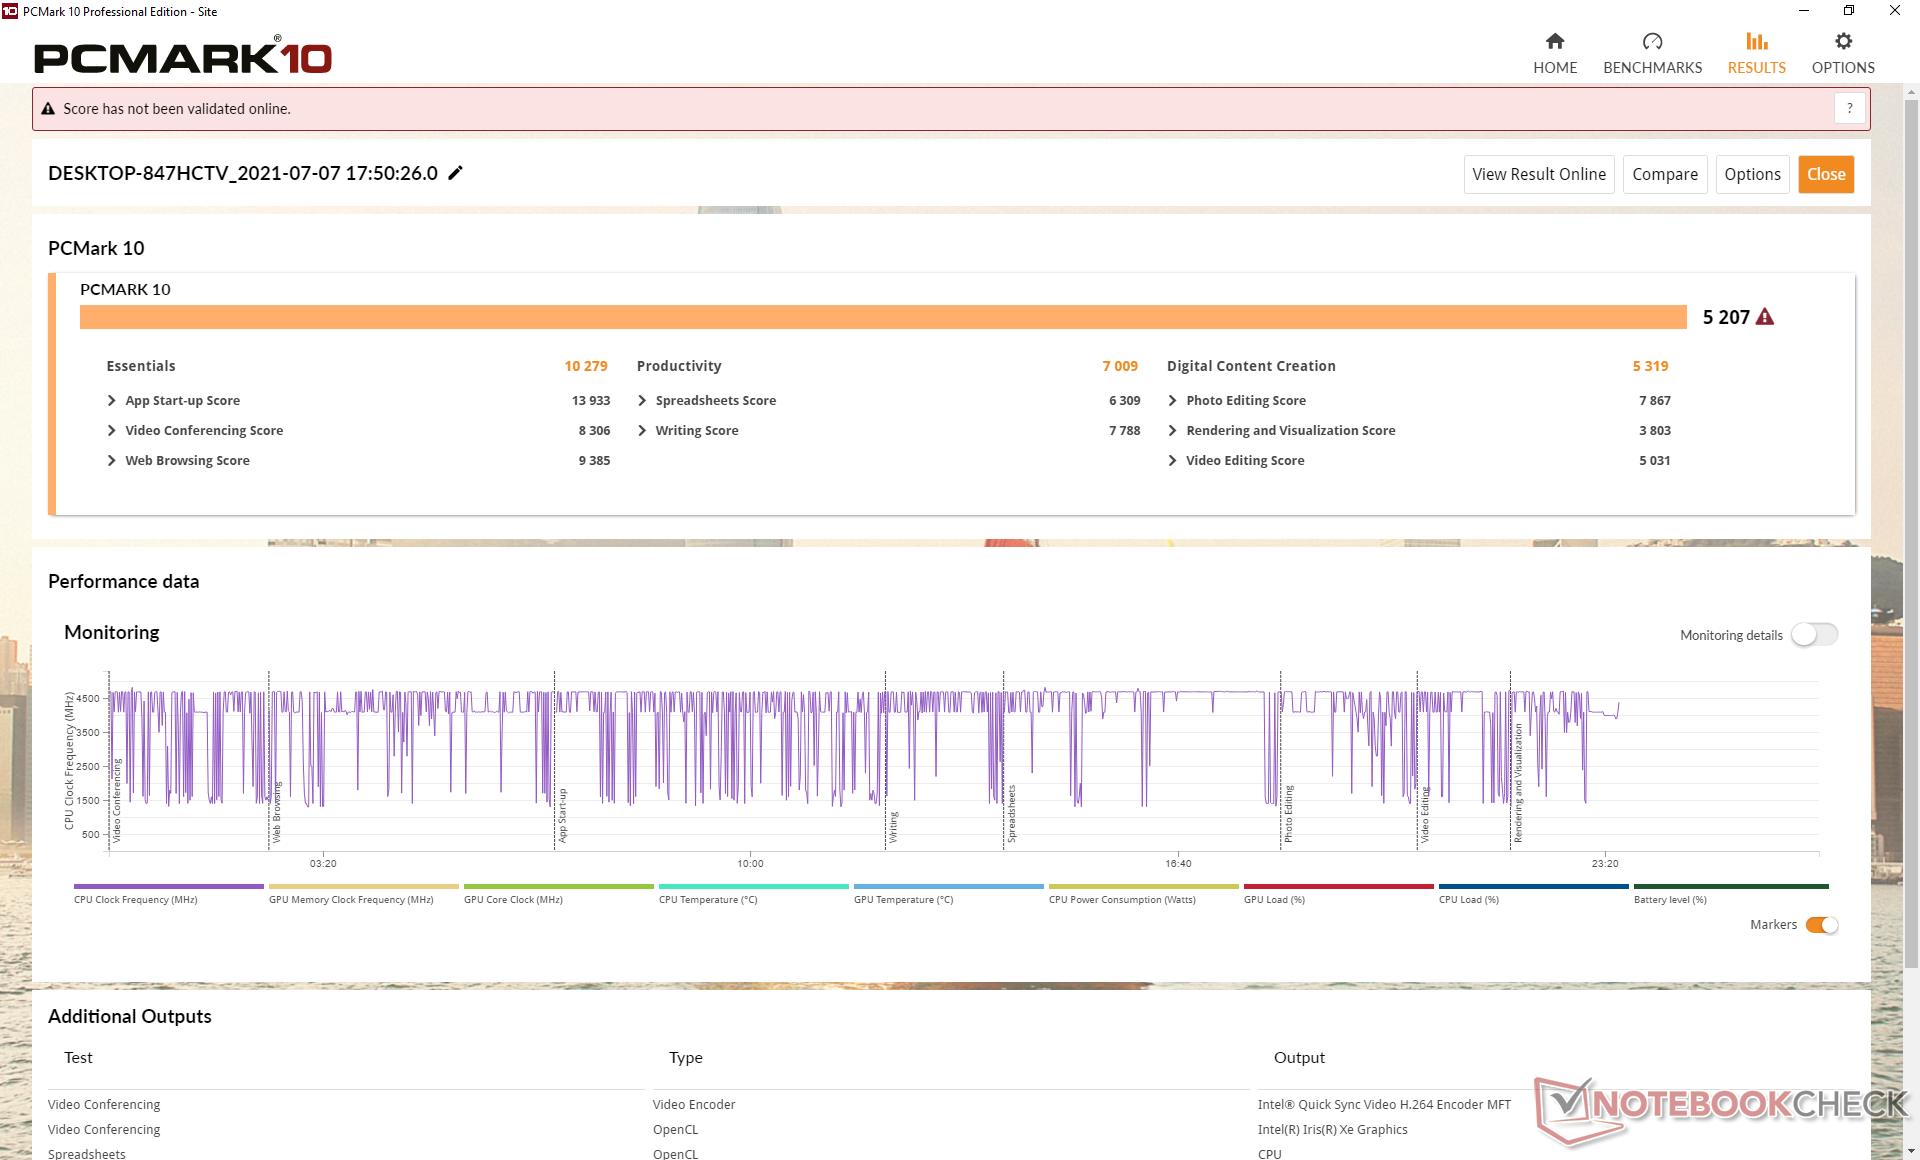
System Performance
PCMark scores are in line with other laptops equipped with the same Core i7-1165G7 CPU. The VAIO Z with the rare Core i7-11375H is only a few percentage points higher on average.
| PCMark 10 / Score | |
| VAIO Z VJZ141C11L | |
| ADATA XPG Xenia 14 | |
| Honor Magicbook 14 i7-1165G7 | |
| Average Intel Core i7-1165G7, Intel Iris Xe Graphics G7 96EUs (4531 - 5454, n=50) | |
| MSI Prestige 14 Evo A11M-005 | |
| LG Gram 14Z90P-G.AA79G | |
| Infinix INBook X1 Pro | |
| PCMark 10 / Essentials | |
| VAIO Z VJZ141C11L | |
| ADATA XPG Xenia 14 | |
| LG Gram 14Z90P-G.AA79G | |
| Average Intel Core i7-1165G7, Intel Iris Xe Graphics G7 96EUs (8997 - 11505, n=50) | |
| Honor Magicbook 14 i7-1165G7 | |
| MSI Prestige 14 Evo A11M-005 | |
| Infinix INBook X1 Pro | |
| PCMark 10 / Productivity | |
| ADATA XPG Xenia 14 | |
| VAIO Z VJZ141C11L | |
| LG Gram 14Z90P-G.AA79G | |
| Honor Magicbook 14 i7-1165G7 | |
| Average Intel Core i7-1165G7, Intel Iris Xe Graphics G7 96EUs (5570 - 7136, n=50) | |
| MSI Prestige 14 Evo A11M-005 | |
| Infinix INBook X1 Pro | |
| PCMark 10 / Digital Content Creation | |
| VAIO Z VJZ141C11L | |
| ADATA XPG Xenia 14 | |
| Honor Magicbook 14 i7-1165G7 | |
| MSI Prestige 14 Evo A11M-005 | |
| Average Intel Core i7-1165G7, Intel Iris Xe Graphics G7 96EUs (4083 - 5550, n=50) | |
| LG Gram 14Z90P-G.AA79G | |
| Infinix INBook X1 Pro | |
| PCMark 10 Score | 5207 points | |
Help | ||
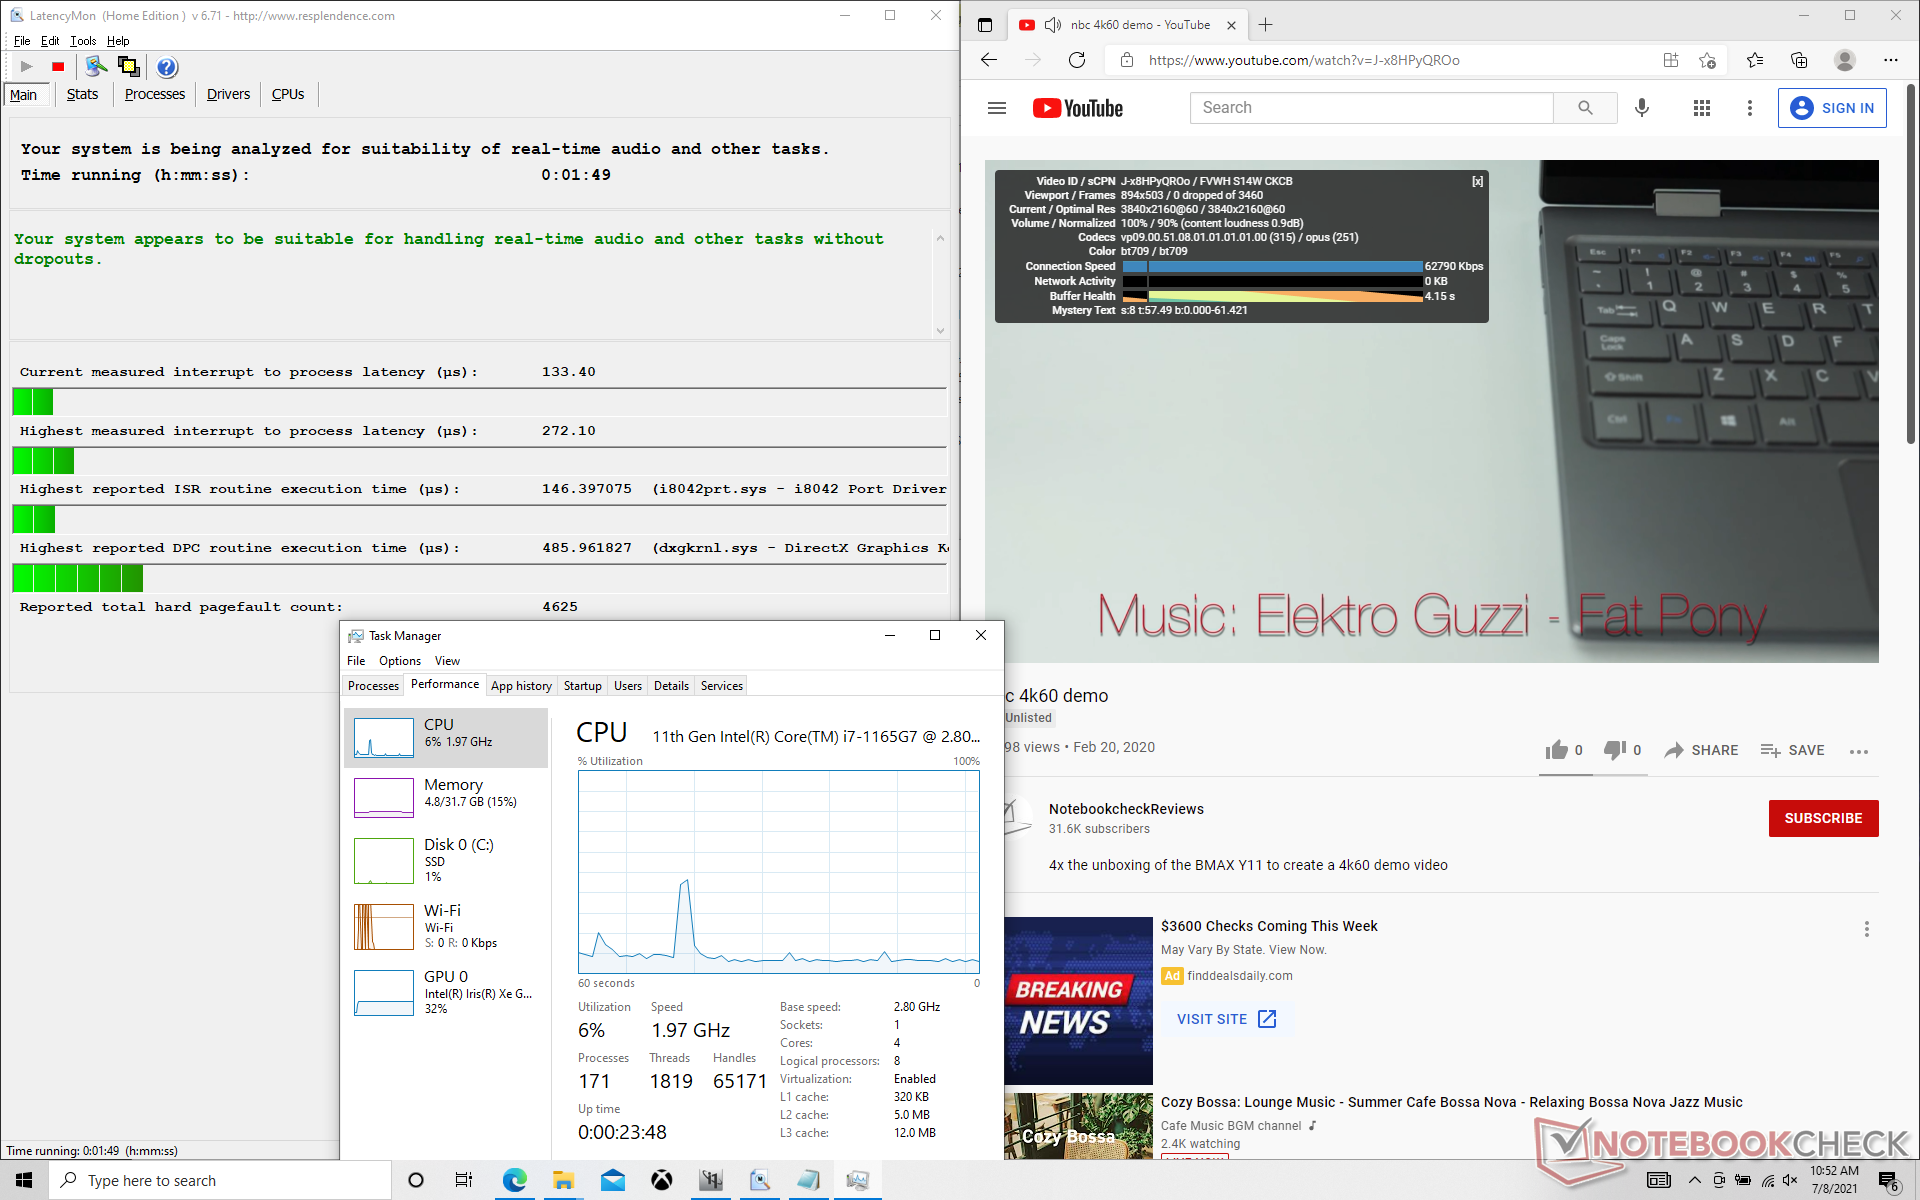
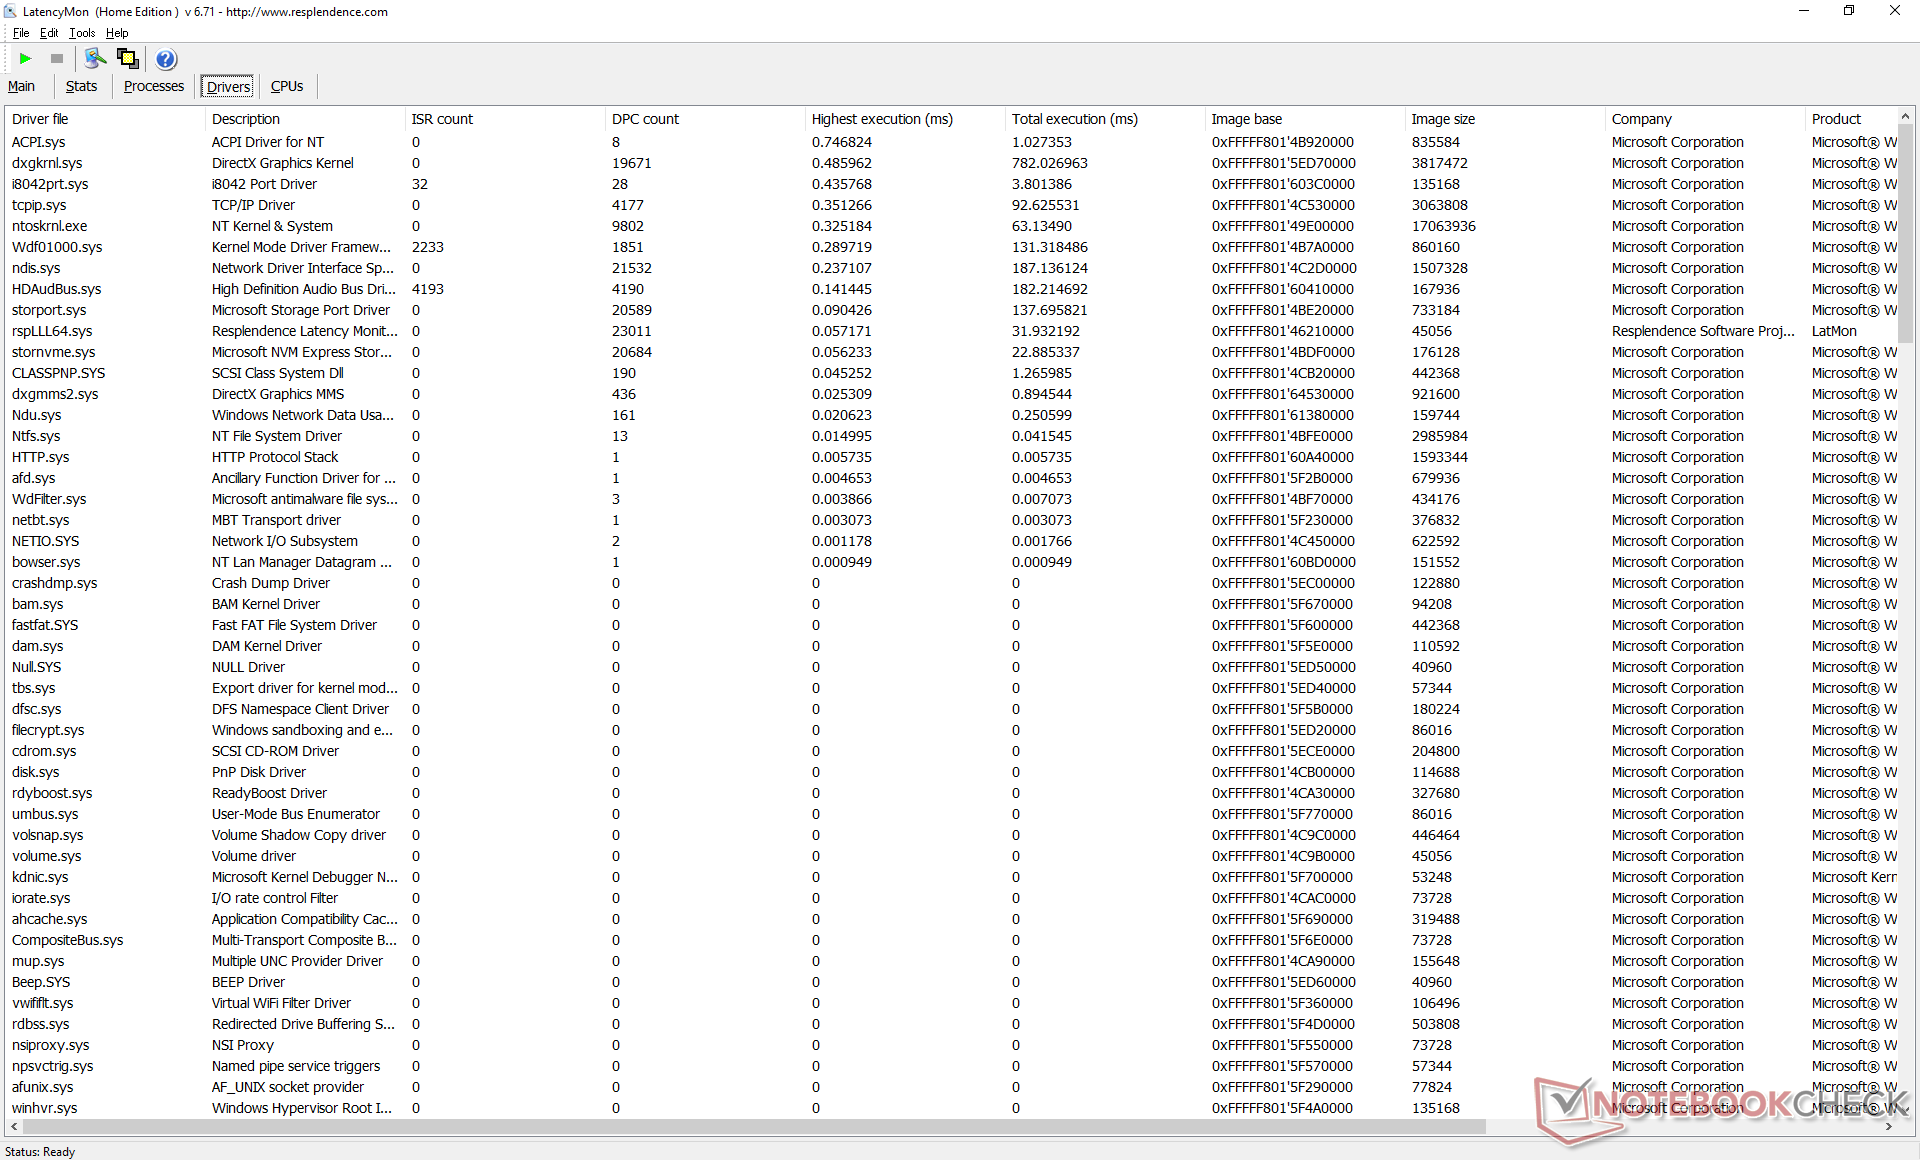
DPC Latency
LatencyMon shows no latency issues when opening multiple tabs on our homepage or when streaming video at 4K60.
| DPC Latencies / LatencyMon - interrupt to process latency (max), Web, Youtube, Prime95 | |
| LG Gram 14Z90P-G.AA79G | |
| Infinix INBook X1 Pro | |
| MSI Prestige 14 Evo A11M-005 | |
| Honor Magicbook 14 i7-1165G7 | |
| VAIO Z VJZ141C11L | |
| ADATA XPG Xenia 14 | |
* ... smaller is better
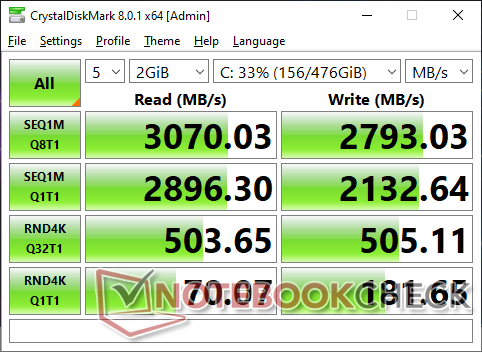
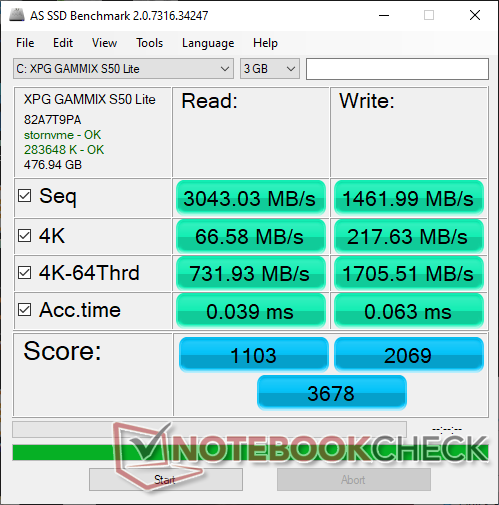
Storage Devices — PCIe 4 Support
Naturally, our XPG laptop ships with an XPG-branded Gammix S50 Lite NVMe 1.4 SSD. This particular 512 GB SKU tops out at around 3200 MB/s and 2800 MB/s sequential read and write, respectively, to outperform most NVMe 1.3 SSDs. Nonetheless, it's not the fastest PCIe 4 SSD available as the pricier Samsung PM9A1 is noticeably faster by up to 2x.
| ADATA XPG Xenia 14 ADATA XPG Gammix S50 Lite 512GB | MSI Prestige 14 Evo A11M-005 Phison 512GB SM280512GKBB4S-E162 | Infinix INBook X1 Pro Phison C-E80T512G4-P3D3B3E13 | Honor Magicbook 14 i7-1165G7 WDC PC SN730 SDBPNTY-512G | LG Gram 14Z90P-G.AA79G SK Hynix PC601 1TB HFS001TD9TNG | VAIO Z VJZ141C11L Samsung PM9A1 MZVL2512HCJQ | |
|---|---|---|---|---|---|---|
| AS SSD | 18% | -32% | 22% | 7% | 43% | |
| Seq Read | 3043 | 3760 24% | 2135 -30% | 3021 -1% | 2975 -2% | 5533 82% |
| Seq Write | 1462 | 2335 60% | 1776 21% | 2341 60% | 1261 -14% | 3289 125% |
| 4K Read | 66.6 | 66.8 0% | 28.88 -57% | 47.9 -28% | 49.97 -25% | 72.5 9% |
| 4K Write | 217.6 | 184.3 -15% | 147.9 -32% | 186.7 -14% | 168.4 -23% | 213.7 -2% |
| 4K-64 Read | 732 | 1801 146% | 712 -3% | 1472 101% | 1539 110% | 2128 191% |
| 4K-64 Write | 1706 | 1754 3% | 643 -62% | 1829 7% | 1517 -11% | 2032 19% |
| Access Time Read * | 0.039 | 0.135 -246% | 0.052 -33% | 0.06 -54% | 0.036 8% | 0.039 -0% |
| Access Time Write * | 0.063 | 0.018 71% | 0.092 -46% | 0.021 67% | 0.026 59% | 0.06 5% |
| Score Read | 1103 | 2244 103% | 954 -14% | 1822 65% | 1886 71% | 2754 150% |
| Score Write | 2069 | 2172 5% | 968 -53% | 2249 9% | 1811 -12% | 2574 24% |
| Score Total | 3678 | 5500 50% | 2395 -35% | 4973 35% | 4579 24% | 6629 80% |
| Copy ISO MB/s | 3306 | 1296 -61% | 1510 -54% | 2235 -32% | ||
| Copy Program MB/s | 1087 | 900 -17% | 950 -13% | 796 -27% | ||
| Copy Game MB/s | 1988 | 1588 -20% | 1470 -26% | 1652 -17% | ||
| CrystalDiskMark 5.2 / 6 | 14% | -10% | 12% | 5% | 51% | |
| Write 4K | 182.5 | 248.4 36% | 228.3 25% | 223.7 23% | 198.9 9% | 236.7 30% |
| Read 4K | 69.4 | 56.4 -19% | 60.7 -13% | 51.2 -26% | 55.9 -19% | 78.6 13% |
| Write Seq | 2171 | 2513 16% | 1895 -13% | 2579 19% | 2441 12% | 3689 70% |
| Read Seq | 2924 | 2250 -23% | 1573 -46% | 2553 -13% | 1939 -34% | 4340 48% |
| Write 4K Q32T1 | 486.5 | 589 21% | 476.6 -2% | 671 38% | 631 30% | 646 33% |
| Read 4K Q32T1 | 506 | 696 38% | 592 17% | 761 50% | 704 39% | 717 42% |
| Write Seq Q32T1 | 2832 | 2515 -11% | 2136 -25% | 2721 -4% | 2566 -9% | 4396 55% |
| Read Seq Q32T1 | 3177 | 4915 55% | 2413 -24% | 3358 6% | 3451 9% | 6804 114% |
| Total Average (Program / Settings) | 16% /
17% | -21% /
-24% | 17% /
18% | 6% /
6% | 47% /
46% |
* ... smaller is better

Disk Throttling: DiskSpd Read Loop, Queue Depth 8
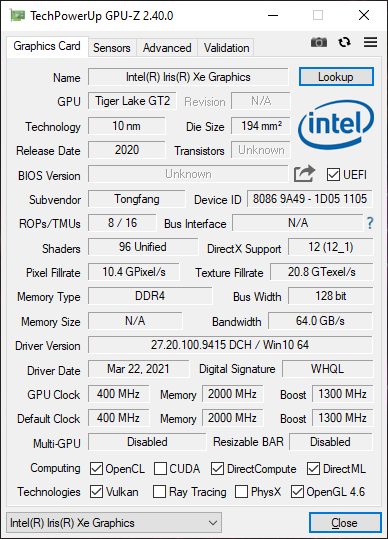
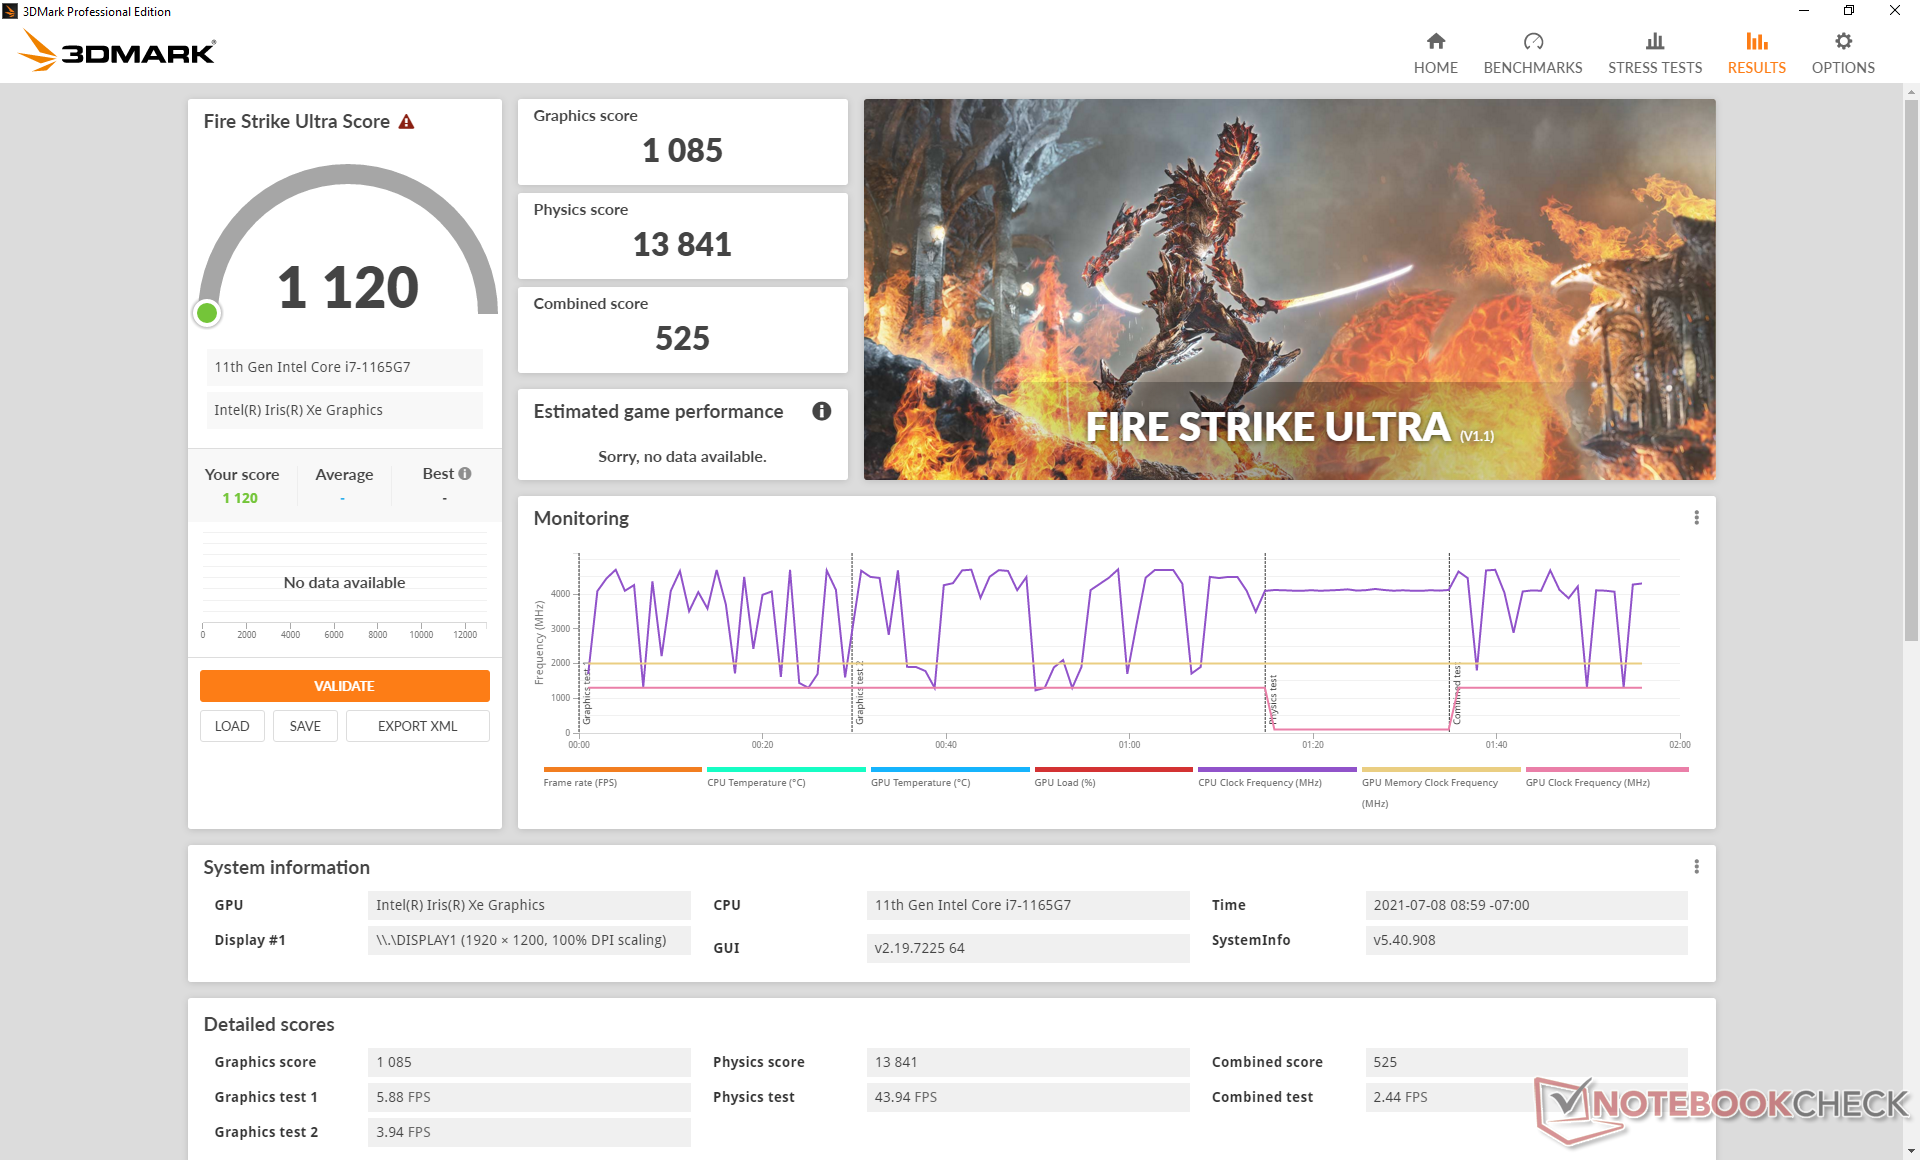
GPU Performance — Iris Xe To The Rescue
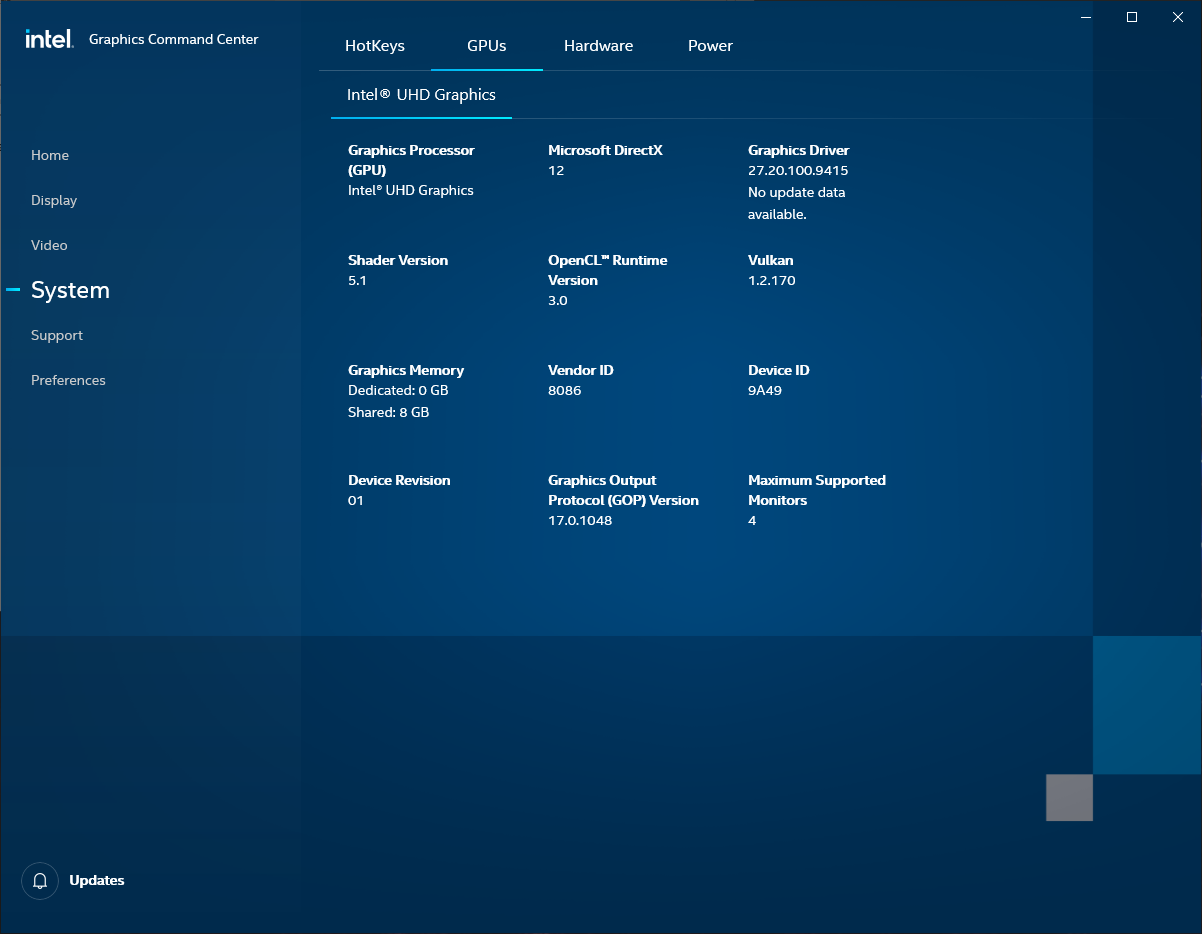
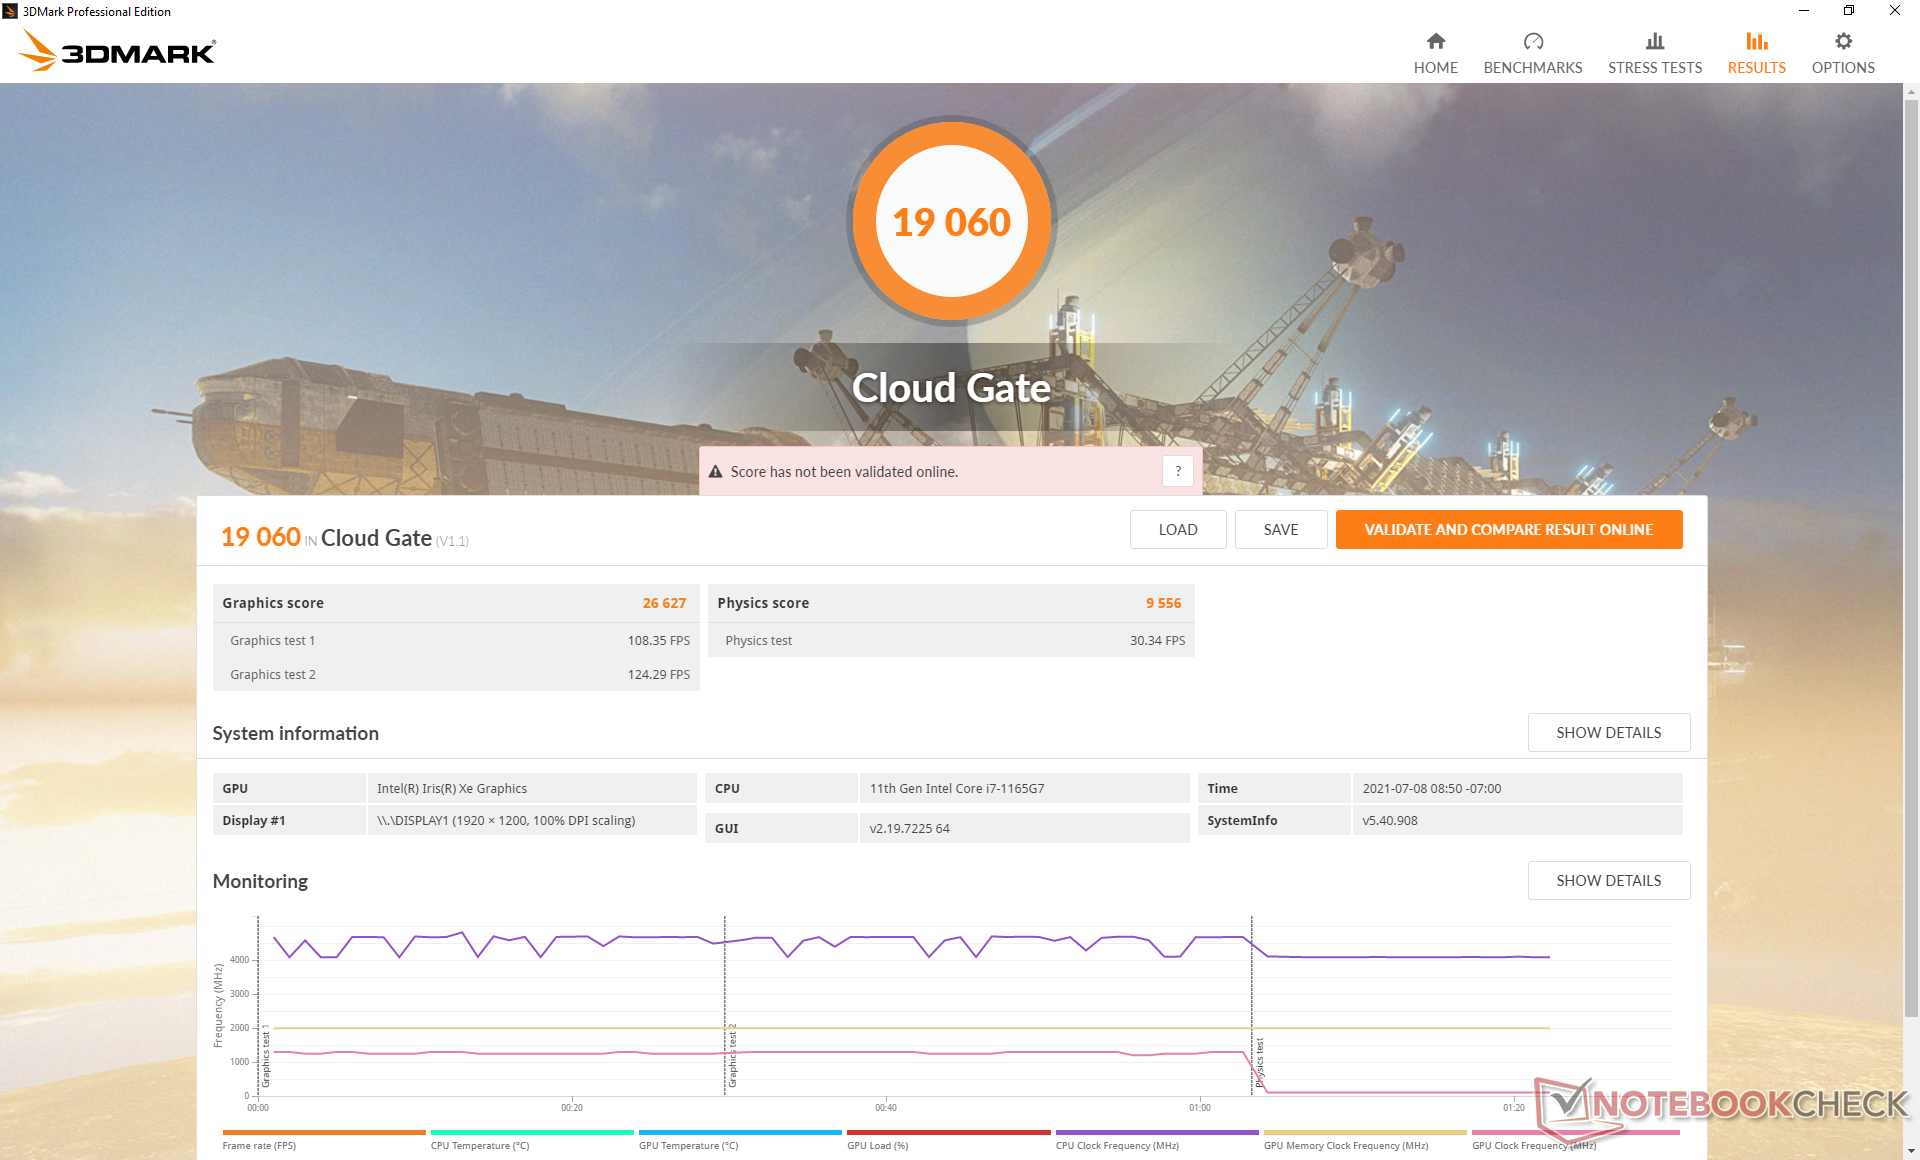
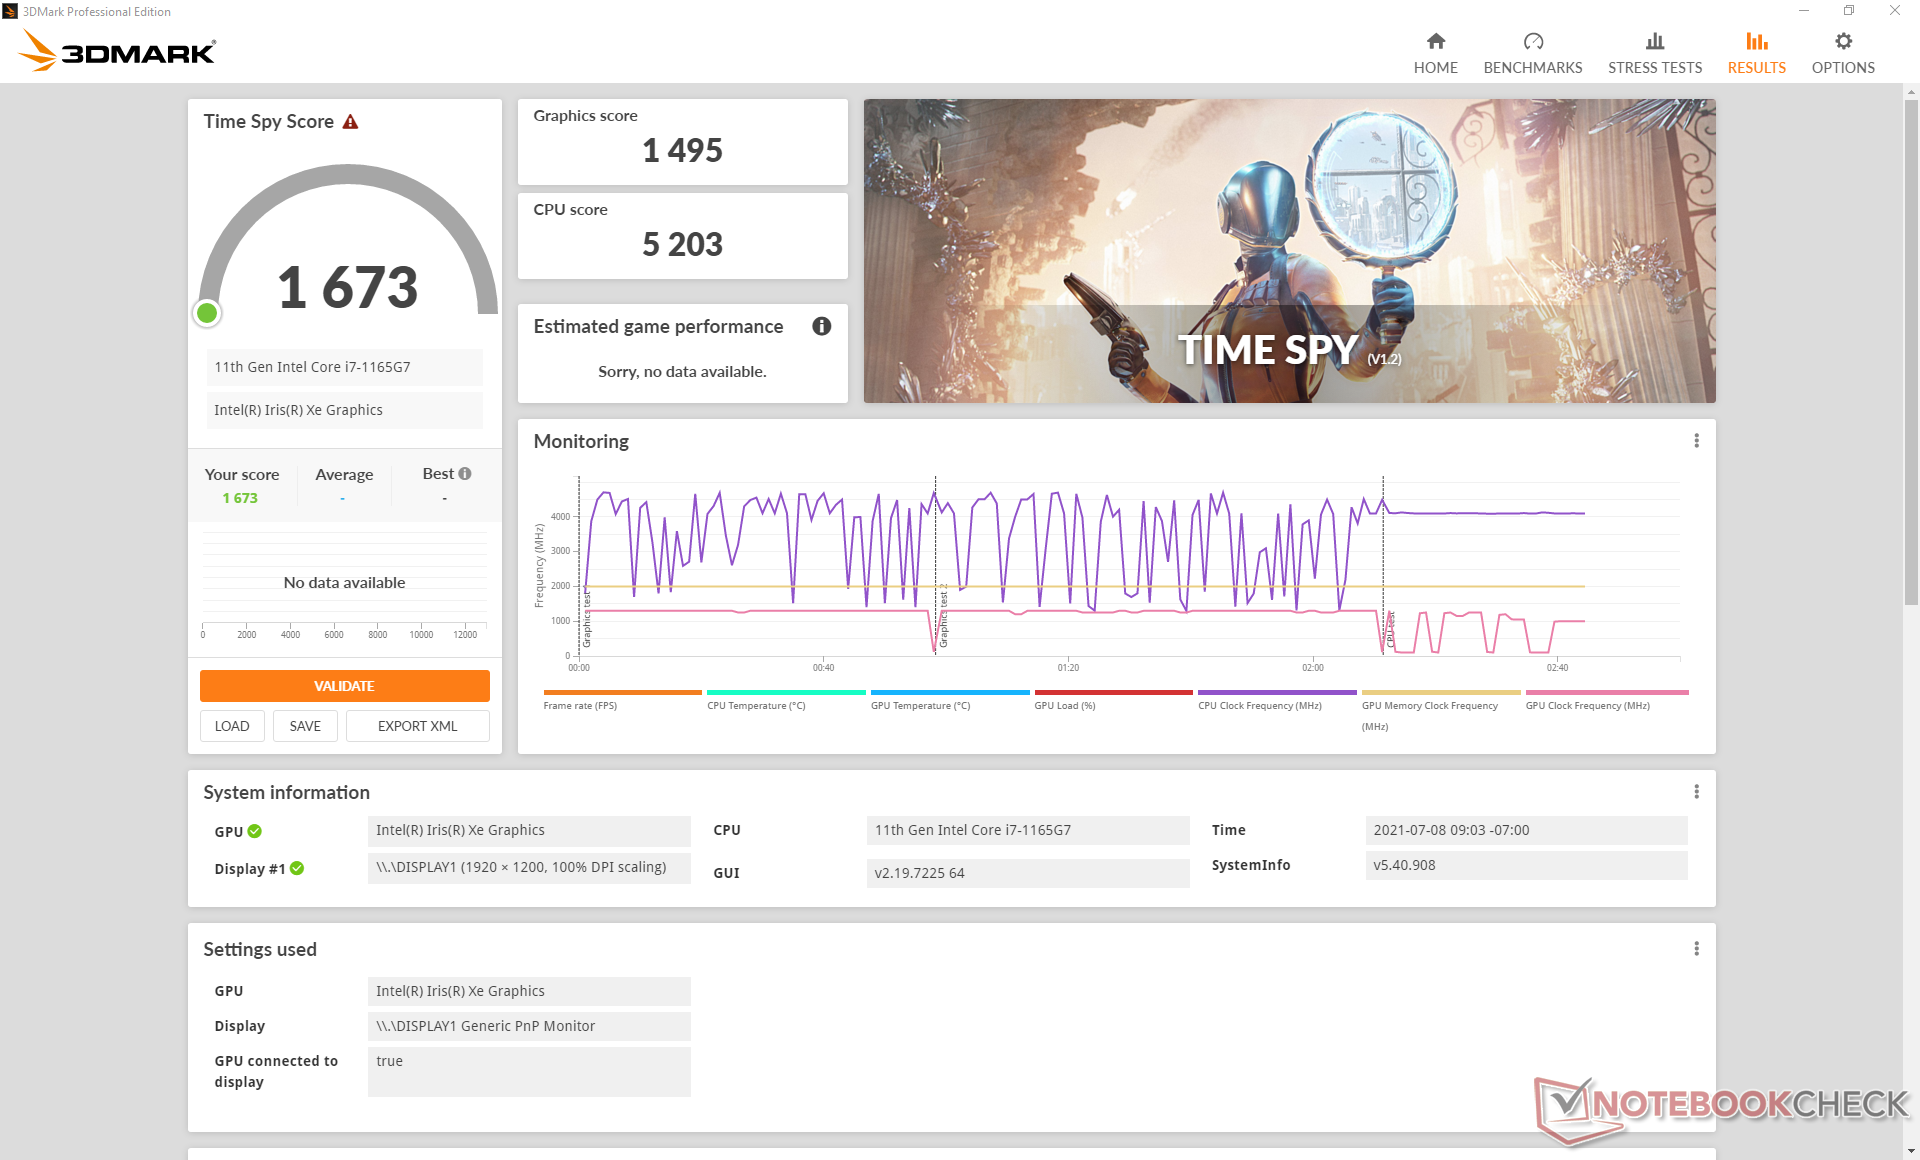
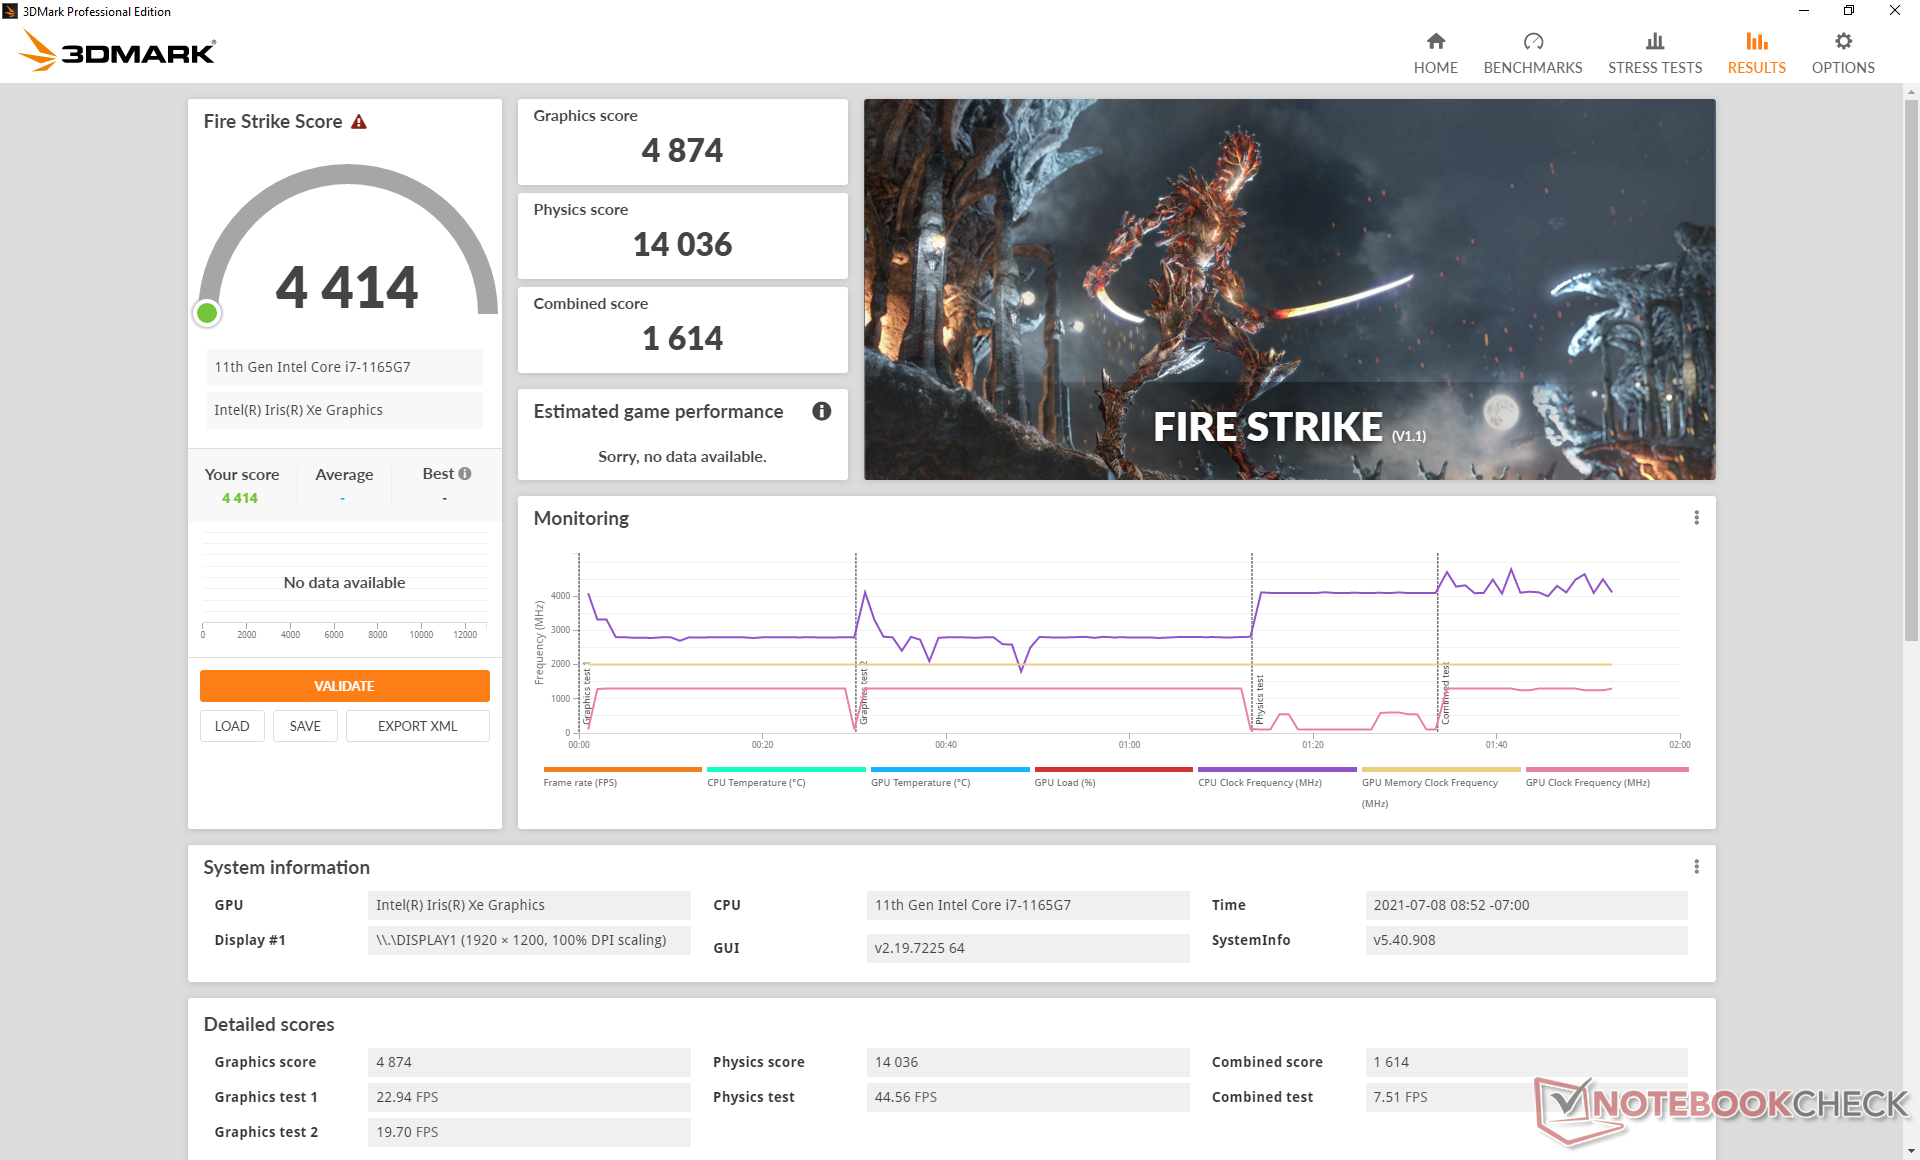
Graphics performance is excellent with frame rates that are consistently ahead of the average laptop in our database with the same integrated Iris Xe 96 EUs GPU by at least a few percentage points. We suspect that the roomy 32 GB of RAM is playing a part in the small performance boost.
Idling on Witcher 3 for over an hour shows consistent frame rates over time with just a single dip that fortunately never occurred a second time.
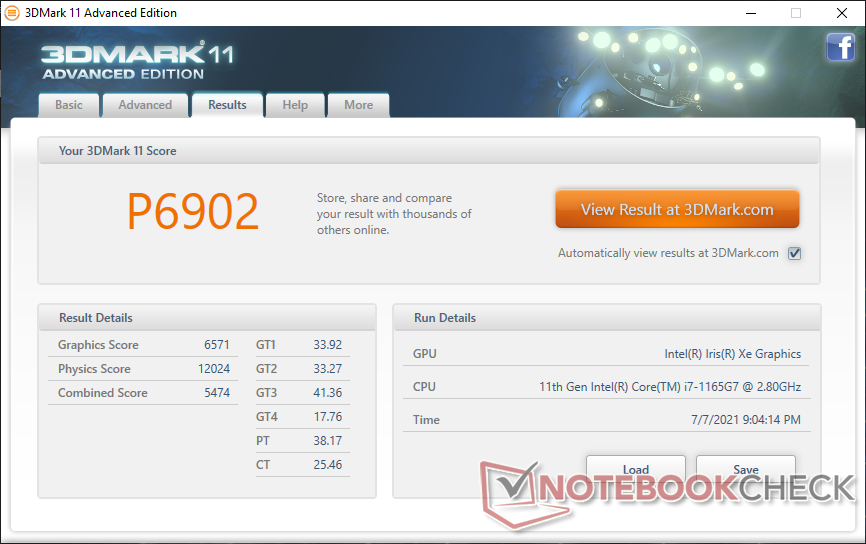
| 3DMark 11 Performance | 6902 points | |
| 3DMark Cloud Gate Standard Score | 19060 points | |
| 3DMark Fire Strike Score | 4414 points | |
| 3DMark Time Spy Score | 1673 points | |
Help | ||
Witcher 3 FPS Chart
| low | med. | high | ultra | |
|---|---|---|---|---|
| The Witcher 3 (2015) | 88.5 | 56.7 | 27.8 | 13.3 |
| Dota 2 Reborn (2015) | 83.8 | 79 | 50.6 | 46.2 |
| Final Fantasy XV Benchmark (2018) | 40.8 | 22.2 | 17.1 | |
| X-Plane 11.11 (2018) | 27.4 | 36.9 | 32.7 |
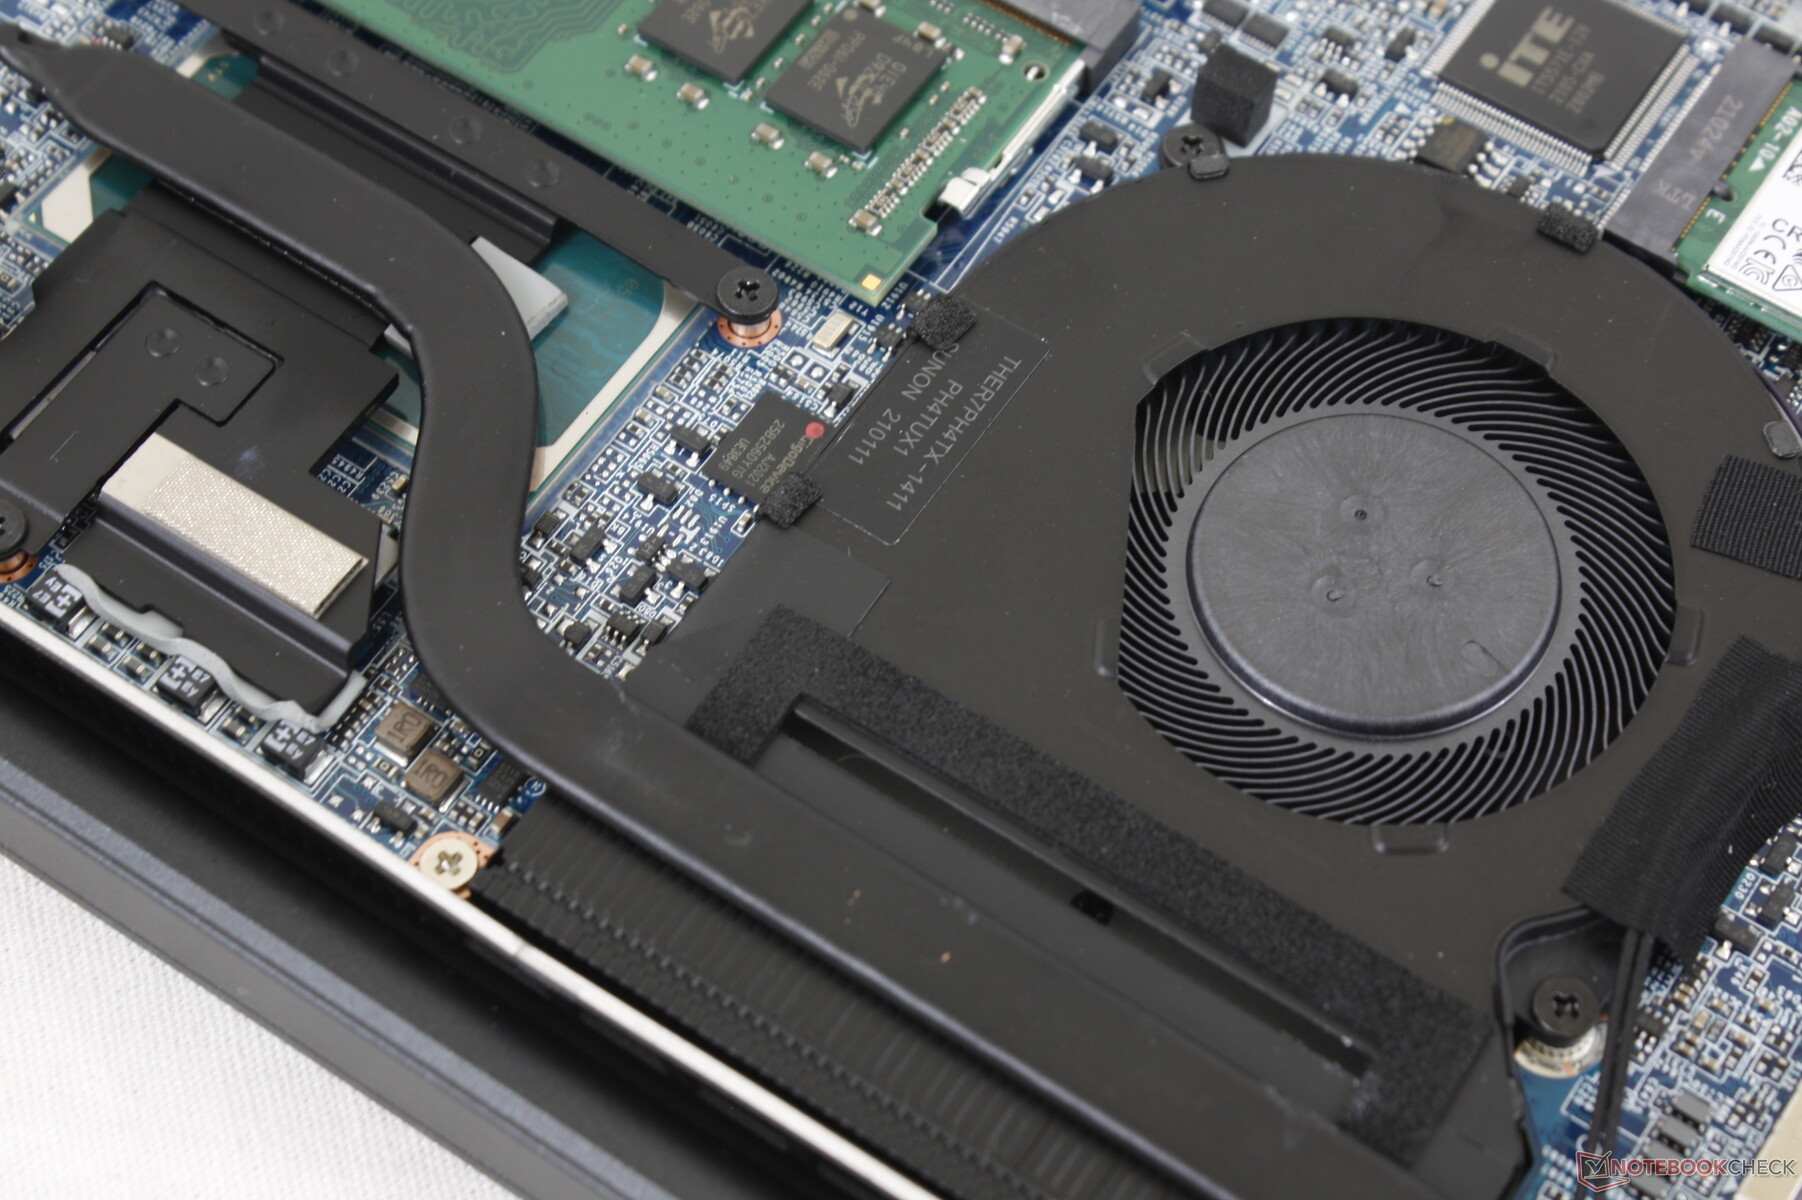
Emissions
System Noise — Loud Only When Gaming
The internal ~45 mm fan is usually running when emailing or web browsing, but it remains quiet enough at 27.2 dB(A) or under to be unnoticeable in most conditions. It's not until the system is stressed with high loads like games where fan noise can be between 37 to 47 dB(A) where the Xenia 14 can be louder than many other subnotebooks.
| ADATA XPG Xenia 14 Iris Xe G7 96EUs, i7-1165G7, ADATA XPG Gammix S50 Lite 512GB | MSI Prestige 14 Evo A11M-005 Iris Xe G7 96EUs, i7-1185G7, Phison 512GB SM280512GKBB4S-E162 | Infinix INBook X1 Pro Iris Plus Graphics G7 (Ice Lake 64 EU), i7-1065G7, Phison C-E80T512G4-P3D3B3E13 | Honor Magicbook 14 i7-1165G7 Iris Xe G7 96EUs, i7-1165G7, WDC PC SN730 SDBPNTY-512G | LG Gram 14Z90P-G.AA79G Iris Xe G7 96EUs, i7-1165G7, SK Hynix PC601 1TB HFS001TD9TNG | VAIO Z VJZ141C11L Iris Xe G7 96EUs, i7-11375H, Samsung PM9A1 MZVL2512HCJQ | |
|---|---|---|---|---|---|---|
| Noise | -11% | 6% | -1% | 6% | -10% | |
| off / environment * | 25.2 | 24 5% | 24.6 2% | 24 5% | 26 -3% | 26.1 -4% |
| Idle Minimum * | 25.2 | 25 1% | 25.1 -0% | 24 5% | 26 -3% | 26.1 -4% |
| Idle Average * | 26.5 | 27 -2% | 25.1 5% | 25 6% | 26 2% | 26.1 2% |
| Idle Maximum * | 26.5 | 39 -47% | 25.1 5% | 28 -6% | 26 2% | 29.9 -13% |
| Load Average * | 30.9 | 43 -39% | 32.7 -6% | 36 -17% | 30.5 1% | 36.3 -17% |
| Witcher 3 ultra * | 37.4 | 39 -4% | 33.4 11% | 43.7 -17% | ||
| Load Maximum * | 46.7 | 43 8% | 33.4 28% | 46 1% | 30.5 35% | 55.4 -19% |
* ... smaller is better
Noise Level
| Idle |
| 25.2 / 26.5 / 26.5 dB(A) |
| Load |
| 30.9 / 46.7 dB(A) |
 | ||
30 dB silent 40 dB(A) audible 50 dB(A) loud |
||
min: | ||
Temperature
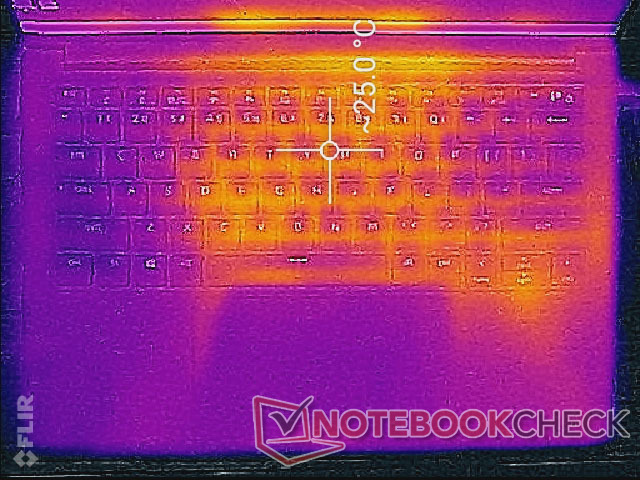
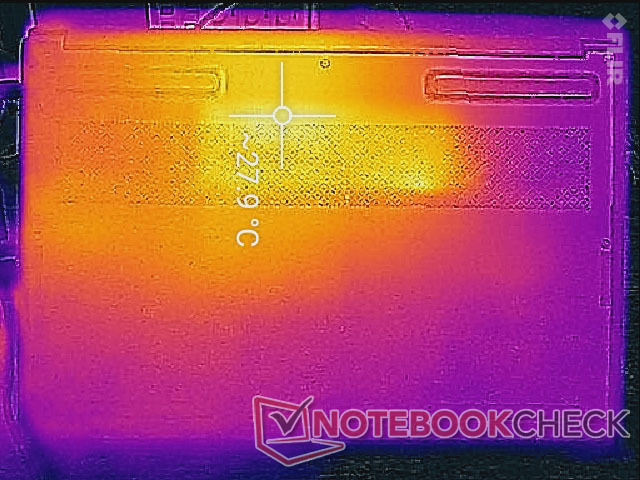
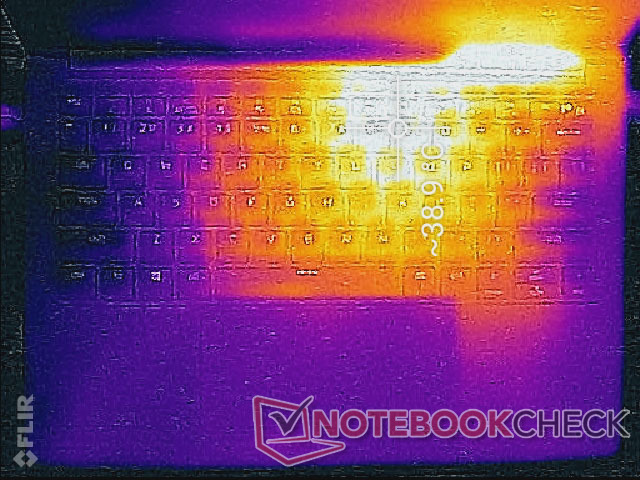
Surface temperatures are warmest toward the rear where they can be up to 39 C near the top row of the keyboard or even 45 C on the bottom when running high loads for extended periods. The rest of the laptop remains relatively cool and so skin temperature is still low on average.
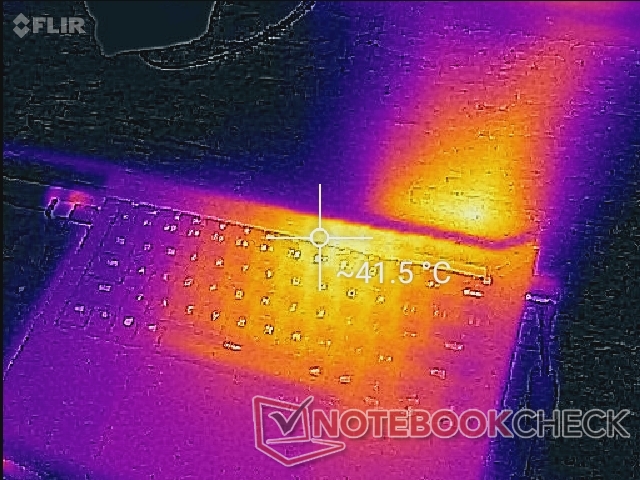
(+) The maximum temperature on the upper side is 39.2 °C / 103 F, compared to the average of 35.9 °C / 97 F, ranging from 21.4 to 59 °C for the class Subnotebook.
(±) The bottom heats up to a maximum of 44.8 °C / 113 F, compared to the average of 39.3 °C / 103 F
(+) In idle usage, the average temperature for the upper side is 24 °C / 75 F, compared to the device average of 30.8 °C / 87 F.
(+) The palmrests and touchpad are cooler than skin temperature with a maximum of 24 °C / 75.2 F and are therefore cool to the touch.
(+) The average temperature of the palmrest area of similar devices was 28.2 °C / 82.8 F (+4.2 °C / 7.6 F).

Stress Test
When stressed with Prime95, the CPU would boost to 4.1 GHz for a few seconds before steadily dropping and stabilizing at 3.2 GHz and 89 C. Its Turbo Boost potential is quite high when compared to other laptops with the same CPU. The recent Pavilion 15, for example, would stabilize at a slower 2.0 to 2.5 GHz range when subjected to the same Prime95 conditions.
Running on battery will not severely impact performance. A 3DMark 11 test on batteries would return Physics and Graphics scores of 11920 and 6447 points, respectively, compared to 12024 and 6571 points when on mains.
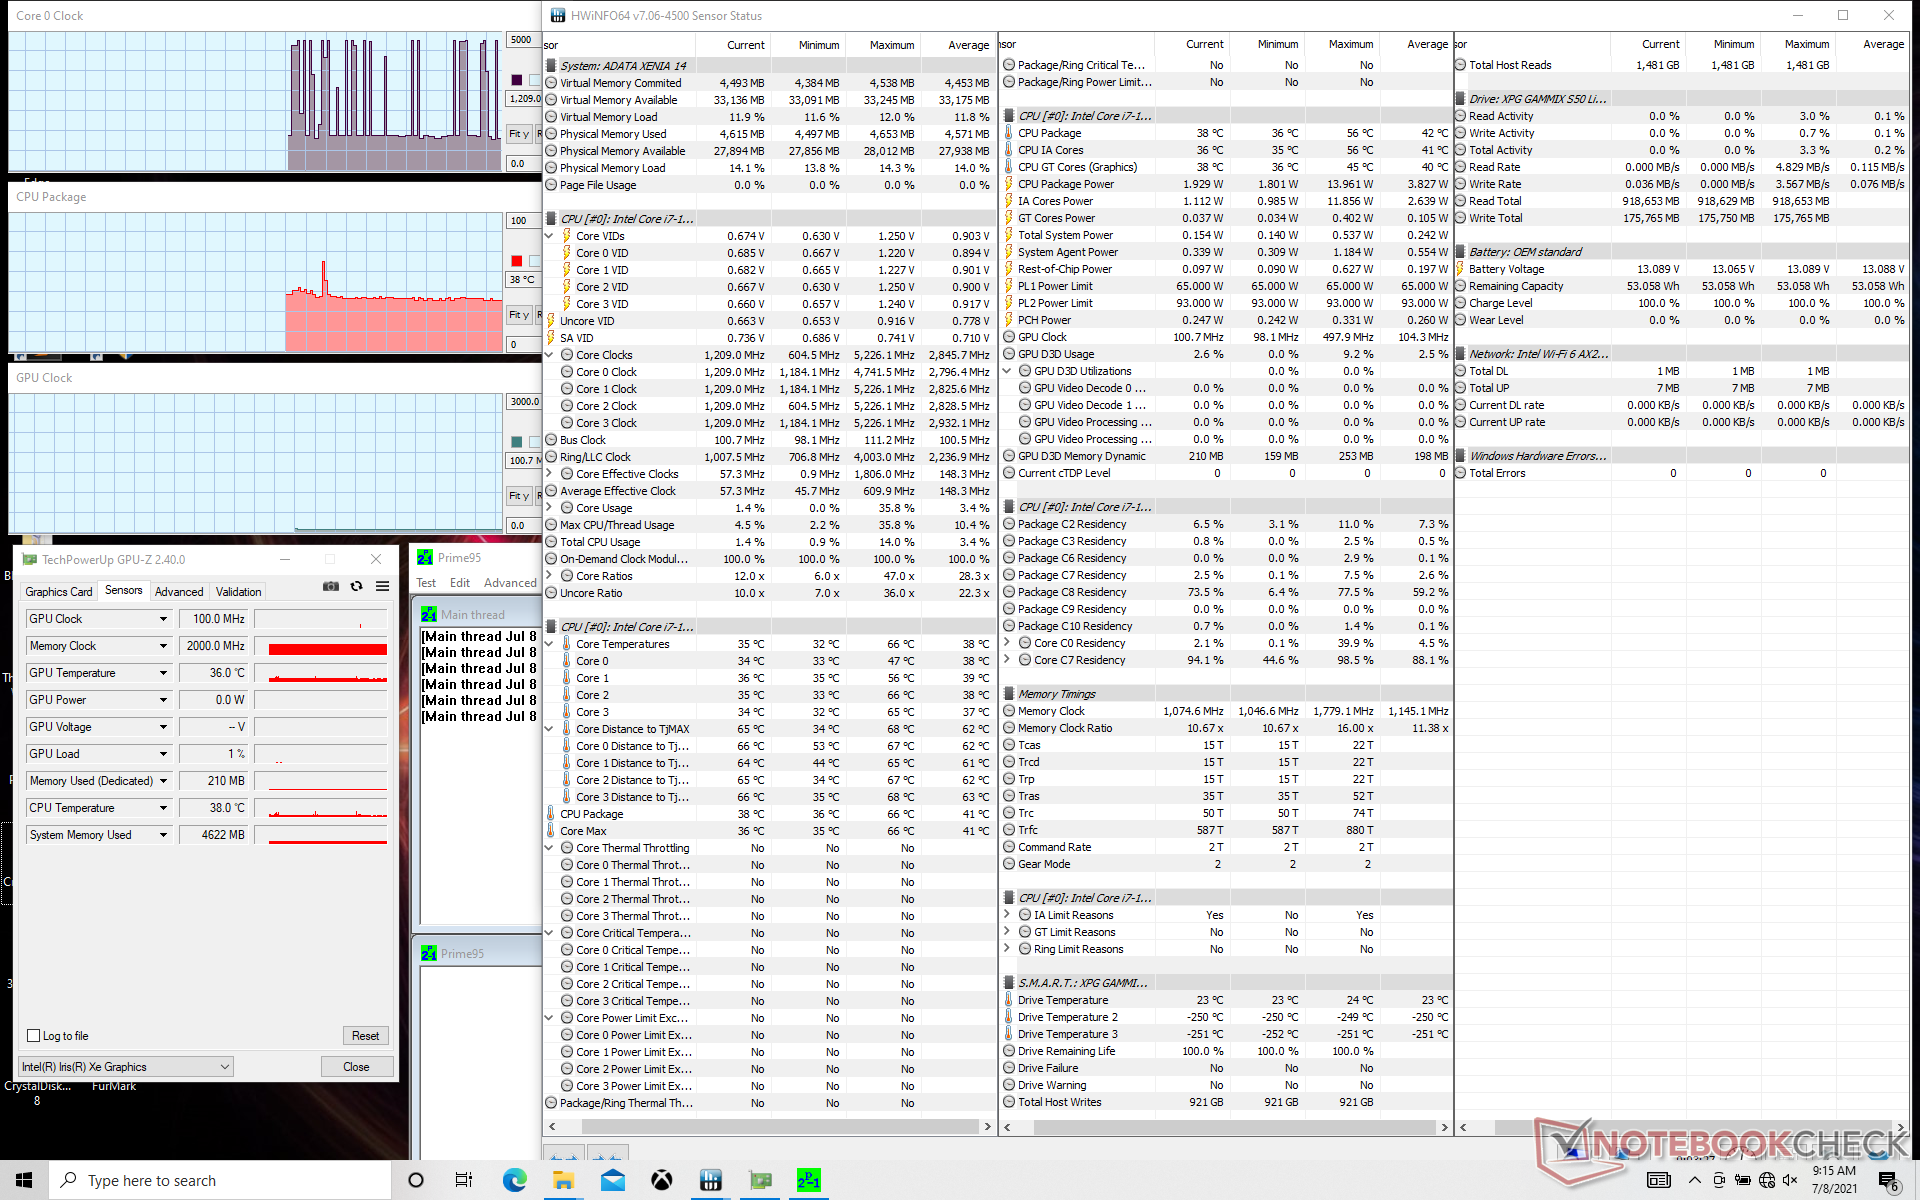
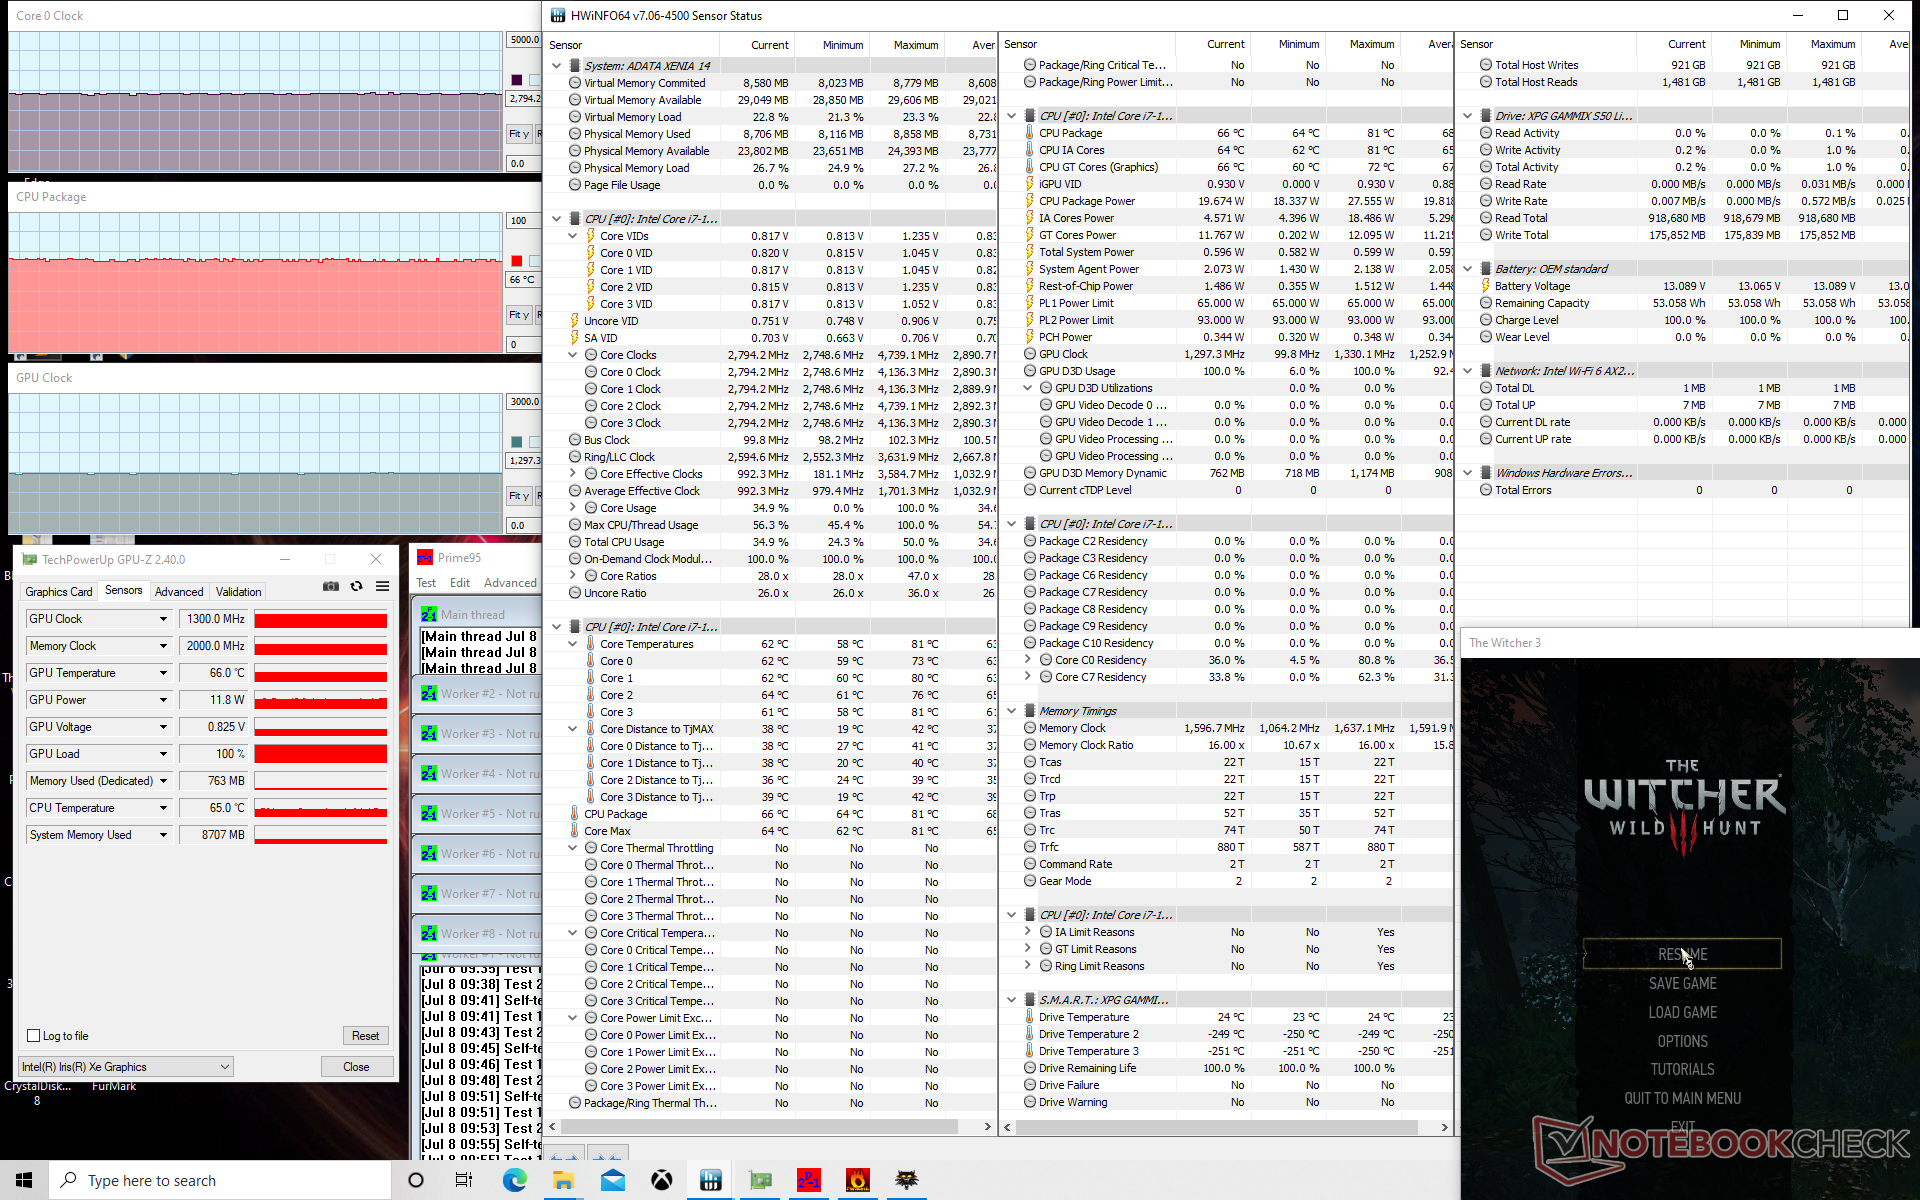
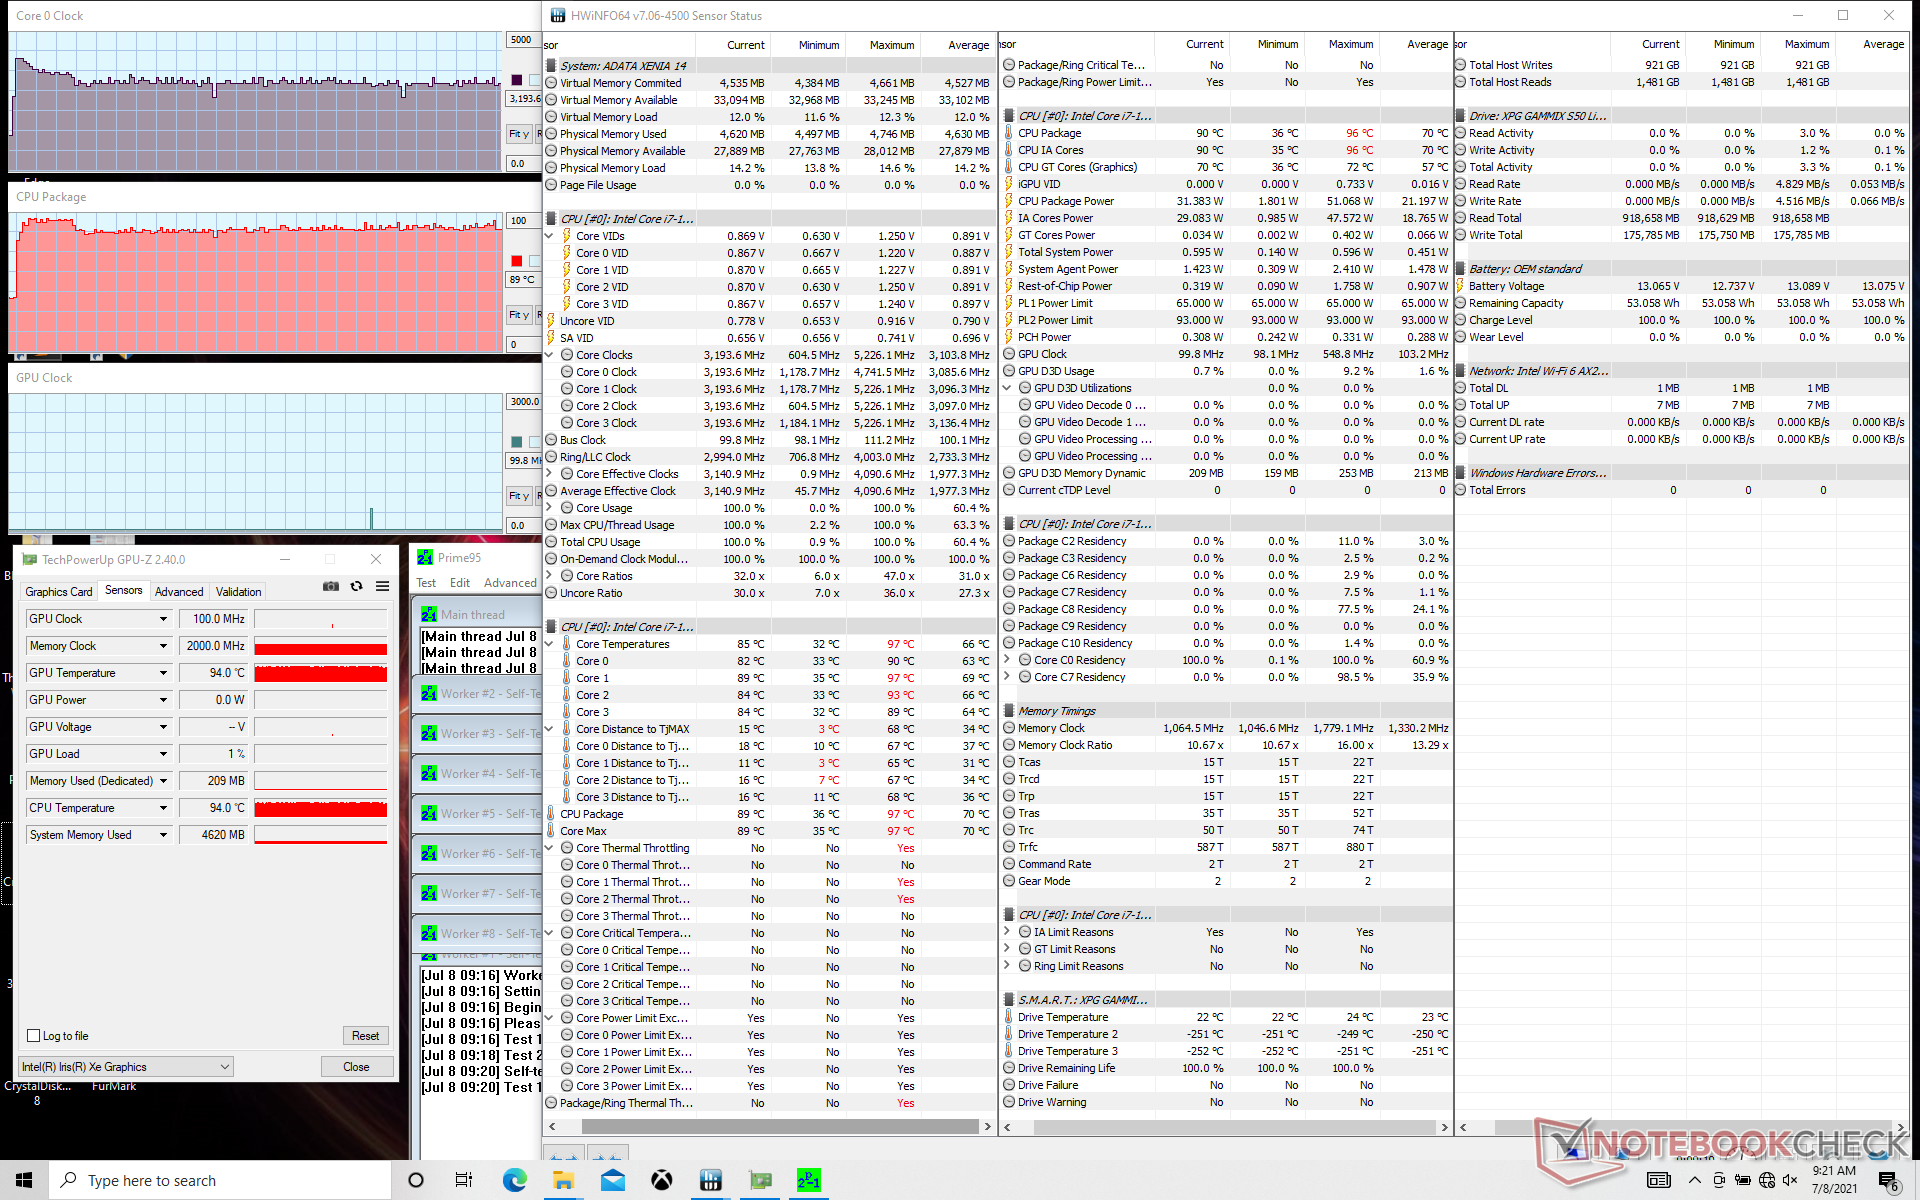
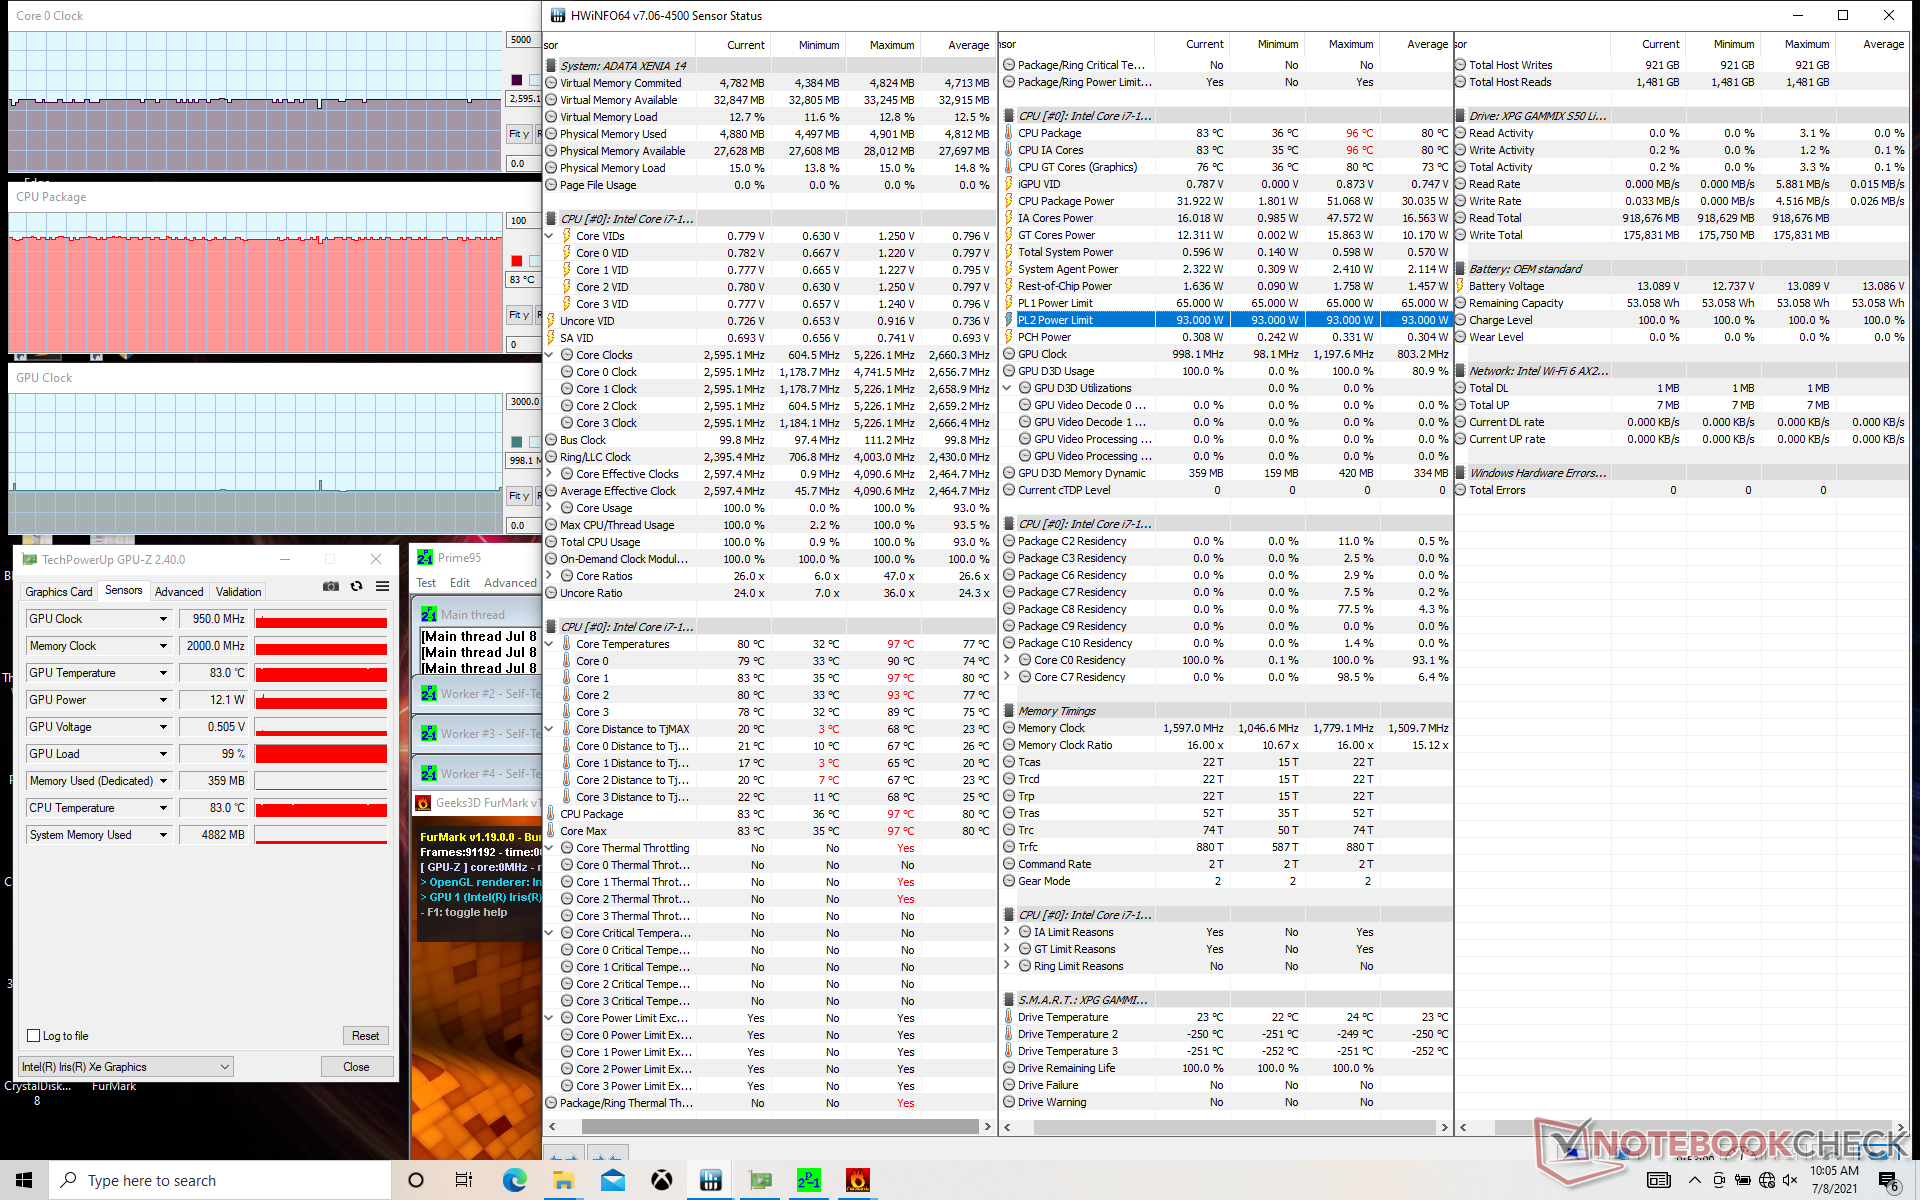
| CPU Clock (GHz) | GPU Clock (MHz) | Average CPU Temperature (°C) | |
| System Idle | -- | - | 38 |
| Prime95 Stress | 3.2 - 3.3 | -- | 90 |
| Prime95 + FurMark Stress | 2.6 | 950 | 83 |
| Witcher 3 Stress | 2.8 | 1300 | 66 |
Speakers

Audio quality is perhaps one of the more disappointing aspects of the Xenia 14. Not only is bass reproduction poor, but maximum volume is on the low side. You're going to want headphones or external speakers for multimedia playback.
ADATA XPG Xenia 14 audio analysis
(±) | speaker loudness is average but good (74 dB)
Bass 100 - 315 Hz
(-) | nearly no bass - on average 19.8% lower than median
(±) | linearity of bass is average (14.6% delta to prev. frequency)
Mids 400 - 2000 Hz
(+) | balanced mids - only 2.7% away from median
(+) | mids are linear (4.4% delta to prev. frequency)
Highs 2 - 16 kHz
(+) | balanced highs - only 1.6% away from median
(+) | highs are linear (4.1% delta to prev. frequency)
Overall 100 - 16.000 Hz
(±) | linearity of overall sound is average (16.8% difference to median)
Compared to same class
» 42% of all tested devices in this class were better, 8% similar, 50% worse
» The best had a delta of 5%, average was 19%, worst was 53%
Compared to all devices tested
» 28% of all tested devices were better, 7% similar, 65% worse
» The best had a delta of 4%, average was 24%, worst was 134%
Apple MacBook 12 (Early 2016) 1.1 GHz audio analysis
(+) | speakers can play relatively loud (83.6 dB)
Bass 100 - 315 Hz
(±) | reduced bass - on average 11.3% lower than median
(±) | linearity of bass is average (14.2% delta to prev. frequency)
Mids 400 - 2000 Hz
(+) | balanced mids - only 2.4% away from median
(+) | mids are linear (5.5% delta to prev. frequency)
Highs 2 - 16 kHz
(+) | balanced highs - only 2% away from median
(+) | highs are linear (4.5% delta to prev. frequency)
Overall 100 - 16.000 Hz
(+) | overall sound is linear (10.2% difference to median)
Compared to same class
» 7% of all tested devices in this class were better, 2% similar, 91% worse
» The best had a delta of 5%, average was 19%, worst was 53%
Compared to all devices tested
» 4% of all tested devices were better, 1% similar, 95% worse
» The best had a delta of 4%, average was 24%, worst was 134%
Energy Management — High Performance-per-Watt
Power Consumption
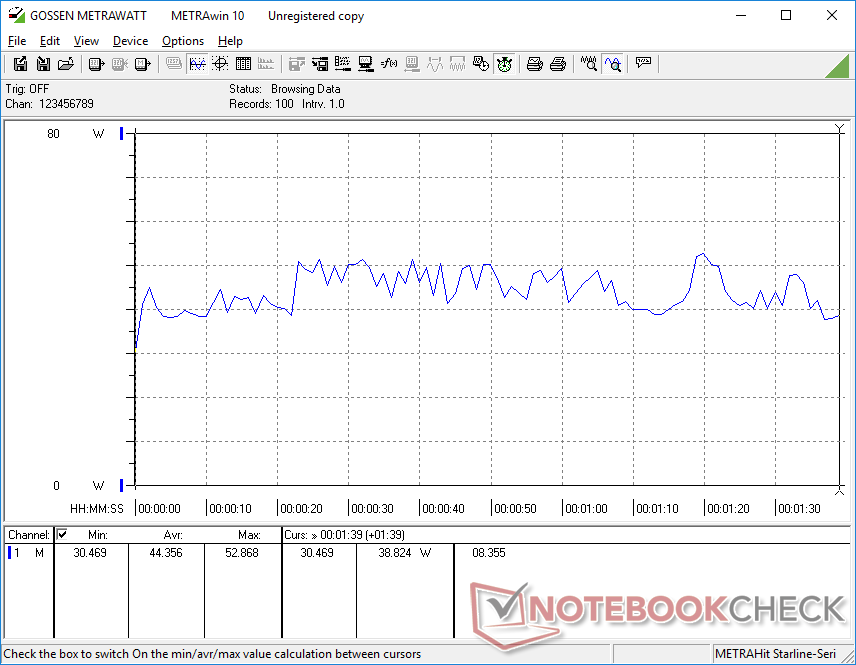
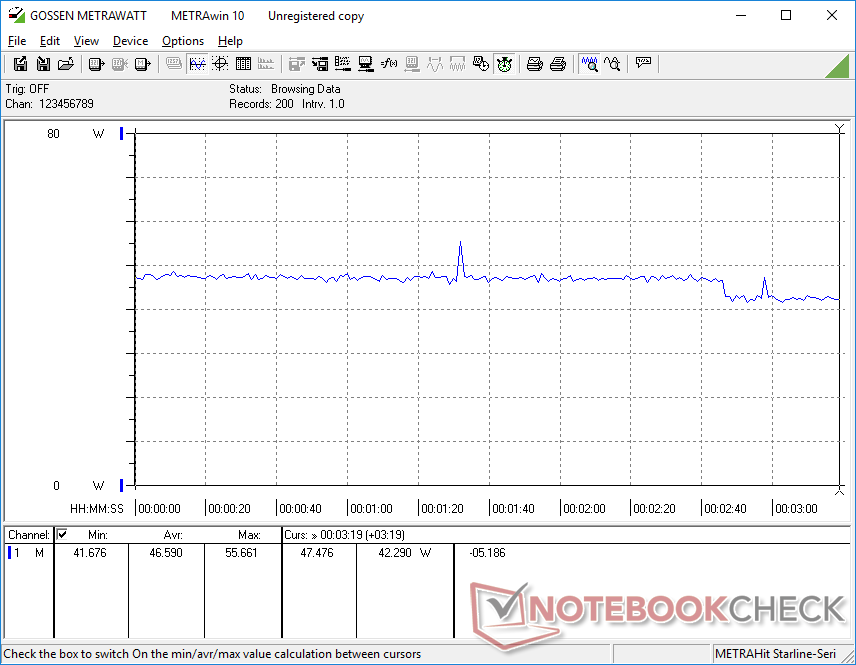
The system is very power efficient drawing just 3 W to 6 W depending on the brightness level when idling on desktop. Running demanding loads like games will draw around 44 W to be higher than what we recorded on the Honor Magicbook 14 or LG Gram 14 each with the same CPU and GPU, but overall performance is slightly higher on our ADATA system.
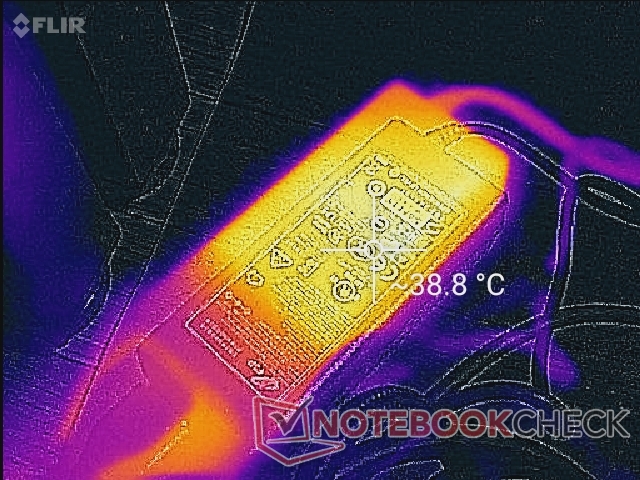
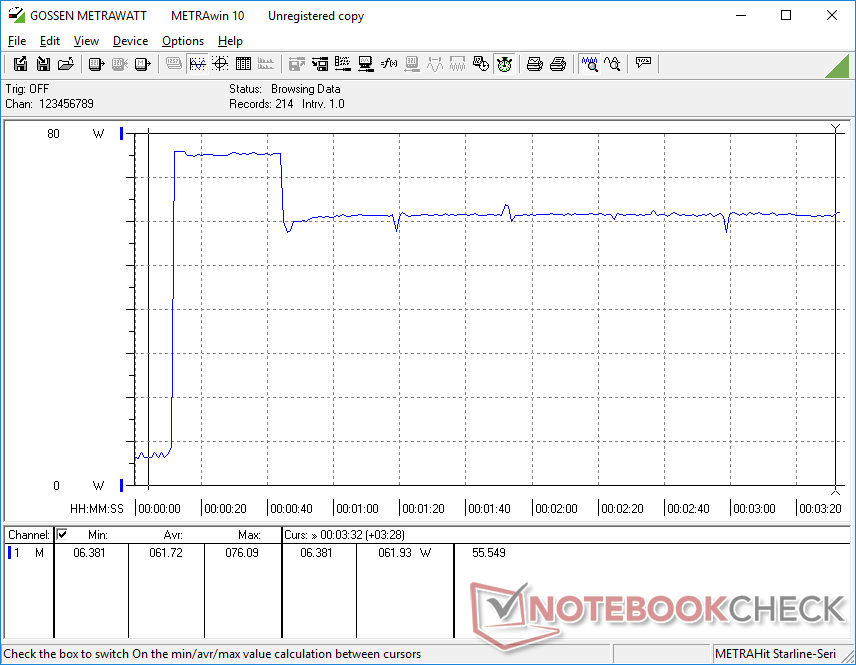
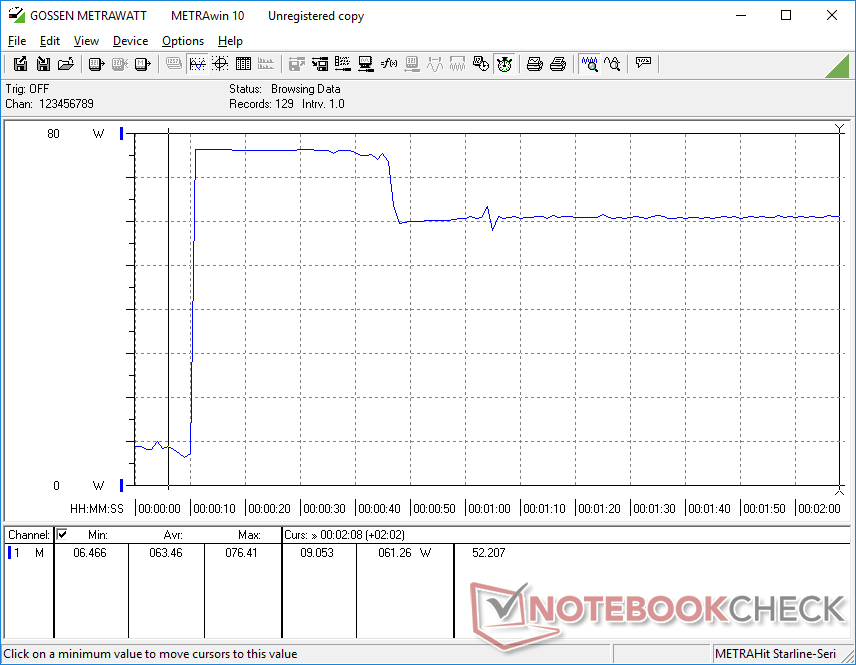
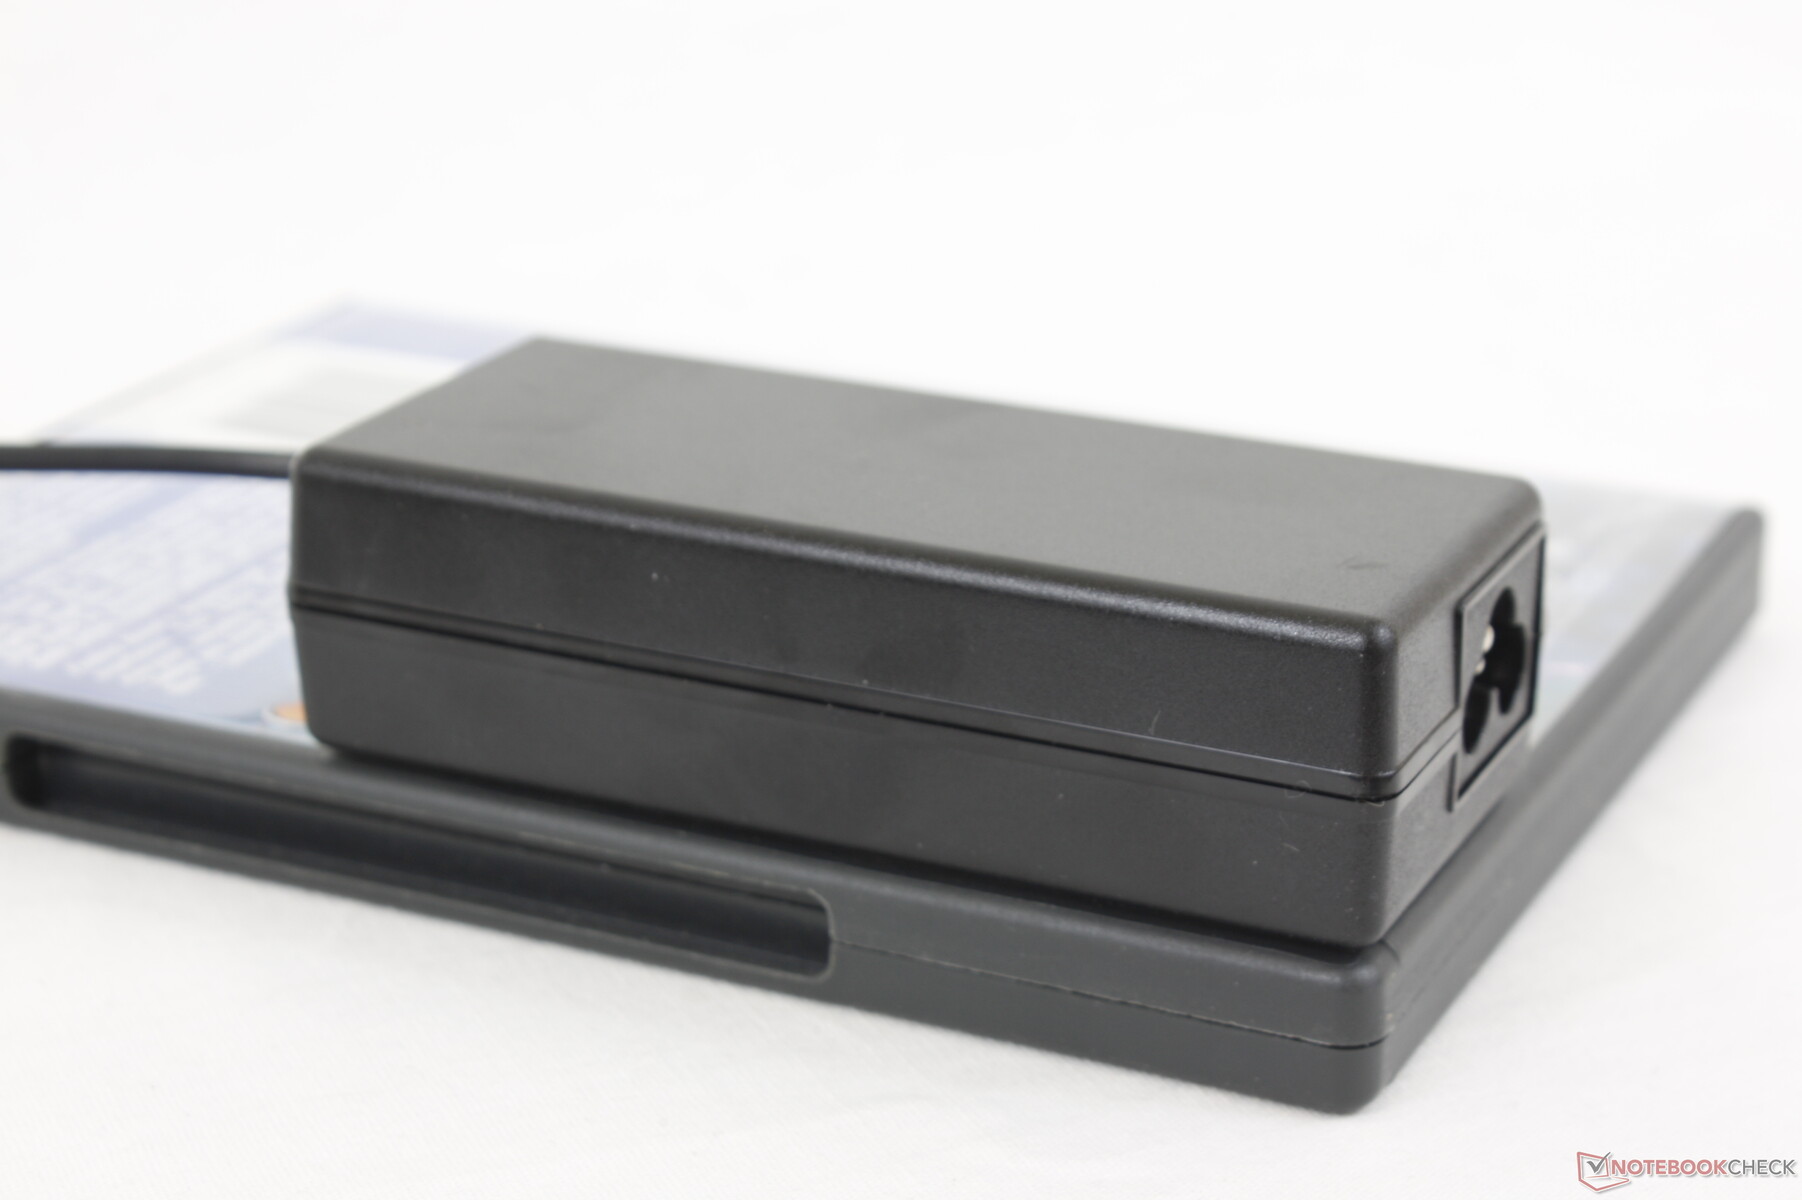
We're able to record a temporary maximum draw of 76.4 W from the small (~10.7 x 4.5 x 3.1 cm) 65 W AC adapter.
| Off / Standby | |
| Idle | |
| Load |
|
Key:
min: | |
| ADATA XPG Xenia 14 i7-1165G7, Iris Xe G7 96EUs, ADATA XPG Gammix S50 Lite 512GB, IPS, 1920x1200, 14" | MSI Prestige 14 Evo A11M-005 i7-1185G7, Iris Xe G7 96EUs, Phison 512GB SM280512GKBB4S-E162, IPS-Level, 1920x1080, 14" | Infinix INBook X1 Pro i7-1065G7, Iris Plus Graphics G7 (Ice Lake 64 EU), Phison C-E80T512G4-P3D3B3E13, IPS, 1920x1080, 14" | Honor Magicbook 14 i7-1165G7 i7-1165G7, Iris Xe G7 96EUs, WDC PC SN730 SDBPNTY-512G, IPS, 1920x1080, 14" | LG Gram 14Z90P-G.AA79G i7-1165G7, Iris Xe G7 96EUs, SK Hynix PC601 1TB HFS001TD9TNG, IPS, 1920x1200, 14" | VAIO Z VJZ141C11L i7-11375H, Iris Xe G7 96EUs, Samsung PM9A1 MZVL2512HCJQ, IPS, 3840x2160, 14" | |
|---|---|---|---|---|---|---|
| Power Consumption | -29% | -45% | -16% | 8% | -88% | |
| Idle Minimum * | 2.9 | 5 -72% | 5 -72% | 4 -38% | 2.5 14% | 9.5 -228% |
| Idle Average * | 5.5 | 7 -27% | 11.5 -109% | 6 -9% | 5.3 4% | 13.7 -149% |
| Idle Maximum * | 5.9 | 11 -86% | 12 -103% | 10 -69% | 9.5 -61% | 14.4 -144% |
| Load Average * | 44.4 | 54 -22% | 48.7 -10% | 34 23% | 26.2 41% | 54.3 -22% |
| Witcher 3 ultra * | 46.6 | 39 16% | 46.4 -0% | 46.1 1% | ||
| Load Maximum * | 76.4 | 65 15% | 58.8 23% | 68 11% | 42.8 44% | 65.5 14% |
* ... smaller is better
Power Consumption Witcher 3 / Stresstest
Battery Life
Runtimes from the 53 Wh battery are good at almost 10 hours of real-world WLAN use to be similar to what we observed on the Honor MagicBook 14. Charging from empty to full capacity is quite fast at about an hour and 15 minutes. Users can also recharge via any of the two USB-C ports along the edges of the laptop.
| ADATA XPG Xenia 14 i7-1165G7, Iris Xe G7 96EUs, 53 Wh | MSI Prestige 14 Evo A11M-005 i7-1185G7, Iris Xe G7 96EUs, 52.4 Wh | Infinix INBook X1 Pro i7-1065G7, Iris Plus Graphics G7 (Ice Lake 64 EU), 55 Wh | Honor Magicbook 14 i7-1165G7 i7-1165G7, Iris Xe G7 96EUs, 56 Wh | LG Gram 14Z90P-G.AA79G i7-1165G7, Iris Xe G7 96EUs, 72 Wh | VAIO Z VJZ141C11L i7-11375H, Iris Xe G7 96EUs, 53 Wh | |
|---|---|---|---|---|---|---|
| Battery Runtime | -24% | -14% | -2% | 44% | -28% | |
| WiFi v1.3 | 592 | 451 -24% | 508 -14% | 580 -2% | 854 44% | 424 -28% |
| Reader / Idle | 825 | 2925 | ||||
| Load | 68 | 107 | 219 |
Pros
Cons
Verdict — Top 14-inch Laptop Under 1 Kg
We didn't have high expectations coming into this review. ADATA isn't exactly known for its laptops and so we weren't expecting much from its first 14-inch Ultrabook. With that said, we're pleasantly surprised by how well the Xenia 14 looks and performs. Not only is it incredibly light, but it has a color accurate 16:10 display, high CPU and GPU performance, easy RAM and SSD serviceability, plenty of port options including Thunderbolt 4, and long battery life. It packs a lot of punch and features considering the size and weight to be better than even the LG Gram series.
The ADATA Xenia 14 doesn't sacrifice performance or features in order to reach the superlight <1 kg target weight.
There's room for improvement especially in regard to the hinge which we find to be the weakest aspect of the chassis. The underwhelming speakers, soft keyboard keys, and lack of a webcam shutter are also minor setbacks. The heavier HP Spectre may be the better option in this regard. Otherwise, the Xenia 14 is near the top of our list for travelers or students in the market for a modern ultralight 14-inch laptop.
Price and availability
ADATA XPG Xenia 14
- 07/14/2021 v7 (old)
Allen Ngo


Price comparison
