 Deutsch
 English
 Español
 Français
 Italiano
 Nederlands
 Polski
 Português
 Русский
 Türkçe
 Svenska
 Chinese
 Magyar
ADATA XPG Xenia Xe Review: The Tiger Lake Laptop Designed By Intel
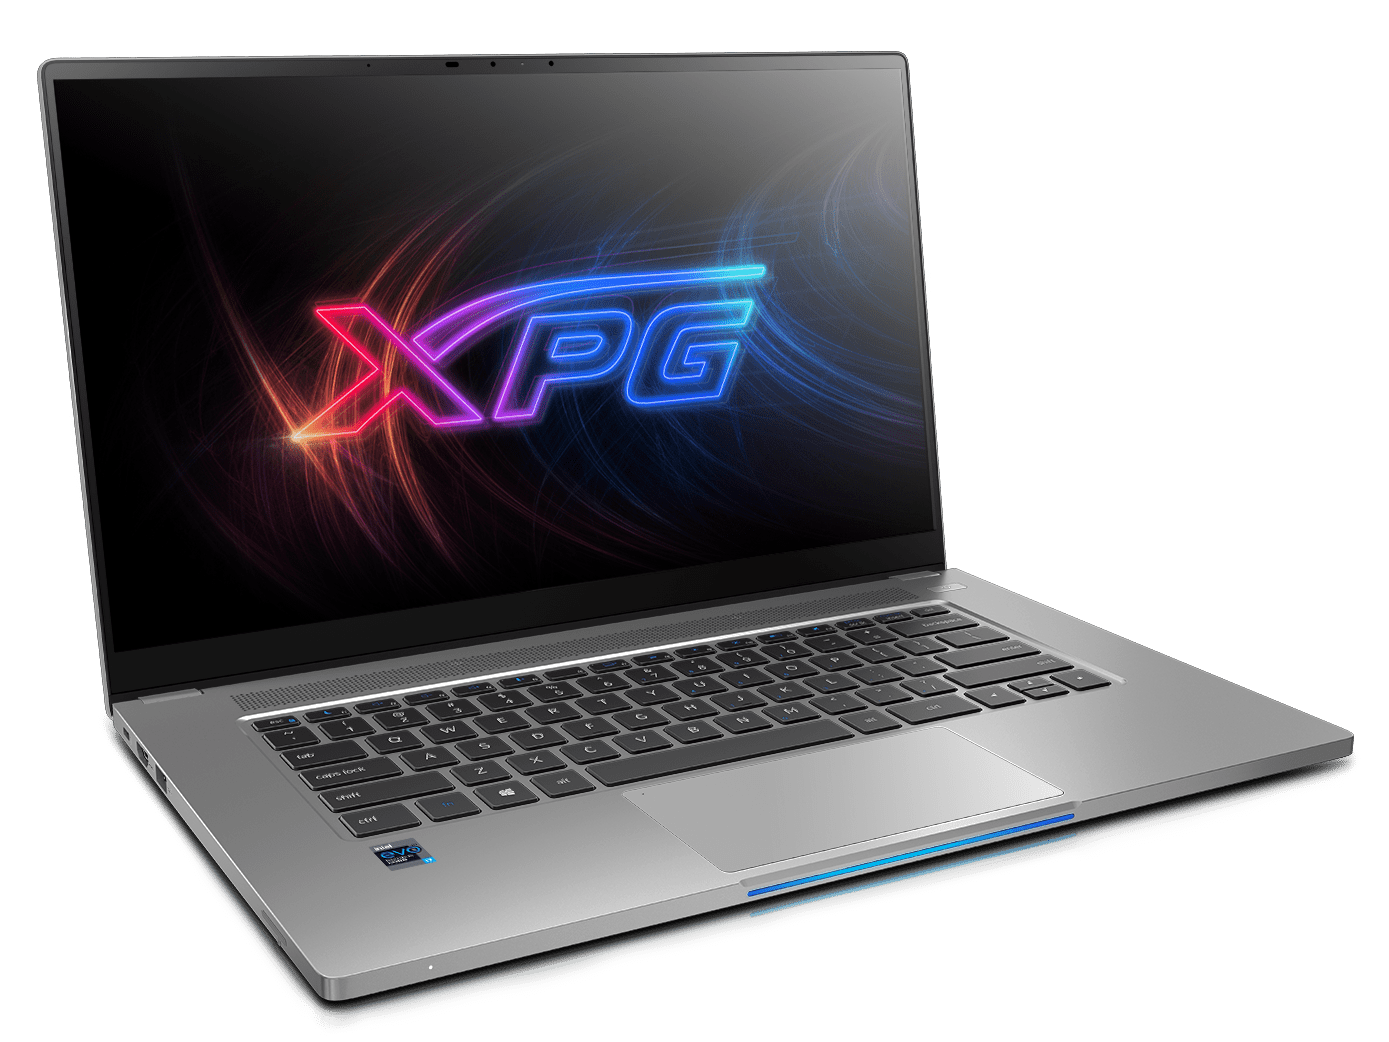
The ADATA XPG Xenia Xe laptop is an Intel-designed chassis with customized parts and skins by ADATA. Thus, users may find this same laptop rebranded by other manufacturers depending on the market or region. In ADATA's case, the XPG Xenia Xe is advertised as a "Gaming Lifestyle Ultrabook" that's part casual gamer and part multimedia machine all powered by the latest 11th gen Intel Tiger Lake CPU.
Competitors in this space include other upper mid-range to high-end 15.6-inch Ultrabooks like the Dell XPS 15, Microsoft Surface Laptop, Asus ZenBook 15, or the MSI Summit B15. Starting prices have not yet been revealed at the time of publishing, but ADATA plans to offer Core i5-1135G7 and Core i7-1165G7 SKUs with 8 GB to 16 GB of soldered RAM. The 1080p Gorilla Glass touchscreen and integrated Iris Xe graphics are fixed across the lineup.
potential competitors in comparison
Rating | Date | Model | Weight | Height | Size | Resolution | Best Price |
|---|---|---|---|---|---|---|---|
| 87.5 % | 05/2021 | ADATA XPG Xenia Xe i7-1165G7, Iris Xe G7 96EUs | 1.7 kg | 14.9 mm | 15.60" | 1920x1080 | |
| 89.4 % | 01/2020 | Apple MacBook Pro 15 2019 i9 Vega 20 i9-9980HK, Radeon Pro Vega 20 | 1.8 kg | 15.5 mm | 15.40" | 2880x1800 | |
| 86.8 % | 05/2020 | Dell XPS 15 9500 Core i5 i5-10300H, UHD Graphics 630 | 1.8 kg | 18 mm | 15.60" | 1920x1200 | |
| 85 % | 01/2020 | HP Spectre X360 15-5ZV31AV i7-10510U, GeForce MX250 | 2.1 kg | 19.3 mm | 15.60" | 3840x2160 | |
| 85.2 % | 03/2020 | Asus ZenBook 15 UX534FTC-A8190T i7-10510U, GeForce GTX 1650 Max-Q | 1.6 kg | 18.9 mm | 15.60" | 1920x1080 | |
| 87.1 % | 04/2021 | Lenovo Yoga Creator 7 15IMH05 82DS000VGE i7-10750H, GeForce GTX 1650 Mobile | 1.8 kg | 17.5 mm | 15.60" | 1920x1080 |
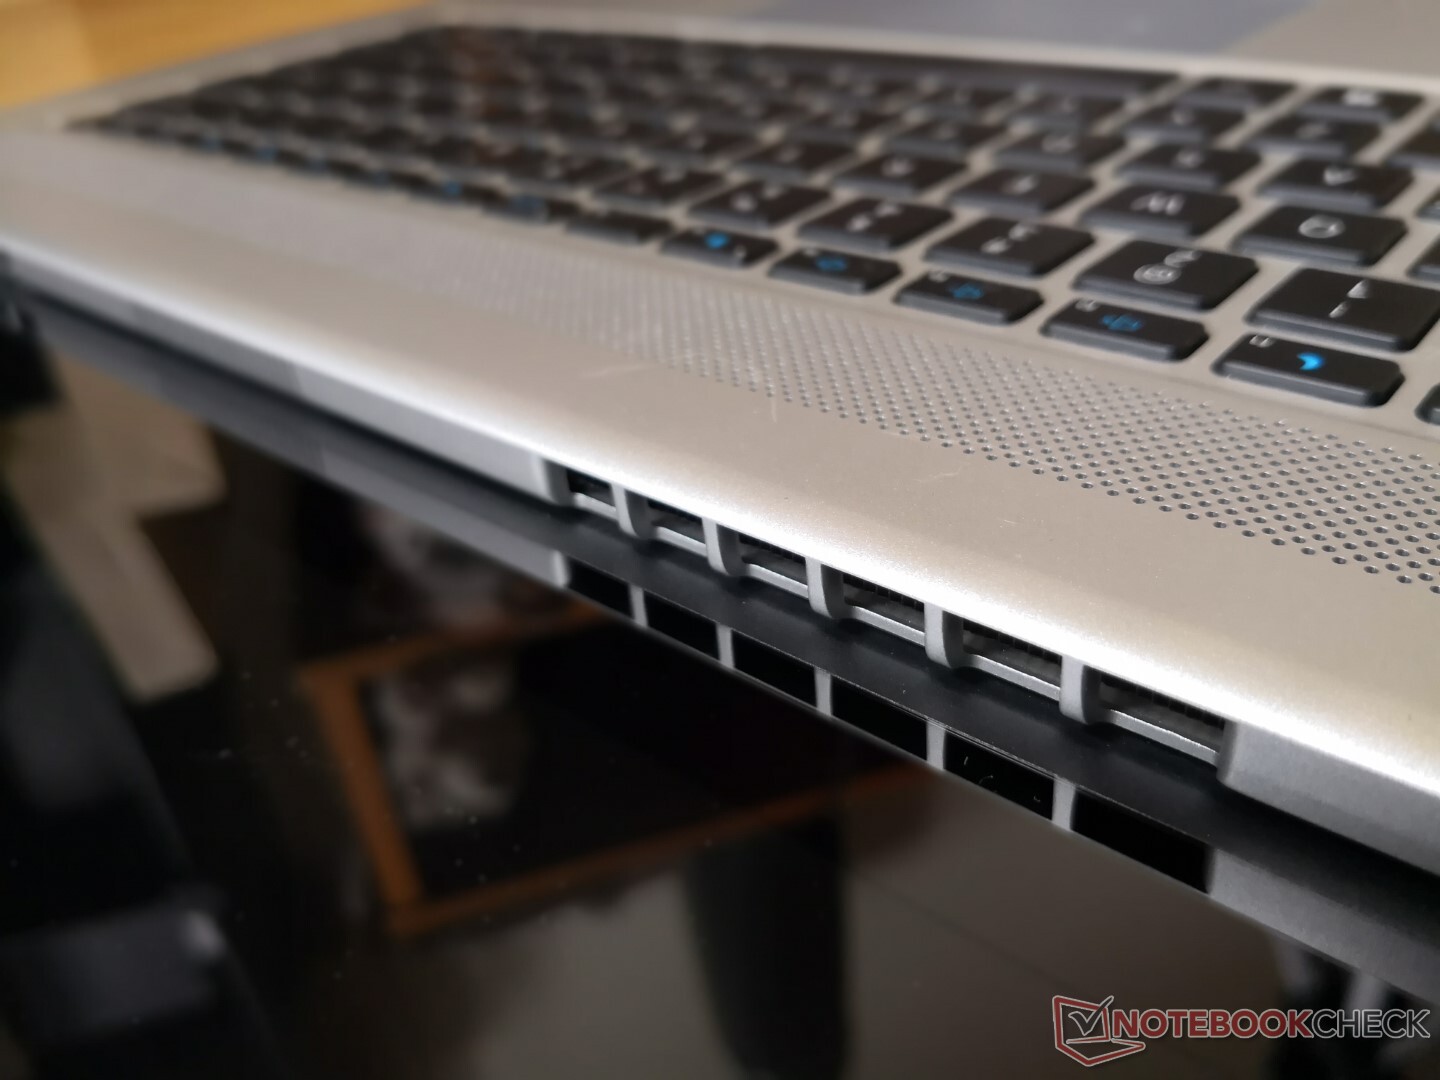
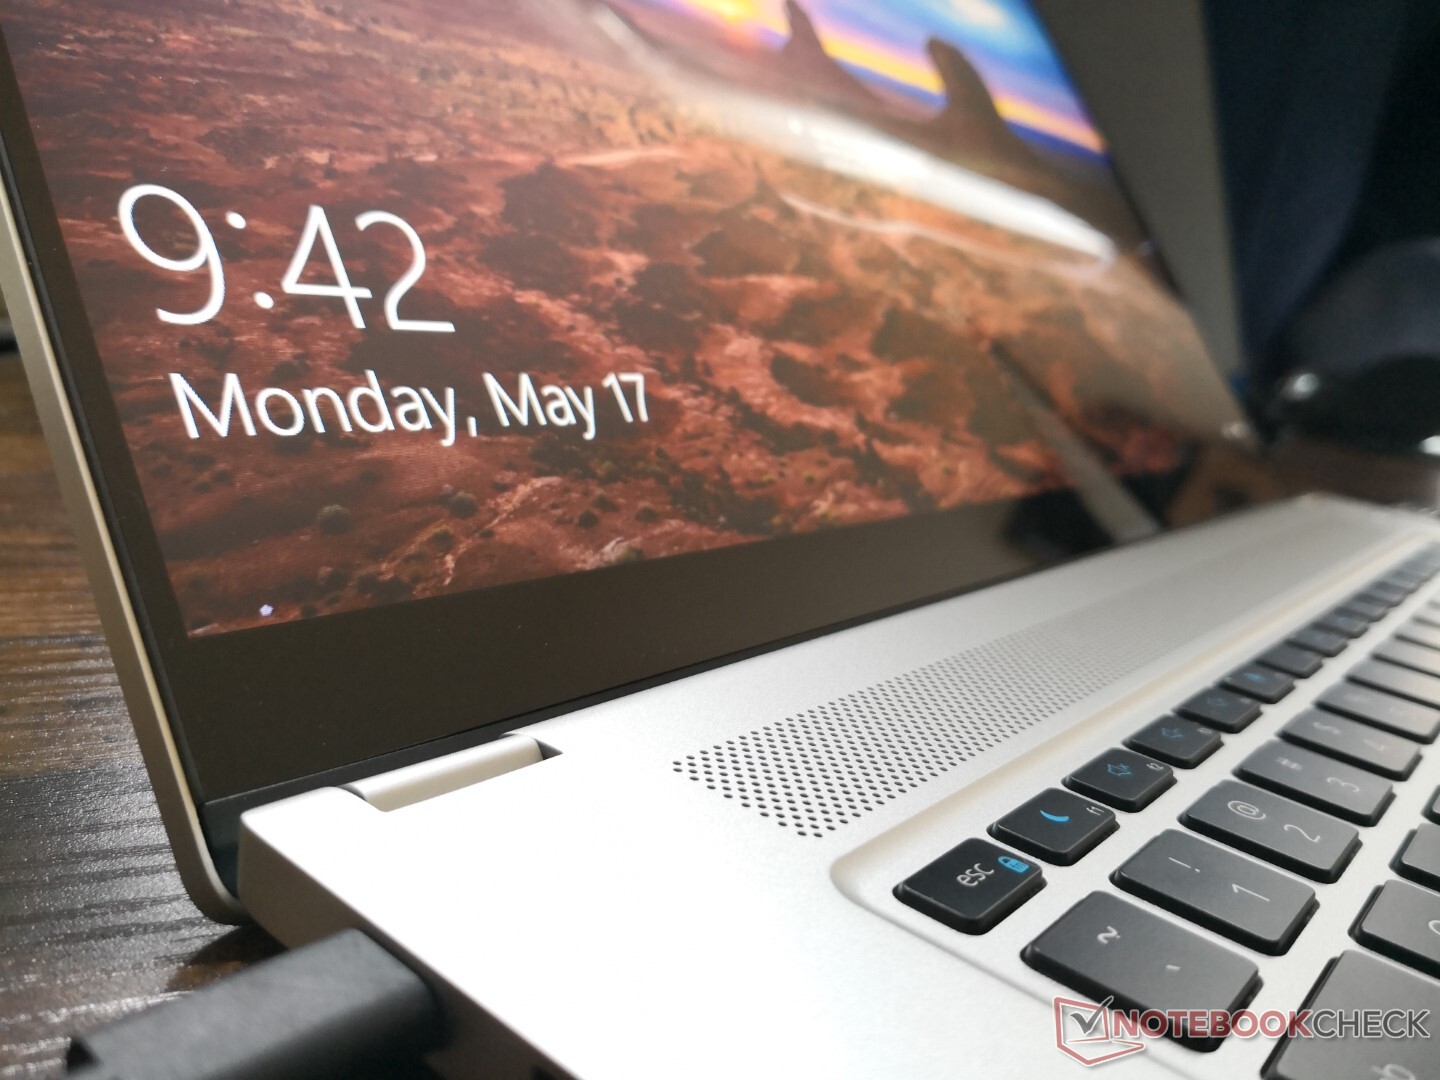
Case
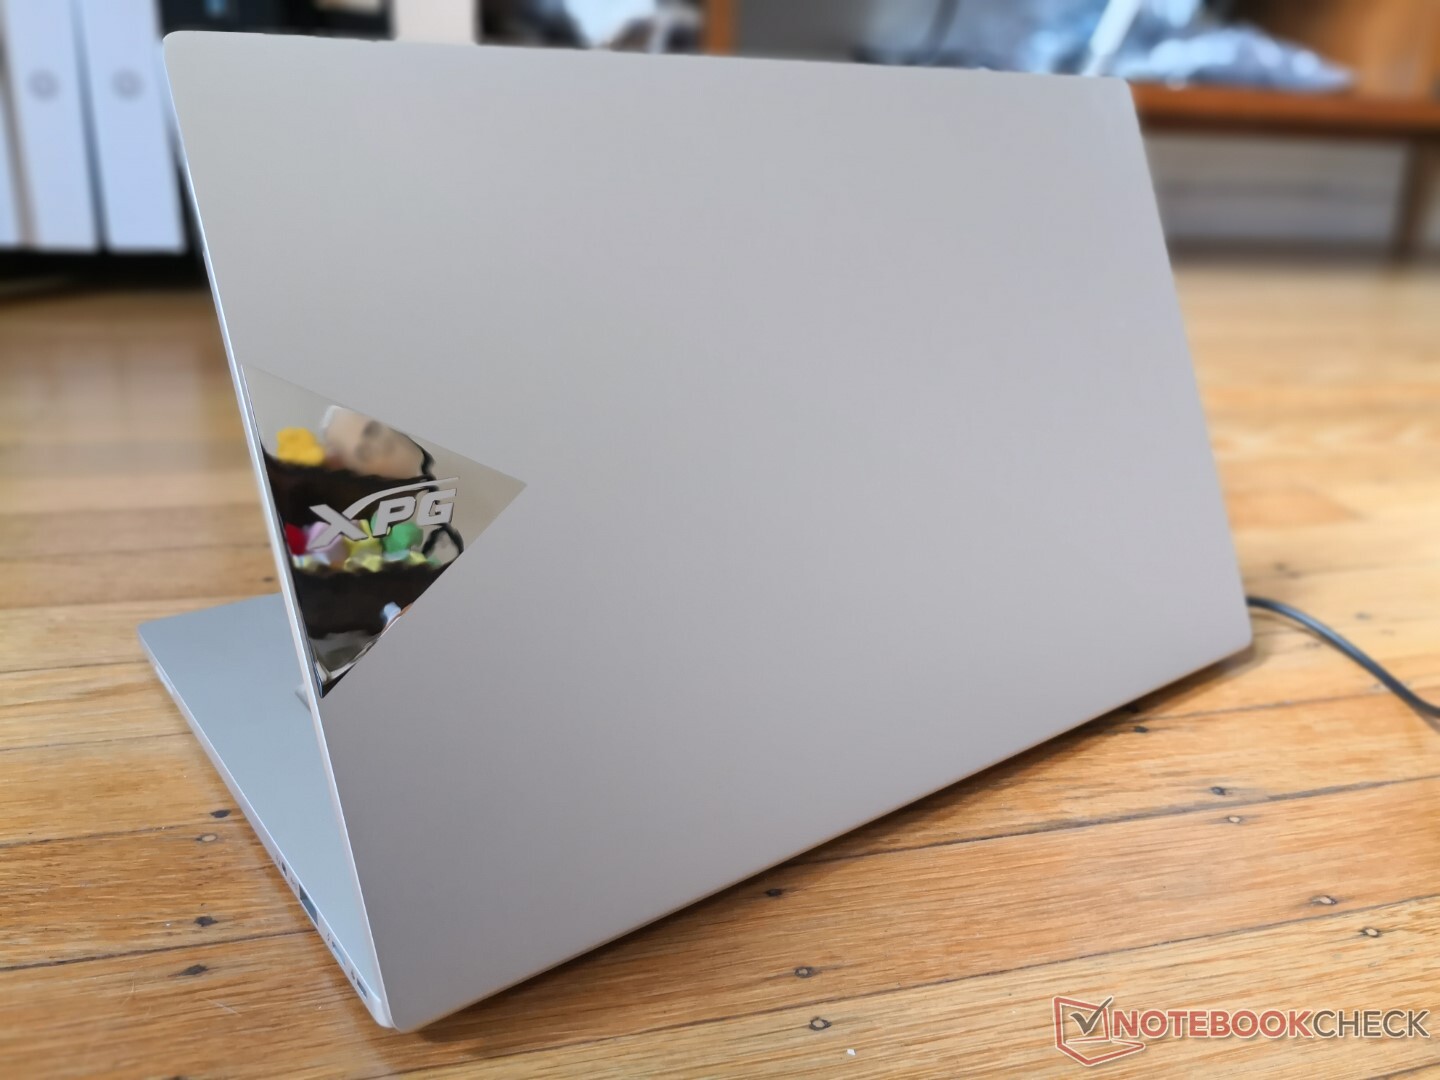
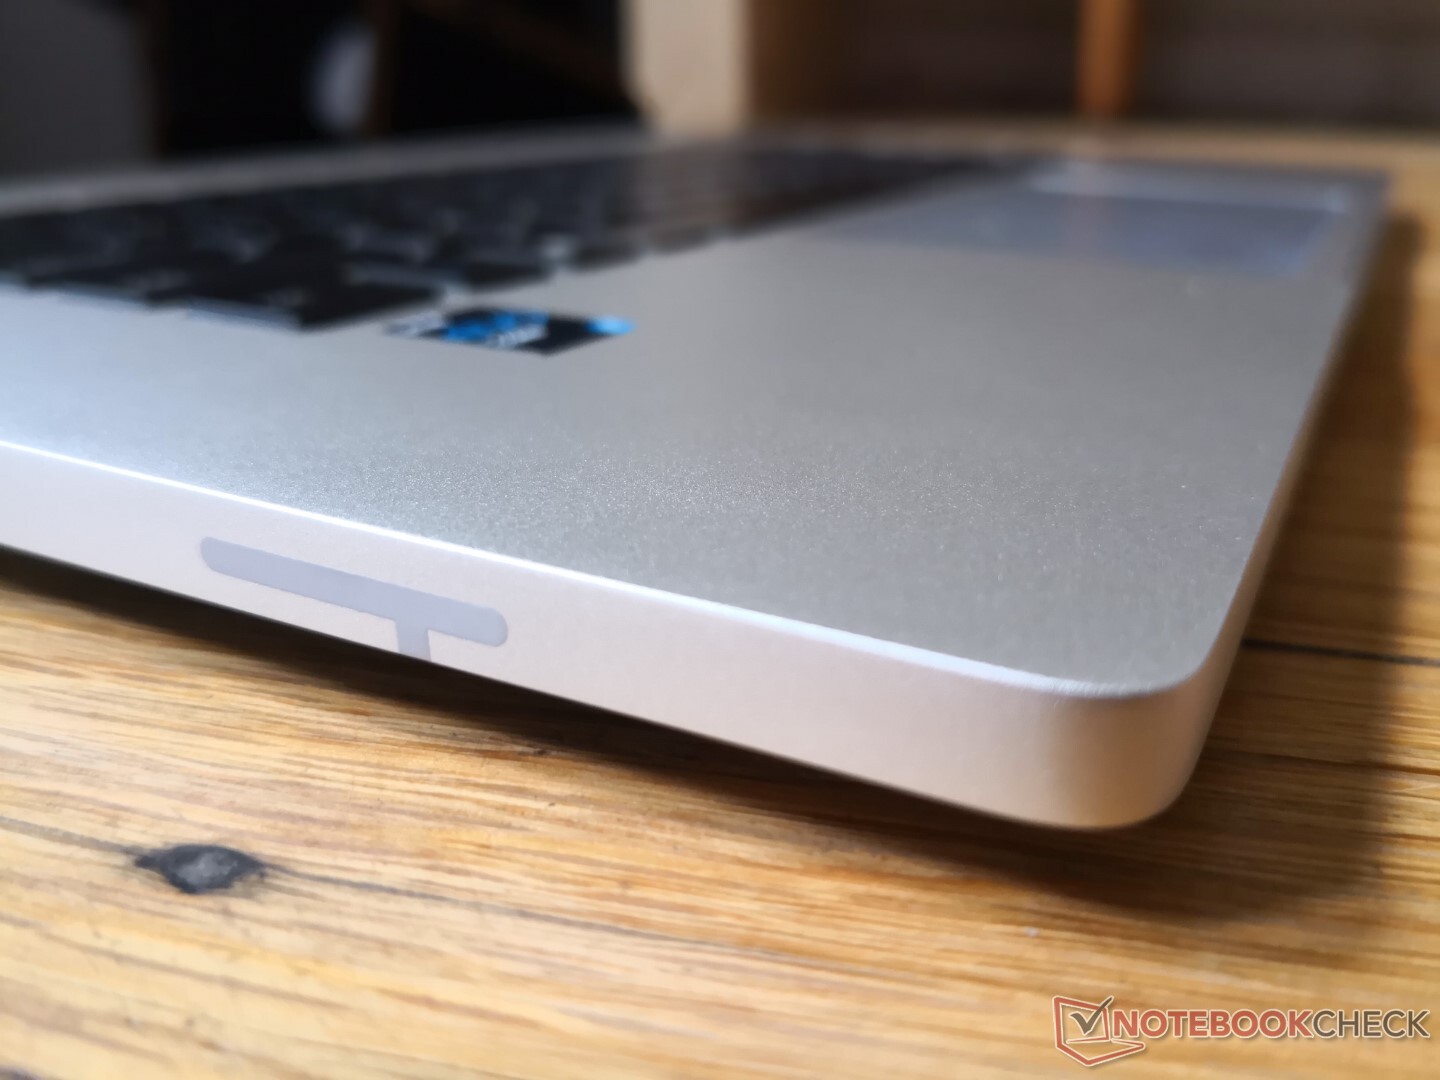
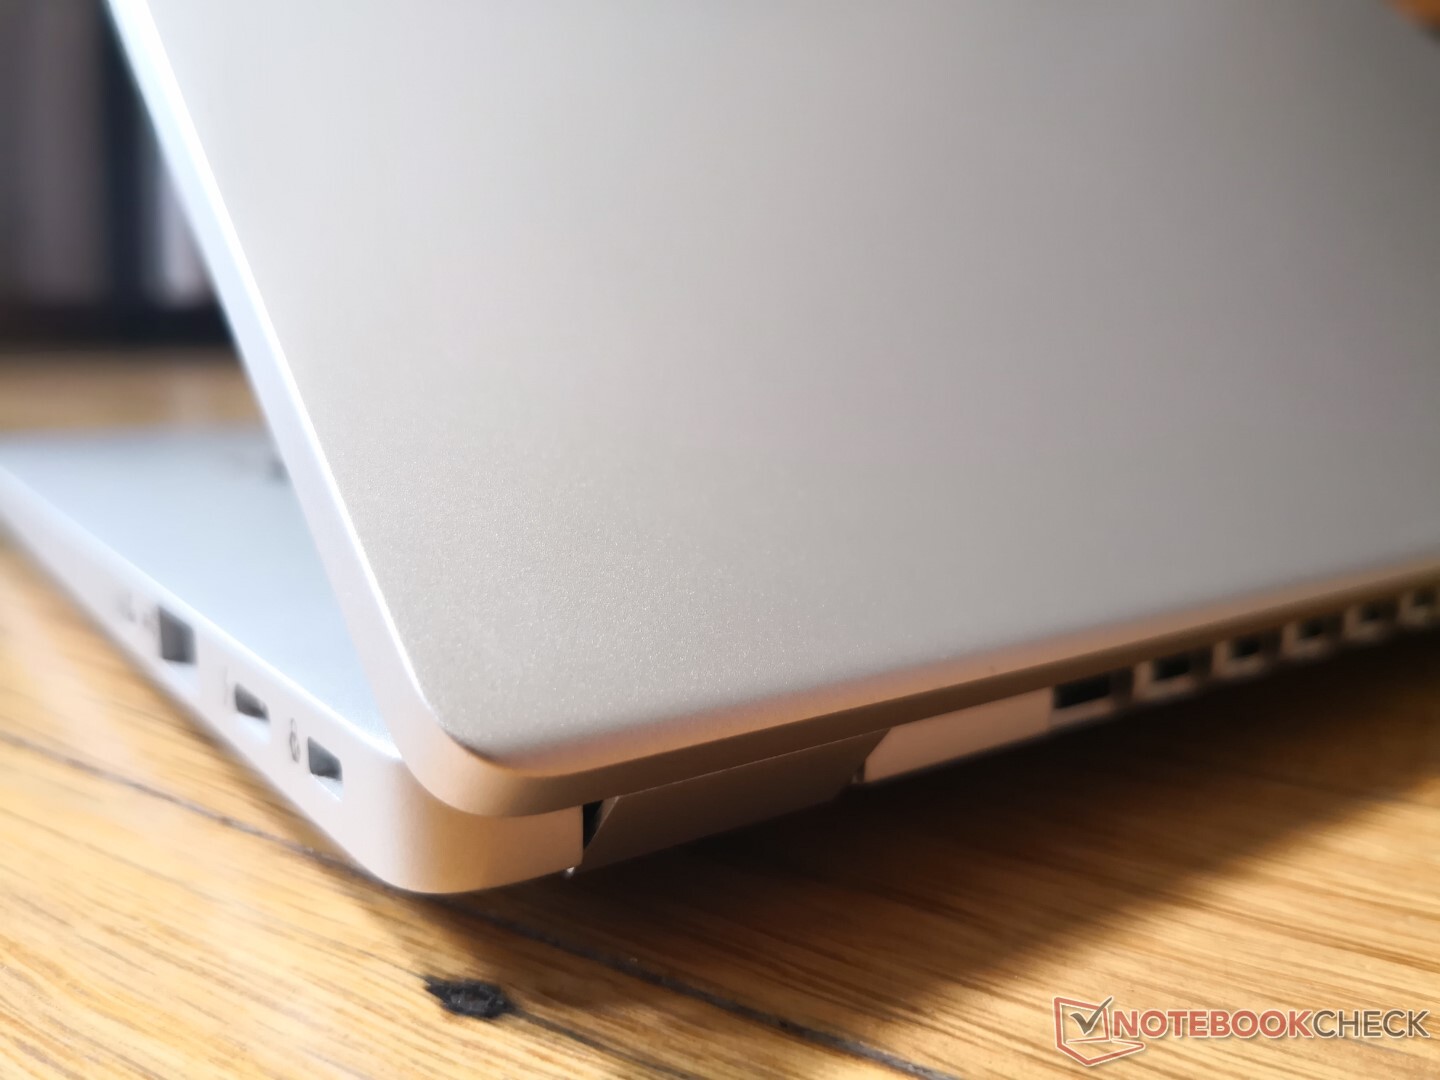
Our comments on the pre-production Schenker Vision 15 apply here for the Xenia Xe since they both share the same chassis design. Its aluminum shell and matte gray color are similar to what you'll see on the MacBook Pro, Razer Blade 15, or HP Envy 15 Creator.
Build quality is excellent with only minimal flexing and creaking when attempting to twist the base or depress its keyboard center. The lid is weaker as usual, but it's nowhere near as bad as on an LG Gram or Lenovo Legion 5. We feel the hinges could have been larger for a better sense of longevity.
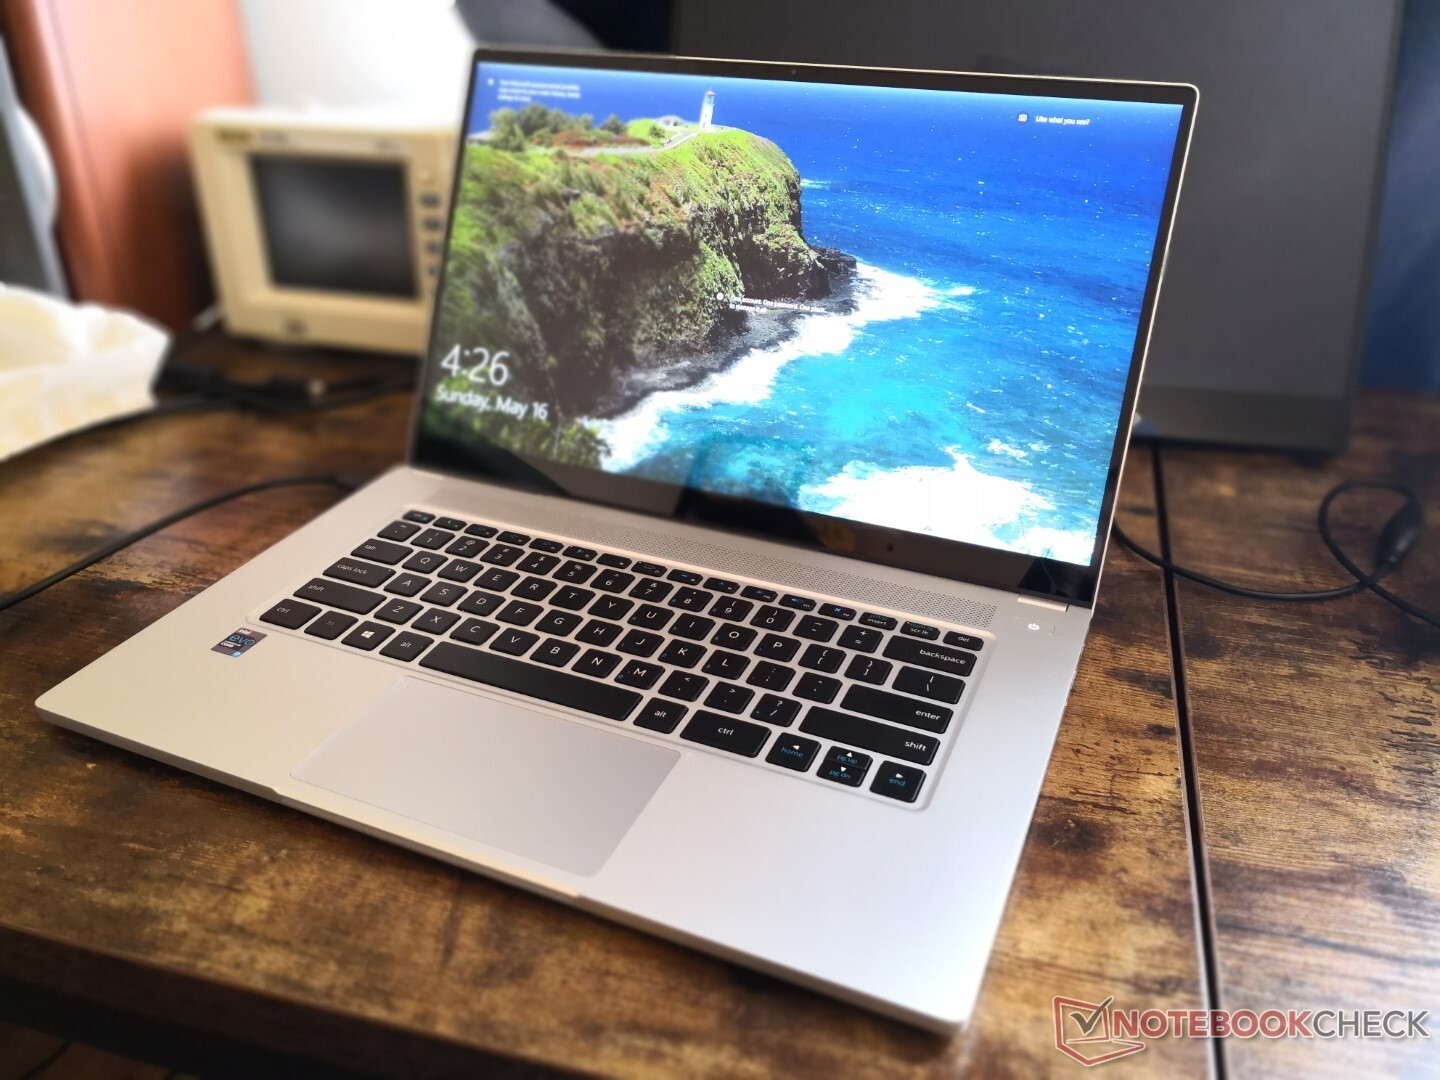
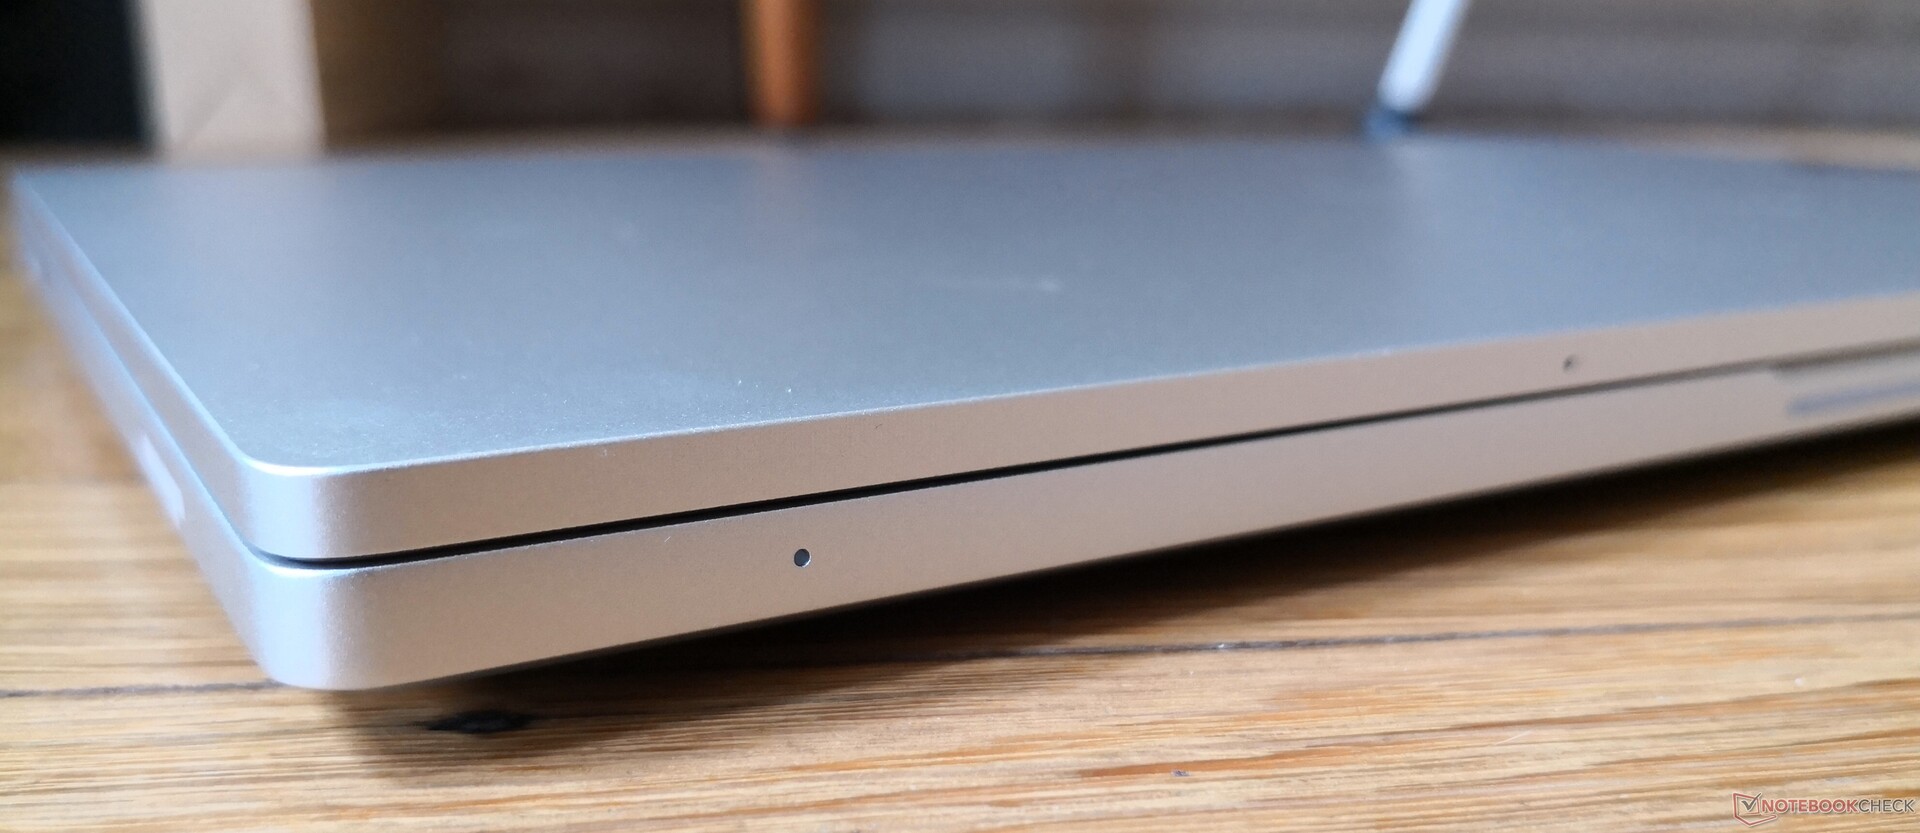
The XPG sits comfortably in the middle when it comes to size and weight. It's slightly lighter than the XPS 15 and slightly heavier than the Asus ZenBook 15 while being thinner and longer than both.
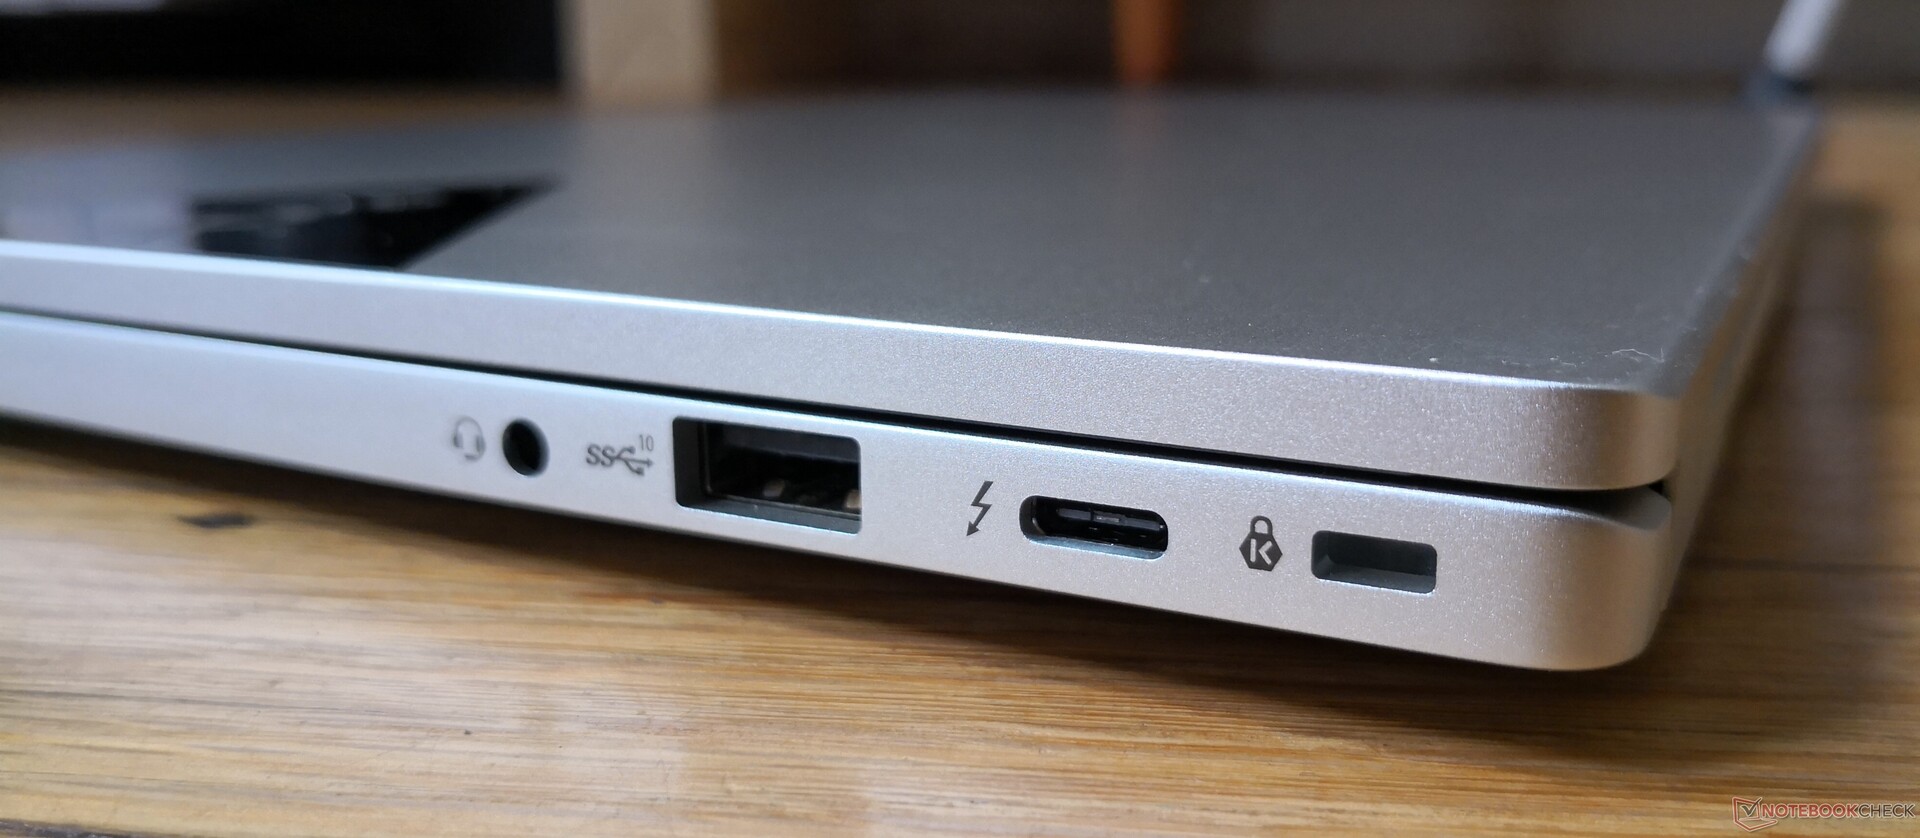
Connectivity
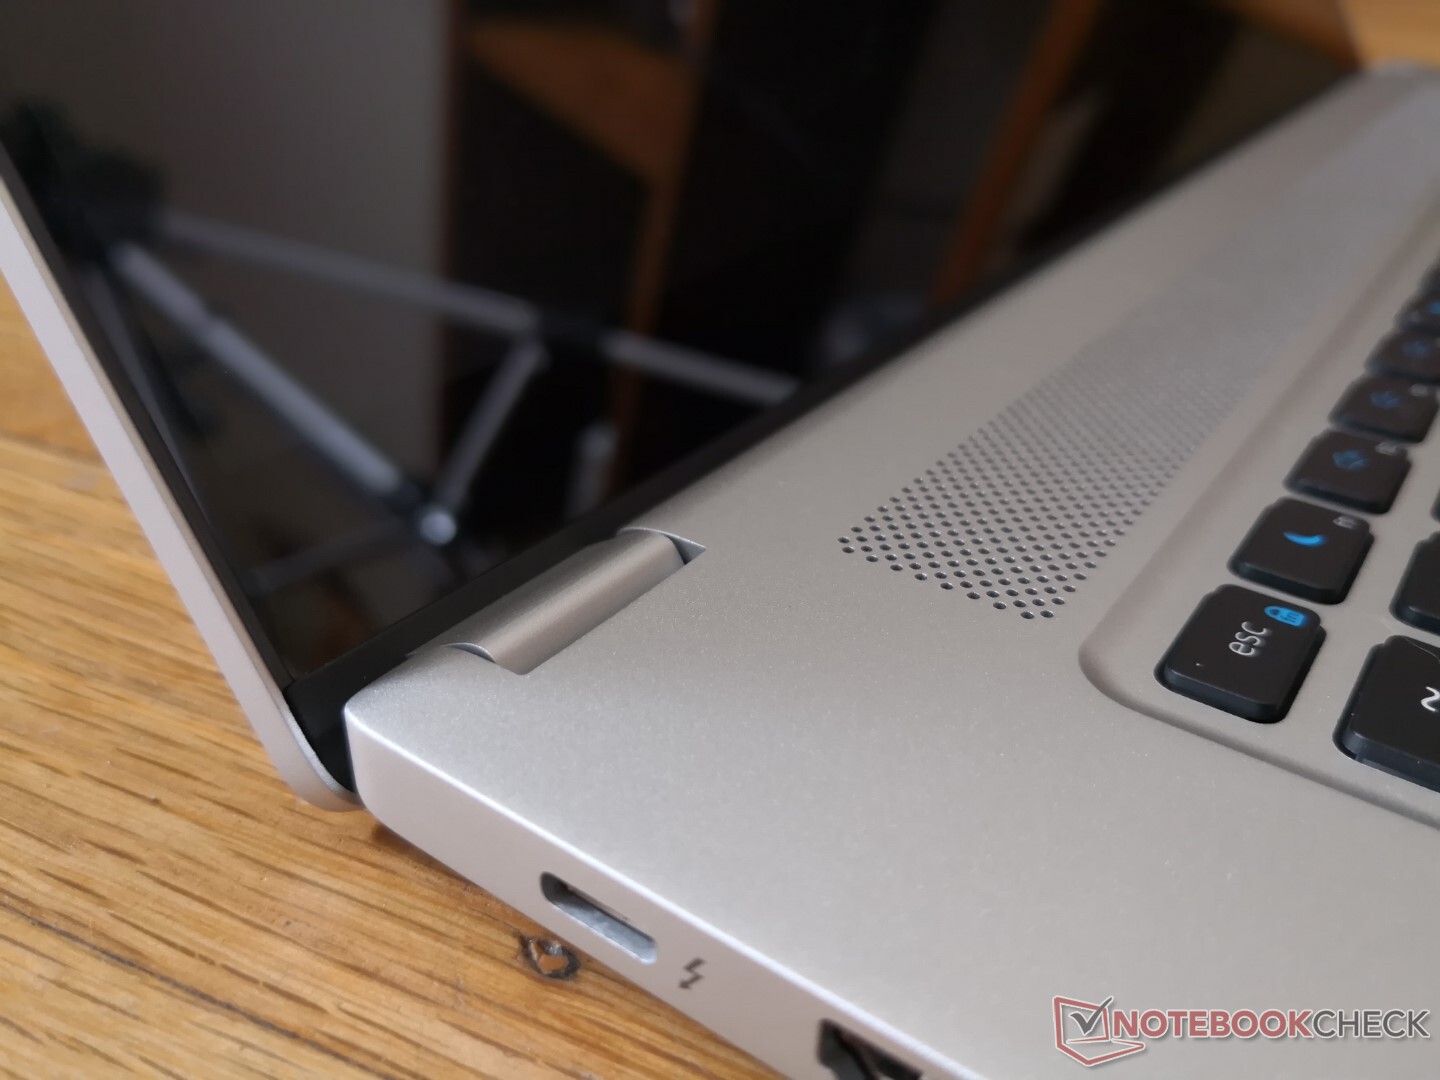
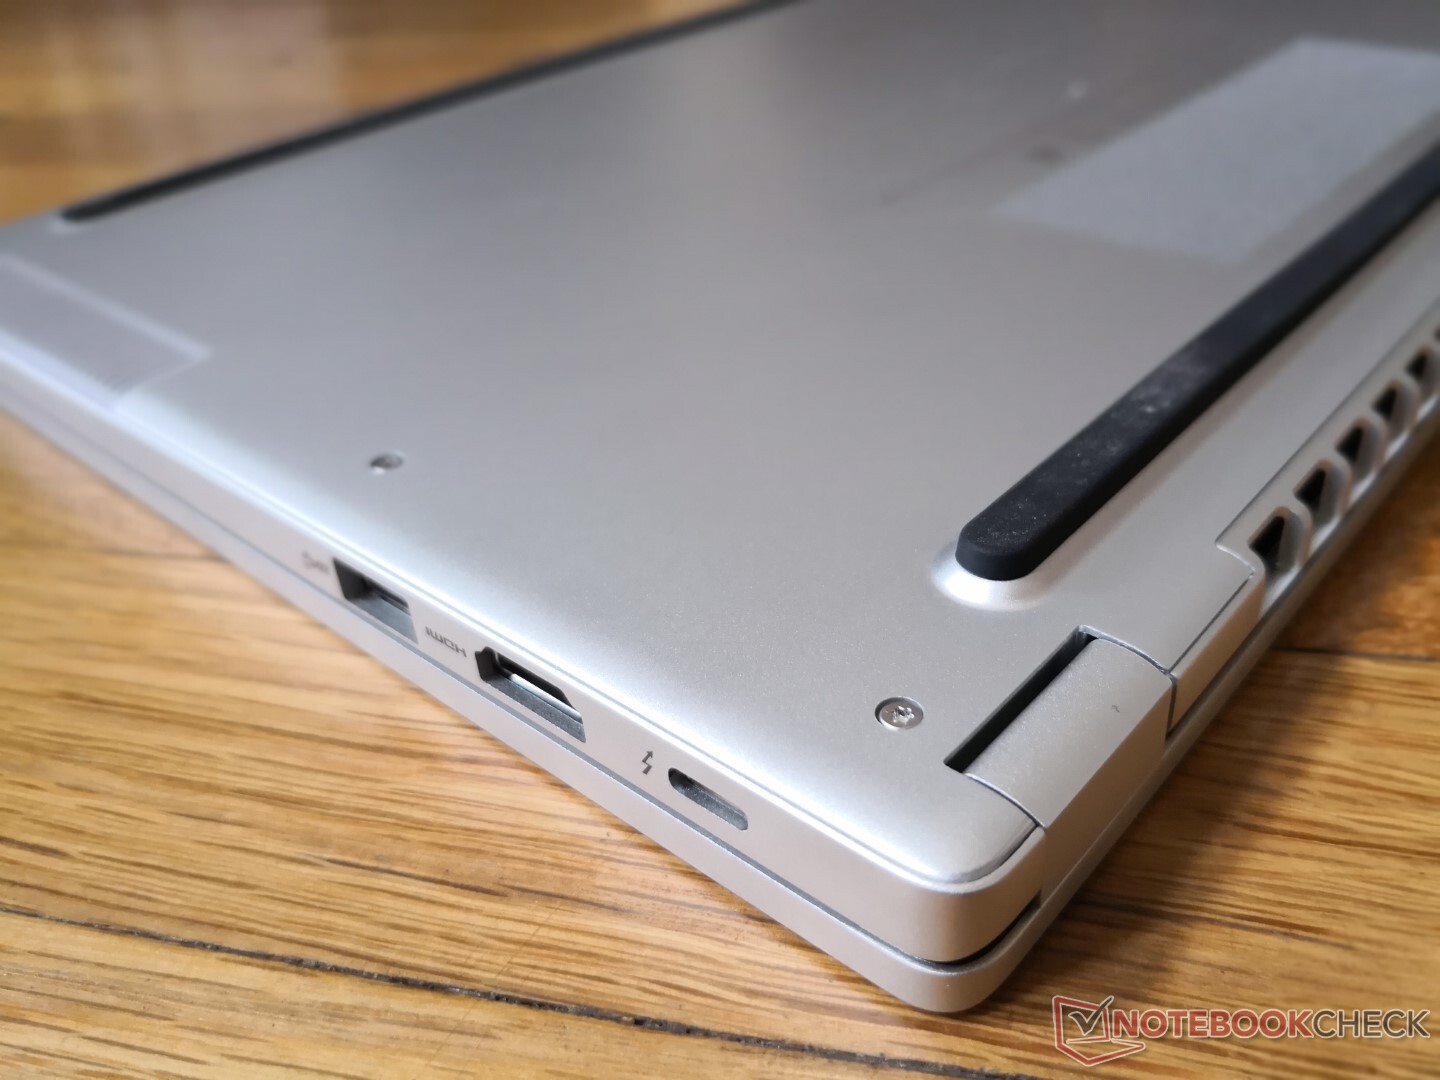
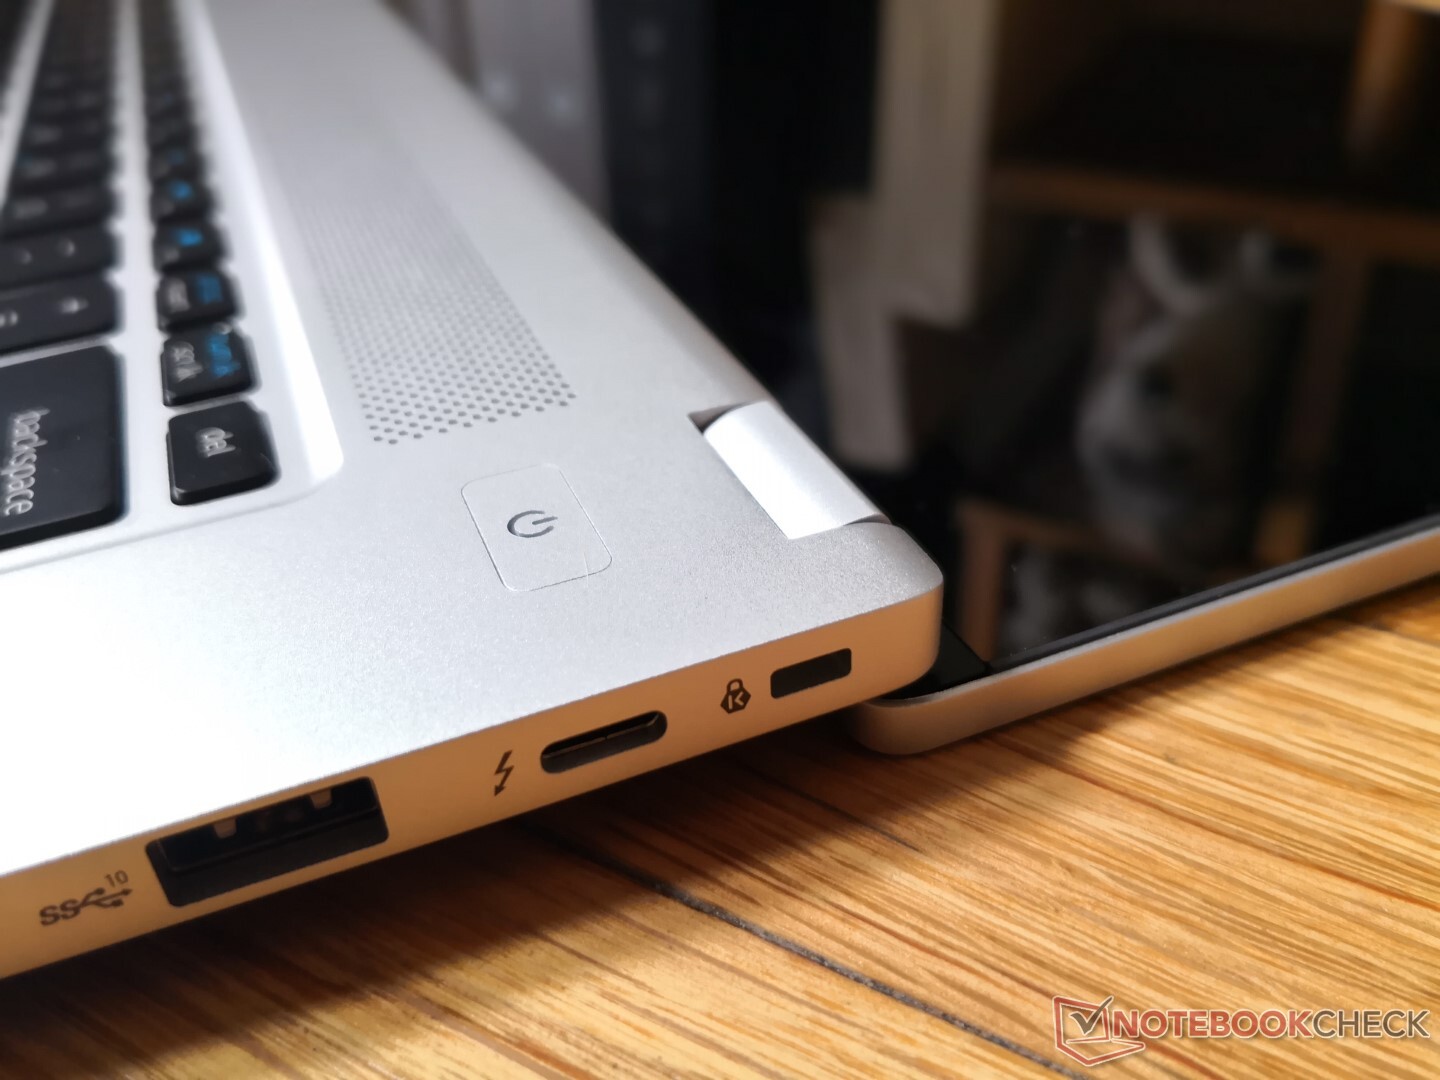
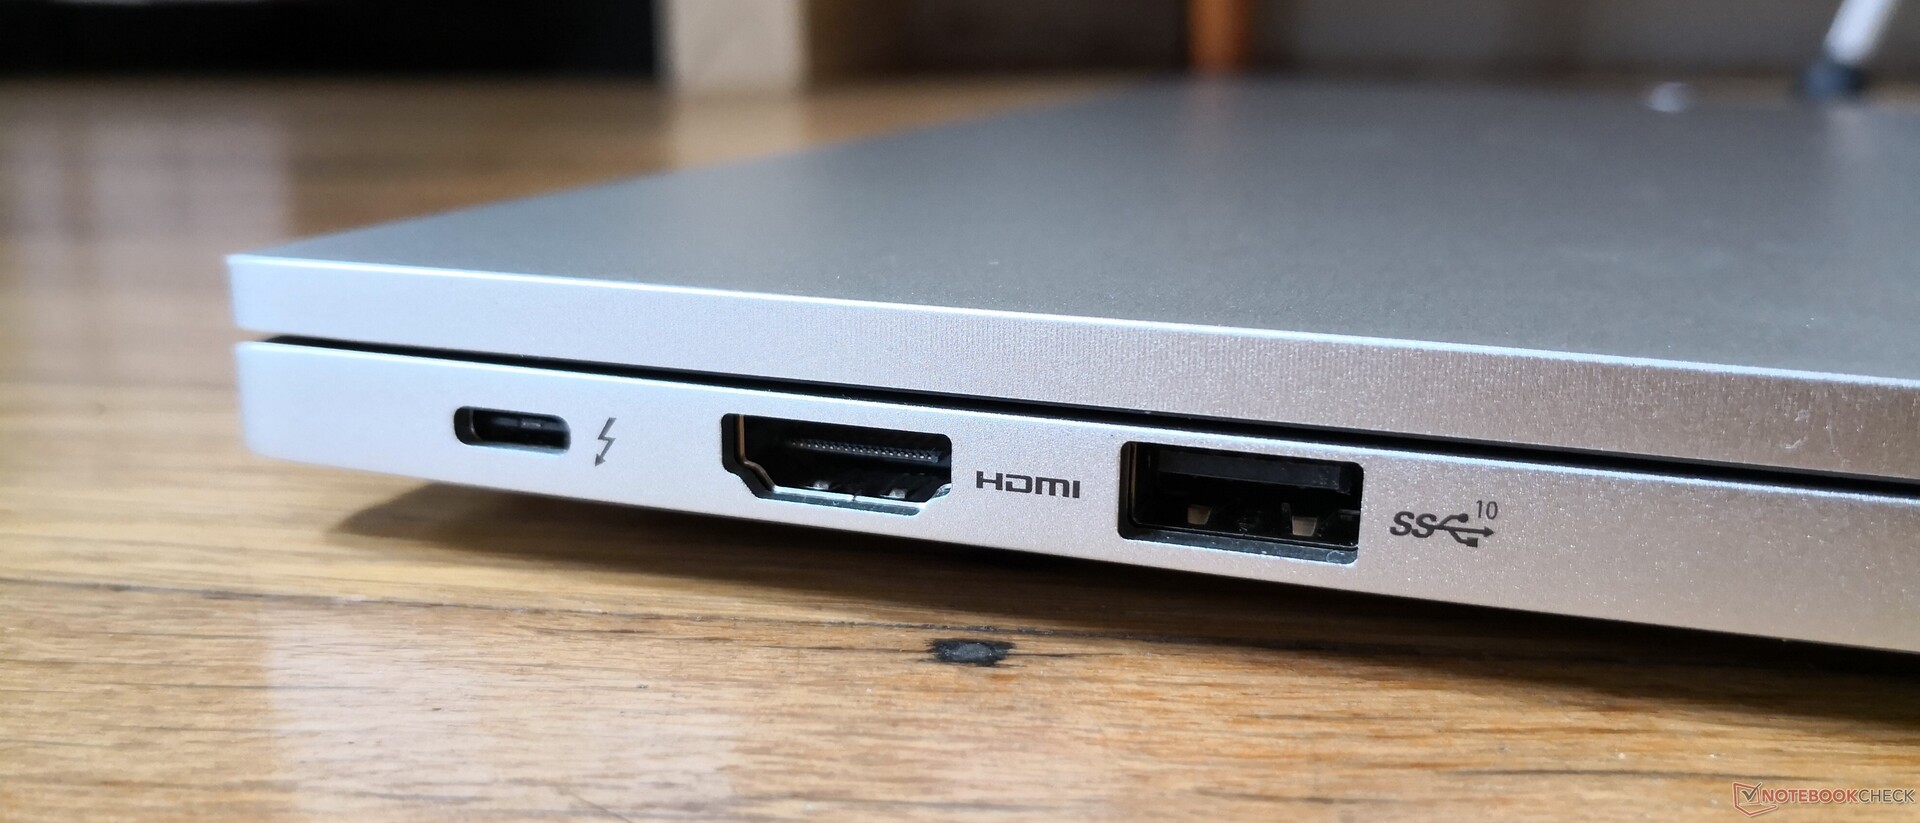
Ports are evenly distributed along the left and right edges of the chassis. We especially appreciate that there is a Thunderbolt 4 port on either side meaning users have the option to recharge the laptop from the left edge or right edge.
Communication
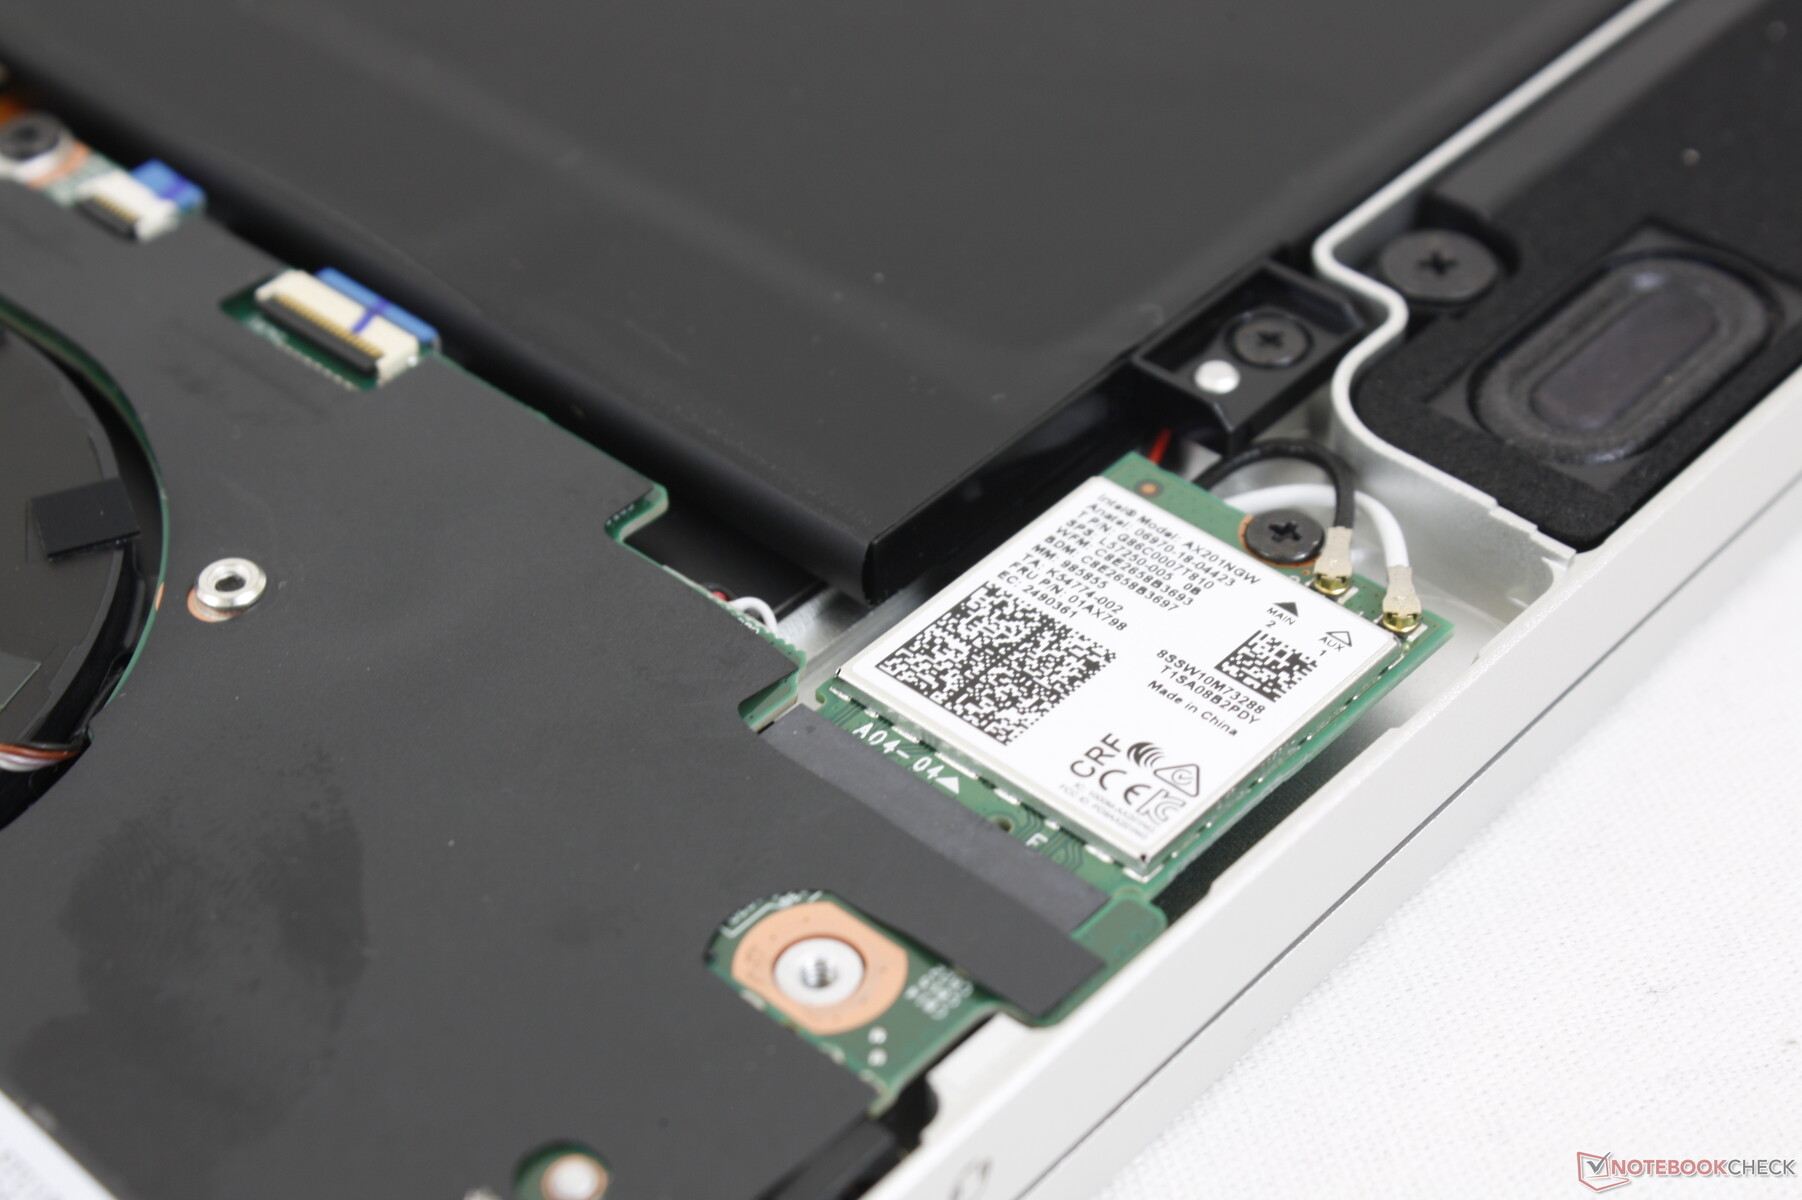
The Intel AX201 comes standard for Wi-Fi 6 and Bluetooth 5.1 connectivity. We experienced no issues when paired with our Netgear RAX200 test router.
Webcam


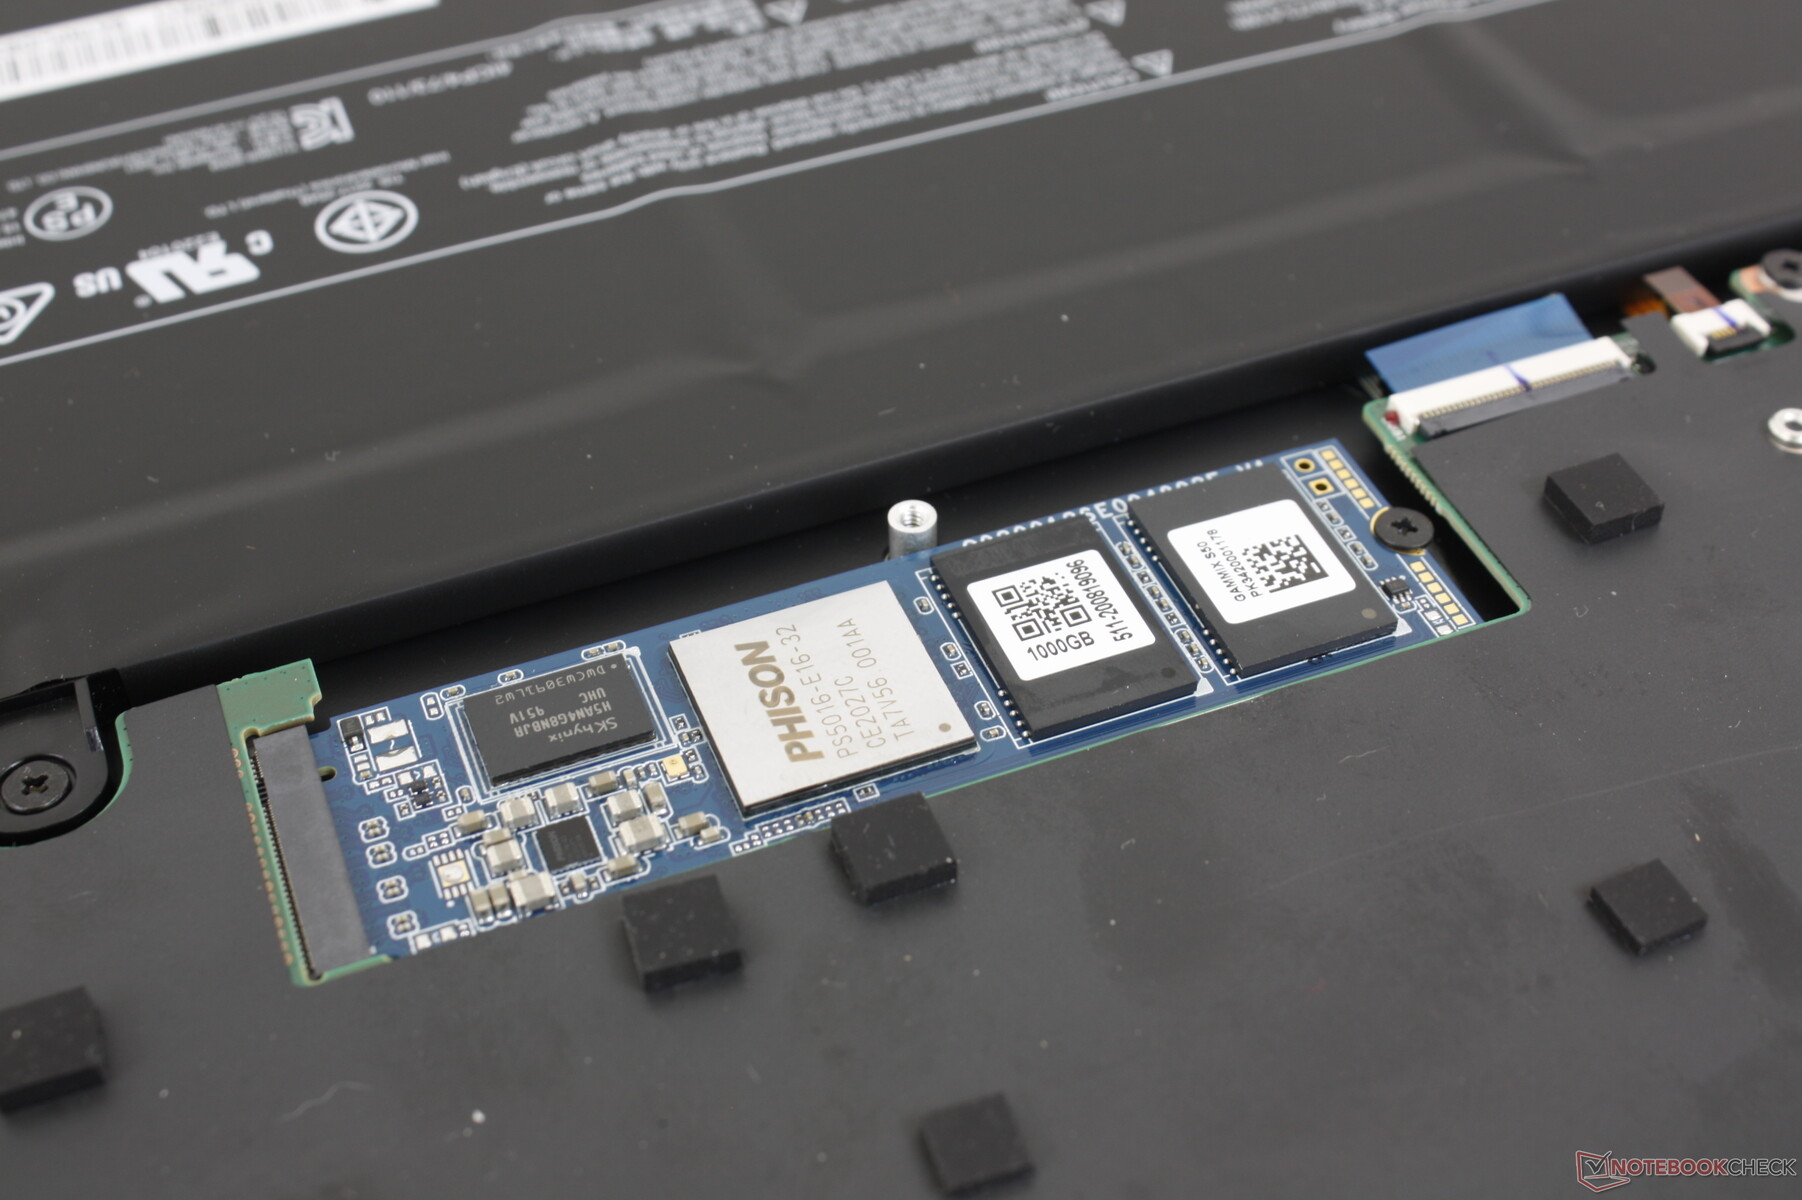
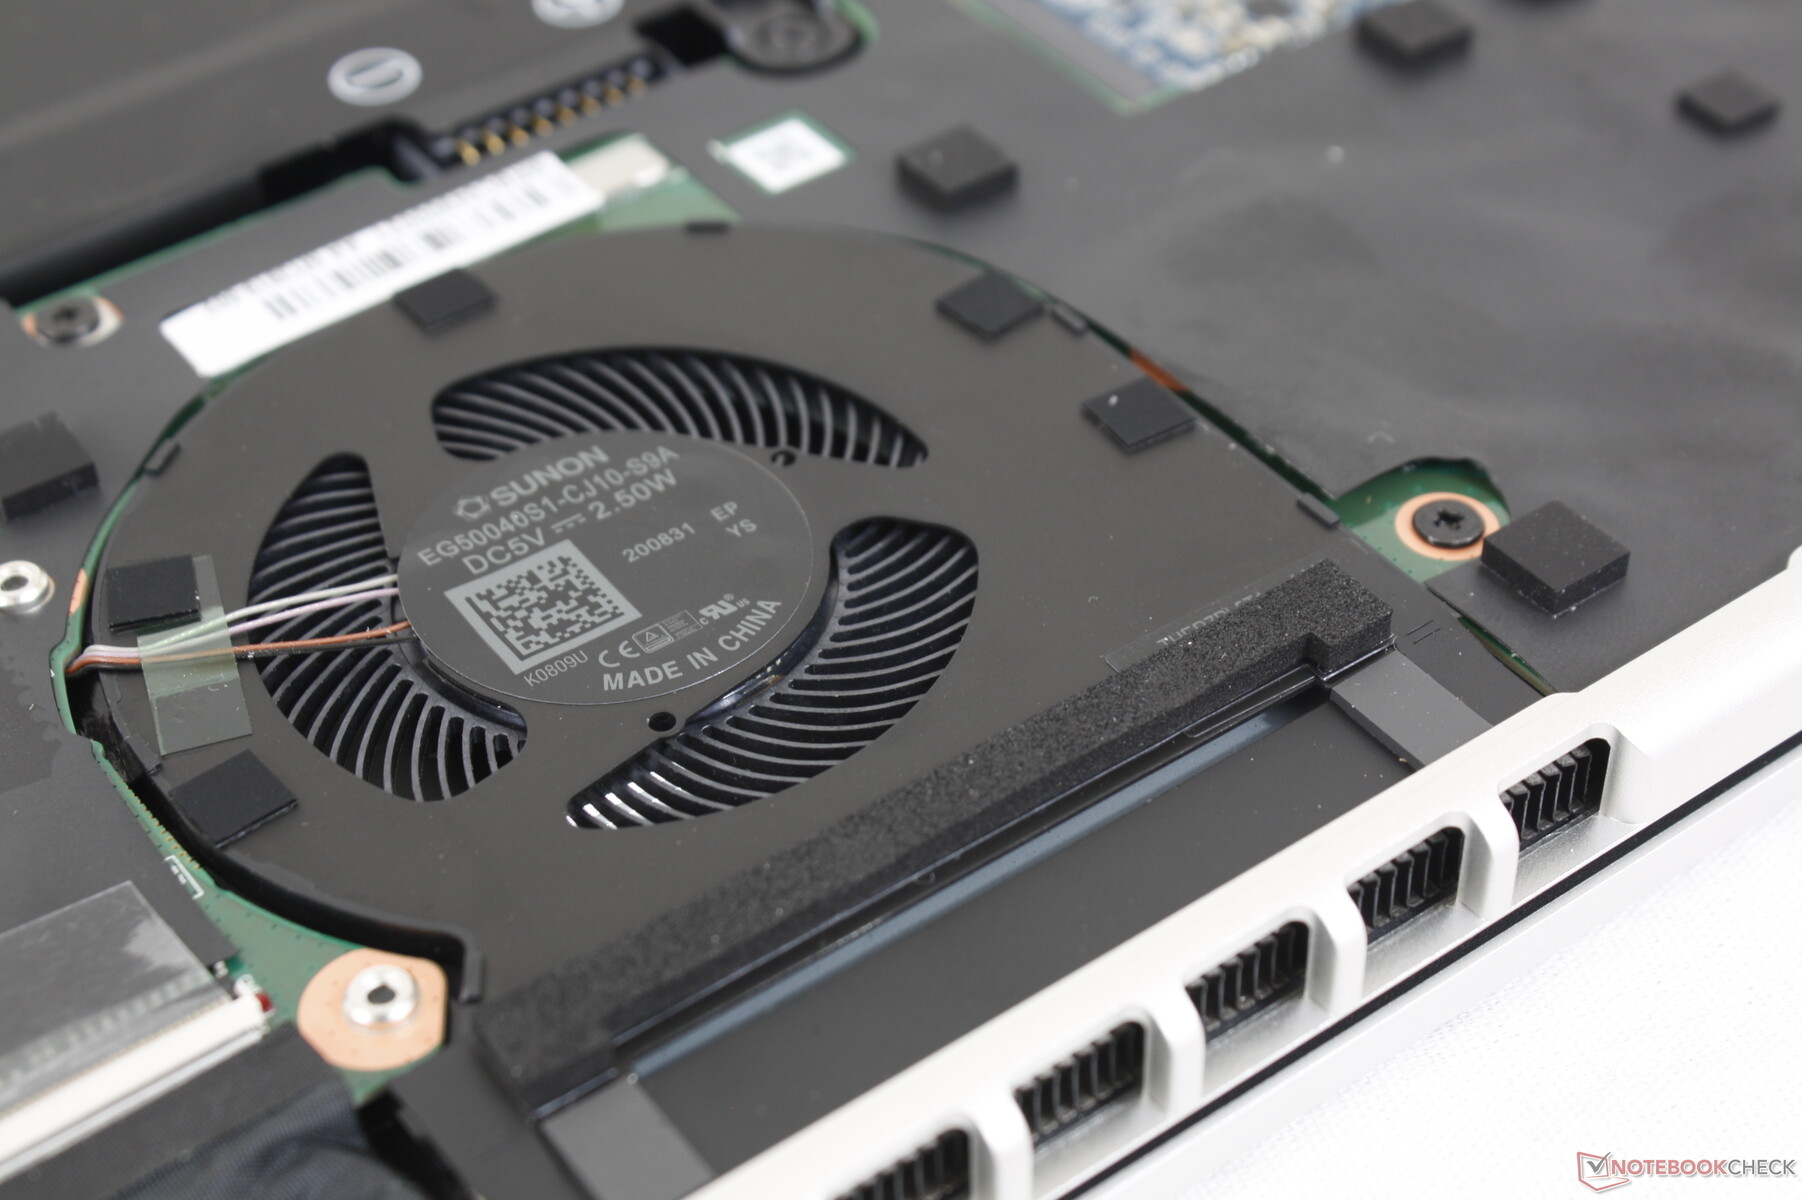
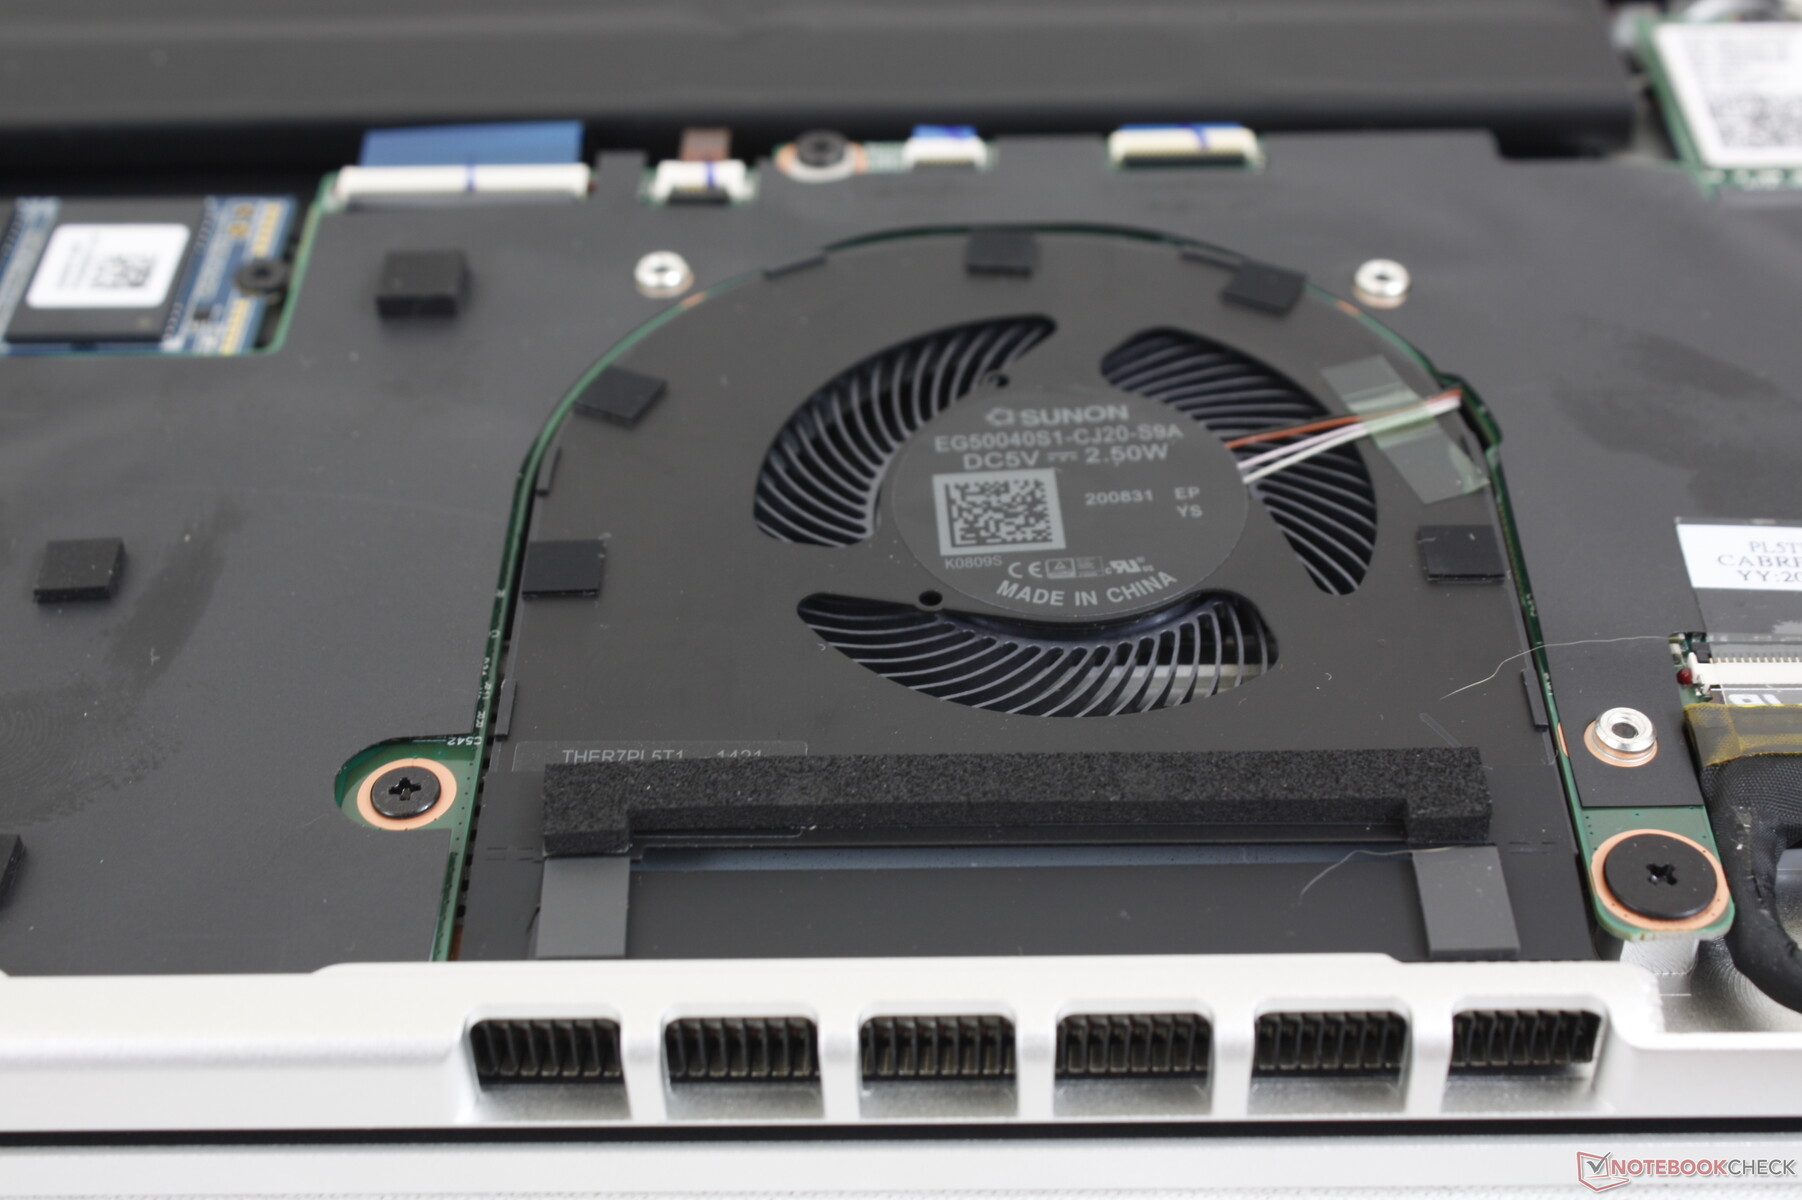
Maintenance
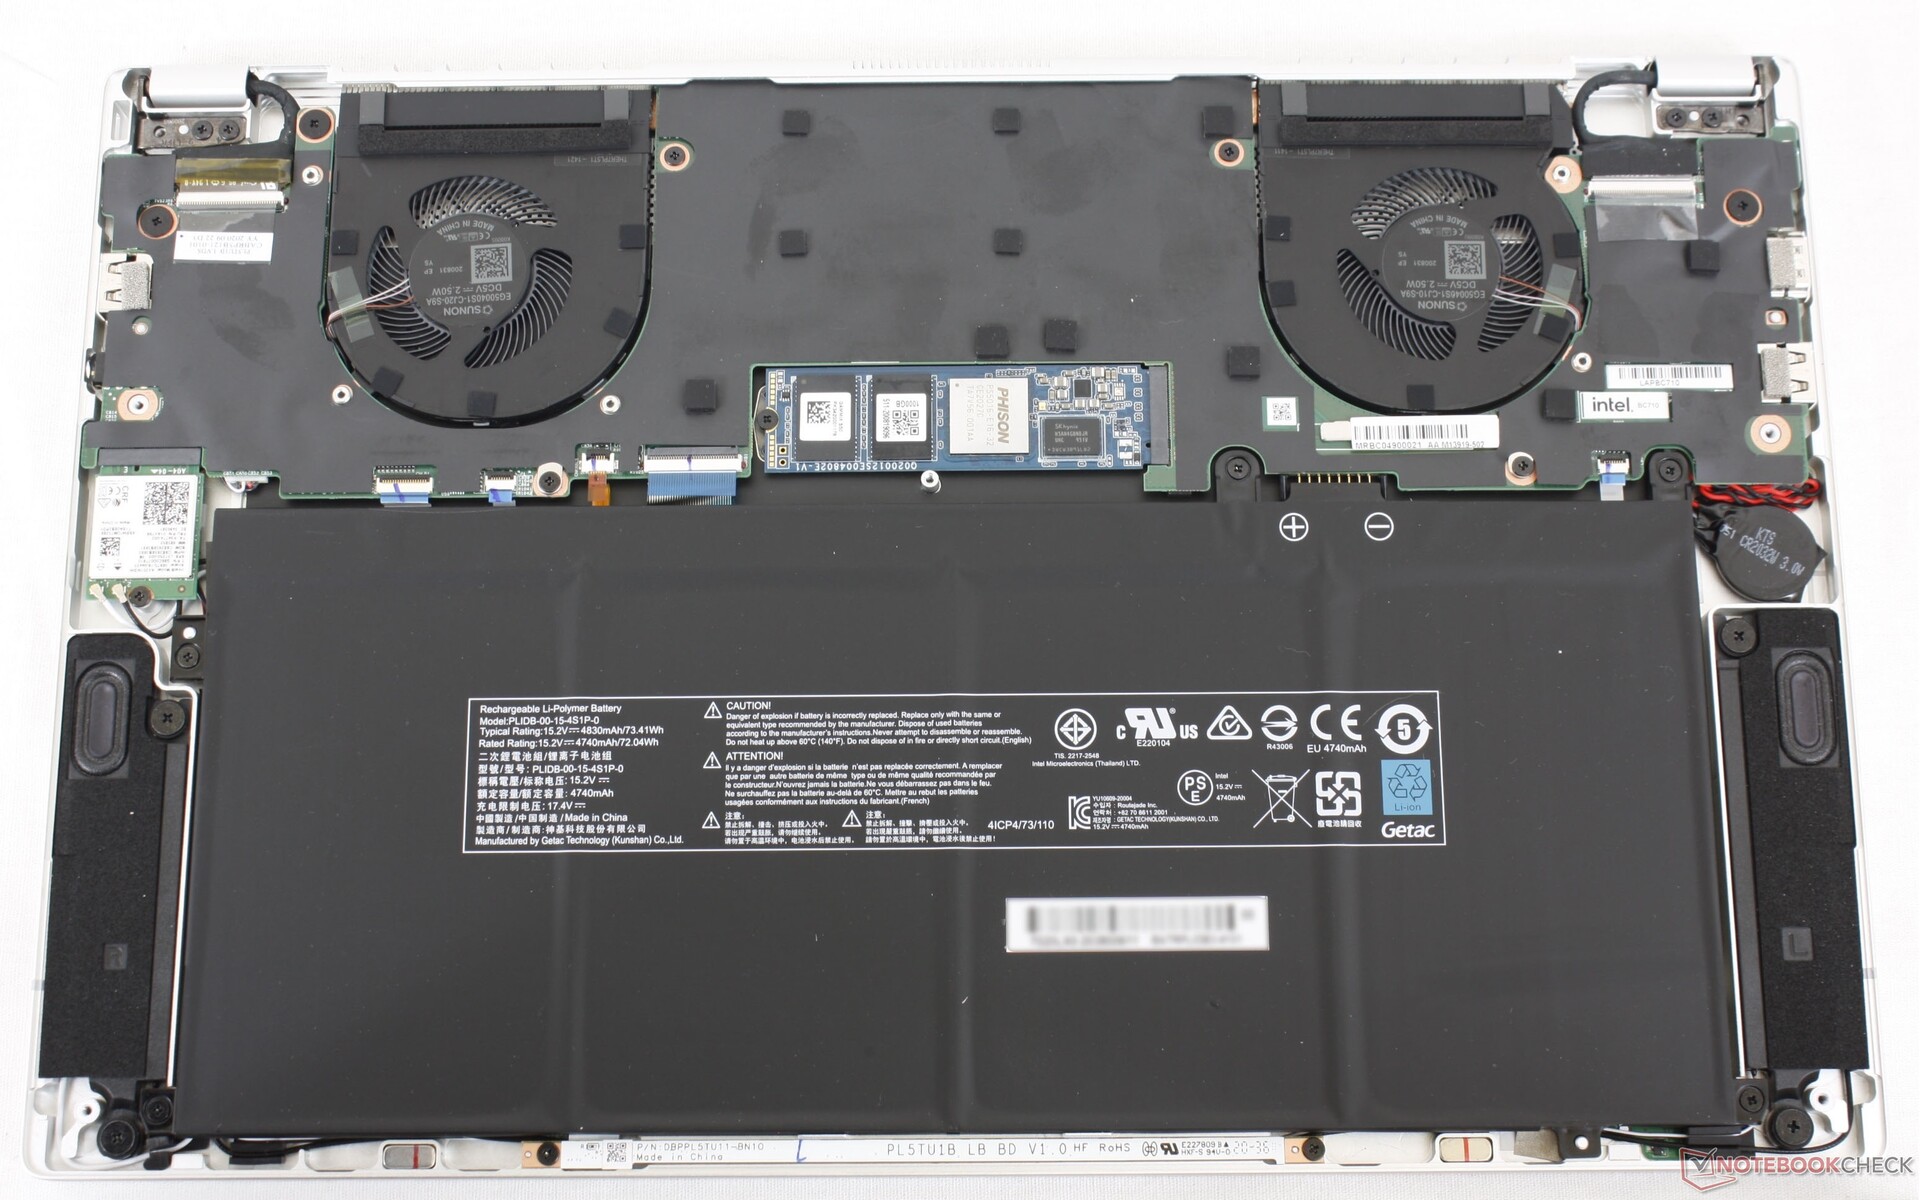
The bottom panel is relatively easy to remove with a T6 Torx wrench and sharp edge. Upgrade options are limited to the WLAN and M.2 2280 modules as RAM is soldered.
Accessories and Warranty
There are no extras in the box beyond the paperwork and AC adapter. The usual one-year limited manufacturer warranty applies.
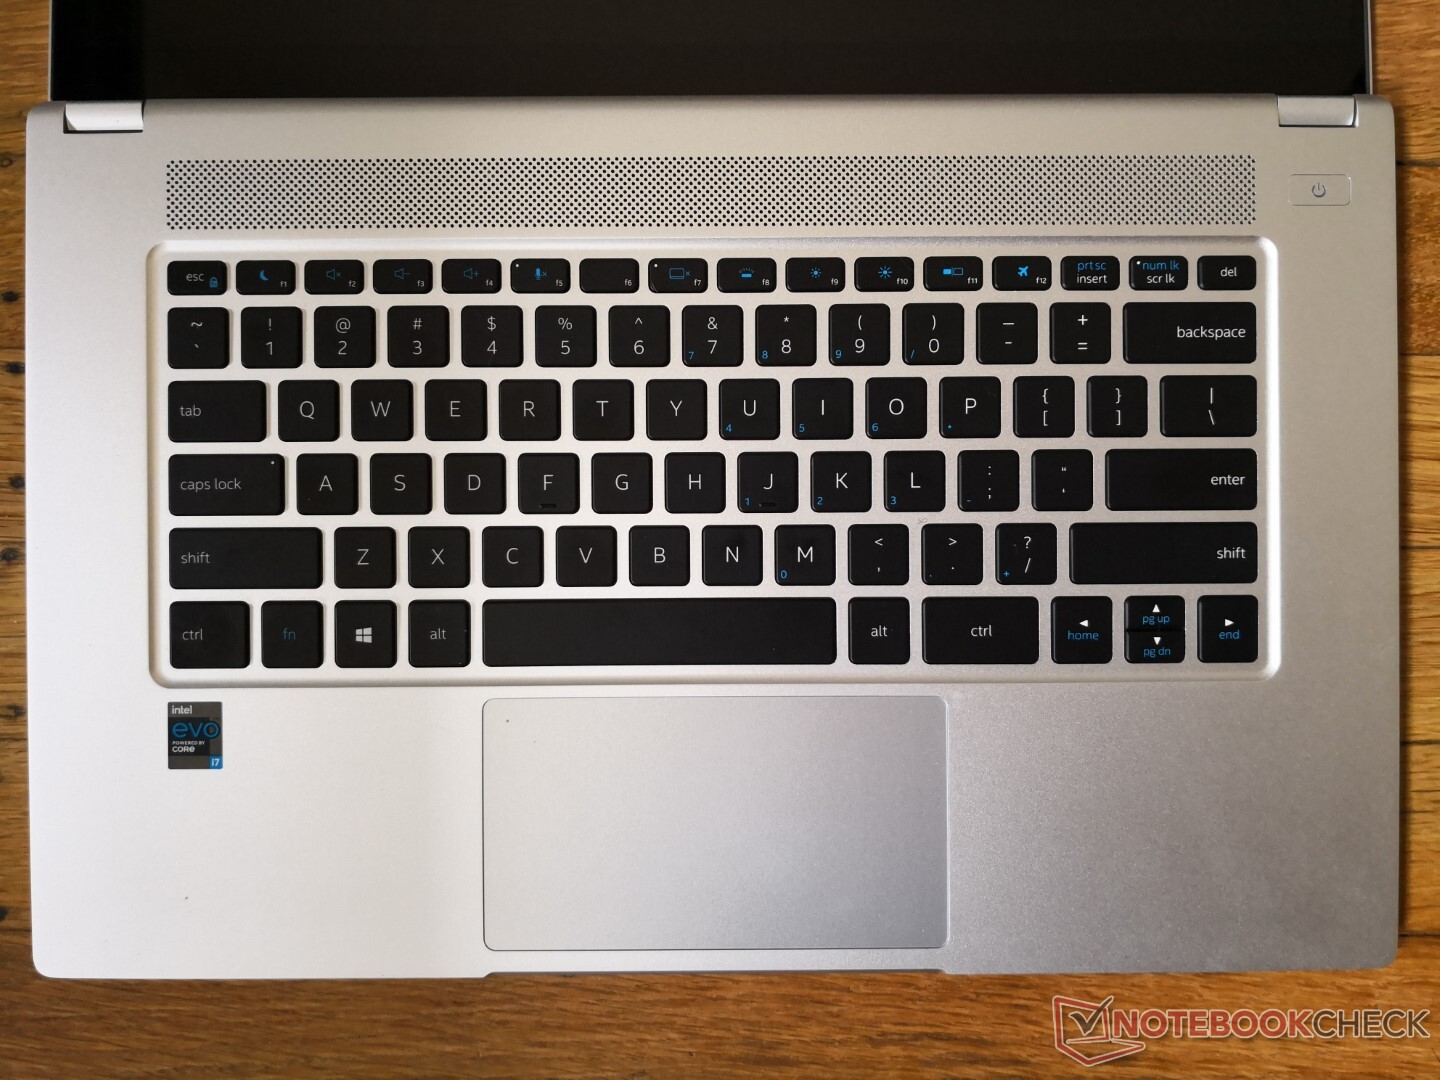
Input Devices
Keyboard
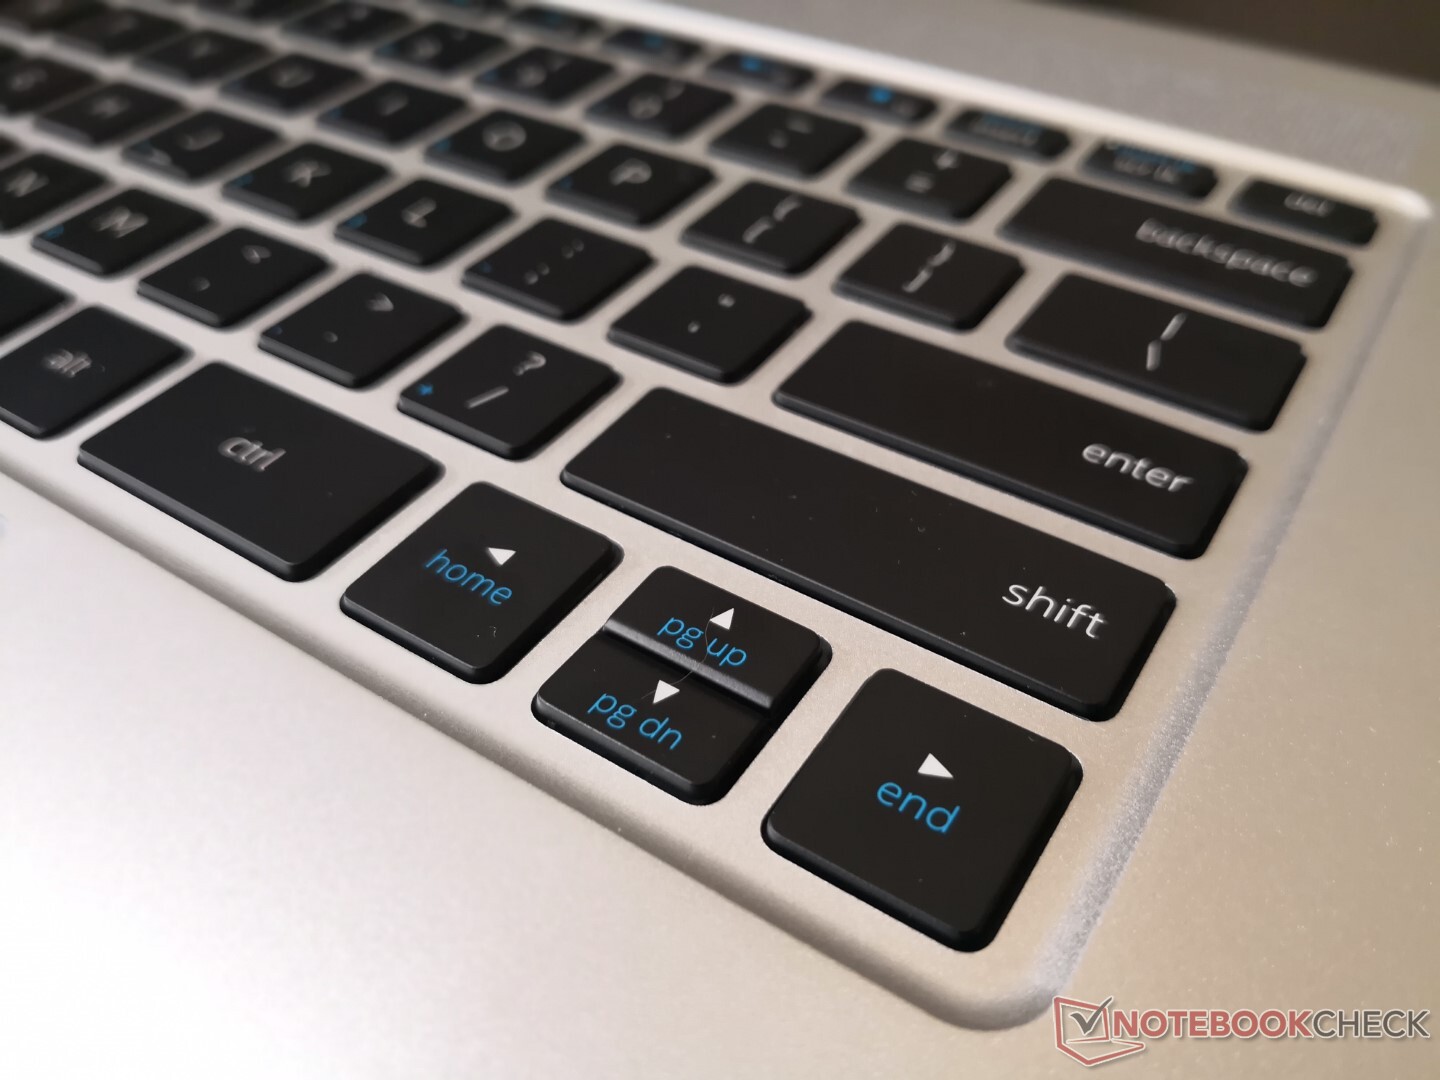
Key feedback is decent if nothing special. More well-known business laptops like the Lenovo ThinkPad T series or Carbon series, HP EliteBook or Spectre series, or Dell Latitude series have crisper and deeper keys for a more satisfying typing experience. The keys on the Xenia feel somewhere in between the Razer Blade 15 and Dell XPS 15.
A two-level white backlight is included by default. All key symbols are properly lit, but the secondary function key symbols are too small and could have been larger.
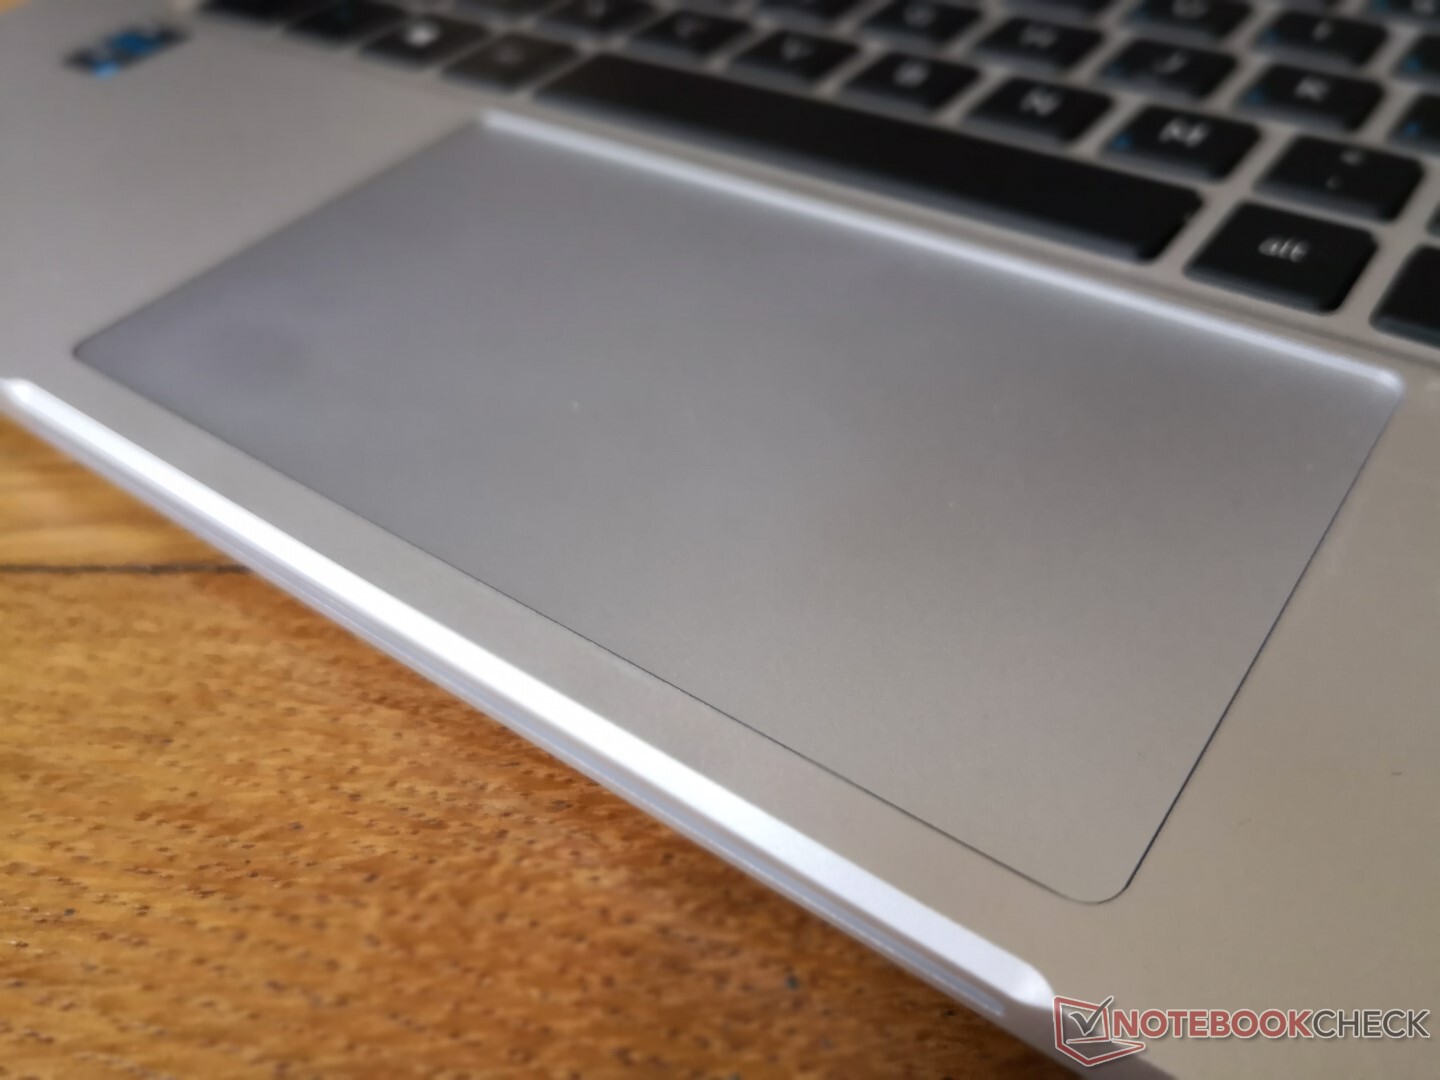
Touchpad
The smooth clickpad is relatively small (12 x 6.5 cm) with only a bit of sticking when gliding at slow speeds. Though reliable for cursor movements, its integrated keys are very spongy and unsatisfying to use. You're going to want an external mouse whenever possible.

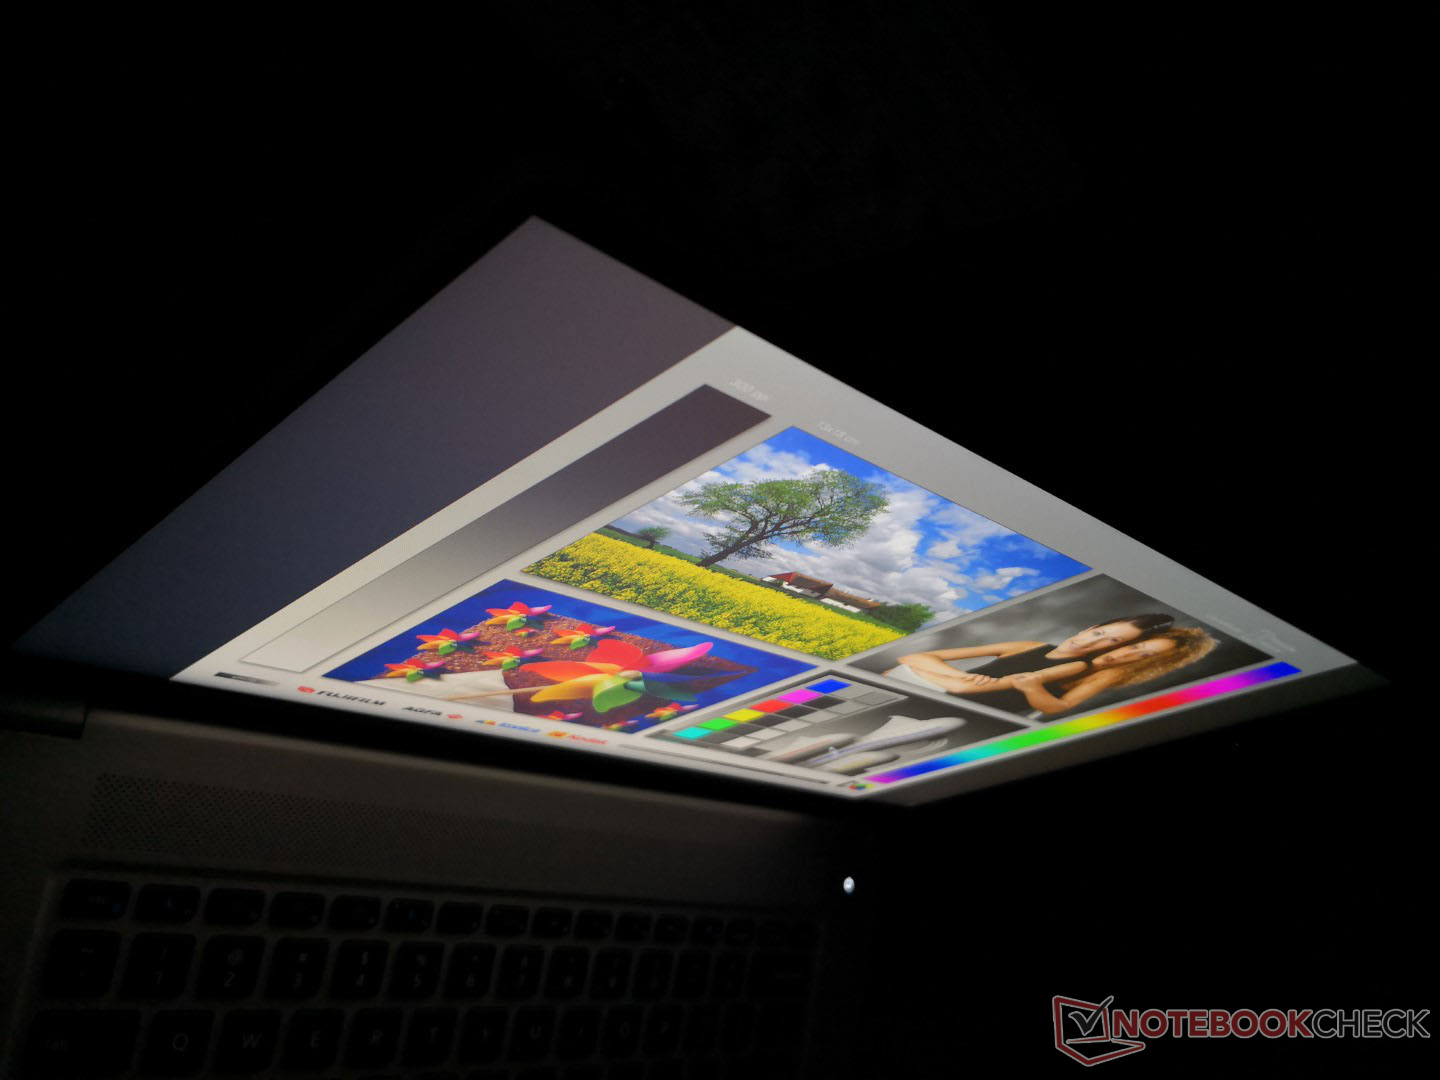
Display
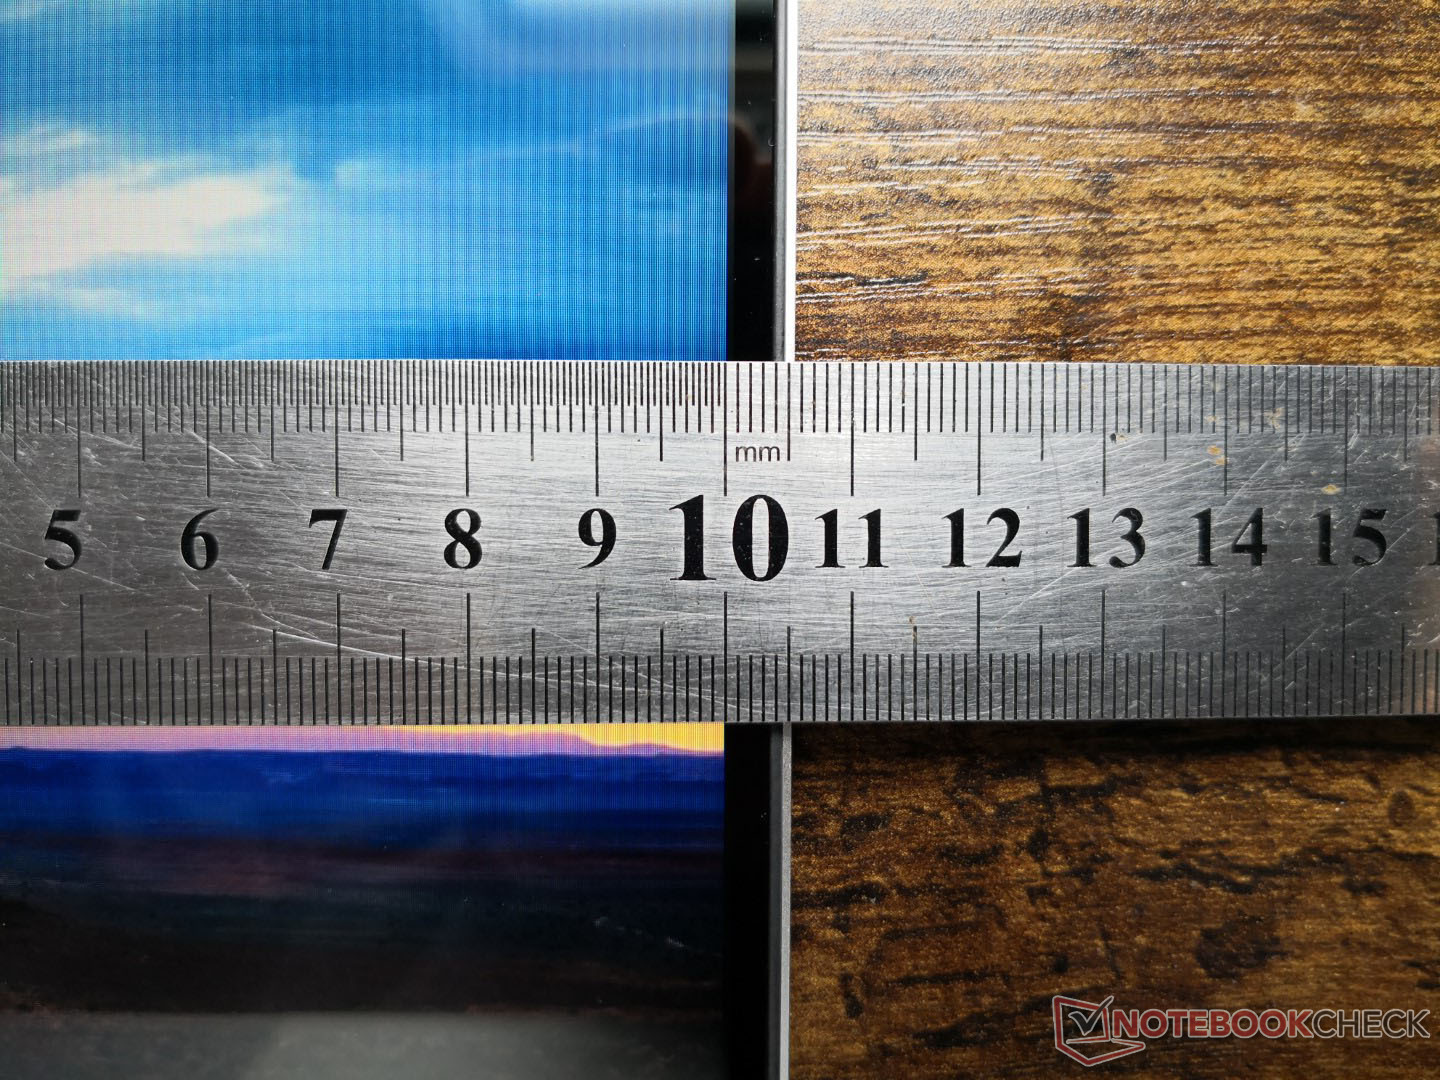
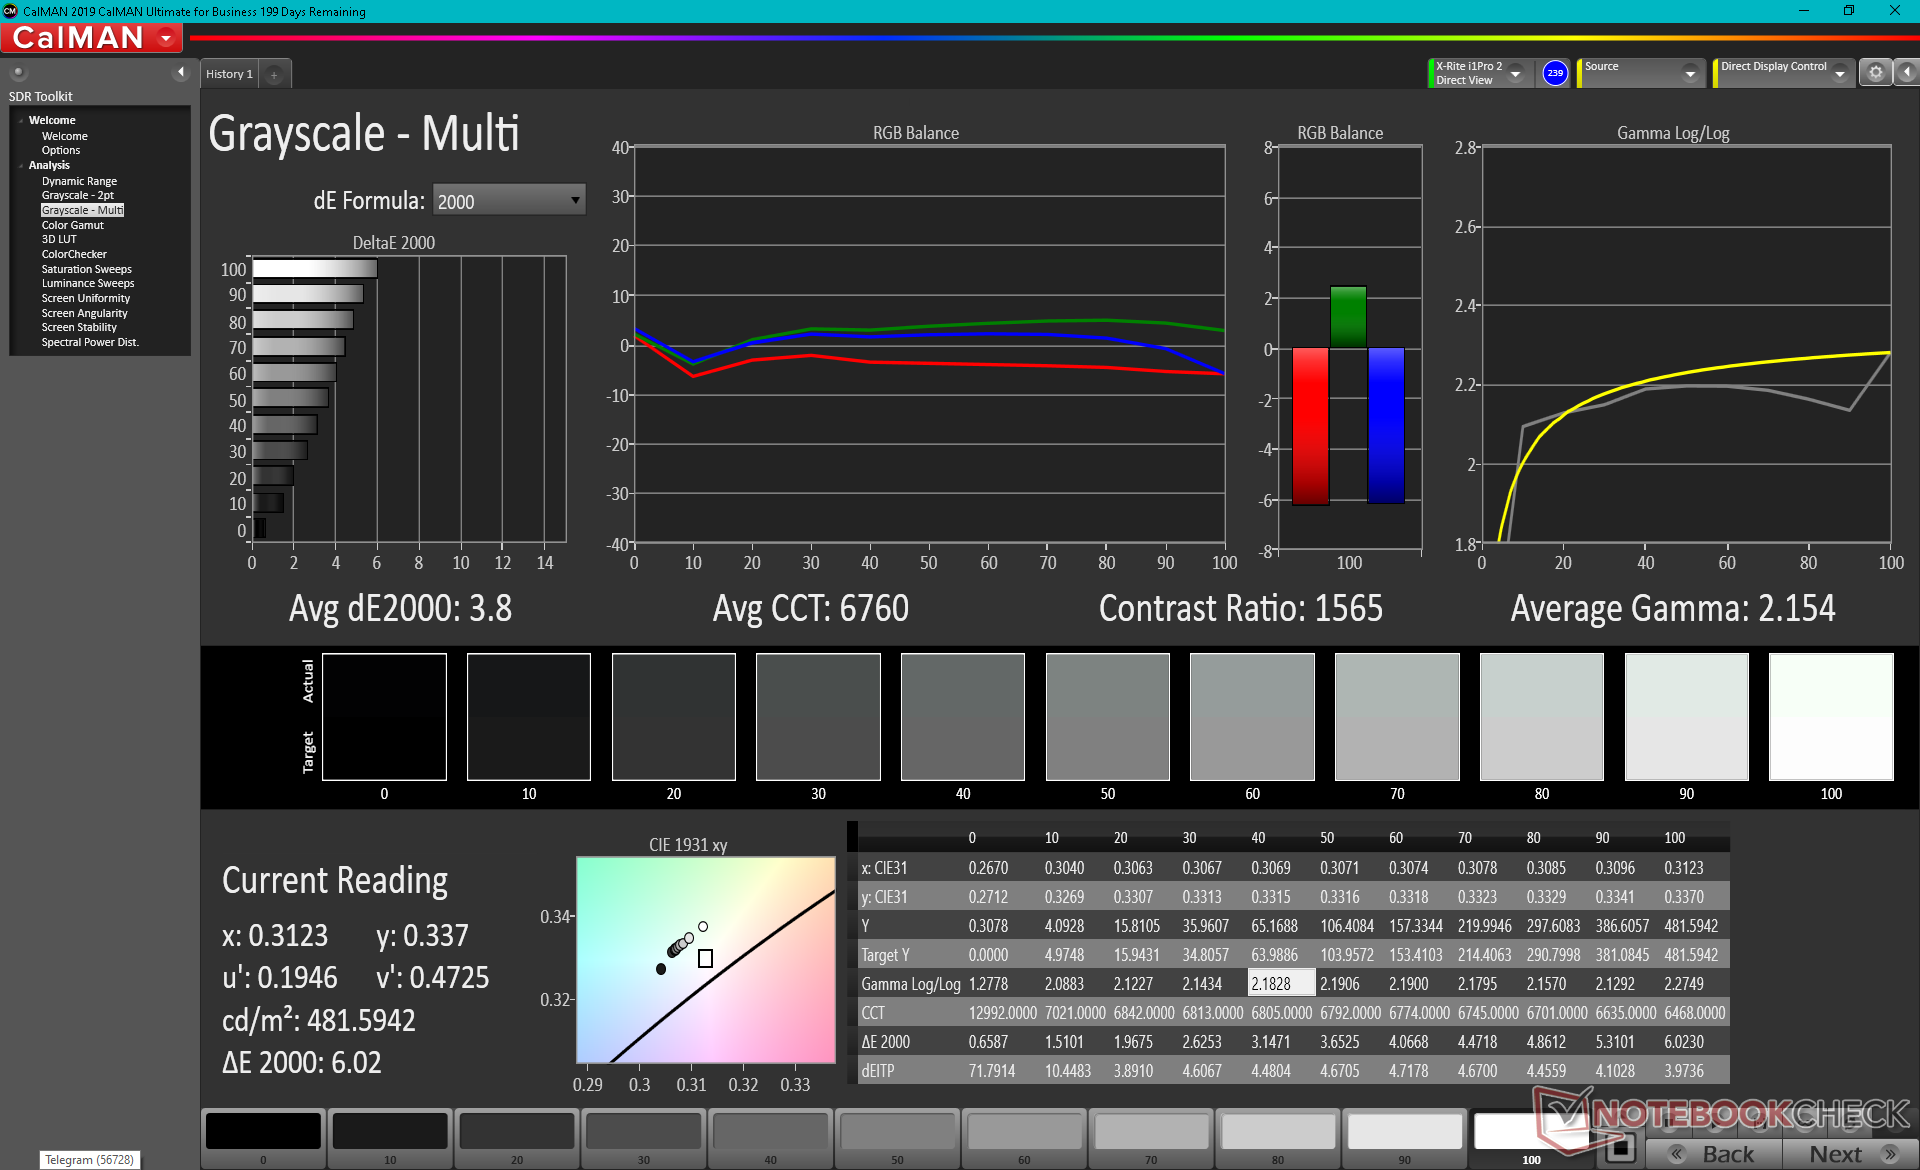
Though HWiNFO cannot identify the exact panel name, the BOE08F5 controller is exactly the same as what we found on the Schenker Vision 15. Display quality is excellent with its bright backlight and high contrast ratio, but the slow black-white and gray-gray response times can be problematic if playing fast-paced 3D games.

| |||||||||||||||||||||||||
Brightness Distribution: 88 %
Center on Battery: 480.4 cd/m²
Contrast: 1550:1 (Black: 0.31 cd/m²)
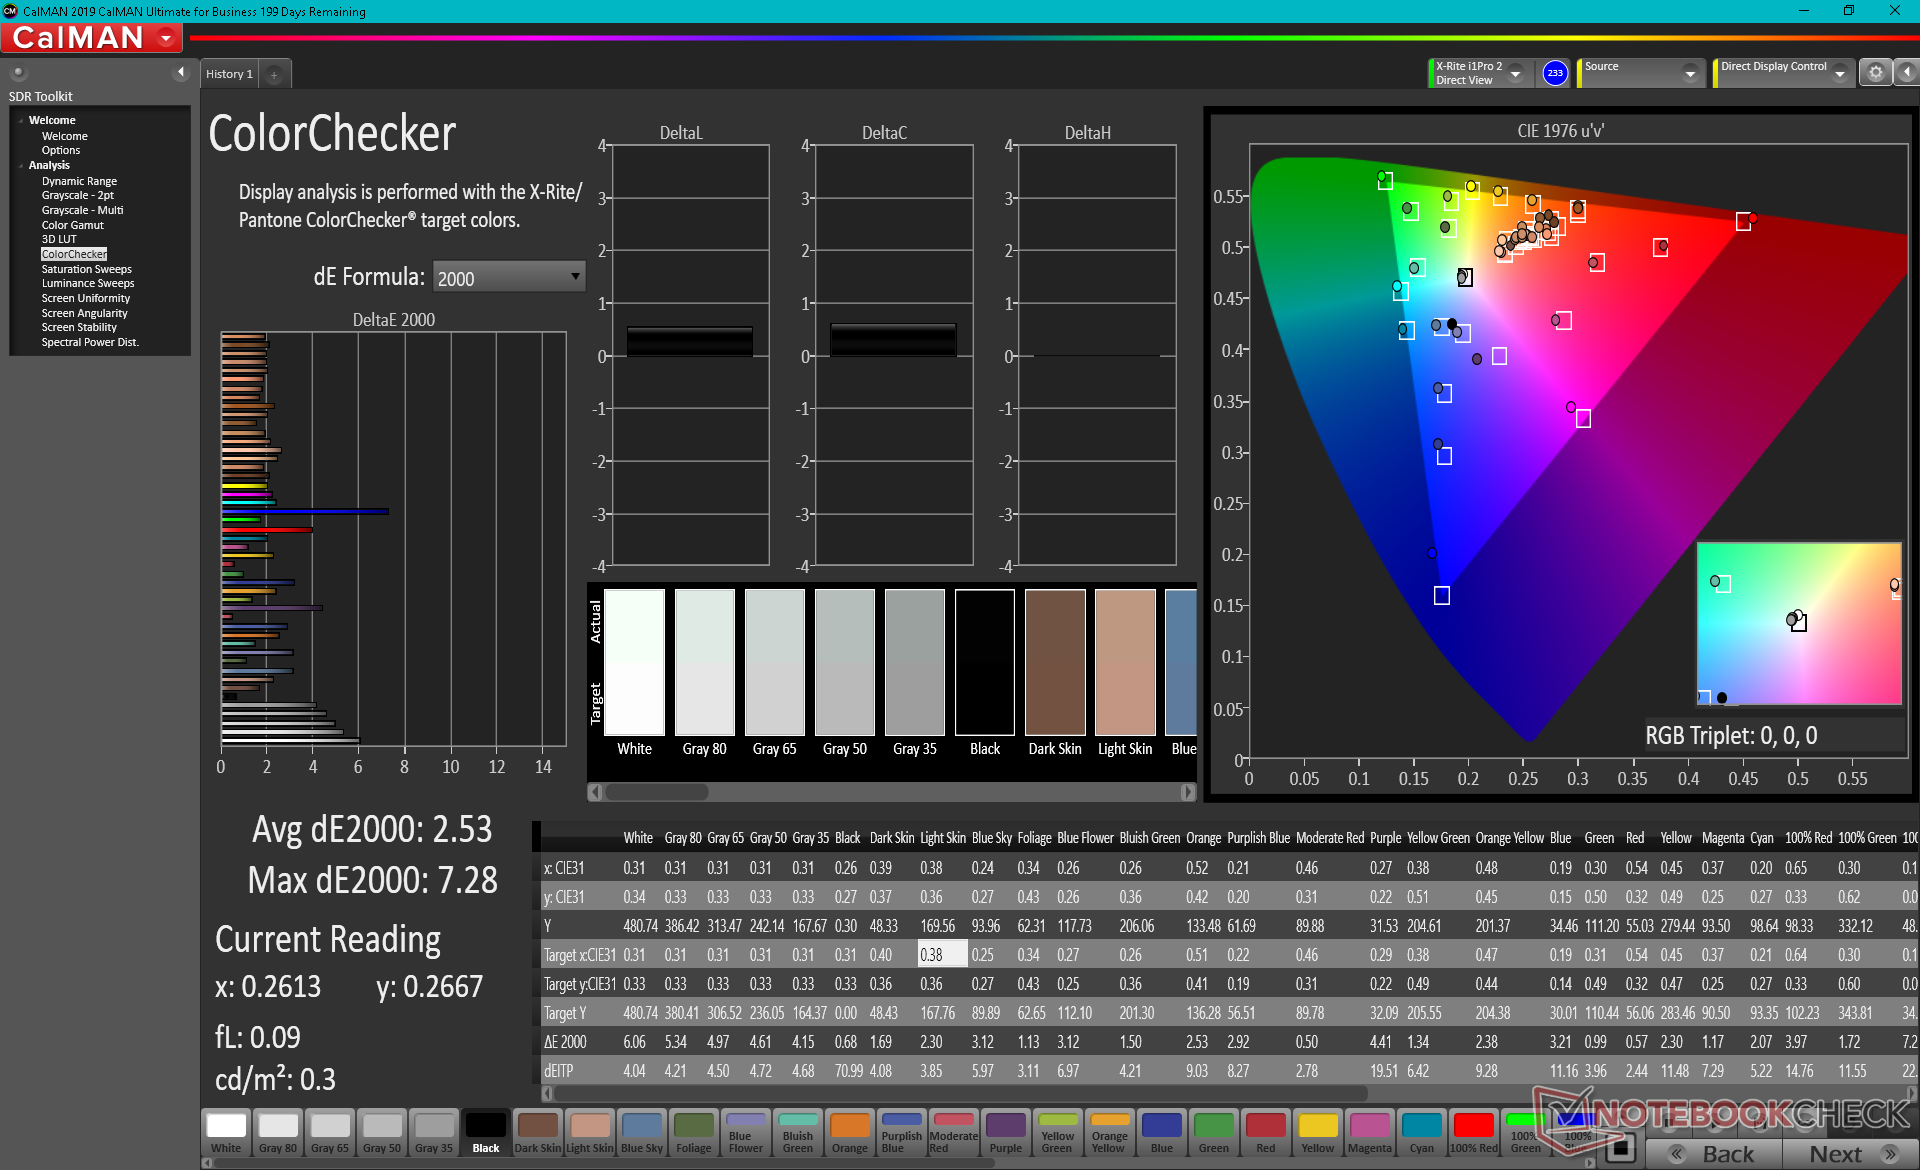
ΔE Color 2.53 | 0.5-29.43 Ø5, calibrated: 1.69
ΔE Greyscale 3.8 | 0.57-98 Ø5.3
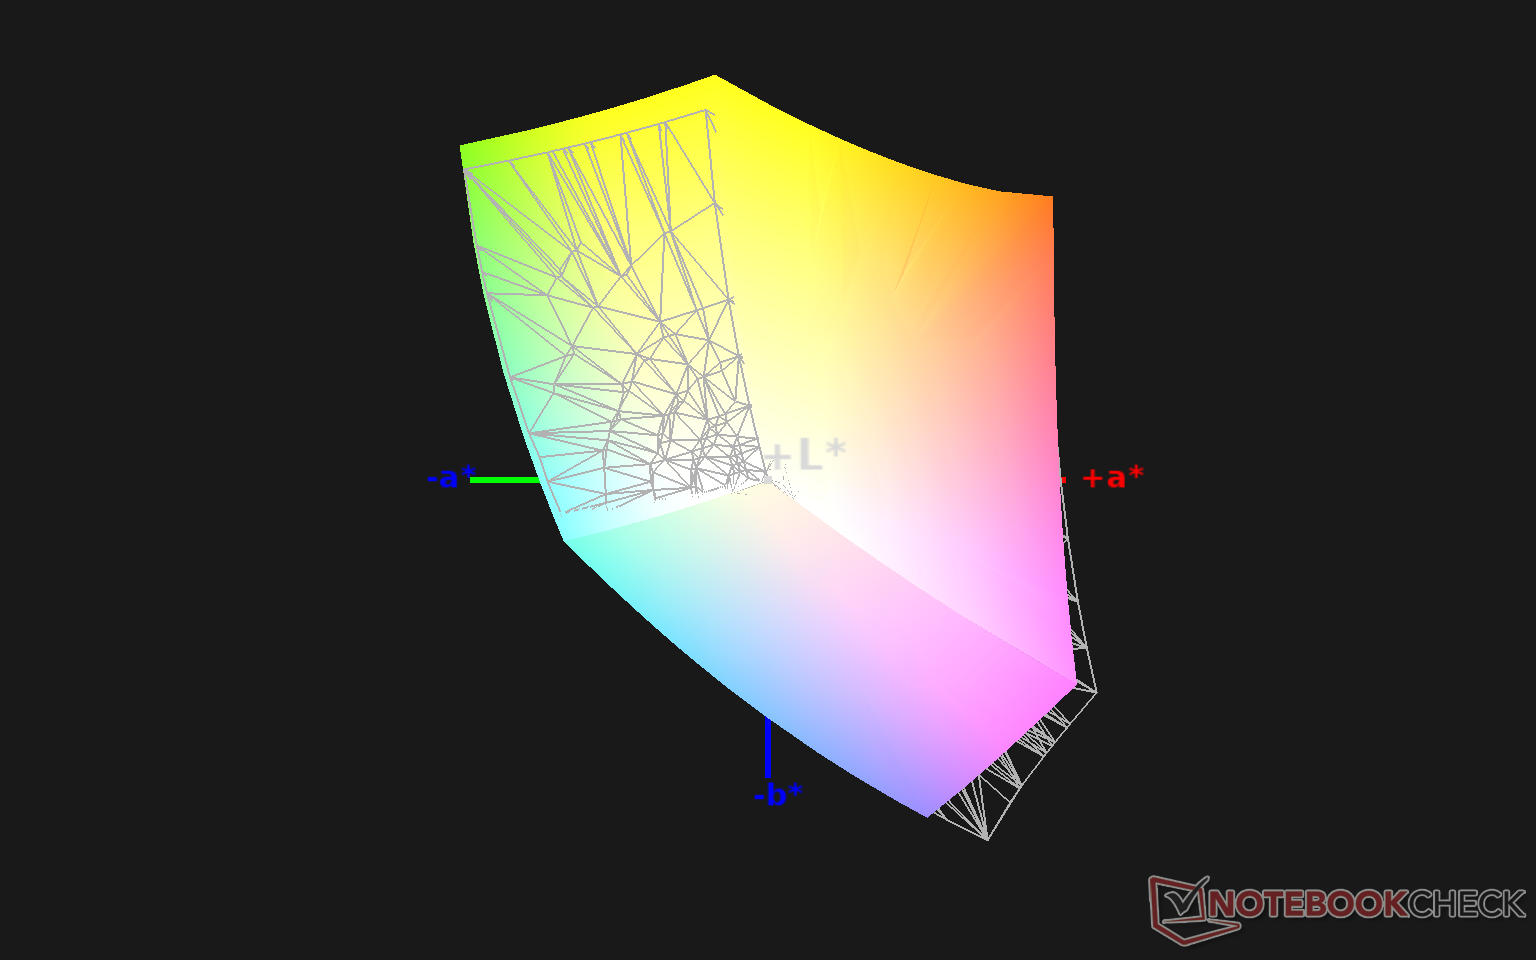
94.9% sRGB (Argyll 1.6.3 3D)
63% AdobeRGB 1998 (Argyll 1.6.3 3D)
71.2% AdobeRGB 1998 (Argyll 2.2.0 3D)
95.2% sRGB (Argyll 2.2.0 3D)
70% Display P3 (Argyll 2.2.0 3D)
Gamma: 2.15
| ADATA XPG Xenia Xe BOE08F5, IPS, 15.60, 1920x1080 | Dell XPS 15 9500 Core i5 Sharp LQ156N1, IPS, 15.60, 1920x1200 | HP Spectre X360 15-5ZV31AV AU Optronics AUO30EB, IPS, 15.60, 3840x2160 | Asus ZenBook 15 UX534FTC-A8190T BOE CQ NV156FHM-N63, IPS, 15.60, 1920x1080 | Lenovo Yoga Creator 7 15IMH05 82DS000VGE BOE CQ NV156FHM-N69, IPS, 15.60, 1920x1080 | Apple MacBook Pro 15 2018 (2.6 GHz, 560X) APPA040, IPS, 15.40, 2880x1800 | |
|---|---|---|---|---|---|---|
| Display | 11% | -2% | -9% | -0% | 23% | |
| Display P3 Coverage | 70 | 81.5 16% | 68.3 -2% | 65 -7% | 68.7 -2% | 98.7 41% |
| sRGB Coverage | 95.2 | 100 5% | 94.3 -1% | 86.2 -9% | 97.1 2% | 99.9 5% |
| AdobeRGB 1998 Coverage | 71.2 | 79.6 12% | 68.4 -4% | 62.9 -12% | 70.3 -1% | 86.6 22% |
| Response Times | 26% | -3% | 20% | 88% | 22% | |
| Response Time Grey 50% / Grey 80% * | 56.8 ? | 42 ? 26% | 56.8 ? -0% | 45 ? 21% | 5 ? 91% | 43.2 ? 24% |
| Response Time Black / White * | 38.8 ? | 28.8 ? 26% | 40.8 ? -5% | 32 ? 18% | 6 ? 85% | 31.2 ? 20% |
| PWM Frequency | 117000 ? | |||||
| Screen | -2% | -15% | -18% | -47% | 21% | |
| Brightness middle | 480.4 | 592 23% | 284.6 -41% | 299 -38% | 360 -25% | 520 8% |
| Brightness | 451 | 565 25% | 285 -37% | 280 -38% | 320 -29% | 492 9% |
| Brightness Distribution | 88 | 85 -3% | 85 -3% | 89 1% | 81 -8% | 88 0% |
| Black Level * | 0.31 | 0.46 -48% | 0.25 19% | 0.21 32% | 0.18 42% | 0.39 -26% |
| Contrast | 1550 | 1287 -17% | 1138 -27% | 1424 -8% | 2000 29% | 1333 -14% |
| Colorchecker dE 2000 * | 2.53 | 3.19 -26% | 3.52 -39% | 4.76 -88% | 6.84 -170% | 1.2 53% |
| Colorchecker dE 2000 max. * | 7.28 | 5.45 25% | 5.56 24% | 9 -24% | 12.52 -72% | 2.3 68% |
| Colorchecker dE 2000 calibrated * | 1.69 | 2.03 -20% | 3 -78% | 2.54 -50% | ||
| Greyscale dE 2000 * | 3.8 | 3.9 -3% | 3.2 16% | 3.53 7% | 12.94 -241% | 1.3 66% |
| Gamma | 2.15 102% | 2.25 98% | 2.28 96% | 2.3 96% | 2.55 86% | 2.18 101% |
| CCT | 6760 96% | 6522 100% | 7070 92% | 7228 90% | 6973 93% | 6738 96% |
| Color Space (Percent of AdobeRGB 1998) | 63 | 71.6 14% | 61.1 -3% | 56 -11% | 63 0% | |
| Color Space (Percent of sRGB) | 94.9 | 100 5% | 93.8 -1% | 86 -9% | 97 2% | |
| Total Average (Program / Settings) | 12% /
4% | -7% /
-11% | -2% /
-11% | 14% /
-22% | 22% /
21% |
* ... smaller is better
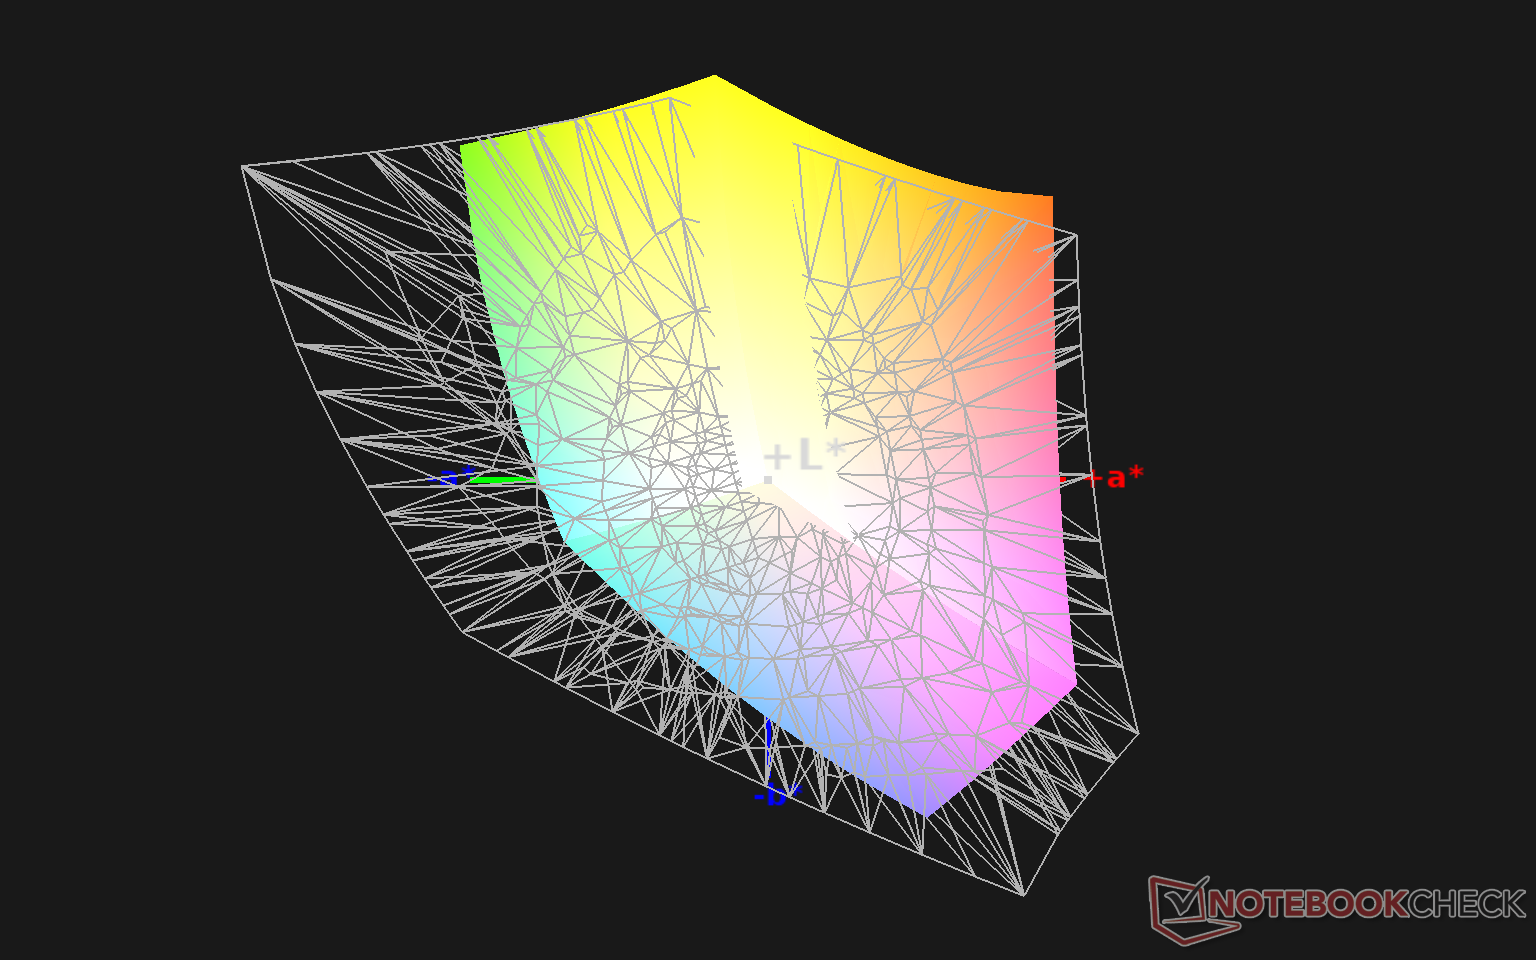
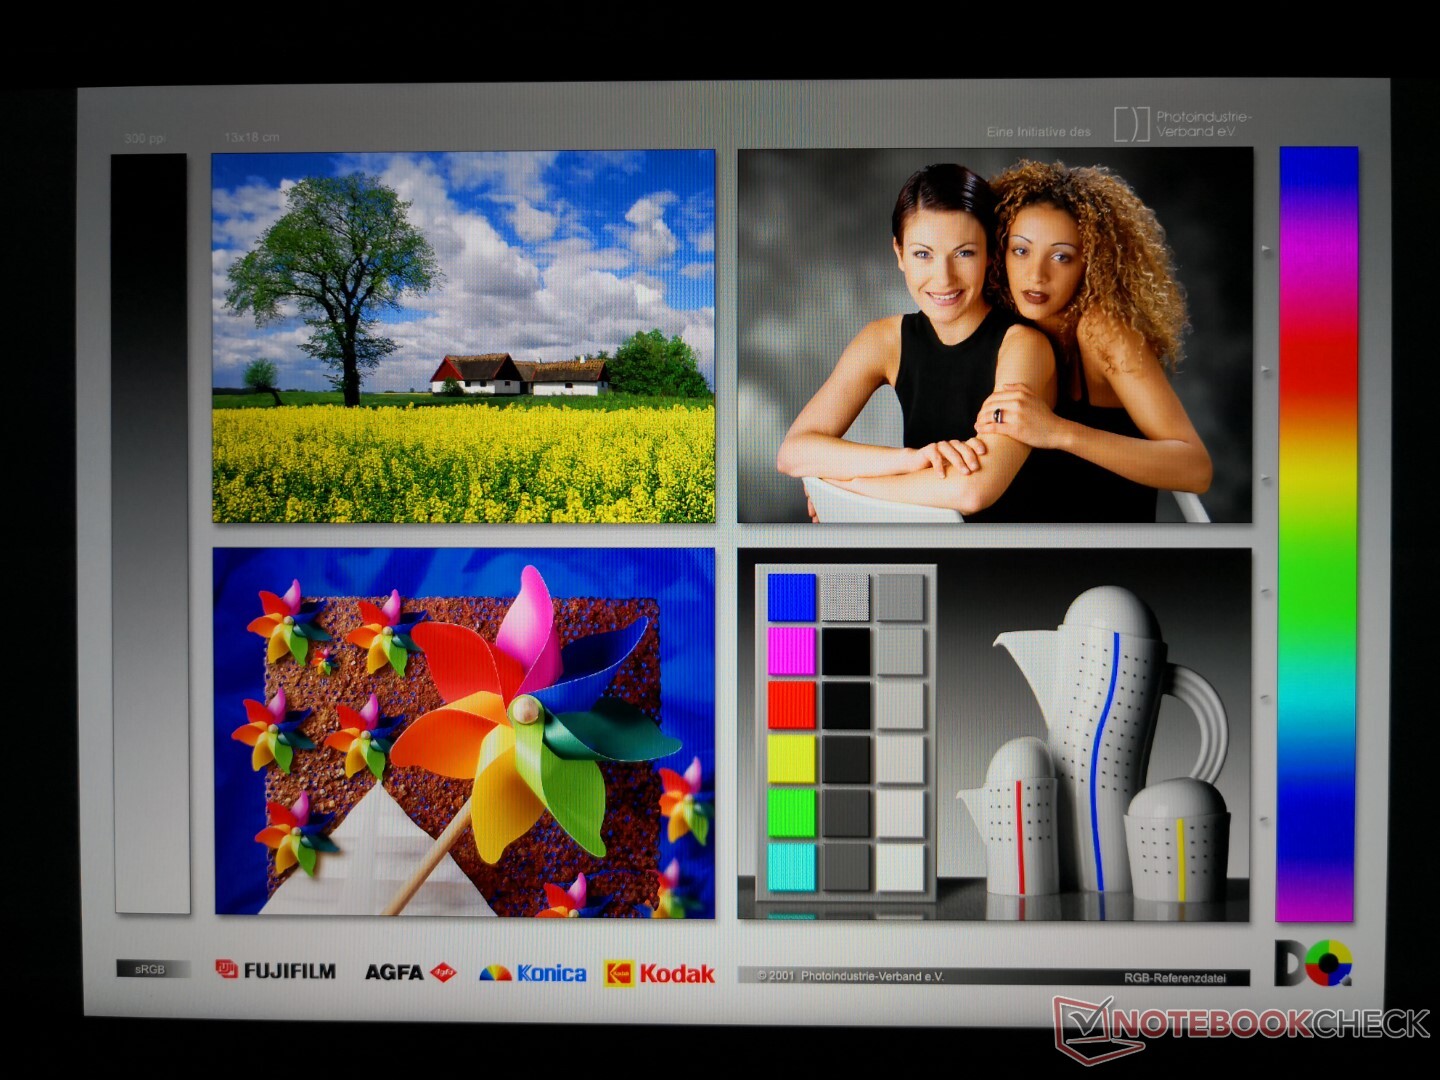
Color space covers >95 percent of sRGB not unlike most other high-end Ultrabooks. For wider colors, users will have to consider the XPS 15, Razer Blade 15, or Asus ZenBook Pro 15 as there are no other display options available on this ADATA.
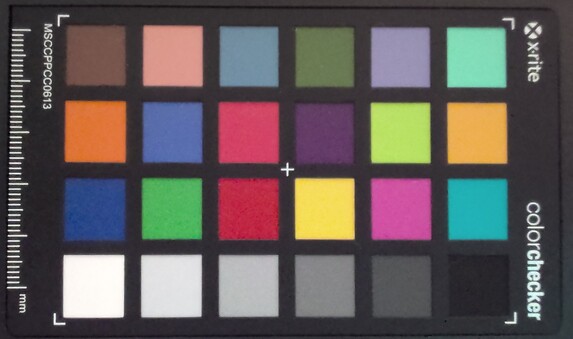
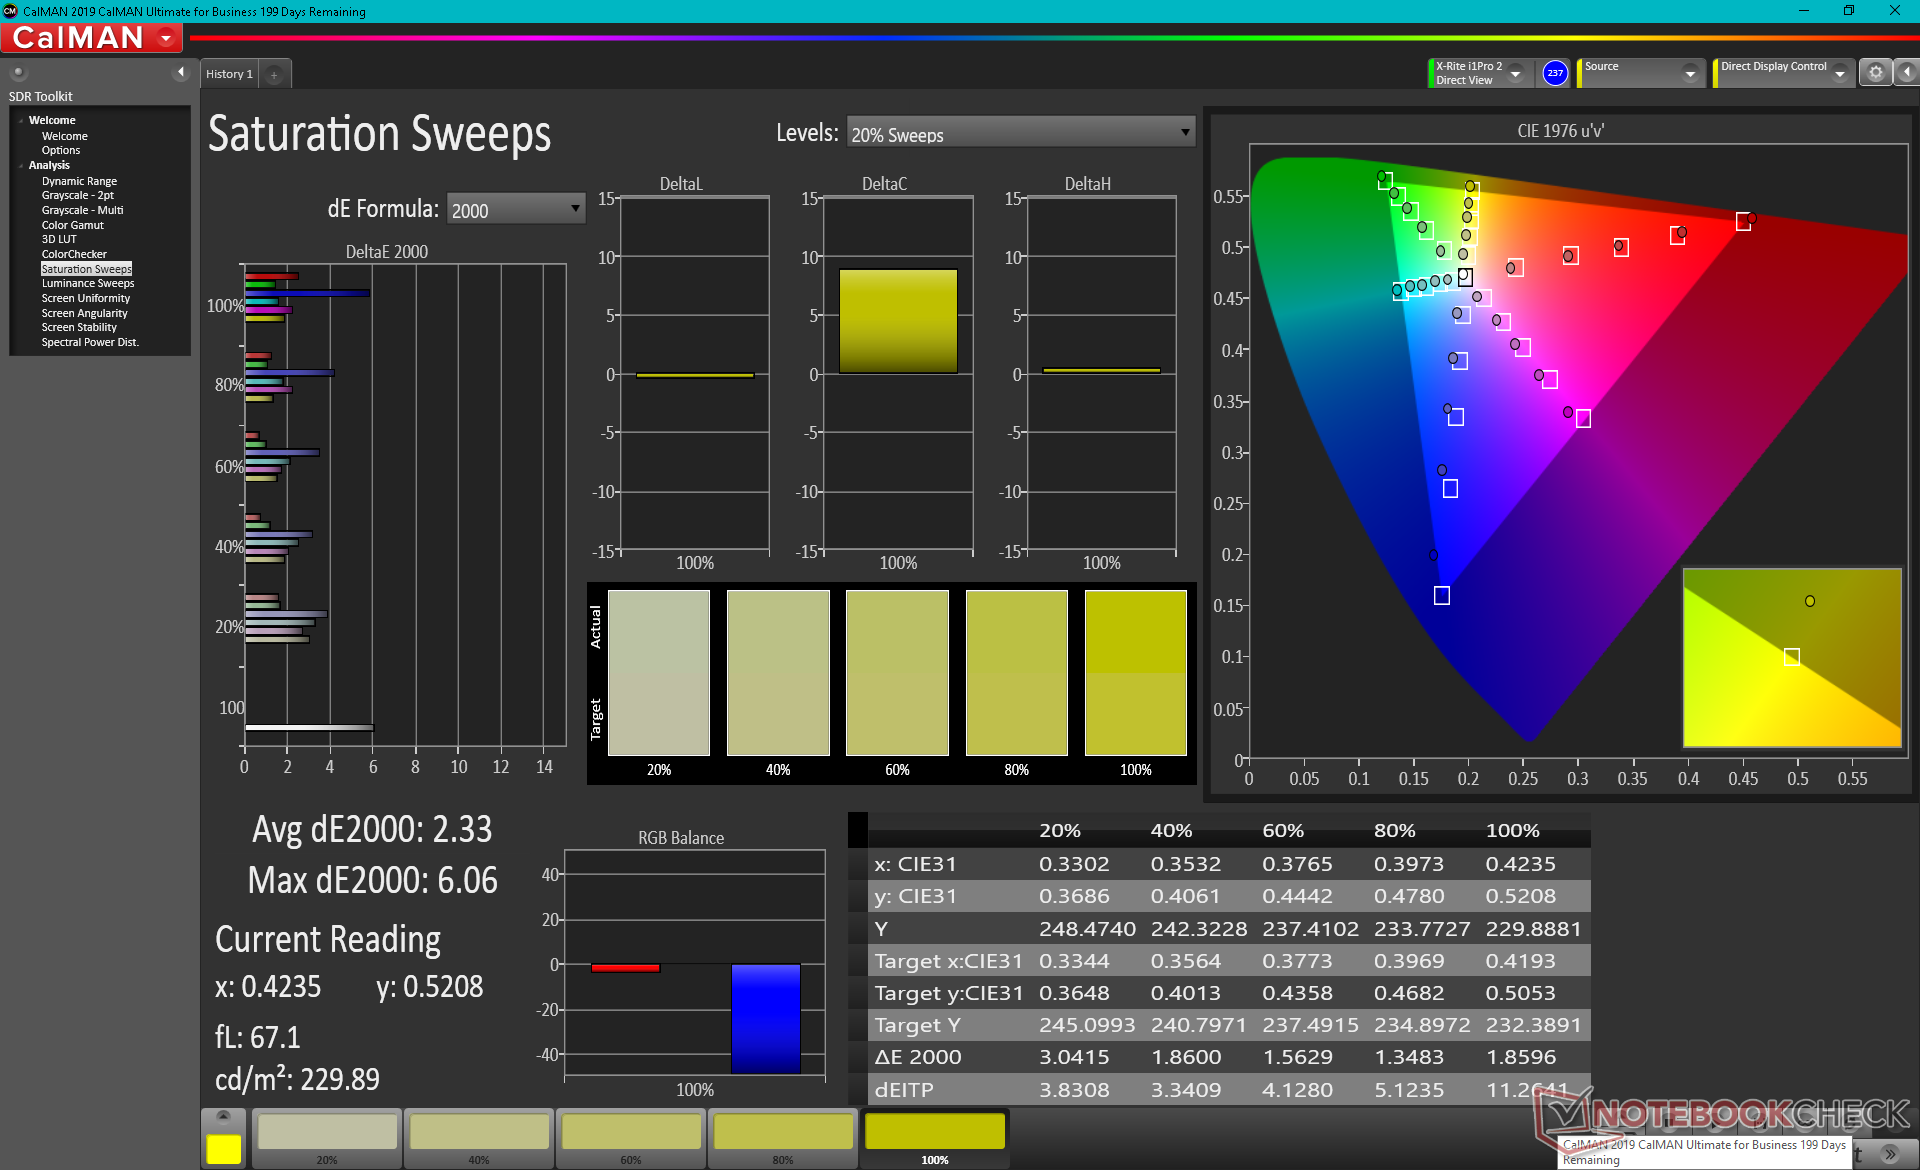
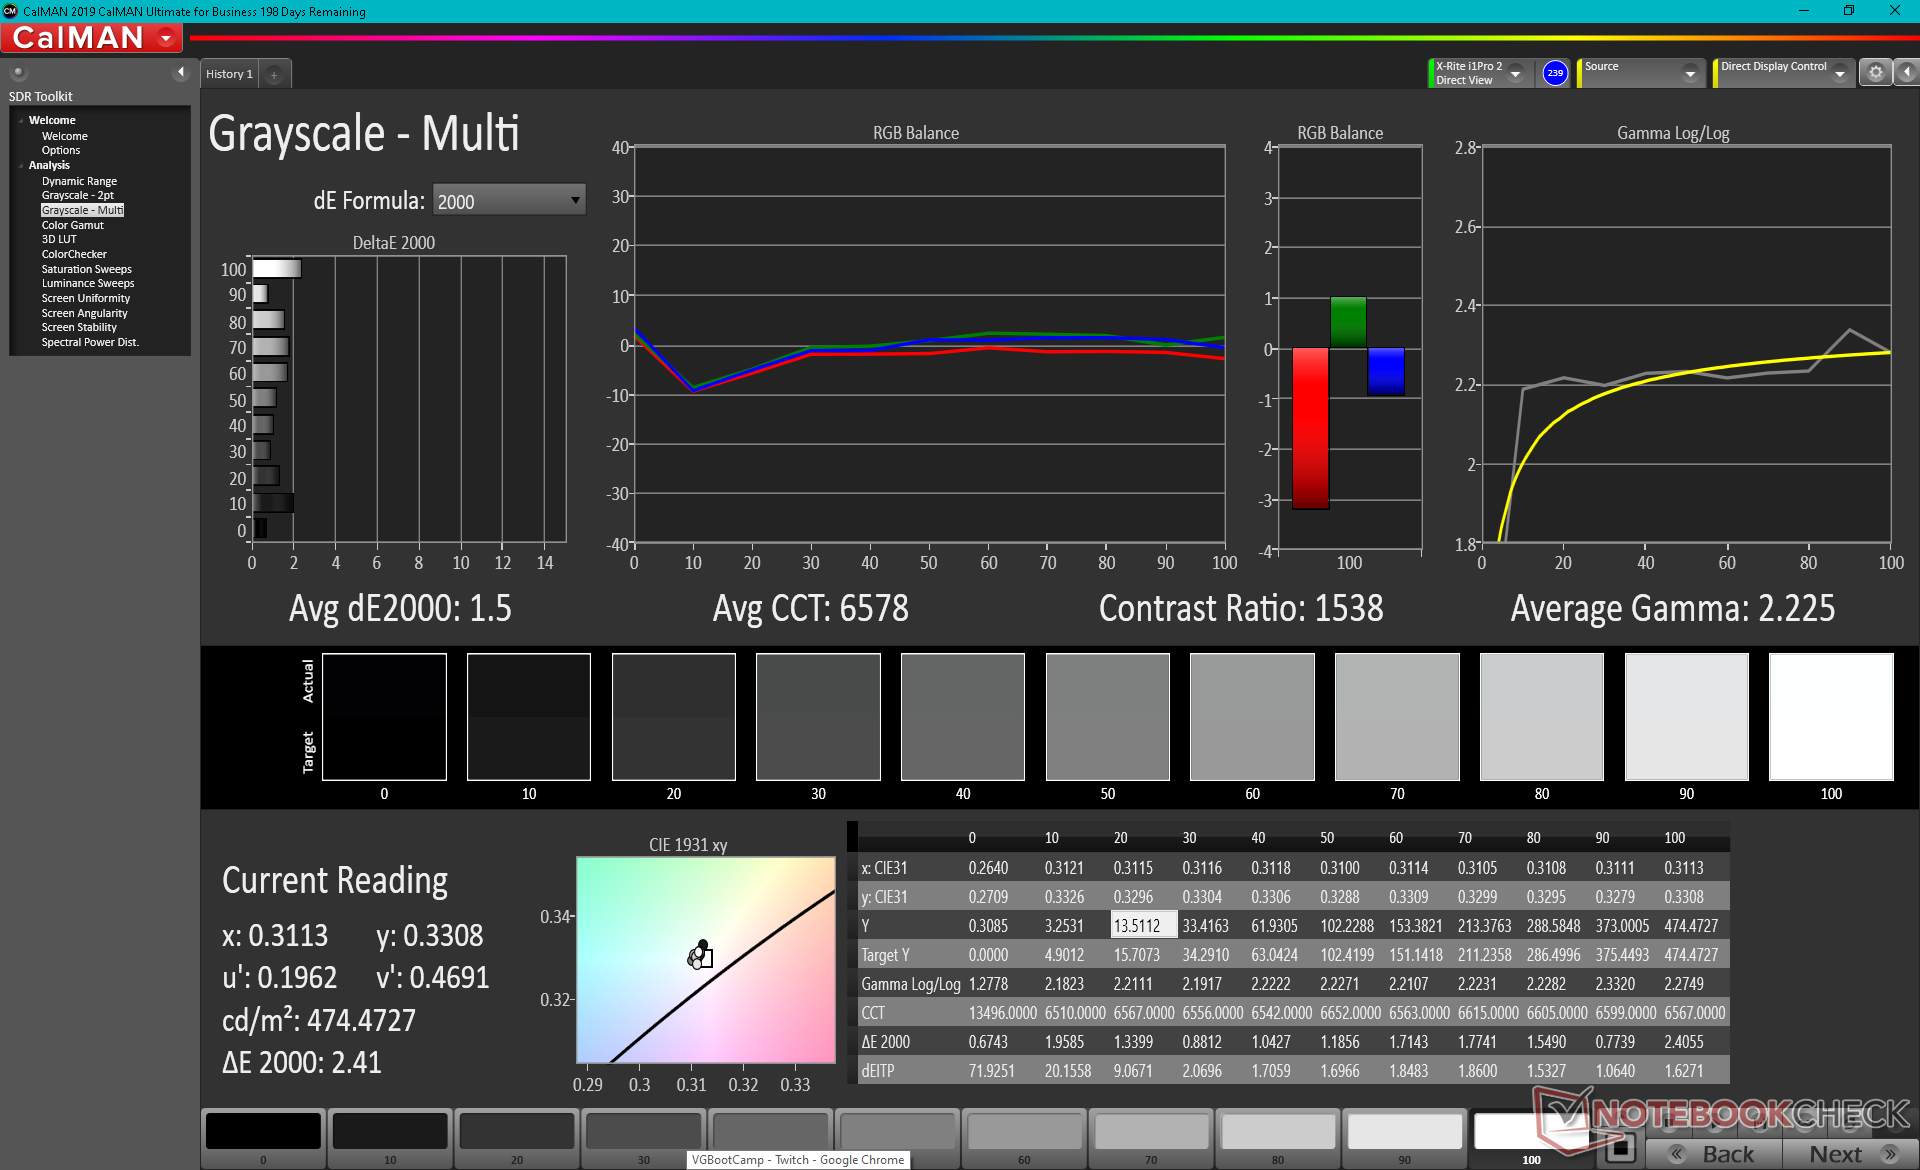
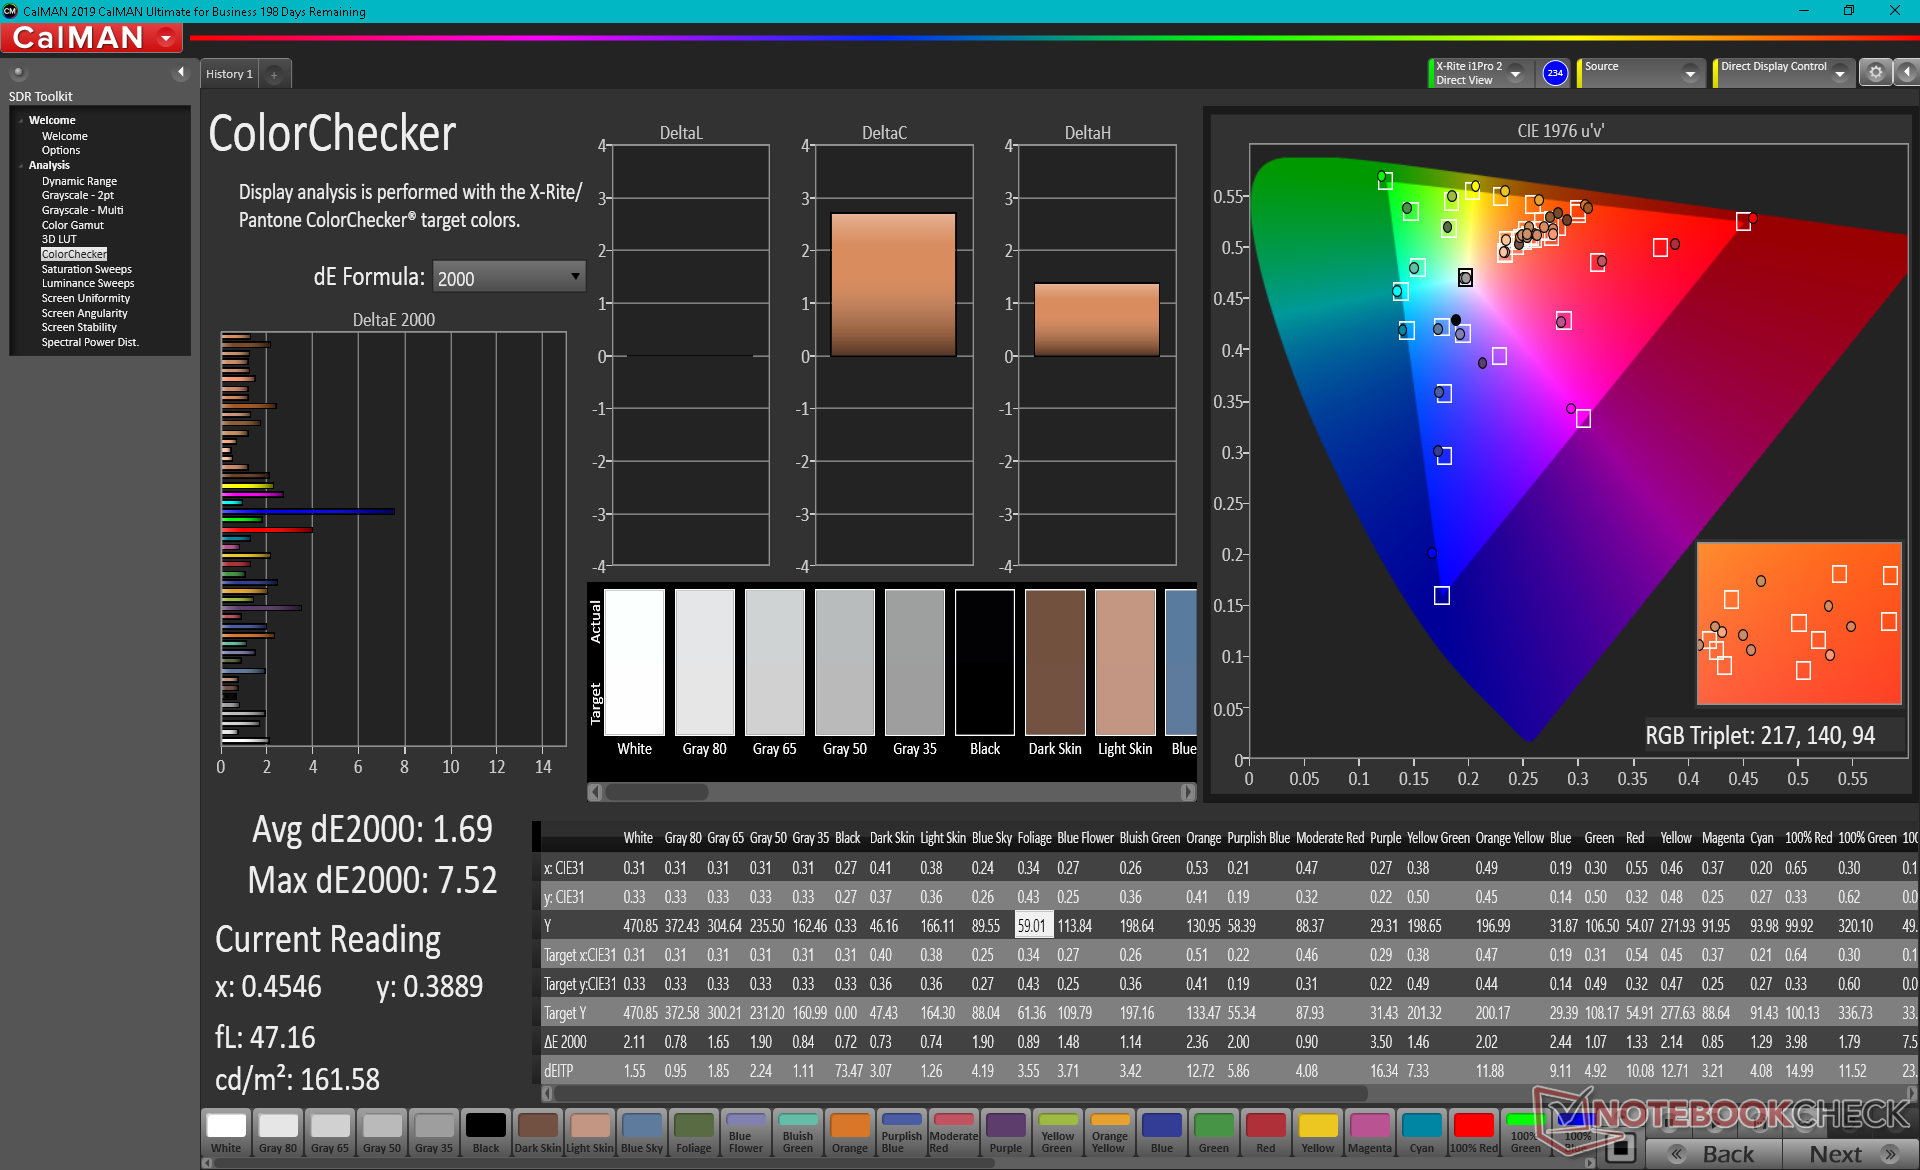
X-Rite colorimeter measurements show color temperature to be slightly on the cool side which we are able to easily fix with a calibration. Grayscale and colors become very accurate after calibration with average DeltaE values of just 1.5 and 1.69, respectively. However, the display seems to have trouble reproducing blue colors as accurately as other primary and secondary colors.
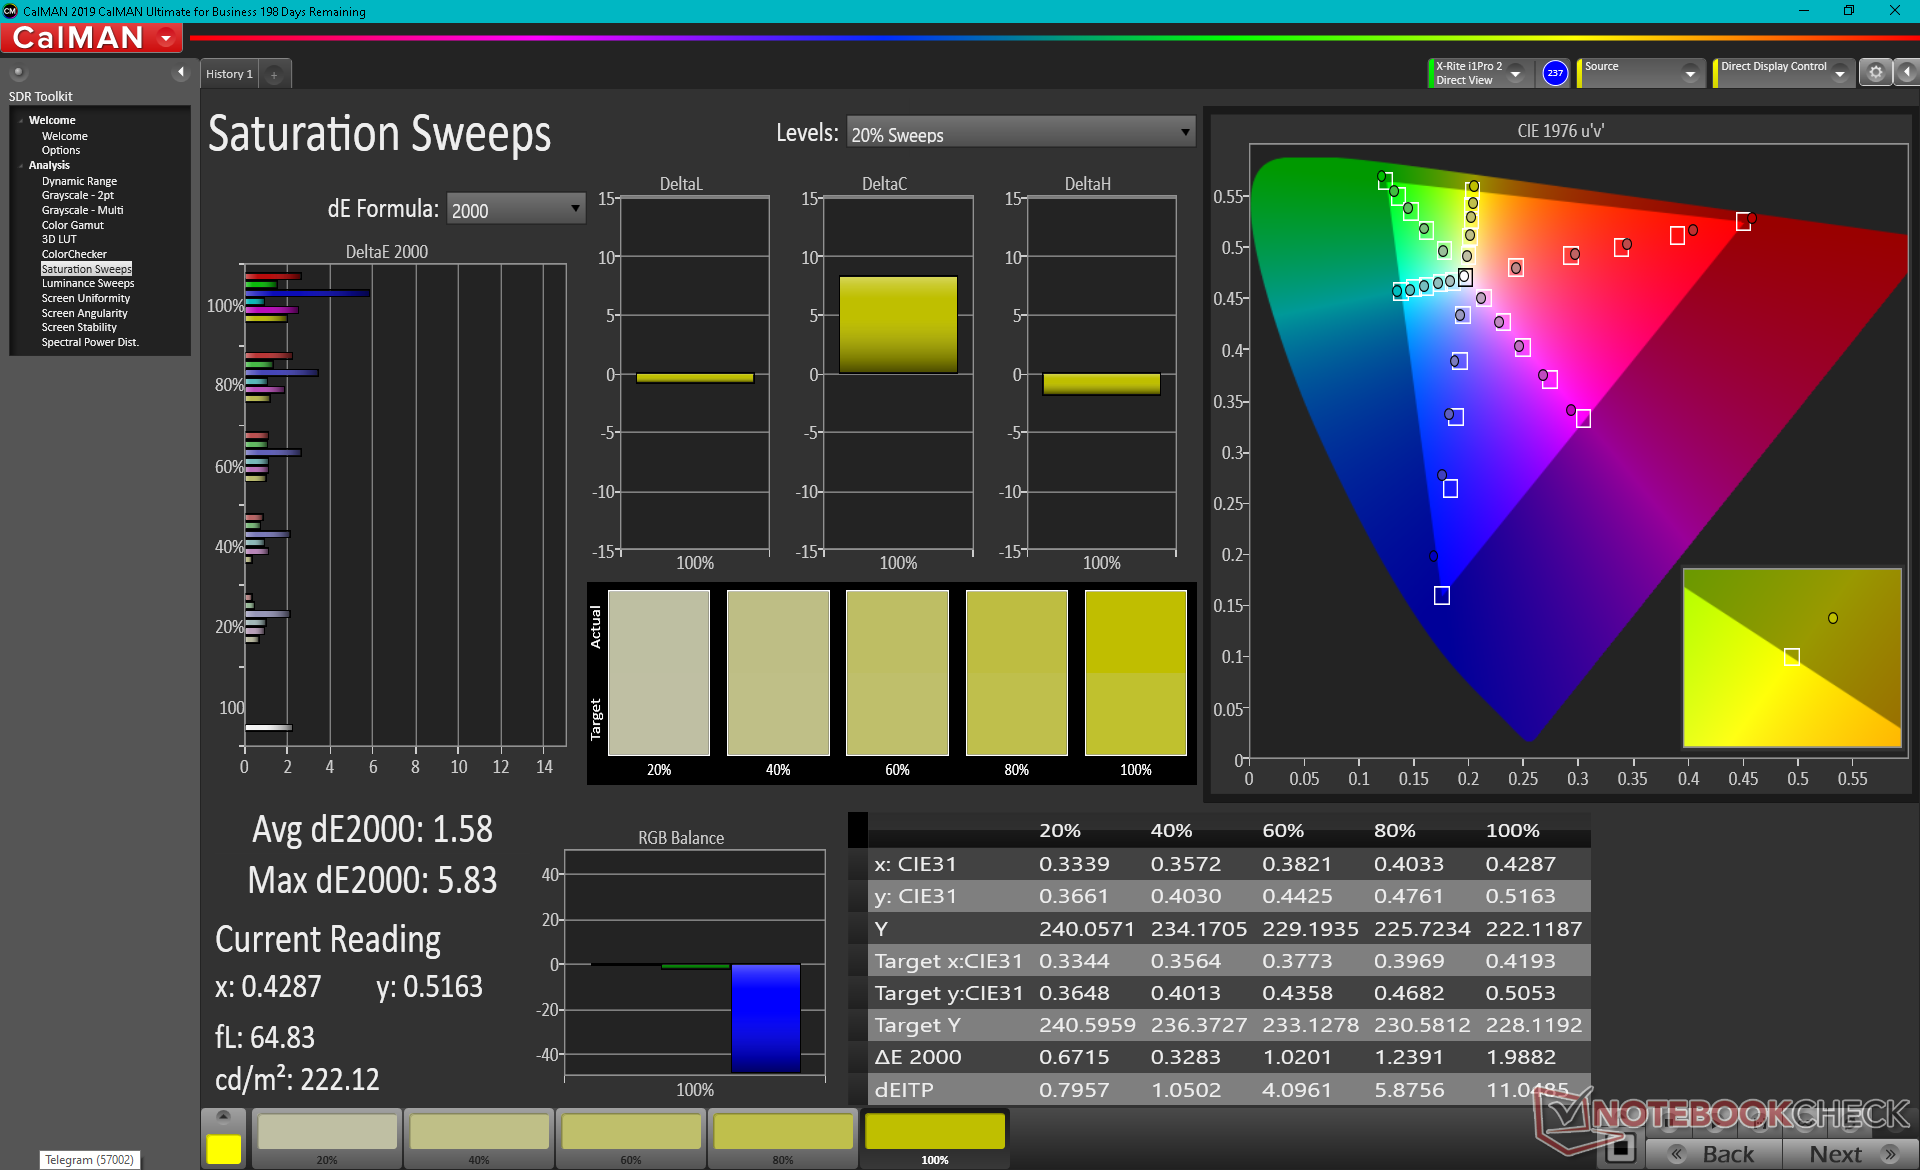
Display Response Times
| ↔ Response Time Black to White | ||
|---|---|---|
| 38.8 ms ... rise ↗ and fall ↘ combined | ↗ 20.4 ms rise | 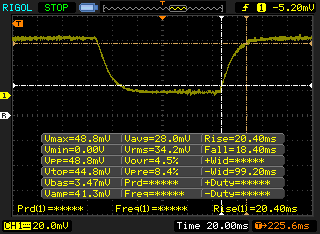 |
| ↘ 18.4 ms fall | ||
| The screen shows slow response rates in our tests and will be unsatisfactory for gamers. In comparison, all tested devices range from 0.1 (minimum) to 240 (maximum) ms. » 96 % of all devices are better. This means that the measured response time is worse than the average of all tested devices (21.5 ms). | ||
| ↔ Response Time 50% Grey to 80% Grey | ||
| 56.8 ms ... rise ↗ and fall ↘ combined | ↗ 29.2 ms rise | 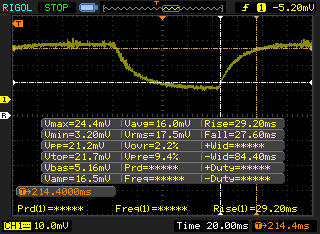 |
| ↘ 27.6 ms fall | ||
| The screen shows slow response rates in our tests and will be unsatisfactory for gamers. In comparison, all tested devices range from 0.2 (minimum) to 636 (maximum) ms. » 93 % of all devices are better. This means that the measured response time is worse than the average of all tested devices (33.7 ms). | ||
Screen Flickering / PWM (Pulse-Width Modulation)
| Screen flickering / PWM not detected | 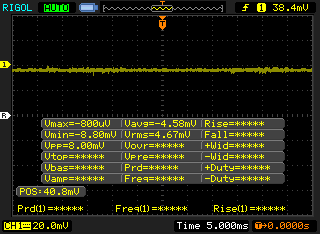 | ||
In comparison: 53 % of all tested devices do not use PWM to dim the display. If PWM was detected, an average of 17900 (minimum: 5 - maximum: 3846000) Hz was measured. | |||
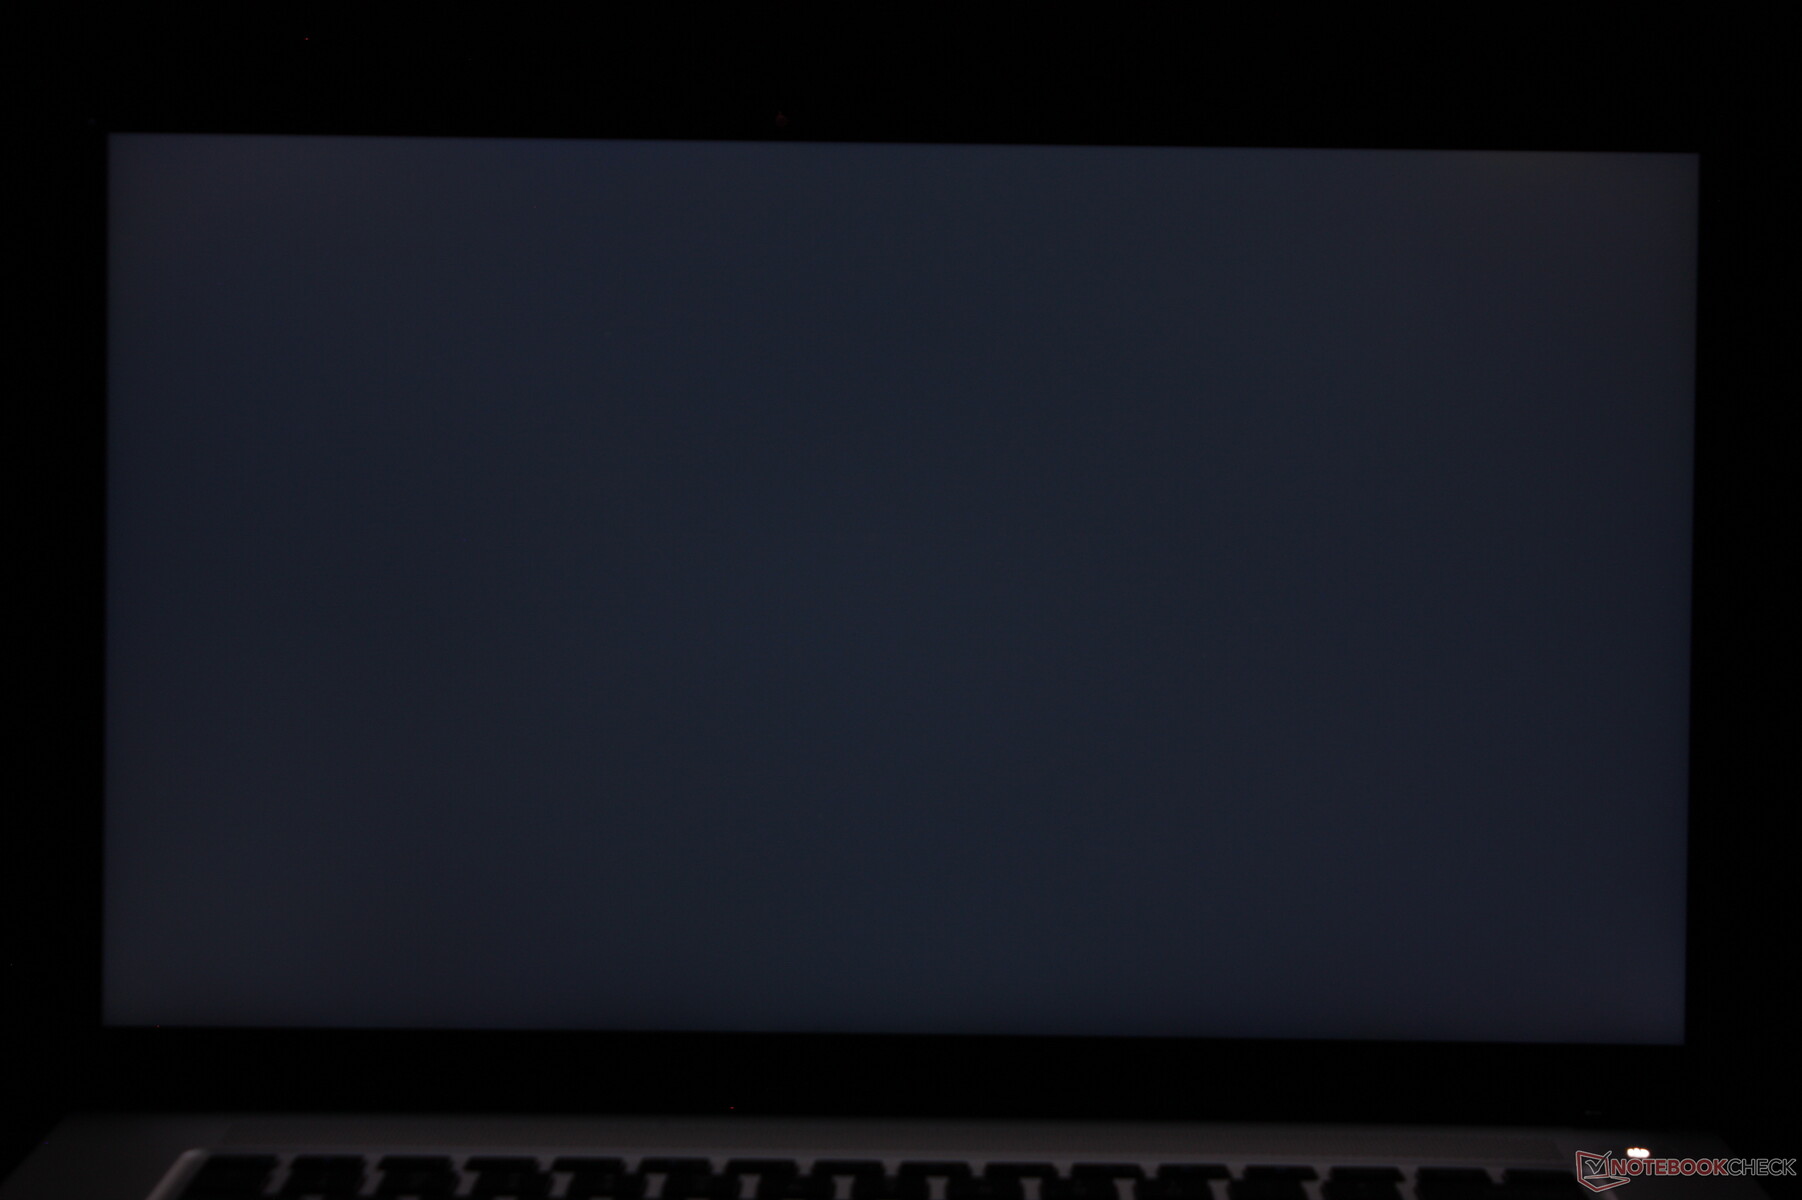
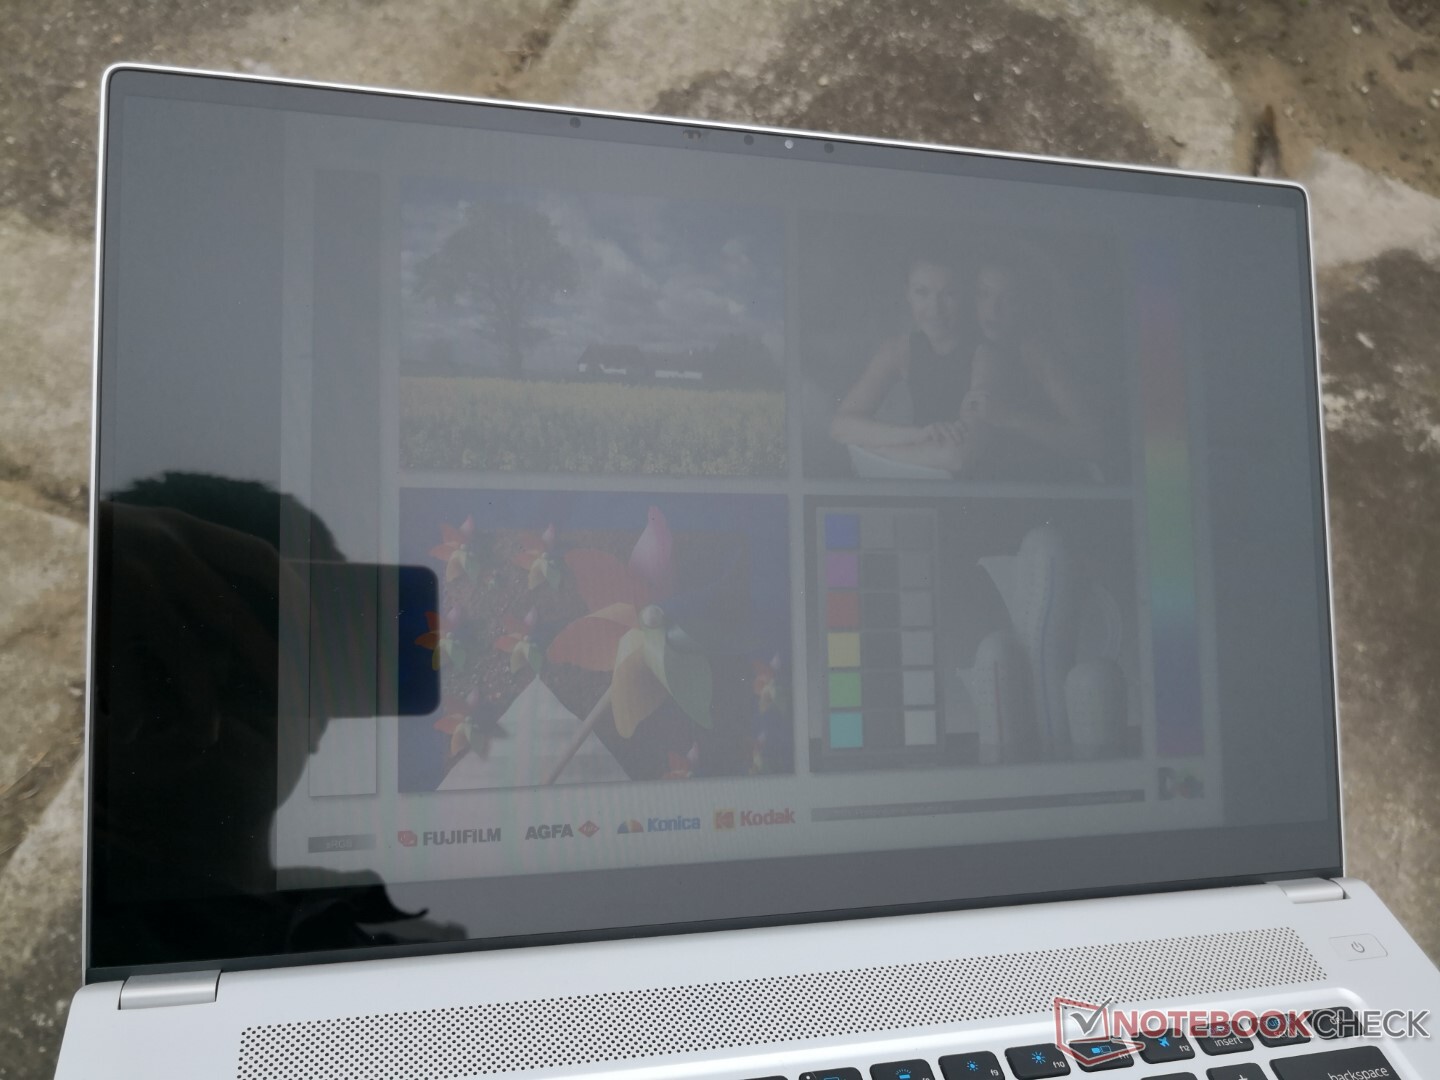
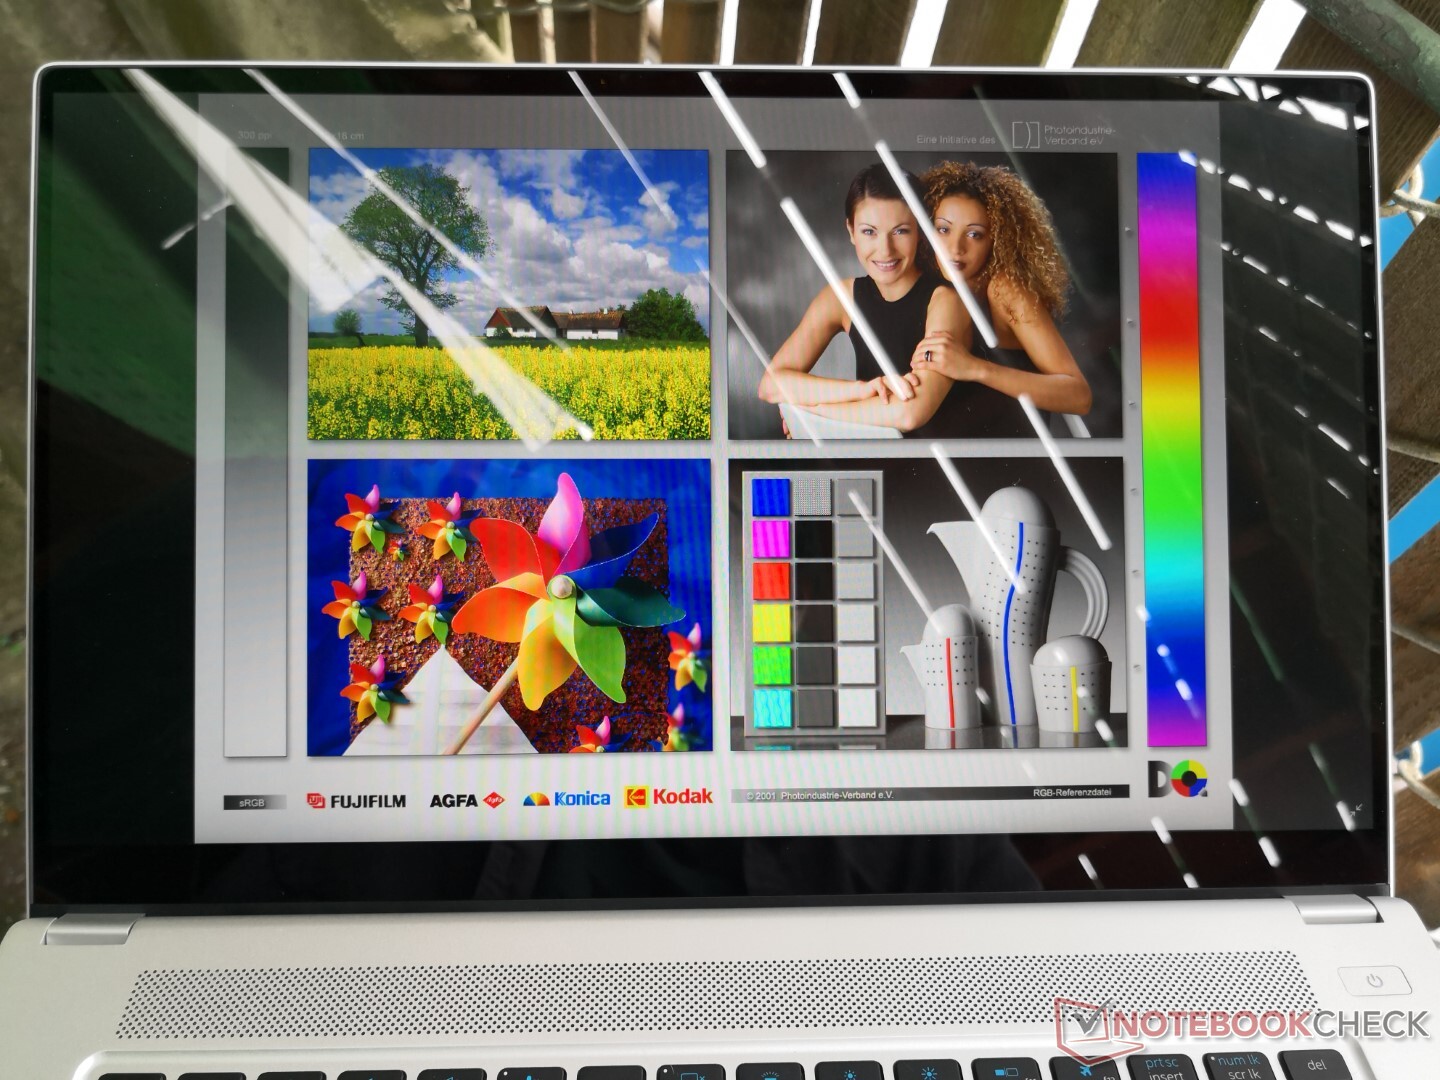
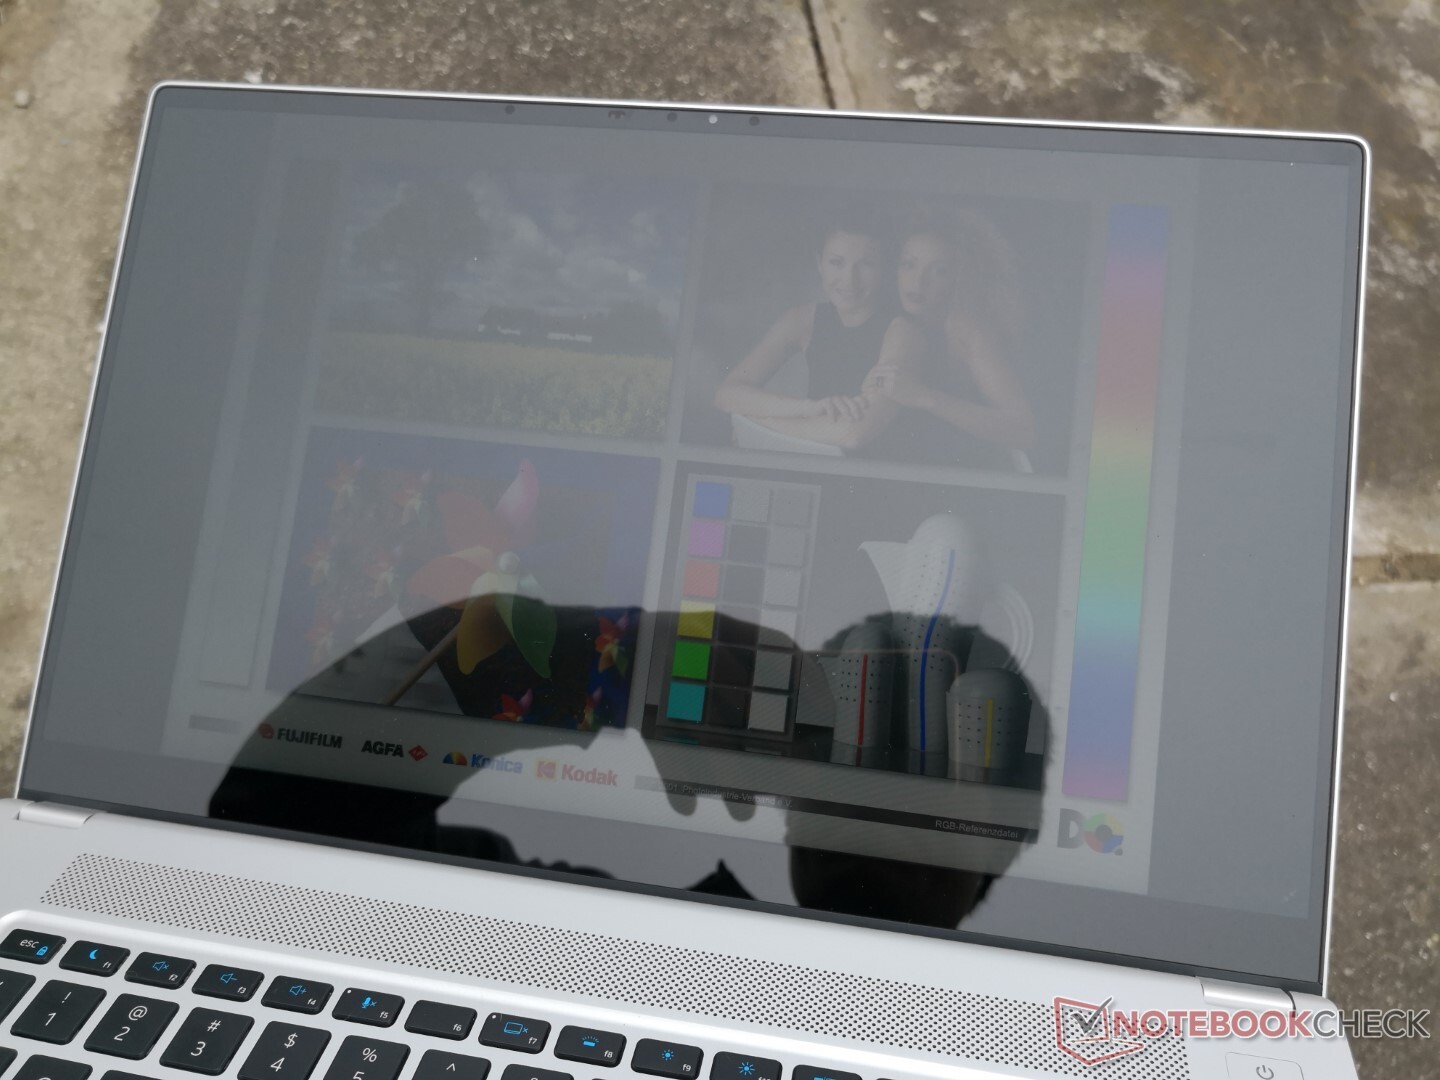
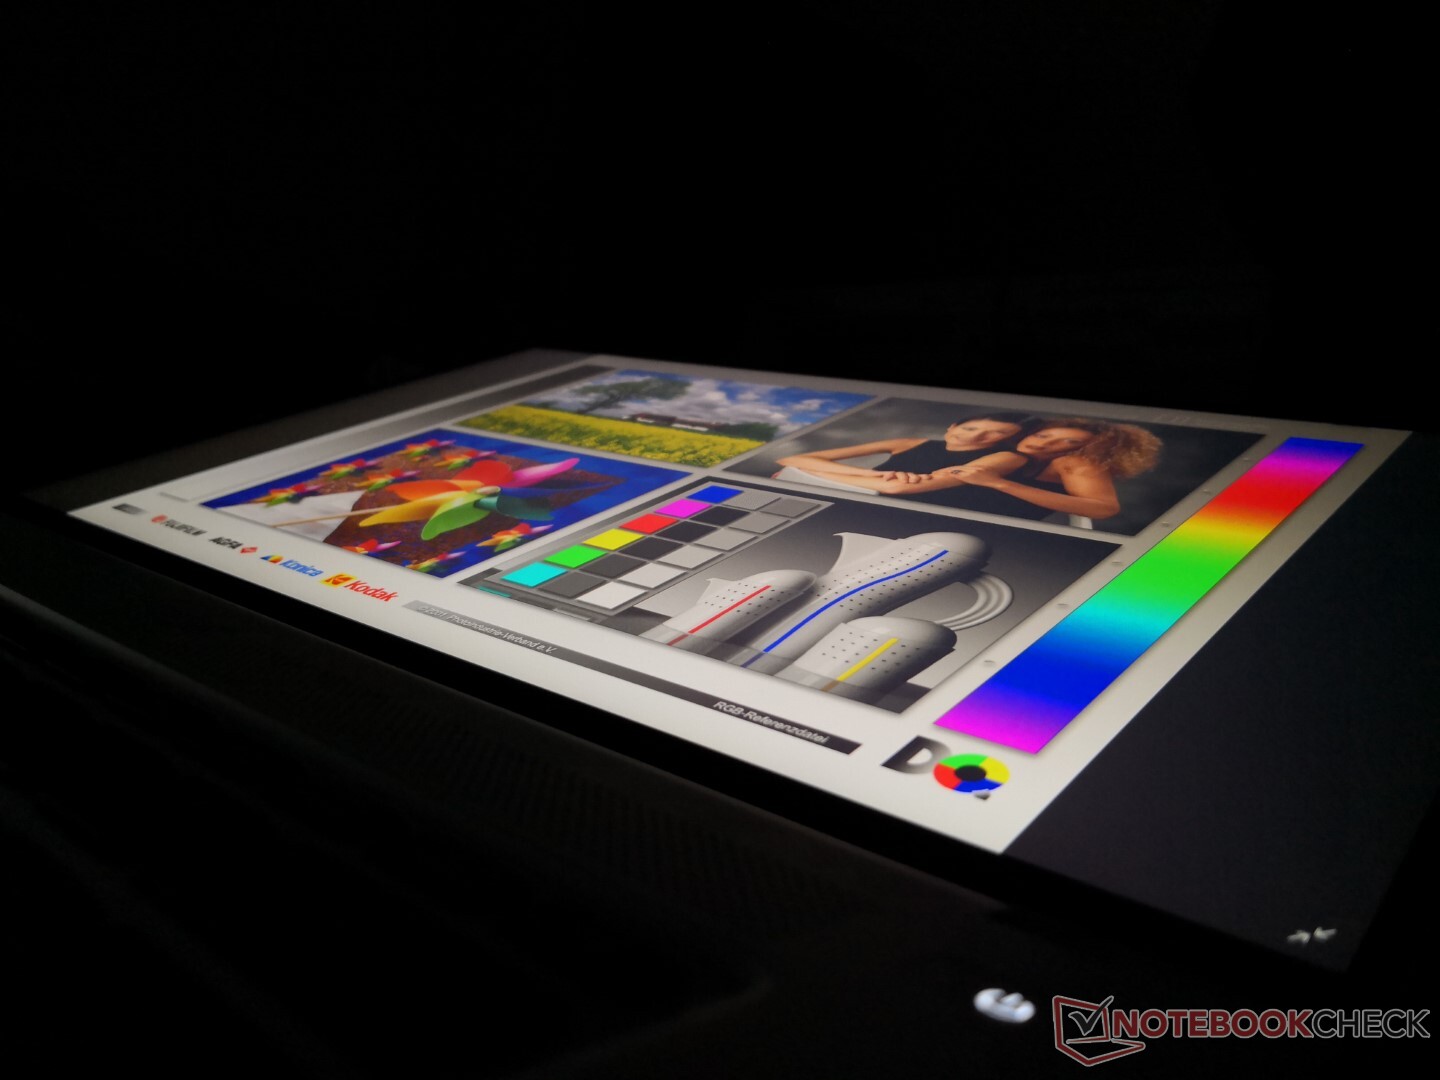
Outdoor visibility is good only when under shade where colors don't become as washed out. Expect some amount of glare no matter the positioning. The XPS 15 has a noticeably brighter display if outdoor visibility is of utmost concern.
Performance
Intel wants to prove that its low-power Tiger Lake-U platform can power a multimedia laptop without requiring dedicated graphics. Thus, the XPG Xenia Xe comes only with a Core i5-1135G7 or Core i7-1165G7 CPU with integrated Iris Xe in contrast to most other multimedia laptops where high-power Core H series CPUs and Nvidia graphics are common.
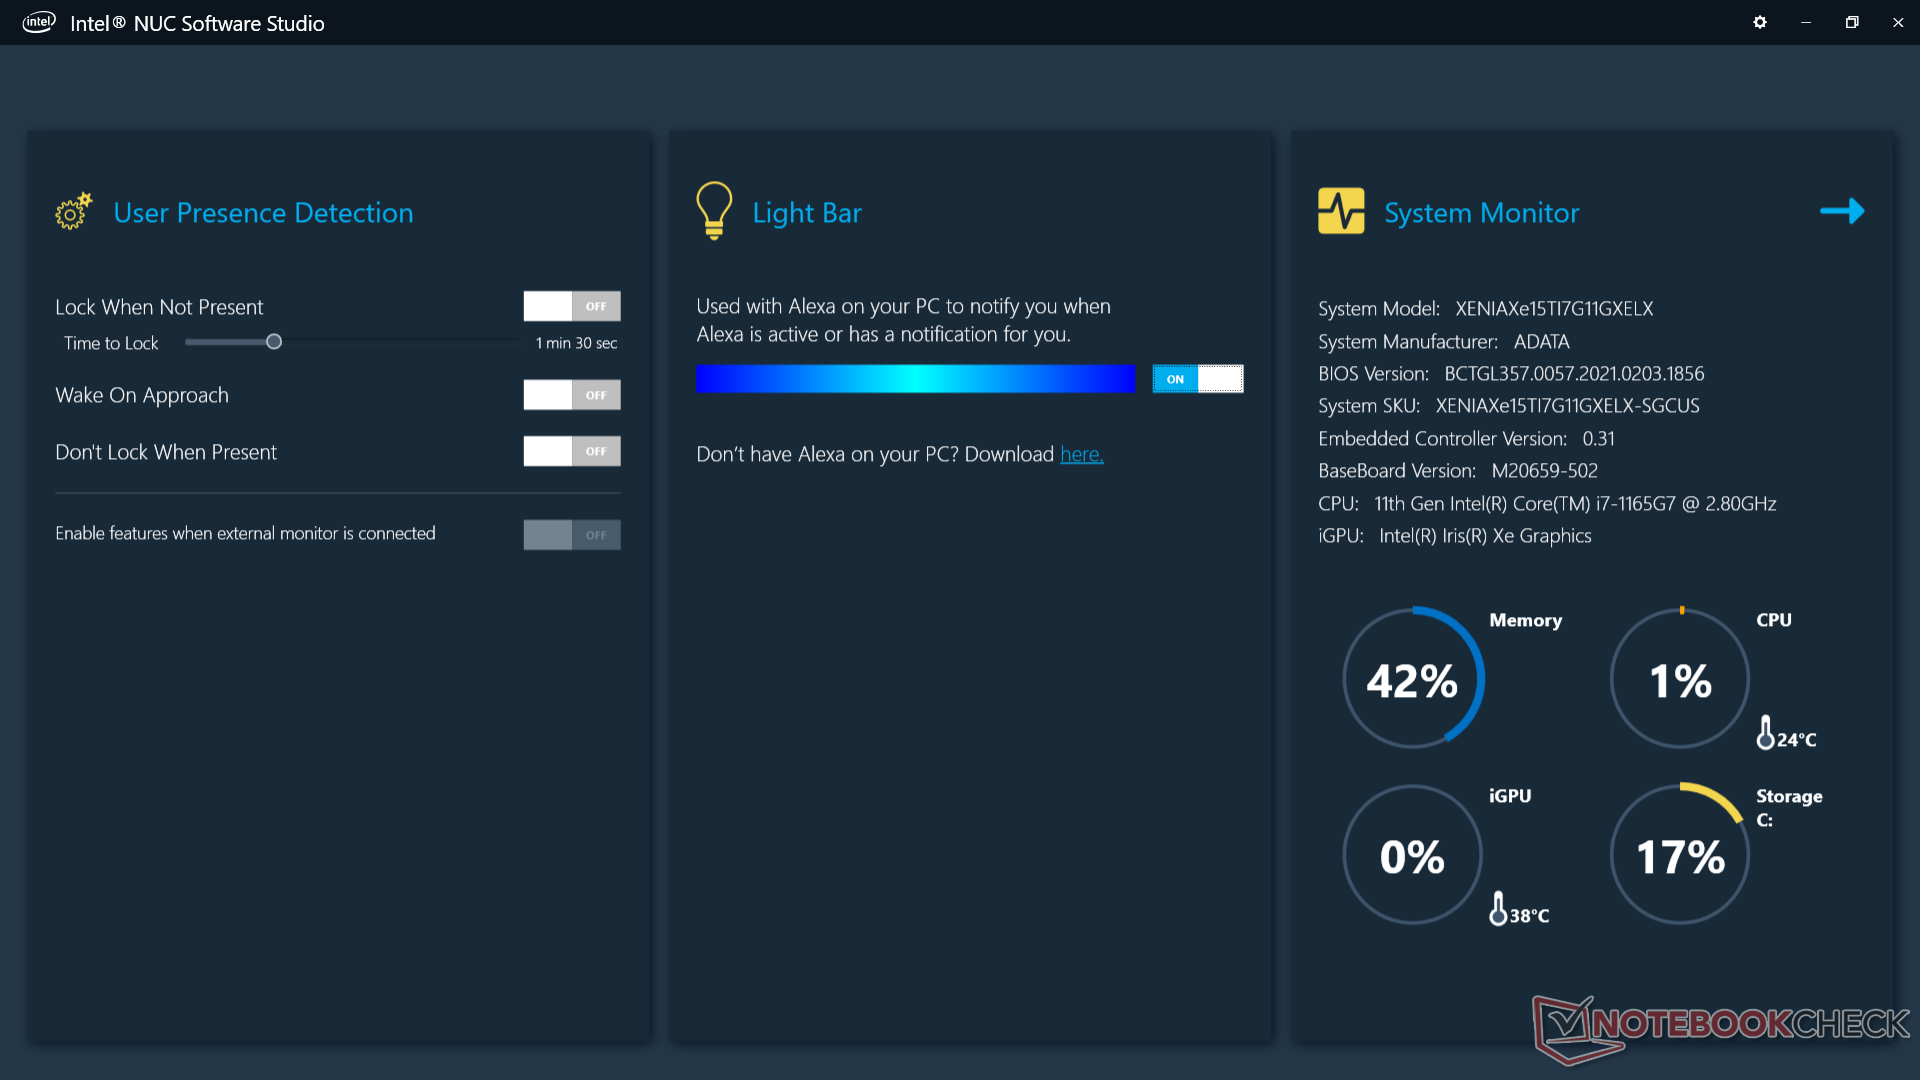
We recommend users become familiar with the pre-installed Intel NUC Software Studio application as key system settings are toggled here. In particular, its Presence Aware feature is enabled by default which overrides any Windows sleep settings.
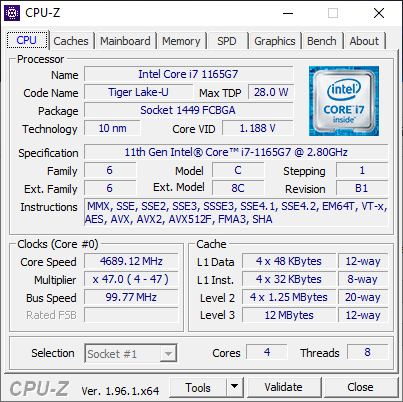
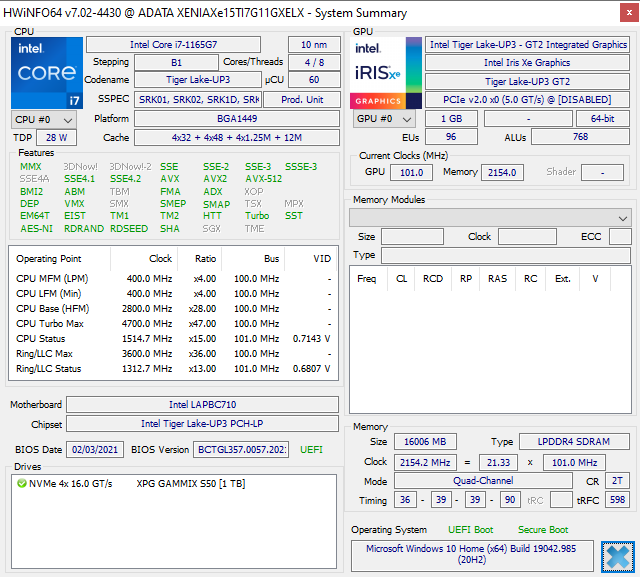
Processor
CPU performance is excellent with multi-thread results that are 12 to 24 percent faster than the average Core i7-1165G7 laptop in our database to suggest excellent Turbo Boost sustainability. Raw performance outpaces even the more demanding Core i7-8850H and Core i5-10300H in the MacBook Pro 15 2018 and Dell XPS 15 9500, respectively. Choosing the less expensive Core i5-1135G7 option will only net users a slight 8 to 10 percent drop in performance.
Cinebench R23: Multi Core | Single Core
Cinebench R15: CPU Multi 64Bit | CPU Single 64Bit
Blender: v2.79 BMW27 CPU
7-Zip 18.03: 7z b 4 -mmt1 | 7z b 4
Geekbench 5.5: Single-Core | Multi-Core
HWBOT x265 Benchmark v2.2: 4k Preset
LibreOffice : 20 Documents To PDF
R Benchmark 2.5: Overall mean
| Cinebench R23 / Multi Core | |
| Lenovo Yoga Creator 7 15IMH05 82DS000VGE | |
| ADATA XPG Xenia Xe | |
| Apple MacBook Pro 15 2018 (2.6 GHz, 560X) | |
| MSI Summit E15 A11SCST | |
| Average Intel Core i7-1165G7 (2525 - 6862, n=64) | |
| Cinebench R23 / Single Core | |
| ADATA XPG Xenia Xe | |
| MSI Summit E15 A11SCST | |
| Average Intel Core i7-1165G7 (1110 - 1539, n=59) | |
| Lenovo Yoga Creator 7 15IMH05 82DS000VGE | |
| Apple MacBook Pro 15 2018 (2.6 GHz, 560X) | |
| HWBOT x265 Benchmark v2.2 / 4k Preset | |
| Lenovo Yoga Creator 7 15IMH05 82DS000VGE | |
| ADATA XPG Xenia Xe | |
| Apple MacBook Pro 15 2018 (2.6 GHz, 560X) | |
| Dell XPS 15 9500 Core i5 | |
| Lenovo ThinkBook 15 Gen2 ITL | |
| MSI Summit E15 A11SCST | |
| Lenovo IdeaPad 5 15IIL05 | |
| Average Intel Core i7-1165G7 (1.39 - 8.47, n=80) | |
| Microsoft Surface Book 3 15 | |
| LibreOffice / 20 Documents To PDF | |
| Apple MacBook Pro 15 2018 (2.6 GHz, 560X) | |
| Microsoft Surface Book 3 15 | |
| Dell XPS 15 9500 Core i5 | |
| MSI Summit E15 A11SCST | |
| Lenovo Yoga Creator 7 15IMH05 82DS000VGE | |
| Lenovo IdeaPad 5 15IIL05 | |
| Average Intel Core i7-1165G7 (21.5 - 88.1, n=78) | |
| Lenovo ThinkBook 15 Gen2 ITL | |
| ADATA XPG Xenia Xe | |
* ... smaller is better
System Performance
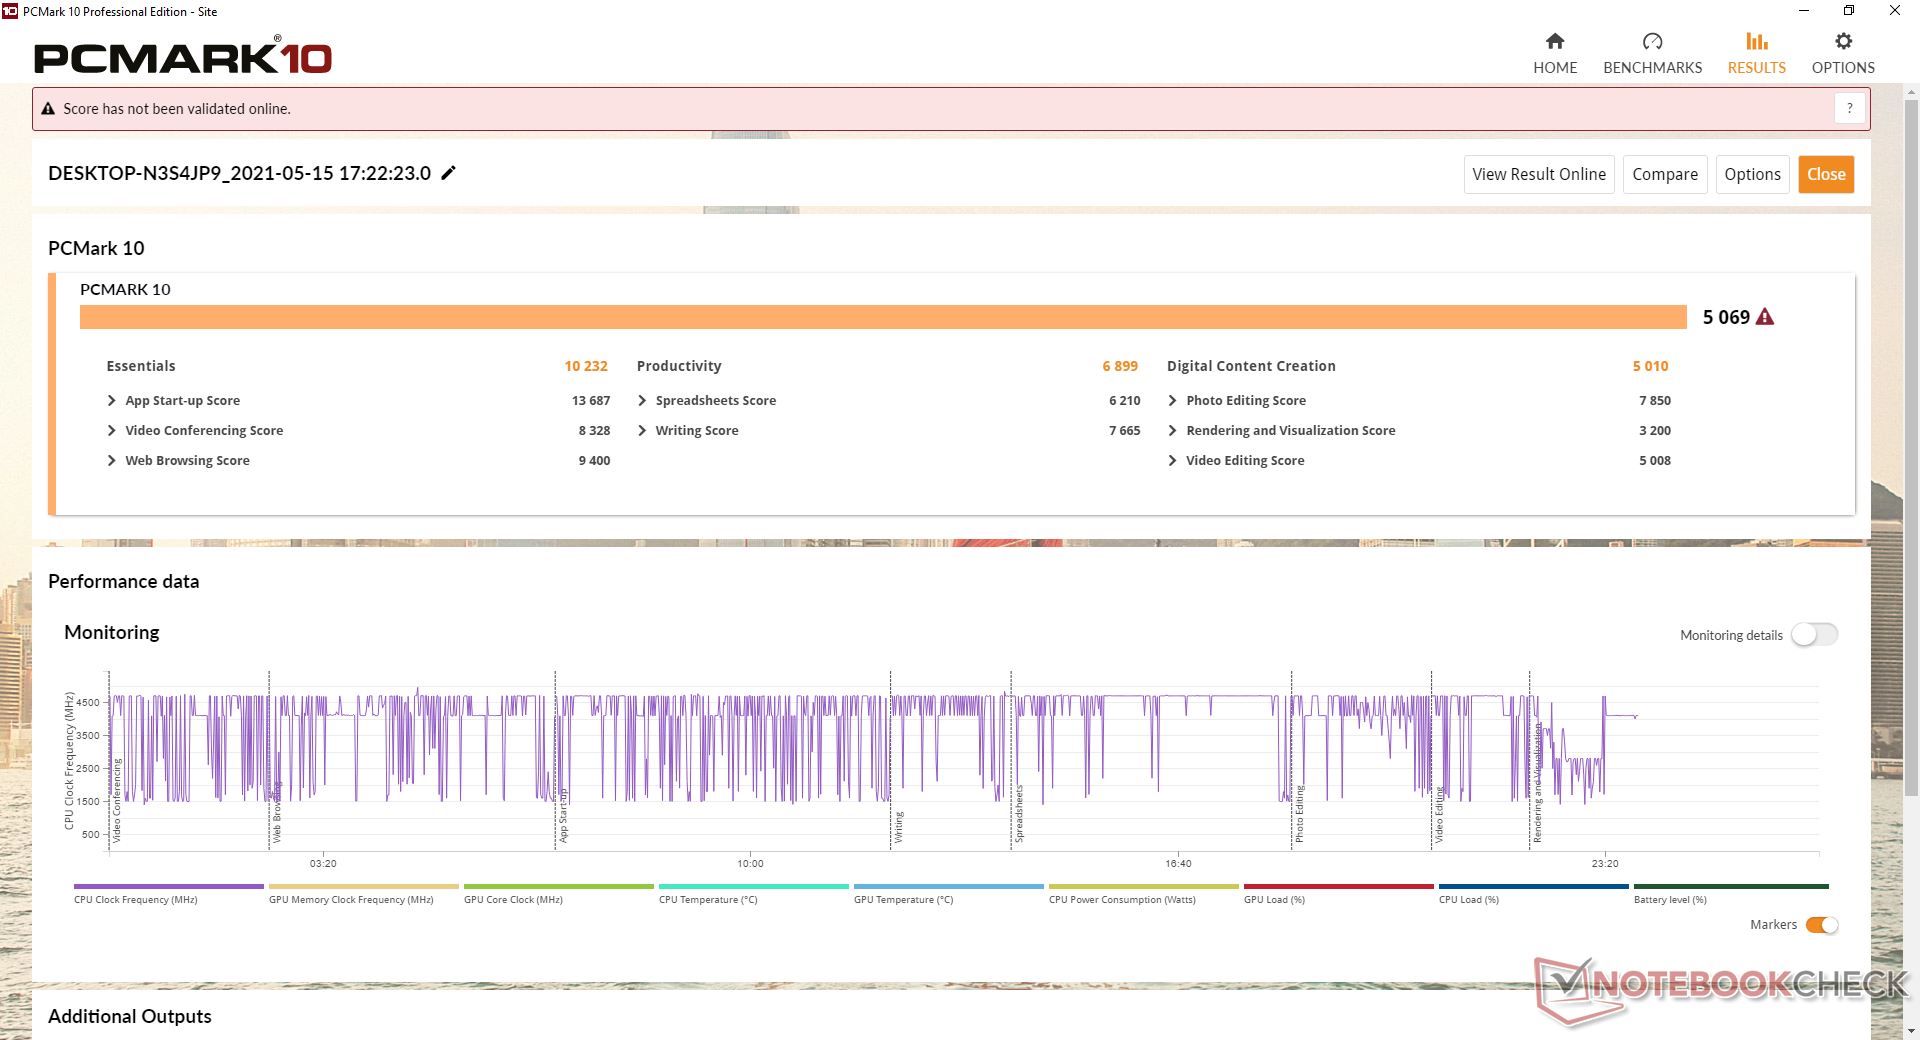
| PCMark 10 Score | 5069 points | |
Help | ||
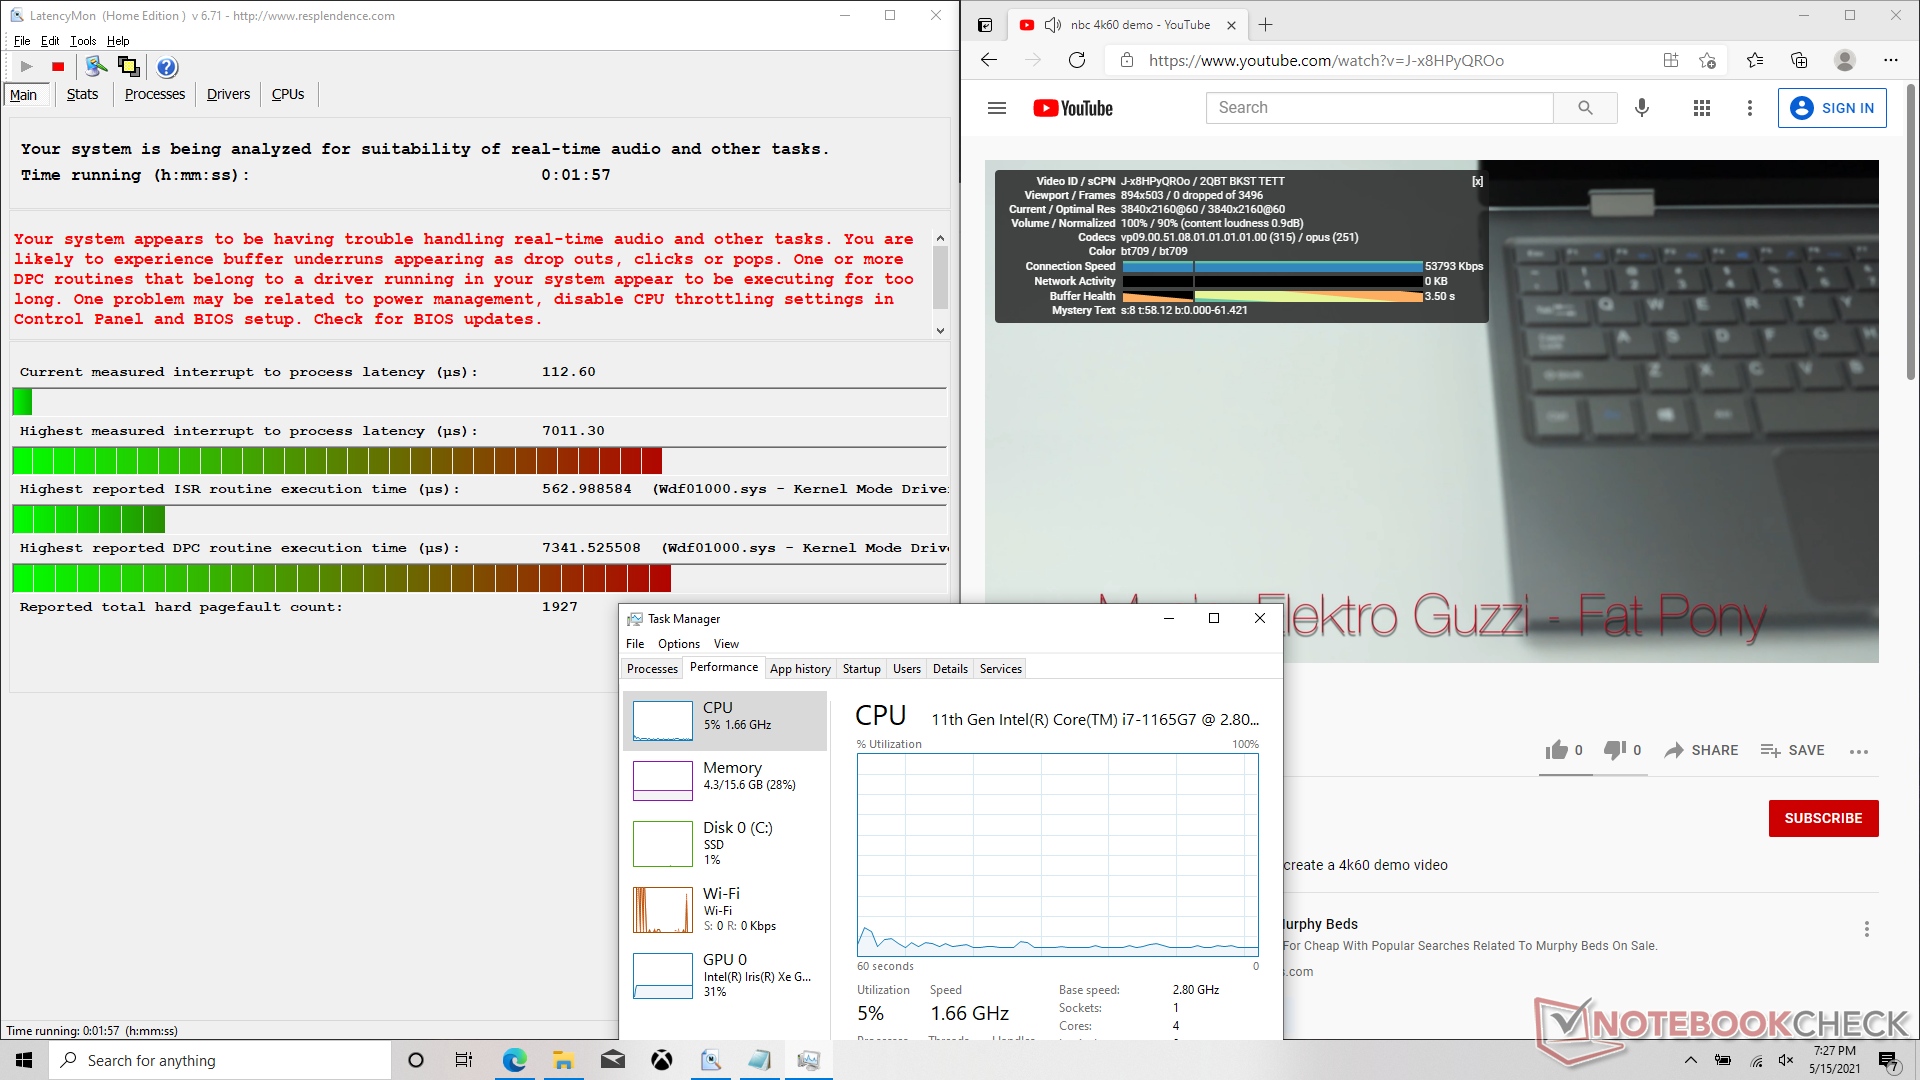
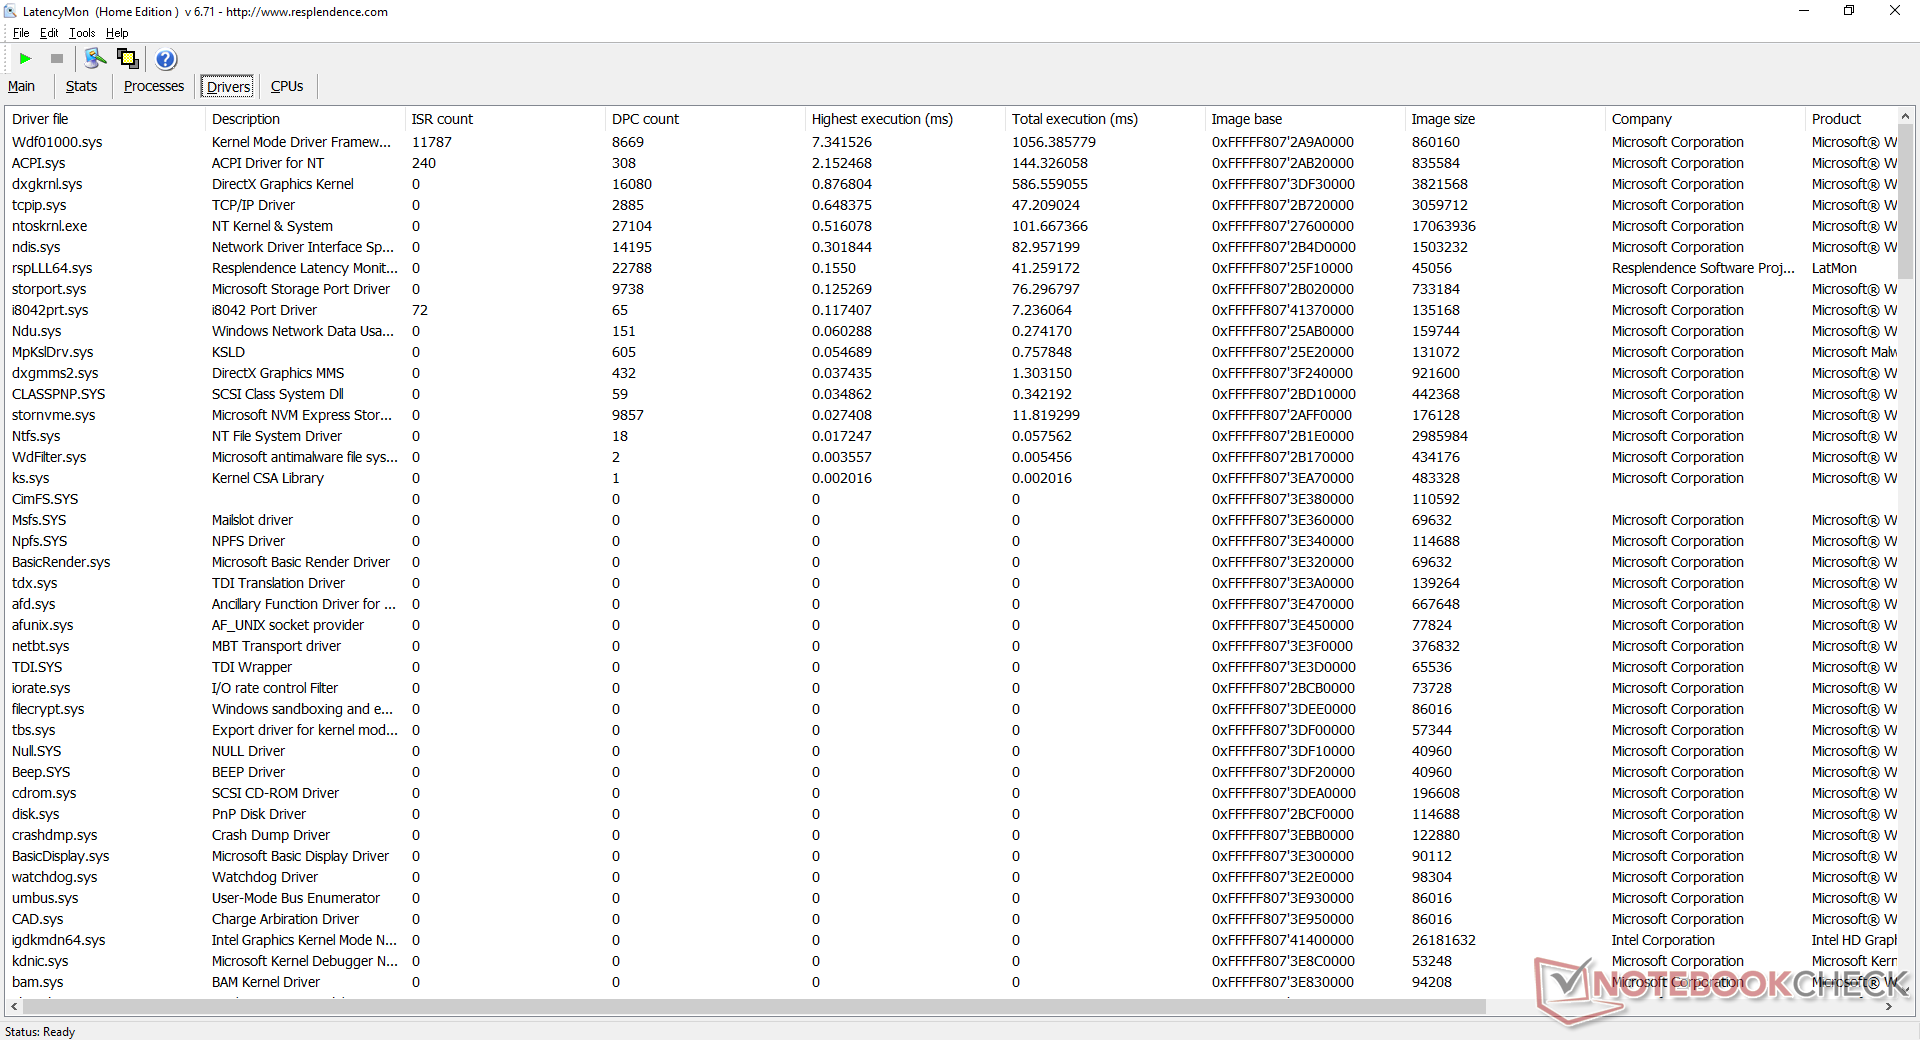
DPC Latency
LatencyMon reveals DPC latency issues when opening multiple tabs on our homepage. 4K video playback at 60 FPS is otherwise smooth and with no dropped frames.
| DPC Latencies / LatencyMon - interrupt to process latency (max), Web, Youtube, Prime95 | |
| ADATA XPG Xenia Xe | |
| Dell XPS 15 9500 Core i5 | |
| Lenovo Yoga Creator 7 15IMH05 82DS000VGE | |
* ... smaller is better
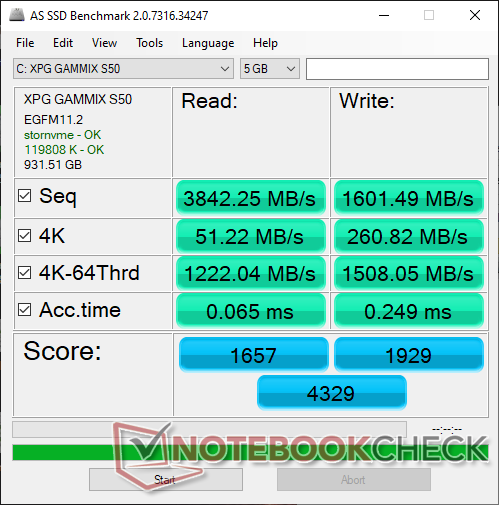
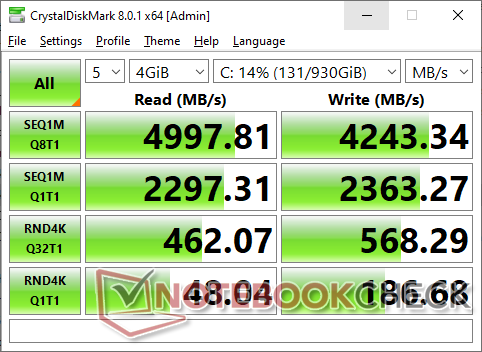
Storage Devices
ADATA has equipped its laptop with its own XPG Gamming S50 PCIe 4.0 NVMe SSD for transfer rates approaching 5000 MB/s. In comparison, the best PCIe 3.0 drives would top out at "only" 3000 to 3500 MB/s. The competing Samsung PM9A1 PCIe 4.0 drive can reach almost 7000 MB/s.
| ADATA XPG Xenia Xe ADATA XPG Gammix S50 1TB | Dell XPS 15 9500 Core i5 Toshiba KBG40ZNS256G NVMe | HP Spectre X360 15-5ZV31AV Intel SSD 660p 2TB SSDPEKNW020T8 | Asus ZenBook 15 UX534FTC-A8190T Samsung SSD PM981 MZVLB1T0HALR | Lenovo Yoga Creator 7 15IMH05 82DS000VGE Samsung PM981a MZVLB1T0HBLR | |
|---|---|---|---|---|---|
| AS SSD | -60% | -29% | -7% | -2% | |
| Seq Read | 3842 | 1423 -63% | 1220 -68% | 2643 -31% | 2078 -46% |
| Seq Write | 1601 | 766 -52% | 1152 -28% | 1533 -4% | 2441 52% |
| 4K Read | 51.2 | 42.21 -18% | 52.3 2% | 49.12 -4% | 53.2 4% |
| 4K Write | 260.8 | 74.8 -71% | 146.6 -44% | 134.7 -48% | 107 -59% |
| 4K-64 Read | 1222 | 973 -20% | 652 -47% | 1028 -16% | 1533 25% |
| 4K-64 Write | 1508 | 218.8 -85% | 847 -44% | 1353 -10% | 1526 1% |
| Access Time Read * | 0.065 | 0.125 -92% | 0.077 -18% | 0.033 49% | 0.051 22% |
| Access Time Write * | 0.249 | 0.552 -122% | 0.106 57% | 0.028 89% | 0.036 86% |
| Score Read | 1657 | 1157 -30% | 826 -50% | 1342 -19% | 1794 8% |
| Score Write | 1929 | 370 -81% | 1109 -43% | 1641 -15% | 1877 -3% |
| Score Total | 4329 | 2094 -52% | 2371 -45% | 3622 -16% | 4613 7% |
| Copy ISO MB/s | 2166 | 1151 -47% | 2070 -4% | 2226 3% | 1633 -25% |
| Copy Program MB/s | 995 | 499.4 -50% | 571 -43% | 506 -49% | 549 -45% |
| Copy Game MB/s | 1844 | 733 -60% | 1219 -34% | 1230 -33% | 940 -49% |
| CrystalDiskMark 5.2 / 6 | -41% | -27% | -18% | -15% | |
| Write 4K | 159.6 | 93.3 -42% | 151.5 -5% | 138.1 -13% | 125.9 -21% |
| Read 4K | 45.45 | 45.9 1% | 59.3 30% | 45.89 1% | 45.78 1% |
| Write Seq | 2498 | 1211 -52% | 1424 -43% | 2147 -14% | 2311 -7% |
| Read Seq | 2340 | 1633 -30% | 1609 -31% | 2188 -6% | 1511 -35% |
| Write 4K Q32T1 | 645 | 273.1 -58% | 393.6 -39% | 427.8 -34% | 446.7 -31% |
| Read 4K Q32T1 | 439.4 | 356 -19% | 369.4 -16% | 404 -8% | 548 25% |
| Write Seq Q32T1 | 4057 | 1198 -70% | 1946 -52% | 2396 -41% | 3020 -26% |
| Read Seq Q32T1 | 4960 | 2269 -54% | 1934 -61% | 3454 -30% | 3518 -29% |
| Total Average (Program / Settings) | -51% /
-53% | -28% /
-28% | -13% /
-11% | -9% /
-7% |
* ... smaller is better

Disk Throttling: DiskSpd Read Loop, Queue Depth 8
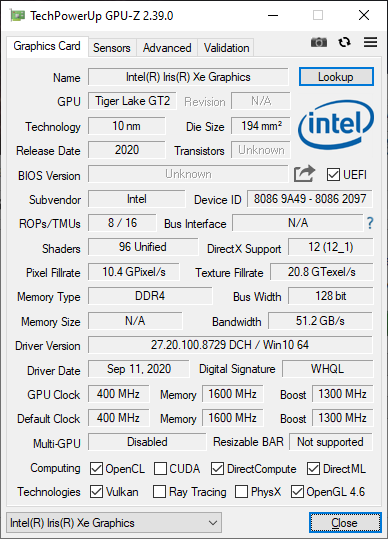
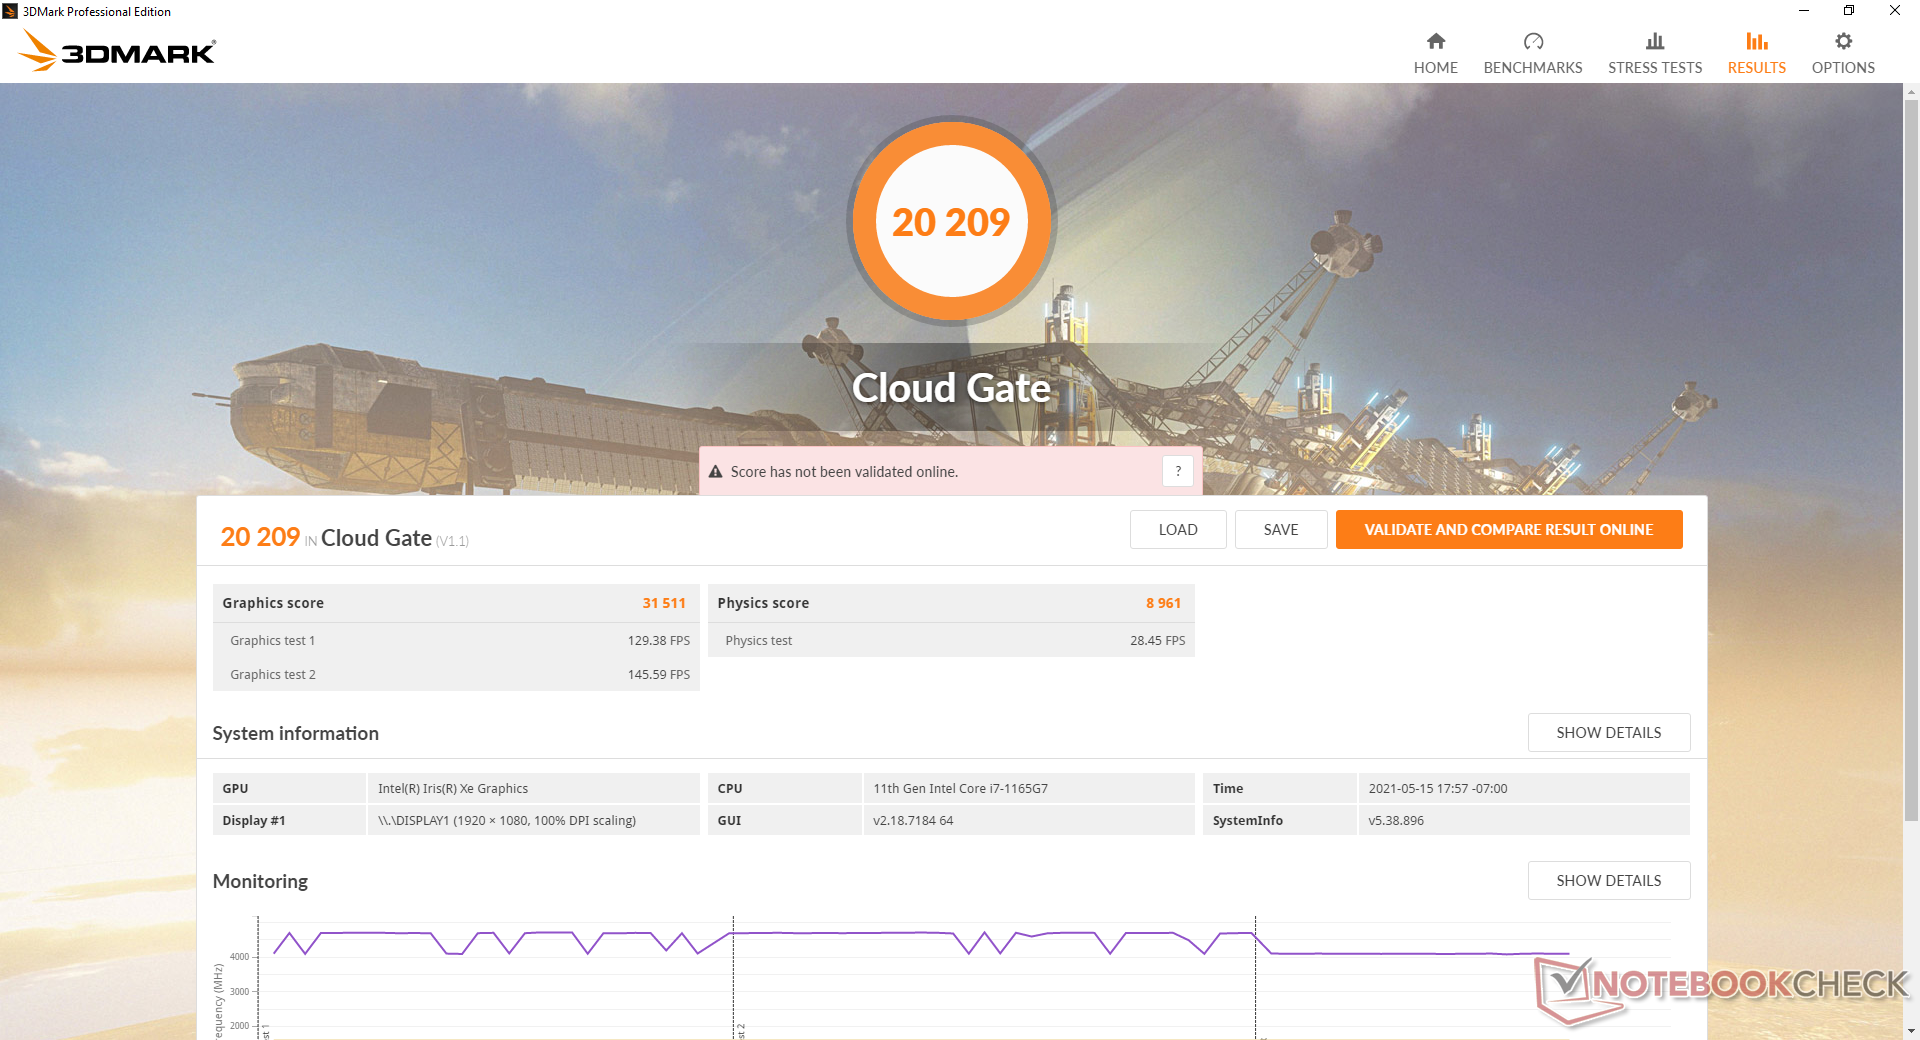
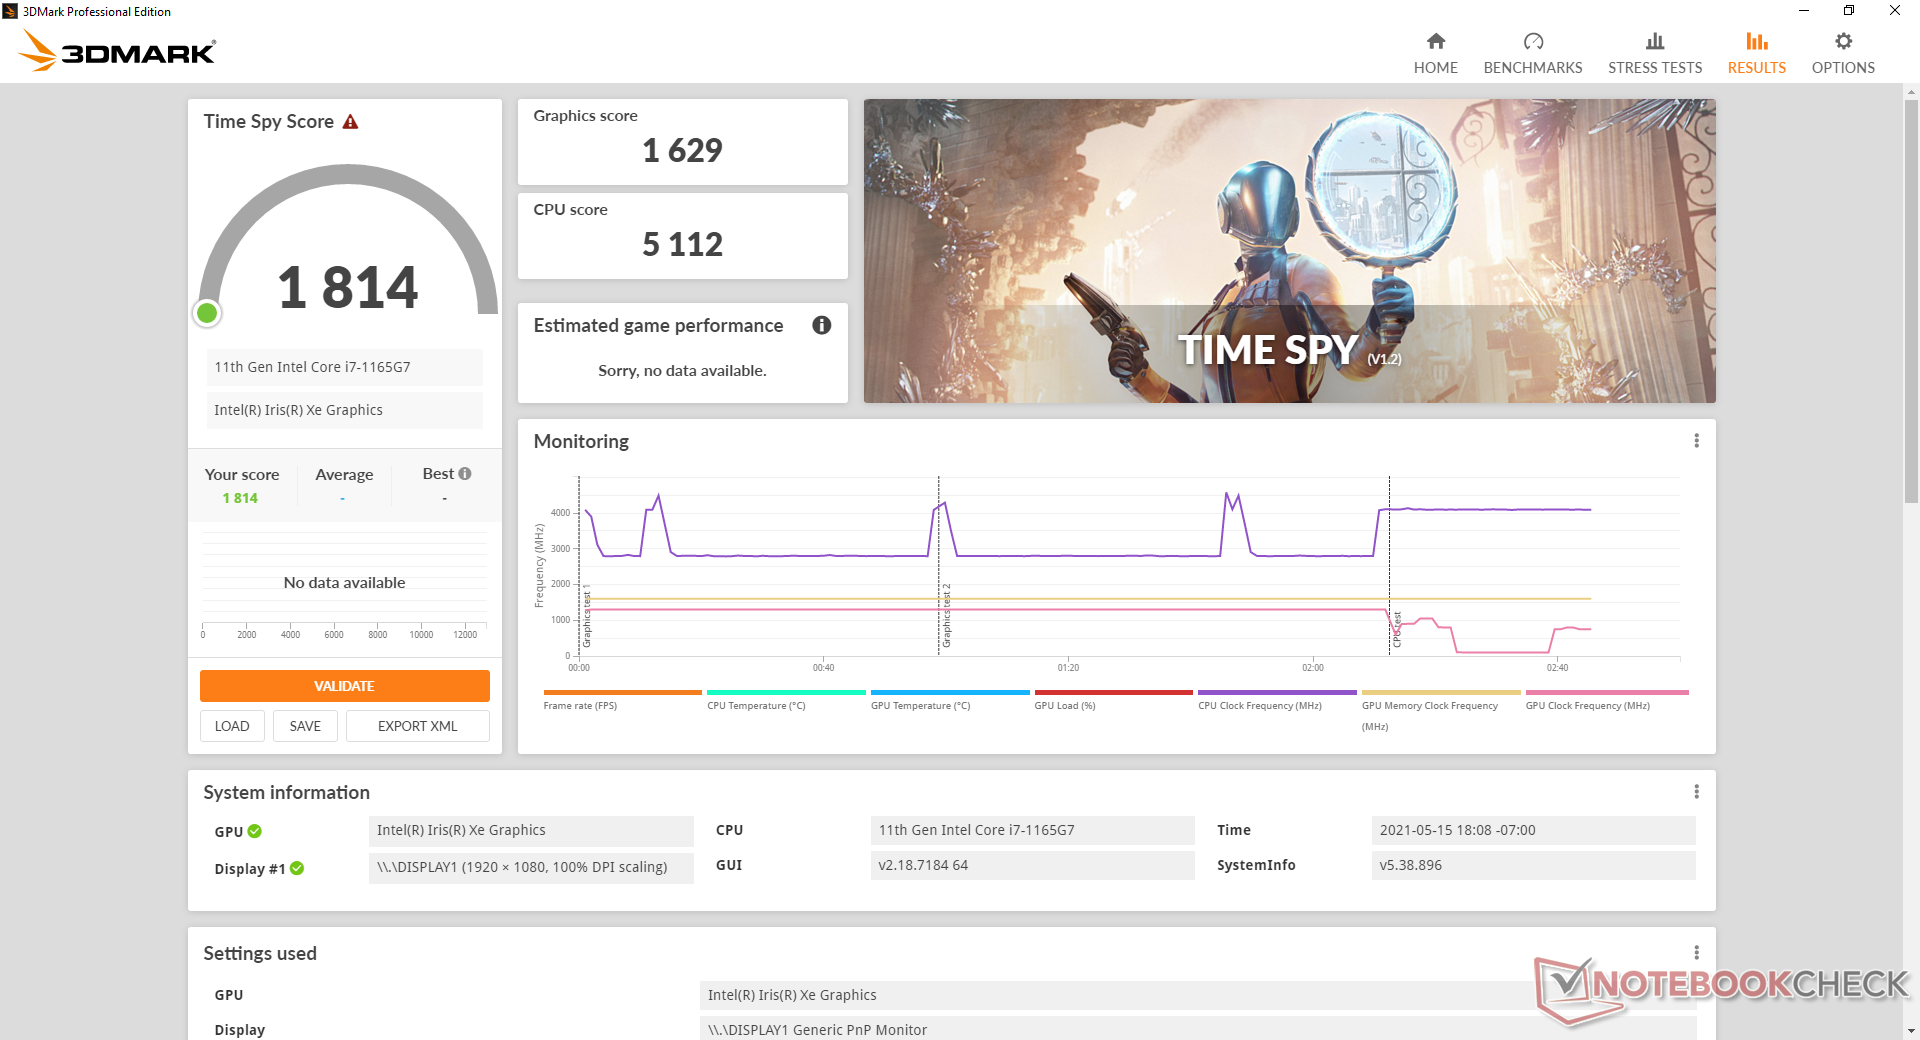
GPU Performance
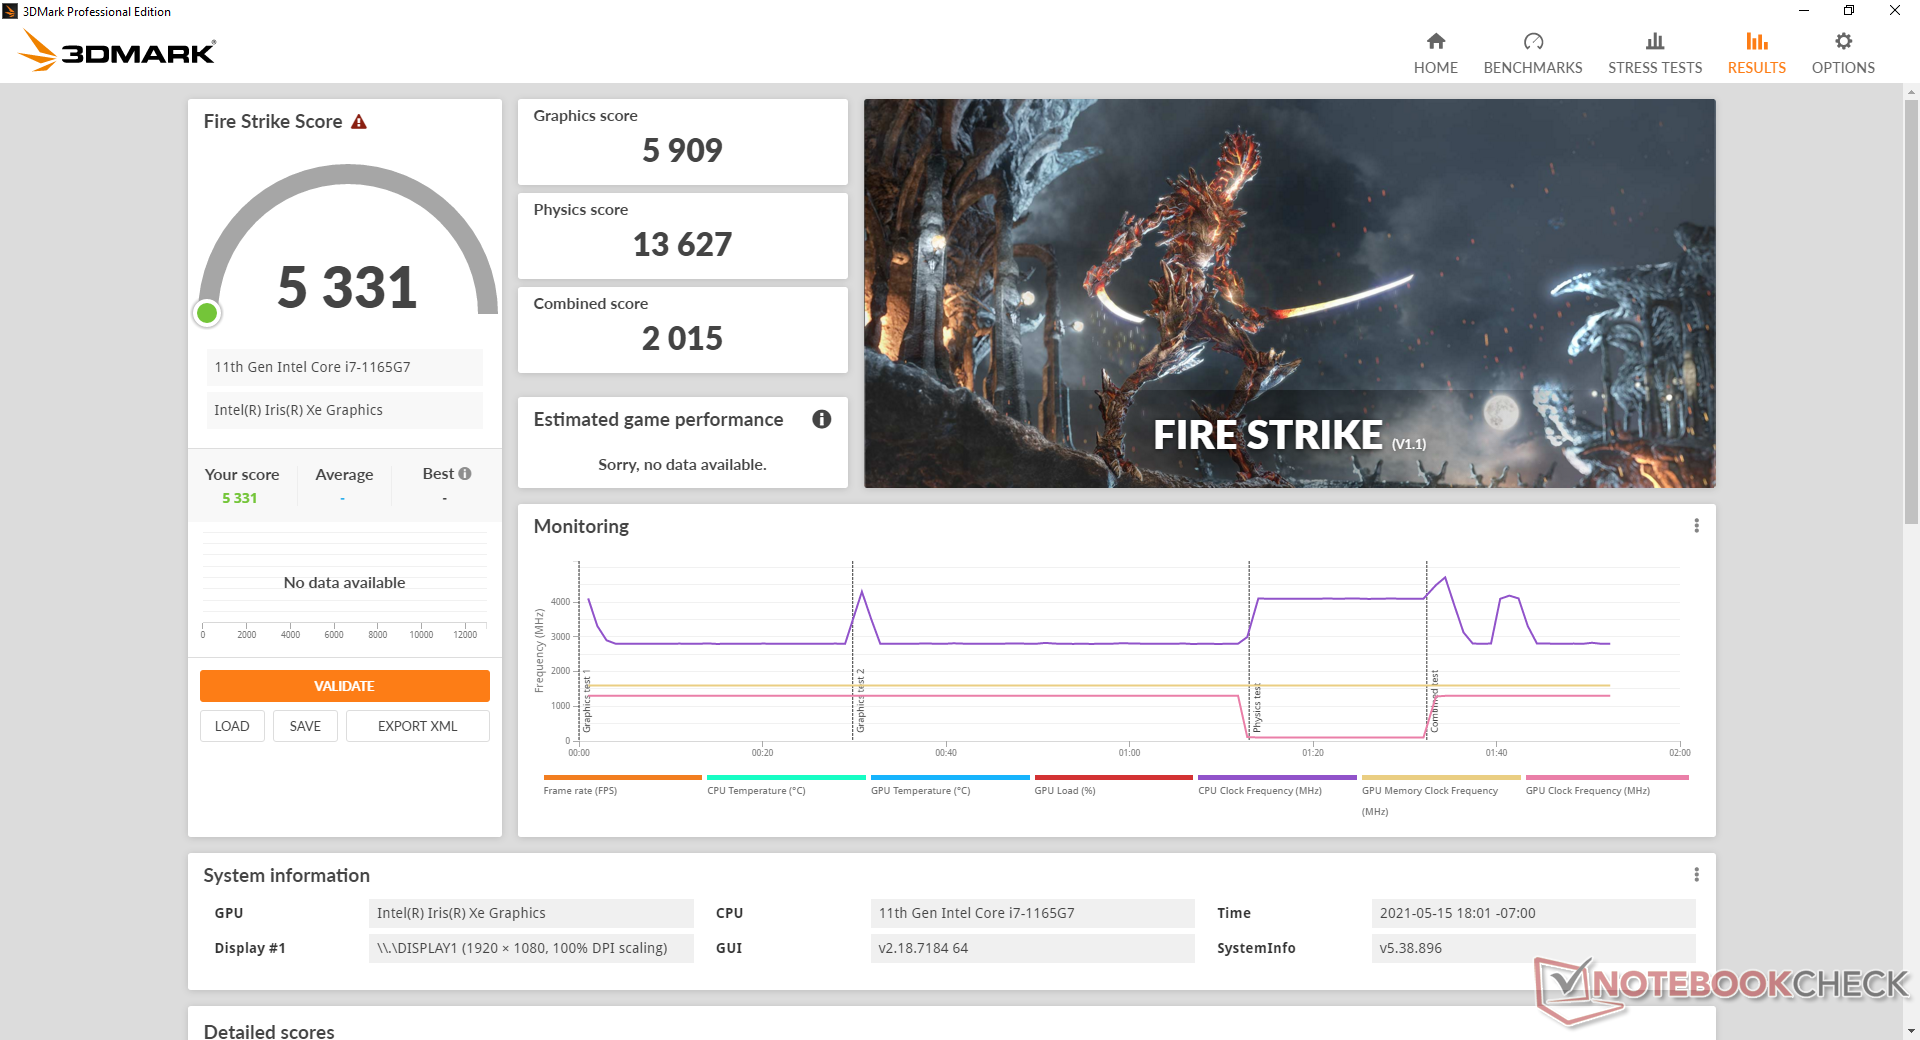
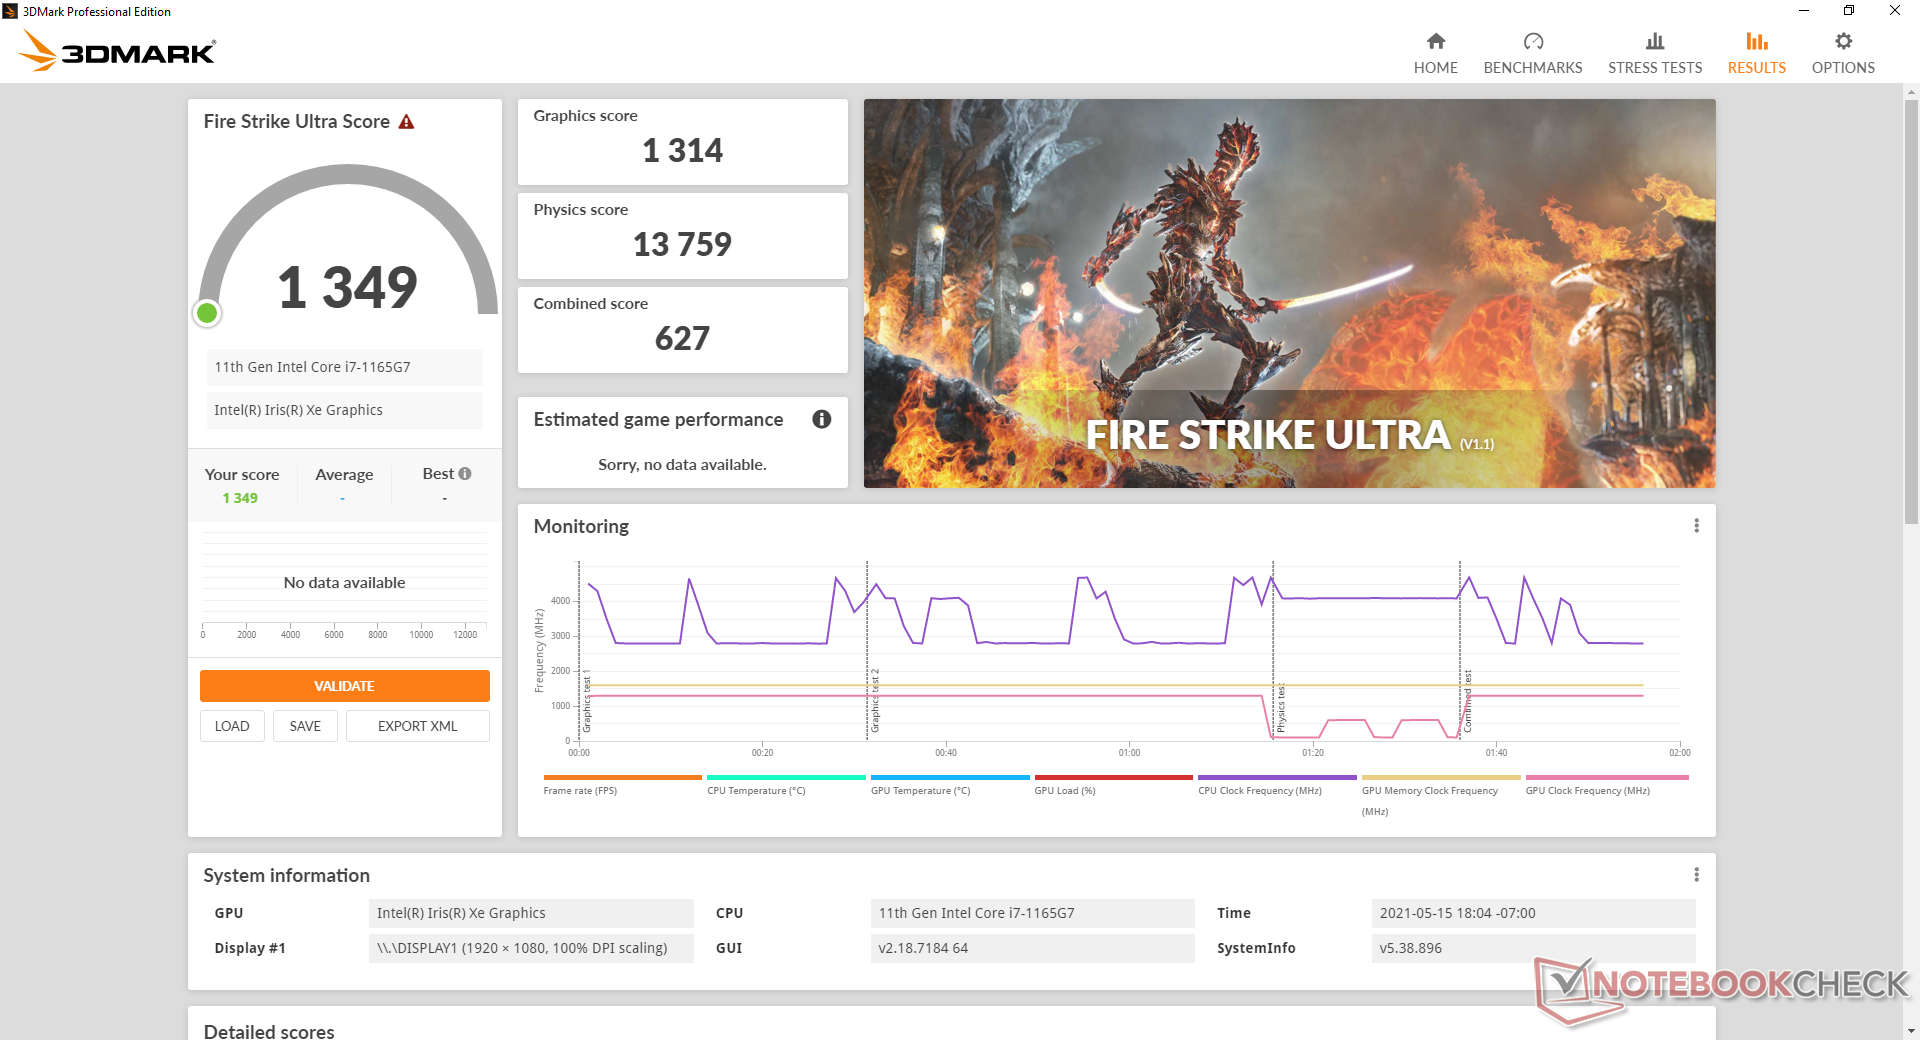
Graphics performance is excellent relative to other laptops with the same Iris Xe 96 EUs GPU. Overall performance is generally comparable to the GeForce MX350/450 series, but most games still favor the discrete Nvidia GPU. DOTA 2 Reborn and GTA V, for example, run much faster on GeForce MX-powered laptops like the Lenovo ThinkPad T15 Gen2.
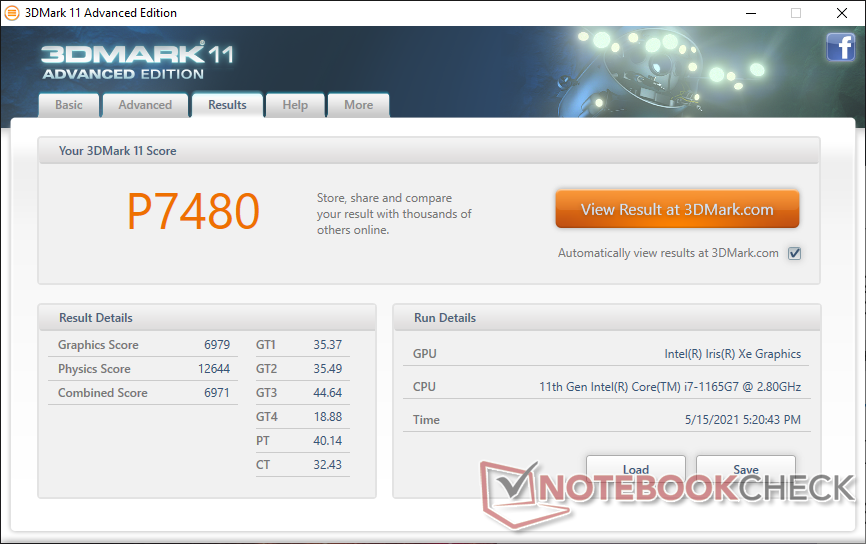
| 3DMark 11 Performance | 7480 points | |
| 3DMark Cloud Gate Standard Score | 20209 points | |
| 3DMark Fire Strike Score | 5331 points | |
| 3DMark Time Spy Score | 1814 points | |
Help | ||
| low | med. | high | ultra | |
| The Witcher 3 (2015) | 103 | 67 | 38.2 | 16.5 |
| Dota 2 Reborn (2015) | 83.2 | 72.2 | 52.8 | 50.3 |
| Final Fantasy XV Benchmark (2018) | 46.3 | 25.4 | 19 | |
| X-Plane 11.11 (2018) | 29 | 38.3 | 34.4 |
Emissions
System Noise
Fan noise is almost always silent during low loads like browsing to video streaming. It may occasionally jump to 29.2 or 31.8 dB(A), but this low range is generally unnoticeable from a normal sitting distance.
Higher loads like games will bump fan noise to the high 30 dB(A) range. The fans tend to pulse or cycle as well which makes fan noise more noticeable. Running Witcher 3, for example, would cause the fans to cycle between 37.3 and 39.7 dB(A) instead of remaining fixed. If the CPU is stressed to 100 percent, fan noise will jump to 45 dB(A).
| ADATA XPG Xenia Xe Iris Xe G7 96EUs, i7-1165G7, ADATA XPG Gammix S50 1TB | Dell XPS 15 9500 Core i5 UHD Graphics 630, i5-10300H, Toshiba KBG40ZNS256G NVMe | HP Spectre X360 15-5ZV31AV GeForce MX250, i7-10510U, Intel SSD 660p 2TB SSDPEKNW020T8 | Asus ZenBook 15 UX534FTC-A8190T GeForce GTX 1650 Max-Q, i7-10510U, Samsung SSD PM981 MZVLB1T0HALR | Apple MacBook Pro 15 2018 (2.6 GHz, 560X) Radeon Pro 560X, i7-8850H, Apple SSD AP0512 | |
|---|---|---|---|---|---|
| Noise | -2% | -8% | -7% | -14% | |
| off / environment * | 25.2 | 28 -11% | 30.1 -19% | 30.3 -20% | 29.6 -17% |
| Idle Minimum * | 25.2 | 28 -11% | 30.1 -19% | 30.3 -20% | 30.1 -19% |
| Idle Average * | 25.2 | 28 -11% | 30.1 -19% | 30.3 -20% | 30.1 -19% |
| Idle Maximum * | 25.2 | 28 -11% | 30.1 -19% | 30.9 -23% | 30.1 -19% |
| Load Average * | 35.7 | 28 22% | 30.1 16% | 31.3 12% | 46.8 -31% |
| Witcher 3 ultra * | 39.7 | 39.7 -0% | 38.1 4% | 36 9% | |
| Load Maximum * | 45.3 | 41.9 8% | 42 7% | 38.2 16% | 46.8 -3% |
* ... smaller is better
Noise Level
| Idle |
| 25.2 / 25.2 / 25.2 dB(A) |
| Load |
| 35.7 / 45.3 dB(A) |
 | ||
30 dB silent 40 dB(A) audible 50 dB(A) loud |
||
min: | ||
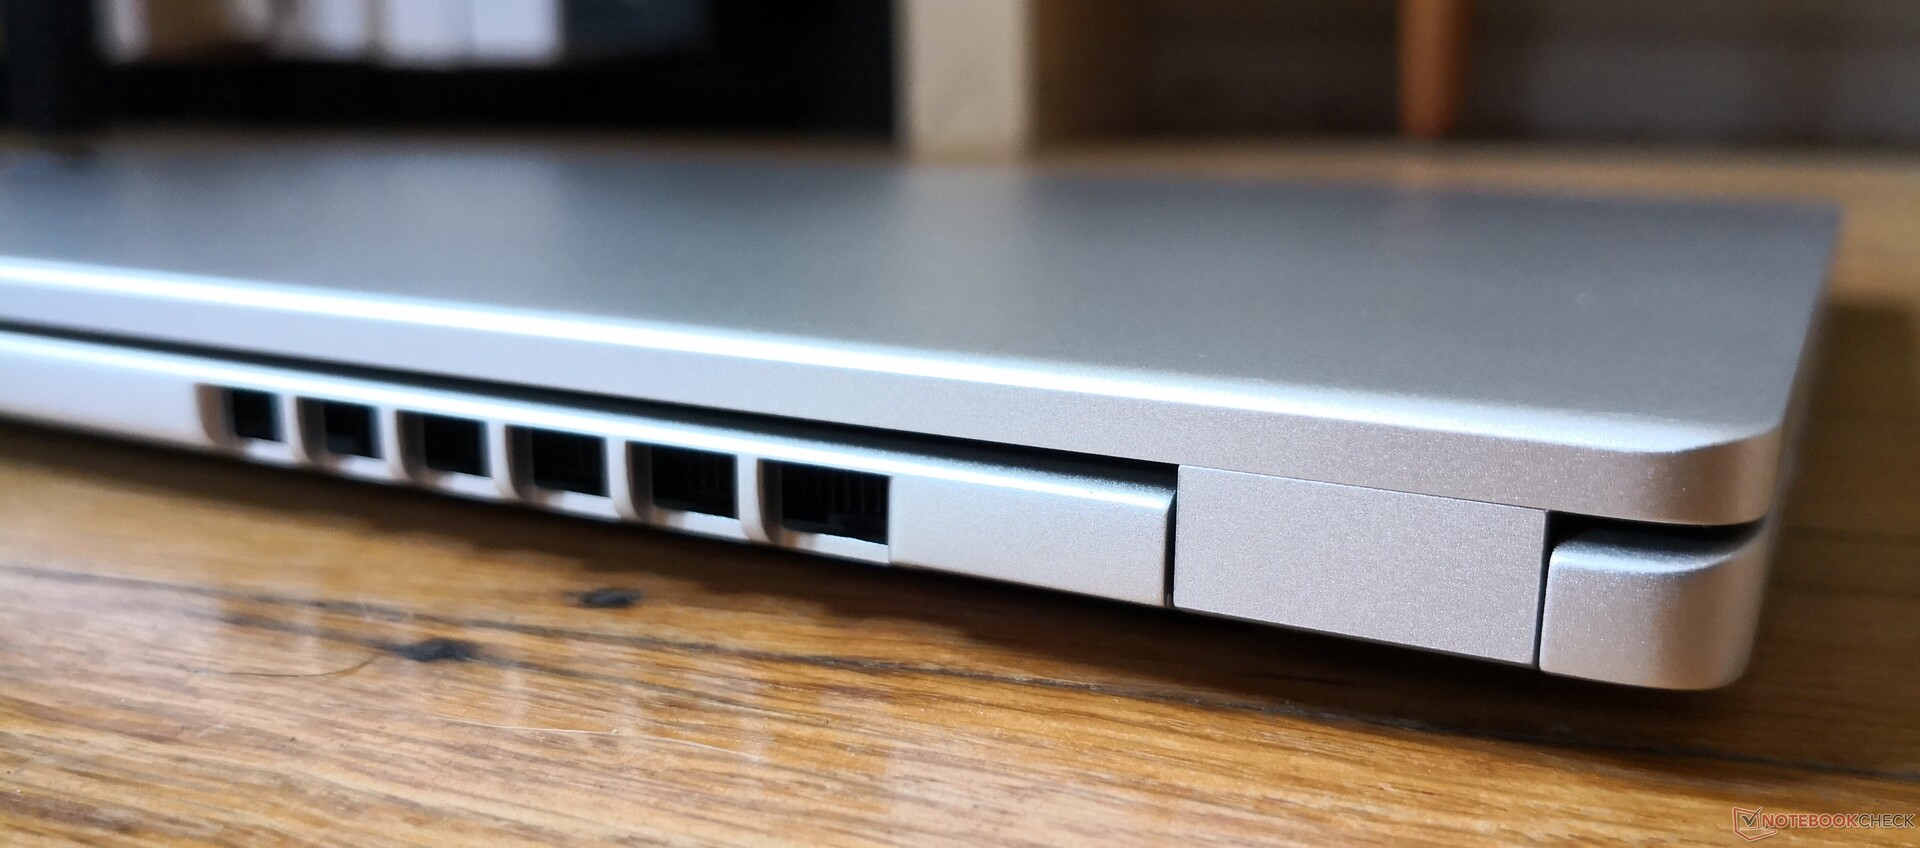
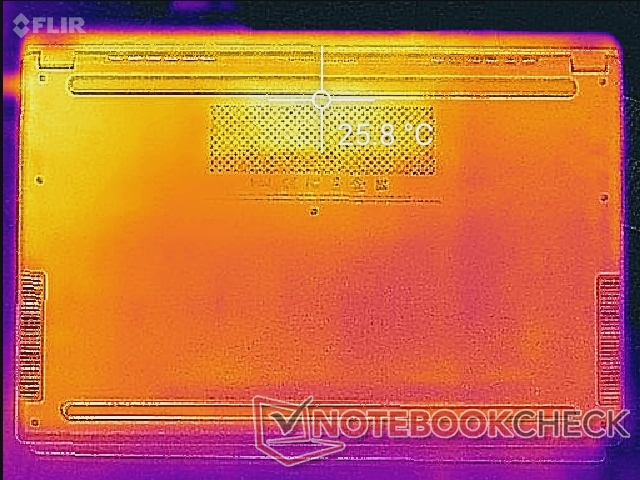
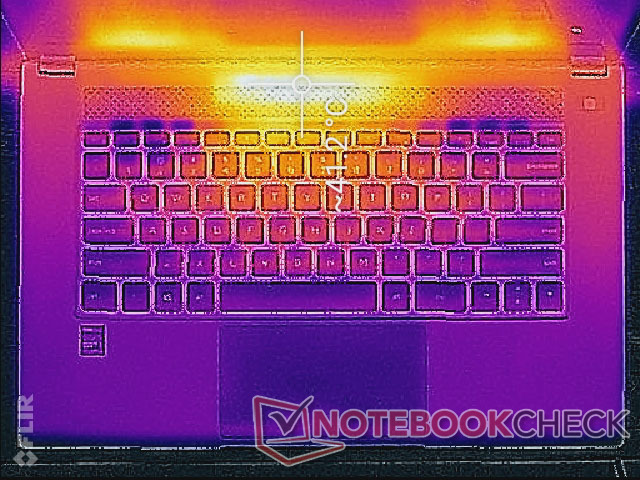
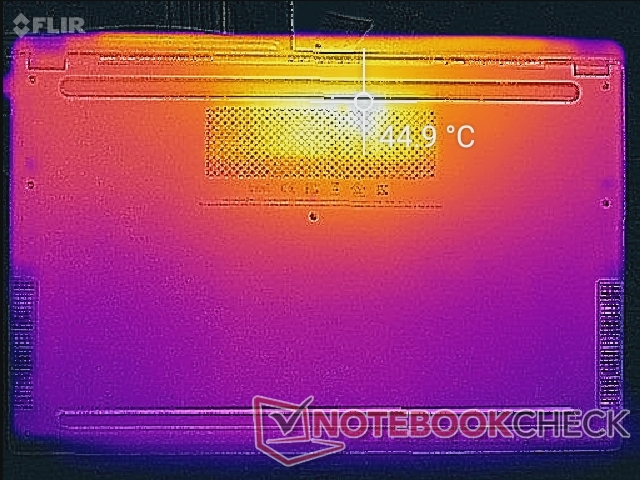
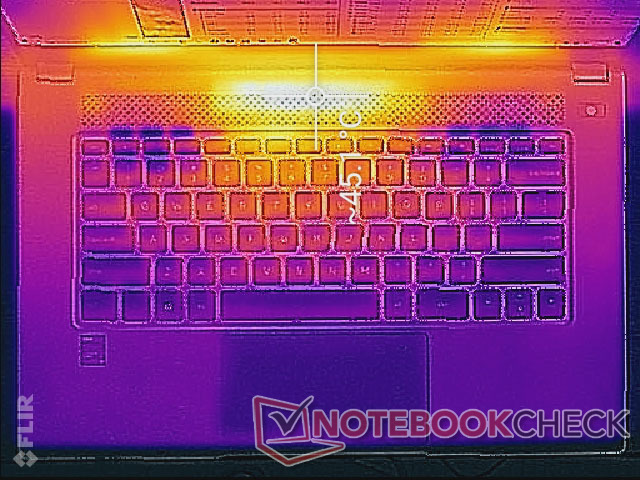
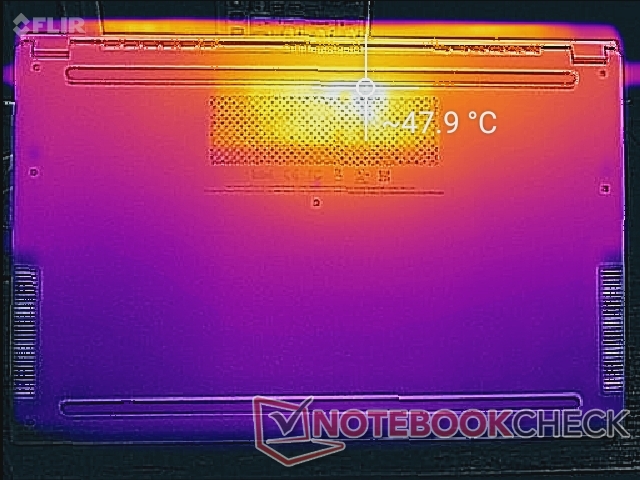
Temperature
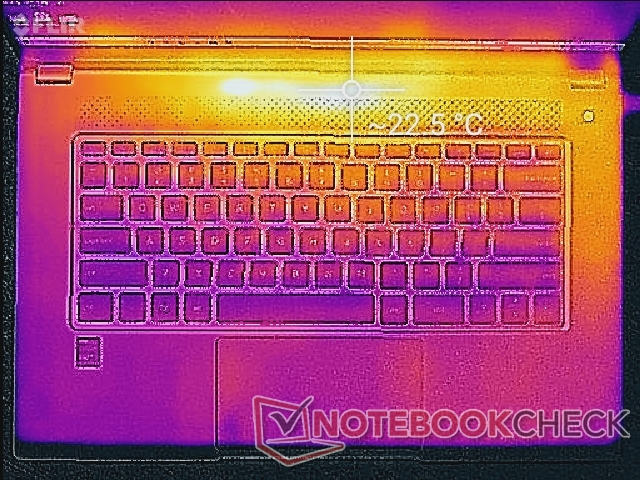
Surface temperatures are relatively cool even when running demanding loads. The keyboard center is just under 30 C when gaming compared to the mid 40 C range on the Dell XPS 15 or Asus ZenBook 15 under similar conditions. The designers have done an excellent job relegating the hot spot to the rear of the unit where hands are unlikely to touch.
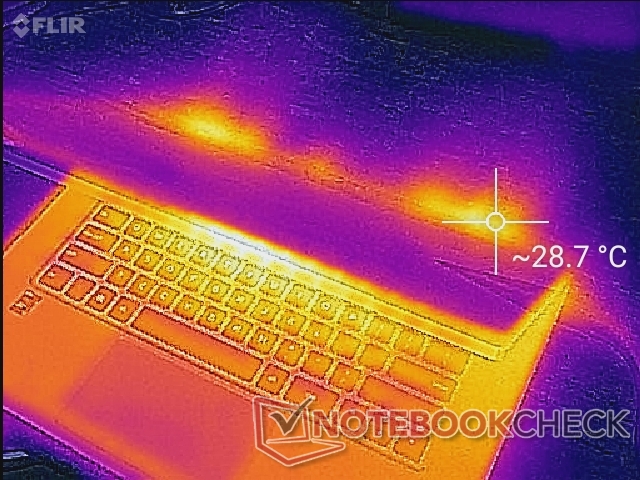
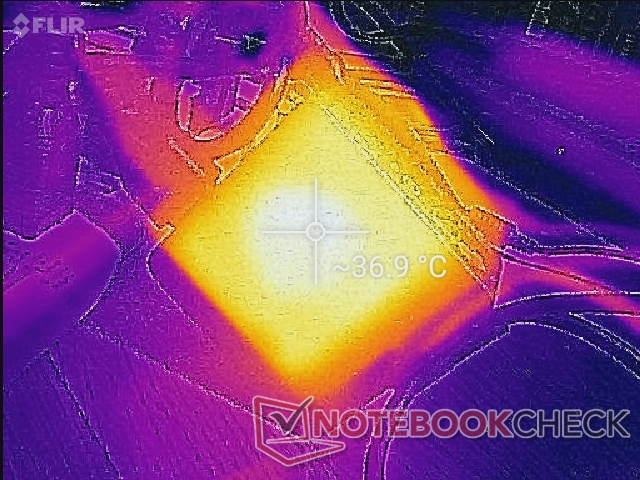
(-) The maximum temperature on the upper side is 45.2 °C / 113 F, compared to the average of 36.9 °C / 98 F, ranging from 21.1 to 71 °C for the class Multimedia.
(-) The bottom heats up to a maximum of 47.8 °C / 118 F, compared to the average of 39.1 °C / 102 F
(+) In idle usage, the average temperature for the upper side is 20.9 °C / 70 F, compared to the device average of 31.2 °C / 88 F.
(+) Playing The Witcher 3, the average temperature for the upper side is 27.8 °C / 82 F, compared to the device average of 31.2 °C / 88 F.
(+) The palmrests and touchpad are cooler than skin temperature with a maximum of 25.4 °C / 77.7 F and are therefore cool to the touch.
(+) The average temperature of the palmrest area of similar devices was 28.8 °C / 83.8 F (+3.4 °C / 6.1 F).
Stress Test
Running Prime95 to stress the CPU reveals something peculiar. Clock rates would cycle between 350 MHz and 3.6 GHz up to a core temperature of 92 C for the first minute or so as shown by the screenshots below. Eventually, clock rates and temperature will stabilize at around 3.2 GHz and 81 C. The short-lived dips to 350 MHz during the start of the test are unusual and not something we've observed on other laptops. Thankfully, this has no impact on the overall performance of the system.
The CPU will stabilize at 72 C when running Witcher 3 compared to 67 C on the MSI Summit B15 with the exact same CPU.
Running on battery power will not significantly impact performance. A 3DMark 11 test on batteries would return Physics and Graphics scores of 12537 and 6861 points, respectively, compared to 12644 and 6979 points when on mains.
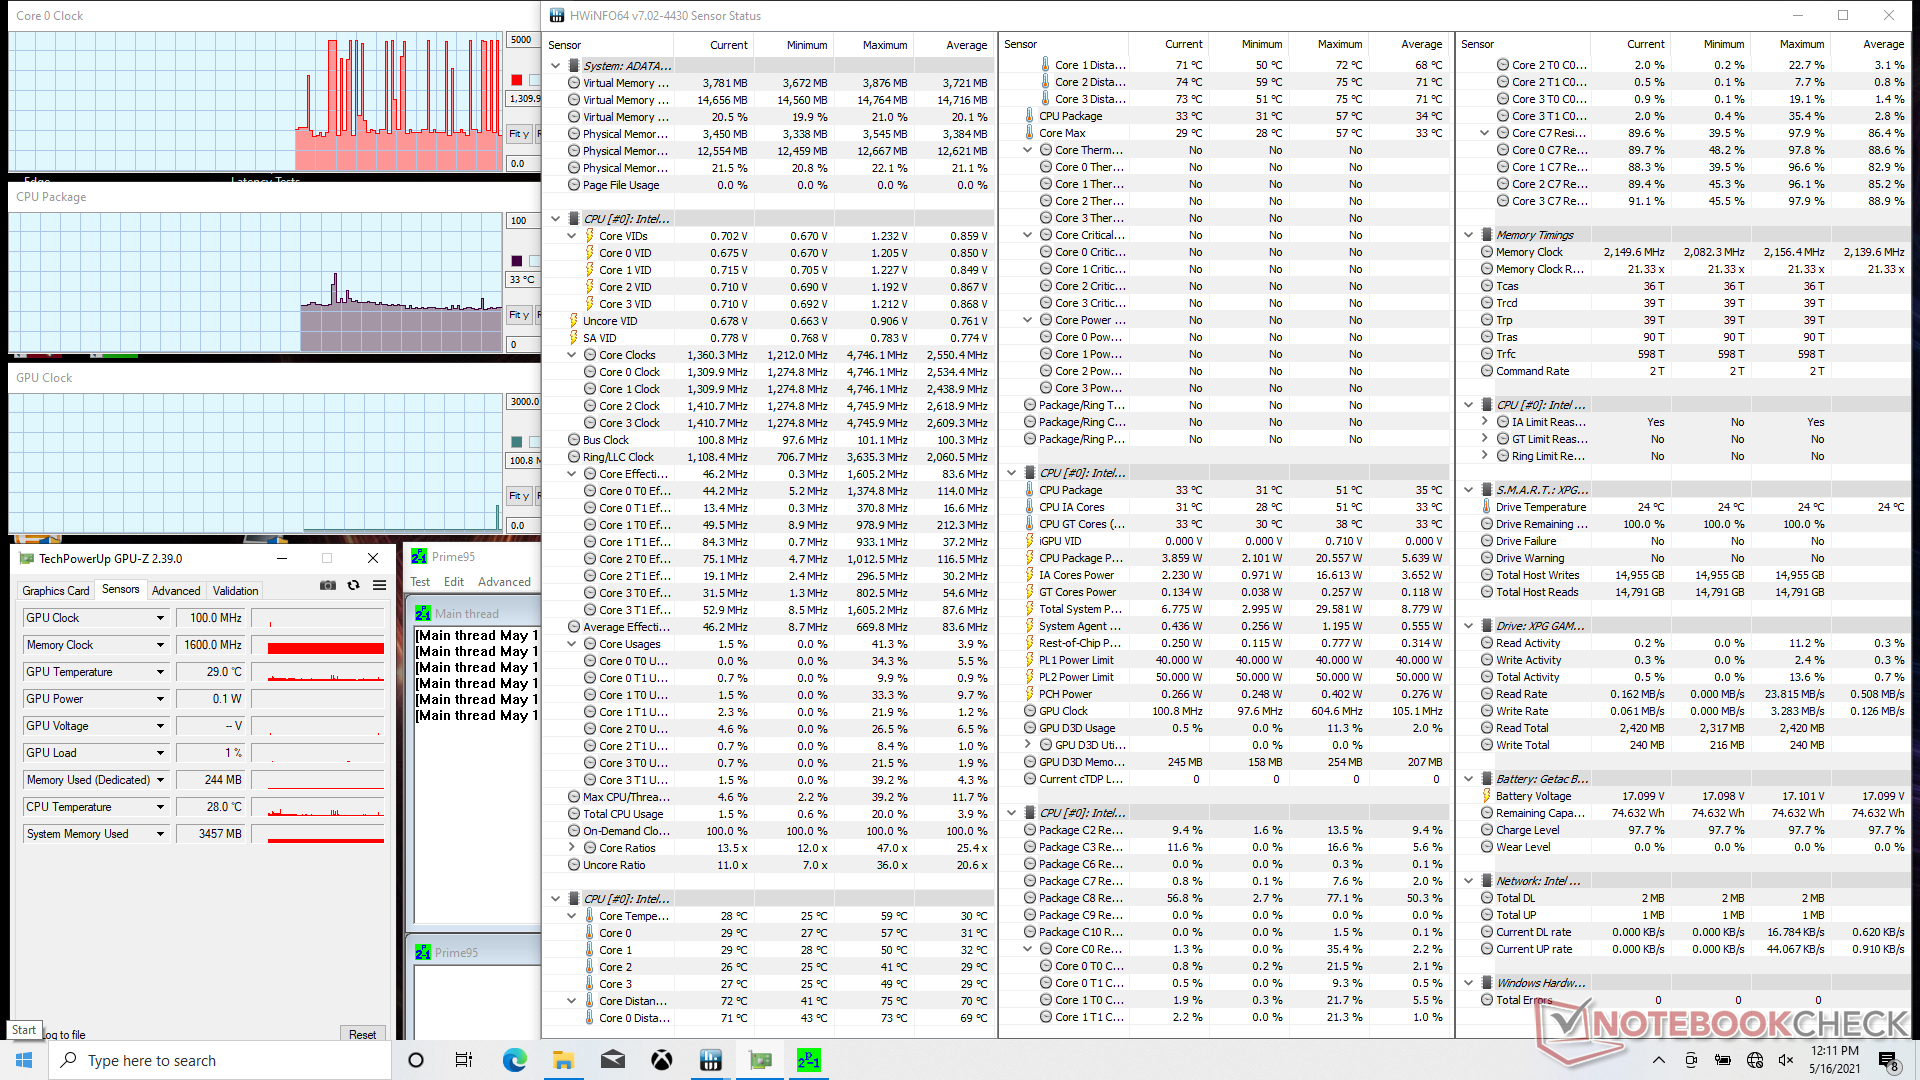
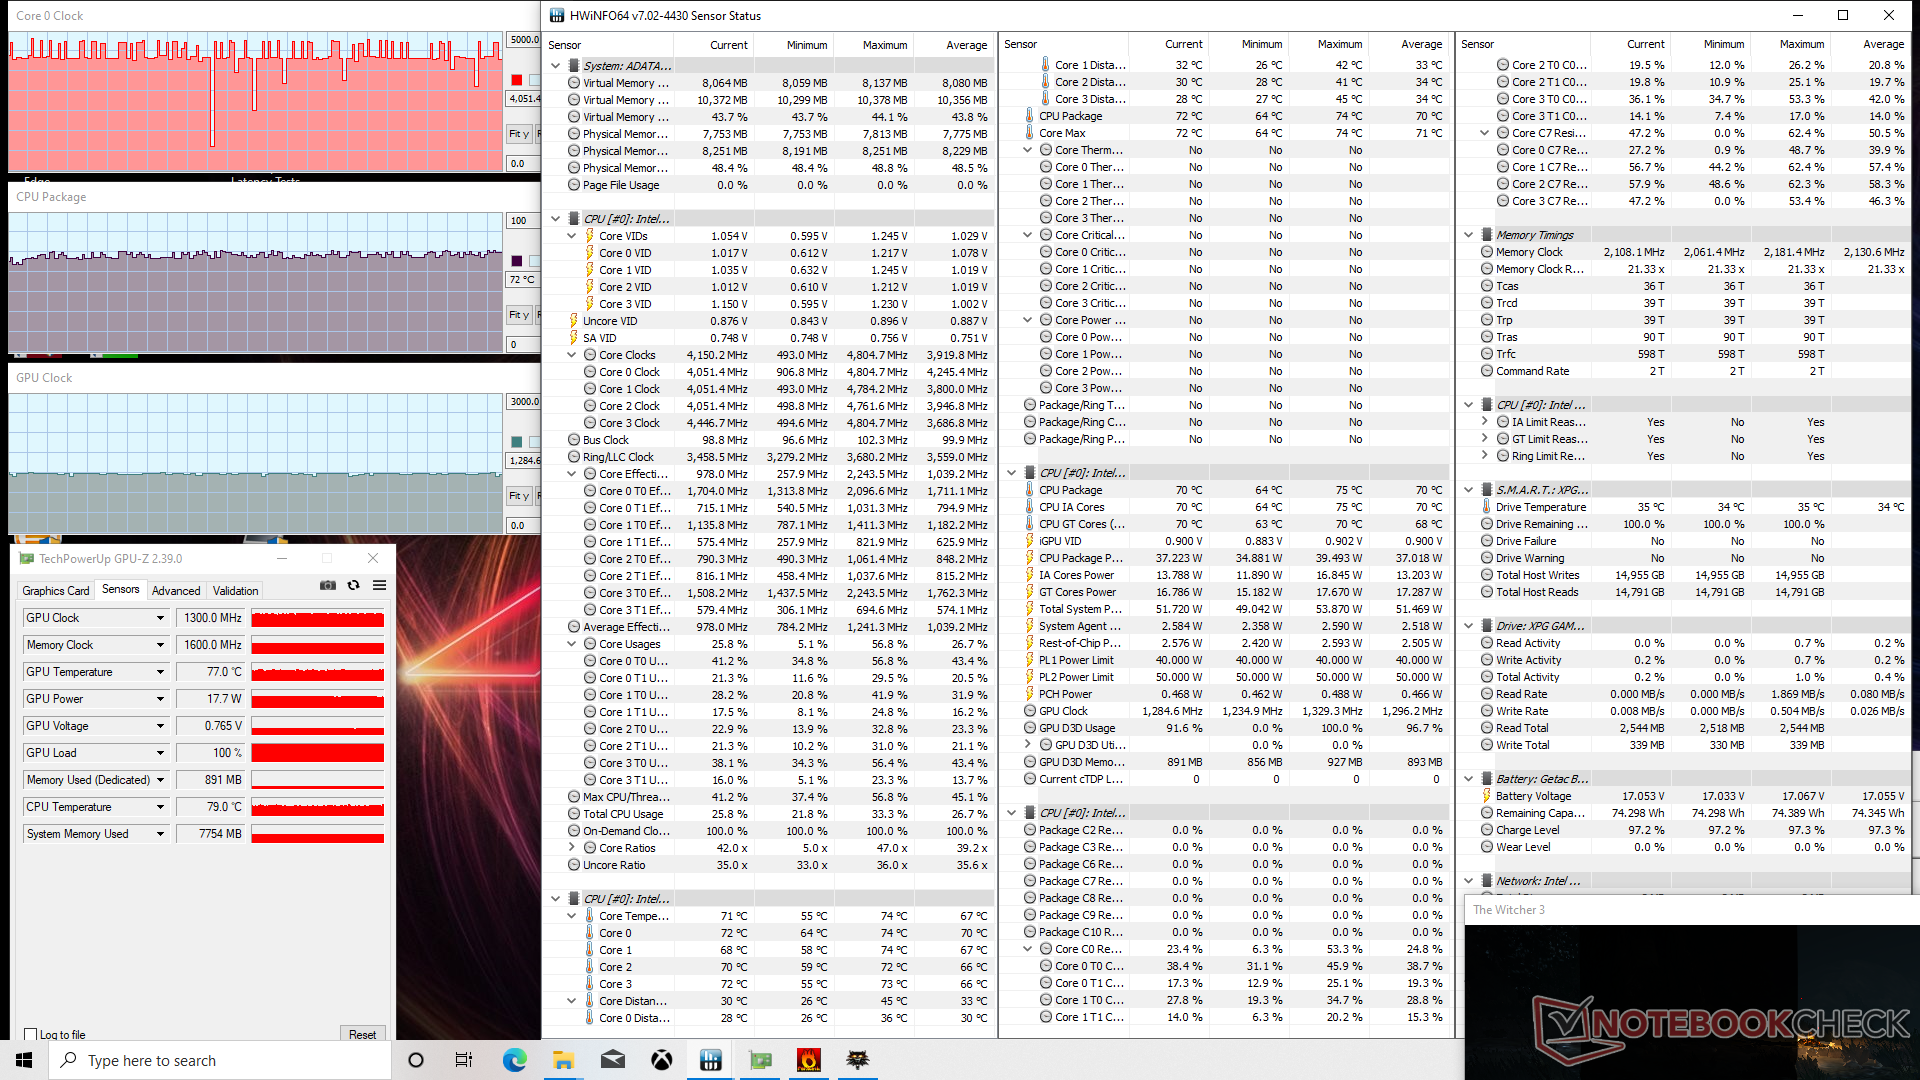
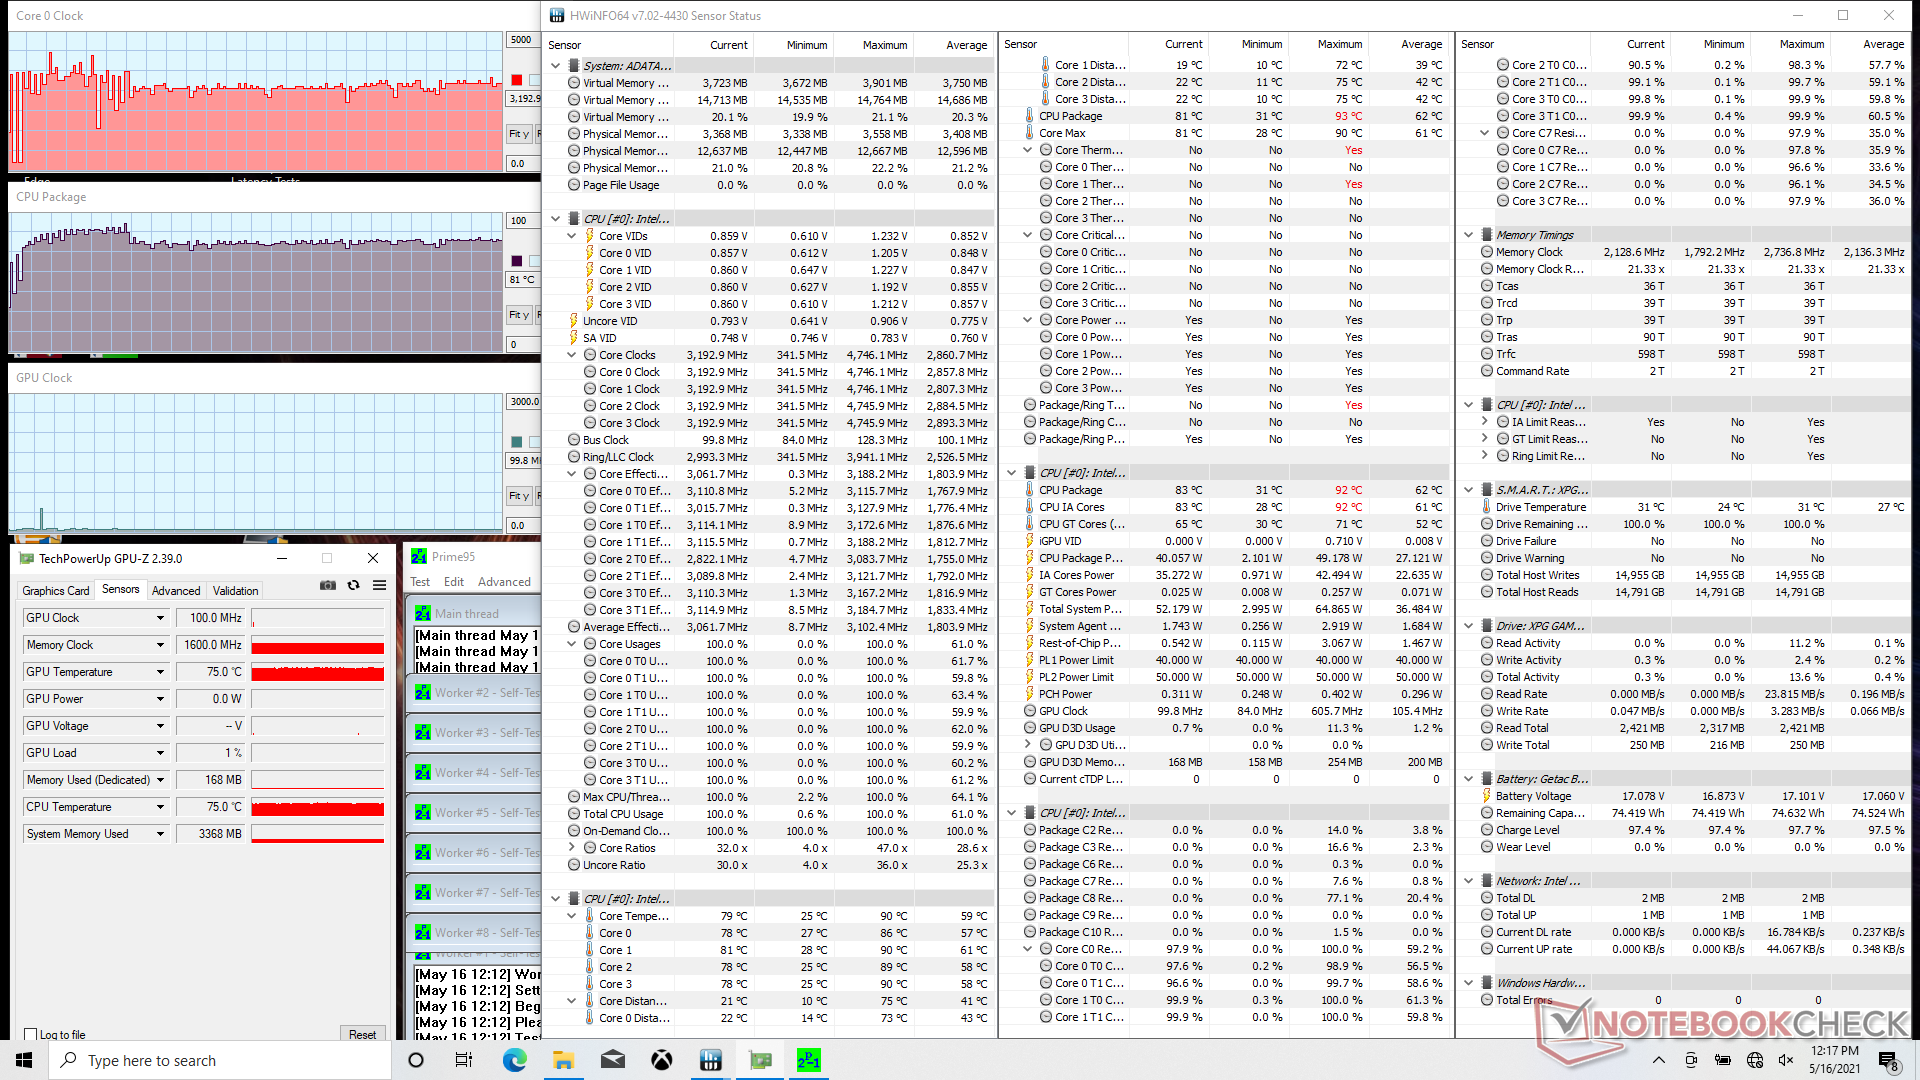
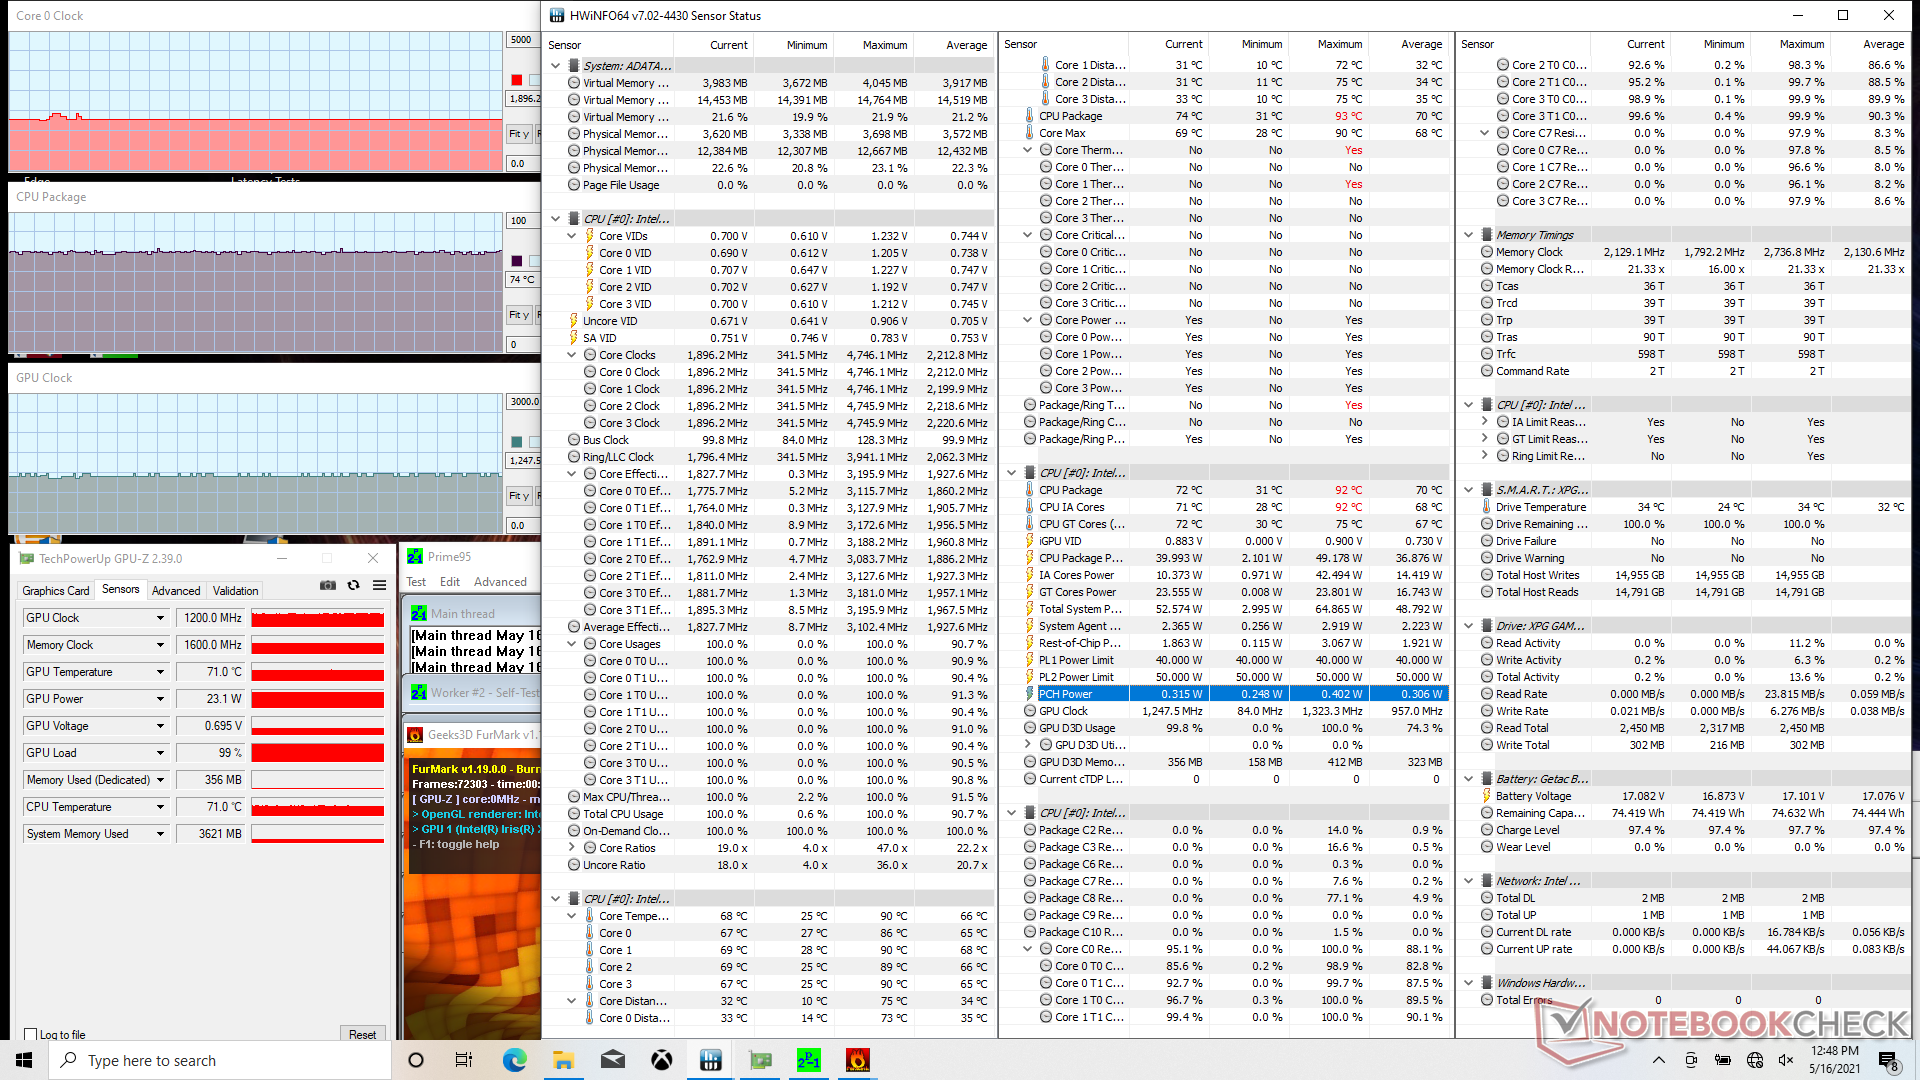
| CPU Clock (GHz) | GPU Clock (MHz) | Average CPU Temperature (°C) | |
| System Idle | -- | -- | 33 |
| Prime95 Stress | 3.0 - 3.2 | -- | 81 |
| Prime95 + FurMark Stress | 1.9 | 1200 | 74 |
| Witcher 3 Stress | 4.0 - 4.6 | 1300 | 72 |
Speakers


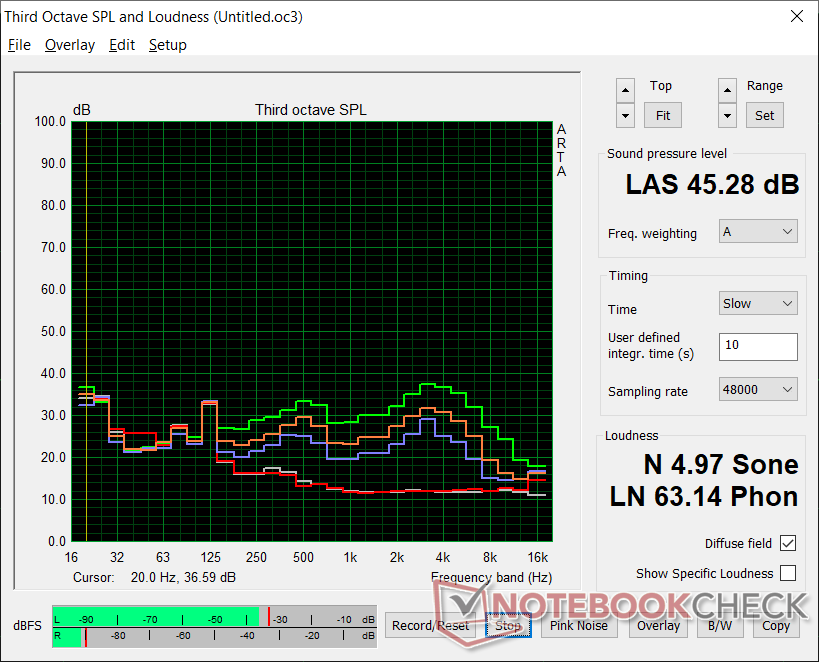
ADATA XPG Xenia Xe audio analysis
(±) | speaker loudness is average but good (79.8 dB)
Bass 100 - 315 Hz
(±) | reduced bass - on average 14.5% lower than median
(±) | linearity of bass is average (10.6% delta to prev. frequency)
Mids 400 - 2000 Hz
(+) | balanced mids - only 2.6% away from median
(+) | mids are linear (3.8% delta to prev. frequency)
Highs 2 - 16 kHz
(+) | balanced highs - only 3.2% away from median
(+) | highs are linear (4% delta to prev. frequency)
Overall 100 - 16.000 Hz
(+) | overall sound is linear (12.9% difference to median)
Compared to same class
» 19% of all tested devices in this class were better, 4% similar, 78% worse
» The best had a delta of 5%, average was 18%, worst was 45%
Compared to all devices tested
» 9% of all tested devices were better, 2% similar, 88% worse
» The best had a delta of 4%, average was 25%, worst was 134%
Apple MacBook 12 (Early 2016) 1.1 GHz audio analysis
(+) | speakers can play relatively loud (83.6 dB)
Bass 100 - 315 Hz
(±) | reduced bass - on average 11.3% lower than median
(±) | linearity of bass is average (14.2% delta to prev. frequency)
Mids 400 - 2000 Hz
(+) | balanced mids - only 2.4% away from median
(+) | mids are linear (5.5% delta to prev. frequency)
Highs 2 - 16 kHz
(+) | balanced highs - only 2% away from median
(+) | highs are linear (4.5% delta to prev. frequency)
Overall 100 - 16.000 Hz
(+) | overall sound is linear (10.2% difference to median)
Compared to same class
» 5% of all tested devices in this class were better, 2% similar, 93% worse
» The best had a delta of 5%, average was 19%, worst was 53%
Compared to all devices tested
» 3% of all tested devices were better, 1% similar, 96% worse
» The best had a delta of 4%, average was 25%, worst was 134%
Energy Management
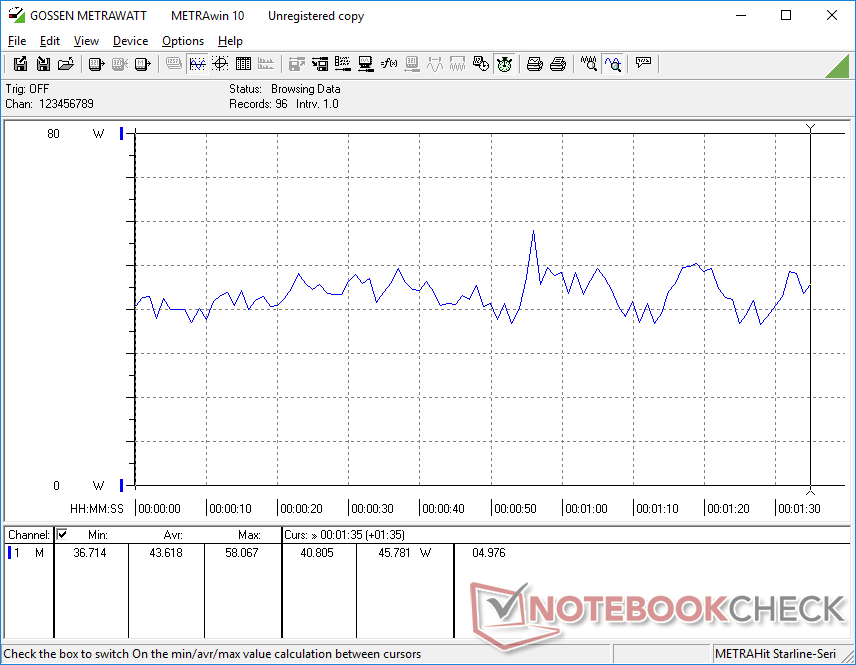
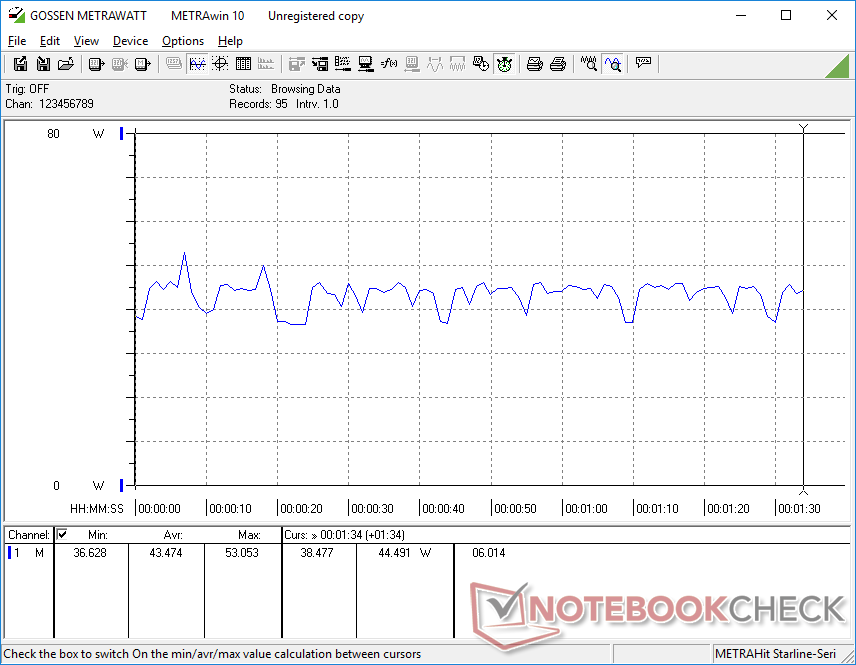
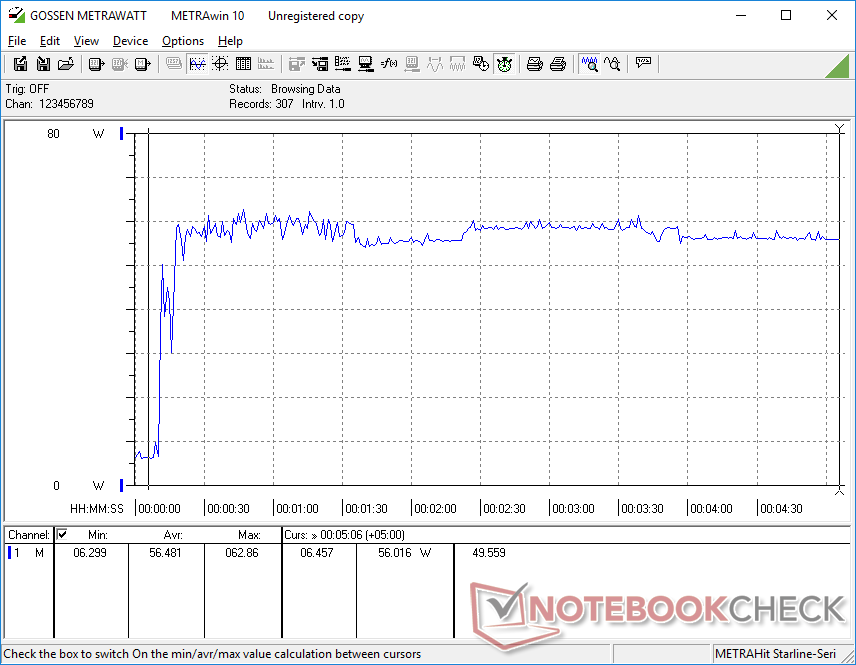
Power Consumption
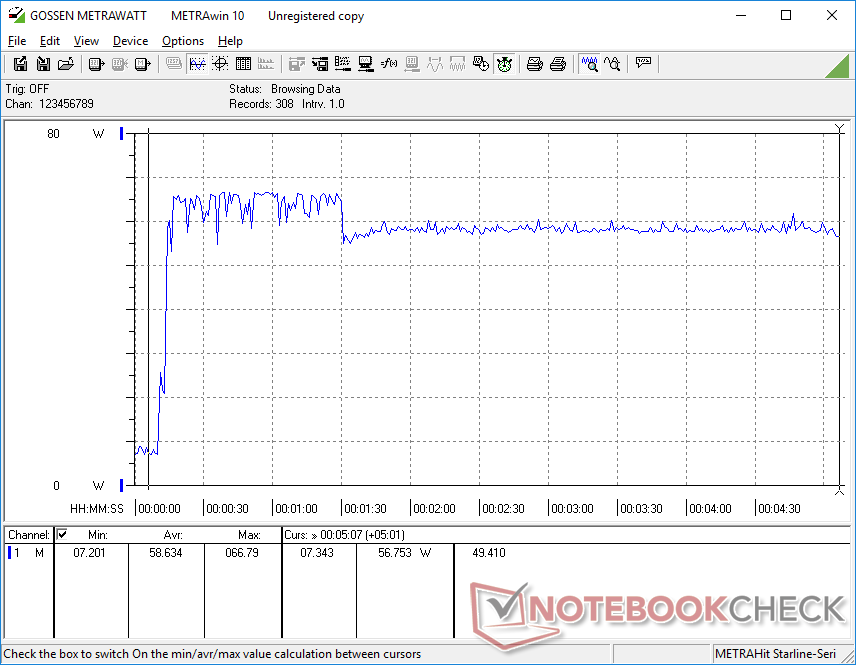
Idling on desktop consumes between 2 W and 8 W depending on the brightness setting and power profile. Gaming loads consume about 43 W compared to 42 W and 56 W to 66 W on the Dell XPS 15 and HP Spectre x360 15, respectively, even though the ADATA system is faster than both in many cases. Tiger Lake continues to impress when it comes to performance-per-watt.
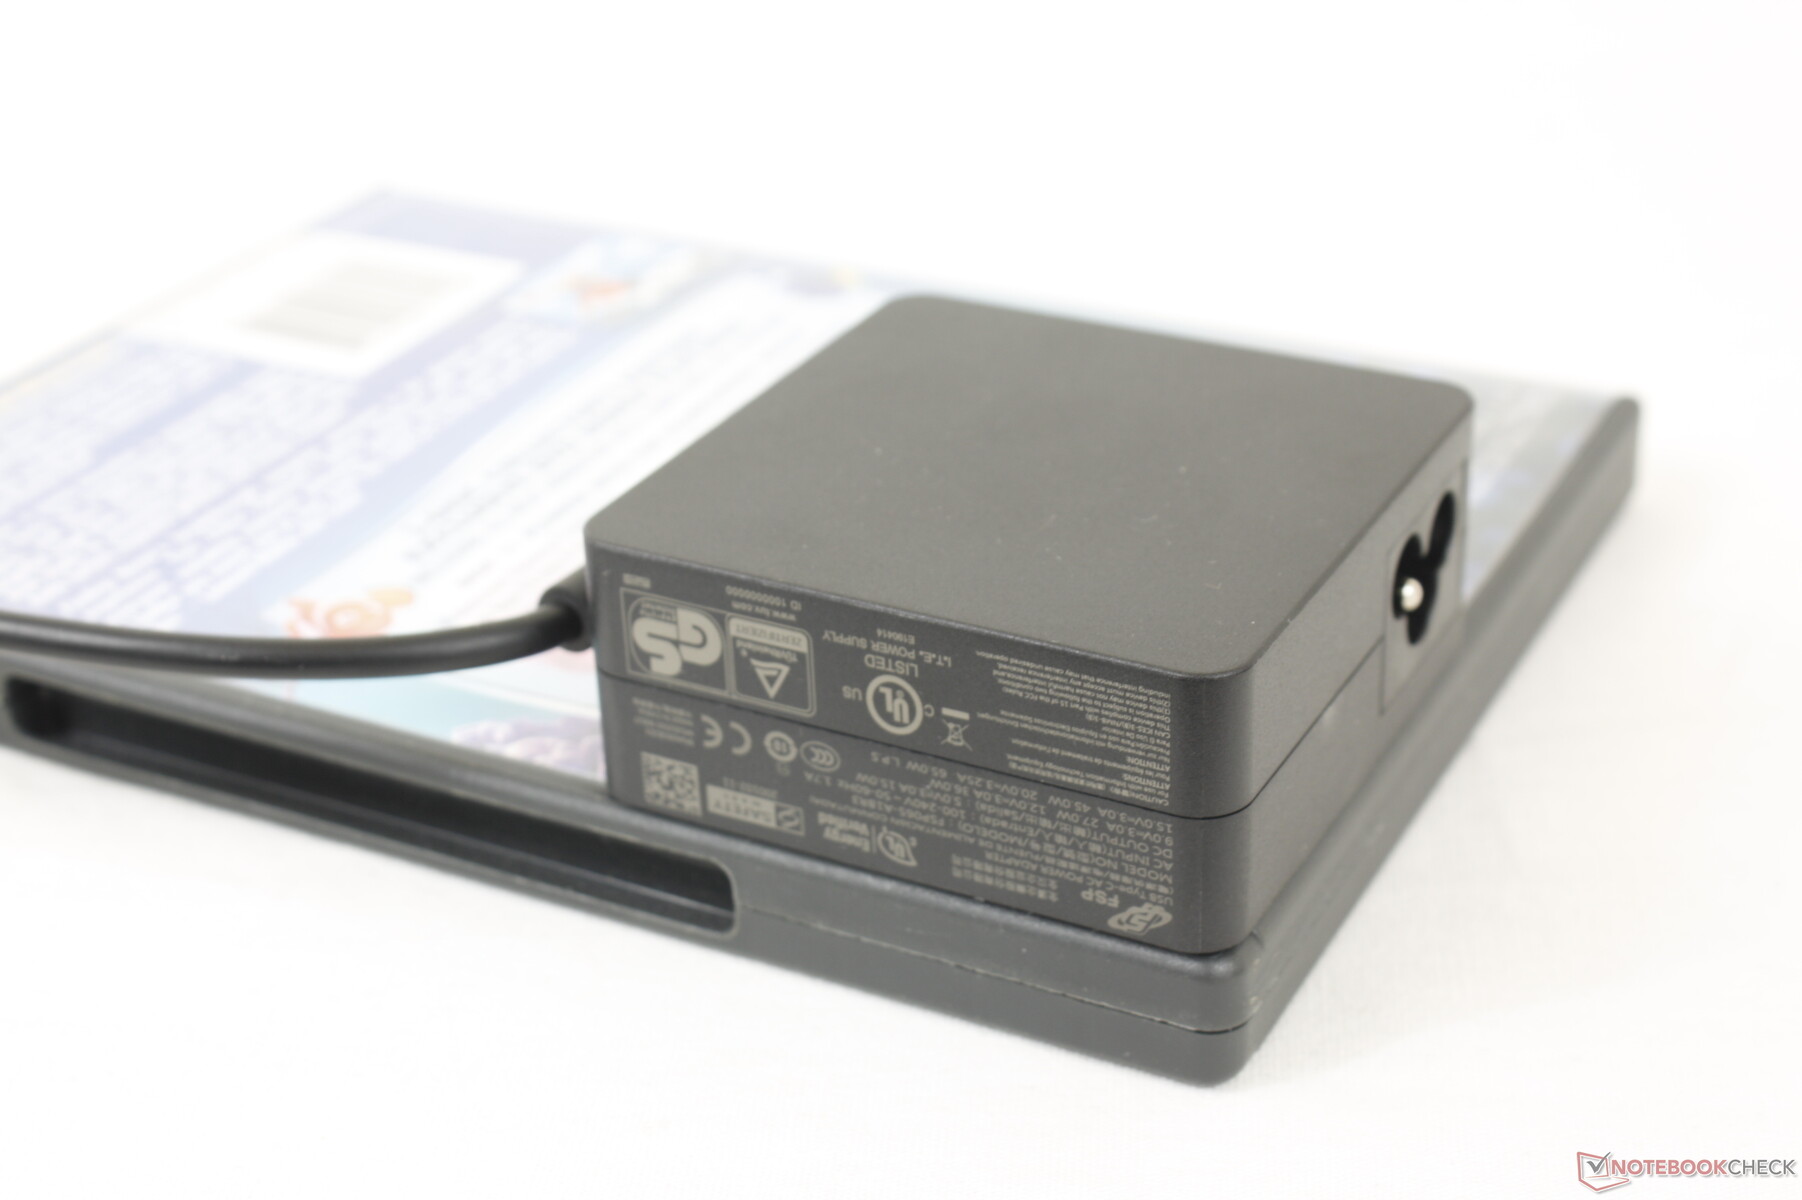
We're able to measure a temporary maximum consumption of 66.8 W from the small (~6.5 x 6.5 x 2.7 cm) 65 W AC adapter when the system is fully stressed.
| Off / Standby | |
| Idle | |
| Load |
|
| ADATA XPG Xenia Xe i7-1165G7, Iris Xe G7 96EUs, ADATA XPG Gammix S50 1TB, IPS, 1920x1080, 15.60 | Dell XPS 15 9500 Core i5 i5-10300H, UHD Graphics 630, Toshiba KBG40ZNS256G NVMe, IPS, 1920x1200, 15.60 | HP Spectre X360 15-5ZV31AV i7-10510U, GeForce MX250, Intel SSD 660p 2TB SSDPEKNW020T8, IPS, 3840x2160, 15.60 | Asus ZenBook 15 UX534FTC-A8190T i7-10510U, GeForce GTX 1650 Max-Q, Samsung SSD PM981 MZVLB1T0HALR, IPS, 1920x1080, 15.60 | Lenovo Yoga Creator 7 15IMH05 82DS000VGE i7-10750H, GeForce GTX 1650 Mobile, Samsung PM981a MZVLB1T0HBLR, IPS, 1920x1080, 15.60 | Apple MacBook Pro 15 2018 (2.6 GHz, 560X) i7-8850H, Radeon Pro 560X, Apple SSD AP0512, IPS, 2880x1800, 15.40 | |
|---|---|---|---|---|---|---|
| Power Consumption | -20% | -48% | -38% | -102% | -71% | |
| Idle Minimum * | 2.7 | 2.9 -7% | 5.2 -93% | 2.8 -4% | 6.9 -156% | 3.4 -26% |
| Idle Average * | 5.3 | 7.6 -43% | 8.5 -60% | 7.7 -45% | 10 -89% | 11 -108% |
| Idle Maximum * | 7.3 | 8 -10% | 8.7 -19% | 9.4 -29% | 12.6 -73% | 14.9 -104% |
| Load Average * | 43.6 | 41.7 4% | 65.6 -50% | 57 -31% | 96 -120% | 78.9 -81% |
| Witcher 3 ultra * | 43.5 | 56.5 -30% | 62 -43% | 75 -72% | ||
| Load Maximum * | 66.8 | 94.8 -42% | 92.4 -38% | 116 -74% | 134 -101% | 91.2 -37% |
* ... smaller is better
Battery Life
Runtimes are long at almost 12 hours of real-world WLAN browsing with the display set to 150 nits. Charging from empty to full capacity takes a little over two hours.
The USB-C AC adapter can be used to charge other devices including laptops, smartphones, and the Nintendo Switch.
| ADATA XPG Xenia Xe i7-1165G7, Iris Xe G7 96EUs, 73.41 Wh | Dell XPS 15 9500 Core i5 i5-10300H, UHD Graphics 630, 56 Wh | HP Spectre X360 15-5ZV31AV i7-10510U, GeForce MX250, 84 Wh | Asus ZenBook 15 UX534FTC-A8190T i7-10510U, GeForce GTX 1650 Max-Q, 71 Wh | Lenovo Yoga Creator 7 15IMH05 82DS000VGE i7-10750H, GeForce GTX 1650 Mobile, 70 Wh | Apple MacBook Pro 15 2018 (2.6 GHz, 560X) i7-8850H, Radeon Pro 560X, 83 Wh | |
|---|---|---|---|---|---|---|
| Battery Runtime | -21% | -8% | 6% | -23% | -13% | |
| WiFi v1.3 | 704 | 556 -21% | 646 -8% | 743 6% | 539 -23% | 614 -13% |
| Reader / Idle | 1581 | 1355 | 1629 | 1543 | ||
| Load | 93 | 173 | 142 | 59 | ||
| Witcher 3 ultra | 88 |
Pros
Cons
Verdict
Intel has proven that it can make consistently excellent mini PCs and the XPG Xenia Xe looks set to continue that trend on laptops. It's visually clean and refined with a framework that rivals the more well-known XPS 15 or HP Envy 15 series.
Raw performance is impressive for a system powered by nothing more than the ULV Core i7-1165G7. The system can outperform Core i5 H series CPUs and match discrete GeForce MX graphics in many scenarios all while consuming much less power and lasting longer in the process. The mobile Core U series has definitely come a long way since the days of Whiskey Lake and the shamefully slow UHD Graphics 620.
It may be one of Intel's first homemade consumer laptops, but it already feels refined. Both chassis design and performance-per-watt are spectacular when compared to Core i5 H series or GeForce MX multimedia laptops out there.
There's a lot that can still be improved for future models. Basics like a webcam shutter, SD card reader, and fingerprint reader are all conspicuously missing on the Xenia Xe. The clickpad and keyboard keys could be firmer and less spongy while additional display options could attract users who prefer matte or OLED. The Alexa light bar integration is a nice touch for existing Alexa users, but it's a bummer that it can't be set to Google instead or anything else.
Systems with Core i7 H series CPUs and GeForce GTX graphics will still handily outperform the Xenia Xe even if performance-per-watt happens to be lower. Thus, if high-end performance is a priority, then a fully configured Dell XPS 15 or Asus ZenBook Pro 15 would be preferable.
Price and availability
ADATA XPG Xenia Xe
-
05/18/2021 v7
Allen Ngo


Pricecompare
