 Deutsch
 English
 Español
 Français
 Italiano
 Nederlands
 Polski
 Português
 Русский
 Türkçe
 Svenska
 Chinese
 Magyar
Lenovo IdeaPad 320s-14IKB (i5-7200U, 920MX, SSD, FHD) Laptop Review

With the IdeaPad 320s-14IKB, Lenovo delivers a 14-inch office notebook. The laptop comes with a Kaby Lake-based processor and a dedicated graphics card. Therefore, the notebook provides enough performance for office tasks. The device is no stranger to us. We have already reviewed a sibling model. The competitors of the device include the HP 14, the Acer Swift 3 SF314-52G and the HP ProBook 440 G4.
Because both IdeaPad models are identically built, we shall skip the sections that deal with the case, input devices and the speakers. You can find all the relevant information in the review of the sibling model.


| SD Card Reader | |
| average JPG Copy Test (av. of 3 runs) | |
| Lenovo IdeaPad 320s-14IKB (Toshiba Exceria Pro SDXC 64 GB UHS-II) | |
| Lenovo ThinkPad E480-20KQS00000 (Toshiba Exceria Pro M501) | |
| HP ProBook 440 G4-Y8B51EA (Toshiba Exceria Pro SDXC 64 GB UHS-II) | |
| Lenovo IdeaPad 320s-14IKB (Toshiba Exceria Pro SDXC 64 GB UHS-II) | |
| Average of class Office (8 - 82.7, n=50, last 2 years) | |
| Asus VivoBook S14 S406UA-BV023T (Toshiba Exceria Pro M501 microSDXC 64GB) | |
| HP 14-bs007ng (Toshiba Exceria Pro SDXC 64 GB UHS-II) | |
| Acer Swift 3 SF314-52G-89SL (Toshiba Exceria Pro SDXC 64 GB UHS-II) | |
| maximum AS SSD Seq Read Test (1GB) | |
| Lenovo IdeaPad 320s-14IKB | |
| HP ProBook 440 G4-Y8B51EA (Toshiba Exceria Pro SDXC 64 GB UHS-II) | |
| Lenovo IdeaPad 320s-14IKB (Toshiba Exceria Pro SDXC 64 GB UHS-II) | |
| Lenovo ThinkPad E480-20KQS00000 (Toshiba Exceria Pro M501) | |
| Average of class Office (25 - 90.5, n=44, last 2 years) | |
| Asus VivoBook S14 S406UA-BV023T (Toshiba Exceria Pro M501 microSDXC 64GB) | |
| HP 14-bs007ng (Toshiba Exceria Pro SDXC 64 GB UHS-II) | |
| Acer Swift 3 SF314-52G-89SL (Toshiba Exceria Pro SDXC 64 GB UHS-II) | |
Maintenance
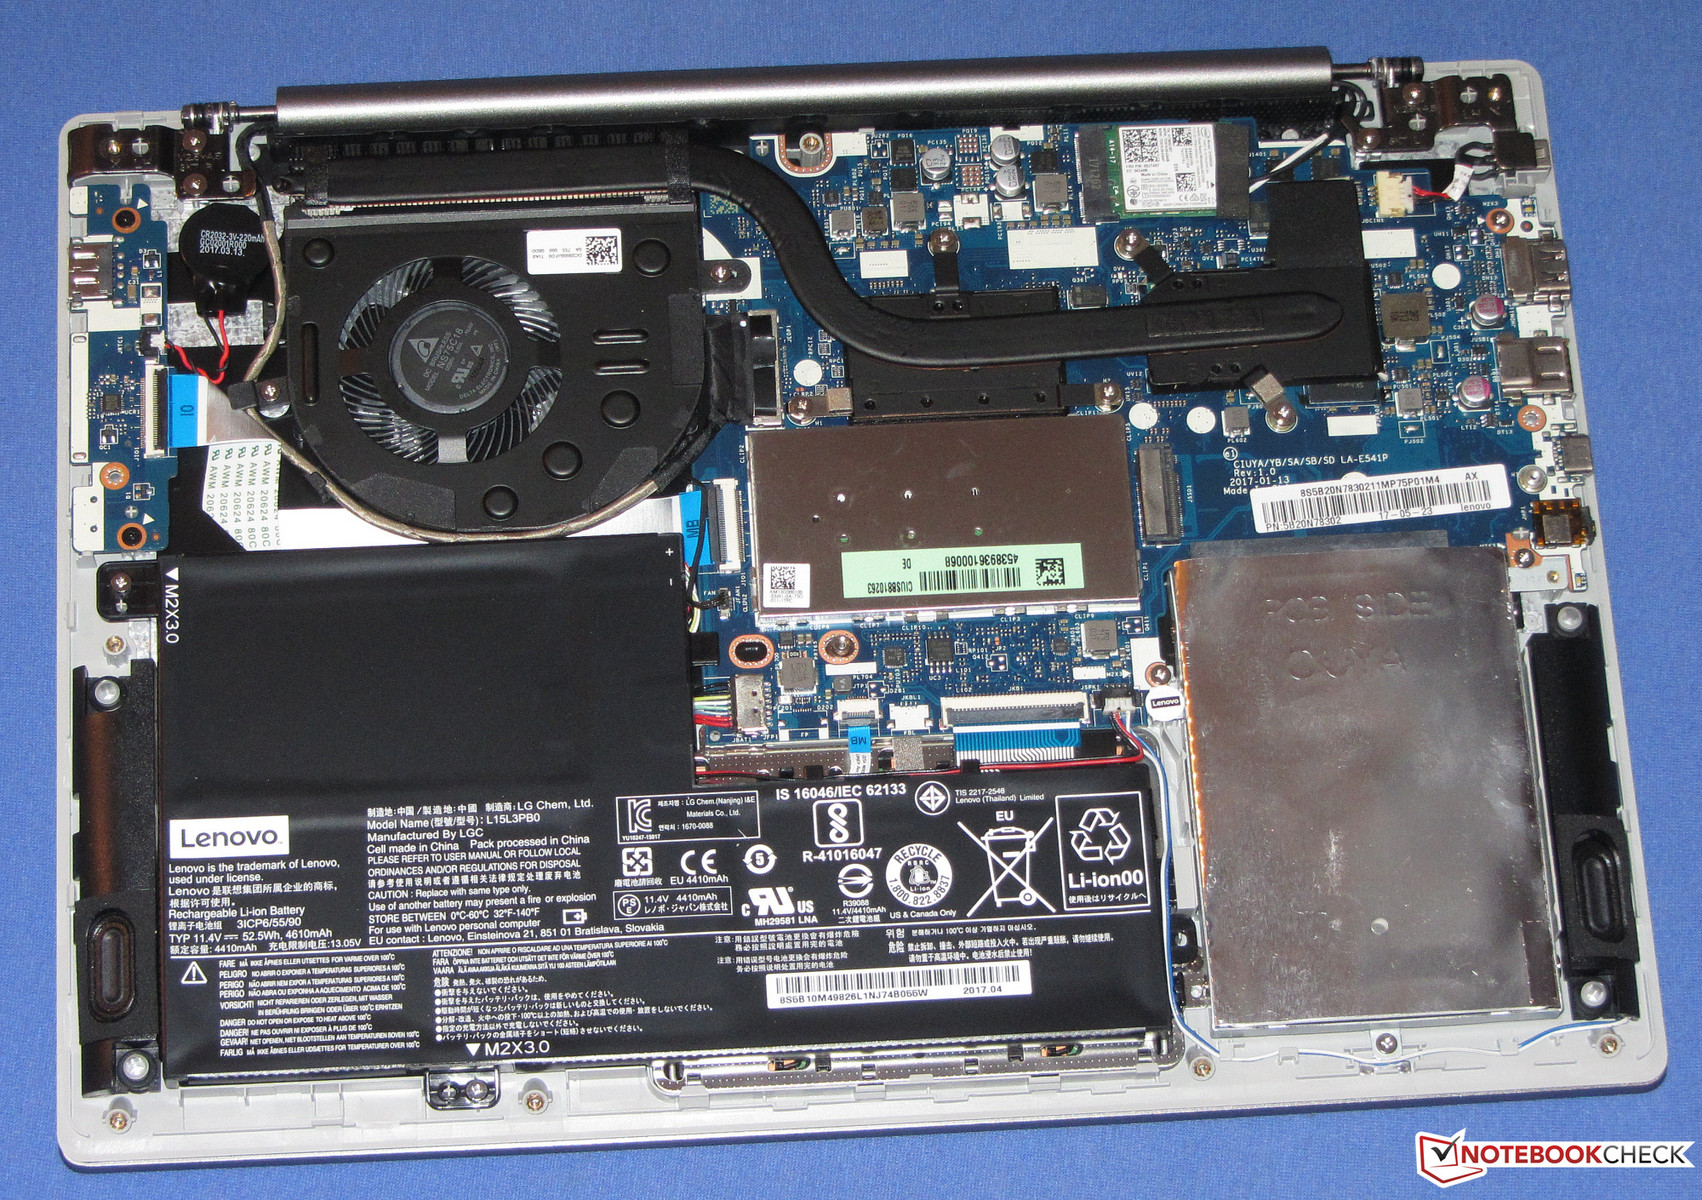
The device can be both serviced and upgraded. However, Lenovo did not provide the 14-incher with a maintenance hatch. In order to get to the internals, you will have to remove the bottom cover. For this, you will have to undo all the screws on the underside of the device. Subsequently, the bottom cover can be removed with the help of a plastic putty knife or an offset spatula. This will require some finger work because the bottom cover is fastened very firmly and the small holding clamps can break easily. After that, you will have access to all of the hardware: SSD, fan, BIOS battery, M.2 slot, Wi-Fi module, battery. The RAM is protected by a cover.
Display

The IdeaPad is equipped with the same Full HD screen as the previously reviewed sibling model. What we have here is an IPS panel with great viewing angles and contrast, which offers a very low brightness. Two identically built panels never match one hundred percent.
Unfortunately, at 90% brightness and below, the display exhibits PWM flickering with a frequency of 357 Hz.
You can find further information about the display in our review of the sibling model.
| |||||||||||||||||||||||||
Brightness Distribution: 71 %
Center on Battery: 245 cd/m²
Contrast: 1167:1 (Black: 0.21 cd/m²)
ΔE Color 4.85 | 0.5-29.43 Ø5
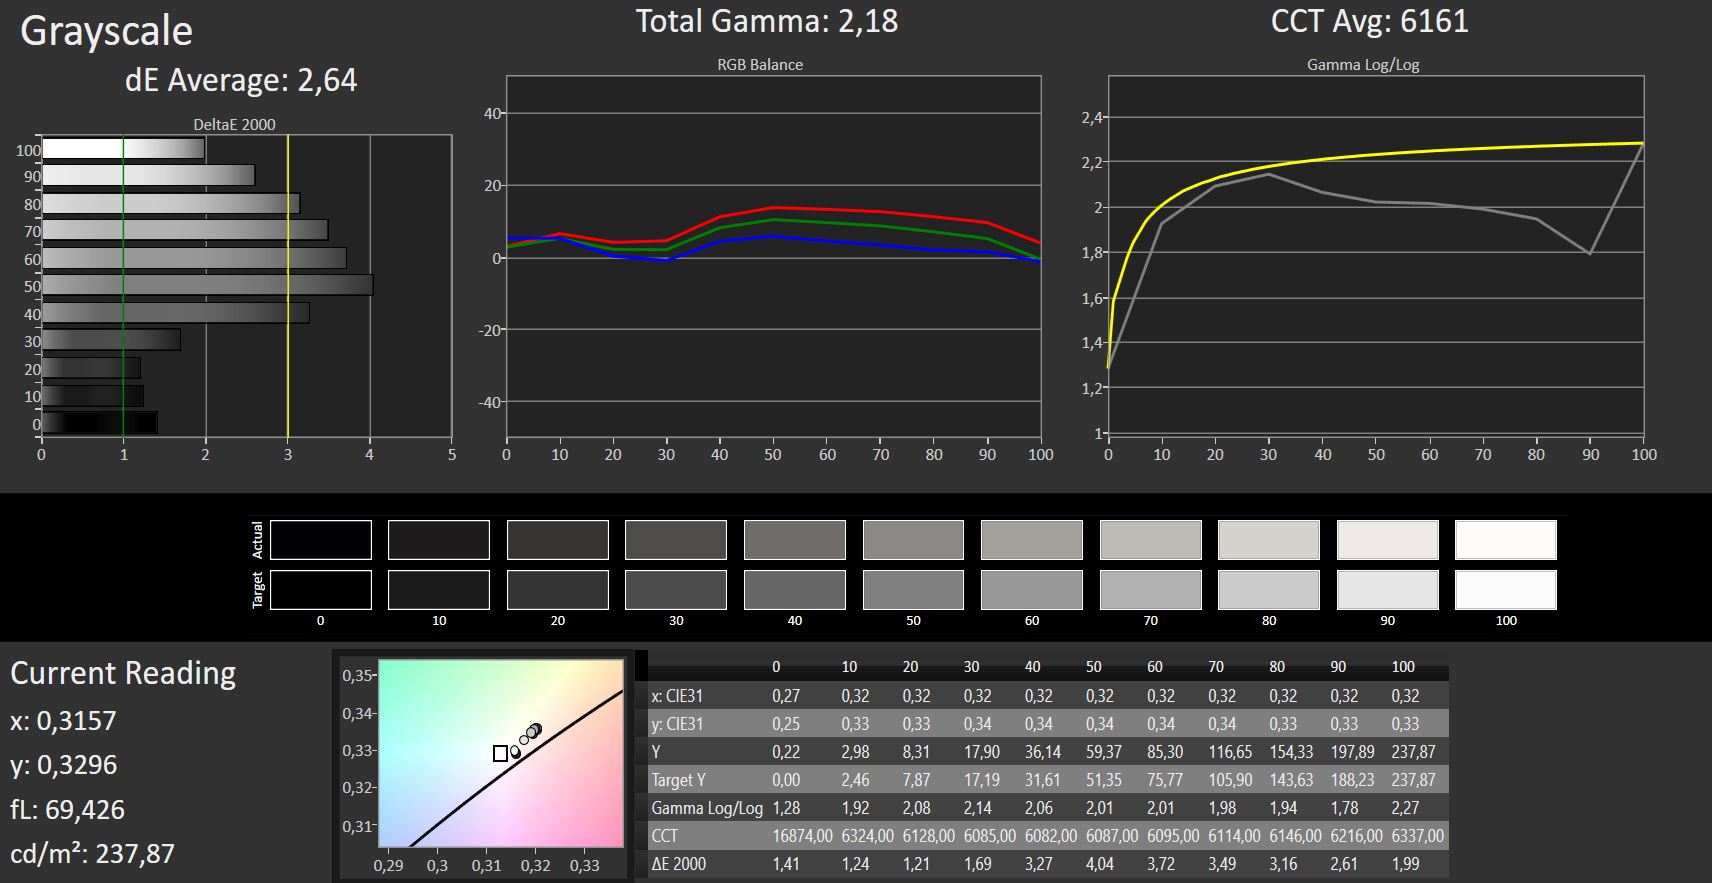
ΔE Greyscale 2.64 | 0.57-98 Ø5.3
57% sRGB (Argyll 1.6.3 3D)
37% AdobeRGB 1998 (Argyll 1.6.3 3D)
40.56% AdobeRGB 1998 (Argyll 2.2.0 3D)
57.6% sRGB (Argyll 2.2.0 3D)
39.26% Display P3 (Argyll 2.2.0 3D)
Gamma: 2.18
Screen Flickering / PWM (Pulse-Width Modulation)
| Screen flickering / PWM detected | 357 Hz | ≤ 90 % brightness setting |  |
The display backlight flickers at 357 Hz (worst case, e.g., utilizing PWM) Flickering detected at a brightness setting of 90 % and below. There should be no flickering or PWM above this brightness setting. The frequency of 357 Hz is relatively high, so most users sensitive to PWM should not notice any flickering. However, there are reports that some users are still sensitive to PWM at 500 Hz and above, so be aware. In comparison: 53 % of all tested devices do not use PWM to dim the display. If PWM was detected, an average of 17853 (minimum: 5 - maximum: 3846000) Hz was measured. | |||
| Lenovo IdeaPad 320s-14IKB IPS, 1920x1080, 14.00 | Lenovo ThinkPad E480-20KQS00000 IPS LED, 1920x1080, 14.00 | Asus VivoBook S14 S406UA-BV023T TN LED, 1366x768, 14.00 | HP 14-bs007ng IPS, 1920x1080, 14.00 | HP ProBook 440 G4-Y8B51EA TN, 1920x1080, 14.00 | Acer Swift 3 SF314-52G-89SL IPS, 1920x1080, 14.00 | Lenovo IdeaPad 320s-14IKB IPS, 1920x1080, 14.00 | |
|---|---|---|---|---|---|---|---|
| Display | 8% | -0% | -6% | -3% | -7% | 6% | |
| Display P3 Coverage | 39.26 | 41.88 7% | 38.82 -1% | 36.53 -7% | 37.6 -4% | 36.09 -8% | 41.65 6% |
| sRGB Coverage | 57.6 | 62.8 9% | 58.2 1% | 54.9 -5% | 56.6 -2% | 54.2 -6% | 61.8 7% |
| AdobeRGB 1998 Coverage | 40.56 | 43.29 7% | 40.11 -1% | 37.74 -7% | 38.85 -4% | 37.28 -8% | 43.03 6% |
| Response Times | 2288% | 6% | 11% | 11% | 12% | 0% | |
| Response Time Grey 50% / Grey 80% * | 44 ? | 44 ? -0% | 42 ? 5% | 39 ? 11% | 43.2 ? 2% | 41 ? 7% | 42 ? 5% |
| Response Time Black / White * | 30 ? | 31.2 ? -4% | 13 ? 57% | 27 ? 10% | 24.4 ? 19% | 25 ? 17% | 31 ? -3% |
| PWM Frequency | 357 ? | 24880 ? 6869% | 200 ? -44% | 352 ? -1% | |||
| Screen | -4% | -62% | 6% | -60% | -19% | -11% | |
| Brightness middle | 245 | 251 2% | 215 -12% | 251 2% | 216 -12% | 233 -5% | 274 12% |
| Brightness | 235 | 231 -2% | 208 -11% | 229 -3% | 203 -14% | 217 -8% | 253 8% |
| Brightness Distribution | 71 | 80 13% | 81 14% | 85 20% | 83 17% | 88 24% | 85 20% |
| Black Level * | 0.21 | 0.19 10% | 0.4 -90% | 0.15 29% | 0.47 -124% | 0.27 -29% | 0.31 -48% |
| Contrast | 1167 | 1321 13% | 538 -54% | 1673 43% | 460 -61% | 863 -26% | 884 -24% |
| Colorchecker dE 2000 * | 4.85 | 5.1 -5% | 9.37 -93% | 4.67 4% | 8.98 -85% | 5.85 -21% | 5.74 -18% |
| Colorchecker dE 2000 max. * | 8.99 | 10.6 -18% | 15.84 -76% | 9.4 -5% | 14.07 -57% | 11.51 -28% | 8.26 8% |
| Greyscale dE 2000 * | 2.64 | 4.5 -70% | 10.52 -298% | 3.09 -17% | 9.61 -264% | 4.87 -84% | 4.61 -75% |
| Gamma | 2.18 101% | 2.18 101% | 2.45 90% | 2.44 90% | 2.63 84% | 2.47 89% | 2.14 103% |
| CCT | 6161 106% | 6146 106% | 11214 58% | 7050 92% | 11265 58% | 6908 94% | 7281 89% |
| Color Space (Percent of AdobeRGB 1998) | 37 | 39.8 8% | 37 0% | 35 -5% | 35.9 -3% | 34 -8% | 39 5% |
| Color Space (Percent of sRGB) | 57 | 62.5 10% | 58 2% | 55 -4% | 56.7 -1% | 54 -5% | 61 7% |
| Total Average (Program / Settings) | 764% /
428% | -19% /
-38% | 4% /
4% | -17% /
-40% | -5% /
-13% | -2% /
-5% |
* ... smaller is better
Display Response Times
| ↔ Response Time Black to White | ||
|---|---|---|
| 30 ms ... rise ↗ and fall ↘ combined | ↗ 18 ms rise |  |
| ↘ 12 ms fall | ||
| The screen shows slow response rates in our tests and will be unsatisfactory for gamers. In comparison, all tested devices range from 0.1 (minimum) to 240 (maximum) ms. » 77 % of all devices are better. This means that the measured response time is worse than the average of all tested devices (21.5 ms). | ||
| ↔ Response Time 50% Grey to 80% Grey | ||
| 44 ms ... rise ↗ and fall ↘ combined | ↗ 22 ms rise |  |
| ↘ 22 ms fall | ||
| The screen shows slow response rates in our tests and will be unsatisfactory for gamers. In comparison, all tested devices range from 0.2 (minimum) to 636 (maximum) ms. » 70 % of all devices are better. This means that the measured response time is worse than the average of all tested devices (33.7 ms). | ||


Performance
With the IdeaPad 320s-14IKB, Lenovo has a 14-inch notebook in its product line-up. It offers enough performance for all current applications. The dedicated graphics card allows users to play video games, albeit in a limited fashion. Our review device can be had for 700 Euros ($863). Other hardware configurations are also available. The prices start at 400 Euros ($493).
Processor
The IdeaPad comes equipped with a Kaby Lake-based dual-core Core i5-7200U processor. What we have here is a ULV model with a TDP of 15 watts, which is going to be able to meet the demands of most users. The CPU operates at 2.5 GHz. By means of Intel’s Turbo Boost Technology, the clock rate can be increased up to 3.1 GHz (for both cores). The Turbo Boost works both when the laptop is running on battery and when it is plugged in.
We check whether Intel’s Turbo Boost Technology can be used over an extended period of time by running the multi-core portion of the Cinebench benchmark for 30 minutes in a continuous loop. The results stay consistently on the same level. There are no drops in performance to report.
| JetStream 1.1 - Total Score | |
| Average of class Office (117.1 - 544, n=18, last 2 years) | |
| Acer Swift 3 SF314-52G-89SL (Edge 40) | |
| Asus VivoBook S14 S406UA-BV023T (Edge 41) | |
| Lenovo ThinkPad E480-20KQS00000 (Edge) | |
| HP 14-bs007ng (Edge 41) | |
| HP ProBook 440 G4-Y8B51EA | |
| Average Intel Core i5-7200U (127.7 - 223, n=69) | |
| Lenovo IdeaPad 320s-14IKB (Edge 41) | |
| Lenovo IdeaPad 320s-14IKB | |
System Performance
The combination of a Core i5 processor and a solid-state drive makes for a very responsive system. The PCMark results show that the laptop offers more than enough performance for such usage scenarios as Internet browsing and office work. Limited video game play is possible thanks to the dedicated graphics adapter. An increase in performance through enabling dual-channel mode is impossible, because the notebook has only one RAM slot.

| PCMark 8 Home Score Accelerated v2 | 3329 points | |
| PCMark 8 Creative Score Accelerated v2 | 4134 points | |
| PCMark 8 Work Score Accelerated v2 | 4312 points | |
| PCMark 10 Score | 2660 points | |
Help | ||
Storage Devices
A SATA-III SSD from Liteon serves as the system drive. What we have here is a 2.5-inch model with a storage capacity of 256 GB. Right out of the box, only 184 GB is available to the user. The rest of the storage space is occupied by the Recovery Partition and the Windows installation files. The transfer rates of the SSD are good.
Inside the device, there is an empty M.2-2280 slot that can be used with a corresponding SSD. Which raises the question: “Why did Lenovo not equip the device with an M.2 SSD in the first place?” Users who would like to go with a combination of an SSD and an HDD will have to get both drives on their own. Here, Lenovo should have thought more about their customers.


| Lenovo IdeaPad 320s-14IKB Liteonit CV3-DE256 | Lenovo ThinkPad E480-20KQS00000 Lenovo LENSE20256GMSP34MEAT2TA | Asus VivoBook S14 S406UA-BV023T SanDisk SD8SN8U256G1002 | HP 14-bs007ng SanDisk SD8SN8U256G1006 | HP ProBook 440 G4-Y8B51EA SanDisk SD8SNAT256G1002 | Acer Swift 3 SF314-52G-89SL Intel SSD 600p SSDPEKKW512G7 | Lenovo IdeaPad 320s-14IKB Samsung PM961 NVMe MZVLW128HEGR | Average Liteonit CV3-DE256 | Average of class Office | |
|---|---|---|---|---|---|---|---|---|---|
| CrystalDiskMark 3.0 | 35% | -3% | -1% | -7% | 68% | 25% | 1% | 195% | |
| Read Seq | 511 | 1295 153% | 480.1 -6% | 456.1 -11% | 491.2 -4% | 944 85% | 991 94% | 488 ? -5% | 1895 ? 271% |
| Write Seq | 417.8 | 160.6 -62% | 440.3 5% | 457.3 9% | 322.2 -23% | 552 32% | 792 90% | 386 ? -8% | 2113 ? 406% |
| Read 512 | 272.8 | 872 220% | 277.5 2% | 347 27% | 310.1 14% | 616 126% | 482.2 77% | 305 ? 12% | 878 ? 222% |
| Write 512 | 258 | 122 -53% | 300.6 17% | 277.3 7% | 276 7% | 483.3 87% | 138.5 -46% | 289 ? 12% | 1297 ? 403% |
| Read 4k | 25.9 | 25.72 -1% | 28.18 9% | 28.47 10% | 19.57 -24% | 13.98 -46% | 28.11 9% | 25.1 ? -3% | 43.3 ? 67% |
| Write 4k | 61.6 | 95.2 55% | 52.6 -15% | 55.4 -10% | 77.8 26% | 133.6 117% | 79 28% | 62.3 ? 1% | 132.5 ? 115% |
| Read 4k QD32 | 334.8 | 389.9 16% | 273.4 -18% | 304.3 -9% | 146.3 -56% | 462.6 38% | 320.9 -4% | 326 ? -3% | 433 ? 29% |
| Write 4k QD32 | 238.7 | 118.3 -50% | 192.4 -19% | 158.2 -34% | 241.4 1% | 496.2 108% | 124.8 -48% | 237 ? -1% | 341 ? 43% |
Graphics Card
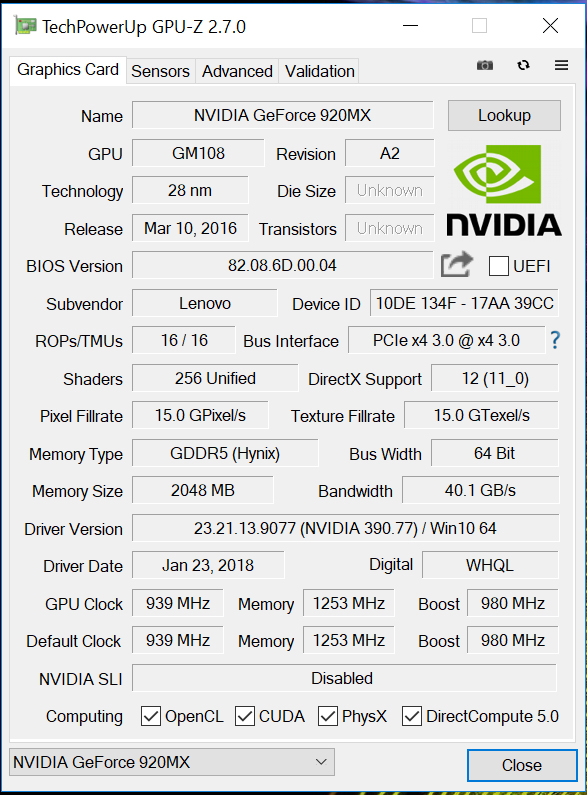
The IdeaPad comes equipped with a GeForce 920MX from Nvidia. What we are dealing with here is an entry-level GPU. It supports DirectX 12 and operates at core clocks of up to 980 MHz. Unlike the GeForce 920M (Kepler), the 920MX is based on Nvidia’s Maxwell architecture. It has 2048 MB of GDDR5 video memory at its disposal.
The various GPU benchmarks show that the 920MX with GDDR5 VRAM is 10 to 30% faster than the DDR3-based models. Therefore, the GPU can trade blows with the DDR3-based variants of the GeForce 930MX.
| 3DMark 03 Standard | 30702 points | |
| 3DMark 05 Standard | 21185 points | |
| 3DMark 06 Standard Score | 13630 points | |
| 3DMark Vantage P Result | 8231 points | |
| 3DMark 11 Performance | 2096 points | |
| 3DMark Ice Storm Standard Score | 73551 points | |
| 3DMark Cloud Gate Standard Score | 7346 points | |
| 3DMark Fire Strike Score | 1519 points | |
| 3DMark Fire Strike Extreme Score | 731 points | |
| 3DMark Time Spy Score | 472 points | |
Help | ||
| 3DMark | |
| 1280x720 Cloud Gate Standard Graphics | |
| Average of class Office (5681 - 58068, n=93, last 2 years) | |
| Lenovo ThinkPad E480-20KQS00000 | |
| Lenovo IdeaPad 320s-14IKB | |
| Asus VivoBook S14 S406UA-BV023T | |
| Average NVIDIA GeForce 920MX (7733 - 10494, n=2) | |
| HP ProBook 440 G4-Y8B51EA | |
| MSI CX61 2QC 2970M MS-16GD | |
| Asus X302UV-FN016T | |
| Asus F555LJ-XX110H | |
| Lenovo B70-80 80MR0006GE | |
| Lenovo U31-70 80M5003EGE | |
| 1920x1080 Fire Strike Graphics | |
| Average of class Office (712 - 9228, n=115, last 2 years) | |
| Lenovo ThinkPad E480-20KQS00000 | |
| HP ProBook 440 G4-Y8B51EA | |
| Lenovo IdeaPad 320s-14IKB | |
| Average NVIDIA GeForce 920MX (1282 - 1614, n=2) | |
| Asus X302UV-FN016T | |
| MSI CX61 2QC 2970M MS-16GD | |
| Asus VivoBook S14 S406UA-BV023T | |
| Lenovo U31-70 80M5003EGE | |
| Lenovo B70-80 80MR0006GE | |
| Asus F555LJ-XX110H | |
| 2560x1440 Time Spy Graphics | |
| Average of class Office (242 - 3242, n=111, last 2 years) | |
| Lenovo IdeaPad 320s-14IKB | |
| Average NVIDIA GeForce 920MX () | |
| MSI CX61 2QC 2970M MS-16GD | |
| 3DMark 06 - 1280x1024 Standard Score AA:0x AF:0x | |
| Average of class Office (9852 - 40490, n=15, last 2 years) | |
| Lenovo IdeaPad 320s-14IKB | |
| HP ProBook 440 G4-Y8B51EA | |
| Average NVIDIA GeForce 920MX (10781 - 13630, n=2) | |
| Asus X302UV-FN016T | |
| MSI CX61 2QC 2970M MS-16GD | |
| Lenovo U31-70 80M5003EGE | |
| Asus F555LJ-XX110H | |
| Geekbench 4.0 - Compute OpenCL Score | |
| Acer Swift 3 SF314-52G-89SL | |
| Lenovo IdeaPad 320s-14IKB | |
| Average NVIDIA GeForce 920MX () | |
| Asus VivoBook S14 S406UA-BV023T | |
| HP 14-bs007ng | |
| MSI CX61 2QC 2970M MS-16GD | |
| Geekbench 4.4 - Compute OpenCL Score | |
| Acer Swift 3 SF314-52G-89SL | |
| Average of class Office (15919 - 85960, n=17, last 2 years) | |
| Lenovo IdeaPad 320s-14IKB | |
| Average NVIDIA GeForce 920MX () | |
| Asus VivoBook S14 S406UA-BV023T | |
| HP 14-bs007ng | |
| MSI CX61 2QC 2970M MS-16GD | |
| GFXBench (DX / GLBenchmark) 2.7 | |
| 1920x1080 T-Rex Offscreen | |
| Lenovo IdeaPad 320s-14IKB | |
| HP ProBook 440 G4-Y8B51EA | |
| Average NVIDIA GeForce 920MX (103.1 - 127.3, n=2) | |
| Asus X302UV-FN016T | |
| MSI CX61 2QC 2970M MS-16GD | |
| Asus F555LJ-XX110H | |
| Average of class Office (38 - 210, n=4, last 2 years) | |
| T-Rex Onscreen | |
| Lenovo IdeaPad 320s-14IKB | |
| Average NVIDIA GeForce 920MX (60 - 117.9, n=2) | |
| Asus X302UV-FN016T | |
| Asus F555LJ-XX110H | |
| HP ProBook 440 G4-Y8B51EA | |
| MSI CX61 2QC 2970M MS-16GD | |
| Average of class Office (35 - 58, n=4, last 2 years) | |
| GFXBench 3.0 | |
| 1920x1080 1080p Manhattan Offscreen | |
| Lenovo IdeaPad 320s-14IKB | |
| HP ProBook 440 G4-Y8B51EA | |
| Average NVIDIA GeForce 920MX (55.7 - 70, n=2) | |
| Asus X302UV-FN016T | |
| MSI CX61 2QC 2970M MS-16GD | |
| Asus F555LJ-XX110H | |
| Average of class Office (18 - 24, n=3, last 2 years) | |
| on screen Manhattan Onscreen OGL | |
| Lenovo IdeaPad 320s-14IKB | |
| Average NVIDIA GeForce 920MX (58.9 - 62.1, n=2) | |
| Asus X302UV-FN016T | |
| MSI CX61 2QC 2970M MS-16GD | |
| HP ProBook 440 G4-Y8B51EA | |
| Asus F555LJ-XX110H | |
| Average of class Office (23 - 49, n=3, last 2 years) | |
| GFXBench 3.1 | |
| 1920x1080 Manhattan ES 3.1 Offscreen | |
| HP ProBook 440 G4-Y8B51EA | |
| Lenovo IdeaPad 320s-14IKB | |
| Average NVIDIA GeForce 920MX (42.8 - 52, n=2) | |
| Asus X302UV-FN016T | |
| MSI CX61 2QC 2970M MS-16GD | |
| Asus F555LJ-XX110H | |
| Average of class Office (8.2 - 85, n=4, last 2 years) | |
| on screen Manhattan ES 3.1 Onscreen | |
| Asus X302UV-FN016T | |
| MSI CX61 2QC 2970M MS-16GD | |
| Average NVIDIA GeForce 920MX (47.5 - 57.5, n=2) | |
| Lenovo IdeaPad 320s-14IKB | |
| Asus F555LJ-XX110H | |
| HP ProBook 440 G4-Y8B51EA | |
| Average of class Office (15 - 59, n=4, last 2 years) | |
| GFXBench | |
| 1920x1080 Car Chase Offscreen | |
| Average of class Office (9.1 - 198.6, n=5, last 2 years) | |
| HP ProBook 440 G4-Y8B51EA | |
| Lenovo IdeaPad 320s-14IKB | |
| Average NVIDIA GeForce 920MX (29.9 - 35.4, n=2) | |
| Asus X302UV-FN016T | |
| MSI CX61 2QC 2970M MS-16GD | |
| on screen Car Chase Onscreen | |
| Asus X302UV-FN016T | |
| MSI CX61 2QC 2970M MS-16GD | |
| Average NVIDIA GeForce 920MX (33.1 - 47.7, n=2) | |
| Average of class Office (9.3 - 60.1, n=5, last 2 years) | |
| HP ProBook 440 G4-Y8B51EA | |
| Lenovo IdeaPad 320s-14IKB | |
| ComputeMark v2.1 - 1024x600 Normal, Score | |
| Average of class Office (634 - 8754, n=4, last 2 years) | |
| HP ProBook 440 G4-Y8B51EA | |
| Asus F555LJ-XX110H | |
| Lenovo IdeaPad 320s-14IKB | |
| Average NVIDIA GeForce 920MX (1066 - 1212, n=2) | |
| Asus X302UV-FN016T | |
Gaming Performance
The CPU-GPU combination of the IdeaPad can run many video games smoothly at HD resolution (1366x768) on the low to medium quality settings. Non-demanding titles can be run smoothly at higher resolutions and with better graphical settings. Highly demanding titles like Assassin’s Creed Origins and Kingdom Come: Deliverance are not really playable.
The fast GDDR5 memory makes itself known in a positive fashion. The IdeaPad delivers 10 to 50% higher frame rates than the DDR3-based variants of the 920MX. The DDR3-based variants of the 930MX are frequently beaten as well.
| low | med. | high | ultra | |
| StarCraft 2 (2010) | 232.7 | 88.9 | 56.7 | 27.2 |
| The Elder Scrolls V: Skyrim (2011) | 81.2 | 57 | 43.1 | 23.3 |
| BioShock Infinite (2013) | 107.7 | 55.7 | 48.9 | 17.5 |
| Dota 2 Reborn (2015) | 83.3 | 68 | 36.4 | 33.5 |
| The Division (2016) | 34.6 | 22.1 | 9.4 | 7 |
| Overwatch (2016) | 90.4 | 60.3 | 27.3 | 15.4 |
| Deus Ex Mankind Divided (2016) | 20.8 | 14.8 | 8 | 4.9 |
| Battlefield 1 (2016) | 49.2 | 29.1 | 13.8 | 12.5 |
| Civilization VI (2016) | 52.3 | 25.4 | 9.9 | 5.6 |
| Farming Simulator 17 (2016) | 135.7 | 87.3 | 36.7 | 23.8 |
| Titanfall 2 (2016) | 46.3 | 33.6 | 13.8 | 12 |
| Resident Evil 7 (2017) | 56.4 | 26.5 | 13.9 | 6 |
| For Honor (2017) | 46.7 | 16.3 | 15.4 | 11.5 |
| Ghost Recon Wildlands (2017) | 27.6 | 11.2 | 10 | 3 |
| Prey (2017) | 58 | 22.3 | 17.5 | 14.3 |
| Rocket League (2017) | 121.5 | 43.7 | 29 | |
| Dirt 4 (2017) | 62.4 | 25.2 | 13 | 7.9 |
| Team Fortress 2 (2017) | 86 | 81 | 69 | 54 |
| F1 2017 (2017) | 41 | 18 | 15 | 13 |
| FIFA 18 (2017) | 110.4 | 63.8 | 54.2 | 50 |
| Middle-earth: Shadow of War (2017) | 33 | 13 | 9 | 7 |
| The Evil Within 2 (2017) | 17.9 | 9.2 | 8.1 | 6.1 |
| ELEX (2017) | 25.1 | 11.9 | 9.3 | 6.4 |
| Destiny 2 (2017) | 43.6 | 25.9 | 23.6 | 18 |
| Assassin´s Creed Origins (2017) | 22 | 10 | 8 | 6 |
| Call of Duty WWII (2017) | 53.7 | 33.1 | 16.3 | 11.9 |
| Need for Speed Payback (2017) | 30.4 | 15.3 | 12.2 | 11.6 |
| Star Wars Battlefront 2 (2017) | 45.4 | 12.8 | 10.5 | 8.9 |
| Fortnite (2018) | 76.7 | 21.2 | 14.5 | 11.4 |
| Final Fantasy XV Benchmark (2018) | 17.3 | 8.2 | 5 | |
| Kingdom Come: Deliverance (2018) | 23.8 | 9.6 | 8.1 | 5.9 |
| The Elder Scrolls V: Skyrim - 1366x768 High Preset AA:8x AF:8x | |
| Lenovo IdeaPad 320s-14IKB | |
| Average NVIDIA GeForce 920MX () | |
| Asus F555LJ-XX110H | |
| Team Fortress 2 - 1920x1080 maximum AA:8x MS AF:16x | |
| Lenovo IdeaPad 320s-14IKB | |
| Average NVIDIA GeForce 920MX () | |
| HP ProBook 470 G5 | |
| FIFA 18 - 1920x1080 Ultra Preset AA:4xMS | |
| Lenovo IdeaPad 320s-14IKB | |
| Average NVIDIA GeForce 920MX () | |
| HP ProBook 470 G5 | |
| Overwatch - 1366x768 Medium (Render Scale 100 %) AA:FX AF:2x | |
| Lenovo IdeaPad 320s-14IKB | |
| Average NVIDIA GeForce 920MX () | |
| HP ProBook 470 G5 | |
| MSI CX61 2QC 2970M MS-16GD | |
| Rocket League - 1920x1080 Quality AA:Medium FX | |
| Lenovo IdeaPad 320s-14IKB | |
| Average NVIDIA GeForce 920MX () | |
| MSI CX61 2QC 2970M MS-16GD | |
| HP ProBook 470 G5 | |
Emissions & Energy Management
System Noise
No matter the load, the IdeaPad does not produce too much noise. When idle, the fan often stands still. It works with a low speed and is practically inaudible. Under load, the fan does not spin very fast. During the stress test, the noise level peaked at 36.2 dB(A). No unusual noises are coming from the notebook.
Noise Level
| Idle |
| 30.8 / 30.8 / 30.8 dB(A) |
| Load |
| 35.5 / 36.2 dB(A) |
 | ||
30 dB silent 40 dB(A) audible 50 dB(A) loud |
||
min: | ||
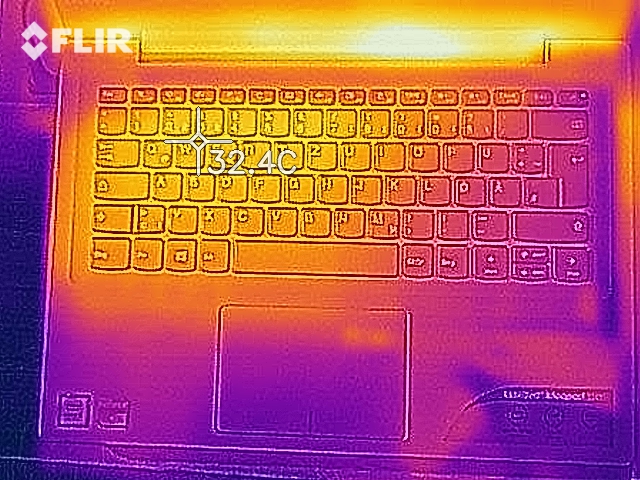
Temperature

In our stress test (Prime95 and FurMark running for one straight hour), the IdeaPad gets the same results both when running on battery power and when plugged in. The processor runs constantly at 2.5 GHz while the core clock of the GPU fluctuates between 950 and 980 MHz.
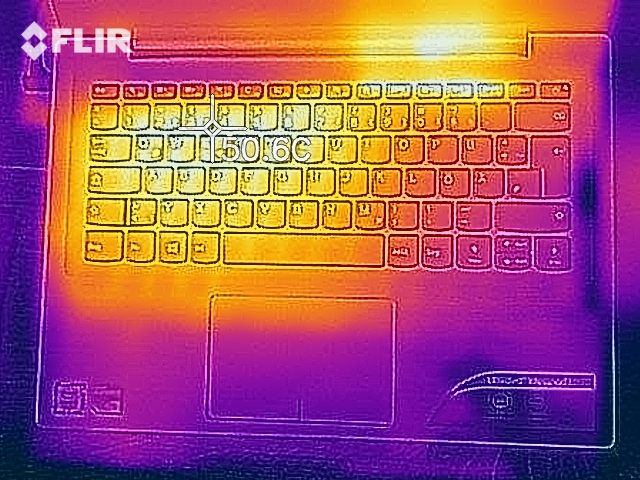
The laptop does not get particularly hot. During the stress test, the 40-degree Celsius (104 Fahrenheit) mark is exceeded at a few measurement points.
(-) The maximum temperature on the upper side is 45.2 °C / 113 F, compared to the average of 34.2 °C / 94 F, ranging from 21.2 to 62.5 °C for the class Office.
(±) The bottom heats up to a maximum of 40 °C / 104 F, compared to the average of 36.7 °C / 98 F
(+) In idle usage, the average temperature for the upper side is 25.8 °C / 78 F, compared to the device average of 29.5 °C / 85 F.
(+) The palmrests and touchpad are cooler than skin temperature with a maximum of 28 °C / 82.4 F and are therefore cool to the touch.
(±) The average temperature of the palmrest area of similar devices was 27.7 °C / 81.9 F (-0.3 °C / -0.5 F).


Speakers
Lenovo IdeaPad 320s-14IKB audio analysis
(-) | not very loud speakers (63.3 dB)
Bass 100 - 315 Hz
(±) | reduced bass - on average 9.6% lower than median
(±) | linearity of bass is average (8% delta to prev. frequency)
Mids 400 - 2000 Hz
(+) | balanced mids - only 2.2% away from median
(+) | mids are linear (6.2% delta to prev. frequency)
Highs 2 - 16 kHz
(+) | balanced highs - only 2.7% away from median
(±) | linearity of highs is average (12.2% delta to prev. frequency)
Overall 100 - 16.000 Hz
(±) | linearity of overall sound is average (15.1% difference to median)
Compared to same class
» 10% of all tested devices in this class were better, 4% similar, 86% worse
» The best had a delta of 7%, average was 22%, worst was 53%
Compared to all devices tested
» 17% of all tested devices were better, 4% similar, 79% worse
» The best had a delta of 4%, average was 25%, worst was 134%
Apple MacBook 12 (Early 2016) 1.1 GHz audio analysis
(+) | speakers can play relatively loud (83.6 dB)
Bass 100 - 315 Hz
(±) | reduced bass - on average 11.3% lower than median
(±) | linearity of bass is average (14.2% delta to prev. frequency)
Mids 400 - 2000 Hz
(+) | balanced mids - only 2.4% away from median
(+) | mids are linear (5.5% delta to prev. frequency)
Highs 2 - 16 kHz
(+) | balanced highs - only 2% away from median
(+) | highs are linear (4.5% delta to prev. frequency)
Overall 100 - 16.000 Hz
(+) | overall sound is linear (10.2% difference to median)
Compared to same class
» 5% of all tested devices in this class were better, 2% similar, 93% worse
» The best had a delta of 5%, average was 19%, worst was 53%
Compared to all devices tested
» 3% of all tested devices were better, 1% similar, 96% worse
» The best had a delta of 4%, average was 25%, worst was 134%
Frequency diagram in comparison (checkboxes can be checked and unchecked!)
Energy Consumption
When idle, the IdeaPad consumes very little energy. Here, the power draw peaks at 6.7 watts. During the stress test (Prime95 and FurMark running for one straight hour), the energy consumption reaches 52.7 watts. The nominal power draw of the AC adapter is 65 watts.
| Off / Standby | |
| Idle | |
| Load |
|
Battery Life
Our practically oriented Wi-Fi test simulates loads that are consistent with surfing the web. The “balanced” power plan is selected, the display brightness set to 150 cd/m² and the energy-saving functions are turned off. The IdeaPad achieves a battery runtime of eight hours and fifty minutes. Therefore, it lasts seventy minutes longer than the previously reviewed sibling model (7 hours 40 minutes). However, it should be noted that our current review device has a battery with a much larger capacity (52.5 Wh) than its sibling model (30 Wh).
Pros
Cons
Verdict
The IdeaPad 320s-14IKB represents a chic, mobile, work-oriented device in the 14-inch form factor. The Core i5 processor offers more than enough performance for such usage scenarios as office work and Internet browsing. The dedicated graphics card allows users to play video games, albeit to a limited extent.
The Lenovo IdeaPad can be portrayed, by and large, as a success. A brighter display and a keyboard backlight would have been a nice touch.
An SSD creates a very responsive system. The replacement of the SSD is possible. For this, you will have to open up the device, though. In addition to the 2.5-inch SSD slot, there is an empty M.2-2280 slot inside the device. Therefore, two SDDs can be put inside the device. Alternatively, you can go for an SSD/HDD combination.
The built-in keyboard has left a good impression, and it is quite suitable for people who have to type a lot. However, it lacks a backlight. The good battery runtimes impress. The IPS screen delights users with great viewing angles and good contrast. However, the display brightness is too low.
Some criticism arises from the fact that the laptop comes with only one RAM slot. Lenovo forgoes the opportunity to enable dual-channel mode and, therefore, leaves some performance on the table.
Lenovo IdeaPad 320s-14IKB
-
02/20/2018 v6(old)
Sascha Mölck
Pricecompare
