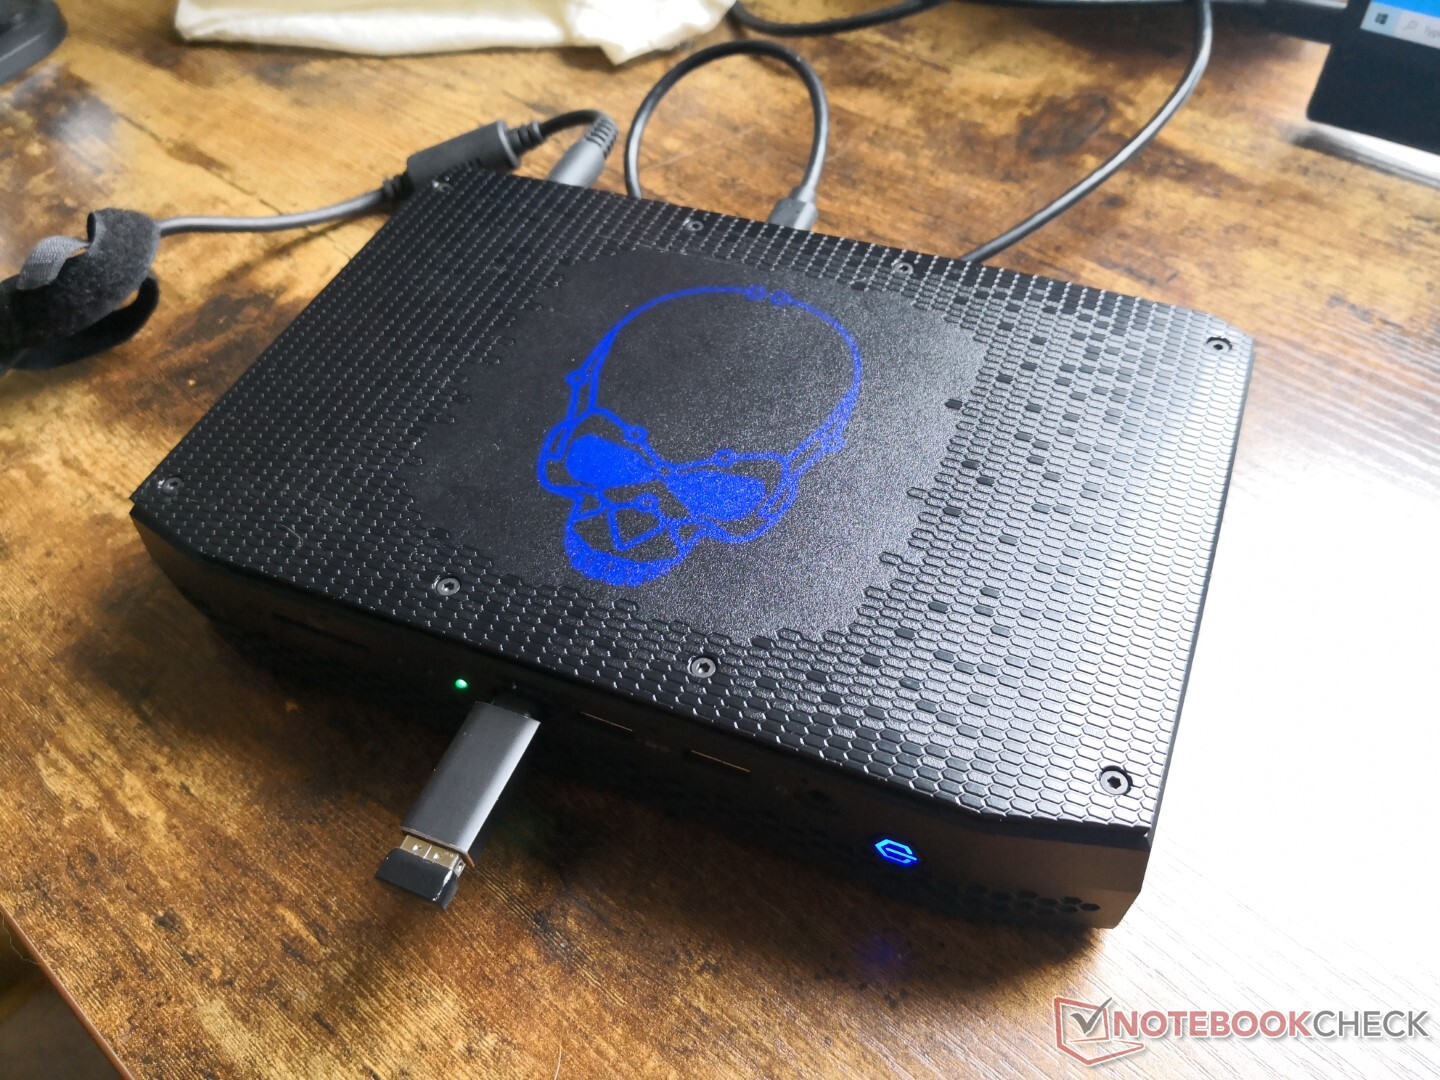
Kaby Lake-G Is History: Intel Phantom Canyon NUC11PHKi7C Review
 vs. 2018 Intel Hades Canyon (right)")
(April 26, 2021 update: We are confirming with Intel whether or not the NUC11PHK supports G-Sync and if the blue LED-lit skull can be changed to different colors. The page will be updated once we have the information.)
(May 2, 2021 update: Intel has confirmed that the LED is customizable via the software here. Additionally, G-Sync is supported, but Intel did not clarify if all ports or only some ports support the feature.)
Unlike the slower and less expensive NUC11TNK or NUC11PAQ, the NUC11PHK Phantom Canyon comes standard with a discrete GeForce RTX 2060 GPU for significantly faster graphics performance and gaming potential. It directly succeeds the NUC8 Hades Canyon and not the NUC9 Extreme as its chassis more closely resembles the former and not the latter.
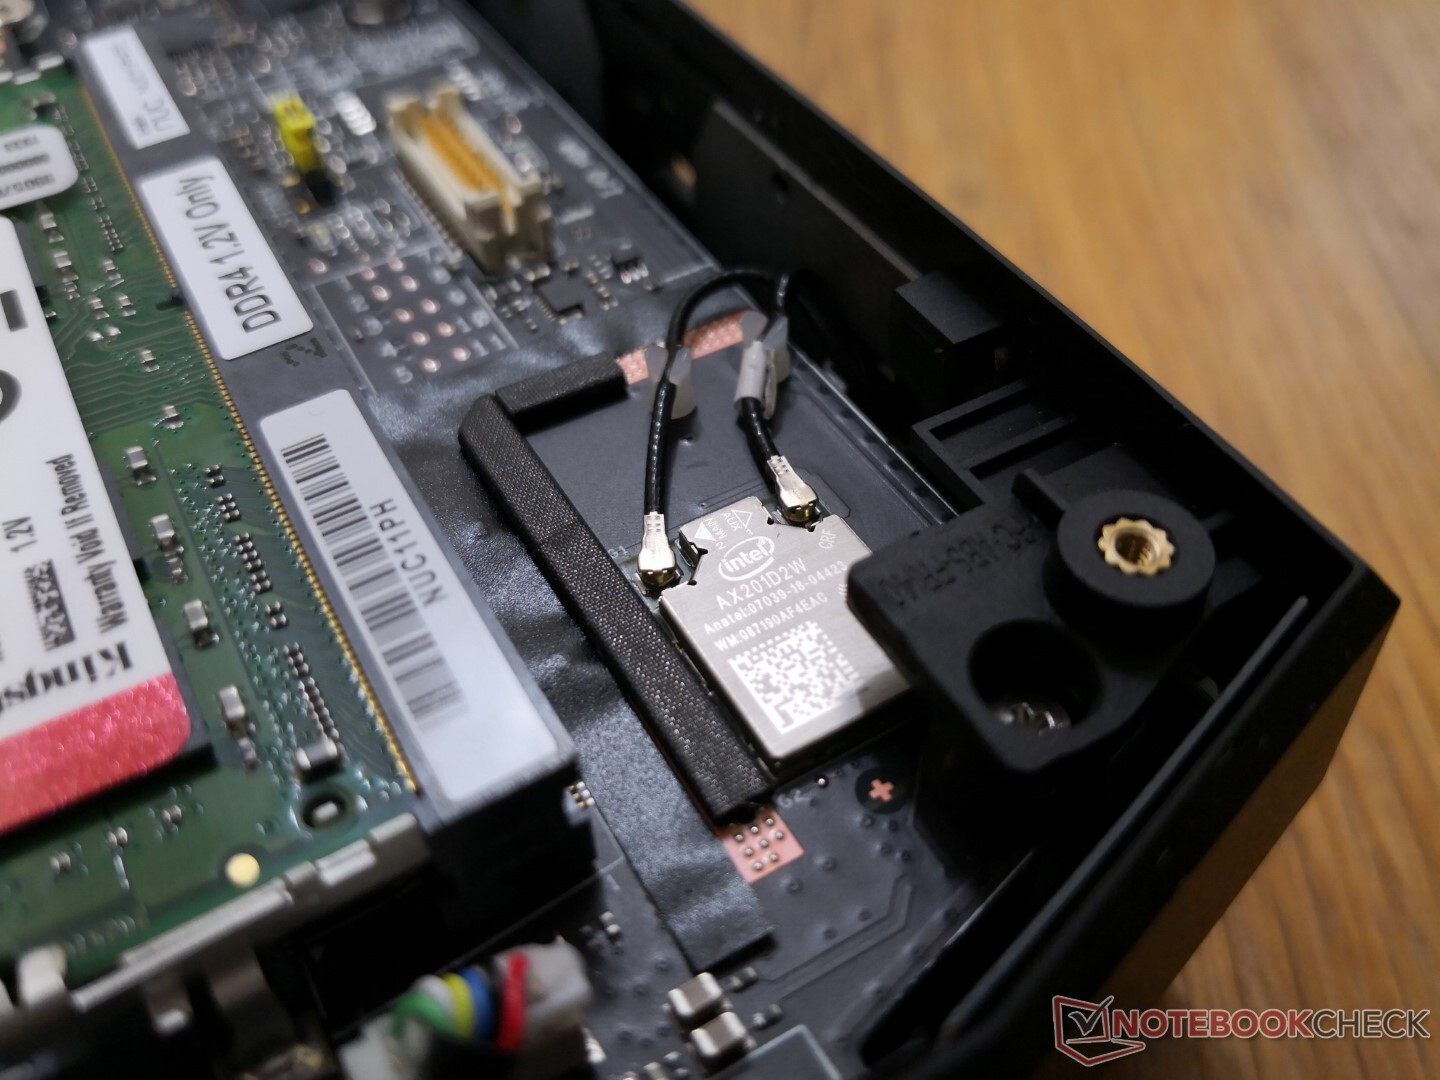
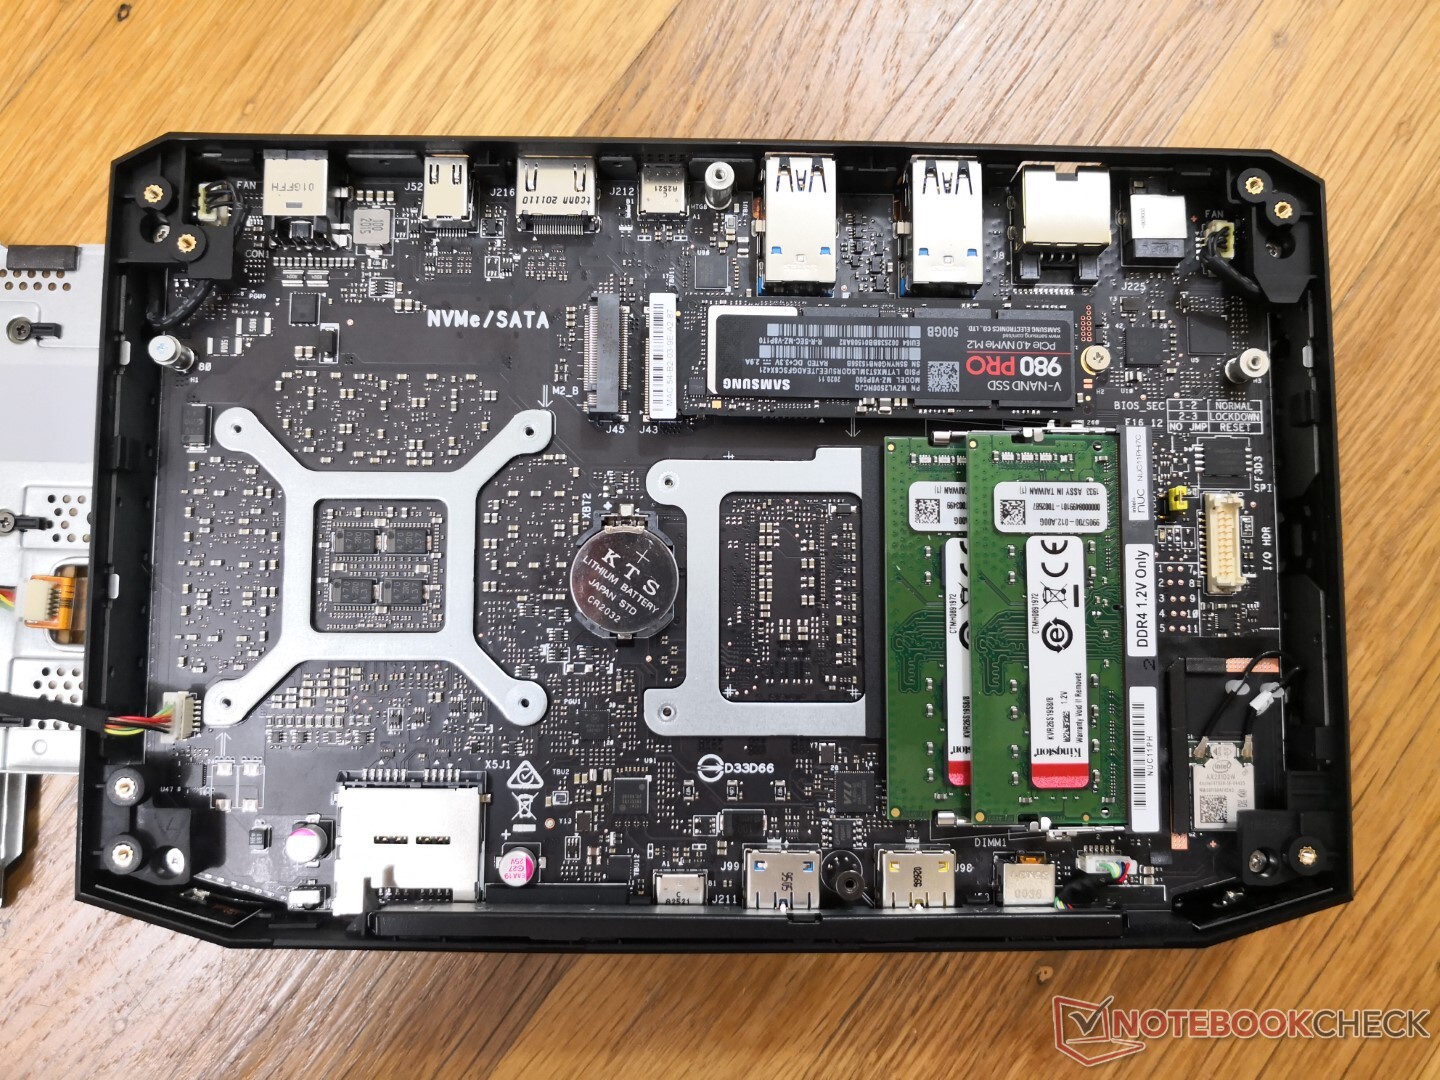
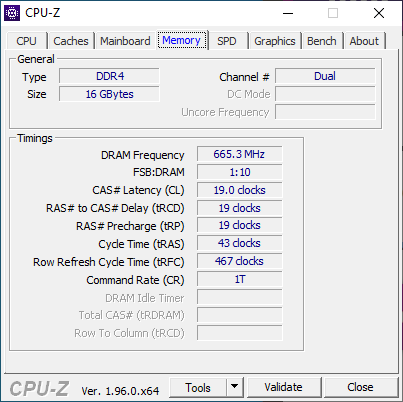
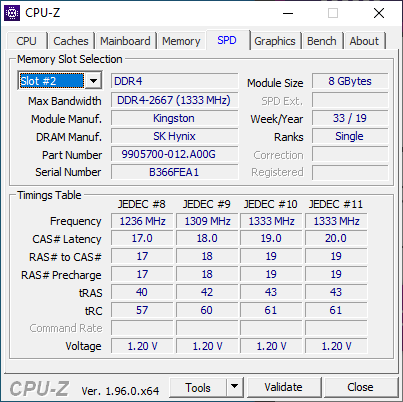
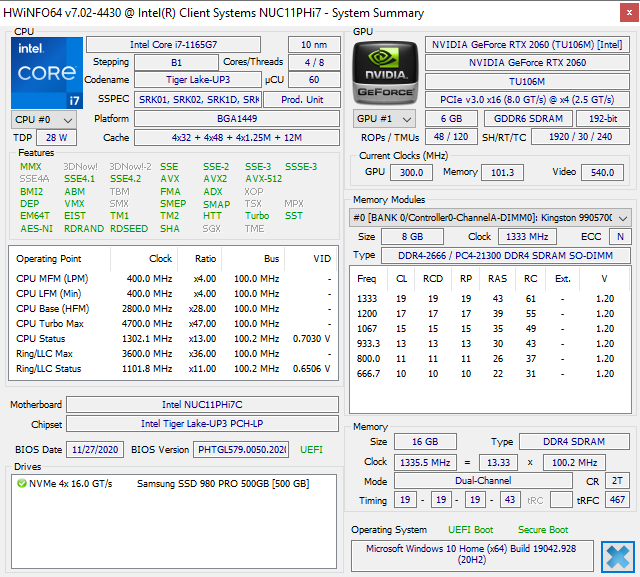
Phantom Canyon ships as a barebones kit and so we elected to install a Samsung 980 Pro NVMe SSD with 16 GB of DDR4-2666 dual-channel RAM for our reviewing purposes. The NUC itself can support faster RAM of up to 3200 MHz.
More Intel NUC reviews:
potential competitors in comparison
Rating | Date | Model | Weight | Height | Size | Resolution | Price |
|---|---|---|---|---|---|---|---|
v (old) | 04 / 2021 | Intel NUC11PHKi7C i7-1165G7, GeForce RTX 2060 Mobile | 1.4 kg | 42 mm | x | ||
v (old) | 03 / 2018 | Intel Hades Canyon NUC8i7HVK i7-8809G, Vega M GH | 1.3 kg | 39 mm | x | ||
v (old) | 02 / 2021 | Intel NUC11PAQi7 i7-1165G7, Iris Xe G7 96EUs | 647 g | 56 mm | x | ||
v (old) | 03 / 2021 | GMK NucBox 2 i5-8259U, Iris Plus Graphics 655 | 430 g | 50 mm | x | ||
v (old) | 03 / 2018 | Zotac ZBOX Magnus EK71080 i7-7700HQ, GeForce GTX 1080 (Desktop) | 3.3 kg | 128 mm | 0.00" | x | |
v (old) | 02 / 2021 | Aorus Gaming Box GeForce RTX 2080 Ti i7-1165G7 | 3.8 kg | 140 mm | x | ||
v (old) | 08 / 2020 | Beelink GTR35 II-G-16512D00W64PRO-1T R5 3550H, Vega 8 | 843 g | 39 mm | x |
Case
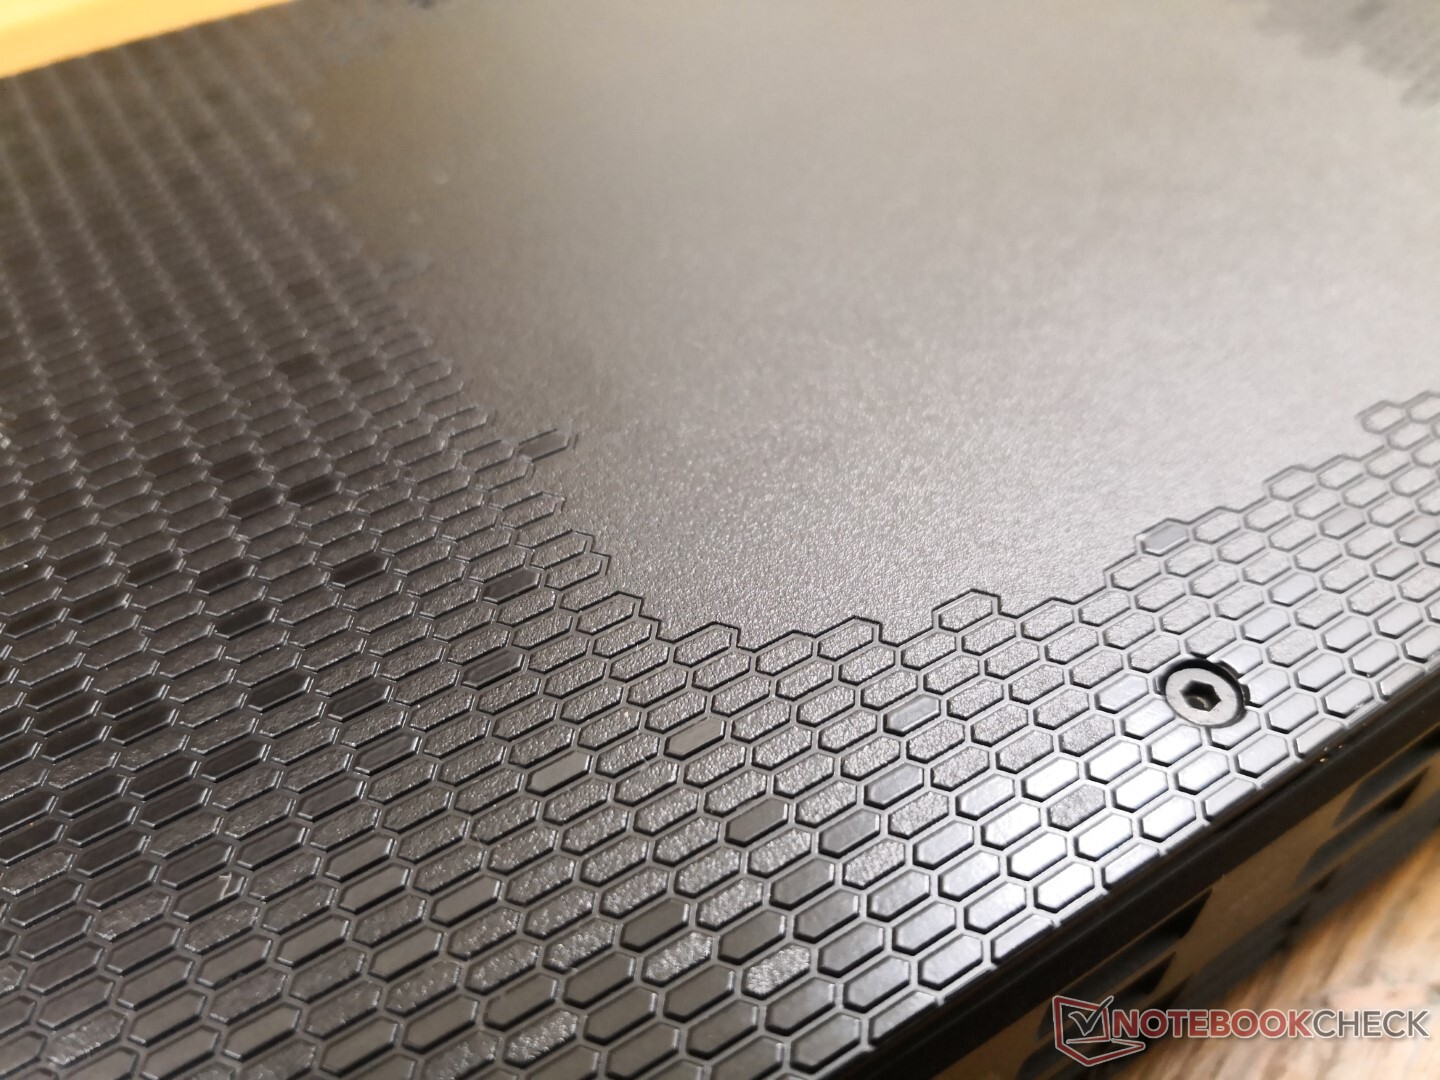
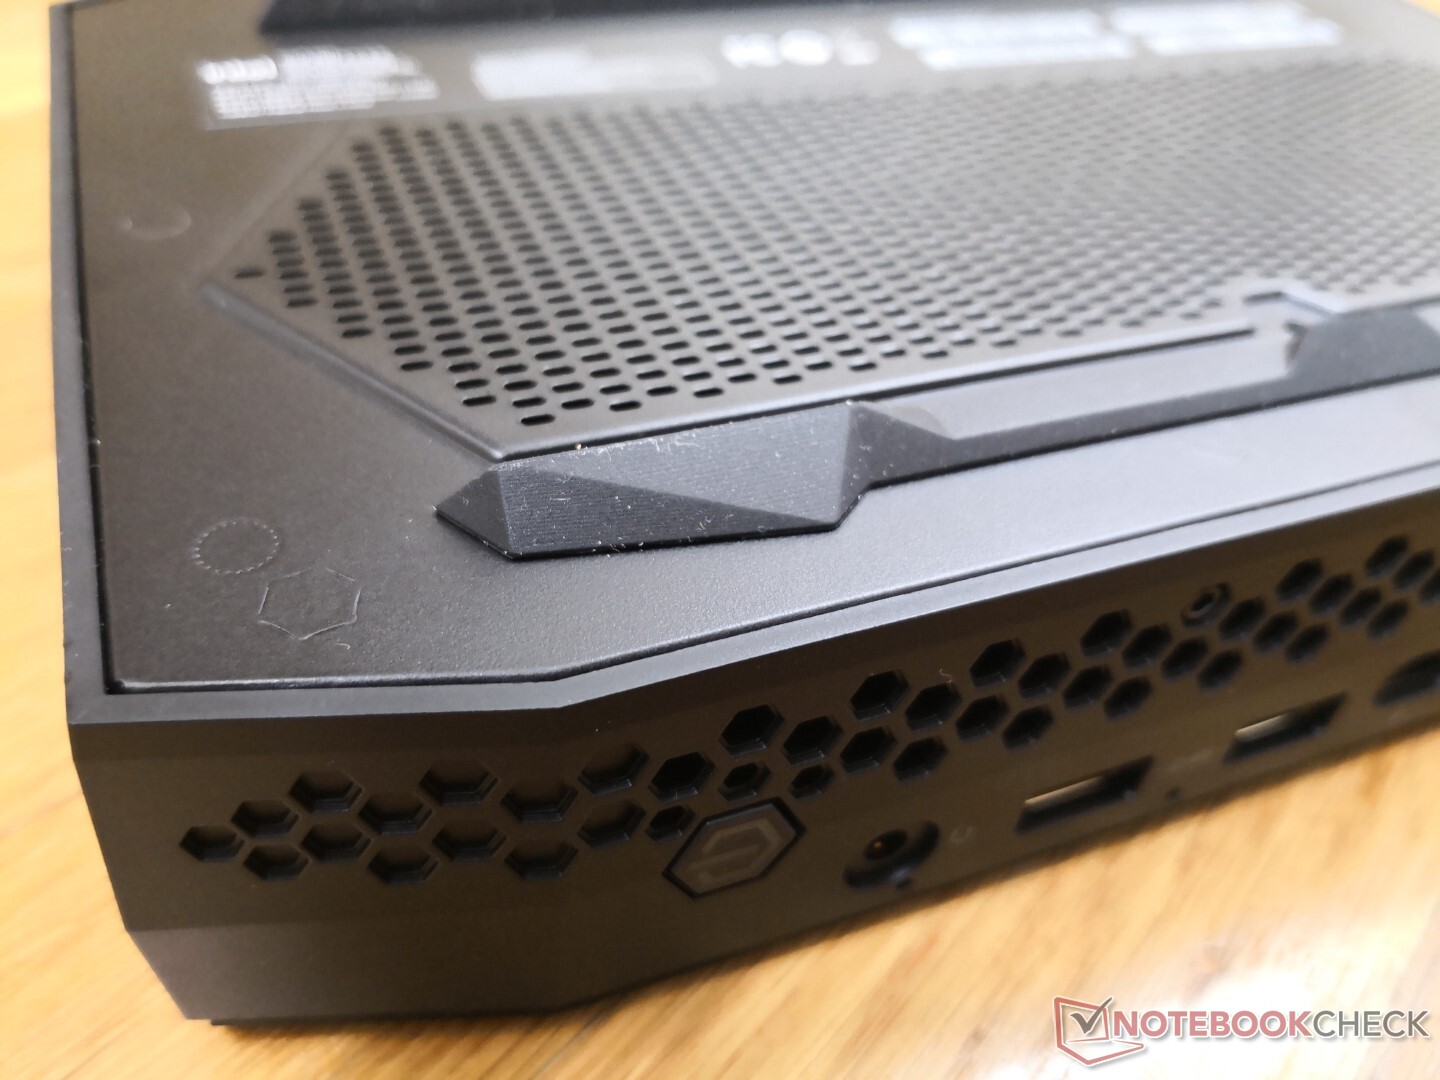
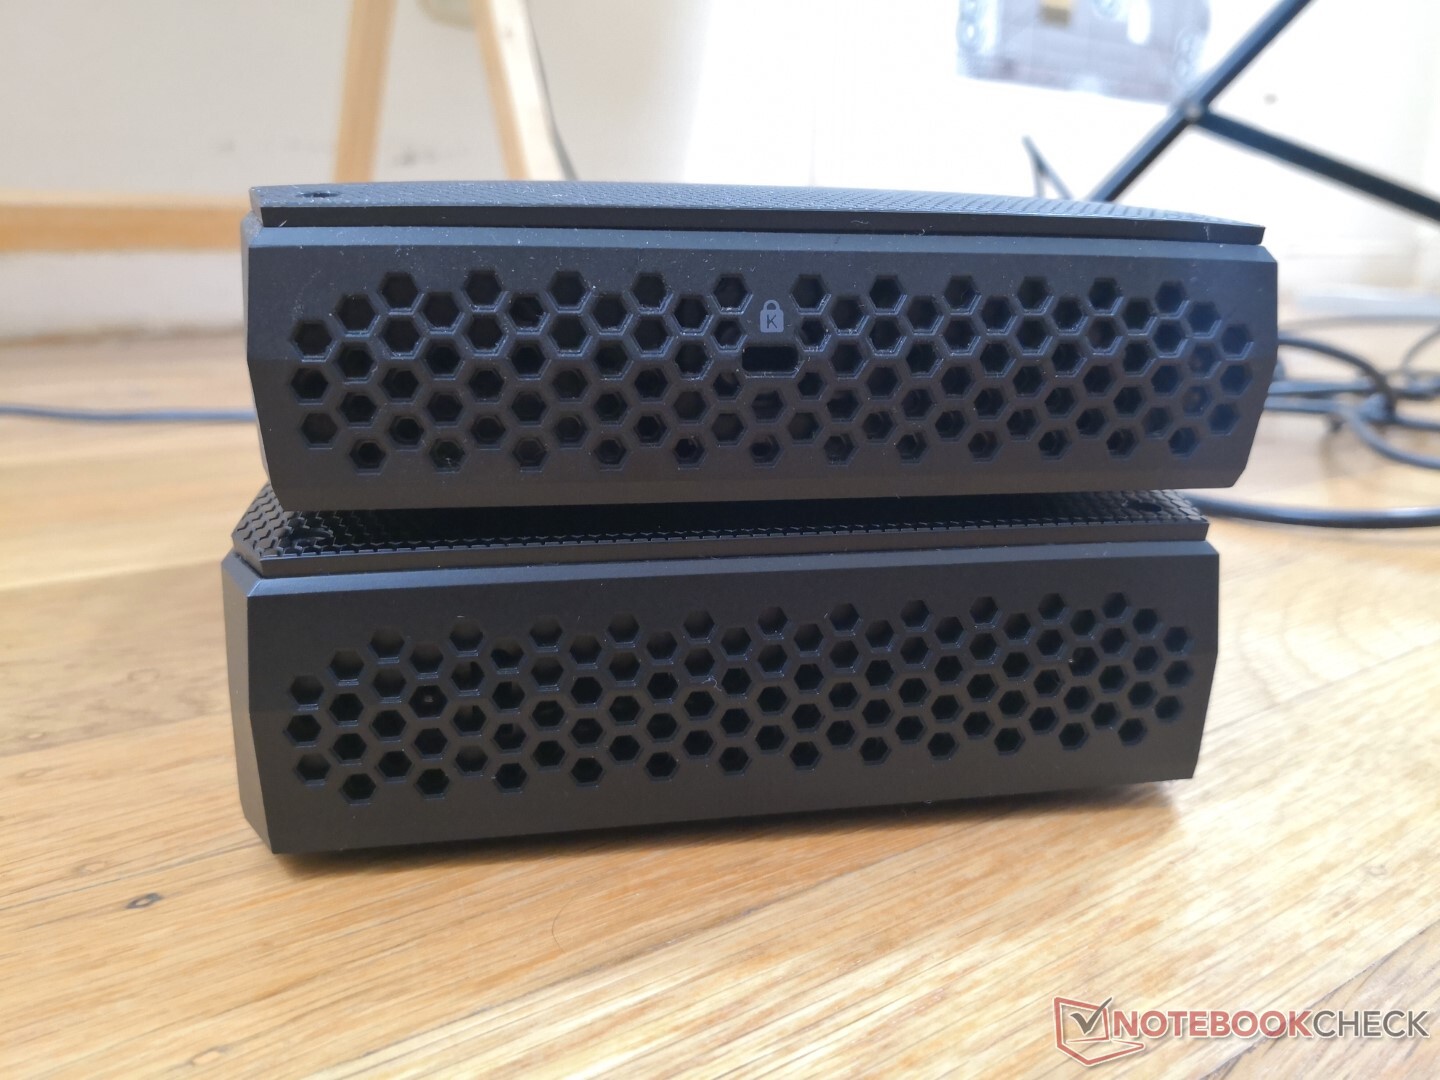
Chassis materials and size are essentially the same as on the Hades Canyon NUC with just slight cosmetic changes to textures and ventilation grilles. However, Phantom Canyon is slightly thicker (42 mm vs. 39 mm) and heavier (1.4 kg vs. 1.3 kg) than its immediate predecessor in order to better accommodate the more power-hungry processors and for the new removable LED-lit face plate.

Connectivity
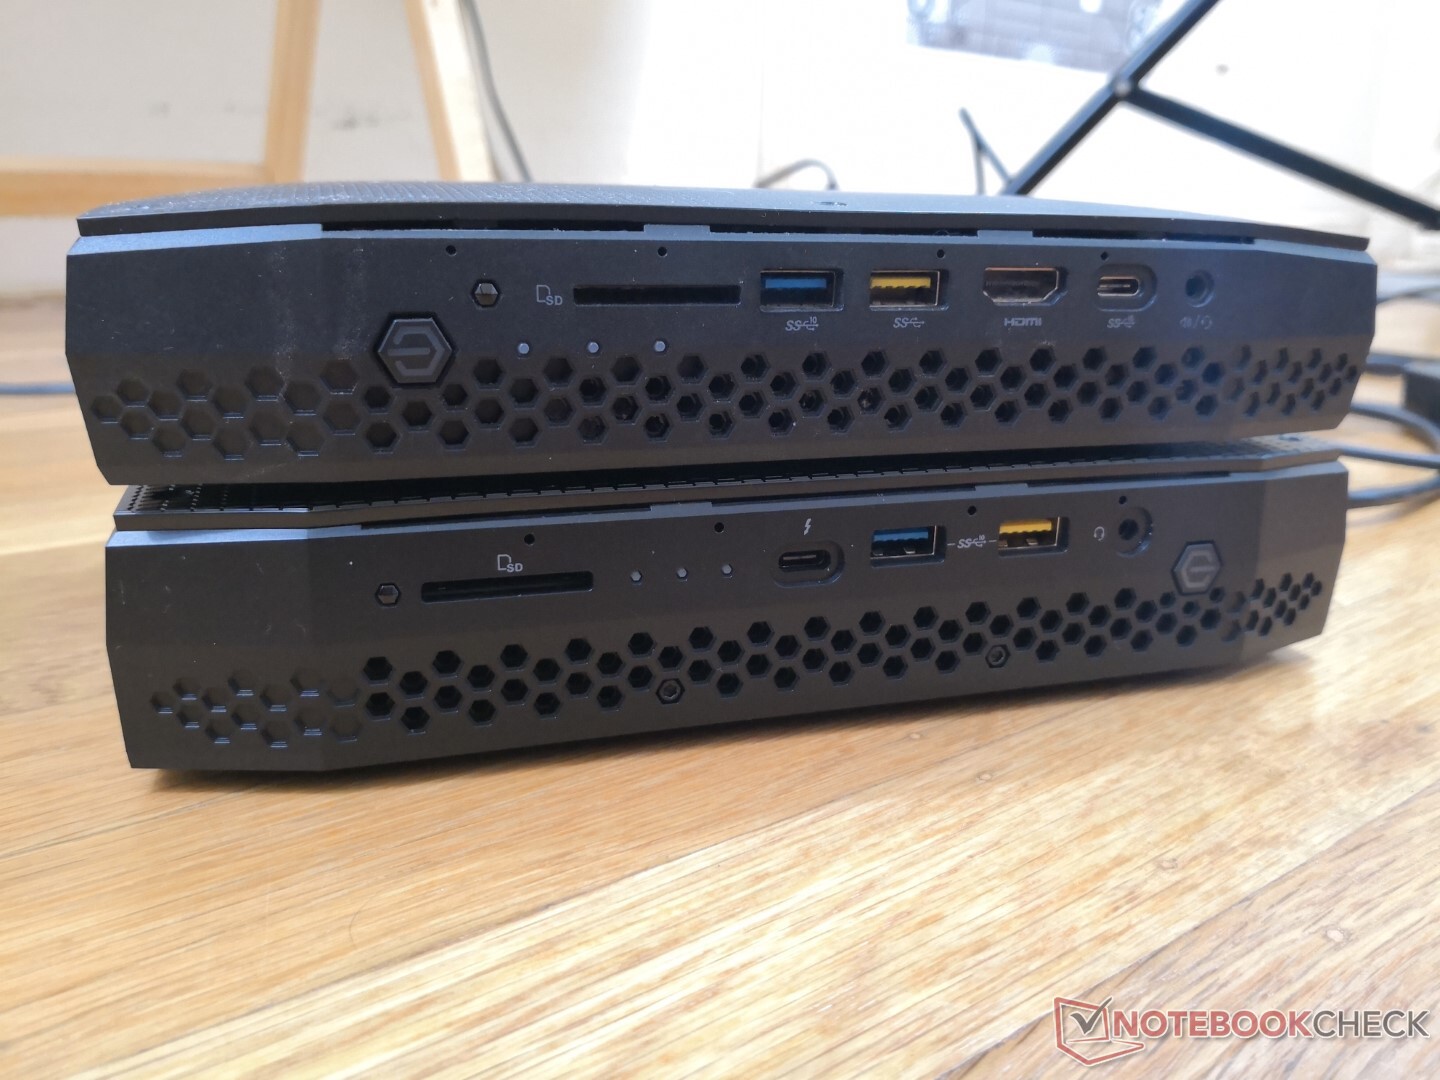
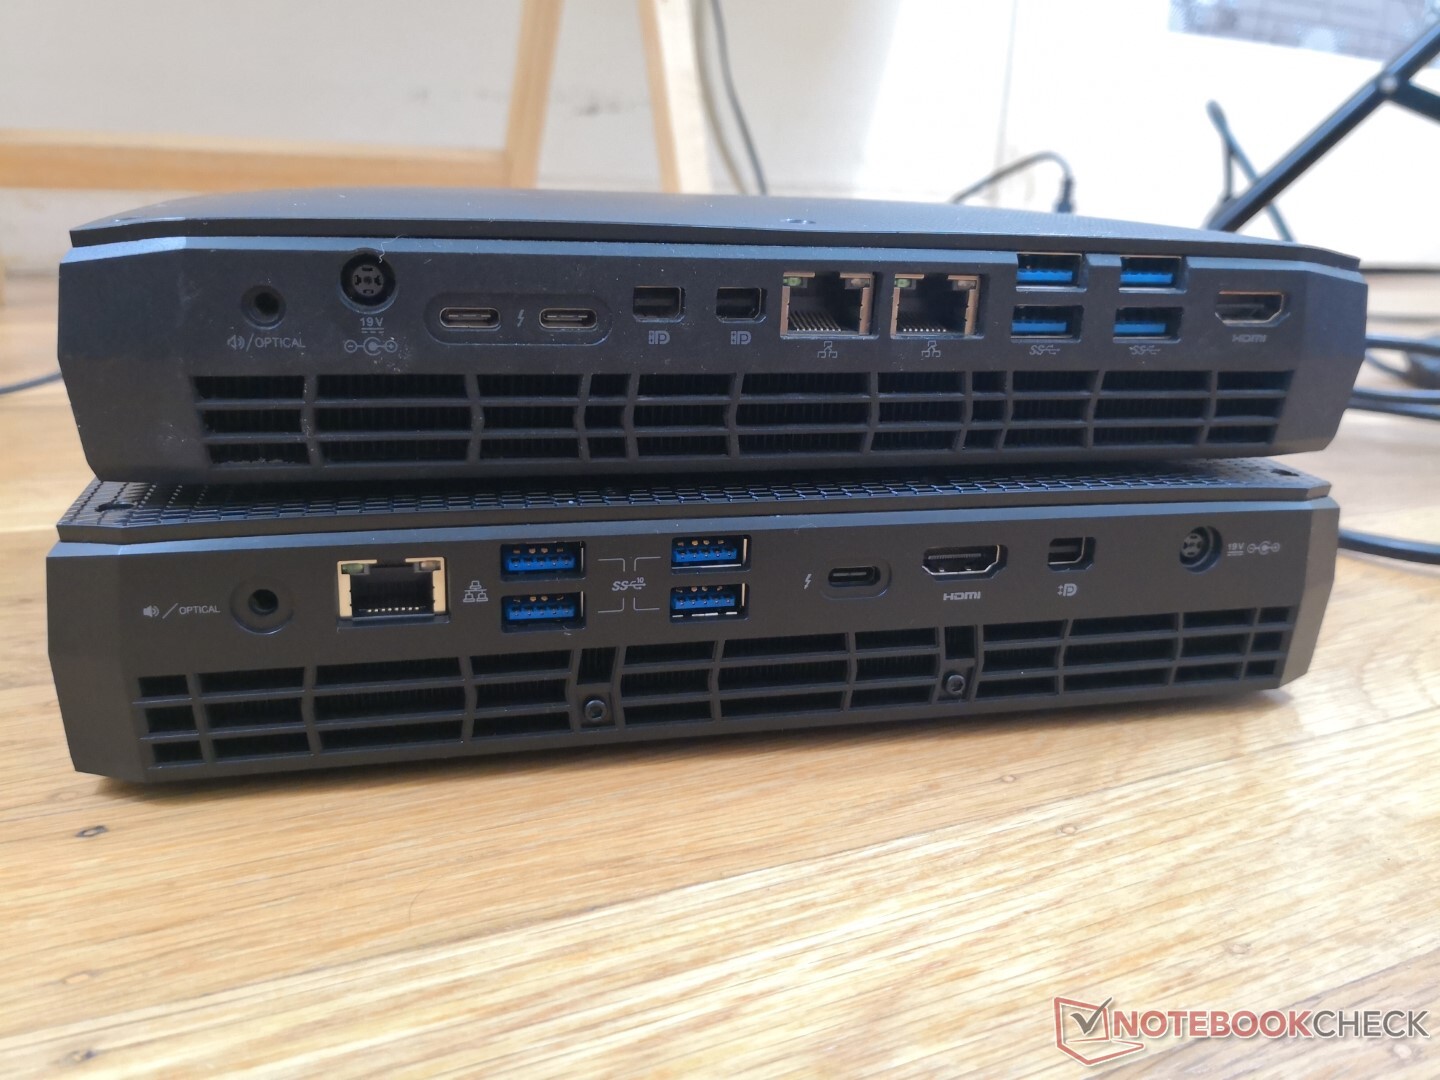
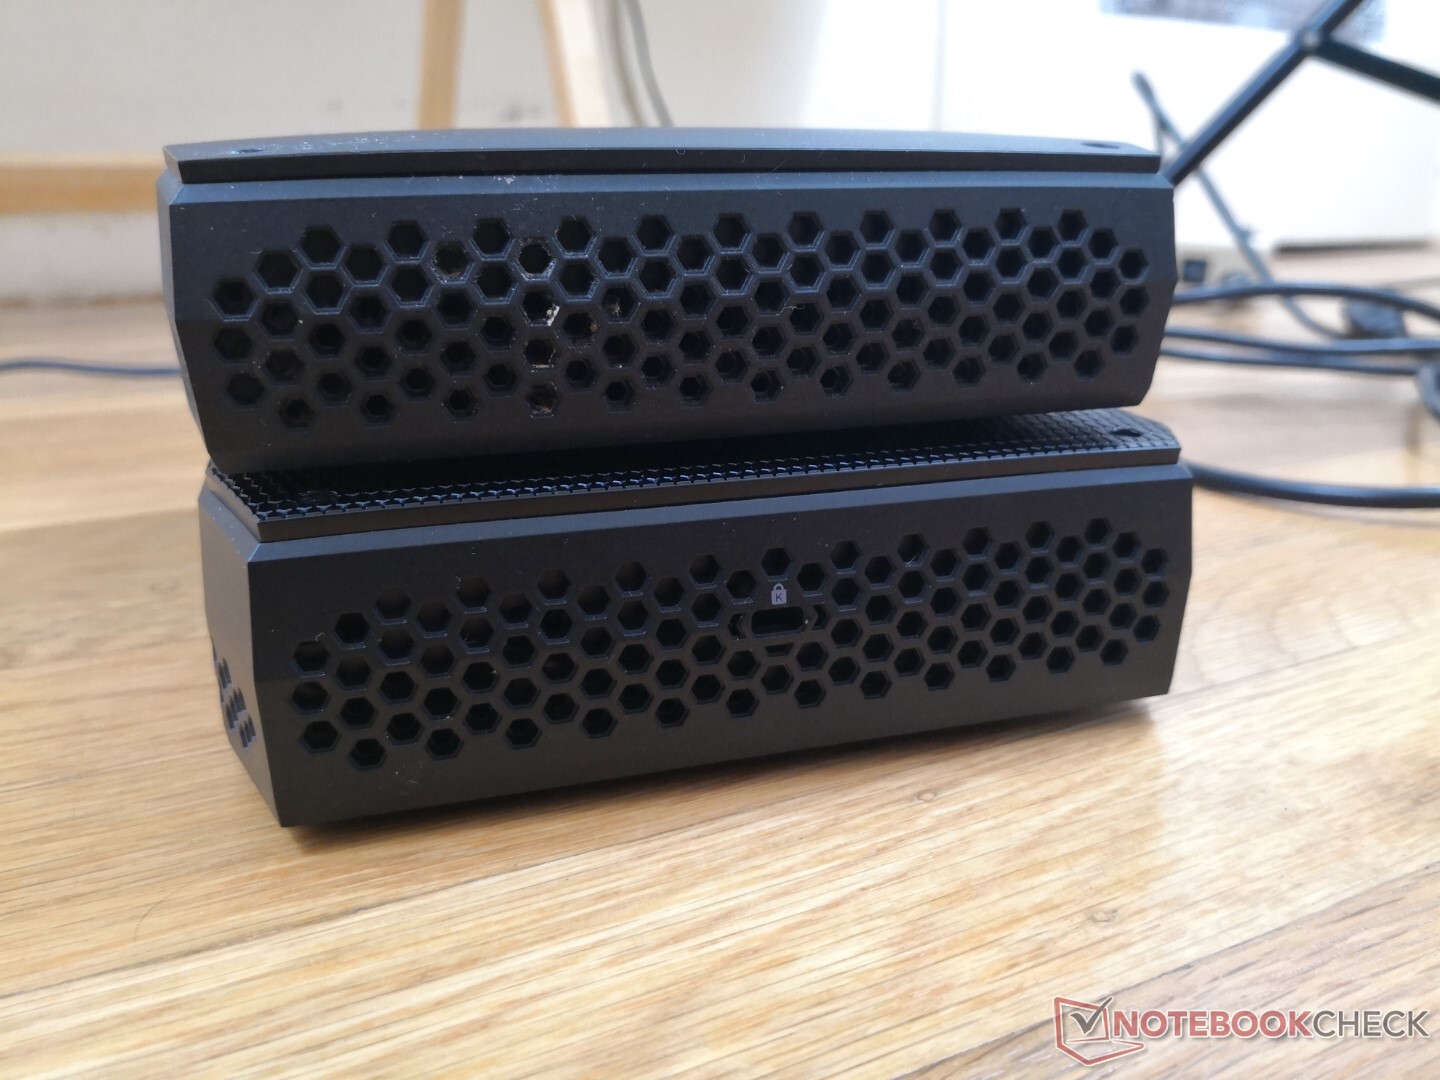
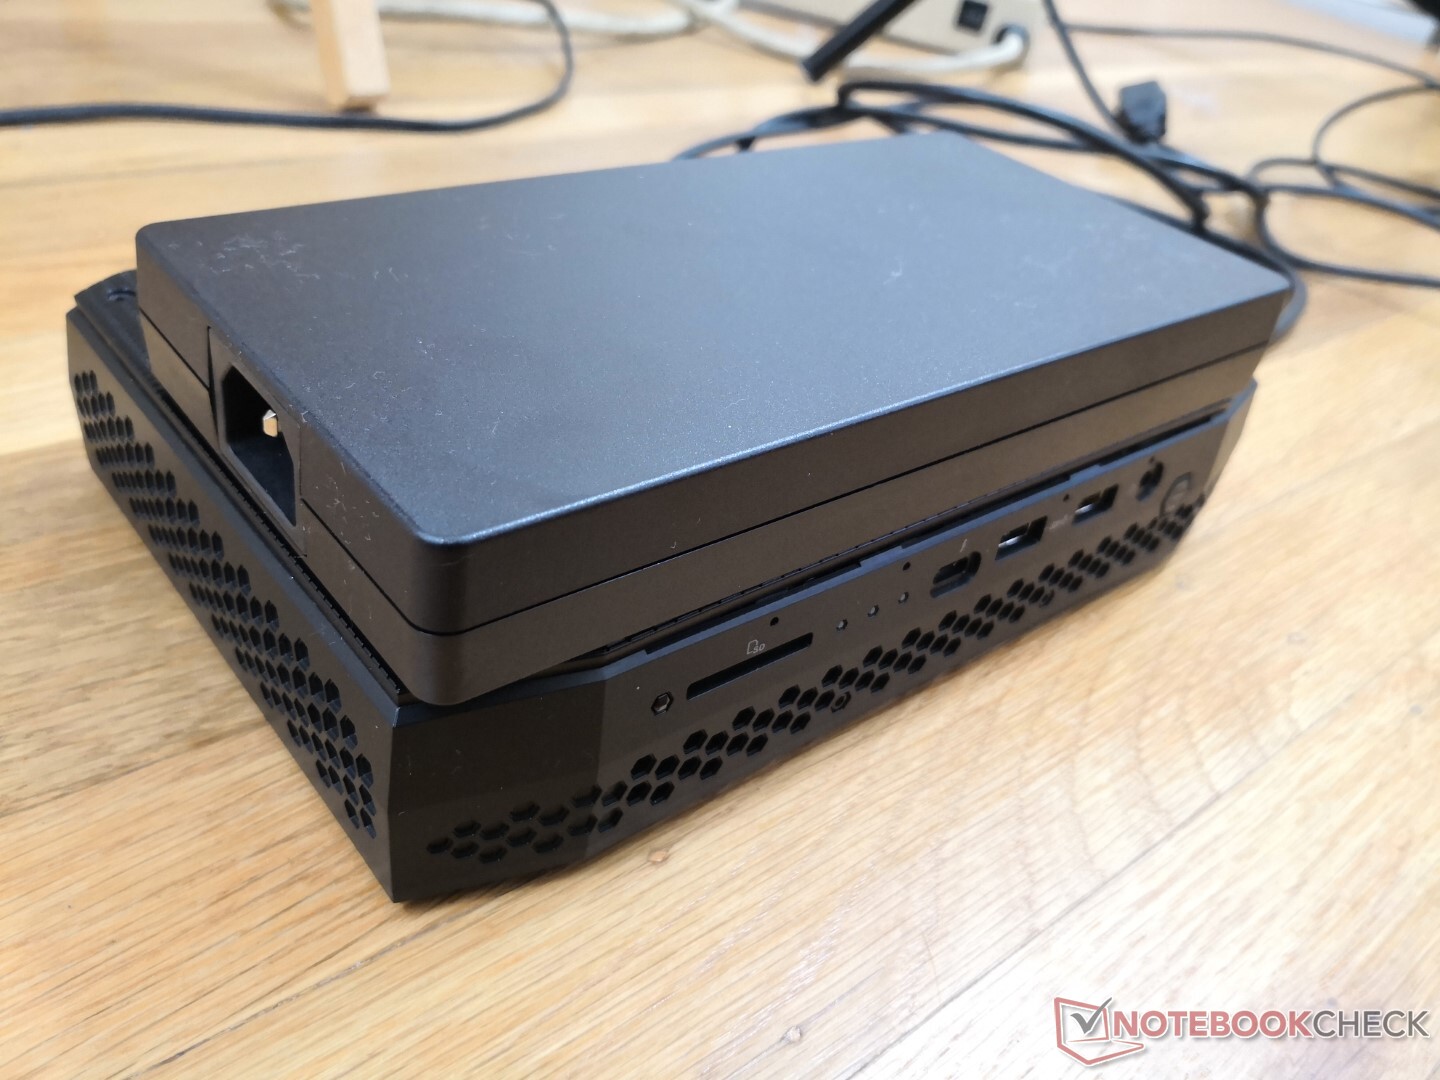
Port options have changed from the 2018 Hades Canyon. There is now just one RJ-45 port, one HDMI port, one mini-DisplayPort, and two USB-C w/ Thunderbolt 4 instead of two RJ-45, two HDMI, two mini-DisplayPort, and three USB-C on the previous model. All six USB-A ports remain.
The NUC cannot be powered by USB-C and even if it could, it would require more juice to run than the 100 W USB-C limit.
The images below compare the NUC8 Hades Canyon (top) against the NUC11 Phantom Canyon (bottom).
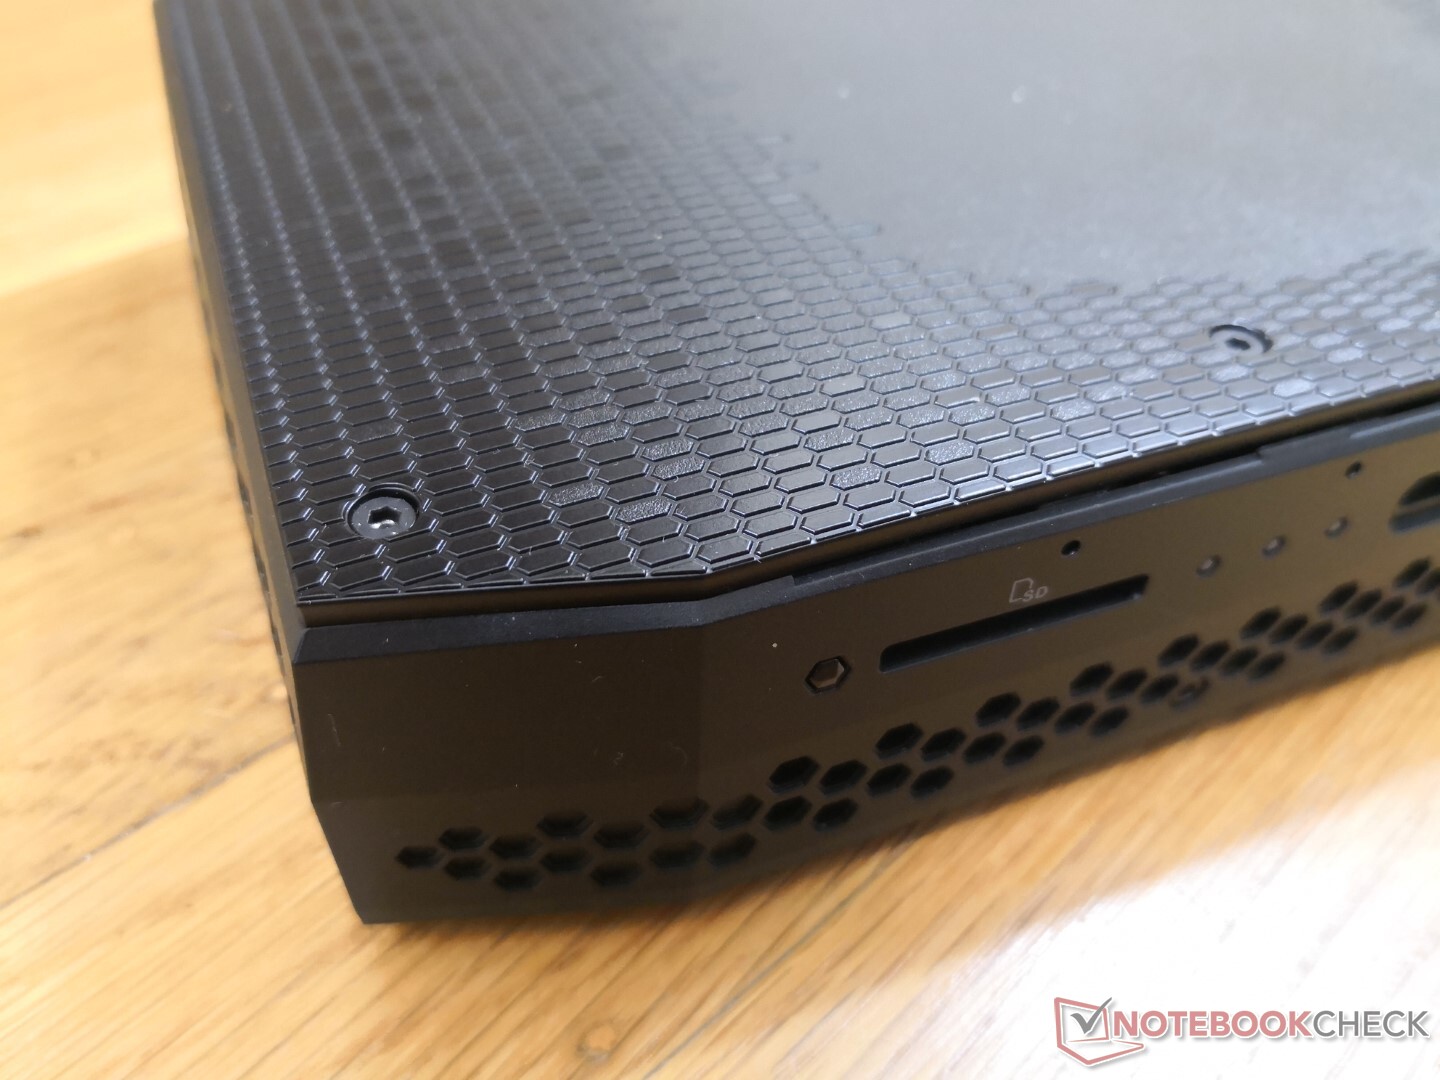
SD Card Reader
The integrated SD reader offers faster transfer rates than the card reader on Hades Canyon. It is not spring-loaded unlike on most laptops.
| SD Card Reader | |
| average JPG Copy Test (av. of 3 runs) | |
| Intel NUC11PAQi7 (Toshiba Exceria Pro SDXC 64 GB UHS-II) | |
| Intel NUC11PHKi7C (Toshiba Exceria Pro SDXC 64 GB UHS-II) | |
| Intel Hades Canyon NUC8i7HVK (Toshiba Exceria Pro SDXC 64 GB UHS-II) | |
| Zotac ZBOX Magnus EK71080 (Toshiba Exceria Pro SDXC 64 GB UHS-II) | |
| GMK NucBox 2 (Toshiba Exceria Pro M501 UHS-II) | |
| maximum AS SSD Seq Read Test (1GB) | |
| Intel NUC11PHKi7C (Toshiba Exceria Pro SDXC 64 GB UHS-II) | |
| Intel NUC11PAQi7 (Toshiba Exceria Pro SDXC 64 GB UHS-II) | |
| Intel Hades Canyon NUC8i7HVK (Toshiba Exceria Pro SDXC 64 GB UHS-II) | |
| Zotac ZBOX Magnus EK71080 (Toshiba Exceria Pro SDXC 64 GB UHS-II) | |
| GMK NucBox 2 (Toshiba Exceria Pro M501 UHS-II) | |
Communication
| Networking | |
| iperf3 transmit AX12 | |
| Intel NUC11PHKi7C | |
| Intel NUC11PAQi7 | |
| GMK NucBox 2 | |
| Intel Hades Canyon NUC8i7HVK | |
| Zotac ZBOX Magnus EK71080 | |
| iperf3 receive AX12 | |
| Intel NUC11PHKi7C | |
| Intel NUC11PAQi7 | |
| GMK NucBox 2 | |
| Intel Hades Canyon NUC8i7HVK | |
| Zotac ZBOX Magnus EK71080 | |
Maintenance
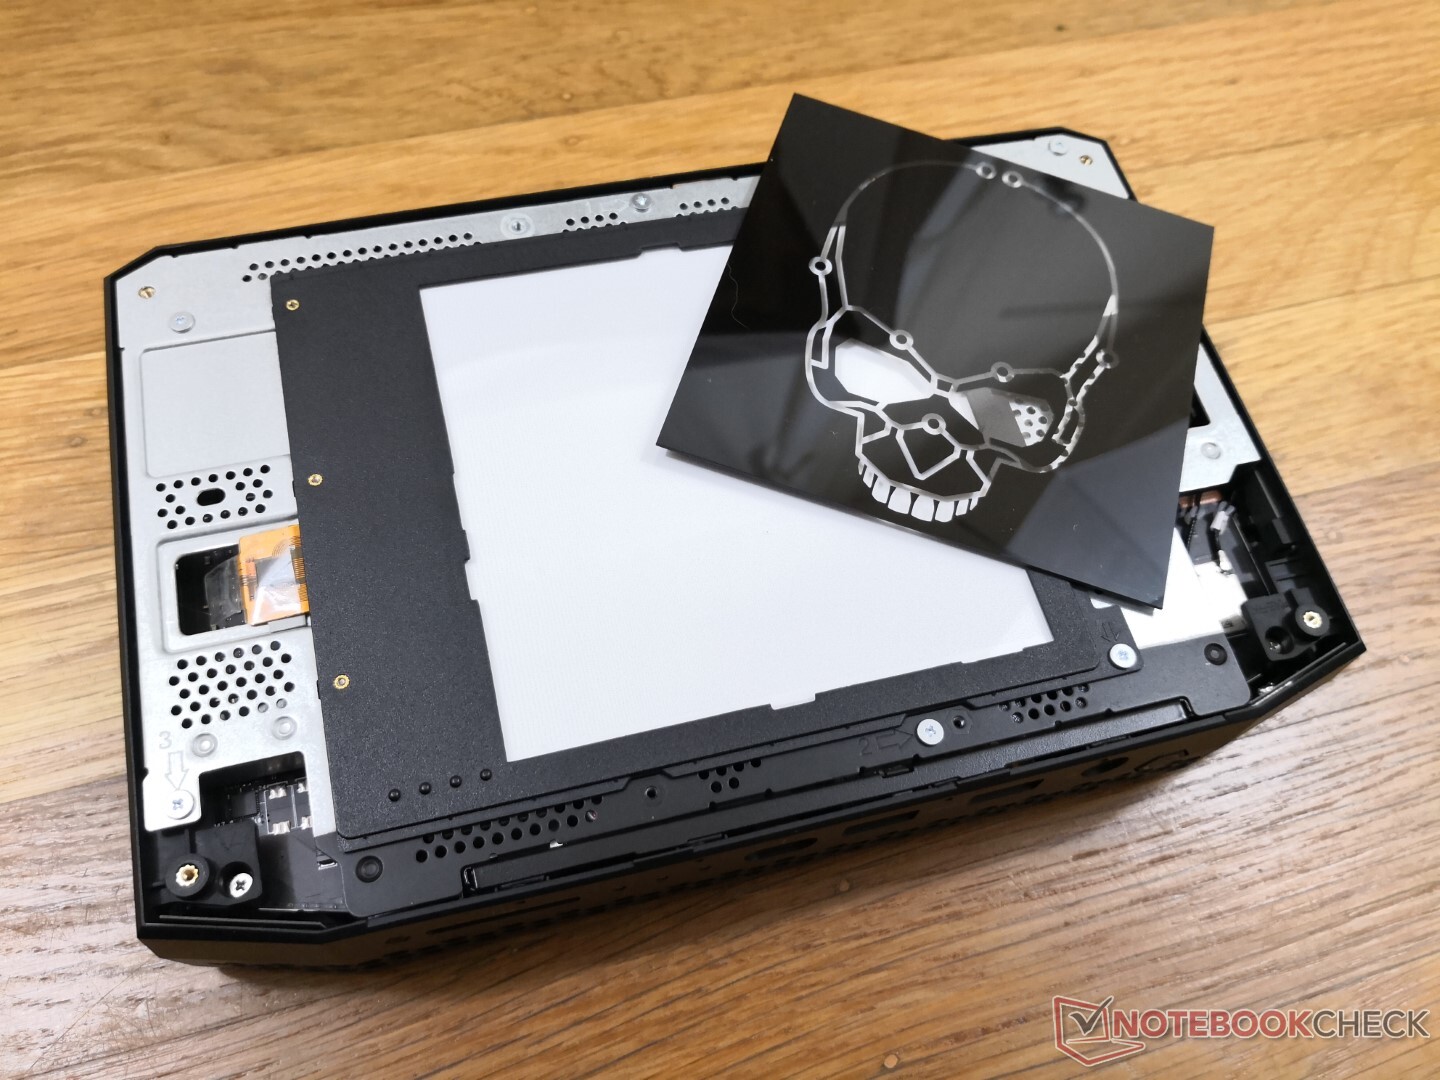
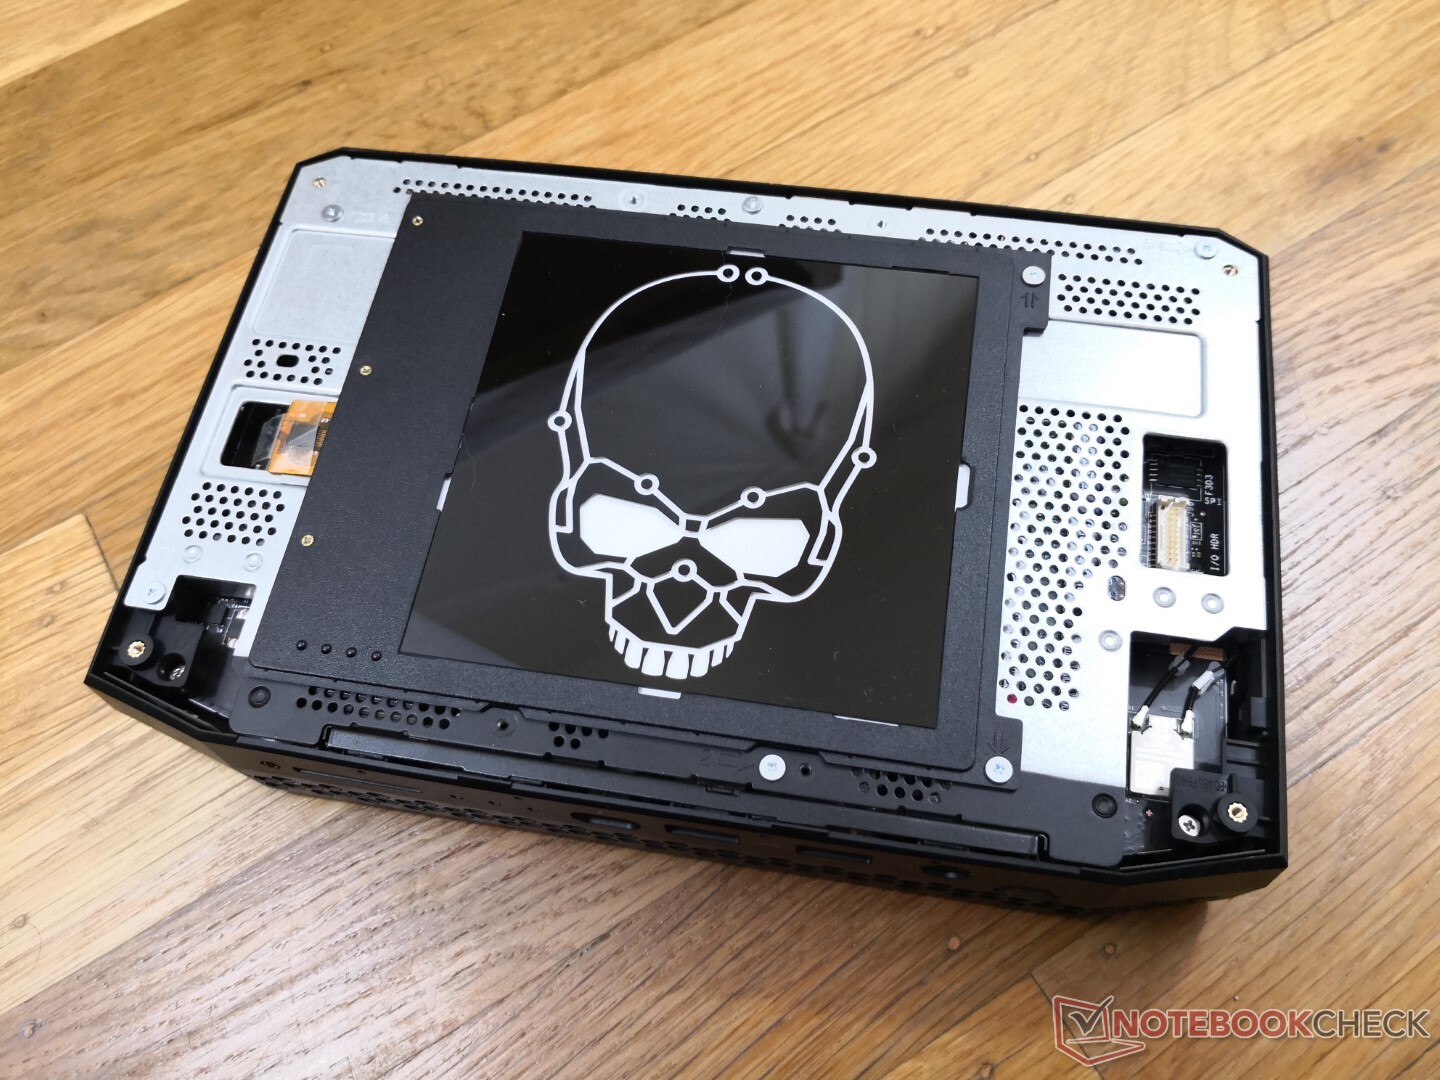
The top panel is secured by 8 hex screws which protects the the customizable LED face plate and metal cage. Removing the metal cage to access the RAM and storage slots will require a standard Philips screwdriver. Accessing the cooling solution underneath is unfortunately more difficult and less user-friendly.
Accessories and Warranty
Extras in the box include a removable VESA bracket, extra screws, plastic vertical stand, and five clear plastic face plates if owners want to swap out the LED-lit skull for another pattern. The stand is thankfully firm with no real risk of tipping. Cushions hold the NUC in place with a bit of clearance along the bottom for airflow.
A three-year limited warranty comes standard unlike on most other mini PCs.
Performance
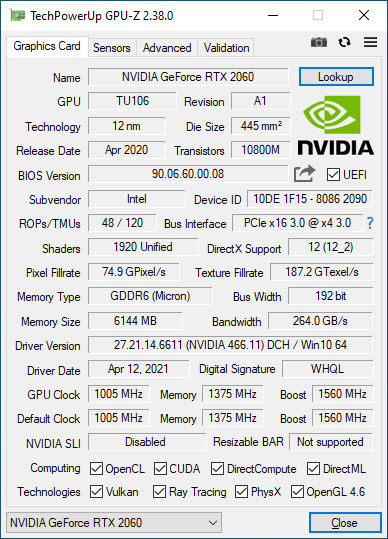
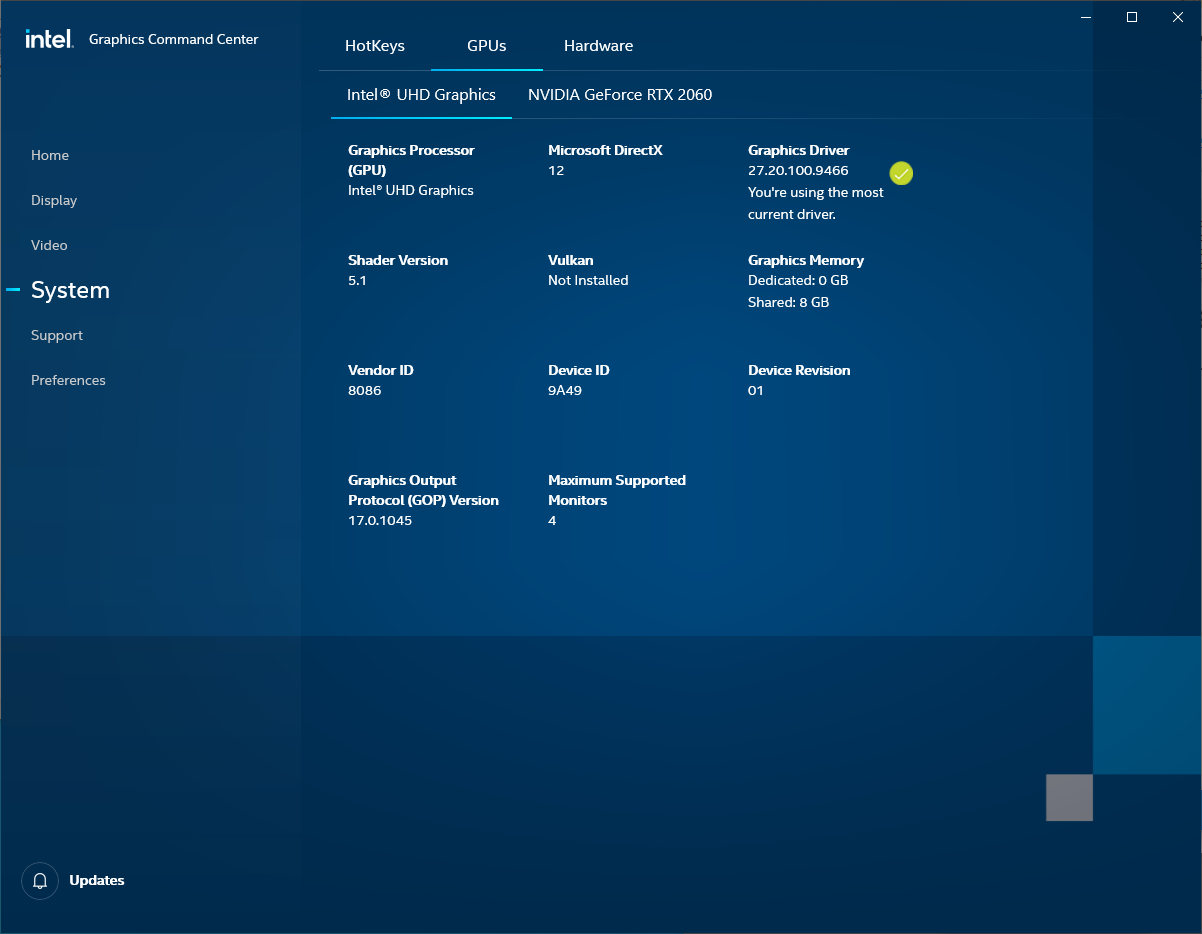
All NUC11 Enthusiast SKUs as of this writing come with the 11th gen Core i7-1165G7 CPU and GeForce RTX 2060 GPU. Keep in mind that the Nvidia GPU here is the mobile Max-P version and not the desktop one.
Optimus is supported for automatic graphics switching.
Our unit was set to "Performance" mode via BIOS prior to running any performance benchmarks below to get the highest scores possible.
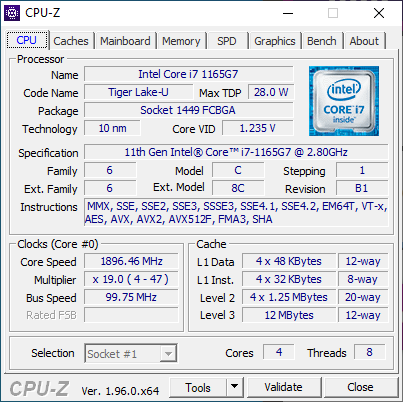
Processor
CPU performance is excellent with results that are within 5 percent of the NUC11PHKi7C. The Huawei MateBook X Pro equipped with the same Core i7-1165G7 CPU would run about 32 percent slower than our Phantom Canyon NUC.
If set to Balanced mode instead of Performance mode via BIOS, then multi-thread performance would drop by about 10 to 15 percent according to CineBench.
When compared to the older Core i7-8809G, our Core i7-1165G7 is able to outperform it in both single-thread and multi-thread benchmarks by about 30 percent and 15 percent, respectively. Interestingly, our CineBench R20 xT score is lower than expected even after two retries.
Cinebench R15: CPU Multi 64Bit | CPU Single 64Bit
Blender: v2.79 BMW27 CPU
7-Zip 18.03: 7z b 4 -mmt1 | 7z b 4
Geekbench 5.5: Single-Core | Multi-Core
HWBOT x265 Benchmark v2.2: 4k Preset
LibreOffice : 20 Documents To PDF
R Benchmark 2.5: Overall mean
* ... smaller is better
System Performance
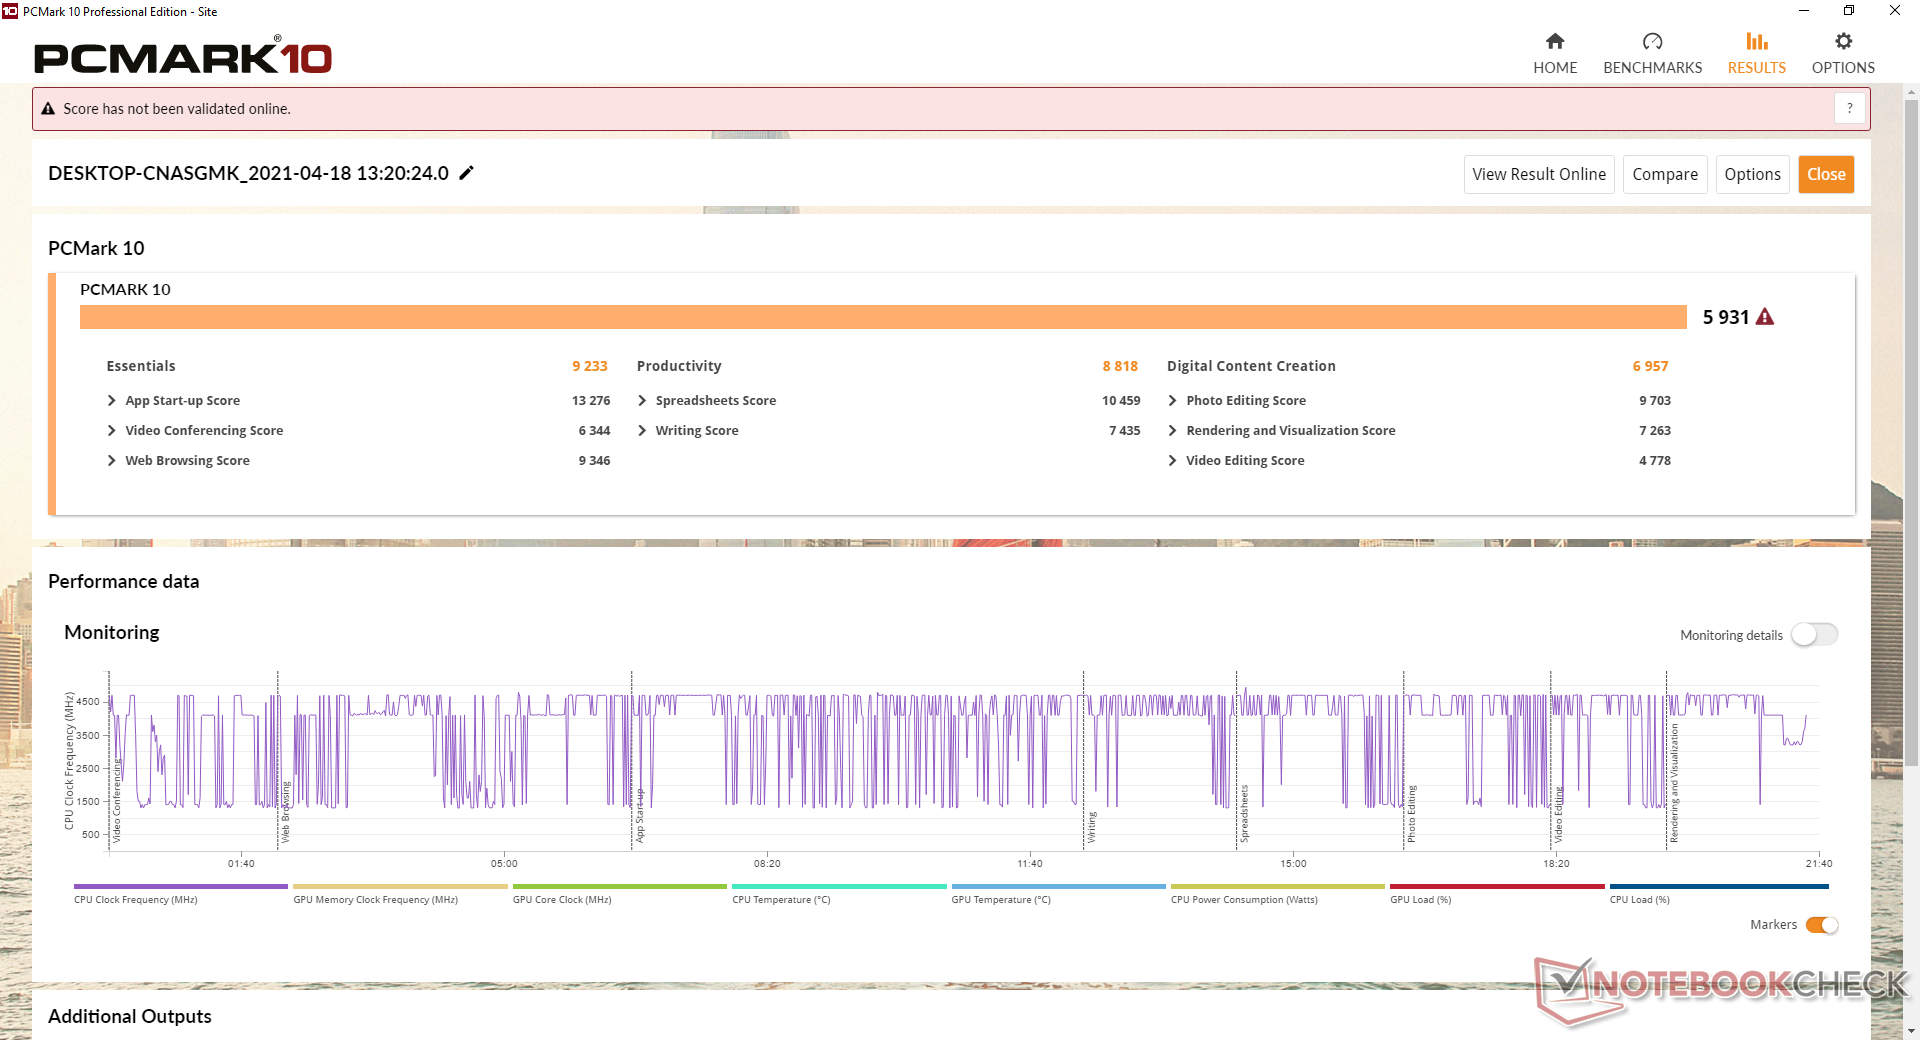
| PCMark 10 Score | 5931 points | |
Help | ||
DPC Latency
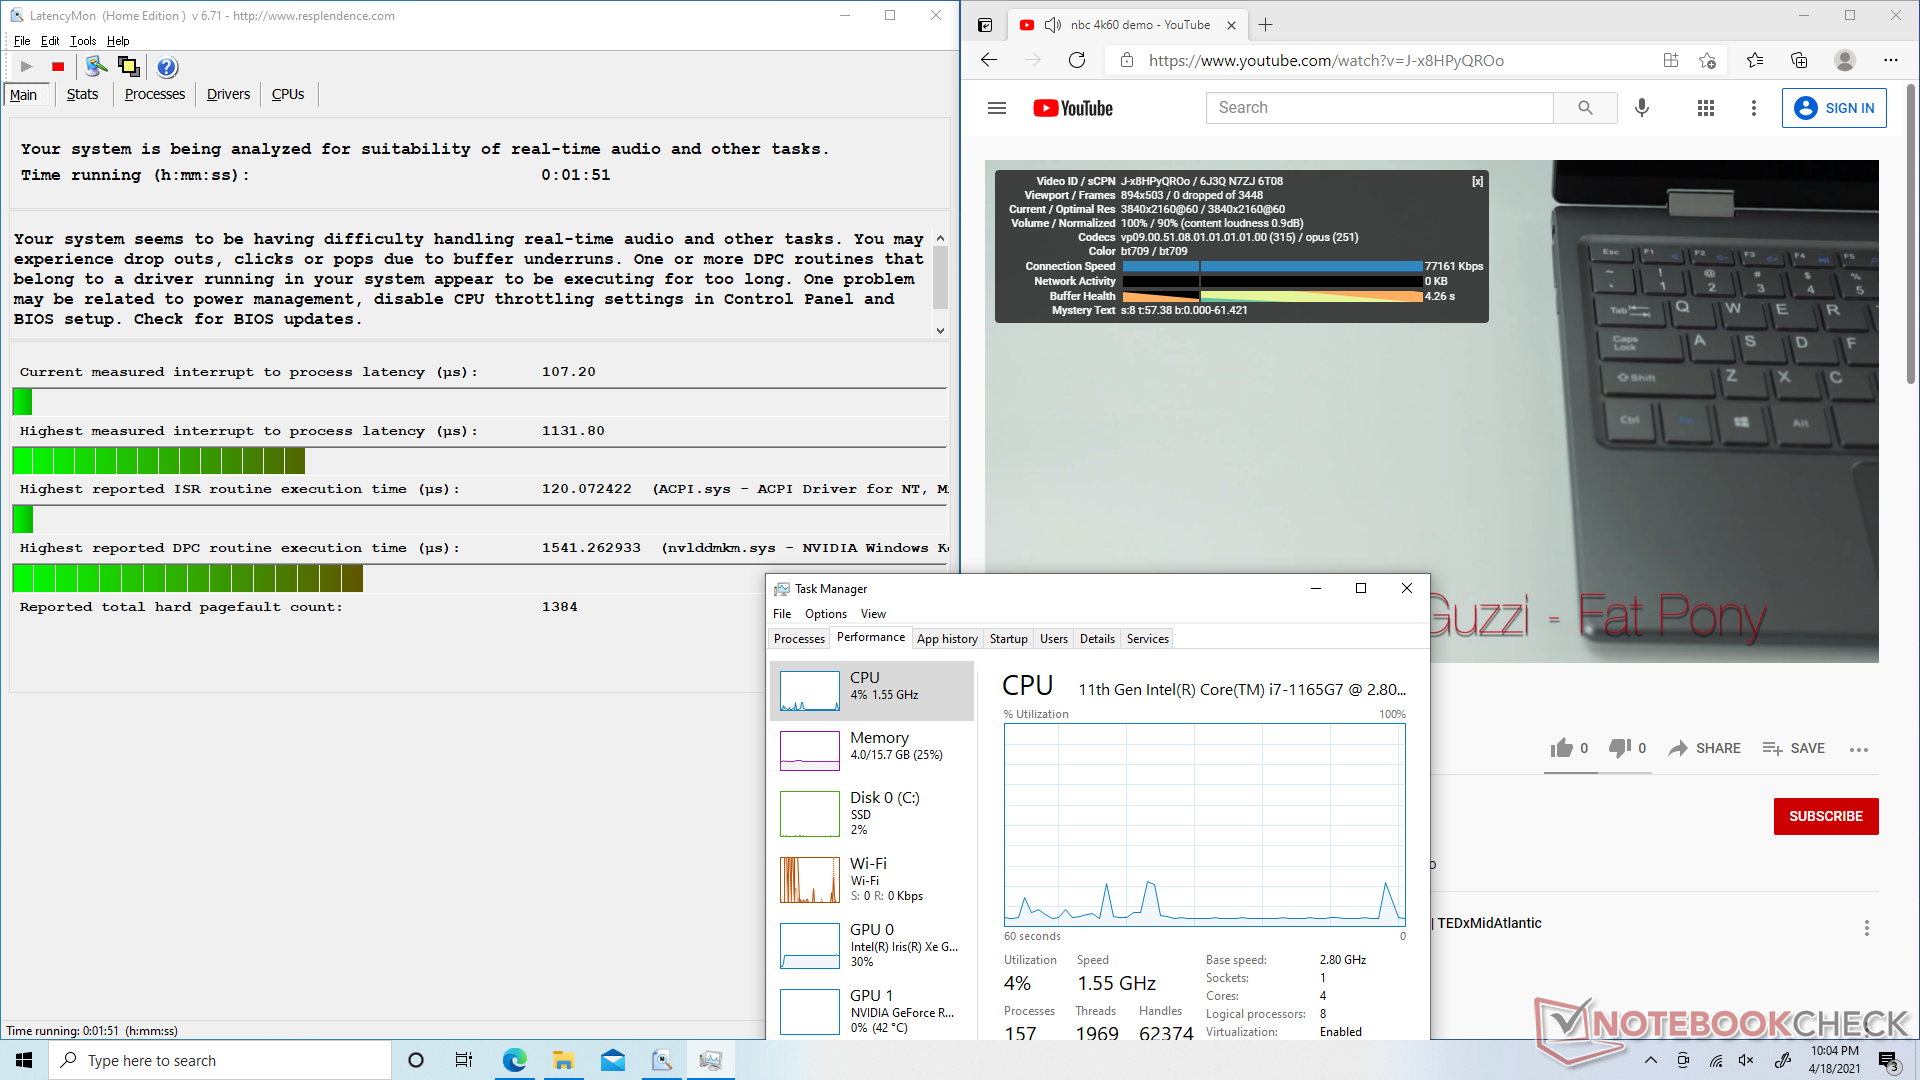
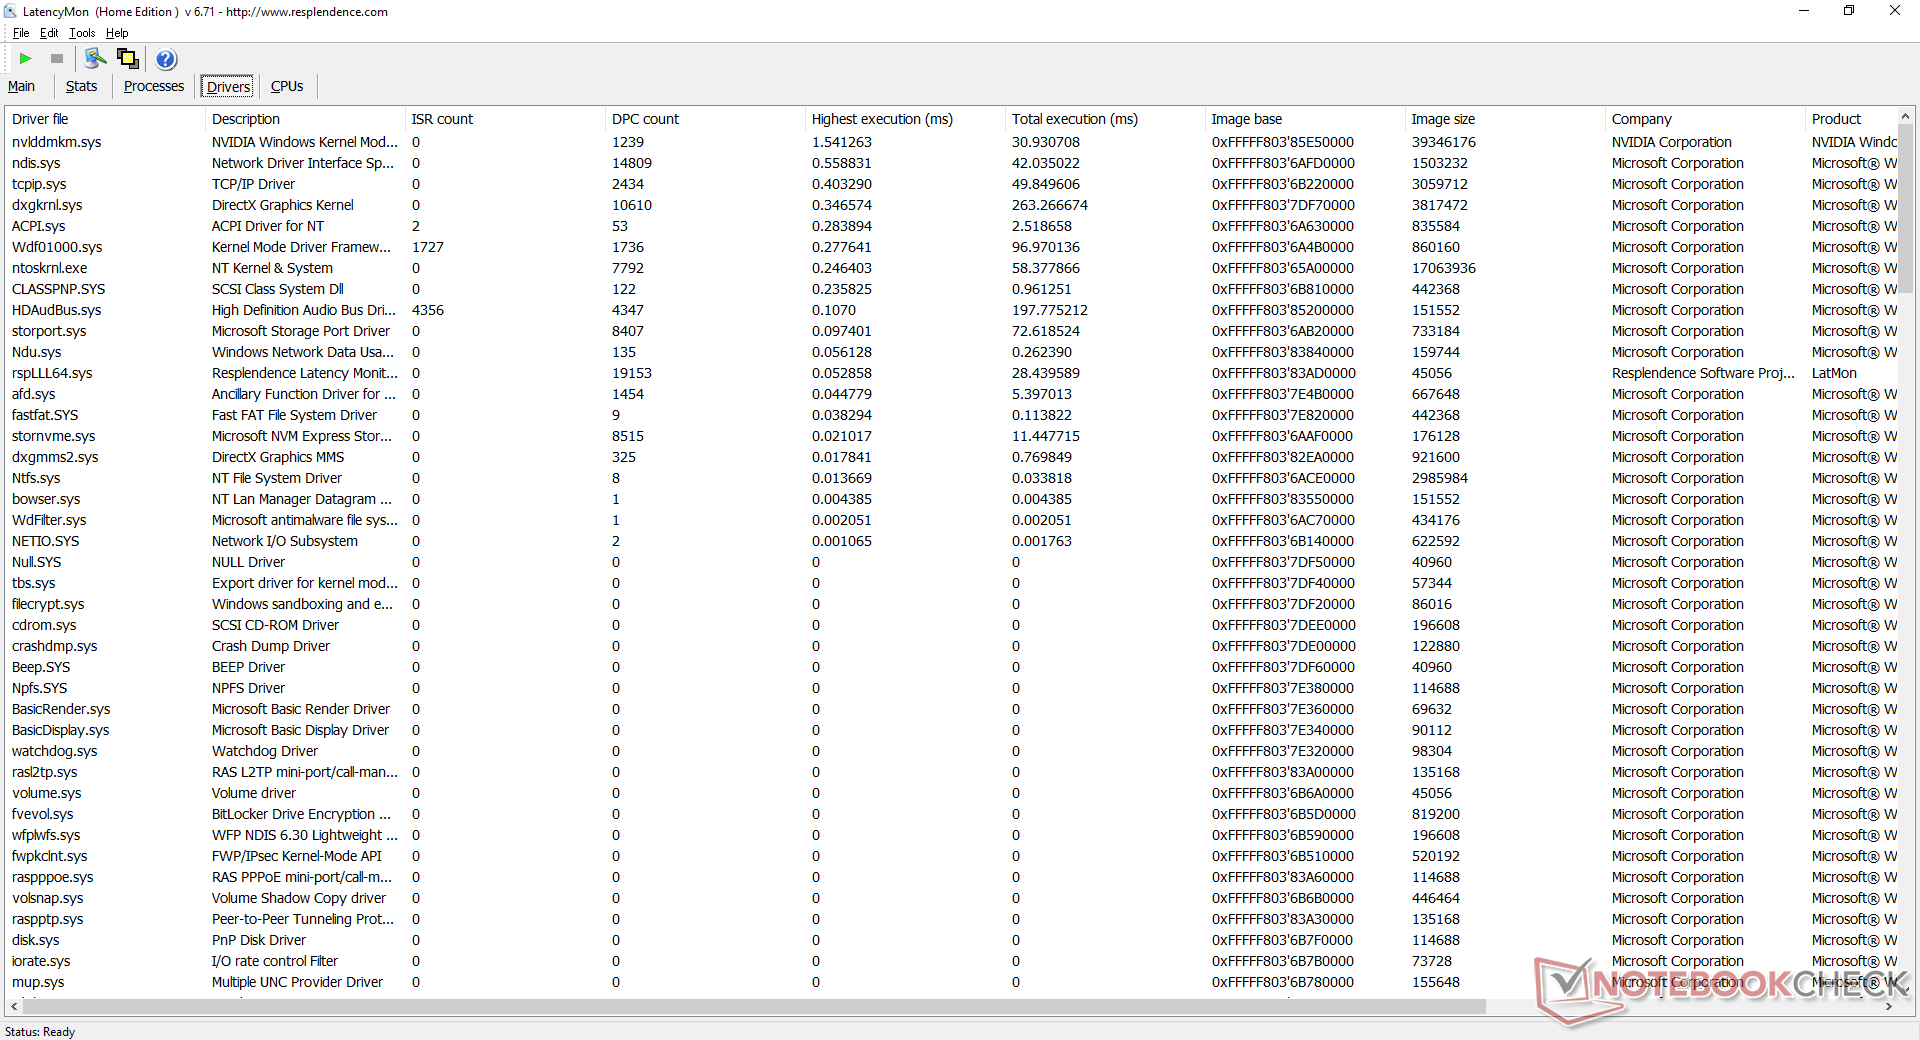
| DPC Latencies / LatencyMon - interrupt to process latency (max), Web, Youtube, Prime95 | |
| Intel NUC11PHKi7C | |
| GMK NucBox 2 | |
| Intel NUC11PAQi7 | |
* ... smaller is better
Storage Devices
While the NUC11PAQi7 supports PCIe 4.0 x4 NVMe SSD speeds, the NUC11PHKi7C does not as its two M.2 slots are limited to only PCIe 3.0 x4 and SATA III speeds, respectively. This is somewhat disappointing when considering that the NUC11PHKi7C is supposed to be an "enthusiast" product targeting high-performance users. We installed the same Samsung SSD 980 from the NUC11PAQi7 on our NUC11PHKi7C and, sure enough, our transfer rates were only about half that on the NUC11PAQi7.
It's worth noting that the system supports longer M.2 22110 SSDs whereas most other systems are limited to 2280.
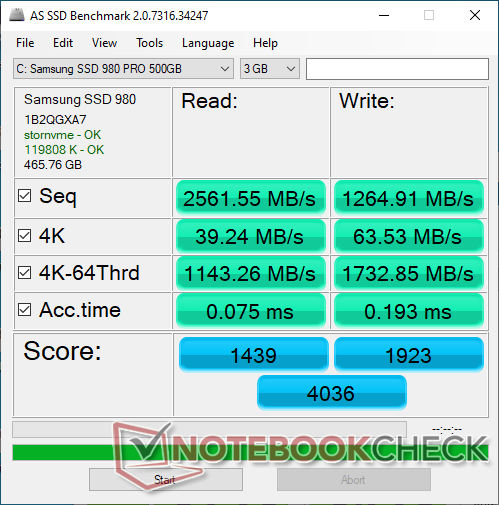
| Intel NUC11PHKi7C Samsung SSD 980 Pro 500GB MZ-V8P500BW | Intel Hades Canyon NUC8i7HVK Intel Optane 120 GB SSDPEK1W120GA | Intel NUC11PAQi7 Samsung SSD 980 Pro 500GB MZ-V8P500BW | GMK NucBox 2 Netac S930E8/256GPN | Zotac ZBOX Magnus EK71080 Samsung PM961 MZVLW256HEHP | |
|---|---|---|---|---|---|
| AS SSD | 3% | 47% | -33% | -8% | |
| Seq Read (MB/s) | 2562 | 1379 -46% | 3257 27% | 2069 -19% | 2119 -17% |
| Seq Write (MB/s) | 1265 | 553 -56% | 3937 211% | 1203 -5% | 1205 -5% |
| 4K Read (MB/s) | 39.24 | 127.9 226% | 51.3 31% | 41.66 6% | 46.69 19% |
| 4K Write (MB/s) | 63.5 | 103.5 63% | 75.7 19% | 136.9 116% | 105.2 66% |
| 4K-64 Read (MB/s) | 1143 | 1258 10% | 2283 100% | 366.3 -68% | 1170 2% |
| 4K-64 Write (MB/s) | 1733 | 556 -68% | 2206 27% | 340.5 -80% | 443.8 -74% |
| Access Time Read * (ms) | 0.075 | 0.025 67% | 0.056 25% | 0.064 15% | 0.06 20% |
| Access Time Write * (ms) | 0.193 | 0.033 83% | 0.154 20% | 0.347 -80% | 0.04 79% |
| Score Read (Points) | 1439 | 1524 6% | 2660 85% | 615 -57% | 1429 -1% |
| Score Write (Points) | 1923 | 714 -63% | 2676 39% | 598 -69% | 669 -65% |
| Score Total (Points) | 4036 | 3023 -25% | 6725 67% | 1497 -63% | 2791 -31% |
| Copy ISO MB/s (MB/s) | 1675 | 1125 -33% | 2030 21% | 1186 -29% | 1649 -2% |
| Copy Program MB/s (MB/s) | 1030 | 342.4 -67% | 883 -14% | 428.6 -58% | 468 -55% |
| Copy Game MB/s (MB/s) | 1810 | 768 -58% | 1817 0% | 435.7 -76% | 1010 -44% |
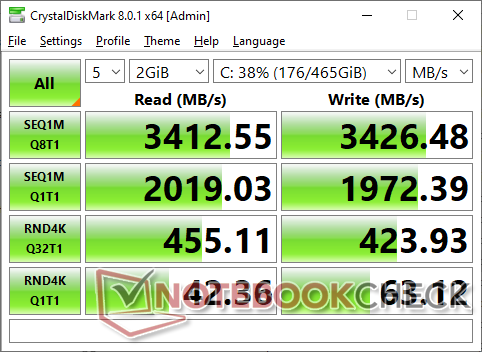
| CrystalDiskMark 5.2 / 6 | 21% | 111% | 6% | -2% | |
| Write 4K (MB/s) | 67.3 | 133.7 99% | 244.6 263% | 178.4 165% | 132.7 97% |
| Read 4K (MB/s) | 38.32 | 178.6 366% | 80.4 110% | 61 59% | 44.48 16% |
| Write Seq (MB/s) | 1985 | 608 -69% | 4094 106% | 1040 -48% | 1193 -40% |
| Read Seq (MB/s) | 2049 | 1428 -30% | 4099 100% | 1919 -6% | 1371 -33% |
| Write 4K Q32T1 (MB/s) | 432.3 | 323.6 -25% | 715 65% | 417.7 -3% | 398.5 -8% |
| Read 4K Q32T1 (MB/s) | 452.4 | 282.3 -38% | 783 73% | 325.6 -28% | 483.5 7% |
| Write Seq Q32T1 (MB/s) | 3423 | 627 -82% | 5065 48% | 1144 -67% | 1202 -65% |
| Read Seq Q32T1 (MB/s) | 3123 | 1521 -51% | 6884 120% | 2379 -24% | 3388 8% |
| Total Average (Program / Settings) | 12% /
10% | 79% /
70% | -14% /
-19% | -5% /
-6% |
* ... smaller is better

Disk Throttling: DiskSpd Read Loop, Queue Depth 8
GPU Performance
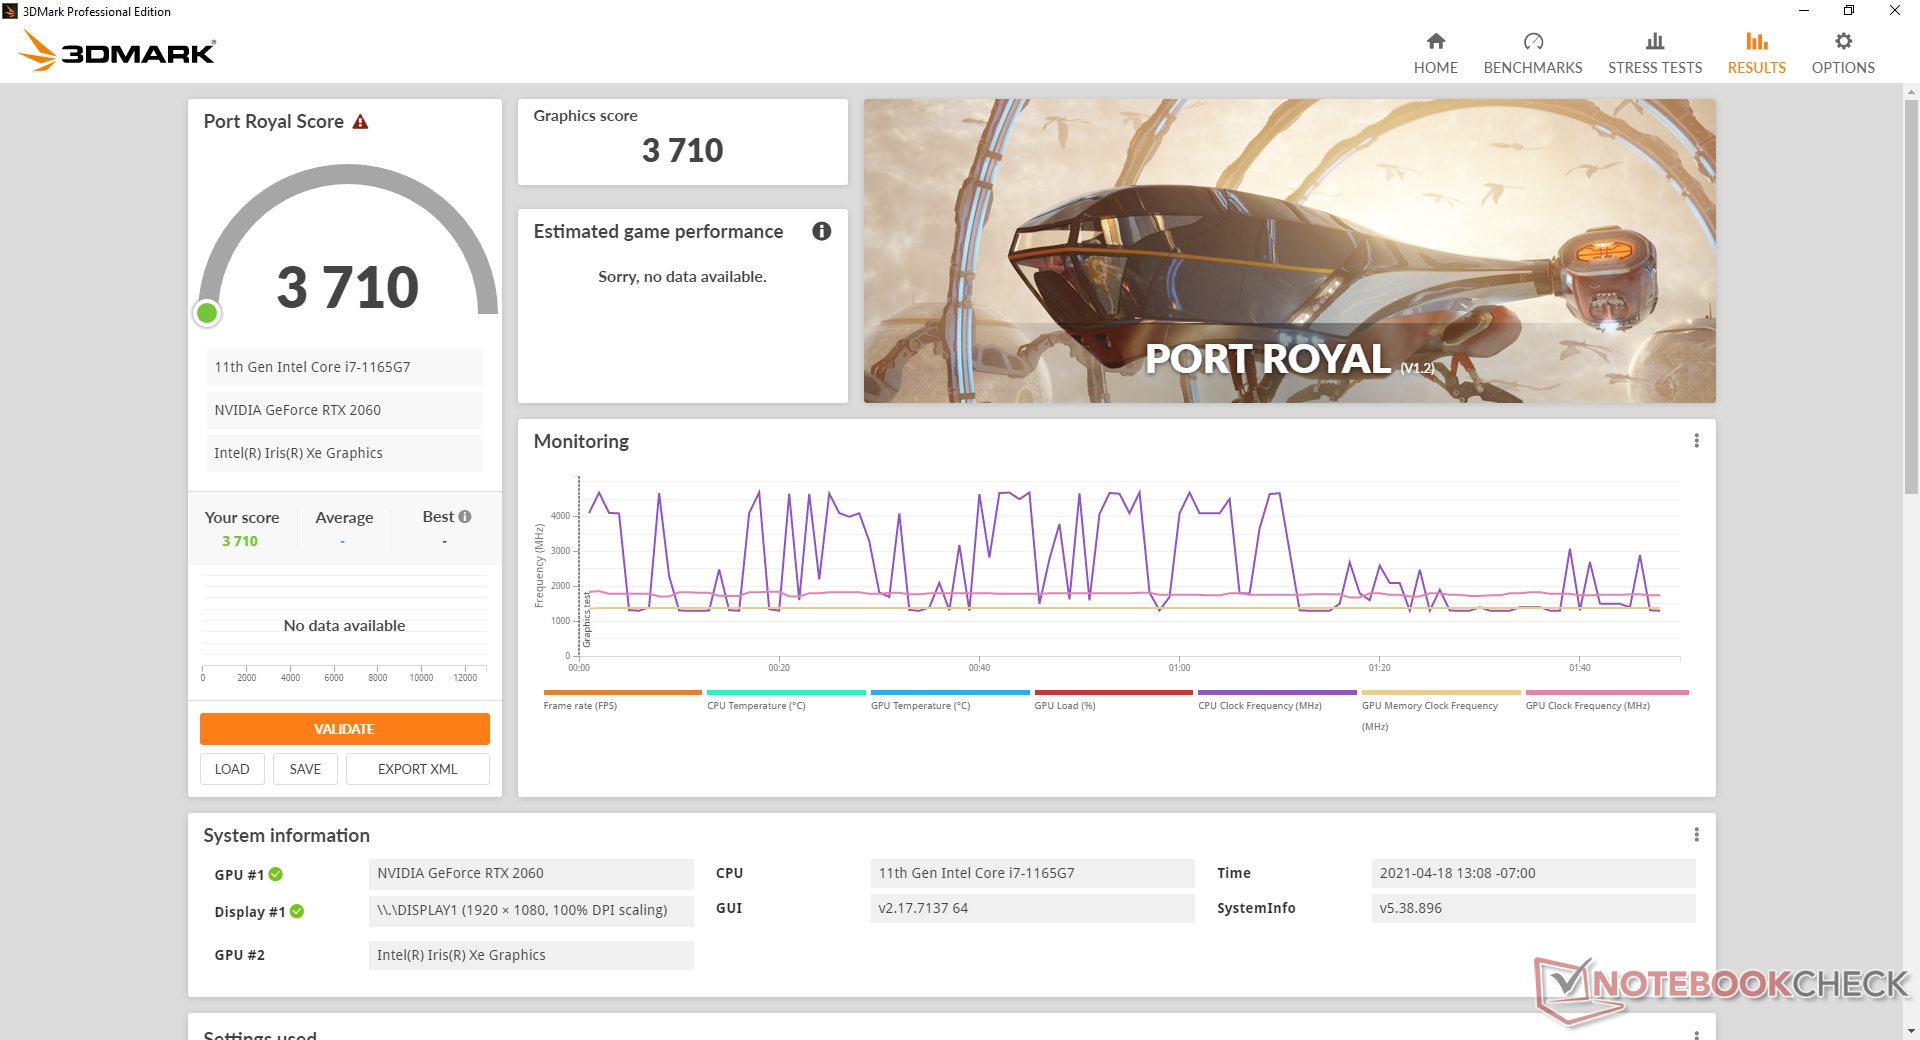
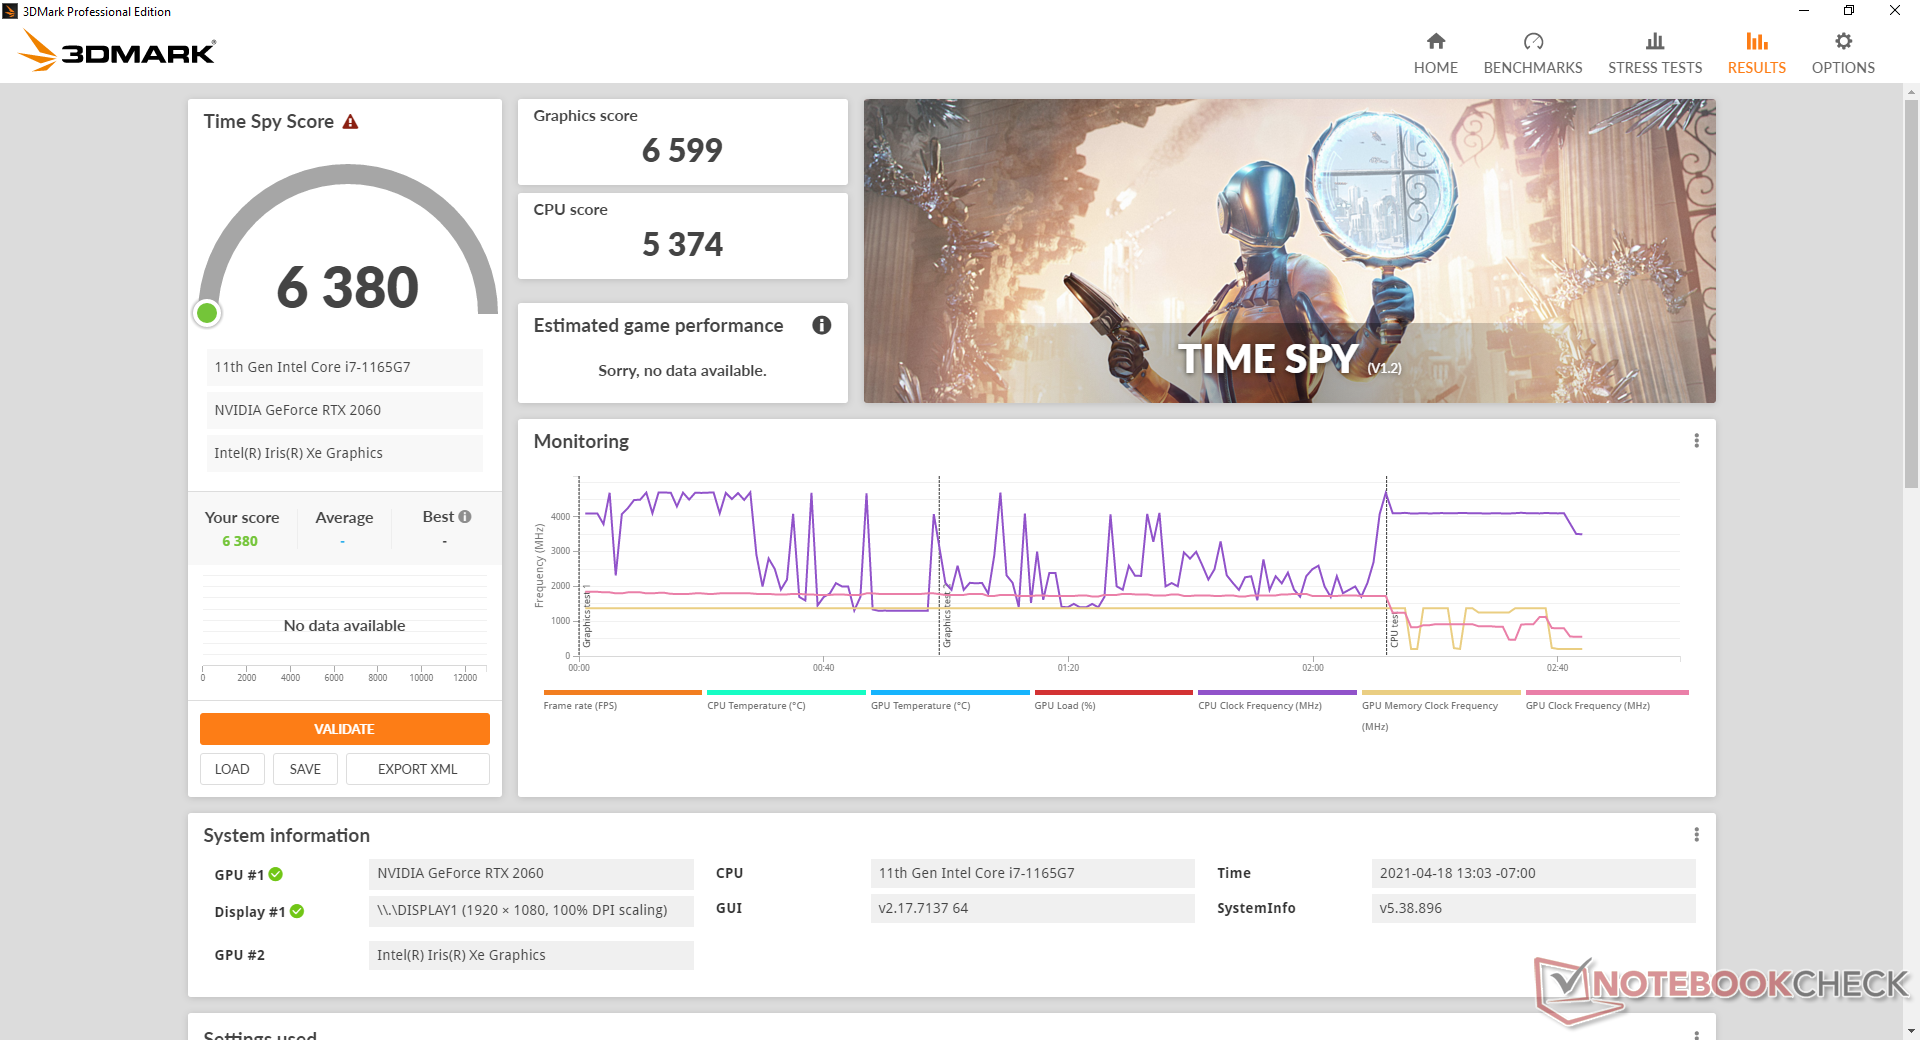
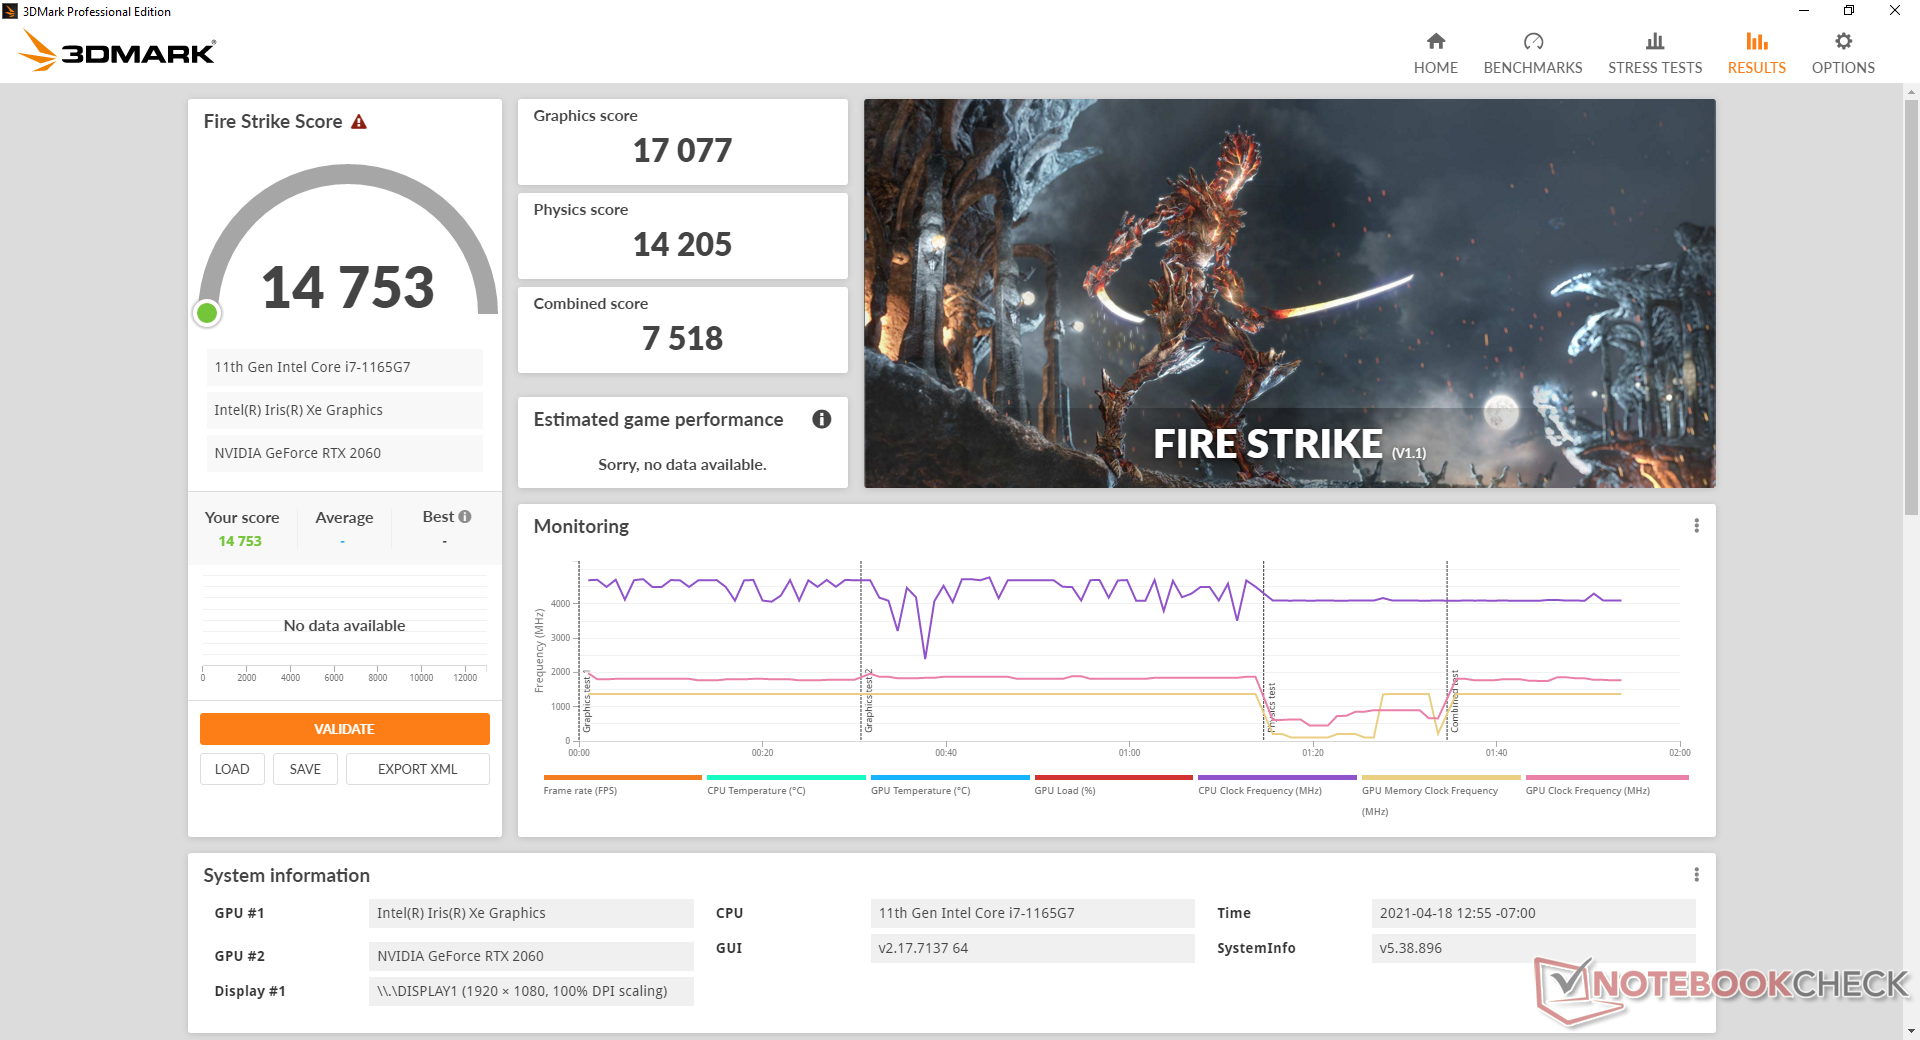
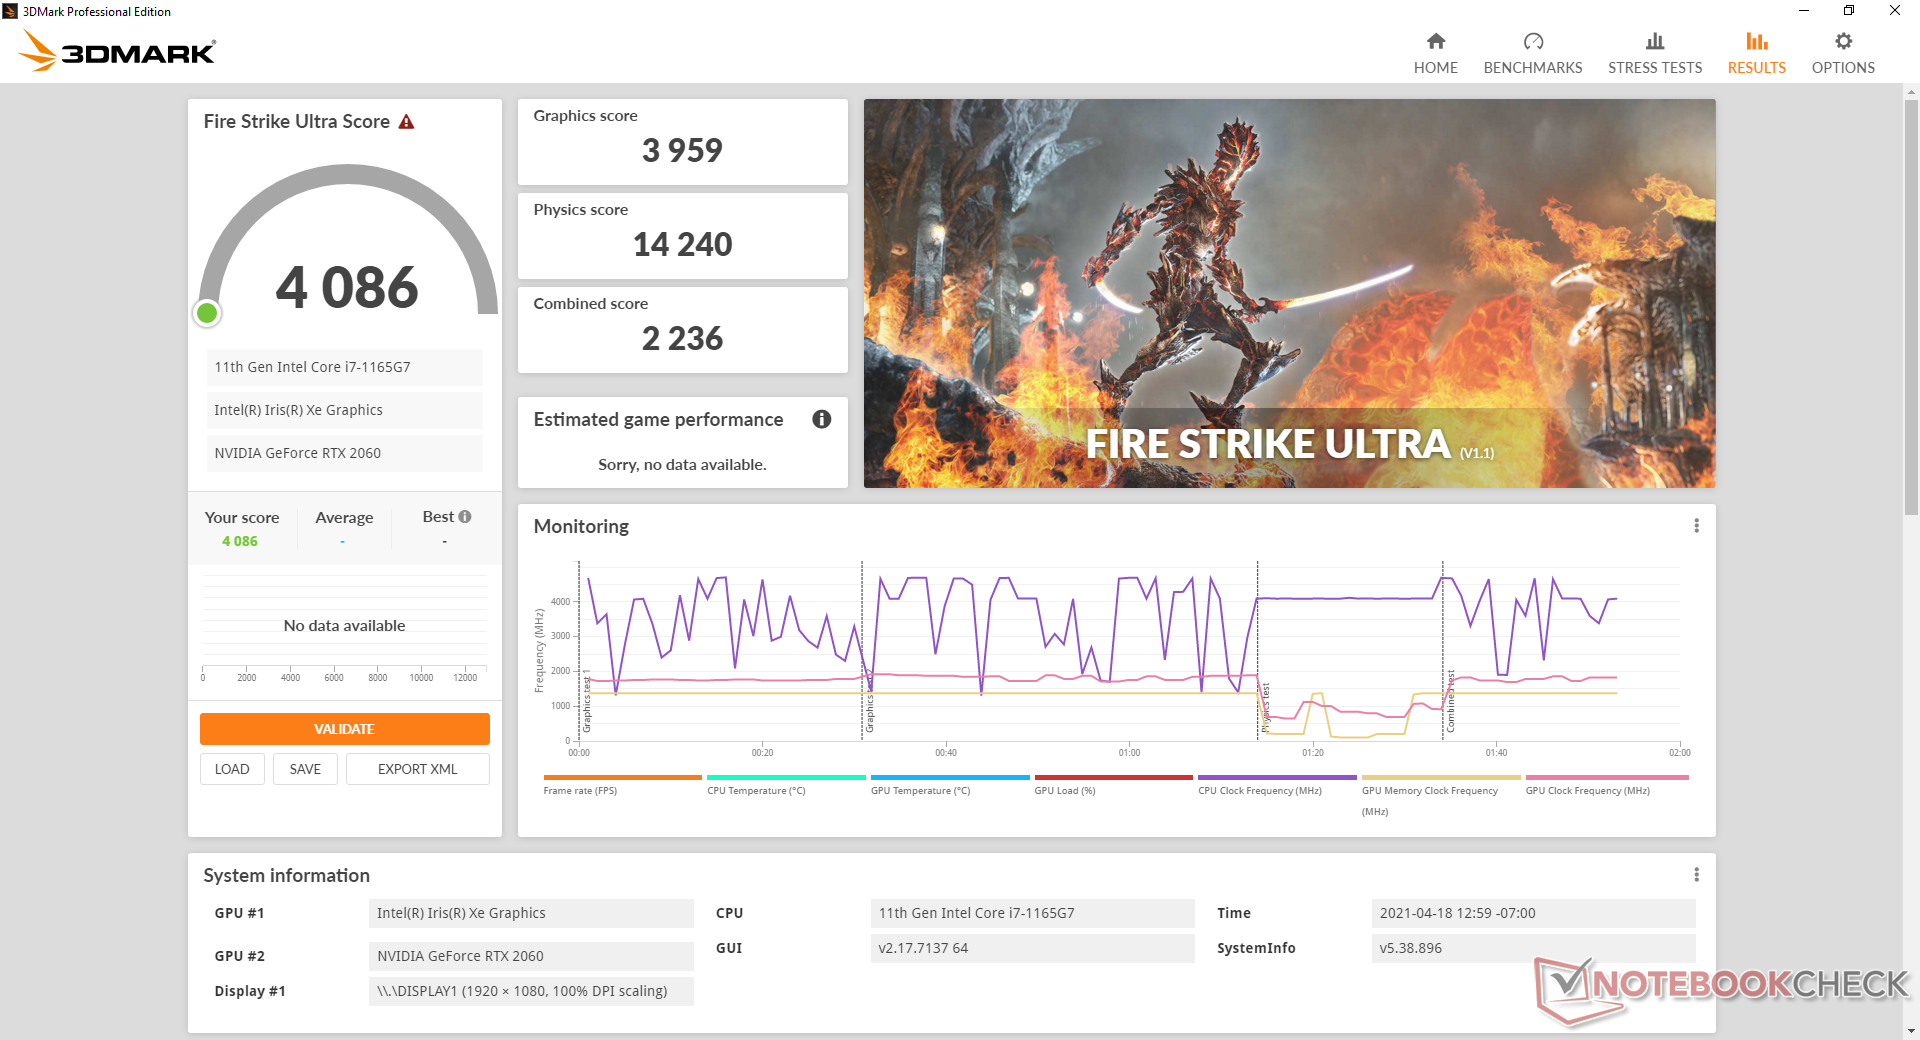
Graphics performance is where we expect it to be relative to the average laptop equipped with the same GeForce RTX 2060 GPU. Most notably, performance is almost 70 percent faster than the Radeon RX Vega M GH on the older Hades Canyon according to 3DMark Fire Strike while Time Spy shows an even larger performance boost of just over 2x. This suggests that games running on DX12 will see the greatest performance benefits gen-to-gen.
A desktop PC with a "proper" GeForce RTX 2060 will still outperform the mobile RTX 2060 in our NUC by about 15 to 20 percent.
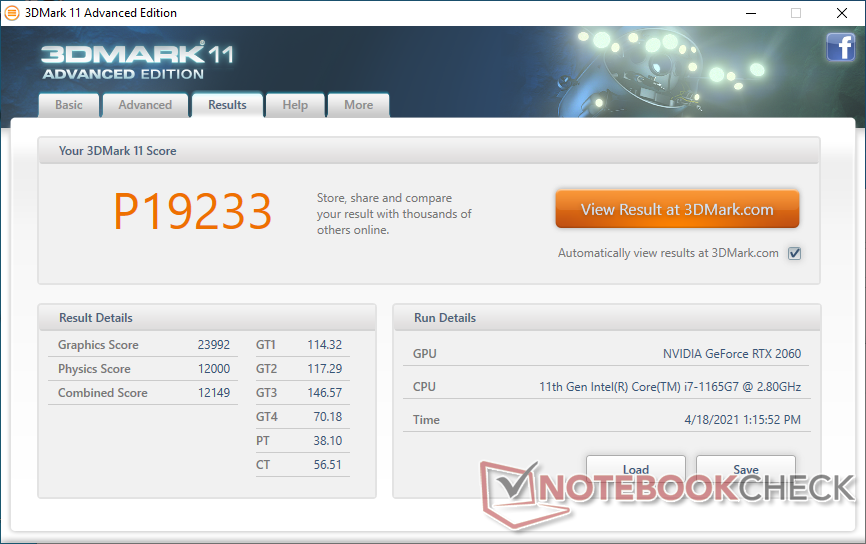

| 3DMark 11 Performance | 19233 points | |
| 3DMark Cloud Gate Standard Score | 30679 points | |
| 3DMark Fire Strike Score | 14753 points | |
| 3DMark Time Spy Score | 6380 points | |
Help | ||
| low | med. | high | ultra | |
|---|---|---|---|---|
| GTA V (2015) | 168 | 158 | 119 | 69.6 |
| The Witcher 3 (2015) | 220.7 | 152.2 | 101.5 | 61.4 |
| Dota 2 Reborn (2015) | 139 | 123 | 116 | 112 |
| Final Fantasy XV Benchmark (2018) | 130 | 89.2 | 67.5 | |
| X-Plane 11.11 (2018) | 94.8 | 81.3 | 69.8 | |
| Strange Brigade (2018) | 287 | 148 | 124 | 109 |
Emissions
System Noise
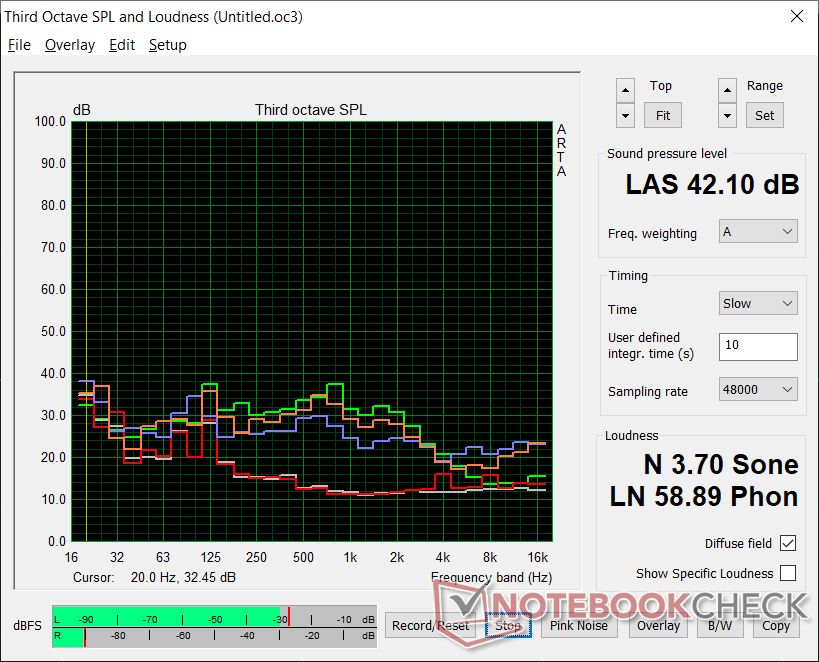
We're able to record a coil whine of 25.3 dB(A) when idling on desktop against a silent background of 24.5 dB(A). Fan noise is otherwise close to what we recorded on the Hades Canyon NUC. When running Witcher 3, for example, fan noise would slowly rise until it reaches a steady 39.7 dB(A). When running more extreme loads like Prime95 or FurMark, fan noise would rise to as high as 47.9 dB(A) temporarily before falling and stabilizing at 42.1 dB(A).
| Intel NUC11PHKi7C GeForce RTX 2060 Mobile, i7-1165G7, Samsung SSD 980 Pro 500GB MZ-V8P500BW | Intel Hades Canyon NUC8i7HVK Vega M GH, i7-8809G, Intel Optane 120 GB SSDPEK1W120GA | Intel NUC11PAQi7 Iris Xe G7 96EUs, i7-1165G7, Samsung SSD 980 Pro 500GB MZ-V8P500BW | GMK NucBox 2 Iris Plus Graphics 655, i5-8259U, Netac S930E8/256GPN | Zotac ZBOX Magnus EK71080 GeForce GTX 1080 (Desktop), i7-7700HQ, Samsung PM961 MZVLW256HEHP | Aorus Gaming Box GeForce RTX 2080 Ti , i7-1165G7 | |
|---|---|---|---|---|---|---|
| Noise | -10% | 0% | 3% | -28% | -25% | |
| off / environment * (dB) | 24.5 | 28.7 -17% | 25.6 -4% | 25.6 -4% | 29.9 -22% | 26.5 -8% |
| Idle Minimum * (dB) | 25.3 | 29 -15% | 25.6 -1% | 25.7 -2% | 38.6 -53% | 34.7 -37% |
| Idle Average * (dB) | 25.3 | 29 -15% | 25.6 -1% | 25.7 -2% | 38.6 -53% | 39.1 -55% |
| Idle Maximum * (dB) | 25.3 | 29 -15% | 25.6 -1% | 25.7 -2% | 39 -54% | 39.1 -55% |
| Load Average * (dB) | 36.4 | 36 1% | 33.6 8% | 35.3 3% | 40.6 -12% | 39.5 -9% |
| Witcher 3 ultra * (dB) | 39.7 | 42 -6% | 33.6 15% | 41.7 -5% | 43.7 -10% | |
| Load Maximum * (dB) | 47.9 | 49.4 -3% | 54.5 -14% | 35.1 27% | 47 2% | 48 -0% |
* ... smaller is better
Noise level
| Idle |
| 25.3 / 25.3 / 25.3 dB(A) |
| Load |
| 36.4 / 47.9 dB(A) |
 | ||
30 dB silent 40 dB(A) audible 50 dB(A) loud |
||
min: | ||
Temperature

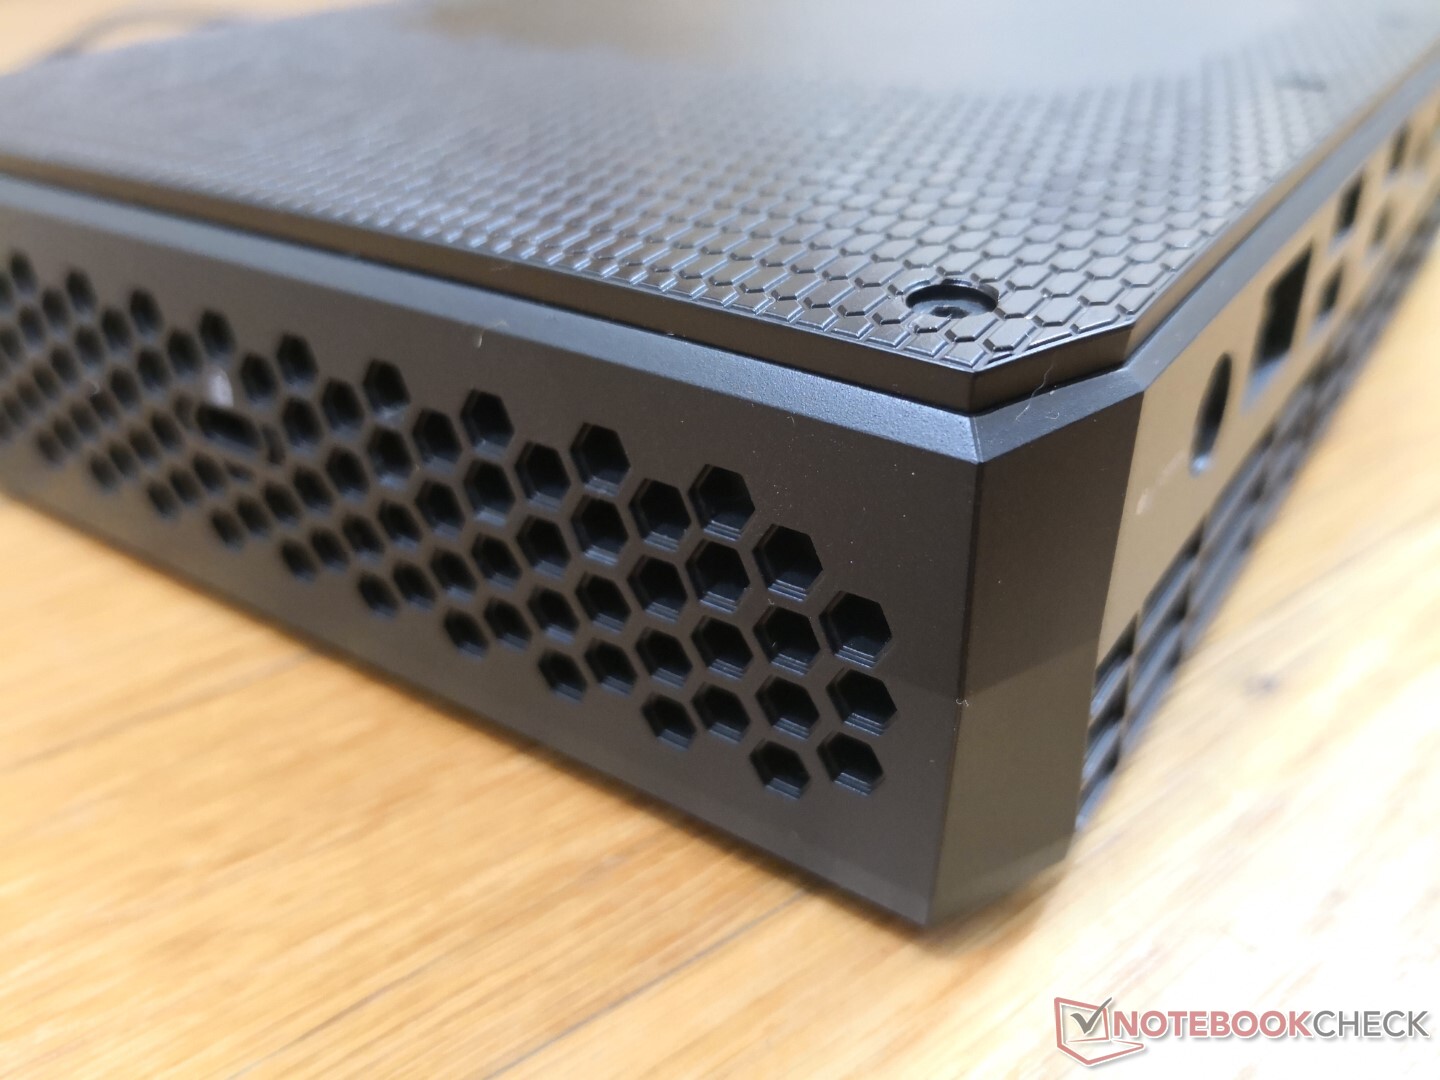
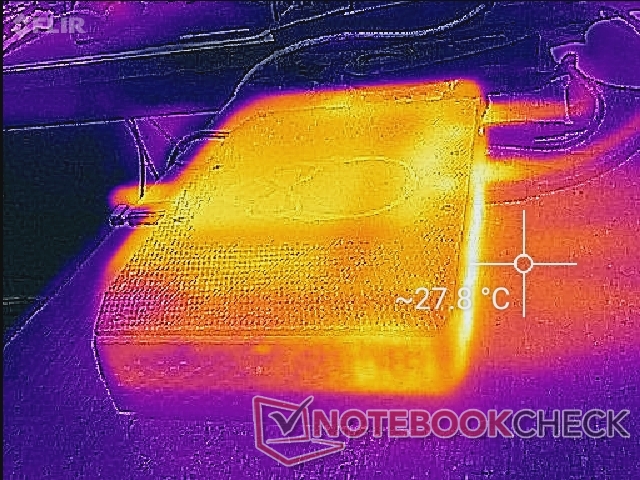
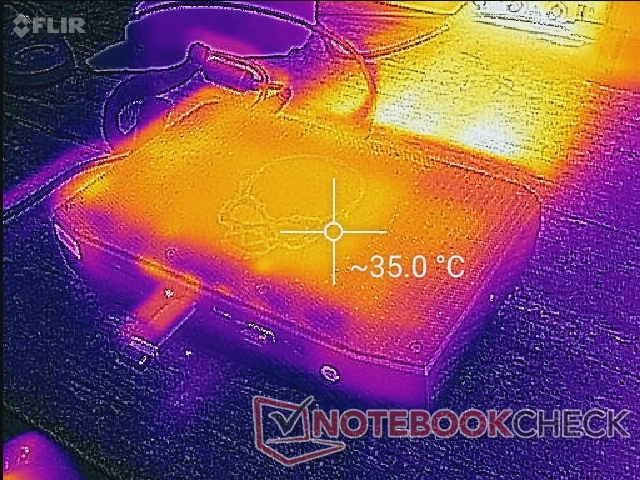
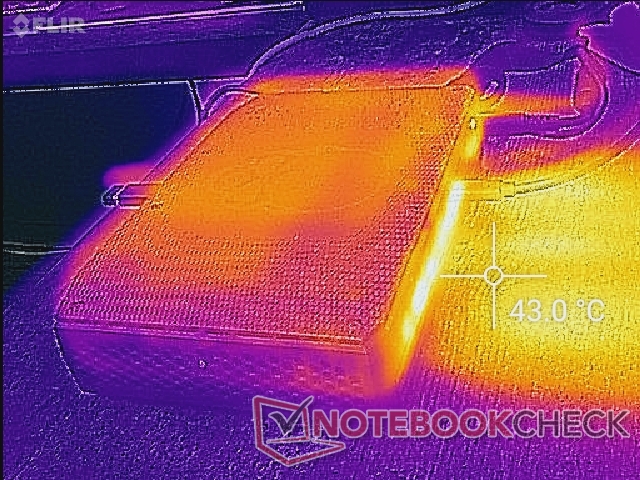
Surface temperatures aren't an issue as the hot spot on top is only about 35 C when gaming. All exhaust is from the rear, however, and so ample space should be reserved behind it for adequate ventilation.
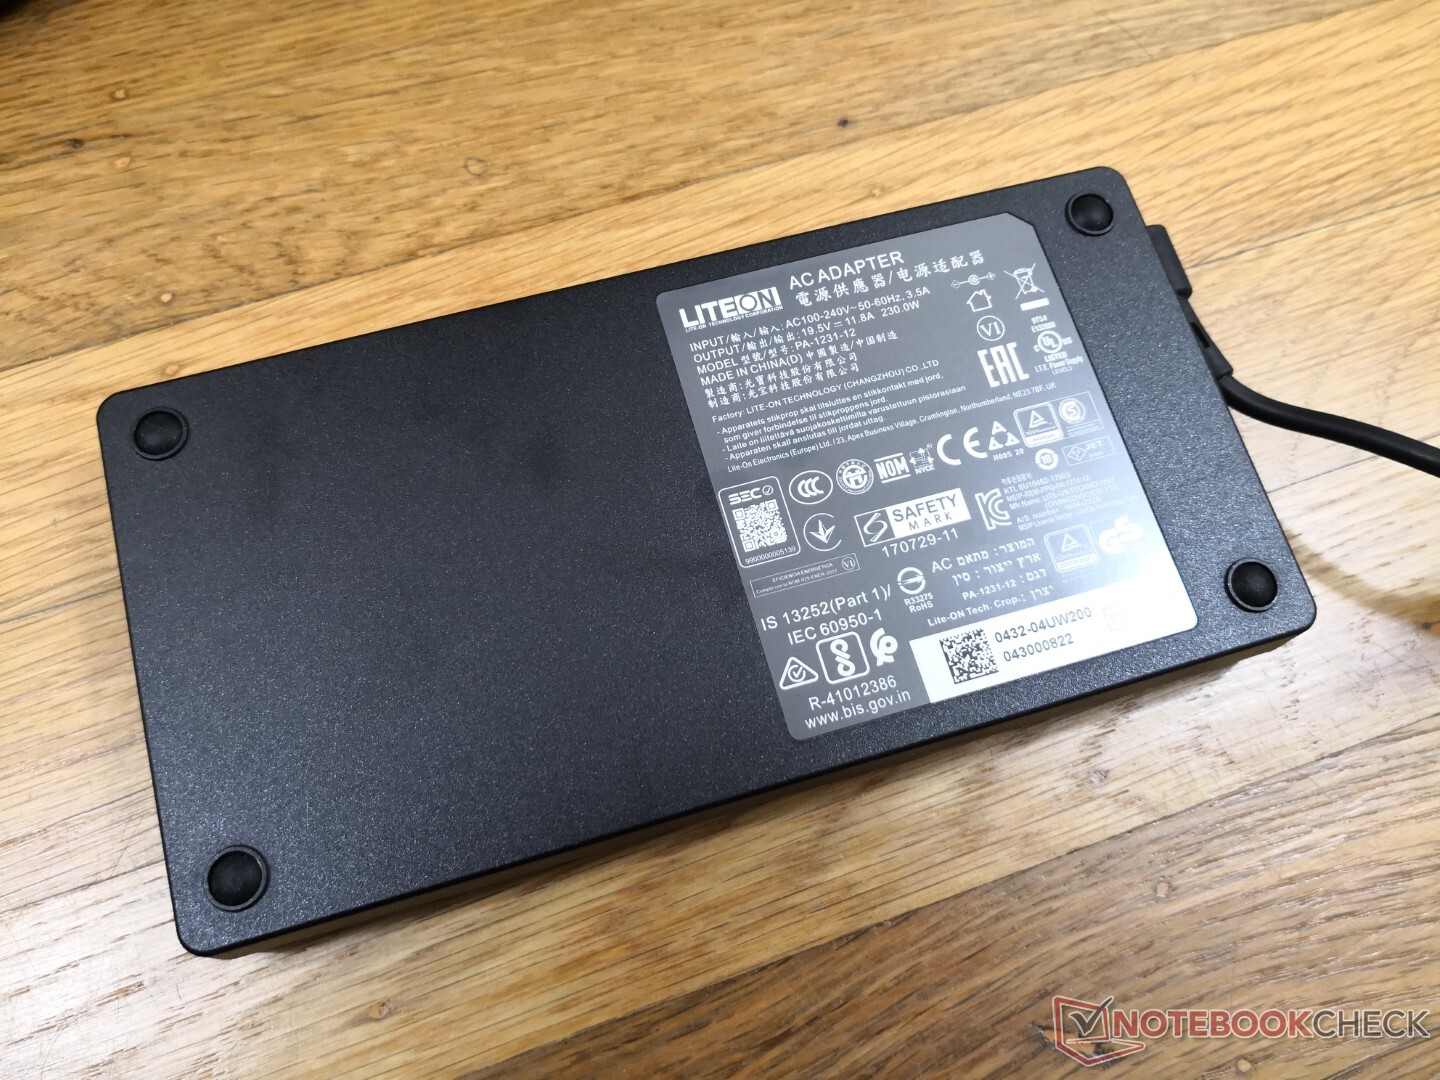
The AC adapter can become warmer than the NUC itself at 43 C when gaming. Intel could have probably designed a smaller and denser AC adapter, but it would have likely run even warmer much like what we've observed on the Razer Blade series.

Stress Test
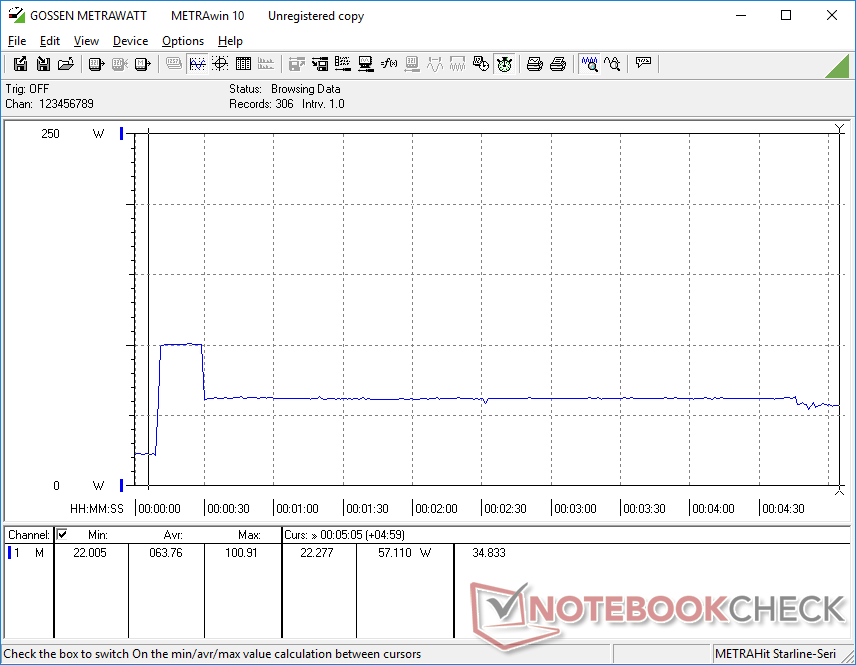
When running Prime95 to stress the CPU, clock rates would boost to 4.1 GHz for about 20 seconds until reaching a core temperature of 89 C. Thereafter, clock rates would steadily fall until stabilizing at the 3.0 to 3.2 GHz and a core temperature of 67 C. If the NUC is set to Balanced mode, clock rates would fall further to 2.8 GHz for a cooler core temperature of 57 C.
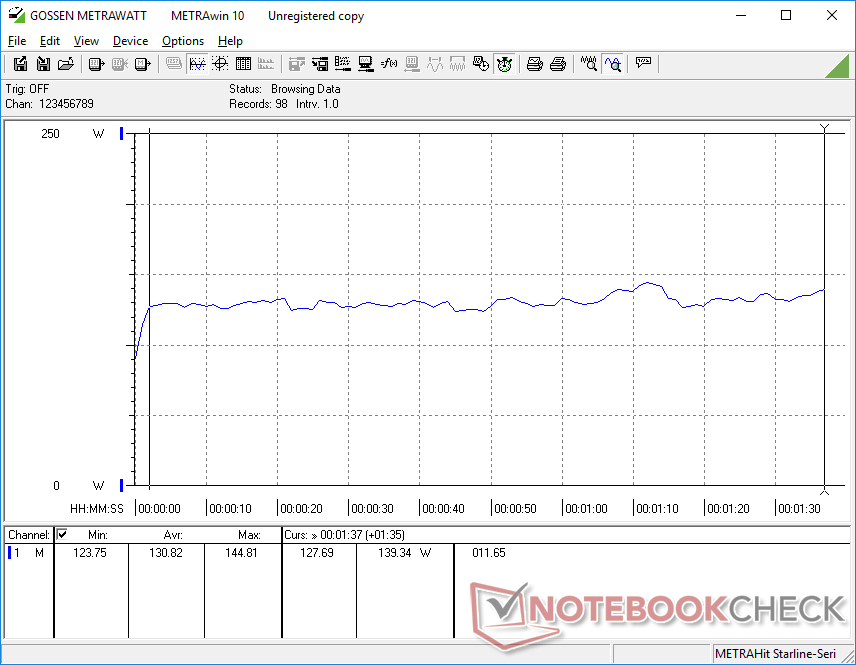
When running Witcher 3 to represent real-world gaming loads, CPU and GPU temperatures would stabilize at 63 C and 69 C, respectively, with a constant GPU board power draw of about 116 W. The Kaby Lake-G CPU in the Hades Canyon NUC would stabilize at a similar temperature range when running the same game.
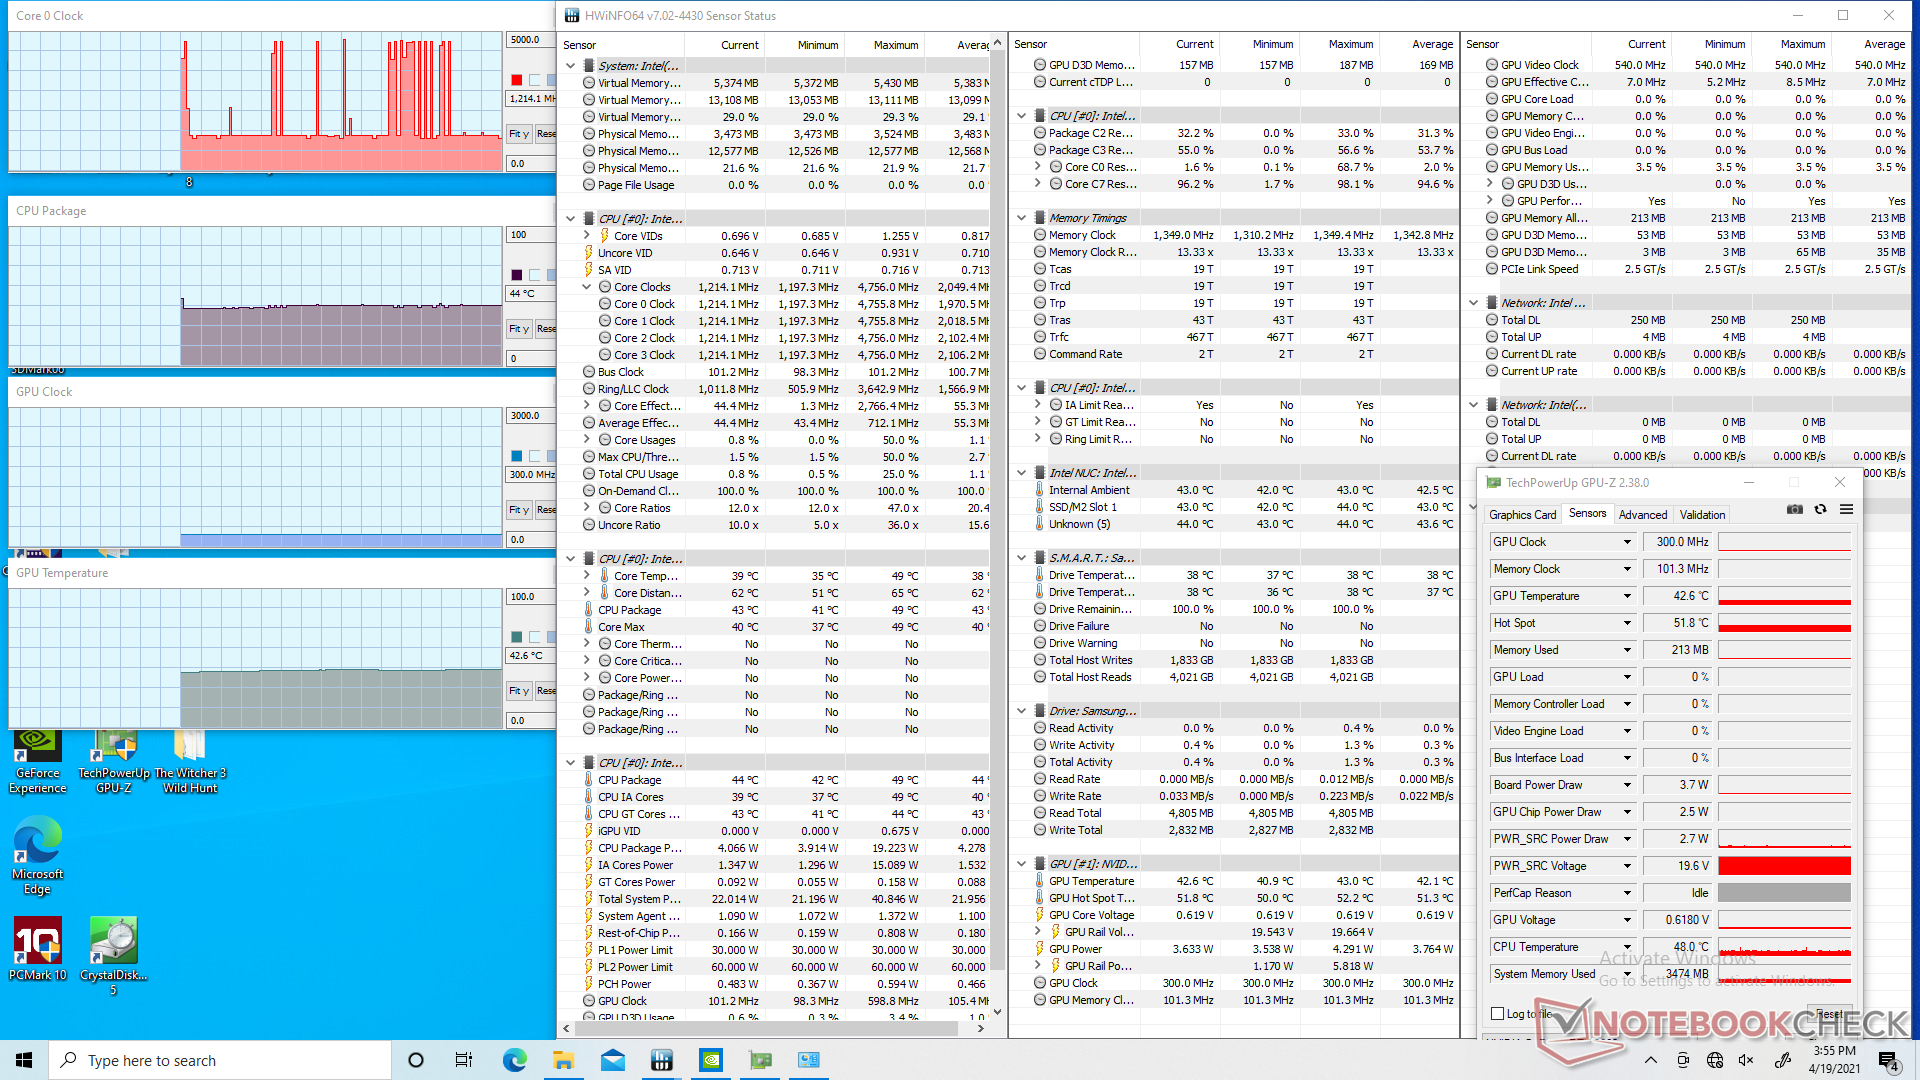
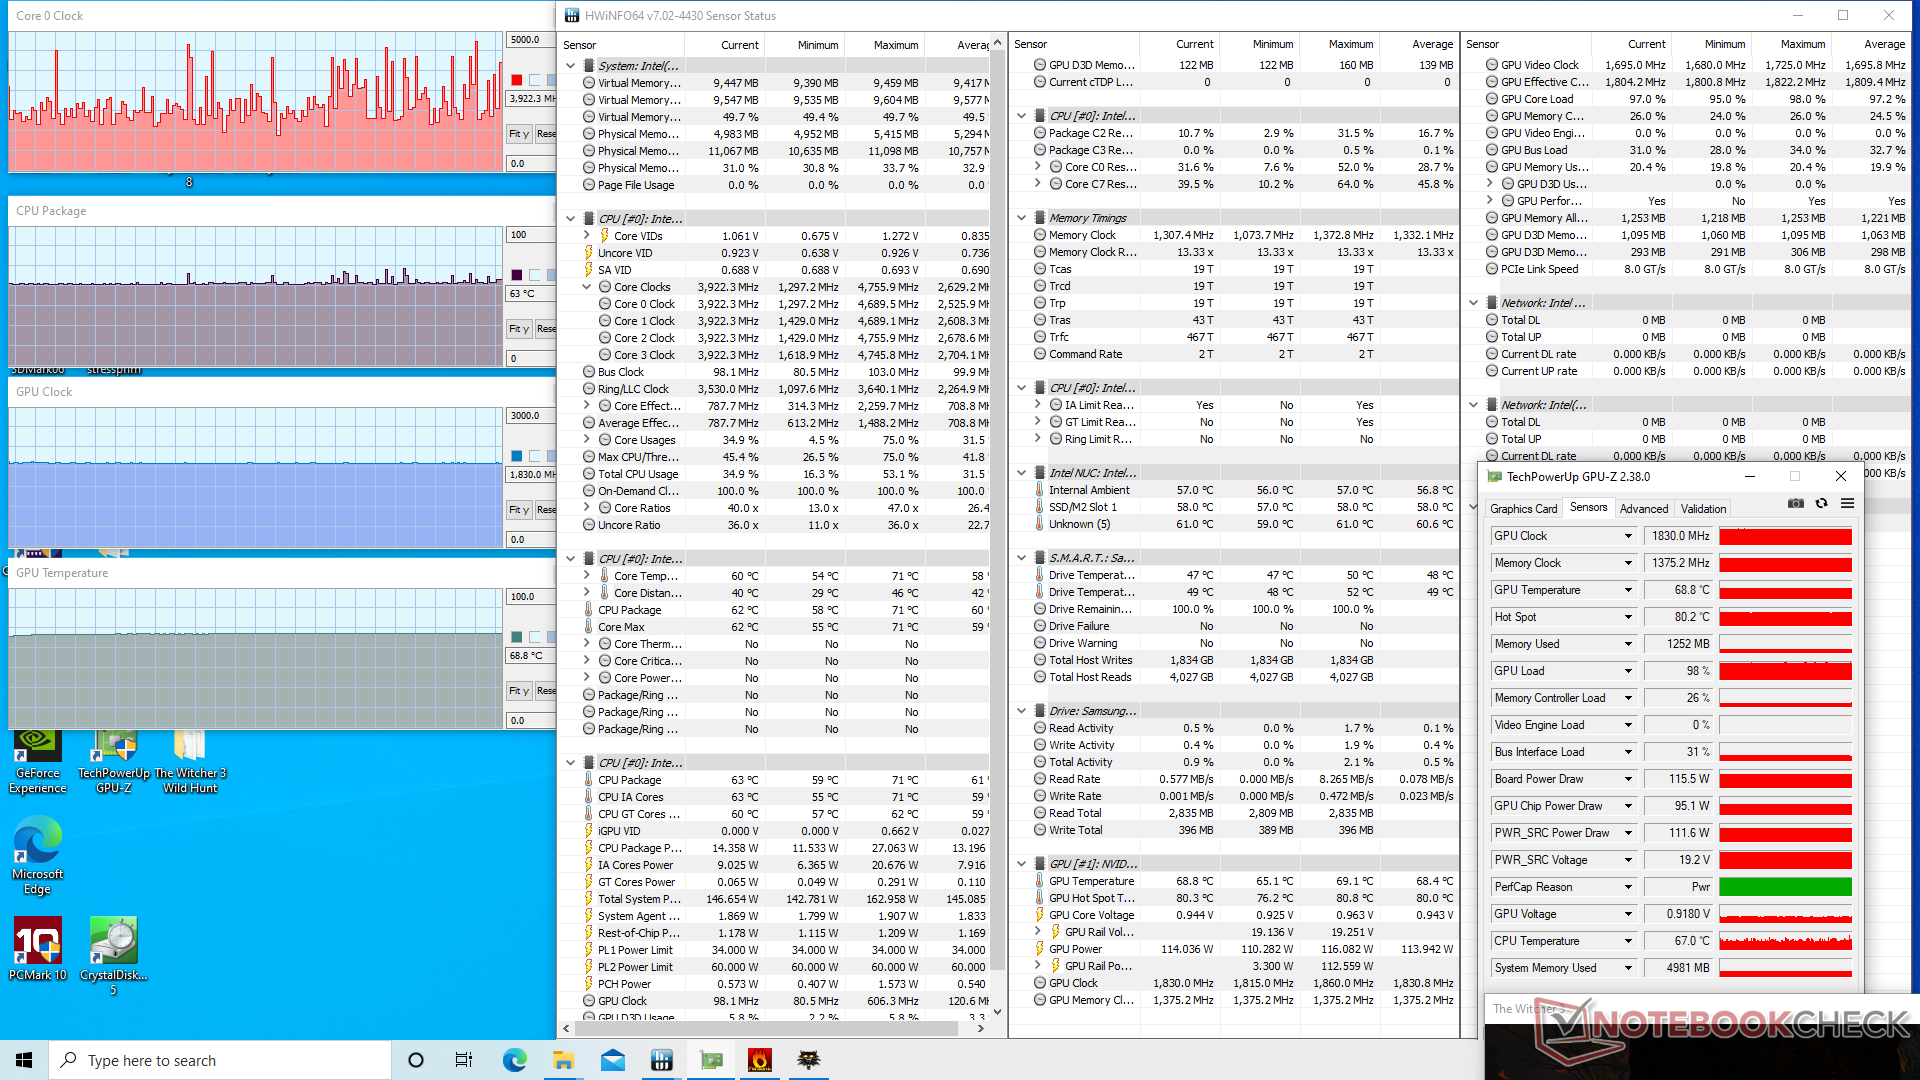
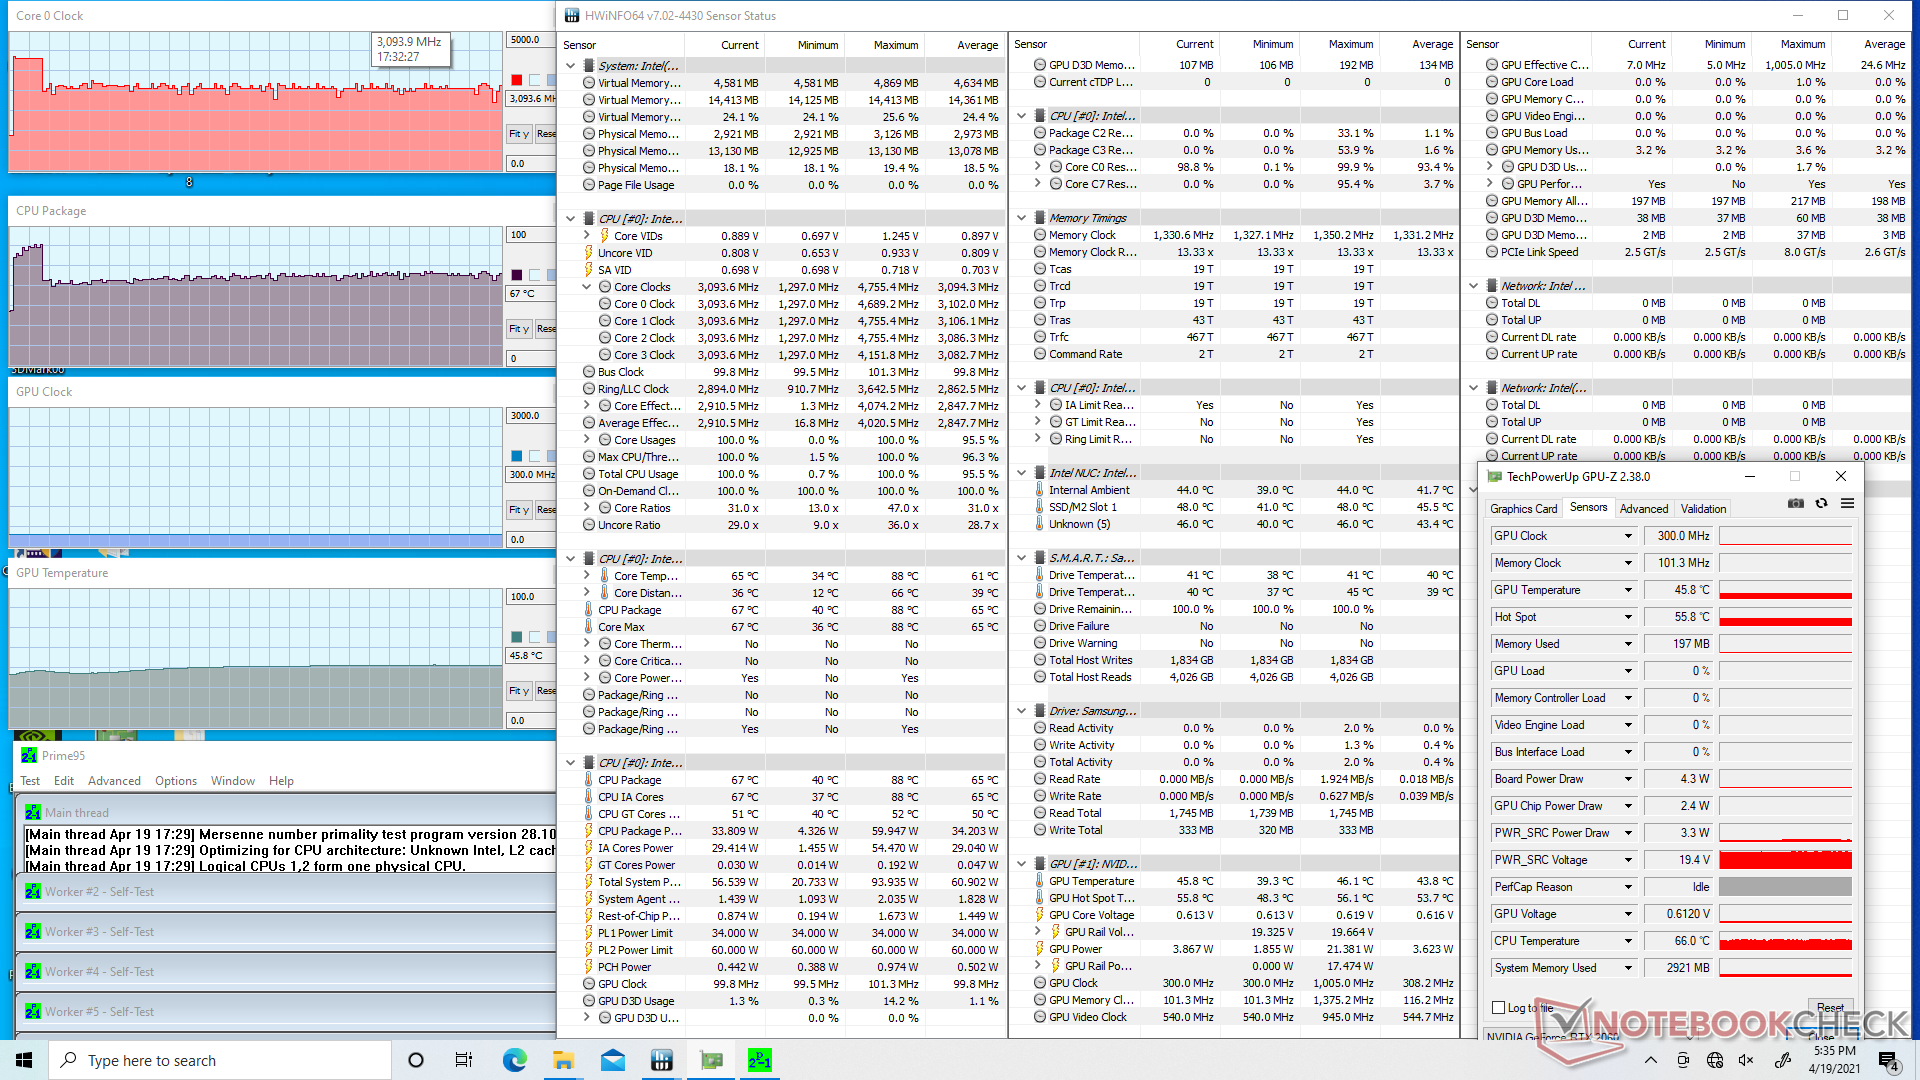
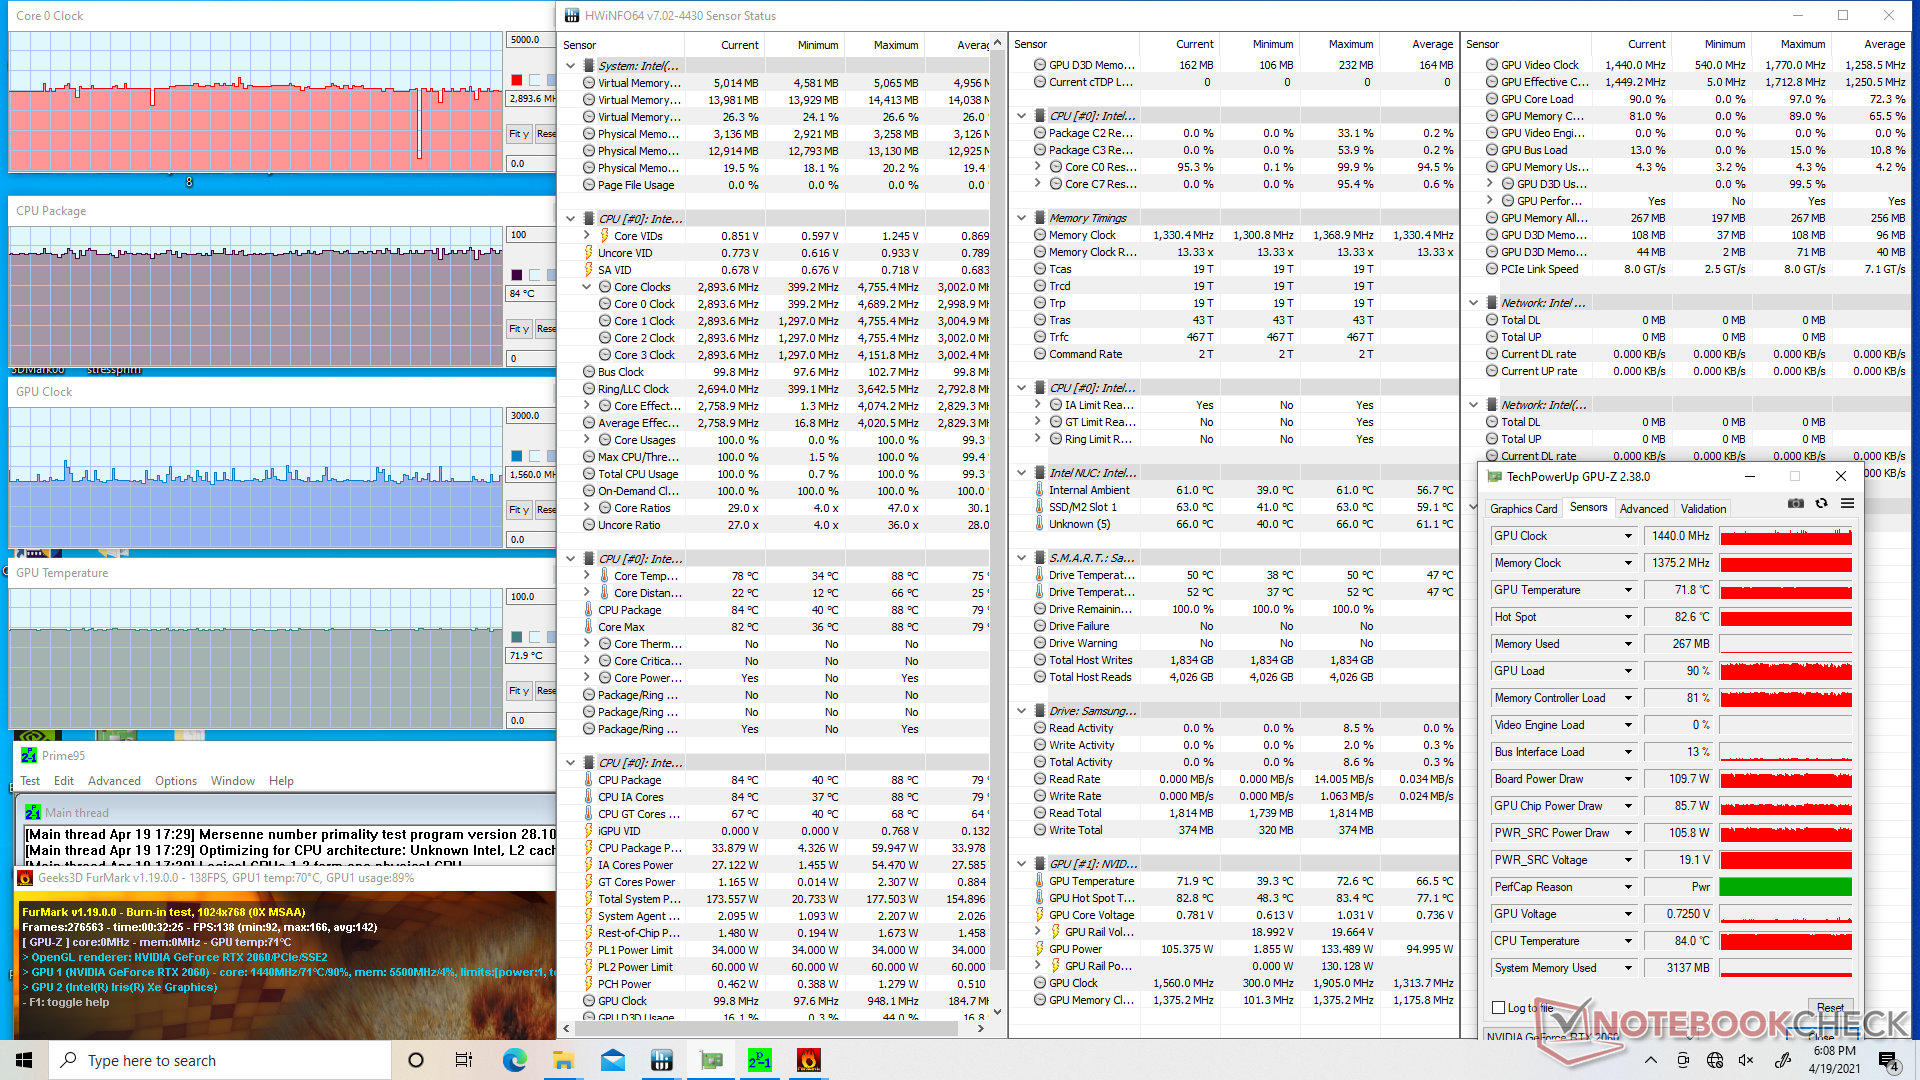
| CPU Clock (GHz) | GPU Clock (MHz) | Average CPU Temperature (°C) | Average GPU Temperature (°C) | |
| System Idle | -- | -- | 44 | 43 |
| Prime95 Stress | 3.0 - 3.2 | -- | 67 | 46 |
| Prime95 + FurMark Stress | 2.9 | 1440 | 84 | 72 |
| Witcher 3 Stress | 1.5 - 4.2 | 1830 | 63 | 69 |
Energy Management
Power Consumption
Idling on desktop will draw as low as 5 W to 6 W when no displays or USB devices are connected to 21 W when keyboards, mice, and displays are connected with the discrete GPU active. Power consumption when gaming can be about 30 to 60 percent higher than the Hades Canyon NUC which is fair considering the 70 to 100 percent boost in graphics performance.
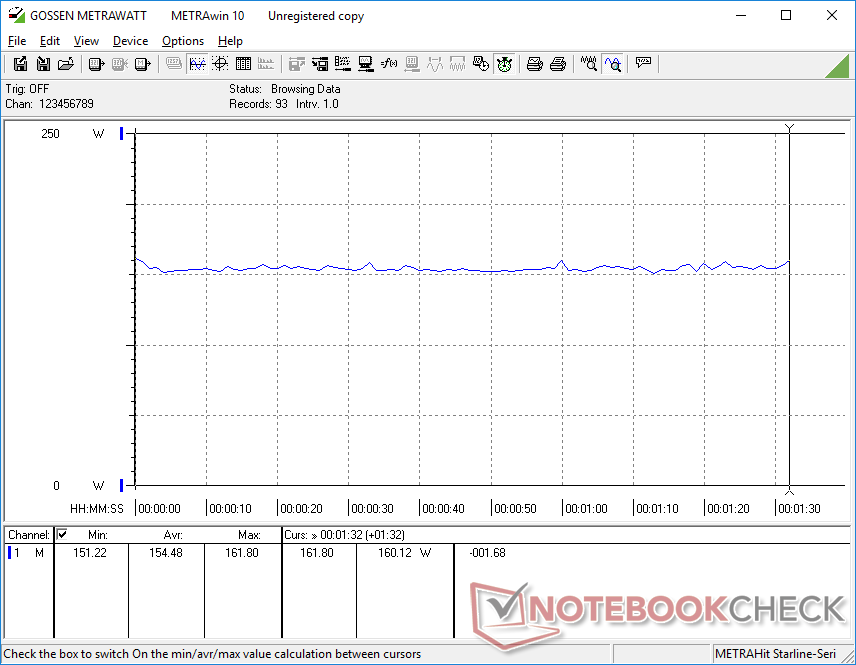
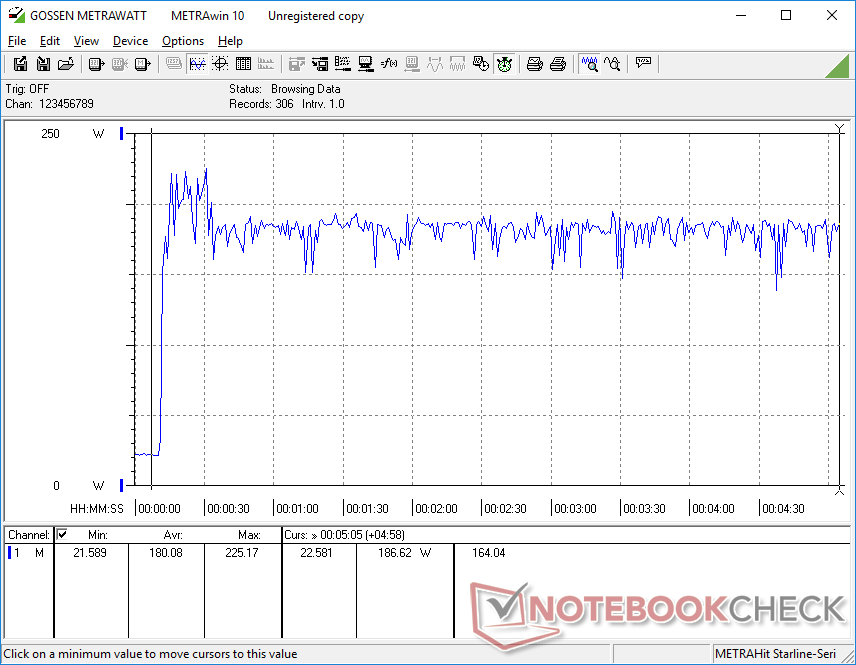
We're able to record a maximum temporary draw of 225 W from the large (~20 x 10 x 2 cm) 240 W AC adapter when running Prime95 and FurMark simultaneously. Note that the NUC11 Phantom Canyon uses the same Lite-On AC adapter as the NUC8 Hades Canyon and so they are interchangeable.
| Off / Standby | |
| Idle | |
| Load |
|
Key:
min: | |
| Intel NUC11PHKi7C i7-1165G7, GeForce RTX 2060 Mobile, Samsung SSD 980 Pro 500GB MZ-V8P500BW, , x, | Intel Hades Canyon NUC8i7HVK i7-8809G, Vega M GH, Intel Optane 120 GB SSDPEK1W120GA, , x, | Intel NUC11PAQi7 i7-1165G7, Iris Xe G7 96EUs, Samsung SSD 980 Pro 500GB MZ-V8P500BW, , x, | Zotac ZBOX Magnus EK71080 i7-7700HQ, GeForce GTX 1080 (Desktop), Samsung PM961 MZVLW256HEHP, , x, 0" | Aorus Gaming Box GeForce RTX 2080 Ti i7-1165G7, , , , x, | |
|---|---|---|---|---|---|
| Power Consumption | -40% | 49% | -131% | -154% | |
| Idle Minimum * (Watt) | 5.8 | 15.5 -167% | 5.6 3% | 27.1 -367% | 29.6 -410% |
| Idle Average * (Watt) | 5.9 | 16.2 -175% | 5.6 5% | 27.4 -364% | 29.6 -402% |
| Idle Maximum * (Watt) | 20.7 | 16.5 20% | 6 71% | 28.8 -39% | 29.6 -43% |
| Load Average * (Watt) | 130.8 | 83.4 36% | 31.4 76% | 100.4 23% | 79.9 39% |
| Witcher 3 ultra * (Watt) | 154.4 | 121.7 21% | 39 75% | 243.1 -57% | 252 -63% |
| Load Maximum * (Watt) | 225.2 | 173.5 23% | 80.5 64% | 186.7 17% | 319.8 -42% |
* ... smaller is better
Pros
Cons
Verdict

Phantom Canyon is proof that Intel has moved on from Kaby Lake-G. Gone is the novelty of an Intel-AMD chipset in favor of more off-the-shelf processors and VRAM modules commonly found on Ultrabooks and gaming laptops. This ultimately means more reliable driver support and smoother compatibility with games moving forward than what Hades Canyon could ever hope for.
Hades Canyon almost feels obsolete in front of Phantom Canyon. The latest NUC may be a bit bigger, but it's significantly faster without needing to run louder or hotter to more than make up for the gen-to-gen size increase.
Overall performance is faster than Hades Canyon as expected, but it's great to see that this doesn't come at the cost of noticeably louder fans or warmer core temperatures which is always the fear when upgrading to faster PCs.
Drawbacks include the slightly thicker size and higher power consumption than Hades Canyon, unsightly power brick, and its high street price north of $1000 USD for a barebones unit. Users will have to really value the form factor and quality of the NUC name as more powerful gaming laptops — complete with RAM and storage, by the way — can be had for around the same price point.
Price and availability
The Intel NUC11PHKi7C Phantom Canyon is not yet widely available as of this writing. Simplynuc.com is currently offering pre-orders for the system starting at $1339 USD.
Price comparison
