HP Pavilion 15-aw004ng Notebook Review
For the original German review, see here.
The HP Pavilion 15-aw004ng is a cheap 15.6 inch allrounder. The laptop runs on an AMD APU from the new Bristol Ridge generation, which promises better energy efficiency and CPU Turbo than the Carrizo predecessor. The competition of the Pavilion include the Lenovo Ideapad 500-15ACZ, the Asus F555/X555, the Acer Aspire E5-552G and the Toshiba Satellite L50-C.
The Pavilion is quite similar to the Pavilion 15 T9Y85AV. As such, we will not discuss the case, the connectivity, the input devices and the speakers in this review, unless there are differences between the models. For more information on these sections, we recommend taking a look at the review of the Pavilion 15 T9Y85AV.
Case
The Pavilion 15 T9Y85AV and our test model use almost identical cases. However, one difference is that the Pavilion 15-aw004ng packs an optical drive. Although the types, number and positioning of the ports available on each laptop are the same, the cases look different. The test model offers a black keyboard, whereas the keys of the T9Y85AV are made of silver synthetic material. The tops of both base units are different, but both laptops remain similar, as they each lack a maintenance flap and have non-removable batteries.
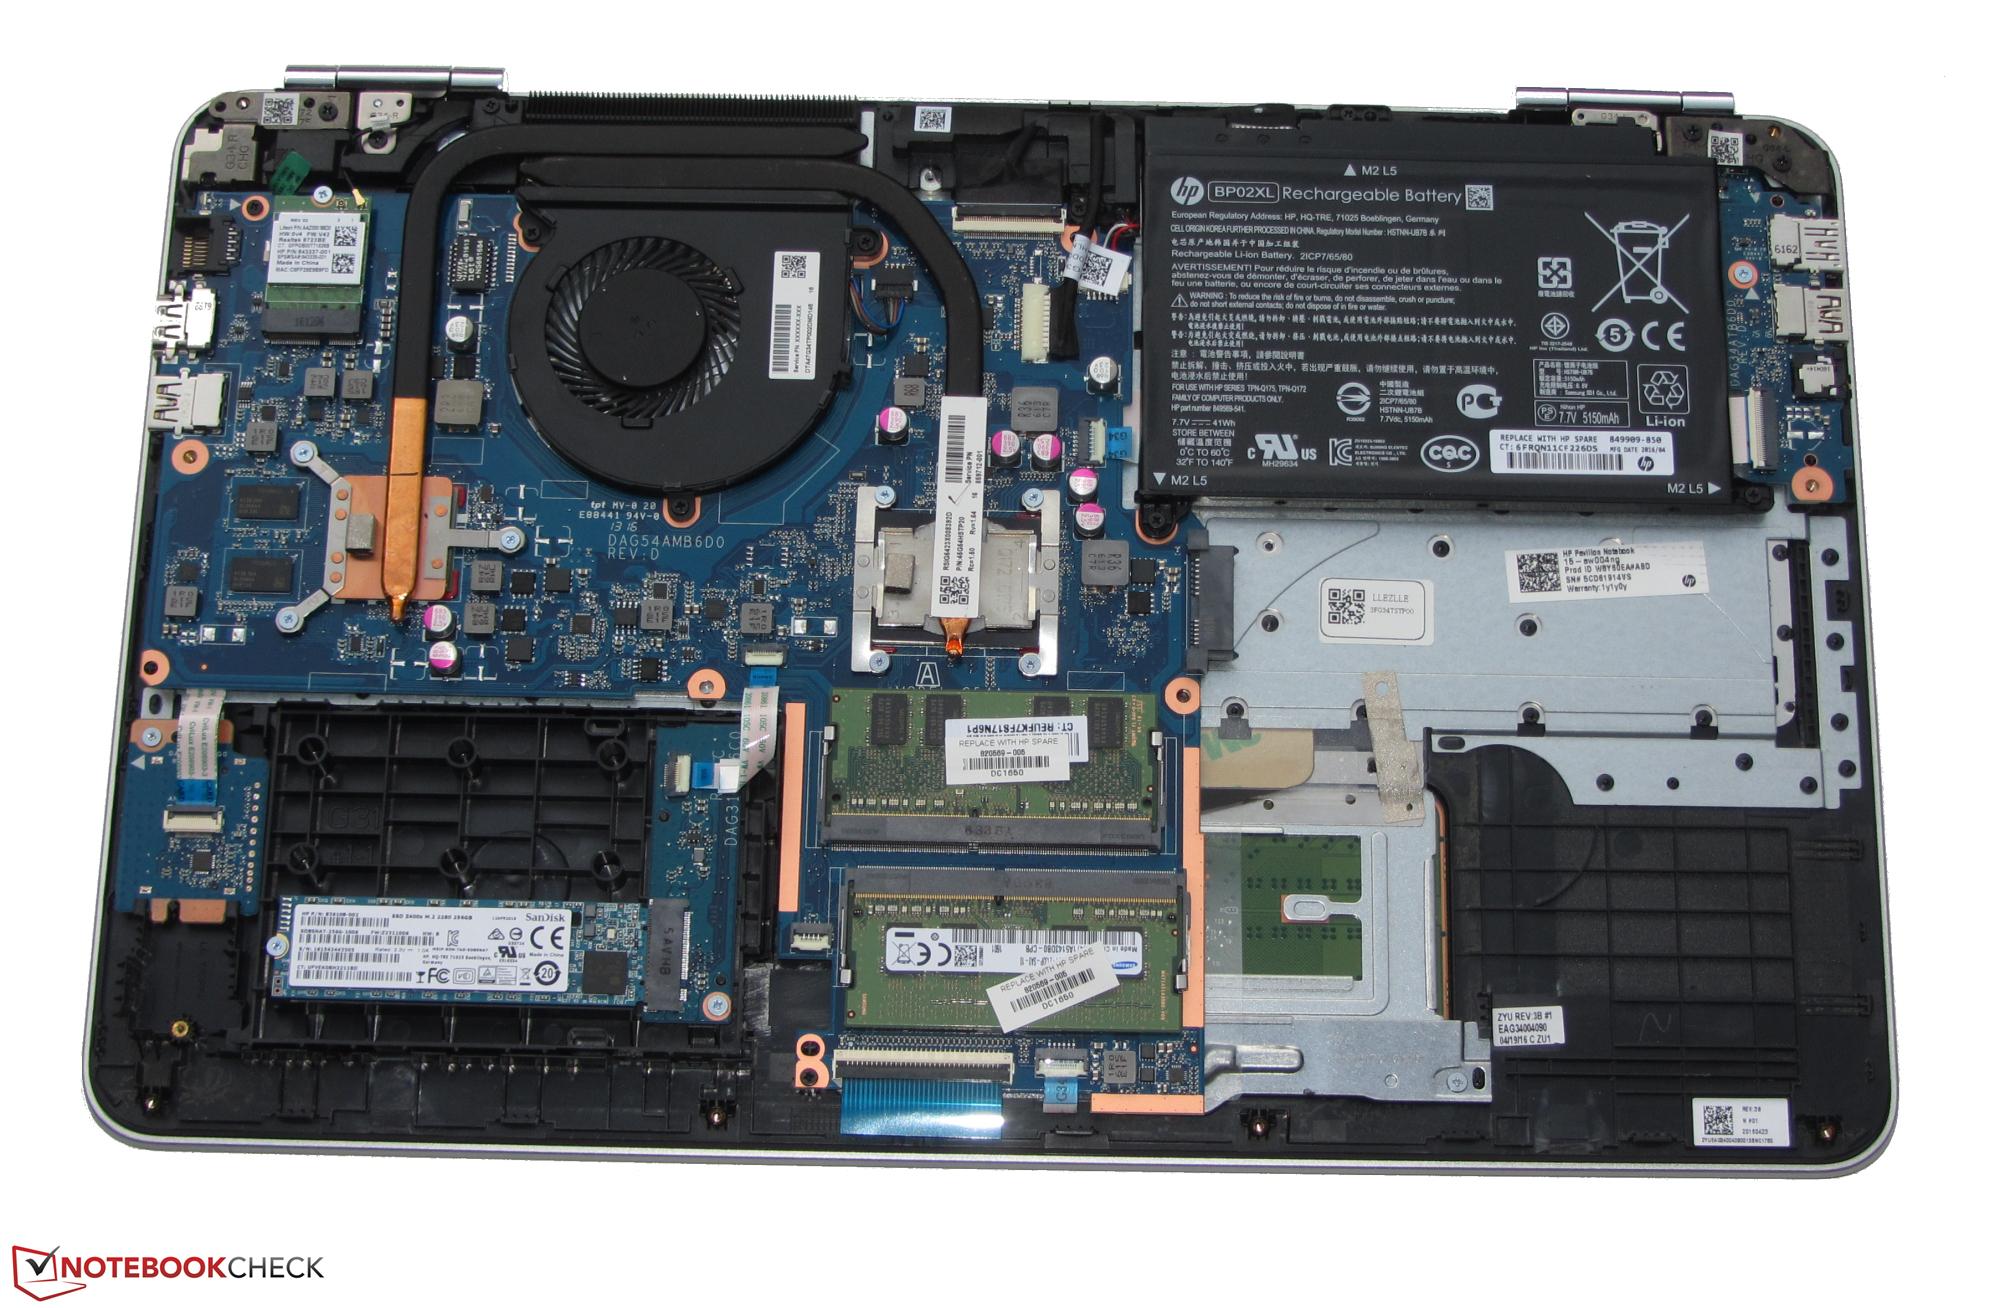
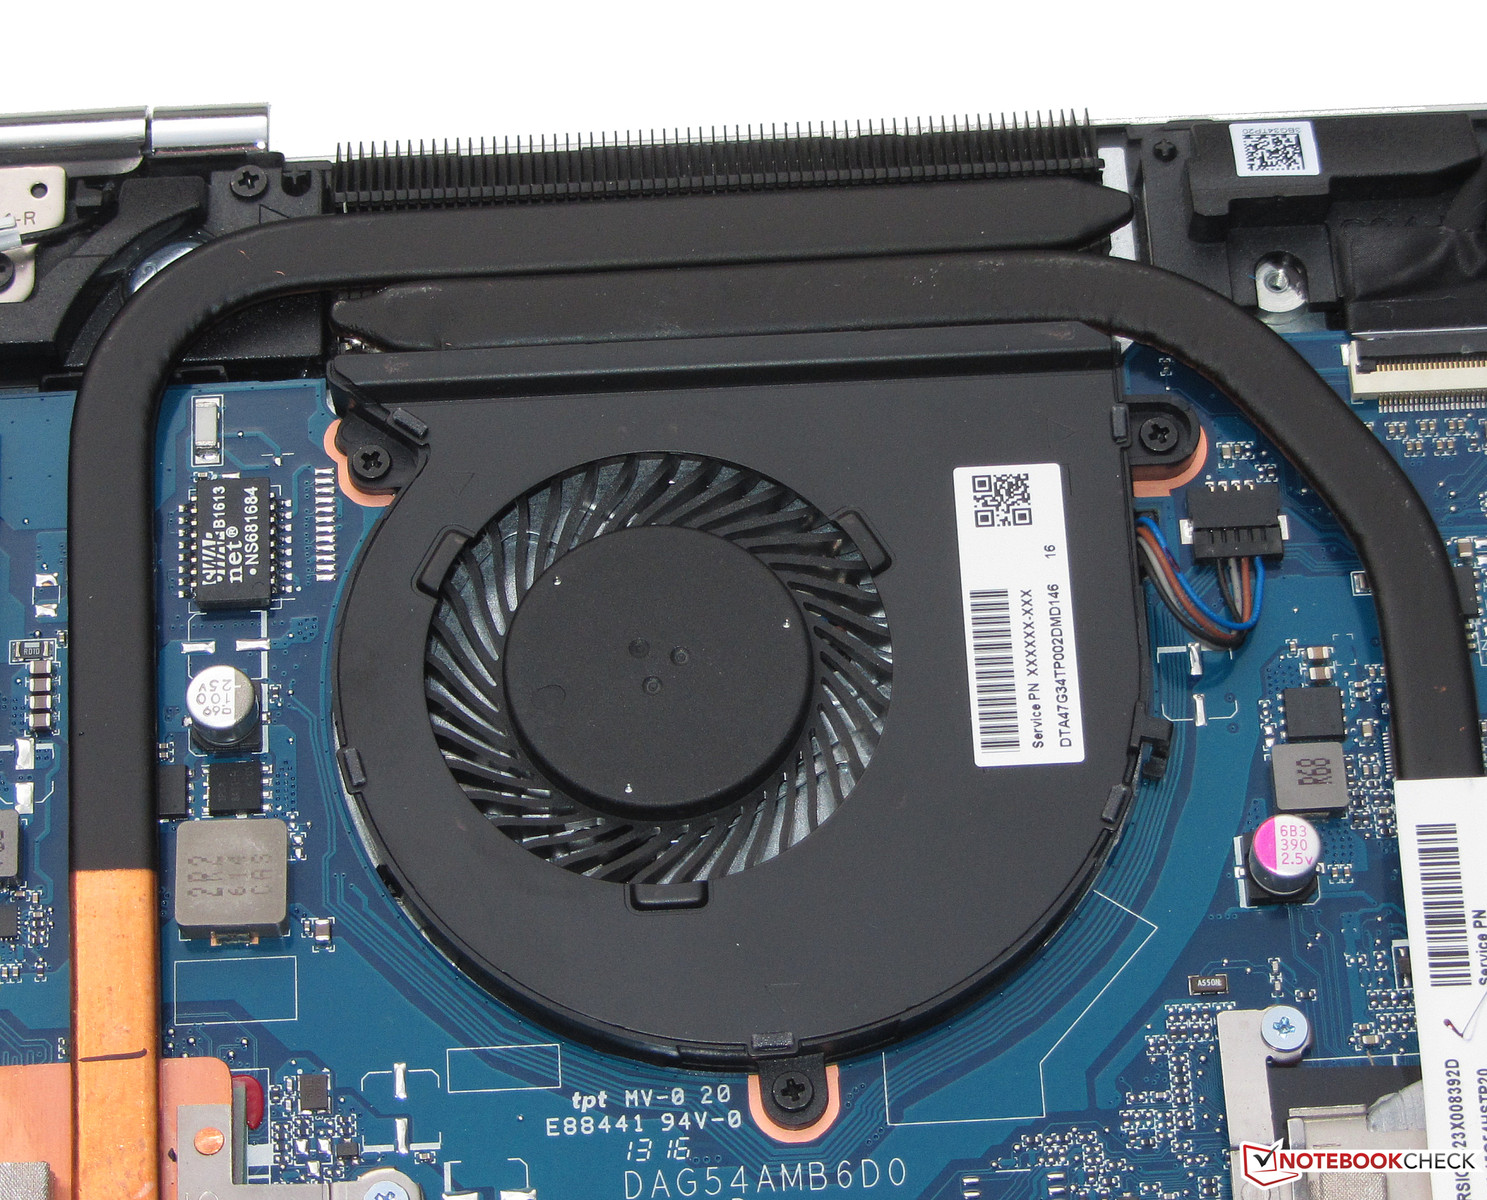
The bottom plate of the notebook must be taken off to get at the innnards of this model. The first step in this process requires the user to remove the DVD burner. Afterwards, all screws are taken out from the bottom of the laptop. The rubber strip on the back must also be removed, as it hides a screw underneath. After all screws have been extracted, the user can pry off the bottom panel of the notebook using a thin-edged tool.


Connectivity
SD Card Reader
The card reader of the laptop is quite fast. While copying large data blocks, it offers a max speed of 85.3 MB/s. The transfer of 250 jpg images (each 5 MB) is performed at 57.3 MB/s. We tested the memory card using a reference card (Toshiba Exceria Pro SDXC 64 GB UHS-II).
| SD Card Reader | |
| average JPG Copy Test (av. of 3 runs) | |
| Toshiba Satellite L50-C-275 | |
| HP Pavilion 15-aw004ng W8Y60EA | |
| Lenovo Ideapad 500-15ACZ | |
| Lenovo Ideapad 310-15ISK | |
| Asus F555UB-XO043T | |
| Acer Aspire E5-552G-F62G | |
| maximum AS SSD Seq Read Test (1GB) | |
| Toshiba Satellite L50-C-275 | |
| HP Pavilion 15-aw004ng W8Y60EA | |
| Lenovo Ideapad 500-15ACZ | |
| Lenovo Ideapad 310-15ISK | |
| Asus F555UB-XO043T | |
| Acer Aspire E5-552G-F62G | |
Communication
The WLAN module of the test model is a Realtek chip (RTL8723BE), which supports the 802.11b/g/n and fast ac WLAN standards. We tested the device in optimal conditions (no other WLAN devices nearby and notebook placed close to the server PC) and found the transfer speeds to be acceptable, but far slower than the industry average.
| Networking | |
| iperf Server (receive) TCP 1 m | |
| Lenovo Ideapad 310-15ISK | |
| HP Pavilion 15-aw004ng W8Y60EA | |
| iperf Client (transmit) TCP 1 m | |
| Lenovo Ideapad 310-15ISK | |
| HP Pavilion 15-aw004ng W8Y60EA | |
Display

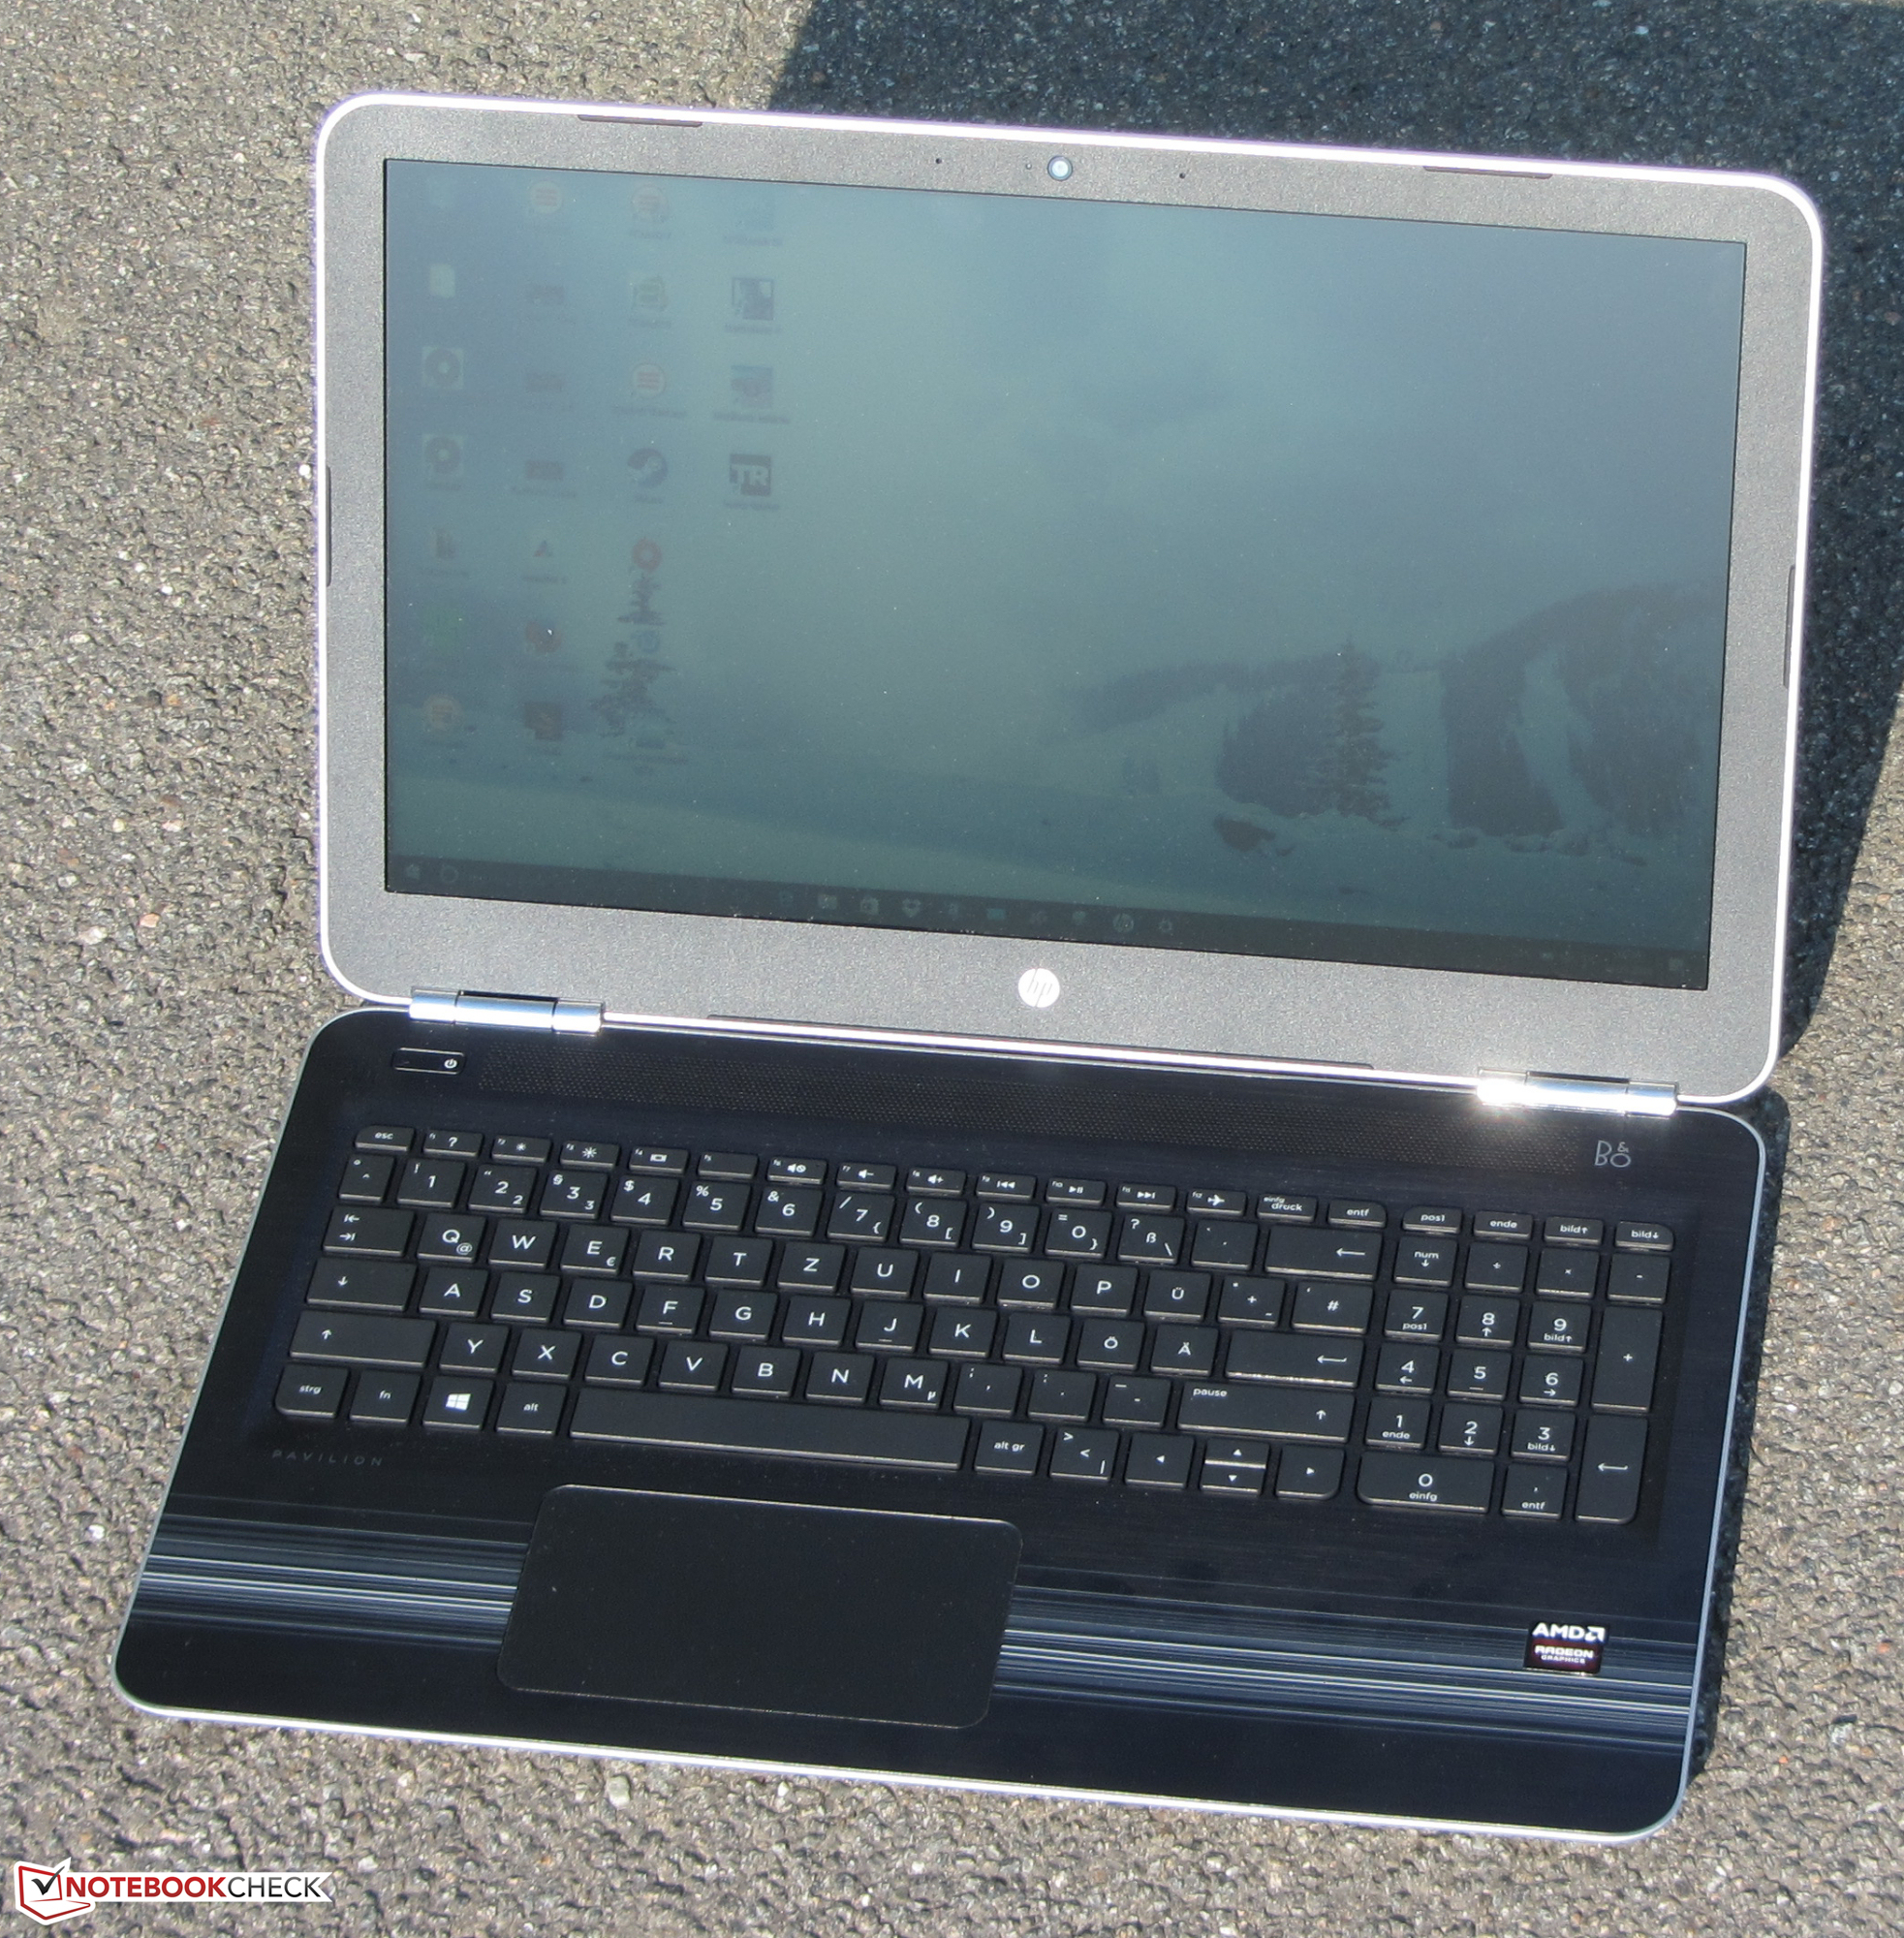
HP has equipped the Pavilion with a matte 15.6 inch display offering a native resolution of 1,920 x 1,080 pixels. The brightness (227.8 cd/m²) and the contrast (490:1) are very low. However, considering the price of this laptop, these flaws are acceptable. Pro: the screen did not show any signs of PWN flickering.
| |||||||||||||||||||||||||
Brightness Distribution: 89 %
Center on Battery: 139 cd/m²
Contrast: 490:1 (Black: 0.49 cd/m²)
ΔE ColorChecker Calman: 10.96 | ∀{0.5-29.43 Ø4.71}
ΔE Greyscale Calman: 11.34 | ∀{0.09-98 Ø4.96}
60% sRGB (Argyll 1.6.3 3D)
39% AdobeRGB 1998 (Argyll 1.6.3 3D)
41.71% AdobeRGB 1998 (Argyll 3D)
60.3% sRGB (Argyll 3D)
40.35% Display P3 (Argyll 3D)
Gamma: 2.27
CCT: 12292 K
| HP Pavilion 15-aw004ng W8Y60EA TN LED, 1920x1080 | Acer Aspire E5-552G-F62G TN LED, 1920x1080 | Lenovo Ideapad 500-15ACZ TN LED, 1920x1080 | Toshiba Satellite L50-C-275 IPS, 1920x1080 | Asus F555UB-XO043T TN LED, 1366x768 | Lenovo Ideapad 310-15ISK TN LED, 1366x768 | |
|---|---|---|---|---|---|---|
| Display | -8% | -1% | 47% | -5% | -8% | |
| Display P3 Coverage (%) | 40.35 | 37.13 -8% | 39.82 -1% | 64.1 59% | 38.22 -5% | 37.06 -8% |
| sRGB Coverage (%) | 60.3 | 55.9 -7% | 59.7 -1% | 82.9 37% | 57.5 -5% | 55.8 -7% |
| AdobeRGB 1998 Coverage (%) | 41.71 | 38.36 -8% | 41.16 -1% | 60.6 45% | 39.49 -5% | 38.29 -8% |
| Response Times | -3% | -5% | 25% | -15% | 19% | |
| Response Time Grey 50% / Grey 80% * (ms) | 41 ? | 45 ? -10% | 43 ? -5% | 24 ? 41% | 46 ? -12% | 27 ? 34% |
| Response Time Black / White * (ms) | 23 ? | 22 ? 4% | 24 ? -4% | 21 ? 9% | 27 ? -17% | 22 ? 4% |
| PWM Frequency (Hz) | 50 ? | 50 ? | 50 ? | |||
| Screen | -3% | -3% | 46% | 9% | 5% | |
| Brightness middle (cd/m²) | 240 | 200 -17% | 238 -1% | 294 23% | 214 -11% | 200 -17% |
| Brightness (cd/m²) | 228 | 196 -14% | 221 -3% | 285 25% | 205 -10% | 198 -13% |
| Brightness Distribution (%) | 89 | 76 -15% | 84 -6% | 83 -7% | 82 -8% | 83 -7% |
| Black Level * (cd/m²) | 0.49 | 0.34 31% | 0.49 -0% | 0.26 47% | 0.46 6% | 0.28 43% |
| Contrast (:1) | 490 | 588 20% | 486 -1% | 1131 131% | 465 -5% | 714 46% |
| Colorchecker dE 2000 * | 10.96 | 11.54 -5% | 11.19 -2% | 5.07 54% | 6.52 41% | 10.63 3% |
| Colorchecker dE 2000 max. * | 18.36 | 19.36 -5% | 19.6 -7% | 9.33 49% | 9.1 50% | 15.69 15% |
| Greyscale dE 2000 * | 11.34 | 12.98 -14% | 11.53 -2% | 4.25 63% | 7.05 38% | 11.19 1% |
| Gamma | 2.27 97% | 2.58 85% | 2.41 91% | 2.49 88% | 2.41 91% | 1.78 124% |
| CCT | 12292 53% | 14060 46% | 13057 50% | 6597 99% | 8623 75% | 11258 58% |
| Color Space (Percent of AdobeRGB 1998) (%) | 39 | 36 -8% | 38 -3% | 54 38% | 36.6 -6% | 35 -10% |
| Color Space (Percent of sRGB) (%) | 60 | 56 -7% | 60 0% | 83 38% | 57.8 -4% | 56 -7% |
| Total Average (Program / Settings) | -5% /
-4% | -3% /
-2% | 39% /
43% | -4% /
3% | 5% /
5% |
* ... smaller is better
Screen Flickering / PWM (Pulse-Width Modulation)
| Screen flickering / PWM not detected | ||
In comparison: 52 % of all tested devices do not use PWM to dim the display. If PWM was detected, an average of 7741 (minimum: 5 - maximum: 343500) Hz was measured. | ||


Out of the box, the display has a DeltaE 2000 color deviation of 10.96. The ideal range of a DeltaE lower than 3 is clearly missed. Furthermore, the panel has a distinct blue tinge. The AdobeRGB and sRGB color spectrums can not be fully covered: 39% (AdobeRGB) and 60% (sRGB) coverage.


Display Response Times
| ↔ Response Time Black to White | ||
|---|---|---|
| 23 ms ... rise ↗ and fall ↘ combined | ↗ 10 ms rise | 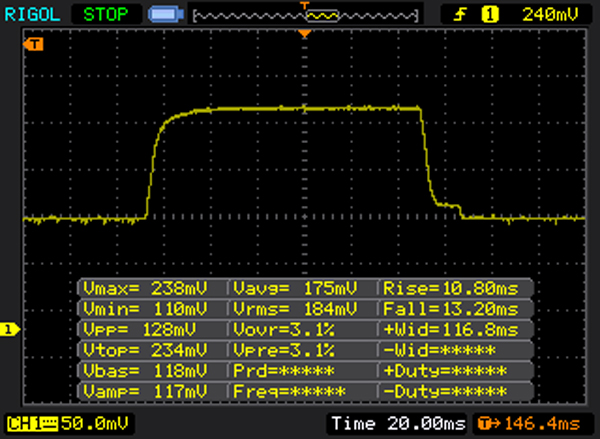 |
| ↘ 13 ms fall | ||
| The screen shows good response rates in our tests, but may be too slow for competitive gamers. In comparison, all tested devices range from 0.1 (minimum) to 240 (maximum) ms. » 52 % of all devices are better. This means that the measured response time is worse than the average of all tested devices (19.8 ms). | ||
| ↔ Response Time 50% Grey to 80% Grey | ||
| 41 ms ... rise ↗ and fall ↘ combined | ↗ 19 ms rise |  |
| ↘ 22 ms fall | ||
| The screen shows slow response rates in our tests and will be unsatisfactory for gamers. In comparison, all tested devices range from 0.165 (minimum) to 636 (maximum) ms. » 65 % of all devices are better. This means that the measured response time is worse than the average of all tested devices (30.9 ms). | ||
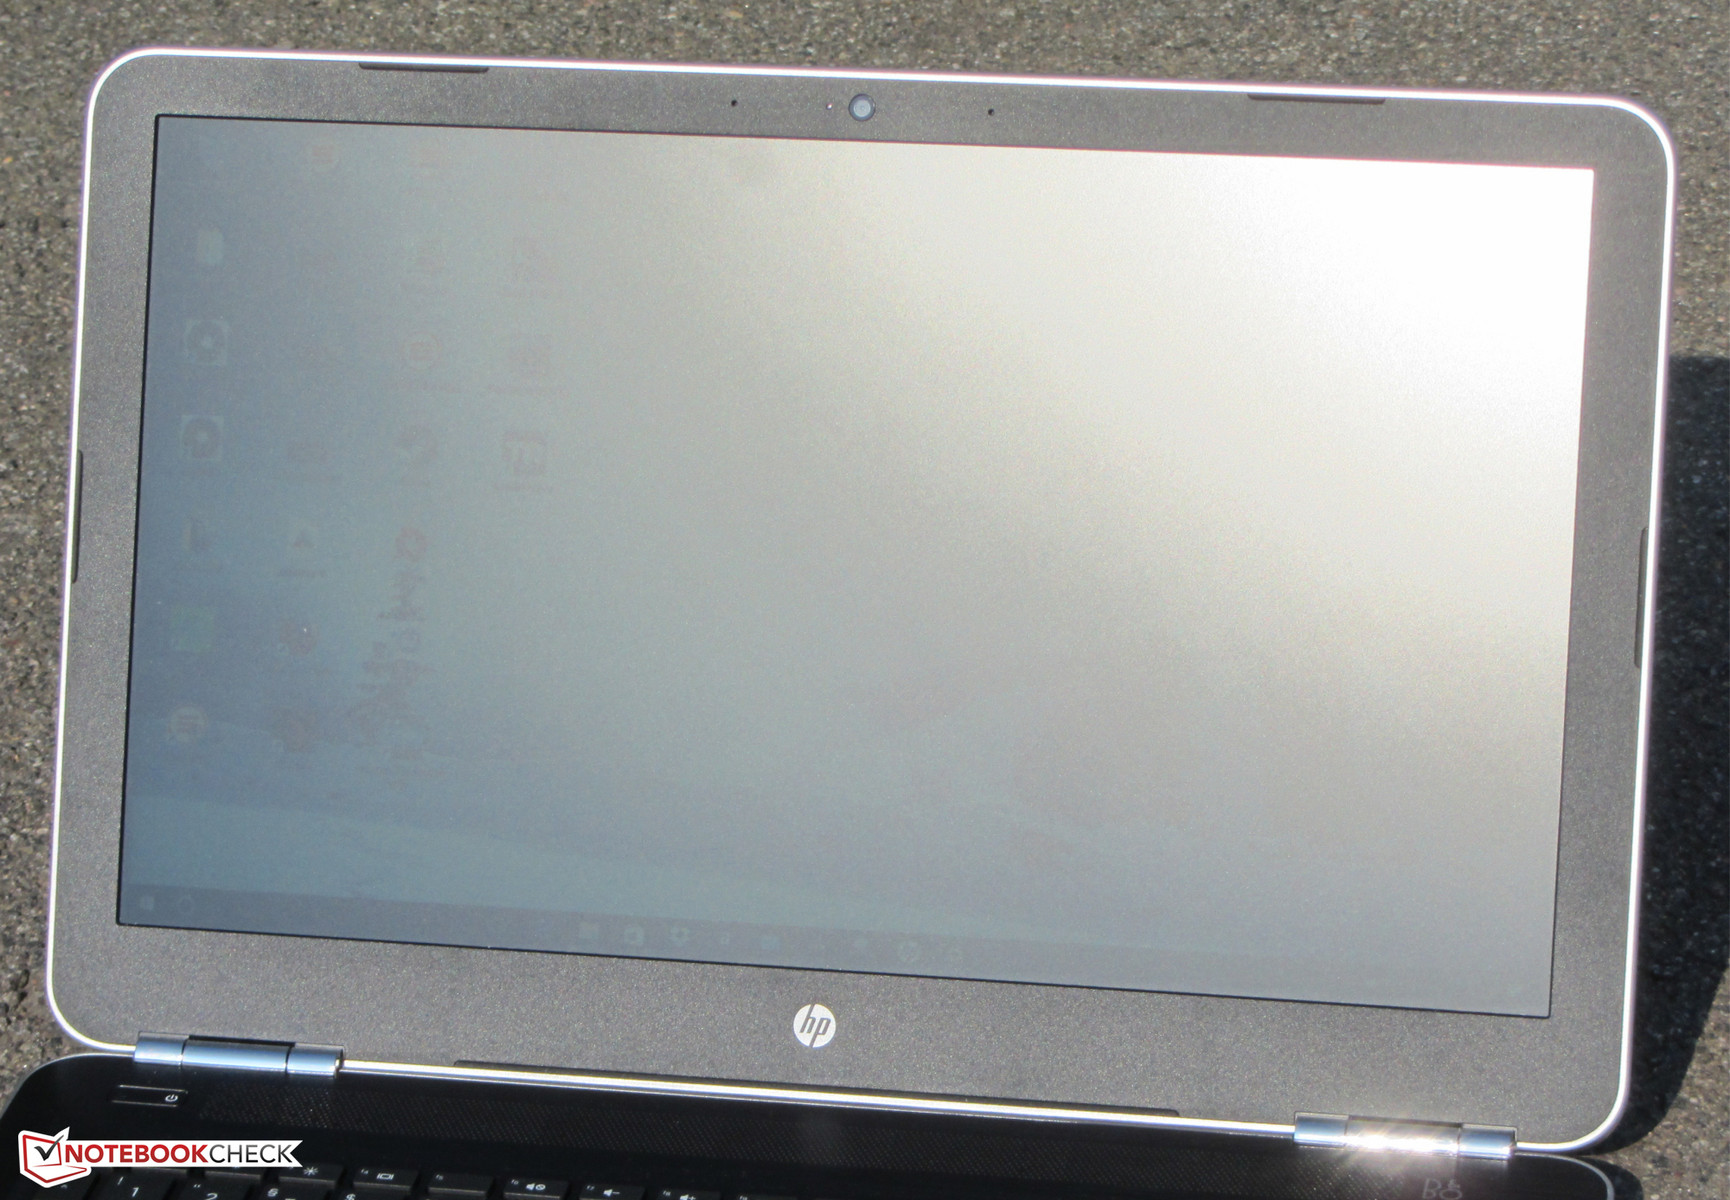
HP has chosen a TN panel for the test model. This means that the displayed content is not clearly visible from all viewing angles. Outdoors, it is quite difficult to use the notebook, as the brightness drops to 139 cd/m² while on battery.


Performance
The HP Pavilion 15-aw004ng is definitely a cheap 15.6 inch allrounder, as it packs a CPU capable of handling the workload in most scenarios. Furthermore, the laptop can run games well. Our test configuration was available for 550 Euros and it is possible to find other variations.


Processor
The Pavilion uses the AMD A10-9600P APU (Bristol Ridge), which is very similar to its predecessor (Carrizo), as AMD has mainly focused on optimizations. As such, the CPU has a stronger and longer Turbo mode, which raises the performance of this APU relative to the Carrizo predecessor. The TDP value of 15 W matches Intel ULV processors. The CPU part of the APU is a quad-core processor, which has a base clock speed of 2.4 GHz. Thanks to Turbo, it is possible for the APU to run at up to 3.3 GHz. The full Turbo speed is not used much, as in our CPU tests, the processor ran primarily at 2.6 GHz. We rarely saw the speed counter hit 3.3 GHz.

| Geekbench 3 | |
| 32 Bit Single-Core Score | |
| Asus F555UB-XO043T | |
| Toshiba Satellite L50-C-275 | |
| Asus F555LJ-XX110H | |
| HP Pavilion 15-aw004ng W8Y60EA | |
| Lenovo Ideapad 500-15ACZ | |
| 32 Bit Multi-Core Score | |
| Asus F555UB-XO043T | |
| Toshiba Satellite L50-C-275 | |
| HP Pavilion 15-aw004ng W8Y60EA | |
| Lenovo Ideapad 500-15ACZ | |
| Asus F555LJ-XX110H | |
| JetStream 1.1 - 1.1 Total | |
| Lenovo Ideapad 310-15ISK | |
| Asus F555UB-XO043T | |
| Toshiba Satellite L50-C-275 | |
| HP Pavilion 15-aw004ng W8Y60EA | |
| Lenovo Ideapad 500-15ACZ | |
| Mozilla Kraken 1.1 - Total | |
| Asus F555LJ-XX110H | |
| Lenovo Ideapad 500-15ACZ | |
| HP Pavilion 15-aw004ng W8Y60EA | |
| Asus F555UB-XO043T | |
| Toshiba Satellite L50-C-275 | |
| Octane V2 - Total Score | |
| Toshiba Satellite L50-C-275 | |
| Asus F555UB-XO043T | |
| HP Pavilion 15-aw004ng W8Y60EA | |
| Lenovo Ideapad 500-15ACZ | |
| Asus F555LJ-XX110H | |
* ... smaller is better
System Performance
The system runs smoothly and we did not encounter any issues. The results of the PC Mark benchmarks are very good and it is not possible to increase the performance of the laptop further. HP has already optimized this model to its limits.

| PCMark 7 Score | 4340 points | |
| PCMark 8 Home Score Accelerated v2 | 2904 points | |
| PCMark 8 Creative Score Accelerated v2 | 3569 points | |
| PCMark 8 Work Score Accelerated v2 | 3883 points | |
Help | ||
Storage Device
The system drive is a SSD from Sandisk. This M.2 drive offers 256 GB of capacity, but a mere 190 GB is free to the user. The rest of the space is occupied by the Windows installation and the Recovery partition. The transfer speeds are good.
The M.2 SSD could be swapped out for a traditional 2.5 inch hard disk, but a specific cable would be needed (HP Spare Number 856352-001).


| HP Pavilion 15-aw004ng W8Y60EA | Acer Aspire E5-552G-F62G Western Digital Scorpio Blue WD5000LPVX | Lenovo Ideapad 500-15ACZ Seagate Momentus SpinPoint M8 ST1000LM024 | Toshiba Satellite L50-C-275 Samsung SSD PM871 MZNLN256HCHP | Asus F555UB-XO043T Seagate Momentus SpinPoint M8 ST1000LM024 | |
|---|---|---|---|---|---|
| CrystalDiskMark 3.0 | -88% | -89% | 67% | -89% | |
| Read Seq (MB/s) | 503 | 110.7 -78% | 96.3 -81% | 490.6 -2% | 108.5 -78% |
| Write Seq (MB/s) | 316.6 | 108.9 -66% | 95.9 -70% | 304.1 -4% | 106.2 -66% |
| Read 512 (MB/s) | 261.9 | 36.71 -86% | 36.46 -86% | 414.6 58% | 34.52 -87% |
| Write 512 (MB/s) | 281.2 | 53.7 -81% | 42.75 -85% | 299.6 7% | 42.45 -85% |
| Read 4k (MB/s) | 17.04 | 0.415 -98% | 0.451 -97% | 36.82 116% | 0.391 -98% |
| Write 4k (MB/s) | 46.55 | 1.261 -97% | 0.895 -98% | 99.5 114% | 0.855 -98% |
| Read 4k QD32 (MB/s) | 125 | 1.126 -99% | 0.847 -99% | 333.4 167% | 0.774 -99% |
| Write 4k QD32 (MB/s) | 131.4 | 1.312 -99% | 0.892 -99% | 236.8 80% | 0.852 -99% |
Graphics Card
The Pavilion boasts a dual-graphics system from AMD: the Radeon R8 M445DX. This system uses the Radeon R5 IGP (integrated graphics processor) and the dedicated Radeon R7 M440 GPU. Both GPUs work together in CrossFire mode and take turns crunching frames (Alternate Frame Rendering). This combo scores high points in the 3D Mark benchmarks and the dual-graphics setup from AMD ranks higher than middle-class Nvidia GPUs.

| 3DMark 06 Standard Score | 8878 points | |
| 3DMark Vantage P Result | 6853 points | |
| 3DMark 11 Performance | 2979 points | |
| 3DMark Ice Storm Standard Score | 44367 points | |
| 3DMark Cloud Gate Standard Score | 5225 points | |
| 3DMark Fire Strike Score | 1678 points | |
| 3DMark Fire Strike Extreme Score | 686 points | |
| 3DMark Time Spy Score | 315 points | |
Help | ||
| 3DMark 11 - 1280x720 Performance GPU | |
| Acer Aspire E5-552G-F62G | |
| HP Pavilion 15-aw004ng W8Y60EA | |
| Lenovo Ideapad 500-15ACZ | |
| Asus F555UB-XO043T | |
| HP Pavilion 15-aw004ng | |
| Toshiba Satellite L50-C-275 | |
| Lenovo Ideapad 310-15ISK | |
| 3DMark | |
| 1280x720 Cloud Gate Standard Graphics | |
| HP Pavilion 15-aw004ng W8Y60EA | |
| Acer Aspire E5-552G-F62G | |
| Lenovo Ideapad 500-15ACZ | |
| Asus F555UB-XO043T | |
| Toshiba Satellite L50-C-275 | |
| HP Pavilion 15-aw004ng | |
| 1920x1080 Fire Strike Graphics | |
| HP Pavilion 15-aw004ng W8Y60EA | |
| Asus F555UB-XO043T | |
| Toshiba Satellite L50-C-275 | |
| Lenovo Ideapad 500-15ACZ | |
| HP Pavilion 15-aw004ng | |
Gaming Performance
The Pavilion can run games, but if they are hardware-hungry the laptop will run into problems. In general, a HD resolution of 1,366 x 768 pixels and low to medium quality settings are possible. In some cases, it is possible for the laptop to offer more. However, the 2016 games we tested did not run at all. Despite the dual-graphics setup performing better than the Nvidia competition in 3D Mark benchmarks, the Nvidia GPUs have an edge in gaming, as our test GPU falls between the GeForce 920M GPU and the GeForce 930M GPU in terms of in-game performance.
| low | med. | high | ultra | |
|---|---|---|---|---|
| Counter-Strike: GO (2012) | 82 | 77.8 | 71.7 | 50.3 |
| Tomb Raider (2013) | 83.6 | 55.7 | 46.3 | 21.8 |
| BioShock Infinite (2013) | 72.7 | 42.9 | 33.7 | 11.7 |
| Battlefield 4 (2013) | 50.1 | 37.2 | 23.4 | 7.7 |
| Middle-earth: Shadow of Mordor (2014) | 33.3 | 21.3 | 12.2 | |
| Alien: Isolation (2014) | 51.6 | 42.7 | 28 | |
| F1 2014 (2014) | 59 | 42 | 39 | 24 |
| Dragon Age: Inquisition (2014) | 40.8 | 27.8 | 9.6 | |
| Battlefield Hardline (2015) | 37.7 | 29.3 | 14 | 8.3 |
| GTA V (2015) | 54.6 | 52.4 | 11.7 | |
| Batman: Arkham Knight (2015) | 19 | 17 | 7 | |
| Metal Gear Solid V (2015) | 60 | 37.5 | 13.3 | |
| FIFA 16 (2015) | 77.5 | 53.8 | 25 | |
| Anno 2205 (2015) | 36 | 17.8 | 7.4 | |
| Call of Duty: Black Ops 3 (2015) | 38.1 | 26.2 | 11.7 | |
| Assassin's Creed Syndicate (2015) | 15.9 | 13.1 | 6.6 | |
| Rainbow Six Siege (2015) | 53.5 | 33.7 | 13.3 | |
| Rise of the Tomb Raider (2016) | 24.4 | 13.9 | 7.7 | |
| XCOM 2 (2016) | 22 | 8 | 5.2 | |
| Far Cry Primal (2016) | 23 | 10 | 9 | |
| The Division (2016) | 23.3 | 15.1 | 7.1 | |
| Hitman 2016 (2016) | 18.6 | 17.7 | 10.5 | |
| Need for Speed 2016 (2016) | 25.6 | 22.6 | 11.7 | 9.5 |
| Ashes of the Singularity (2016) | 14.2 | 7 | 6.2 | |
| Doom (2016) | 22.4 | 12.8 | 8.3 | |
| Mirror's Edge Catalyst (2016) | 26.4 | 12.8 | 5.8 | |
| No Man's Sky (2016) | 21.8 | 18 | 10 | |
| Deus Ex Mankind Divided (2016) | 15.1 | 10.9 | 5.4 |
| BioShock Infinite - 1366x768 Medium Preset | |
| Asus F555UB-XO043T | |
| Toshiba Satellite L50-C-275 | |
| HP Pavilion 15-aw004ng W8Y60EA | |
| HP Pavilion 15-aw004ng | |
| Lenovo Ideapad 310-15ISK | |
| Lenovo Ideapad 500-15ACZ | |
| Tomb Raider - 1366x768 Normal Preset AA:FX AF:4x | |
| Toshiba Satellite L50-C-275 | |
| HP Pavilion 15-aw004ng W8Y60EA | |
| Lenovo Ideapad 500-15ACZ | |
| Battlefield 4 - 1024x768 Low Preset | |
| HP Pavilion 15-aw004ng | |
| HP Pavilion 15-aw004ng W8Y60EA | |
| Lenovo Ideapad 500-15ACZ | |
| Acer Aspire E5-552G-F62G | |
| FIFA 16 - 1366x768 High Preset AA:2x MS | |
| HP Pavilion 15-aw004ng W8Y60EA | |
| Lenovo Ideapad 500-15ACZ | |
| Acer Aspire E5-552G-F62G | |
| GTA V - 1024x768 Lowest Settings possible | |
| Lenovo Ideapad 310-15ISK | |
| HP Pavilion 15-aw004ng W8Y60EA | |
| F1 2014 - 1920x1080 High Preset | |
| Lenovo Ideapad 310-15ISK | |
| HP Pavilion 15-aw004ng W8Y60EA | |
| Lenovo Ideapad 500-15ACZ | |
| Counter-Strike: GO - 1366x768 High AA:2x MS AF:4x | |
| HP Pavilion 15-aw004ng W8Y60EA | |
Emissions
System Noise
The fan of the HP laptop runs at a slow speed while the laptop is idle. At this level, it is barely audible. The fan is alwas on due to the HP BIOS option "fan always on". Once this option is deactivated, the fan can turn off. At load, the noise emission rise distinctly. Unfortunately, the test model produced an unusual sound: an electric crackling. The intensity of this noise can be adjusted, as Windows "High Performance" mode will make it louder and "Power Saver" or "Balanced" mode will make it quieter.

Noise level
| Idle |
| 31.7 / 31.9 / 31.9 dB(A) |
| HDD |
| 32.2 dB(A) |
| DVD |
| 36.6 / dB(A) |
| Load |
| 41 / 42.7 dB(A) |
 | ||
30 dB silent 40 dB(A) audible 50 dB(A) loud |
||
min: | ||
| HP Pavilion 15-aw004ng W8Y60EA A10-9600P, Radeon R8 M445DX | Acer Aspire E5-552G-F62G FX-8800P, Radeon R8 M365DX | Lenovo Ideapad 500-15ACZ A10-8700P, Radeon R6 M340DX | Toshiba Satellite L50-C-275 6200U, GeForce 930M | Asus F555UB-XO043T 6200U, GeForce 940M | Lenovo Ideapad 310-15ISK 6500U, GeForce 920MX | |
|---|---|---|---|---|---|---|
| Noise | 3% | 0% | 9% | -4% | -1% | |
| off / environment * (dB) | 31.2 | 31.3 -0% | 31.3 -0% | 22 29% | 31.2 -0% | |
| Idle Minimum * (dB) | 31.7 | 32.4 -2% | 33.1 -4% | 31.3 1% | 34 -7% | 32.6 -3% |
| Idle Average * (dB) | 31.9 | 33.2 -4% | 33.3 -4% | 31.3 2% | 34 -7% | 32.6 -2% |
| Idle Maximum * (dB) | 31.9 | 33.2 -4% | 33.5 -5% | 32.2 -1% | 34.2 -7% | 33.8 -6% |
| Load Average * (dB) | 41 | 36.5 11% | 38.9 5% | 36.4 11% | 38.9 5% | 40.2 2% |
| Load Maximum * (dB) | 42.7 | 34.4 19% | 38.9 9% | 36.6 14% | 43.6 -2% | 40.4 5% |
* ... smaller is better
Temperature
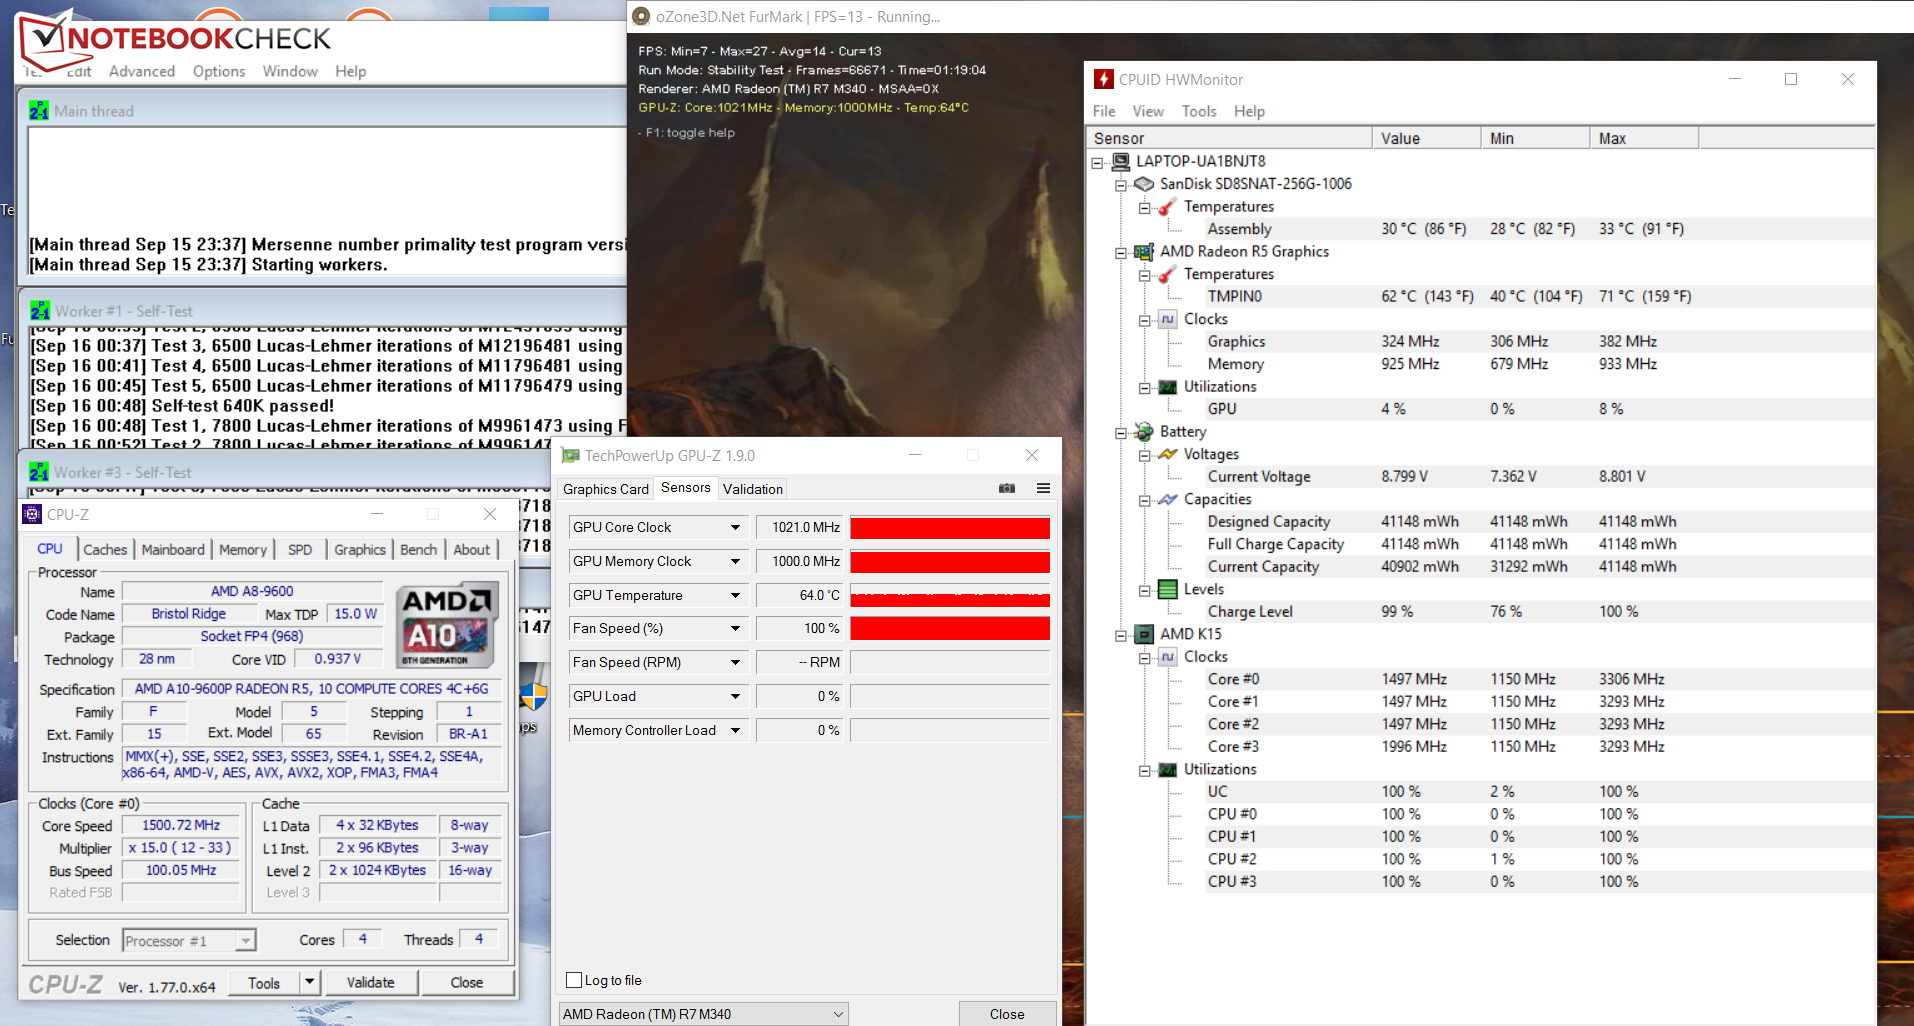
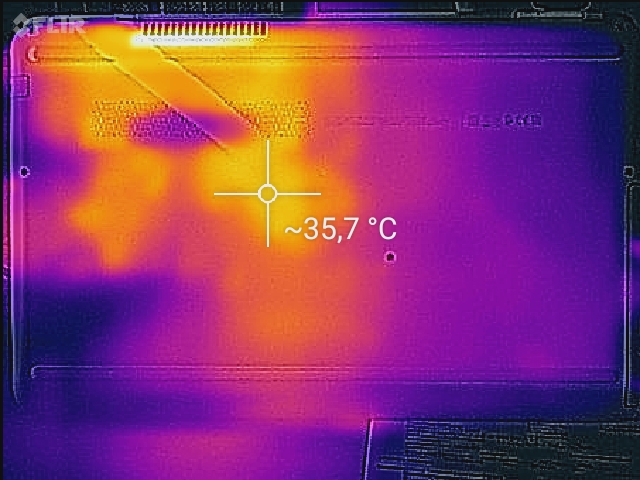
Our stress test involves running Prime95 and Furmark simultaneously for at least a hour. The Pavilion runs this test differently when it is plugged in and on battery. The CPU operates at 1.2 GHz on battery and the dedicated GPU offers 551 MHz. When the laptop is plugged in, the processors offers 1.5 to 2 GHz and the dedicated GPU runs at full power (1,021 MHz). The integrated GPU works in both cases at 320 to 340 MHz. The Pavilion barely gets hot, as all measurement points stayed well below 40 degrees Celsius during the stress test.
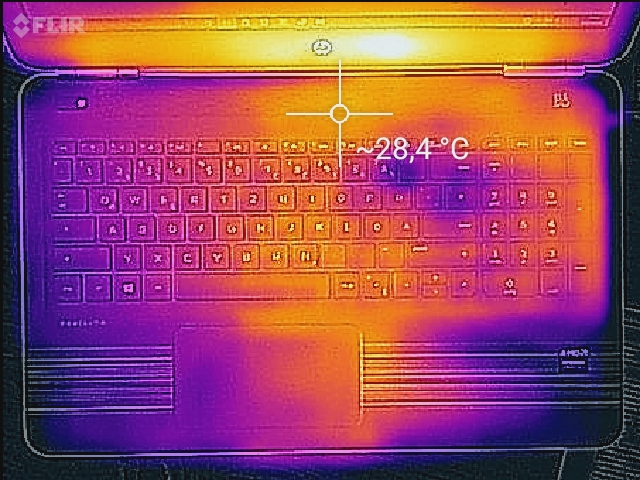
(+) The maximum temperature on the upper side is 33.4 °C / 92 F, compared to the average of 36.8 °C / 98 F, ranging from 21 to 71 °C for the class Multimedia.
(+) The bottom heats up to a maximum of 32.9 °C / 91 F, compared to the average of 39.1 °C / 102 F
(+) In idle usage, the average temperature for the upper side is 26 °C / 79 F, compared to the device average of 31.3 °C / 88 F.
(+) The palmrests and touchpad are cooler than skin temperature with a maximum of 27 °C / 80.6 F and are therefore cool to the touch.
(±) The average temperature of the palmrest area of similar devices was 28.7 °C / 83.7 F (+1.7 °C / 3.1 F).


| HP Pavilion 15-aw004ng W8Y60EA A10-9600P, Radeon R8 M445DX | Acer Aspire E5-552G-F62G FX-8800P, Radeon R8 M365DX | Lenovo Ideapad 500-15ACZ A10-8700P, Radeon R6 M340DX | Toshiba Satellite L50-C-275 6200U, GeForce 930M | Asus F555UB-XO043T 6200U, GeForce 940M | Lenovo Ideapad 310-15ISK 6500U, GeForce 920MX | |
|---|---|---|---|---|---|---|
| Heat | -5% | -4% | -13% | -8% | -10% | |
| Maximum Upper Side * (°C) | 33.4 | 34 -2% | 36 -8% | 42.5 -27% | 33.2 1% | 38.6 -16% |
| Maximum Bottom * (°C) | 32.9 | 39.6 -20% | 39.2 -19% | 46.9 -43% | 44 -34% | 42 -28% |
| Idle Upper Side * (°C) | 27.7 | 27.7 -0% | 27.1 2% | 25.8 7% | 28.2 -2% | 28.1 -1% |
| Idle Bottom * (°C) | 29.4 | 29 1% | 26.6 10% | 26 12% | 28.1 4% | 28.1 4% |
* ... smaller is better
Speakers
HP Pavilion 15-aw004ng W8Y60EA audio analysis
(-) | not very loud speakers (68 dB)
Bass 100 - 315 Hz
(-) | nearly no bass - on average 22.8% lower than median
(+) | bass is linear (5.9% delta to prev. frequency)
Mids 400 - 2000 Hz
(±) | higher mids - on average 5.5% higher than median
(±) | linearity of mids is average (12.2% delta to prev. frequency)
Highs 2 - 16 kHz
(+) | balanced highs - only 4.7% away from median
(+) | highs are linear (4.7% delta to prev. frequency)
Overall 100 - 16.000 Hz
(±) | linearity of overall sound is average (29.1% difference to median)
Compared to same class
» 95% of all tested devices in this class were better, 2% similar, 4% worse
» The best had a delta of 5%, average was 17%, worst was 45%
Compared to all devices tested
» 87% of all tested devices were better, 2% similar, 11% worse
» The best had a delta of 4%, average was 23%, worst was 134%
Apple MacBook 12 (Early 2016) 1.1 GHz audio analysis
(+) | speakers can play relatively loud (83.6 dB)
Bass 100 - 315 Hz
(±) | reduced bass - on average 11.3% lower than median
(±) | linearity of bass is average (14.2% delta to prev. frequency)
Mids 400 - 2000 Hz
(+) | balanced mids - only 2.4% away from median
(+) | mids are linear (5.5% delta to prev. frequency)
Highs 2 - 16 kHz
(+) | balanced highs - only 2% away from median
(+) | highs are linear (4.5% delta to prev. frequency)
Overall 100 - 16.000 Hz
(+) | overall sound is linear (10.2% difference to median)
Compared to same class
» 7% of all tested devices in this class were better, 2% similar, 90% worse
» The best had a delta of 5%, average was 18%, worst was 53%
Compared to all devices tested
» 5% of all tested devices were better, 1% similar, 94% worse
» The best had a delta of 4%, average was 23%, worst was 134%
Frequency diagram for comparison (Checkboxes above can be selected!)
Energy Management
Power Consumption
While idle, the laptop needs at most 9.5 W, which is acceptable. During the stress test, this value rises to 58 W. Notebooks, with middle-class GeForce GPUs and Intel processors, can reach similar levels. While playing games, our test model needs around 45 W (+/-10 W). The power adapter can cover the needs of our test model, as it packs 65 W.
| Off / Standby | |
| Idle | |
| Load |
|
Key:
min: | |
| HP Pavilion 15-aw004ng W8Y60EA A10-9600P, Radeon R8 M445DX | Acer Aspire E5-552G-F62G FX-8800P, Radeon R8 M365DX | Lenovo Ideapad 500-15ACZ A10-8700P, Radeon R6 M340DX | Toshiba Satellite L50-C-275 6200U, GeForce 930M | Asus F555UB-XO043T 6200U, GeForce 940M | Lenovo Ideapad 310-15ISK 6500U, GeForce 920MX | |
|---|---|---|---|---|---|---|
| Power Consumption | -2% | -10% | 4% | 13% | 2% | |
| Idle Minimum * (Watt) | 5.5 | 6.7 -22% | 6.8 -24% | 4.7 15% | 4.7 15% | 7 -27% |
| Idle Average * (Watt) | 8.2 | 9.8 -20% | 10.5 -28% | 9.9 -21% | 6.5 21% | 8 2% |
| Idle Maximum * (Watt) | 9.5 | 10.6 -12% | 11 -16% | 10.1 -6% | 6.8 28% | 8.4 12% |
| Load Average * (Watt) | 44.5 | 46 -3% | 41.6 7% | 36 19% | 42.7 4% | 38.8 13% |
| Load Maximum * (Watt) | 58 | 32 45% | 51 12% | 51 12% | 59 -2% | 52.8 9% |
* ... smaller is better
Battery Life
The Pavilion offers a run time of 4:20 hours in the practical WLAN test. For this test, we simulate the load from surfing websites. The "Balanced" power profile is turned on, all power saver options are off and the brightness is set to around 150 cd/m². Our video test lasts 3:14 hours. In this test, we let the short movie, Big Buck Bunny (H.264 coding, 1,920 x 1,080 pixels) run in a loop. The wireless modules and power saver options are turned off and brightness is set to 150 cd/m². Sadly, the battery life of this laptop is not very good. A 15.6 inch laptop is expected to run between 5 to 6 hours in our WLAN test.

| HP Pavilion 15-aw004ng W8Y60EA 41 Wh | Acer Aspire E5-552G-F62G 37 Wh | Lenovo Ideapad 500-15ACZ 32 Wh | Toshiba Satellite L50-C-275 45 Wh | Asus F555UB-XO043T 37 Wh | |
|---|---|---|---|---|---|
| Battery runtime | -32% | -31% | 35% | 37% | |
| Reader / Idle (h) | 9.3 | 6.7 -28% | 6.1 -34% | ||
| H.264 (h) | 3.2 | 2.8 -13% | |||
| WiFi v1.3 (h) | 4.3 | 2.8 -35% | 3.1 -28% | 5.8 35% | 5.9 37% |
| Load (h) | 1.6 | 0.8 -50% |
Pros
Cons
Verdict
The AMD processor of the test model offers sufficient performance for everyday use. Furthermore, the laptop is quite most of the time and it barely heats up. A fast SSD ensures that the system runs smoothly. Sadly, the laptop has no maintenance flap. To swap the SSD, the case must be opened up. The keyboard suffices for home use and the battery life is nothing special. The Pavilion could have been better in these areas.
For roughly 550 Euros, the Pavilion 15-aw004ng is a good allrounder for entry-level users.
For a relatively low price, HP has included a FHD display and a dual-graphics system. On the other hand, the panel is not very bright and has poor viewing angles and contrast. Additionally, in terms of gaming performance, the dual-graphics system is not as strong as the Nvidia competition. The system itself is covered by a mere 1 year warranty. All-in-all, HP offers a low-priced 15.6 inch notebook with clear flaws, which may be suitable for some users.
HP Pavilion 15-aw004ng W8Y60EA
- 09/22/2016 v5.1 (old)
Sascha Mölck
Price comparison
