

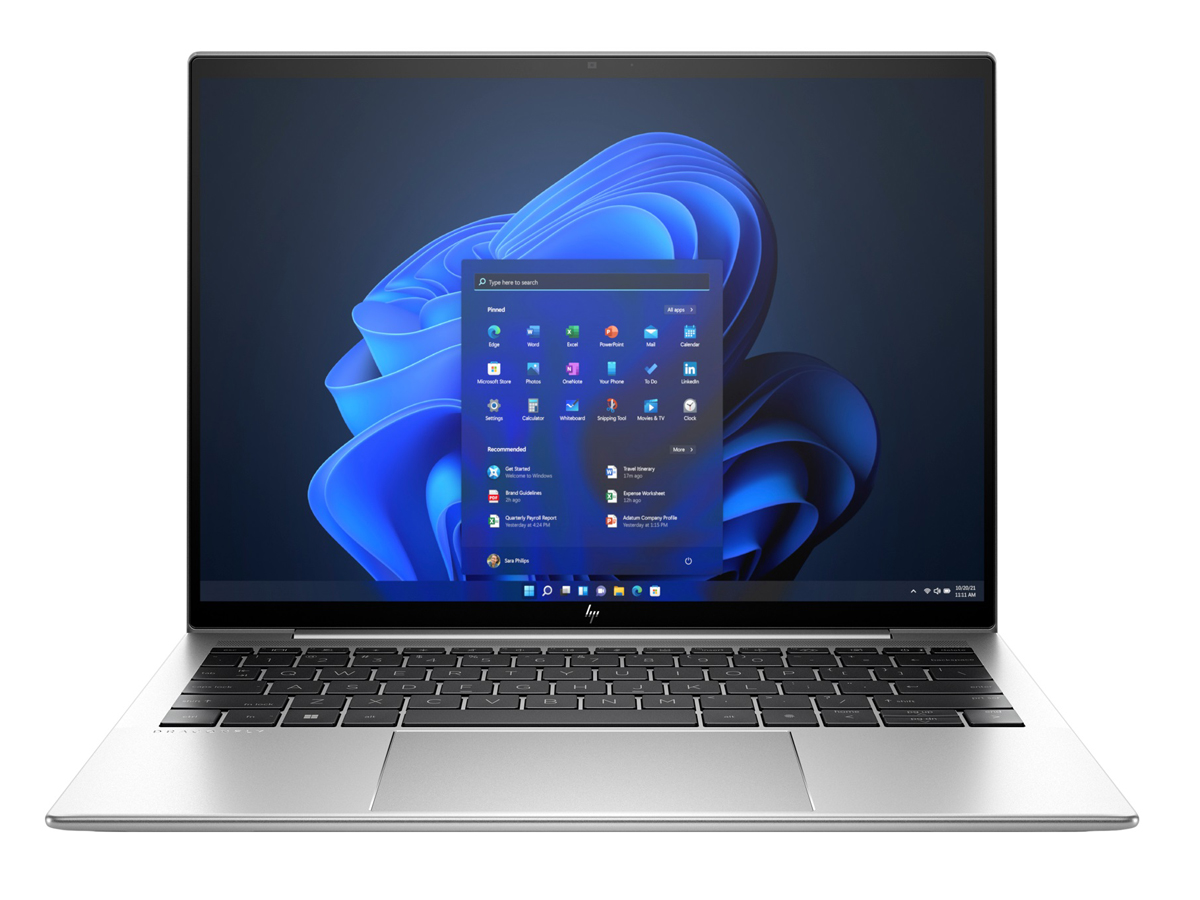
HP Elite Dragonfly G3 13.5 laptop review: All-new design and performance
The Dragonfly G3 directly succeeds last year's Dragonfly Max (i.e., the Dragonfly G2) with new hardware from top to bottom. Other than the obvious CPU upgrade from 11th gen Tiger Lake-U to 12th gen Alder Lake-U, the G3 sports a new 3:2 form factor and 13.5-inch display to contrast to older 16:9 13.3-inch design. HP says all the changes collectively cater to a hybrid out-of-home and in-home workforce.
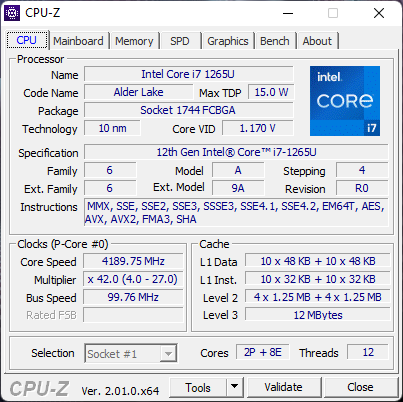
Our review unit comes configured with the Core i7-1265U vPro CPU, 1280p IPS display, 5G WWAN, and 512 GB SSD for approximately $2700 USD. Other configurations are available with the lesser Core i5-1235U up to an OLED touchscreen, but all options come with integrated Iris Xe graphics and at least 16 GB of LPDDR5 RAM.
Alternatives to the Dragonfly G3 include other flagship 13-inch office or business laptops like the Dell Latitude 13 7330, Lenovo ThinkPad X1 Yoga G1, MSI Summit E13, or the Framework Laptop.
More HP reviews:
Potential Competitors in Comparison
Rating | Date | Model | Weight | Height | Size | Resolution | Price |
|---|---|---|---|---|---|---|---|
| 91 % v7 (old) | 08 / 2022 | HP Elite Dragonfly G3 i7-1265U, Iris Xe G7 96EUs | 1.2 kg | 16.3 mm | 13.50" | 1920x1280 | |
| 89.4 % v7 (old) | 12 / 2020 | HP Spectre x360 14t-ea000 i7-1165G7, Iris Xe G7 96EUs | 1.3 kg | 17.2 mm | 13.50" | 1920x1280 | |
| 86.1 % v7 (old) | 08 / 2022 | Dell XPS 13 Plus 9320 i5-1240p i5-1240P, Iris Xe G7 80EUs | 1.2 kg | 15.3 mm | 13.40" | 1920x1200 | |
| 85.1 % v7 (old) | 07 / 2022 | Framework Laptop 13.5 12th Gen Intel i7-1260P, Iris Xe G7 96EUs | 1.3 kg | 15.85 mm | 13.50" | 2256x1504 | |
| 84 % v7 (old) | 08 / 2021 | HP EliteBook Folio 13.5-3G2L2EA SD 8cx Gen 2 5G, Adreno 680 | 1.3 kg | 16 mm | 13.50" | 1920x1280 | |
| 87.3 % v7 (old) | 04 / 2021 | Lenovo ThinkPad X1 Titanium Yoga G1 20QA001RGE i7-1160G7, Iris Xe G7 96EUs | 1.2 kg | 11.5 mm | 13.50" | 2256x1504 |
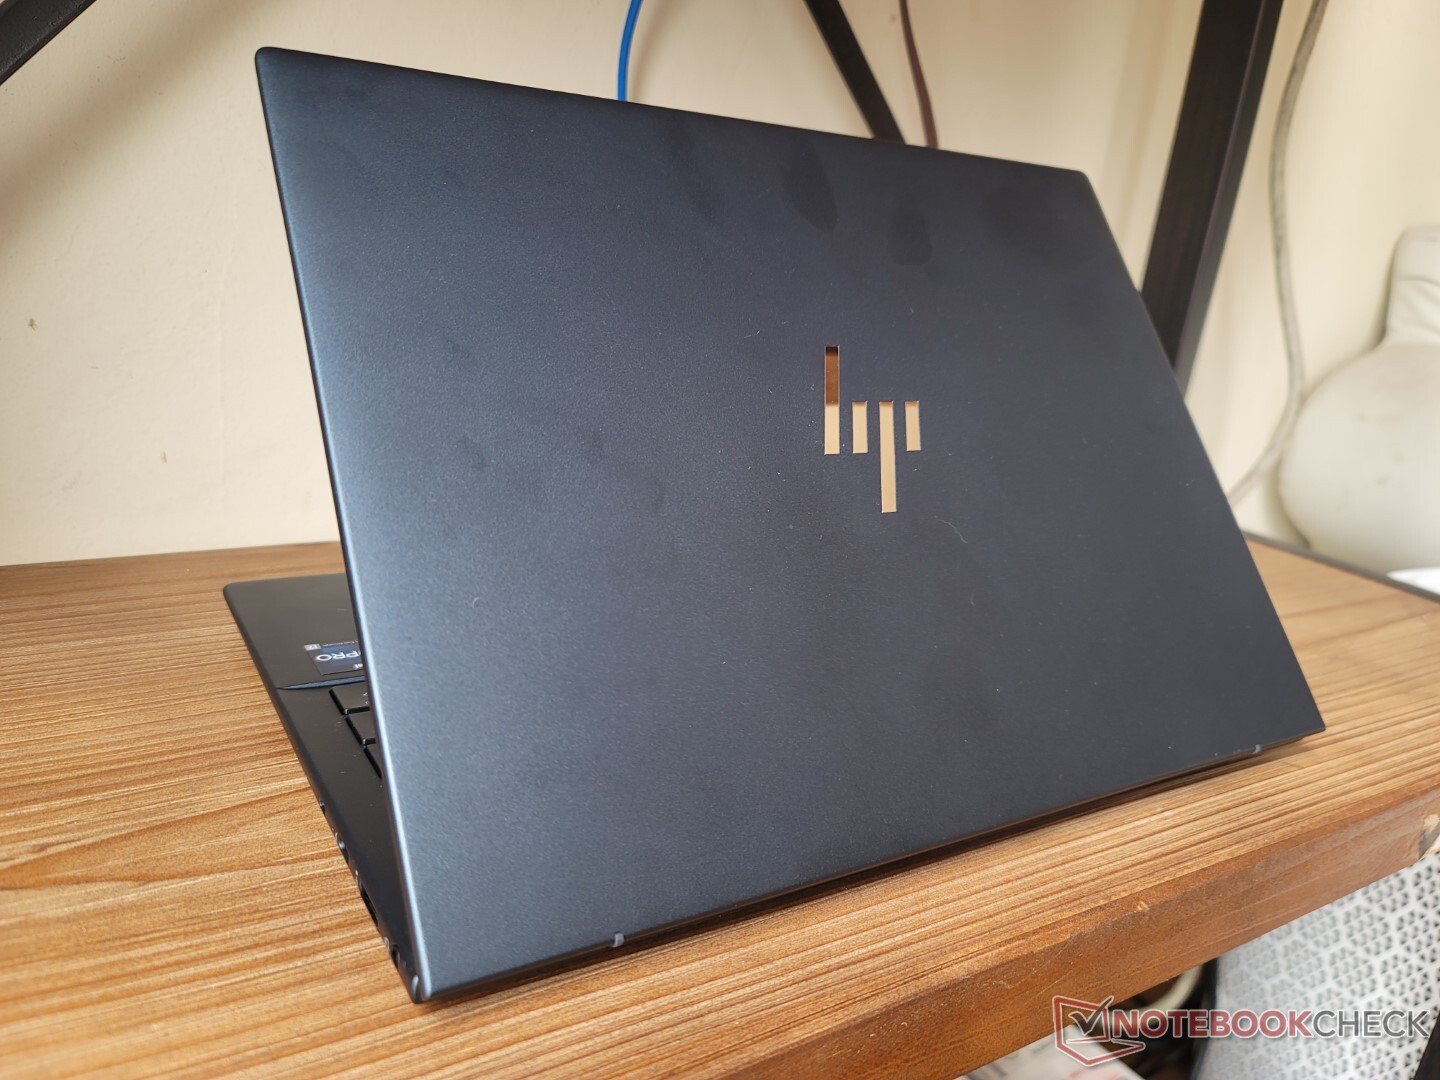
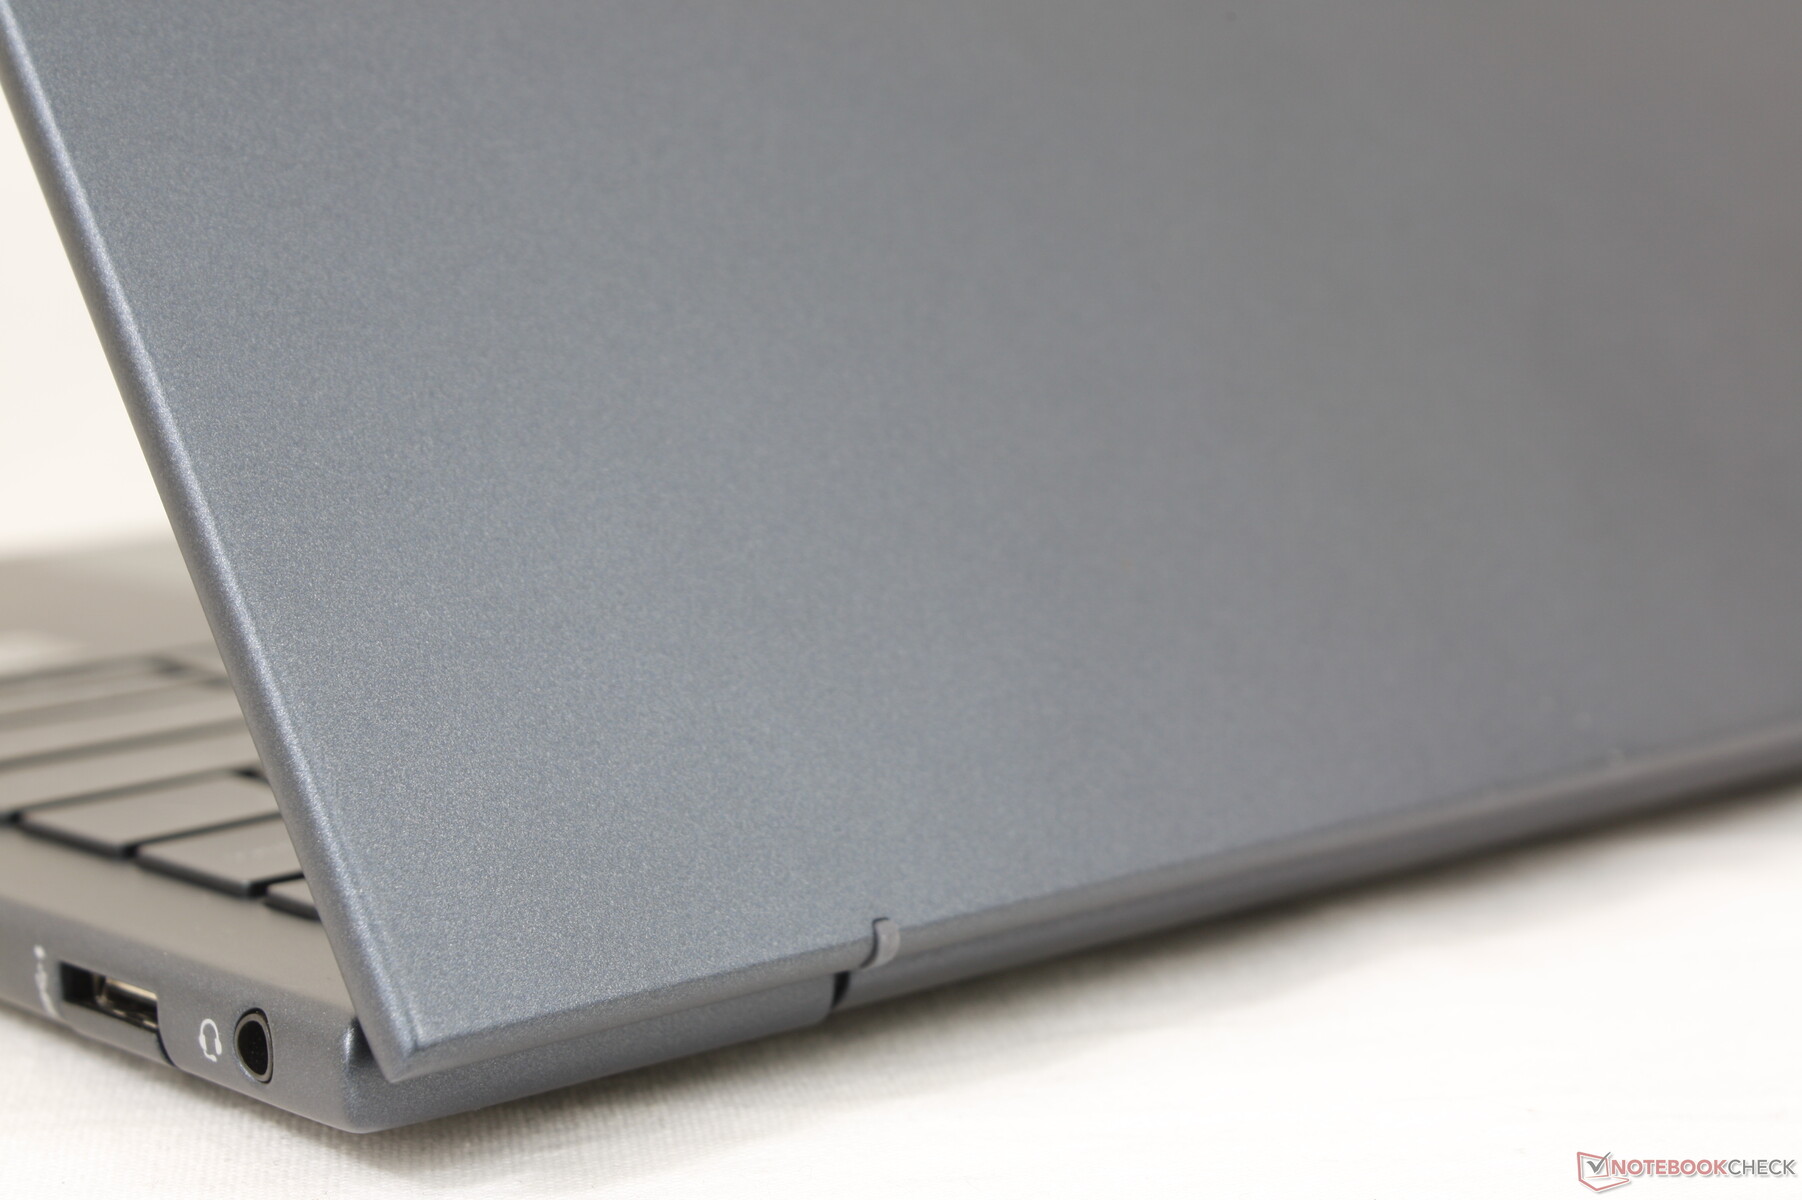
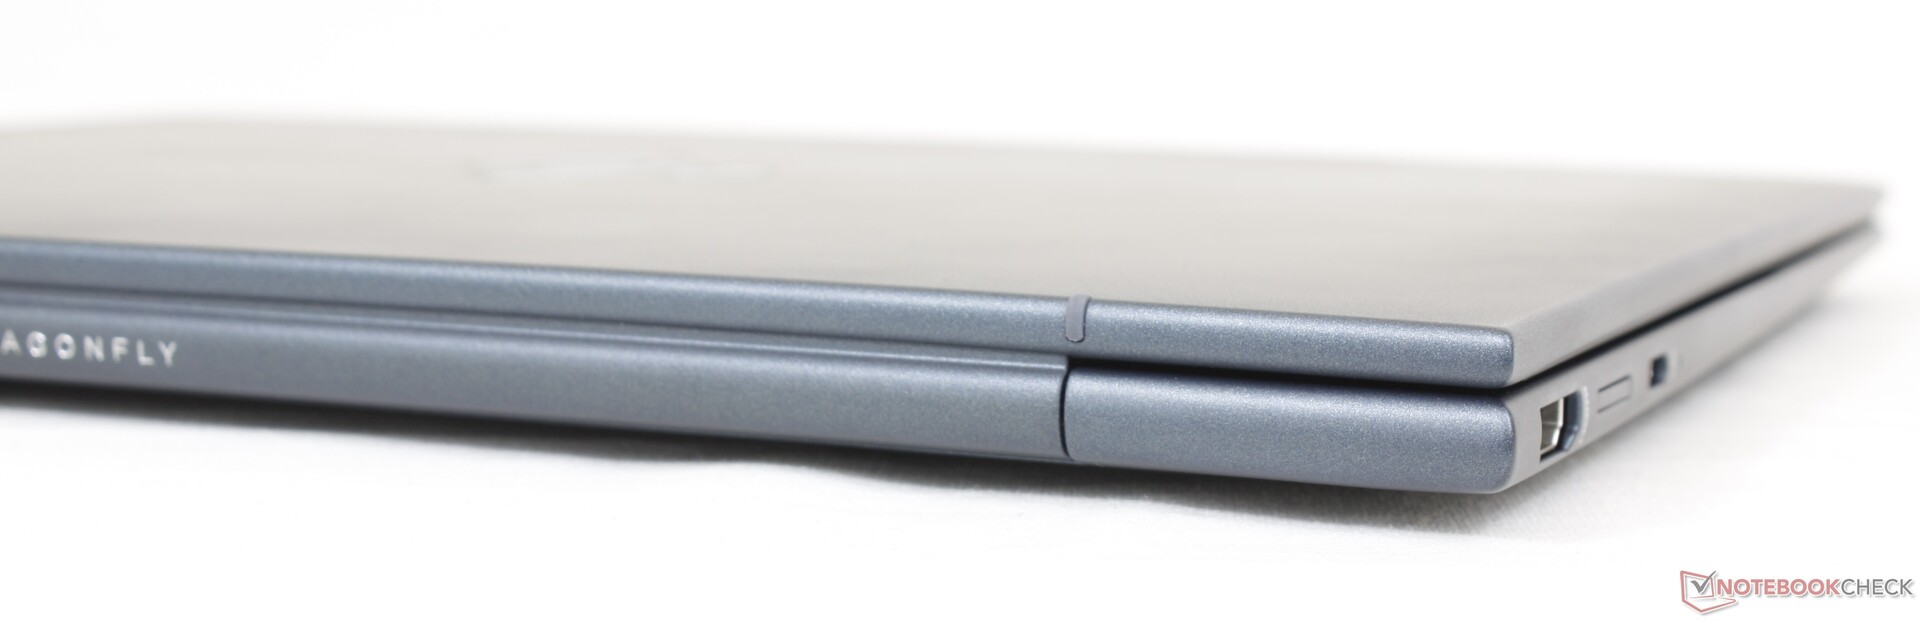
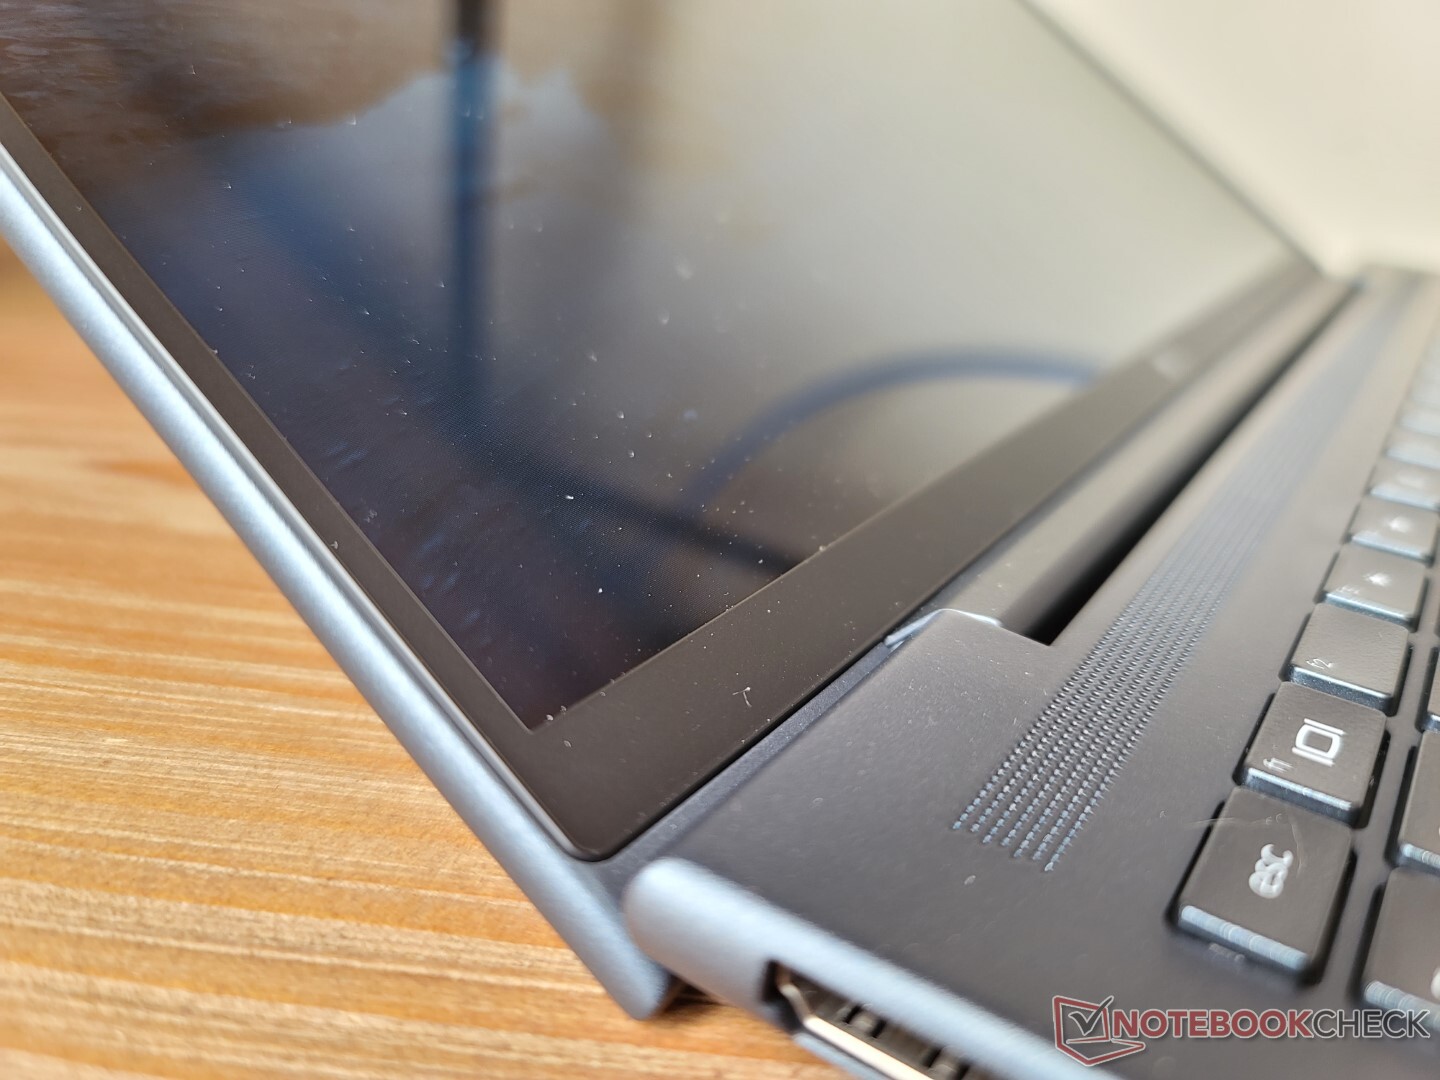
Case — Strong Base, Weak Lid
The metal chassis remains strong and rigid around the base and keyboard center. The same can't be said about the lid, however, as it twists and flexes as easily as the lids on the LG gram or Samsung Galaxy Book. Applying pressure down the center of the outer lid warps the surface more readily than the lid on a Spectre. The very low weight and lack of any Gorilla Glass reinforcement contribute to the weaker lid of the Dragonfly G3.
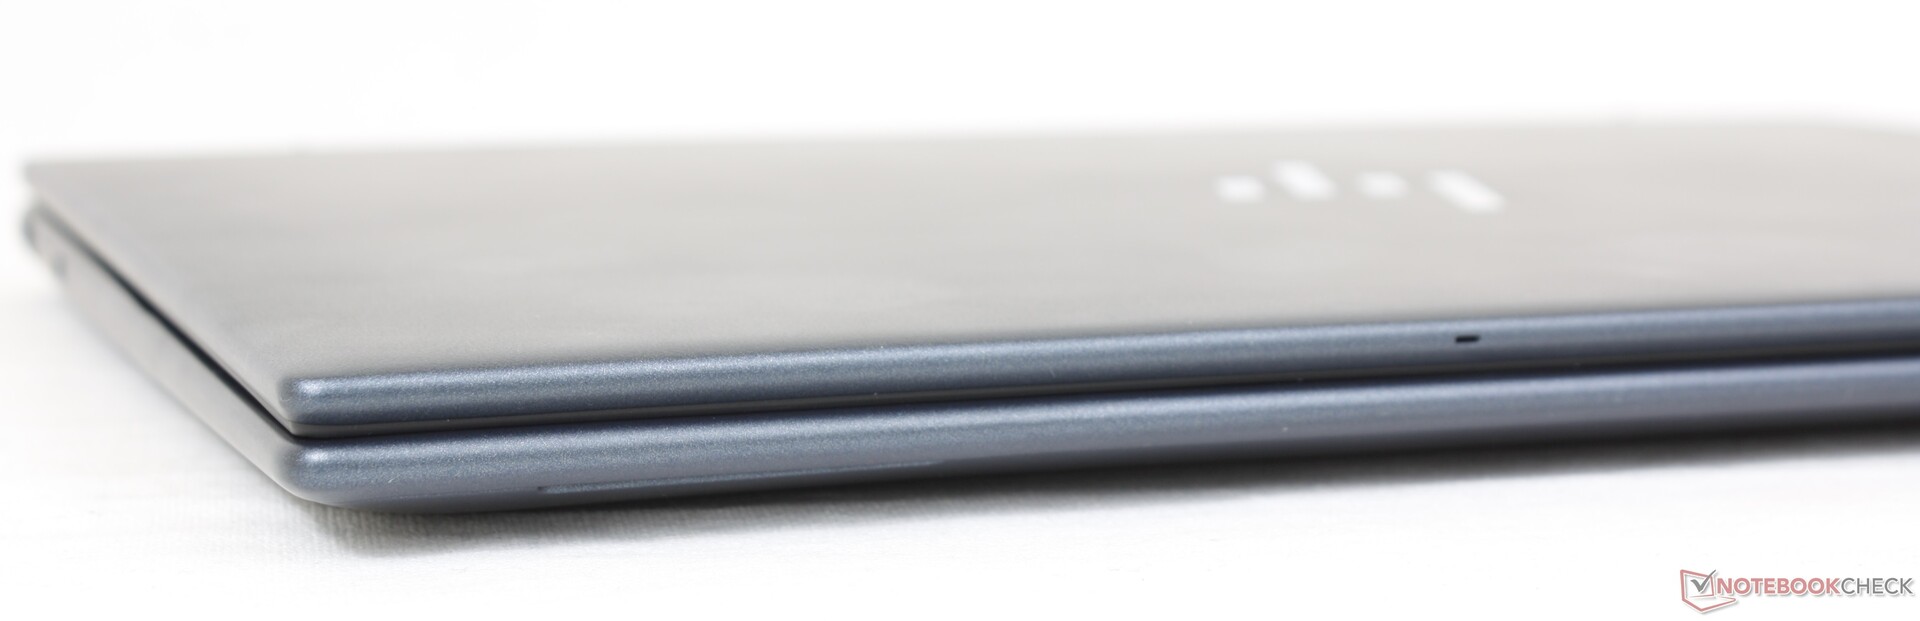
It's worth noting that the Dragonfly G3 doesn't come with any of the vibrant color options that the original 2020 launch model offered. The new color options have grown more matte and sterile in comparison. For a series called "Dragonfly", its colors are becoming too similar to a typical EliteBook model.
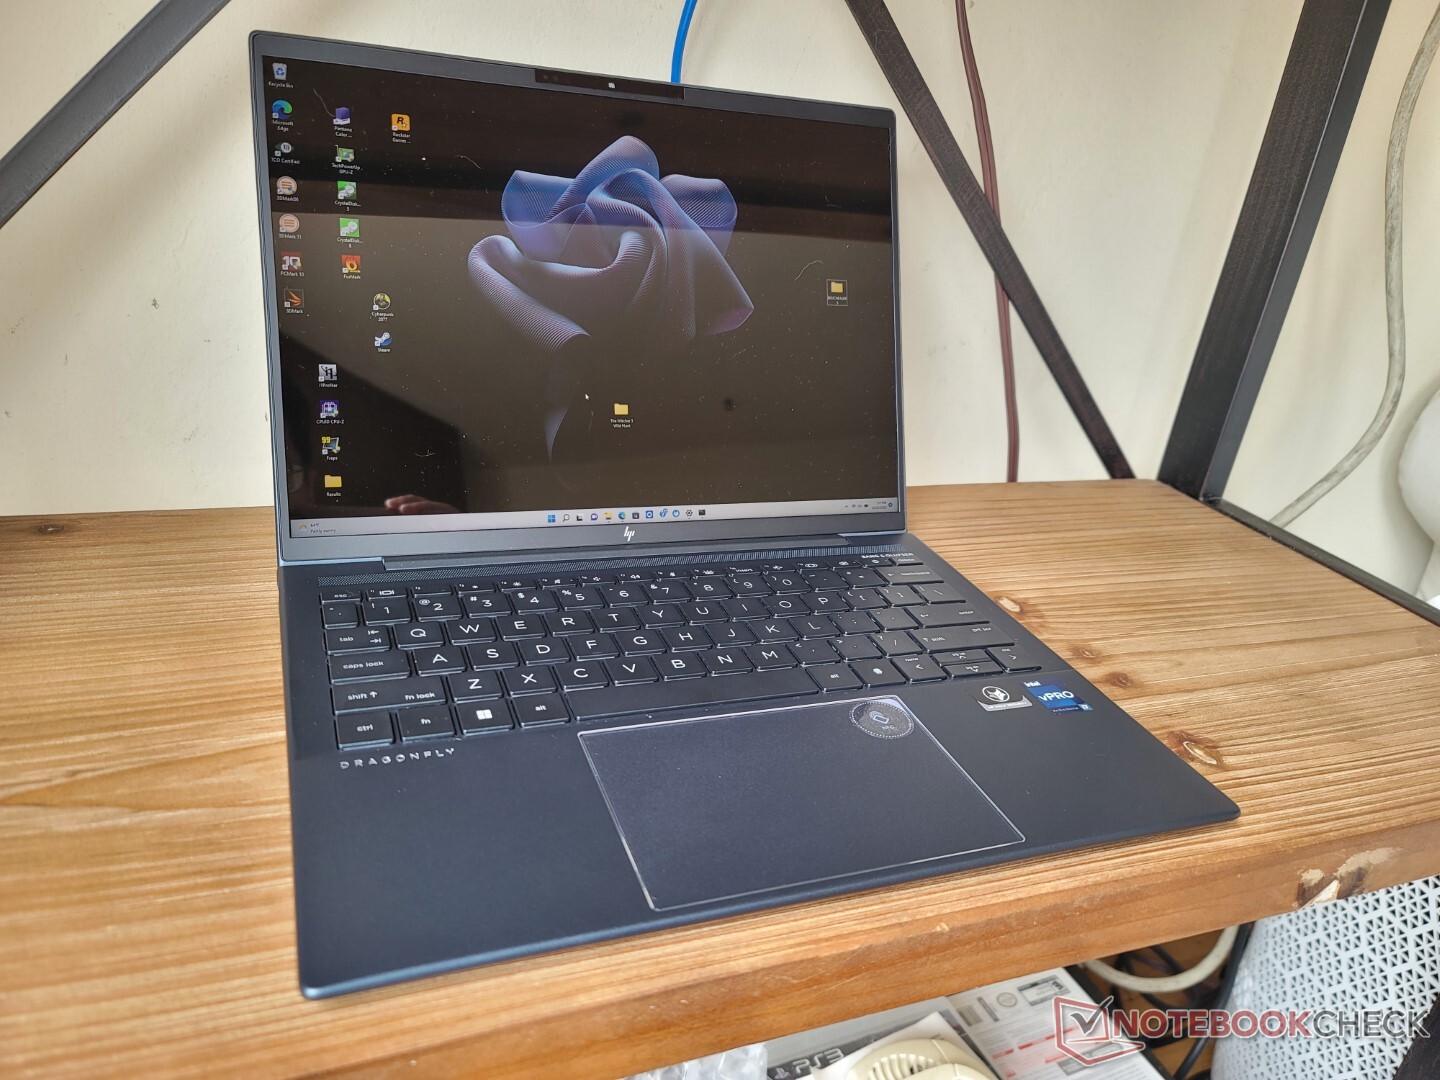
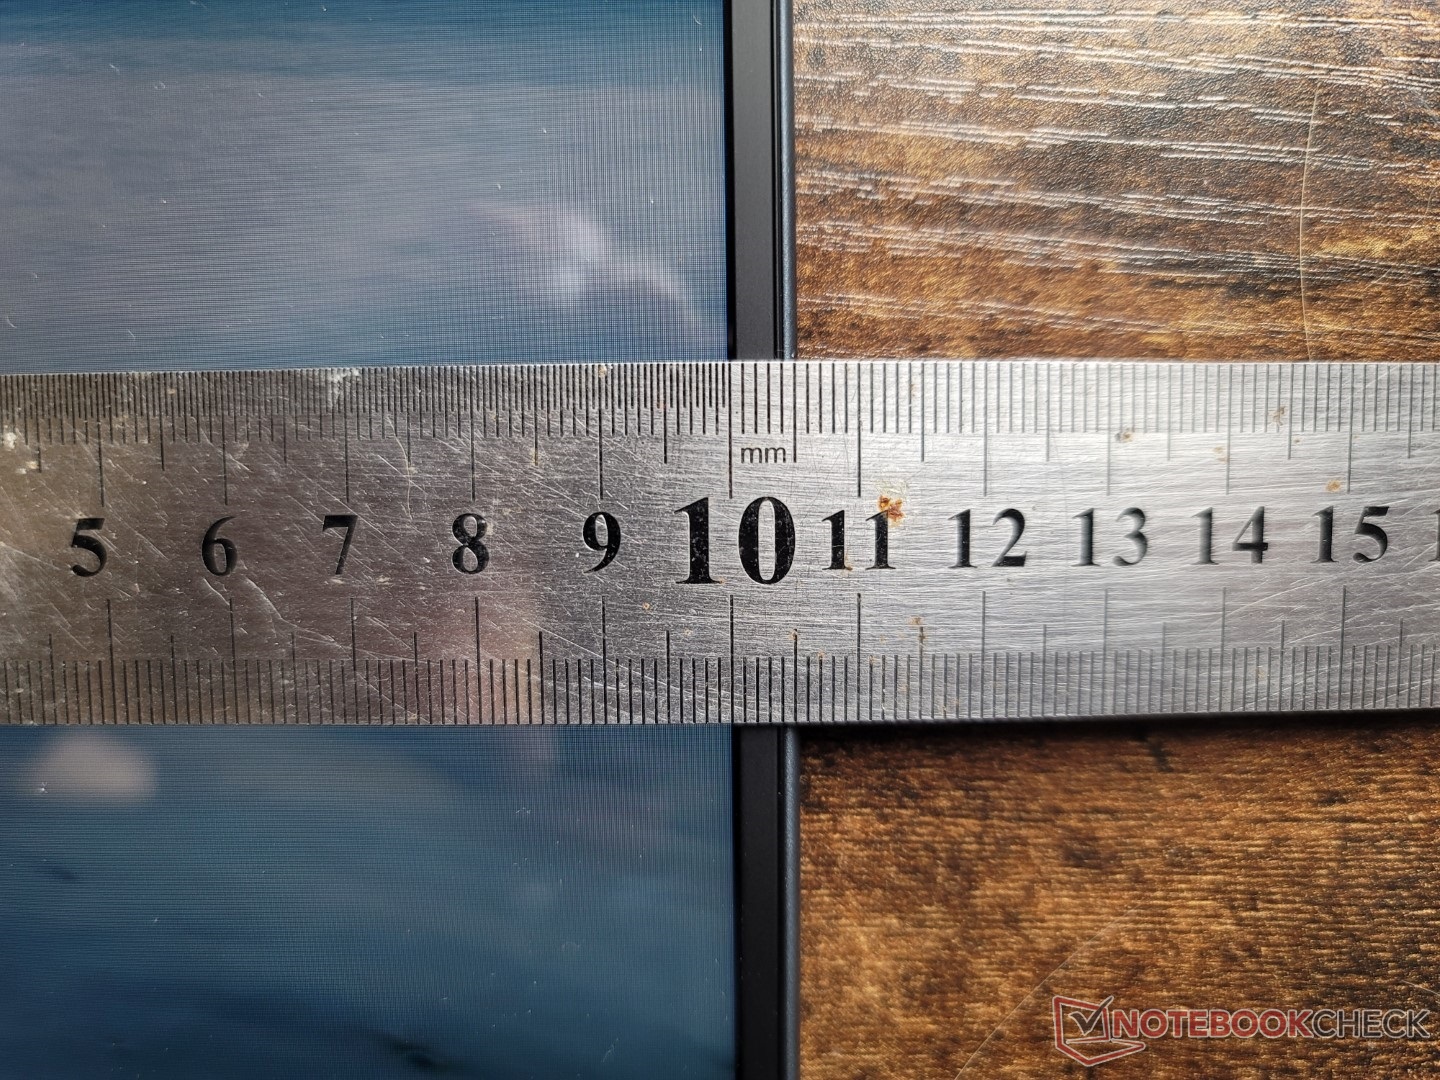
The new model is longer than the outgoing Dragonfly Max by over 20 mm due to its new 13.5-inch form factor, but it is thankfully not any heavier at 1.2 kg despite the larger volume. Perhaps unsurprisingly, dimensions are almost identical to the recent 13.5-inch Spectre x360 13.5.
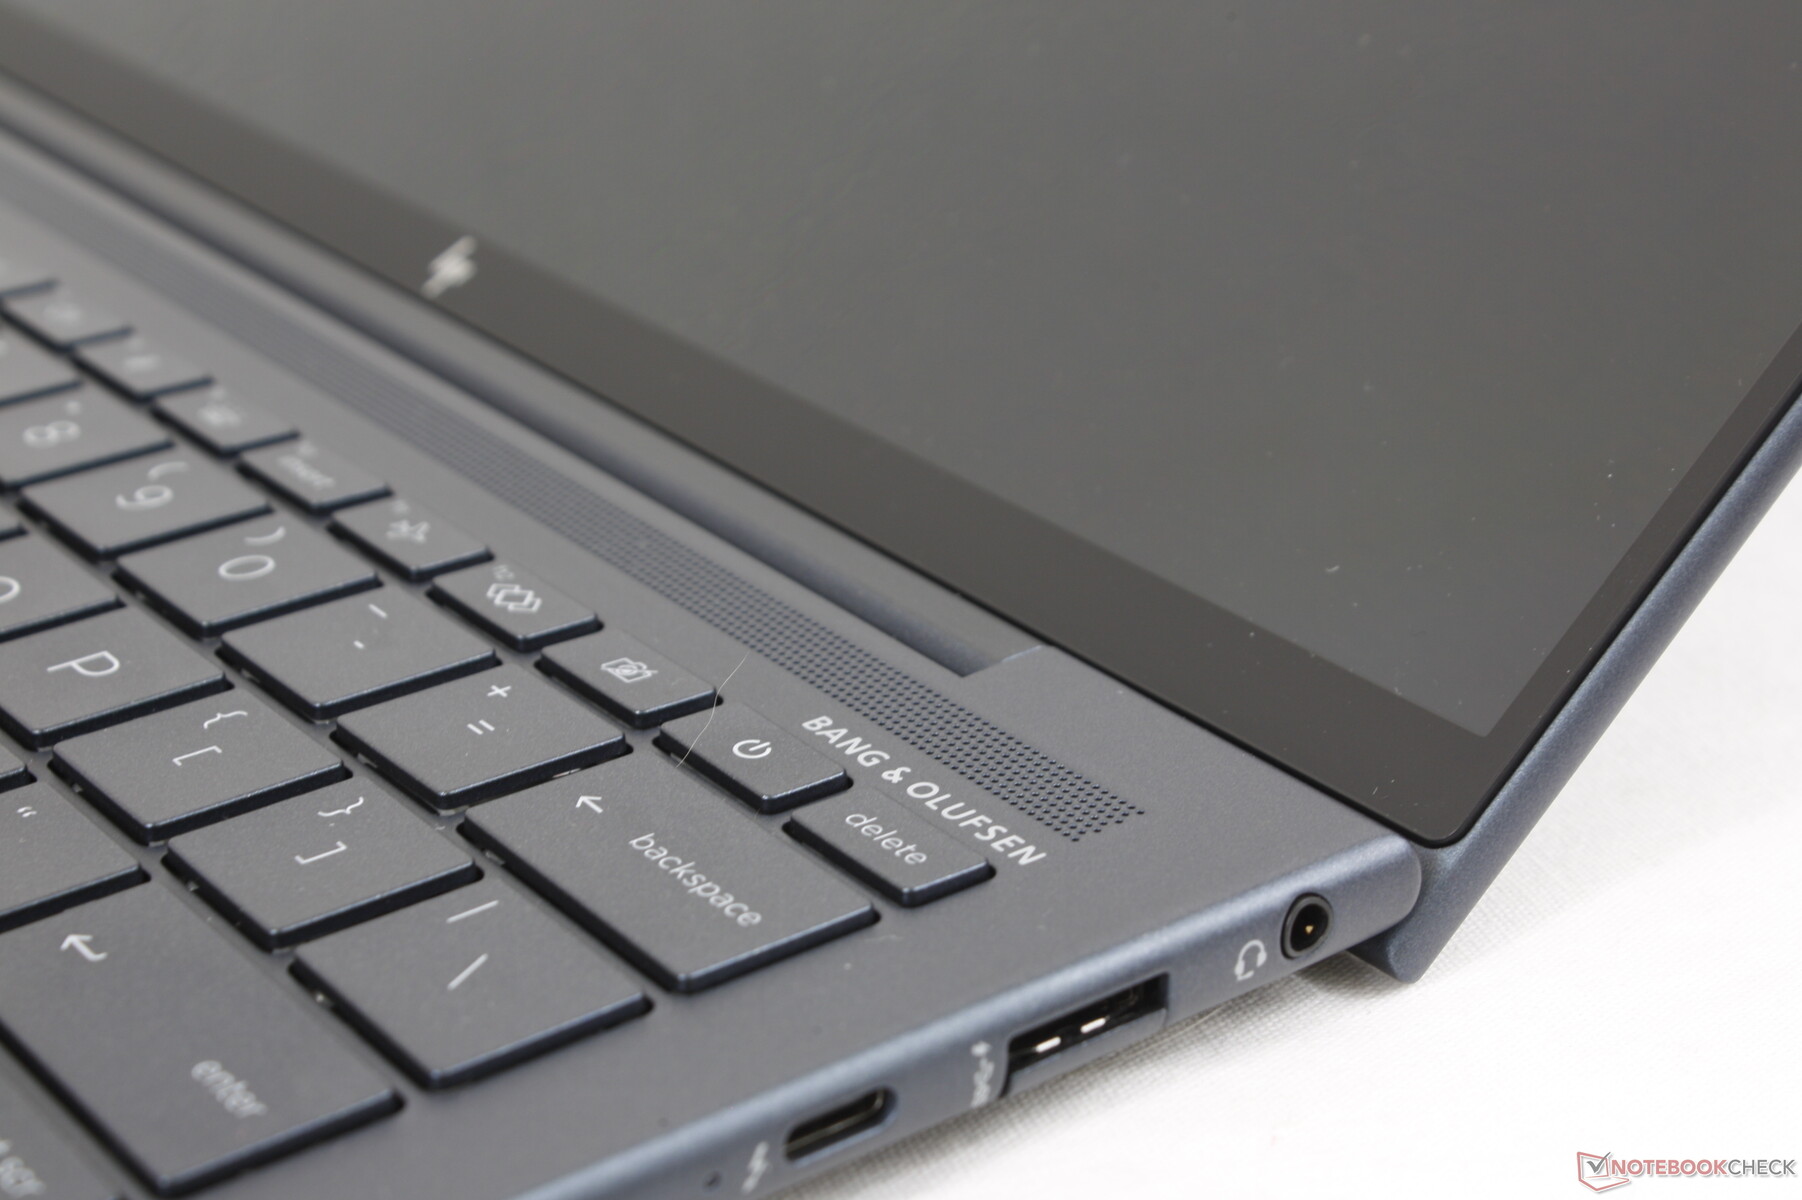
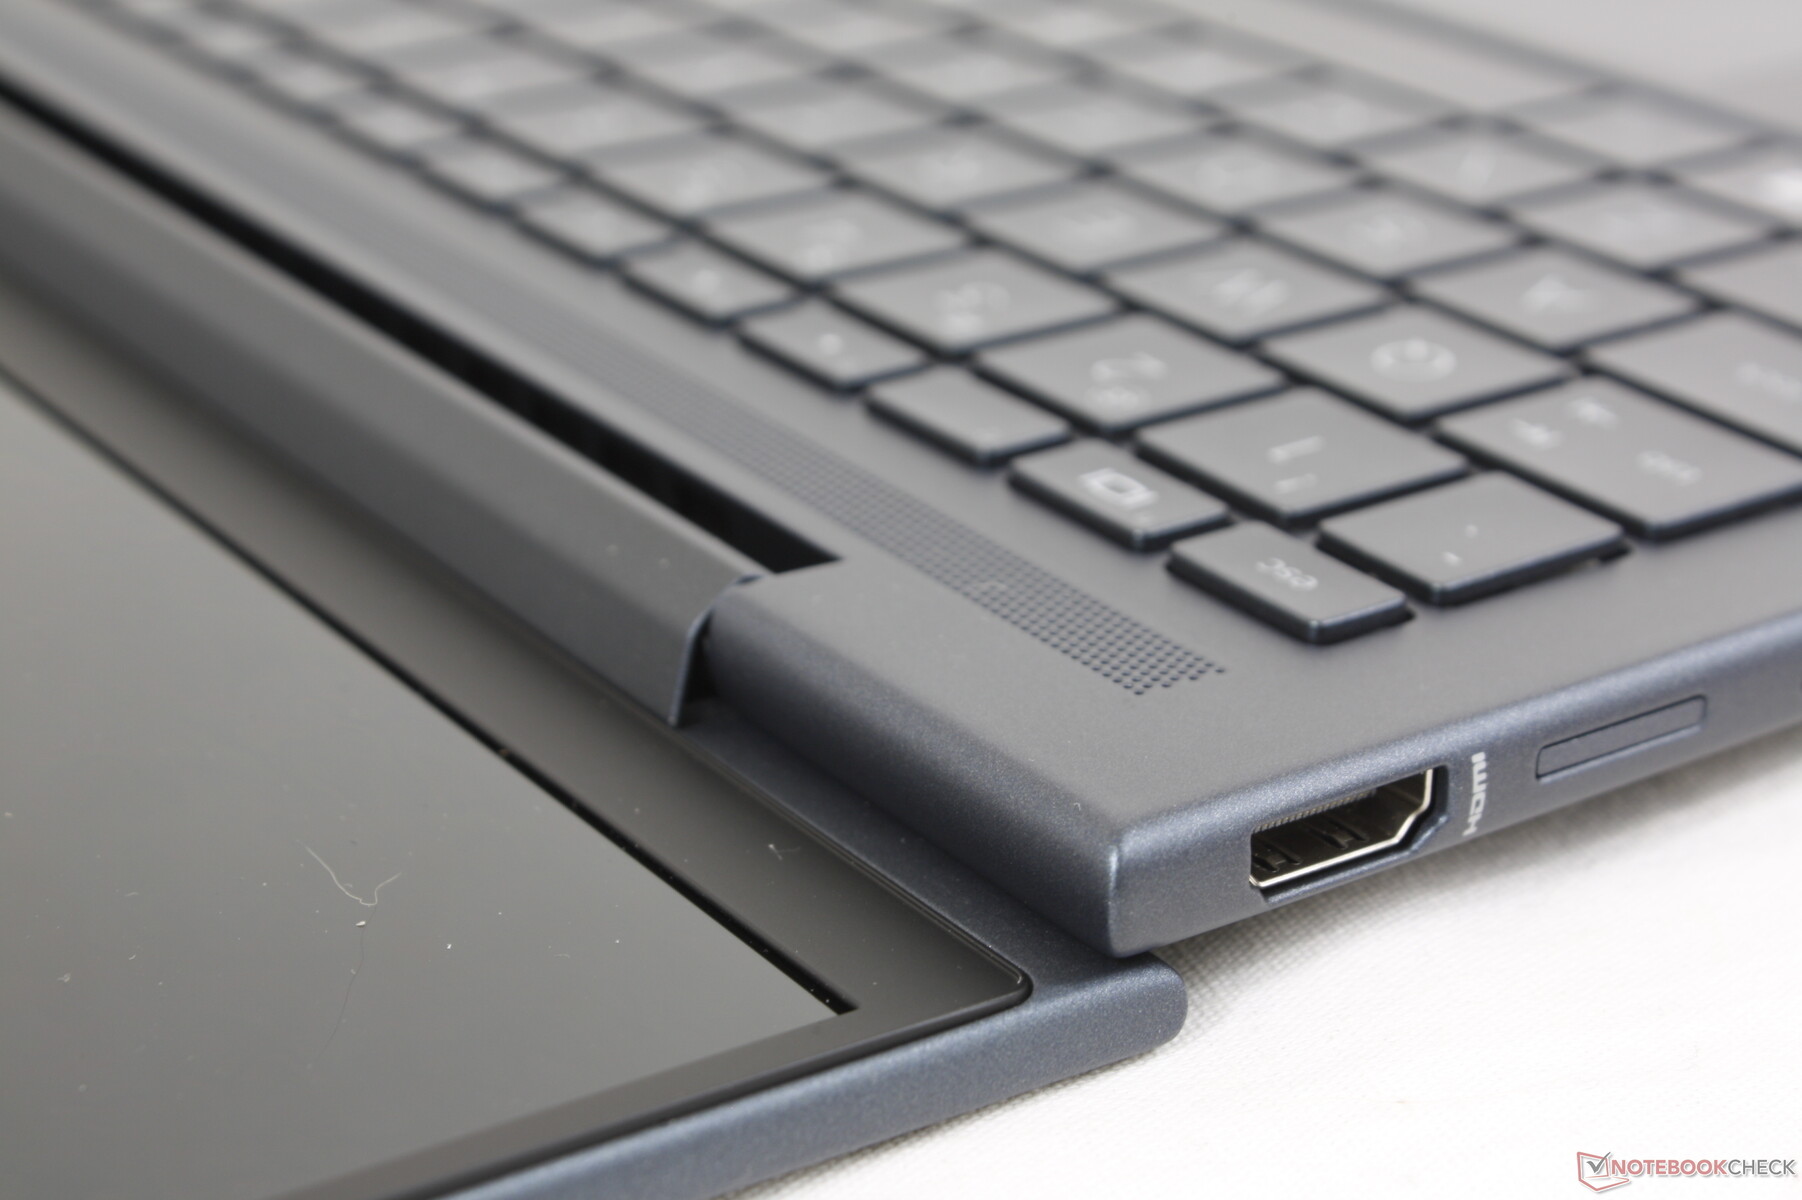
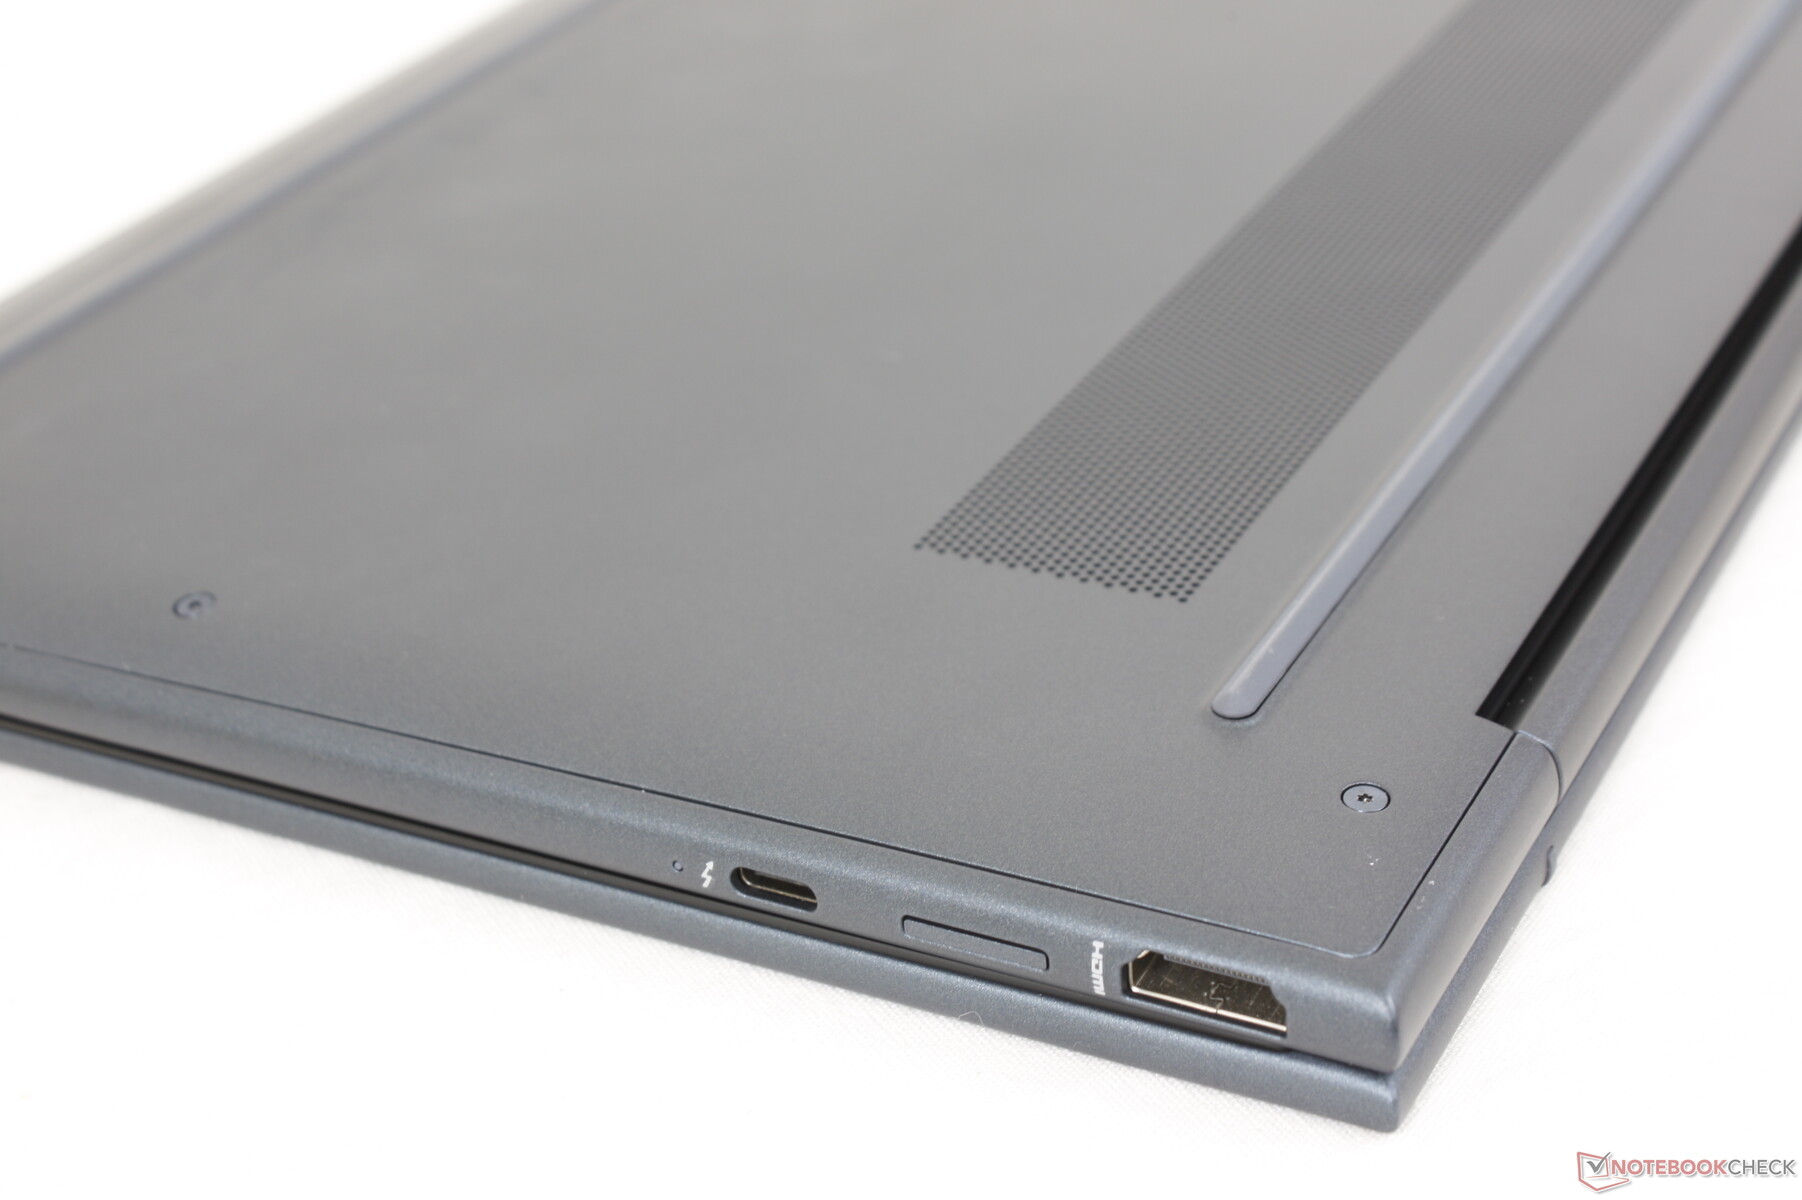
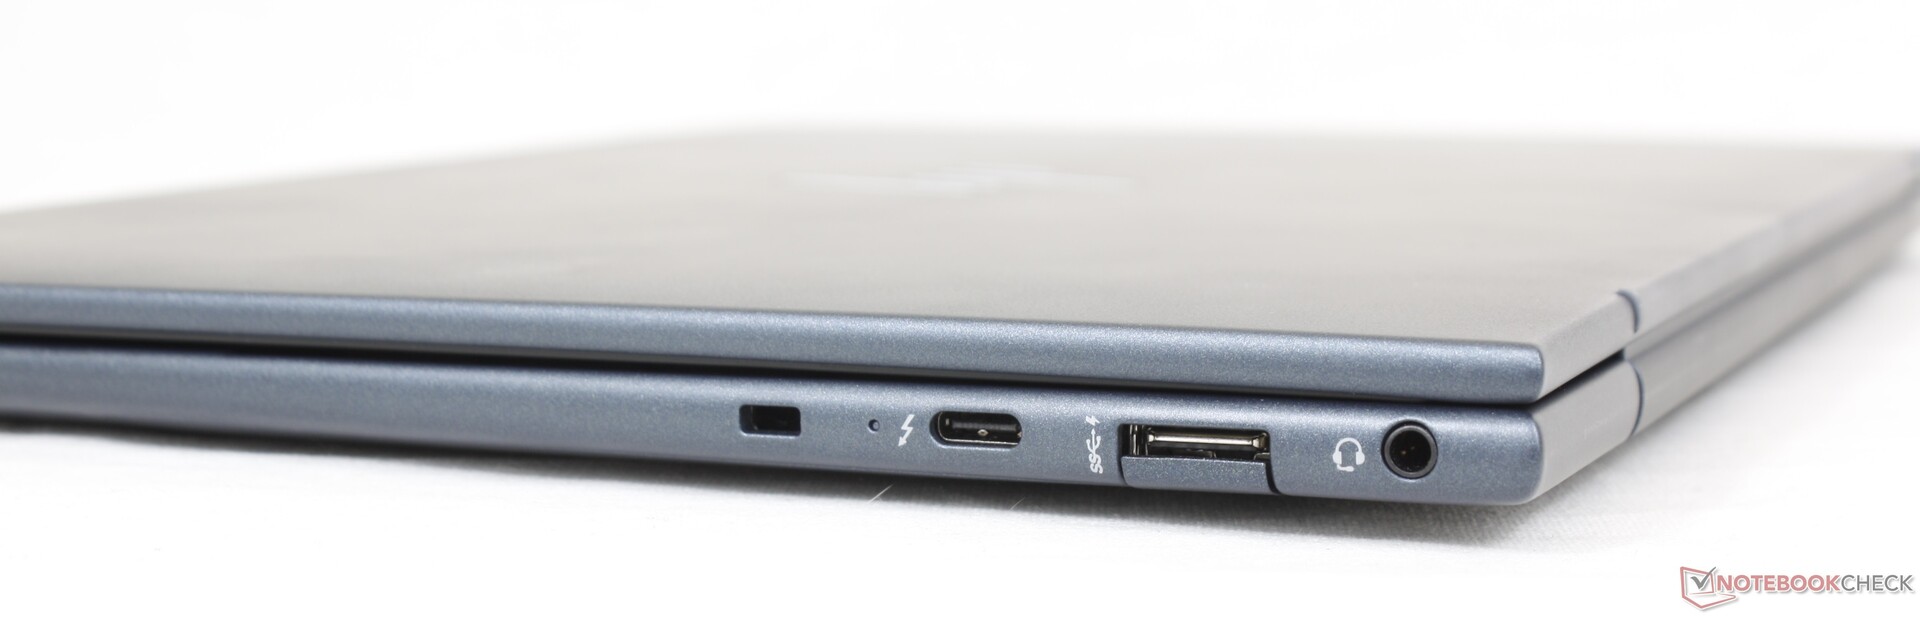
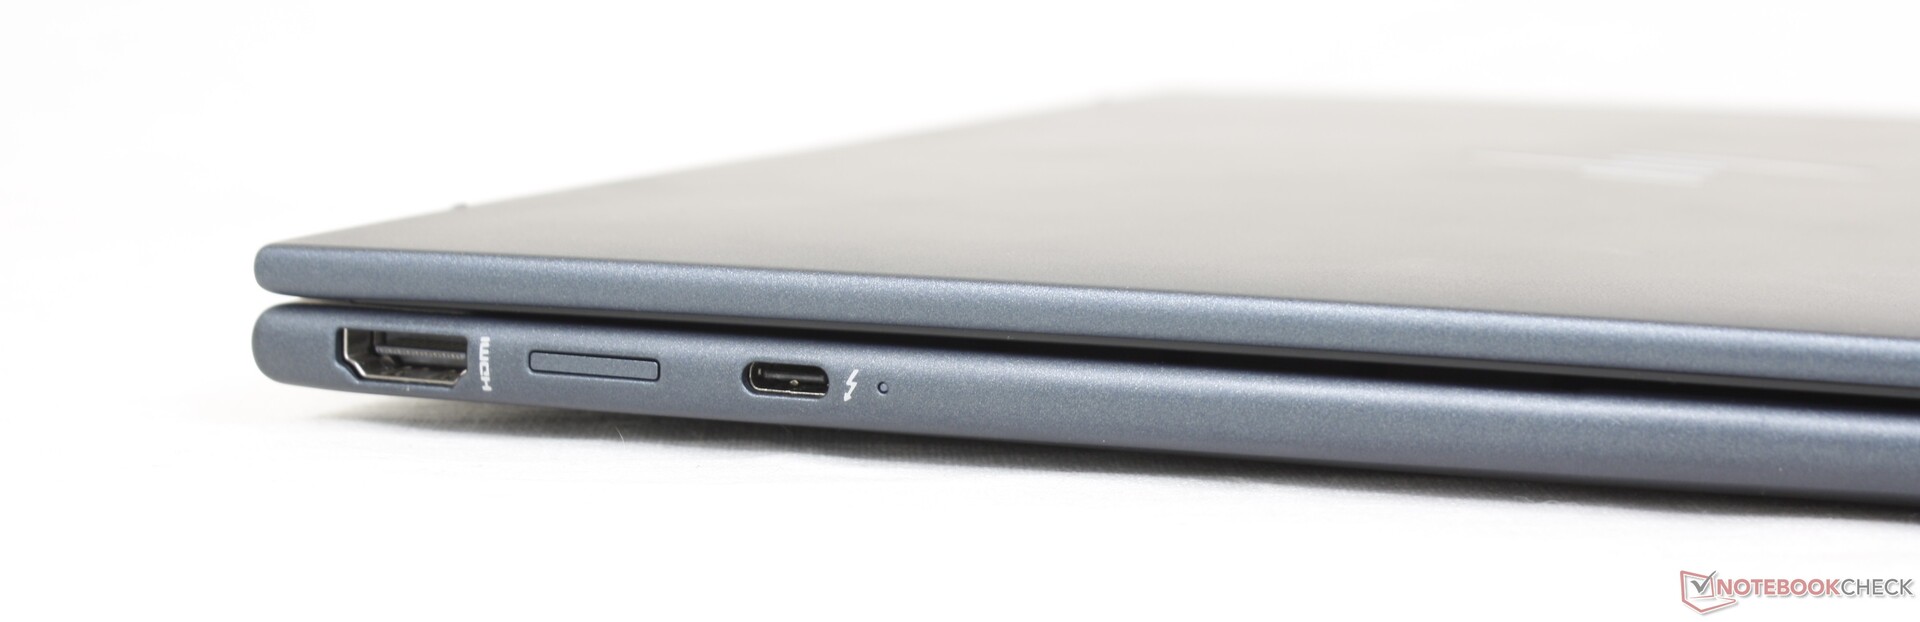
Connectivity — Thunderbolt 4 Support
Port options are essentially the same as on the Dragonfly Max but rearranged for the better. The two USB-C ports, for example, are now along on the left and right edges of the laptop instead of only along the right edge to allow for charging on either side of the laptop.
There is no integrated SD card reader yet again as HP is pushing its own wireless QuickDrop software solution. QuickDrop works well enough for smartphones, but dedicated camera users who rely on SD cards remain out of luck.
Communication
An Intel AX211 comes standard for Wi-Fi 6E and Bluetooth 5.2 connectivity. We experienced excellent receive transfer rates when paired to our 6 GHz network, but transmit rates could have been steadier.
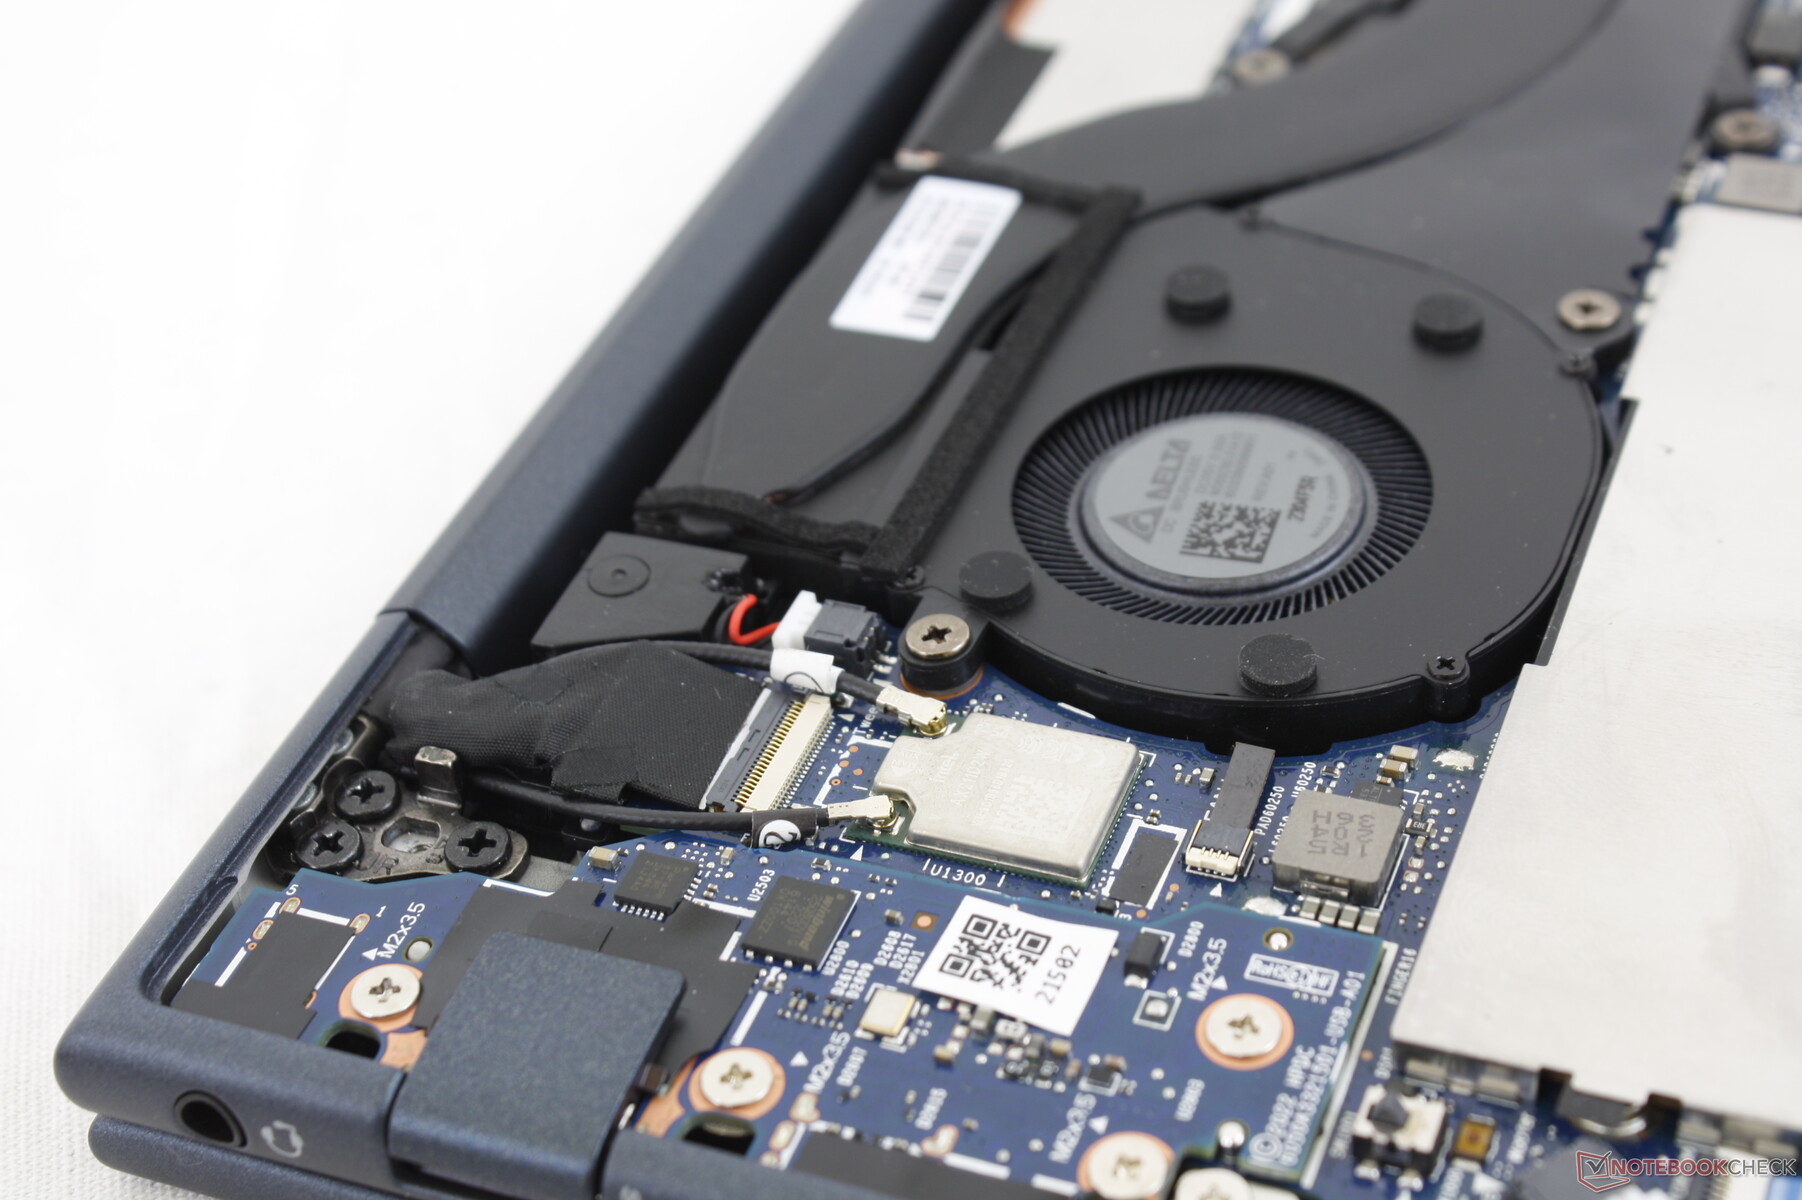
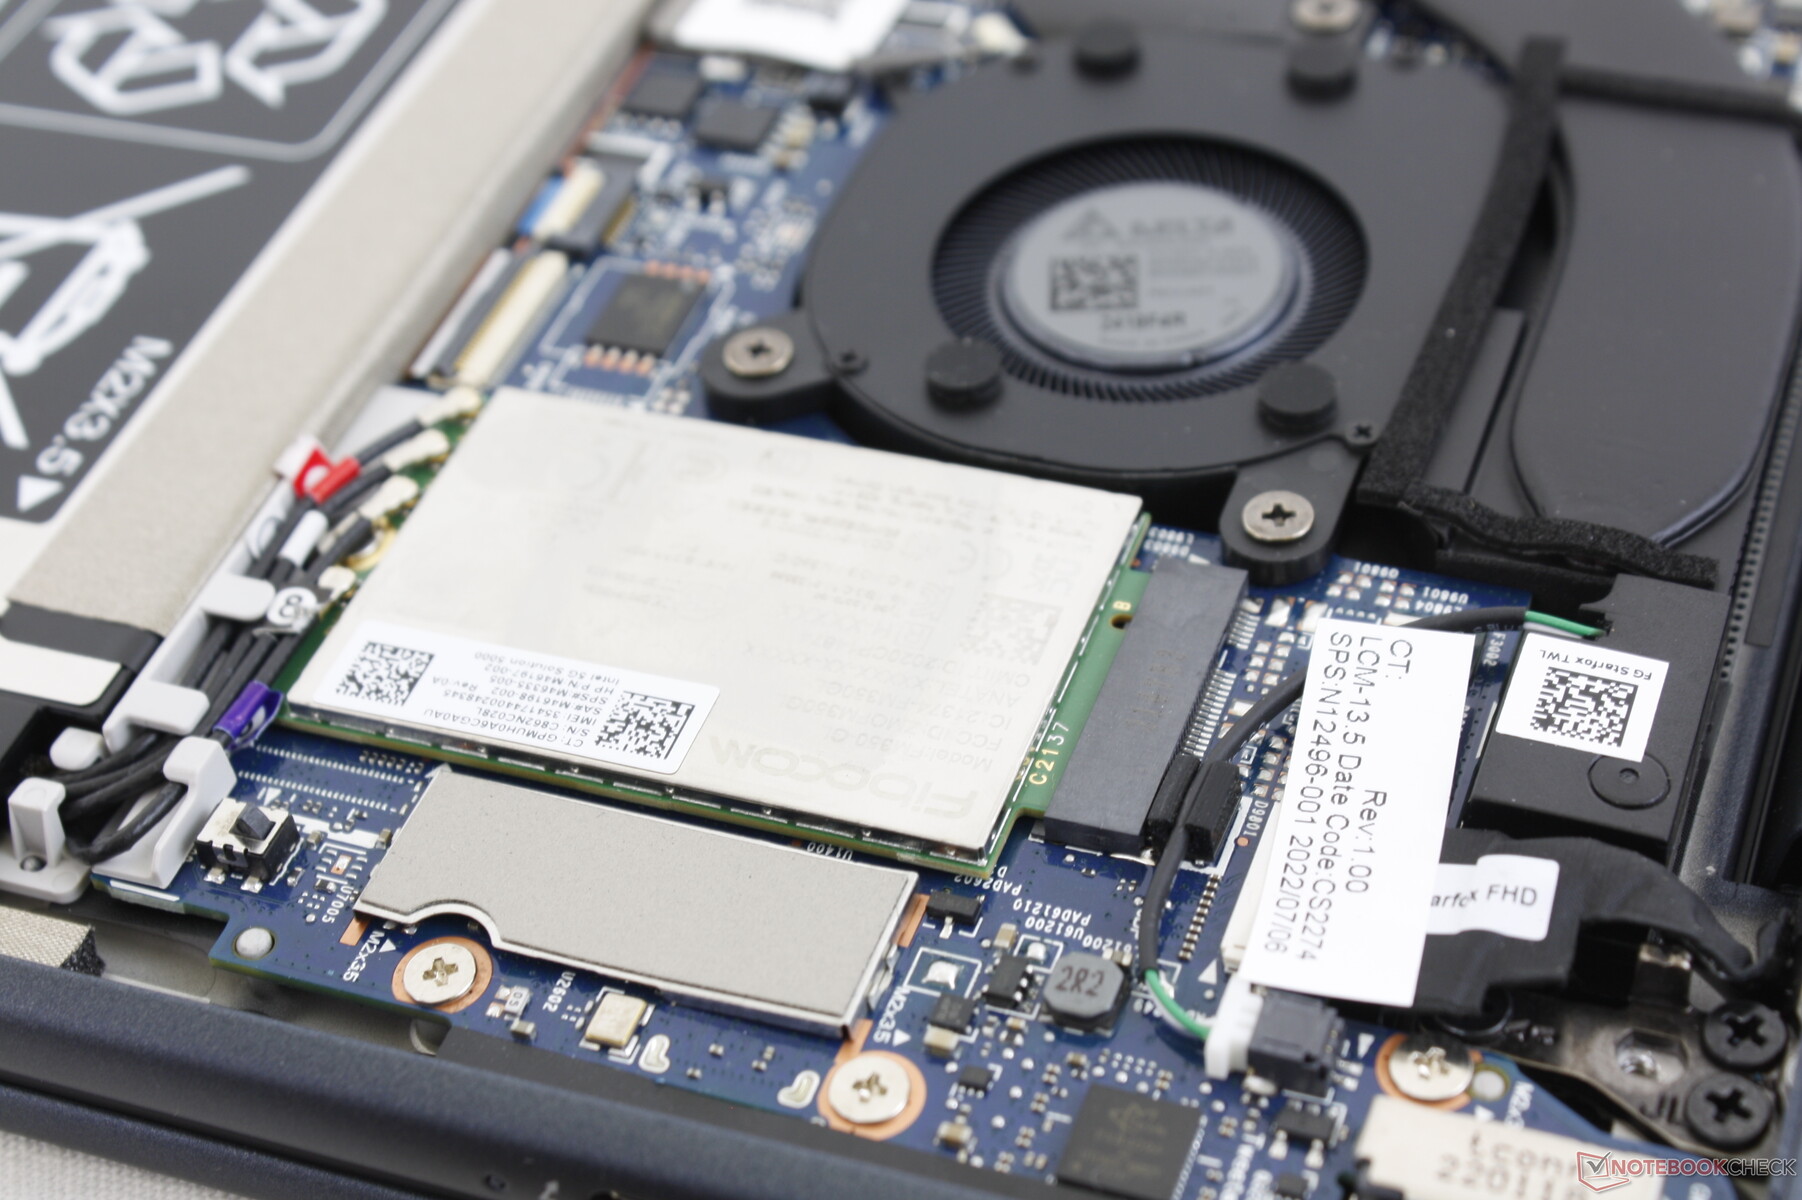
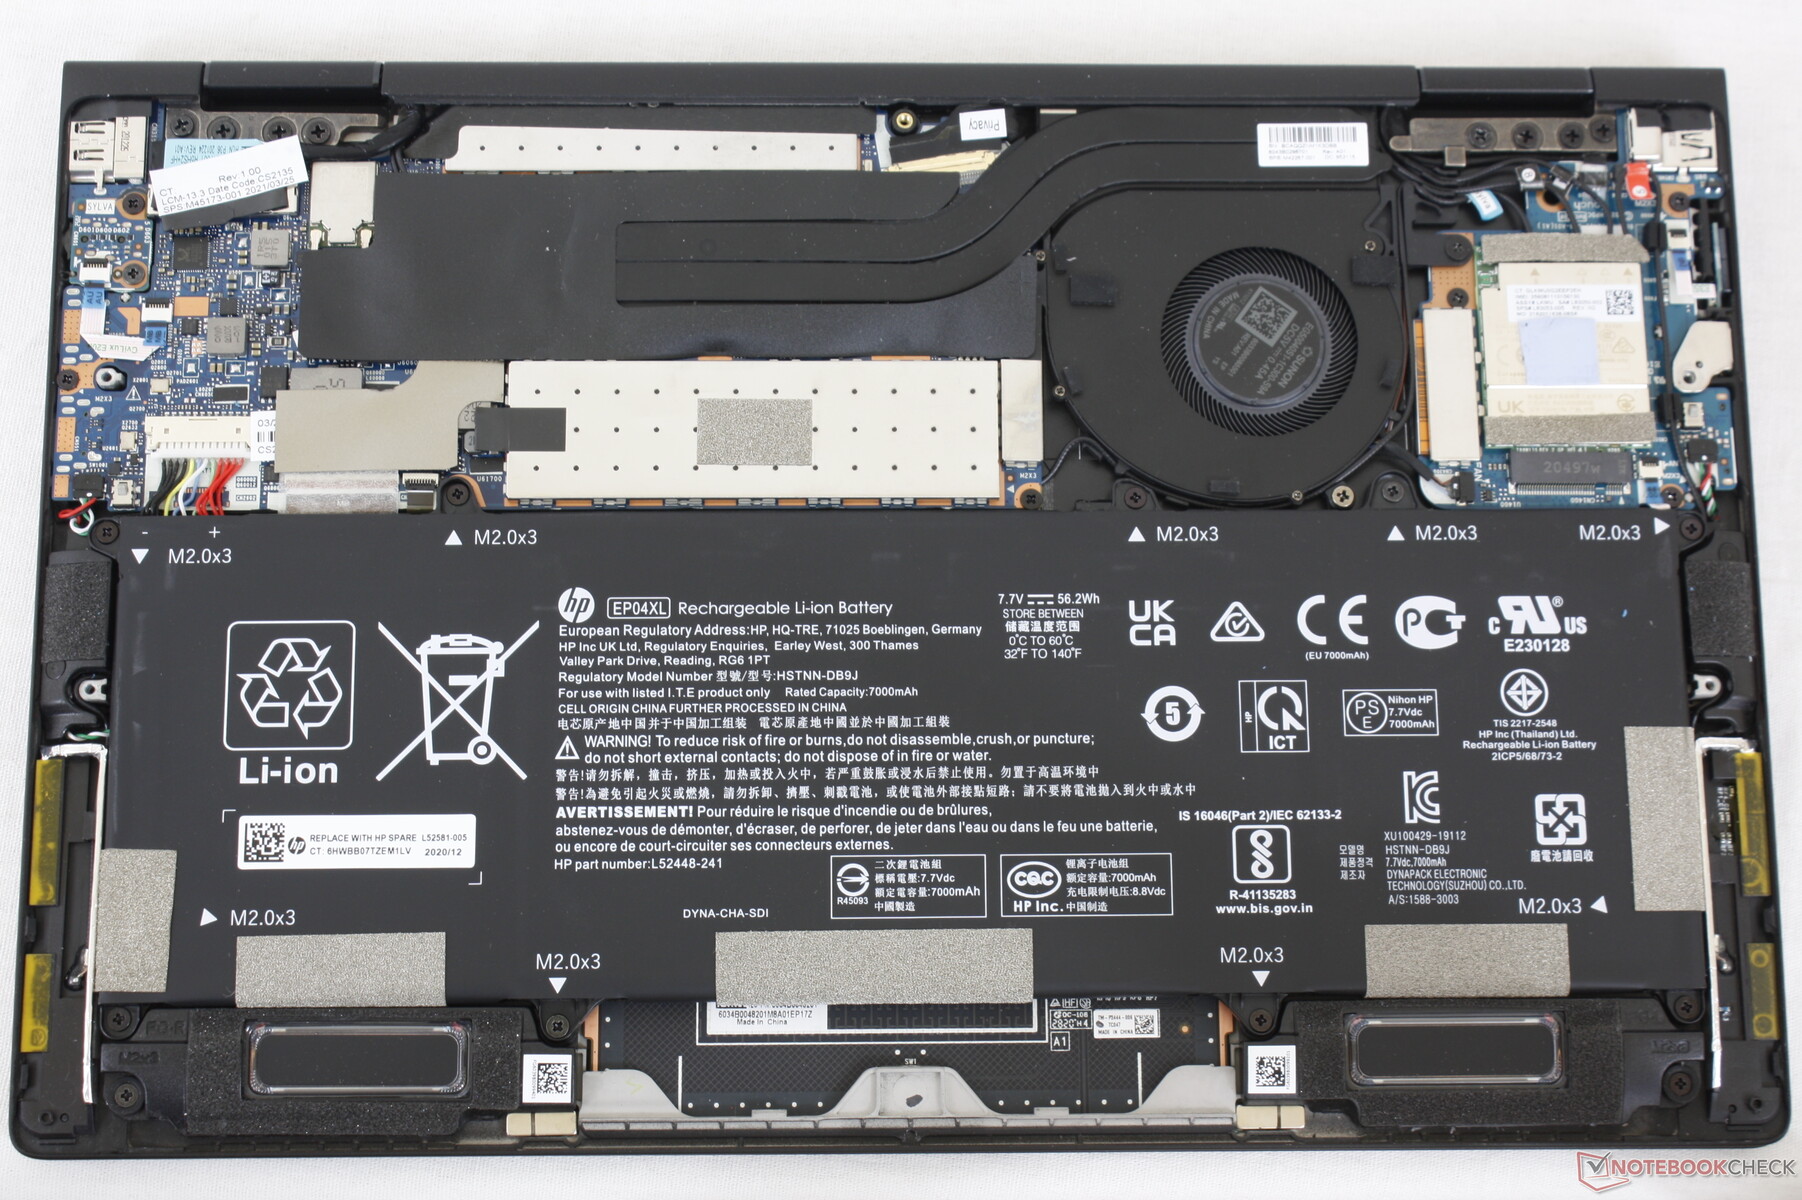
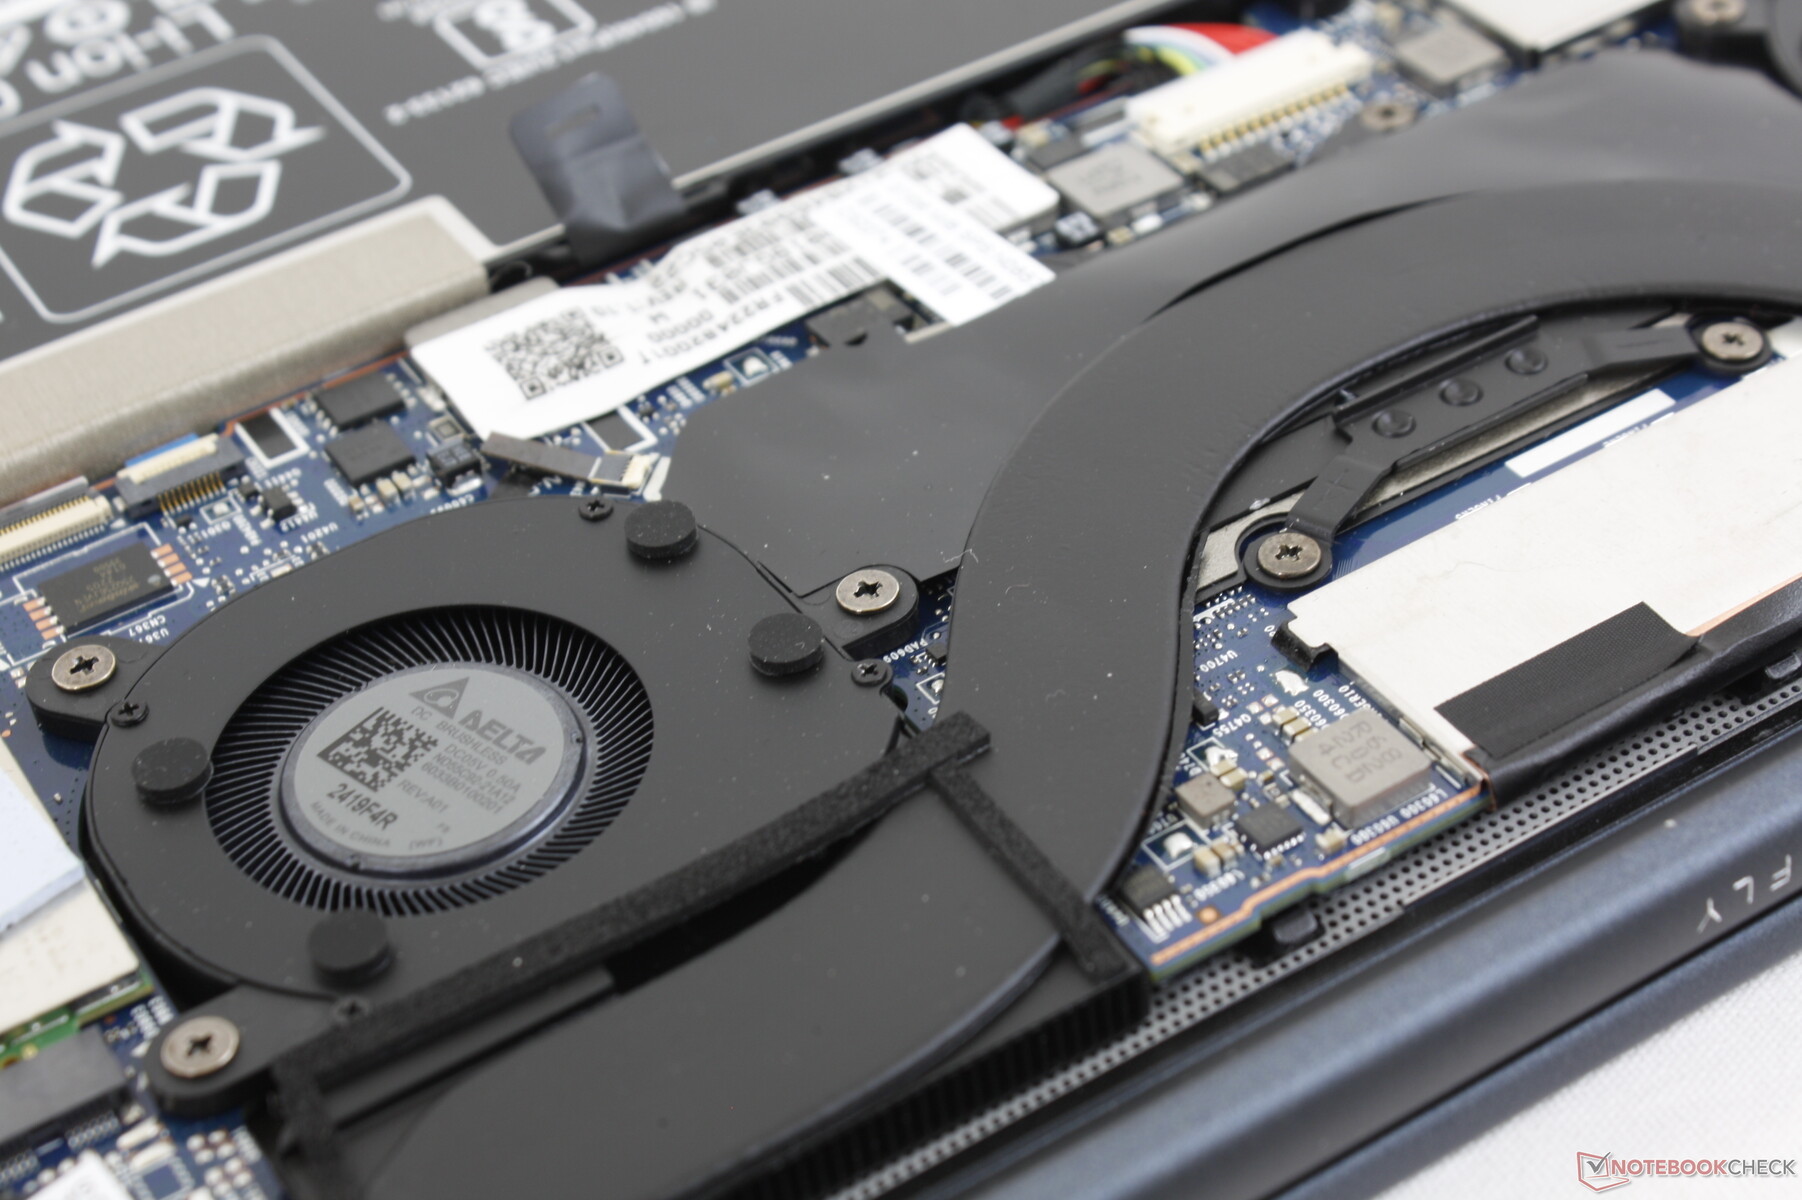
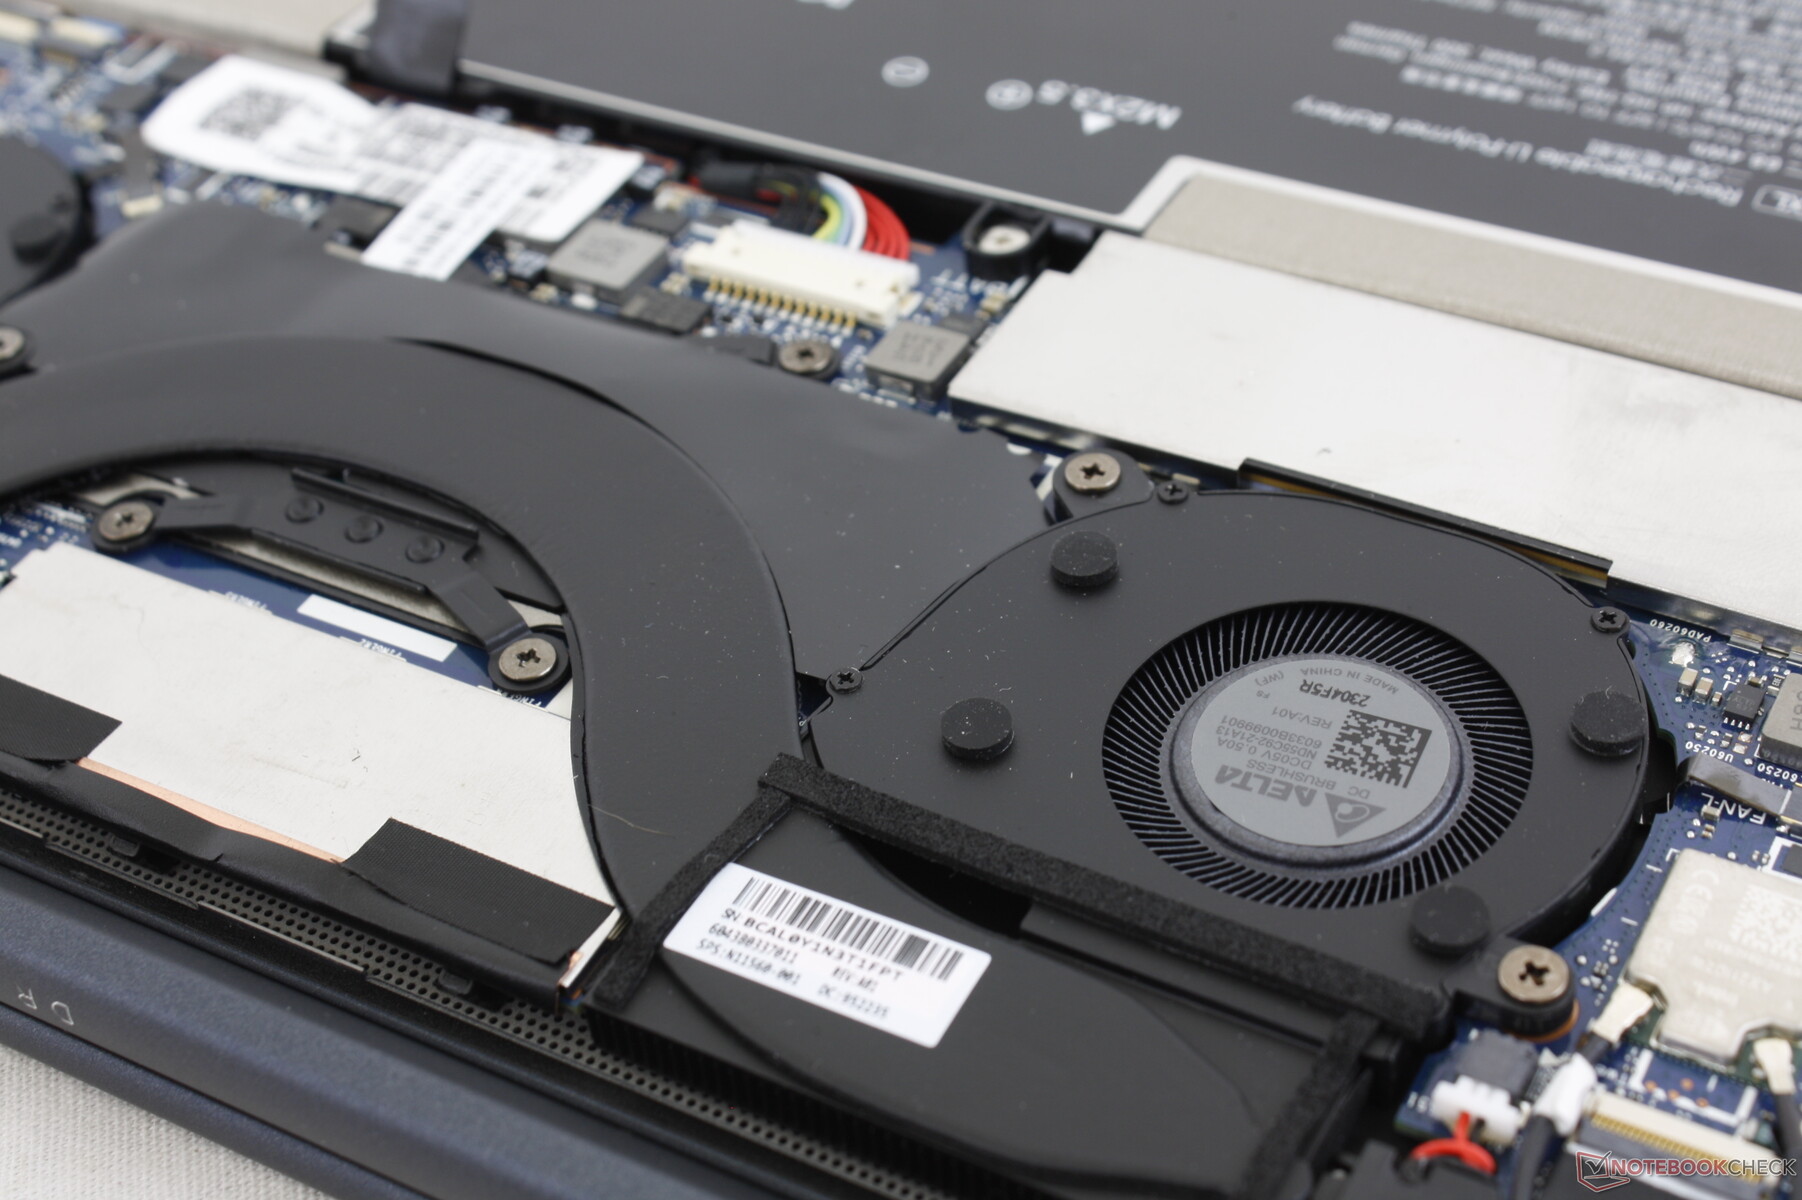
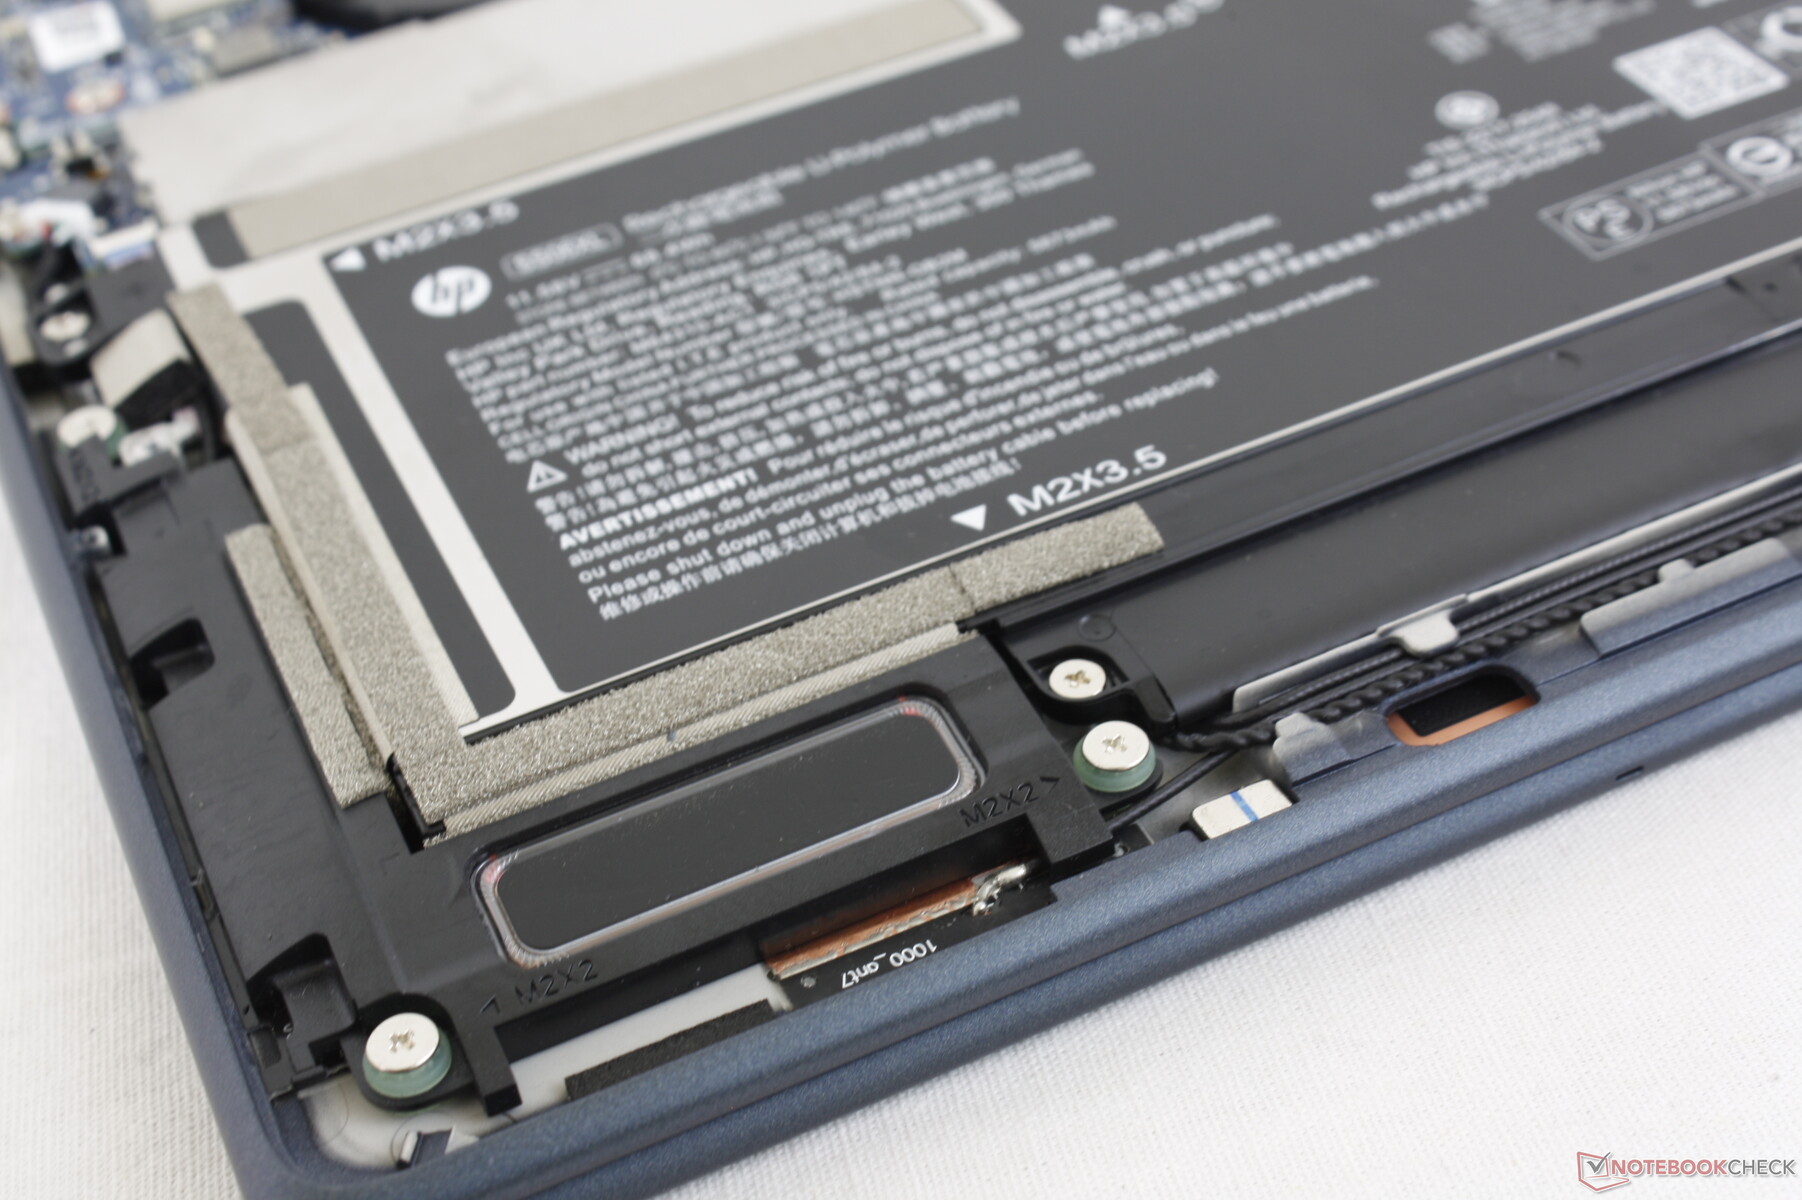
An Intel XMM 7560 R+ or 5G 5000 WWAN module are optional. The WWAN module is removable while the WLAN module is not as shown by the images below.
| Networking | |
| iperf3 transmit AX12 | |
| Lenovo ThinkPad X1 Titanium Yoga G1 20QA001RGE | |
| HP Spectre x360 14t-ea000 | |
| HP EliteBook Folio 13.5-3G2L2EA | |
| iperf3 receive AX12 | |
| Lenovo ThinkPad X1 Titanium Yoga G1 20QA001RGE | |
| HP Spectre x360 14t-ea000 | |
| HP EliteBook Folio 13.5-3G2L2EA | |
| iperf3 receive AXE11000 6GHz | |
| Dell XPS 13 Plus 9320 i5-1240p | |
| Framework Laptop 13.5 12th Gen Intel | |
| HP Elite Dragonfly G3 | |
| iperf3 transmit AXE11000 6GHz | |
| Framework Laptop 13.5 12th Gen Intel | |
| HP Elite Dragonfly G3 | |
| Dell XPS 13 Plus 9320 i5-1240p | |
Webcam — 5 MP Standard
Though last year's Dragonfly Max also shipped with a 5 MP webcam, the one on the Dragonfly G3 is noticeably sharper and brighter overall to be one of the best integrated webcams we've seen on any laptop regardless of screen size. Shutter and IR are both present for privacy and Hello support, respectively.


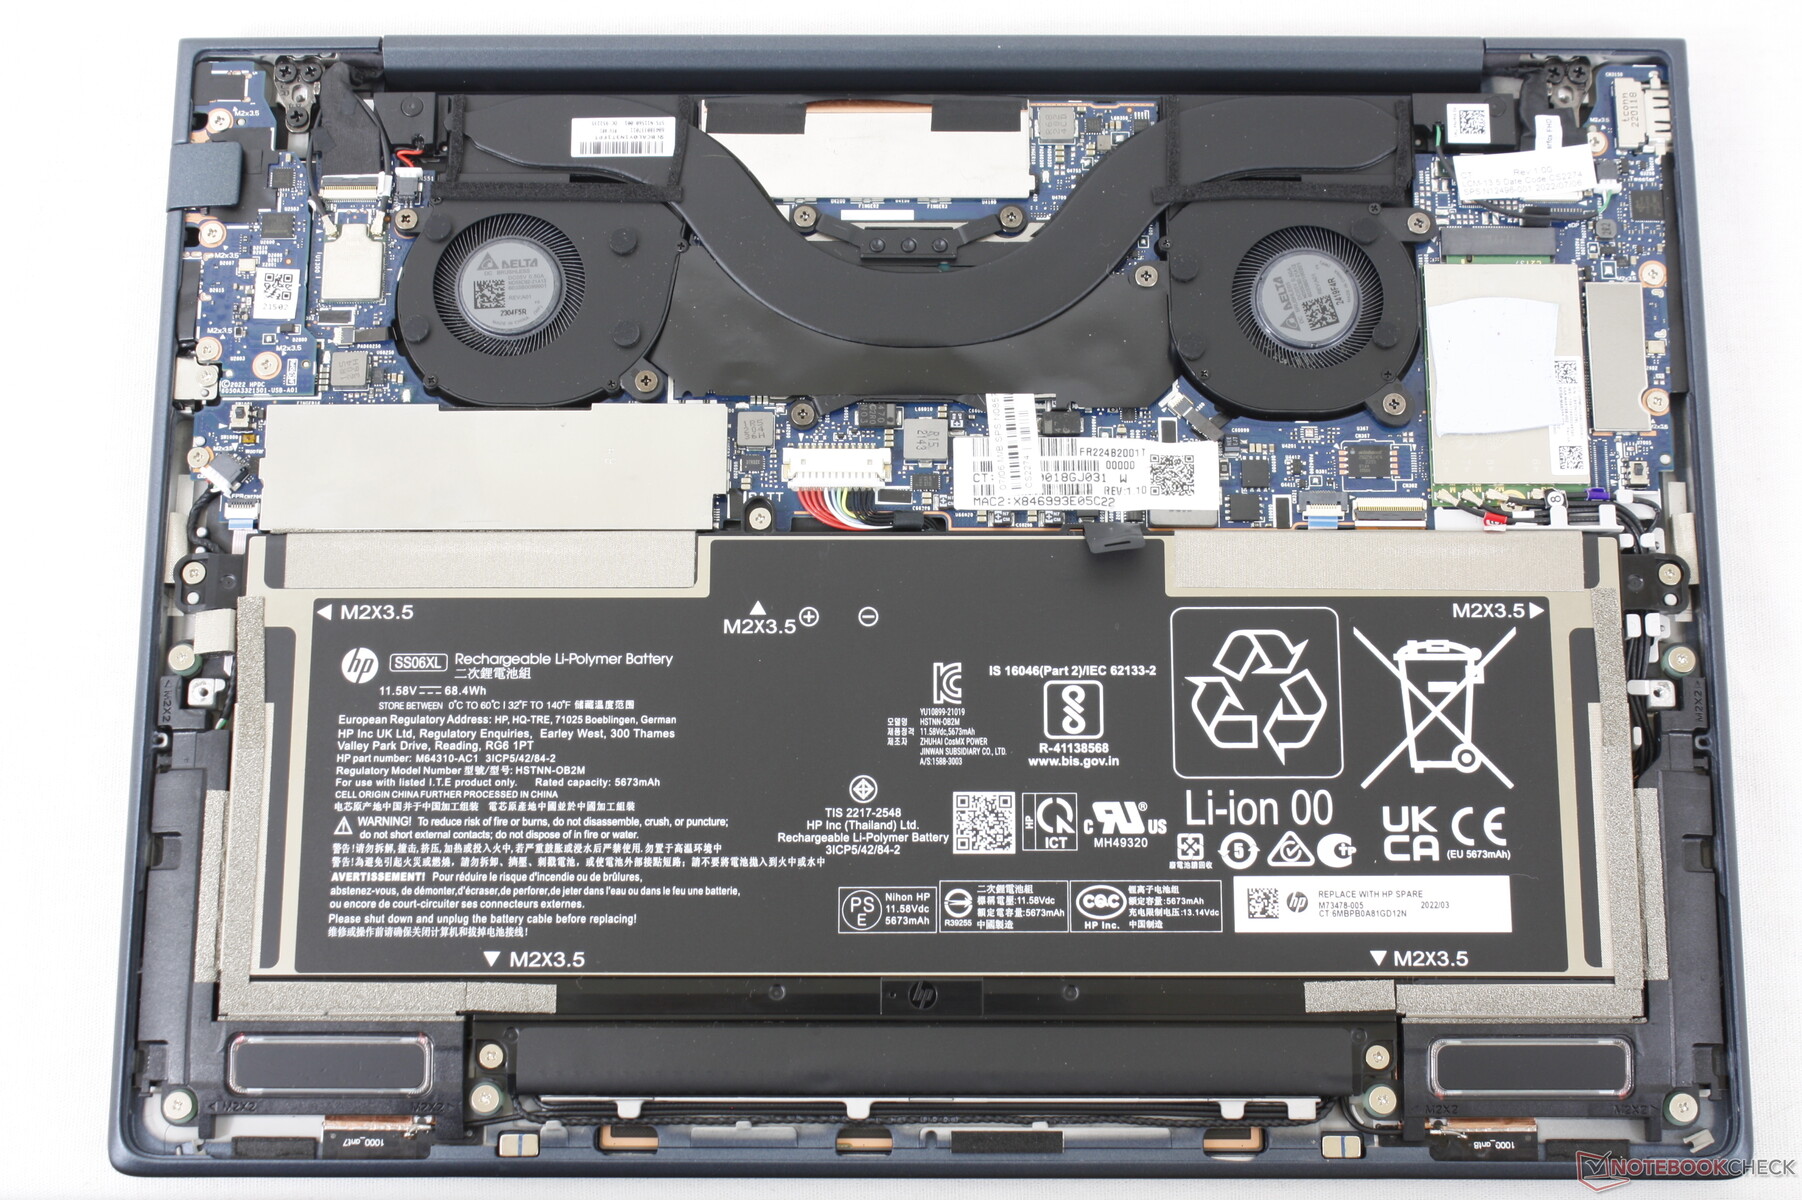
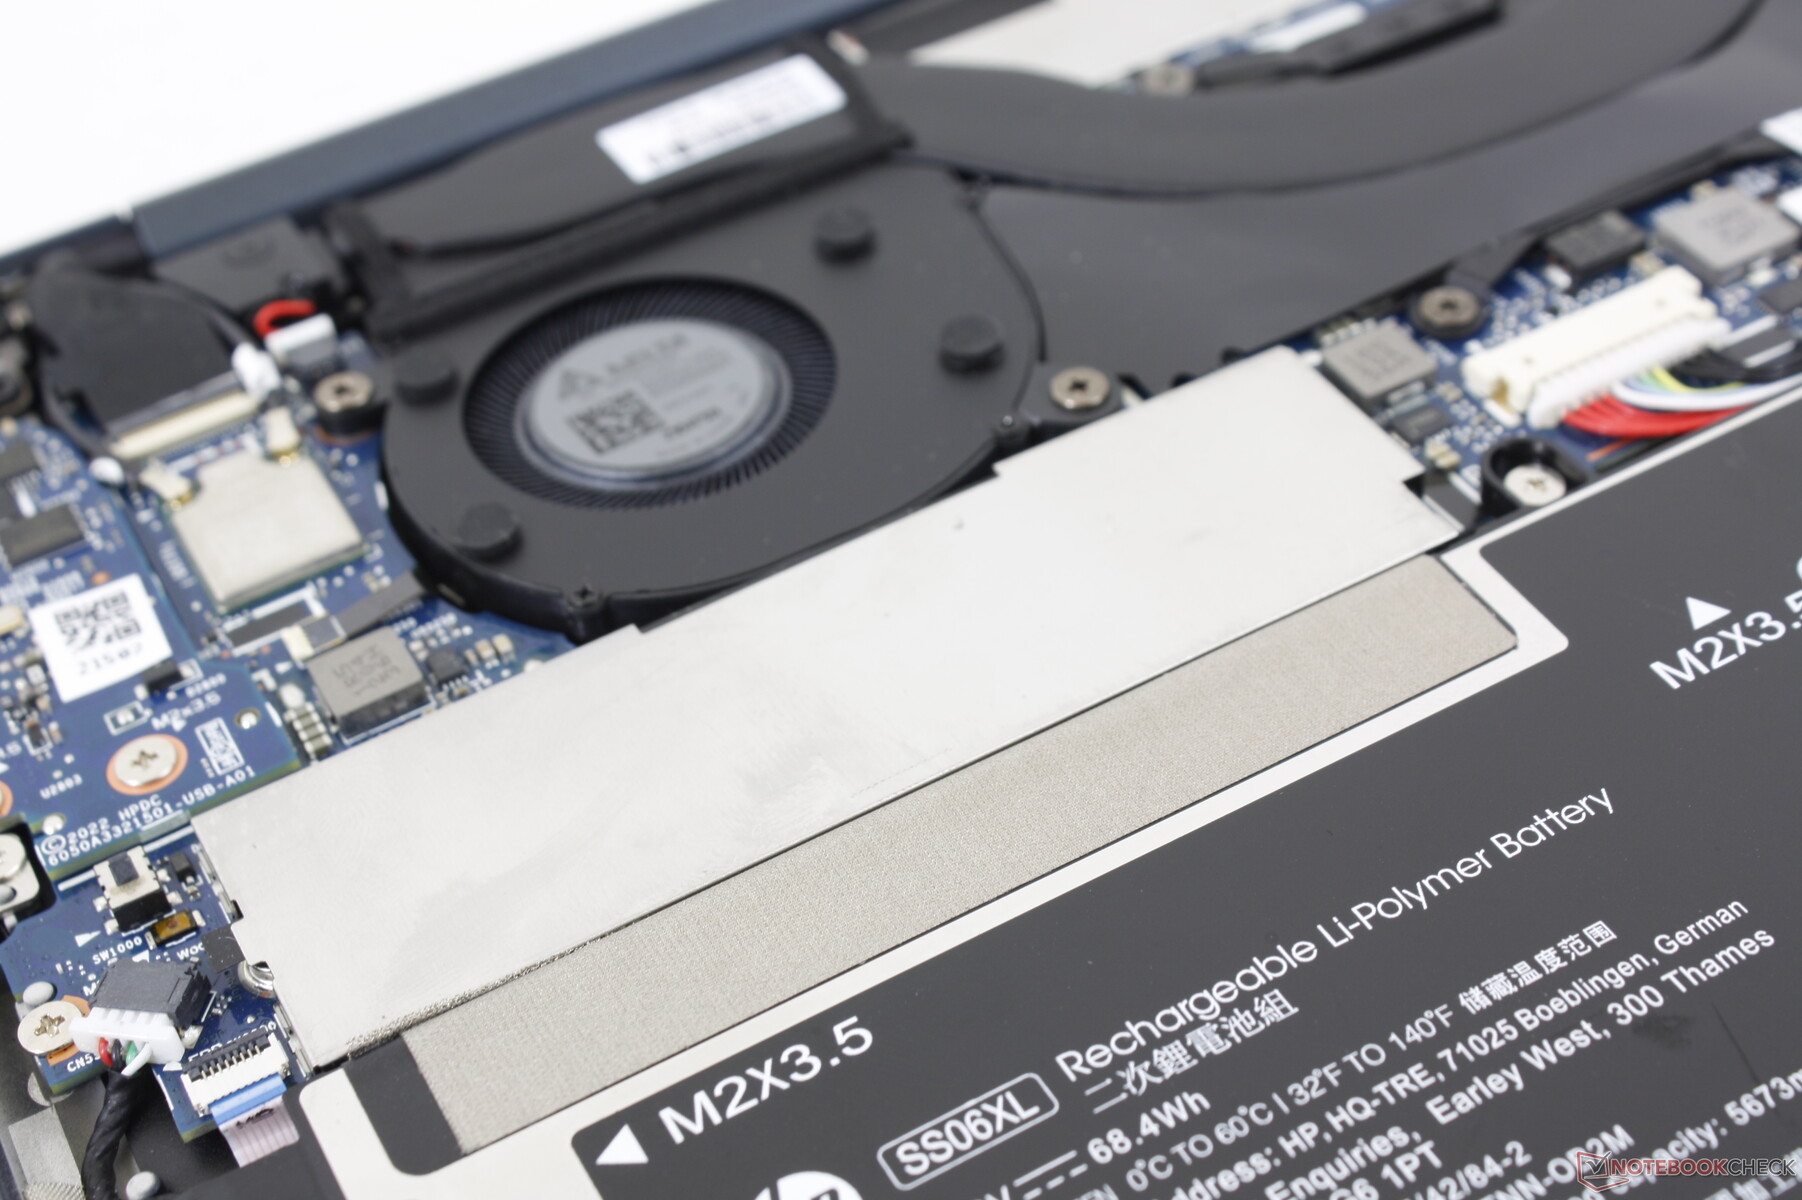
Maintenance
The bottom panel is secured by just four accessible T5 Torx screws for easy servicing. Users can swap out the battery, M.2 WWAN, or M.2 SSD as needed while the RAM modules are fixed.
Accessories and Warranty
There are no extras in the box other than the AC adapter and paperwork. A carrying case would have been nice to see similar to what is included with certain Spectre models.
A base one-year limited manufacturer warranty comes standard if purchased in the US. We find this disappointing as the Dragonfly is one of HP's flagship business laptops where a base 3-year warranty is expected. The Dell Latitude 7330, for example, comes with a 3-year warranty at no extra cost.
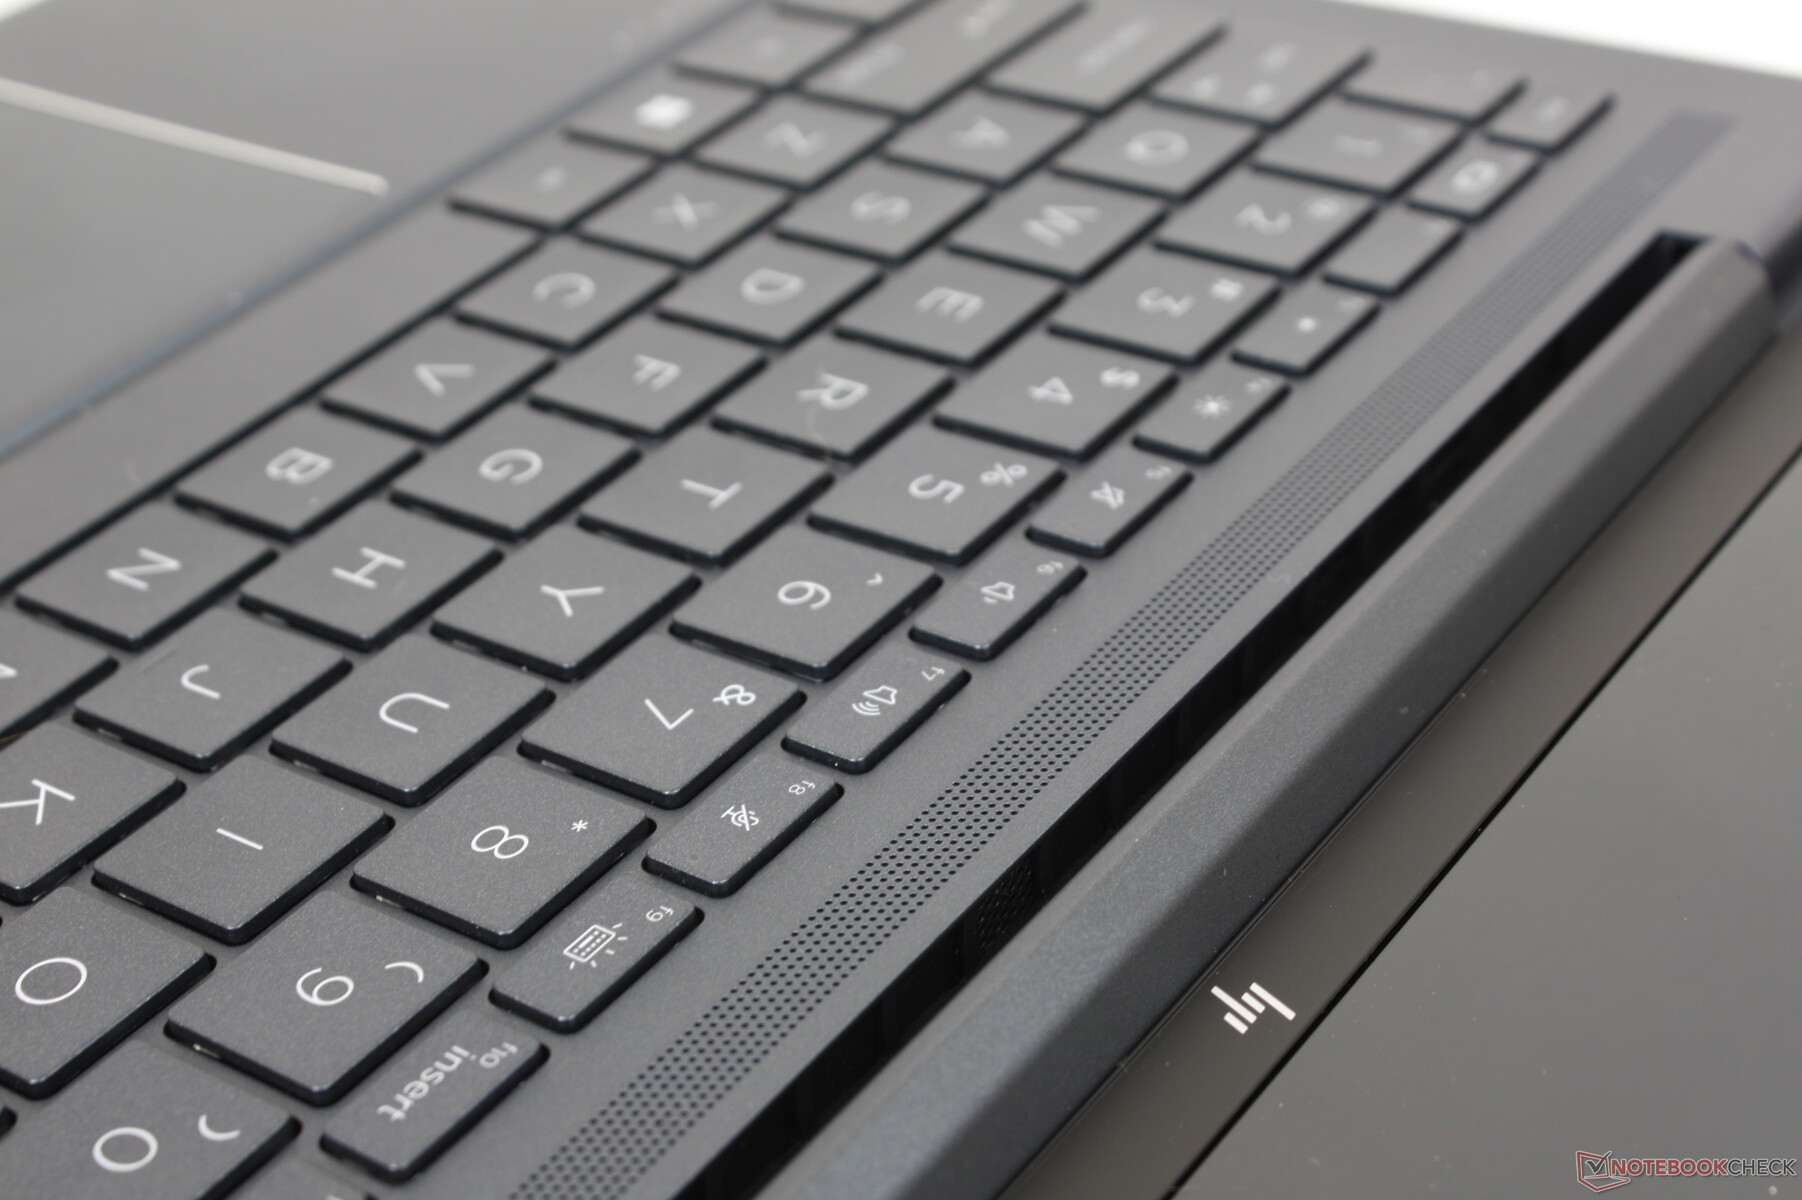
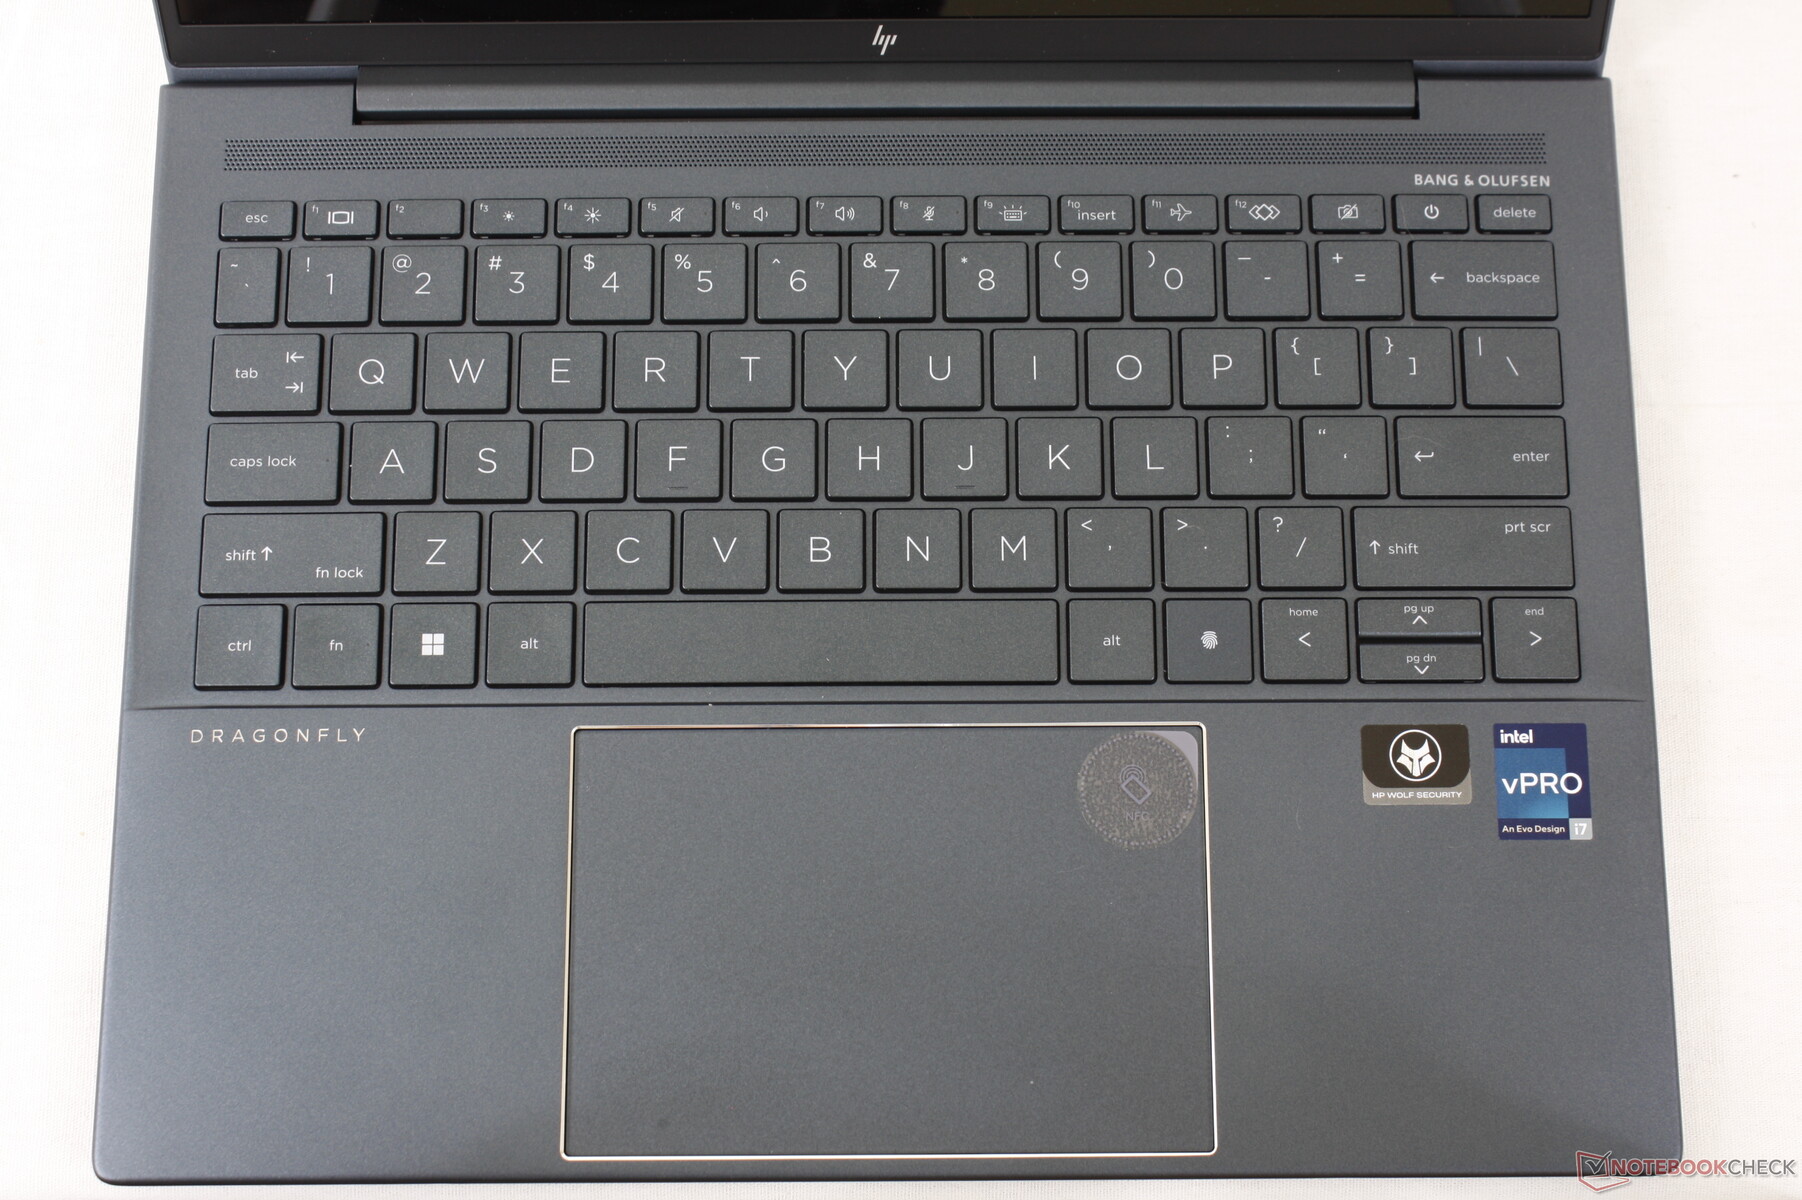
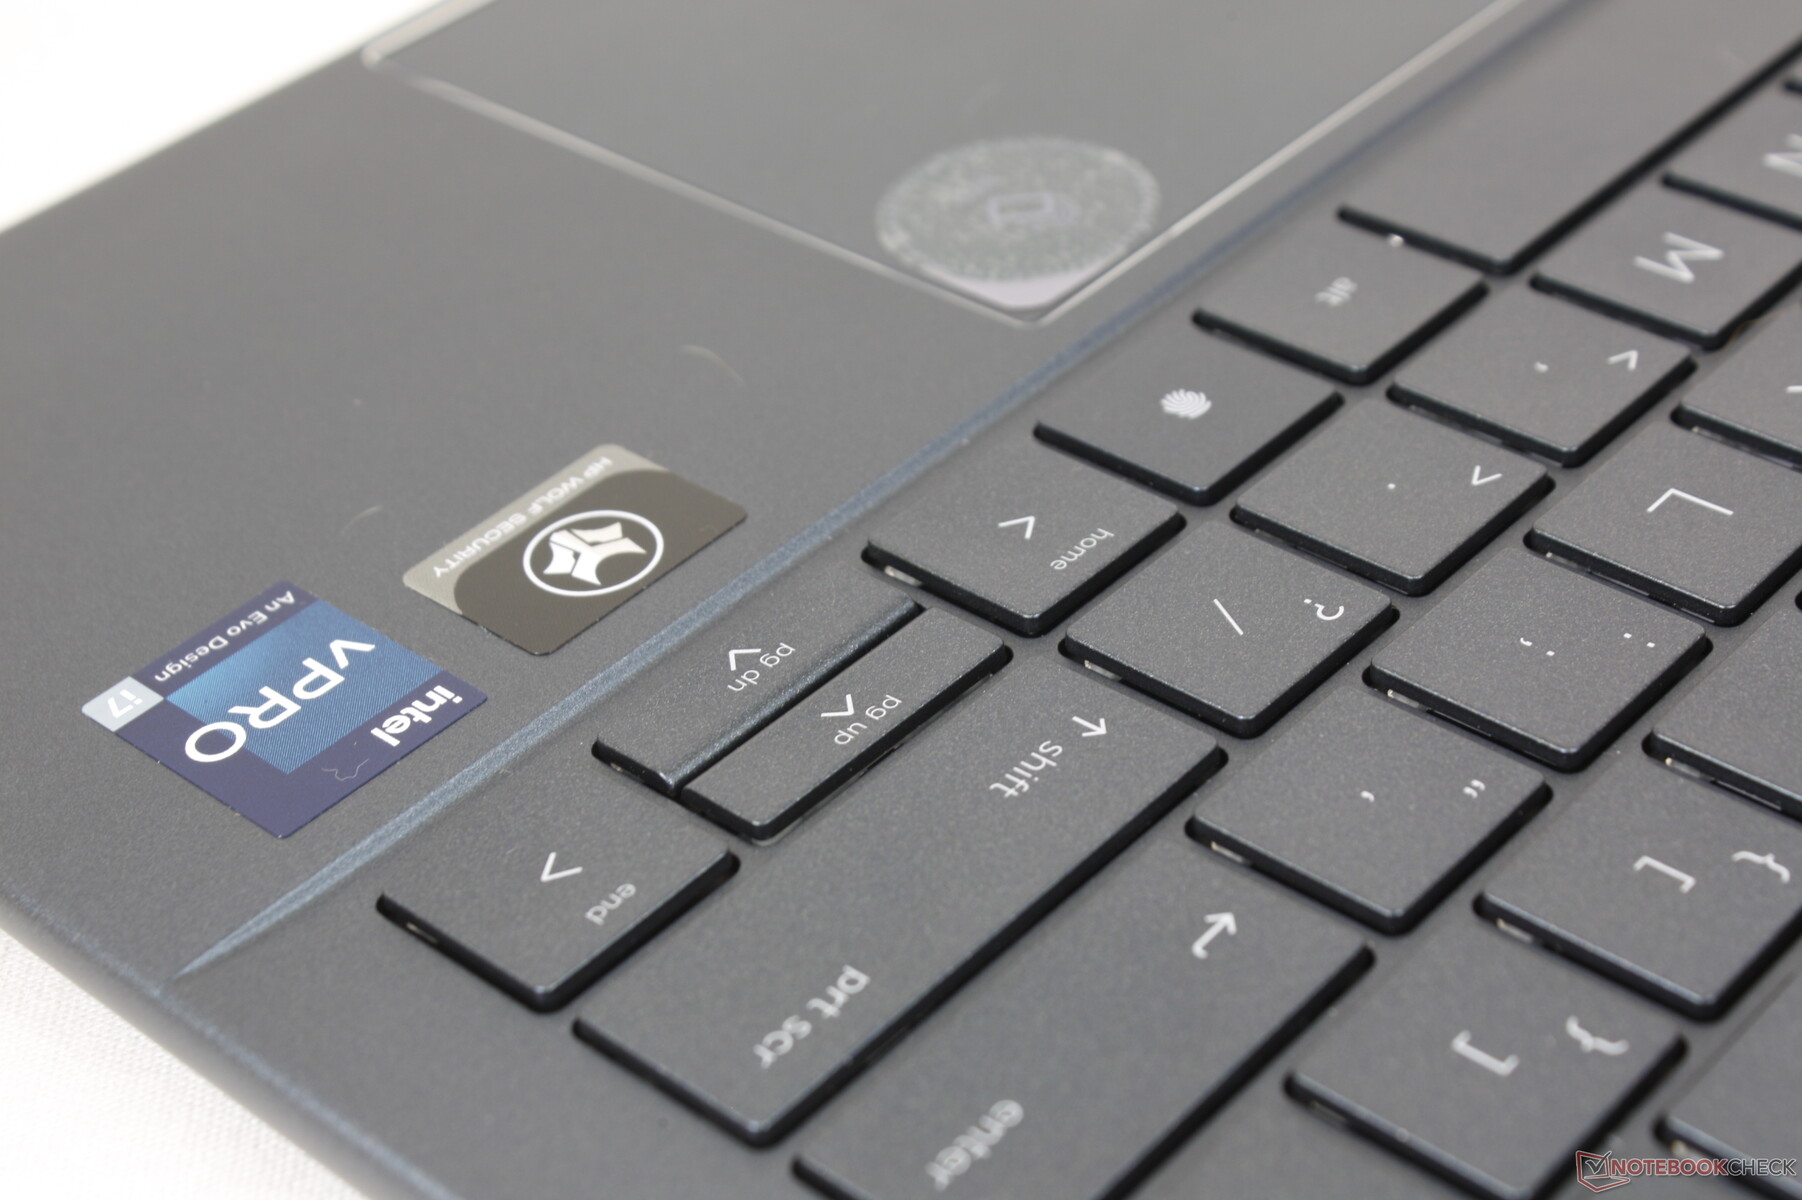
Input Devices — Bigger Letters, Bigger Clickpad
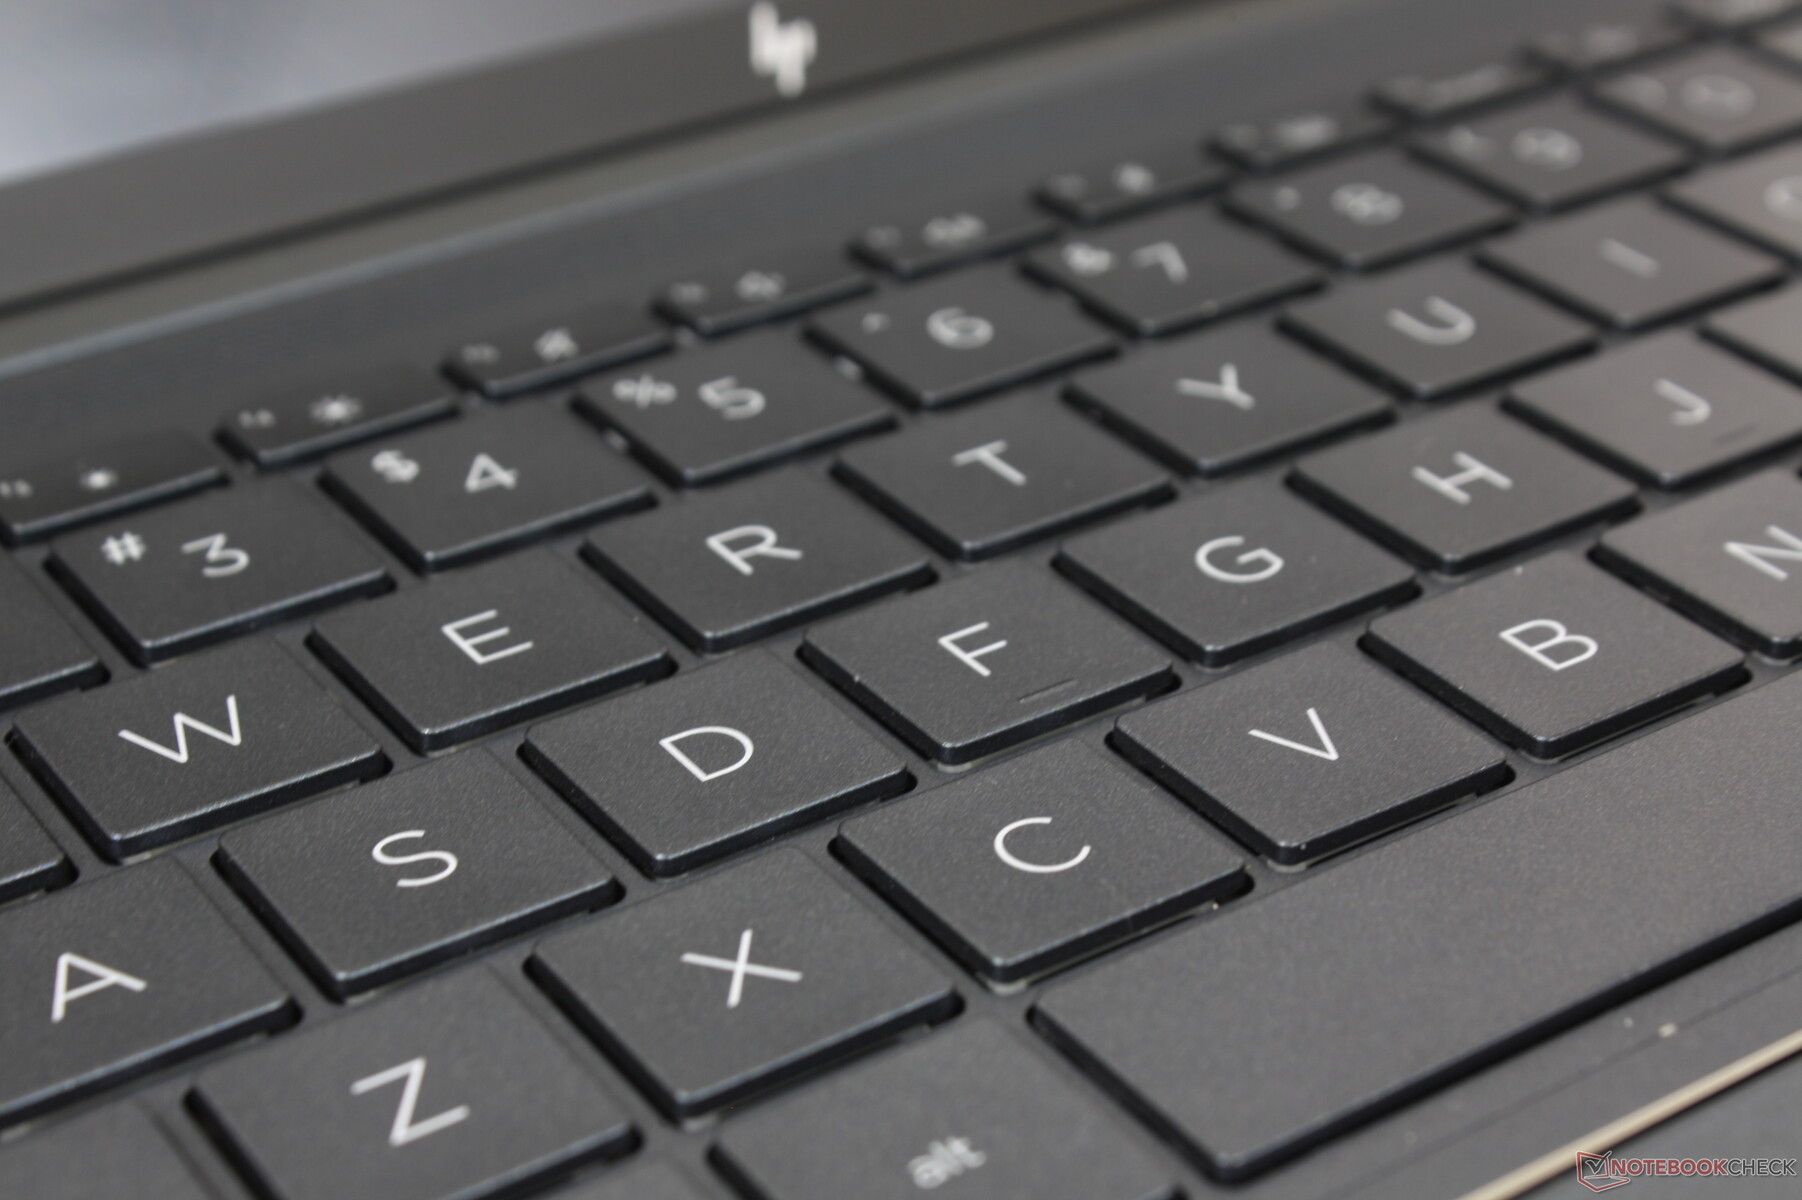
Keyboard
The typing experience between Spectre and EliteBook/Dragonfly models is nearly identical. If you've typed on a Spectre laptop before, then you'll know what to expect from the Dragonfly G3. Feedback is sharp and with seemingly deeper travel than on the ThinkPad X1 Nano Gen 2. The cramped Up and Down keys are the perhaps worst part of the keyboard.
If configured with Sure View, the F2 key will have a toggle option for the display. Otherwise, the key will have no secondary function as shown in our picture below.
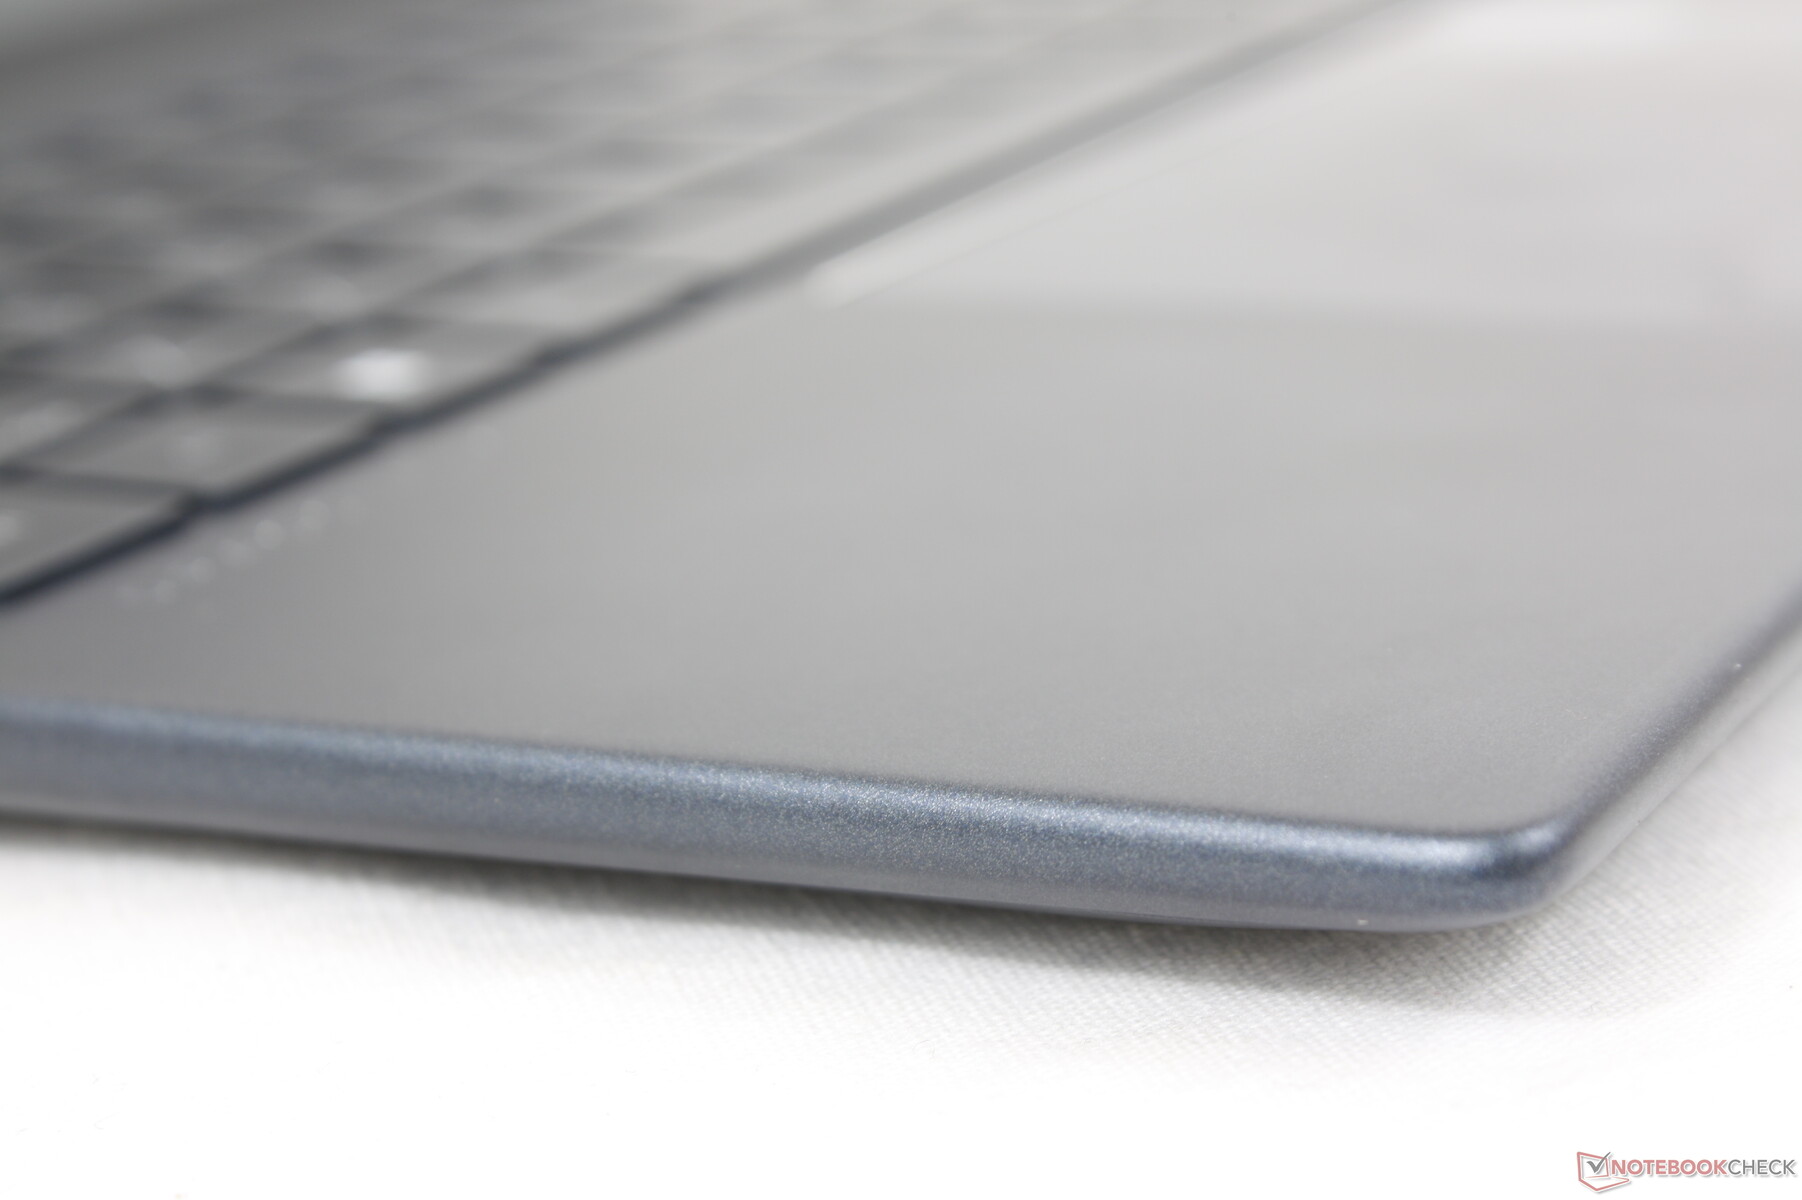
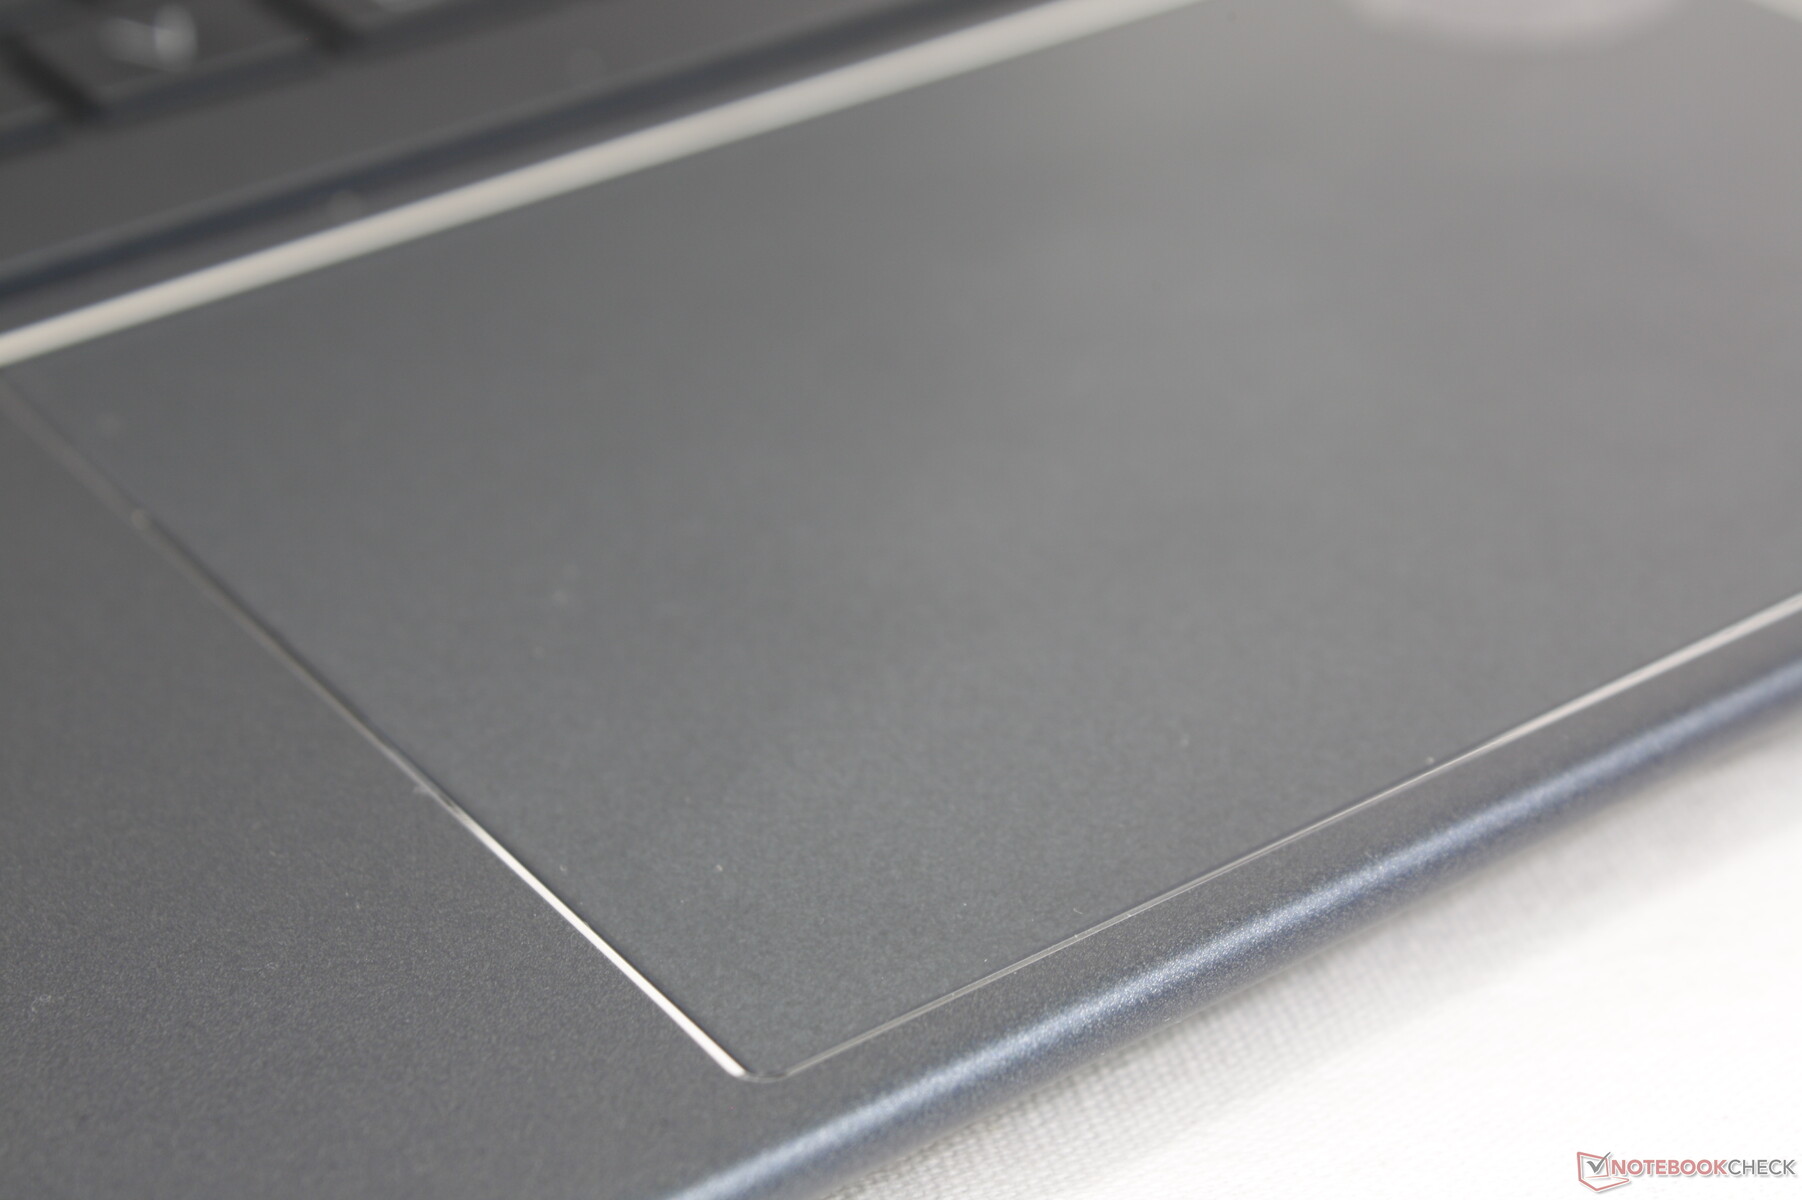
Touchpad
The clickpad is larger than the clickpad on the Dragonfly Max for easier cursor control (12 x 8 cm vs. 11 x 6.5 cm). Feedback when pressing on the clickpad is shallow but satisfying in spite of the quieter-than-expected clatter.
Display — Lots Of Options
A total of six 13.5-inch display options are available as follows:
- 1920 x 1280, 400 nits, glossy, non-touch, IPS
- 1920 x 1280, 400 nits, glossy, touch, IPS
- 1920 x 1280, 400 nits, matte, touch, IPS
- 1920 x 1280, 1000 nits, Sure View, matte, non-touch, IPS
- 1920 x 1280, 1000 nits, Sure View, matte, touch, IPS
- 3000 x 2000, 400 nits, glossy, touch, OLED
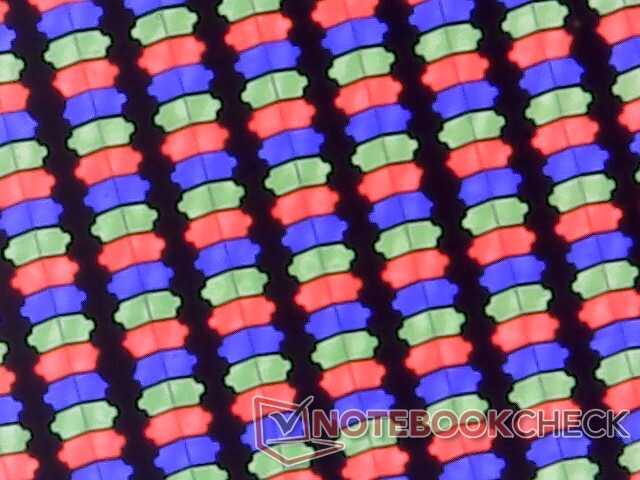
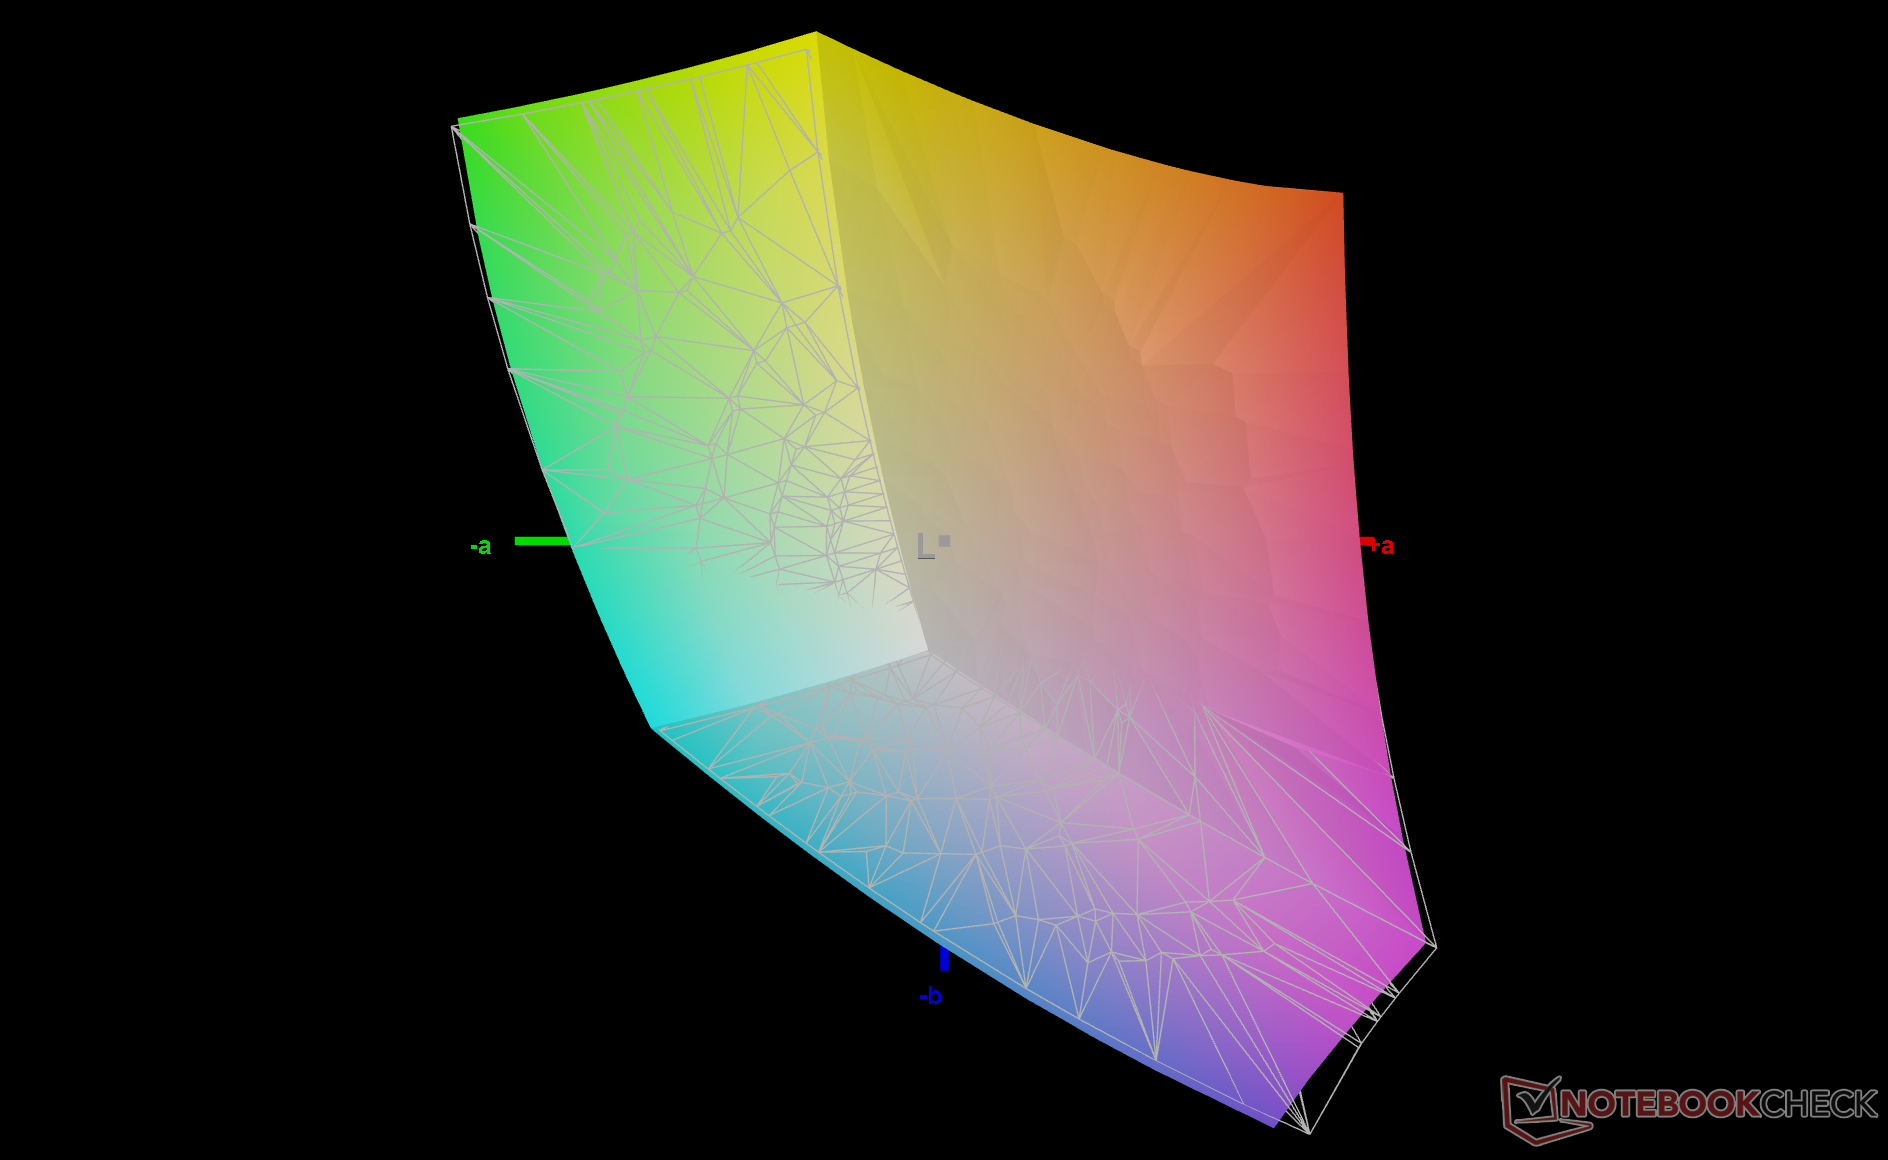
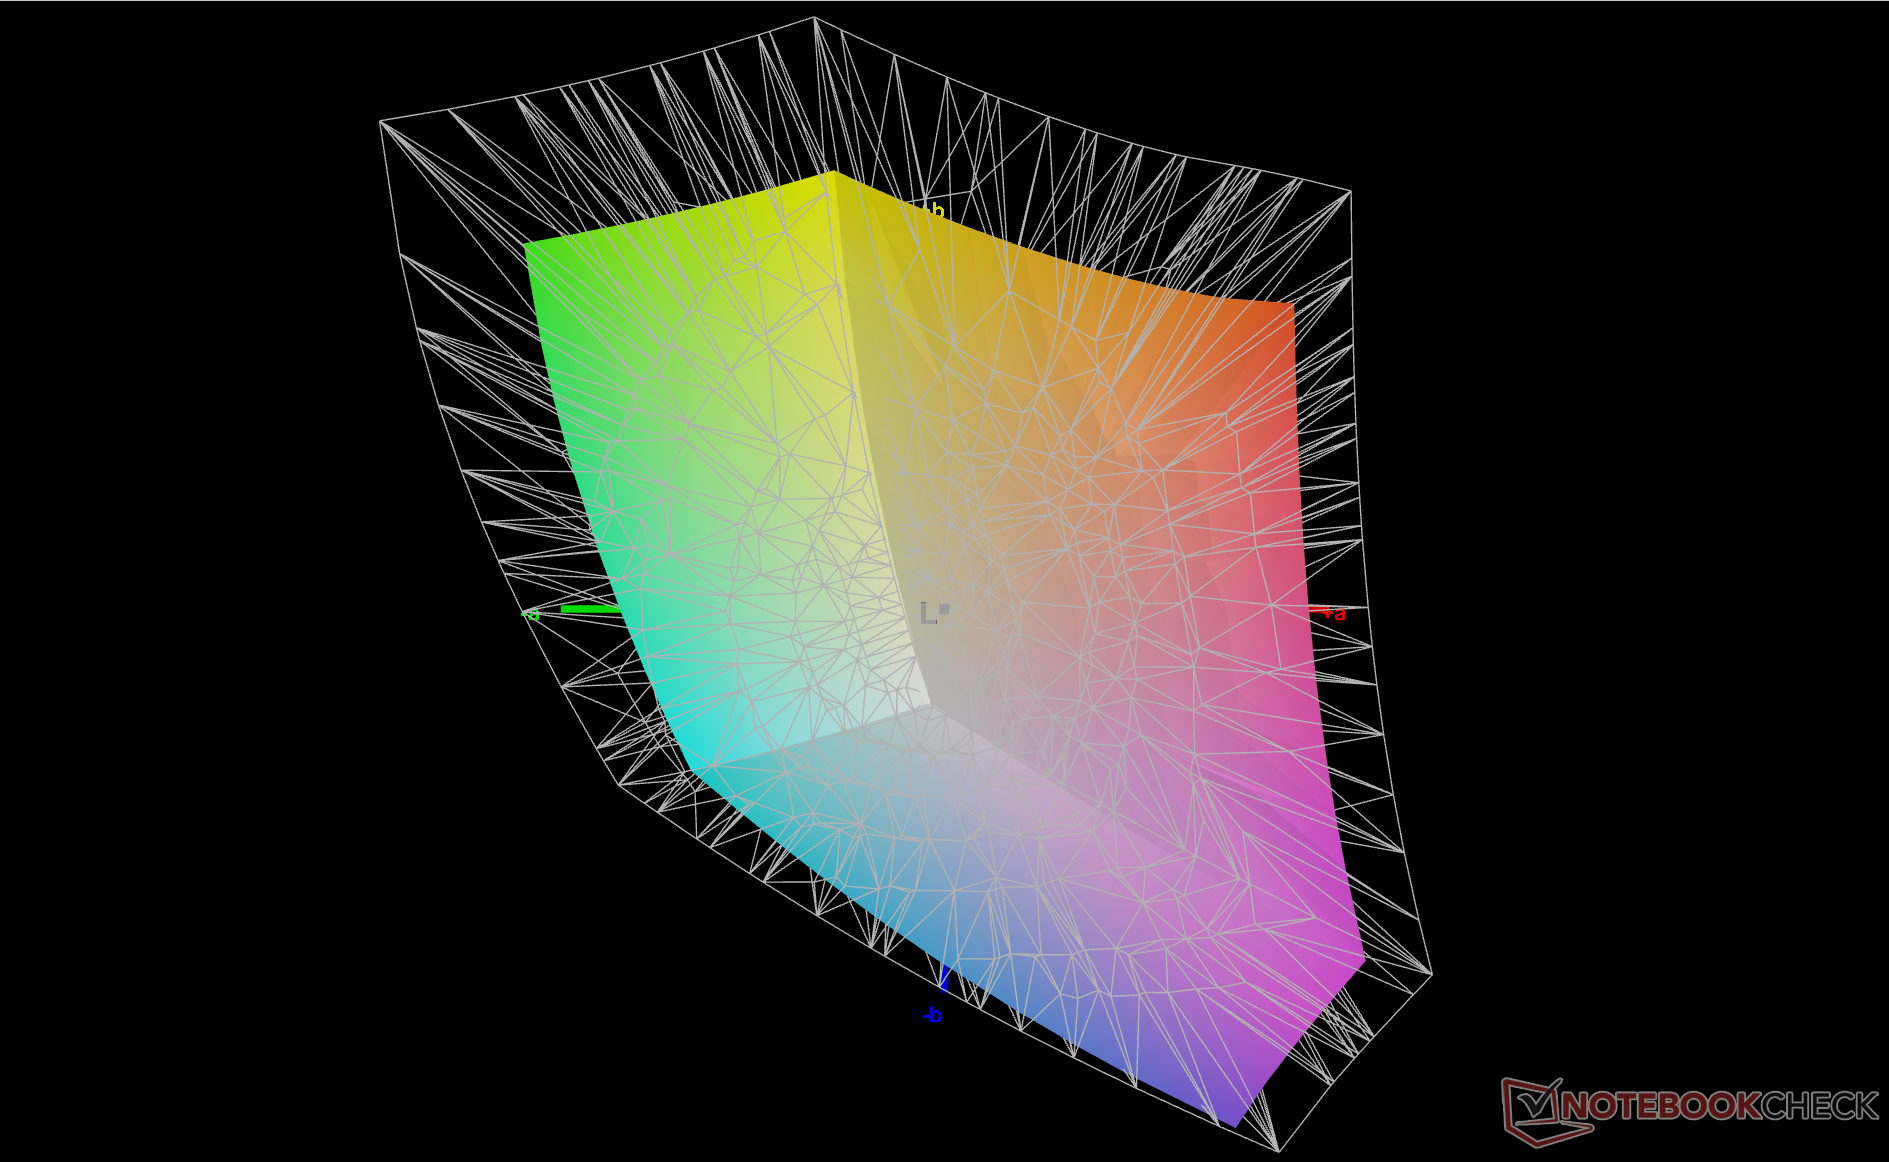
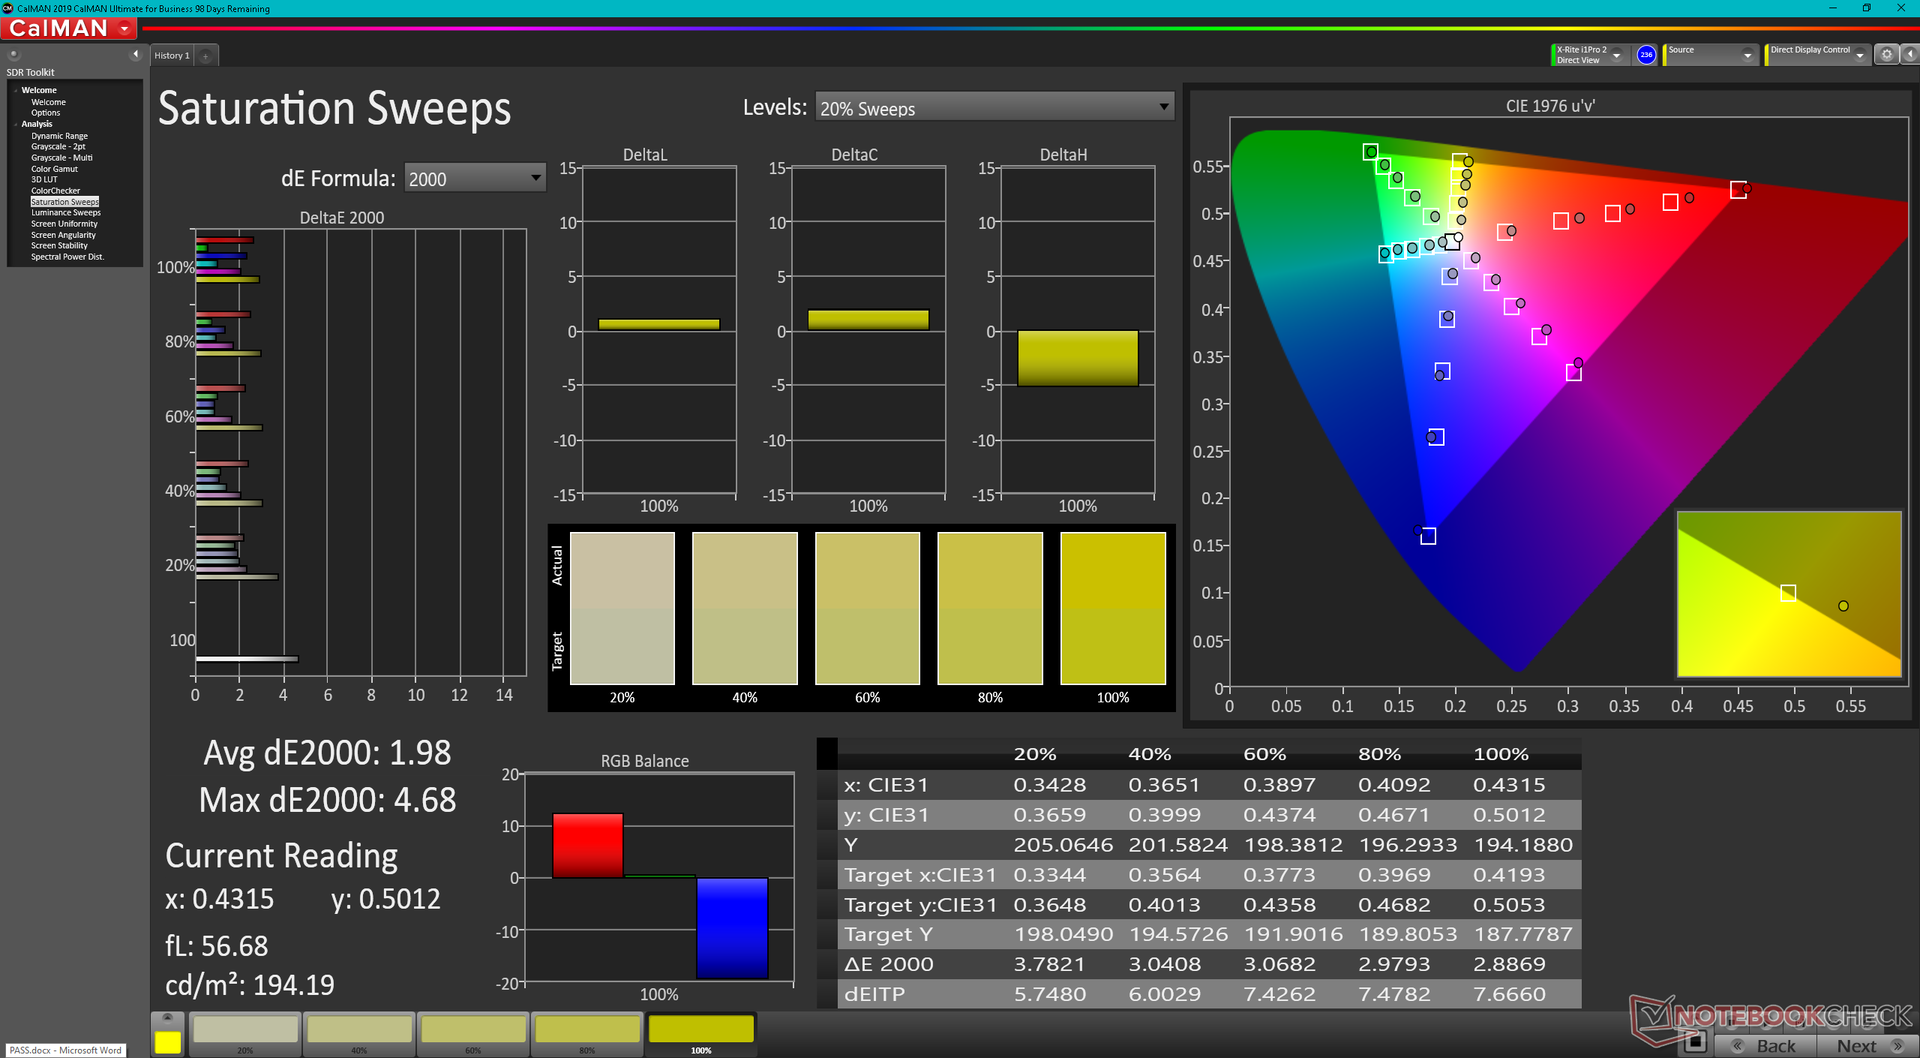
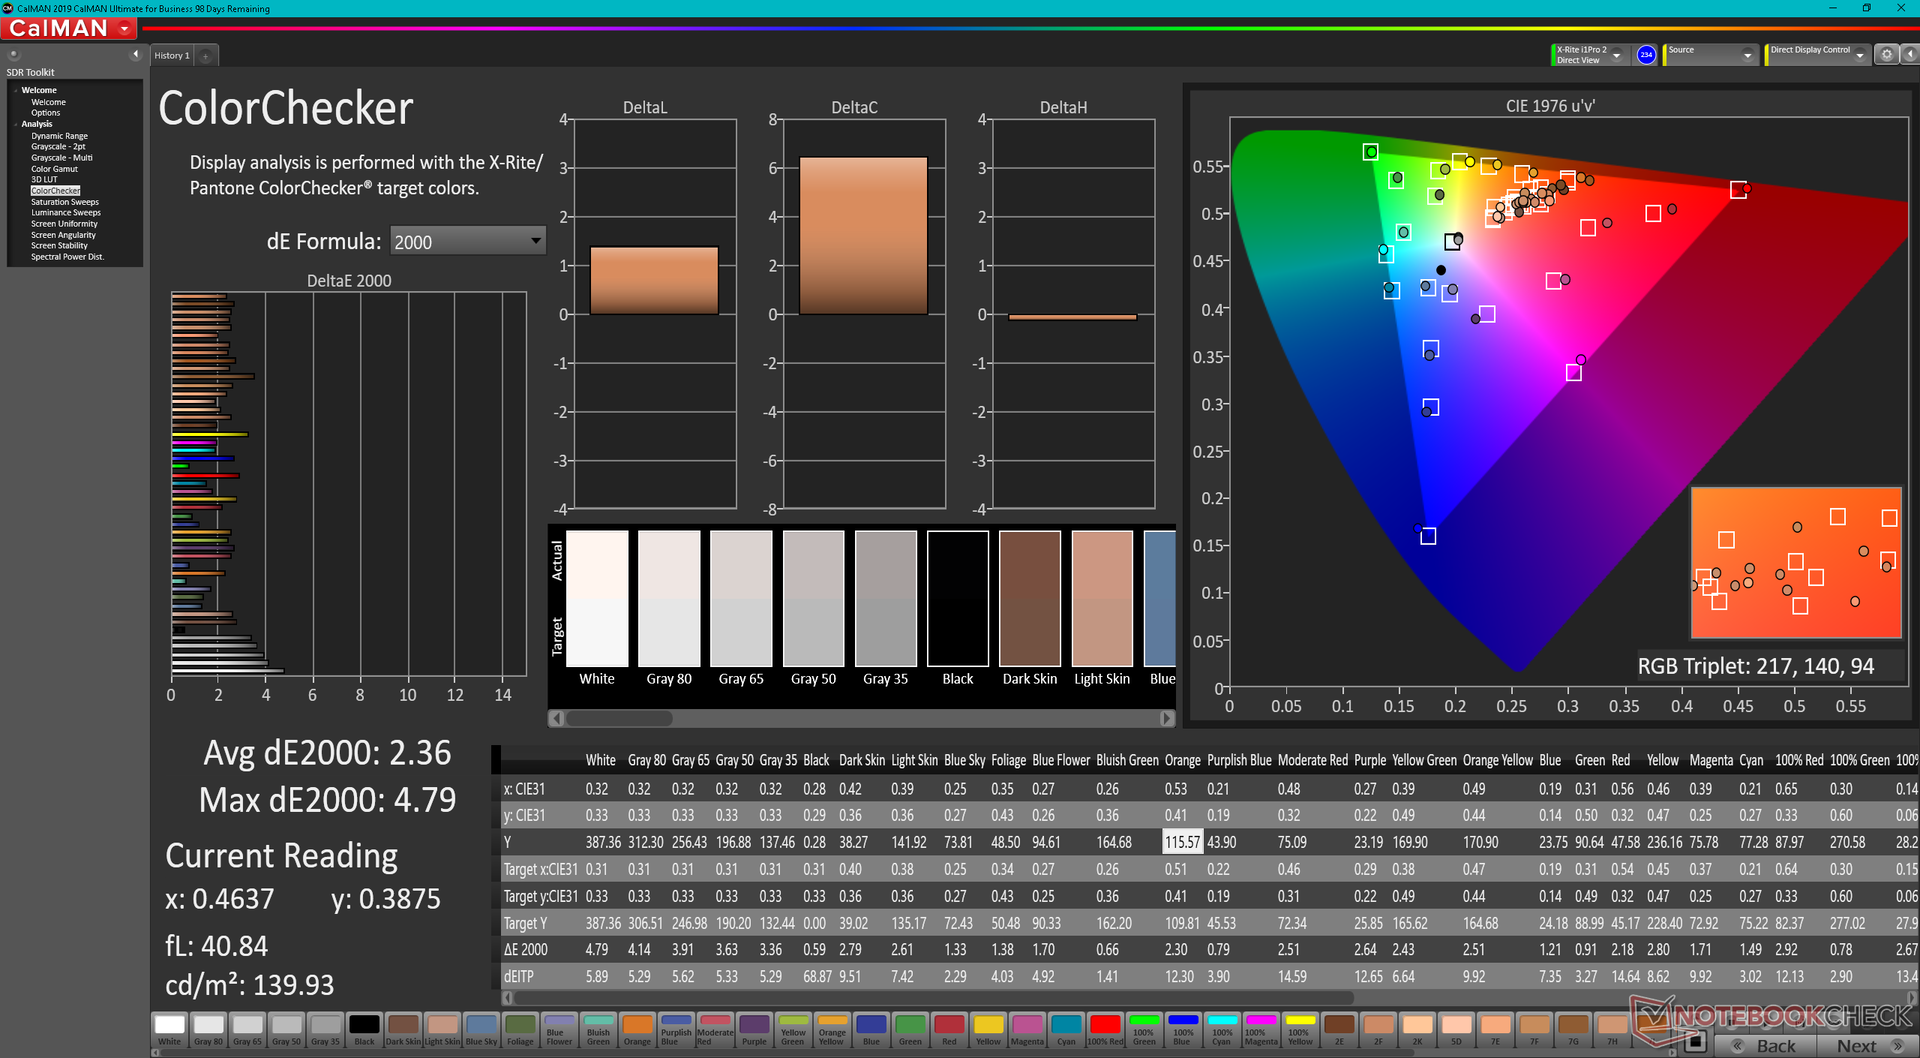
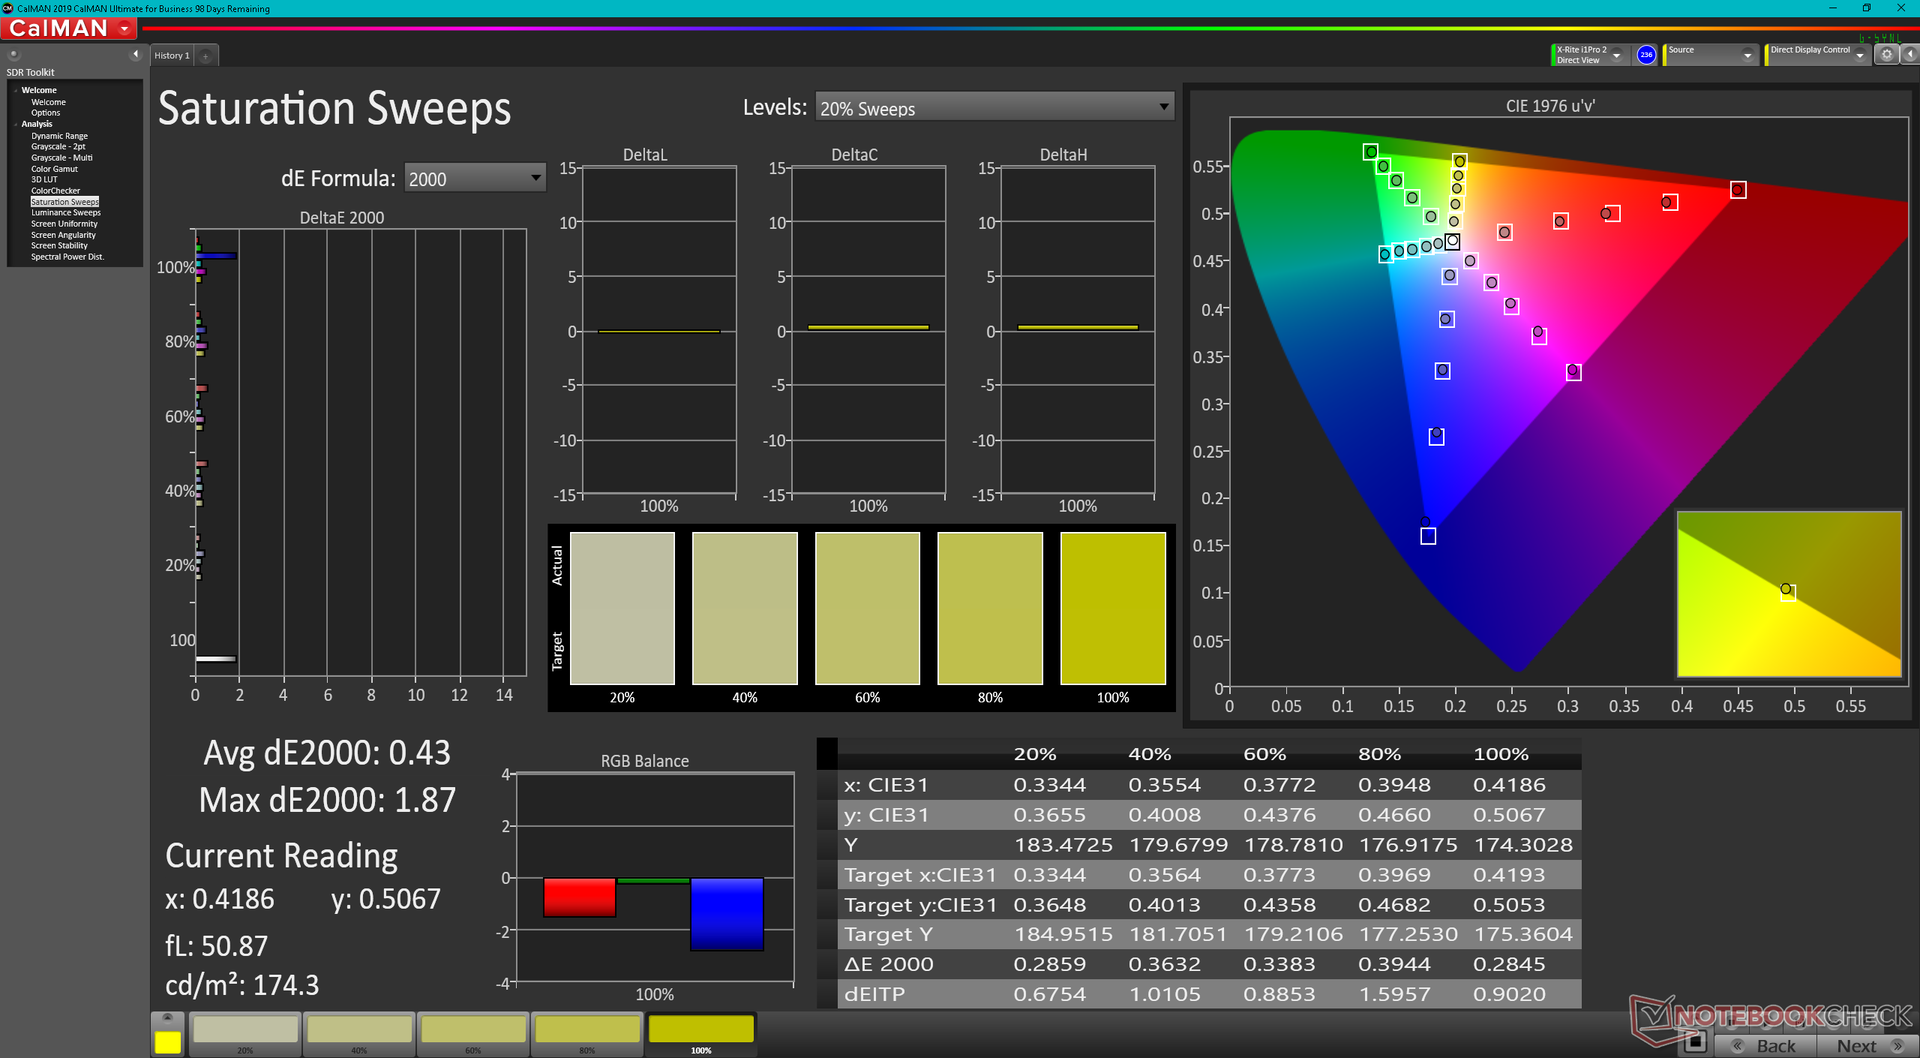
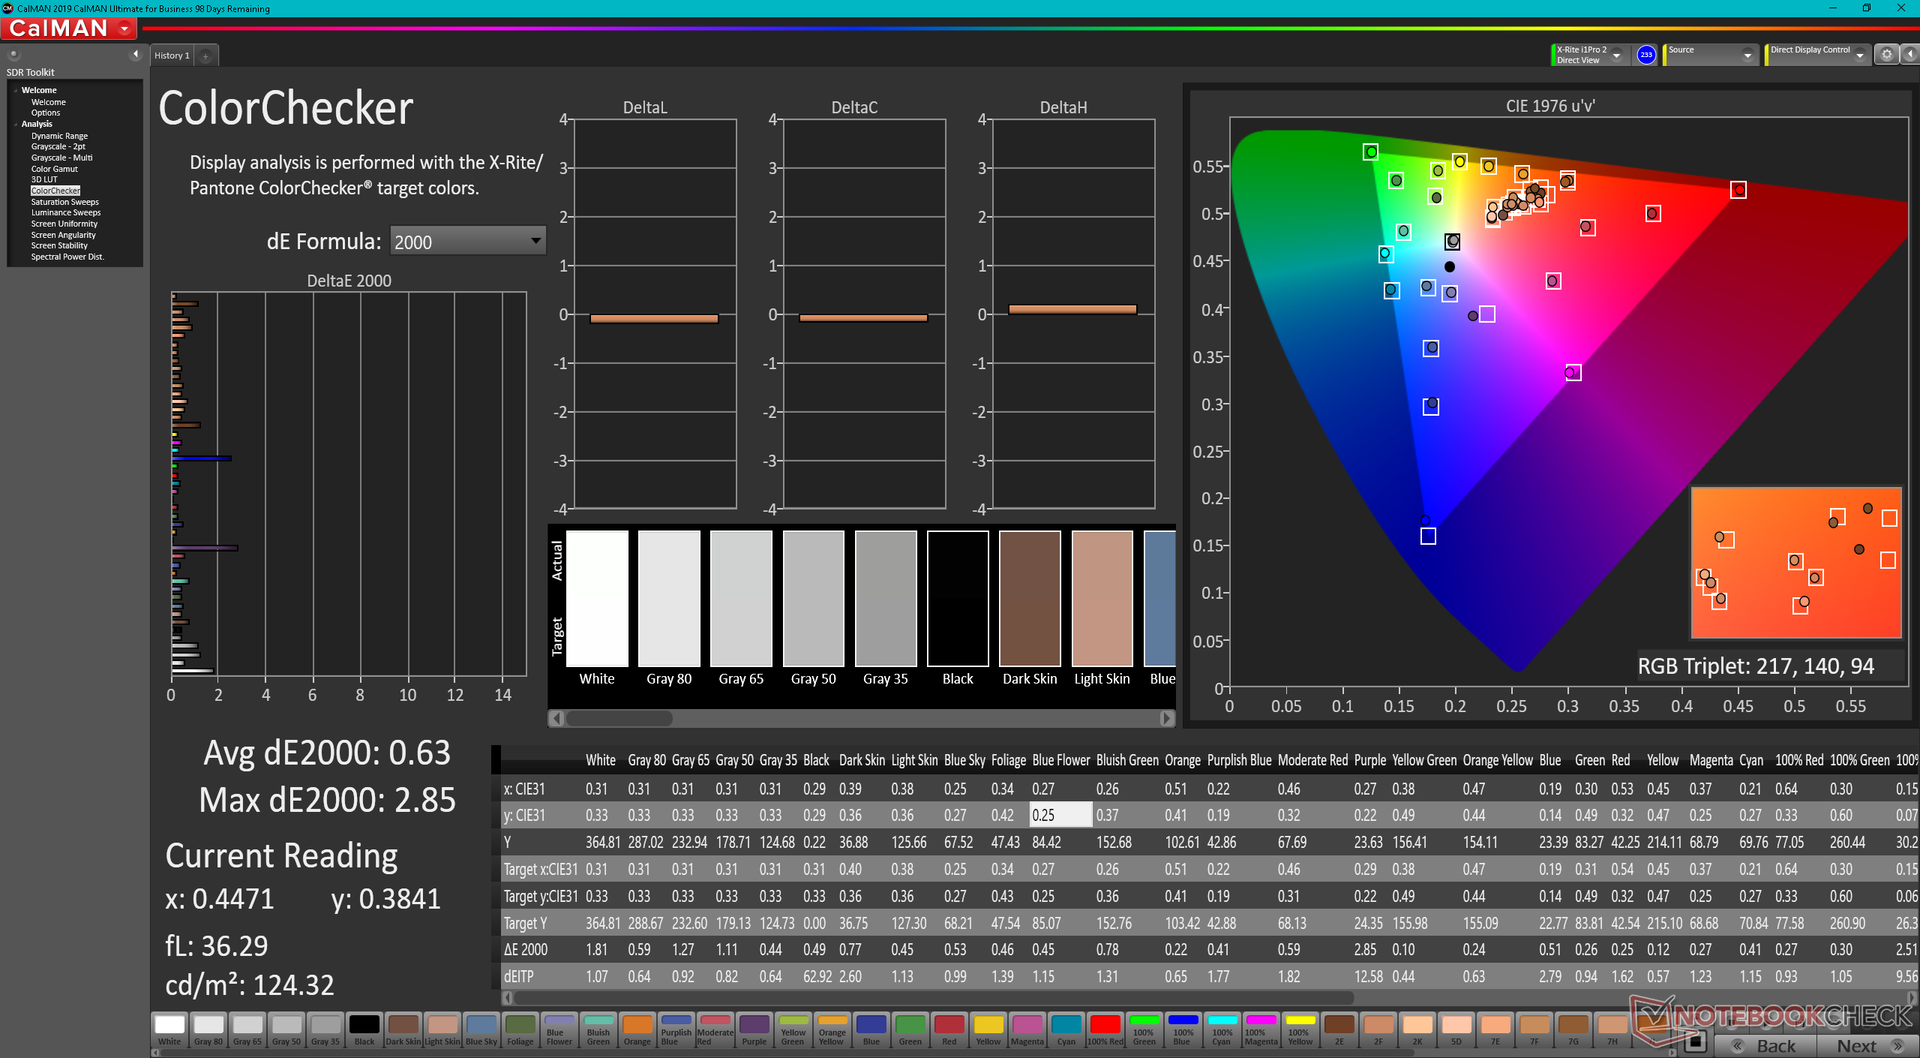
Our measurements below reflect only the configuration above in bold. Interestingly, our unit utilizes a Chi Mei panel instead of the LG Philips panel as found on the 13.5-inch Spectre x360, but core attributes are otherwise nearly the same between them including the full sRGB coverage, high contrast ratio of ~1500:1, and very slow black-white and gray-gray response times. Expect some noticeable ghosting if running any fast-paced games on the Dragonfly G3. Image quality is sharp and vibrant even with the base display option on our review unit. For deeper colors, we suspect that the OLED option can offer full P3 coverage much like on the 2022 Spectre x360 13.5.
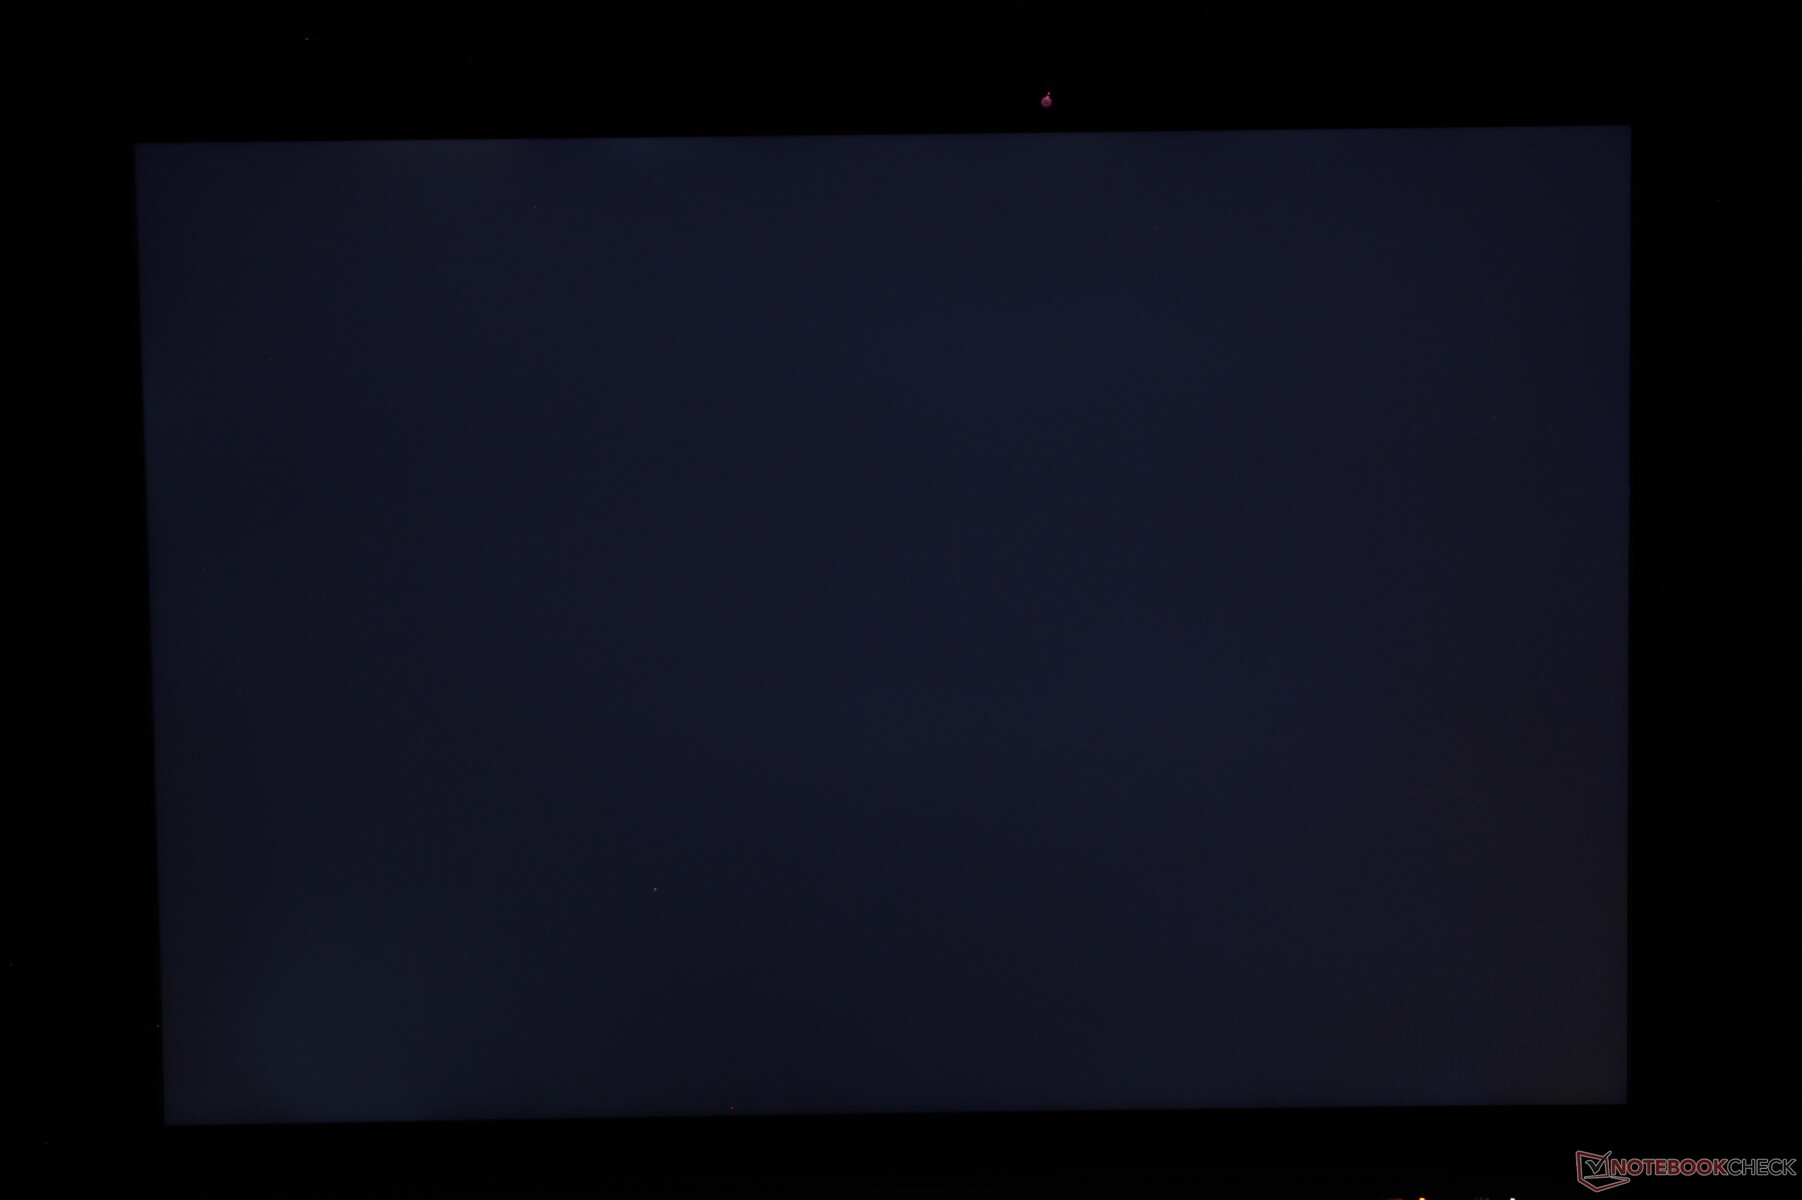
Brightness distribution could be better. The bottom left corner of our screen is only 314 nits whereas the top right is 389 nits for a corner-to-corner brightness decrease of 20 percent. Though the difference is not distracting during regular use, we expected better from a high-end laptop such as this.
| |||||||||||||||||||||||||
Brightness Distribution: 80 %
Center on Battery: 387.2 cd/m²
Contrast: 1489:1 (Black: 0.26 cd/m²)
ΔE ColorChecker Calman: 2.36 | ∀{0.5-29.43 Ø4.82}
calibrated: 0.63
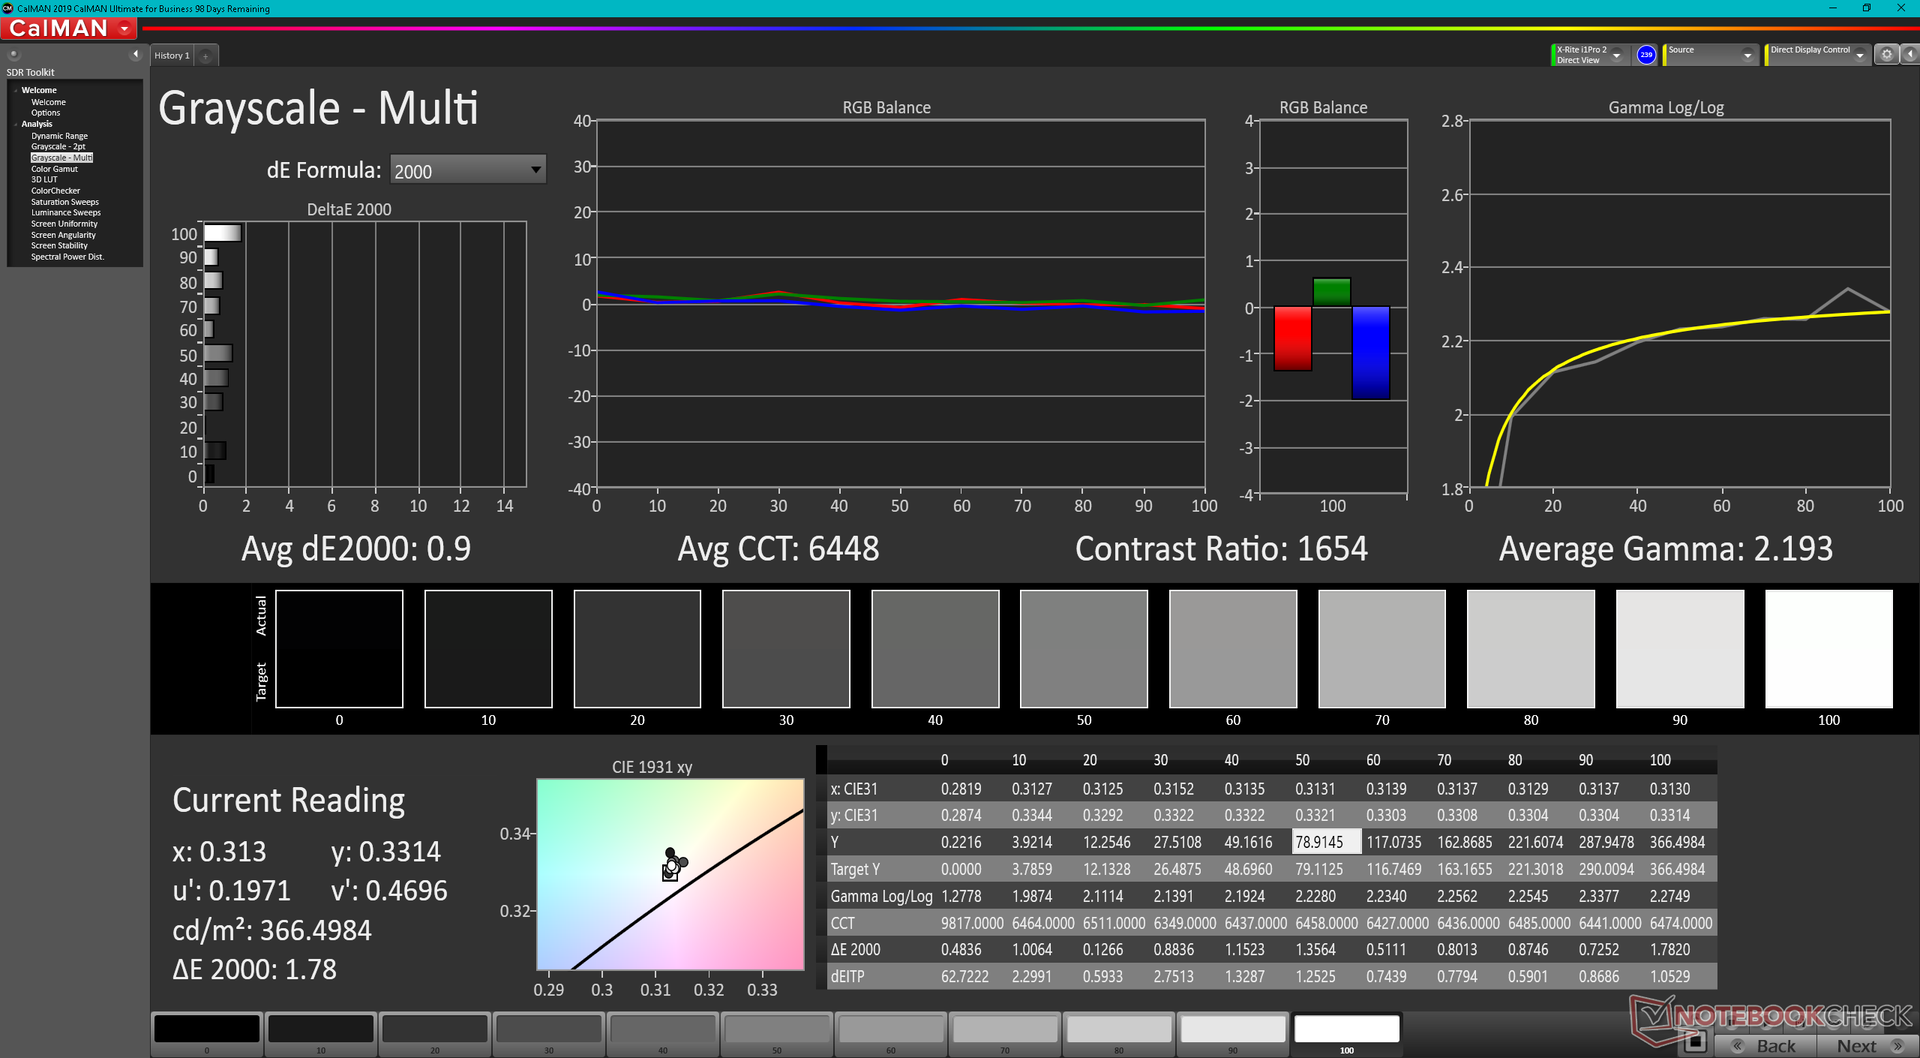
ΔE Greyscale Calman: 3 | ∀{0.09-98 Ø5.1}
69.9% AdobeRGB 1998 (Argyll 3D)
98.3% sRGB (Argyll 3D)
68% Display P3 (Argyll 3D)
Gamma: 2.17
CCT: 6137 K
| HP Elite Dragonfly G3 Chi Mei CMN13C0, IPS, 1920x1280, 13.5" | HP Spectre x360 14t-ea000 LG Philips LGD0663, IPS, 1920x1280, 13.5" | Dell XPS 13 Plus 9320 i5-1240p Sharp SHP1548 LQ134N1, IPS, 1920x1200, 13.4" | Framework Laptop 13.5 12th Gen Intel BOE CQ NE135FBM-N41, IPS, 2256x1504, 13.5" | HP EliteBook Folio 13.5-3G2L2EA LGD0663, IPS, 1920x1280, 13.5" | Lenovo ThinkPad X1 Titanium Yoga G1 20QA001RGE LPM135M467, IPS, 2256x1504, 13.5" | |
|---|---|---|---|---|---|---|
| Display | -2% | 1% | 2% | |||
| Display P3 Coverage | 68 | 65.8 -3% | 69 1% | 69.9 3% | ||
| sRGB Coverage | 98.3 | 98.2 0% | 99 1% | 99.4 1% | ||
| AdobeRGB 1998 Coverage | 69.9 | 67.9 -3% | 71 2% | 71.1 2% | ||
| Response Times | -18% | 26% | 27% | 18% | 13% | |
| Response Time Grey 50% / Grey 80% * | 50.8 ? | 62 ? -22% | 45 ? 11% | 34.7 ? 32% | 44 ? 13% | 53.6 ? -6% |
| Response Time Black / White * | 35.2 ? | 39.6 ? -13% | 21 ? 40% | 27.5 ? 22% | 27 ? 23% | 24 ? 32% |
| PWM Frequency | ||||||
| Screen | -22% | -52% | -13% | -23% | 17% | |
| Brightness middle | 387.2 | 443.5 15% | 498 29% | 449.6 16% | 250 -35% | 466 20% |
| Brightness | 360 | 394 9% | 460 28% | 431 20% | 226 -37% | 454 26% |
| Brightness Distribution | 80 | 78 -2% | 85 6% | 90 13% | 82 3% | 94 18% |
| Black Level * | 0.26 | 0.17 35% | 0.53 -104% | 0.31 -19% | 0.215 17% | 0.23 12% |
| Contrast | 1489 | 2609 75% | 940 -37% | 1450 -3% | 1163 -22% | 2026 36% |
| Colorchecker dE 2000 * | 2.36 | 2.7 -14% | 3.65 -55% | 2.76 -17% | 3.59 -52% | 2.1 11% |
| Colorchecker dE 2000 max. * | 4.79 | 4.36 9% | 7.11 -48% | 7.96 -66% | 5.9 -23% | 4.5 6% |
| Colorchecker dE 2000 calibrated * | 0.63 | 2.61 -314% | 2.16 -243% | 0.58 8% | ||
| Greyscale dE 2000 * | 3 | 3.4 -13% | 4.25 -42% | 5.2 -73% | 3.99 -33% | 2.7 10% |
| Gamma | 2.17 101% | 2.09 105% | 2.45 90% | 2.23 99% | 2.98 74% | 2.08 106% |
| CCT | 6137 106% | 6144 106% | 6690 97% | 6475 100% | 6765 96% | 6210 105% |
| Color Space (Percent of AdobeRGB 1998) | 62.1 | 61.1 | ||||
| Color Space (Percent of sRGB) | 98.5 | 94.9 | ||||
| Total Average (Program / Settings) | -14% /
-17% | -8% /
-29% | 5% /
-4% | -3% /
-15% | 15% /
17% |
* ... smaller is better
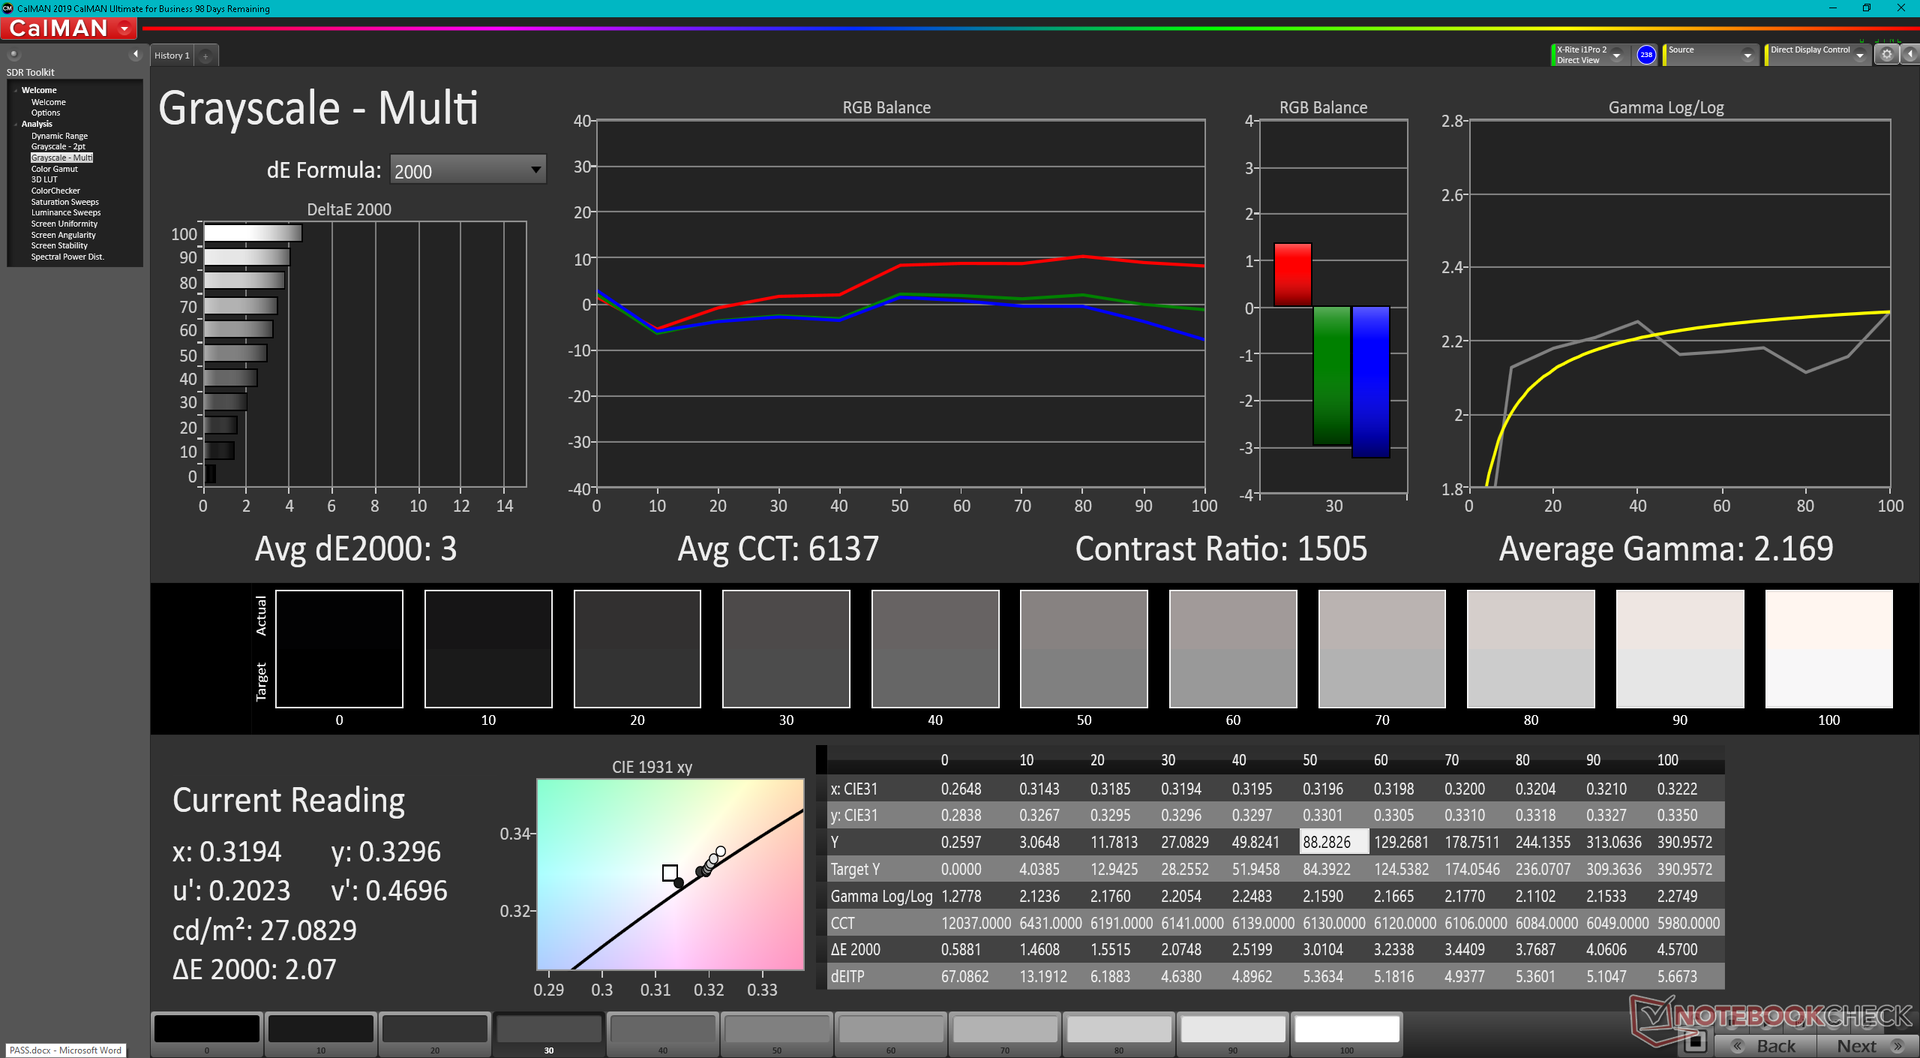
The display is decently calibrated out of the box with average grayscale and color deltaE values of 3 and 2.36, respectively. Calibrating the display ourselves would improve average DeltaE values even further to less than one each.
Display Response Times
| ↔ Response Time Black to White | ||
|---|---|---|
| 35.2 ms ... rise ↗ and fall ↘ combined | ↗ 18.8 ms rise | 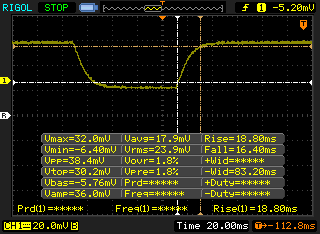 |
| ↘ 16.4 ms fall | ||
| The screen shows slow response rates in our tests and will be unsatisfactory for gamers. In comparison, all tested devices range from 0.1 (minimum) to 240 (maximum) ms. » 92 % of all devices are better. This means that the measured response time is worse than the average of all tested devices (20.5 ms). | ||
| ↔ Response Time 50% Grey to 80% Grey | ||
| 50.8 ms ... rise ↗ and fall ↘ combined | ↗ 27.2 ms rise | 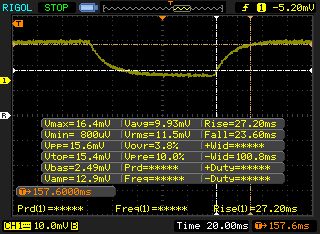 |
| ↘ 23.6 ms fall | ||
| The screen shows slow response rates in our tests and will be unsatisfactory for gamers. In comparison, all tested devices range from 0.165 (minimum) to 636 (maximum) ms. » 86 % of all devices are better. This means that the measured response time is worse than the average of all tested devices (32 ms). | ||
Screen Flickering / PWM (Pulse-Width Modulation)
| Screen flickering / PWM not detected | 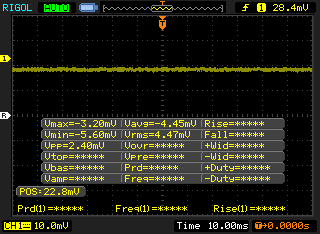 | ||
In comparison: 53 % of all tested devices do not use PWM to dim the display. If PWM was detected, an average of 8320 (minimum: 5 - maximum: 343500) Hz was measured. | |||
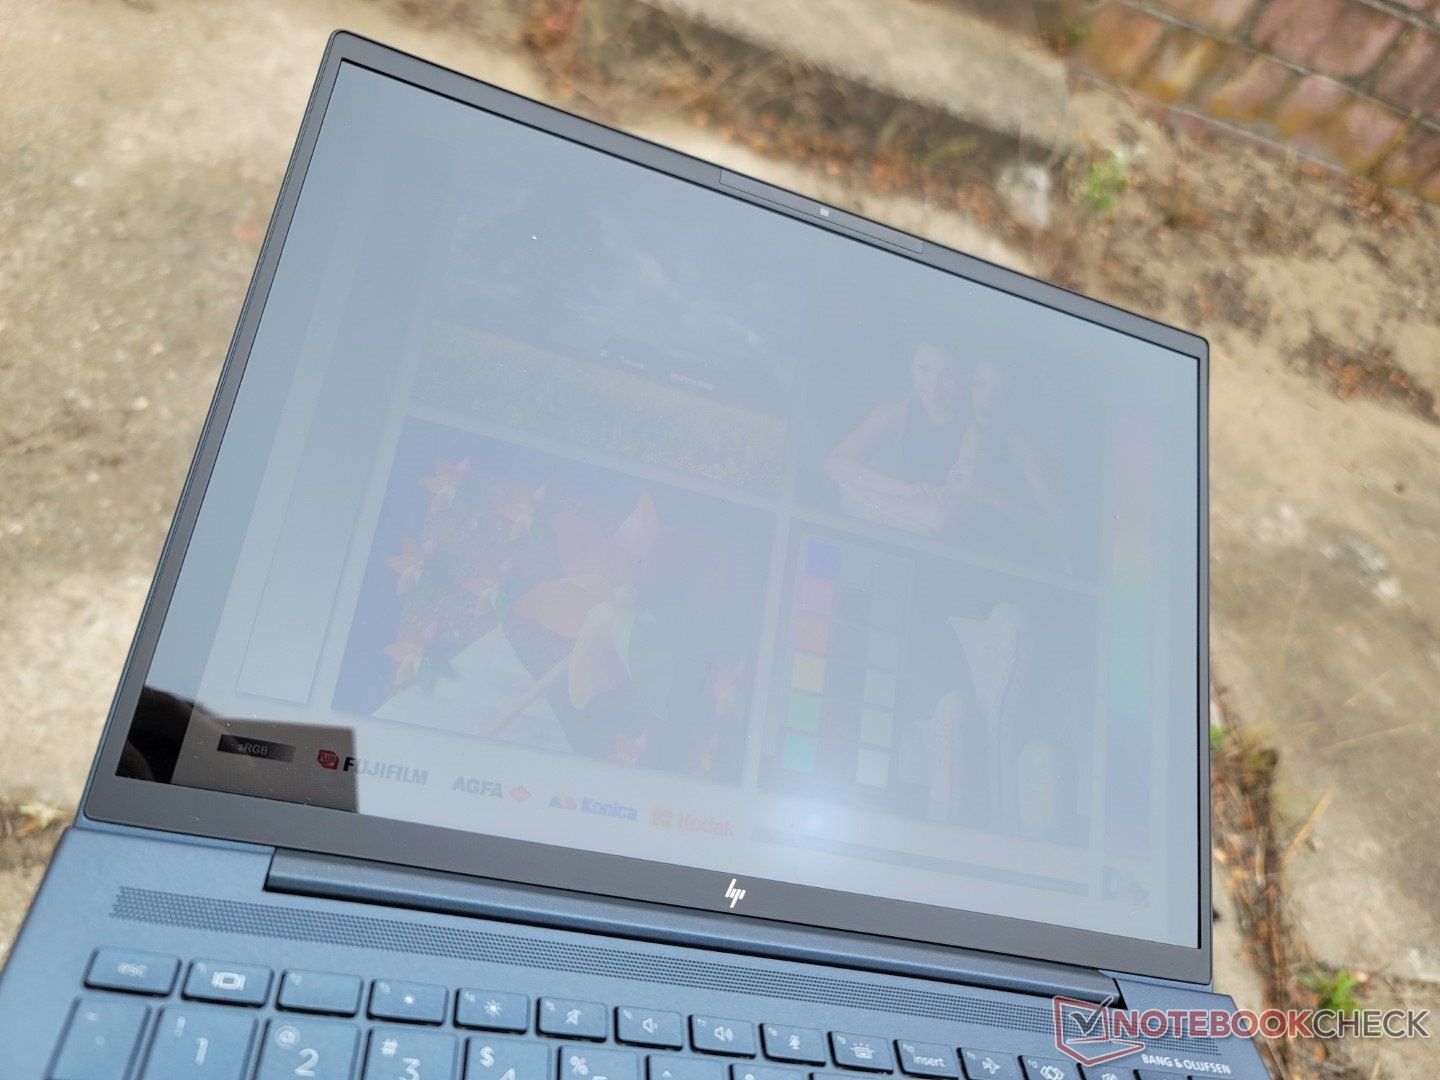
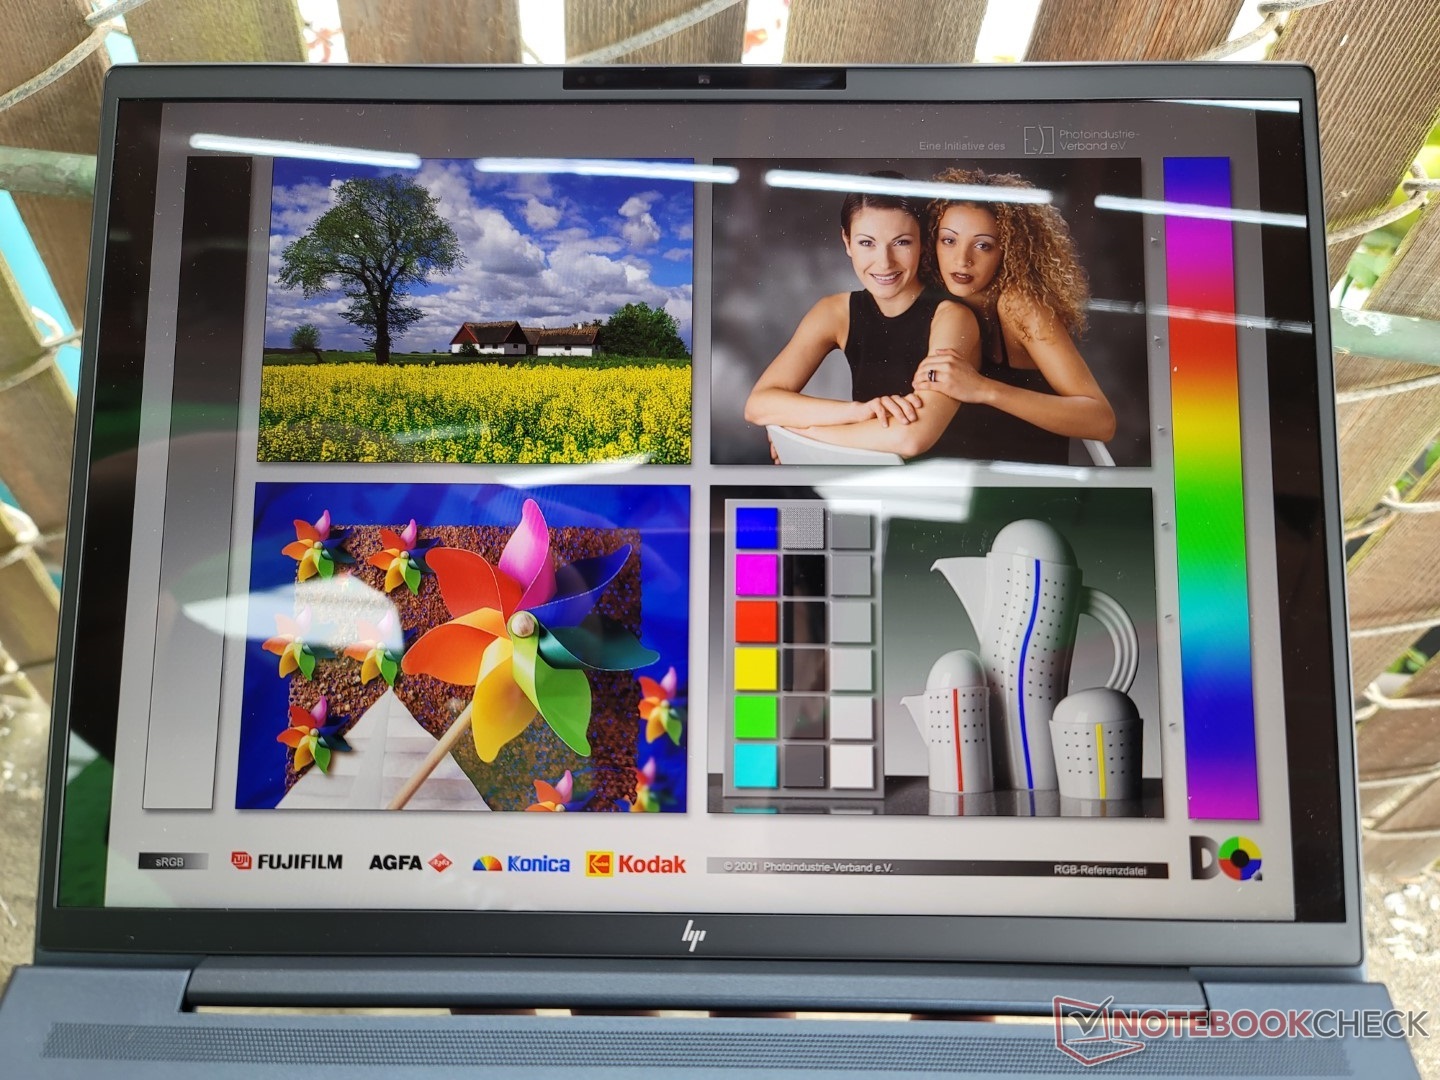
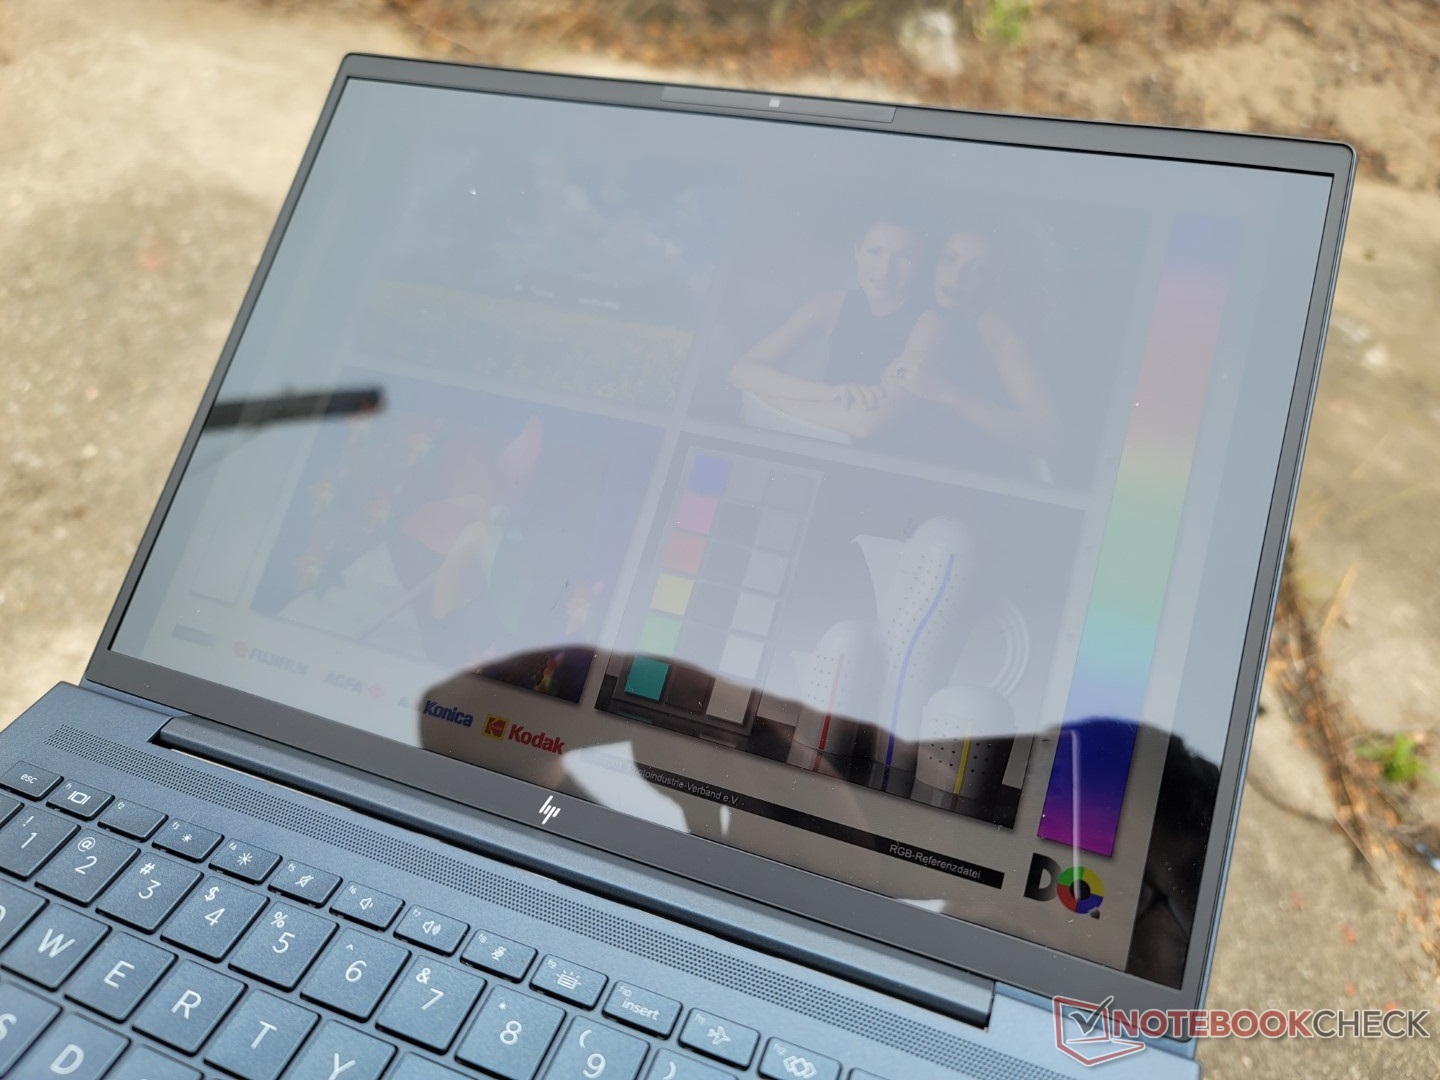
The base 400-nit screen is just barely viewable under most brightly lit outdoor conditions. HP offers its signature 1000-nit panel as an option for improved outdoor visibility, but these are unfortunately tied to Sure View which may be undesirable for some users.

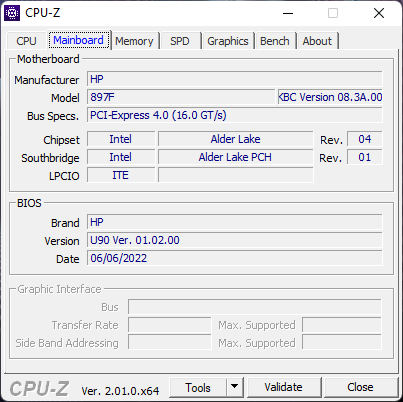
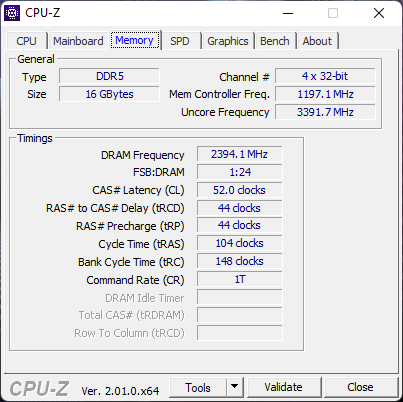
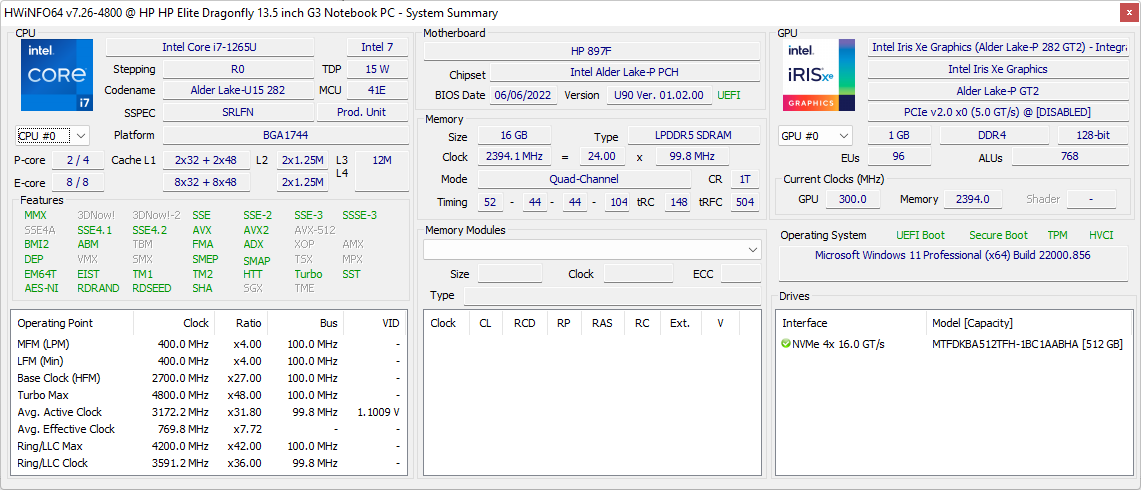
Performance — Intel 12th Gen
Testing Conditions
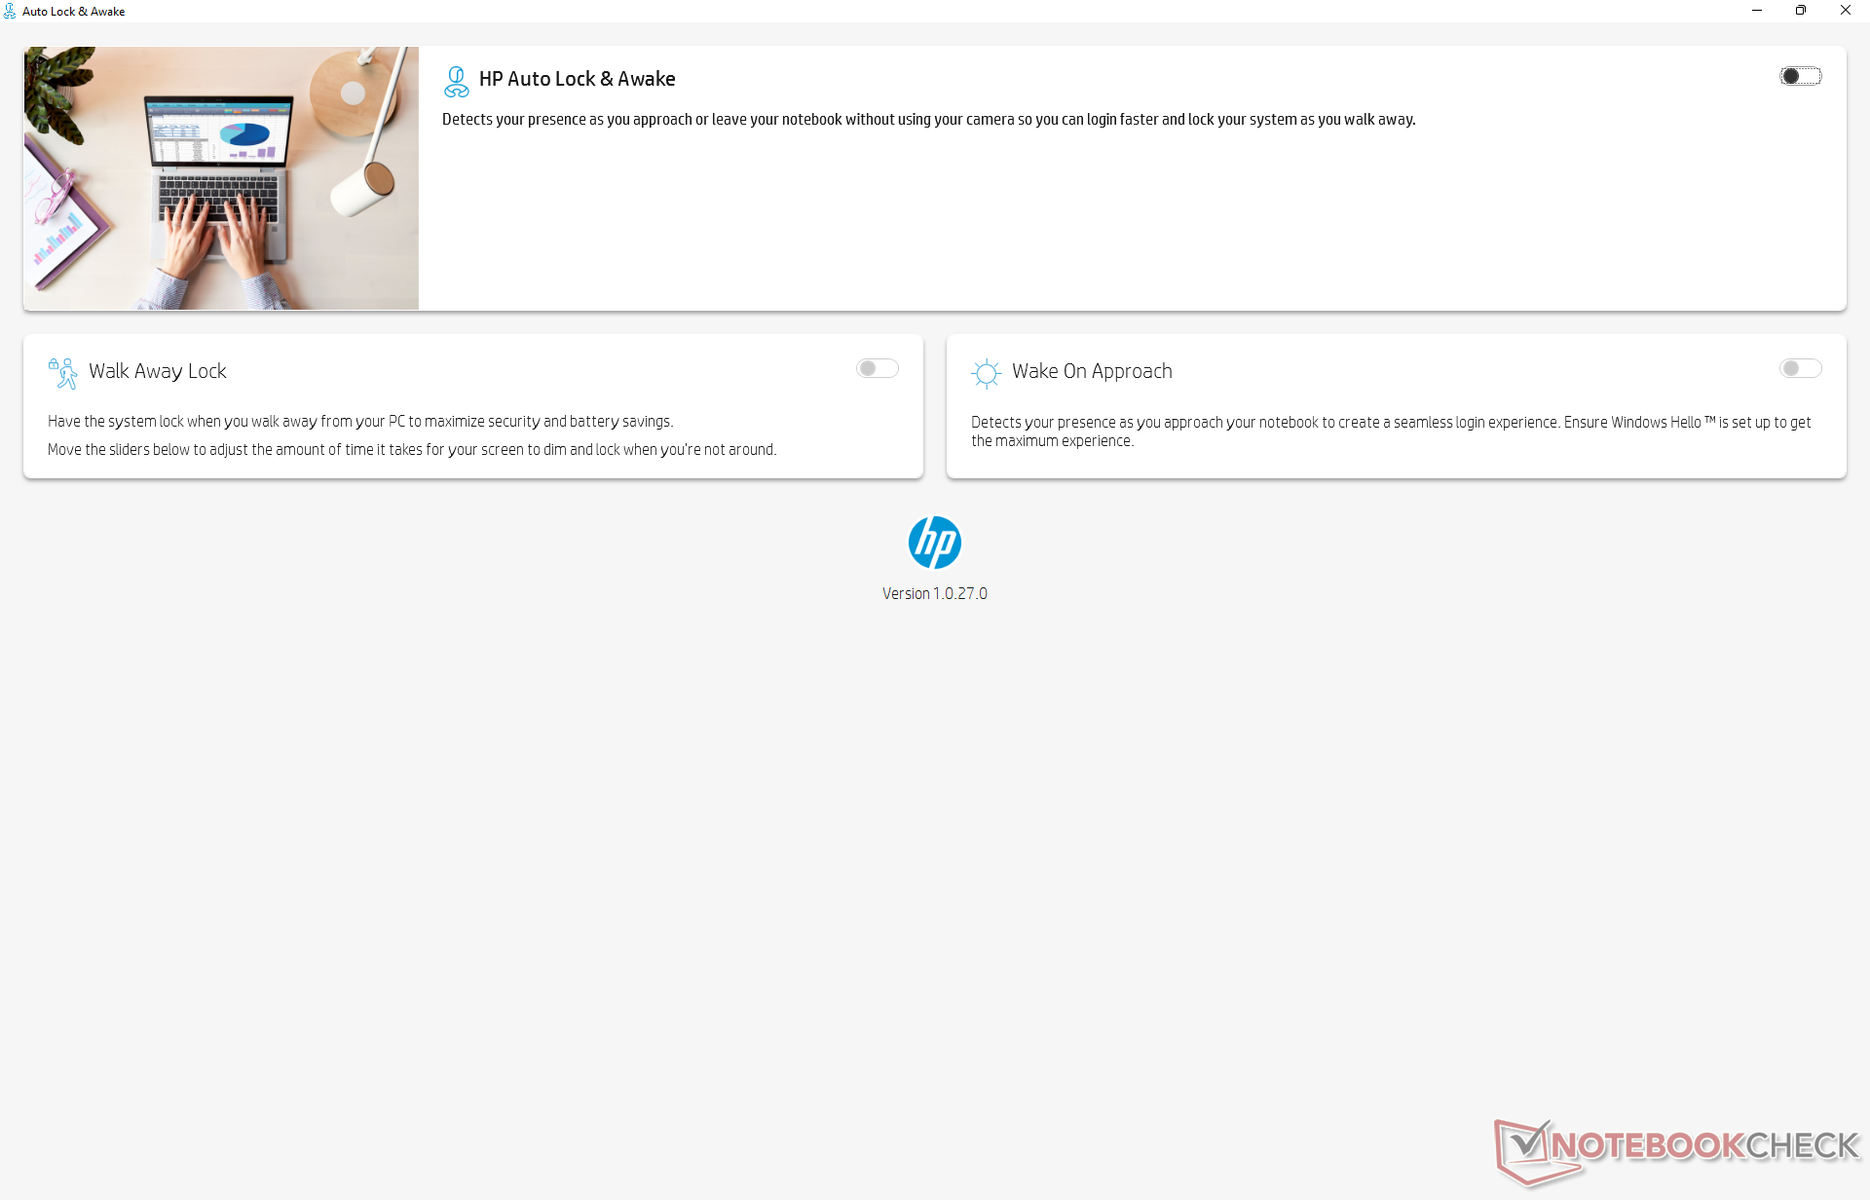
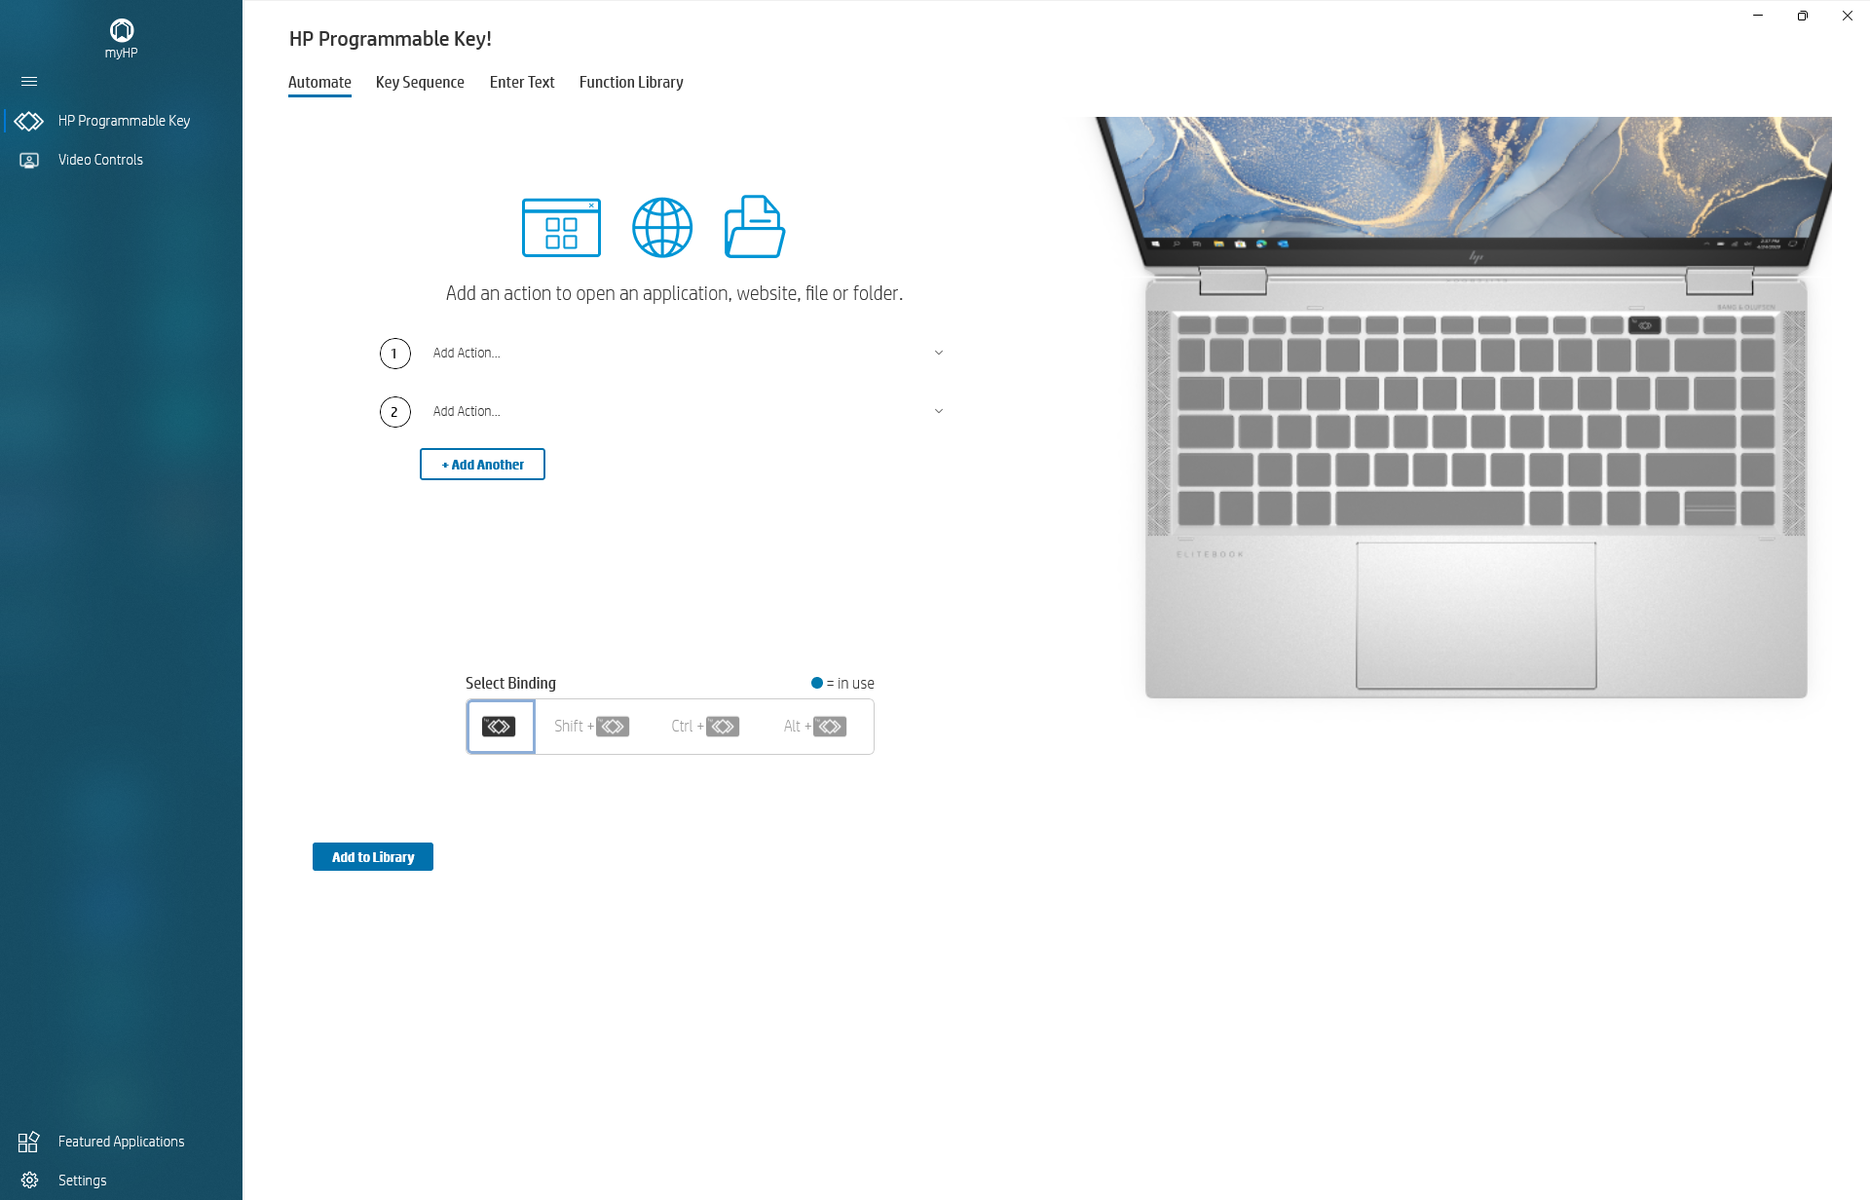
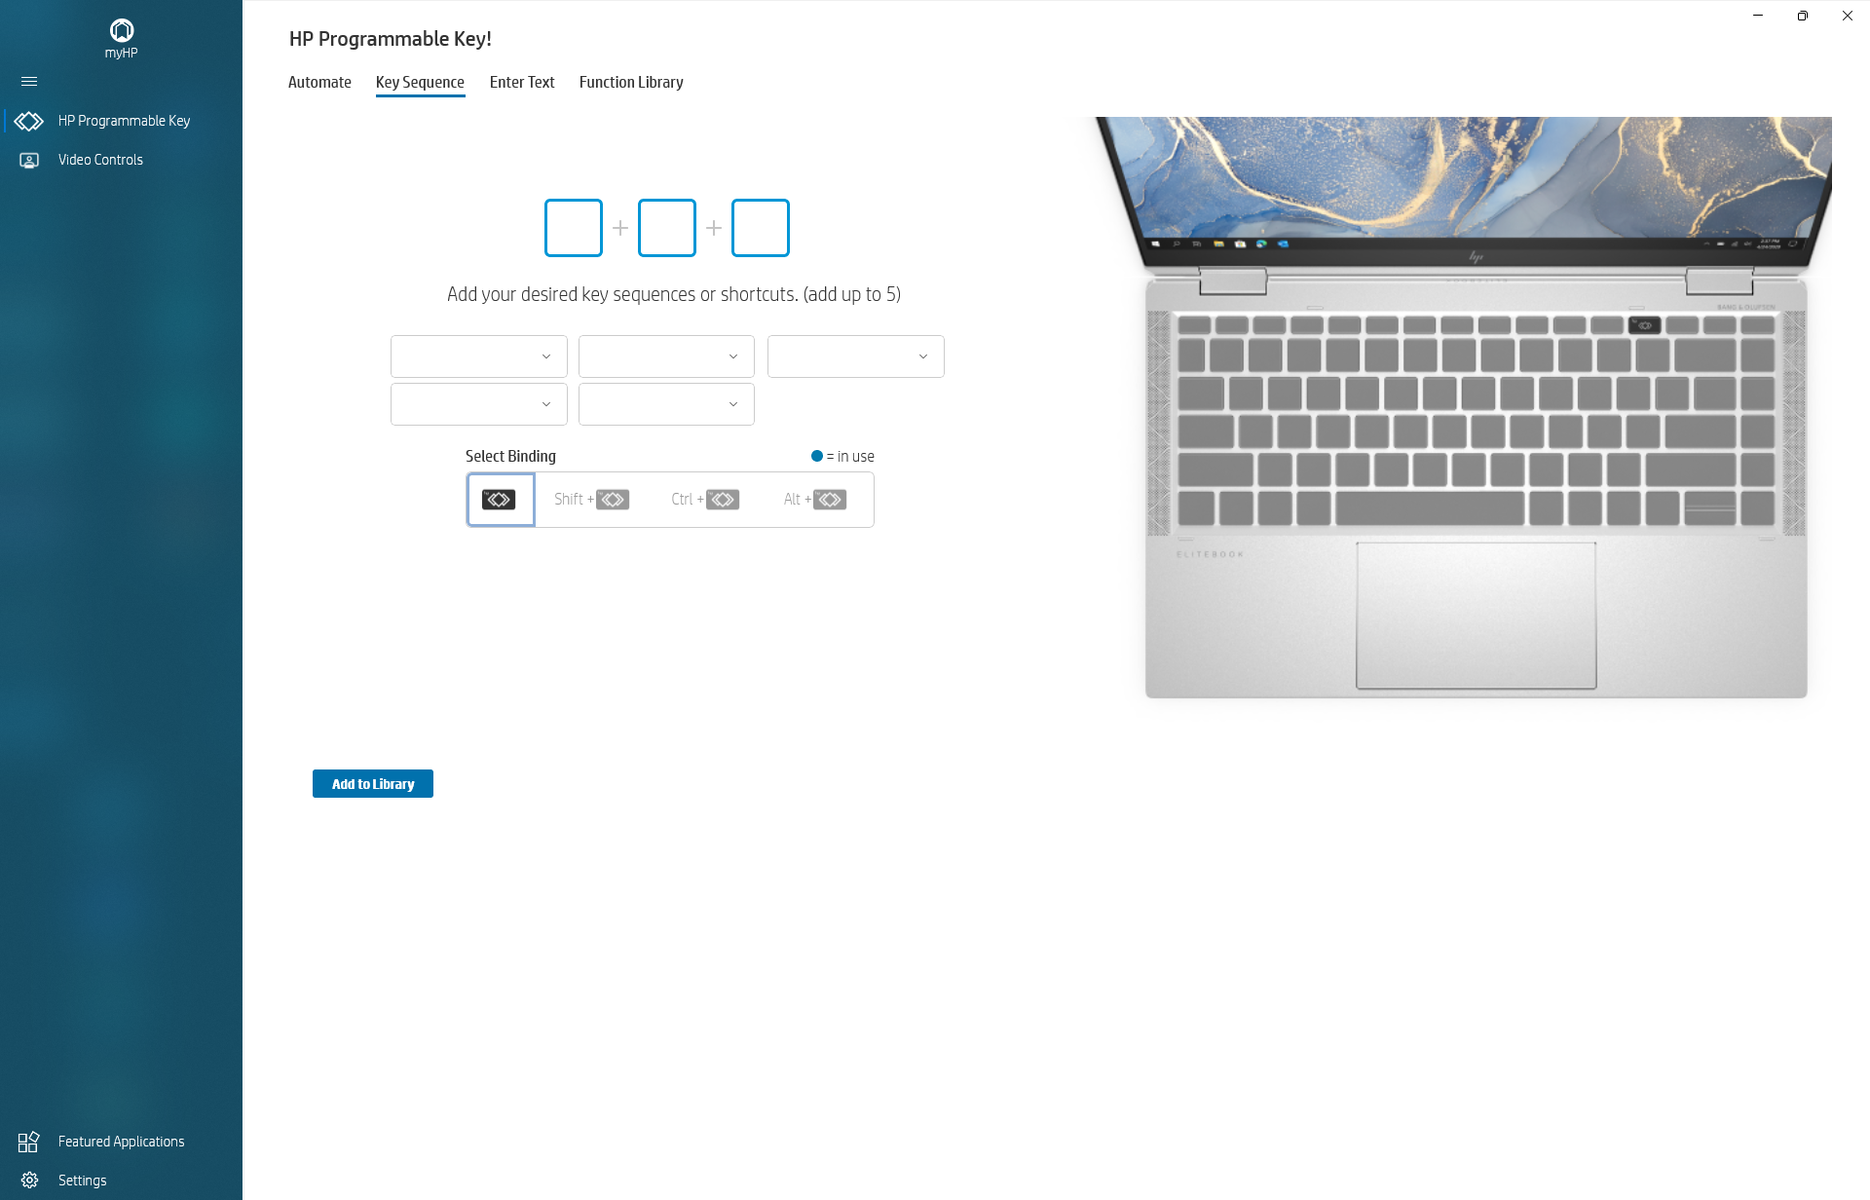
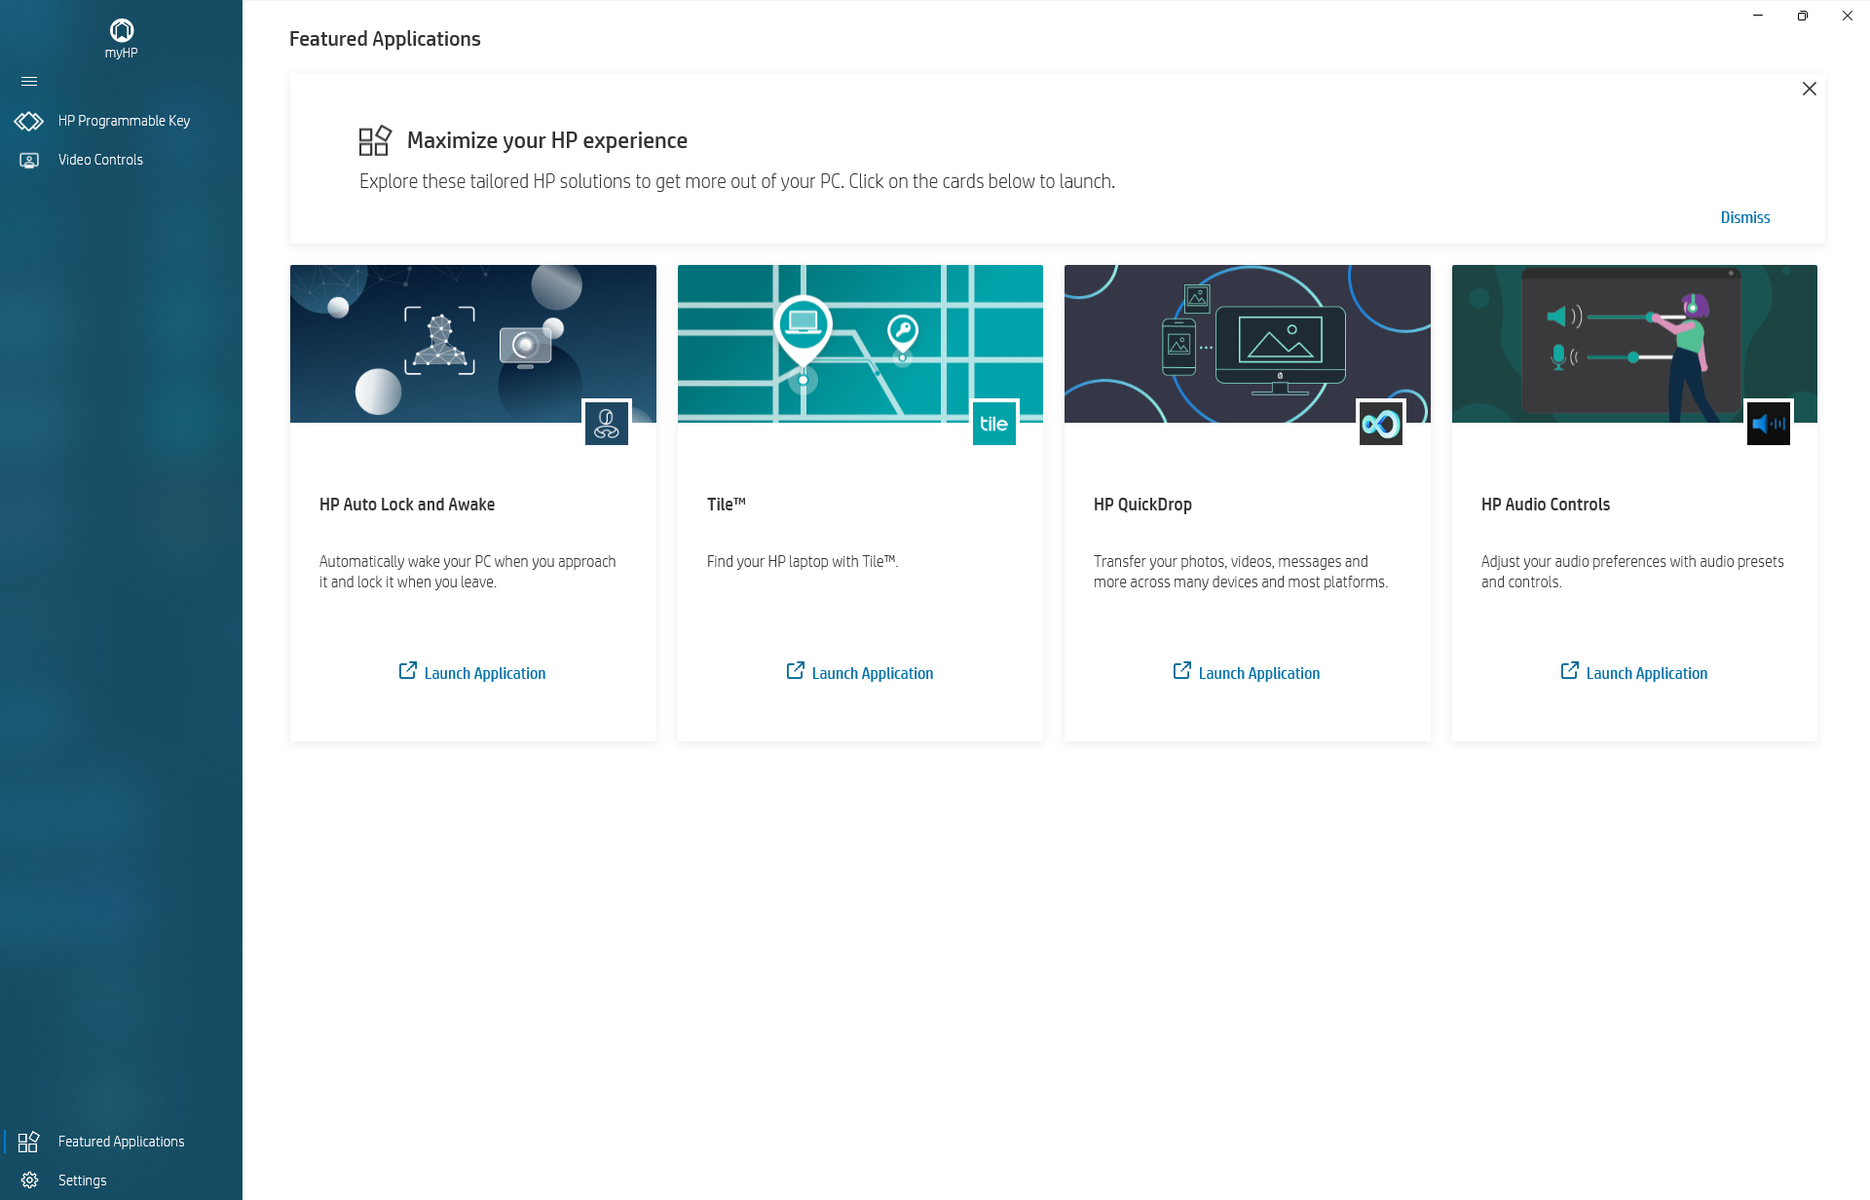
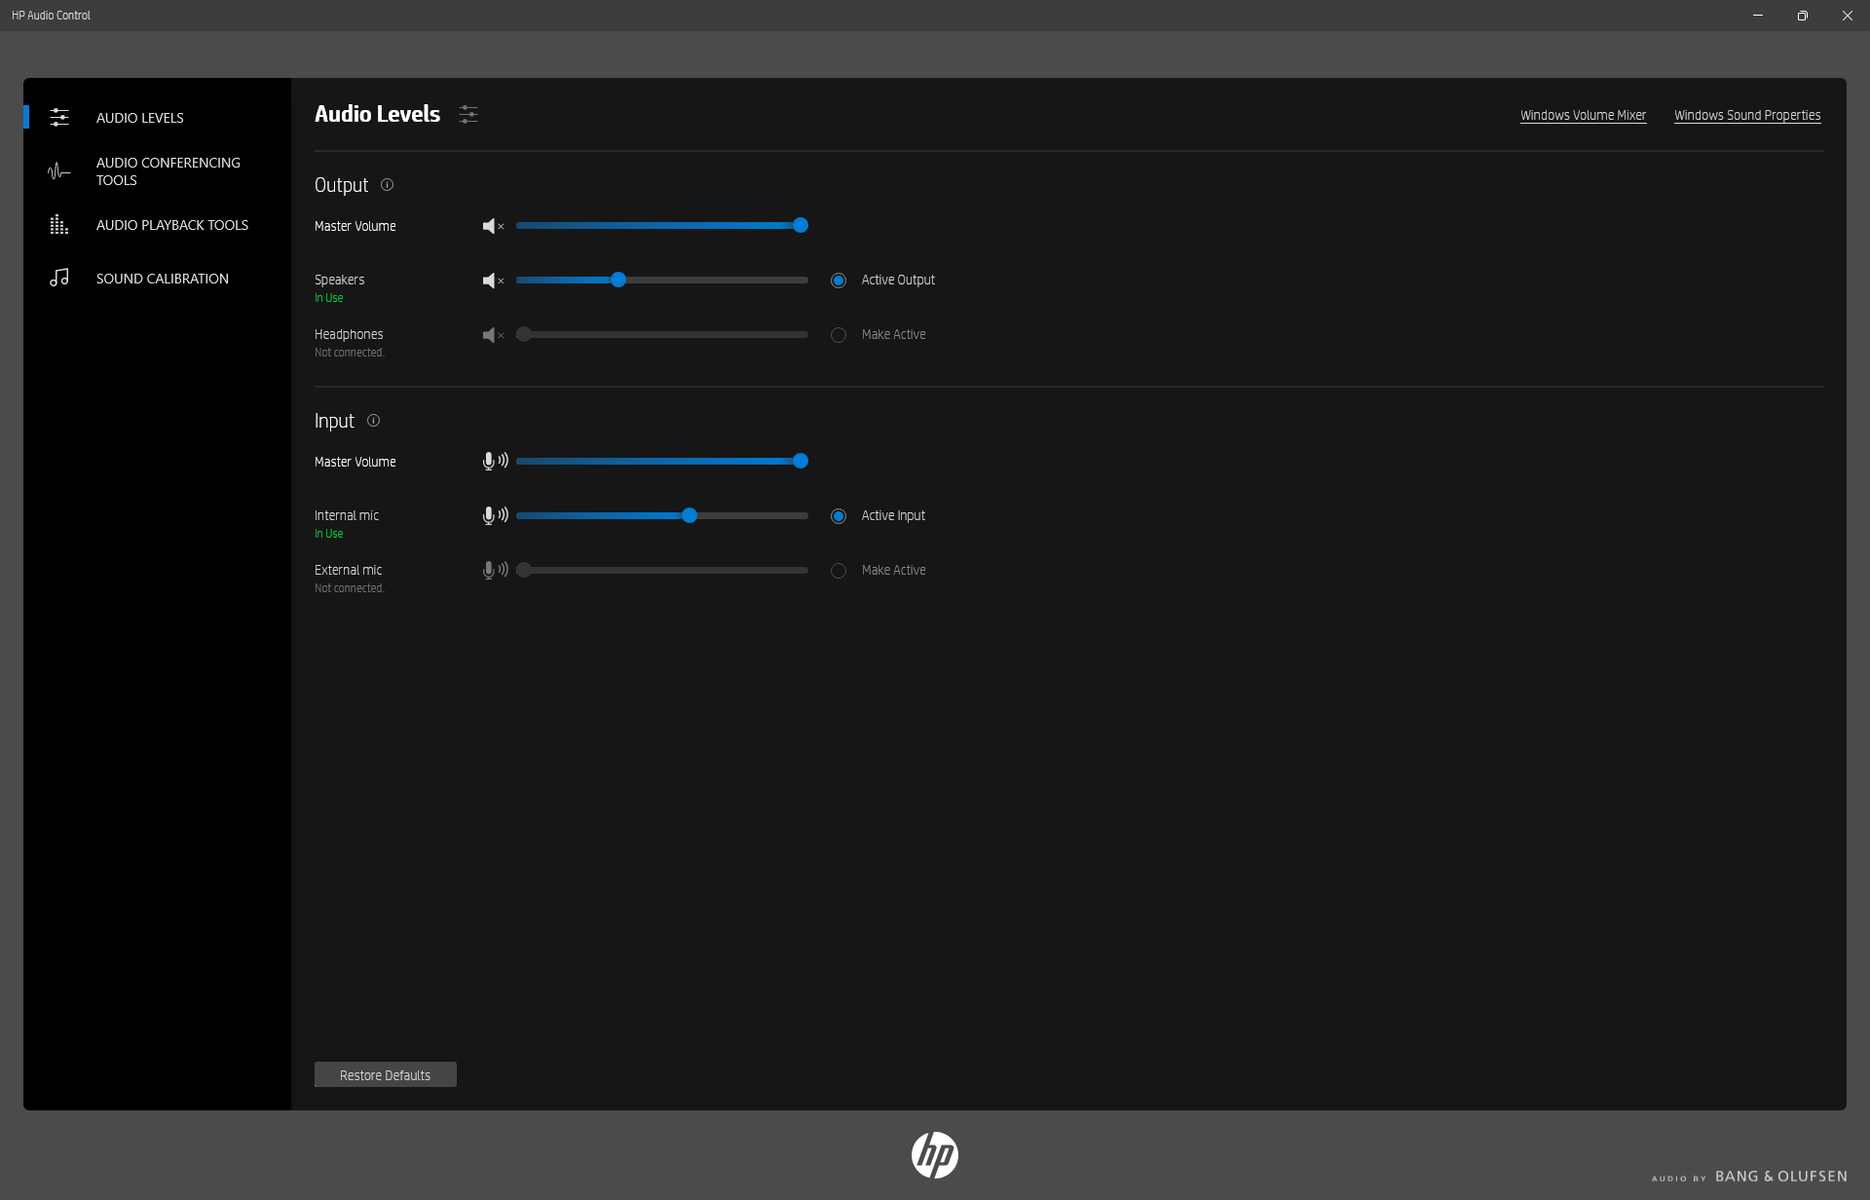
Our unit was set to Performance mode via Windows prior to running any benchmarks below. HP Command Center, which comes pre-installed on Spectre and Envy laptops, is not present on the business-centric Dragonfly. Instead, the model comes with HP Programmable Key, Auto Lock and Awake, Tile, QuickDrop, and Audio Controls. We recommend becoming familiar with Programmable Key and Auto Lock and Awake as they have the most useful features for day-to-day work. The latter utilizes IR to automatically sign in or out if it detects a user in front of the camera similar to higher-end Dell Latitude models. A few screenshots of some of the programs are below.

Processor
Of the three laptops we've tested thus far with the Core i7-1265U, our Dragonfly G3 is the slowest by quite the margin. The Core i7-1265U in the Dell Latitude 9430 2-in-1 outperforms our HP by 20 percent and 50 percent in single-threaded and multi-threaded benchmarks, respectively. In fact, the Core i7-1255U in our Spectre x360 13.5 is 40 percent faster than our Core i7-1265U-powered Dragonfly G3 even after accounting for any performance throttling.
Running CineBench R15 xT in a loop reveals limited Turbo Boost potential as CPU performance would drop by about 19 percent after the first loop. The same CPU in the Latitude 7330 is able to maintain higher scores and thus faster performance for longer when subjected to the same loop test as shown by our comparison graph below.
Downgrading to the Core i5-1235U SKU from our Core i7-1265U is expected to impact performance by about 25 percent.
Cinebench R15 Multi Loop
Cinebench R23: Multi Core | Single Core
Cinebench R15: CPU Multi 64Bit | CPU Single 64Bit
Blender: v2.79 BMW27 CPU
7-Zip 18.03: 7z b 4 | 7z b 4 -mmt1
Geekbench 5.5: Multi-Core | Single-Core
HWBOT x265 Benchmark v2.2: 4k Preset
LibreOffice : 20 Documents To PDF
R Benchmark 2.5: Overall mean
Cinebench R23: Multi Core | Single Core
Cinebench R15: CPU Multi 64Bit | CPU Single 64Bit
Blender: v2.79 BMW27 CPU
7-Zip 18.03: 7z b 4 | 7z b 4 -mmt1
Geekbench 5.5: Multi-Core | Single-Core
HWBOT x265 Benchmark v2.2: 4k Preset
LibreOffice : 20 Documents To PDF
R Benchmark 2.5: Overall mean
* ... smaller is better
AIDA64: FP32 Ray-Trace | FPU Julia | CPU SHA3 | CPU Queen | FPU SinJulia | FPU Mandel | CPU AES | CPU ZLib | FP64 Ray-Trace | CPU PhotoWorxx
| Performance Rating | |
| Framework Laptop 13.5 12th Gen Intel | |
| Dell XPS 13 Plus 9320 i5-1240p | |
| Average Intel Core i7-1265U | |
| HP Elite Dragonfly G3 | |
| Lenovo ThinkPad X1 Titanium Yoga G1 20QA001RGE | |
| AIDA64 / FP32 Ray-Trace | |
| Average Intel Core i7-1265U (2619 - 8178, n=10) | |
| HP Elite Dragonfly G3 | |
| Framework Laptop 13.5 12th Gen Intel | |
| Dell XPS 13 Plus 9320 i5-1240p | |
| Lenovo ThinkPad X1 Titanium Yoga G1 20QA001RGE | |
| AIDA64 / FPU Julia | |
| Average Intel Core i7-1265U (12909 - 41649, n=10) | |
| HP Elite Dragonfly G3 | |
| Framework Laptop 13.5 12th Gen Intel | |
| Dell XPS 13 Plus 9320 i5-1240p | |
| Lenovo ThinkPad X1 Titanium Yoga G1 20QA001RGE | |
| AIDA64 / CPU SHA3 | |
| Framework Laptop 13.5 12th Gen Intel | |
| Dell XPS 13 Plus 9320 i5-1240p | |
| Average Intel Core i7-1265U (824 - 2183, n=10) | |
| HP Elite Dragonfly G3 | |
| Lenovo ThinkPad X1 Titanium Yoga G1 20QA001RGE | |
| AIDA64 / CPU Queen | |
| Framework Laptop 13.5 12th Gen Intel | |
| Dell XPS 13 Plus 9320 i5-1240p | |
| Average Intel Core i7-1265U (63615 - 67065, n=10) | |
| HP Elite Dragonfly G3 | |
| Lenovo ThinkPad X1 Titanium Yoga G1 20QA001RGE | |
| AIDA64 / FPU SinJulia | |
| Framework Laptop 13.5 12th Gen Intel | |
| Dell XPS 13 Plus 9320 i5-1240p | |
| Average Intel Core i7-1265U (3105 - 5135, n=10) | |
| HP Elite Dragonfly G3 | |
| Lenovo ThinkPad X1 Titanium Yoga G1 20QA001RGE | |
| AIDA64 / FPU Mandel | |
| Average Intel Core i7-1265U (6967 - 20804, n=10) | |
| HP Elite Dragonfly G3 | |
| Framework Laptop 13.5 12th Gen Intel | |
| Dell XPS 13 Plus 9320 i5-1240p | |
| Lenovo ThinkPad X1 Titanium Yoga G1 20QA001RGE | |
| AIDA64 / CPU AES | |
| Framework Laptop 13.5 12th Gen Intel | |
| Lenovo ThinkPad X1 Titanium Yoga G1 20QA001RGE | |
| Dell XPS 13 Plus 9320 i5-1240p | |
| Average Intel Core i7-1265U (19489 - 42966, n=10) | |
| HP Elite Dragonfly G3 | |
| AIDA64 / CPU ZLib | |
| Framework Laptop 13.5 12th Gen Intel | |
| Dell XPS 13 Plus 9320 i5-1240p | |
| Average Intel Core i7-1265U (314 - 632, n=10) | |
| HP Elite Dragonfly G3 | |
| Lenovo ThinkPad X1 Titanium Yoga G1 20QA001RGE | |
| AIDA64 / FP64 Ray-Trace | |
| Average Intel Core i7-1265U (1473 - 4376, n=10) | |
| HP Elite Dragonfly G3 | |
| Framework Laptop 13.5 12th Gen Intel | |
| Dell XPS 13 Plus 9320 i5-1240p | |
| Lenovo ThinkPad X1 Titanium Yoga G1 20QA001RGE | |
| AIDA64 / CPU PhotoWorxx | |
| Lenovo ThinkPad X1 Titanium Yoga G1 20QA001RGE | |
| HP Elite Dragonfly G3 | |
| Dell XPS 13 Plus 9320 i5-1240p | |
| Average Intel Core i7-1265U (20213 - 47031, n=10) | |
| Framework Laptop 13.5 12th Gen Intel | |
System Performance
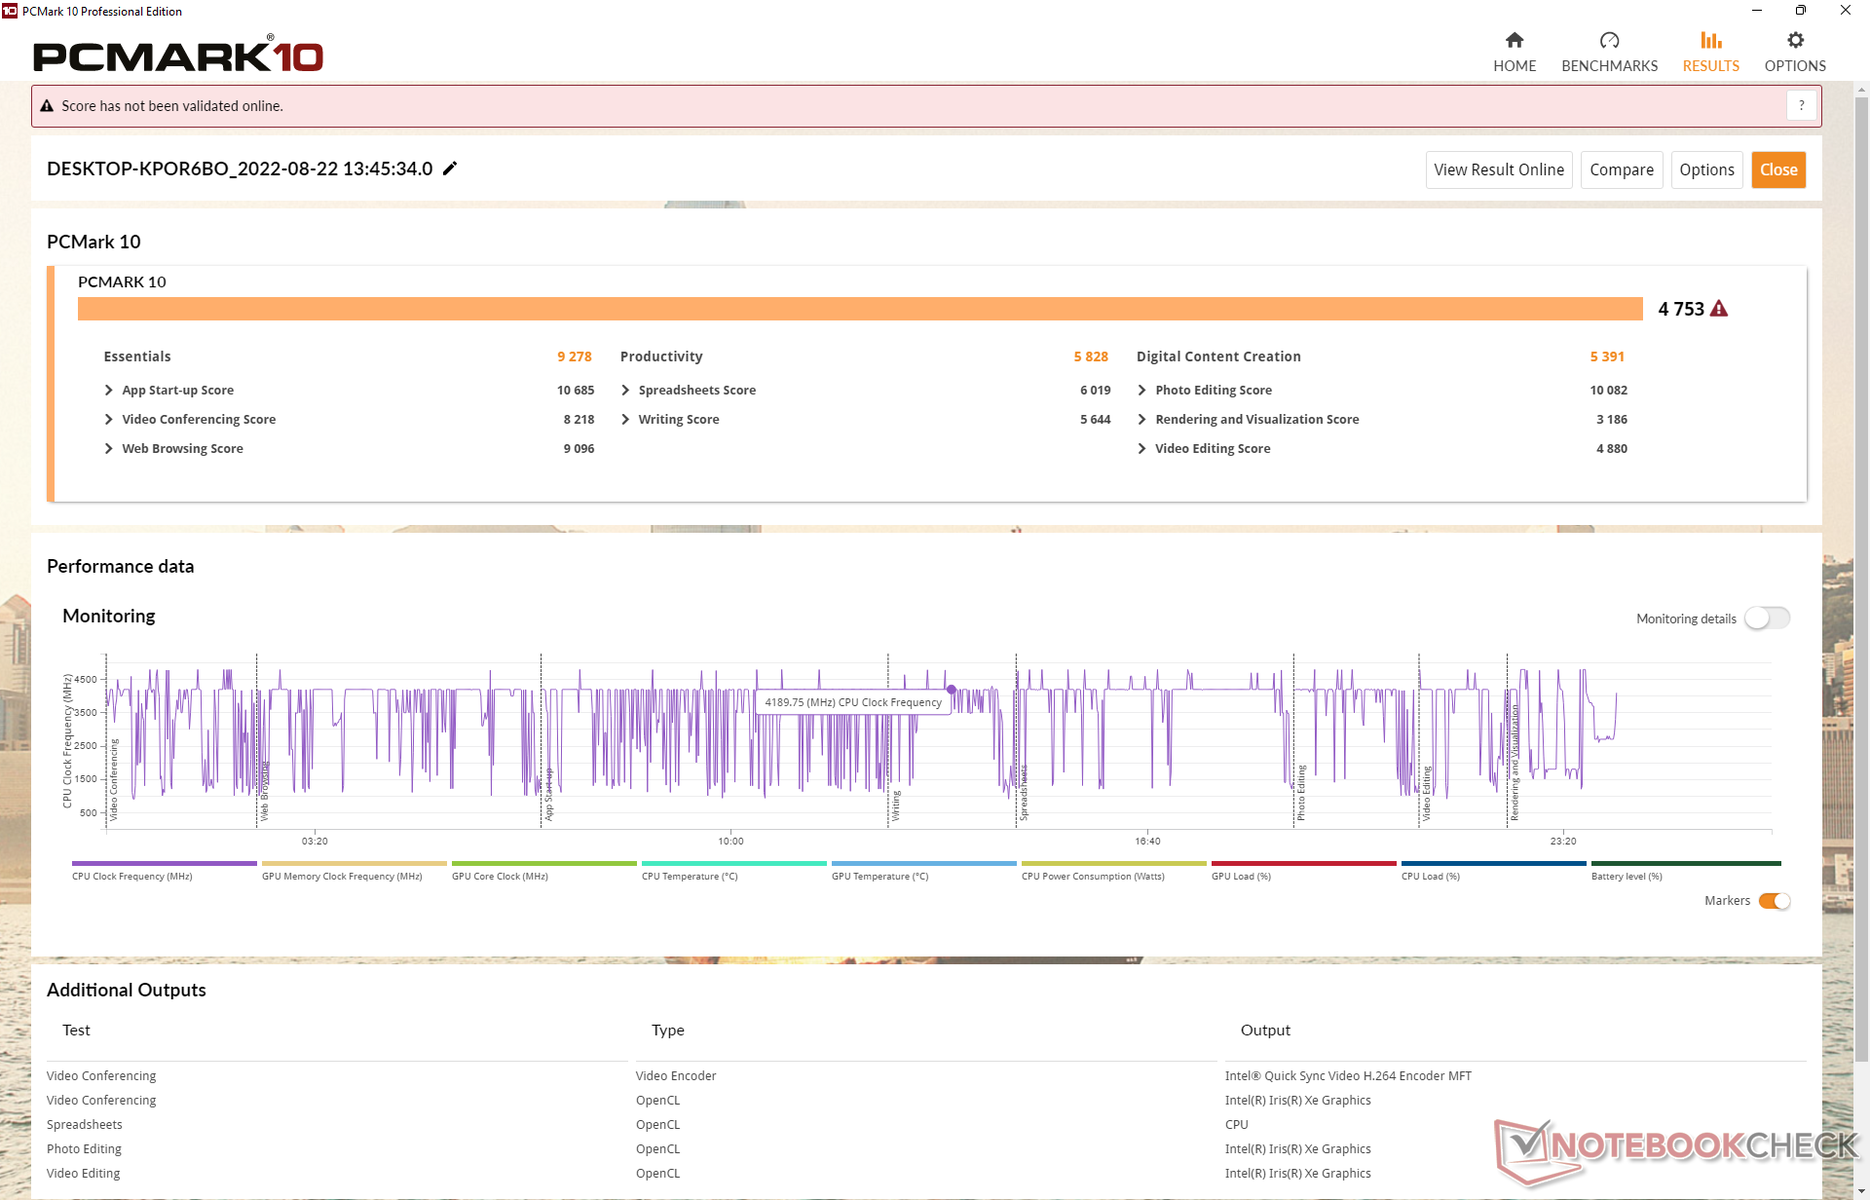
Interestingly, PCMark results are slightly lower than what we recorded on the Spectre x360 14 equipped with the last generation Core i7 CPU. Don't expect the Dragonfly G3 to be tangibly faster when browsing, video streaming, or running other undemanding workloads.
CrossMark: Overall | Productivity | Creativity | Responsiveness
| PCMark 10 / Score | |
| Framework Laptop 13.5 12th Gen Intel | |
| Average Intel Core i7-1265U, Intel Iris Xe Graphics G7 96EUs (4753 - 5766, n=7) | |
| HP Spectre x360 14t-ea000 | |
| Dell XPS 13 Plus 9320 i5-1240p | |
| HP Elite Dragonfly G3 | |
| Lenovo ThinkPad X1 Titanium Yoga G1 20QA001RGE | |
| PCMark 10 / Essentials | |
| Framework Laptop 13.5 12th Gen Intel | |
| Average Intel Core i7-1265U, Intel Iris Xe Graphics G7 96EUs (9278 - 11418, n=7) | |
| Lenovo ThinkPad X1 Titanium Yoga G1 20QA001RGE | |
| HP Spectre x360 14t-ea000 | |
| HP Elite Dragonfly G3 | |
| Dell XPS 13 Plus 9320 i5-1240p | |
| PCMark 10 / Productivity | |
| Framework Laptop 13.5 12th Gen Intel | |
| HP Spectre x360 14t-ea000 | |
| Average Intel Core i7-1265U, Intel Iris Xe Graphics G7 96EUs (5828 - 7311, n=7) | |
| Lenovo ThinkPad X1 Titanium Yoga G1 20QA001RGE | |
| Dell XPS 13 Plus 9320 i5-1240p | |
| HP Elite Dragonfly G3 | |
| PCMark 10 / Digital Content Creation | |
| Framework Laptop 13.5 12th Gen Intel | |
| Average Intel Core i7-1265U, Intel Iris Xe Graphics G7 96EUs (5127 - 6330, n=7) | |
| Dell XPS 13 Plus 9320 i5-1240p | |
| HP Elite Dragonfly G3 | |
| HP Spectre x360 14t-ea000 | |
| Lenovo ThinkPad X1 Titanium Yoga G1 20QA001RGE | |
| CrossMark / Overall | |
| Framework Laptop 13.5 12th Gen Intel | |
| Average Intel Core i7-1265U, Intel Iris Xe Graphics G7 96EUs (1301 - 1615, n=7) | |
| Dell XPS 13 Plus 9320 i5-1240p | |
| HP Elite Dragonfly G3 | |
| CrossMark / Productivity | |
| Framework Laptop 13.5 12th Gen Intel | |
| Average Intel Core i7-1265U, Intel Iris Xe Graphics G7 96EUs (1230 - 1586, n=7) | |
| Dell XPS 13 Plus 9320 i5-1240p | |
| HP Elite Dragonfly G3 | |
| CrossMark / Creativity | |
| Framework Laptop 13.5 12th Gen Intel | |
| Average Intel Core i7-1265U, Intel Iris Xe Graphics G7 96EUs (1413 - 1706, n=7) | |
| Dell XPS 13 Plus 9320 i5-1240p | |
| HP Elite Dragonfly G3 | |
| CrossMark / Responsiveness | |
| Framework Laptop 13.5 12th Gen Intel | |
| Average Intel Core i7-1265U, Intel Iris Xe Graphics G7 96EUs (1193 - 1521, n=7) | |
| Dell XPS 13 Plus 9320 i5-1240p | |
| HP Elite Dragonfly G3 | |
| PCMark 10 Score | 4753 points | |
Help | ||
| AIDA64 / Memory Copy | |
| HP Elite Dragonfly G3 | |
| Dell XPS 13 Plus 9320 i5-1240p | |
| Average Intel Core i7-1265U (40212 - 72204, n=10) | |
| Lenovo ThinkPad X1 Titanium Yoga G1 20QA001RGE | |
| Framework Laptop 13.5 12th Gen Intel | |
| AIDA64 / Memory Read | |
| Dell XPS 13 Plus 9320 i5-1240p | |
| HP Elite Dragonfly G3 | |
| Lenovo ThinkPad X1 Titanium Yoga G1 20QA001RGE | |
| Average Intel Core i7-1265U (41808 - 69493, n=10) | |
| Framework Laptop 13.5 12th Gen Intel | |
| AIDA64 / Memory Write | |
| Lenovo ThinkPad X1 Titanium Yoga G1 20QA001RGE | |
| Dell XPS 13 Plus 9320 i5-1240p | |
| Average Intel Core i7-1265U (41382 - 76027, n=10) | |
| HP Elite Dragonfly G3 | |
| Framework Laptop 13.5 12th Gen Intel | |
| AIDA64 / Memory Latency | |
| HP Elite Dragonfly G3 | |
| Average Intel Core i7-1265U (74.6 - 112.4, n=10) | |
| Lenovo ThinkPad X1 Titanium Yoga G1 20QA001RGE | |
| Framework Laptop 13.5 12th Gen Intel | |
* ... smaller is better
DPC Latency
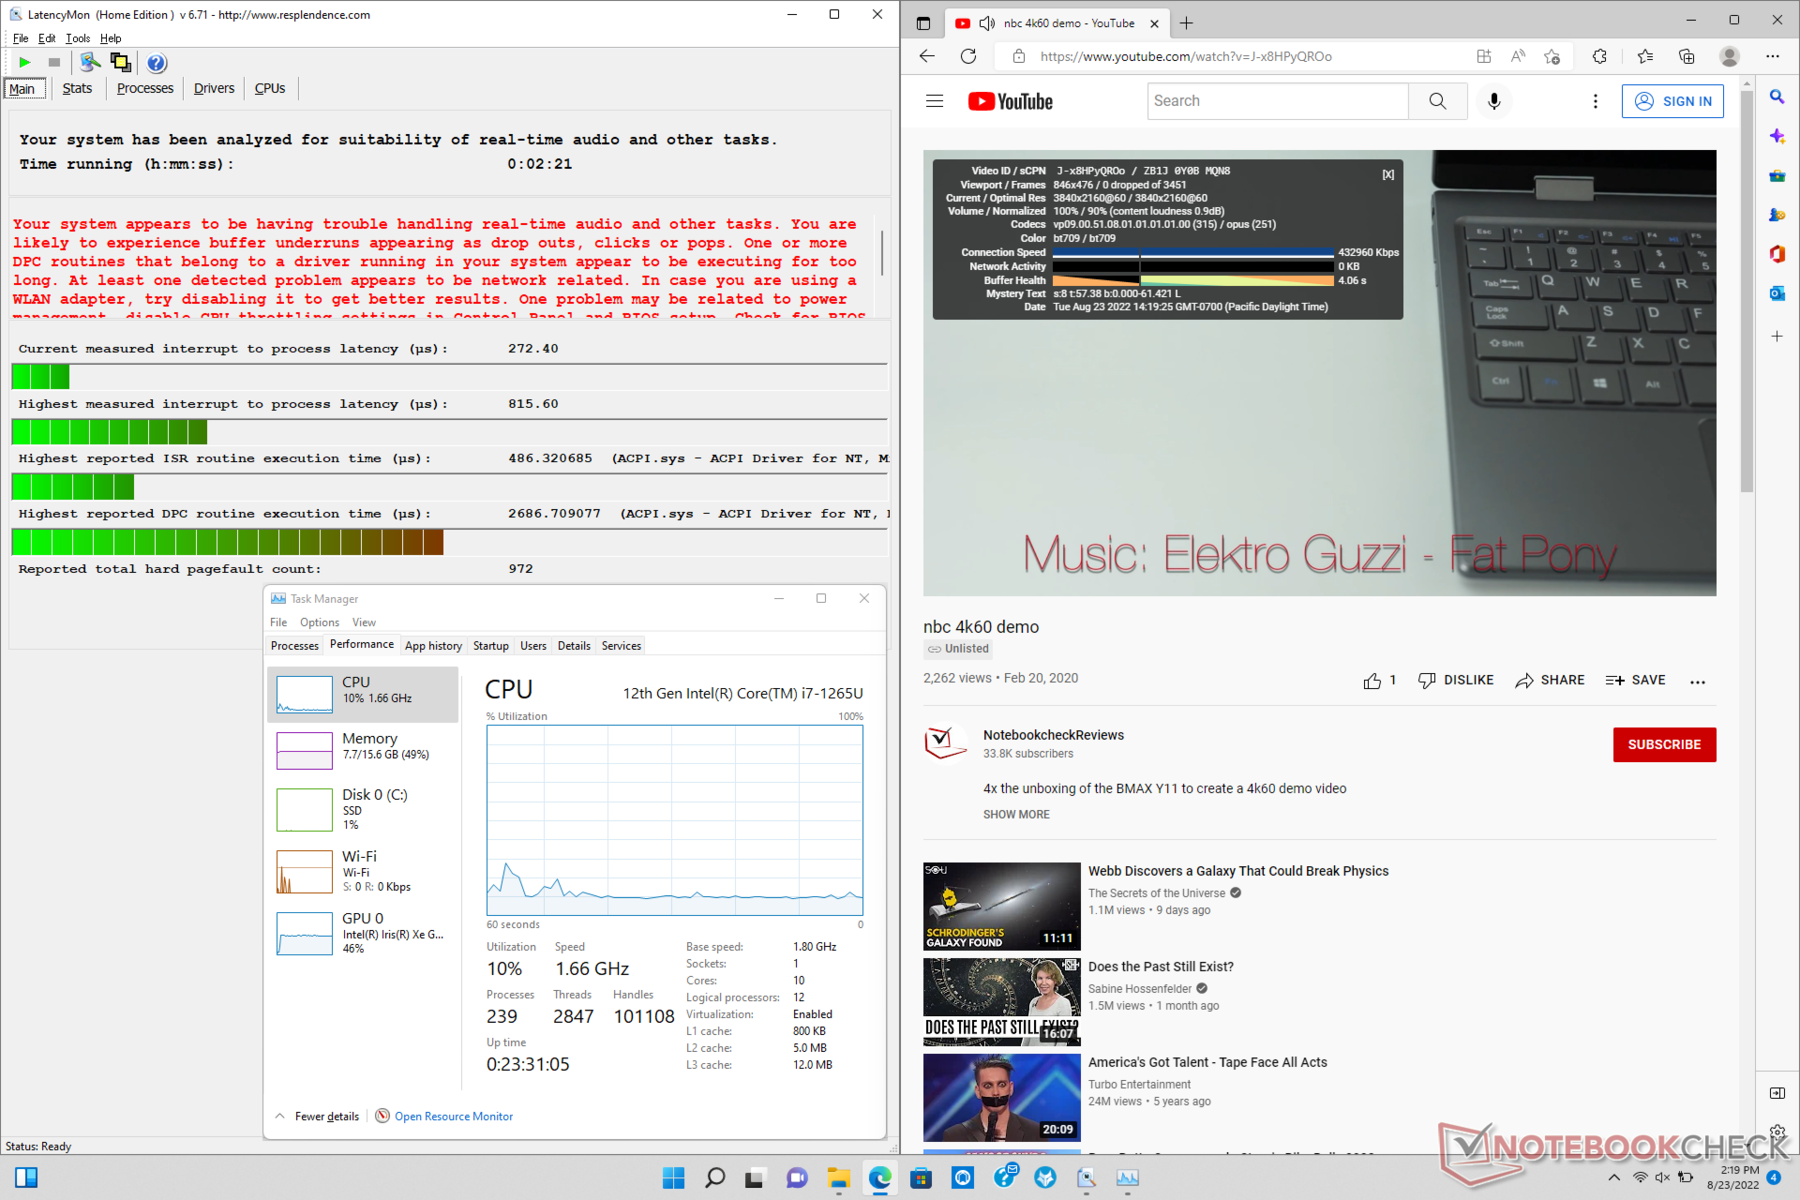
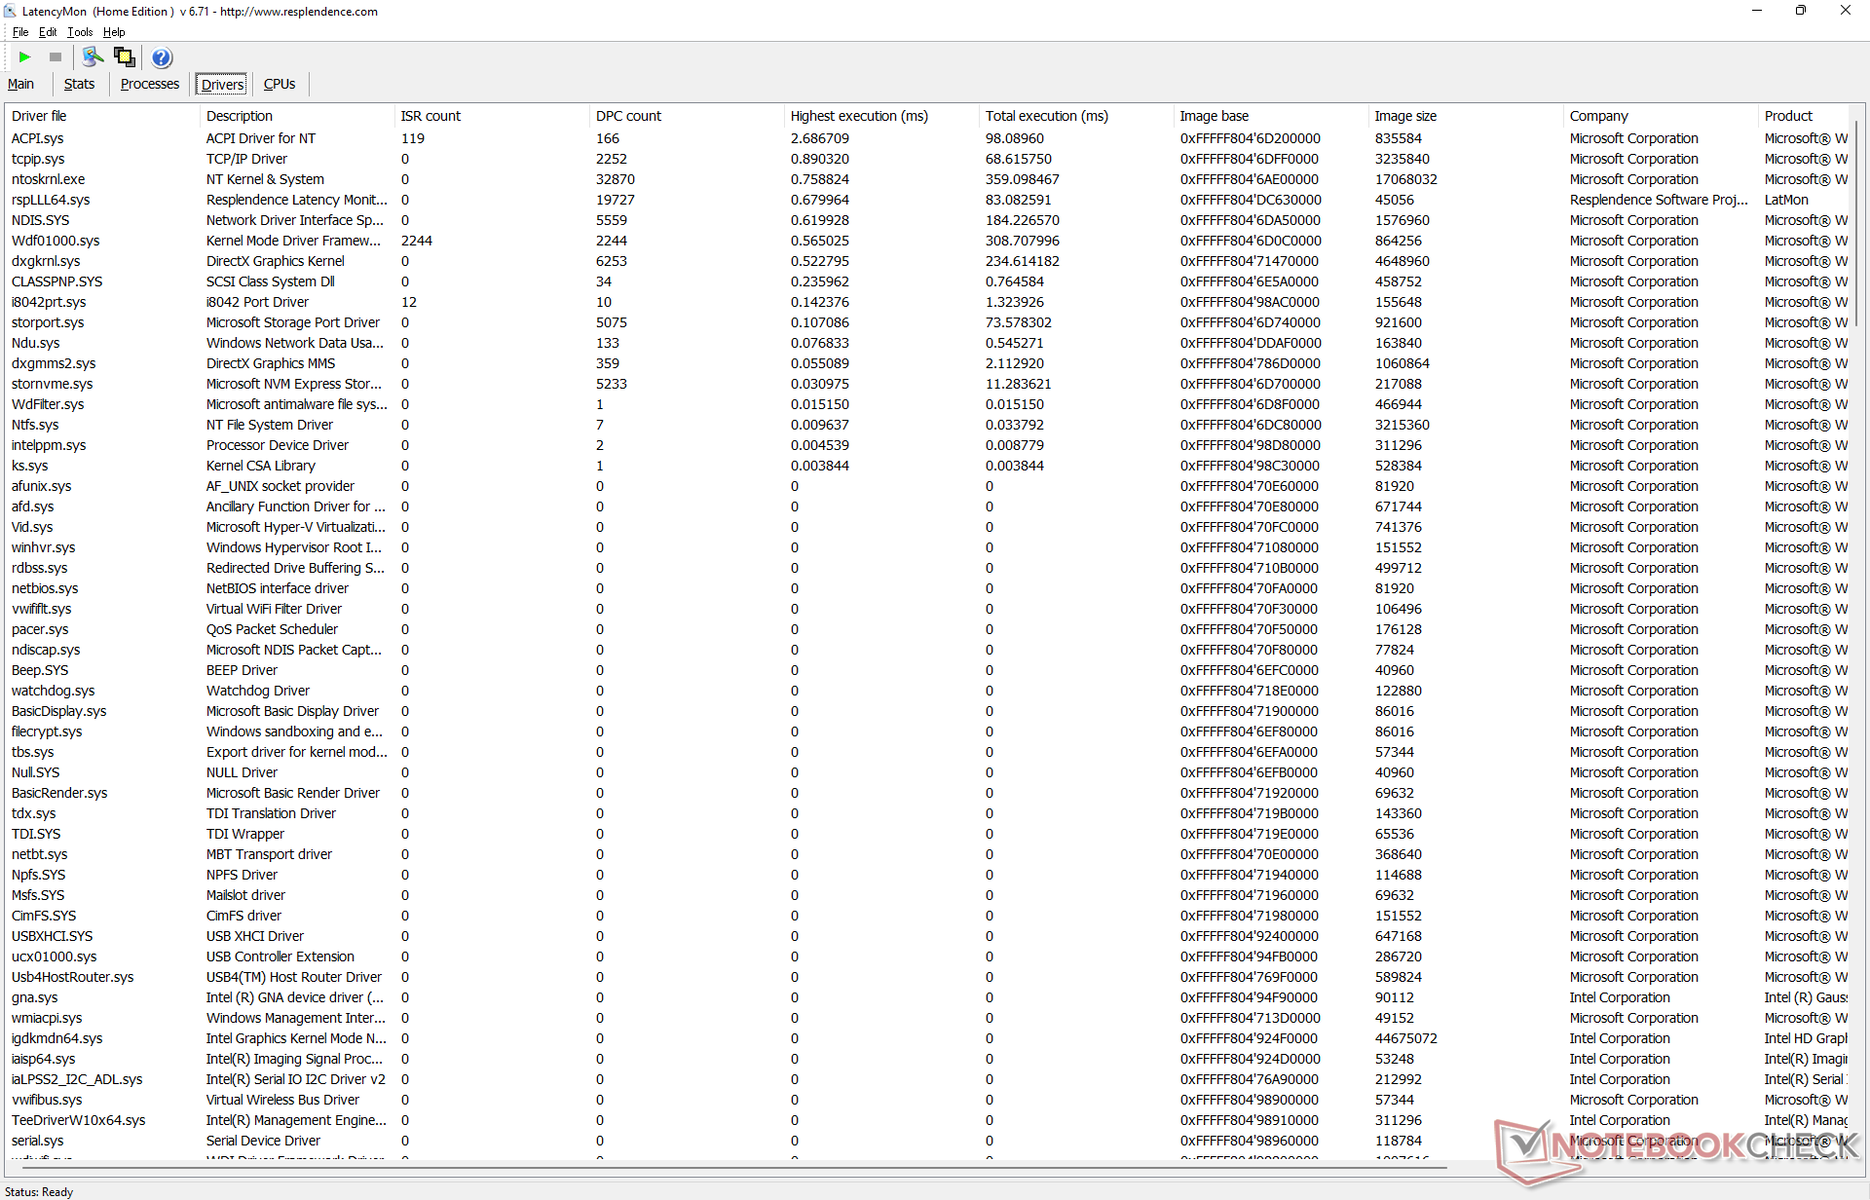
LatencyMon reveals DPC issues when opening multiple browser tabs of our homepage. 4K video playback at 60 FPS is otherwise perfect with no dropped frames during our testing.
| DPC Latencies / LatencyMon - interrupt to process latency (max), Web, Youtube, Prime95 | |
| Dell XPS 13 Plus 9320 i5-1240p | |
| HP Spectre x360 14t-ea000 | |
| Lenovo ThinkPad X1 Titanium Yoga G1 20QA001RGE | |
| Framework Laptop 13.5 12th Gen Intel | |
| HP Elite Dragonfly G3 | |
* ... smaller is better
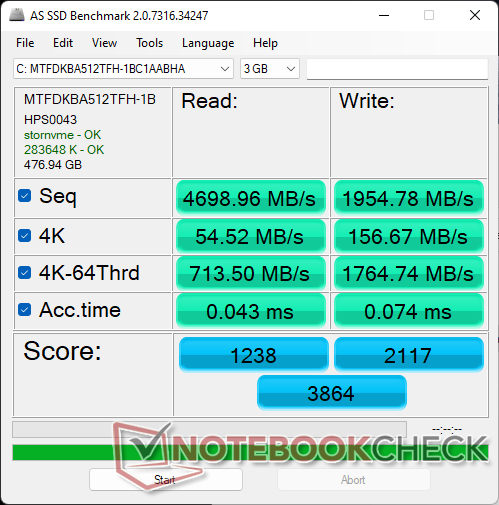
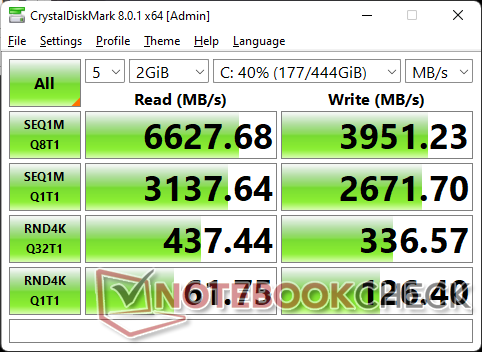
Storage Devices
HP offers SSD options ranging from 256 GB to 1 TB OPAL2 NVMe. Our specific configuration comes with the 512 GB Micron MTFDKBA512TFH PCIe4 SSD for sequential read and write rates of about 6500 MB/s and 4000 MB/s, respectively. The drive would exhibit no major performance throttling issues when running DiskSpd in a loop.

* ... smaller is better
Disk Throttling: DiskSpd Read Loop, Queue Depth 8
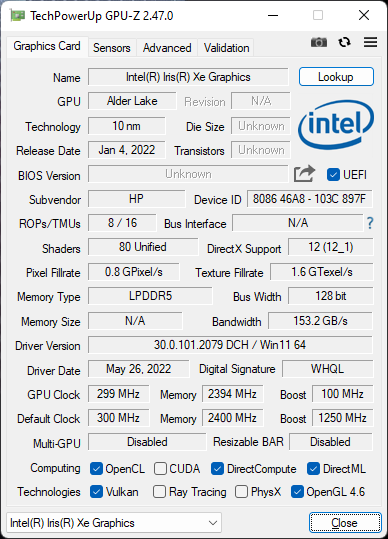
GPU Performance
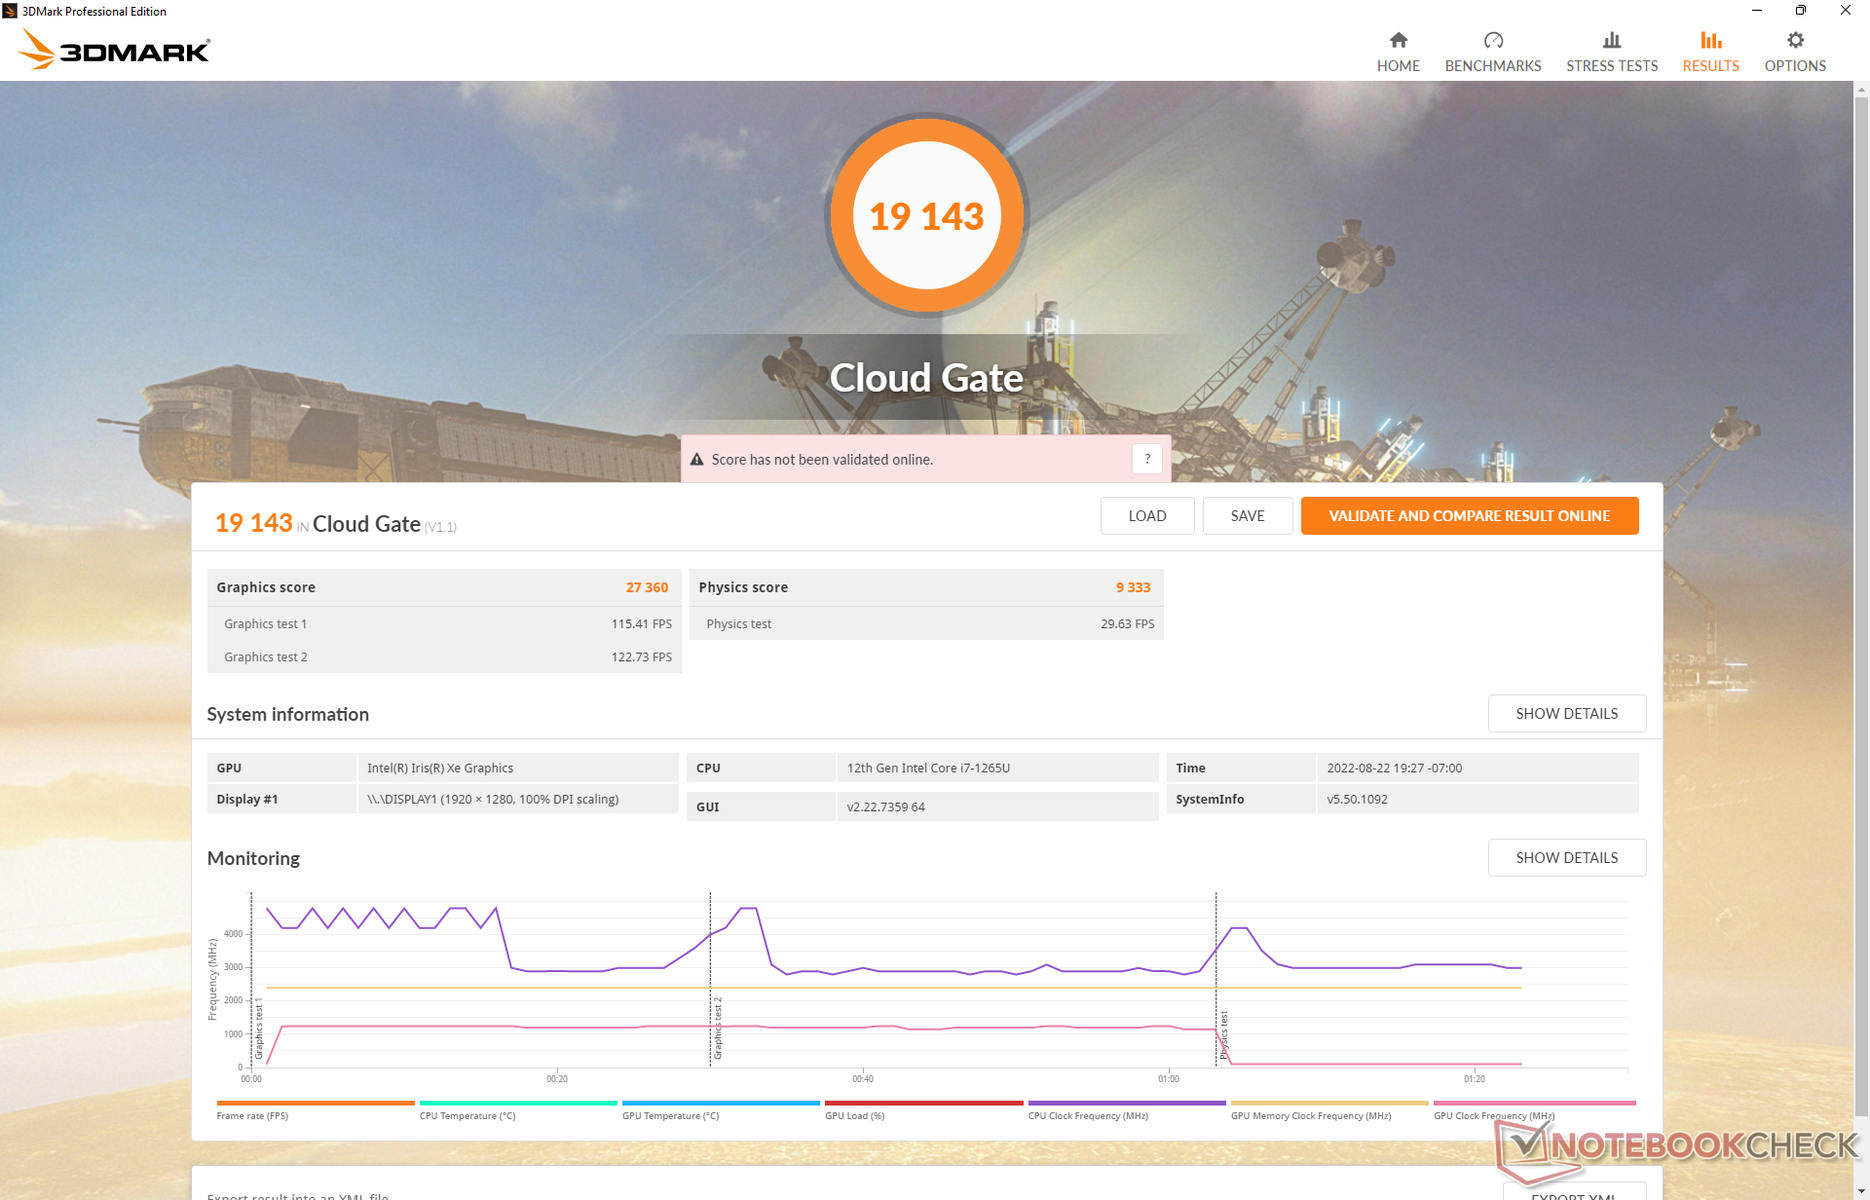
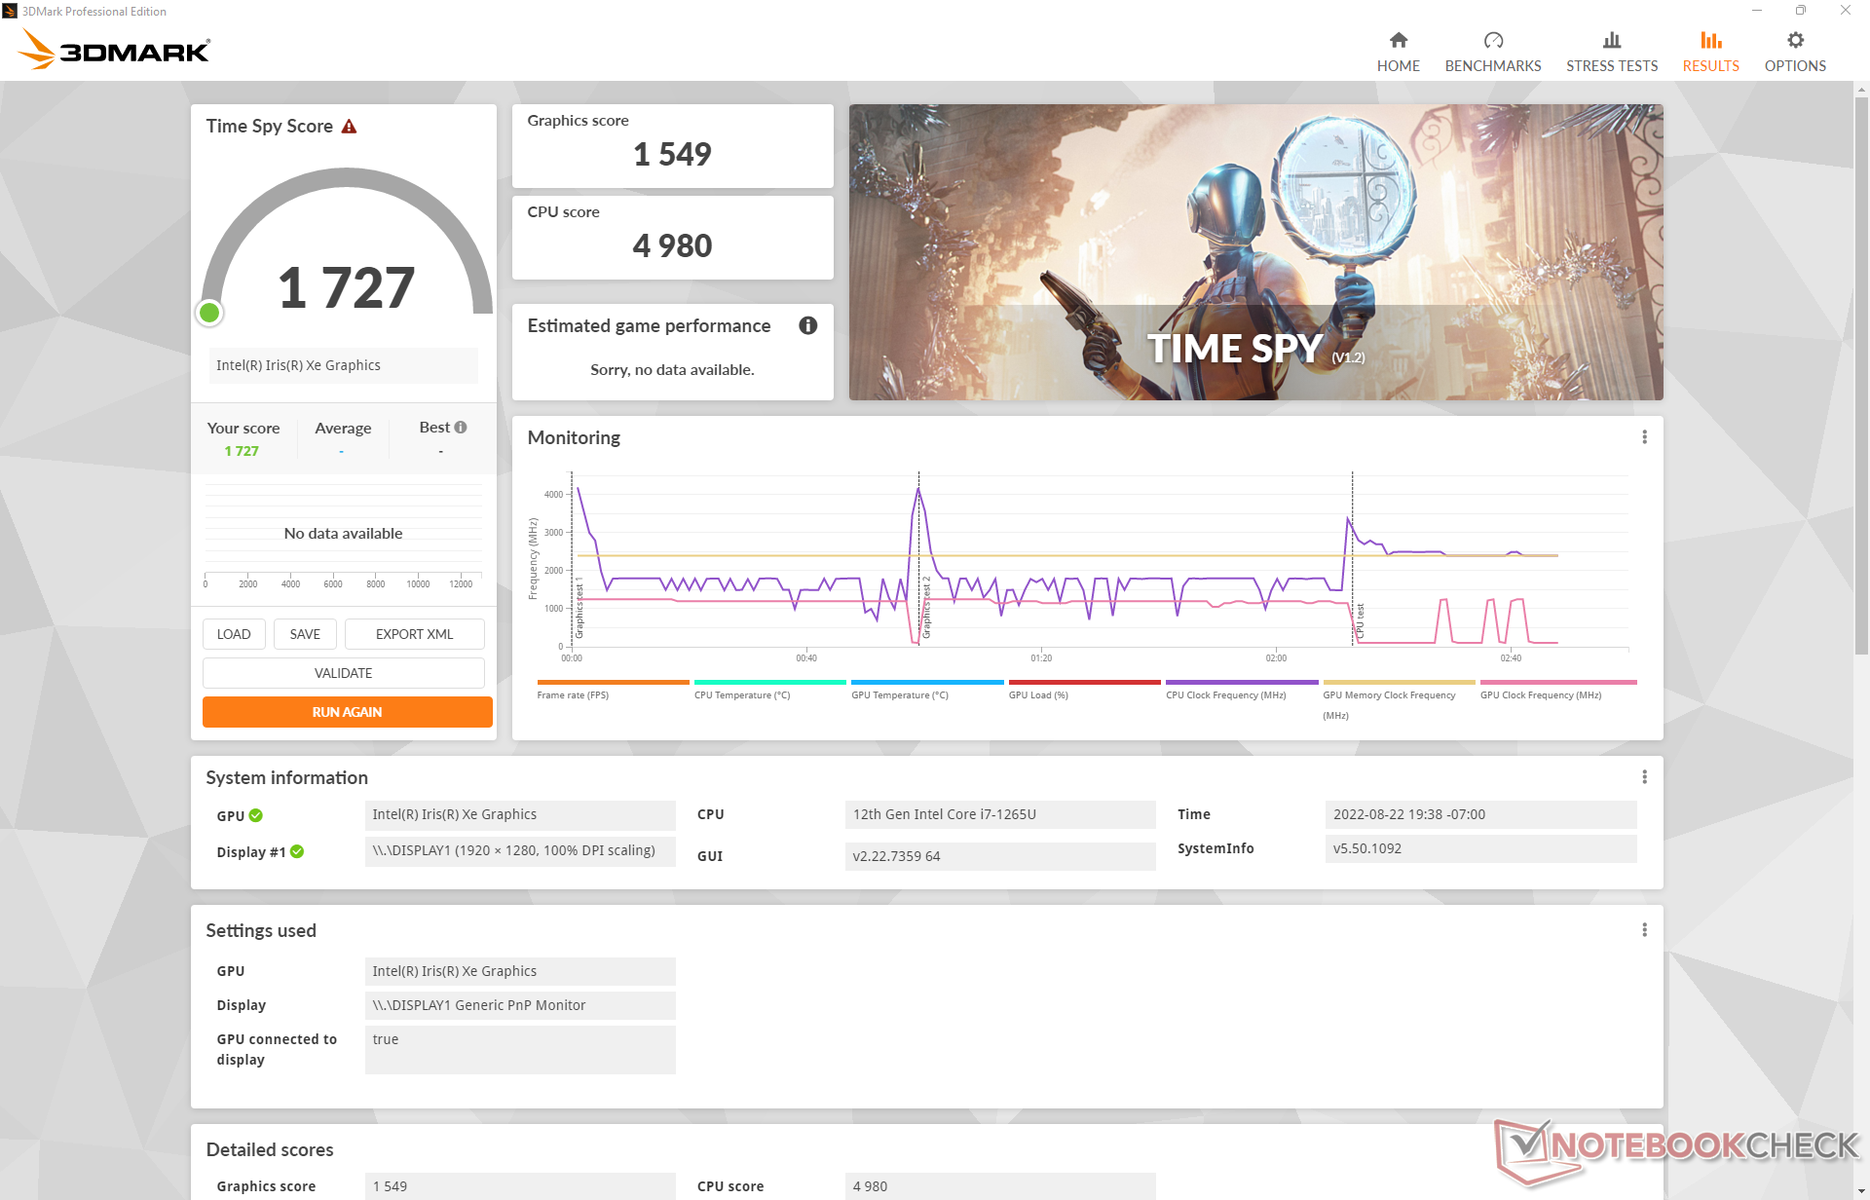
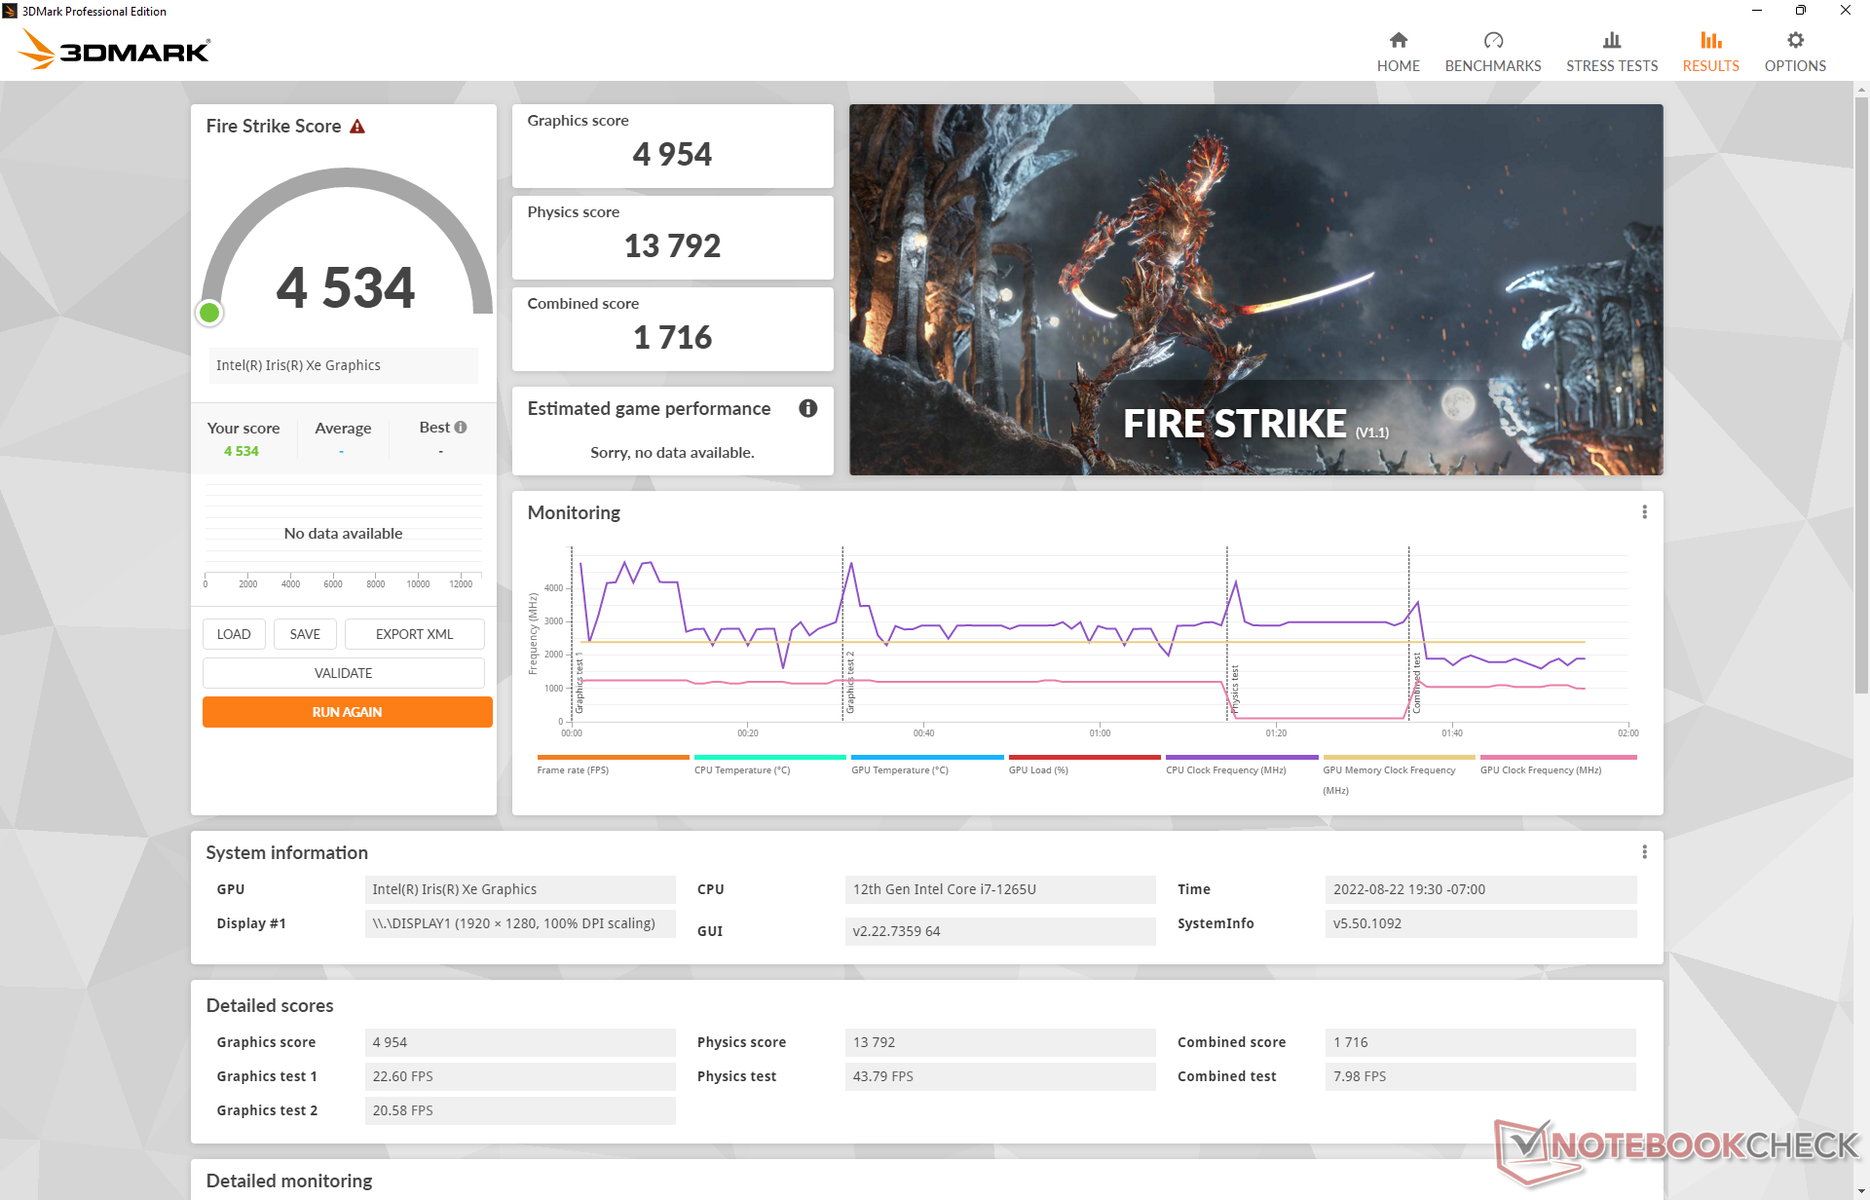
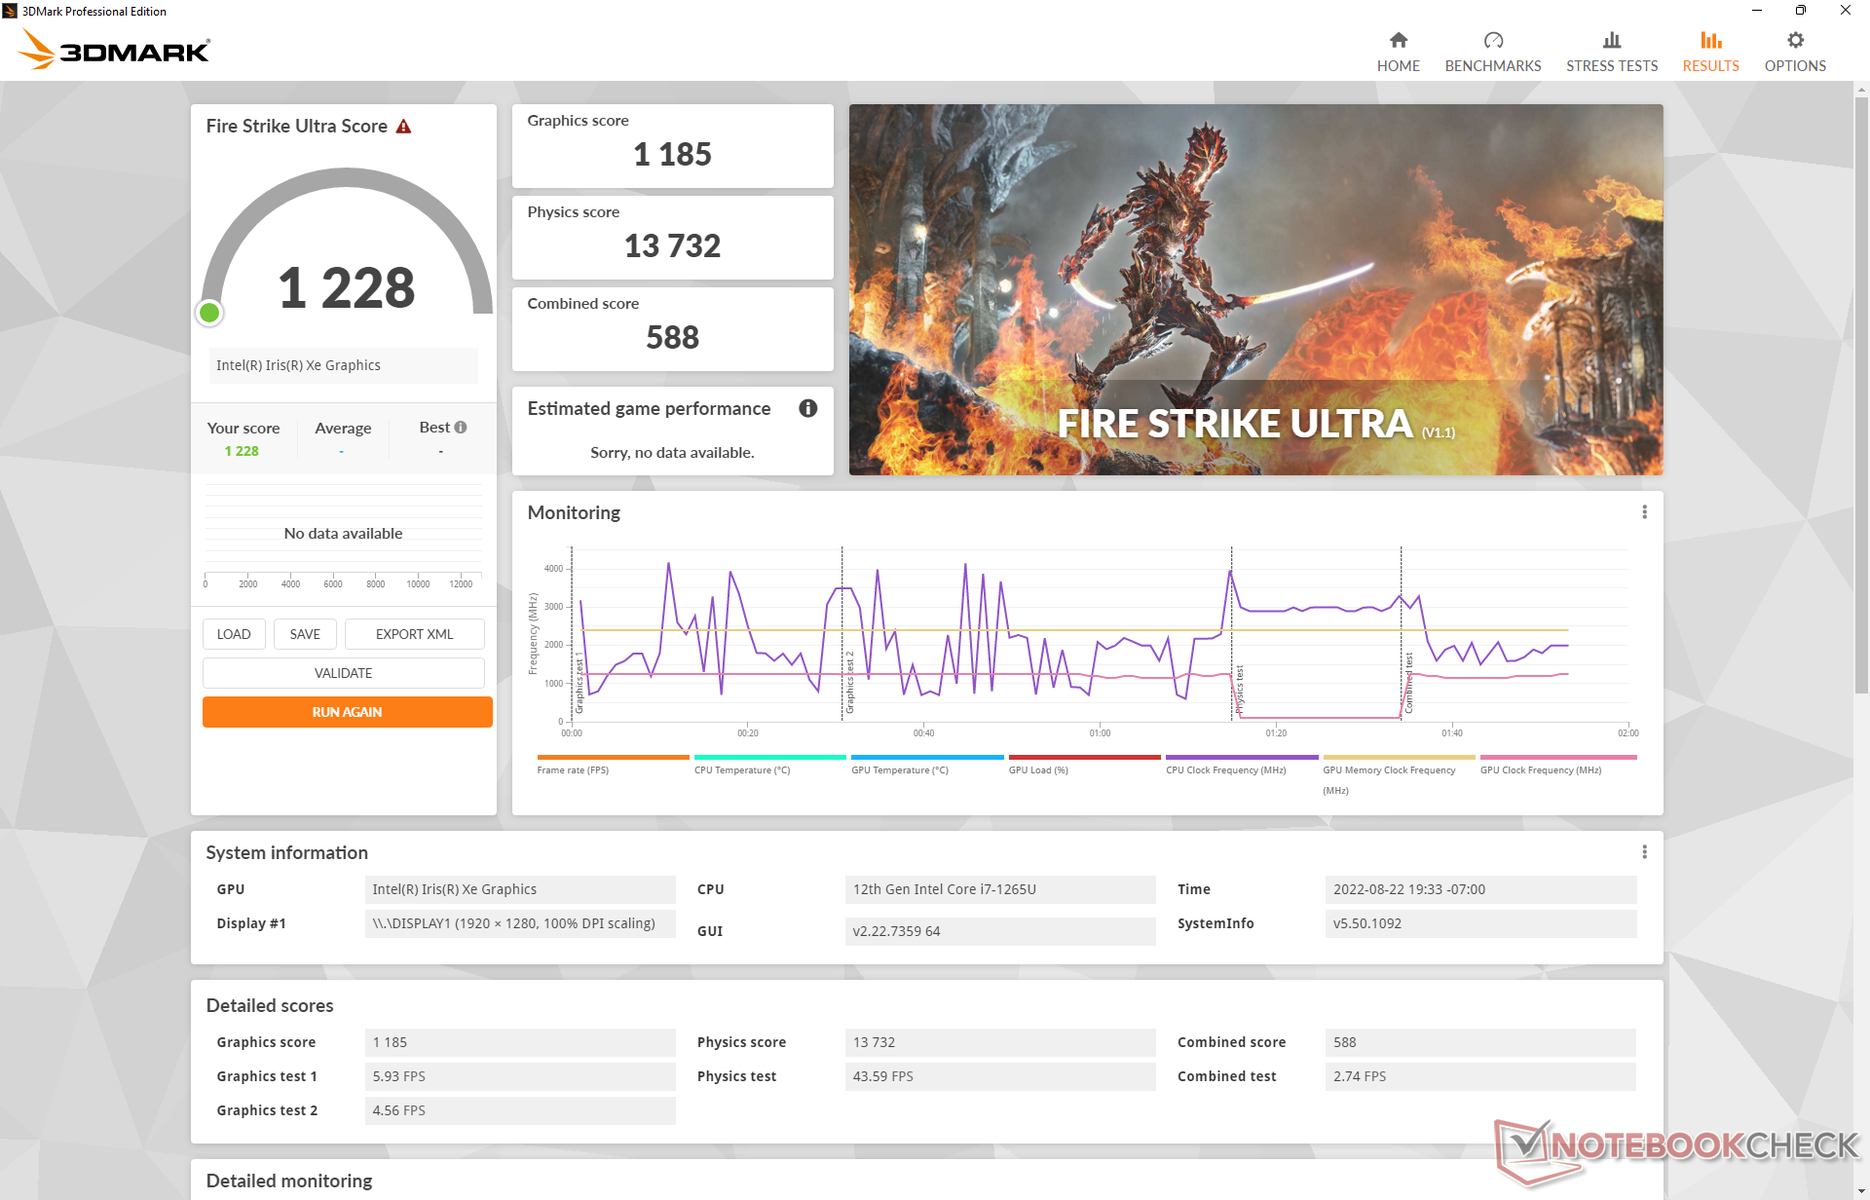
The integrated Iris Xe 96 EUs is performing where we expect it to be relative to other laptops with the same GPU. This is great as it means HP didn't artificially throttle graphics performance too heavily, but it's also disappointing as it means users shouldn't expect any significant GPU gains over the last generation Core i7-1165G7 series.
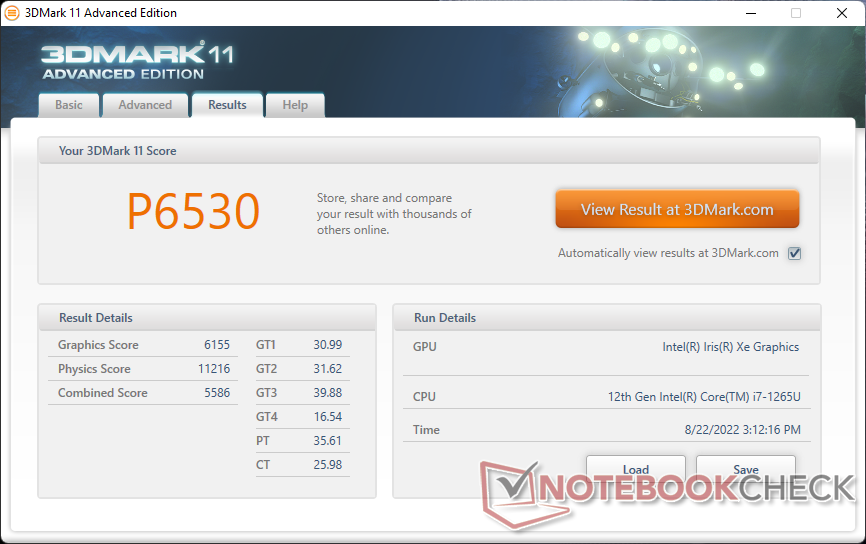
| 3DMark 11 Performance | 6530 points | |
| 3DMark Cloud Gate Standard Score | 19143 points | |
| 3DMark Fire Strike Score | 4534 points | |
| 3DMark Time Spy Score | 1727 points | |
Help | ||
| Cyberpunk 2077 1.6 | |
| 1920x1080 Low Preset | |
| Framework Laptop 13.5 12th Gen Intel | |
| HP Elite Dragonfly G3 | |
| Average Intel Iris Xe Graphics G7 96EUs (13 - 25.9, n=42) | |
| 1920x1080 Medium Preset | |
| Framework Laptop 13.5 12th Gen Intel | |
| HP Elite Dragonfly G3 | |
| Average Intel Iris Xe Graphics G7 96EUs (10.8 - 21.7, n=37) | |
| 1920x1080 High Preset | |
| Framework Laptop 13.5 12th Gen Intel | |
| HP Elite Dragonfly G3 | |
| Average Intel Iris Xe Graphics G7 96EUs (9.8 - 16.9, n=34) | |
Witcher 3 FPS Chart
| low | med. | high | ultra | |
|---|---|---|---|---|
| GTA V (2015) | 90.6 | 79.2 | 23.3 | 10.2 |
| The Witcher 3 (2015) | 76.1 | 52 | 28.4 | 13.8 |
| Dota 2 Reborn (2015) | 97.4 | 71.1 | 57 | 50.9 |
| Final Fantasy XV Benchmark (2018) | 39.7 | 22.7 | 15.8 | |
| X-Plane 11.11 (2018) | 37.3 | 34.7 | 31.2 | |
| Strange Brigade (2018) | 84.9 | 39.3 | 31.4 | 25.4 |
| Cyberpunk 2077 1.6 (2022) | 19.8 | 16.8 | 12.8 | 10.2 |
Emissions — Super Quiet
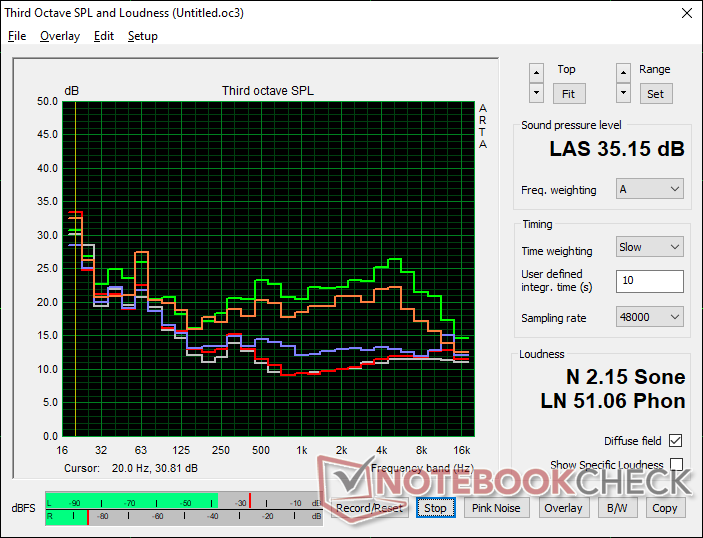
System Noise
On the Dragonfly Max, we found fan noise to be quieter-than-average which aligned with its slower-than-average CPU performance. This trend continues on the Dragonfly G3 for better or worse. At its loudest, we're only able to record a fan noise of just 35 dB(A) compared to 40 dB(A) or greater on competing models as shown by the table below. Users who value CPU performance may be disappointed while those who value quieter fans may not mind the slower processor.
Noise Level
| Idle |
| 23.2 / 23.2 / 23.2 dB(A) |
| Load |
| 25.1 / 35.2 dB(A) |
 | ||
30 dB silent 40 dB(A) audible 50 dB(A) loud |
||
min: | ||
| HP Elite Dragonfly G3 Iris Xe G7 96EUs, i7-1265U, Micron 3400 MTFDKBA512TFH 512GB | HP Spectre x360 14t-ea000 Iris Xe G7 96EUs, i7-1165G7, Samsung SSD PM981a MZVLB512HBJQ | Dell XPS 13 Plus 9320 i5-1240p Iris Xe G7 80EUs, i5-1240P, Micron 3400 MTFDKBA512TFH 512GB | Framework Laptop 13.5 12th Gen Intel Iris Xe G7 96EUs, i7-1260P, WDC PC SN730 SDBPNTY-512G | HP EliteBook Folio 13.5-3G2L2EA Adreno 680, SD 8cx Gen 2 5G, Toshiba XG6 KXG60ZNV512G | Lenovo ThinkPad X1 Titanium Yoga G1 20QA001RGE Iris Xe G7 96EUs, i7-1160G7, Toshiba BG4 KBG40ZNT512G | |
|---|---|---|---|---|---|---|
| Noise | -12% | -23% | -25% | -11% | ||
| off / environment * | 22.8 | 25.8 -13% | 26 -14% | 22.8 -0% | 25.1 -10% | |
| Idle Minimum * | 23.2 | 25.9 -12% | 26.2 -13% | 23 1% | 25.1 -8% | |
| Idle Average * | 23.2 | 25.9 -12% | 26.2 -13% | 23 1% | 25.1 -8% | |
| Idle Maximum * | 23.2 | 25.9 -12% | 26.2 -13% | 23 1% | 27.1 -17% | |
| Load Average * | 25.1 | 26.4 -5% | 38.4 -53% | 47.3 -88% | 32.7 -30% | |
| Witcher 3 ultra * | 32 | 36.9 -15% | 47.3 -48% | 32.7 -2% | ||
| Load Maximum * | 35.2 | 41.5 -18% | 47.1 -34% | 49.8 -41% | 35.8 -2% |
* ... smaller is better
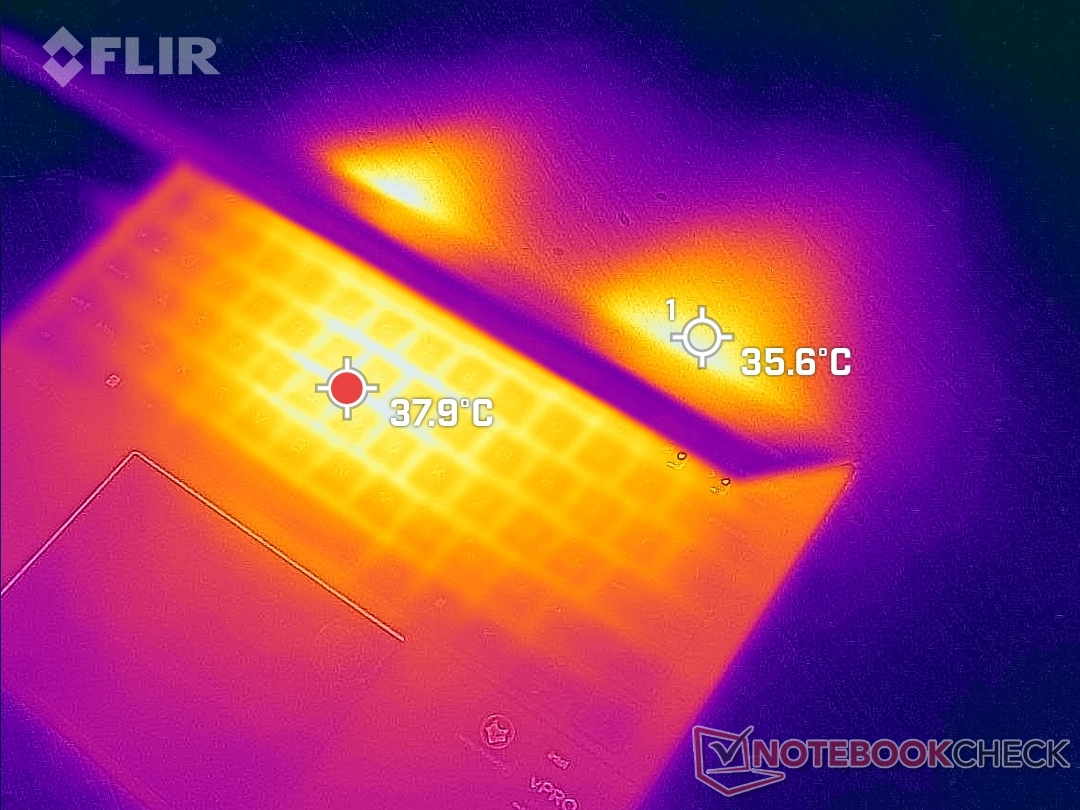
Temperature
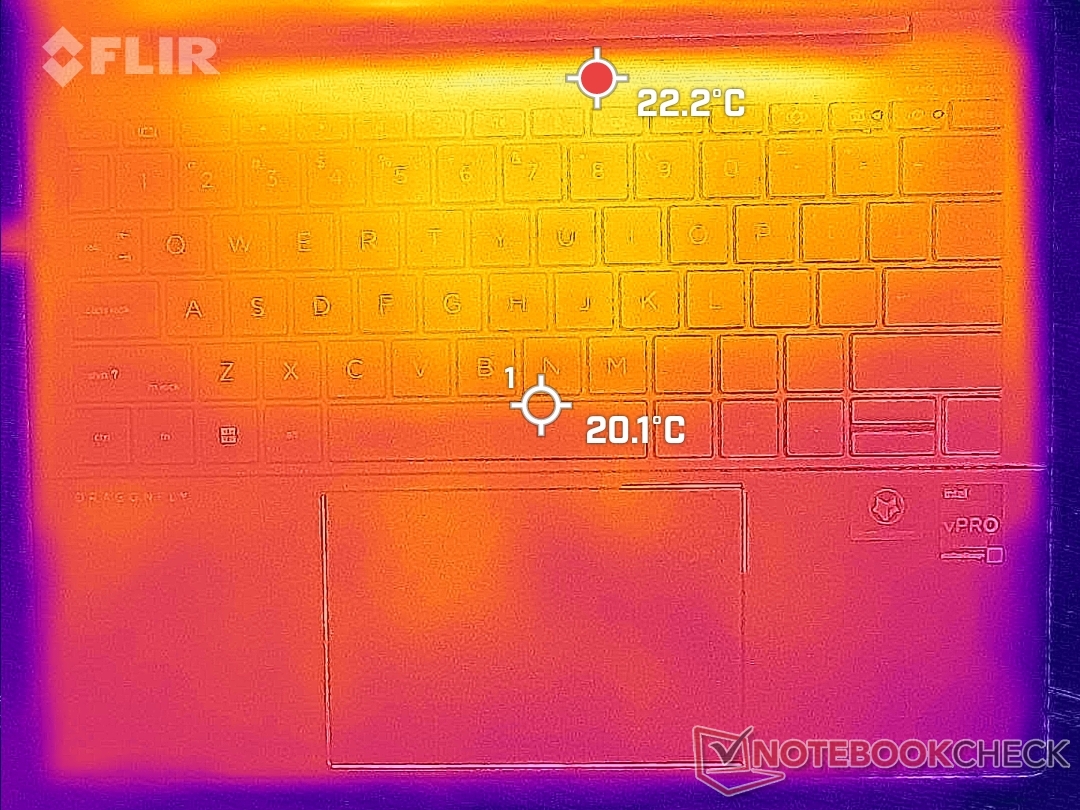
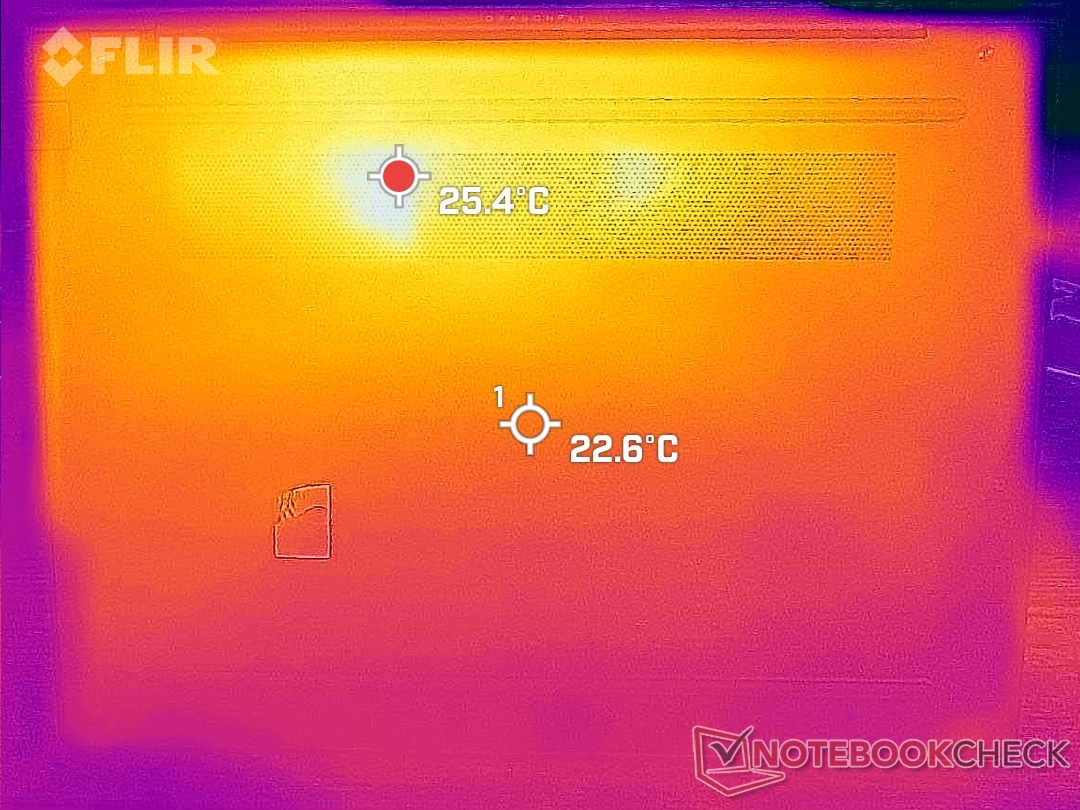
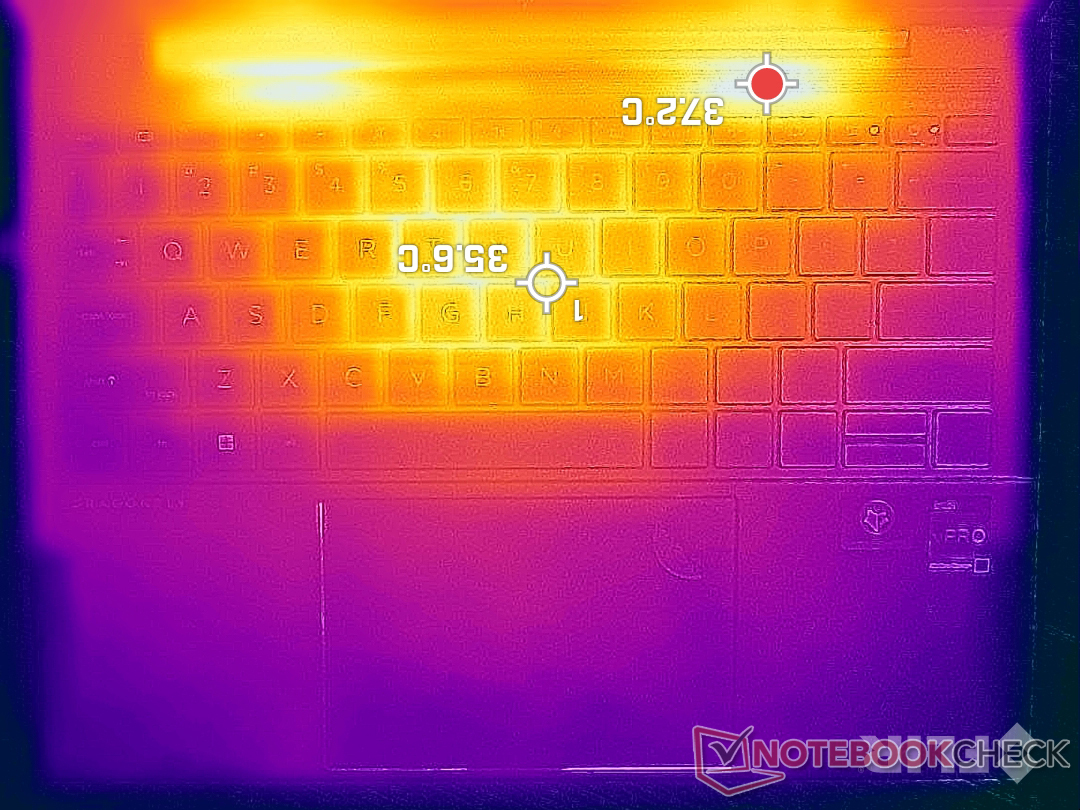
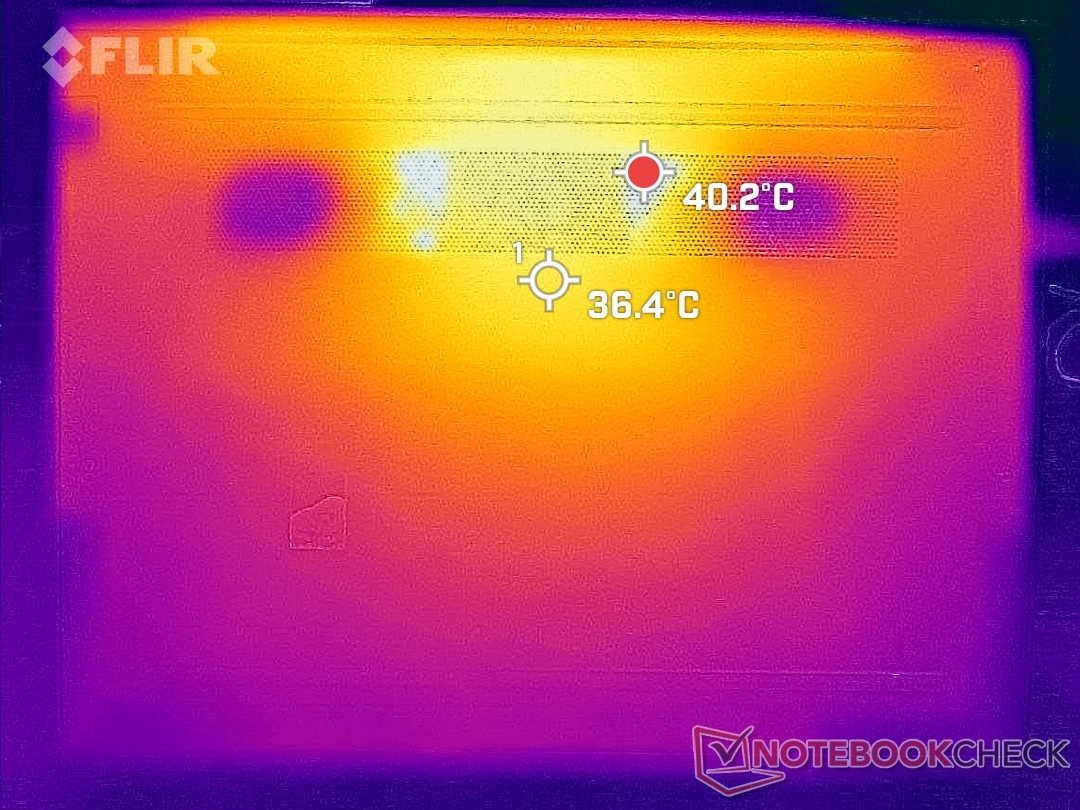
Surface temperature gradient is more symmetrical than on the older Dragonfly Max due to the revised cooling solution. This means that the hot spot on the Dragonfly G3 is nearest the keyboard center instead of on the right half of the keyboard. These areas can become as warm as 40 C when under high loads for extended periods, but they are thankfully toward the rear and nowhere near the palm rests or clickpad.
(+) The maximum temperature on the upper side is 39 °C / 102 F, compared to the average of 34.3 °C / 94 F, ranging from 21.2 to 62.5 °C for the class Office.
(±) The bottom heats up to a maximum of 42.2 °C / 108 F, compared to the average of 36.8 °C / 98 F
(+) In idle usage, the average temperature for the upper side is 25.4 °C / 78 F, compared to the device average of 29.5 °C / 85 F.
(+) The palmrests and touchpad are cooler than skin temperature with a maximum of 28.4 °C / 83.1 F and are therefore cool to the touch.
(±) The average temperature of the palmrest area of similar devices was 27.6 °C / 81.7 F (-0.8 °C / -1.4 F).
| HP Elite Dragonfly G3 Intel Core i7-1265U, Intel Iris Xe Graphics G7 96EUs | HP Spectre x360 14t-ea000 Intel Core i7-1165G7, Intel Iris Xe Graphics G7 96EUs | Dell XPS 13 Plus 9320 i5-1240p Intel Core i5-1240P, Intel Iris Xe Graphics G7 80EUs | Framework Laptop 13.5 12th Gen Intel Intel Core i7-1260P, Intel Iris Xe Graphics G7 96EUs | HP EliteBook Folio 13.5-3G2L2EA Qualcomm Snapdragon 8cx Gen 2 5G, Qualcomm Adreno 680 | Lenovo ThinkPad X1 Titanium Yoga G1 20QA001RGE Intel Core i7-1160G7, Intel Iris Xe Graphics G7 96EUs | |
|---|---|---|---|---|---|---|
| Heat | -9% | -37% | 3% | 11% | -7% | |
| Maximum Upper Side * | 39 | 40.4 -4% | 47.6 -22% | 36.8 6% | 34.3 12% | 46.5 -19% |
| Maximum Bottom * | 42.2 | 52.8 -25% | 57 -35% | 42.4 -0% | 35.4 16% | 45.2 -7% |
| Idle Upper Side * | 26.8 | 27.2 -1% | 38.8 -45% | 24.2 10% | 25.7 4% | 27.3 -2% |
| Idle Bottom * | 28.2 | 29.2 -4% | 41 -45% | 29 -3% | 25.1 11% | 27.7 2% |
* ... smaller is better
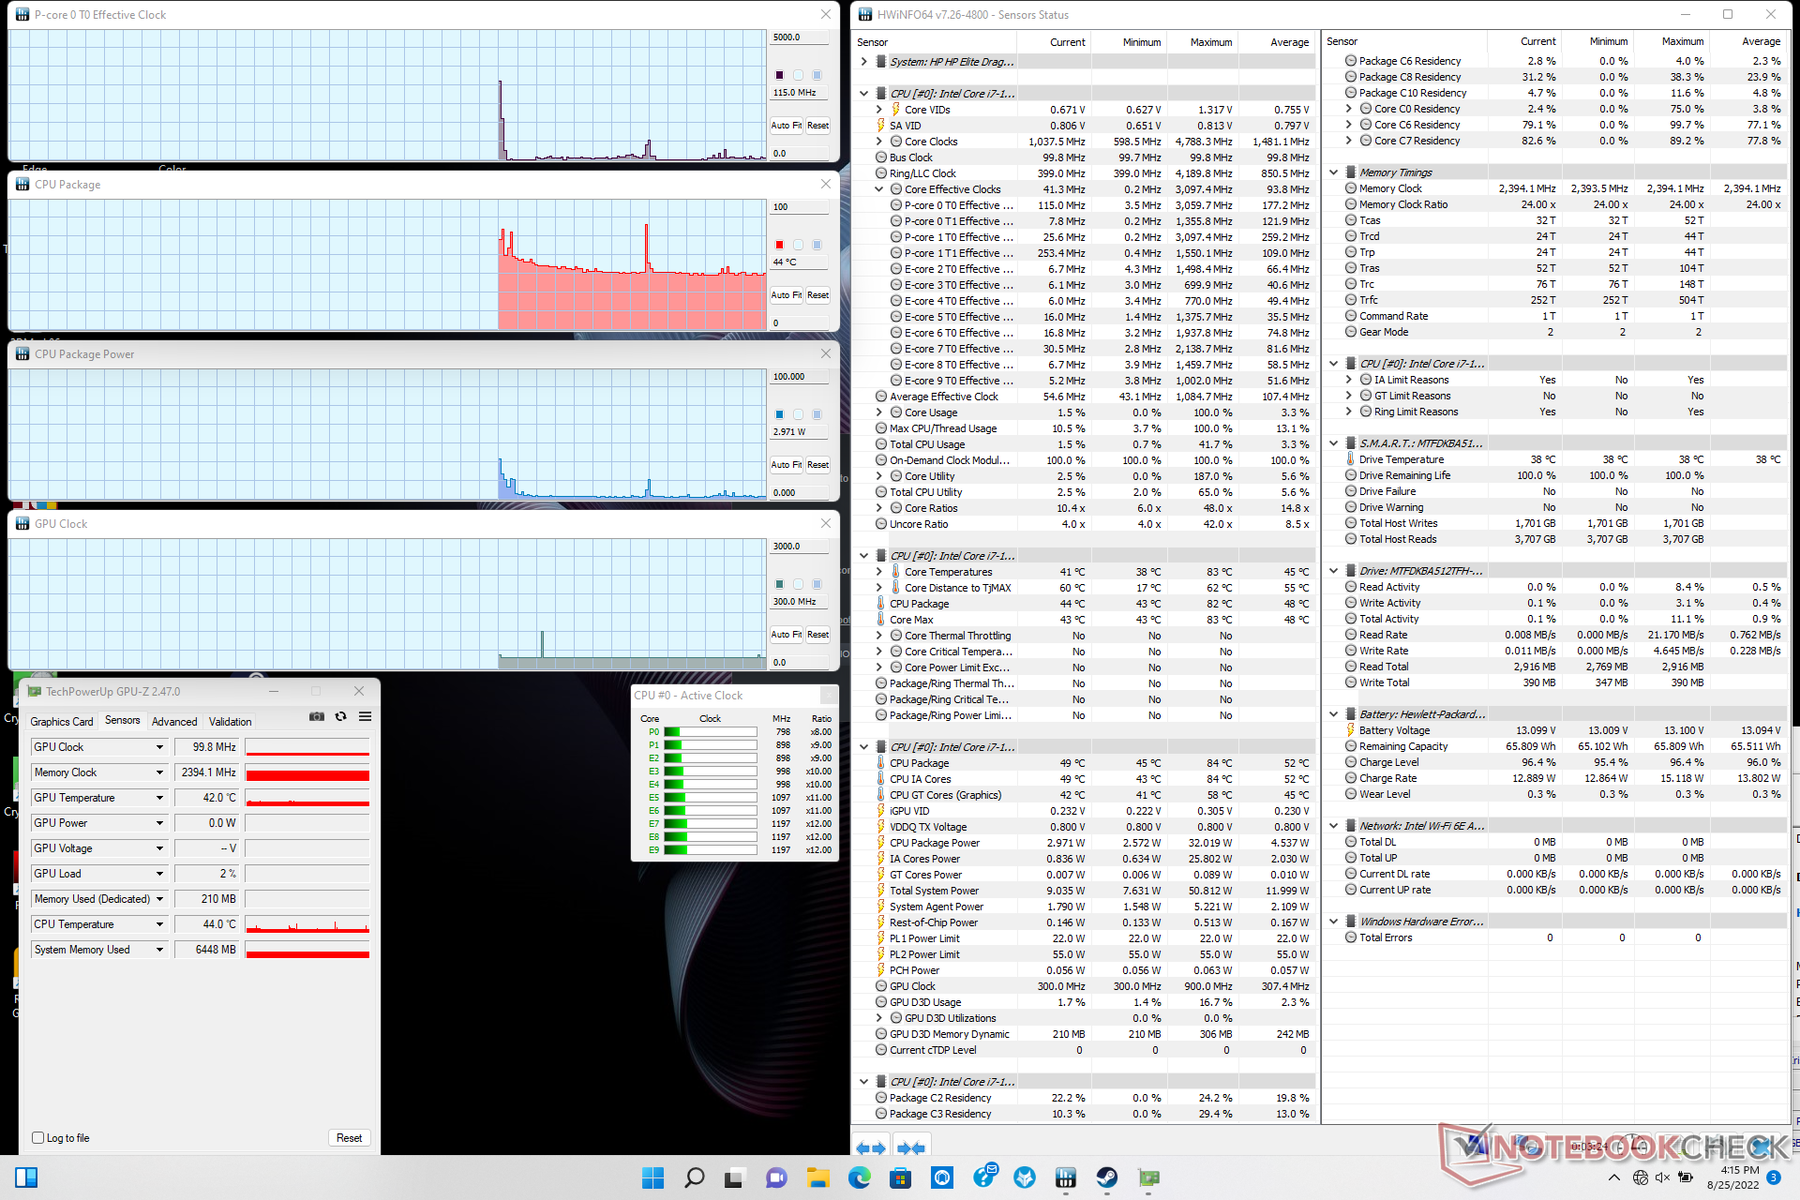
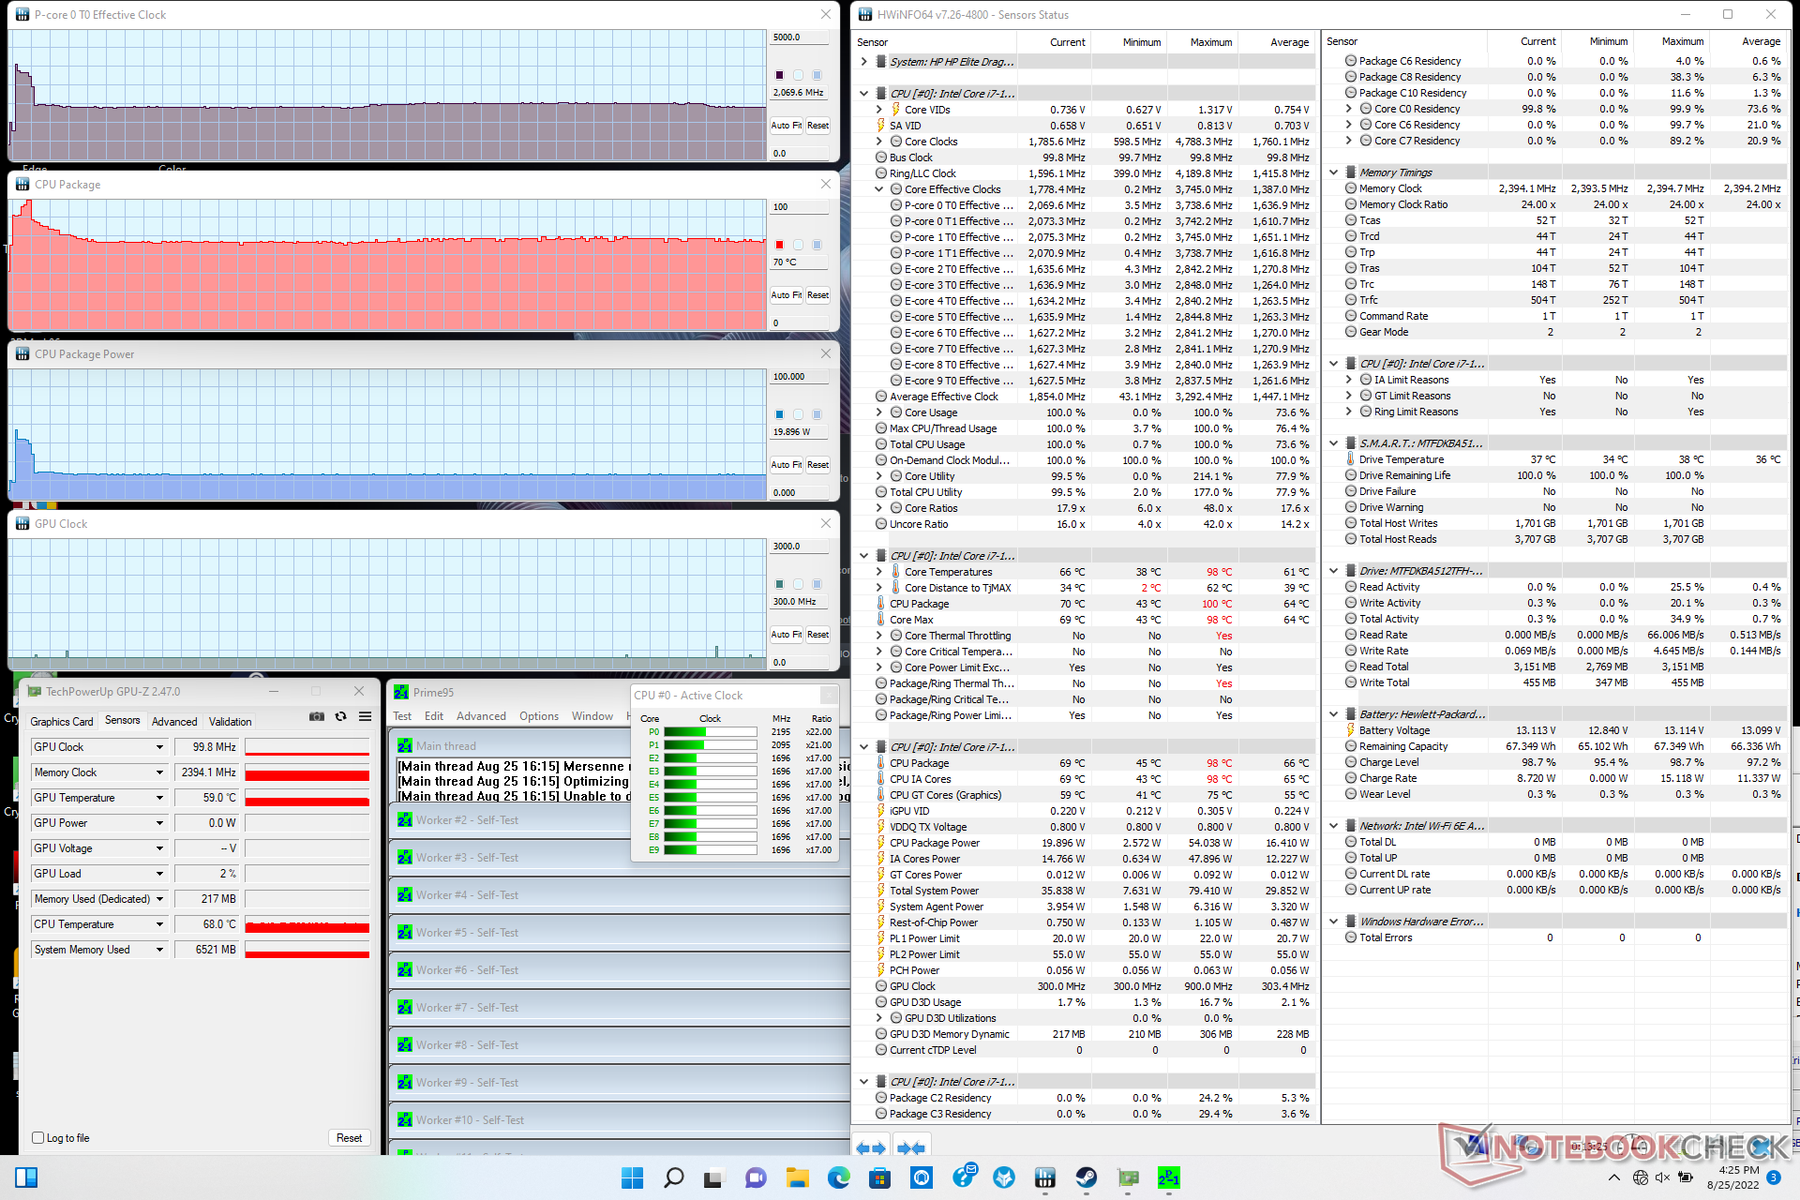
Stress Test
CPU clock rates, temperature, and board power draw would spike to 3.7 GHz, 100 C, and 54 W, respectively, when initiating Prime95 stress. After just 10 to 15 seconds, however, clock rates and board power draw would fall and stabilize at 2.1 GHz and 20 W, respectively, in order to maintain a more manageable core temperature of 70 C. Repeating this same test on the Dell Latitude 7330 with the same Core i7-1265U CPU would see higher stable clock rates, temperatures, and board power draw of 2.4 GHz, >80 C, and 25 W, respectively. HP is running the Core i7-1265U more conservatively when compared to the competition.
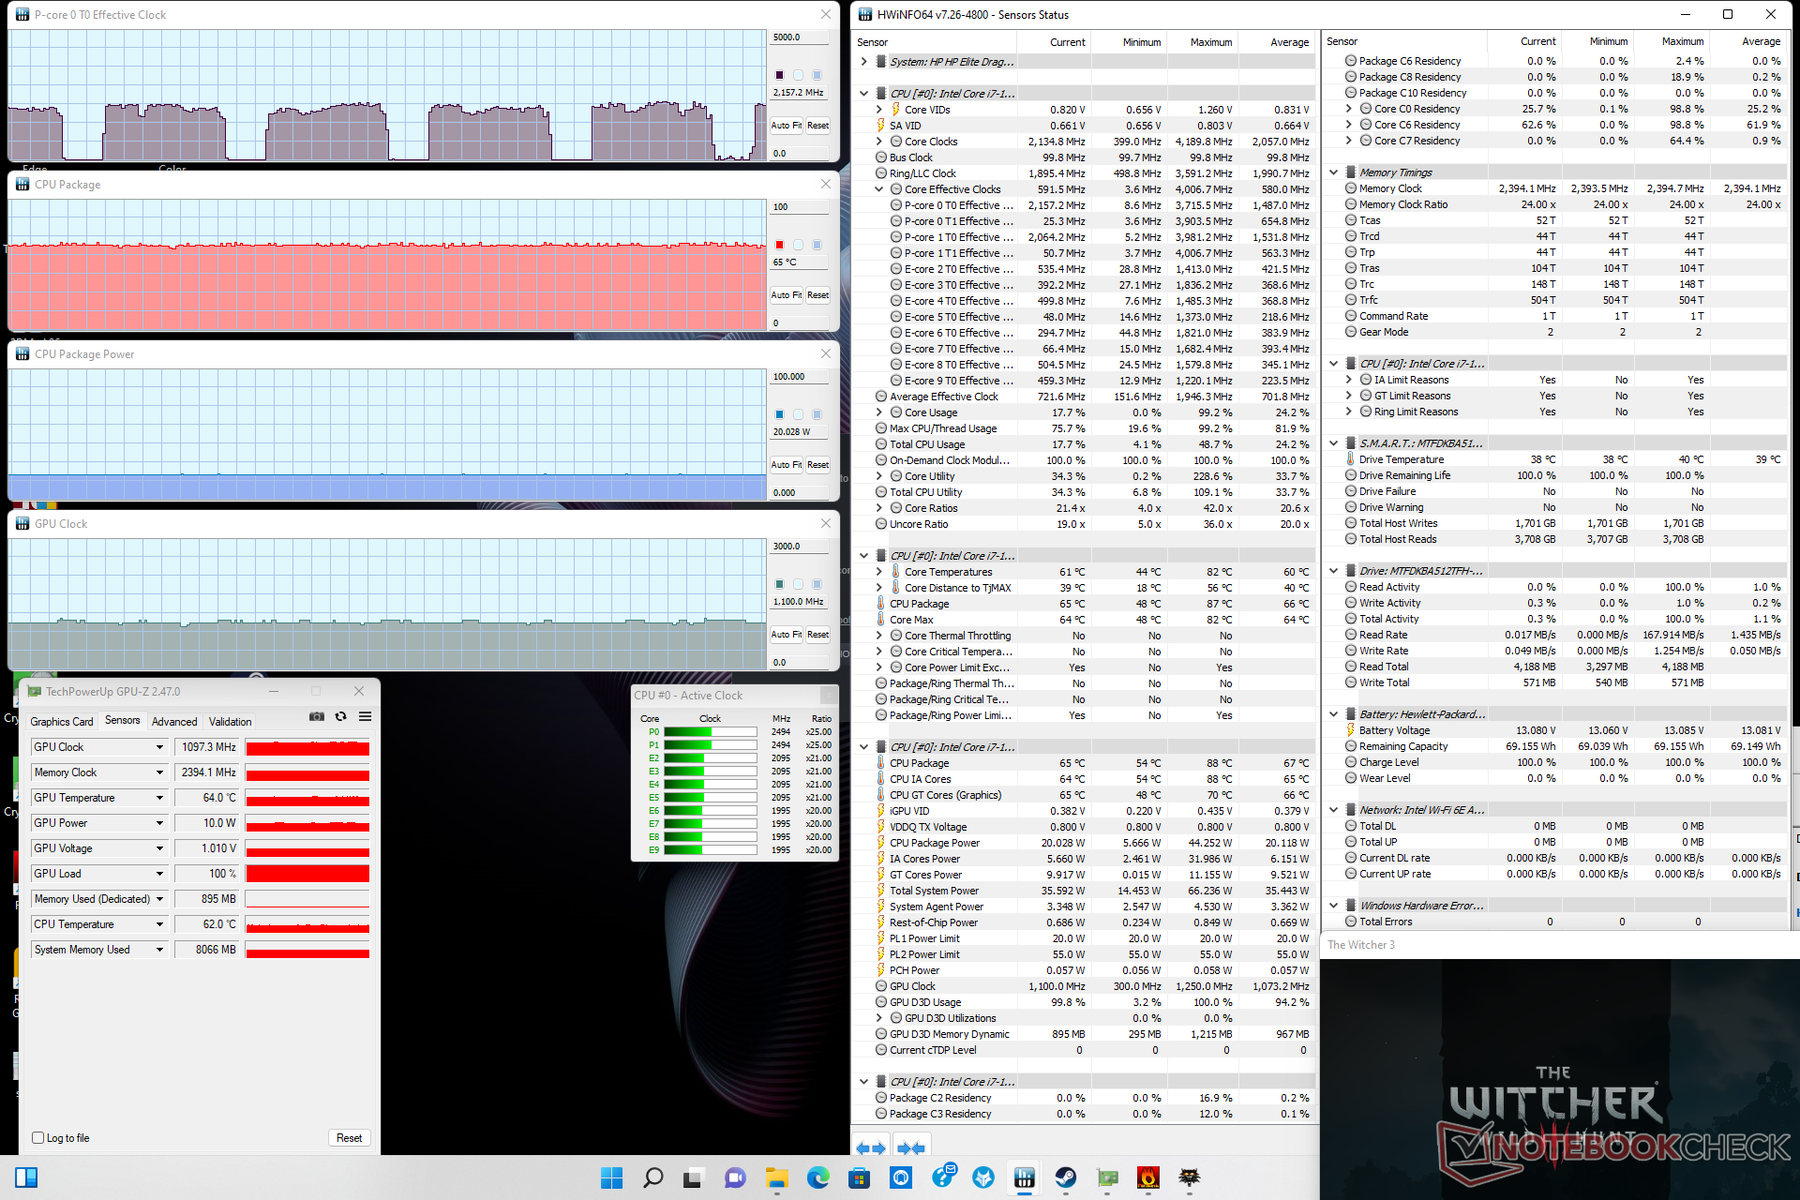
When running Witcher 3 to represent demanding loads, GPU clock rate and temperature would stabilize at 1097 MHz and 65 C, respectively, compared to 1247 MHz and 83 C on the aforementioned Dell.
Running on battery power limits performance. A 3DMark test on batteries would return Physics and Graphics scores of 9619 and 5532 points, respectively, compared to 11216 and 6155 points when on mains.
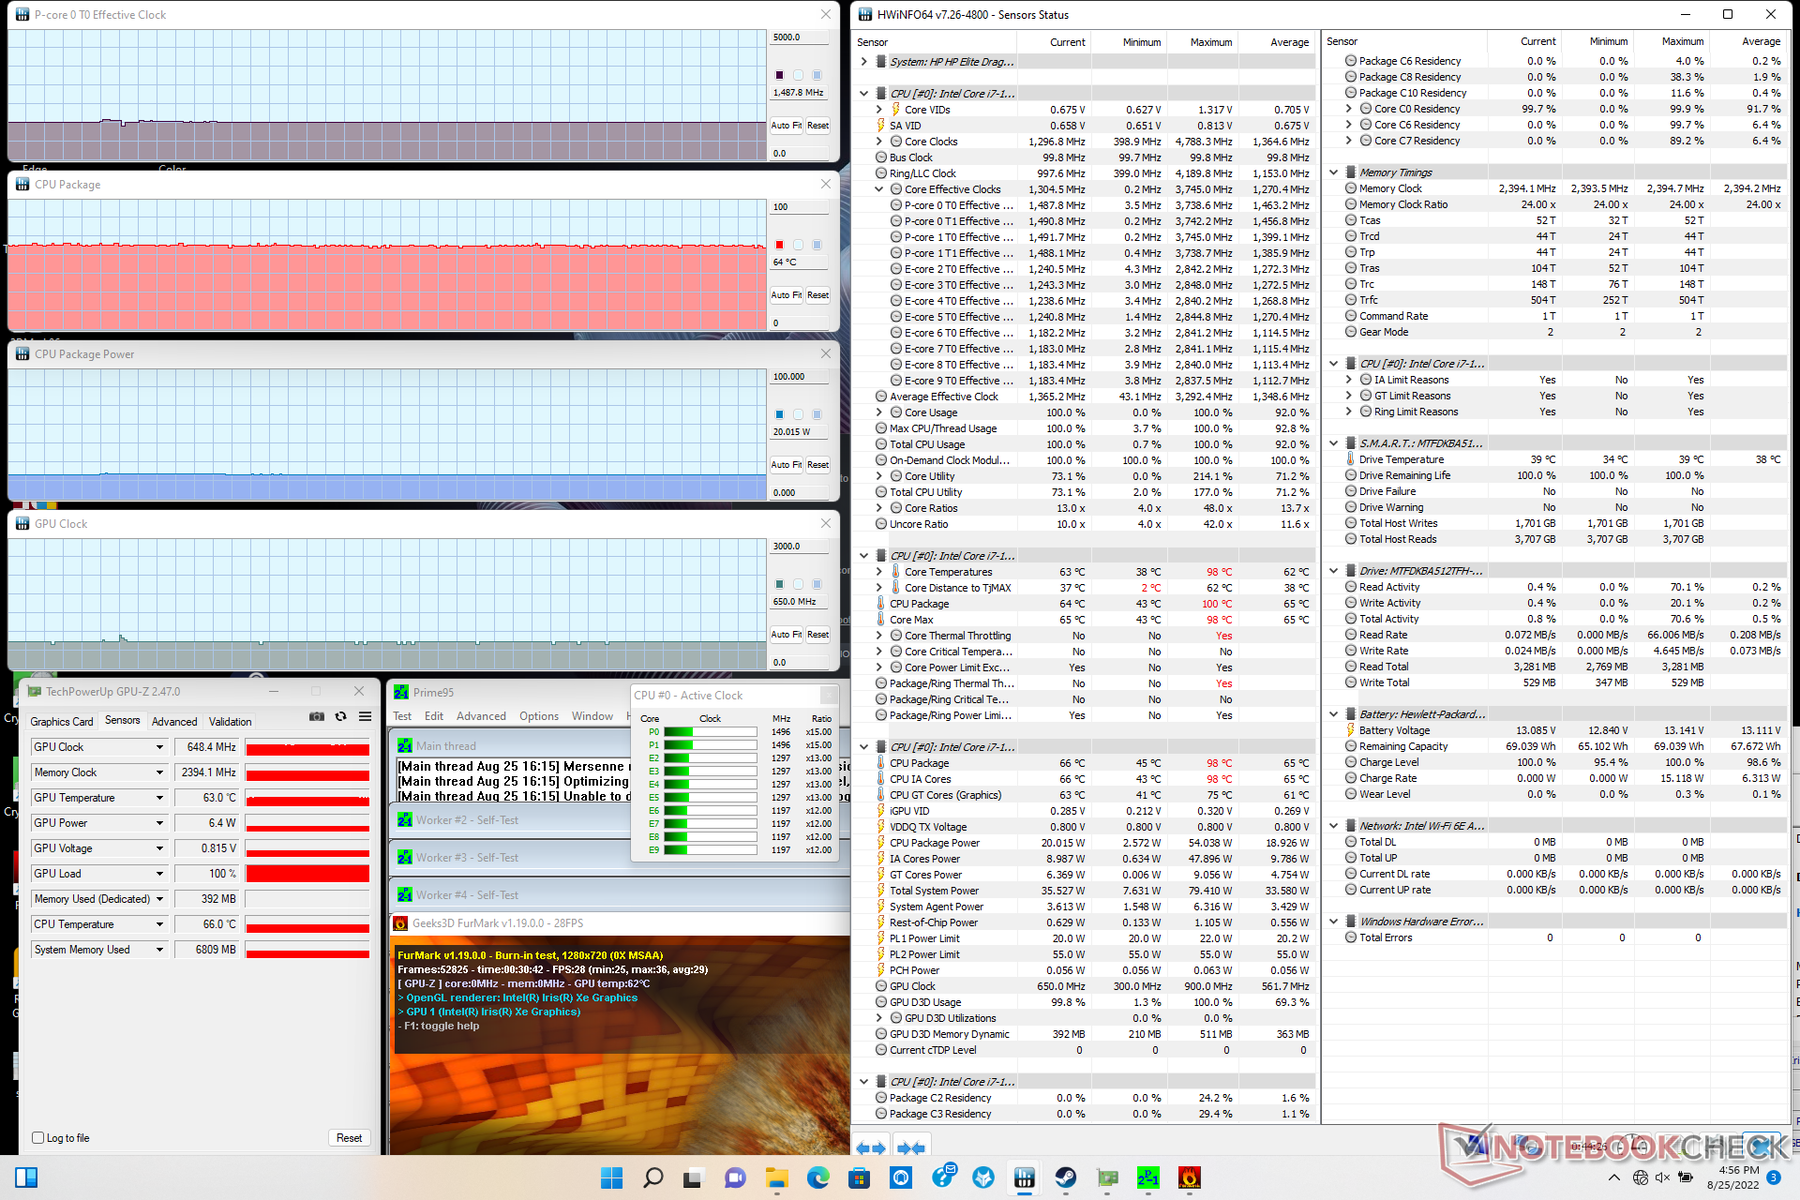
| CPU Clock (GHz) | GPU Clock (MHz) | Average CPU Temperature (°C) | |
| System Idle | -- | -- | 2.1 |
| Prime95 Stress | 2.1 | -- | 70 |
| Prime95 + FurMark Stress | 1.5 | 648 | 64 |
| Witcher 3 Stress | ~2.1 | 1097 | 65 |
Speakers
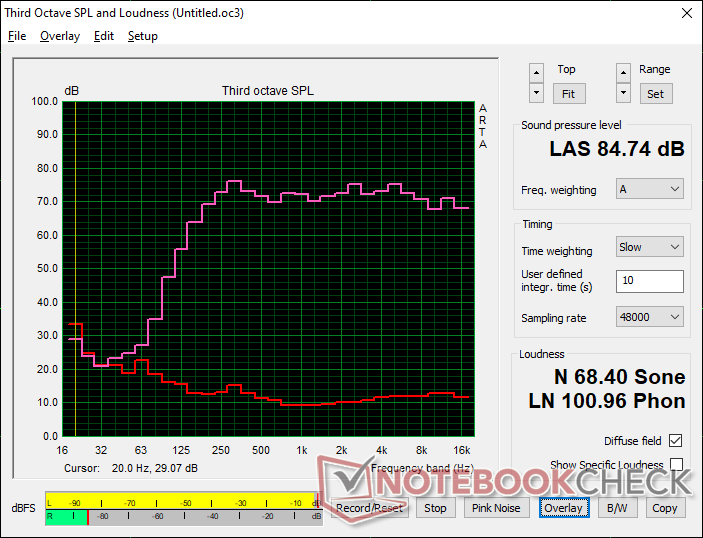
HP Elite Dragonfly G3 audio analysis
(+) | speakers can play relatively loud (84.7 dB)
Bass 100 - 315 Hz
(±) | reduced bass - on average 9.4% lower than median
(±) | linearity of bass is average (11.4% delta to prev. frequency)
Mids 400 - 2000 Hz
(+) | balanced mids - only 0.9% away from median
(+) | mids are linear (2.8% delta to prev. frequency)
Highs 2 - 16 kHz
(+) | balanced highs - only 2.1% away from median
(+) | highs are linear (3.9% delta to prev. frequency)
Overall 100 - 16.000 Hz
(+) | overall sound is linear (6.6% difference to median)
Compared to same class
» 0% of all tested devices in this class were better, 0% similar, 100% worse
» The best had a delta of 7%, average was 21%, worst was 53%
Compared to all devices tested
» 1% of all tested devices were better, 0% similar, 99% worse
» The best had a delta of 4%, average was 24%, worst was 134%
Apple MacBook Pro 16 2021 M1 Pro audio analysis
(+) | speakers can play relatively loud (84.7 dB)
Bass 100 - 315 Hz
(+) | good bass - only 3.8% away from median
(+) | bass is linear (5.2% delta to prev. frequency)
Mids 400 - 2000 Hz
(+) | balanced mids - only 1.3% away from median
(+) | mids are linear (2.1% delta to prev. frequency)
Highs 2 - 16 kHz
(+) | balanced highs - only 1.9% away from median
(+) | highs are linear (2.7% delta to prev. frequency)
Overall 100 - 16.000 Hz
(+) | overall sound is linear (4.6% difference to median)
Compared to same class
» 0% of all tested devices in this class were better, 0% similar, 100% worse
» The best had a delta of 5%, average was 18%, worst was 45%
Compared to all devices tested
» 0% of all tested devices were better, 0% similar, 100% worse
» The best had a delta of 4%, average was 24%, worst was 134%
Energy Management
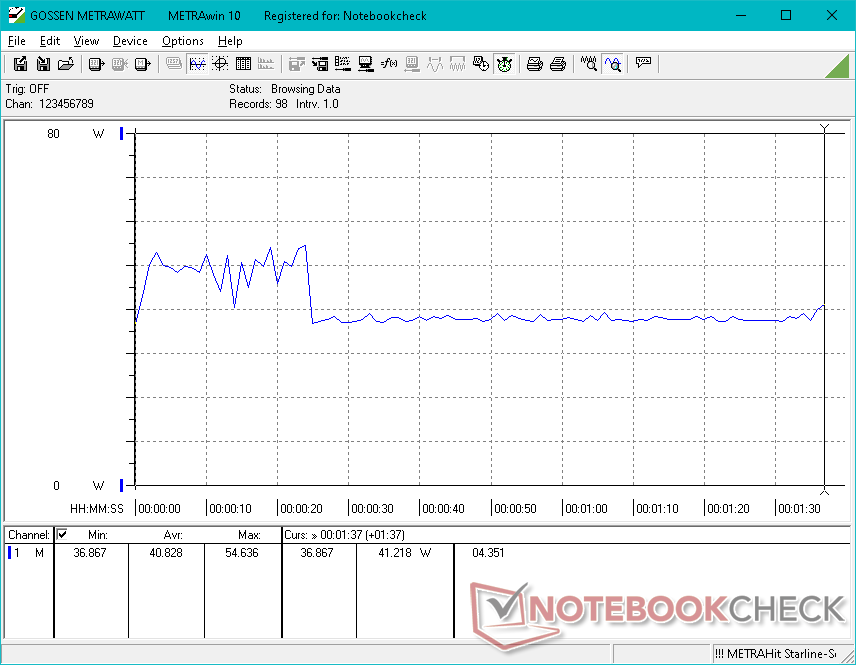
Power Consumption
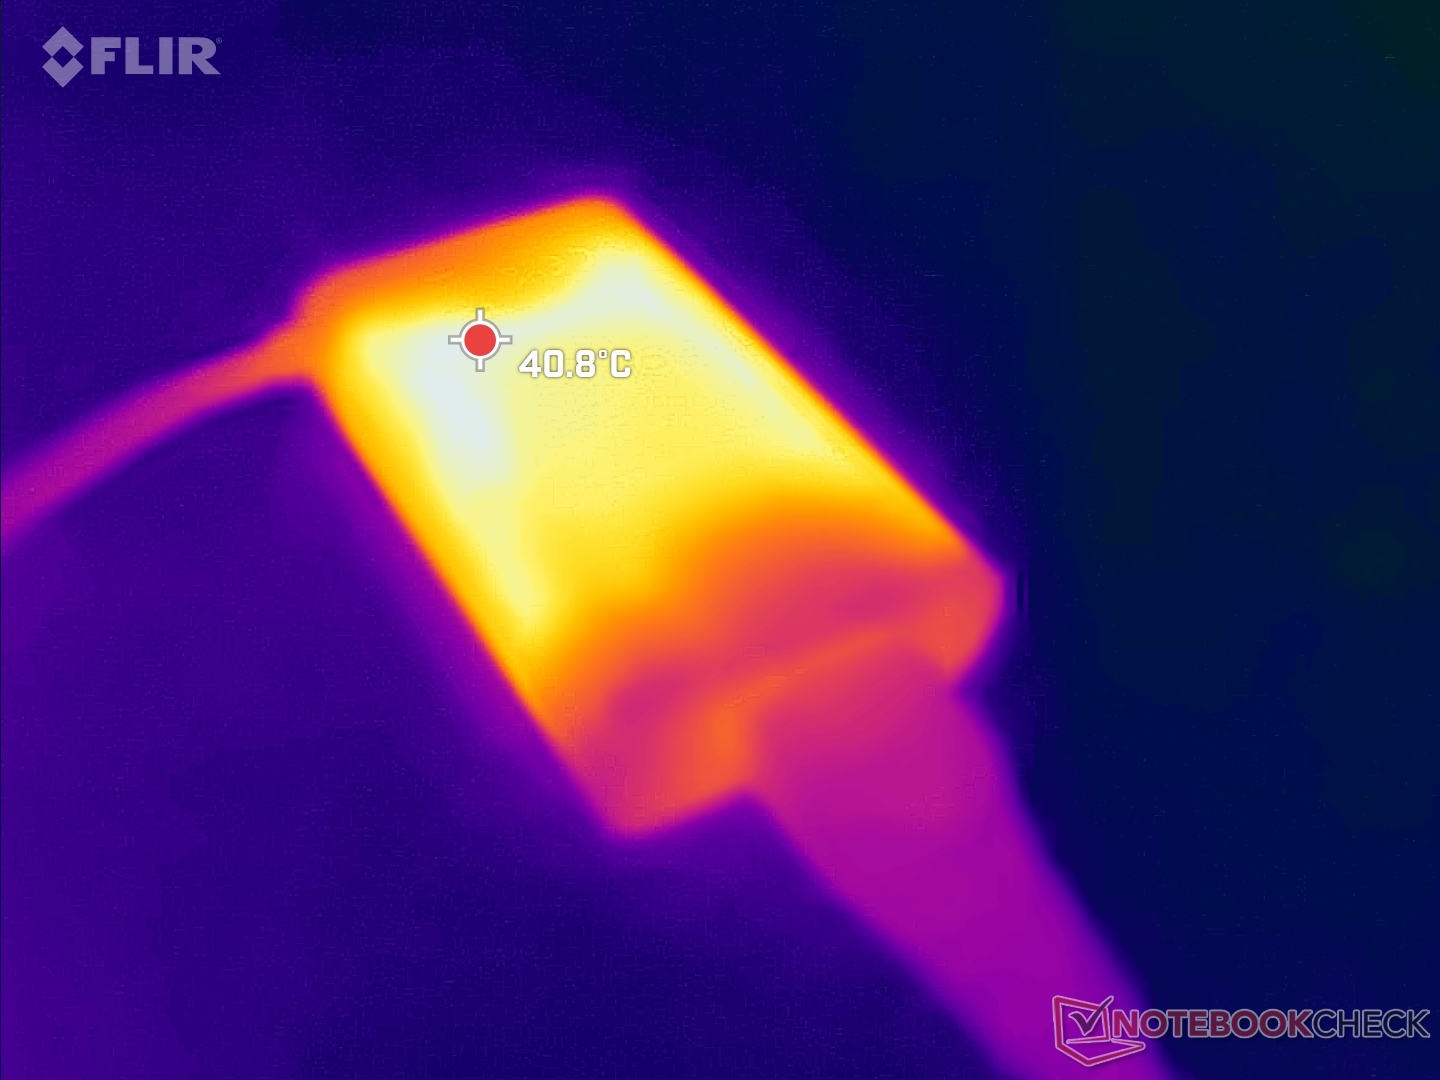
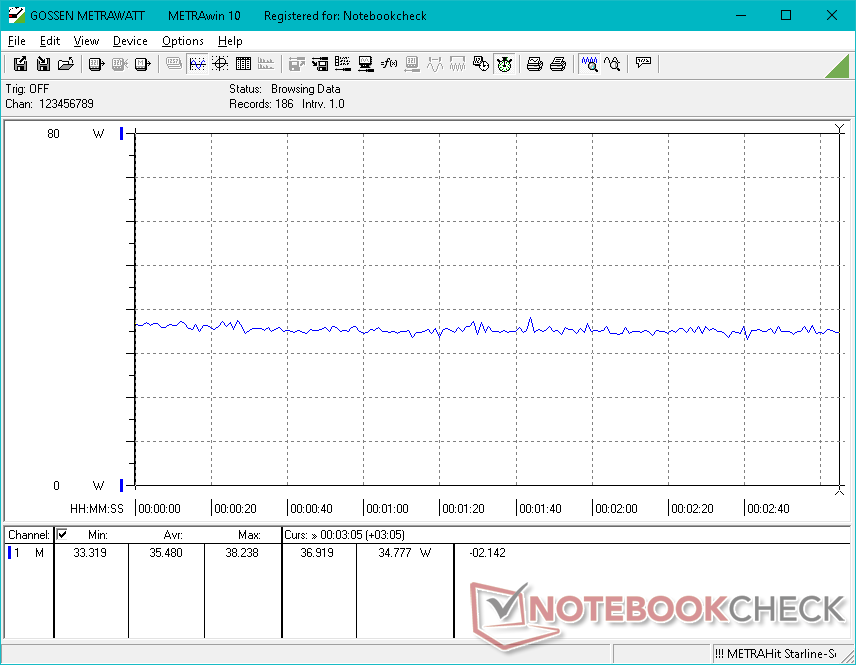
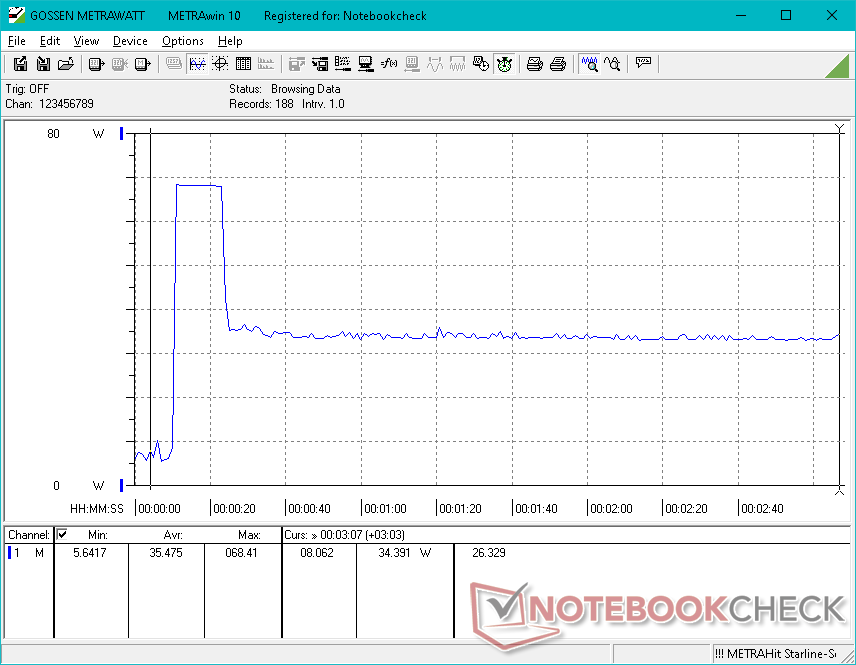
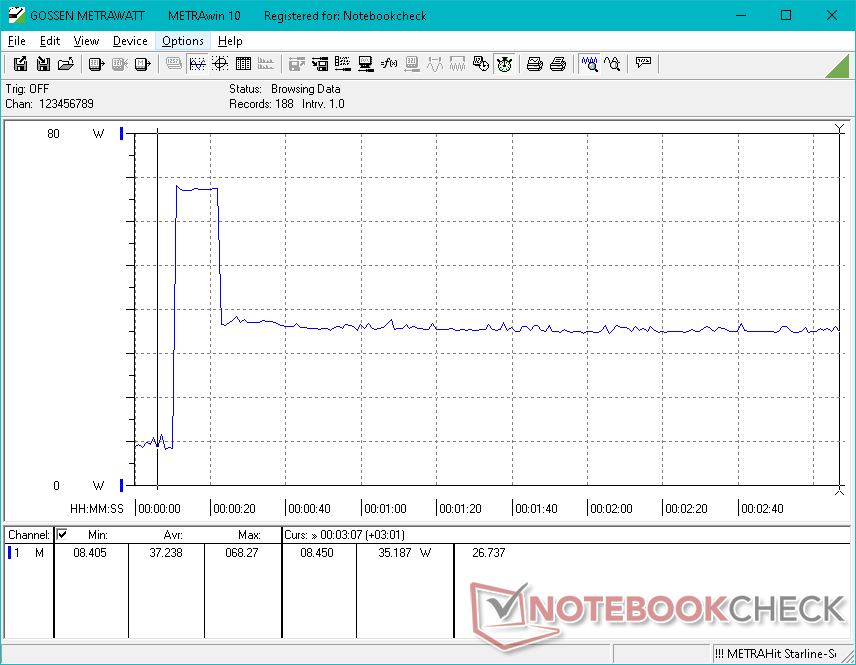
Power consumption is nearly identical to the Dell Latitude 7330 equipped with the same CPU when running undemanding loads like web browsing or video streaming. However, the Dell system is more demanding when running CPU-intensive tasks as it is able to sustain higher clock rates and TDP levels for longer than on the HP. Overall consumption is not all that different from the Spectre x360 14 running on the last generation Core i7-1165G7 despite the 15 to 30 percent increase in multi-thread performance.
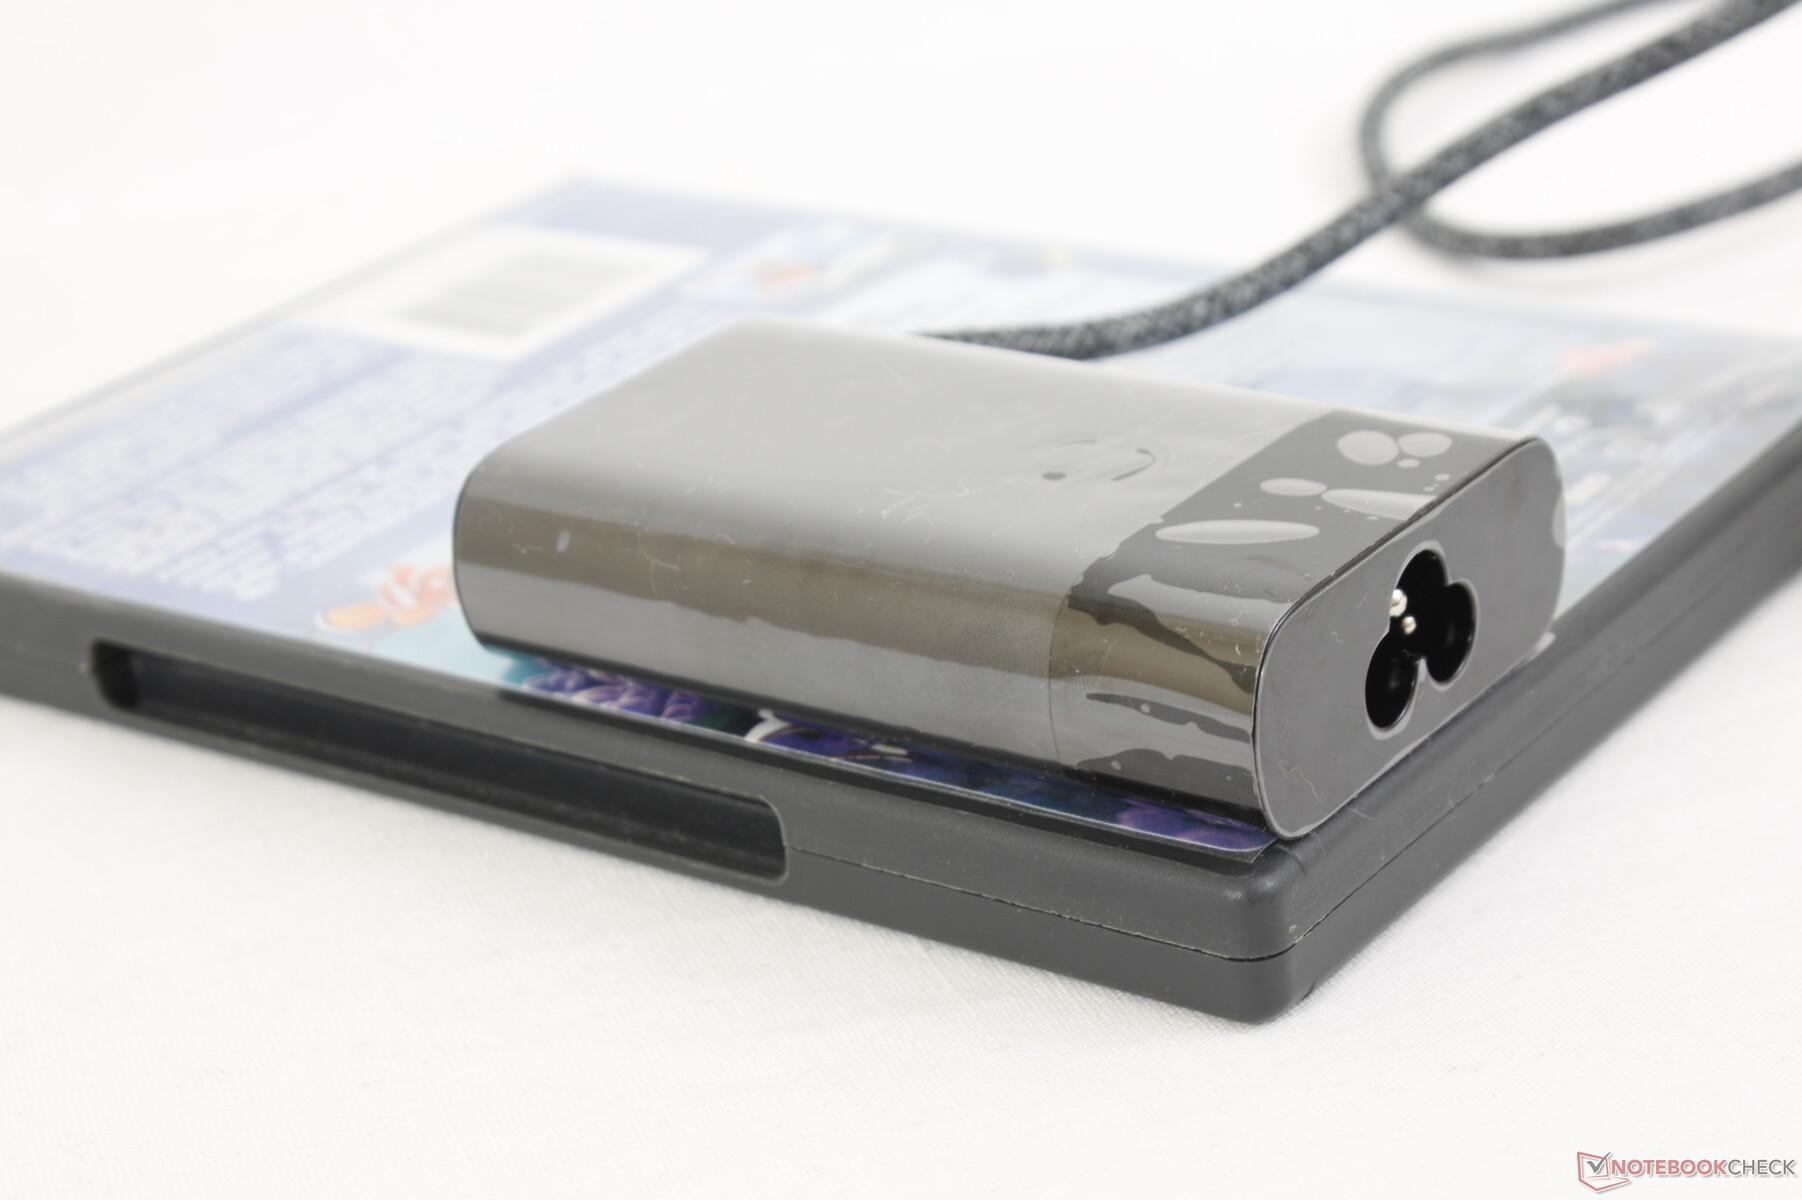
We're able to record a temporary maximum draw of 68.4 W from the small (~8.8 x 5.3 x 2.1 cm) 65 W AC adapter when the CPU is at 100 percent utilization. Thermal limitations prevent the CPU from running at its highest Turbo Boost clock rates for extended periods.
| Off / Standby | |
| Idle | |
| Load |
|
Key:
min: | |
| HP Elite Dragonfly G3 i7-1265U, Iris Xe G7 96EUs, Micron 3400 MTFDKBA512TFH 512GB, IPS, 1920x1280, 13.5" | HP Spectre x360 14t-ea000 i7-1165G7, Iris Xe G7 96EUs, Samsung SSD PM981a MZVLB512HBJQ, IPS, 1920x1280, 13.5" | Dell XPS 13 Plus 9320 i5-1240p i5-1240P, Iris Xe G7 80EUs, Micron 3400 MTFDKBA512TFH 512GB, IPS, 1920x1200, 13.4" | Framework Laptop 13.5 12th Gen Intel i7-1260P, Iris Xe G7 96EUs, WDC PC SN730 SDBPNTY-512G, IPS, 2256x1504, 13.5" | HP EliteBook Folio 13.5-3G2L2EA SD 8cx Gen 2 5G, Adreno 680, Toshiba XG6 KXG60ZNV512G, IPS, 1920x1280, 13.5" | Lenovo ThinkPad X1 Titanium Yoga G1 20QA001RGE i7-1160G7, Iris Xe G7 96EUs, Toshiba BG4 KBG40ZNT512G, IPS, 2256x1504, 13.5" | |
|---|---|---|---|---|---|---|
| Power Consumption | 9% | -70% | -34% | 46% | 0% | |
| Idle Minimum * | 3.4 | 3 12% | 10 -194% | 5.3 -56% | 2.3 32% | 3.9 -15% |
| Idle Average * | 5.6 | 5.1 9% | 12.3 -120% | 8.4 -50% | 3.7 34% | 7.3 -30% |
| Idle Maximum * | 8.4 | 6.4 24% | 15.5 -85% | 11.2 -33% | 5.6 33% | 10.3 -23% |
| Load Average * | 40.8 | 39.6 3% | 43 -5% | 57.4 -41% | 13 68% | 30.6 25% |
| Witcher 3 ultra * | 35.5 | 39.6 -12% | 43.1 -21% | 46.7 -32% | 25.5 28% | |
| Load Maximum * | 68.4 | 56.2 18% | 62.8 8% | 61.2 11% | 25 63% | 57.1 17% |
* ... smaller is better
Power Consumption Witcher 3 / Stresstest
Power Consumption external Monitor
Battery Life — Long Runtimes
Battery capacity has increased from 56 Wh on the Dragonfly Max to 68 Wh on the Dragonfly G3. WLAN runtime is nonetheless just slightly longer at almost 12 hours.
Charging from empty to full takes about 90 minutes. The USB-C AC adapter can be used to Quick Charge other USB-C devices as well including smartphones and tablets.
| HP Elite Dragonfly G3 i7-1265U, Iris Xe G7 96EUs, 68 Wh | HP Spectre x360 14t-ea000 i7-1165G7, Iris Xe G7 96EUs, 66 Wh | Dell XPS 13 Plus 9320 i5-1240p i5-1240P, Iris Xe G7 80EUs, 55 Wh | Framework Laptop 13.5 12th Gen Intel i7-1260P, Iris Xe G7 96EUs, 55 Wh | HP EliteBook Folio 13.5-3G2L2EA SD 8cx Gen 2 5G, Adreno 680, 46 Wh | Lenovo ThinkPad X1 Titanium Yoga G1 20QA001RGE i7-1160G7, Iris Xe G7 96EUs, 44.5 Wh | |
|---|---|---|---|---|---|---|
| Battery Runtime | -12% | -43% | -37% | 22% | -37% | |
| Reader / Idle | 2268 | 2185 -4% | ||||
| WiFi v1.3 | 706 | 707 0% | 480 -32% | 447 -37% | 874 24% | 506 -28% |
| Load | 209 | 145 -31% | 96 -54% | 251 20% | 112 -46% | |
| H.264 | 685 |
Pros
Cons
Verdict — Maximizing Functionality, Features, And Looks
The Dragonfly G3 addresses one of our biggest complaints about the Dragonfly G2 by moving the series away from the 16:9 form factor and towards a 3:2 aspect ratio. 16:9 works well for consumer-based laptops and most video playback, but 3:2 or 16:10 are usually more appropriate for the target audience of office users and professionals.
Other than the visual overhaul, the webcam in particular deserves praise for being one of the best we've seen on any laptop. 5 MP may sound measly to smartphone users, but this is quite literally 5x the resolution (!) of the webcams on most other laptops these days. If you value video quality and do a lot of video conferencing, then look no further than the Dragonfly G3. Additional highlights include the quieter fans, very large clickpad, fast SSD performance with no performance throttling, and excellent audio quality for its size class.
The Dragonfly G3 looks great and feels even better to use. However, CPU performance hunters may want to look elsewhere as TDP targets are relatively low on the HP.
The big asterisk atop the Dragonfly G3 relates to its processor performance. When the competing Dell Latitude 9430 2-in-1 is able to run the exact same Core i7-1265U CPU 50 percent faster, then that's when you know you're not getting the full benefits of 12th gen Intel out of the HP model. Fan noise is quieter for sure, but we would have preferred an option to allow for louder fans if it had meant faster performance for those who need it.
For next year's model, we would love to see Sure View be detached from the 1000-nit panel option. You'll have to accept them as a pair as of this writing if configuring with one or the other. Additionally, higher displays refresh rate options like those found on the Asus ZenBook series would improve the user experience. A stiffer lid and longer 36-month base warranty would go a long way to improving sturdiness and longevity, respectively.
Price and Availability
The HP Elite Dragonfly G3 is not yet widely available on Amazon, Best Buy, or other major retail outlets. We recommend purchasing directly from HP for the most configurable options. Base configurations start at $1999 USD while our specific configuration retails for just under $2700.
HP Elite Dragonfly G3
- 08/28/2022 v7 (old)
Allen Ngo
More articles related to this device
HP Elite Dragonfly G3 (Elite Dragonfly Series)Related Articles


Price comparison
