Intel Core i7-1265U debut: Dell Latitude 13 7330 1 kg laptop review
Not to be confused with the Dell Latitude 7330 Rugged, the Latitude 7330 is your more traditional laptop for offices and businesses. It comes in both clamshell and convertible 2-in-1 options each with similar Intel 12th gen Core-U CPU options, ports, and overall chassis design but with different display and chassis material options to choose from. We recommend checking out the product page or the publicly available technical PDF for the Latitude 7330 as it offers more configurable options than most other laptops ranging from different webcams, battery sizes, WAN, and even MicroSD readers.
Our specific review unit is the Magnesium alloy Latitude 7330 clamshell targeting a weight of just 1 kg to be one of the lightest 13.3-inch business laptops in the market. A few other laptops have also promised similar super lightweight designs in the past such as the LG Gram series, Samsung Galaxy Book Pro series, HP Elite Dragonfly, or the Toshiba Portege Z series all of which serve as alternatives to the Latitude 7330. Our configuration as reviewed retails for approximately $2000 USD.
More Dell reviews:
Potential Competitors in Comparison
Rating | Date | Model | Weight | Height | Size | Resolution | Price |
|---|---|---|---|---|---|---|---|
| 89 % v7 (old) | 07 / 2022 | Dell Latitude 13 7330 i7-1265U, Iris Xe G7 96EUs | 1 kg | 16.96 mm | 13.30" | 1920x1080 | |
| 87.9 % v7 (old) | 10 / 2020 | Lenovo ThinkPad X13 Yoga 20SX0004GE i7-10510U, UHD Graphics 620 | 1.3 kg | 15.95 mm | 13.30" | 1920x1080 | |
| 85.1 % v7 (old) | 07 / 2022 | Framework Laptop 13.5 12th Gen Intel i7-1260P, Iris Xe G7 96EUs | 1.3 kg | 15.85 mm | 13.50" | 2256x1504 | |
| 86.6 % v7 (old) | 12 / 2020 | Razer Book 13 FHD i7-1165G7, Iris Xe G7 96EUs | 1.4 kg | 15.15 mm | 13.40" | 1920x1200 | |
| 89.4 % v7 (old) | 07 / 2020 | Dell Latitude 7310 i7-10610U, UHD Graphics 620 | 1.2 kg | 18.3 mm | 13.30" | 1920x1080 | |
| 85.2 % v7 (old) | 05 / 2021 | Microsoft Surface Laptop 4 13 Ryzen 5 R5 4680U, Vega 7 | 1.3 kg | 14 mm | 13.50" | 2256x1504 |
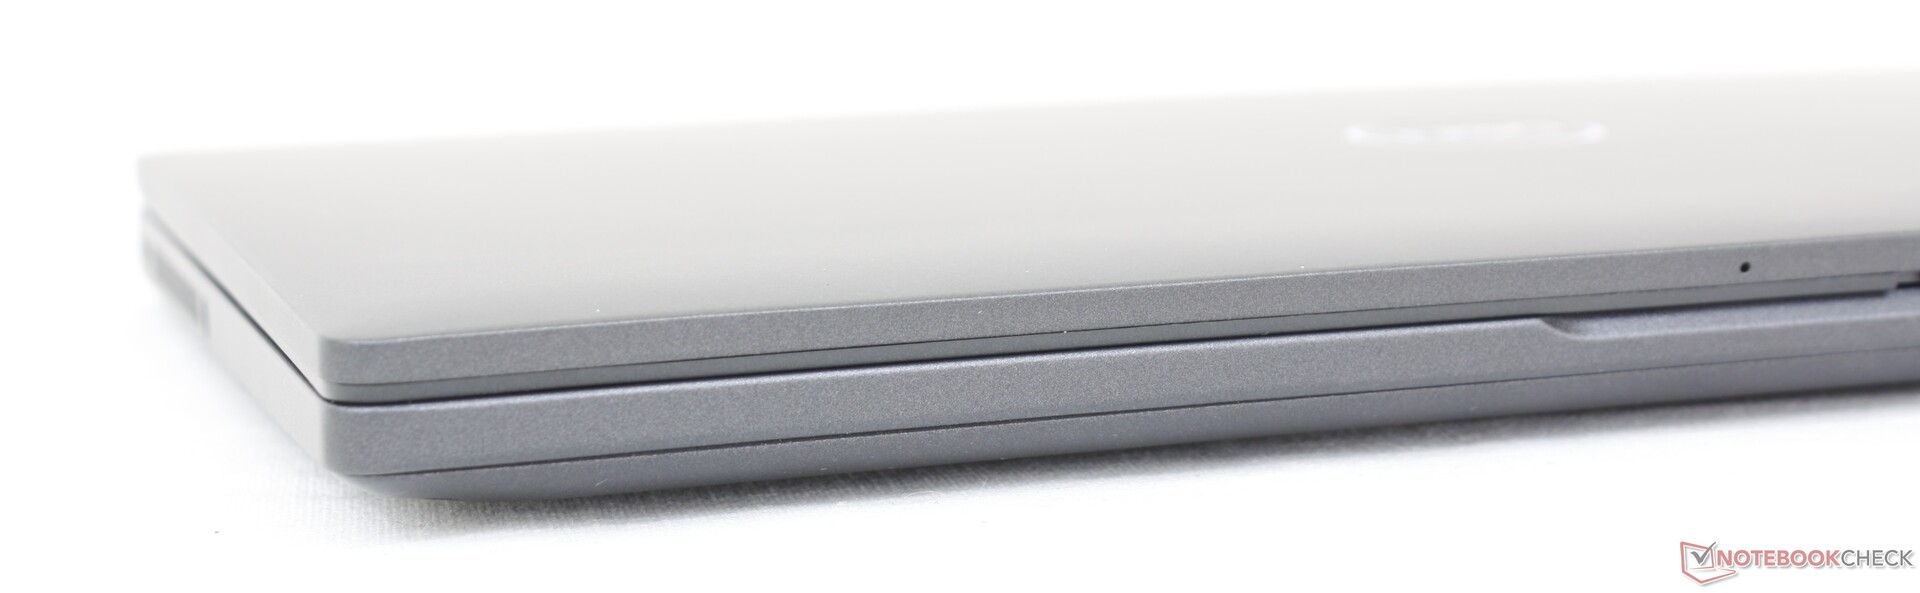
Case — Three Different Options
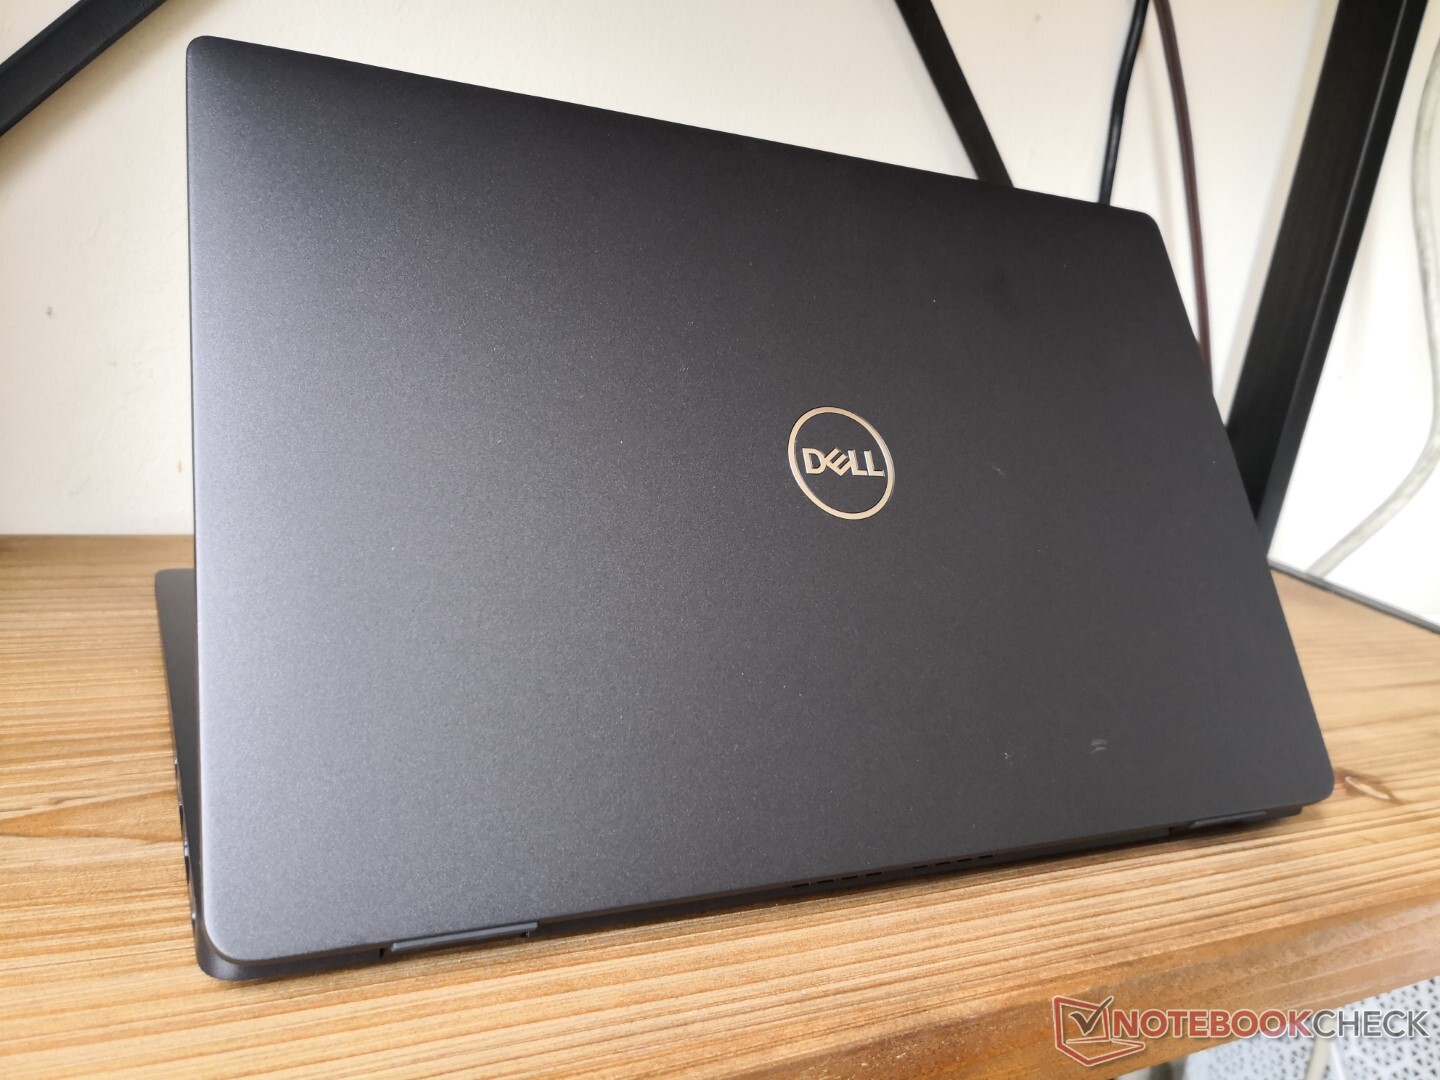
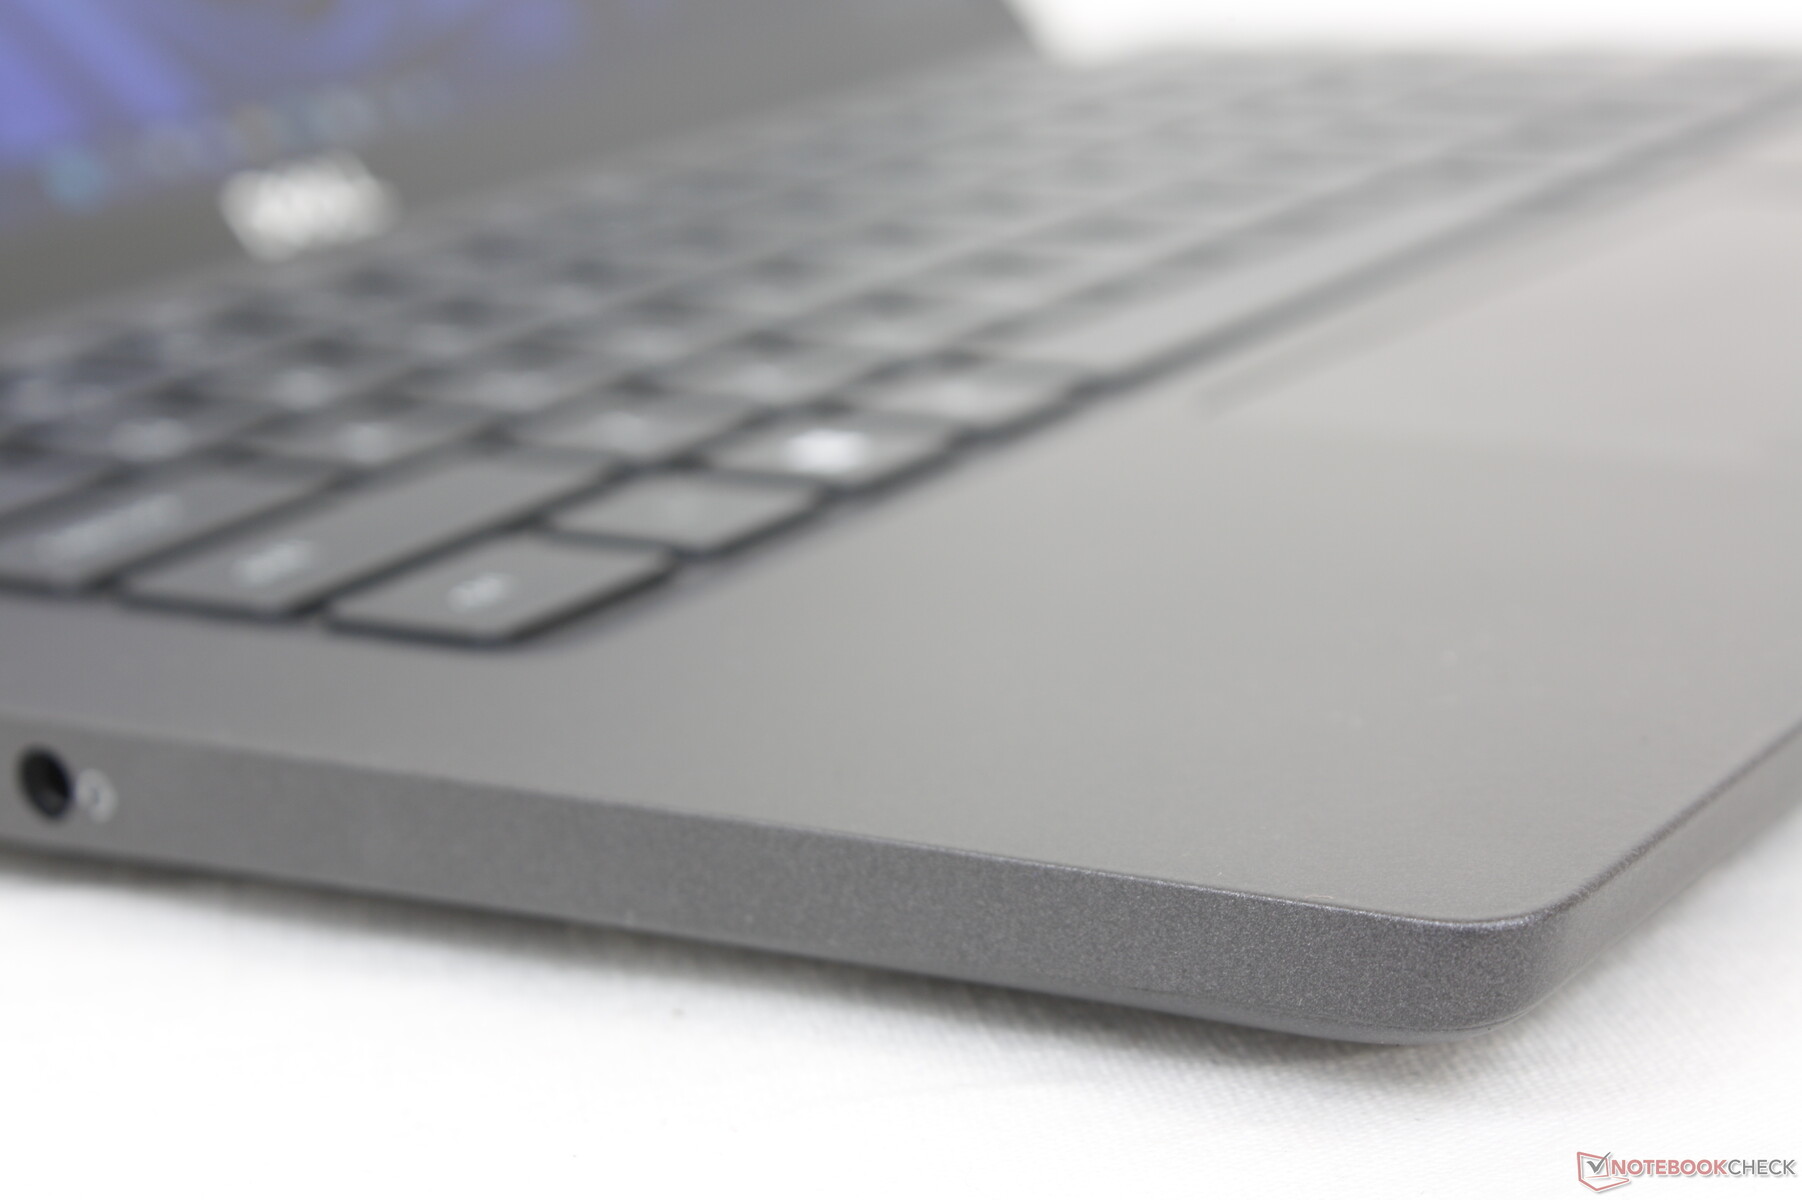
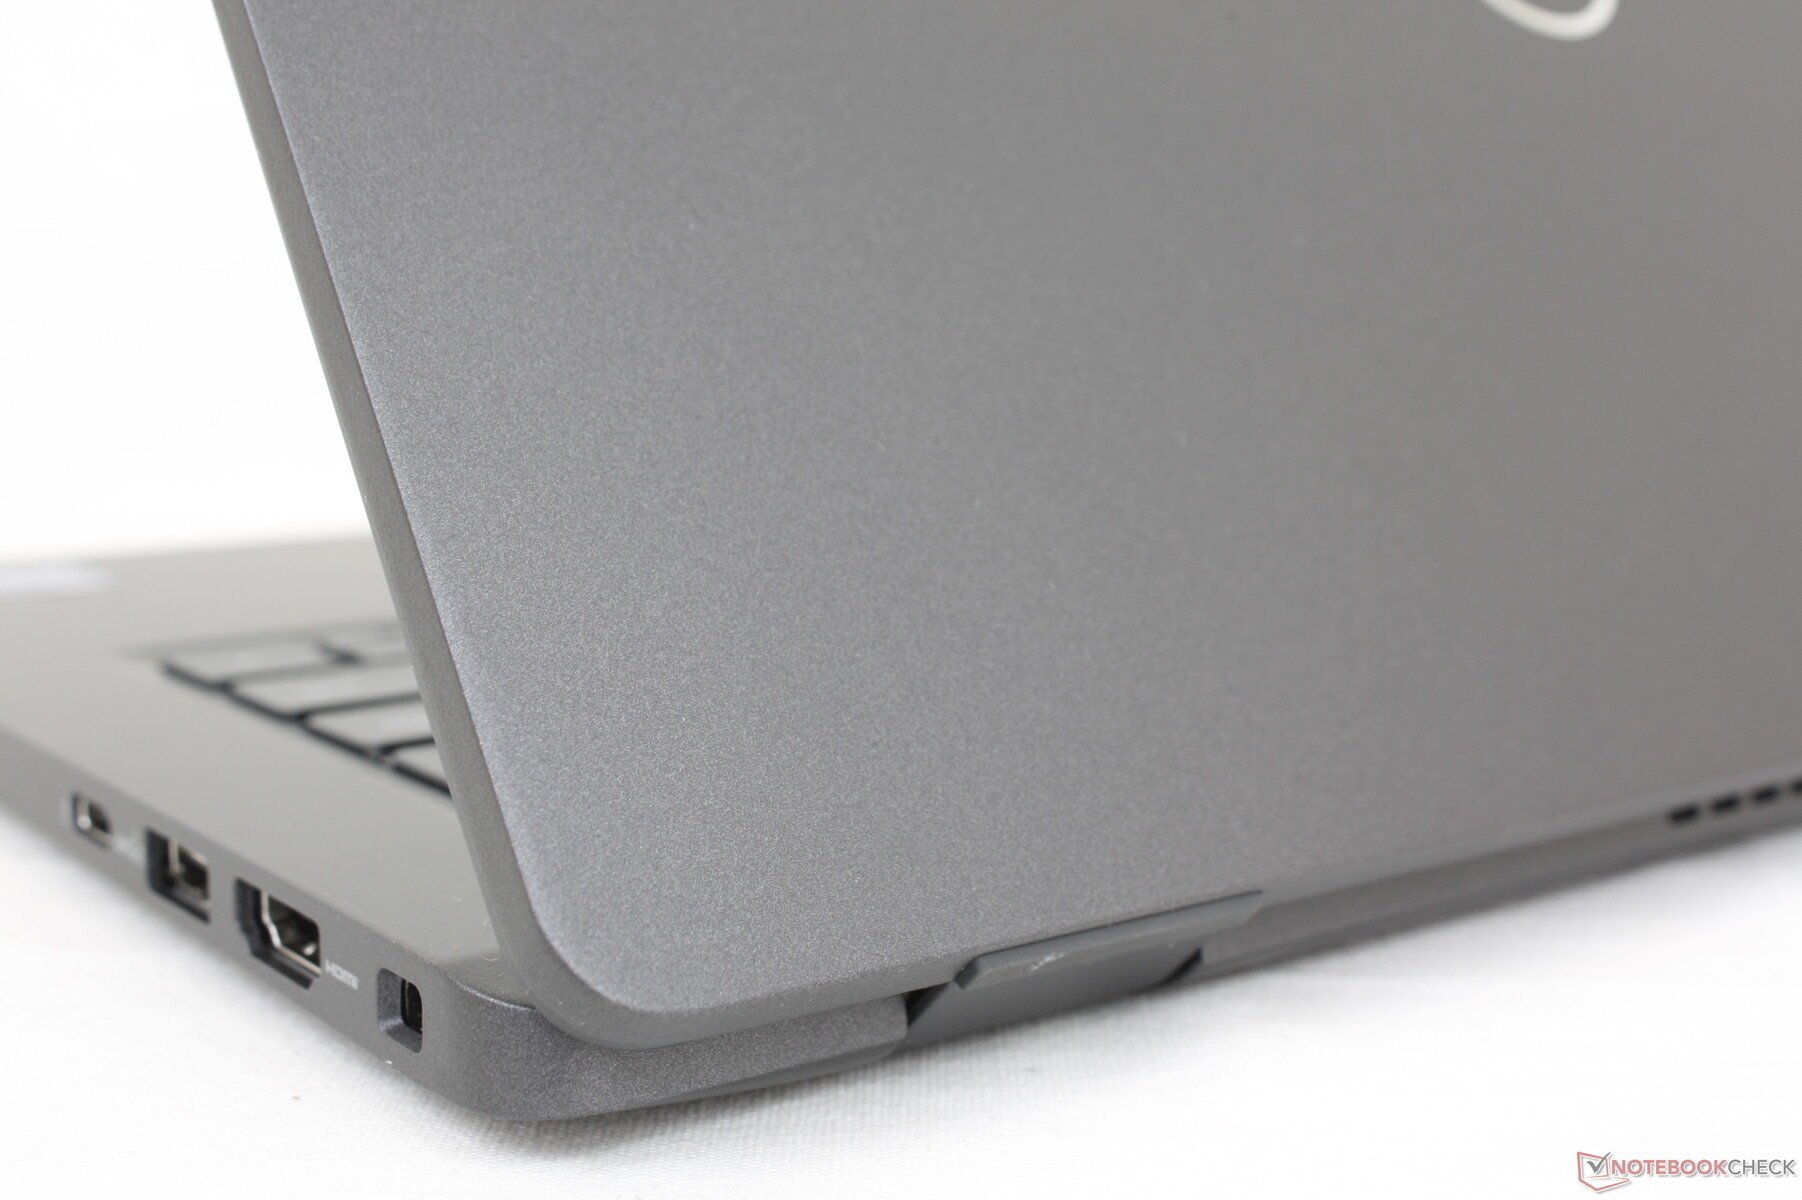
13-inch laptops promising to be 1 kg or even lighter already exist, but they almost always come with some caveats. Most notably, such models typically show much more flexing for an overall weaker impression when it comes to durability. Spend just a minute with the LG Gram 13 compared to the heavier Dell XPS 13 9310 and the thinness differences in their skeletons become immediately noticeable. The Latitude 7330 has somehow avoided the trend by being more rigid than expected for a 1 kg build. The base, for example, doesn't twist or bend nearly as much as on the aforementioned LG. Overall rigidity lies somewhere in between the Gram 13 and XPS 13 which we consider to be a fair tradeoff if you value the superlight weight.
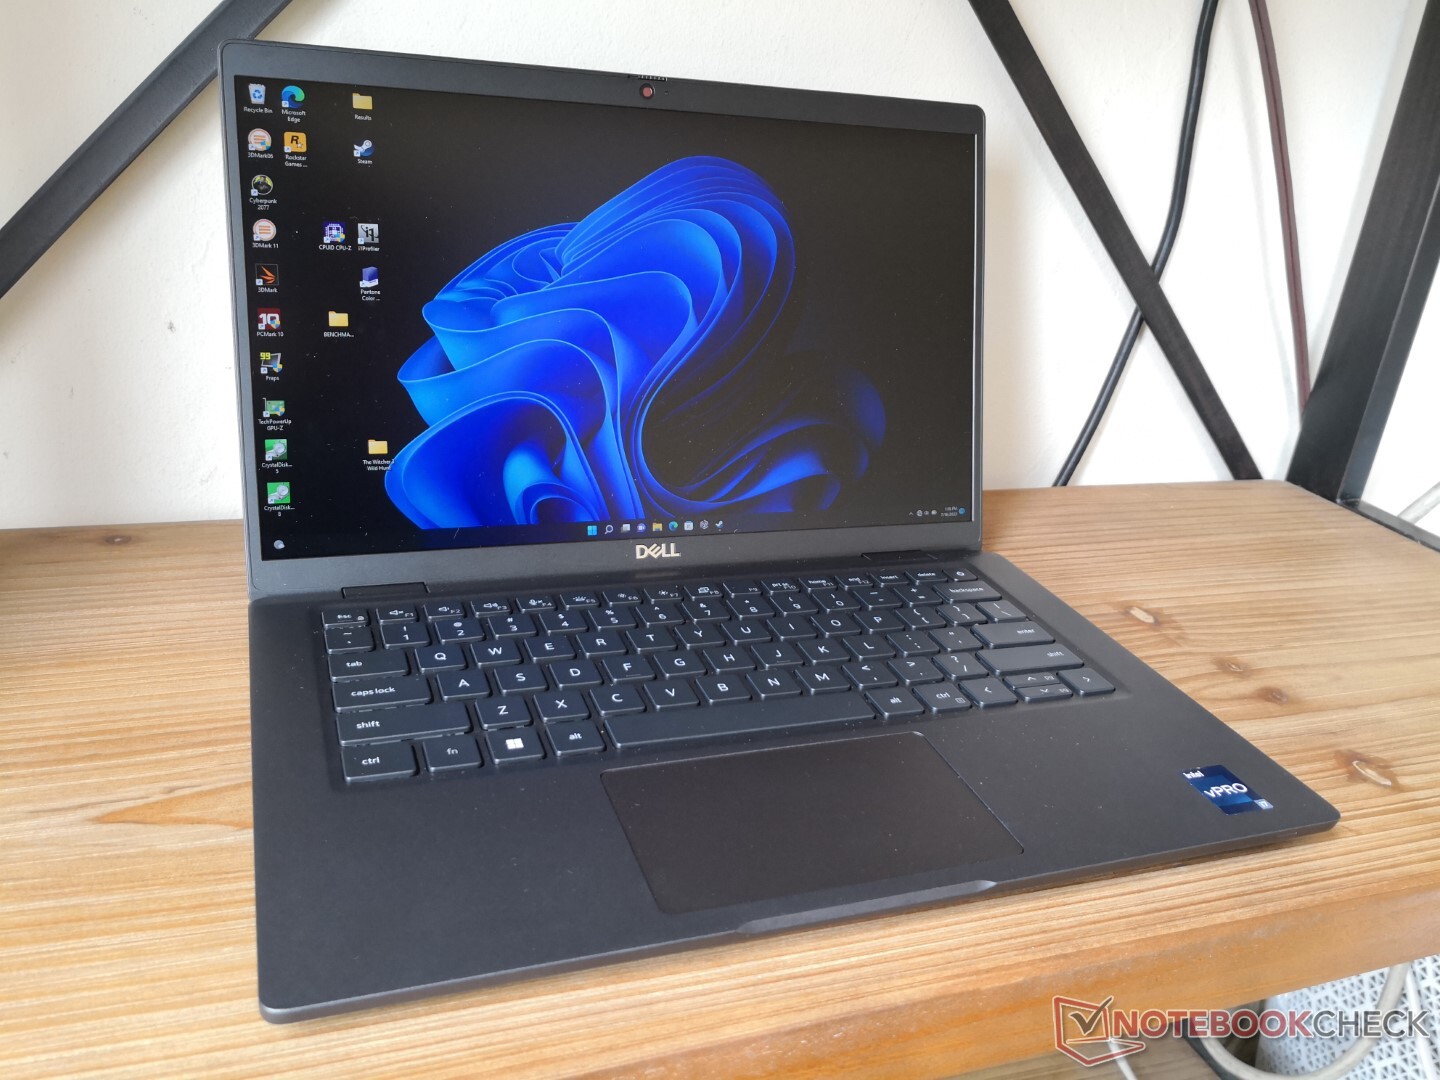
The very low weight of just 1 kg is the main selling point of the magnesium alloy option. Most subnotebooks in this size category are typically a few hundred grams heavier to be very noticeable when traveling or working on-the-go. Overall dimensions are just slightly smaller than with the Latitude 7310 which was already quite small.
Opting for the carbon fiber or aluminum options instead will entail a weight increase of about 160 g and 240 g, respectively, over our magnesium option.
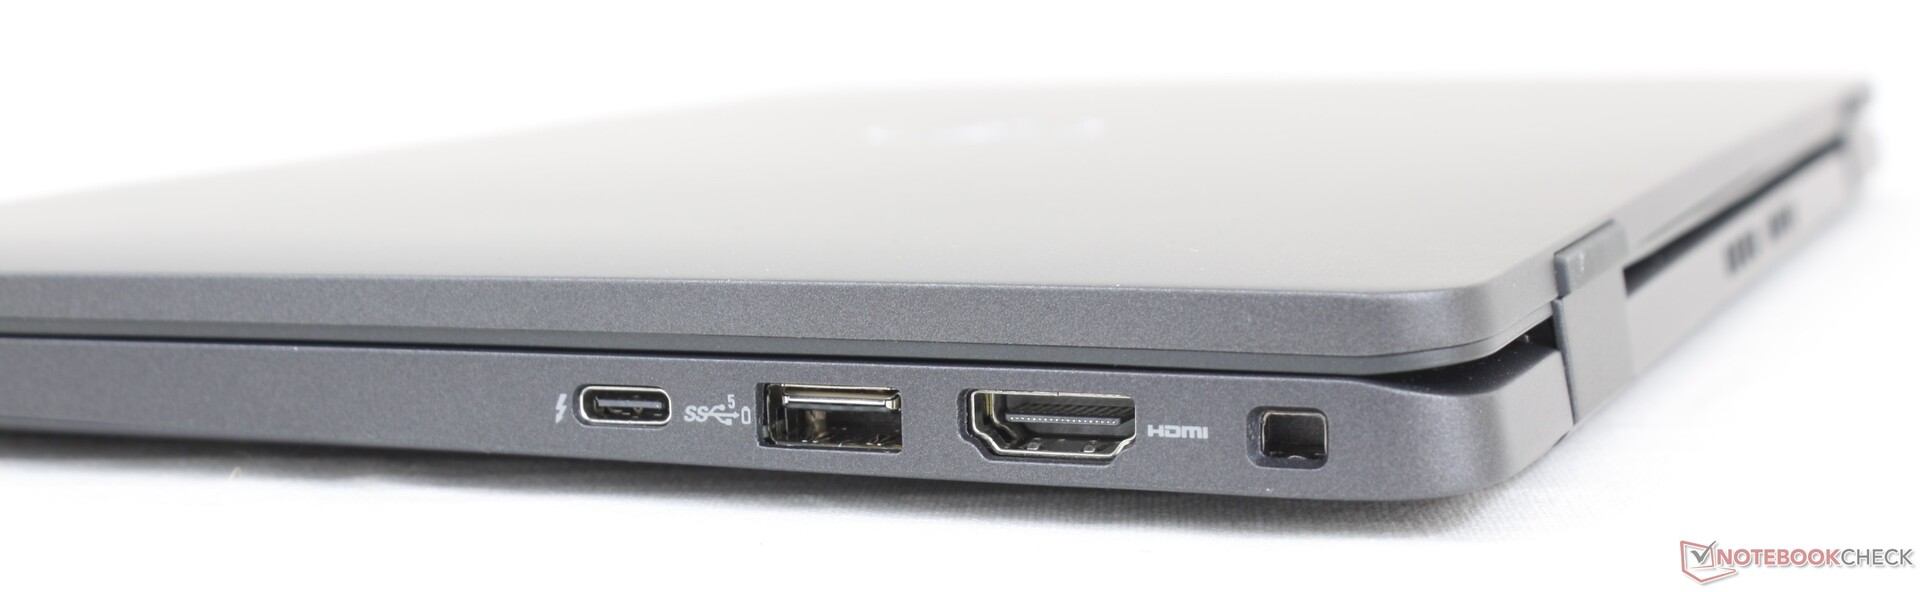
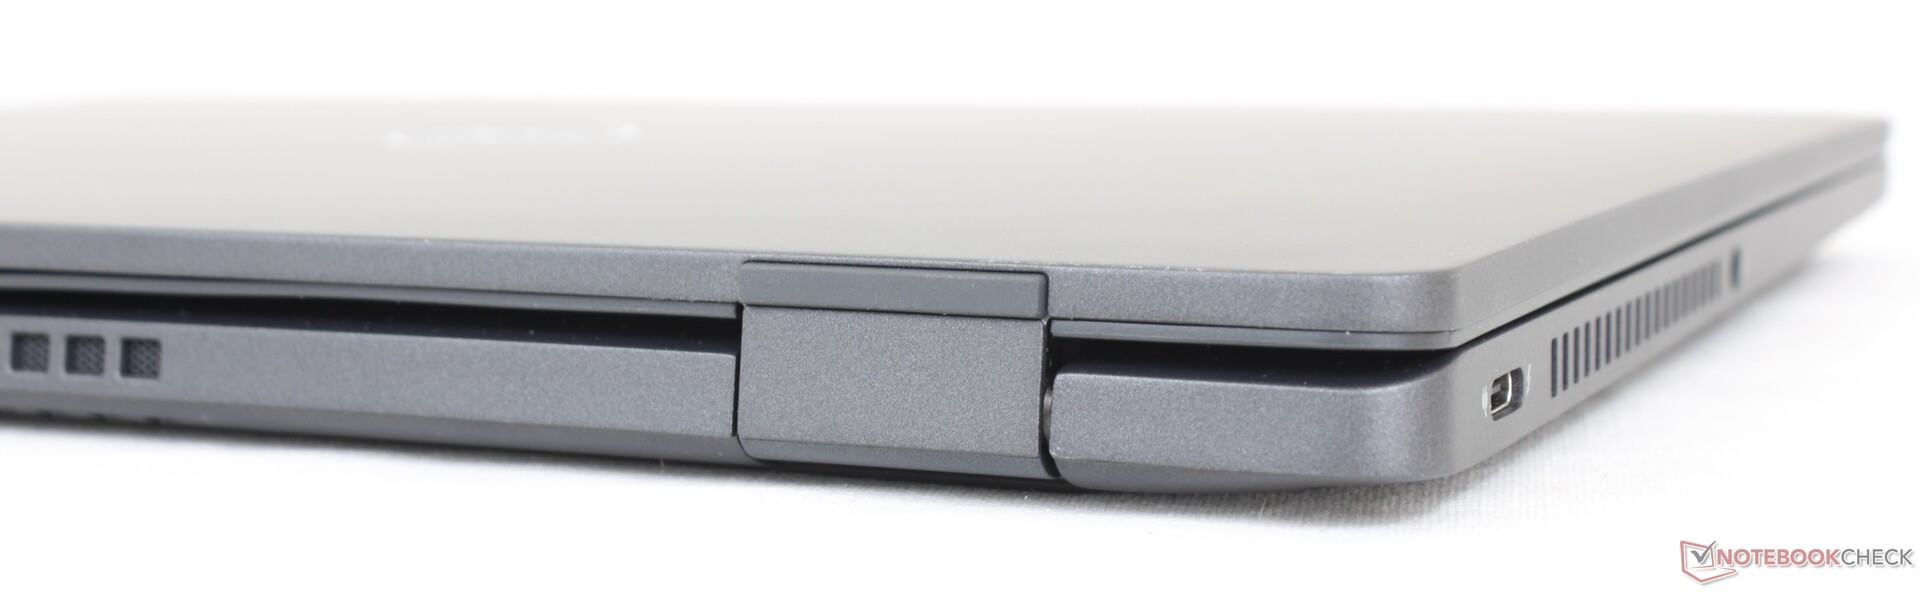
Connectivity — Thunderbolt 4 Support
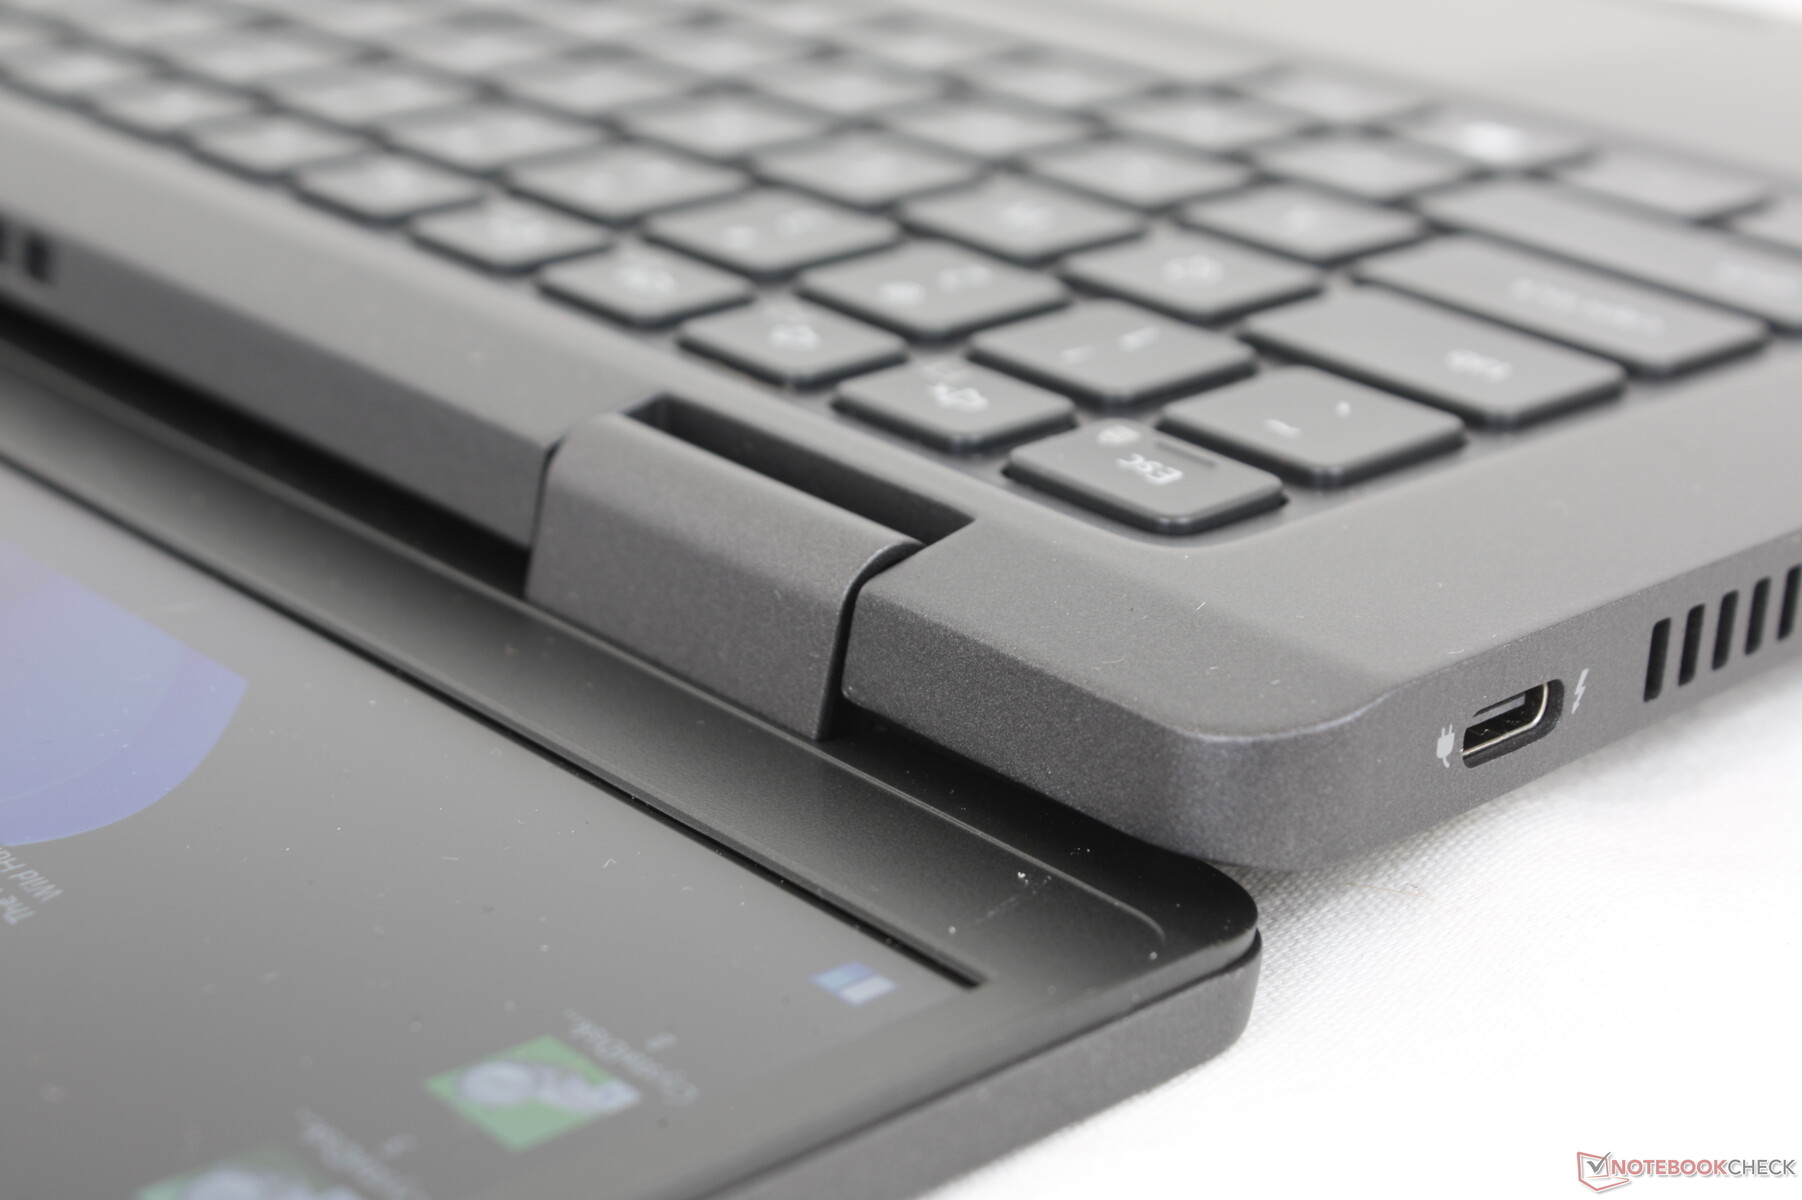
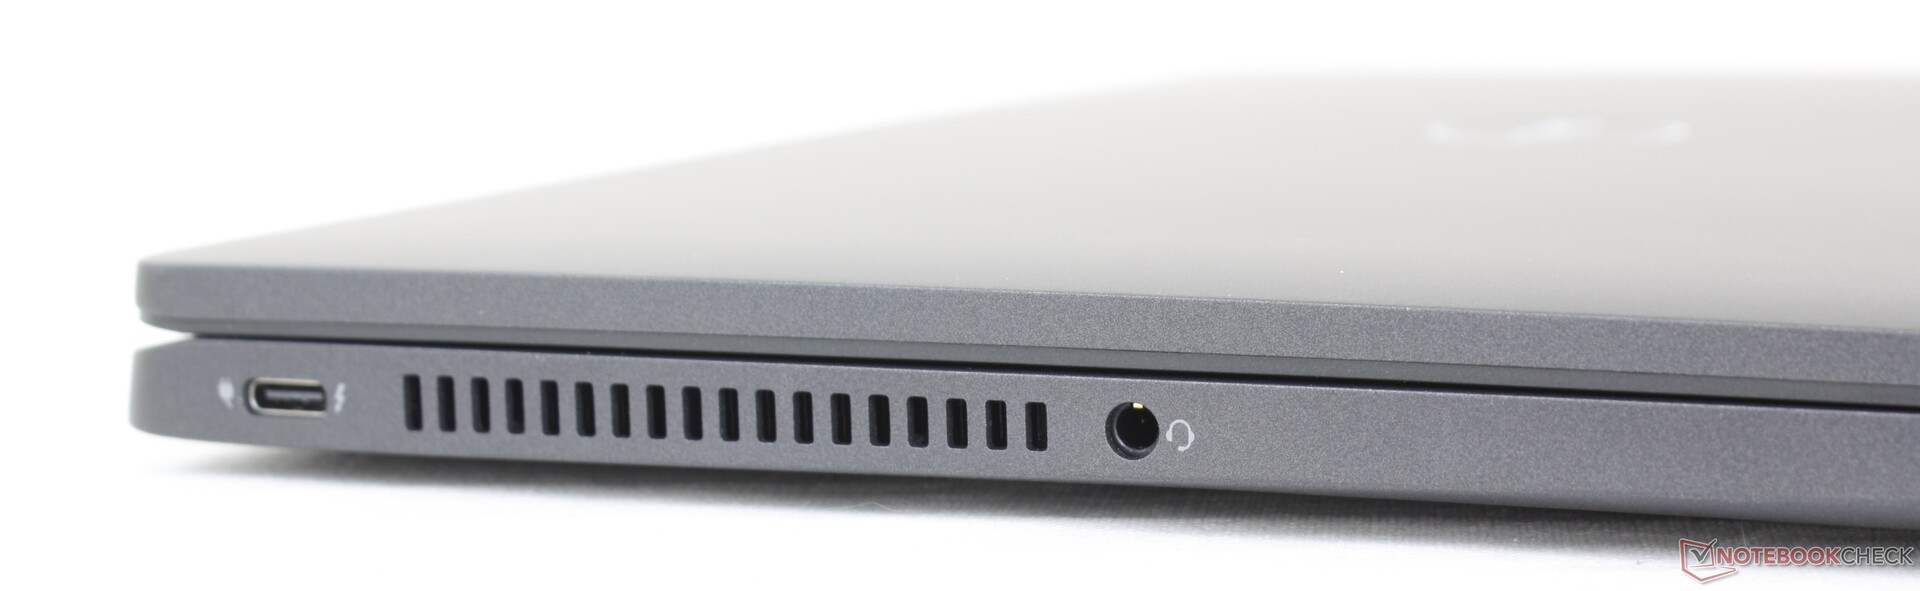
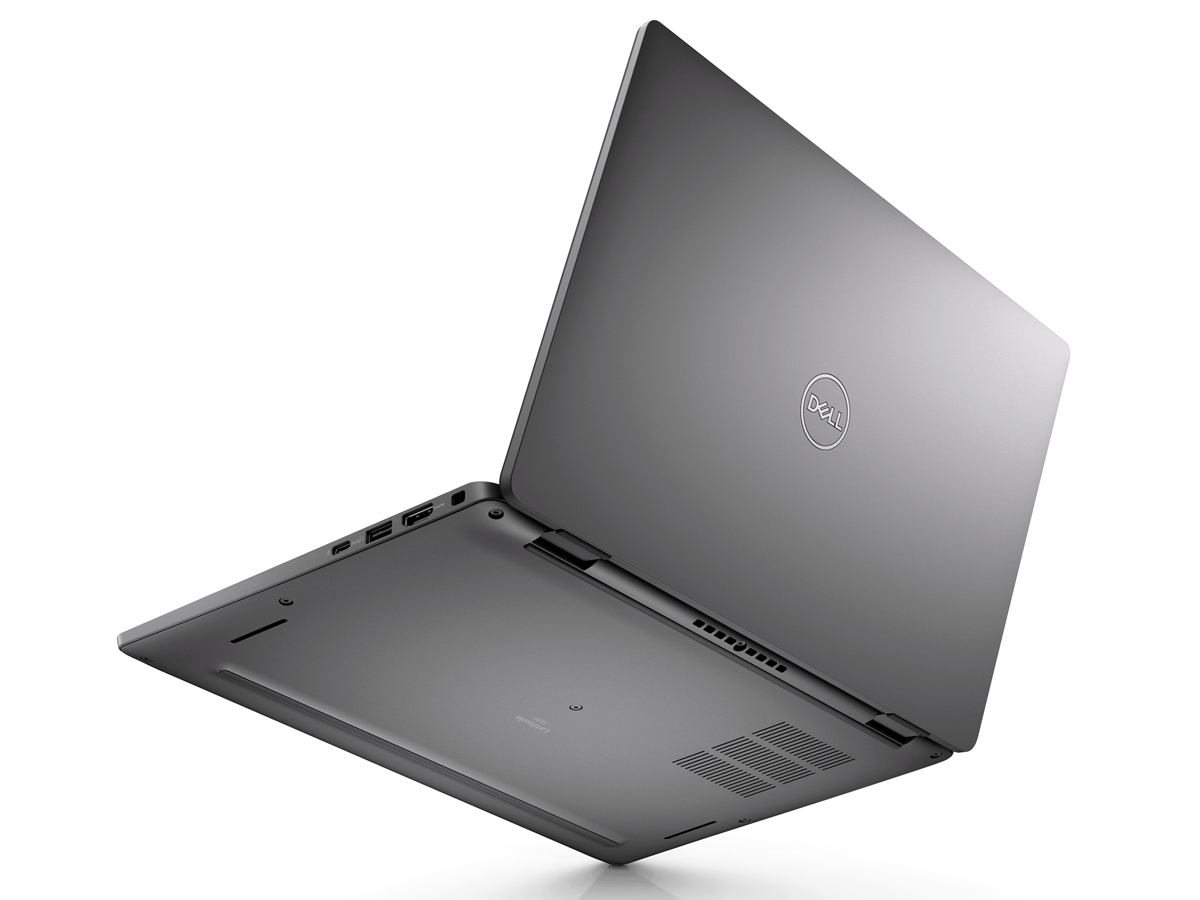
Port options are the same as they were on the Latitude 7310 but rearranged to improve convenience. The two USB-C ports, for example, are now each along the left and righthand edges of the chassis, respectively, compared to only the left edge on the older model. This change allows users to charge the laptop from either side.
Communication — Optional LTE
The Intel AX211 comes standard for Wi-Fi 6E and Bluetooth 5.2 connectivity. We experienced no major connectivity issues when paired to our 6 GHz network. The performance differences between Wi-Fi 6 and Wi-Fi 6E will be minimal to most users.
Though our unit doesn't come configured with WAN, users have to option to configure with an eSIM-enabled Qualcomm Snapdragon X20 LTE-A CAT 9 or CAT 16 module.
| Networking | |
| iperf3 transmit AX12 | |
| Microsoft Surface Laptop 4 13 Ryzen 5 | |
| Dell Latitude 7310 | |
| Razer Book 13 FHD | |
| Lenovo ThinkPad X13 Yoga 20SX0004GE | |
| iperf3 receive AX12 | |
| Razer Book 13 FHD | |
| Microsoft Surface Laptop 4 13 Ryzen 5 | |
| Dell Latitude 7310 | |
| Lenovo ThinkPad X13 Yoga 20SX0004GE | |
| iperf3 receive AXE11000 6GHz | |
| Framework Laptop 13.5 12th Gen Intel | |
| Dell Latitude 13 7330 | |
| iperf3 transmit AXE11000 6GHz | |
| Dell Latitude 13 7330 | |
| Framework Laptop 13.5 12th Gen Intel | |
Webcam
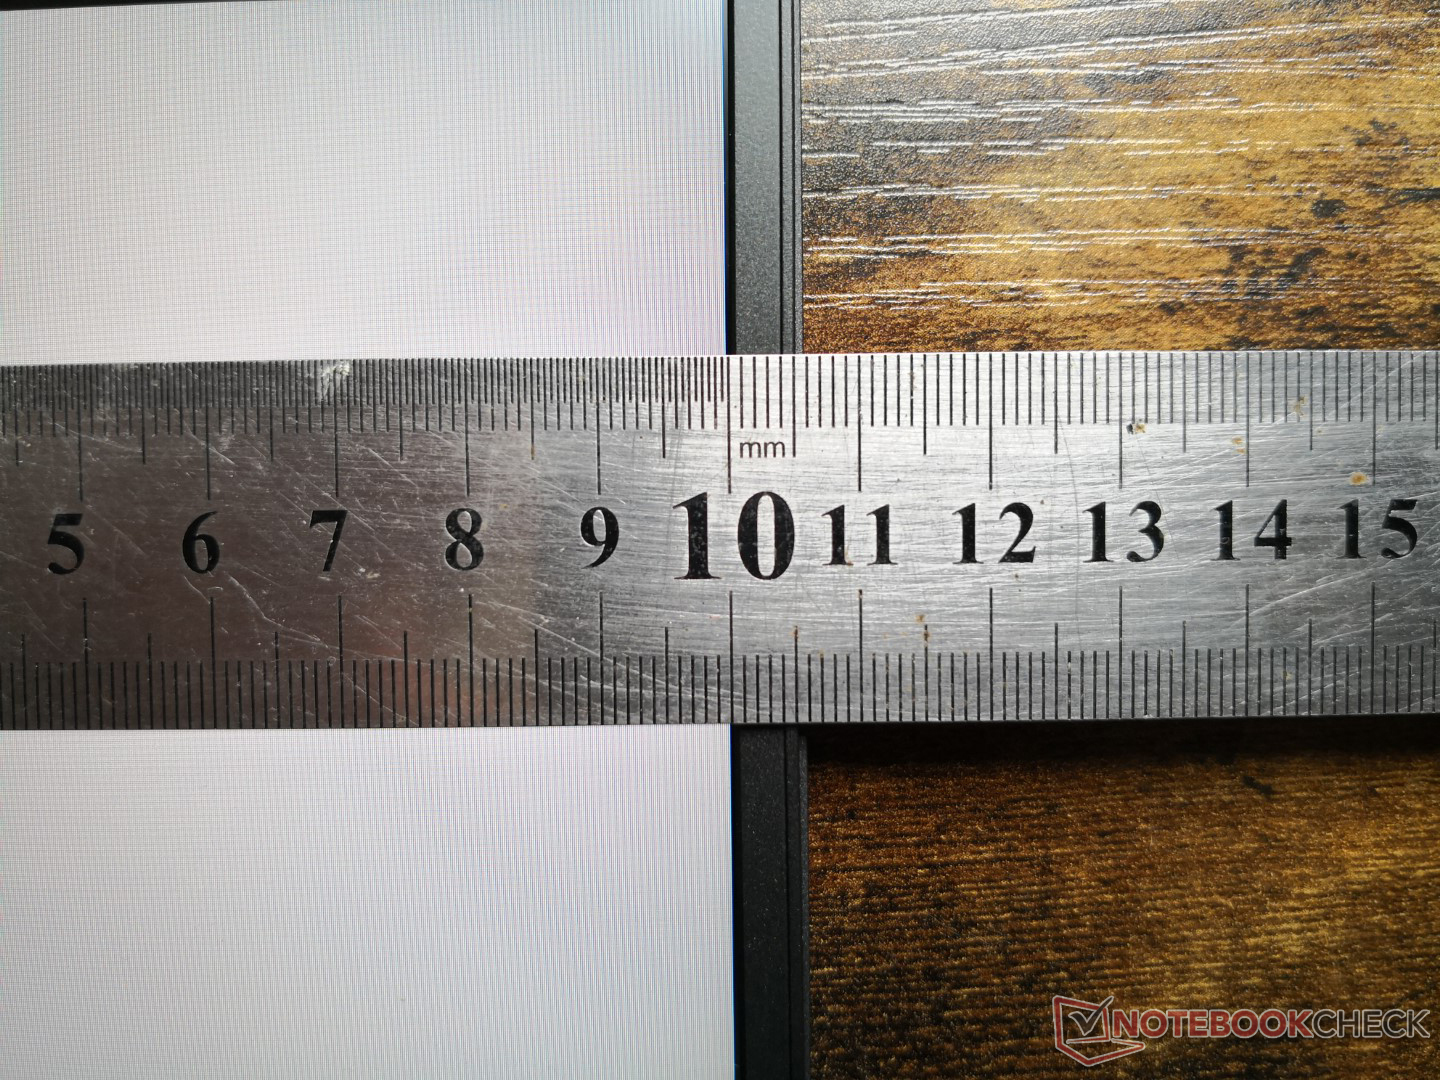
Users can configure between an HD (720p) or FHD (1080p) webcam with optional IR for Windows Hello support. We recommend upgrading to 1080p as the picture quality from our 720p configuration is blurry and brutally outdated.
A manual shutter slider is installed for privacy.


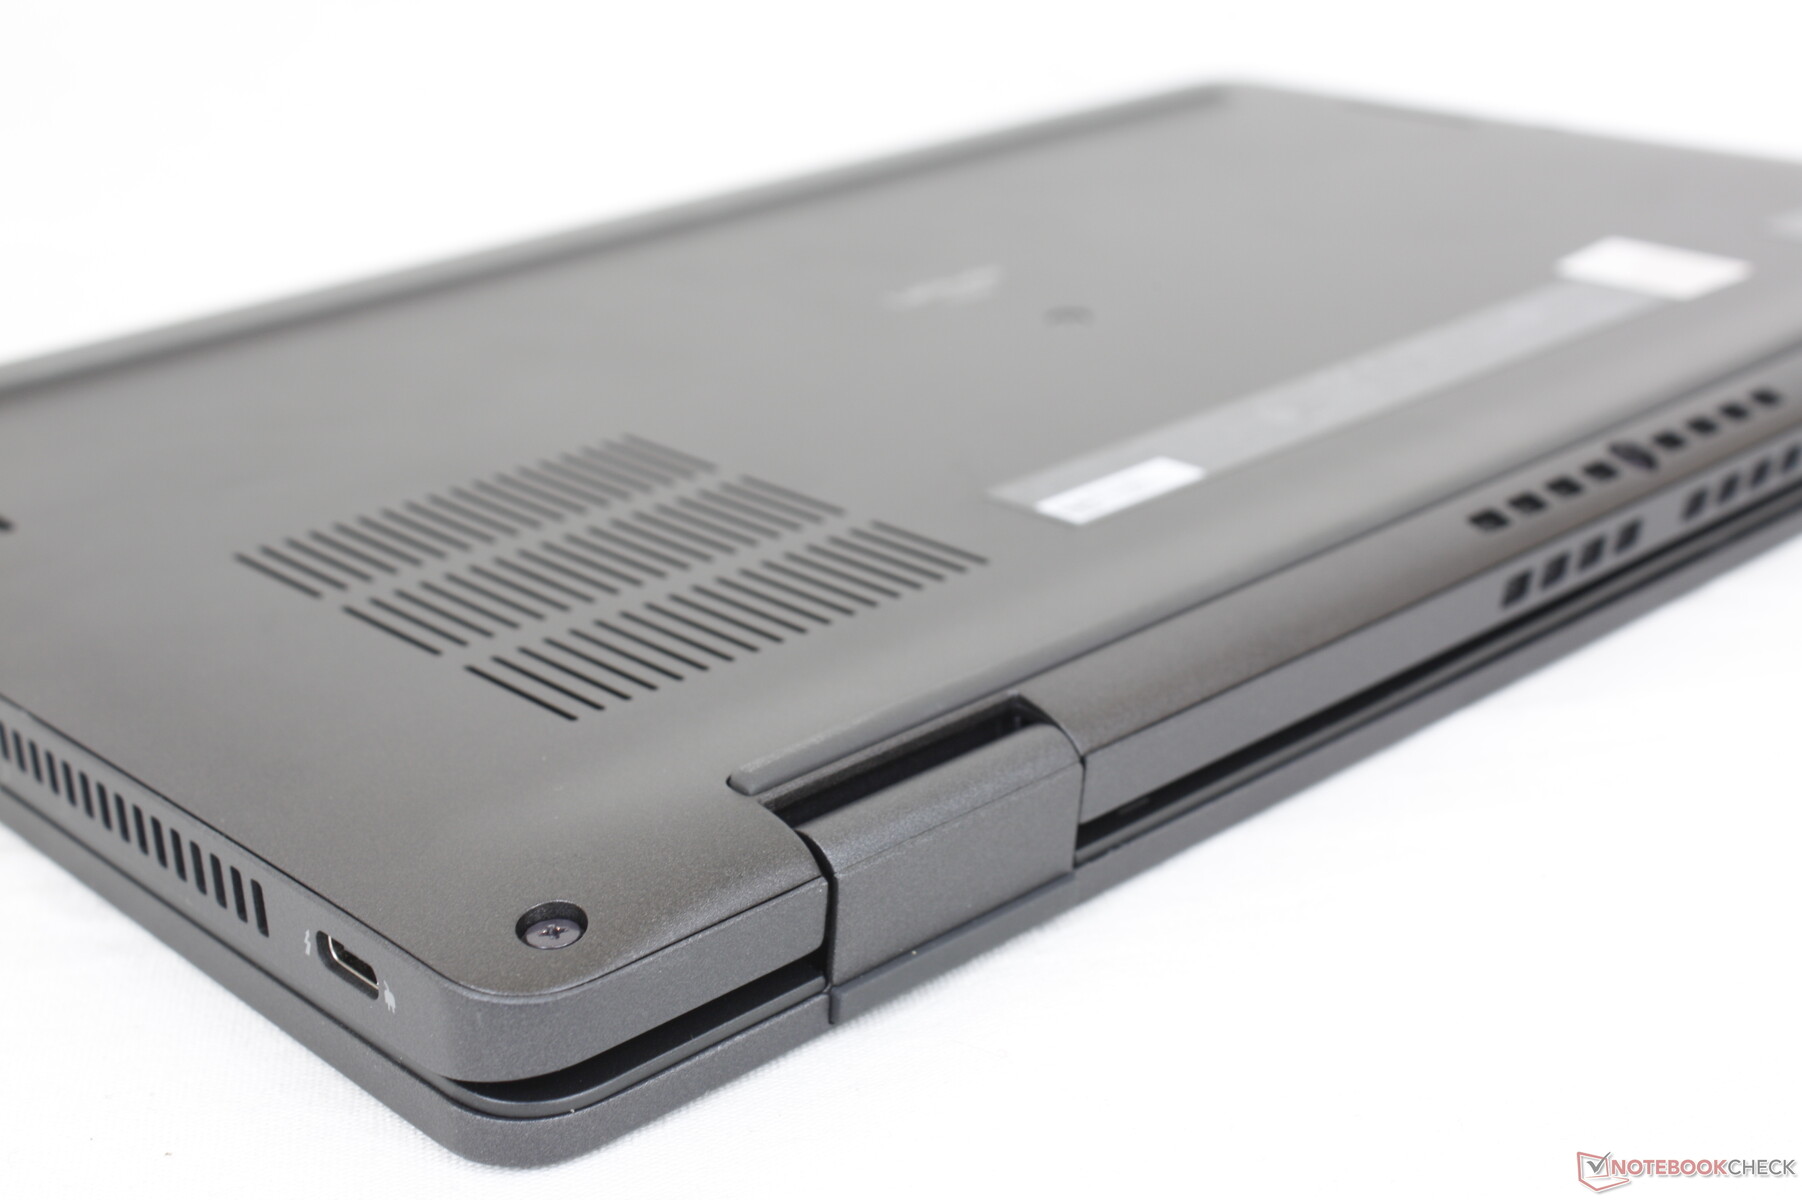
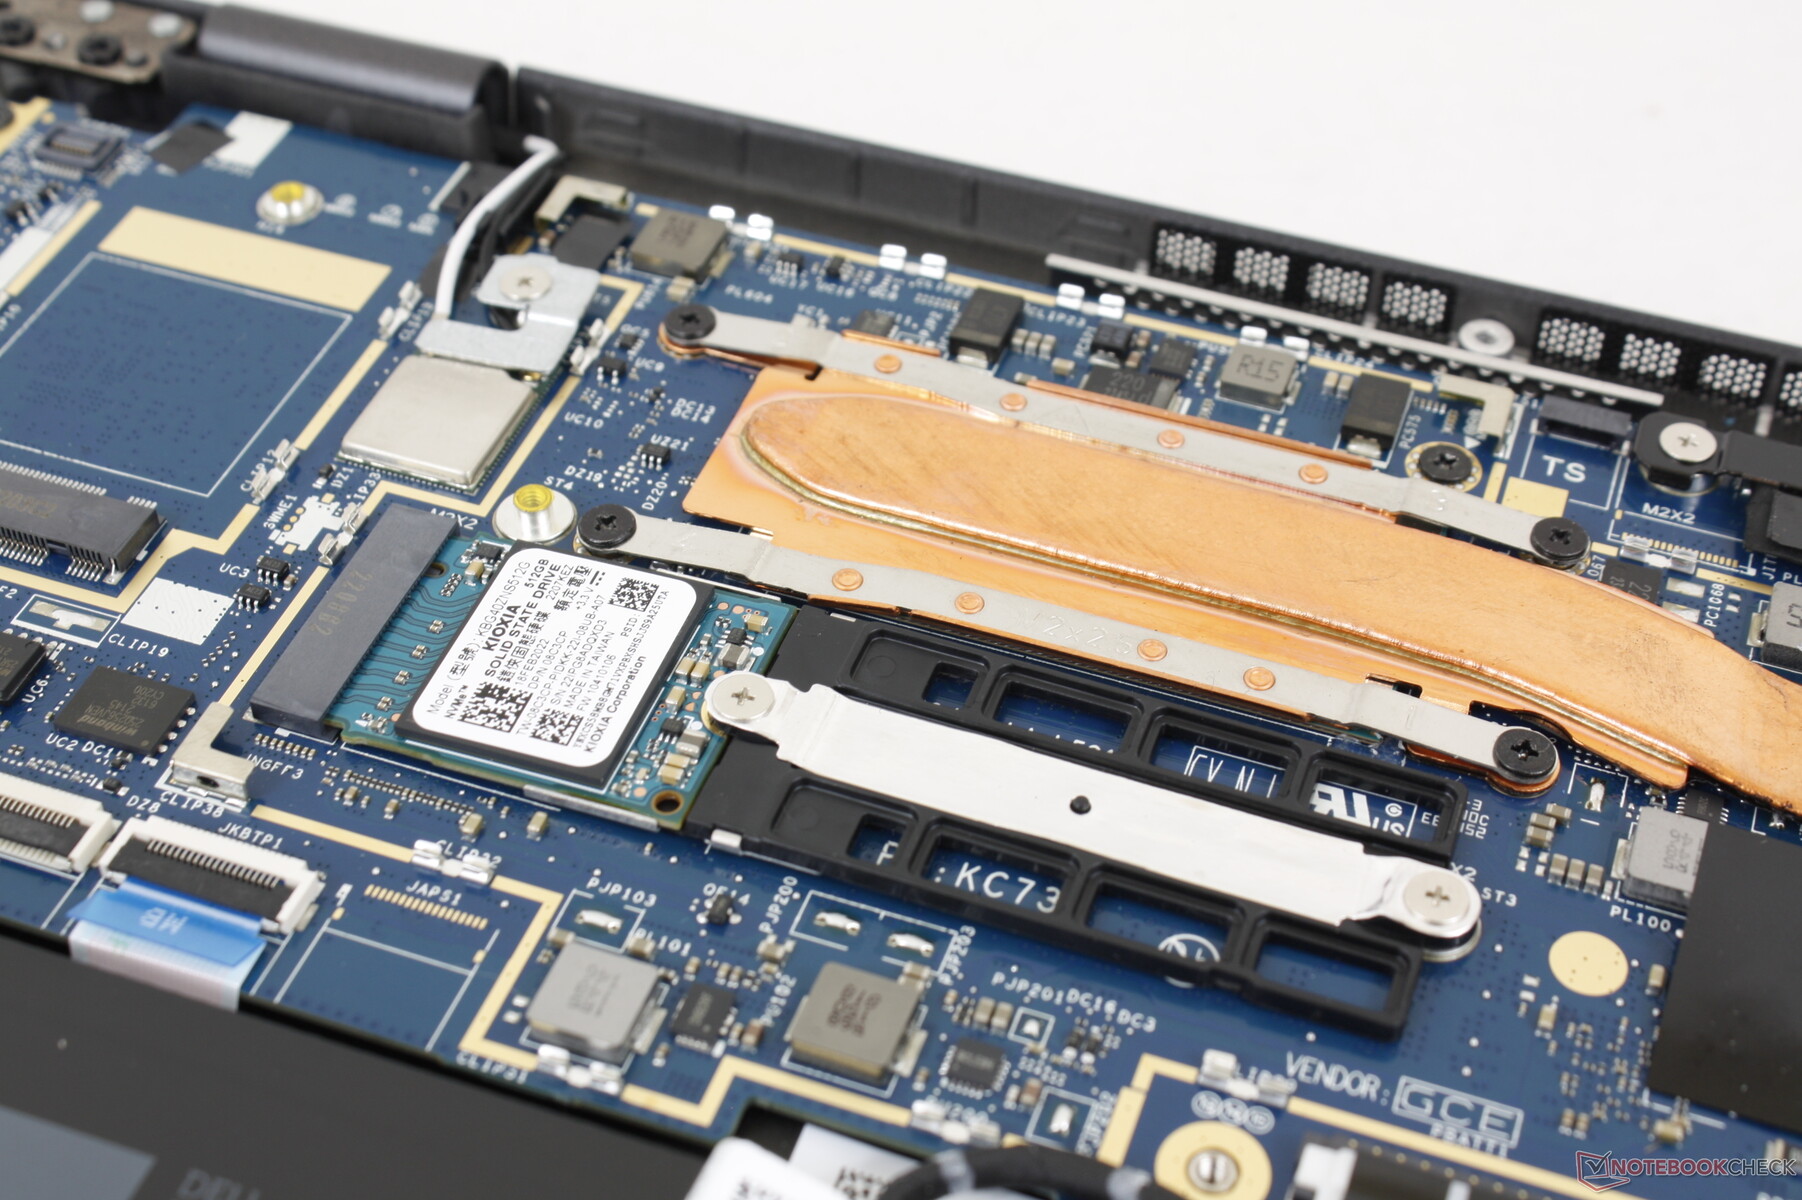
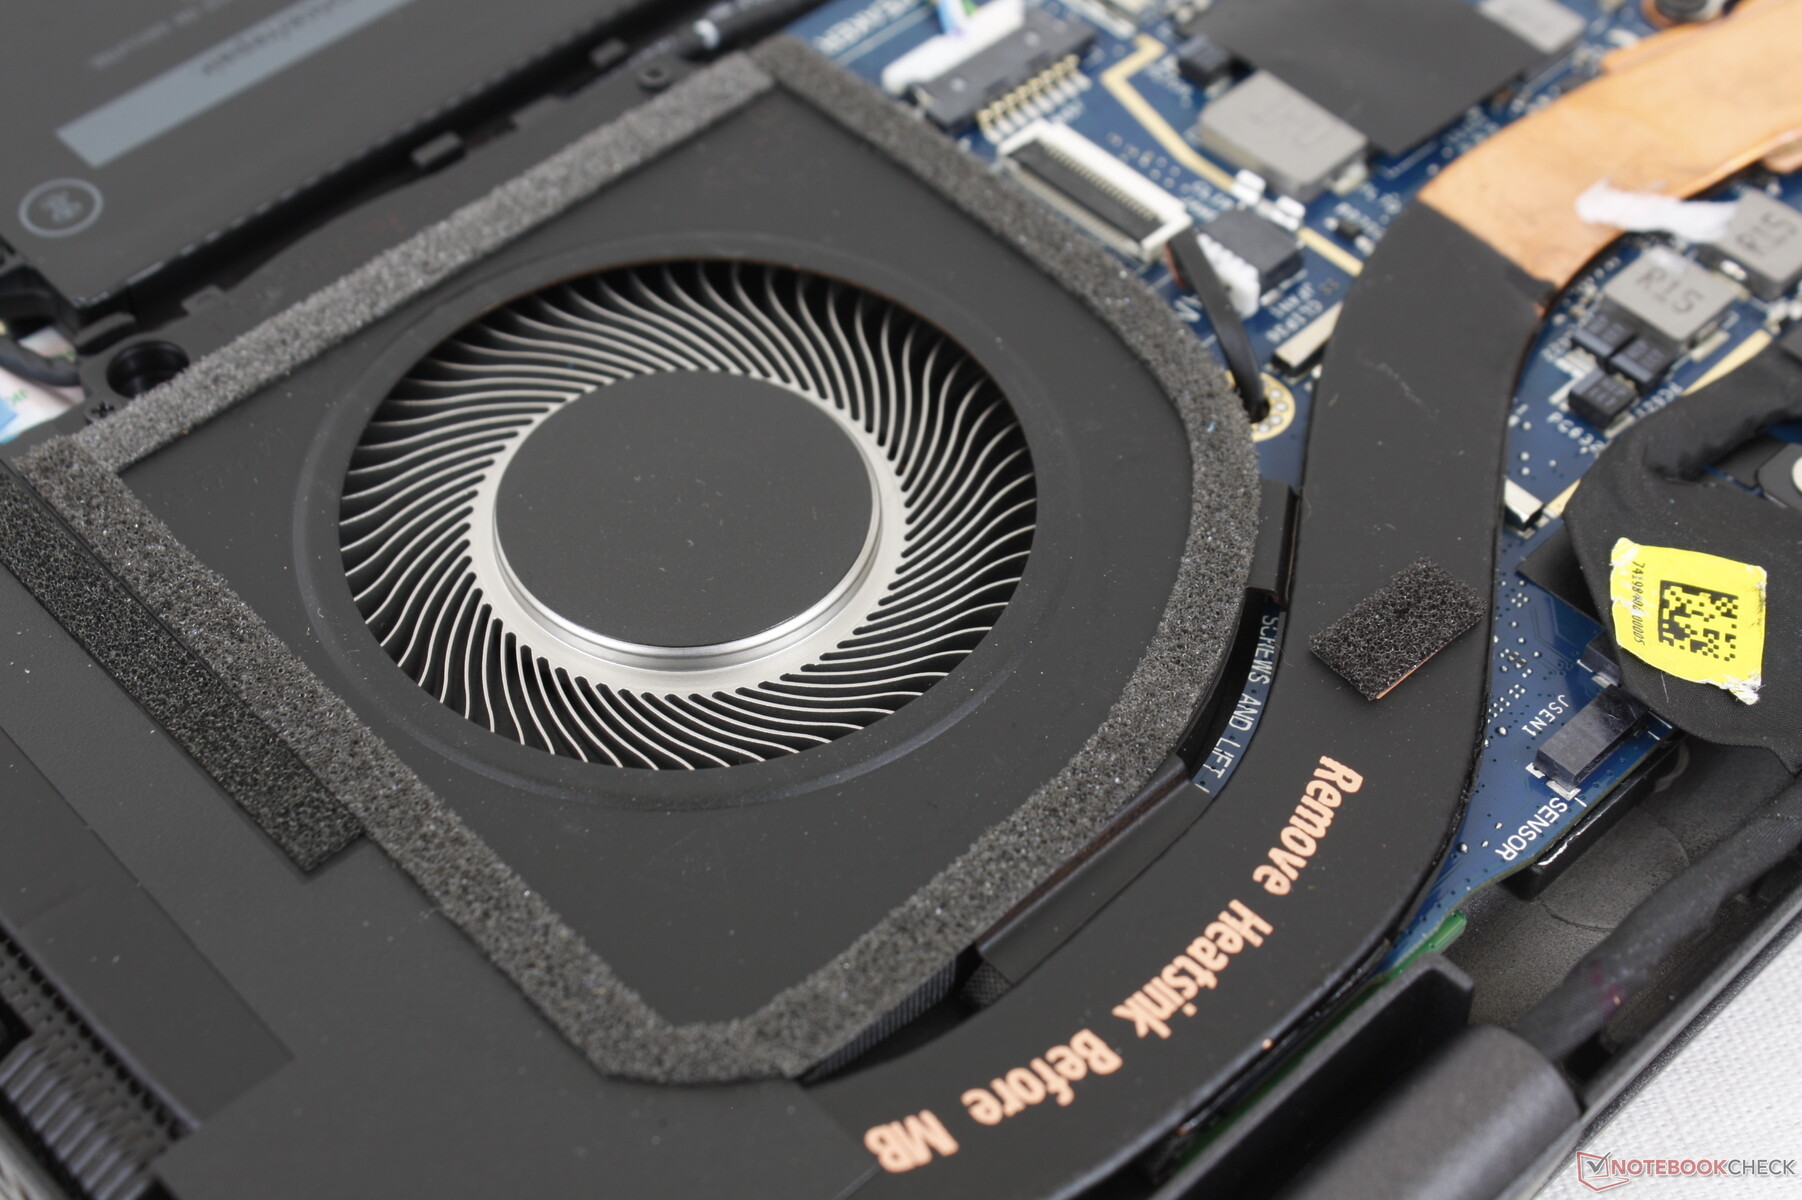
Maintenance
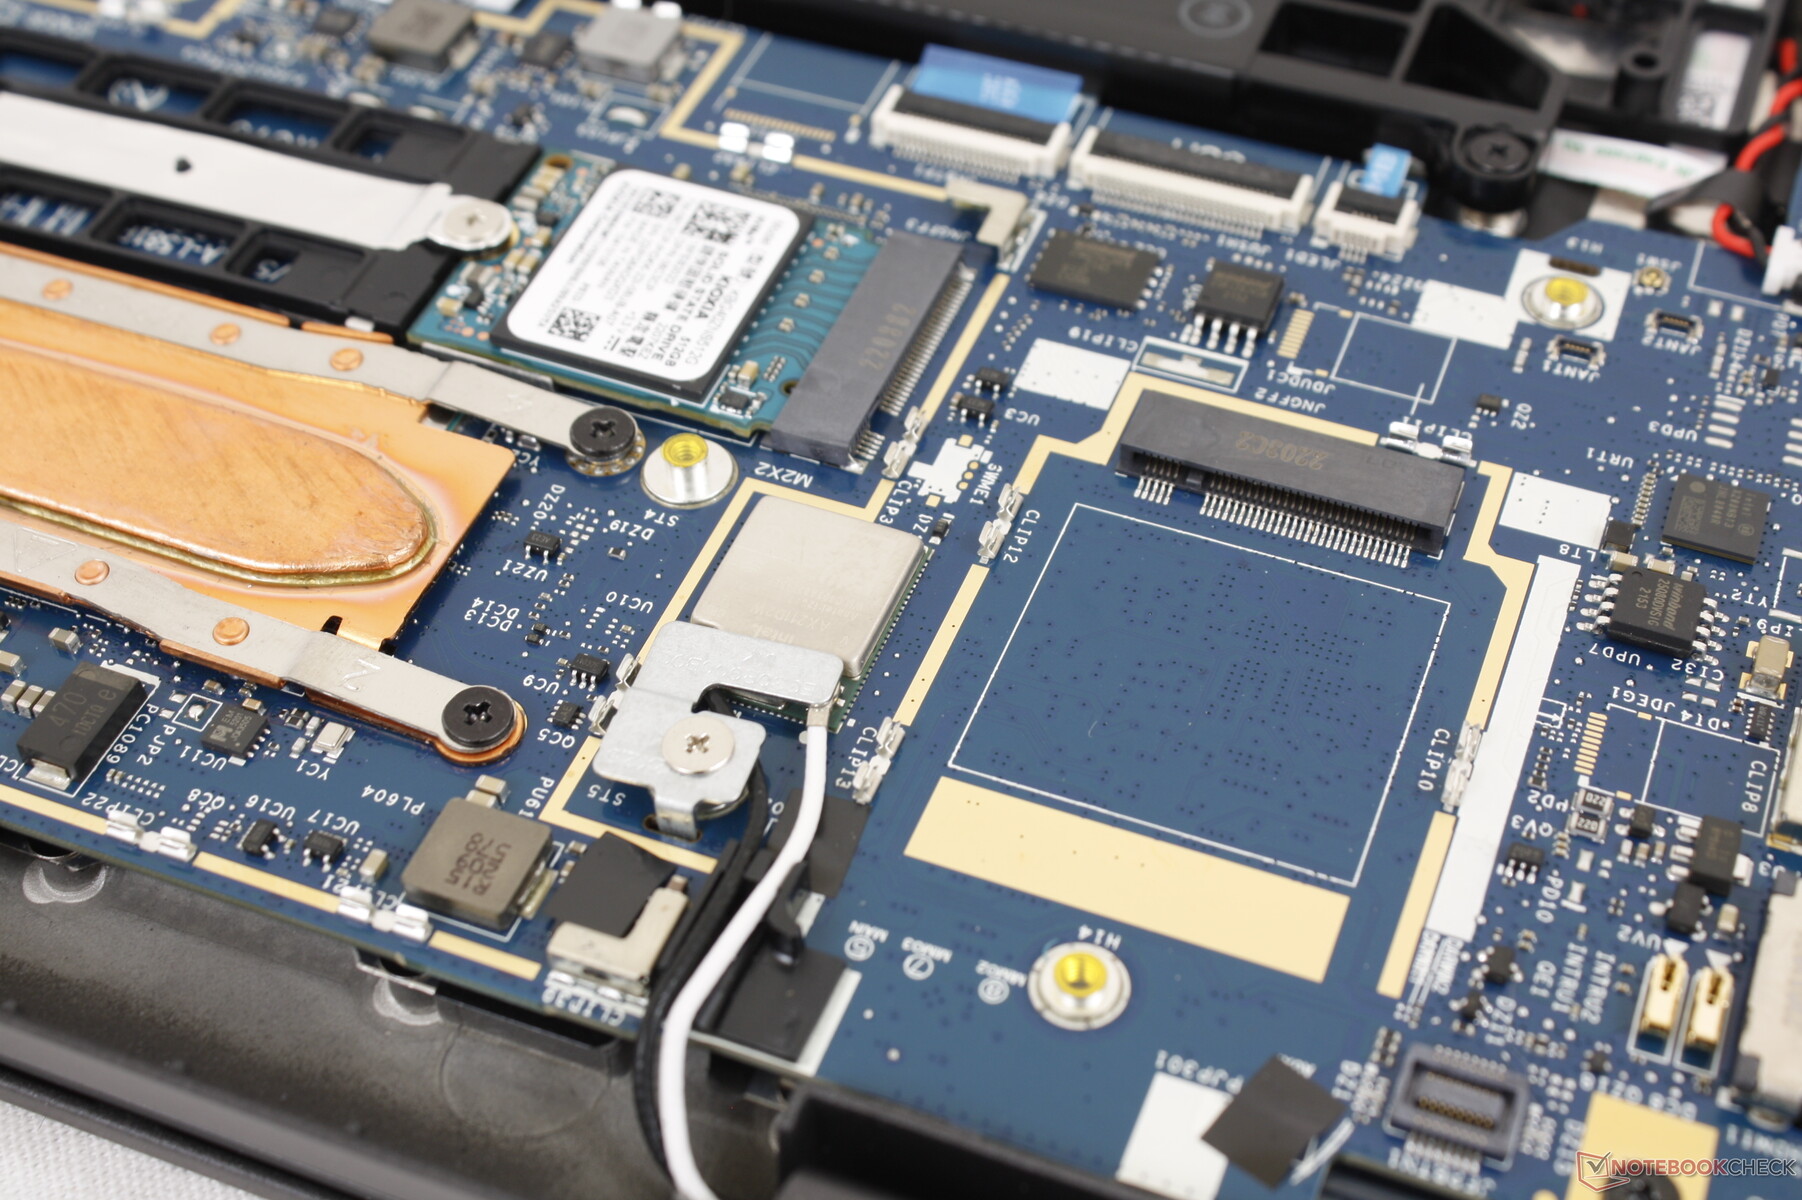
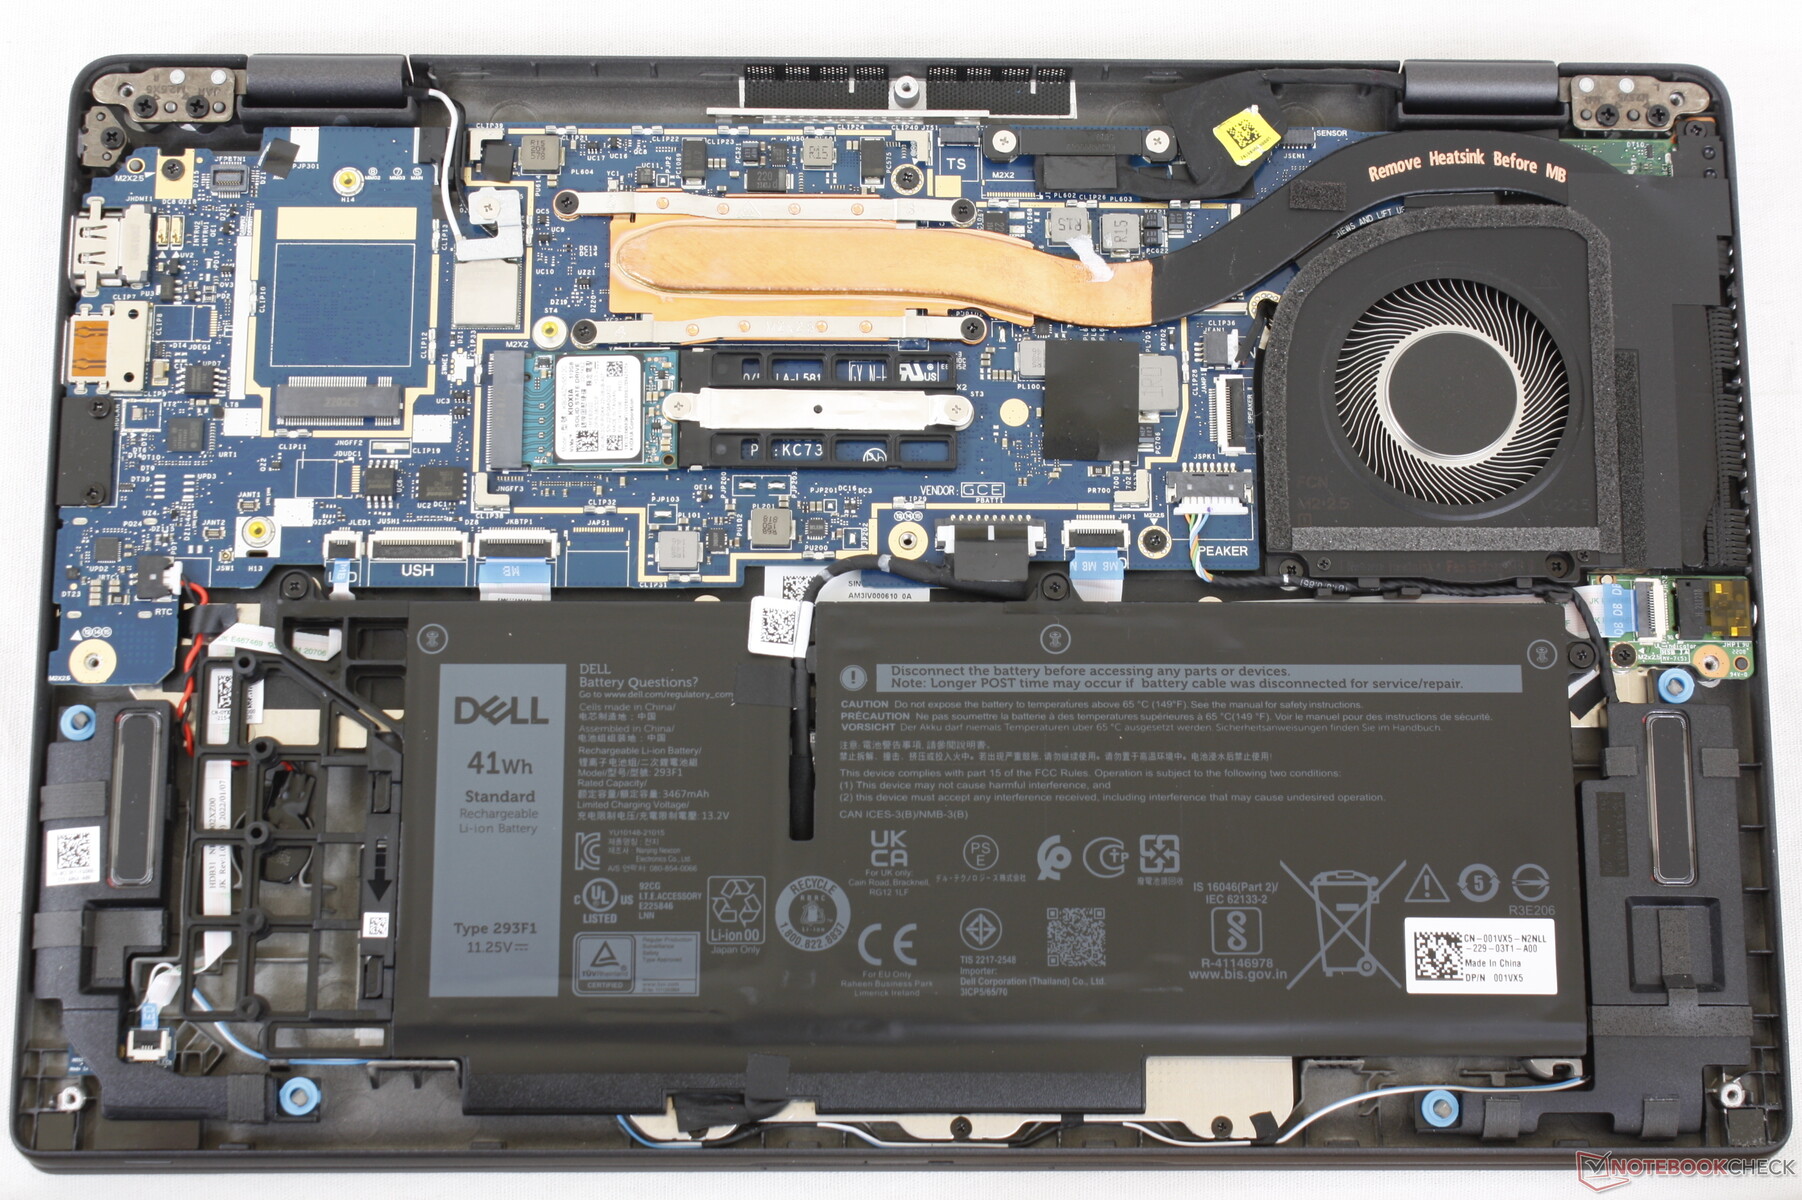
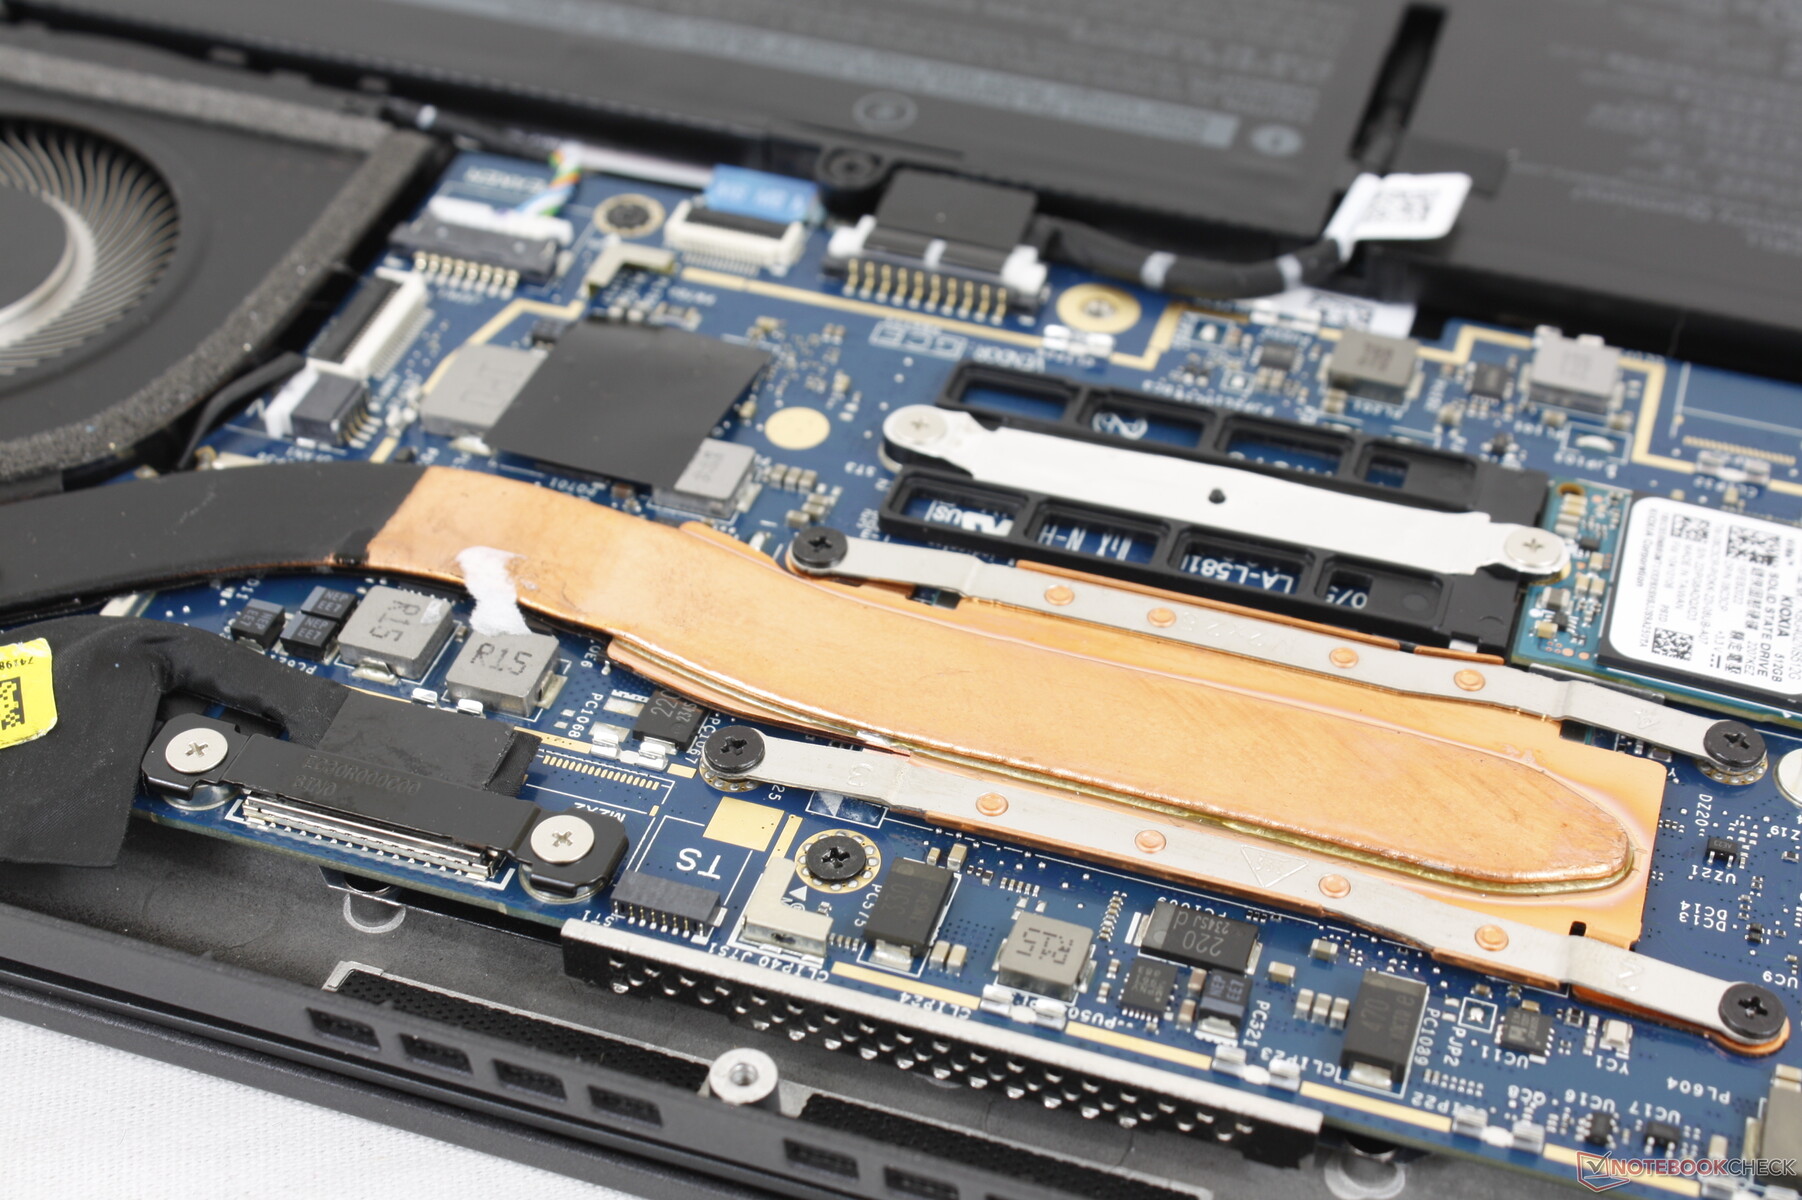
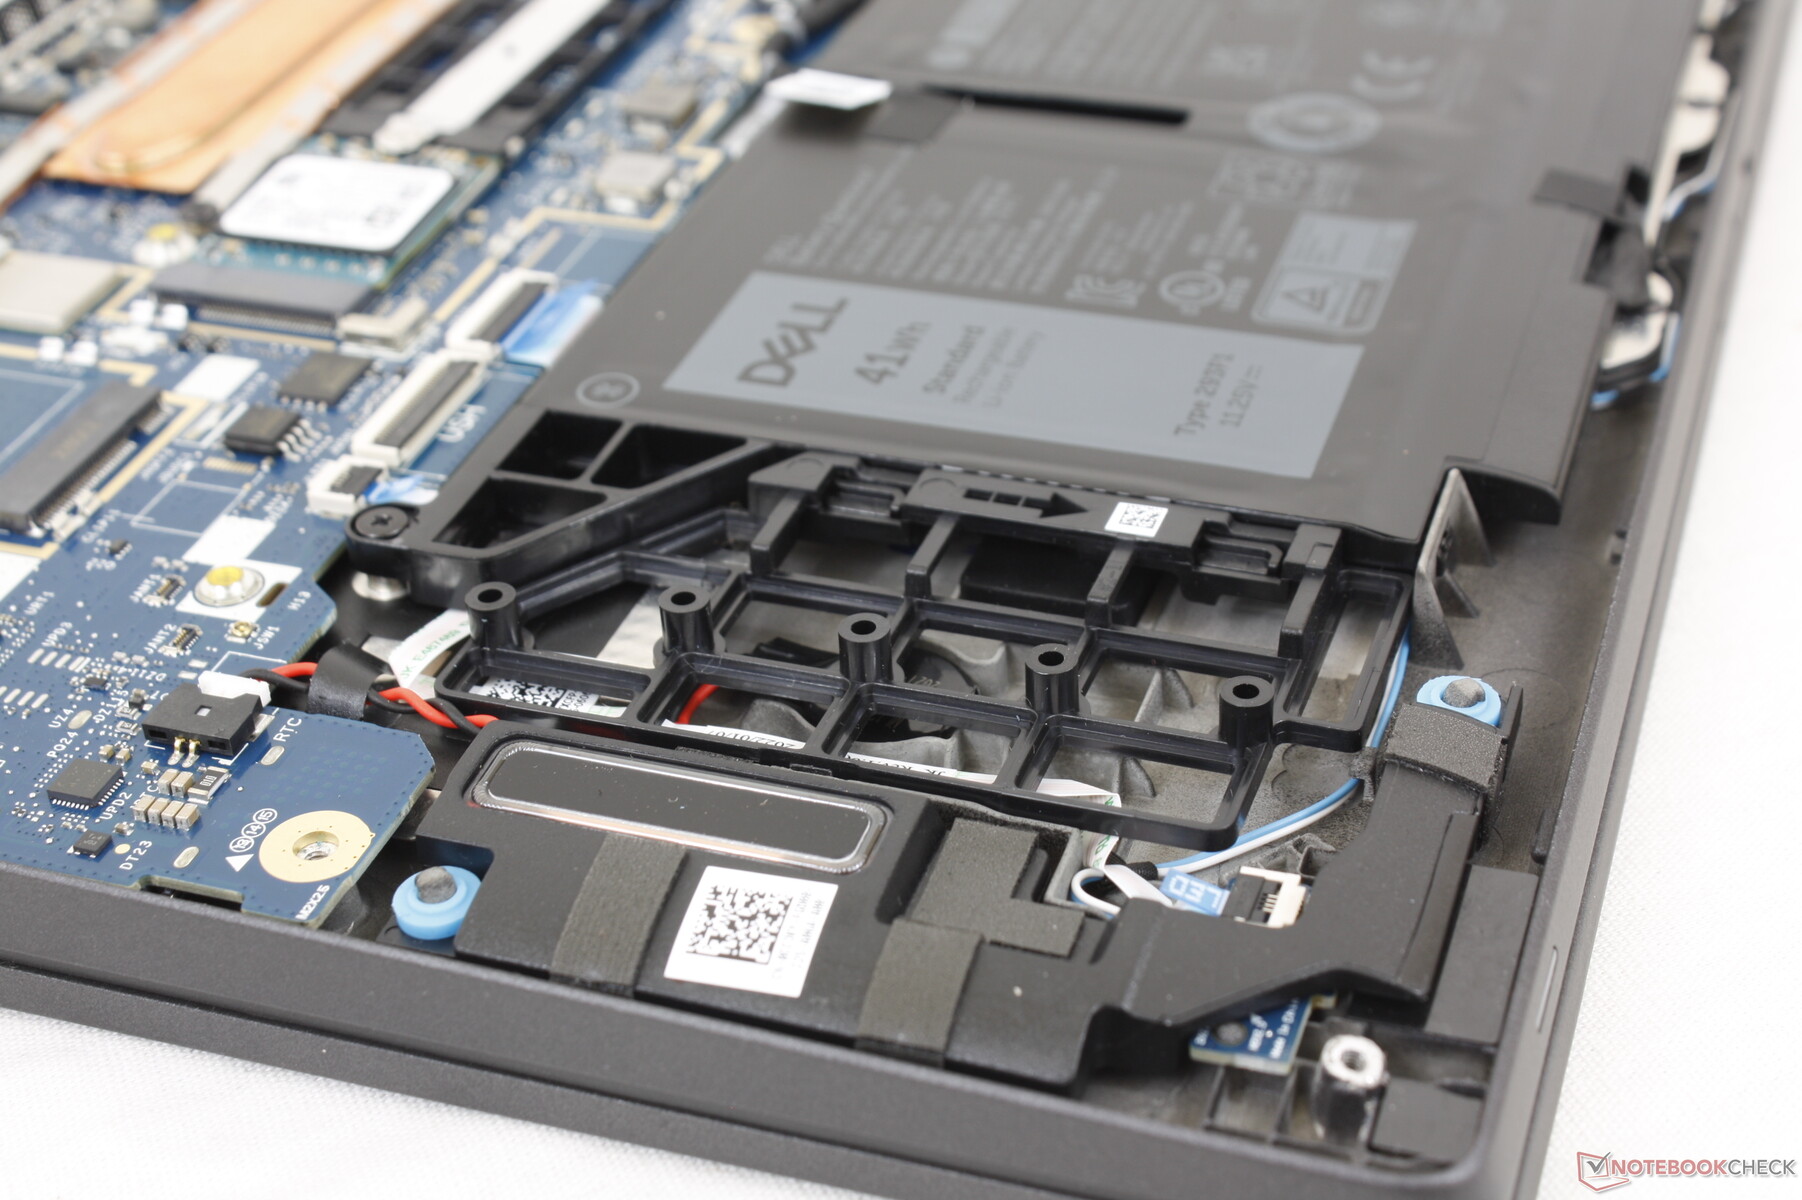
The bottom panel is easily removable with just a Philips screwdriver. There isn't much to service beyond the M.2 SSD and battery since the WLAN and RAM modules are soldered.
Note that there are no antenna included if configuring without WAN to discourage owners from installing their own WAN module. Additionally, note the empty space to the left of the 41 Wh battery to reduce weight; this space becomes occupied if configuring with the larger 58 Wh option.
Accessories and Warranty
There are no extras in the box other than the AC adapter and paperwork. A three-year warranty comes standard as is customary for most Latitude models.
Input Devices — Same As Before
Keyboard
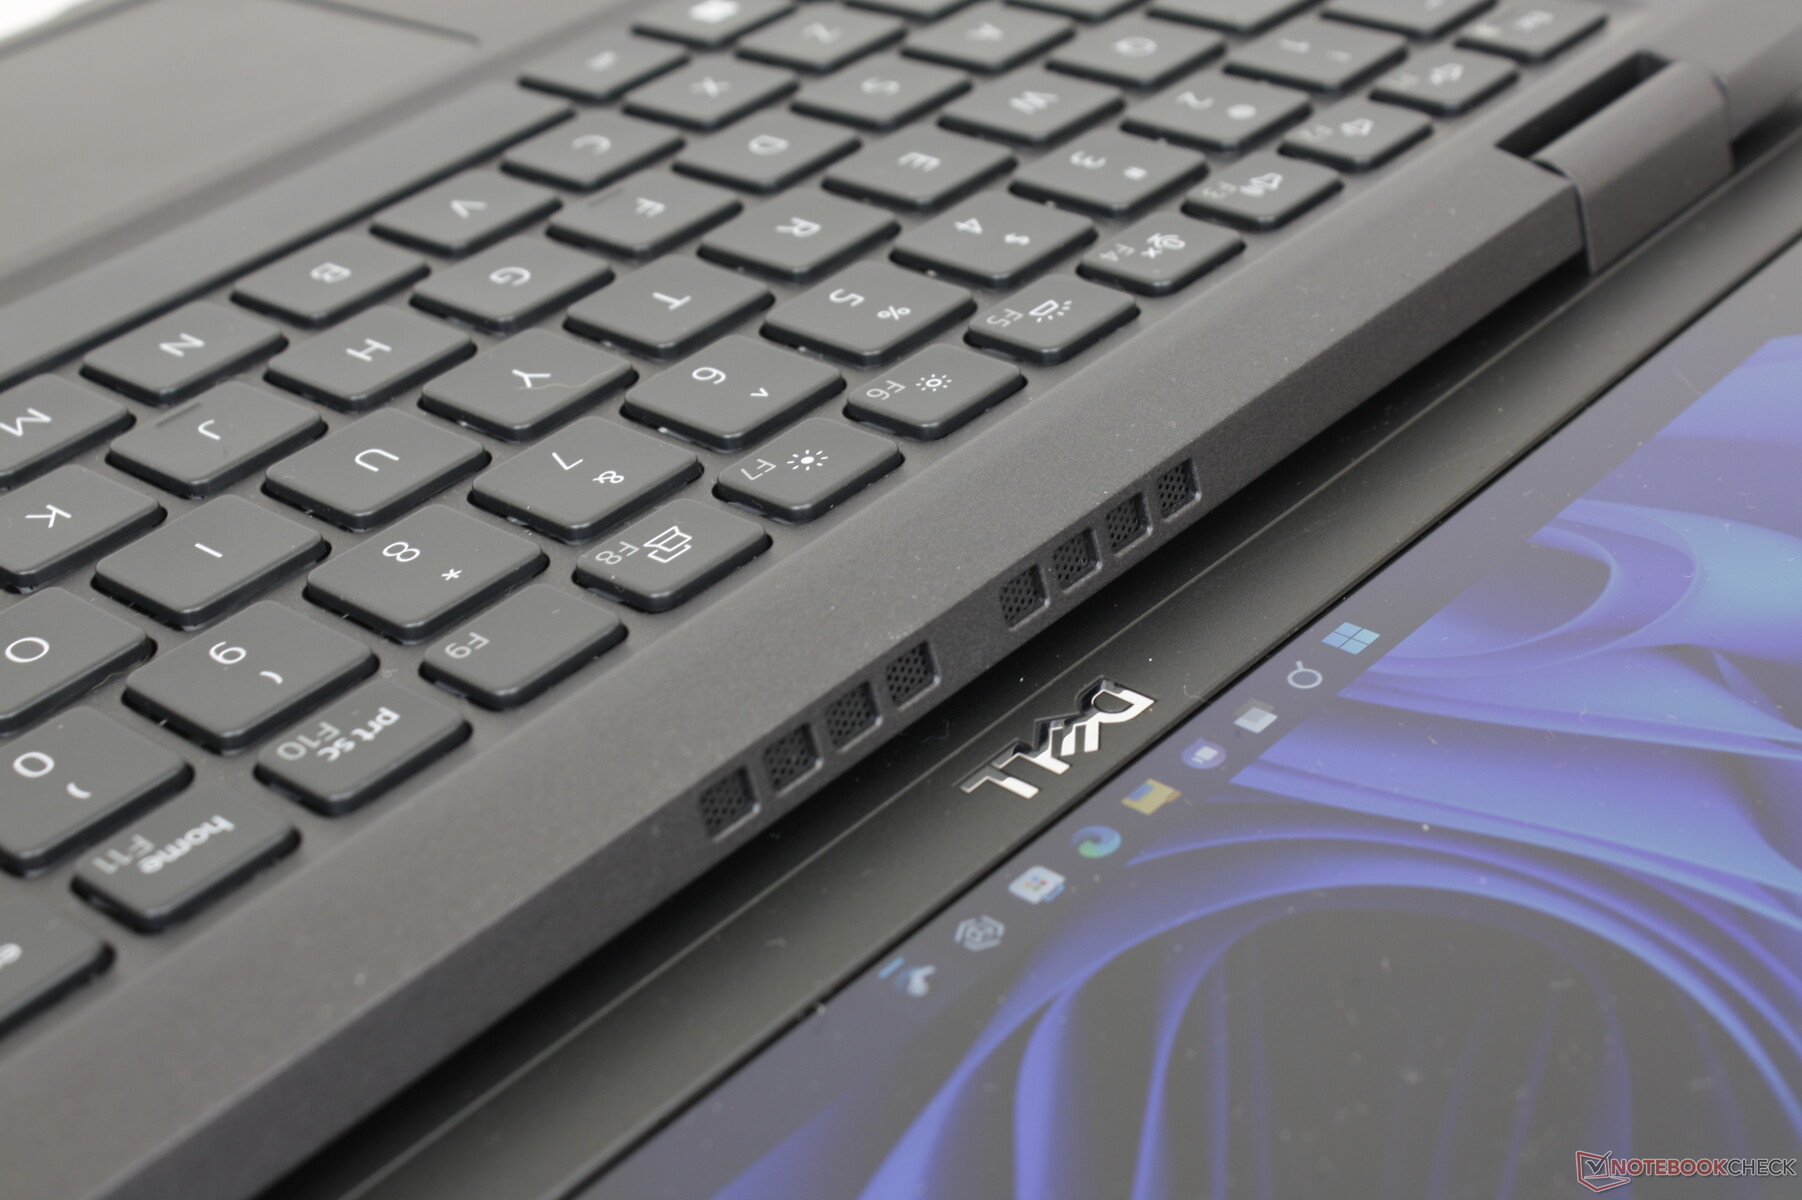
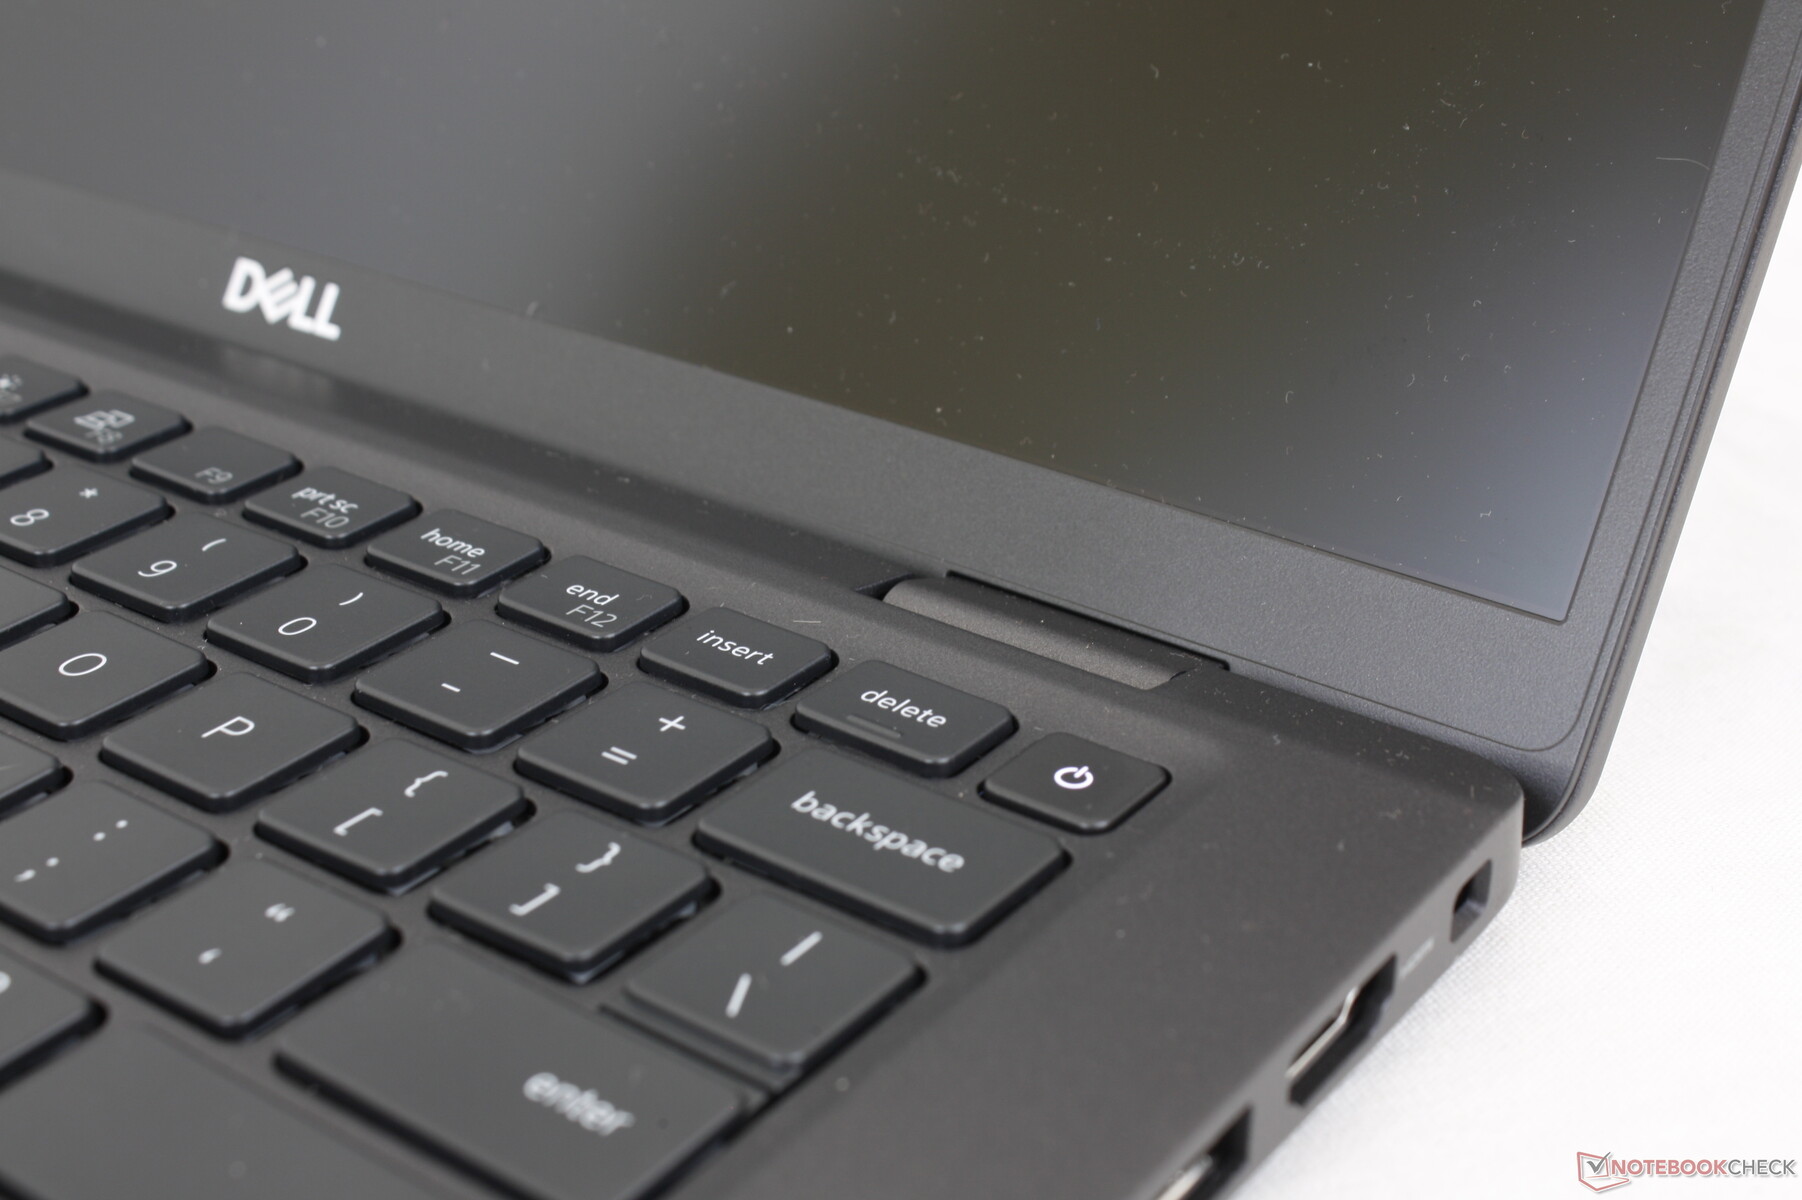
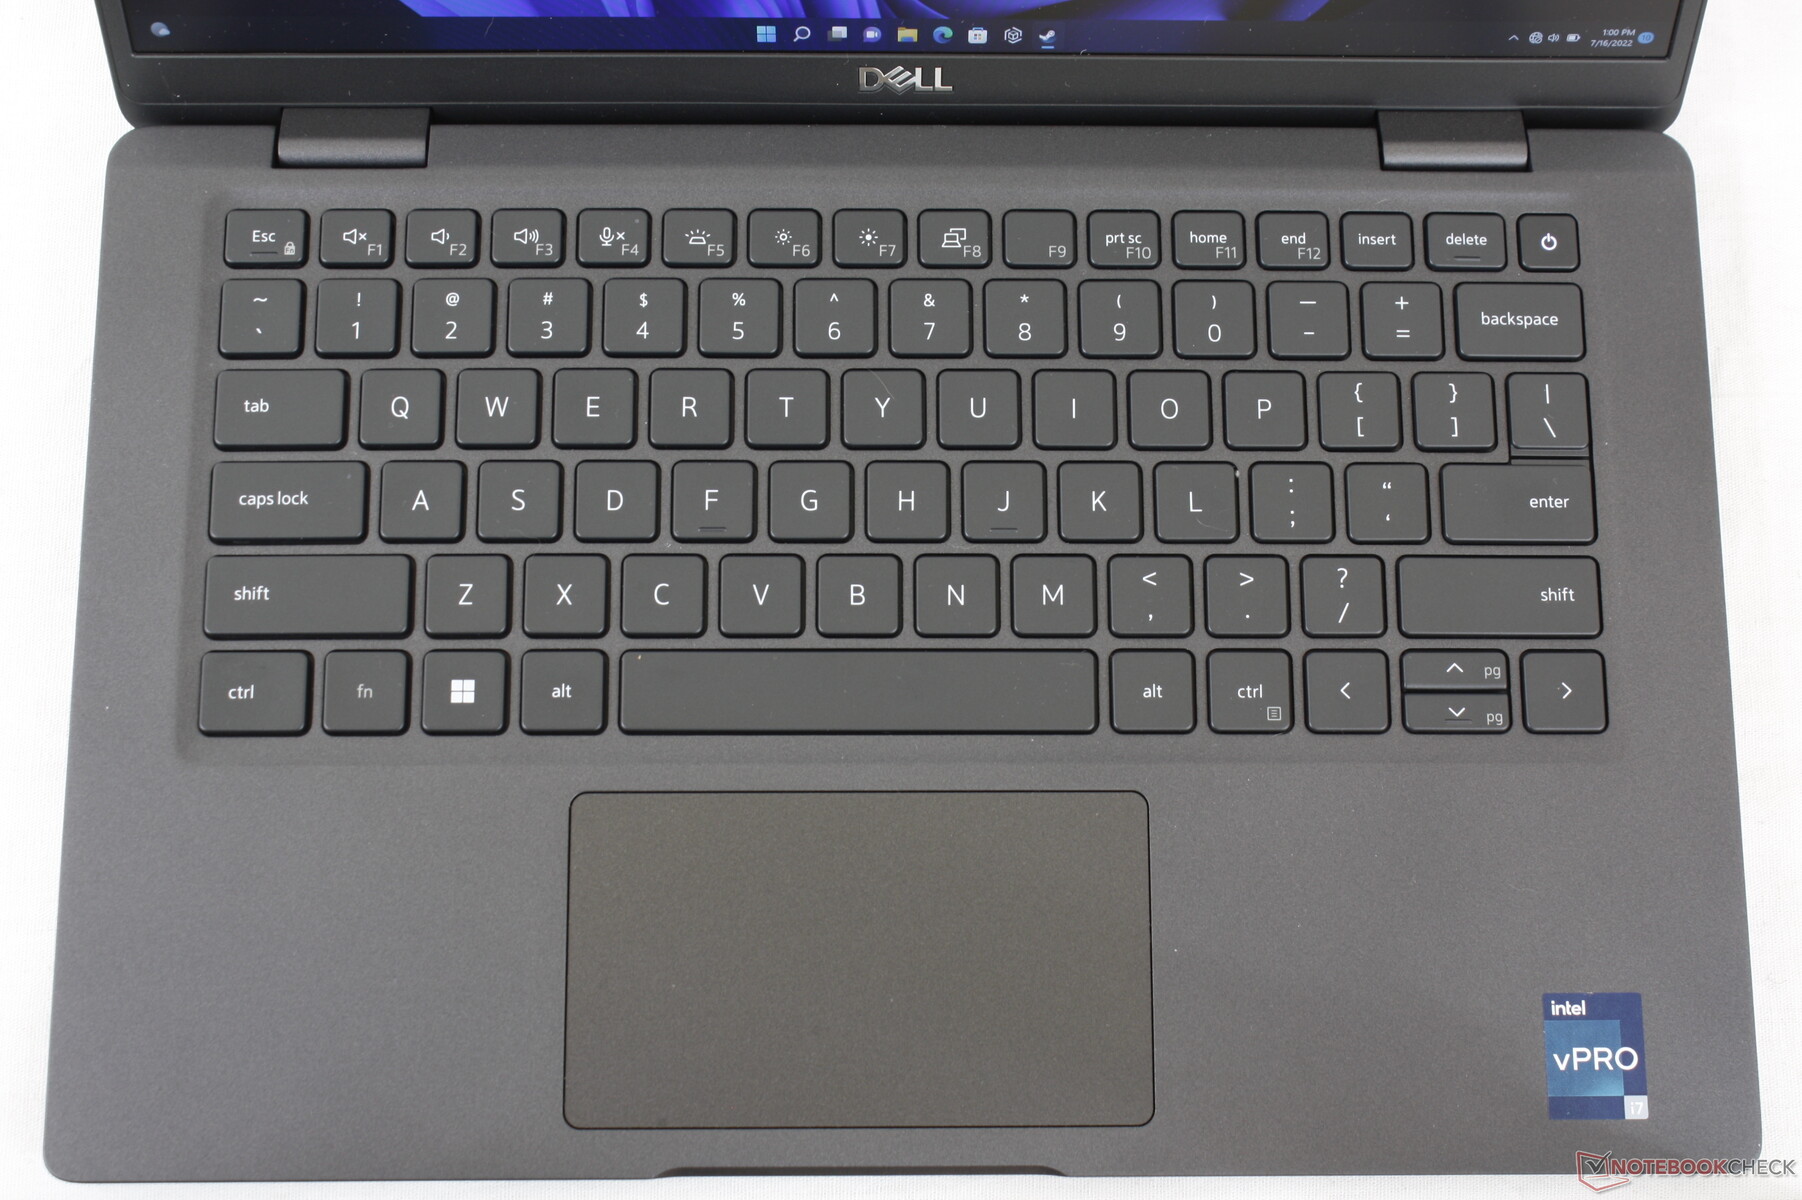
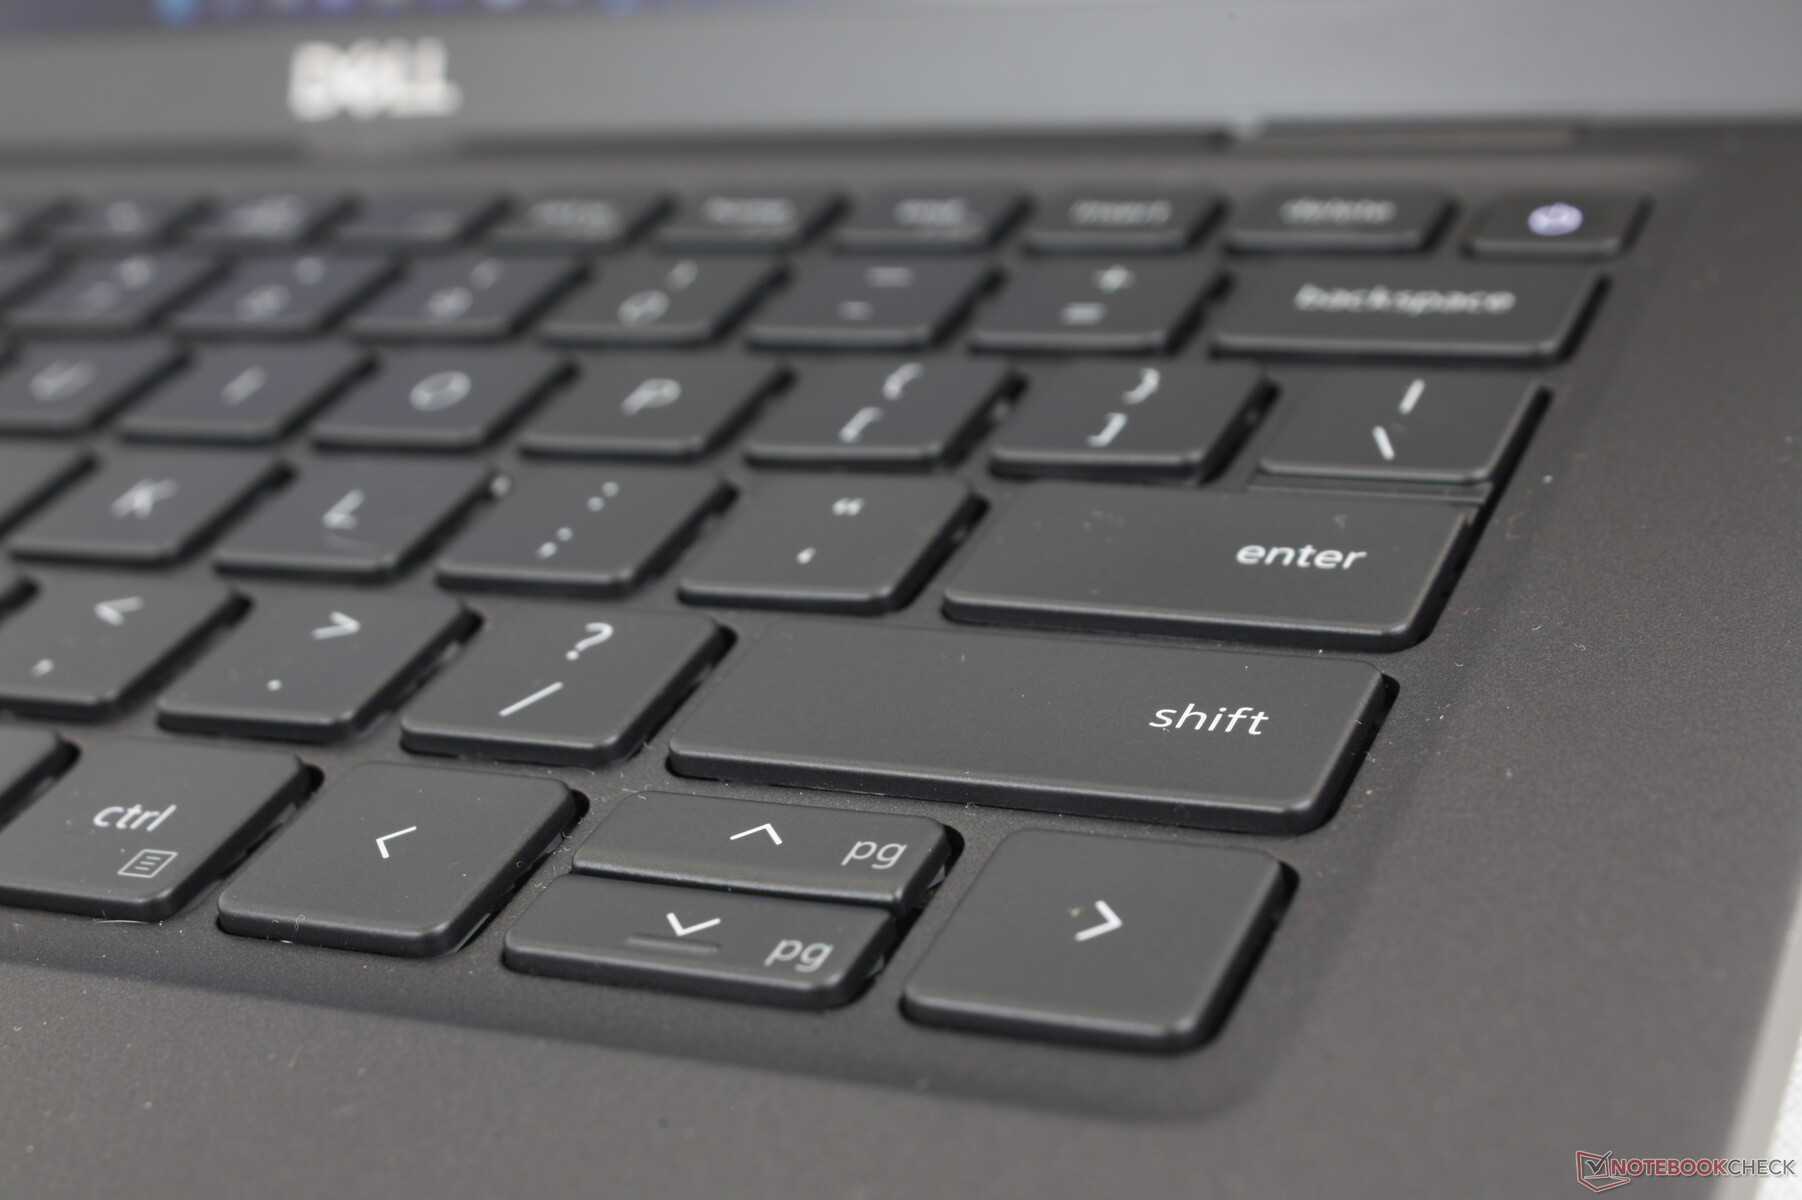
Dell has made no changes to the keyboard between the Latitude 7310 and Latitude 7330. In fact, many of the newer Latitude models share the same keyboard design and layout including the Latitude 7400 7410, 7310, and 7330. We find the firmer keys of the Latitude to be more comfortable for typing than on the lighter keys of the XPS 13. The keys on the LG Gram 14 or HP EliteBook series have crisper or sharper feedback.
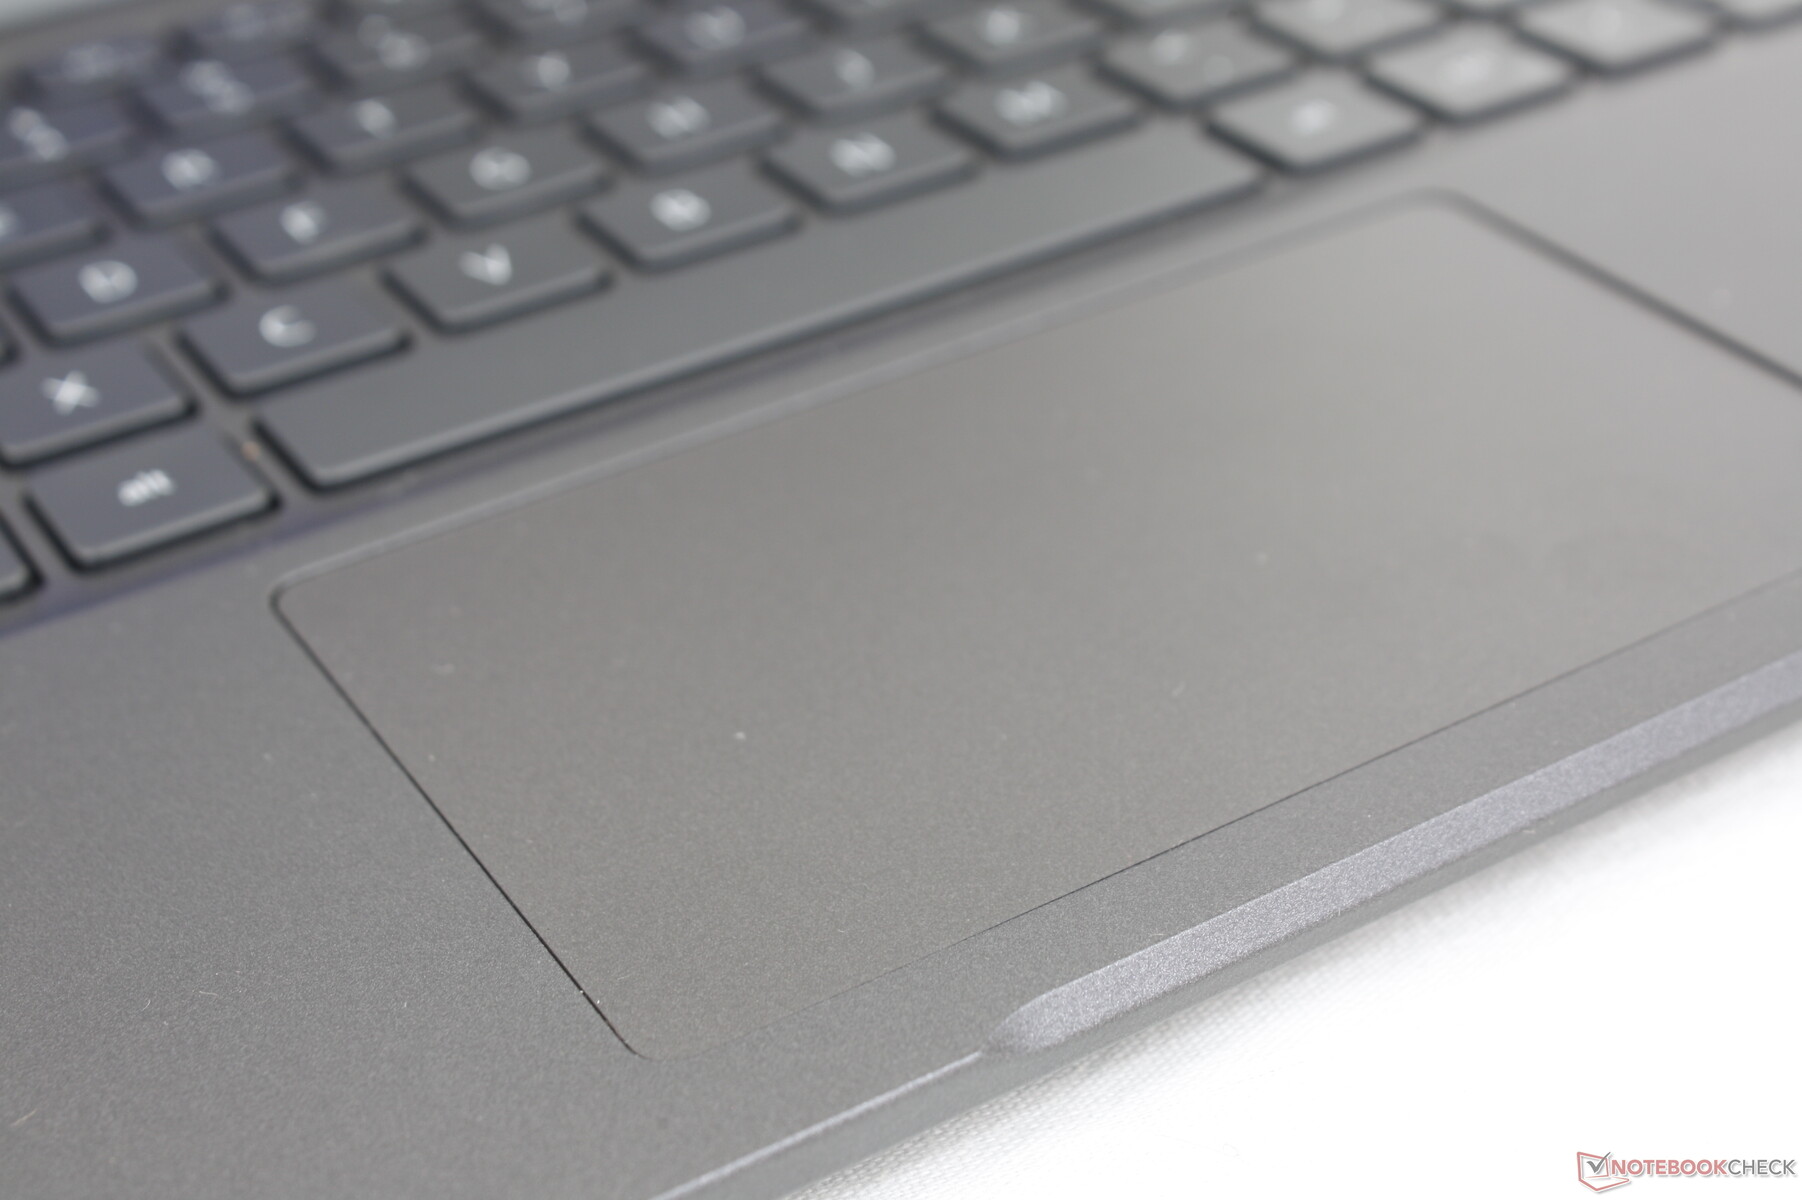
Touchpad
Clickpad size has not changed from the older Latitude 7310 at around 10 x 6.1 cm. We do wish it was taller, however, as vertical cursor movement and multi-touch scrolling can feel a bit cramped. The integrated mouse keys are also softer than we would like and they become tiring to press after a short while.

Display — No OLED Or Fast Refresh Rate
There are four display options available as follows from worst to best:
- Non-touch, 250-nits, ~60% sRGB
- Touch, 300-nits, ~60% sRGB
- Non-touch, 400-nits, 100% sRGB, Low Blue Light, Low Power
- Non-touch, 400-nits, 100% sRGB, Low Blue Light, Low Power, Ultralight
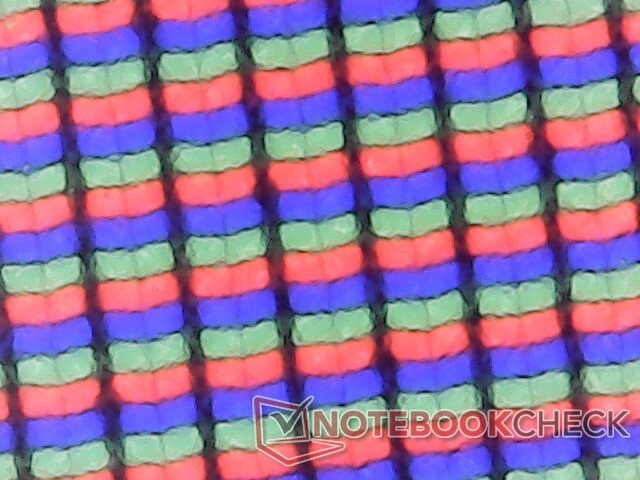
All options are FHD, WVA/IPS, and matte only meaning no 2K, 4K, OLED, or glossy alternatives here. We recommend avoiding the first panel due to its dim backlight and very narrow color range. Our specific test unit comes equipped with the fourth option above.
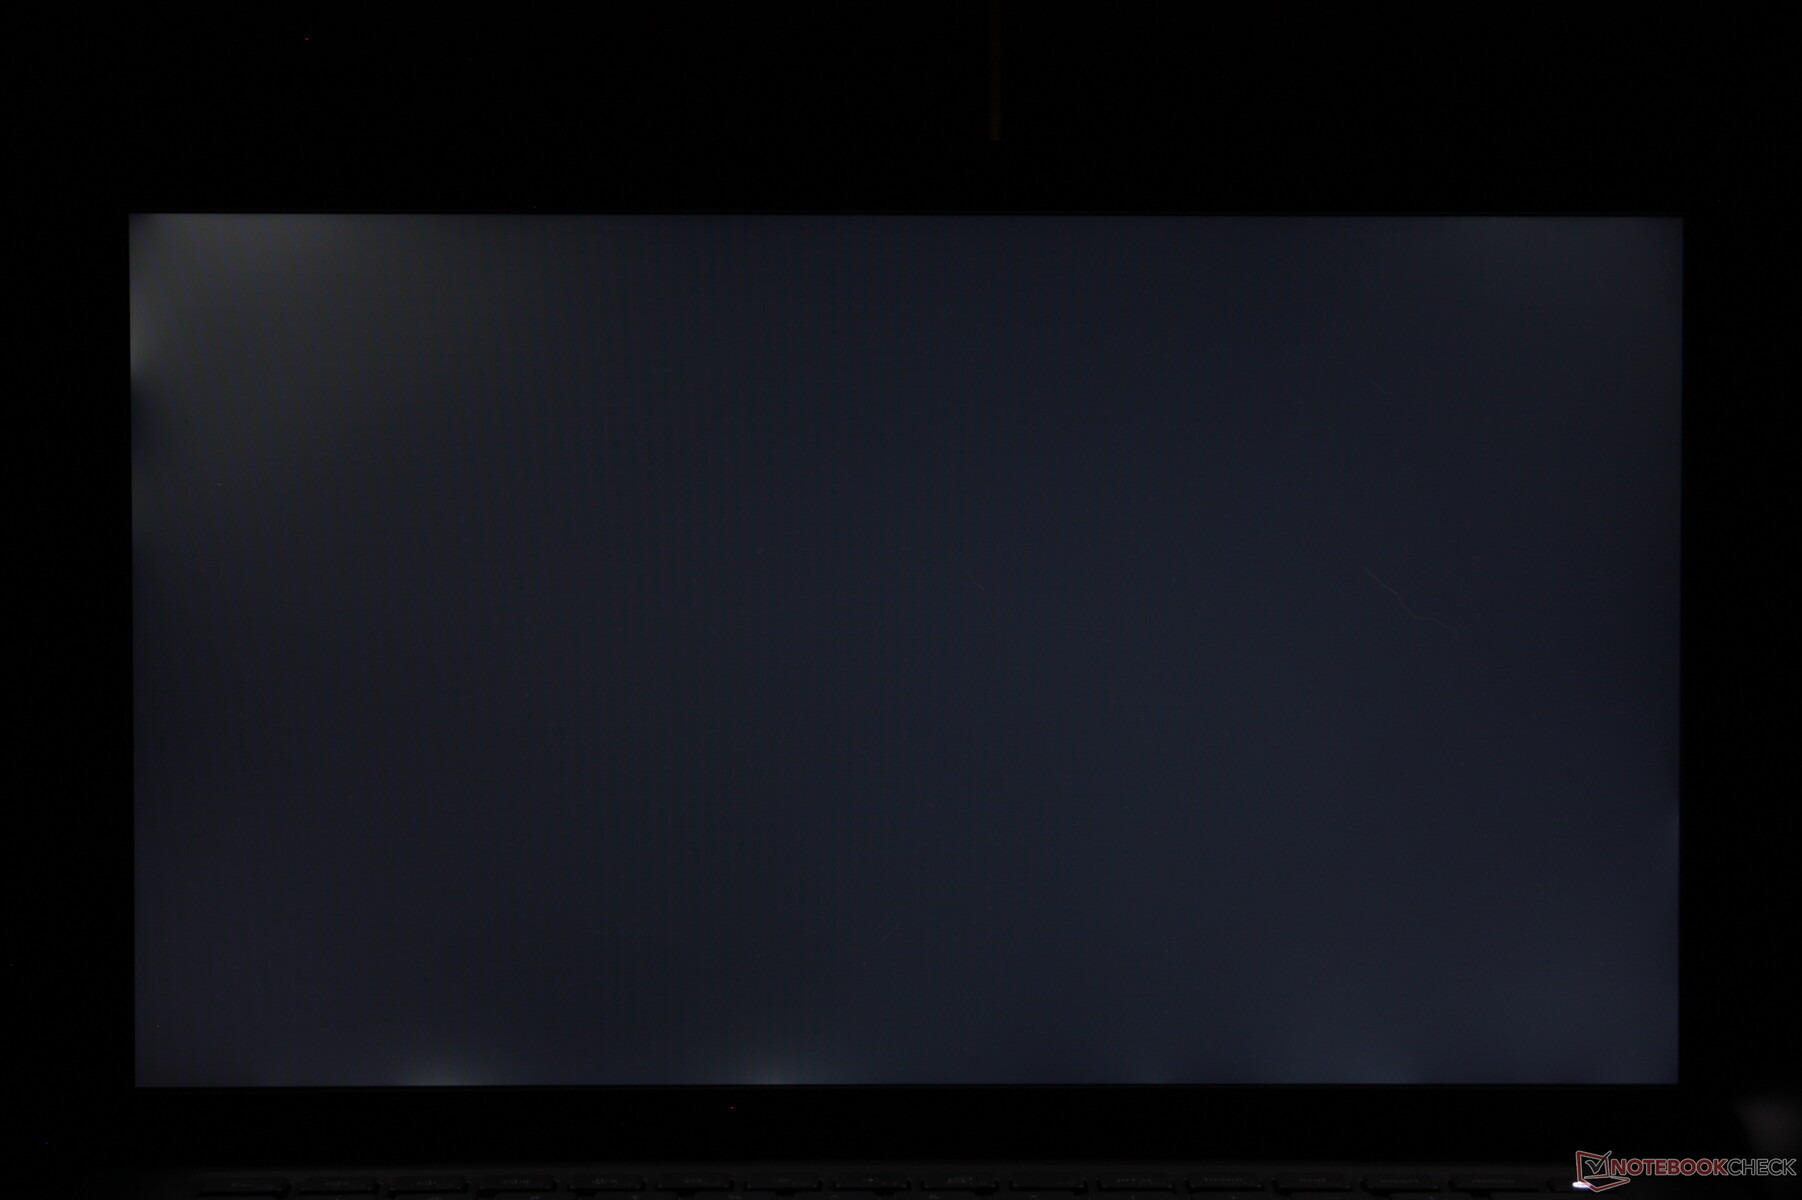
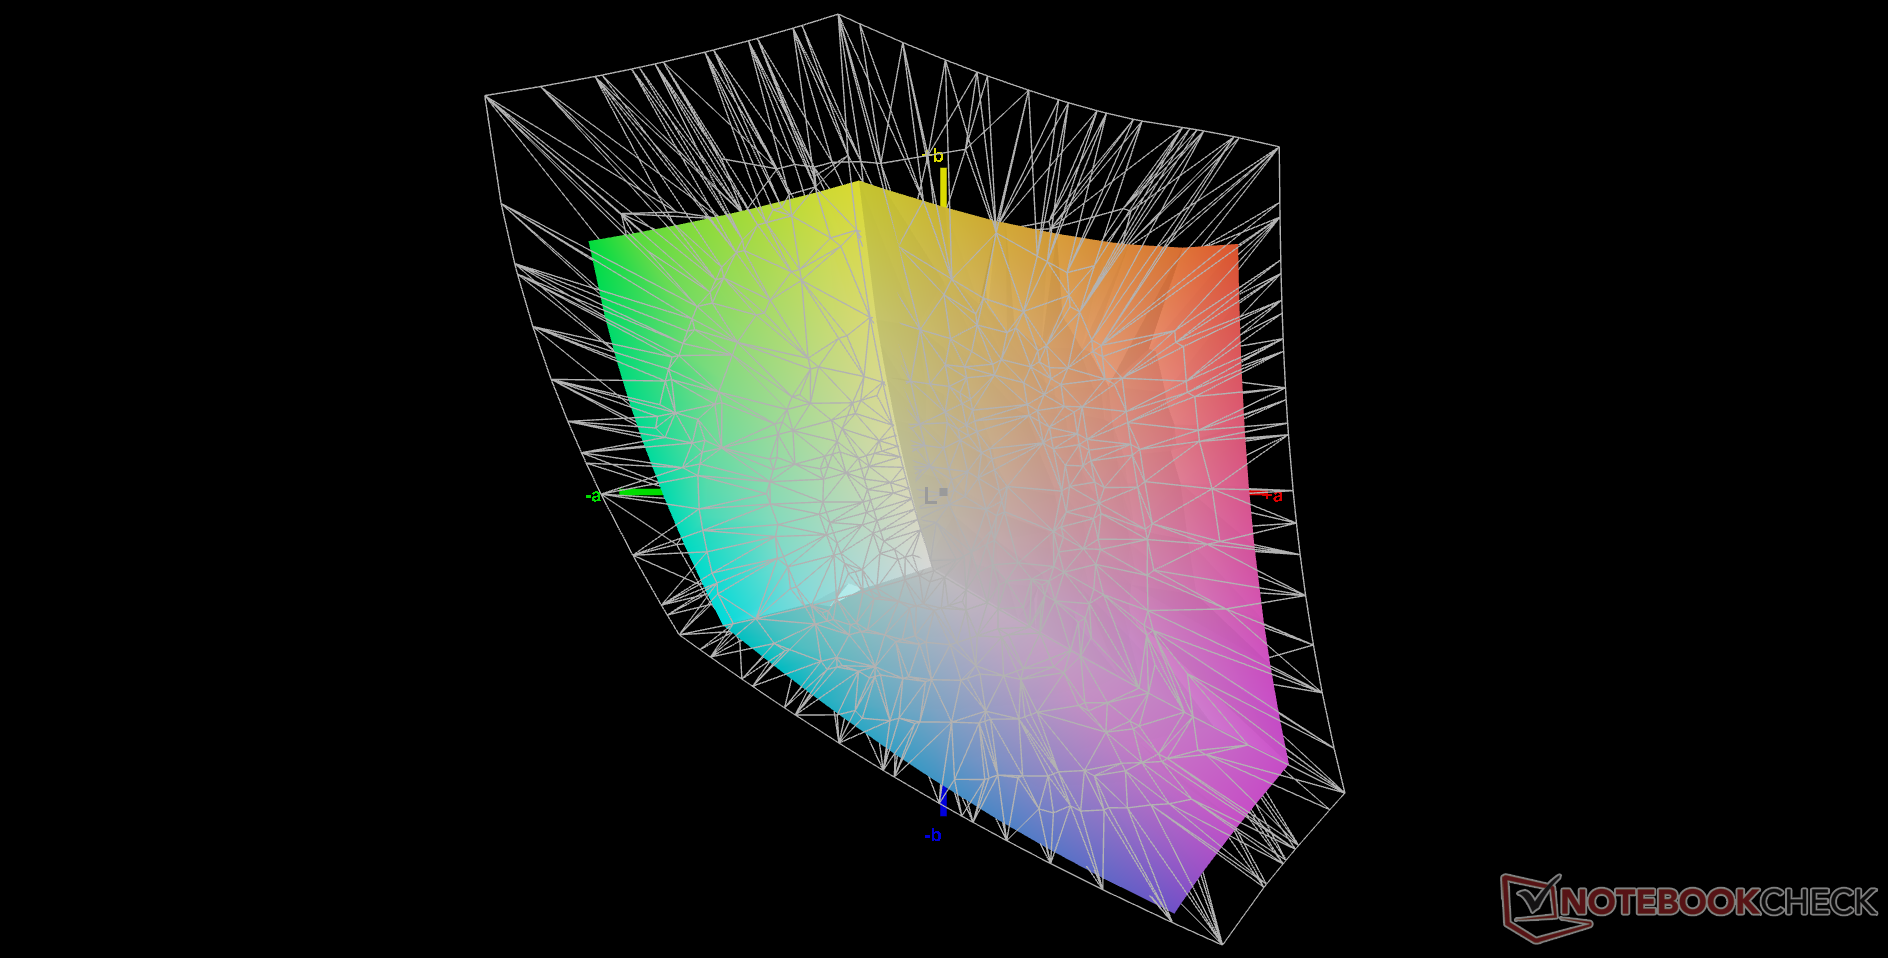
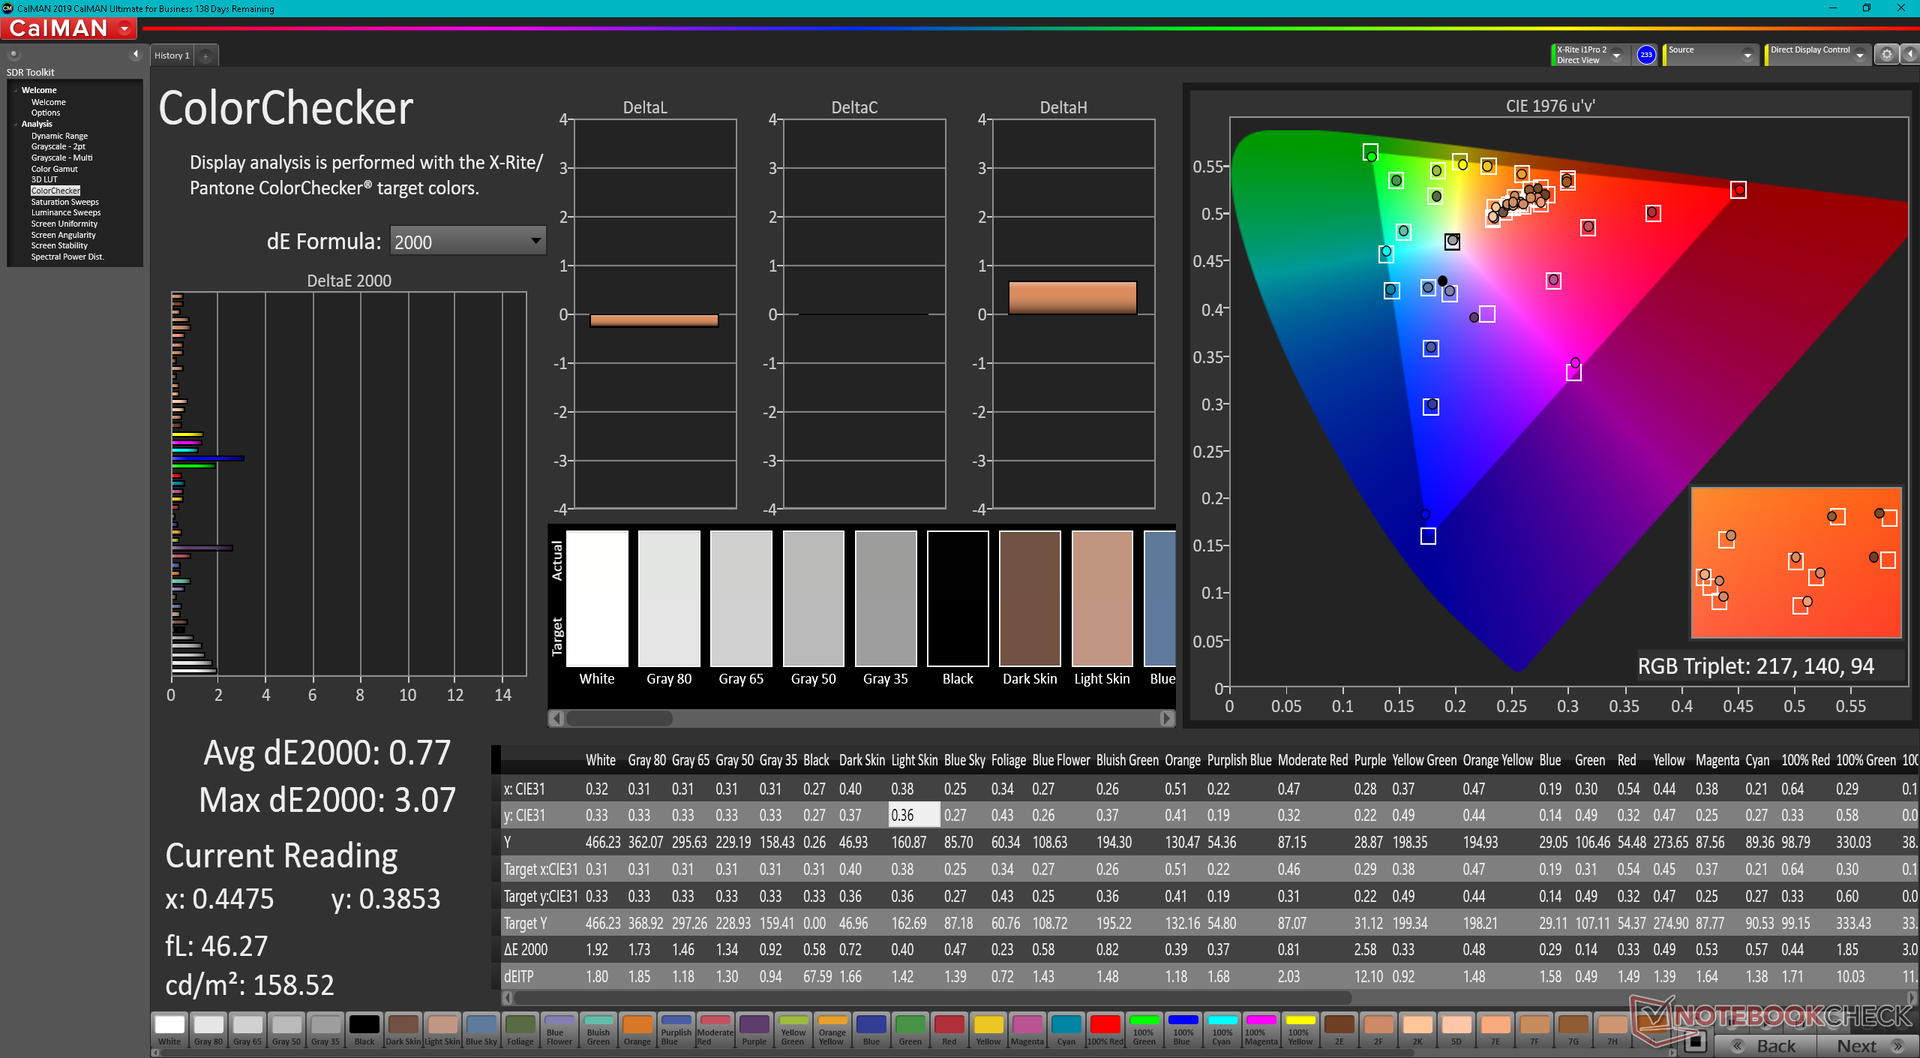
Our independent measurements show a slightly smaller sRGB coverage of 93 percent but a slightly brighter average maximum brightness of 445 nits. It's still a quality display considering its high contrast ratio of over 1000:1, but we're hopeful that future SKUs will include OLED for faster black-white and gray-gray response times or at least higher refresh rate panels for a smoother UI.
| |||||||||||||||||||||||||
Brightness Distribution: 89 %
Center on Battery: 460.1 cd/m²
Contrast: 1484:1 (Black: 0.31 cd/m²)
ΔE ColorChecker Calman: 2.42 | ∀{0.5-29.43 Ø4.73}
calibrated: 0.77
ΔE Greyscale Calman: 2.3 | ∀{0.09-98 Ø4.97}
68.2% AdobeRGB 1998 (Argyll 3D)
93.5% sRGB (Argyll 3D)
66.1% Display P3 (Argyll 3D)
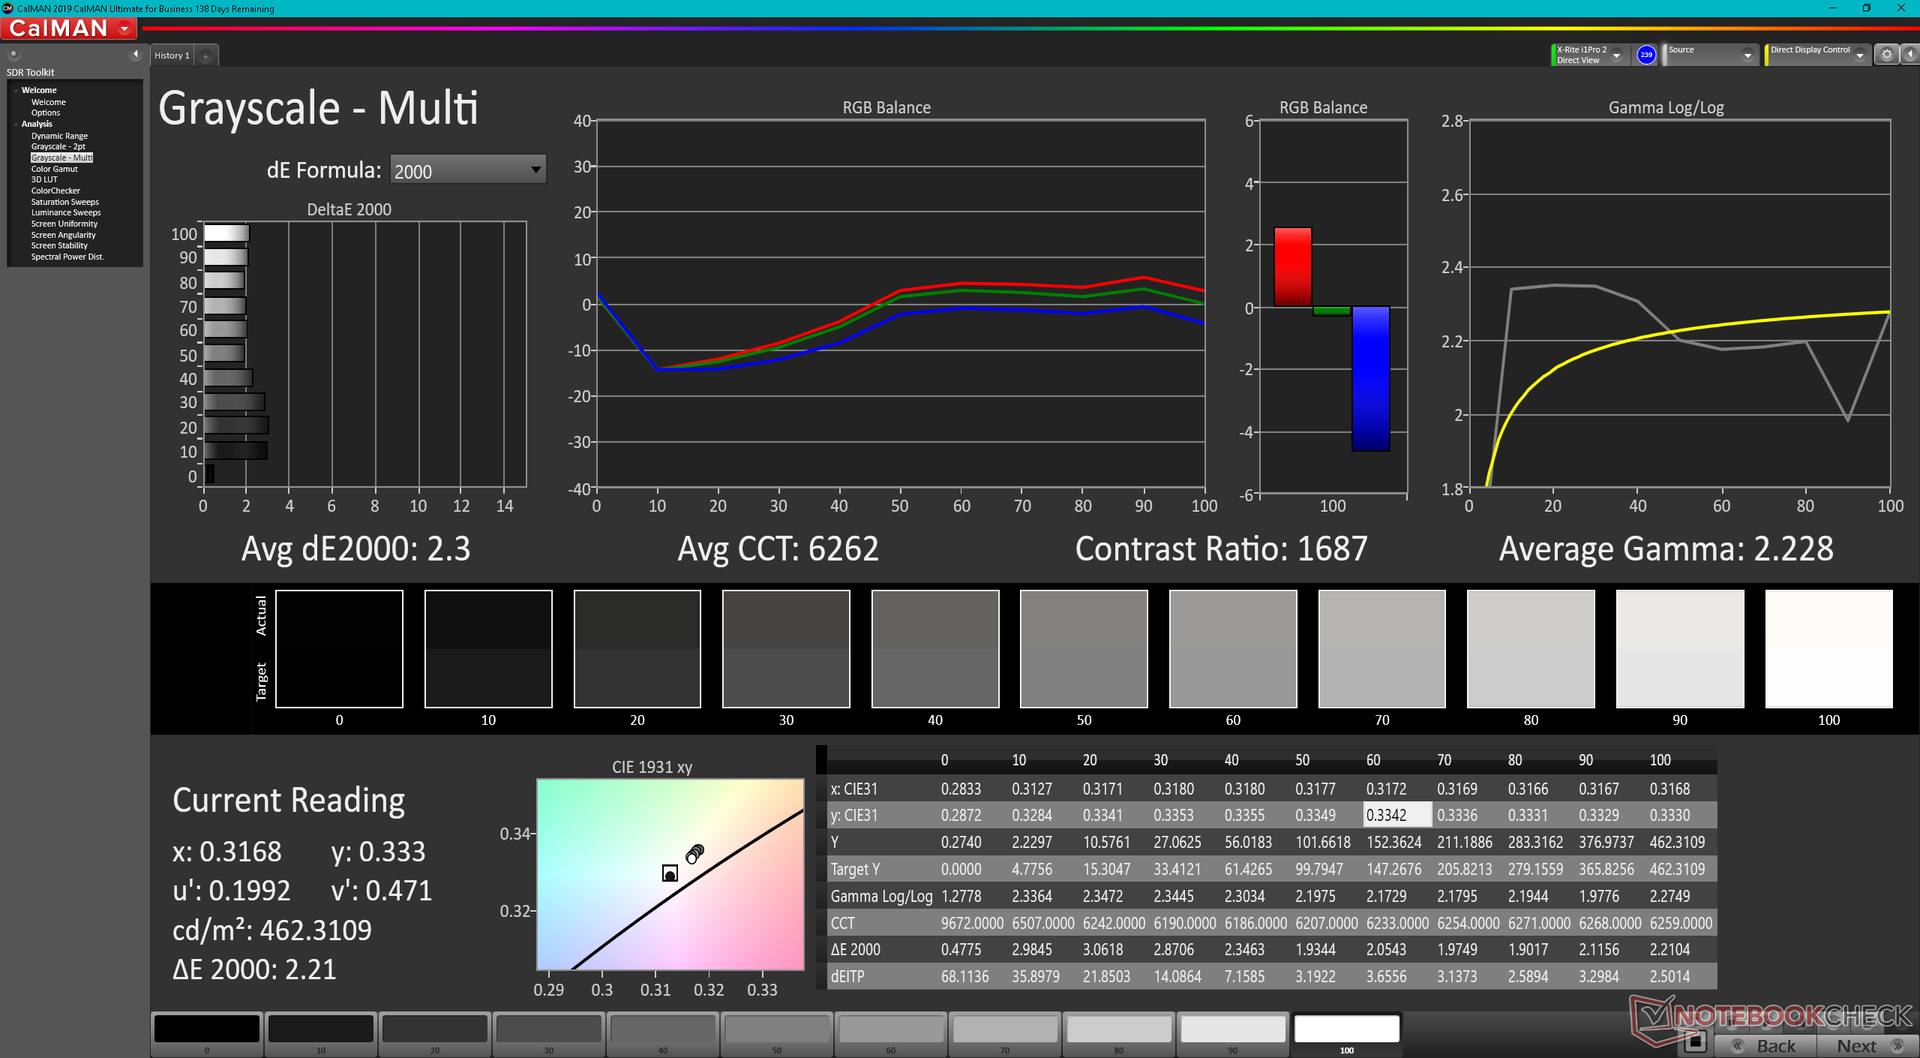
Gamma: 2.23
CCT: 6262 K
| Dell Latitude 13 7330 LG Philips 133WF9, IPS, 1920x1080, 13.3" | Lenovo ThinkPad X13 Yoga 20SX0004GE N133HCG-GR3, IPS, 1920x1080, 13.3" | Framework Laptop 13.5 12th Gen Intel BOE CQ NE135FBM-N41, IPS, 2256x1504, 13.5" | Razer Book 13 FHD Sharp LQ134N1JW48, IPS, 1920x1200, 13.4" | Dell Latitude 7310 AU Optronics B133HAN, IPS, 1920x1080, 13.3" | Microsoft Surface Laptop 4 13 i7 LQ135P1JX51, IPS, 2256x1504, 13.5" | |
|---|---|---|---|---|---|---|
| Display | 3% | 5% | 6% | 7% | 0% | |
| Display P3 Coverage (%) | 66.1 | 67.2 2% | 69.9 6% | 70.1 6% | 71.8 9% | 64.7 -2% |
| sRGB Coverage (%) | 93.5 | 98.1 5% | 99.4 6% | 99.3 6% | 99.3 6% | 97.2 4% |
| AdobeRGB 1998 Coverage (%) | 68.2 | 69 1% | 71.1 4% | 71.6 5% | 72.4 6% | 66.9 -2% |
| Response Times | -6% | 18% | -24% | 10% | -32% | |
| Response Time Grey 50% / Grey 80% * (ms) | 48.4 ? | 56 ? -16% | 34.7 ? 28% | 56.8 ? -17% | 40.8 ? 16% | 62.8 ? -30% |
| Response Time Black / White * (ms) | 29.6 ? | 28 ? 5% | 27.5 ? 7% | 38.8 ? -31% | 28.8 ? 3% | 39.8 ? -34% |
| PWM Frequency (Hz) | 2475 ? | 21930 ? | ||||
| Screen | 2% | -25% | -9% | -9% | -11% | |
| Brightness middle (cd/m²) | 460.1 | 401 -13% | 449.6 -2% | 545.3 19% | 332.7 -28% | 413 -10% |
| Brightness (cd/m²) | 445 | 383 -14% | 431 -3% | 507 14% | 329 -26% | 400 -10% |
| Brightness Distribution (%) | 89 | 91 2% | 90 1% | 88 -1% | 89 0% | 94 6% |
| Black Level * (cd/m²) | 0.31 | 0.16 48% | 0.31 -0% | 0.31 -0% | 0.25 19% | 0.29 6% |
| Contrast (:1) | 1484 | 2506 69% | 1450 -2% | 1759 19% | 1331 -10% | 1424 -4% |
| Colorchecker dE 2000 * | 2.42 | 2.6 -7% | 2.76 -14% | 1.39 43% | 2.15 11% | 2.8 -16% |
| Colorchecker dE 2000 max. * | 3.97 | 4.2 -6% | 7.96 -101% | 2.61 34% | 3.89 2% | 7.2 -81% |
| Colorchecker dE 2000 calibrated * | 0.77 | 0.9 -17% | 0.58 25% | 2.72 -253% | 1.09 -42% | 0.8 -4% |
| Greyscale dE 2000 * | 2.3 | 3.3 -43% | 5.2 -126% | 1.3 43% | 2.5 -9% | 1.9 17% |
| Gamma | 2.23 99% | 2.01 109% | 2.23 99% | 2.2 100% | 2.3 96% | 2.12 104% |
| CCT | 6262 104% | 6076 107% | 6475 100% | 6476 100% | 6347 102% | 6510 100% |
| Color Space (Percent of AdobeRGB 1998) (%) | 62.7 | 65.9 | 64.1 | 61.6 | ||
| Color Space (Percent of sRGB) (%) | 98.1 | 99.6 | 99.4 | 97.2 | ||
| Total Average (Program / Settings) | -0% /
1% | -1% /
-12% | -9% /
-8% | 3% /
-3% | -14% /
-11% |
* ... smaller is better
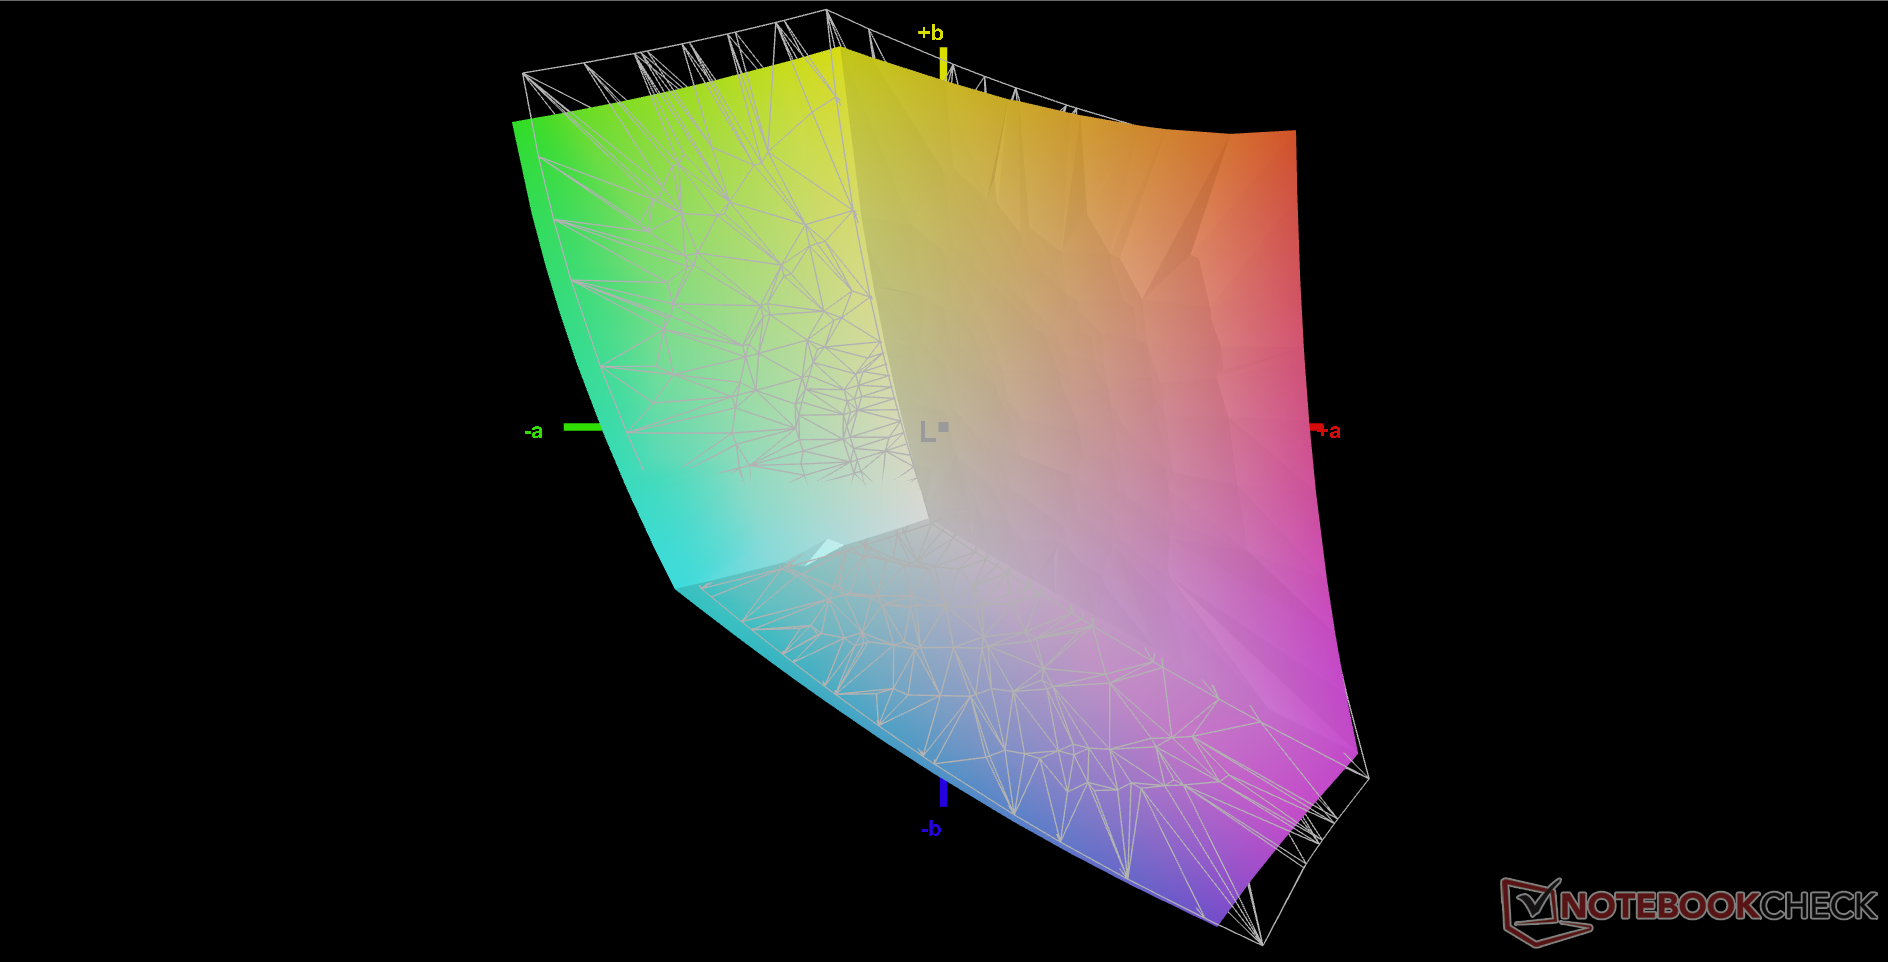
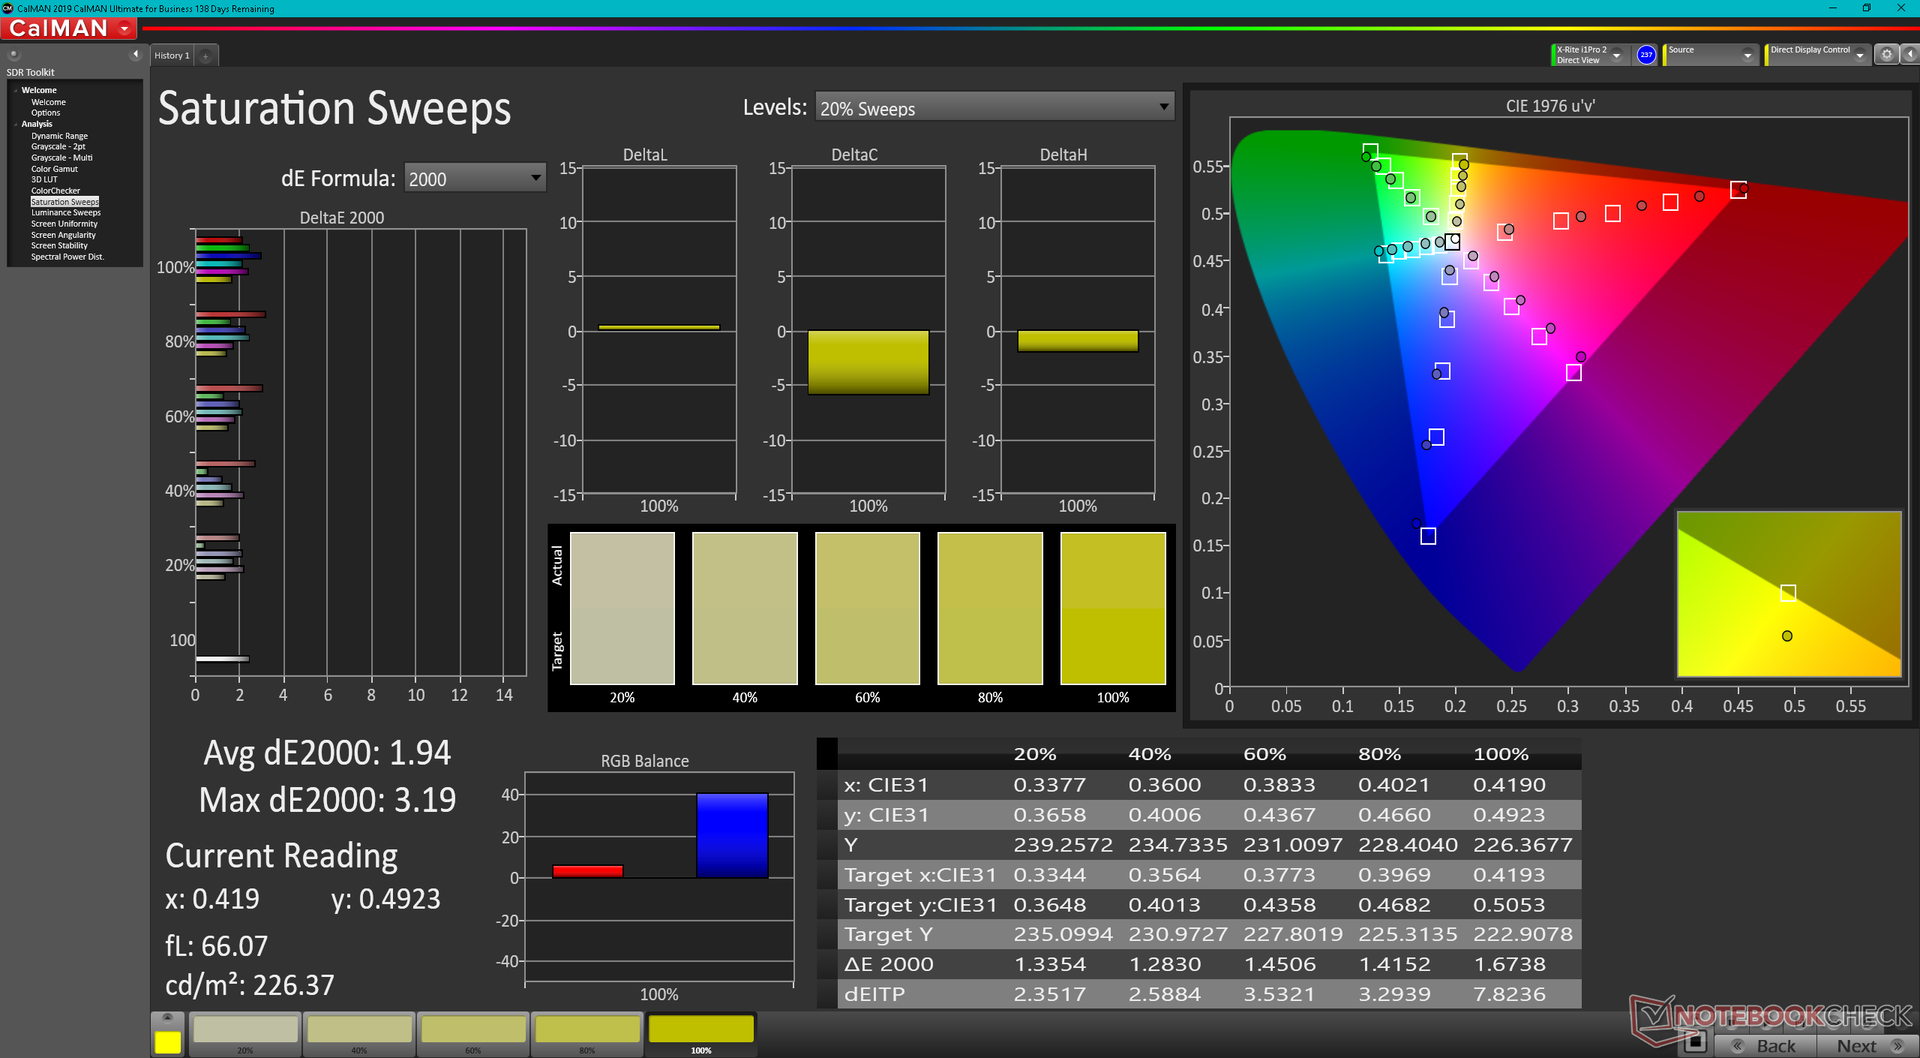
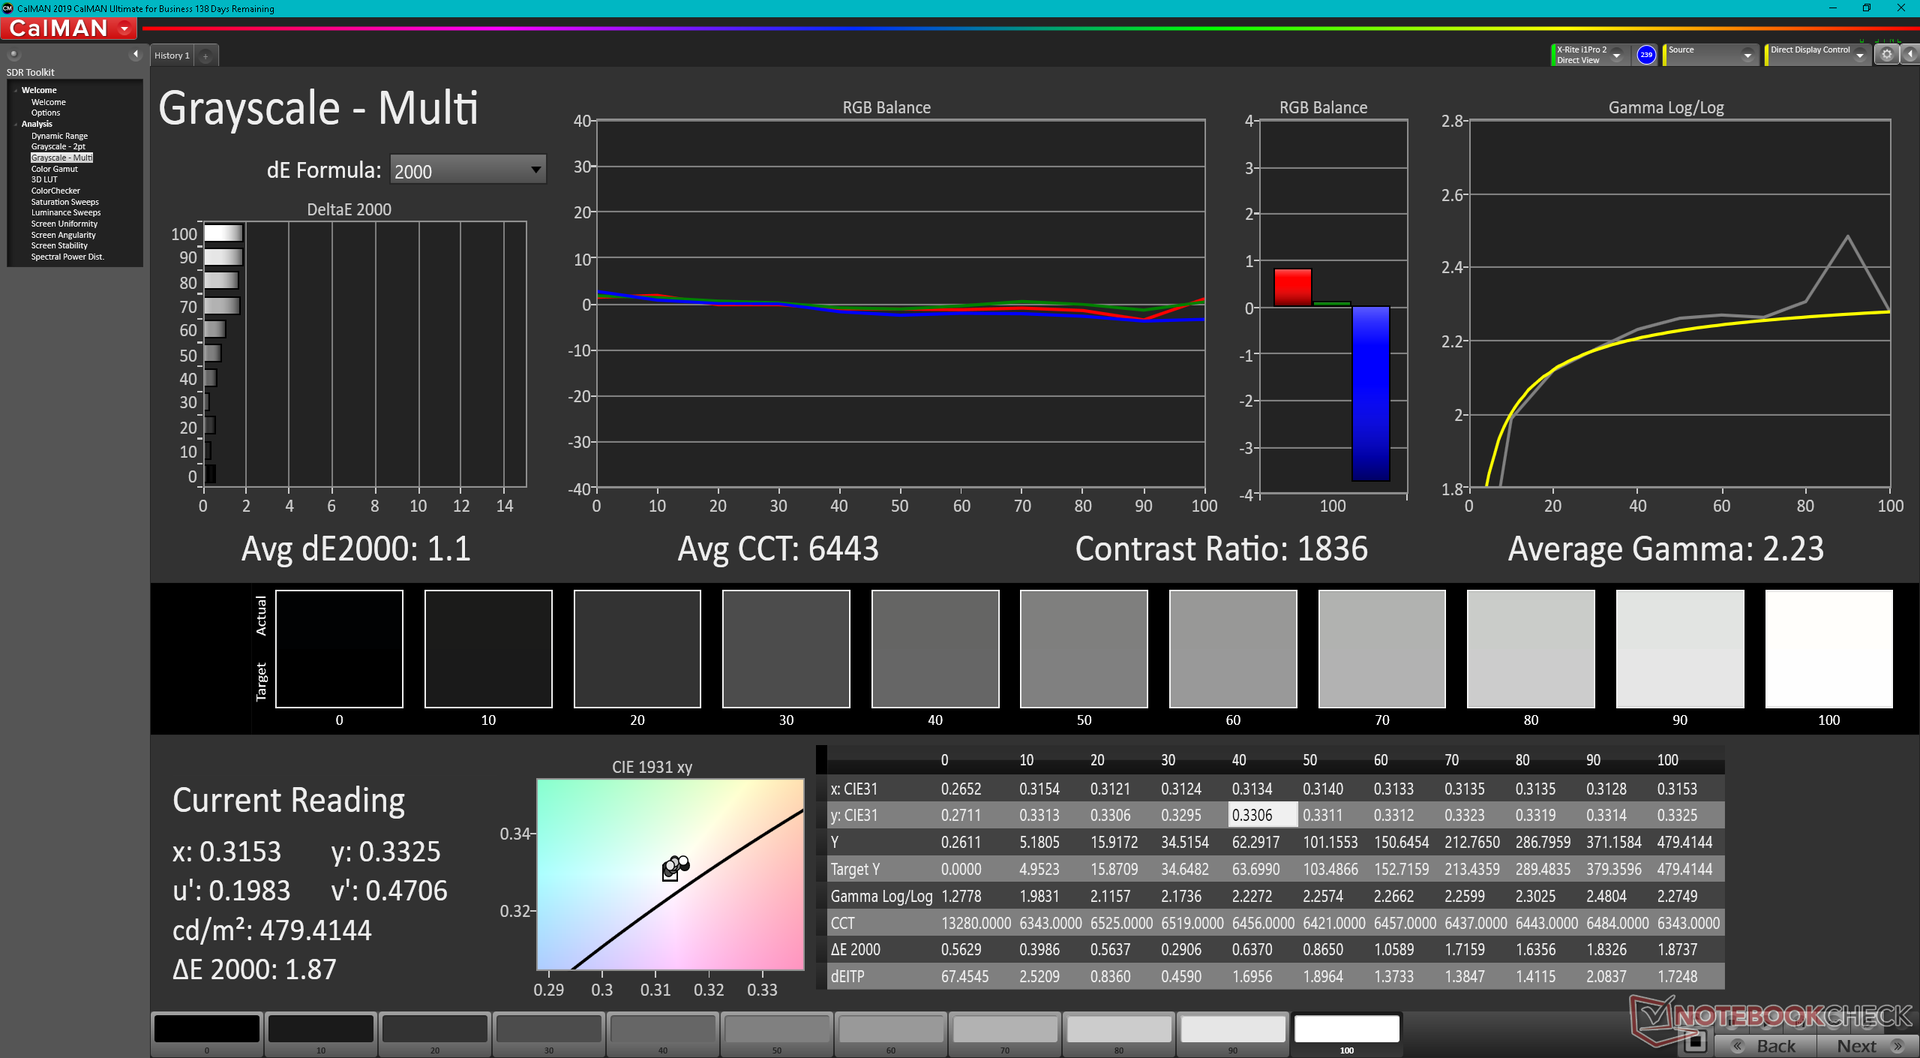
The display is well-calibrated out of the box with average grayscale and deltaE values of just 2.3 and 2.42, respectively, as shown by our CalMAN results below. Calibrating it even further ourselves with an X-Rite colorimeter would improve average DeltaE values to less than 1.


Display Response Times
| ↔ Response Time Black to White | ||
|---|---|---|
| 29.6 ms ... rise ↗ and fall ↘ combined | ↗ 14.8 ms rise | 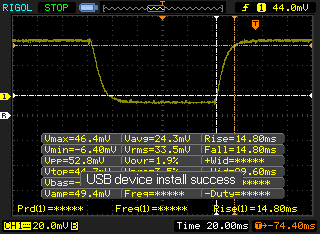 |
| ↘ 14.8 ms fall | ||
| The screen shows relatively slow response rates in our tests and may be too slow for gamers. In comparison, all tested devices range from 0.1 (minimum) to 240 (maximum) ms. » 79 % of all devices are better. This means that the measured response time is worse than the average of all tested devices (19.9 ms). | ||
| ↔ Response Time 50% Grey to 80% Grey | ||
| 48.4 ms ... rise ↗ and fall ↘ combined | ↗ 23.6 ms rise | 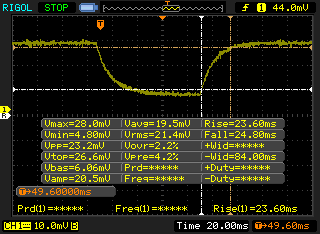 |
| ↘ 24.8 ms fall | ||
| The screen shows slow response rates in our tests and will be unsatisfactory for gamers. In comparison, all tested devices range from 0.165 (minimum) to 636 (maximum) ms. » 84 % of all devices are better. This means that the measured response time is worse than the average of all tested devices (31.1 ms). | ||
Screen Flickering / PWM (Pulse-Width Modulation)
| Screen flickering / PWM not detected | 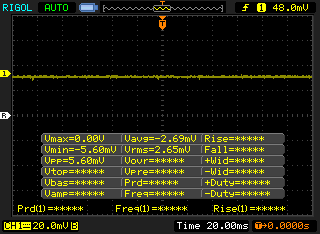 | ||
In comparison: 52 % of all tested devices do not use PWM to dim the display. If PWM was detected, an average of 7798 (minimum: 5 - maximum: 343500) Hz was measured. | |||
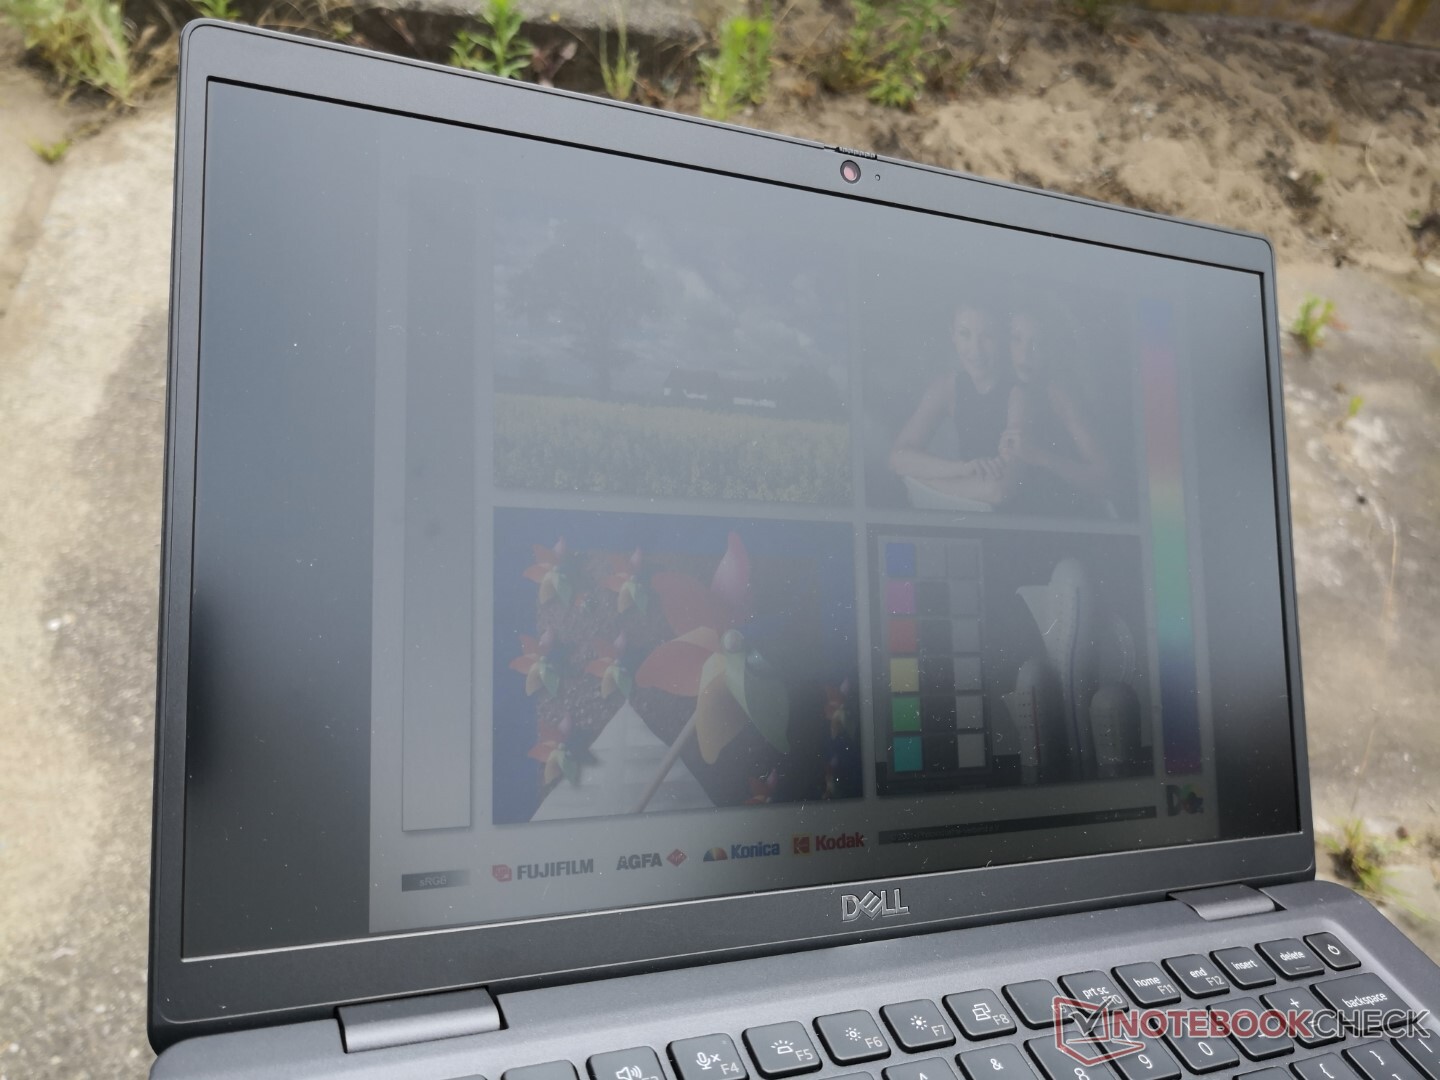
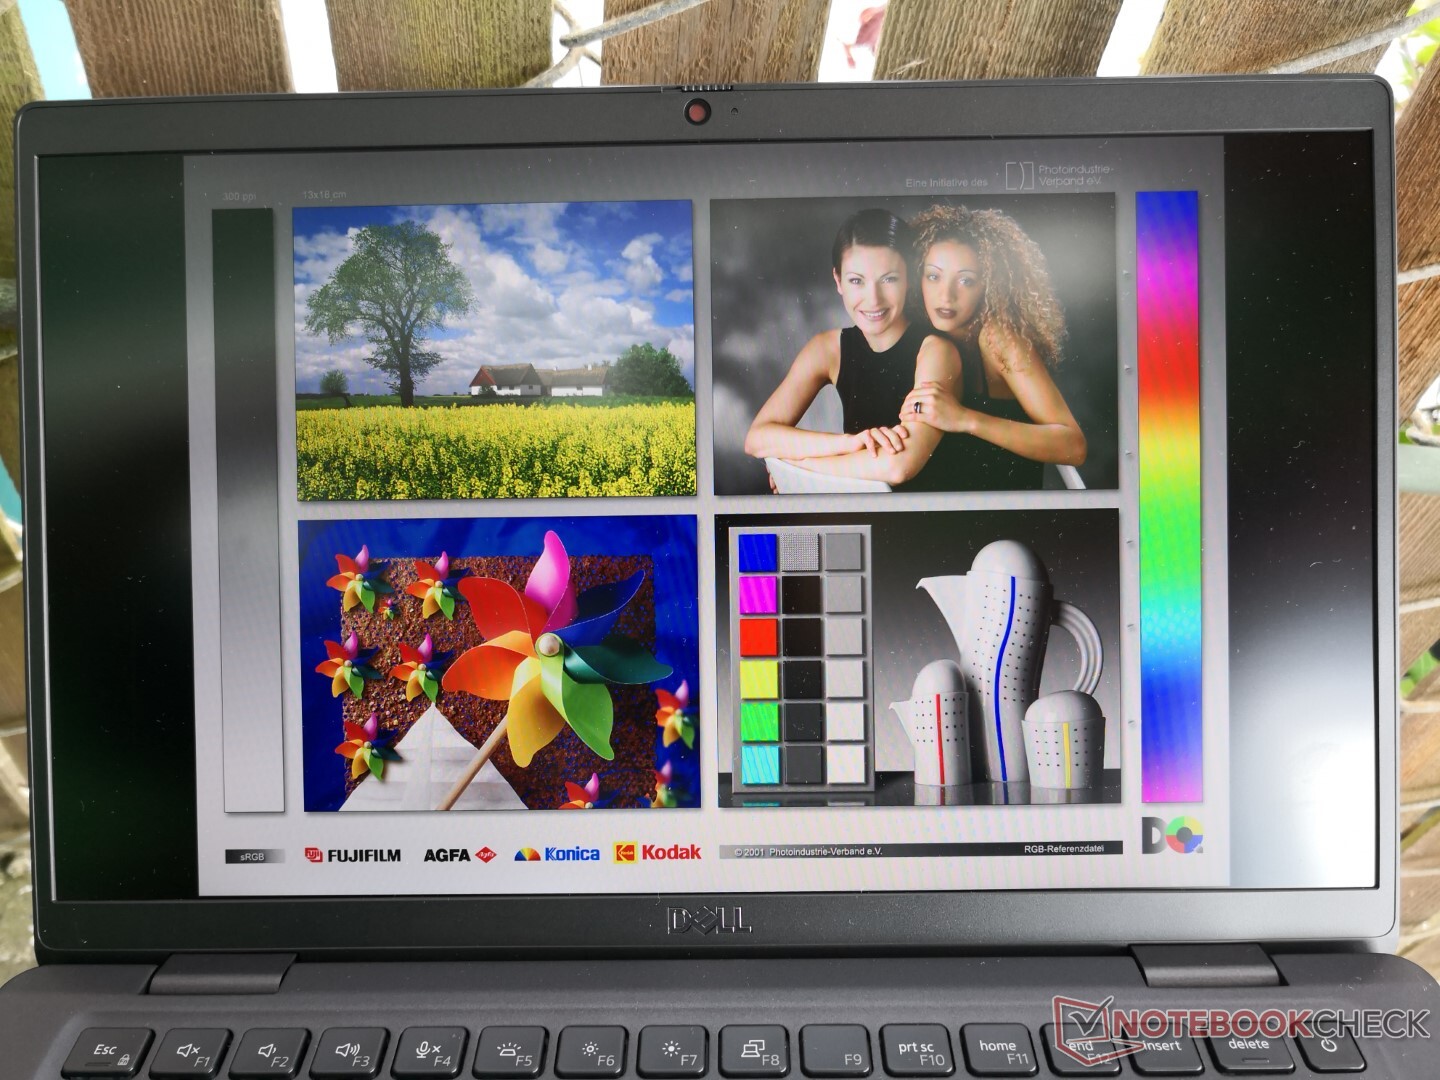
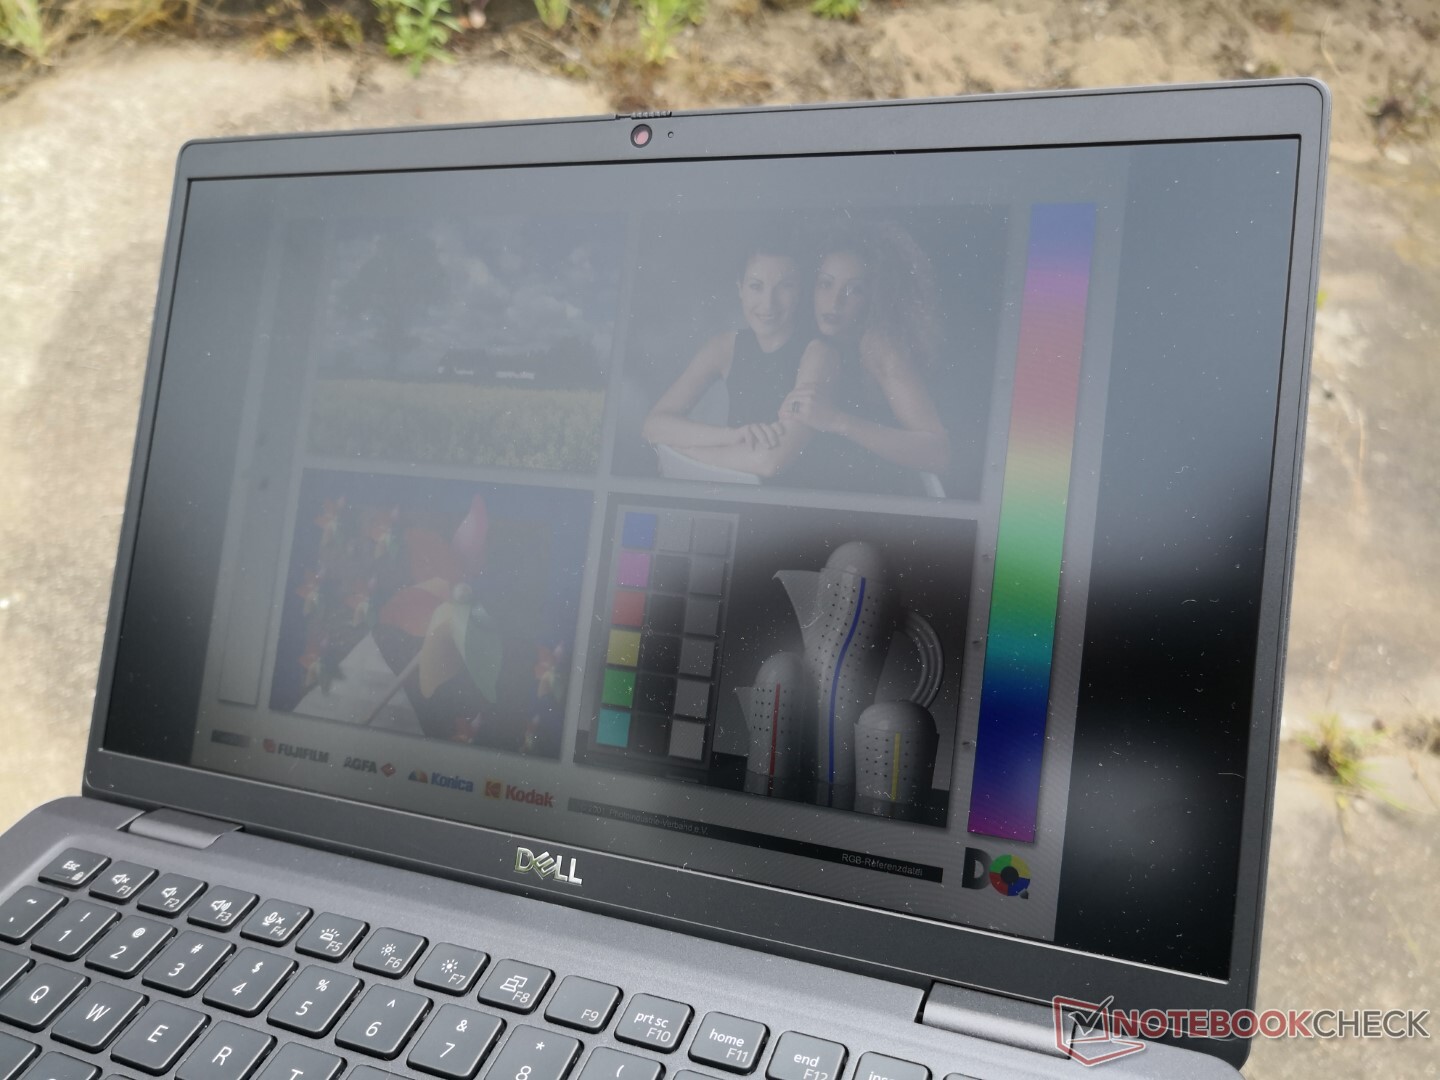
Outdoor visibility is quite good if working under shade due to the relatively bright ~450-nit display and matte overlay to reduce glare. It's still not bright enough for comfortable viewing on sunny or bright and cloudy days, however.

Performance — Core i7-1265U Impresses
Testing Conditions
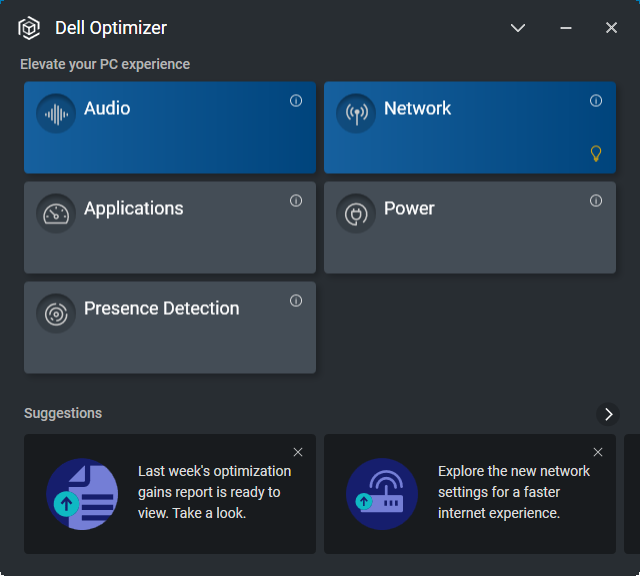
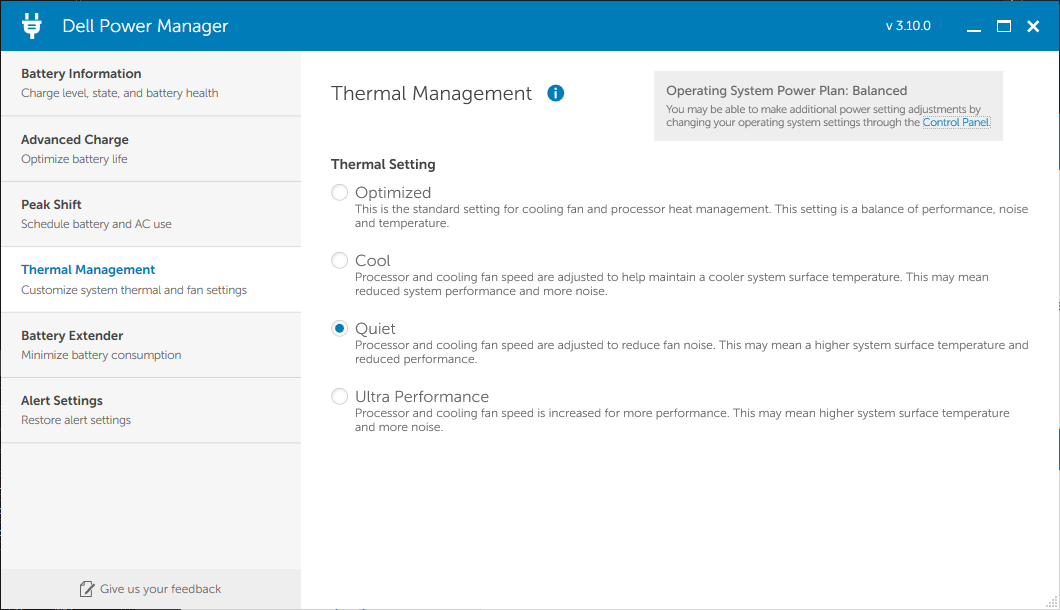
We set our unit to Performance mode and Ultra Performance mode vis Windows and the Dell Power Manager software, respectively, prior to running any benchmarks below. It's recommended that owners become familiar with the pre-installed Dell Power Manager, Optimizer, and Command applications as they serve as hubs for toggling model-specific updates and features.

Processor
After being disappointed with the Core i5-1235U, our hopes weren't very high for the Core i7-1265U. Fortunately, the i7-1265U is proving to be quite the speed demon despite it belonging to the U-series family. Raw single-thread and multi-thread performance is 20 percent and 60 percent higher than the average laptop in our database equipped with the last generation Core i7-1165G7. In fact, the CPU is only about 10 to 25 percent behind the more demanding Core i7-1260P. Some higher-end AMD CPUs like the Ryzen 7 5700U or 5800U can match or outperform the Core i7-1265U in multi-threaded workloads, but they still fall behind in single-threaded operations.
Performance sustainability is good, but it could definitely be better. Running CineBench R15 xT in a loop shows an initial score of 1379 points before steadily falling and stabilizing at around 1000 points representing a performance dip of about 27 percent. The limited cooling potential of the small cooling solution is likely preventing the CPU from running at higher clock rates for longer periods.
Cinebench R15 Multi Loop
Cinebench R23: Multi Core | Single Core
Cinebench R15: CPU Multi 64Bit | CPU Single 64Bit
Blender: v2.79 BMW27 CPU
7-Zip 18.03: 7z b 4 | 7z b 4 -mmt1
Geekbench 5.5: Multi-Core | Single-Core
HWBOT x265 Benchmark v2.2: 4k Preset
LibreOffice : 20 Documents To PDF
R Benchmark 2.5: Overall mean
| Cinebench R23 / Multi Core | |
| Framework Laptop 13.5 12th Gen Intel | |
| MSI Summit E14 Flip Evo A12MT | |
| Dell Latitude 13 7330 | |
| HP Pavilion Aero 13 be0097nr | |
| Asus ZenBook 13 OLED UM325UA | |
| Average Intel Core i7-1265U (4332 - 9219, n=10) | |
| Microsoft Surface Laptop 4 13 Ryzen 5 | |
| Razer Book 13 FHD | |
| Samsung Galaxy Book2 Pro 13 NP930XED-KA1DE | |
| Average Intel Core i7-1165G7 (2525 - 6862, n=64) | |
| Gateway Ultra Slim 14.1 GWTC51427 | |
| Dell Latitude 5320-TM4V2 | |
| Cinebench R23 / Single Core | |
| MSI Summit E14 Flip Evo A12MT | |
| Dell Latitude 13 7330 | |
| Framework Laptop 13.5 12th Gen Intel | |
| Average Intel Core i7-1265U (1144 - 1820, n=10) | |
| Gateway Ultra Slim 14.1 GWTC51427 | |
| Average Intel Core i7-1165G7 (1110 - 1539, n=59) | |
| HP Pavilion Aero 13 be0097nr | |
| Dell Latitude 5320-TM4V2 | |
| Asus ZenBook 13 OLED UM325UA | |
| Microsoft Surface Laptop 4 13 Ryzen 5 | |
| Samsung Galaxy Book2 Pro 13 NP930XED-KA1DE | |
Cinebench R23: Multi Core | Single Core
Cinebench R15: CPU Multi 64Bit | CPU Single 64Bit
Blender: v2.79 BMW27 CPU
7-Zip 18.03: 7z b 4 | 7z b 4 -mmt1
Geekbench 5.5: Multi-Core | Single-Core
HWBOT x265 Benchmark v2.2: 4k Preset
LibreOffice : 20 Documents To PDF
R Benchmark 2.5: Overall mean
* ... smaller is better
AIDA64: FP32 Ray-Trace | FPU Julia | CPU SHA3 | CPU Queen | FPU SinJulia | FPU Mandel | CPU AES | CPU ZLib | FP64 Ray-Trace | CPU PhotoWorxx
| Performance rating | |
| Microsoft Surface Laptop 4 13 Ryzen 5 | |
| Framework Laptop 13.5 12th Gen Intel | |
| Dell Latitude 13 7330 | |
| Dell Latitude 7310 | |
| Lenovo ThinkPad X13 Yoga 20SX0004GE | |
| AIDA64 / FP32 Ray-Trace | |
| Microsoft Surface Laptop 4 13 Ryzen 5 | |
| Dell Latitude 13 7330 | |
| Framework Laptop 13.5 12th Gen Intel | |
| Dell Latitude 7310 | |
| Lenovo ThinkPad X13 Yoga 20SX0004GE | |
| AIDA64 / FPU Julia | |
| Microsoft Surface Laptop 4 13 Ryzen 5 | |
| Dell Latitude 13 7330 | |
| Framework Laptop 13.5 12th Gen Intel | |
| Dell Latitude 7310 | |
| Lenovo ThinkPad X13 Yoga 20SX0004GE | |
| AIDA64 / CPU SHA3 | |
| Dell Latitude 13 7330 | |
| Framework Laptop 13.5 12th Gen Intel | |
| Microsoft Surface Laptop 4 13 Ryzen 5 | |
| Lenovo ThinkPad X13 Yoga 20SX0004GE | |
| Dell Latitude 7310 | |
| AIDA64 / CPU Queen | |
| Framework Laptop 13.5 12th Gen Intel | |
| Microsoft Surface Laptop 4 13 Ryzen 5 | |
| Dell Latitude 13 7330 | |
| Dell Latitude 7310 | |
| Lenovo ThinkPad X13 Yoga 20SX0004GE | |
| AIDA64 / FPU SinJulia | |
| Microsoft Surface Laptop 4 13 Ryzen 5 | |
| Framework Laptop 13.5 12th Gen Intel | |
| Dell Latitude 13 7330 | |
| Dell Latitude 7310 | |
| Lenovo ThinkPad X13 Yoga 20SX0004GE | |
| AIDA64 / FPU Mandel | |
| Microsoft Surface Laptop 4 13 Ryzen 5 | |
| Dell Latitude 13 7330 | |
| Framework Laptop 13.5 12th Gen Intel | |
| Dell Latitude 7310 | |
| Lenovo ThinkPad X13 Yoga 20SX0004GE | |
| AIDA64 / CPU AES | |
| Framework Laptop 13.5 12th Gen Intel | |
| Dell Latitude 13 7330 | |
| Microsoft Surface Laptop 4 13 Ryzen 5 | |
| Lenovo ThinkPad X13 Yoga 20SX0004GE | |
| Dell Latitude 7310 | |
| AIDA64 / CPU ZLib | |
| Framework Laptop 13.5 12th Gen Intel | |
| Microsoft Surface Laptop 4 13 Ryzen 5 | |
| Dell Latitude 13 7330 | |
| Lenovo ThinkPad X13 Yoga 20SX0004GE | |
| Dell Latitude 7310 | |
| AIDA64 / FP64 Ray-Trace | |
| Microsoft Surface Laptop 4 13 Ryzen 5 | |
| Dell Latitude 13 7330 | |
| Framework Laptop 13.5 12th Gen Intel | |
| Dell Latitude 7310 | |
| Lenovo ThinkPad X13 Yoga 20SX0004GE | |
| AIDA64 / CPU PhotoWorxx | |
| Framework Laptop 13.5 12th Gen Intel | |
| Dell Latitude 13 7330 | |
| Dell Latitude 7310 | |
| Microsoft Surface Laptop 4 13 Ryzen 5 | |
| Lenovo ThinkPad X13 Yoga 20SX0004GE | |
System Performance
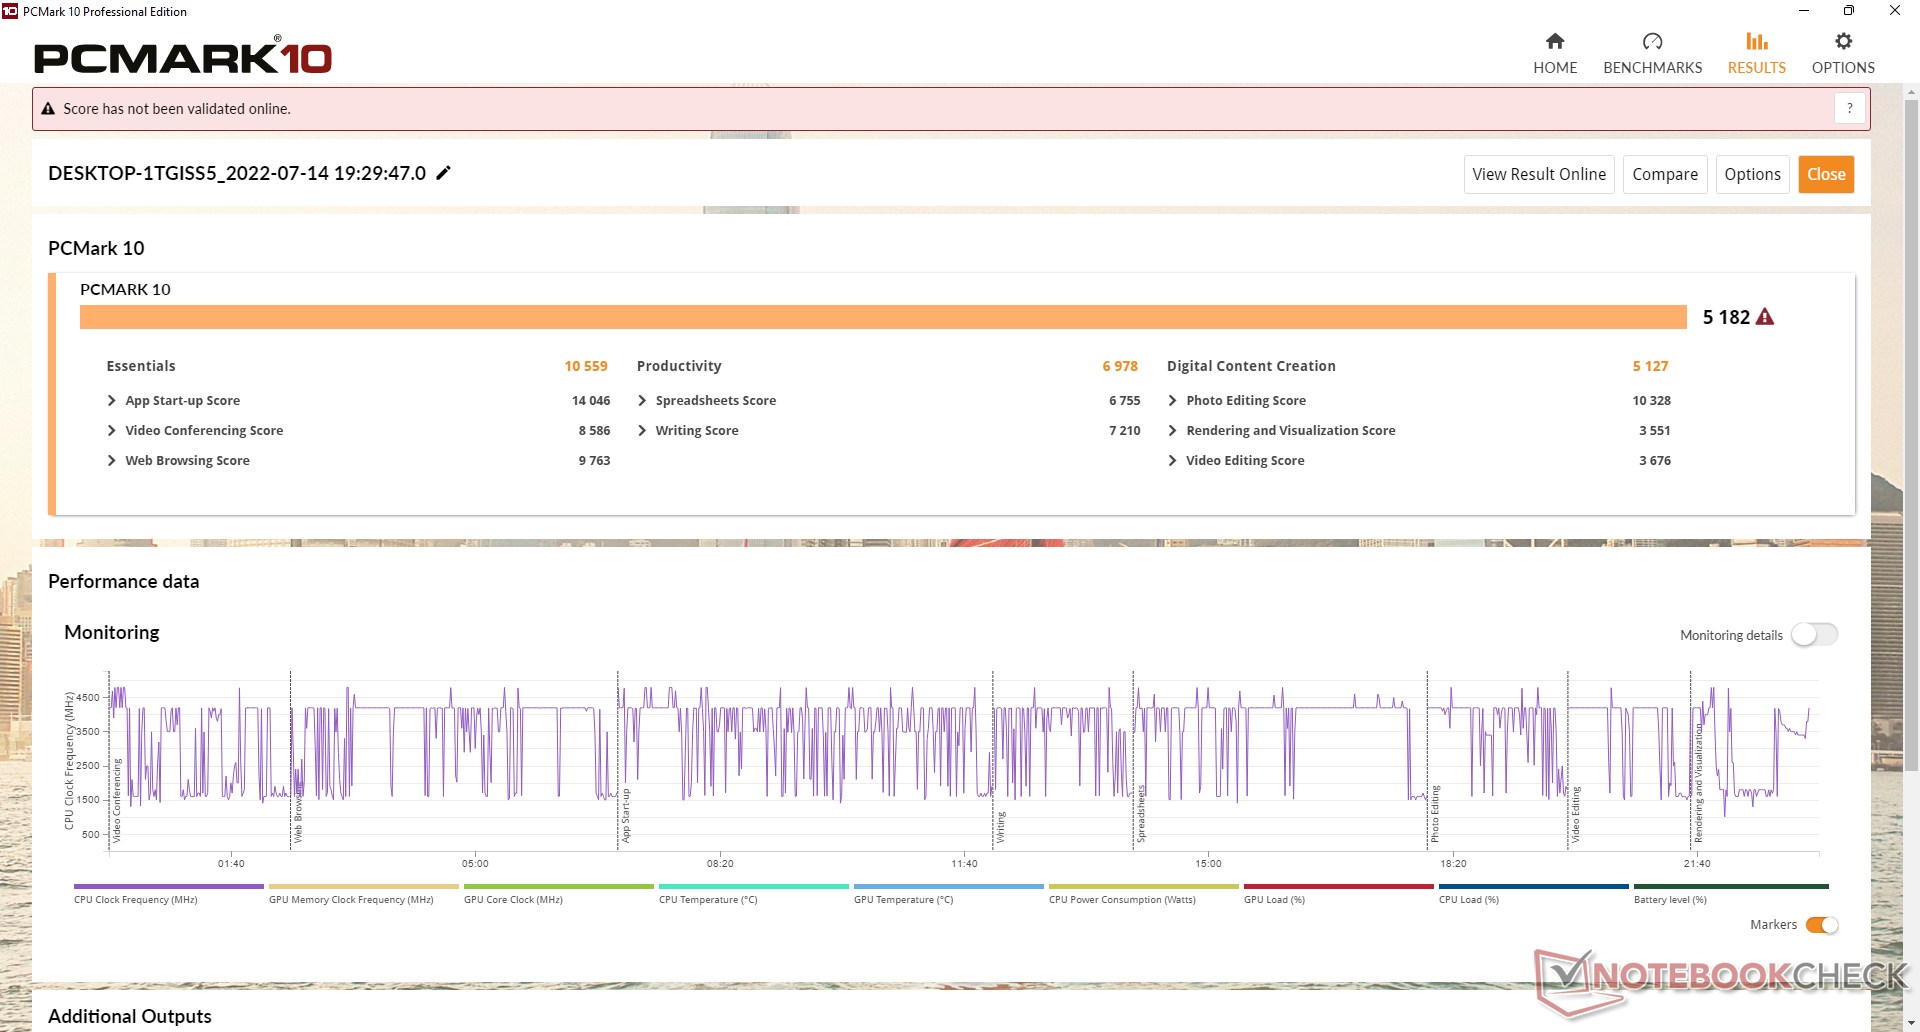
PCMark scores are higher than on many other business laptops running on last generation or older CPUs such as the Microsoft Surface Laptop 4 or especially the Latitude 7310. The Razer Book 13 comes very close due to its faster SSD and integrated graphics performance.
CrossMark: Overall | Productivity | Creativity | Responsiveness
| PCMark 10 / Score | |
| Framework Laptop 13.5 12th Gen Intel | |
| Average Intel Core i7-1265U, Intel Iris Xe Graphics G7 96EUs (4753 - 5766, n=7) | |
| Dell Latitude 13 7330 | |
| Razer Book 13 FHD | |
| Microsoft Surface Laptop 4 13 Ryzen 5 | |
| Dell Latitude 7310 | |
| Lenovo ThinkPad X13 Yoga 20SX0004GE | |
| PCMark 10 / Essentials | |
| Framework Laptop 13.5 12th Gen Intel | |
| Dell Latitude 13 7330 | |
| Average Intel Core i7-1265U, Intel Iris Xe Graphics G7 96EUs (9278 - 11418, n=7) | |
| Razer Book 13 FHD | |
| Lenovo ThinkPad X13 Yoga 20SX0004GE | |
| Dell Latitude 7310 | |
| Microsoft Surface Laptop 4 13 Ryzen 5 | |
| PCMark 10 / Productivity | |
| Dell Latitude 7310 | |
| Framework Laptop 13.5 12th Gen Intel | |
| Dell Latitude 13 7330 | |
| Lenovo ThinkPad X13 Yoga 20SX0004GE | |
| Razer Book 13 FHD | |
| Average Intel Core i7-1265U, Intel Iris Xe Graphics G7 96EUs (5828 - 7311, n=7) | |
| Microsoft Surface Laptop 4 13 Ryzen 5 | |
| PCMark 10 / Digital Content Creation | |
| Framework Laptop 13.5 12th Gen Intel | |
| Average Intel Core i7-1265U, Intel Iris Xe Graphics G7 96EUs (5127 - 6330, n=7) | |
| Razer Book 13 FHD | |
| Dell Latitude 13 7330 | |
| Microsoft Surface Laptop 4 13 Ryzen 5 | |
| Dell Latitude 7310 | |
| Lenovo ThinkPad X13 Yoga 20SX0004GE | |
| CrossMark / Overall | |
| Framework Laptop 13.5 12th Gen Intel | |
| Average Intel Core i7-1265U, Intel Iris Xe Graphics G7 96EUs (1301 - 1615, n=7) | |
| Dell Latitude 13 7330 | |
| CrossMark / Productivity | |
| Framework Laptop 13.5 12th Gen Intel | |
| Dell Latitude 13 7330 | |
| Average Intel Core i7-1265U, Intel Iris Xe Graphics G7 96EUs (1230 - 1586, n=7) | |
| CrossMark / Creativity | |
| Framework Laptop 13.5 12th Gen Intel | |
| Average Intel Core i7-1265U, Intel Iris Xe Graphics G7 96EUs (1413 - 1706, n=7) | |
| Dell Latitude 13 7330 | |
| CrossMark / Responsiveness | |
| Framework Laptop 13.5 12th Gen Intel | |
| Average Intel Core i7-1265U, Intel Iris Xe Graphics G7 96EUs (1193 - 1521, n=7) | |
| Dell Latitude 13 7330 | |
| PCMark 10 Score | 5182 points | |
Help | ||
| AIDA64 / Memory Copy | |
| Average Intel Core i7-1265U (40212 - 72204, n=10) | |
| Framework Laptop 13.5 12th Gen Intel | |
| Dell Latitude 13 7330 | |
| Microsoft Surface Laptop 4 13 Ryzen 5 | |
| Dell Latitude 7310 | |
| Lenovo ThinkPad X13 Yoga 20SX0004GE | |
| AIDA64 / Memory Read | |
| Average Intel Core i7-1265U (41808 - 69493, n=10) | |
| Framework Laptop 13.5 12th Gen Intel | |
| Microsoft Surface Laptop 4 13 Ryzen 5 | |
| Dell Latitude 13 7330 | |
| Dell Latitude 7310 | |
| Lenovo ThinkPad X13 Yoga 20SX0004GE | |
| AIDA64 / Memory Write | |
| Average Intel Core i7-1265U (41382 - 76027, n=10) | |
| Framework Laptop 13.5 12th Gen Intel | |
| Dell Latitude 13 7330 | |
| Microsoft Surface Laptop 4 13 Ryzen 5 | |
| Dell Latitude 7310 | |
| Lenovo ThinkPad X13 Yoga 20SX0004GE | |
| AIDA64 / Memory Latency | |
| Microsoft Surface Laptop 4 13 Ryzen 5 | |
| Average Intel Core i7-1265U (74.6 - 112.4, n=10) | |
| Lenovo ThinkPad X13 Yoga 20SX0004GE | |
| Dell Latitude 7310 | |
| Framework Laptop 13.5 12th Gen Intel | |
| Dell Latitude 13 7330 | |
* ... smaller is better
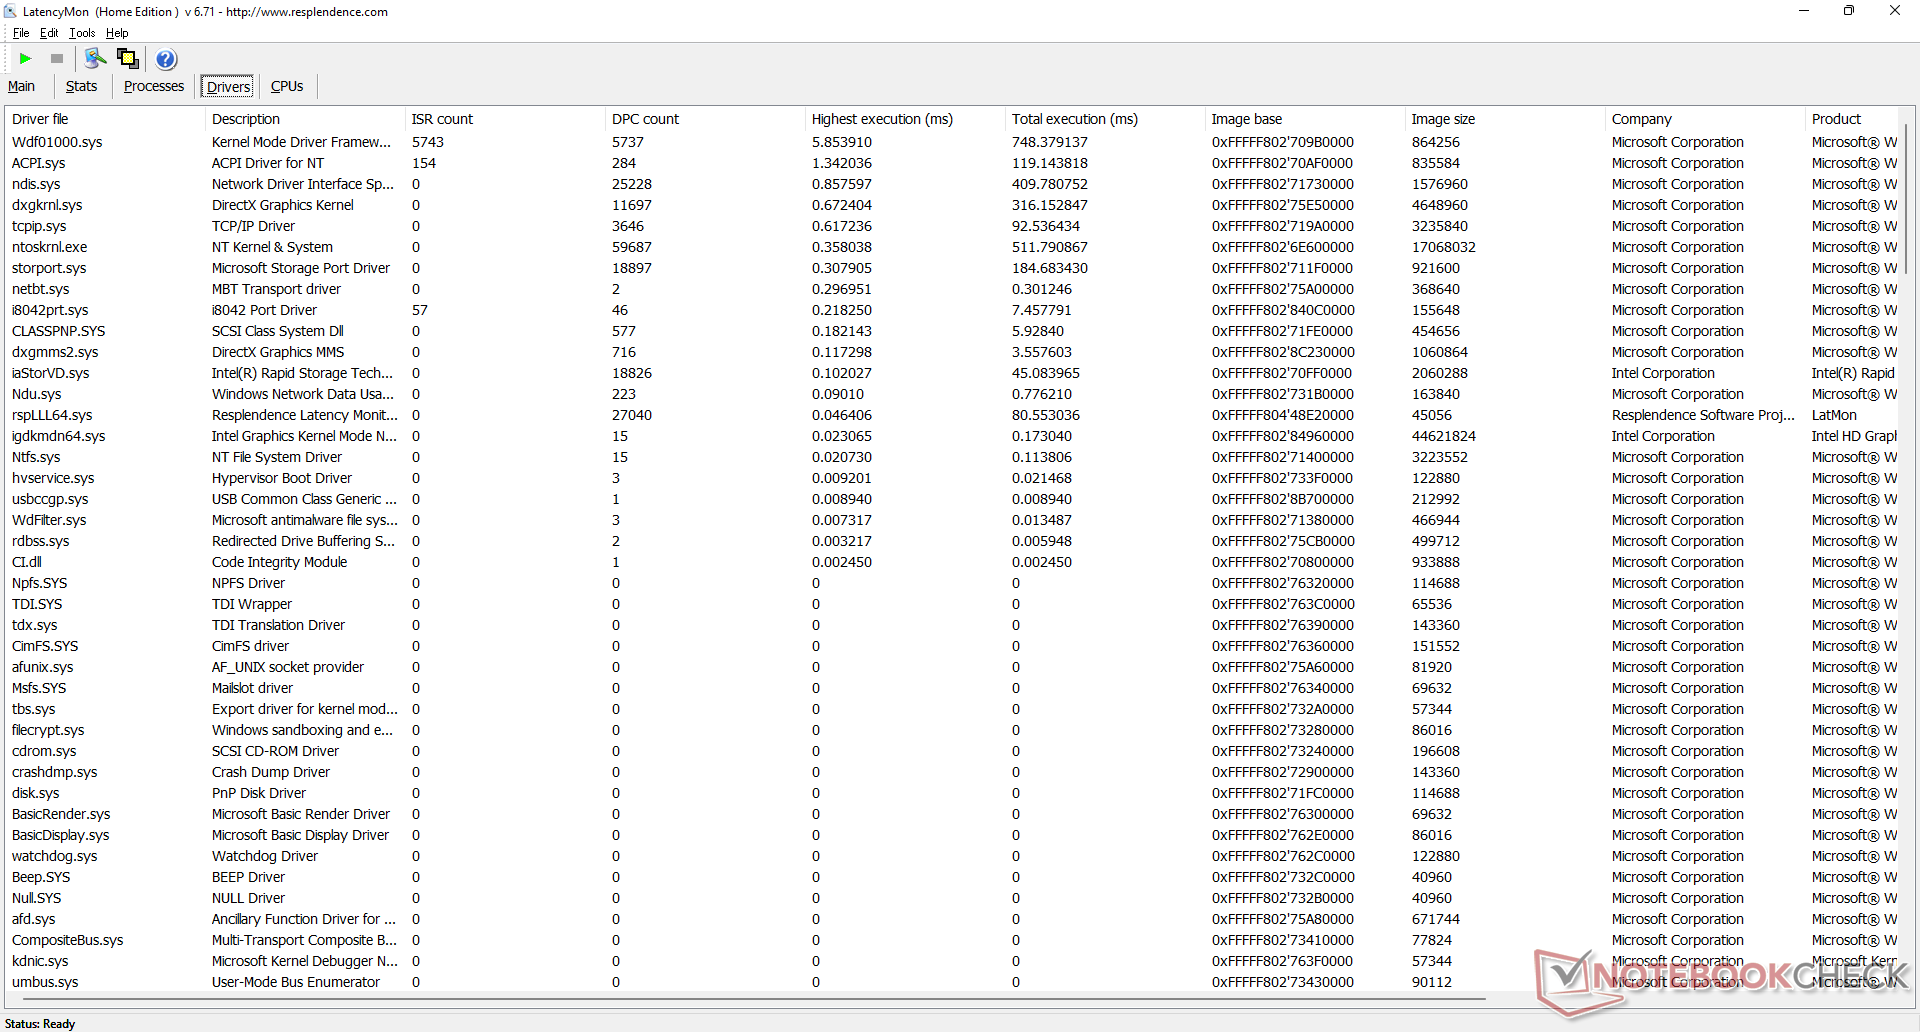
DPC Latency
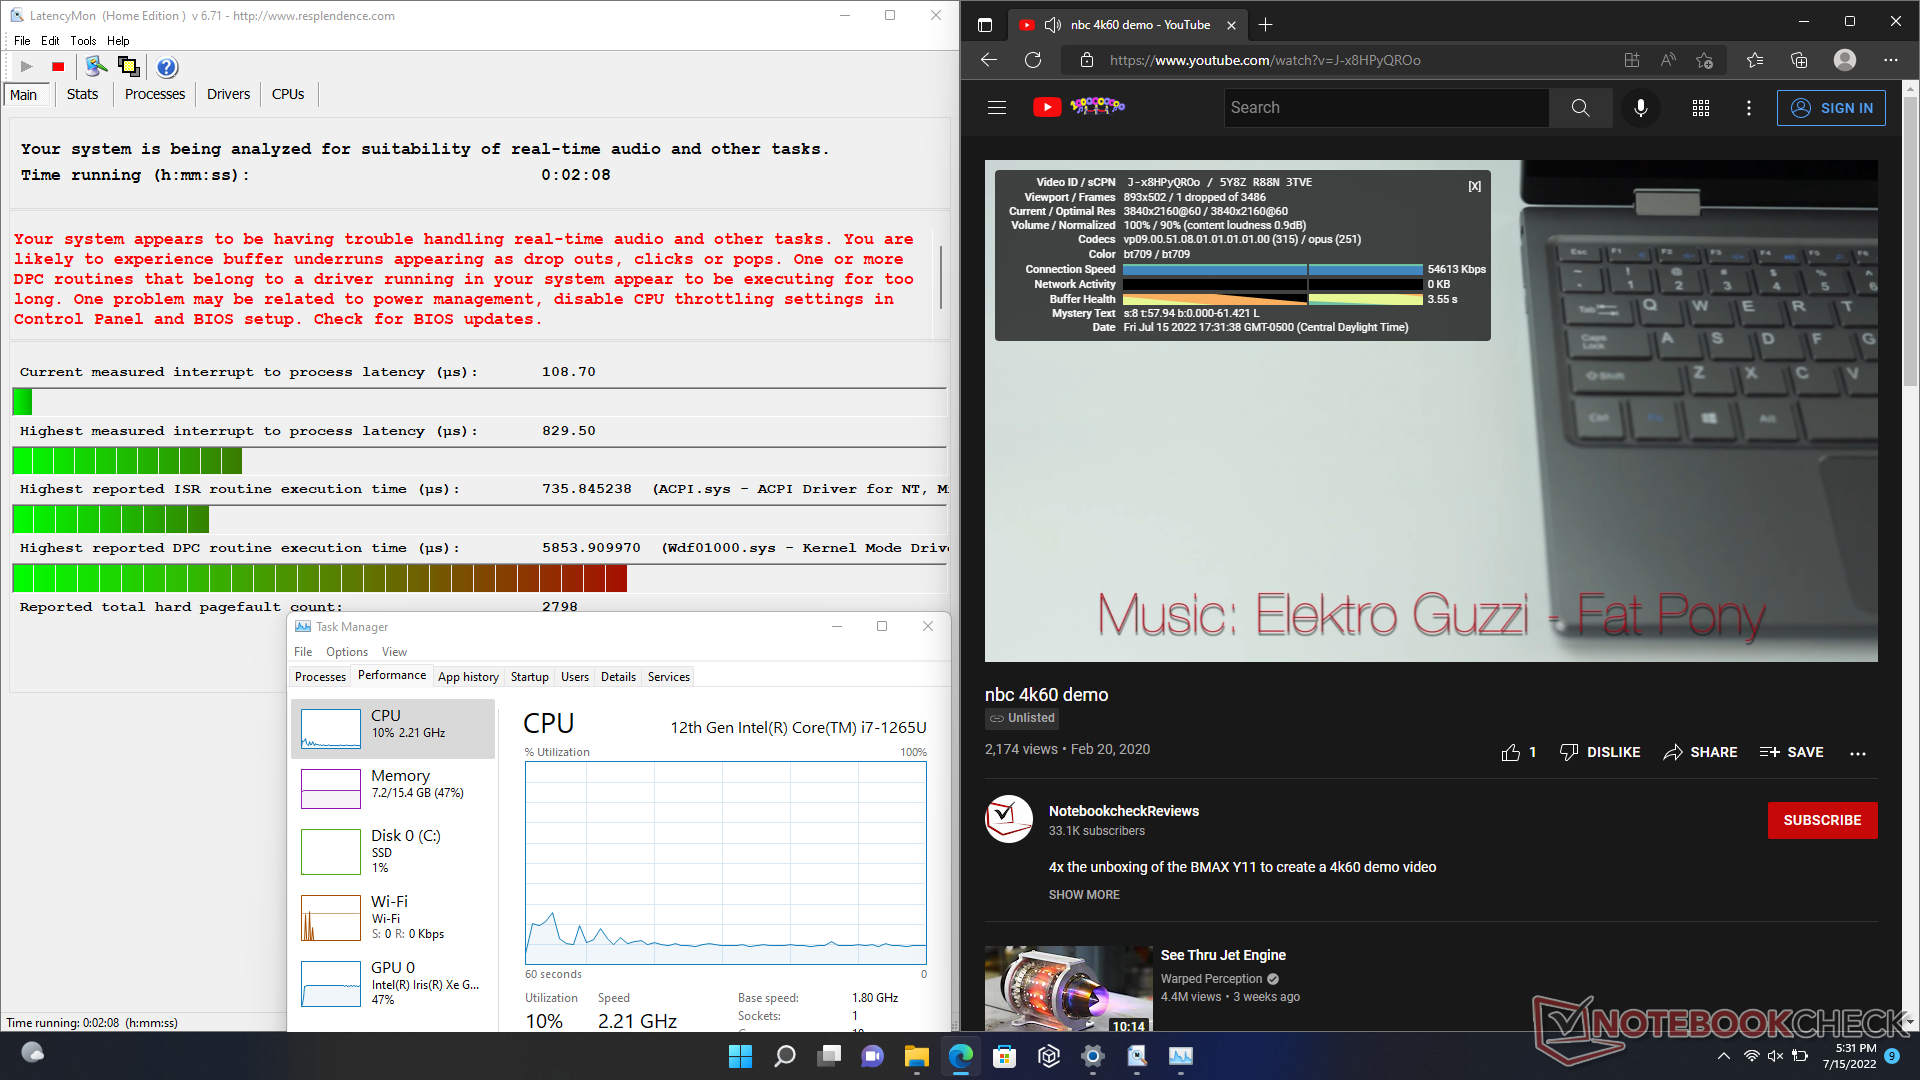
LatencyMon reveals DPC issues when opening multiple browser tabs on our homepage. 4K video playback at 60 FPS is otherwise perfect with just one dropped frame during our 60-seconds test video.
| DPC Latencies / LatencyMon - interrupt to process latency (max), Web, Youtube, Prime95 | |
| Razer Book 13 FHD | |
| Framework Laptop 13.5 12th Gen Intel | |
| Lenovo ThinkPad X13 Yoga 20SX0004GE | |
| Microsoft Surface Laptop 4 13 Ryzen 5 | |
| Dell Latitude 13 7330 | |
| Dell Latitude 7310 | |
* ... smaller is better
Storage Devices — One Internal Drive Only
Dell likes to ship many of its subnotebooks with shorter M.2 2230 SSDs compared to the longer 2280 drives on most other laptops. The 512 GB Kioxia PCIe3 x4 drive in our test unit would top out at 2400 MB/s for only a short period before throttling kicks in to reduce transfer rates to just 1200 MB/s as shown by our DiskSpd loop test results below. The drive is likely running into temperature limitations when stressed. In comparison, the HP EliteBook 845 G9 is able to sustain significantly faster transfer rates for longer periods with its included PCIe4 x4 drive when subjected to the same testing conditions.

| Drive Performance rating - Percent | |
| Lenovo ThinkPad X13 Yoga 20SX0004GE | |
| Framework Laptop 13.5 12th Gen Intel | |
| Dell Latitude 7310 | |
| Razer Book 13 FHD | |
| Dell Latitude 13 7330 | |
| Microsoft Surface Laptop 4 13 Ryzen 5 | |
* ... smaller is better
Disk Throttling: DiskSpd Read Loop, Queue Depth 8
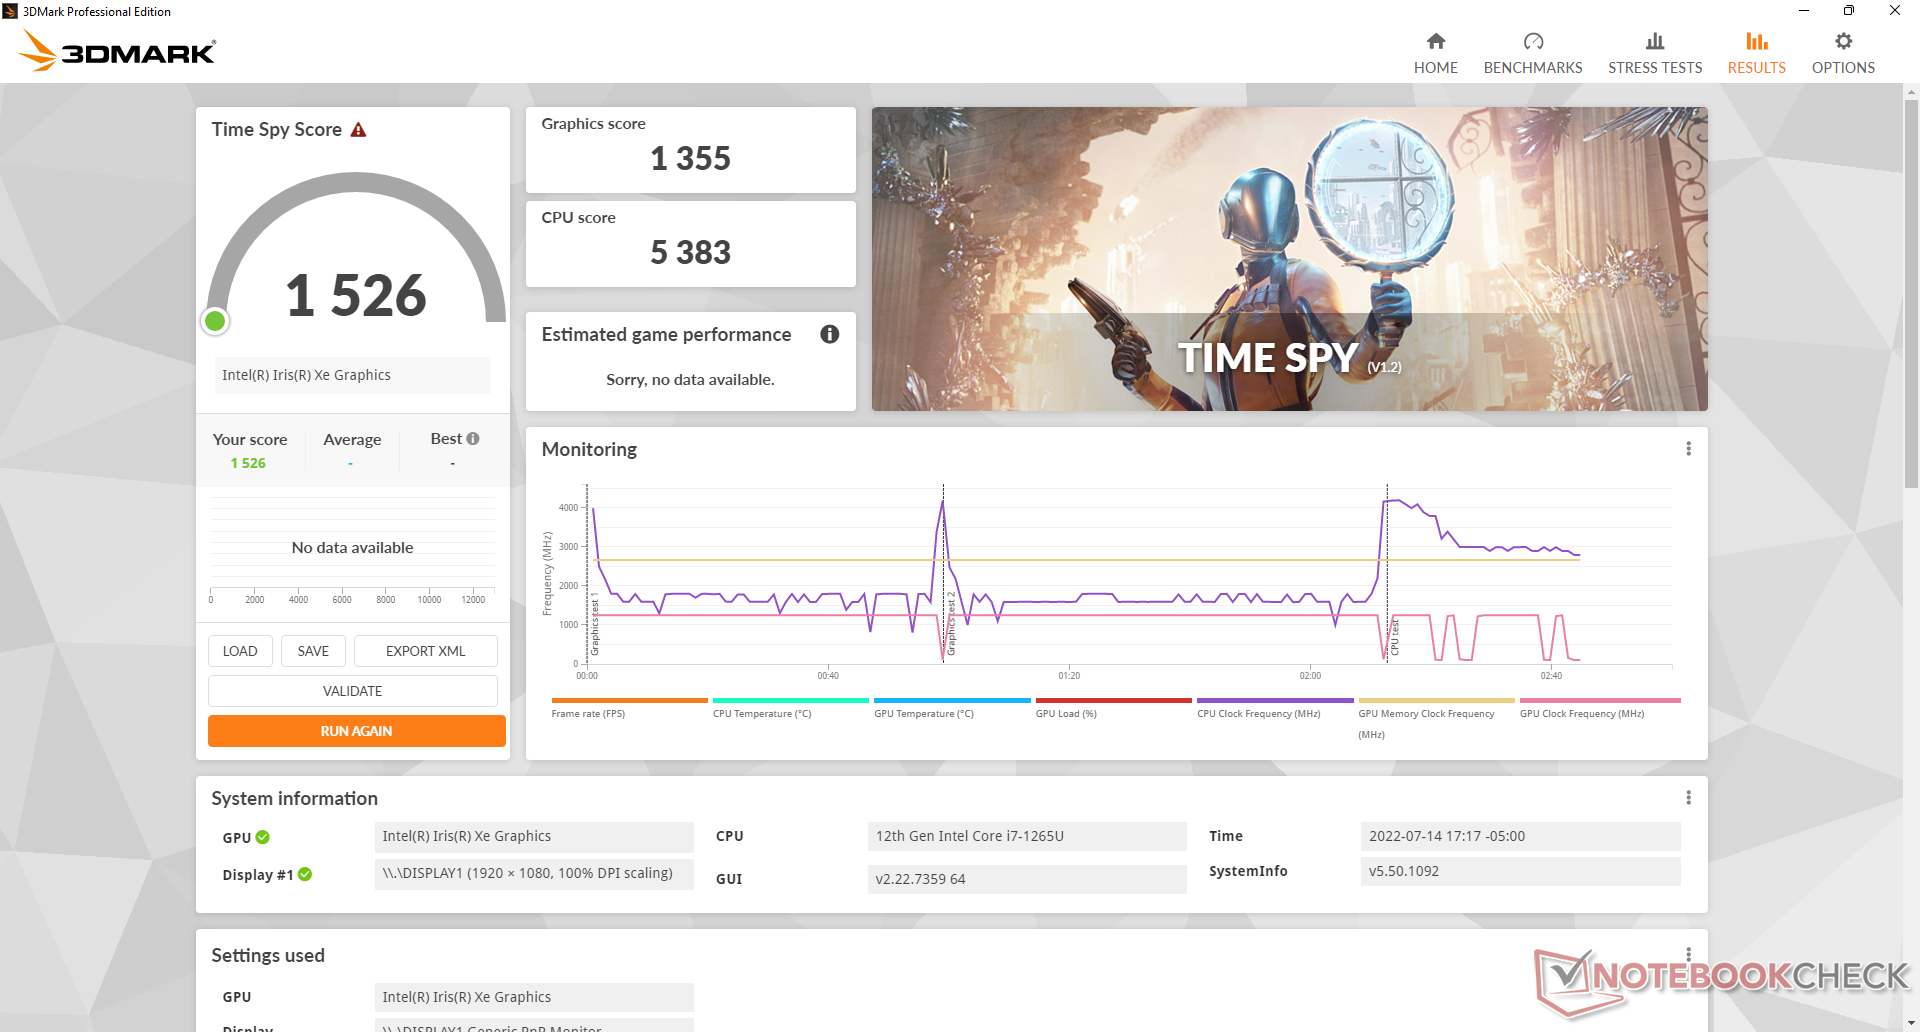
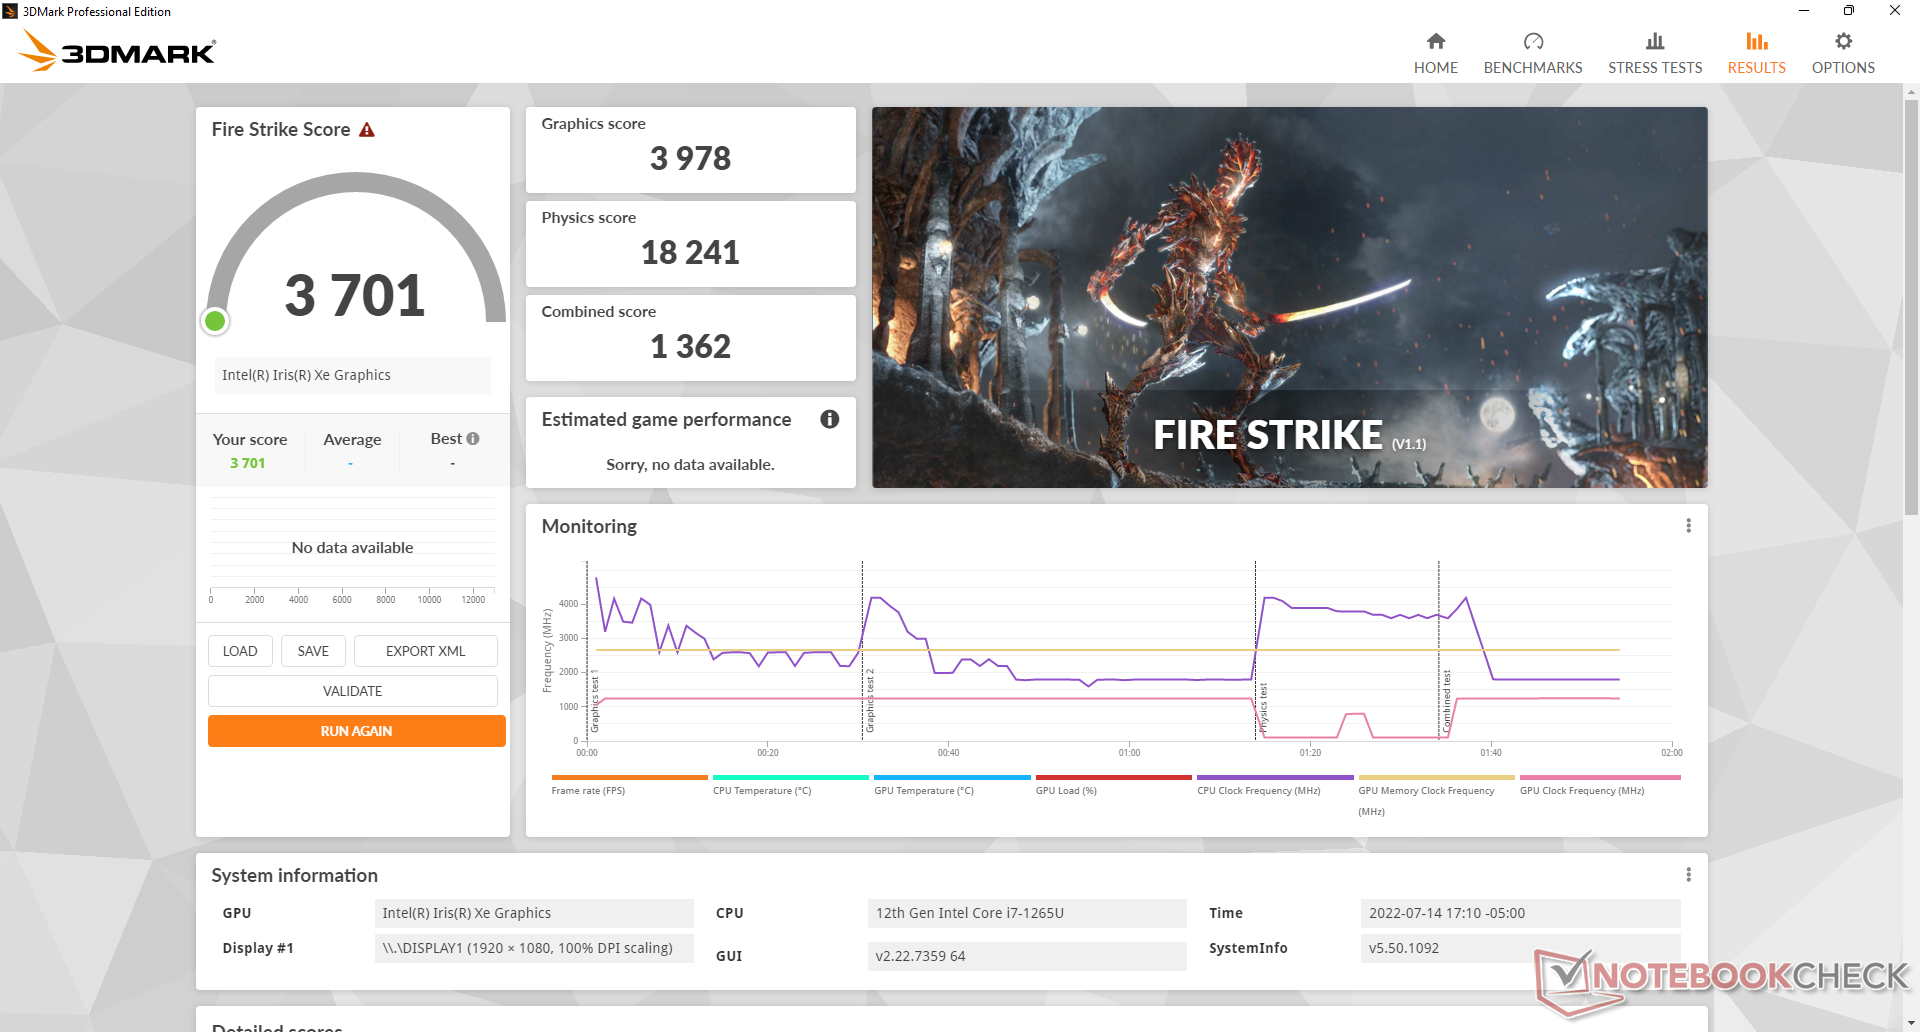
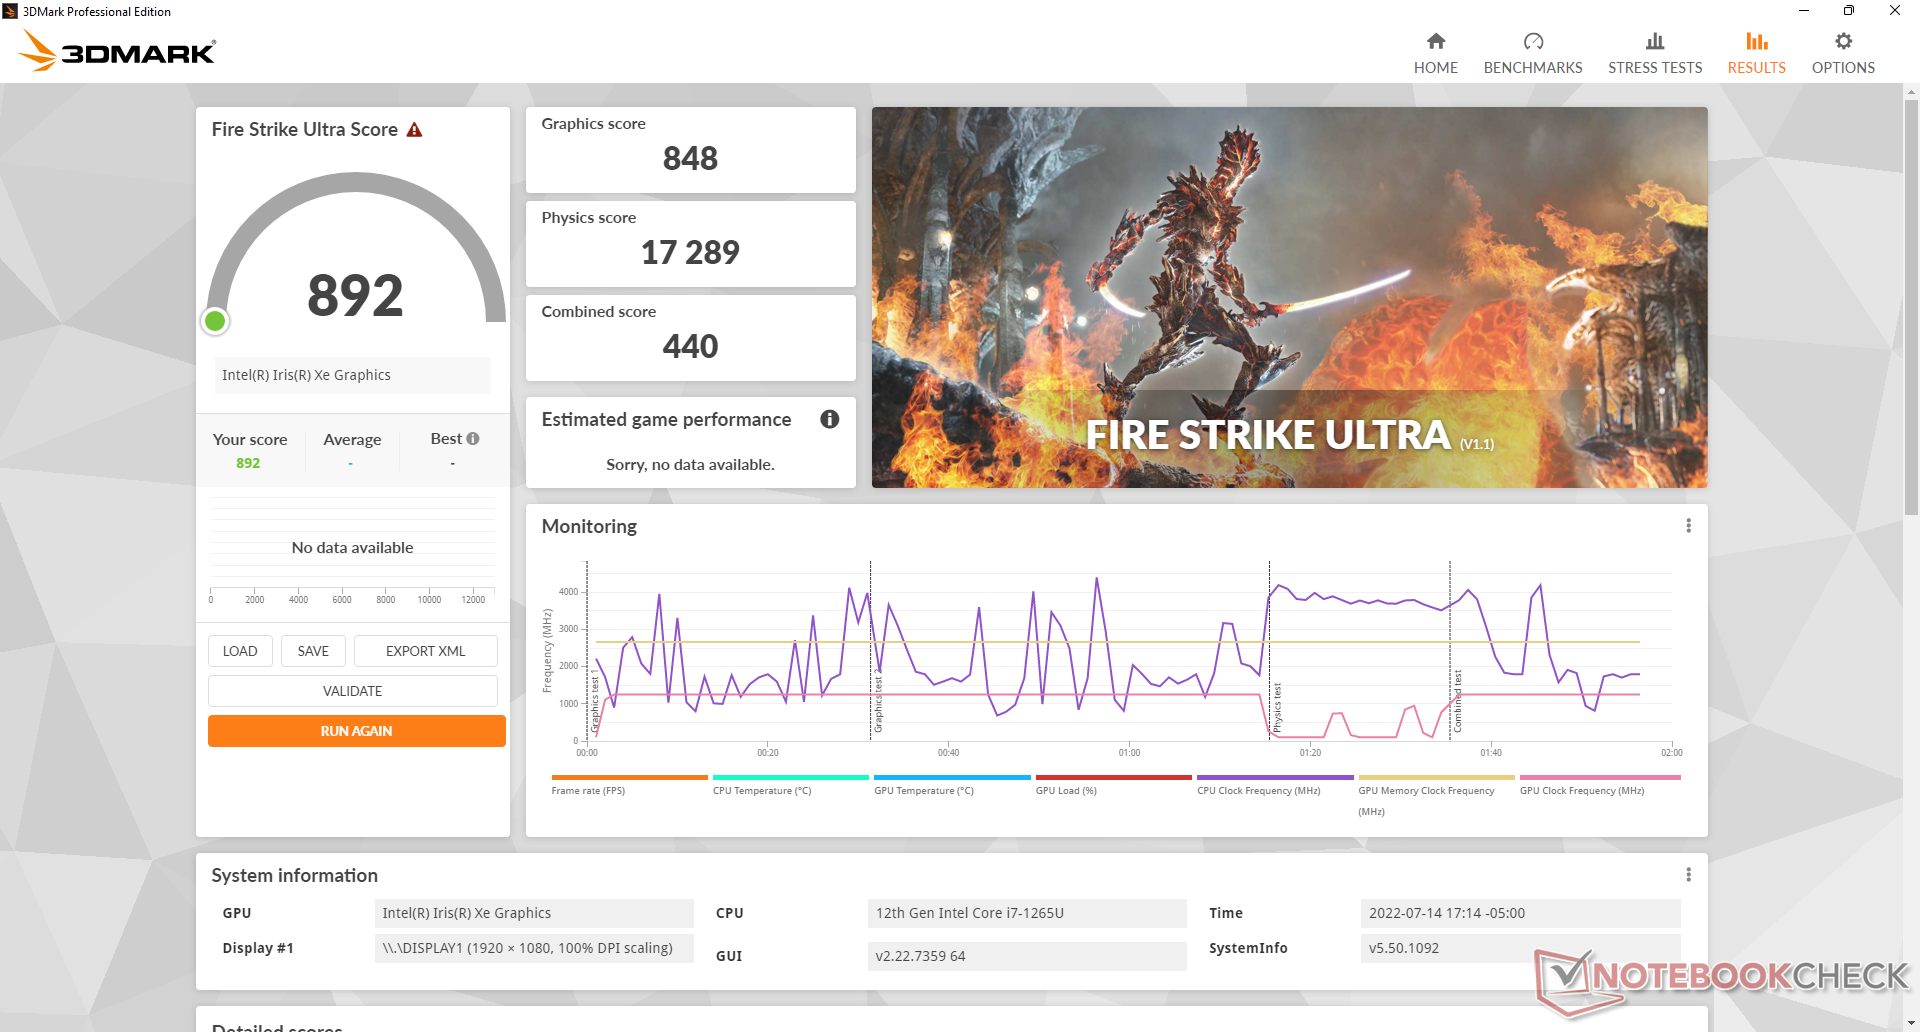
GPU Performance — Iris Xe Chugs Along
Graphics performance is roughly 5 to 20 percent slower than the average laptop in our database equipped with the same Iris Xe 96 EUs GPU. It's still fast for an integrated graphics chip, but there are certainly faster options available such as the Razer Book 13 or AMD-powered Asus Zenbook S 13 if maximizing GPU performance is a priority.
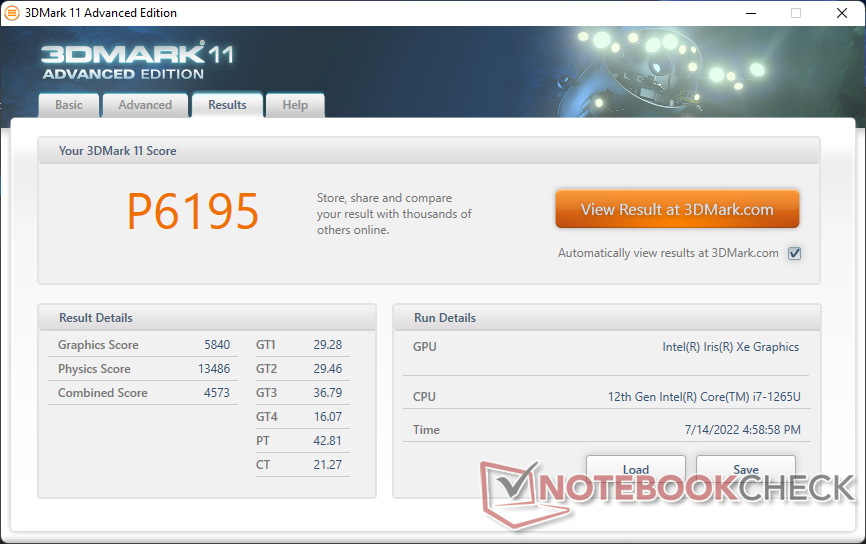
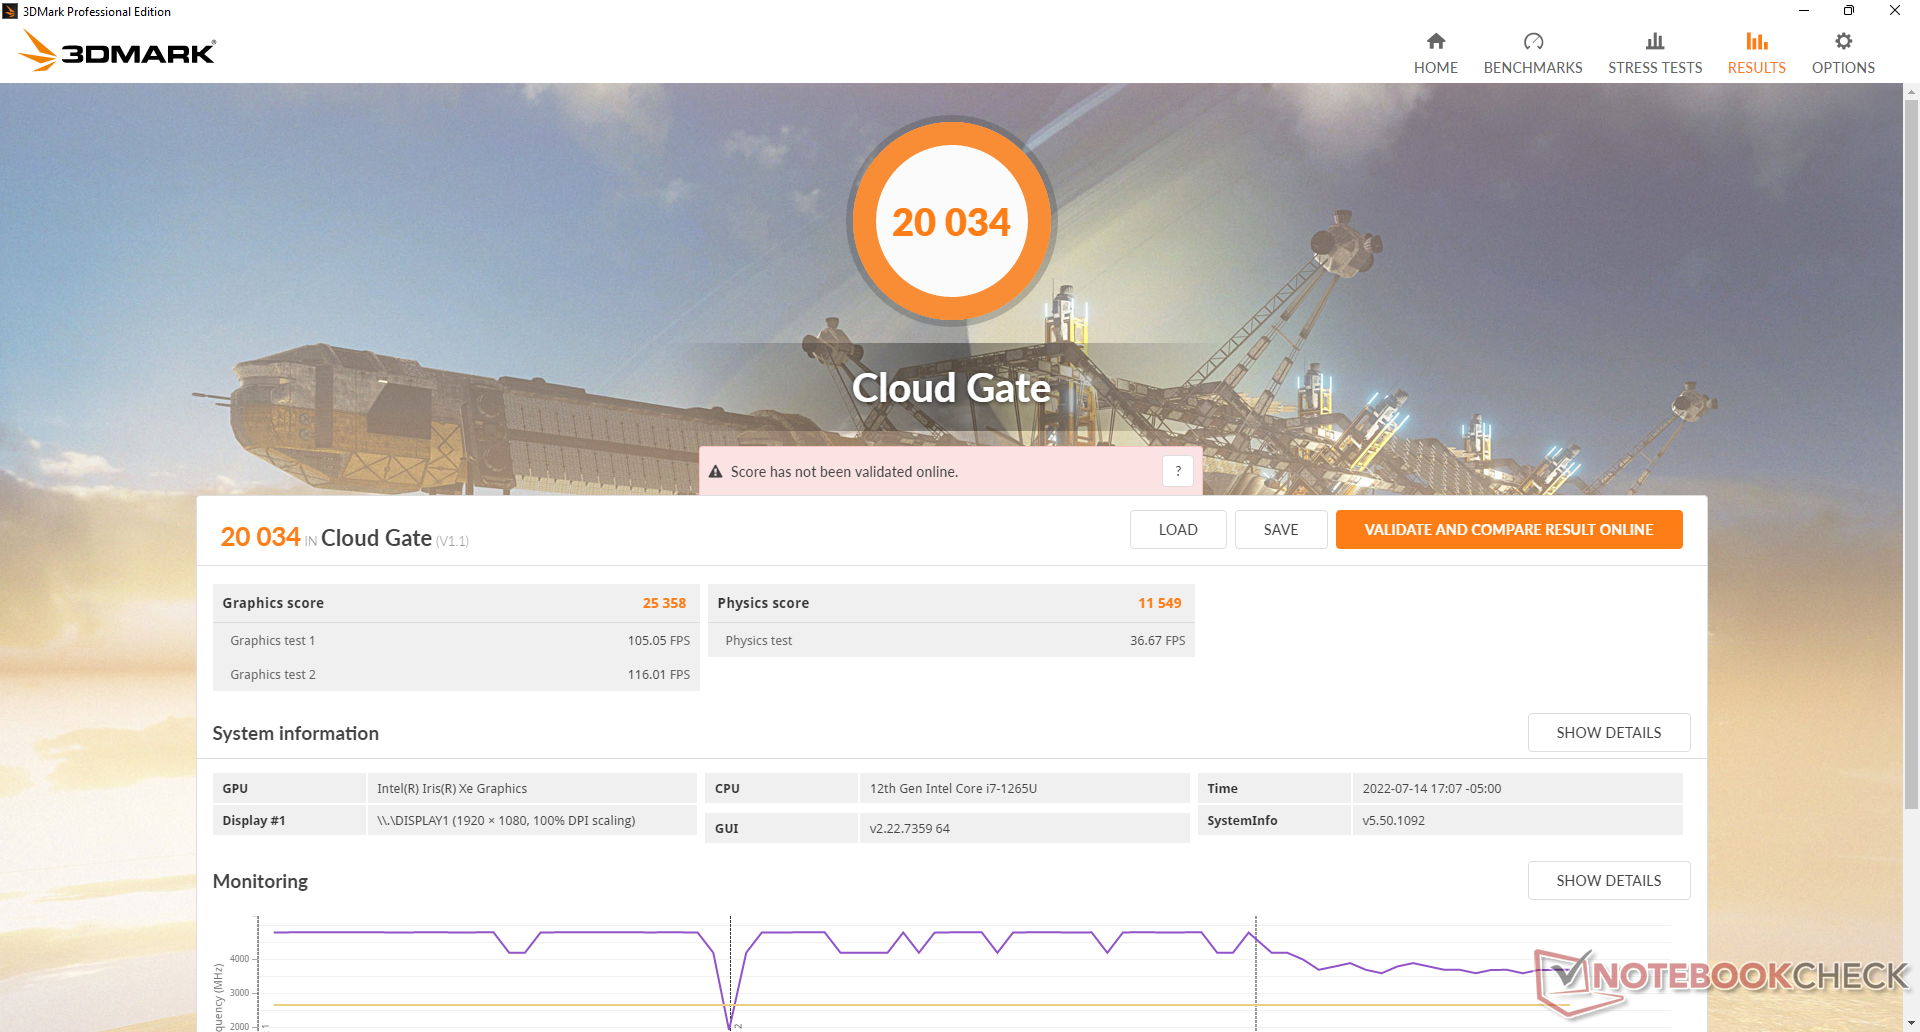
| 3DMark 11 Performance | 6195 points | |
| 3DMark Cloud Gate Standard Score | 20034 points | |
| 3DMark Fire Strike Score | 3701 points | |
| 3DMark Time Spy Score | 1526 points | |
Help | ||
| Cyberpunk 2077 1.6 | |
| 1920x1080 Low Preset | |
| Framework Laptop 13.5 12th Gen Intel | |
| Average Intel Iris Xe Graphics G7 96EUs (13 - 25.9, n=42) | |
| Dell Latitude 13 7330 | |
| 1920x1080 Medium Preset | |
| Framework Laptop 13.5 12th Gen Intel | |
| Average Intel Iris Xe Graphics G7 96EUs (10.8 - 21.7, n=37) | |
| Dell Latitude 13 7330 | |
| 1920x1080 High Preset | |
| Framework Laptop 13.5 12th Gen Intel | |
| Average Intel Iris Xe Graphics G7 96EUs (9.8 - 16.9, n=34) | |
| Dell Latitude 13 7330 | |
Witcher 3 FPS Chart
| low | med. | high | ultra | |
|---|---|---|---|---|
| GTA V (2015) | 84.5 | 64.7 | 13.9 | 6.15 |
| The Witcher 3 (2015) | 71.6 | 47.3 | 23.6 | 11.9 |
| Dota 2 Reborn (2015) | 109.7 | 79.6 | 50.6 | 44.9 |
| Final Fantasy XV Benchmark (2018) | 32.9 | 17.5 | 12.9 | |
| X-Plane 11.11 (2018) | 47.3 | 33.8 | 30.3 | |
| Strange Brigade (2018) | 75.8 | 29.8 | 24.9 | 20 |
| Cyberpunk 2077 1.6 (2022) | 18.7 | 15.4 | 11.2 |
Emissions
System Noise — Mostly Quiet
Fan noise tends to hover between a silent background of 23.4 dB(A) and 25.3 dB(A) when web browsing or word processing to be almost inaudible in most environments. However, it begins to pick up quickly when running more demanding loads like 3DMark 06 where fan noise can reach 38 dB(A) to be louder than what we recorded on the ThinkPad X13 Yoga, Razer Book 13, or older Latitude 7310. Fan noise would cycle between 37 and 39 dB(A) when running Witcher 3 instead of remaining steady which would have been preferable.
When running Prime95, fan noise would spike to 43 dB(A) for only a short period before quickly falling back down to the 39 dB(A) range.
Noise level
| Idle |
| 23.4 / 23.4 / 23.4 dB(A) |
| Load |
| 37.8 / 43 dB(A) |
 | ||
30 dB silent 40 dB(A) audible 50 dB(A) loud |
||
min: | ||
| Dell Latitude 13 7330 Iris Xe G7 96EUs, i7-1265U, Toshiba KBG40ZNS512G NVMe | Lenovo ThinkPad X13 Yoga 20SX0004GE UHD Graphics 620, i7-10510U, Samsung SSD PM981a MZVLB512HBJQ | Framework Laptop 13.5 12th Gen Intel Iris Xe G7 96EUs, i7-1260P, WDC PC SN730 SDBPNTY-512G | Razer Book 13 FHD Iris Xe G7 96EUs, i7-1165G7, Samsung SSD PM981a MZVLB256HBHQ | Dell Latitude 7310 UHD Graphics 620, i7-10610U, Samsung SSD PM981a MZVLB512HBJQ | Microsoft Surface Laptop 4 13 Ryzen 5 Vega 7, R5 4680U, Samsung PM991 MZ9LQ256HBJQ | |
|---|---|---|---|---|---|---|
| Noise | -13% | -8% | -4% | -12% | -3% | |
| off / environment * (dB) | 23.4 | 29.3 -25% | 22.8 3% | 27 -15% | 29 -24% | 24.6 -5% |
| Idle Minimum * (dB) | 23.4 | 29.3 -25% | 23 2% | 27 -15% | 29 -24% | 24.6 -5% |
| Idle Average * (dB) | 23.4 | 29.3 -25% | 23 2% | 27 -15% | 29 -24% | 24.6 -5% |
| Idle Maximum * (dB) | 23.4 | 31.4 -34% | 23 2% | 27.1 -16% | 29 -24% | 24.6 -5% |
| Load Average * (dB) | 37.8 | 33 13% | 47.3 -25% | 29 23% | 30.1 20% | 39.5 -4% |
| Witcher 3 ultra * (dB) | 39.2 | 47.3 -21% | 33.3 15% | |||
| Load Maximum * (dB) | 43 | 34.9 19% | 49.8 -16% | 44.8 -4% | 41.3 4% | 39.5 8% |
* ... smaller is better
Temperature
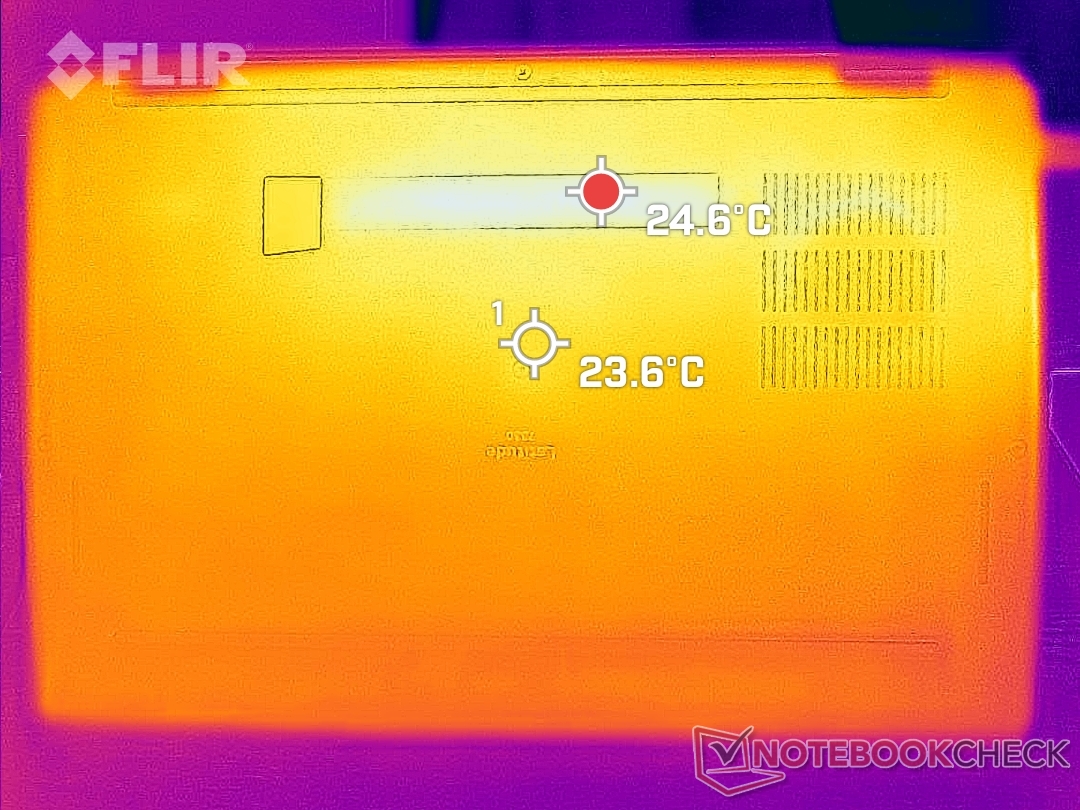
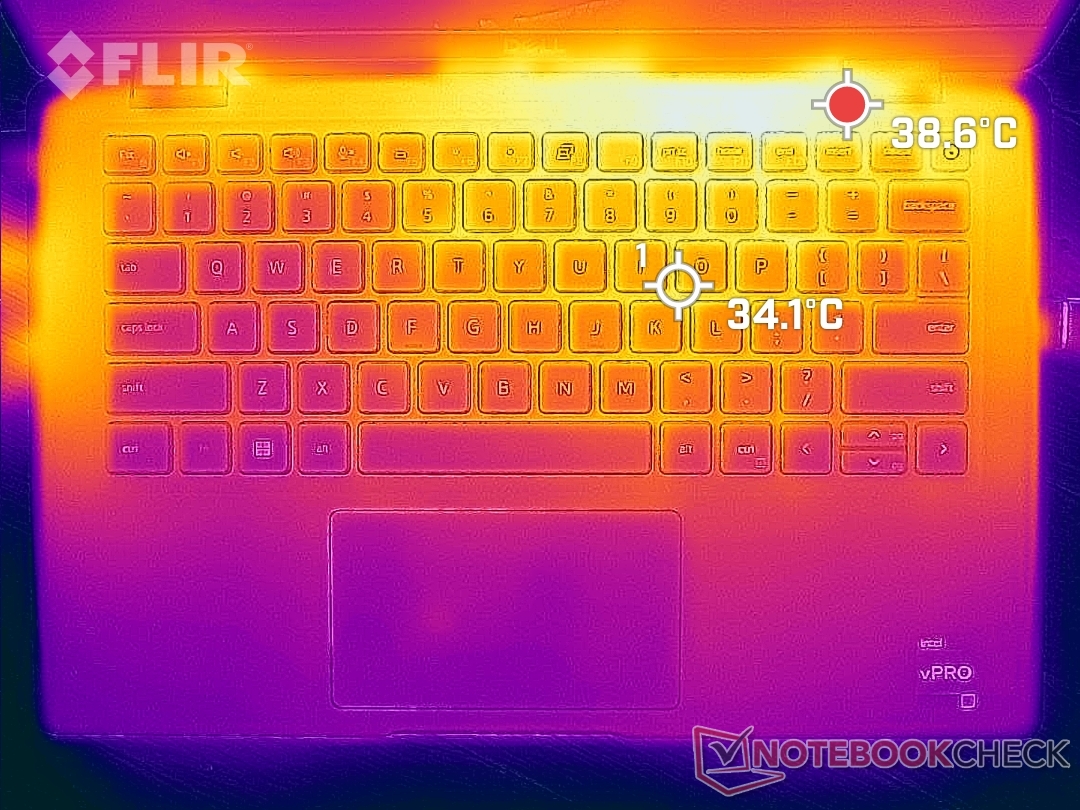
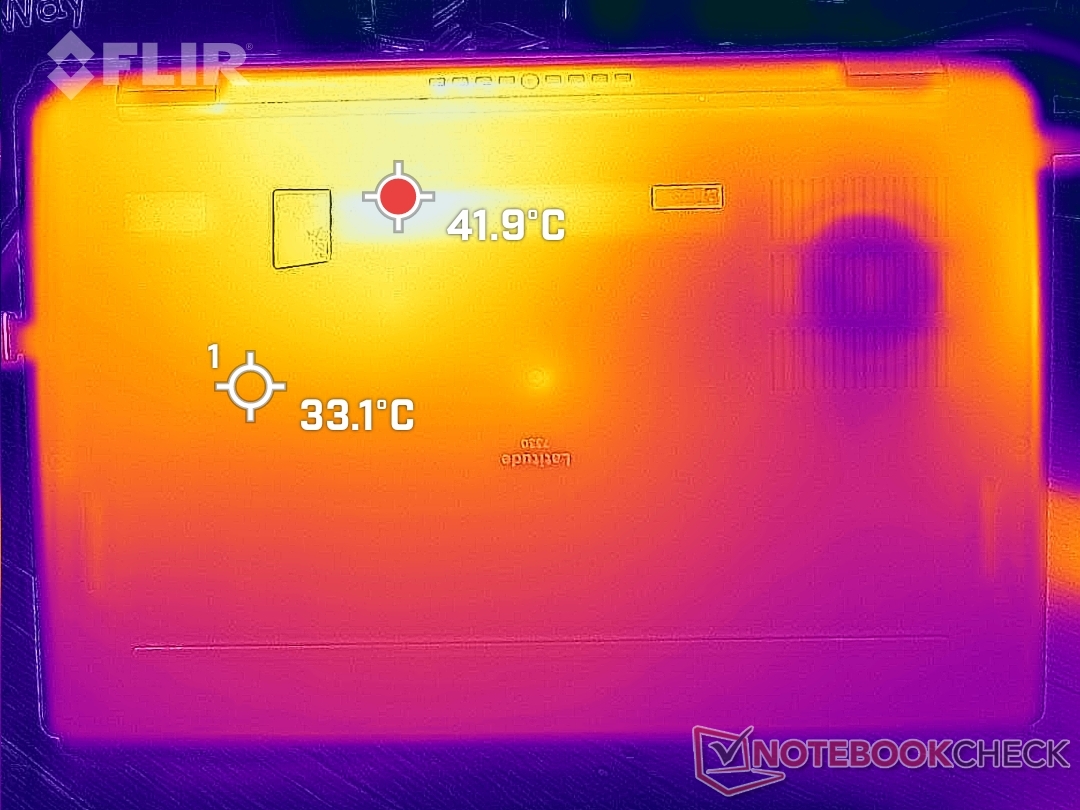
Surface temperatures are not an issue on the Latitude 7330. At worst, we're able to record hot spots of 39 C and 42 C on the top and bottom surfaces, respectively, to be cooler than the 46 C and 53 C we recorded on the older Latitude 7310. These hot spots are also toward the rear of the chassis away from the keyboard keys and palm rests.
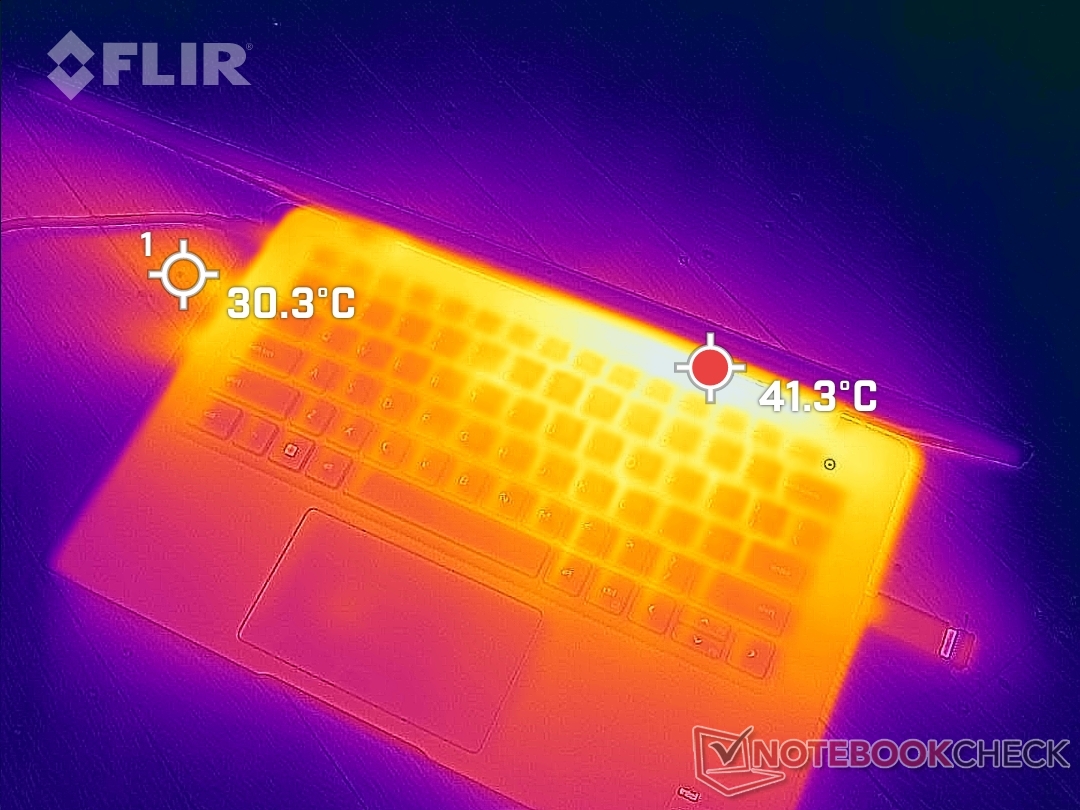

(+) The maximum temperature on the upper side is 38.6 °C / 101 F, compared to the average of 34.3 °C / 94 F, ranging from 21.2 to 62.5 °C for the class Office.
(±) The bottom heats up to a maximum of 42 °C / 108 F, compared to the average of 36.8 °C / 98 F
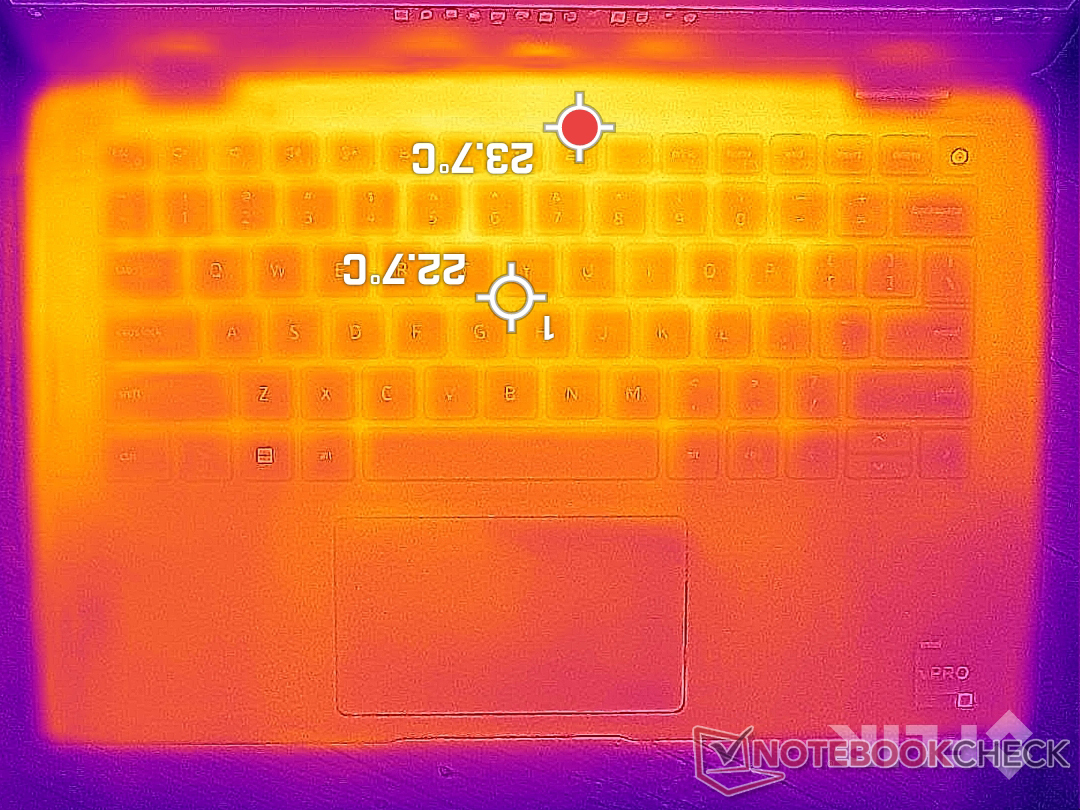
(+) In idle usage, the average temperature for the upper side is 22.2 °C / 72 F, compared to the device average of 29.5 °C / 85 F.
(+) The palmrests and touchpad are cooler than skin temperature with a maximum of 23.2 °C / 73.8 F and are therefore cool to the touch.
(+) The average temperature of the palmrest area of similar devices was 27.5 °C / 81.5 F (+4.3 °C / 7.7 F).
| Dell Latitude 13 7330 Intel Core i7-1265U, Intel Iris Xe Graphics G7 96EUs | Lenovo ThinkPad X13 Yoga 20SX0004GE Intel Core i7-10510U, Intel UHD Graphics 620 | Framework Laptop 13.5 12th Gen Intel Intel Core i7-1260P, Intel Iris Xe Graphics G7 96EUs | Razer Book 13 FHD Intel Core i7-1165G7, Intel Iris Xe Graphics G7 96EUs | Dell Latitude 7310 Intel Core i7-10610U, Intel UHD Graphics 620 | Microsoft Surface Laptop 4 13 Ryzen 5 AMD Ryzen 5 4680U, AMD Radeon RX Vega 7 | |
|---|---|---|---|---|---|---|
| Heat | -31% | -4% | -3% | -22% | -9% | |
| Maximum Upper Side * (°C) | 38.6 | 43.8 -13% | 36.8 5% | 39.2 -2% | 45.2 -17% | 45.8 -19% |
| Maximum Bottom * (°C) | 42 | 65 -55% | 42.4 -1% | 44 -5% | 52.8 -26% | 45.5 -8% |
| Idle Upper Side * (°C) | 23.8 | 29.2 -23% | 24.2 -2% | 23 3% | 28.2 -18% | 24.9 -5% |
| Idle Bottom * (°C) | 24.6 | 32.7 -33% | 29 -18% | 26.8 -9% | 31.6 -28% | 25.7 -4% |
* ... smaller is better
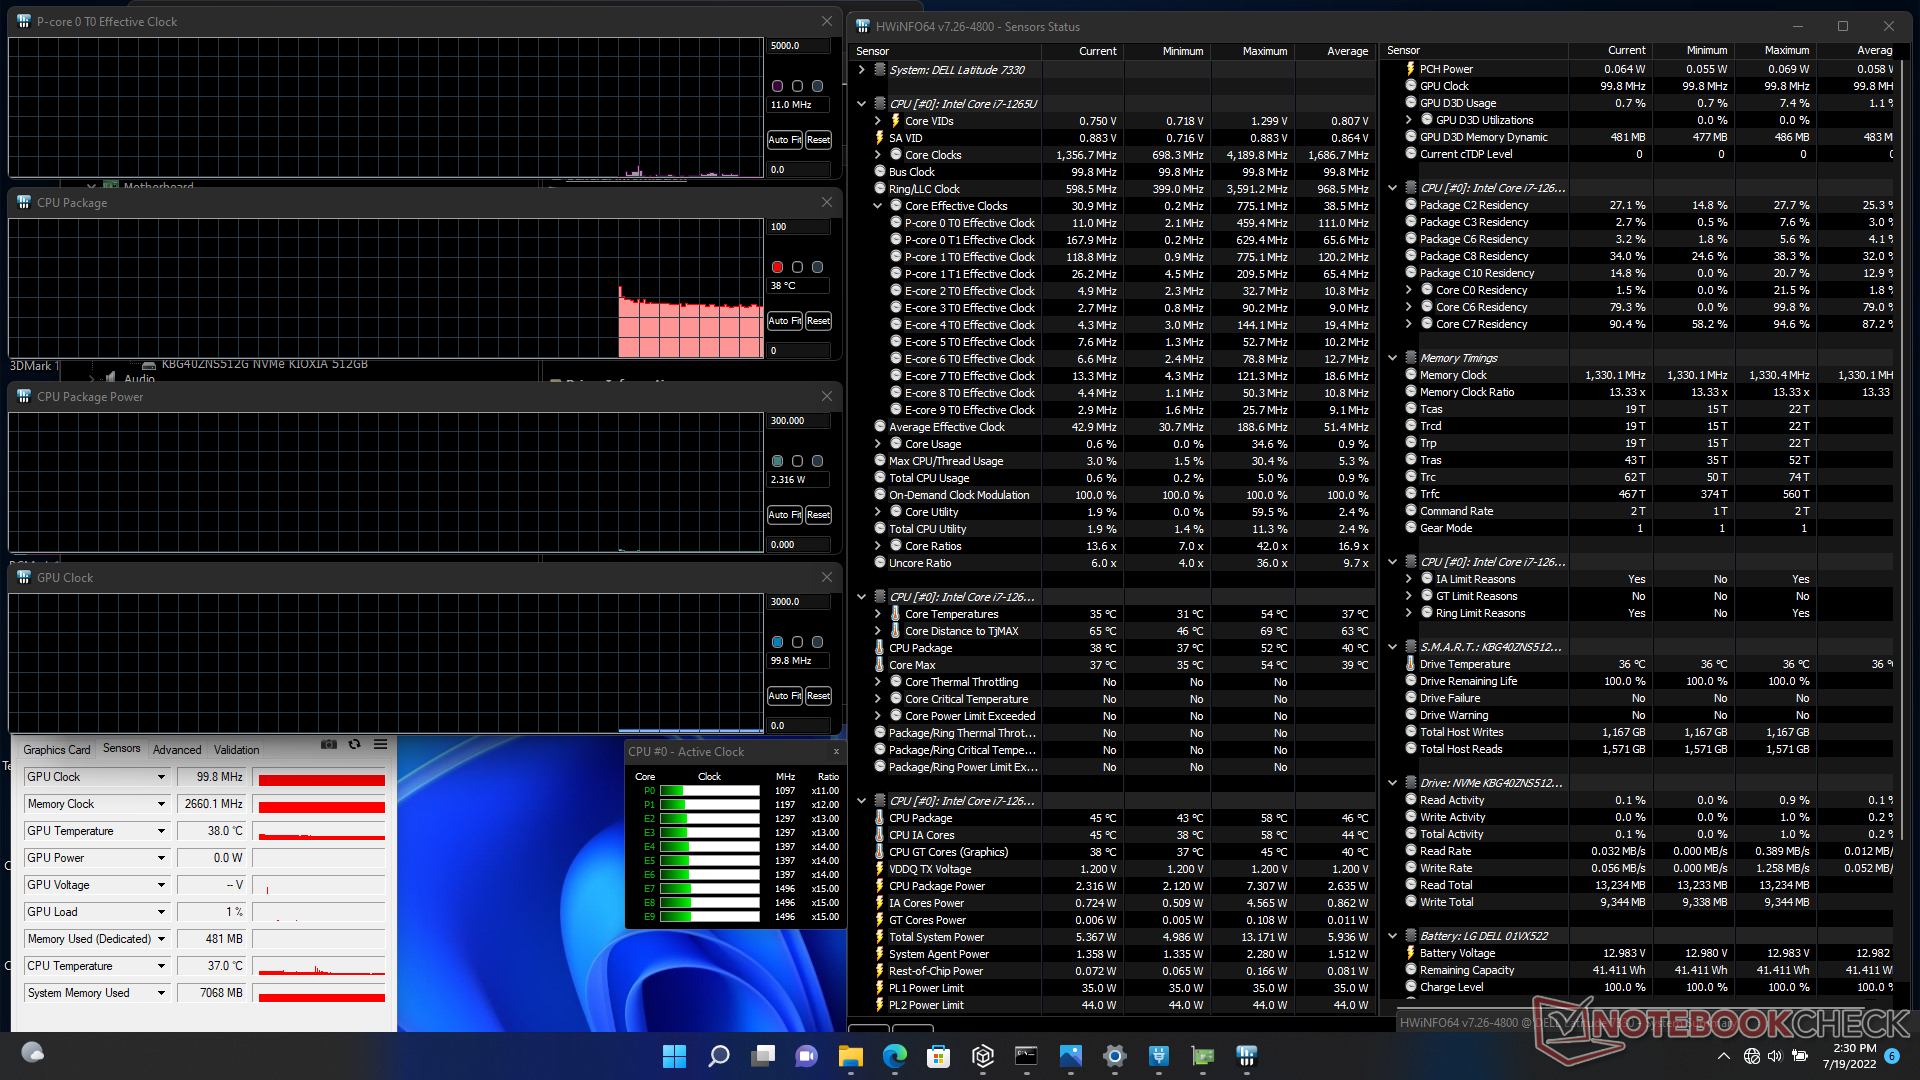
Stress Test
When running Prime95, CPU clock rates would boost to 3.8 GHz for the first few seconds at a board power draw and core temperature of 44 W and 97 C, respectively. After just a few seconds, however, clock rates would begin to steadily fall before stabilizing in the 2.1 to 2.5 GHz and 72 to 85 C range. Board power draw would also drop to the 23 to 25 W range since high Turbo Boost clock rates are unsustainable. These results correlate with our CineBench R15 loop observations above. Repeating this test on the Razer Book 13 would result in a much cooler core temperature of 60 C.
Running Witcher 3 to represent high loads would result in a stable GPU clock rate and temperature of 1247 MHz and 83 C, respectively, compared to 1300 MHz and just 59 C on the aforementioned Razer. The processor in the Latitude has to run warmer to compensate for the smaller cooling solution.
Running on battery power limits performance. A 3DMark 11 test on batteries would return Physics and Graphics scores of 8511 and 4764 points, respectively, compared to 13486 and 5840 points when on mains.
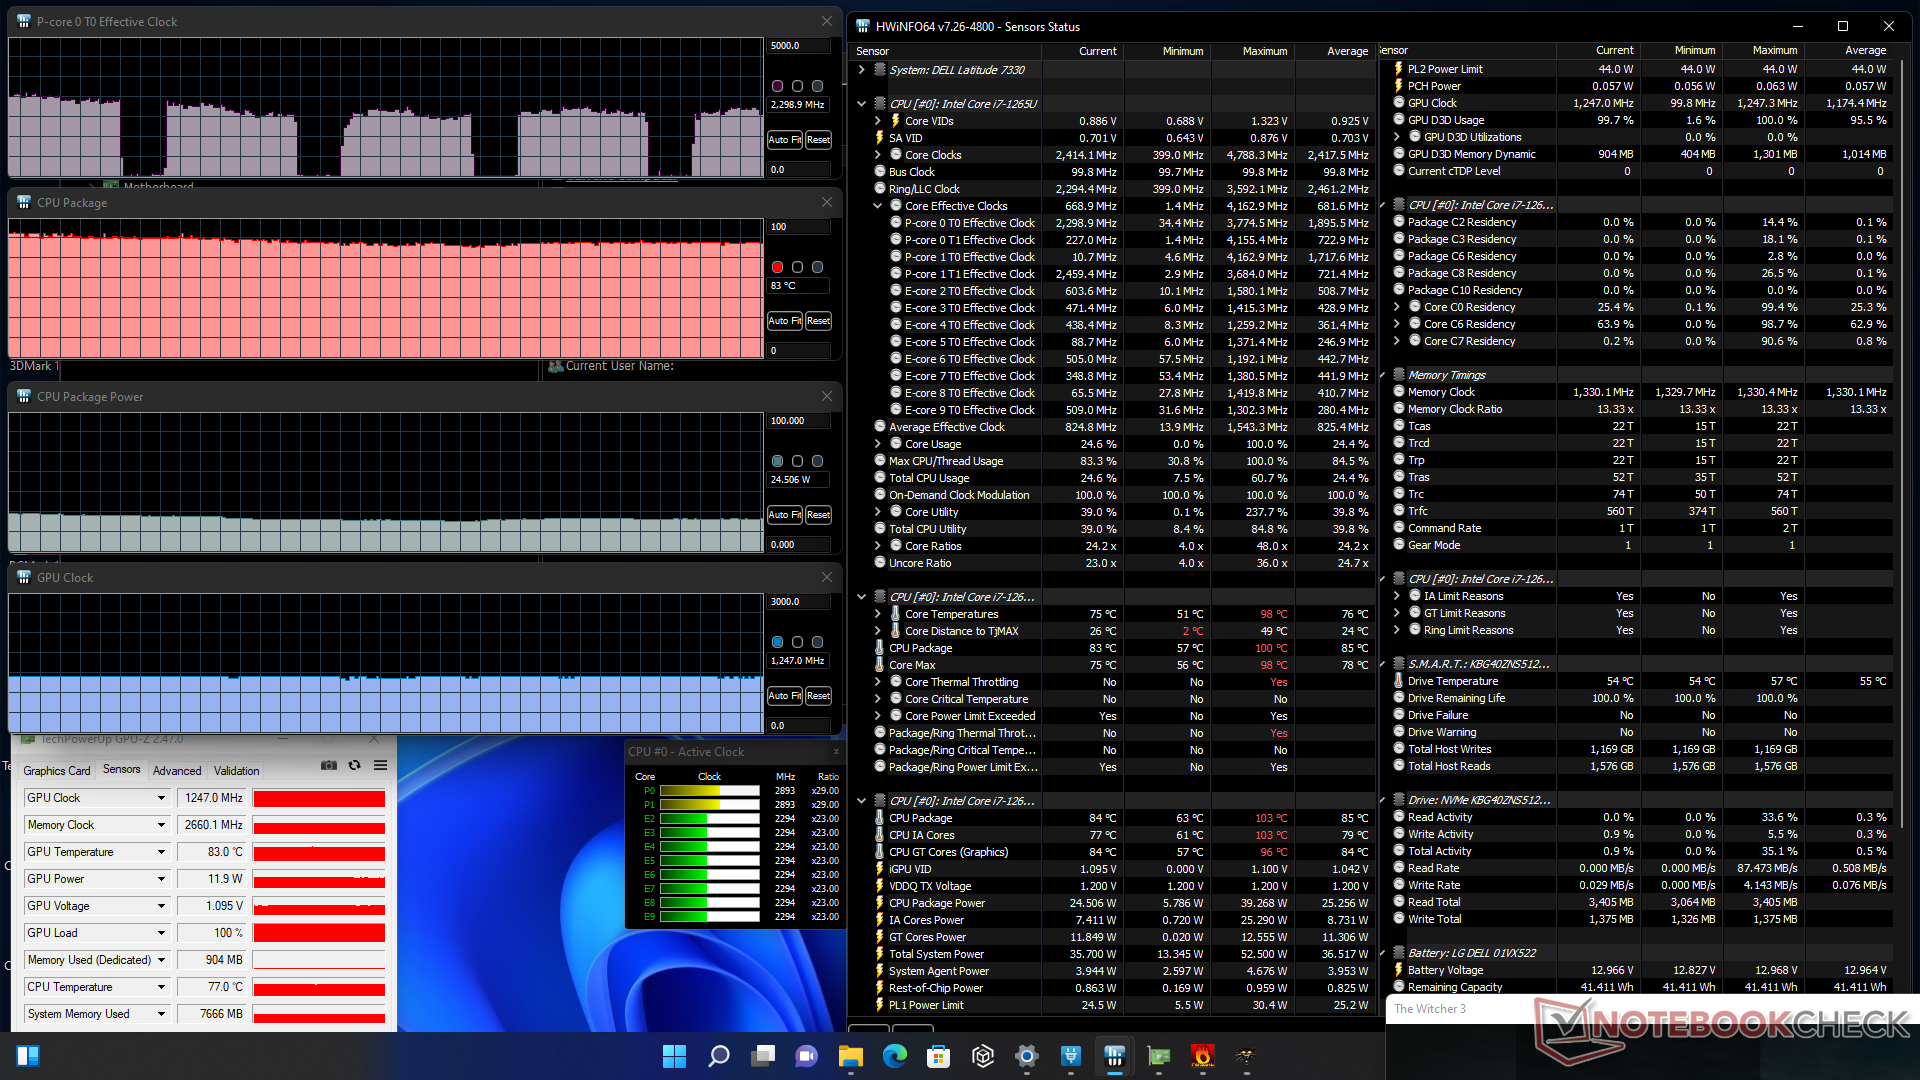
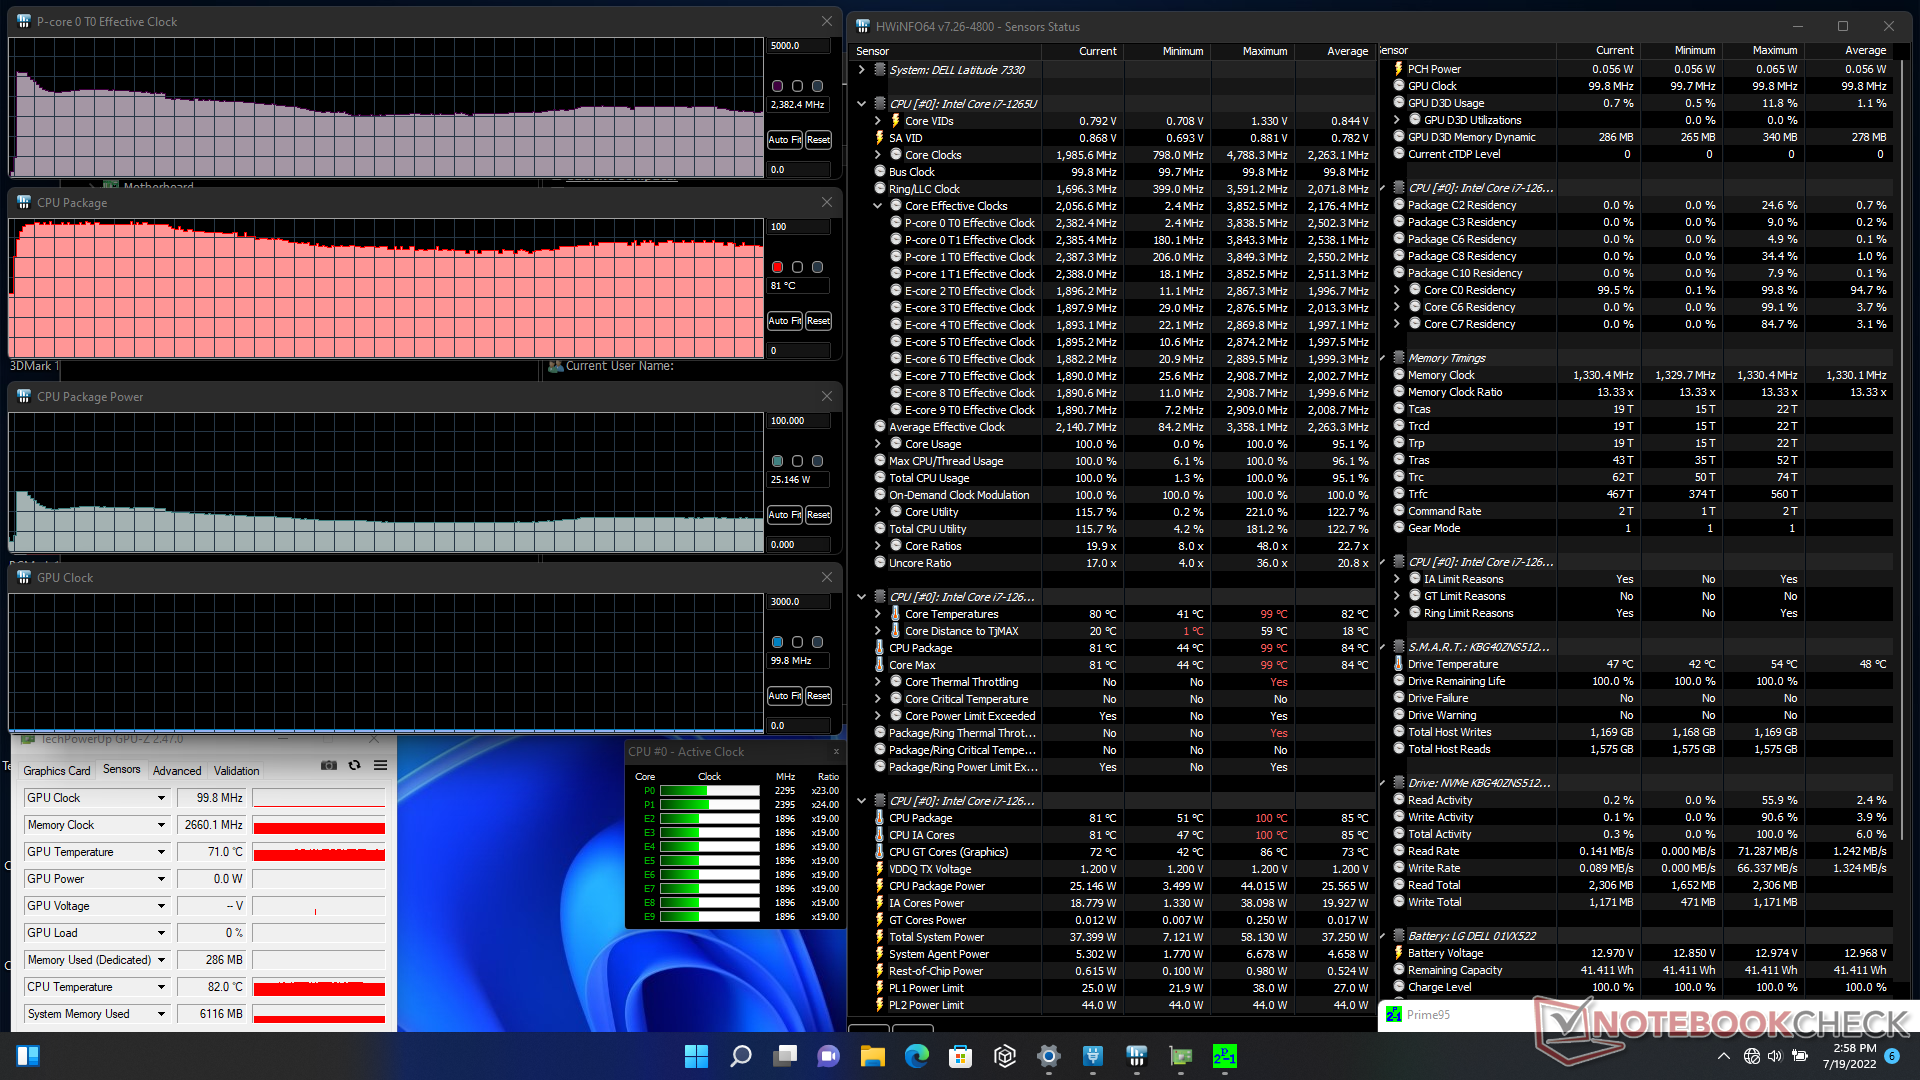

| CPU Clock (GHz) | GPU Clock (MHz) | Average CPU Temperature (°C) | |
| System Idle | -- | -- | 38 |
| Prime95 Stress | 2.1 - 2.5 | -- | 72 - 85 |
| Prime95 + FurMark Stress | ~1.4 | 848 | 75 |
| Witcher 3 Stress | ~2.3 | 1247 | 83 |
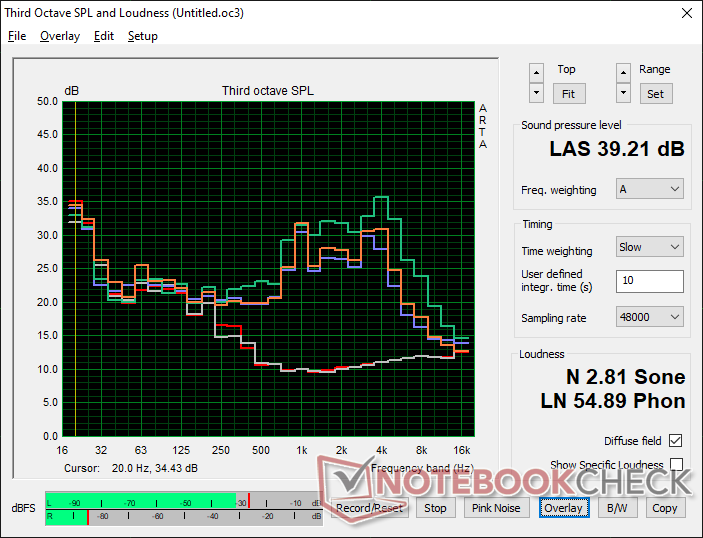
Speakers
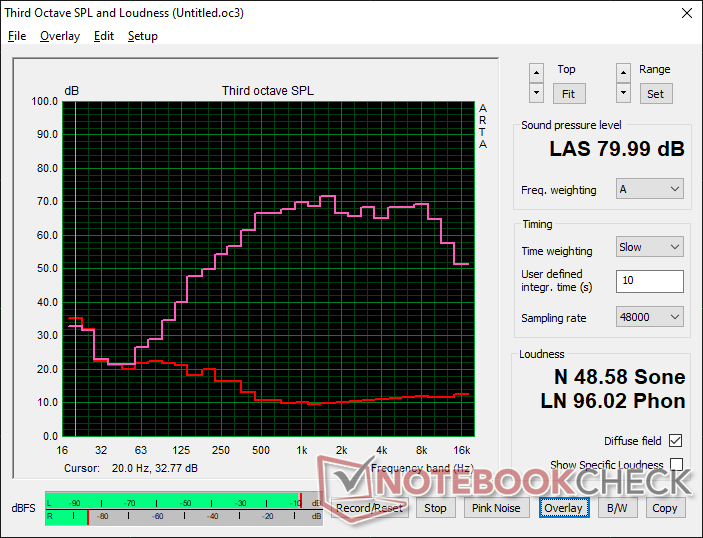
Dell Latitude 13 7330 audio analysis
(±) | speaker loudness is average but good (80 dB)
Bass 100 - 315 Hz
(-) | nearly no bass - on average 18.6% lower than median
(±) | linearity of bass is average (8.6% delta to prev. frequency)
Mids 400 - 2000 Hz
(+) | balanced mids - only 2.7% away from median
(+) | mids are linear (5.1% delta to prev. frequency)
Highs 2 - 16 kHz
(+) | balanced highs - only 1.9% away from median
(+) | highs are linear (4.1% delta to prev. frequency)
Overall 100 - 16.000 Hz
(+) | overall sound is linear (14.8% difference to median)
Compared to same class
» 13% of all tested devices in this class were better, 4% similar, 83% worse
» The best had a delta of 7%, average was 21%, worst was 53%
Compared to all devices tested
» 20% of all tested devices were better, 4% similar, 76% worse
» The best had a delta of 4%, average was 24%, worst was 134%
Apple MacBook Pro 16 2021 M1 Pro audio analysis
(+) | speakers can play relatively loud (84.7 dB)
Bass 100 - 315 Hz
(+) | good bass - only 3.8% away from median
(+) | bass is linear (5.2% delta to prev. frequency)
Mids 400 - 2000 Hz
(+) | balanced mids - only 1.3% away from median
(+) | mids are linear (2.1% delta to prev. frequency)
Highs 2 - 16 kHz
(+) | balanced highs - only 1.9% away from median
(+) | highs are linear (2.7% delta to prev. frequency)
Overall 100 - 16.000 Hz
(+) | overall sound is linear (4.6% difference to median)
Compared to same class
» 0% of all tested devices in this class were better, 0% similar, 100% worse
» The best had a delta of 5%, average was 17%, worst was 45%
Compared to all devices tested
» 0% of all tested devices were better, 0% similar, 100% worse
» The best had a delta of 4%, average was 24%, worst was 134%
Energy Management
Power Consumption — More Demanding
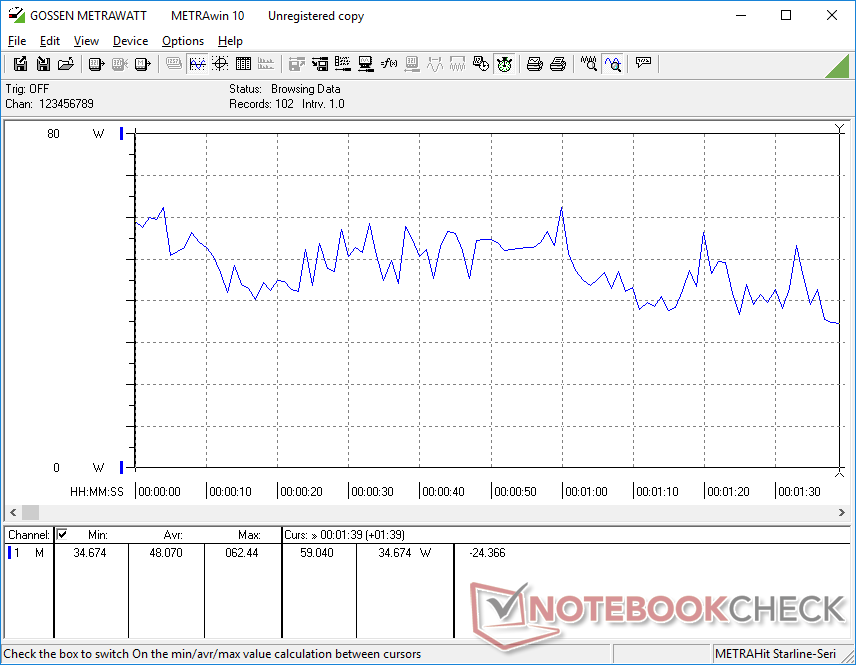
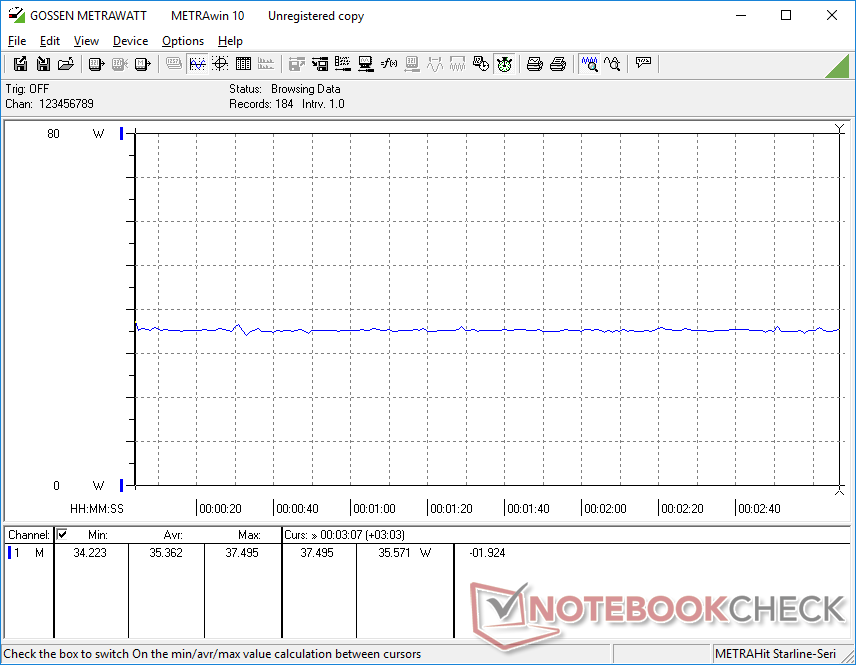
Power consumption is generally higher over laptops running on previous generation hardware which aligns with our observations on the Alder Lake platform as a whole. Running 3DMark06 and Prime95, for example, would consume 30 percent and 21 percent more power, respectively, than on the Core i7-1165G7 Razer Book 13. Performance may be higher, but performance-per-watt isn't as high as we had hoped it to be.
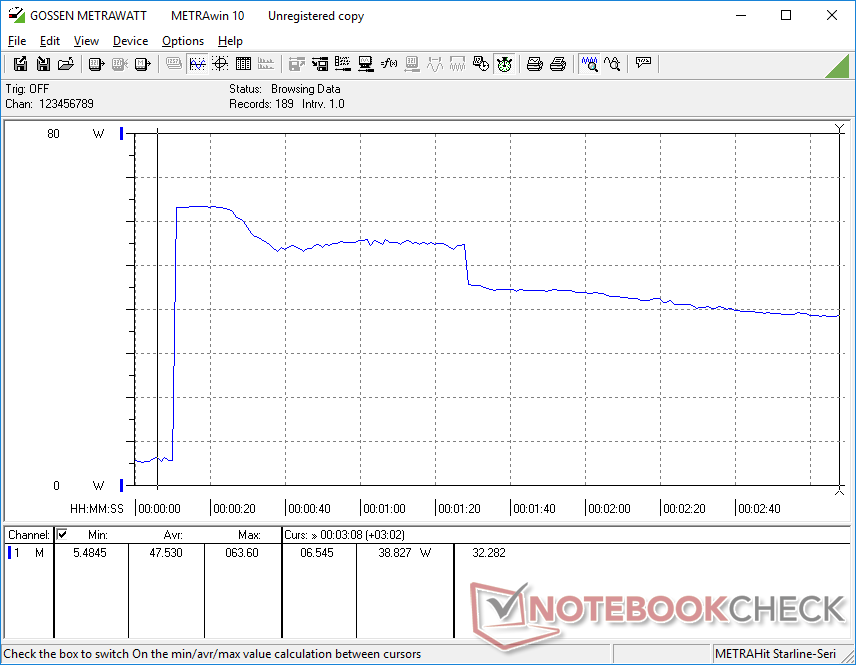
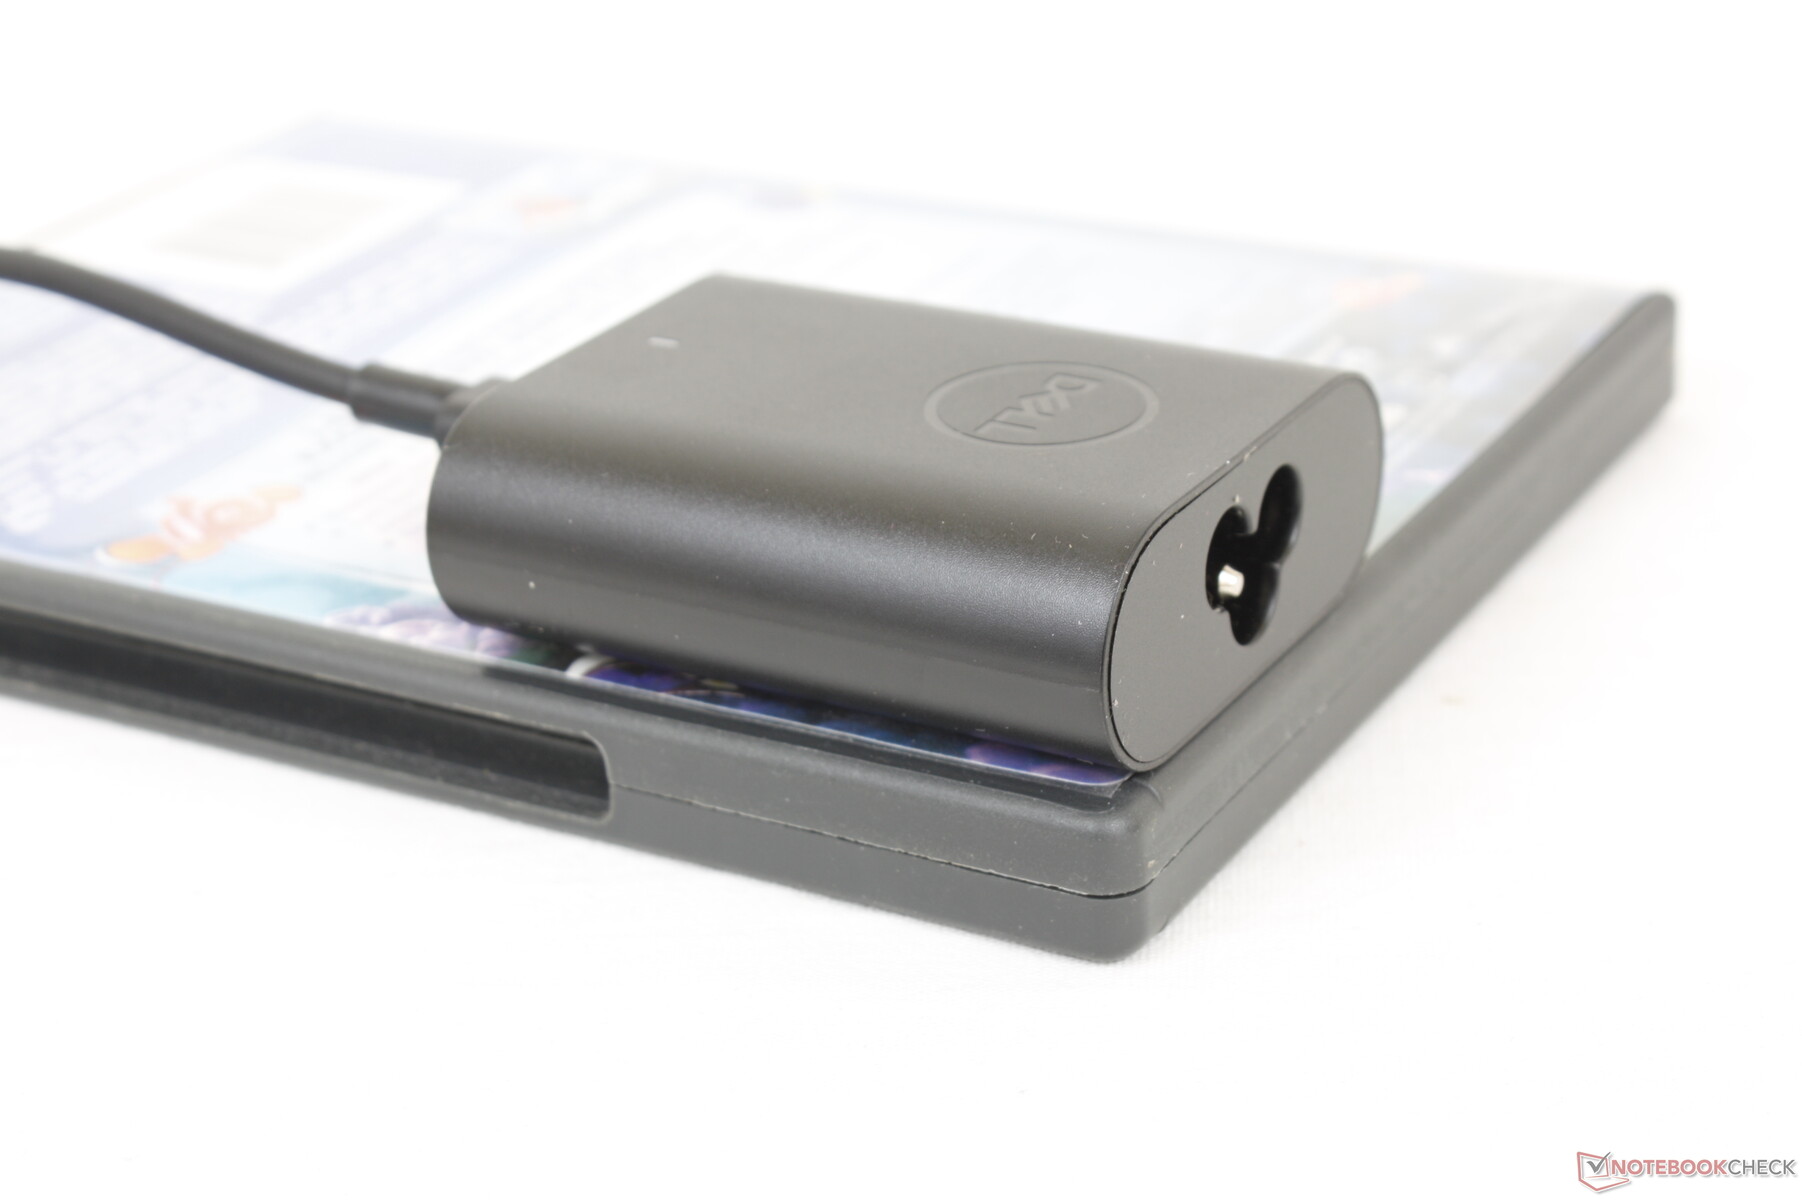
We're able to record a maximum draw of 63.6 W from the very small (~6.6 x 5.5 x 2.2 cm) 60 W USB-C AC adapter. This rate is only temporary as shown by the screenshot below due to the thermal limitations of the CPU cooling solution. The system will still recharge at a decent rate when under heavy processing stress.
Larger 65 W or 90 W AC adapters are also options depending on the configuration.

| Off / Standby | |
| Idle | |
| Load |
|
Key:
min: | |
| Dell Latitude 13 7330 i7-1265U, Iris Xe G7 96EUs, Toshiba KBG40ZNS512G NVMe, IPS, 1920x1080, 13.3" | Lenovo ThinkPad X13 Yoga 20SX0004GE i7-10510U, UHD Graphics 620, Samsung SSD PM981a MZVLB512HBJQ, IPS, 1920x1080, 13.3" | Framework Laptop 13.5 12th Gen Intel i7-1260P, Iris Xe G7 96EUs, WDC PC SN730 SDBPNTY-512G, IPS, 2256x1504, 13.5" | Razer Book 13 FHD i7-1165G7, Iris Xe G7 96EUs, Samsung SSD PM981a MZVLB256HBHQ, IPS, 1920x1200, 13.4" | Dell Latitude 7310 i7-10610U, UHD Graphics 620, Samsung SSD PM981a MZVLB512HBJQ, IPS, 1920x1080, 13.3" | Microsoft Surface Laptop 4 13 Ryzen 5 R5 4680U, Vega 7, Samsung PM991 MZ9LQ256HBJQ, IPS, 2256x1504, 13.5" | |
|---|---|---|---|---|---|---|
| Power Consumption | -3% | -44% | -2% | 13% | -8% | |
| Idle Minimum * (Watt) | 2.8 | 3.4 -21% | 5.3 -89% | 3.3 -18% | 2.7 4% | 3.4 -21% |
| Idle Average * (Watt) | 4.8 | 4.98 -4% | 8.4 -75% | 6.4 -33% | 4.4 8% | 6.3 -31% |
| Idle Maximum * (Watt) | 7.3 | 8.1 -11% | 11.2 -53% | 7 4% | 4.8 34% | 8.1 -11% |
| Load Average * (Watt) | 48.1 | 37.2 23% | 57.4 -19% | 37.3 22% | 33.4 31% | 36.2 25% |
| Witcher 3 ultra * (Watt) | 35.4 | 46.7 -32% | 36.4 -3% | |||
| Load Maximum * (Watt) | 63.6 | 63.3 -0% | 61.2 4% | 53.7 16% | 69.7 -10% | 64.1 -1% |
* ... smaller is better
Power Consumption Witcher 3 / Stresstest
Power Consumption external Monitor
Battery Life
Users have the option to configure with either a lighter 41 Wh battery or a heavier but longer-lasting 58 Wh battery. We're able to squeeze just over 8 hours of real-world WLAN usage from our 41 Wh test unit which should be more than sufficient for most users.
Charging from empty to full capacity with the included USB-C AC adapter takes between 2 to 2.5 hours.
| Dell Latitude 13 7330 i7-1265U, Iris Xe G7 96EUs, 41 Wh | Lenovo ThinkPad X13 Yoga 20SX0004GE i7-10510U, UHD Graphics 620, 50 Wh | Framework Laptop 13.5 12th Gen Intel i7-1260P, Iris Xe G7 96EUs, 55 Wh | Razer Book 13 FHD i7-1165G7, Iris Xe G7 96EUs, 55 Wh | Dell Latitude 7310 i7-10610U, UHD Graphics 620, 52 Wh | Microsoft Surface Laptop 4 13 Ryzen 5 R5 4680U, Vega 7, 47.4 Wh | |
|---|---|---|---|---|---|---|
| Battery runtime | 53% | -10% | 65% | 51% | 31% | |
| Reader / Idle (h) | 21.9 | 36.8 68% | 37.4 71% | |||
| WiFi v1.3 (h) | 8.3 | 8.2 -1% | 7.5 -10% | 14.8 78% | 12.6 52% | 10.9 31% |
| Load (h) | 1.4 | 2.9 107% | 2.1 50% | 1.8 29% |
Pros
Cons
Verdict — Options, Options, Options
The high level of configurations help differentiate the Latitude 7330 from other business subnotebooks. Features like a MicroSD reader, 4G LTE connectivity, 1080p webcam, 2-in-1 form factor, carbon fiber, battery size, and even AC adapter are all optional depending on the needs of the buyer. If your daily workloads don't require certain features, then they can simply be omitted at checkout for a lighter overall weight. Other ultralight laptops like the LG Gram 13 or Toshiba X30 series have far fewer configurable options like due to their smaller production scales relative to the Dell Latitude series.
The Latitude 7330 series is big on configurable options and customizations to better fit the specific needs of the user. Its 16:9 aspect ratio is starting to show its age, however.
The closest alternatives to the Latitude 7330 are the HP EliteBook 830 G8 and G9 models which offer features like a larger 16:10 aspect ratio, sharper 5 MP webcam, removable RAM modules, and significantly brighter 1000-nit display options all of which are unavailable on the Latitude 7330. They're slightly heavier than our Dell, however, but its stronger attributes may be worth the weight increase for some users.
Price and Availability
The Latitude 7330 is not yet widely available on Amazon or Best Buy. Purchasing directly from Dell is recommended where prices currently hover around $2000 USD.
Dell Latitude 13 7330
- 07/22/2022 v7 (old)
Allen Ngo
Price comparison
