 Deutsch
 English
 Español
 Français
 Italiano
 Nederlands
 Polski
 Português
 Русский
 Türkçe
 Svenska
 Chinese
 Magyar
Latitude 5320 in review: Dell spoils the mouse replacement

Dell's Latitude 5000 series are represented by mid-range business laptops. The new offspring is called Latitude 5320, it is the successor of the Latitude 5310 and it almost hasn't changed externally compared to the predecessor. Dell primarily replaces the Comet Lake processors with Tiger Lake models. However, there are also significant changes in connectivity, including the appearance of Thunderbolt 4. However, some downgrades will not please every buyer. Keywords: clickpad and working memory.
The field of competitors between 800 and just over 1000 Euros is large. Lenovo's ThinkPads from the L-series are the main competitors for the Latitude with business equipment. The ThinkBooks do not offer quite as much connectivity but could be an alternative for budget customers due to the lower prices. Can the Latitude 5320 hold its own in this tough competition? Our test provides the answer.
Possible competitors in comparison
Rating | Date | Model | Weight | Height | Size | Resolution | Best Price |
|---|---|---|---|---|---|---|---|
| 84.1 % | 03/2022 | Dell Latitude 5320-TM4V2 i5-1135G7, Iris Xe G7 80EUs | 1.3 kg | 17 mm | 13.30" | 1920x1080 | |
| 87.2 % | 12/2020 | Dell Latitude 5310-23VP6 i5-10310U, UHD Graphics 620 | 1.3 kg | 19.7 mm | 13.30" | 1920x1080 | |
| 87.8 % | 01/2022 | Lenovo ThinkBook 13s G3 20YA0005GE R7 5800U, Vega 8 | 1.3 kg | 14.9 mm | 13.30" | 1920x1200 | |
| 87.5 % | 03/2022 | Lenovo ThinkPad L13 Gen2-21AB000PGE R5 PRO 5650U, Vega 7 | 1.4 kg | 17.6 mm | 13.30" | 1920x1080 | |
| 85.6 % | 12/2021 | Lenovo ThinkPad L14 G2-20X1003WGE i5-1135G7, Iris Xe G7 80EUs | 1.7 kg | 19 mm | 14.00" | 1920x1080 | |
| 85.3 % | 01/2022 | Acer TravelMate P4 TMP414-51-59MR i5-1135G7, Iris Xe G7 80EUs | 1.4 kg | 17.9 mm | 14.00" | 1920x1080 | |
| 83.6 % | Lenovo ThinkBook 14 G2 ITL 20VDS02G00 i3-1115G4, UHD Graphics Xe G4 48EUs | 1.5 kg | 17.9 mm | 14.00" | 1920x1080 |
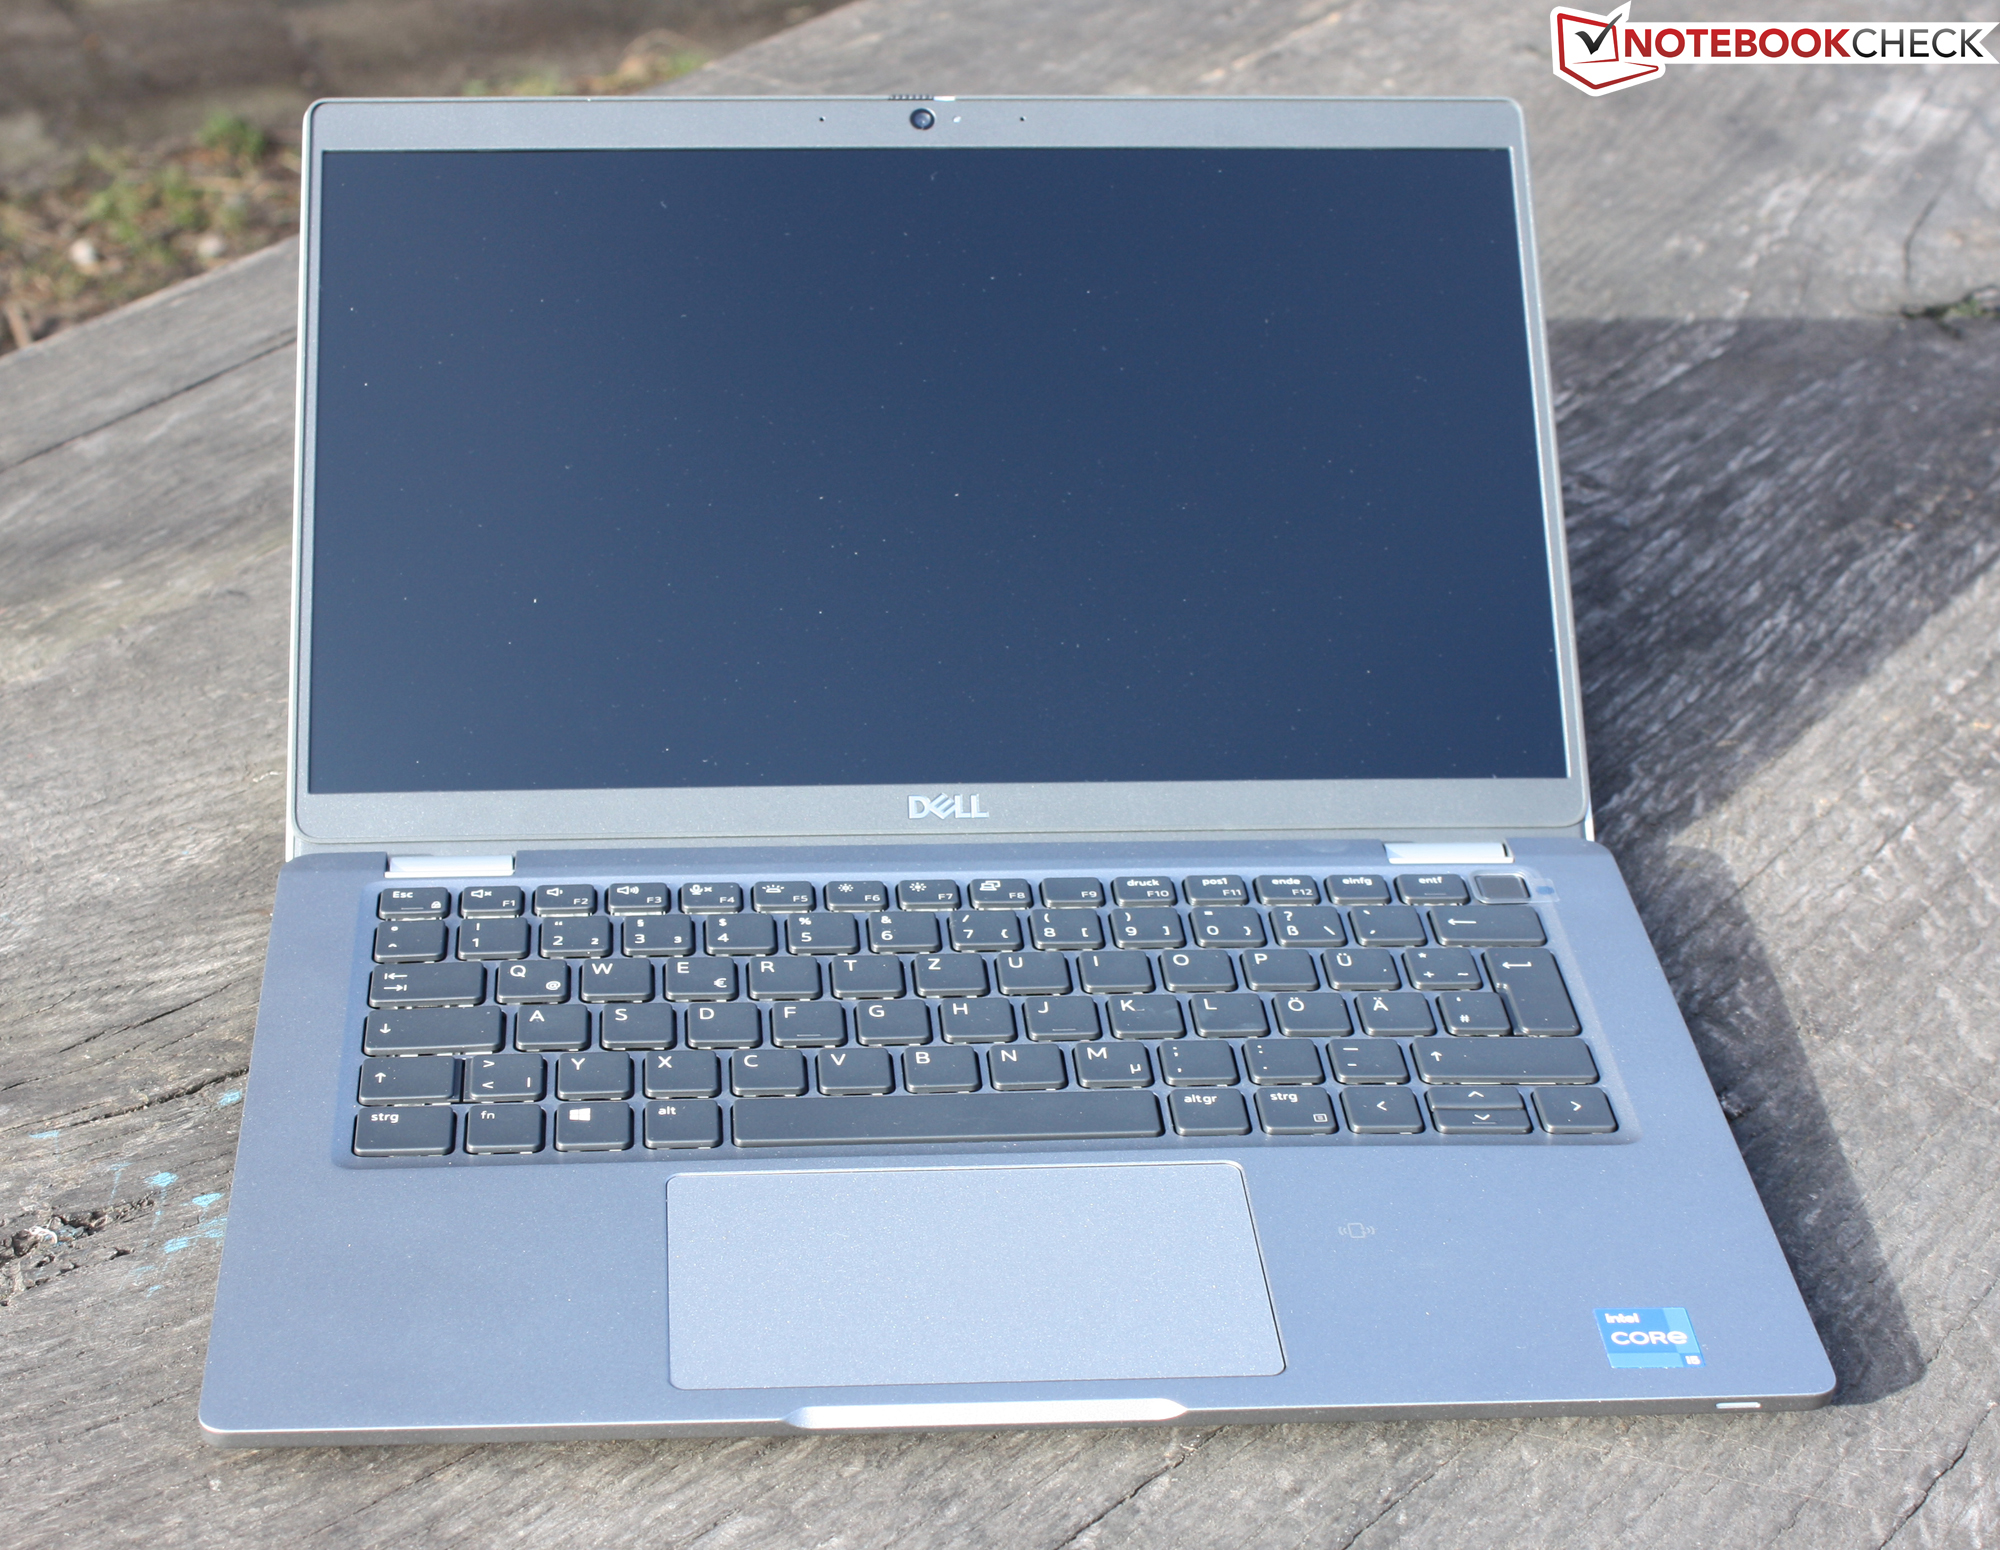
Case - Laptop case could be more stable
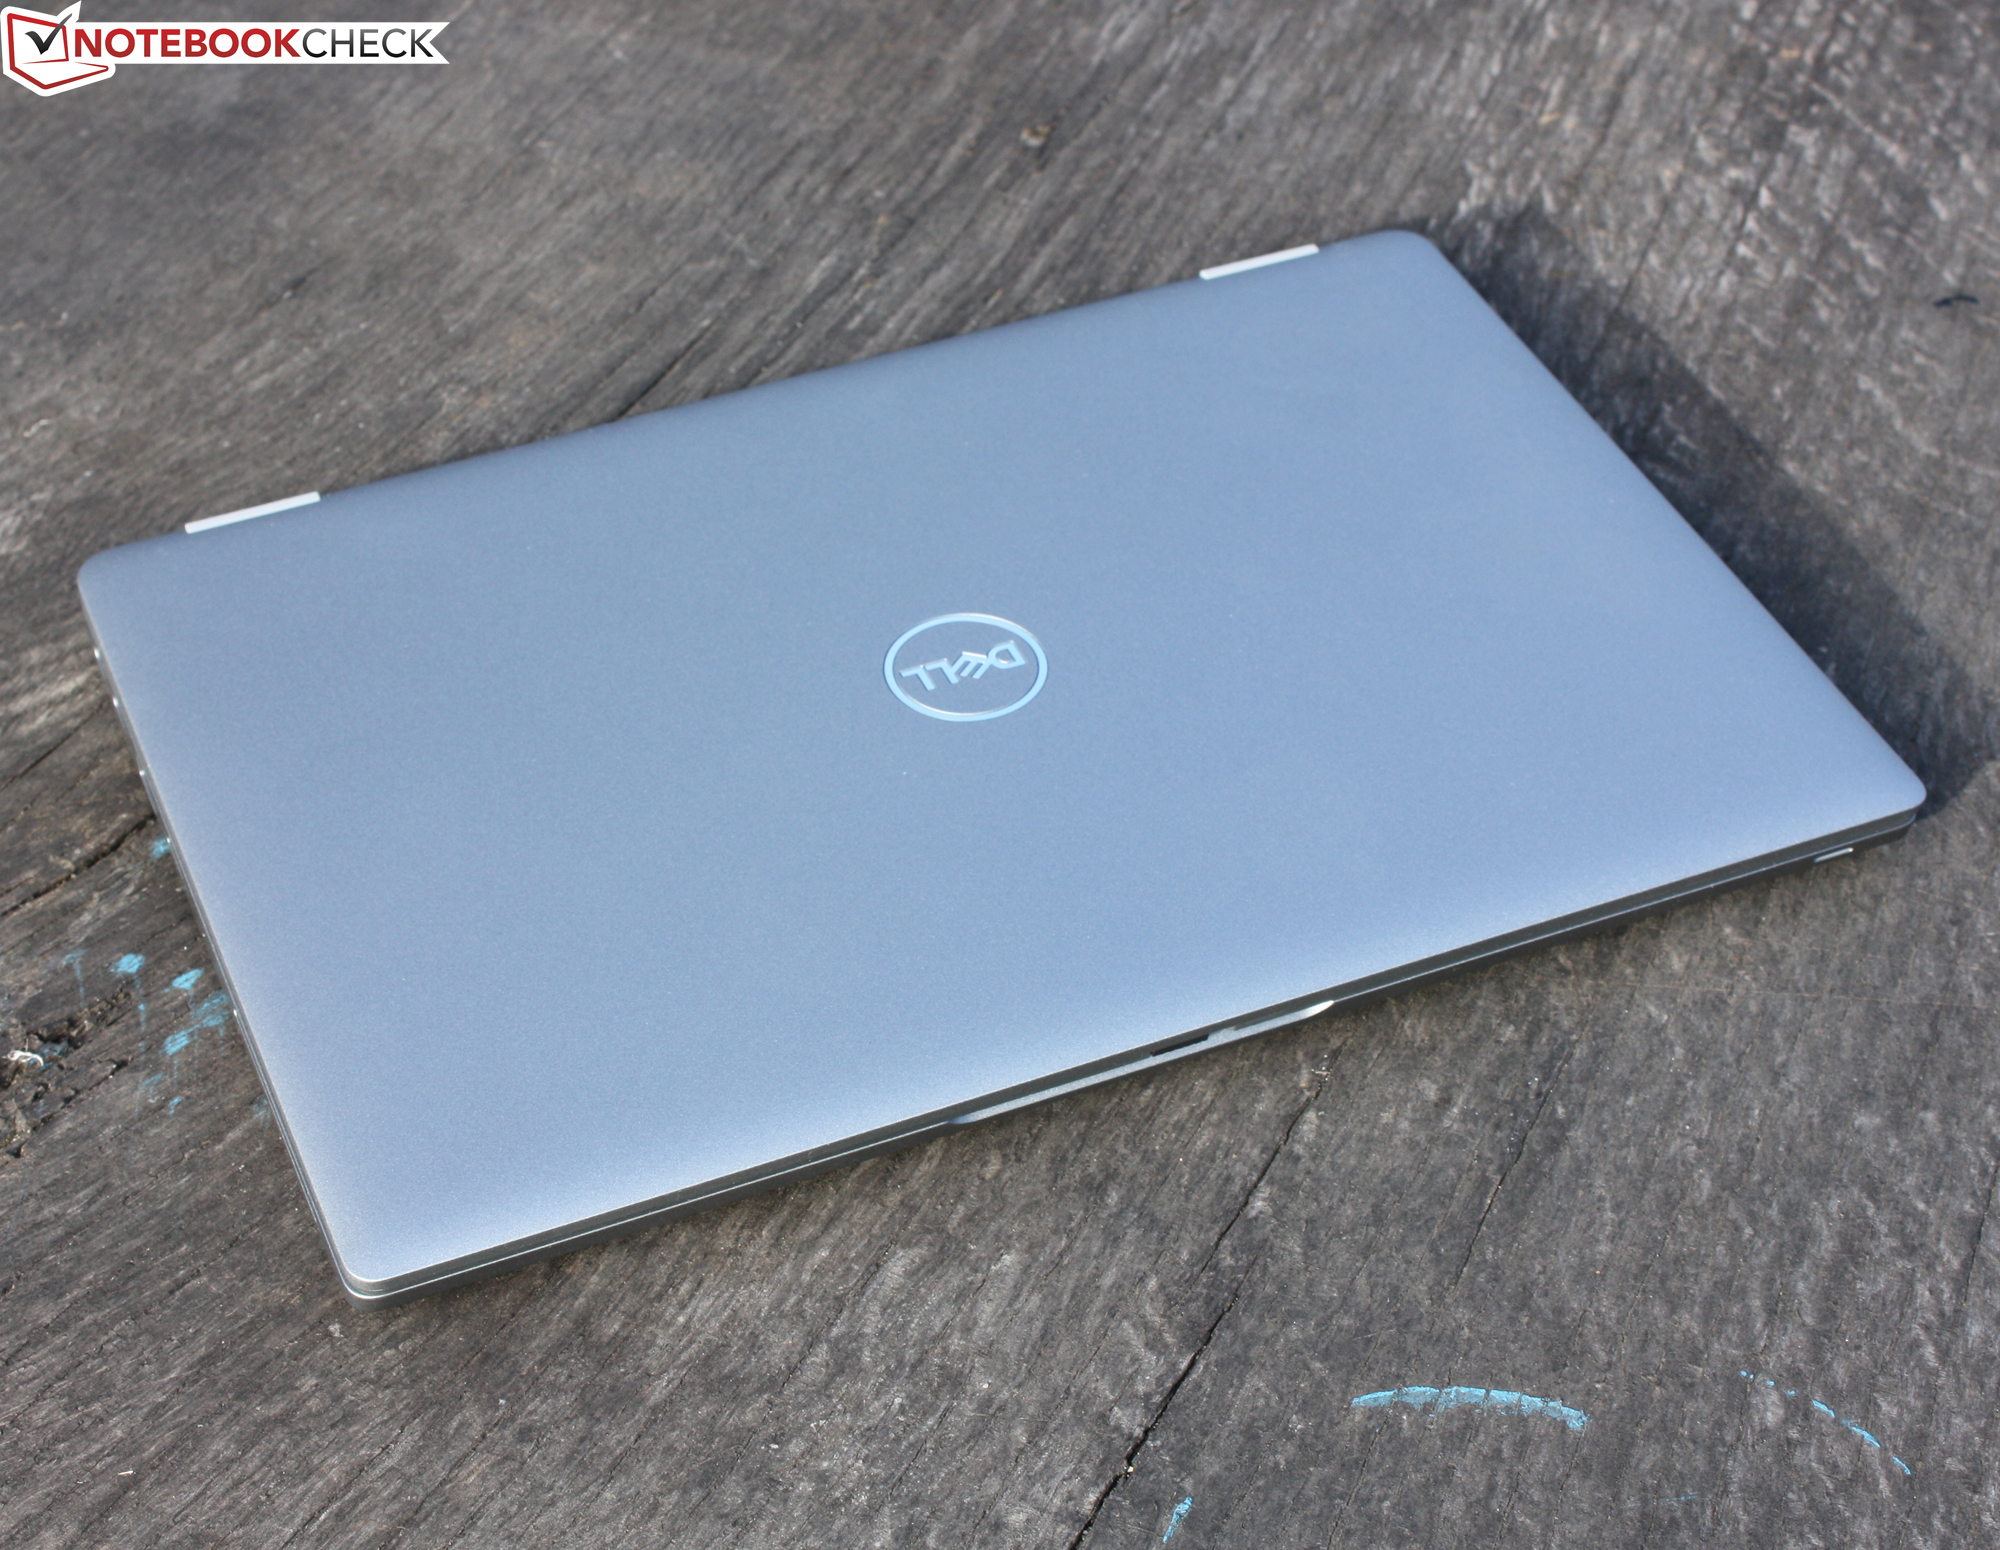
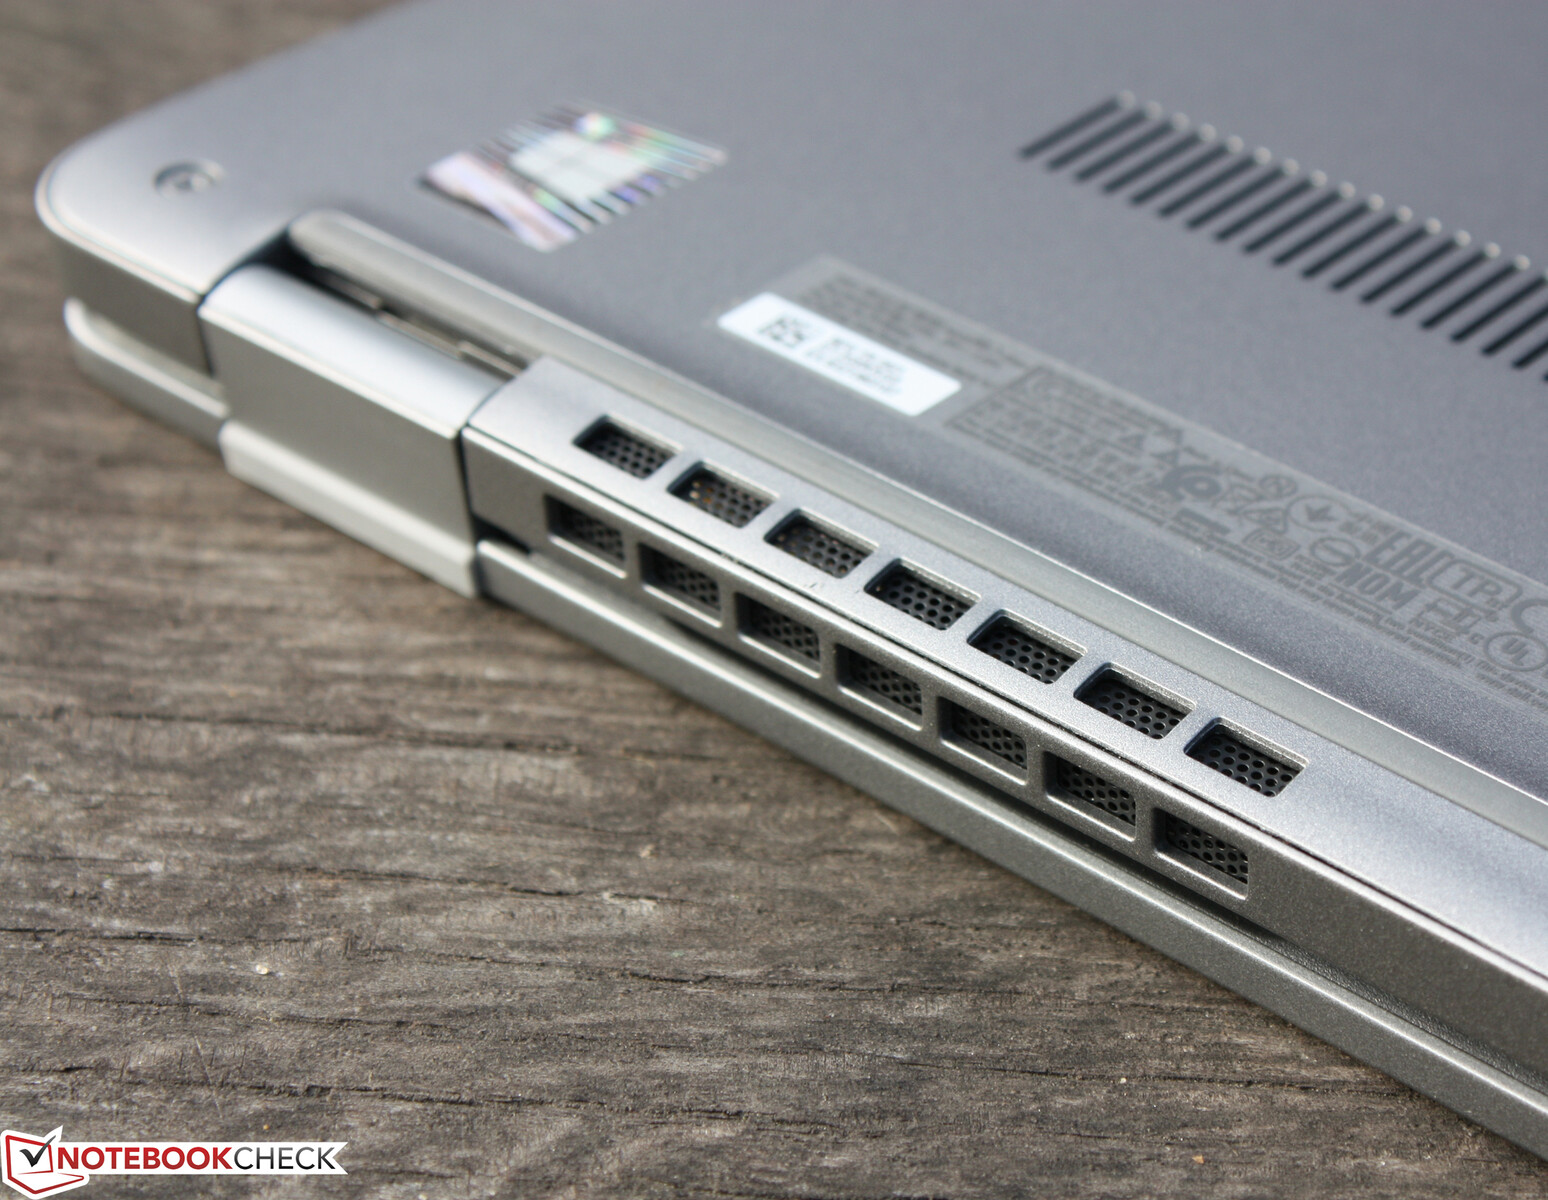
The technology of the Latitude 5320 has been packed into a chic metal casing that comes without frills. The silver-gray chassis and its design language are identical to the predecessor. However, the ports have been changed and the separate power button on the base unit has been omitted. The black display bezel is quite wide at the top where the webcam is located, the result of the widescreen display. The circumferential hard rubber lip around the display frame, which lies cleanly on the base, is well made. This prevents sand or dirt from getting into the gap during transport.
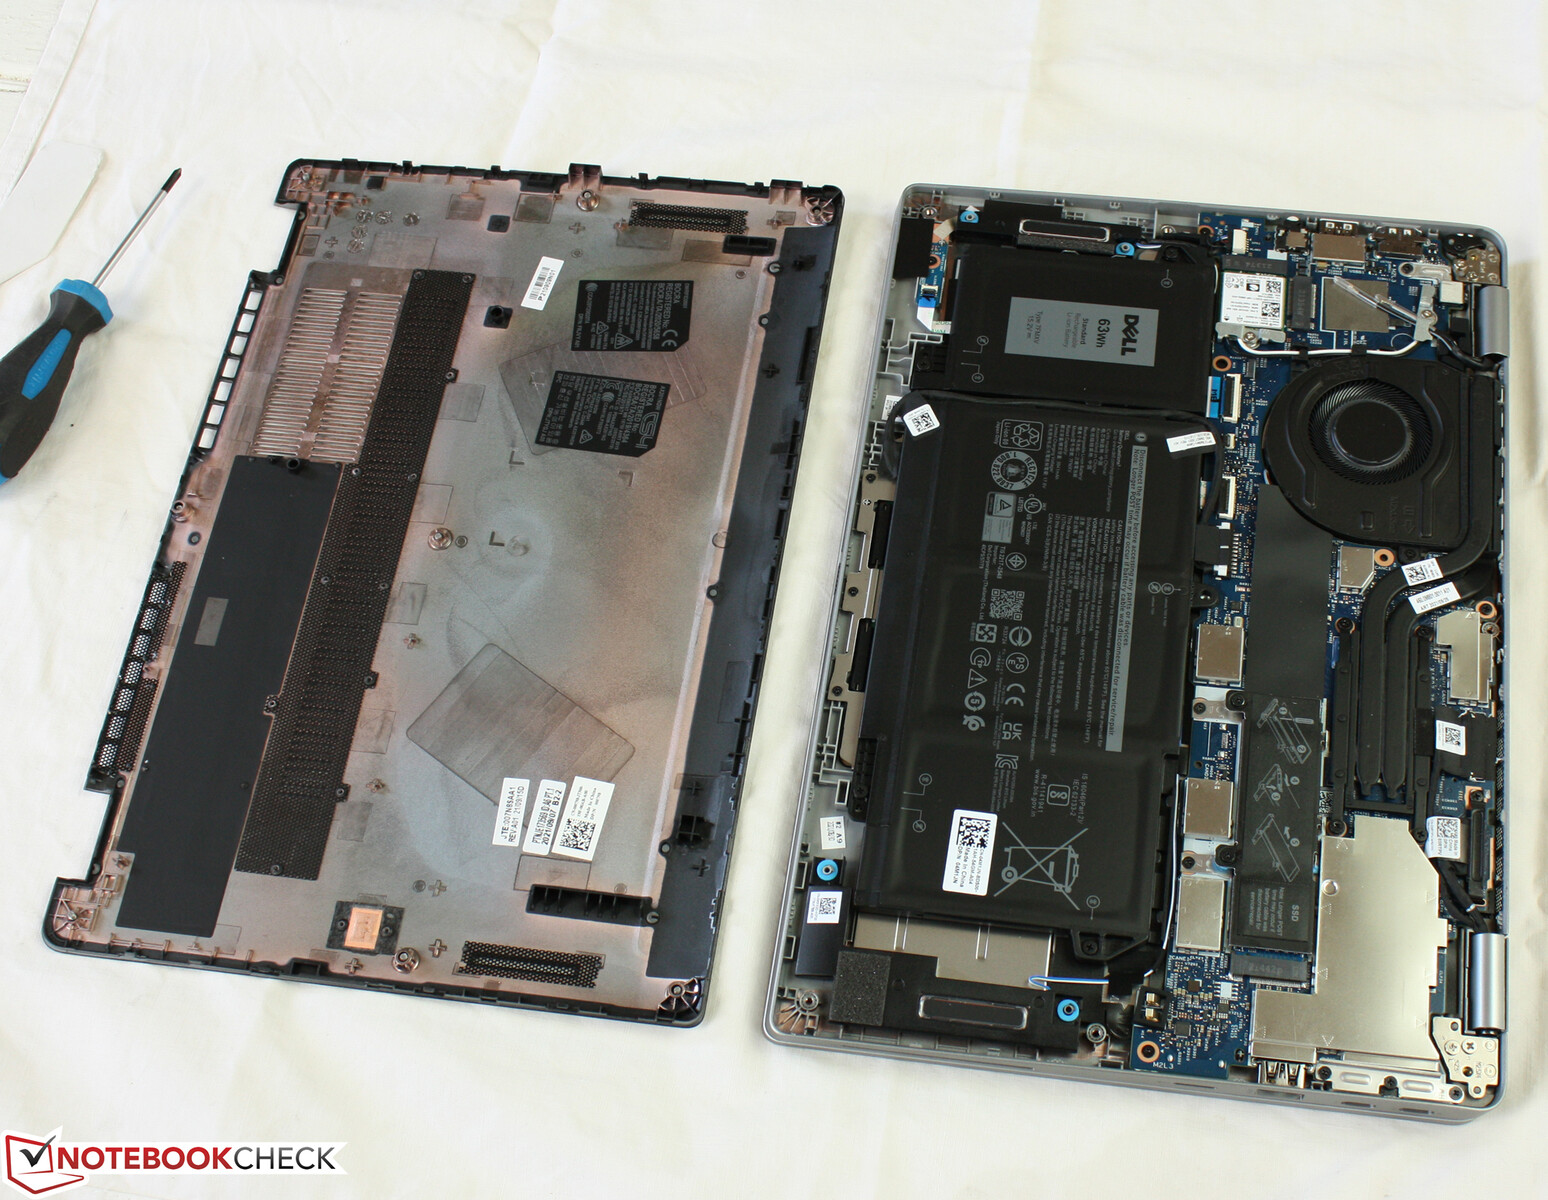
Dell also relies on matte surfaces throughout. There is no maintenance hatch, the battery is permanently installed but can be replaced. The innards can be accessed after removing the bottom cover - more on that later.
The Latitude is well manufactured. The gaps are correct, there are no material protrusions or sharp edges. There is room for improvement in terms of stability. The base unit is stiff, but it can be bent to a certain extent, which is detrimental to the premium claim. We consider the lid to be more stable: its thick edges provide a high stiffness. Pressure on the back does not cause any ripple on the picture.
The extremely tight hinges keep the lid firmly in position, but the one-hand opening is not possible. The maximum opening angle is 180 degrees. The lid lifts the base slightly when opened and slides underneath. It does not get scratched because rubber feet are attached to its bottom edge.
Within our comparison field, the Latitude is one of the most compact devices. ThinkBook 13s and Dell XPS 13 9305 are on par, but the 13s is even thinner. In terms of weight, it is largely on par with most of the rivals.
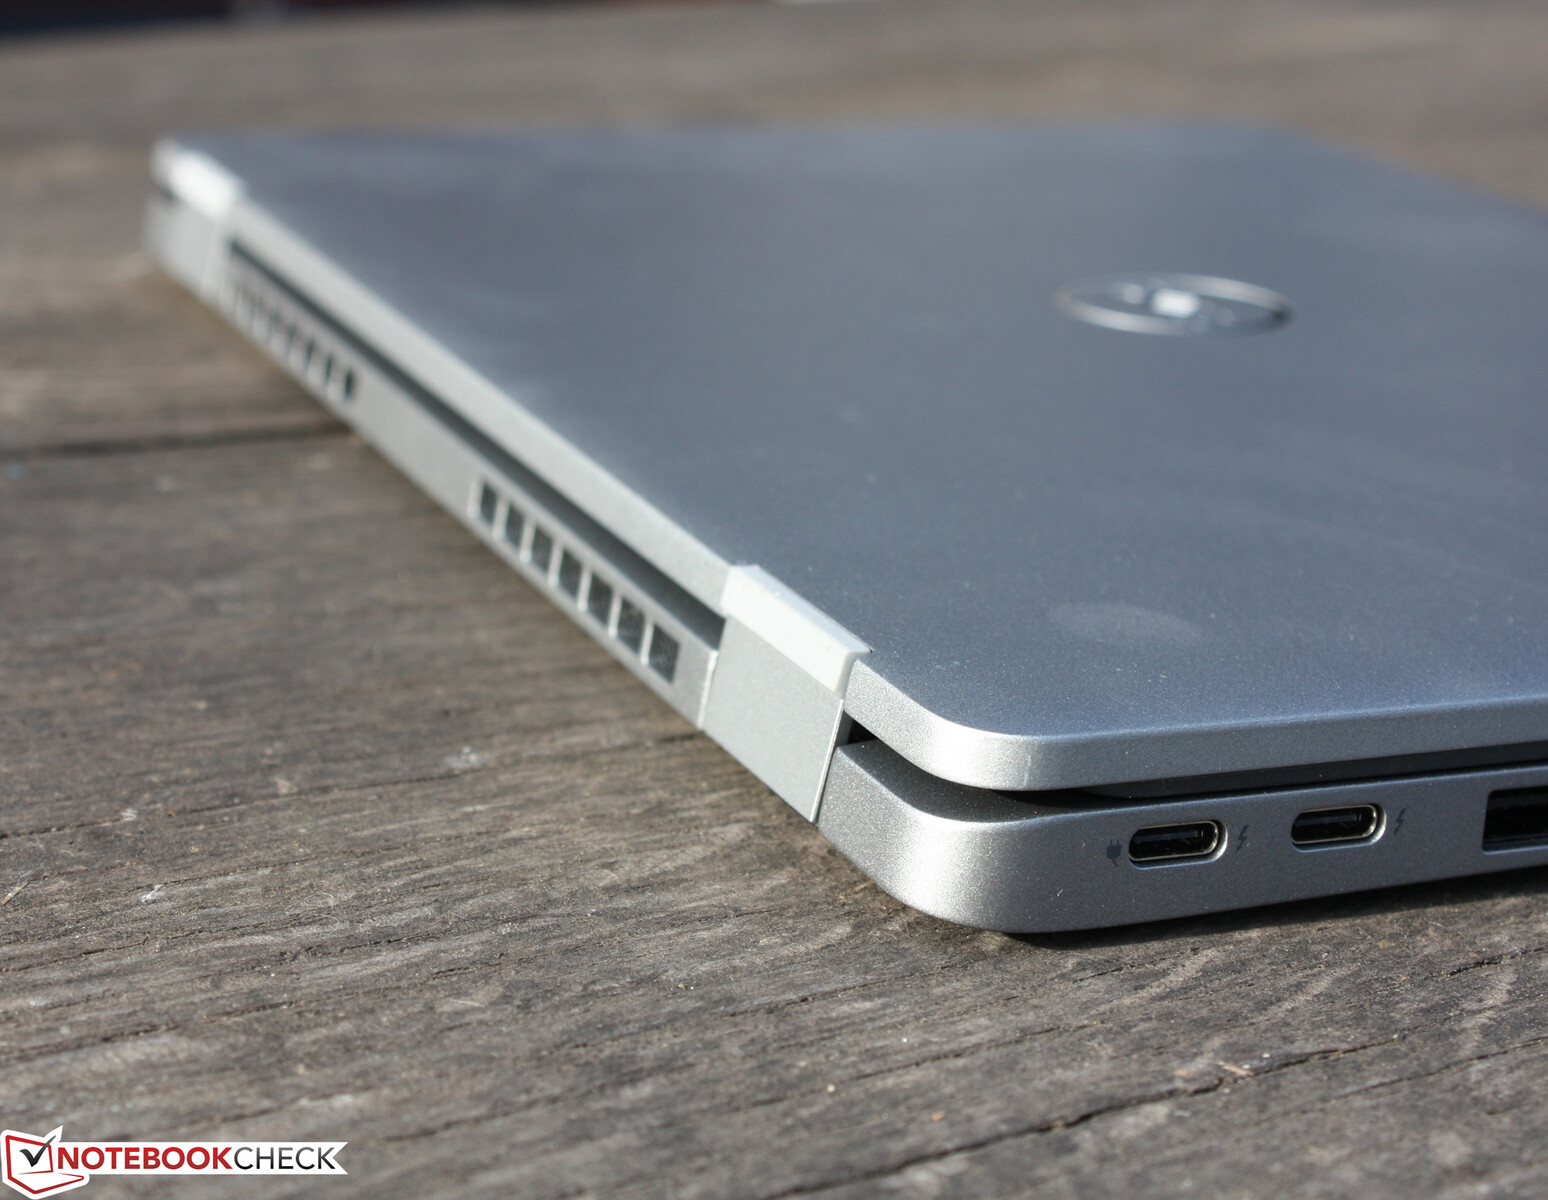
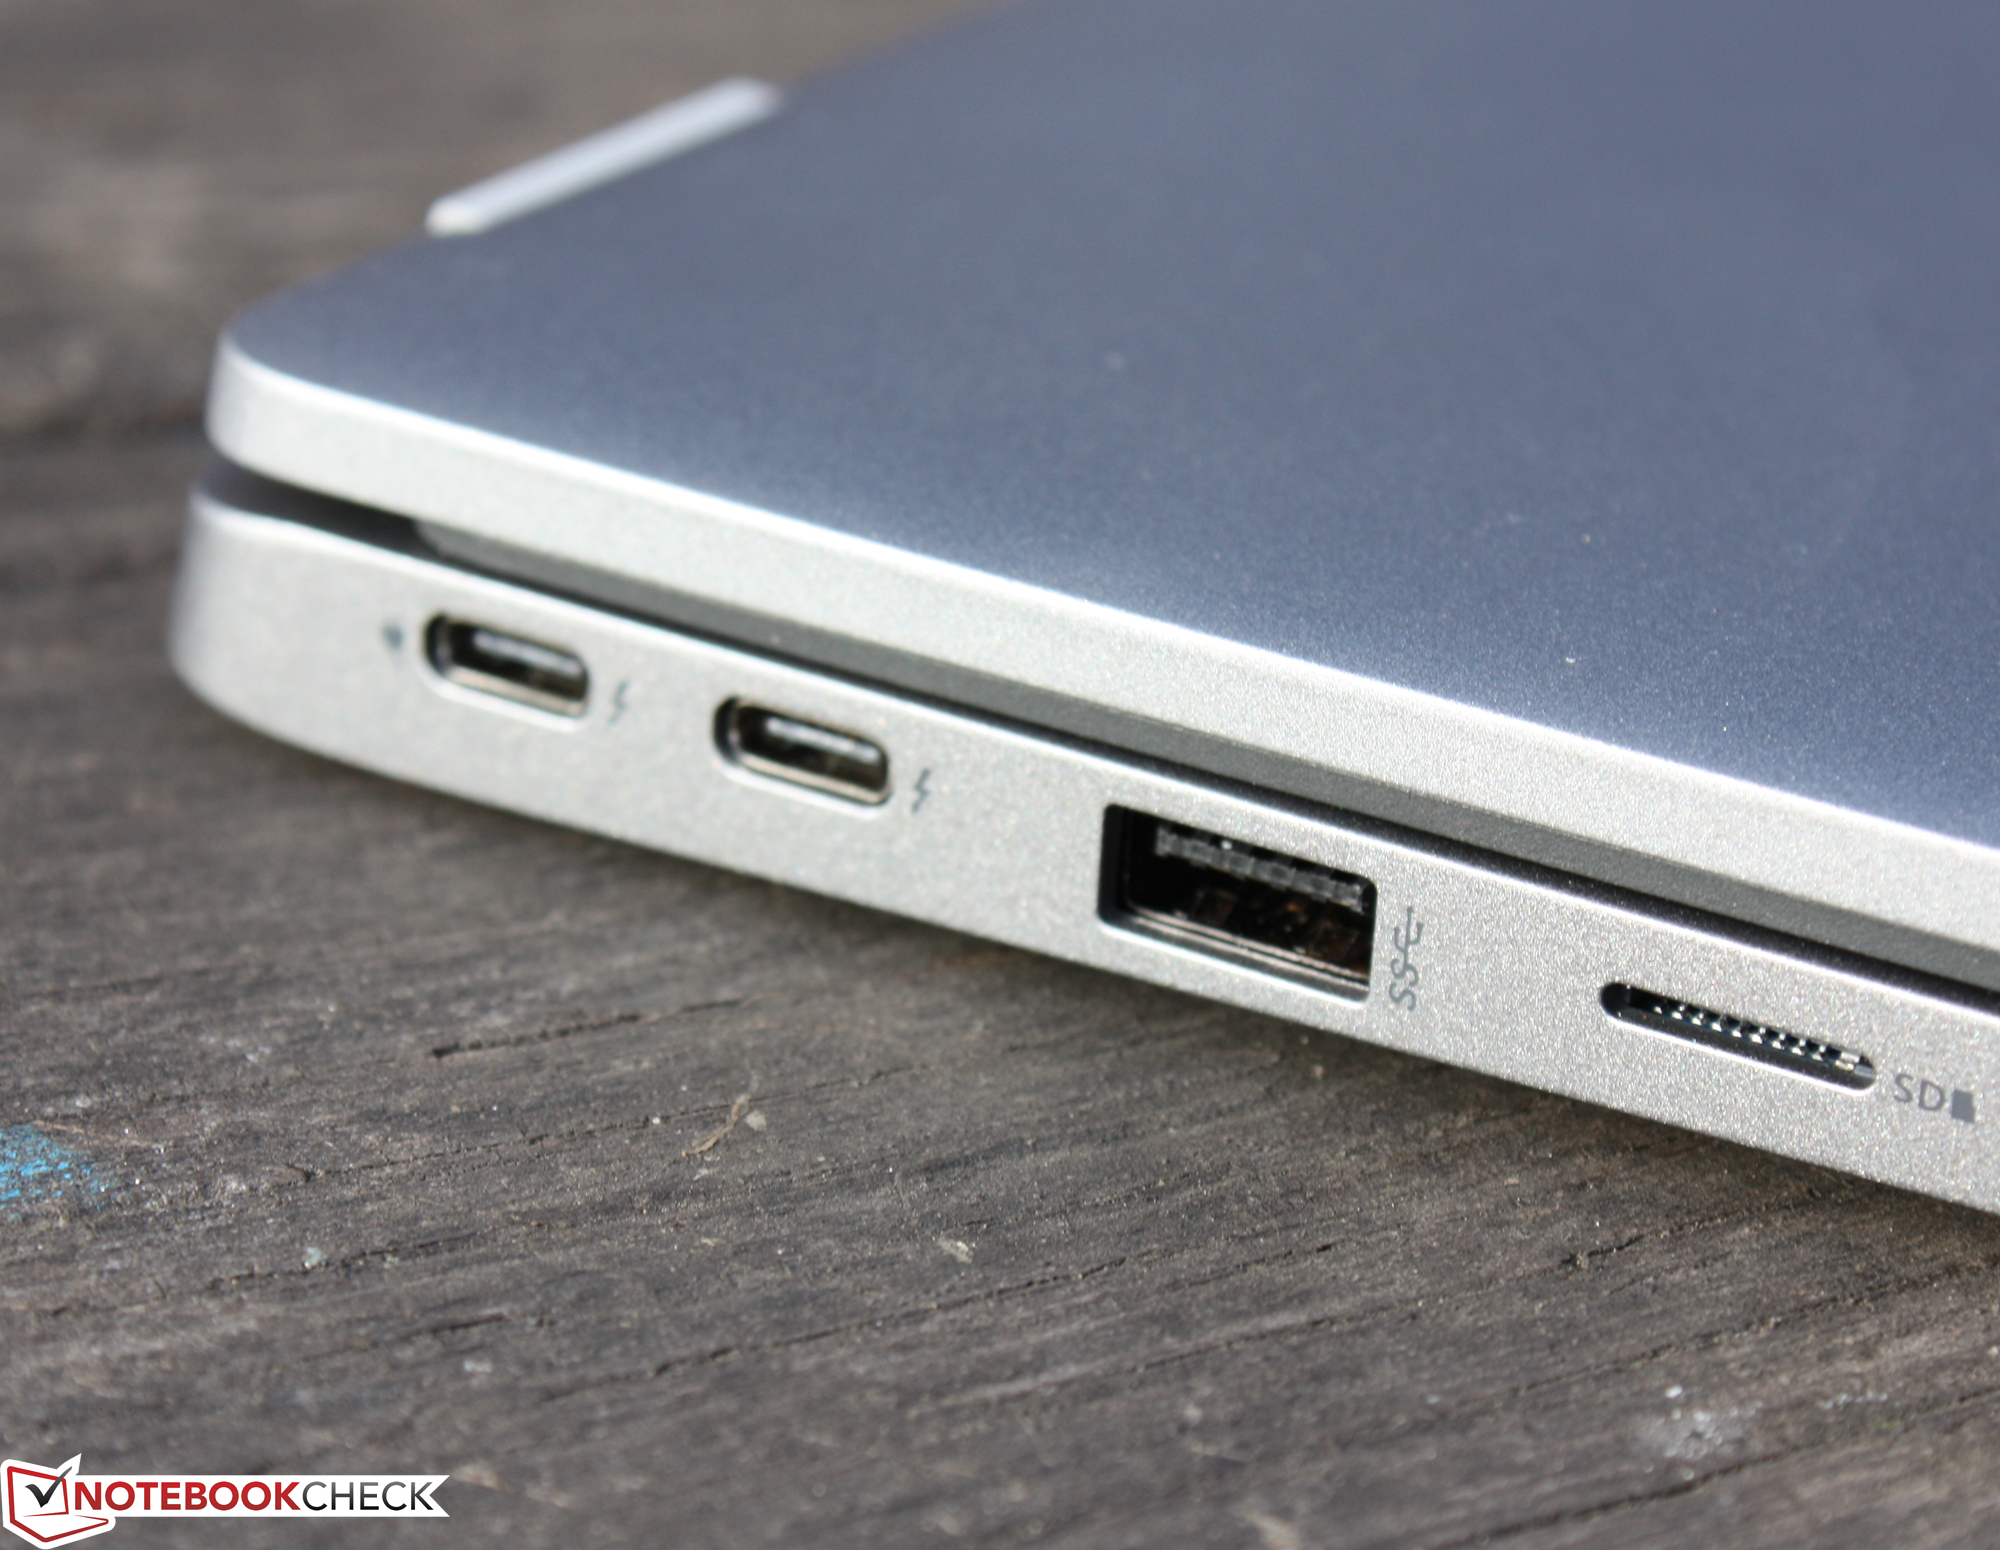
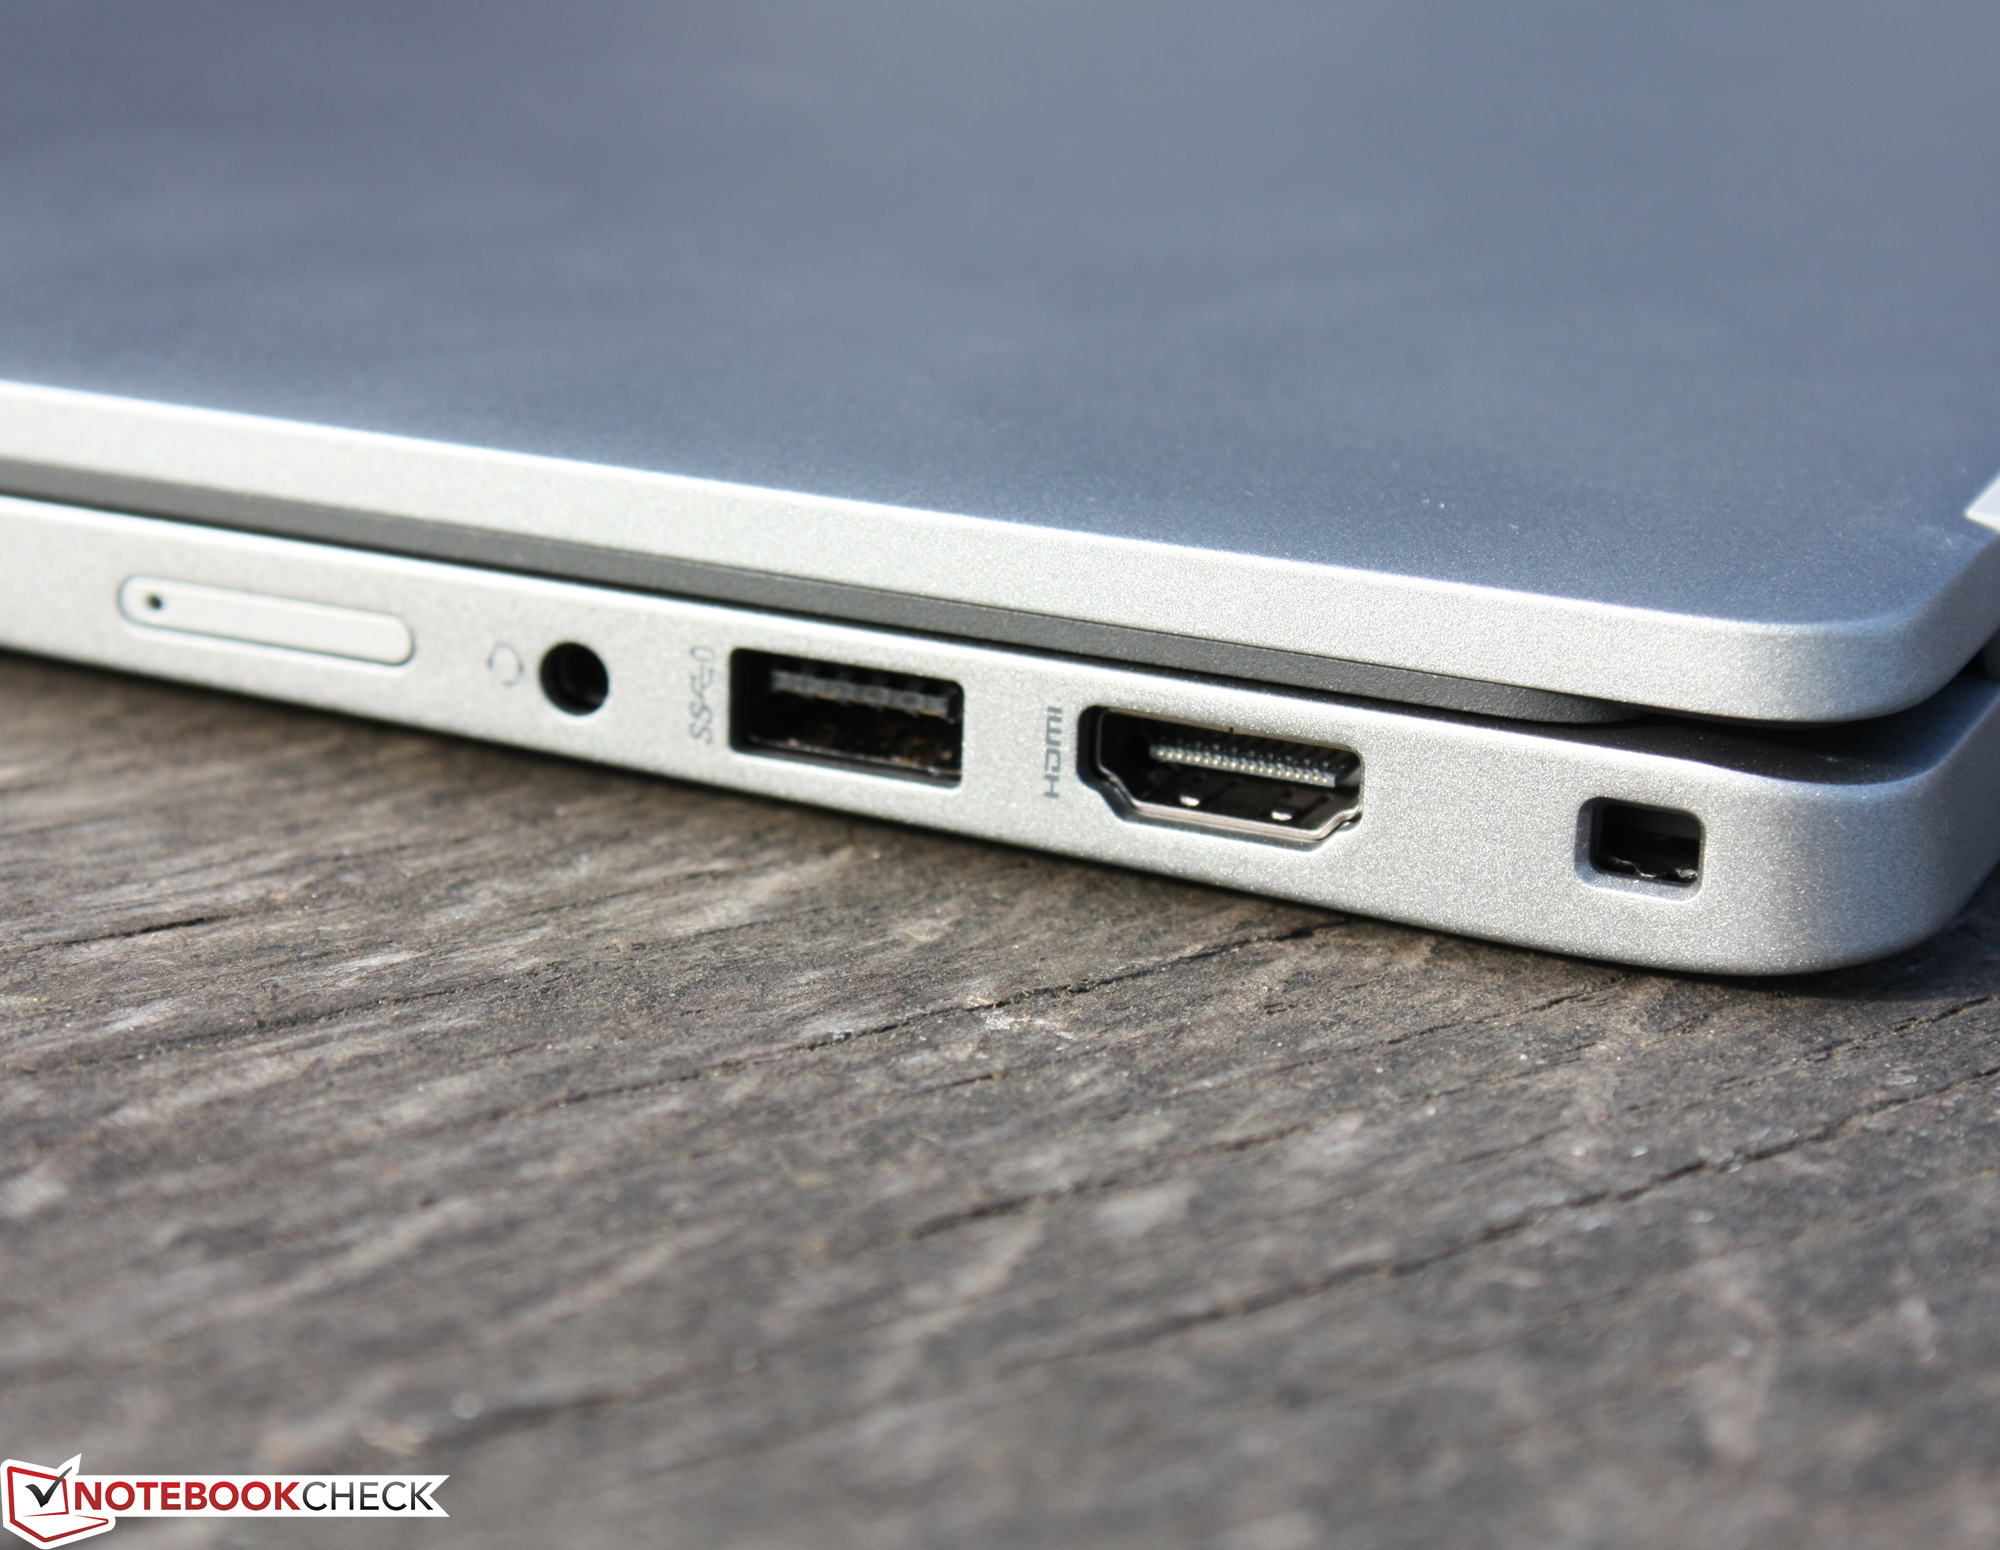
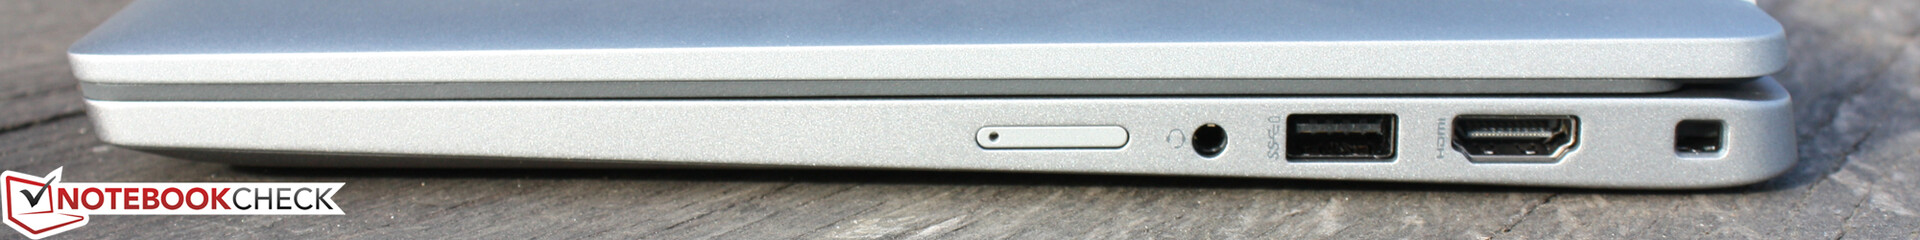
Equipment - 2x Thunderbolt 4 as standard
Compared to the predecessor from 2020, there are significant changes, such as the removal of the hollow-jack power connector in favor of USB Type-C with Power Delivery support. Furthermore, the dedicated mouse keys and the replaceable working memory are omitted. RJ45 Ethernet is also no longer available, but two Thunderbolt ports with USB 4.0 and DisplayPort are. A Thunderbolt 3 port was optional before, but now the TB4 is standard.
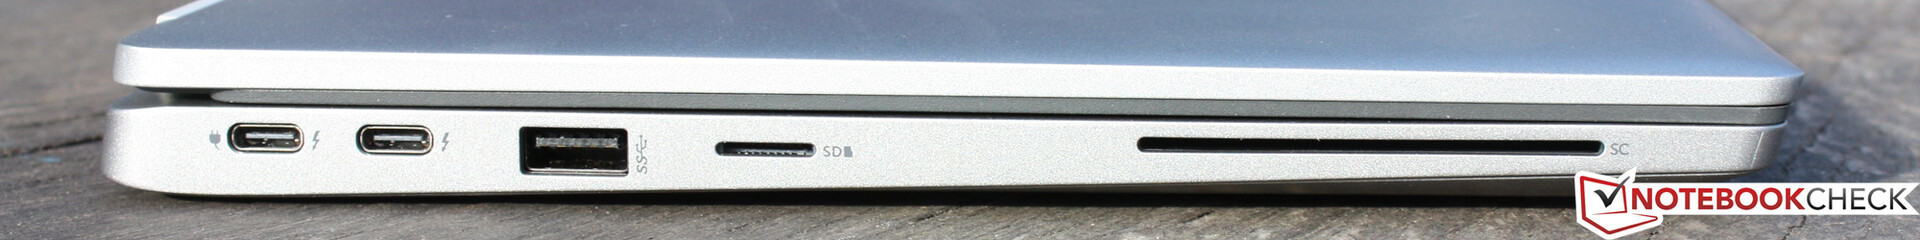
SD CardReader
The built-in microSD card reader is one of the fastest of its kind with transfer rates of 191 MB/s (copying large data blocks) and 205 MB/s (transferring 250 jpg image files of around 5 MB each). We determined the data rates using a reference card (Angelbird AV PRO V60 microSD 128 GB).
| SD Card Reader | |
| average JPG Copy Test (av. of 3 runs) | |
| Dell Latitude 5320-TM4V2 (AV Pro SD microSD 128 GB V60) | |
| Dell XPS 13 9305 Core i5 FHD | |
| Lenovo ThinkPad L13 Gen2-21AB000PGE | |
| Lenovo ThinkPad L14 G2-20X1003WGE (AV Pro V60) | |
| Lenovo ThinkBook 14 G2 ITL 20VDS02G00 (AV Pro V60) | |
| Average of class Subnotebook (18.9 - 193.9, n=17, last 2 years) | |
| Acer TravelMate P4 TMP414-51-59MR (AV Pro SD microSD 128 GB V60) | |
| maximum AS SSD Seq Read Test (1GB) | |
| Dell Latitude 5320-TM4V2 (AV Pro SD microSD 128 GB V60) | |
| Dell XPS 13 9305 Core i5 FHD | |
| Lenovo ThinkBook 14 G2 ITL 20VDS02G00 (AV Pro V60) | |
| Lenovo ThinkPad L13 Gen2-21AB000PGE | |
| Lenovo ThinkPad L14 G2-20X1003WGE (AV Pro V60) | |
| Average of class Subnotebook (23.6 - 239, n=17, last 2 years) | |
| Acer TravelMate P4 TMP414-51-59MR (AV Pro SD microSD 128 GB V60) | |
Communication
The WLAN chip (Intel AX201) supports the WLAN standards 802.11a/b/g/n/ac/ax. The transmission speeds determined under optimal conditions (no other WLAN devices in the immediate vicinity, short distance between notebook and server PC) are normal or excellent. In all control measurements, the indicated drop occurred. Wired network connections are no longer possible for the first time, the predecessor still had a pop-up RJ45.
Dell offers an optional LTE modem for the Latitude - our test device comes without a modem. However, it could be retrofitted, LTE antennas and SIM card slot (eSim) are available.
| Networking | |
| iperf3 transmit AX12 | |
| Lenovo ThinkBook 13s G3 20YA0005GE | |
| Average Intel Wi-Fi 6 AX201 (49.8 - 1775, n=324) | |
| Dell XPS 13 9305 Core i5 FHD | |
| Lenovo ThinkPad L14 G2-20X1003WGE | |
| Acer TravelMate P4 TMP414-51-59MR | |
| Lenovo ThinkPad L13 Gen2-21AB000PGE | |
| Dell Latitude 5320-TM4V2 | |
| Lenovo ThinkBook 14 G2 ITL 20VDS02G00 | |
| Lenovo ThinkBook 14 G2 ITL 20VDS02G00 | |
| iperf3 receive AX12 | |
| Dell XPS 13 9305 Core i5 FHD | |
| Dell Latitude 5320-TM4V2 | |
| Average Intel Wi-Fi 6 AX201 (136 - 1743, n=324) | |
| Lenovo ThinkBook 13s G3 20YA0005GE | |
| Acer TravelMate P4 TMP414-51-59MR | |
| Lenovo ThinkPad L13 Gen2-21AB000PGE | |
| Lenovo ThinkBook 14 G2 ITL 20VDS02G00 | |
| Lenovo ThinkBook 14 G2 ITL 20VDS02G00 | |
| Lenovo ThinkPad L14 G2-20X1003WGE | |
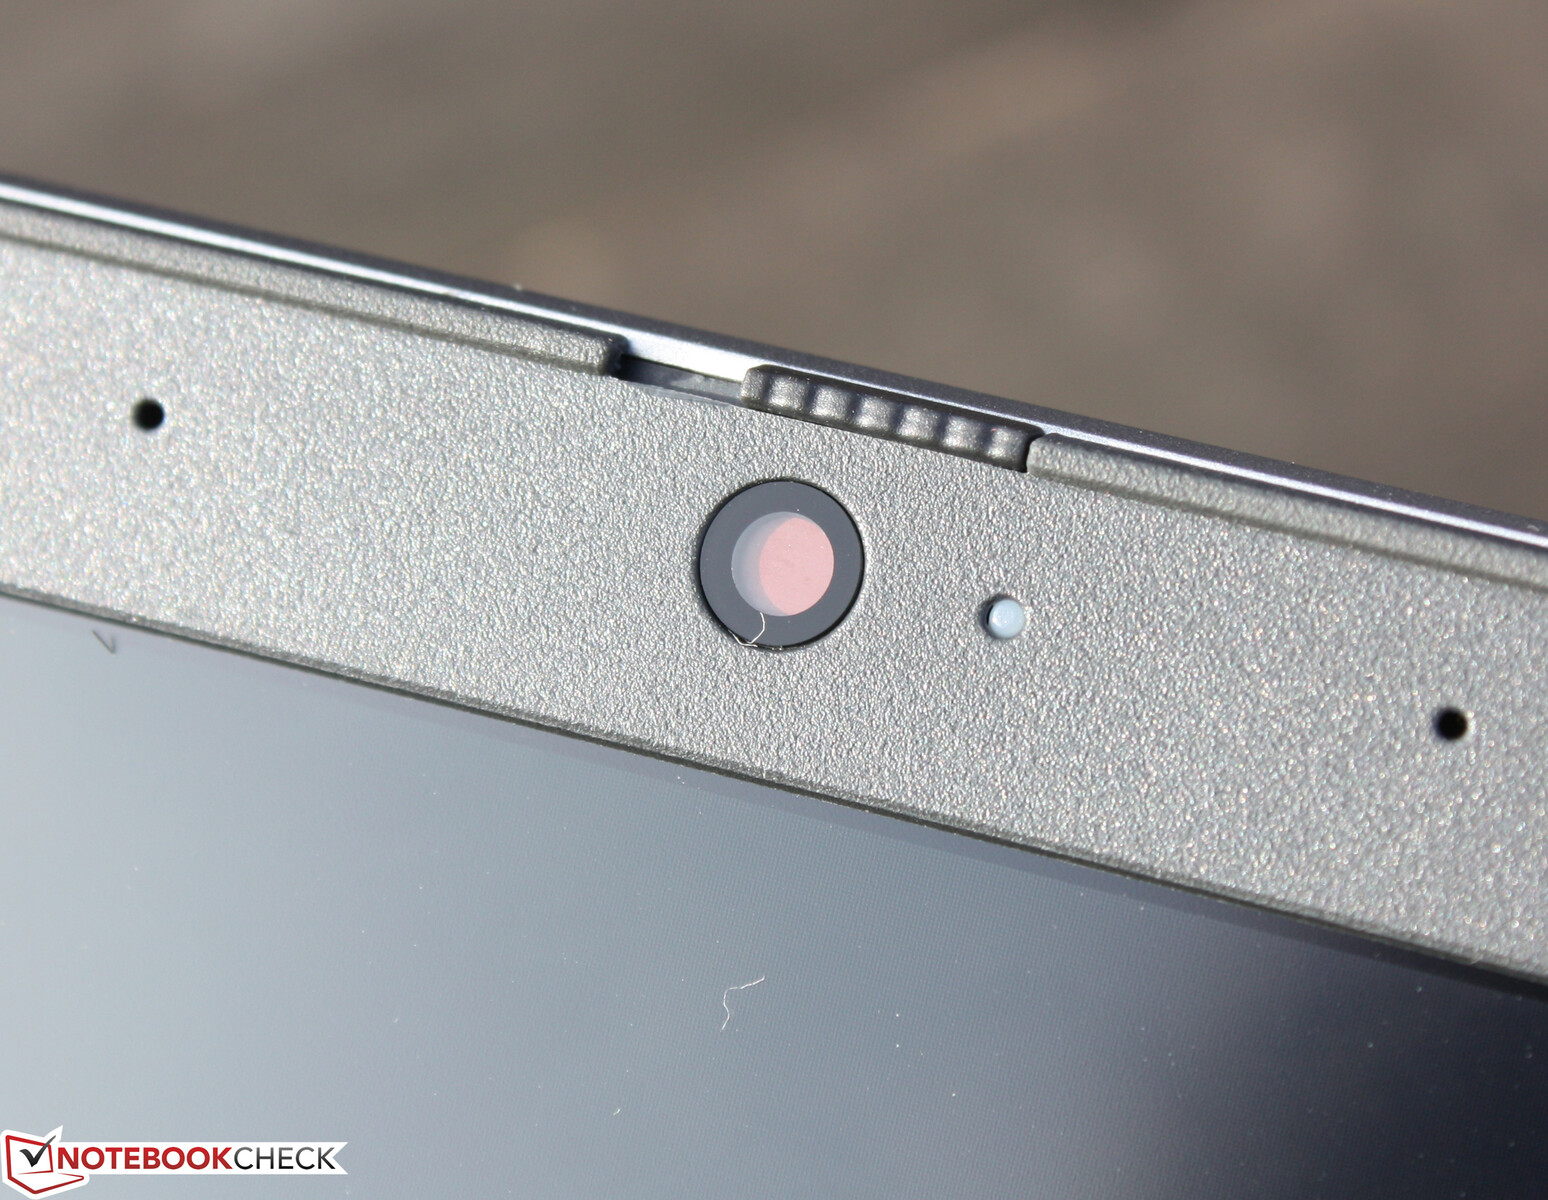
Webcam
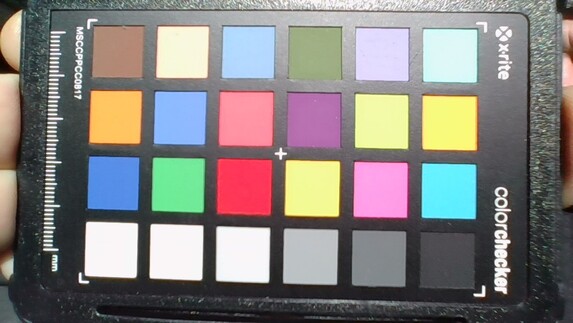
The webcam (0.9 MP; max. 1280 x 720) does not produce convincing pictures - just like the cameras of the competition. Furthermore, the color accuracy is lacking. With a deviation of almost 32, the target (DeltaE less than 3) is clearly missed.


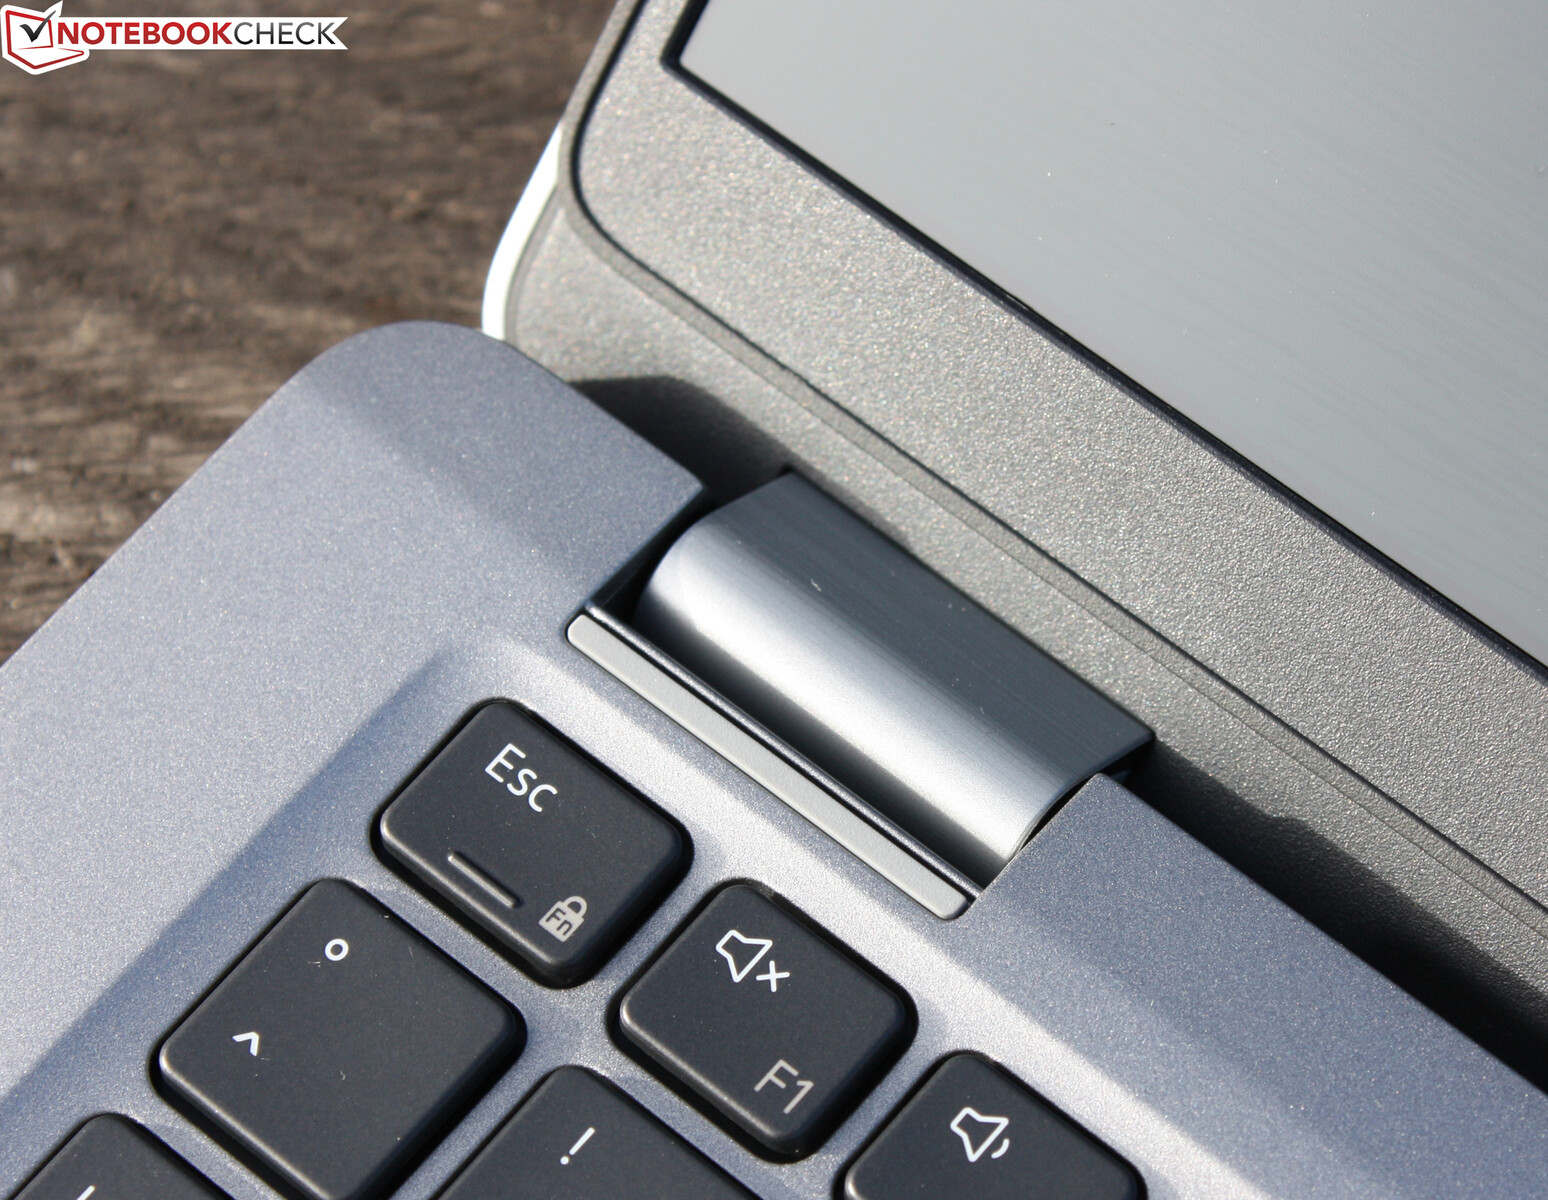
Security
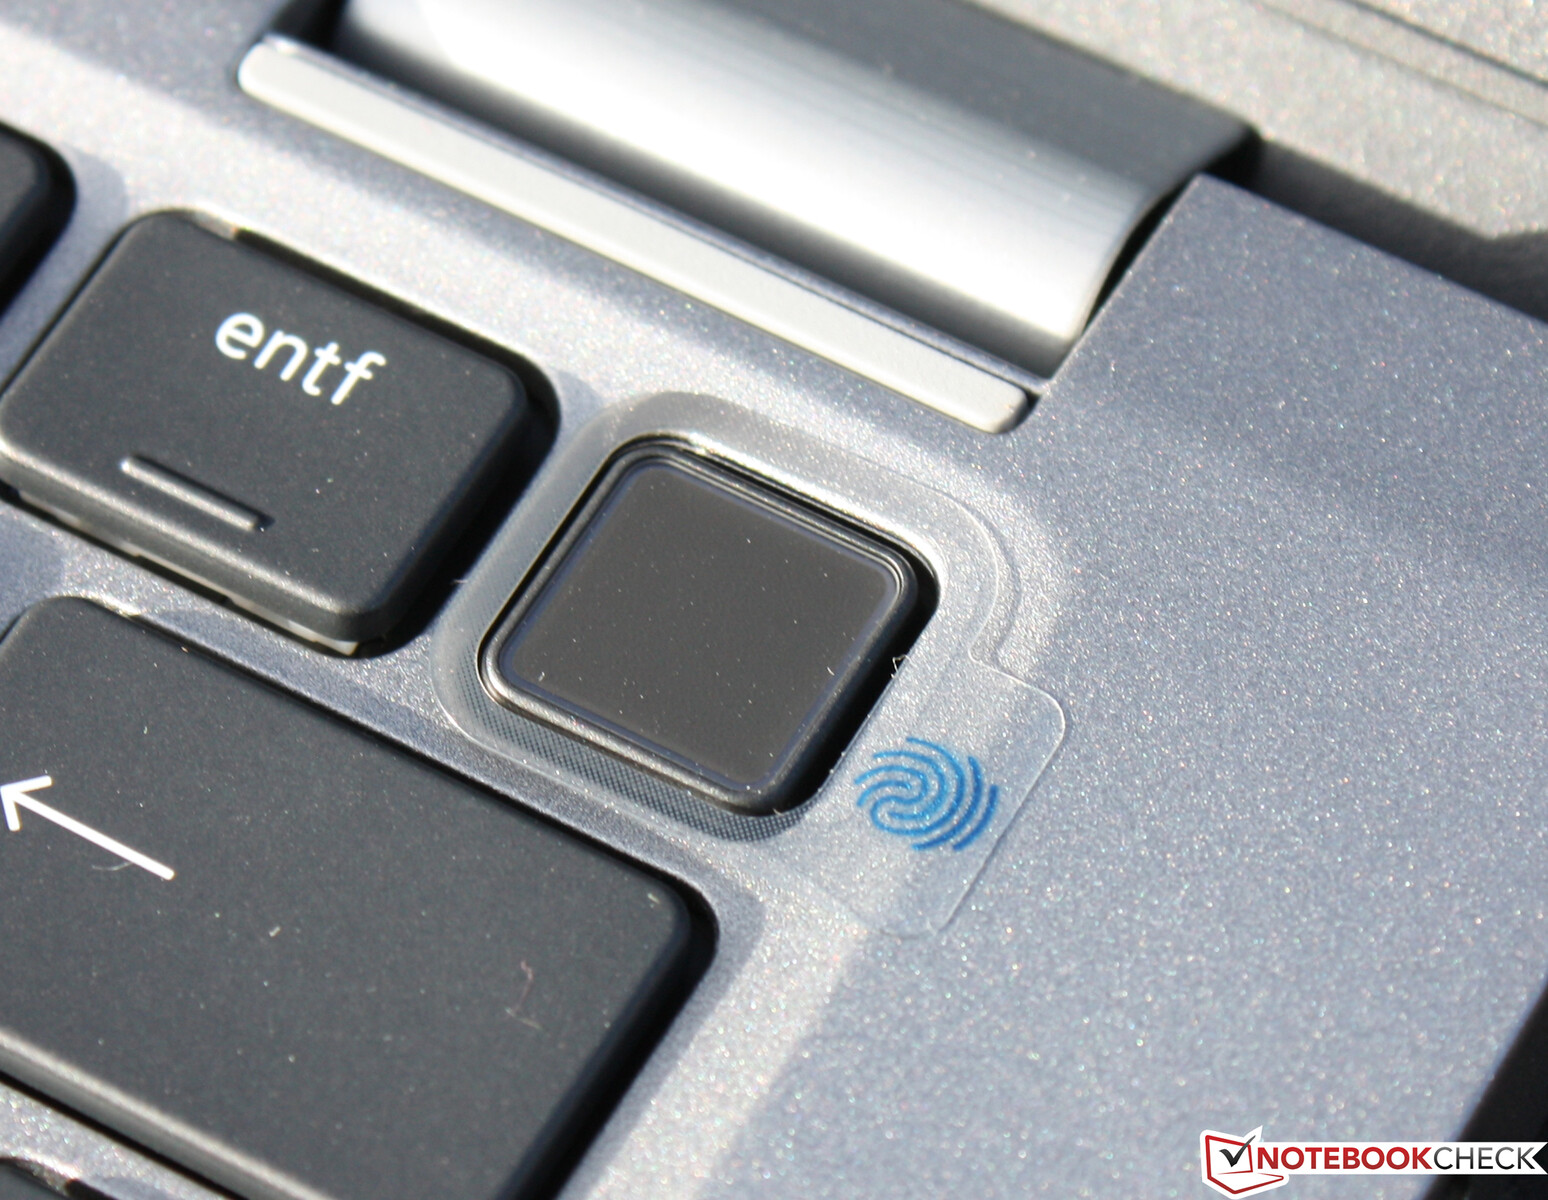
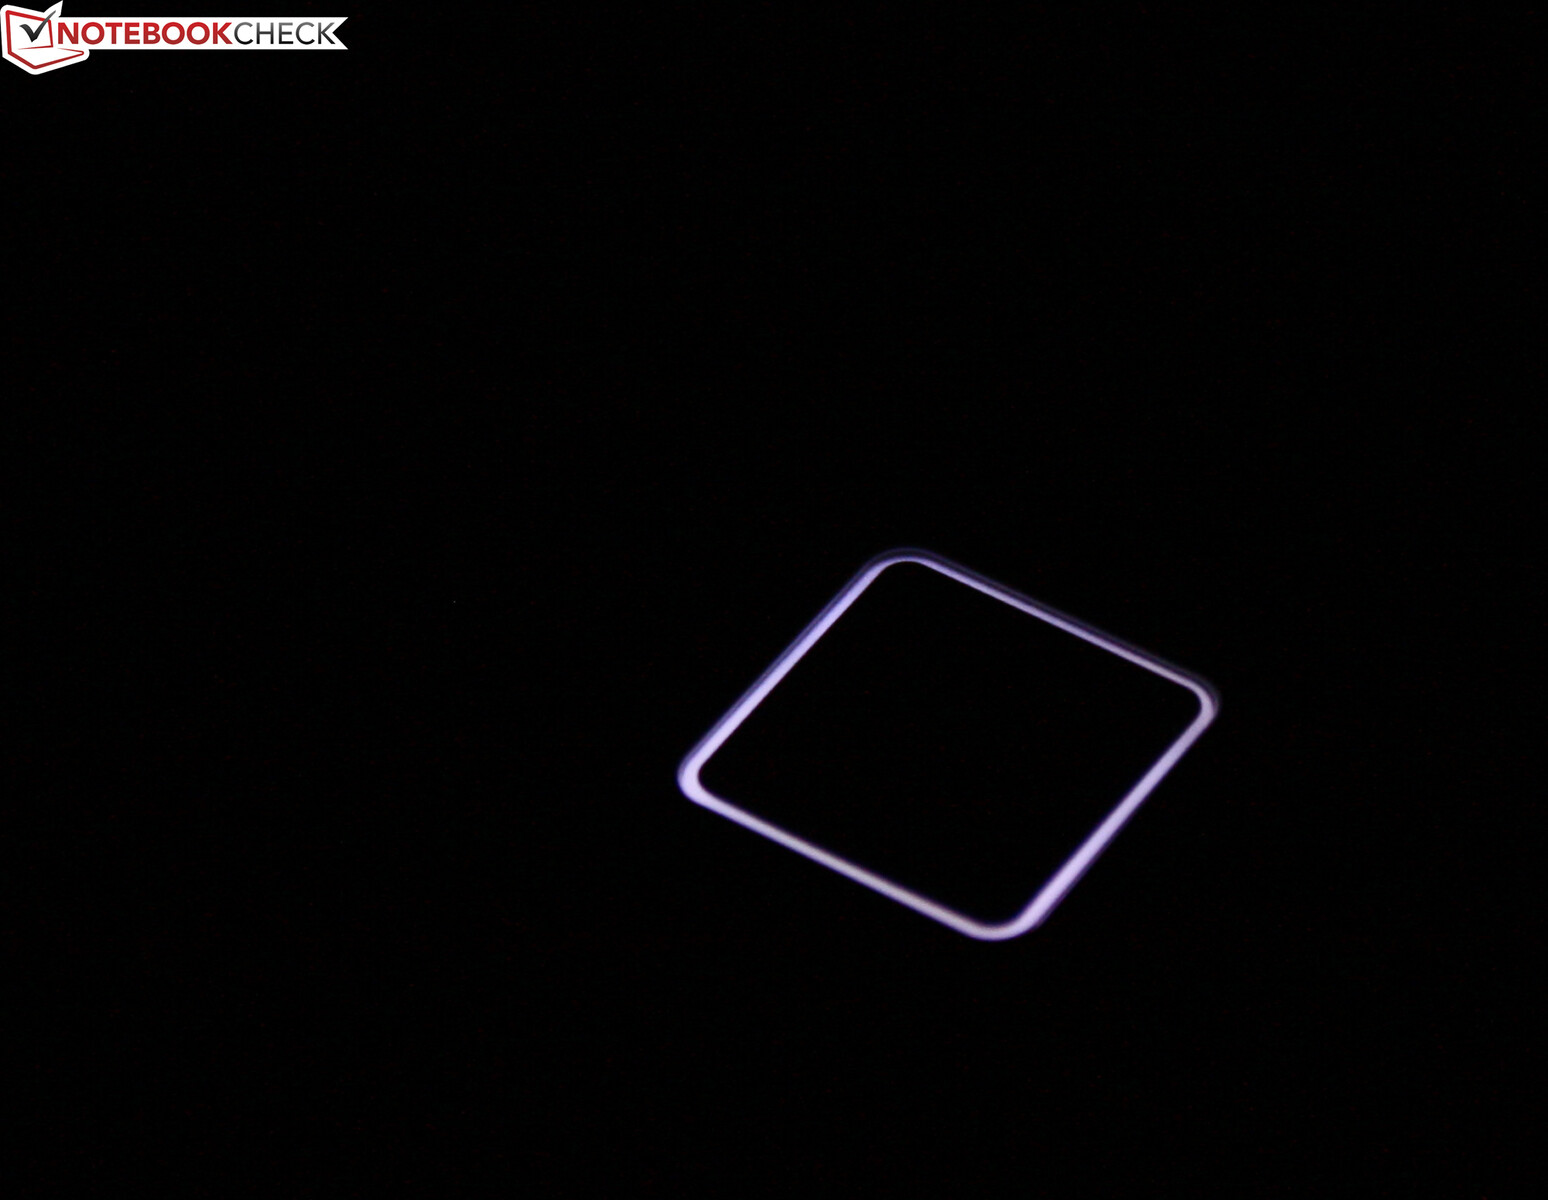
Our configuration variant comes with a smartcard as well as a fingerprint reader for biometric access security. The fingerprint reader is embedded in the power button, which is located in the keyboard's block for the first time. The proximity to the delete key theoretically bears the risk of an unintentional shutdown. However, this never happened in practice because the power-on requires a stronger pressure point.
Accessories
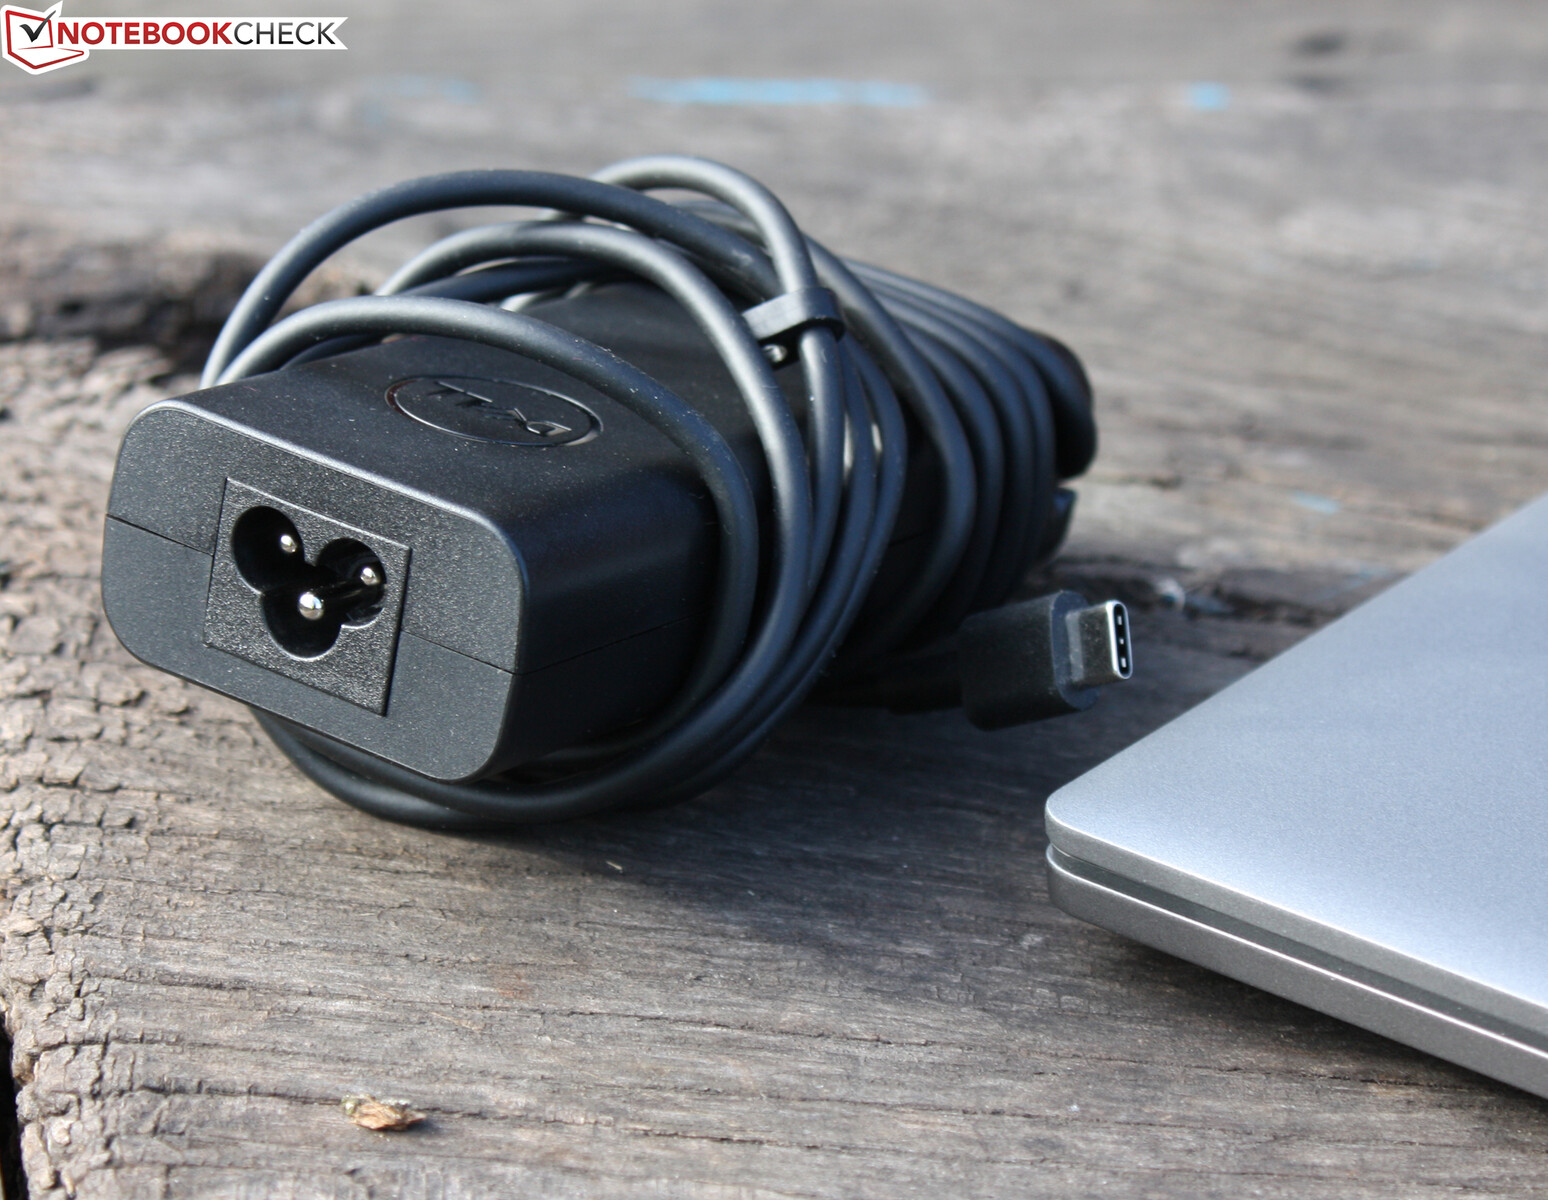
The notebook comes with the usual documents: a quick start guide and warranty information. In addition, there is a 65-Watt Type-C power adapter. Dell has interesting accessories ready. The Thunderbolt docks WD19TBS or TB16 have a lot of ports on the desk at home and are connected to the laptop with a single cable. The laptop is then also charged via this cable.
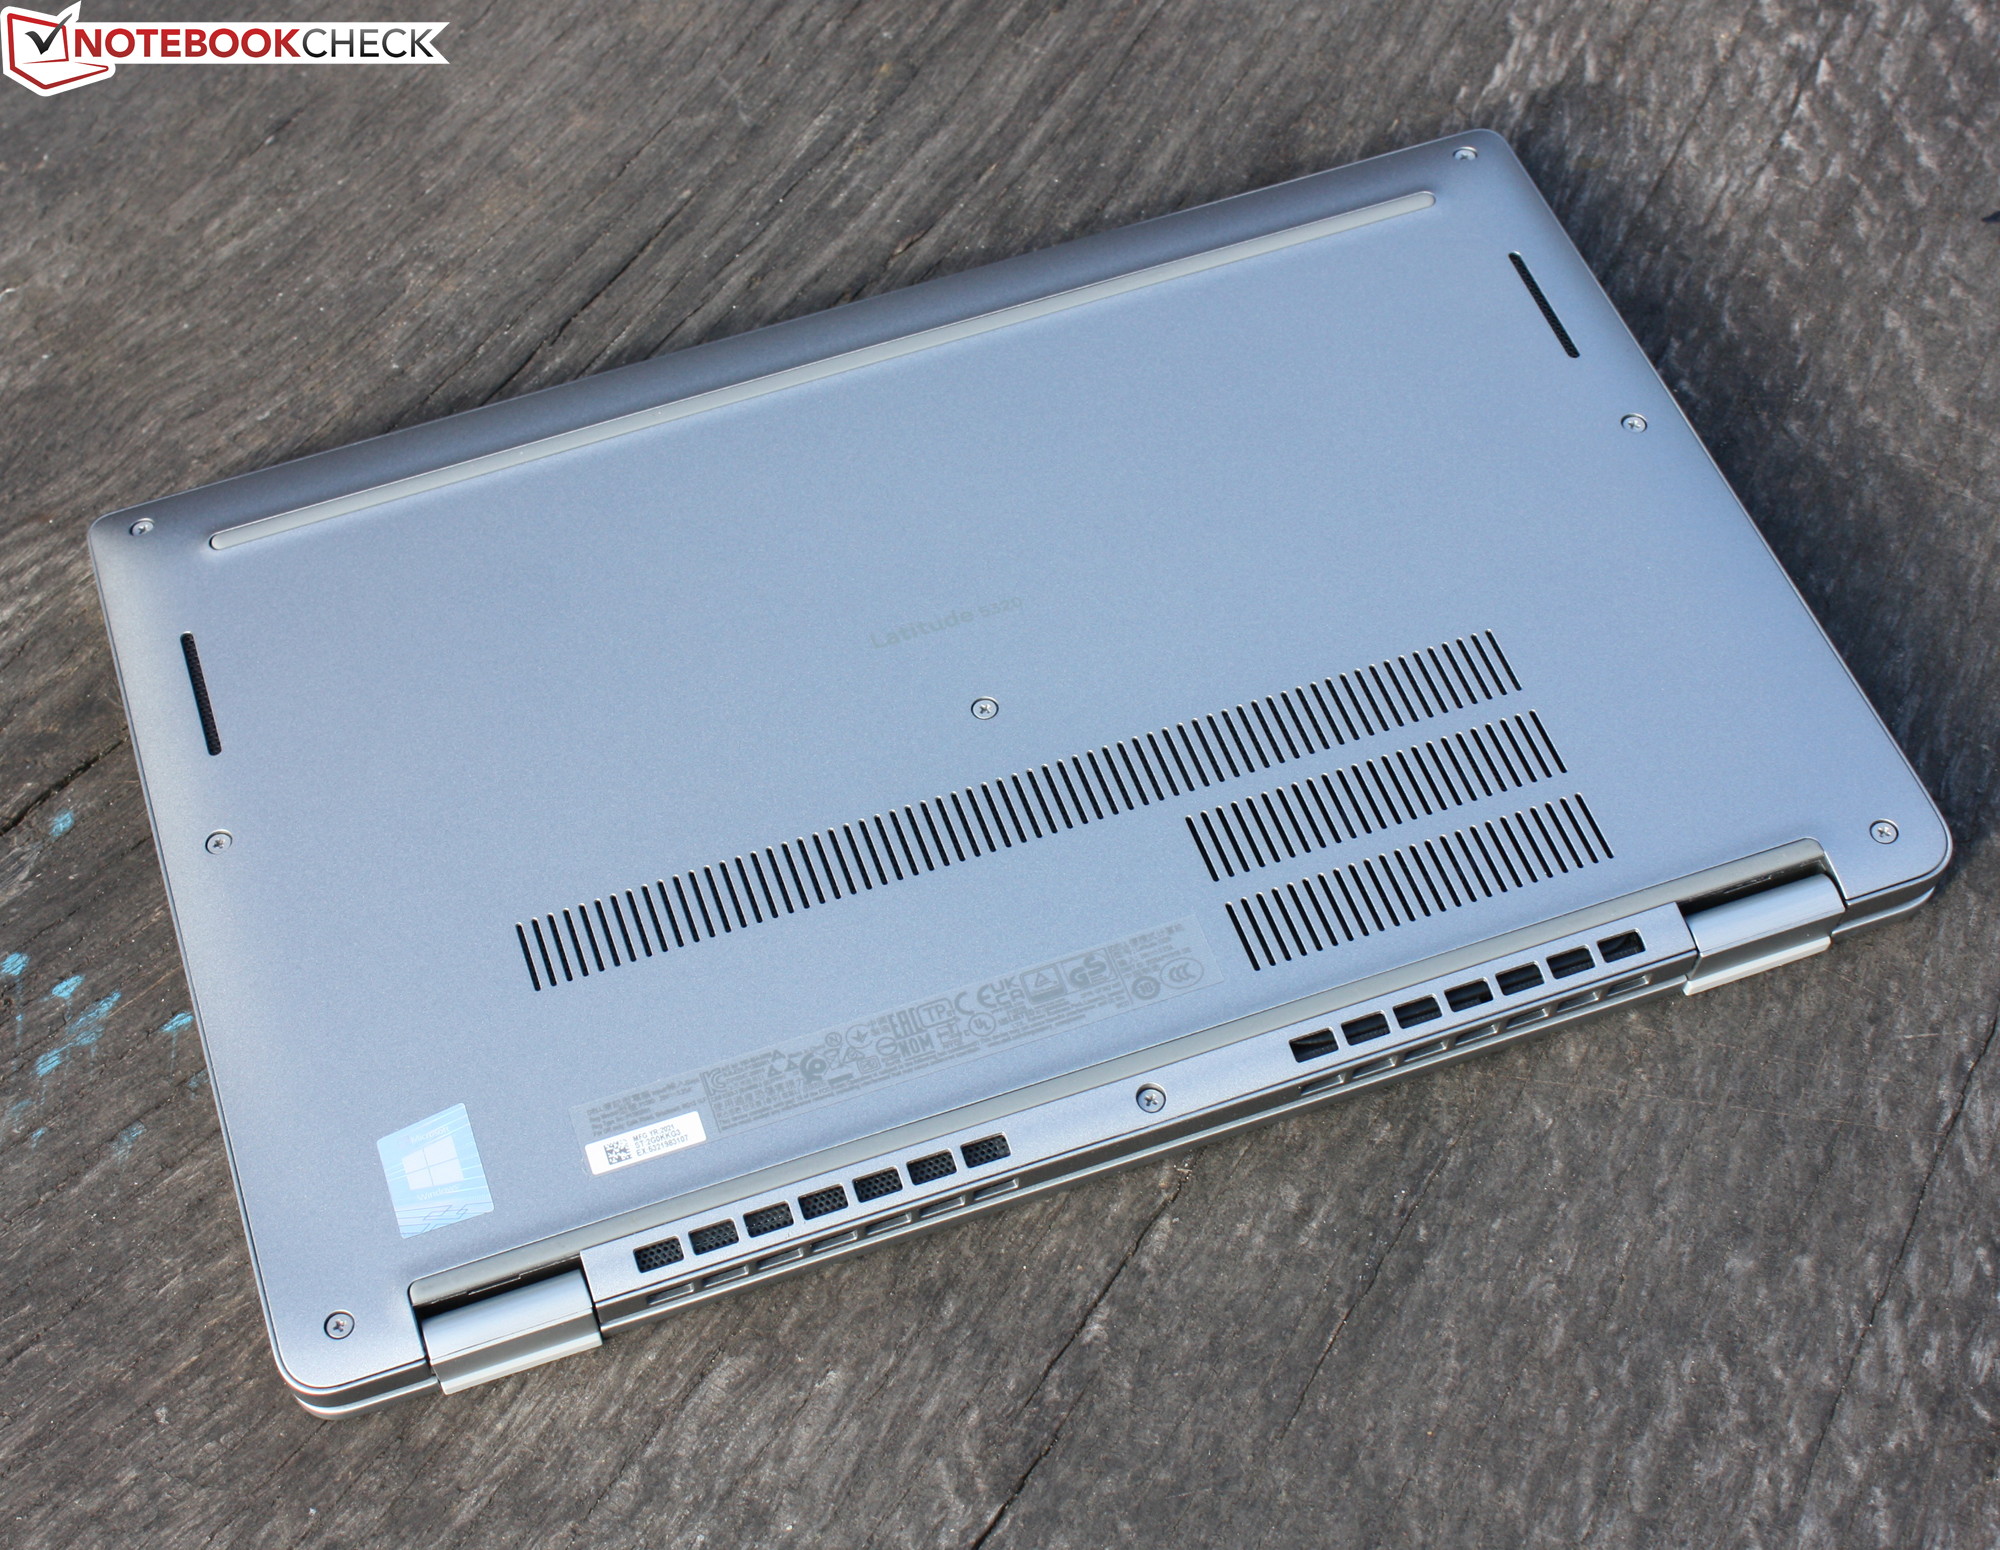
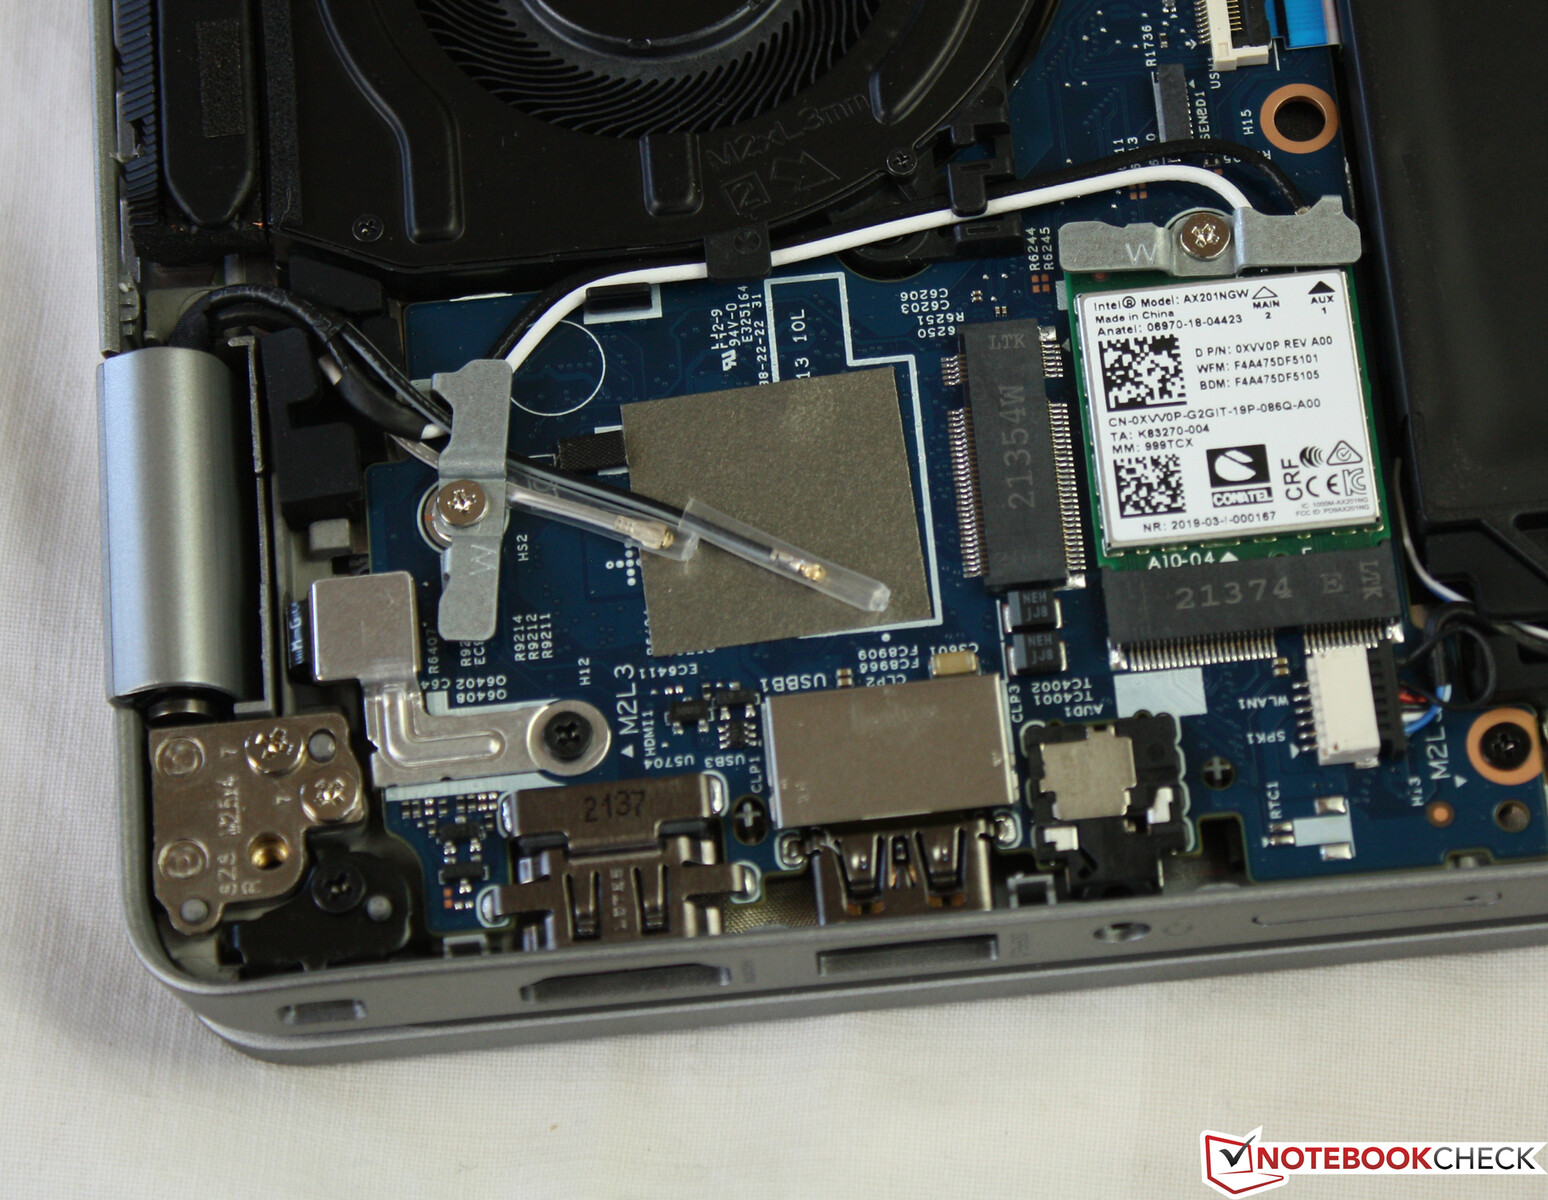
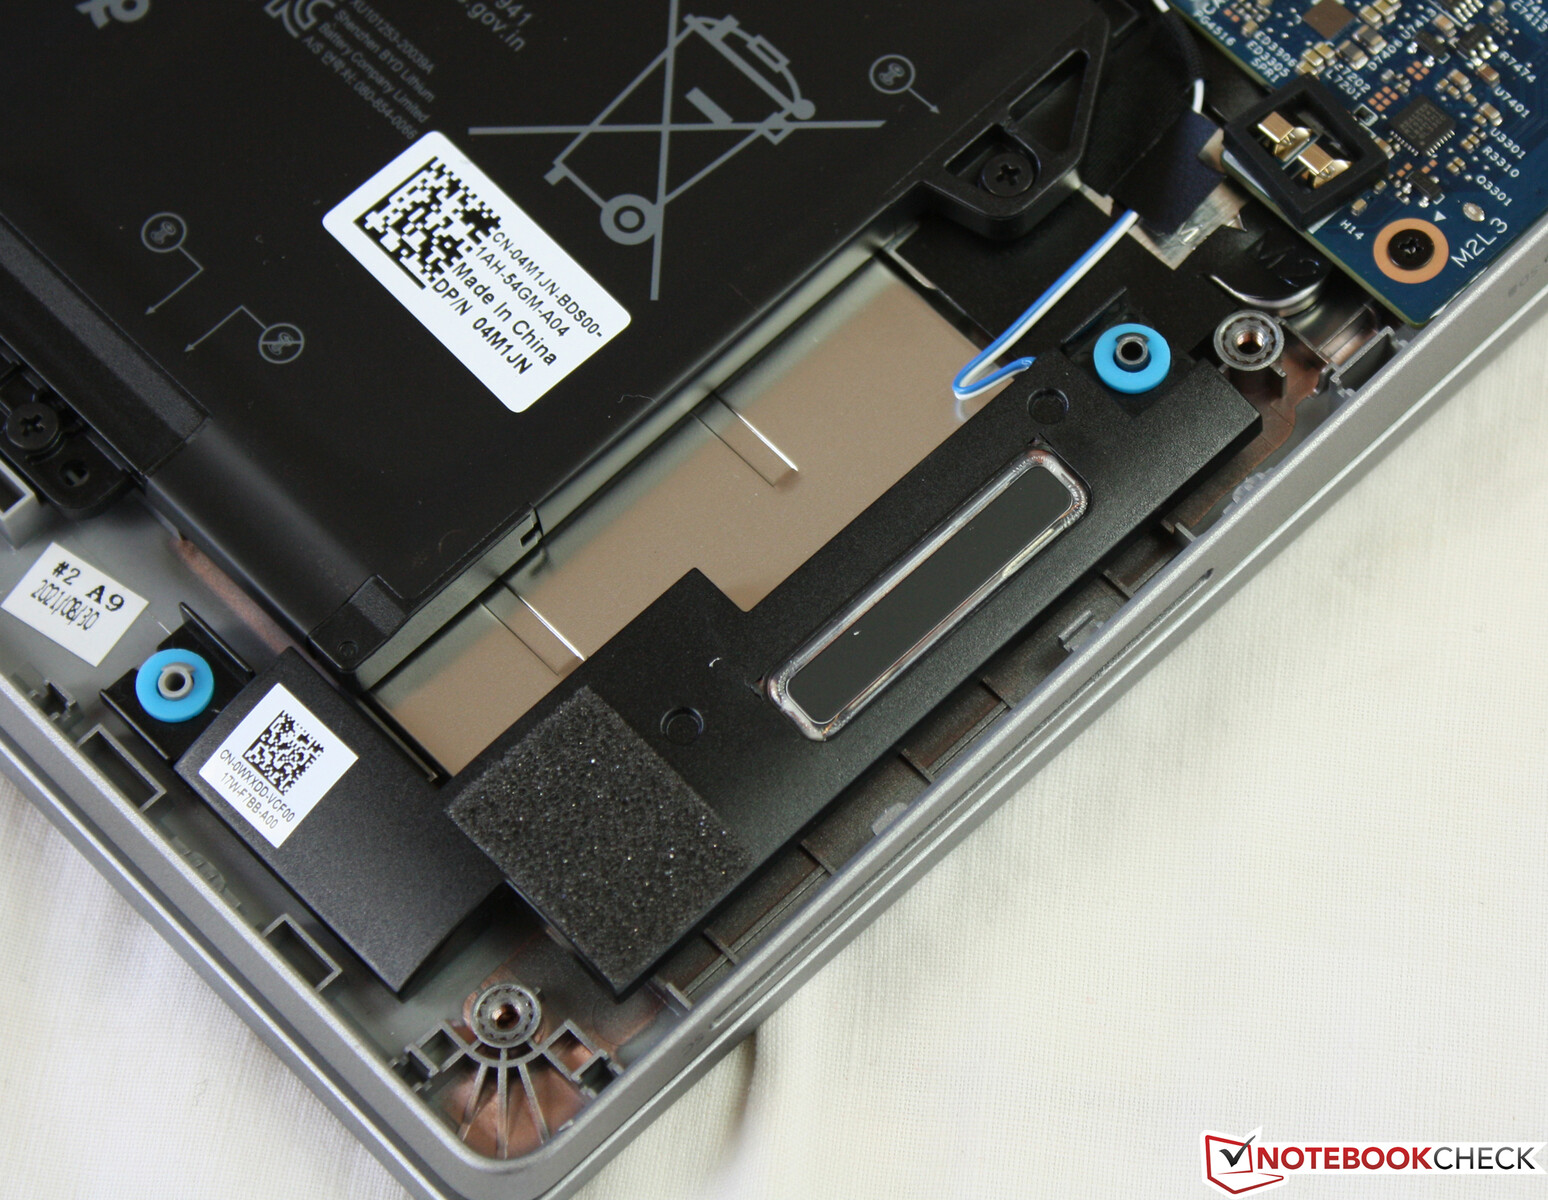
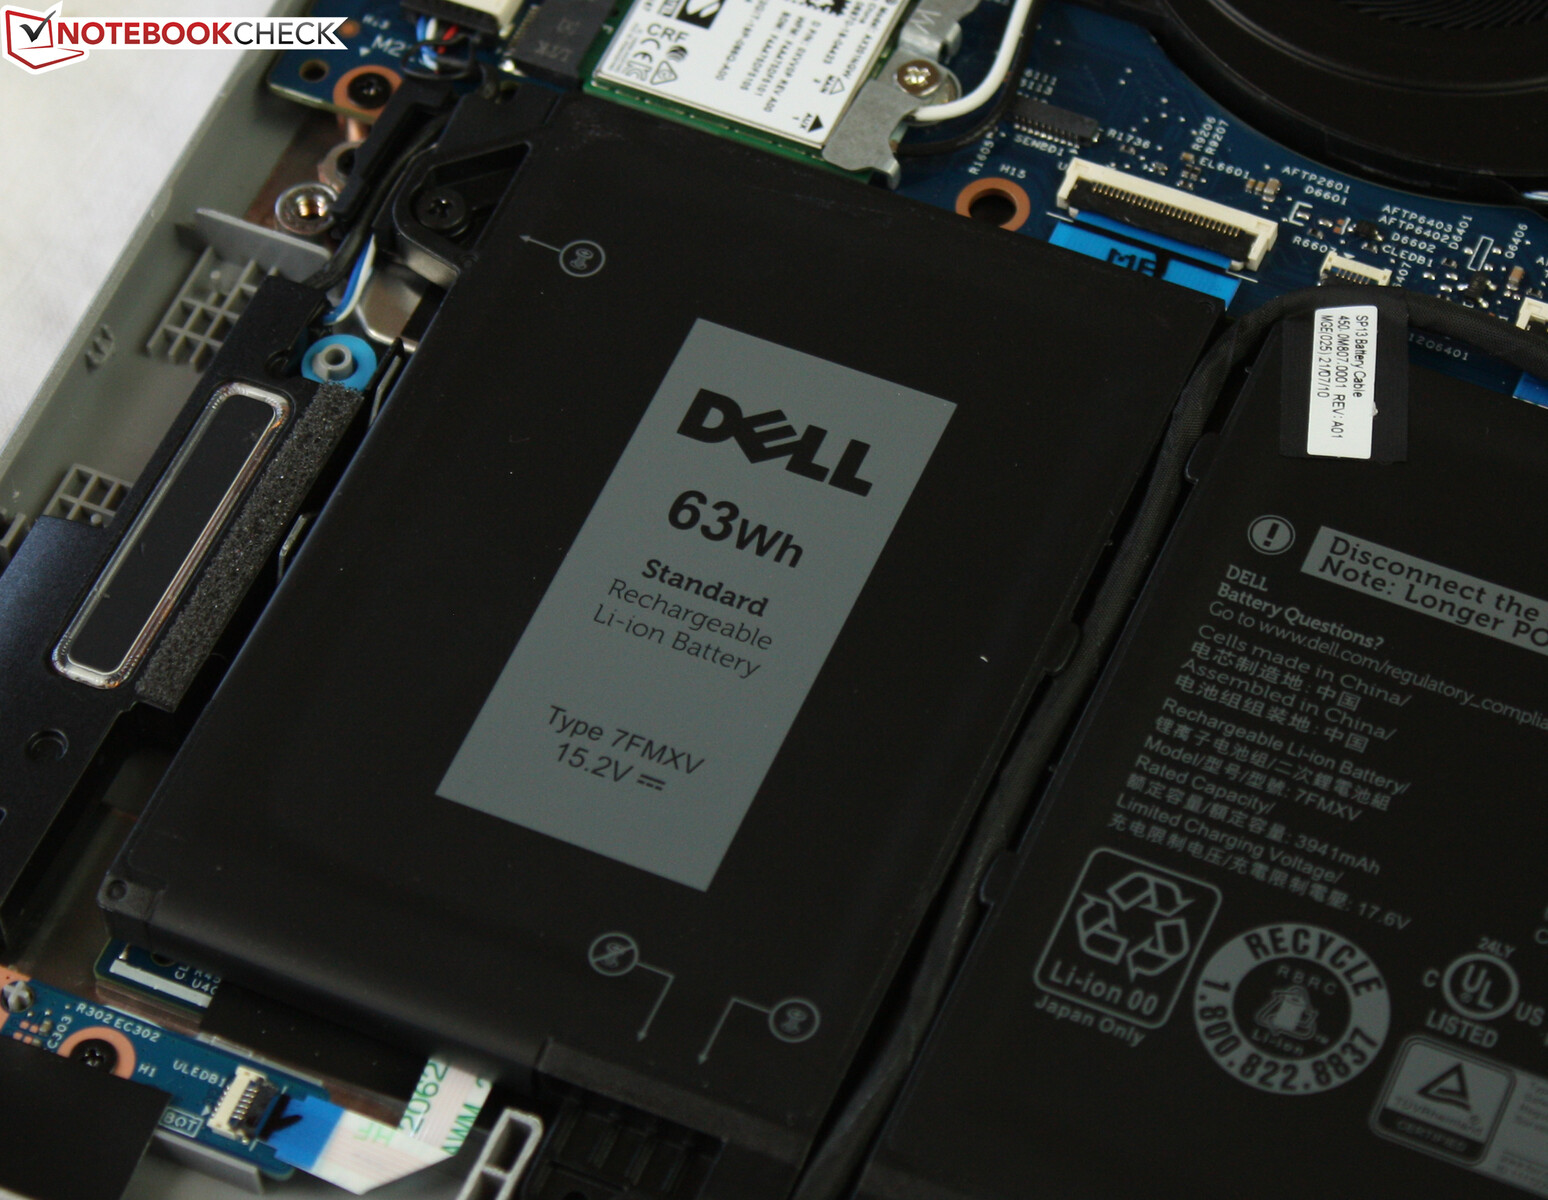
Maintenance
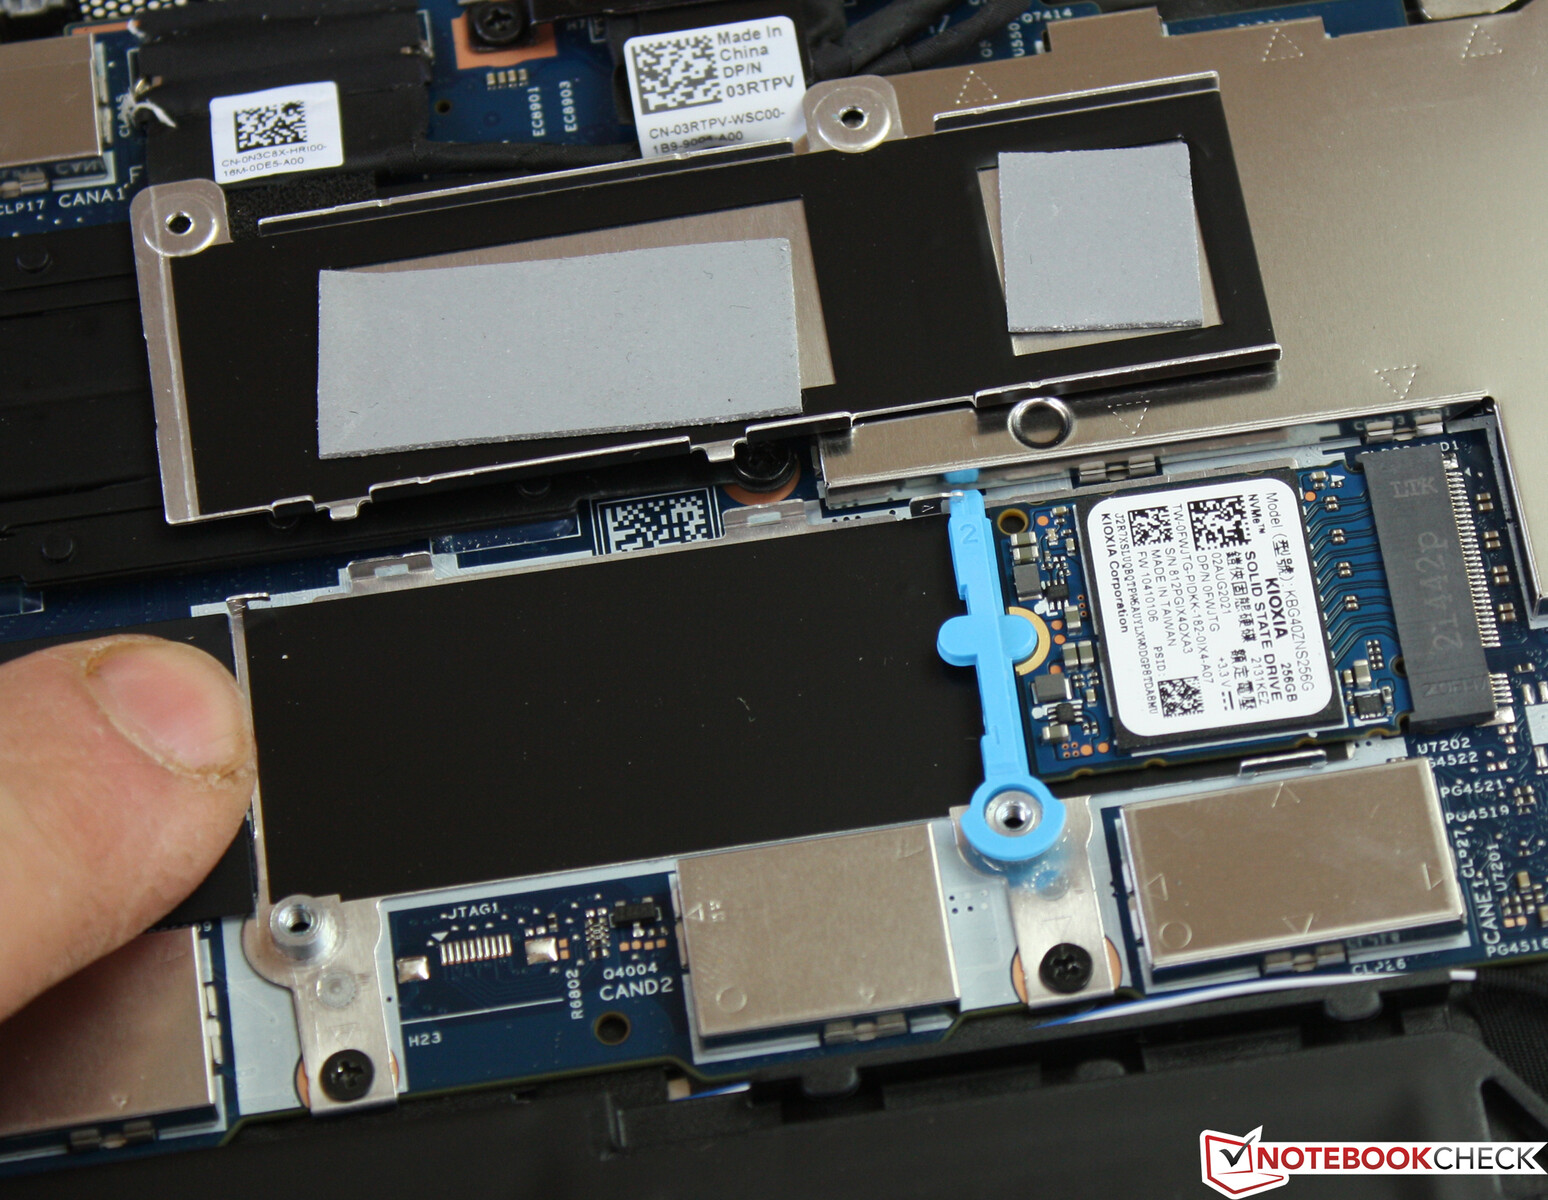
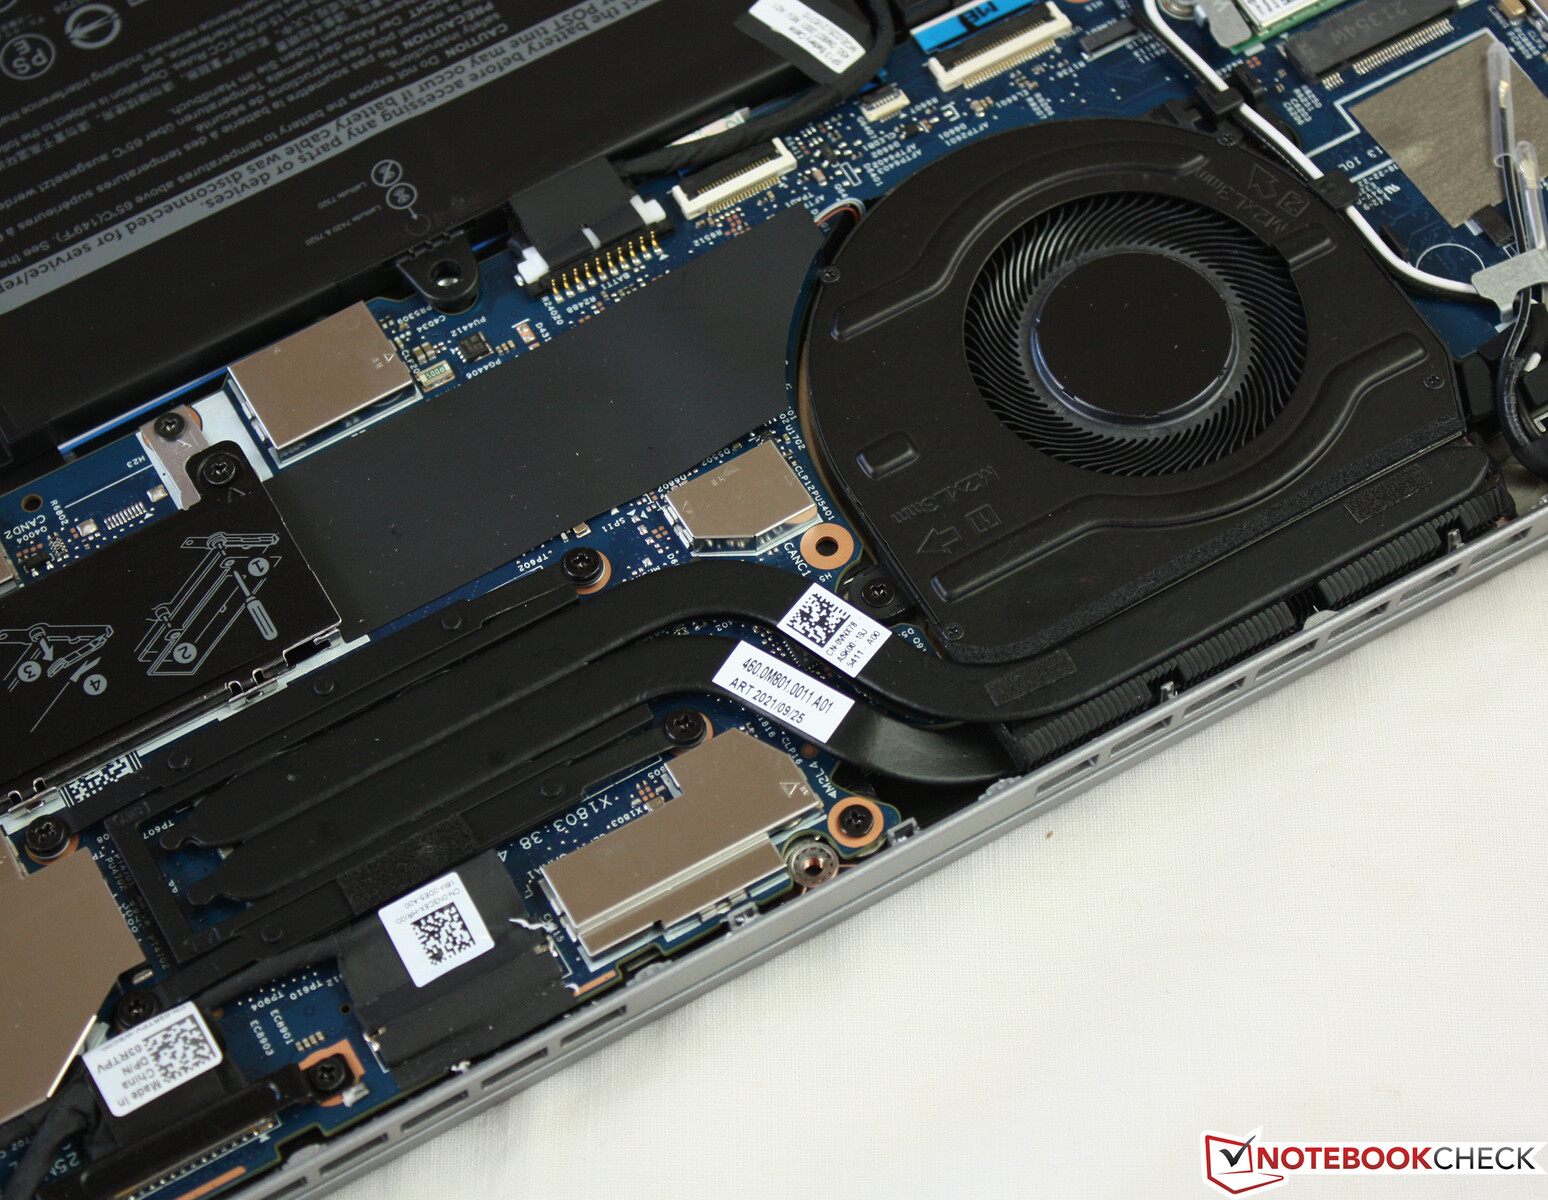
The hardware can be accessed after removing the bottom shell. All screws on the underside of the device are loosened. When lifting off the panel, you should start in the area of the hinges. You then have access to the SSD, the battery, the WLAN module, the LTE modem (option, prepared with antennas), and the fan. There are no memory slots, the RAM is onboard.

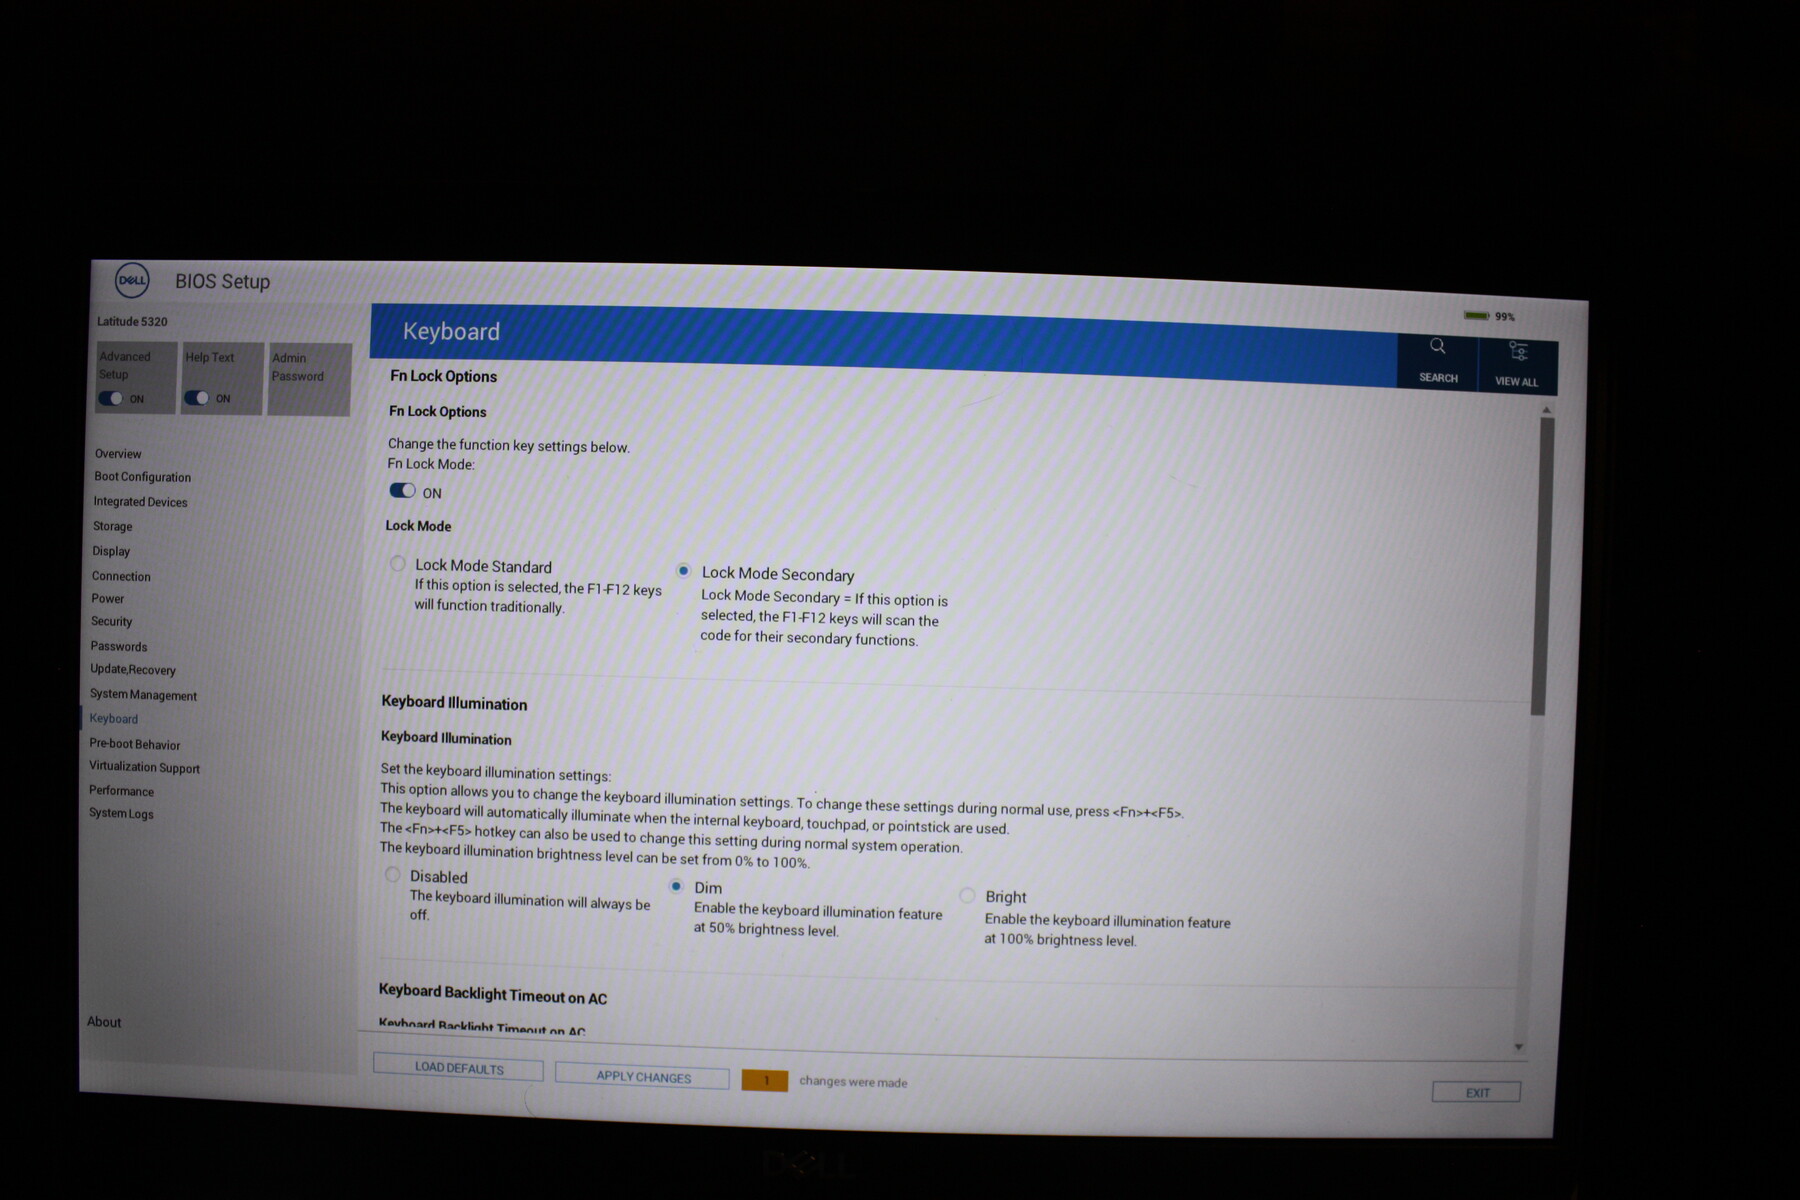
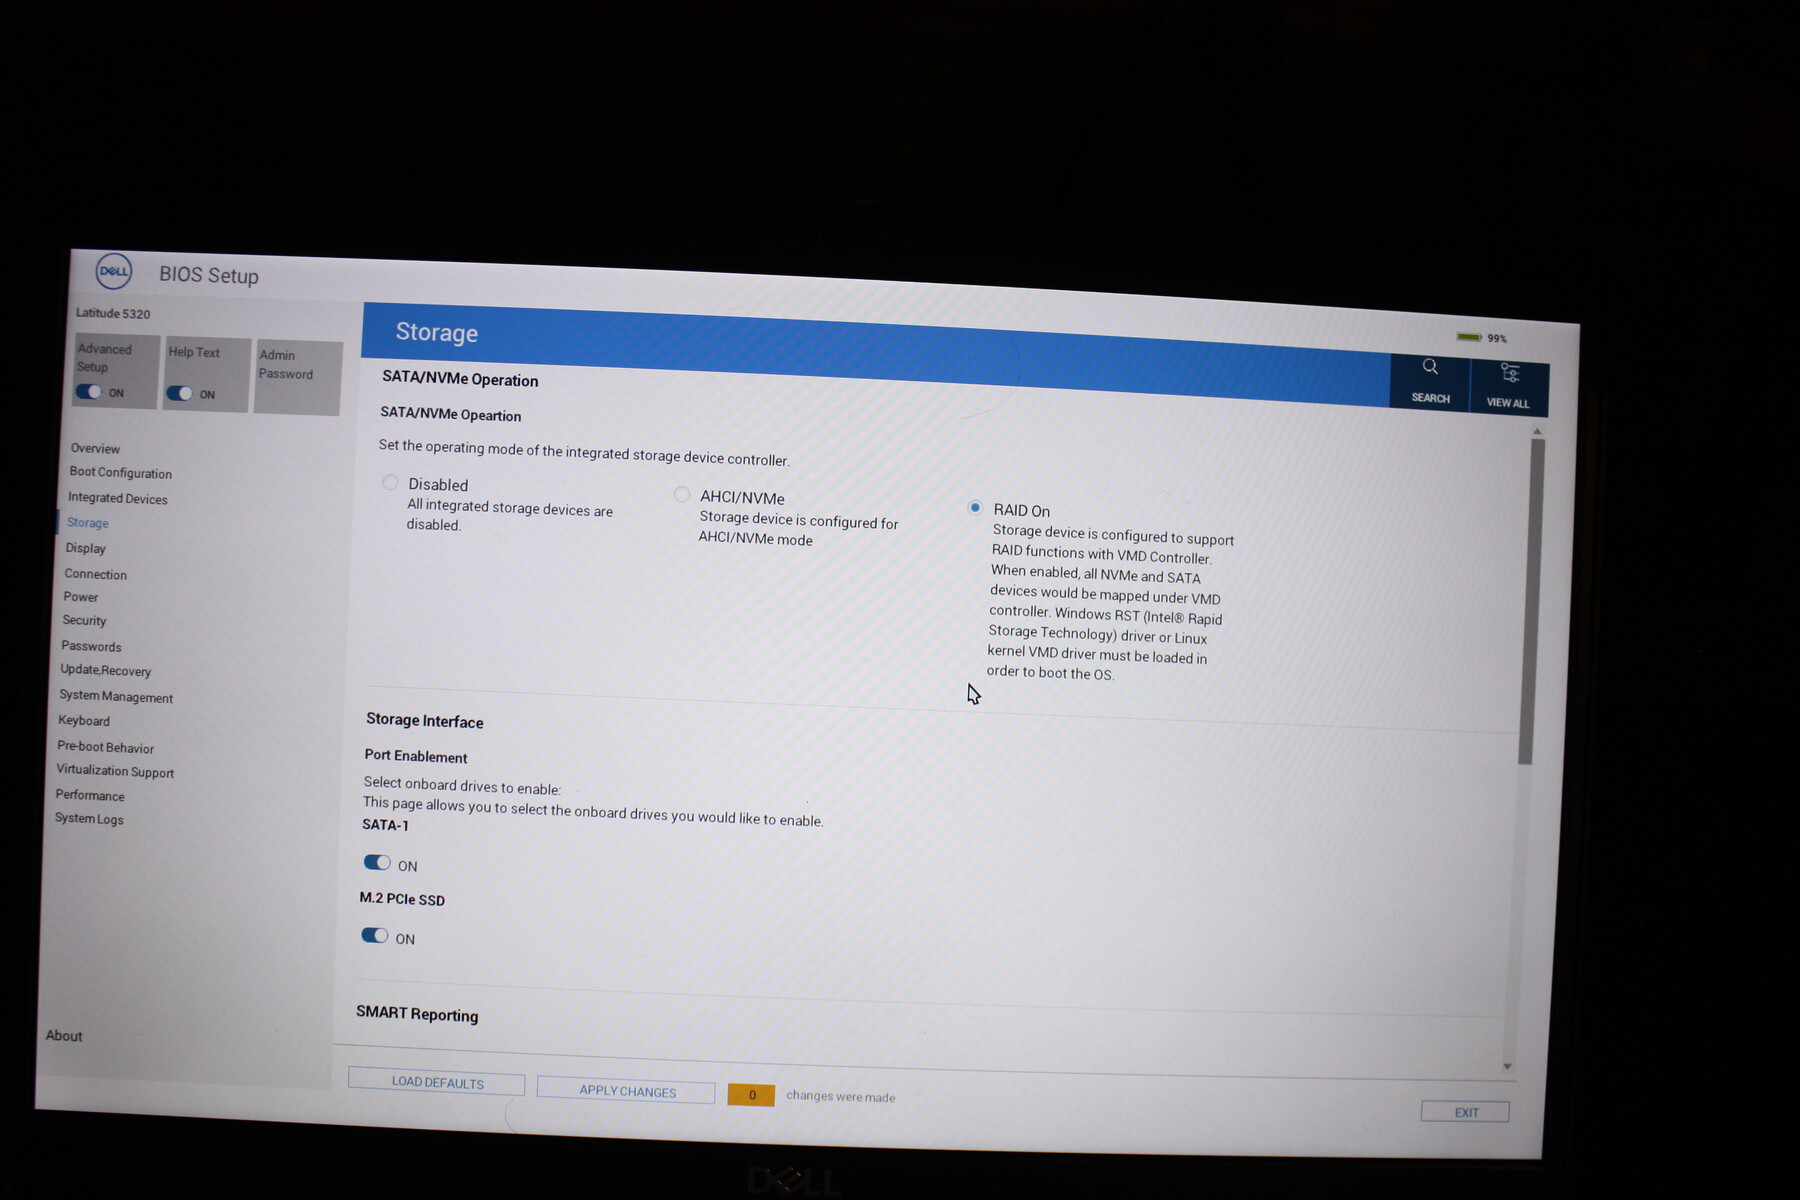
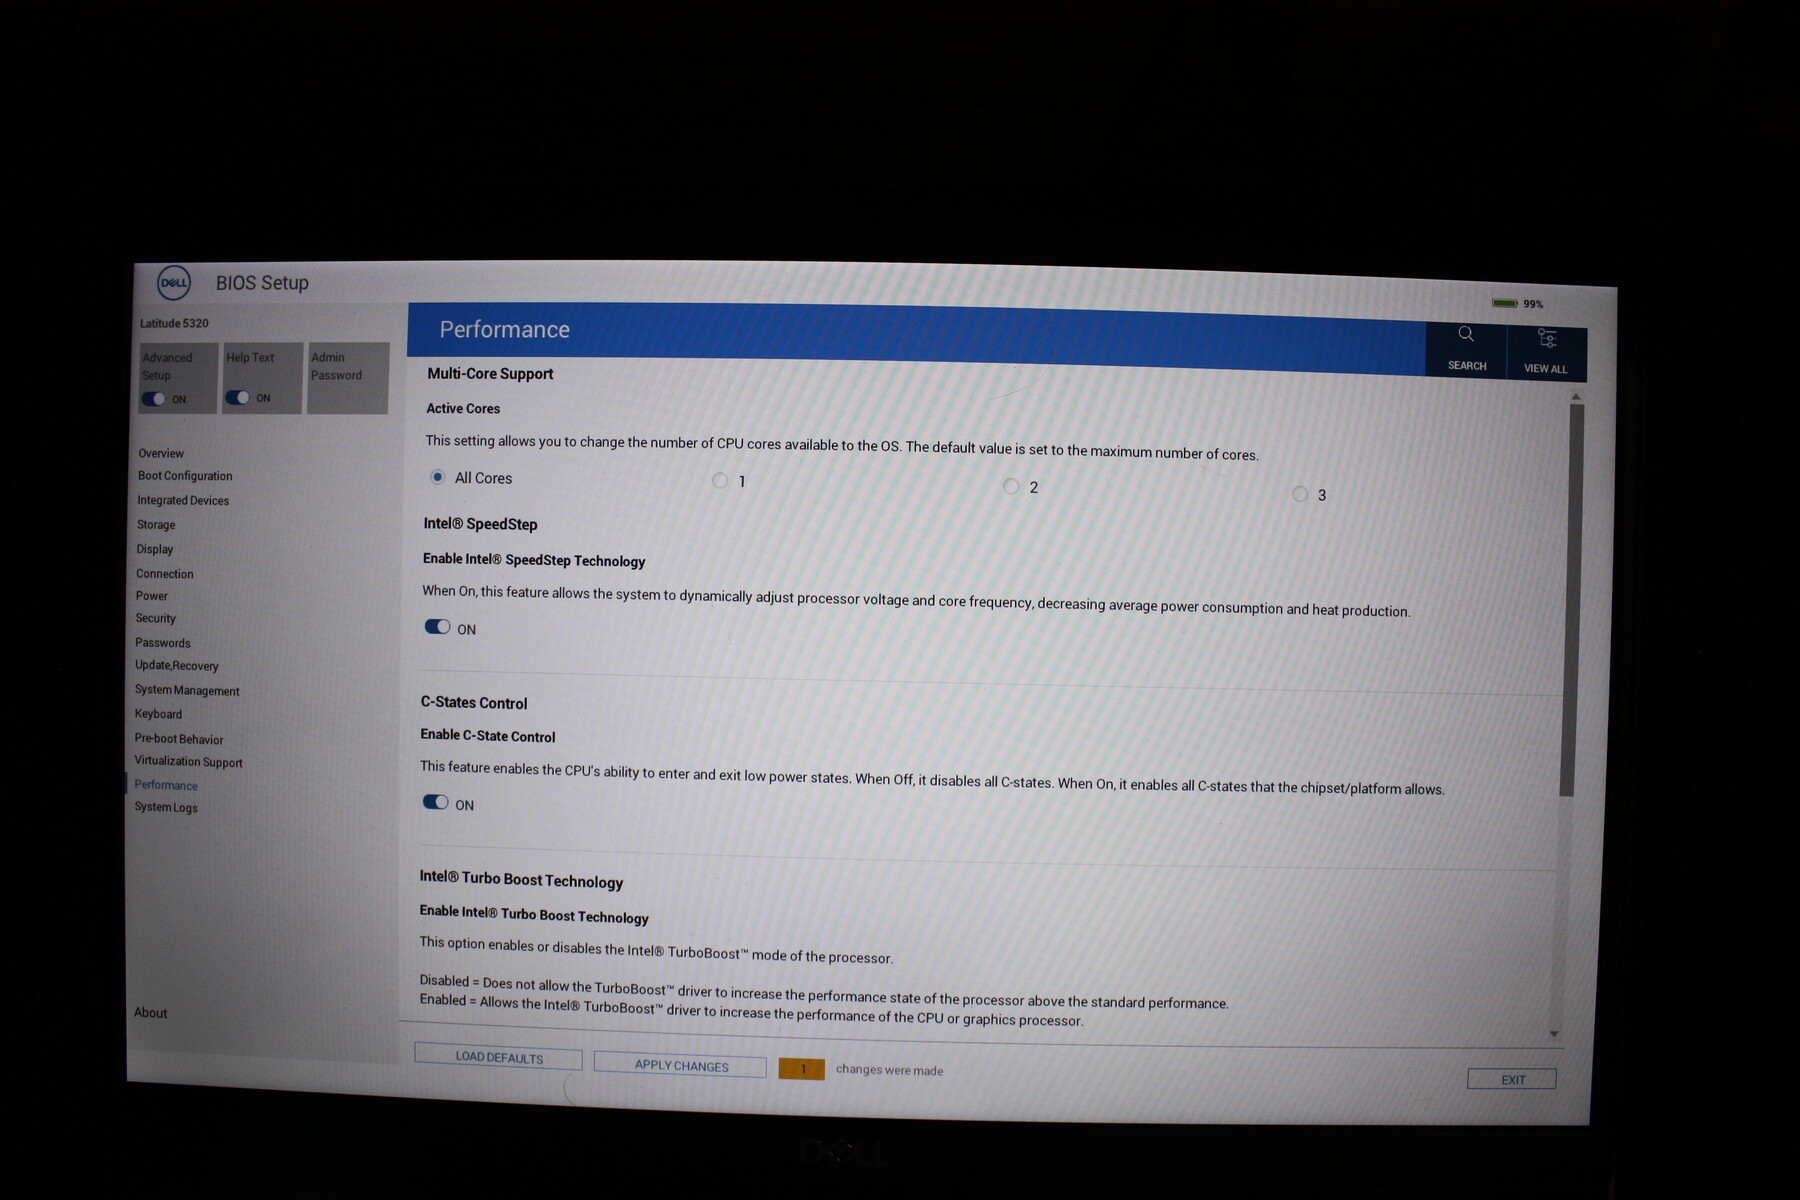
BIOS
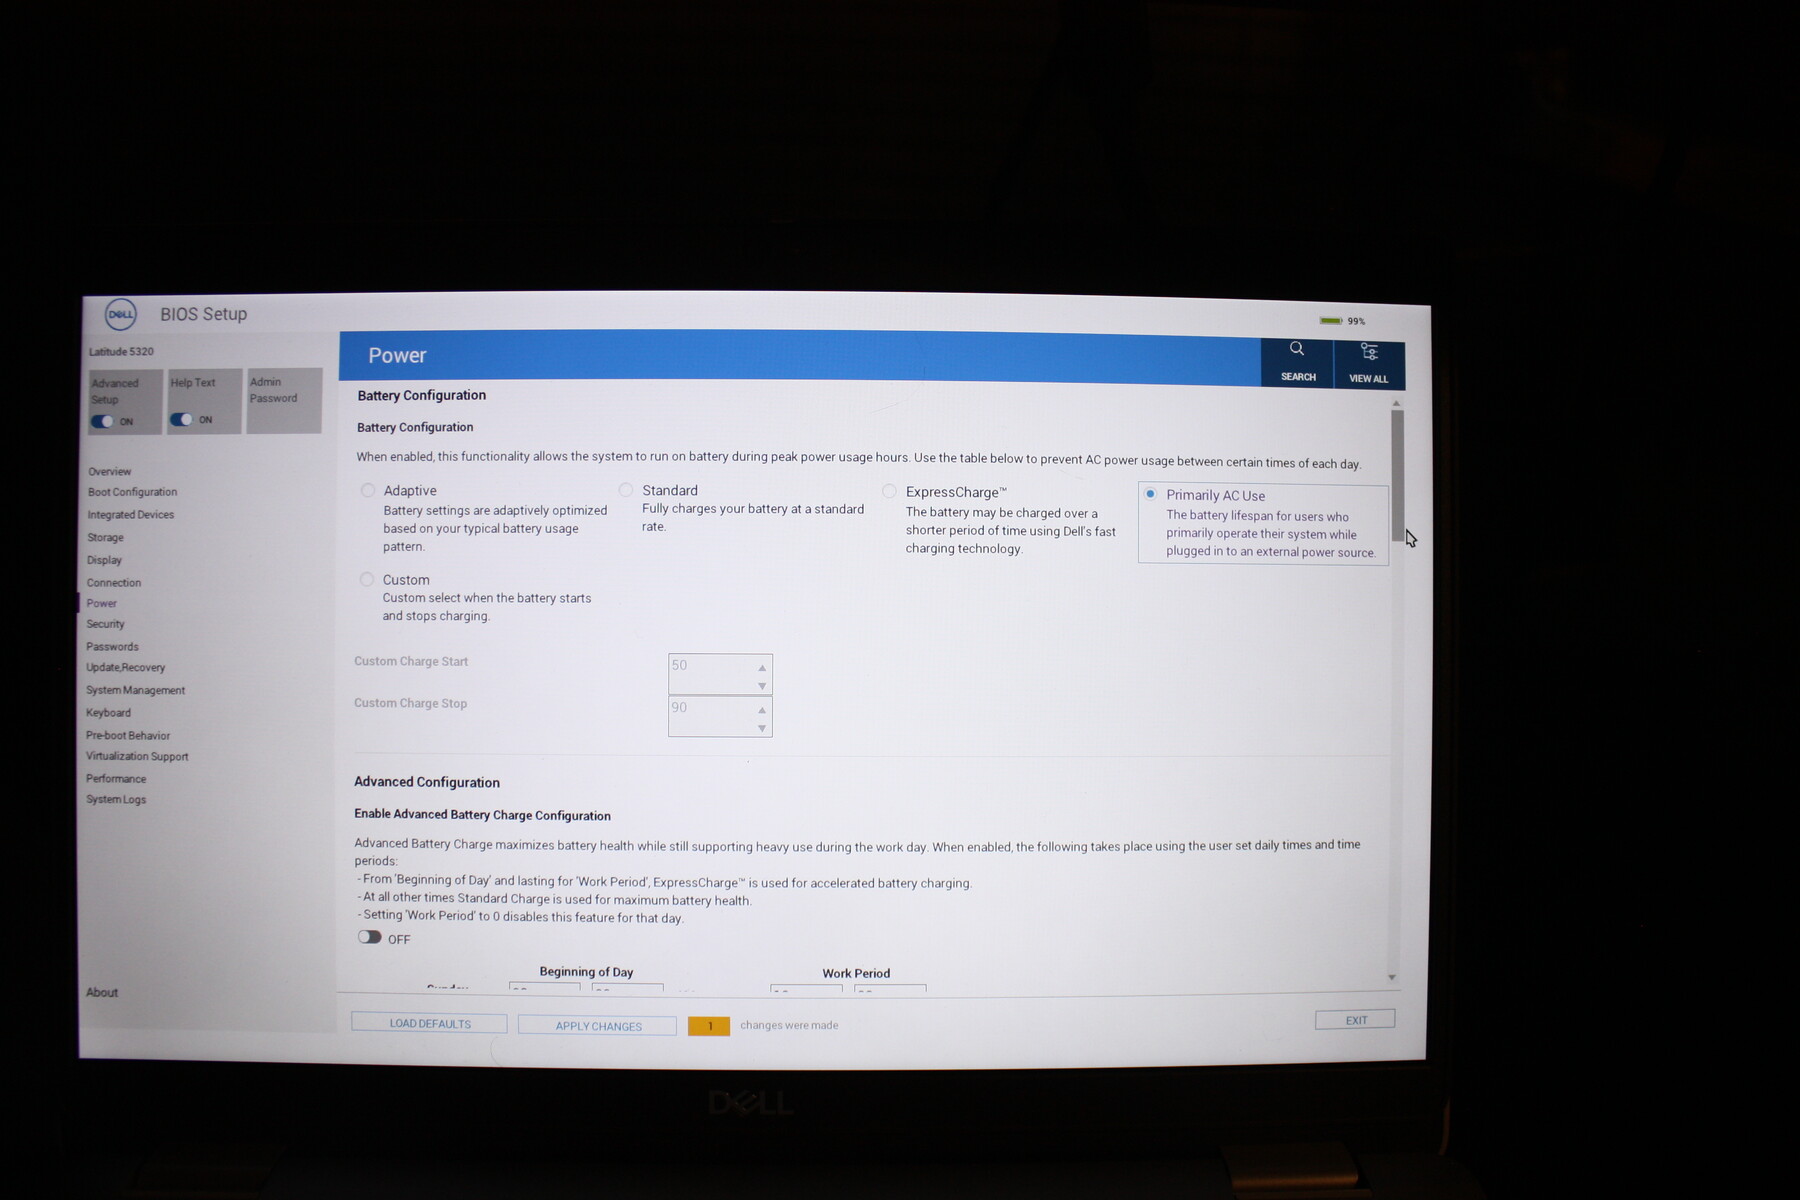
The BIOS of the computer offers extensive configuration options regarding security, management, hardware, and energy. Details like the number of active CPU cores can be set. It is also possible to set the maximum display brightness for both mains and battery operation. Such a wide functionality is rarely found in laptops.
Warranty
The Latitude comes with a one-year on-site warranty. Dell offers extensive expansion options. For example, a four-year Pro Support with on-site service on the next business day is available for about 370 Euros.
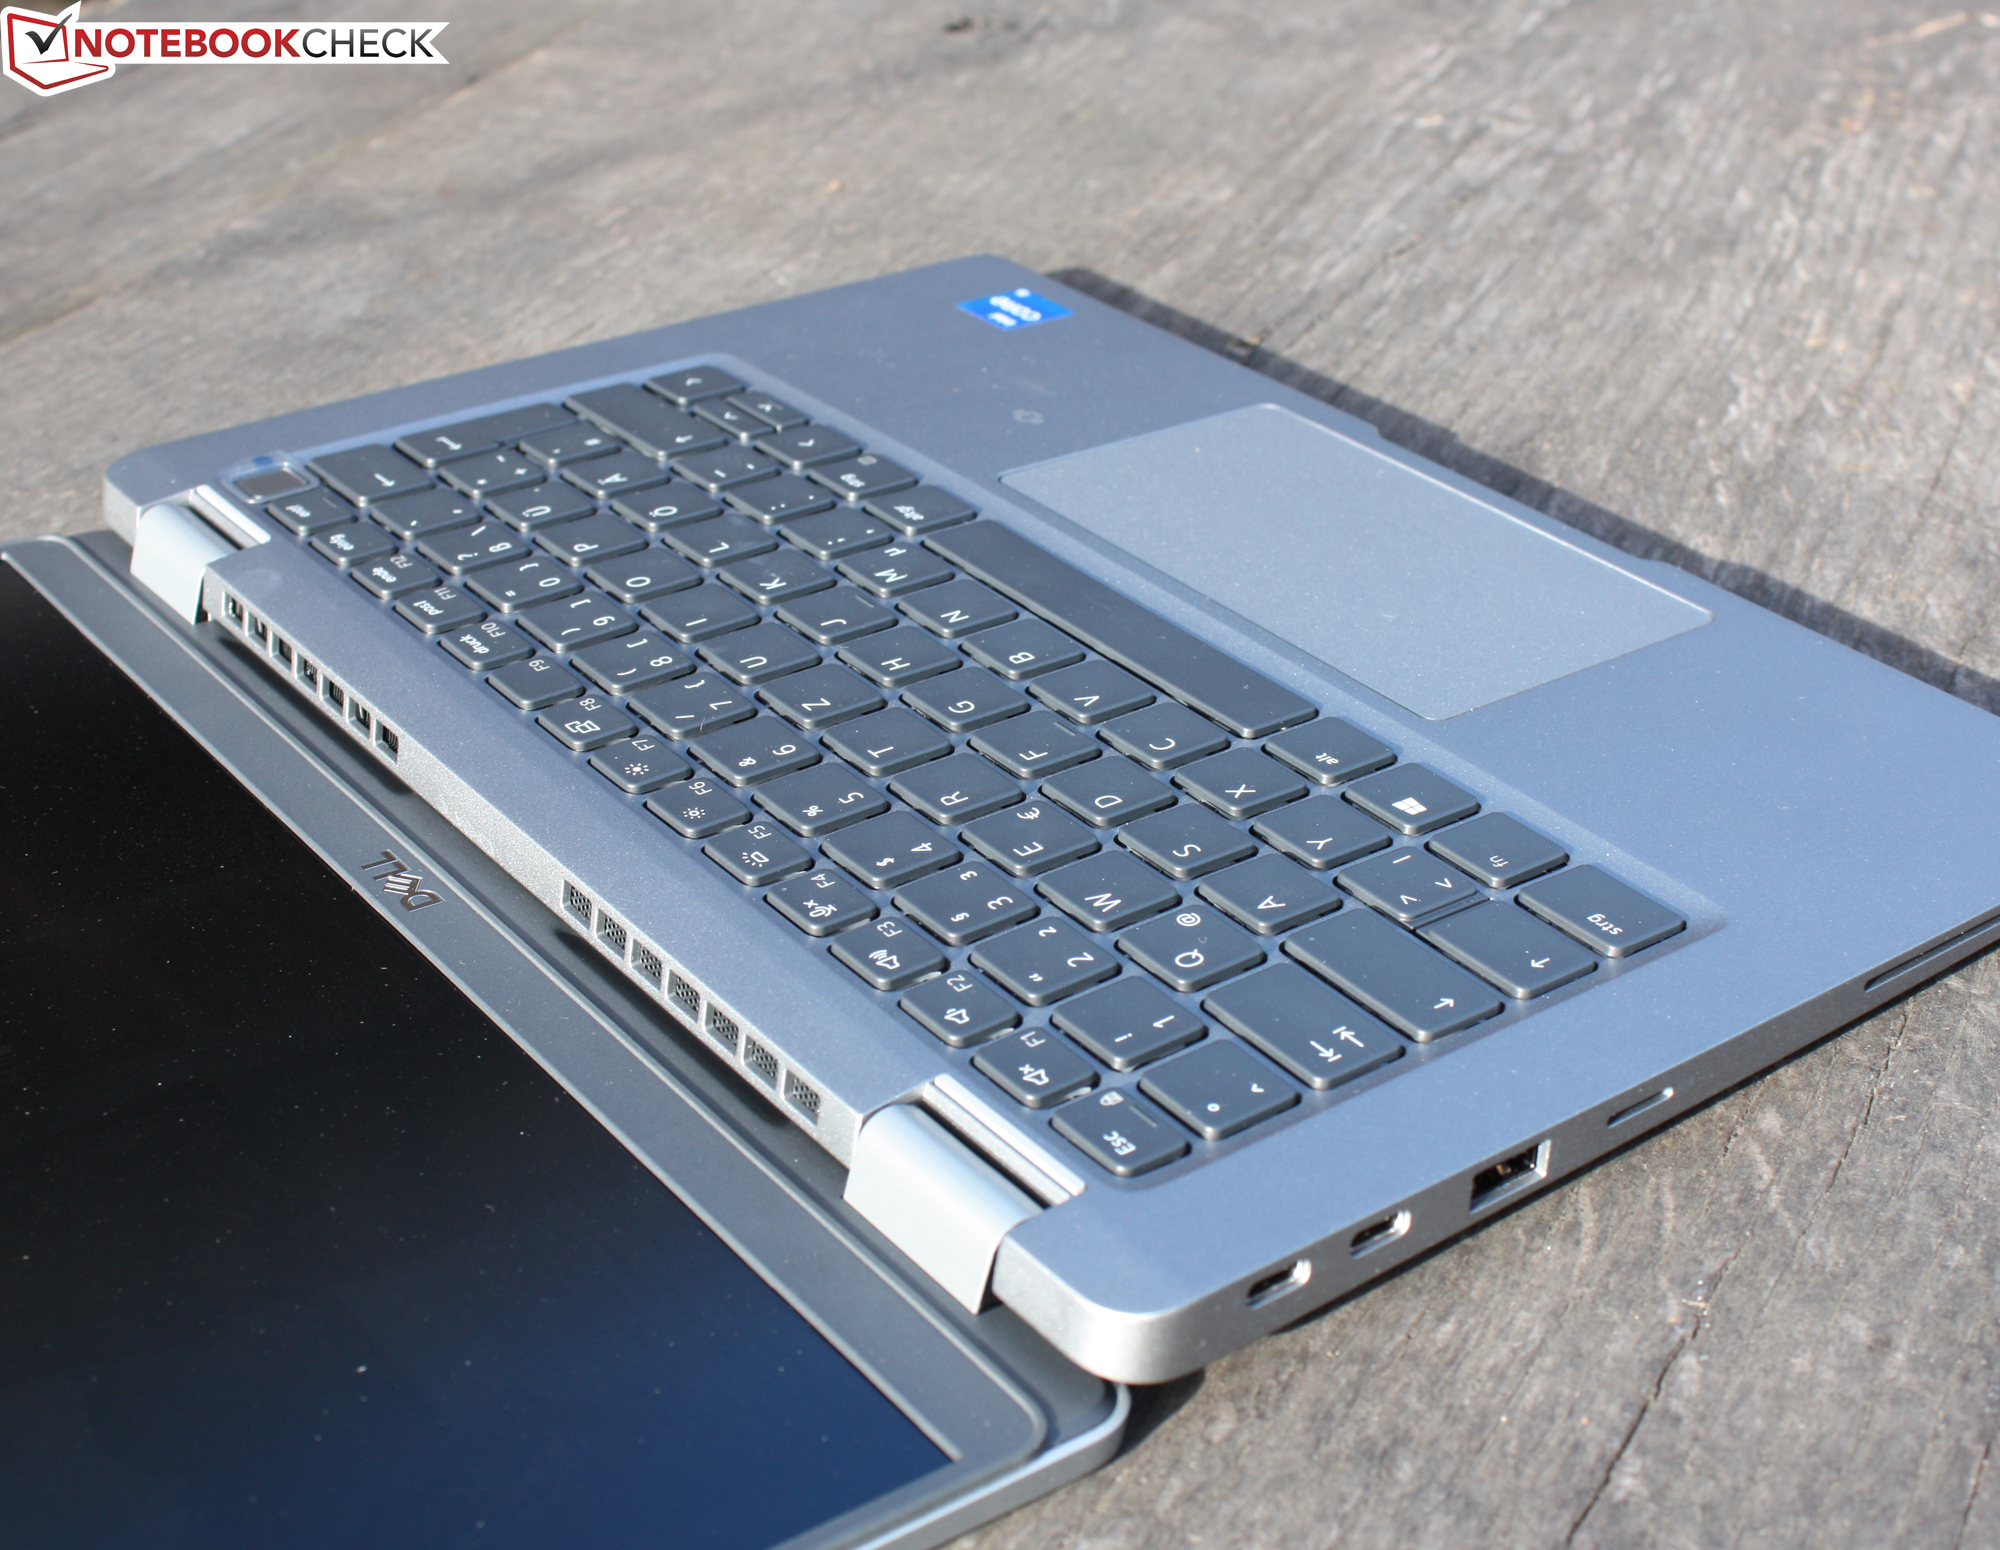
Input devices - Dell's notebook no longer has touchpad keys
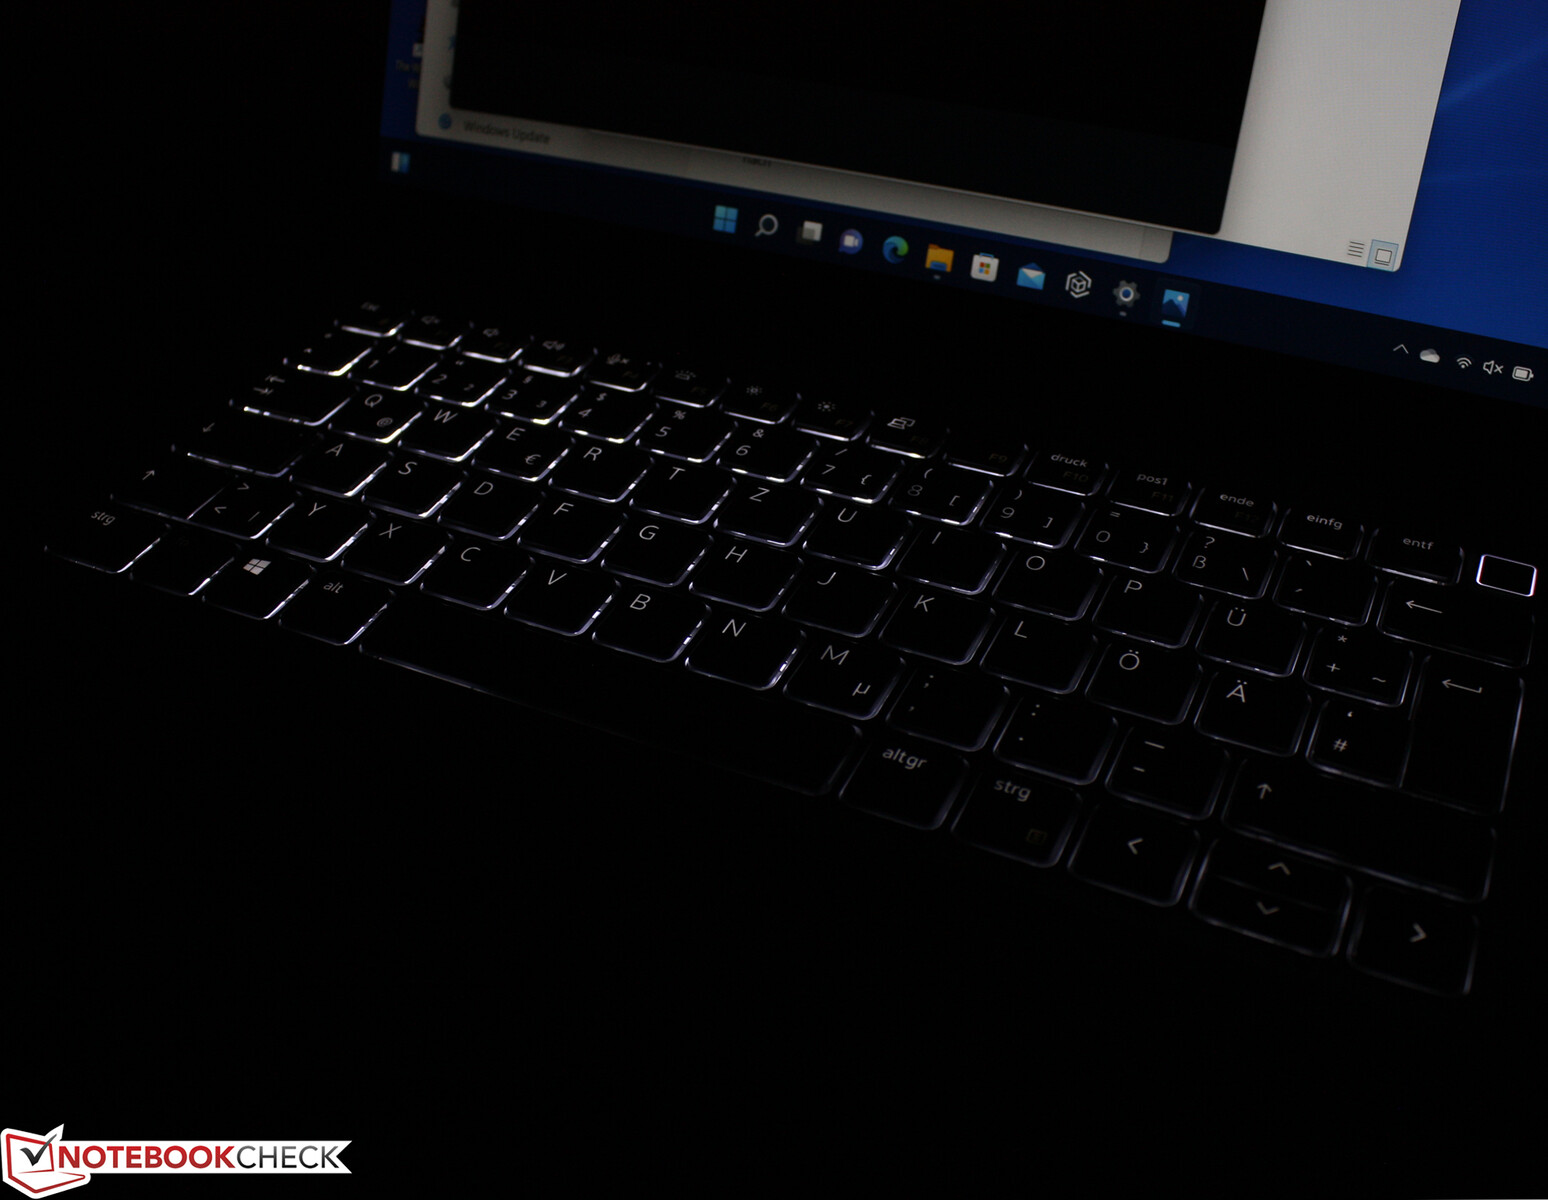
Dell equips the Latitude with an illuminated keyboard. The flat, blunted keys offer a clear stroke and a distinctive pressure point. This is accompanied by a pleasant key resistance. The stroke is a mixture of spongy and moderately firm - the biggest drawback of this keyboard.
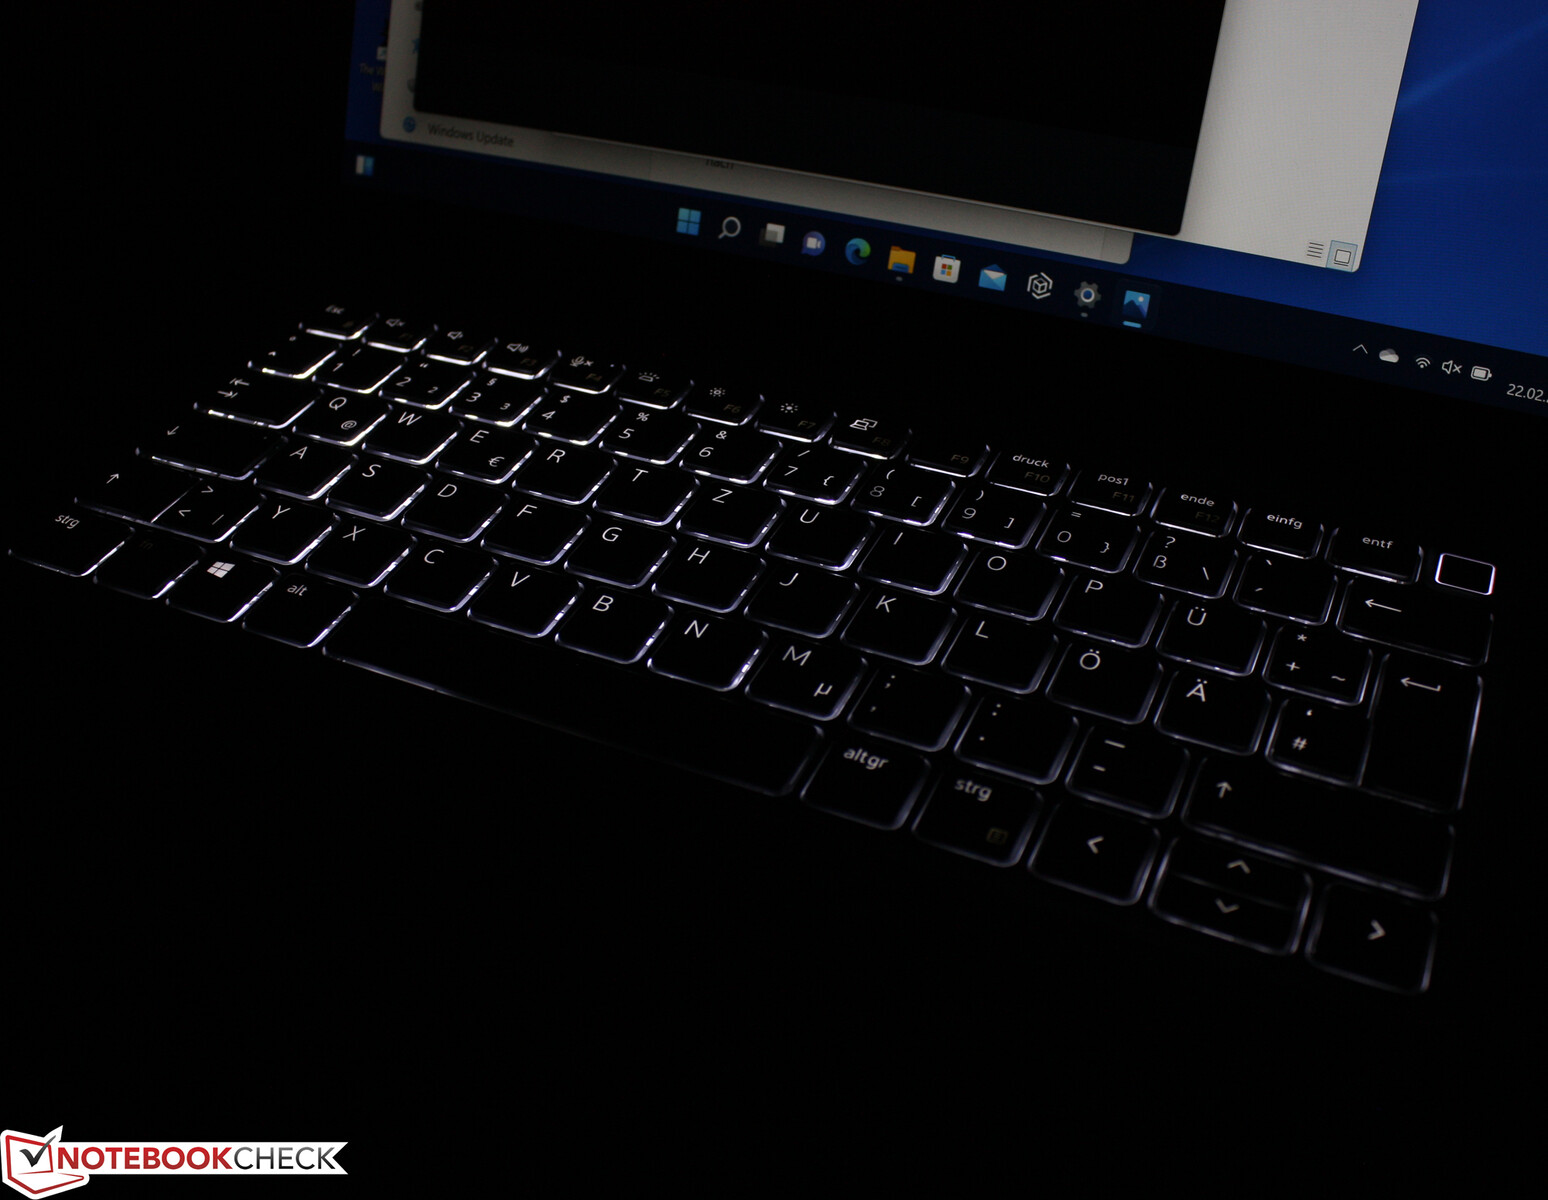
Keyboard
During typing, the keyboard yields slightly in the center and on the right. The key illumination offers two brightness levels that are selected via a function button. All in all, the keyboard left a good impression, especially because of the good feedback, that is ensured by rich travel and pressure point.
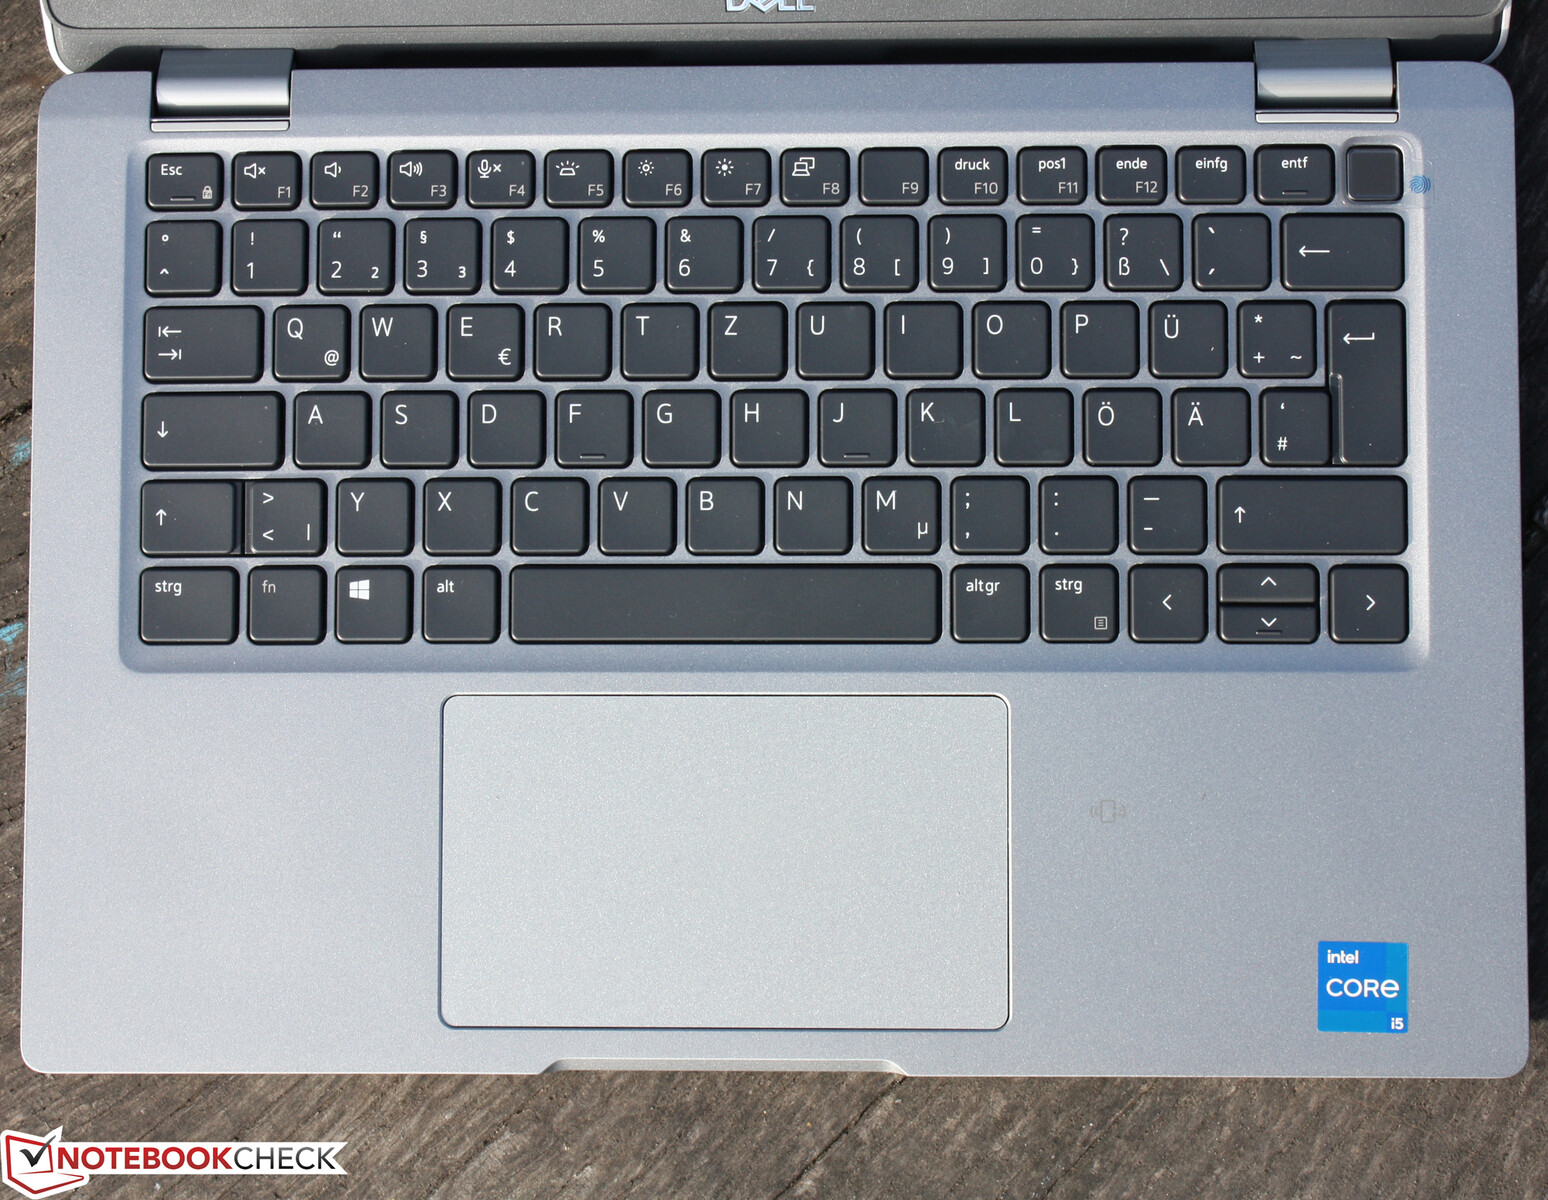
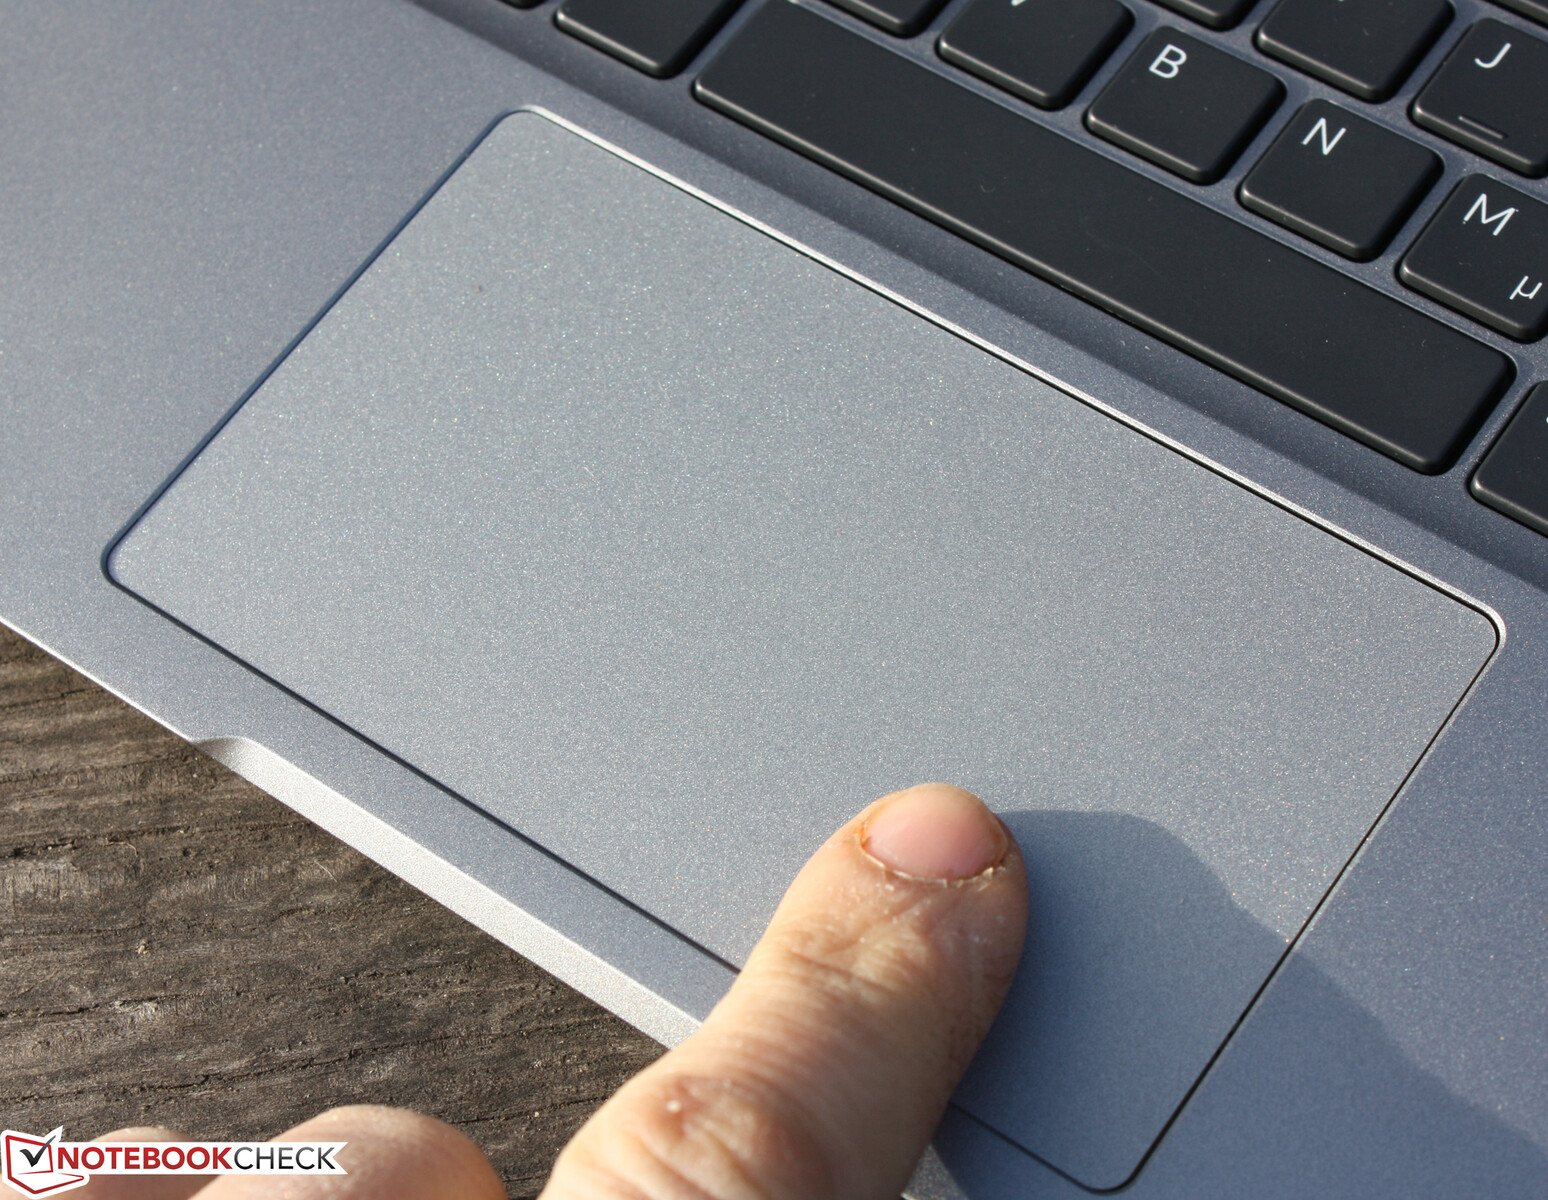
Touchpad
A multitouch-capable clickpad serves as a mouse replacement and occupies an area of about 11.7 x 6.7 cm. The key touchpad of the 5110 was smaller. Thus, a lot of space is available for using gesture control. The pad also responds to inputs in the corners. The surface is dull, the finger always has noticeable friction.
Unfortunately, there is almost no travel on the pad, which results in an unsatisfactory pressure point. It may be a personal preference, the tester did not like the clickpad at all due to the poor feedback, the operation was almost unpleasant. Either way, Dell has not done itself any favors omitting physical keys.
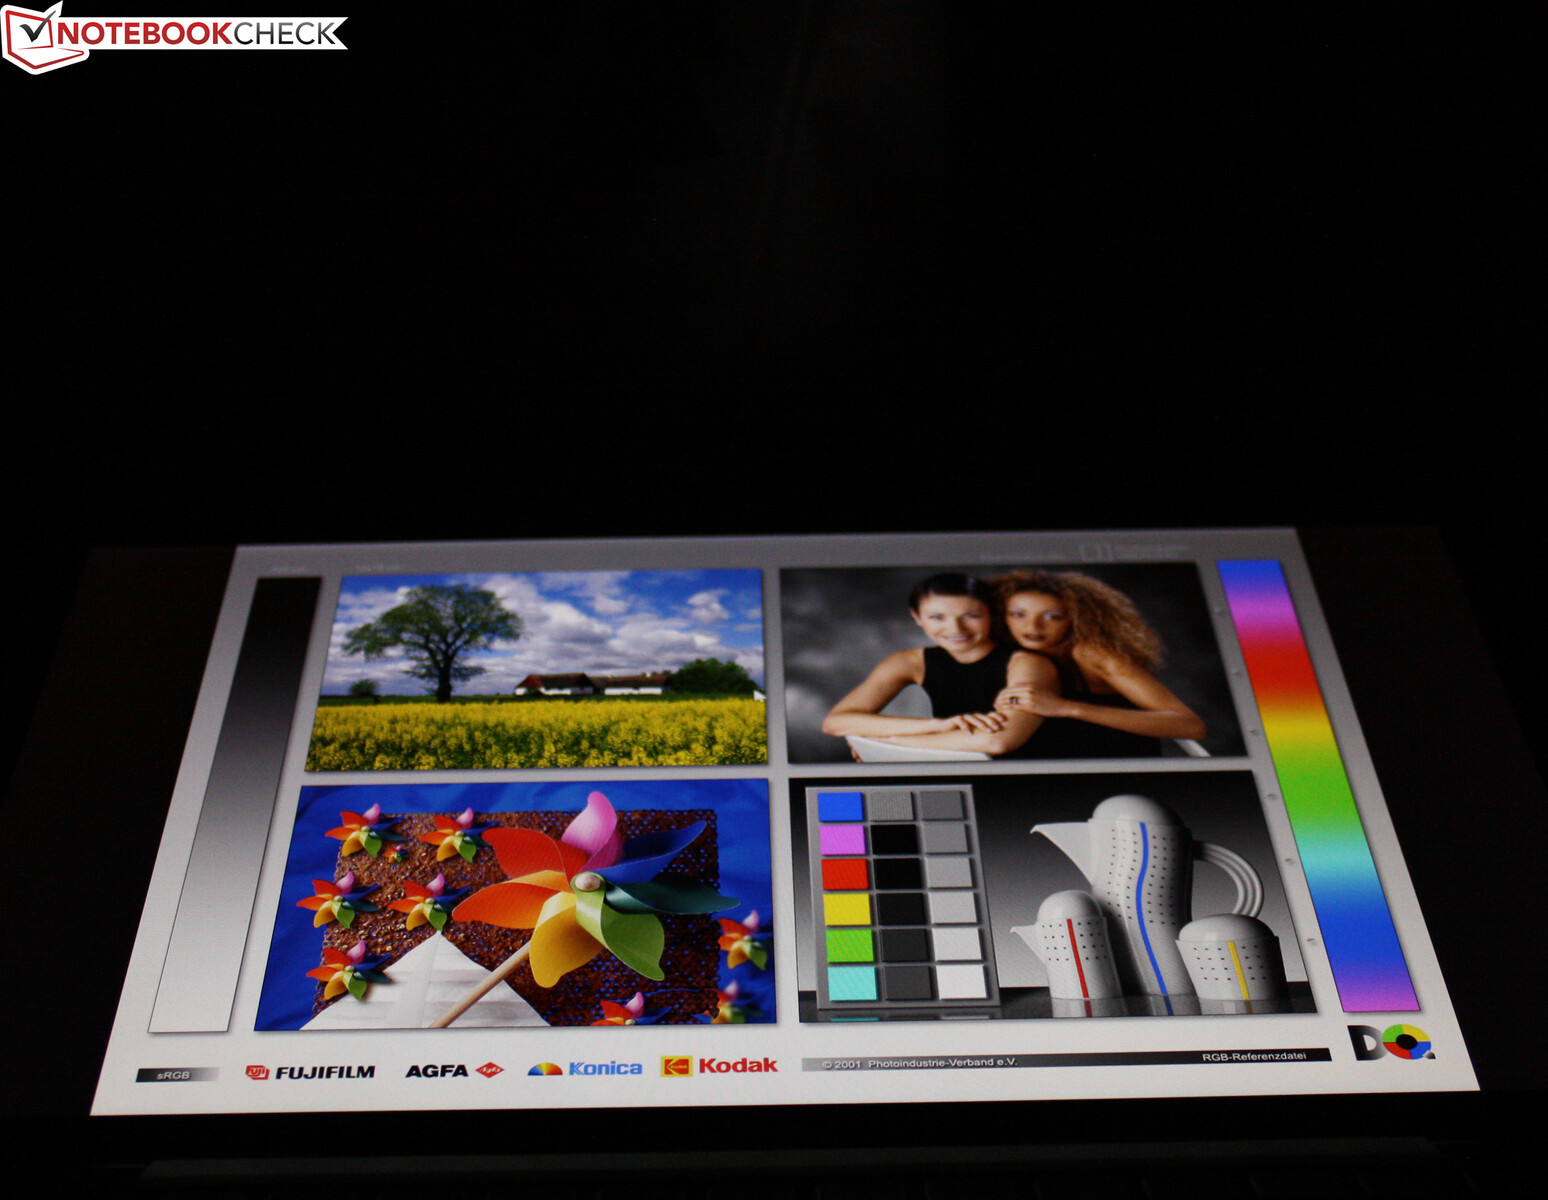
Display - Weakly positioned for the display business
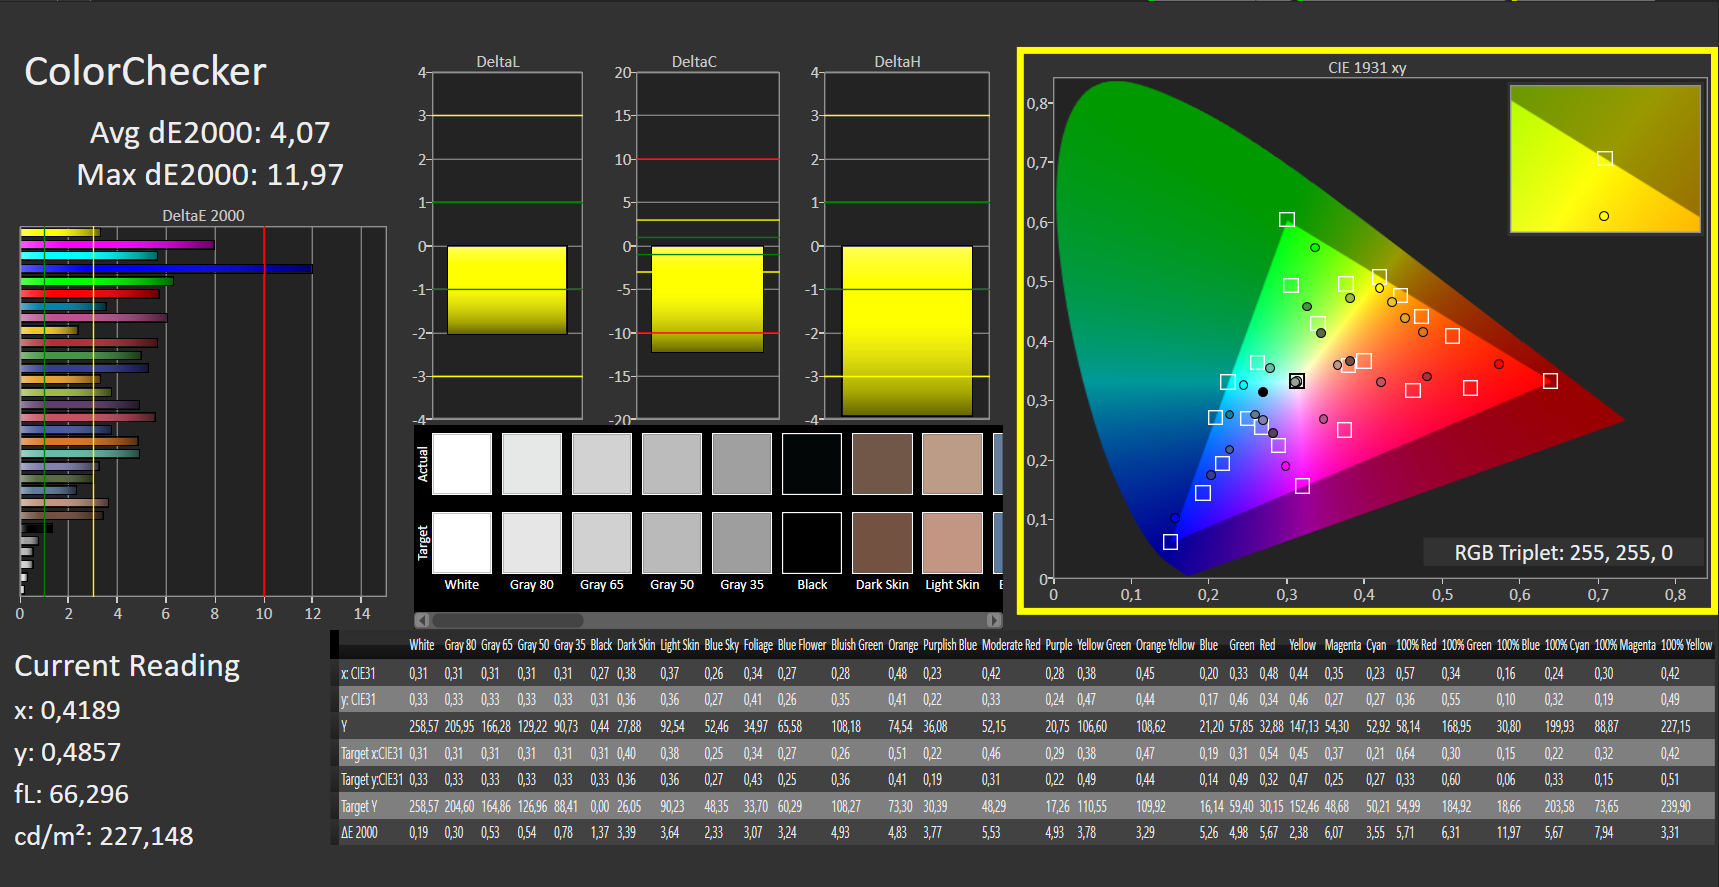
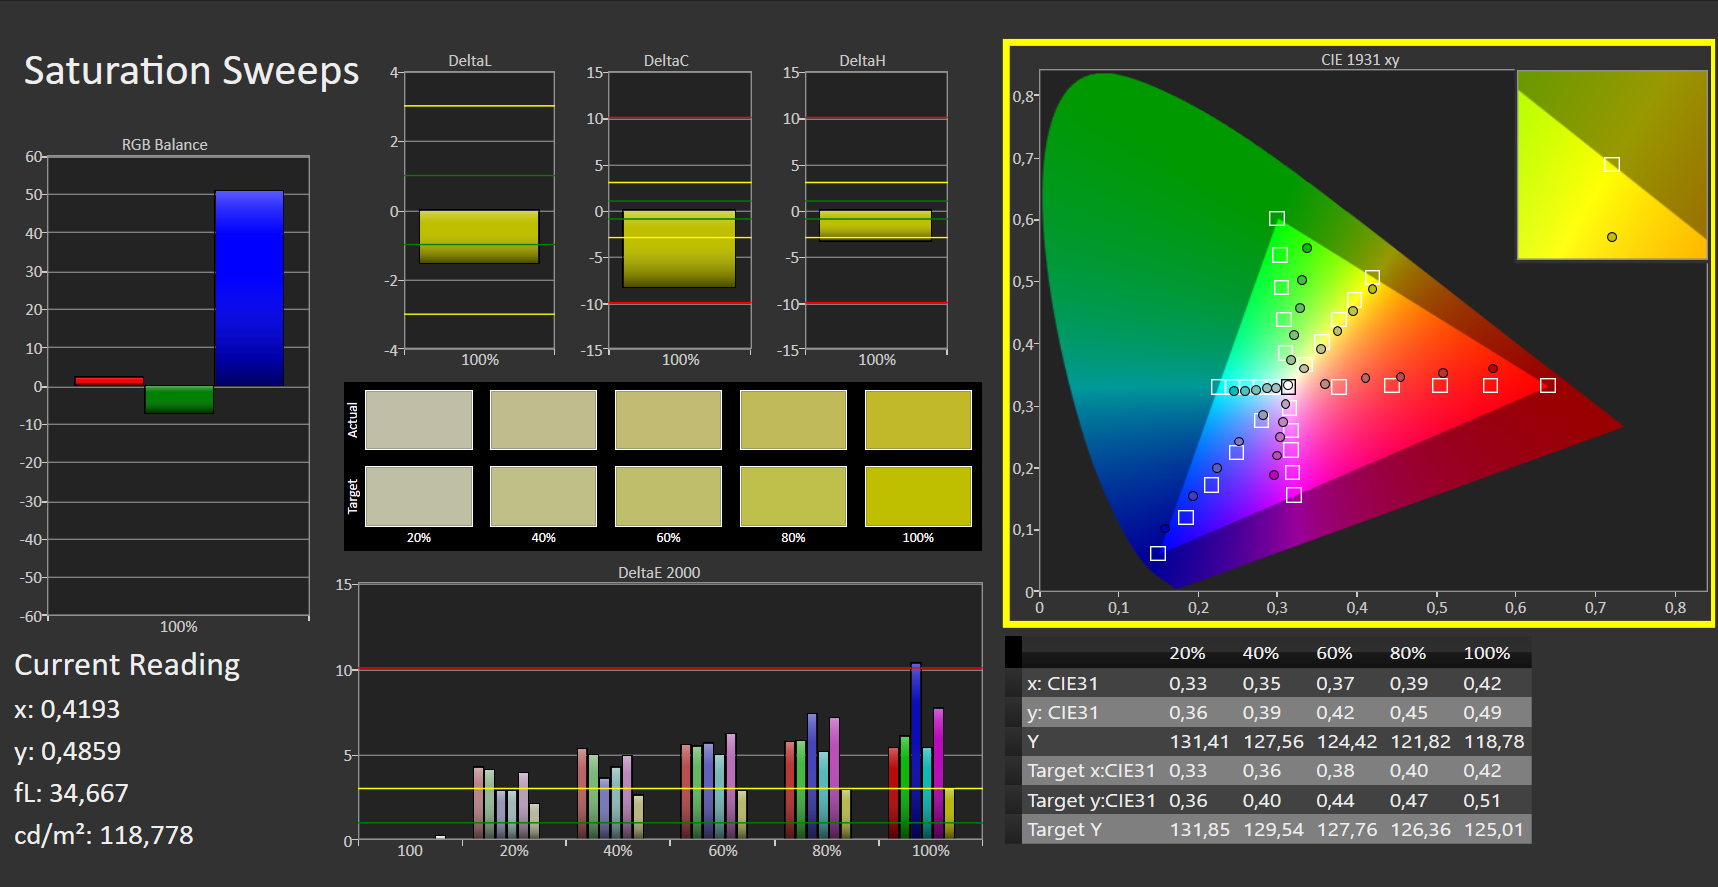
The matte 13.3-inch screen of the Latitude works with a native resolution of 1920 x 1080 pixels. The panel model can only be read as a Dell product. Brightness (248 cd/m²) and contrast (1,083:1) are too low - taking into account the price level of the notebook. We consider values beyond 300 cd/m² and 1,000:1 as good. The rivals have brighter and often also higher-contrast screens on board. Dell offers a multi-touch/non-glare variant of the screen, which is then supposed to have a 300 instead of 250 cd/m² brightness level. Positive: The display does not show PWM flickering in any brightness setting.
| |||||||||||||||||||||||||
Brightness Distribution: 97 %
Center on Battery: 270 cd/m²
Contrast: 1083:1 (Black: 0.23 cd/m²)
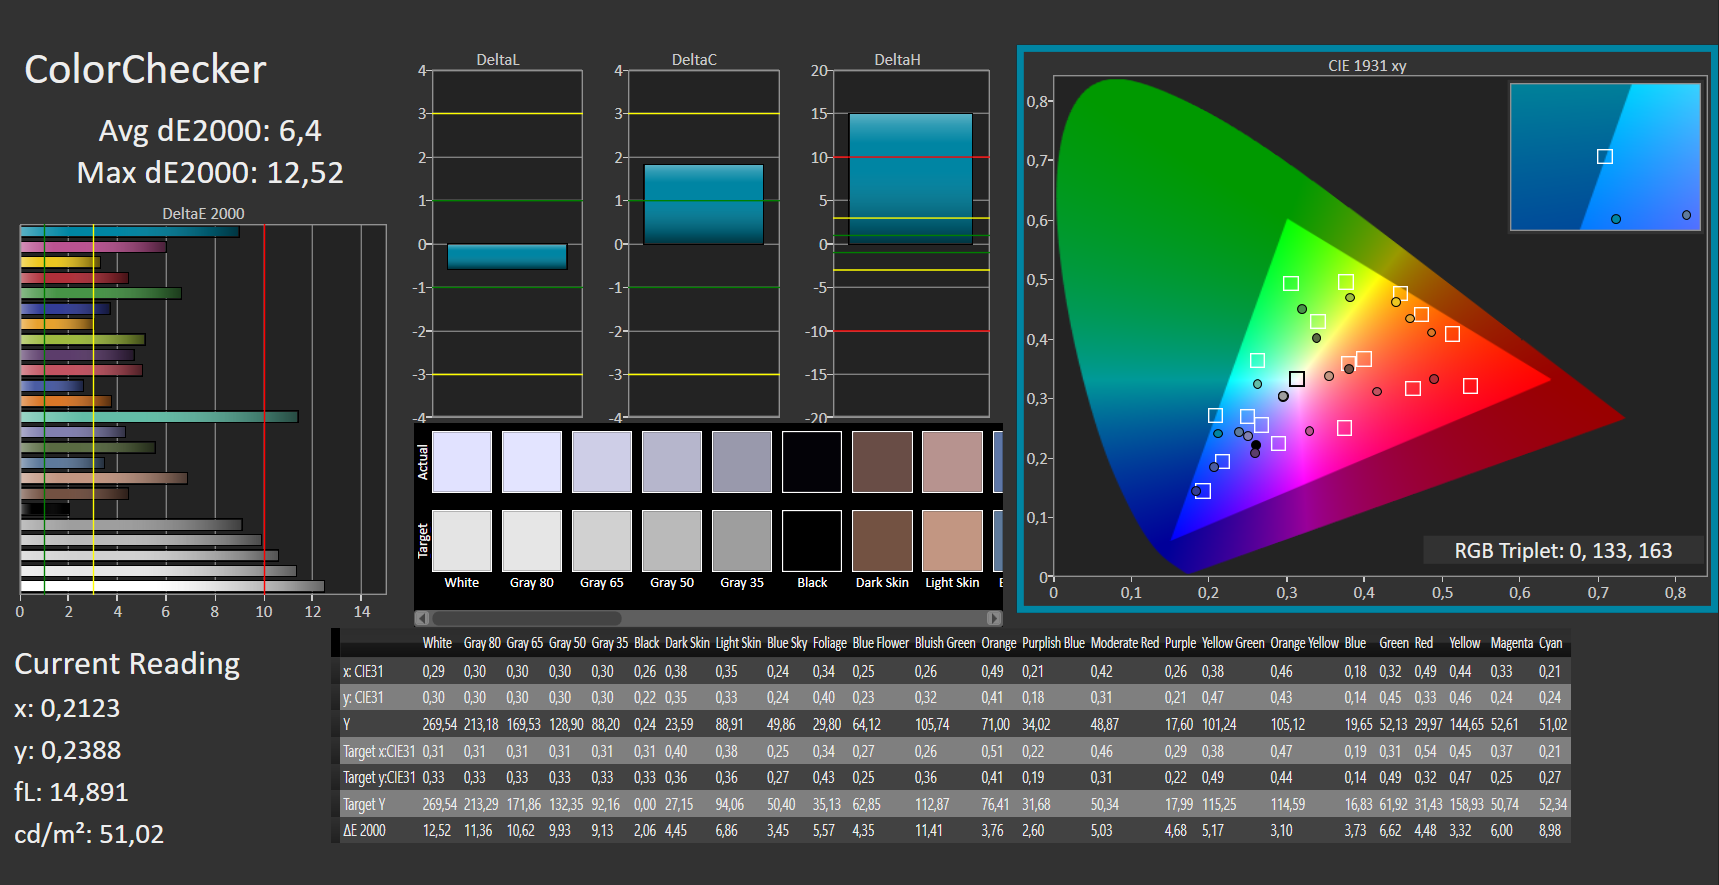
ΔE Color 6.4 | 0.5-29.43 Ø5, calibrated: 4.07
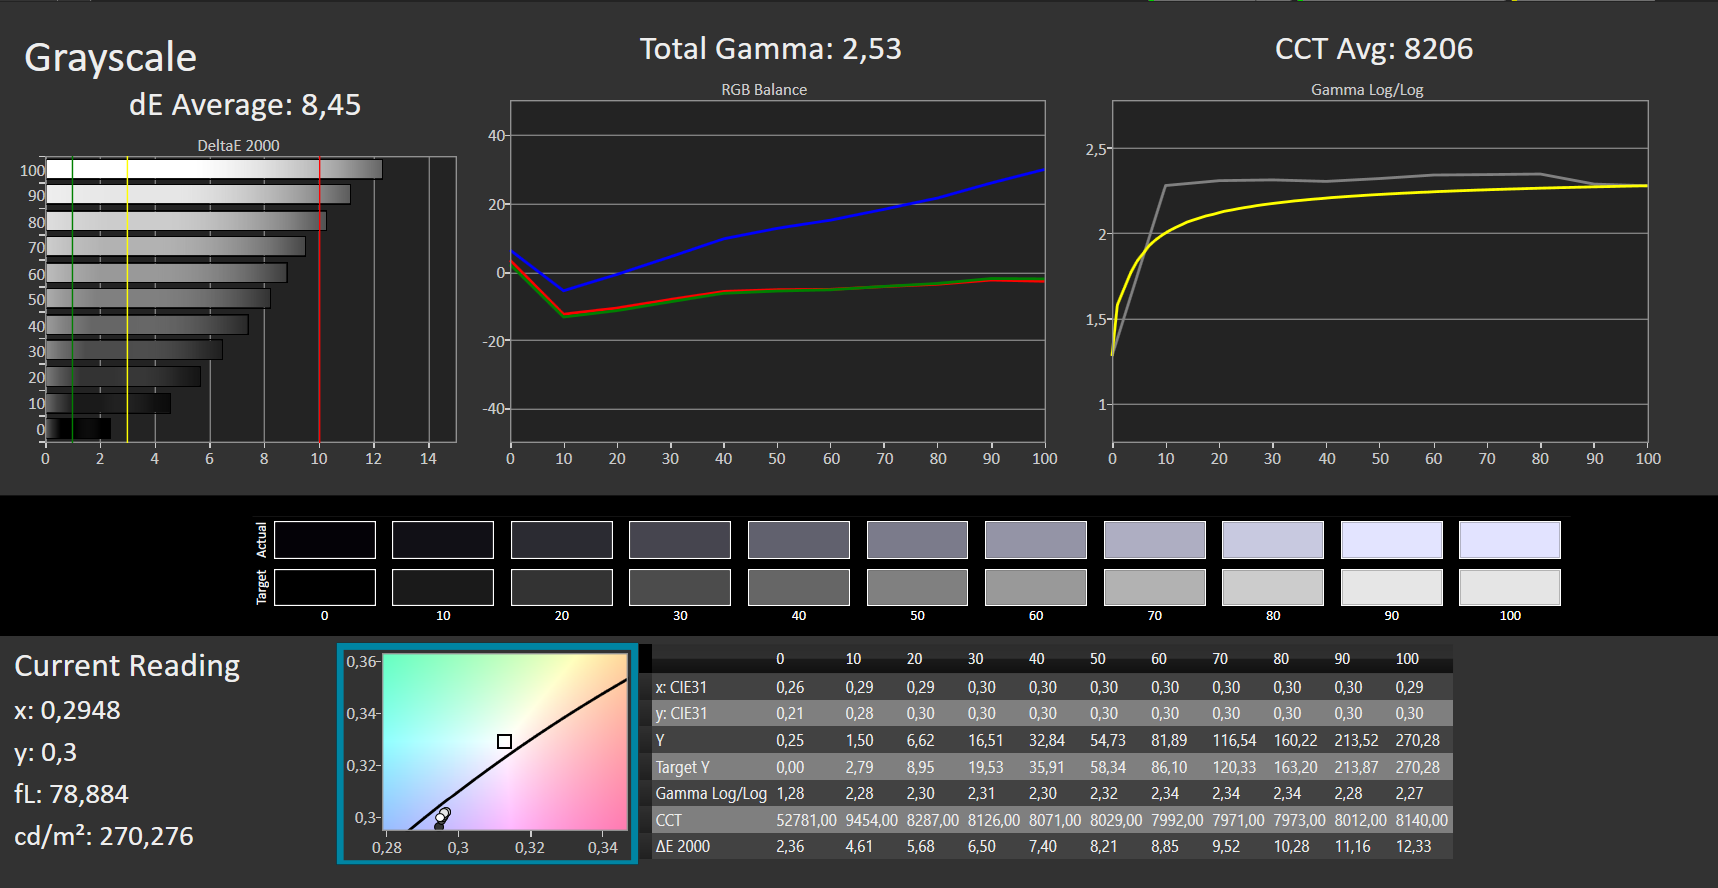
ΔE Greyscale 8.45 | 0.57-98 Ø5.3
40.6% AdobeRGB 1998 (Argyll 2.2.0 3D)
59.2% sRGB (Argyll 2.2.0 3D)
39.3% Display P3 (Argyll 2.2.0 3D)
Gamma: 2.53
| Dell Latitude 5320-TM4V2 Dell 1337L02, IPS, 1920x1080, 13.30 | Dell Latitude 5310-23VP6 Chi Mei CMN1382, IPS, 1920x1080, 13.30 | Lenovo ThinkBook 13s G3 20YA0005GE M133NW4JR0, IPS, 1920x1200, 13.30 | Dell XPS 13 9305 Core i5 FHD Sharp SHP14AE, IPS, 1920x1080, 13.30 | Lenovo ThinkPad L13 Gen2-21AB000PGE IVO M133NWF4 RA, IPS, 1920x1080, 13.30 | Lenovo ThinkBook 14 G2 ITL 20VDS02G00 AU Optronics B140HAN04.E, a-Si IPS LED, 1920x1080, 14.00 | |
|---|---|---|---|---|---|---|
| Display | 70% | 68% | 66% | -5% | -5% | |
| Display P3 Coverage | 39.3 | 67.5 72% | 67.5 72% | 66.3 69% | 37.47 -5% | 37.2 -5% |
| sRGB Coverage | 59.2 | 99 67% | 97.1 64% | 97.1 64% | 56.3 -5% | 55.5 -6% |
| AdobeRGB 1998 Coverage | 40.6 | 69.2 70% | 68.8 69% | 67.1 65% | 38.7 -5% | 38.4 -5% |
| Response Times | 9% | -31% | -23% | -25% | -14% | |
| Response Time Grey 50% / Grey 80% * | 36 ? | 36 ? -0% | 53.2 ? -48% | 55 ? -53% | 49.2 ? -37% | 45.9 ? -28% |
| Response Time Black / White * | 29 ? | 24 ? 17% | 32.8 ? -13% | 27 ? 7% | 32.8 ? -13% | 29 ? -0% |
| PWM Frequency | 2500 ? | 996 ? | ||||
| Screen | 37% | 49% | 40% | 20% | 8% | |
| Brightness middle | 249 | 383 54% | 379 52% | 486 95% | 294 18% | 386 55% |
| Brightness | 248 | 364 47% | 356 44% | 446 80% | 273 10% | 348 40% |
| Brightness Distribution | 97 | 84 -13% | 88 -9% | 77 -21% | 87 -10% | 83 -14% |
| Black Level * | 0.23 | 0.34 -48% | 0.23 -0% | 0.4 -74% | 0.275 -20% | 0.29 -26% |
| Contrast | 1083 | 1126 4% | 1648 52% | 1215 12% | 1069 -1% | 1331 23% |
| Colorchecker dE 2000 * | 6.4 | 2.24 65% | 1.6 75% | 2.54 60% | 3.81 40% | 6.3 2% |
| Colorchecker dE 2000 max. * | 12.52 | 3.32 73% | 2.7 78% | 4.34 65% | 6.22 50% | 18.3 -46% |
| Colorchecker dE 2000 calibrated * | 4.07 | 0.72 82% | 1 75% | 1.04 74% | 3.29 19% | 4.1 -1% |
| Greyscale dE 2000 * | 8.45 | 2.42 71% | 2 76% | 2.34 72% | 2.28 73% | 5.4 36% |
| Gamma | 2.53 87% | 2.65 83% | 2.25 98% | 2.28 96% | 2.48 89% | 2.55 86% |
| CCT | 8206 79% | 6776 96% | 6835 95% | 6864 95% | 6820 95% | 5894 110% |
| Color Space (Percent of AdobeRGB 1998) | 56 | 62 | ||||
| Color Space (Percent of sRGB) | 99 | 97 | ||||
| Total Average (Program / Settings) | 39% /
40% | 29% /
42% | 28% /
37% | -3% /
8% | -4% /
2% |
* ... smaller is better
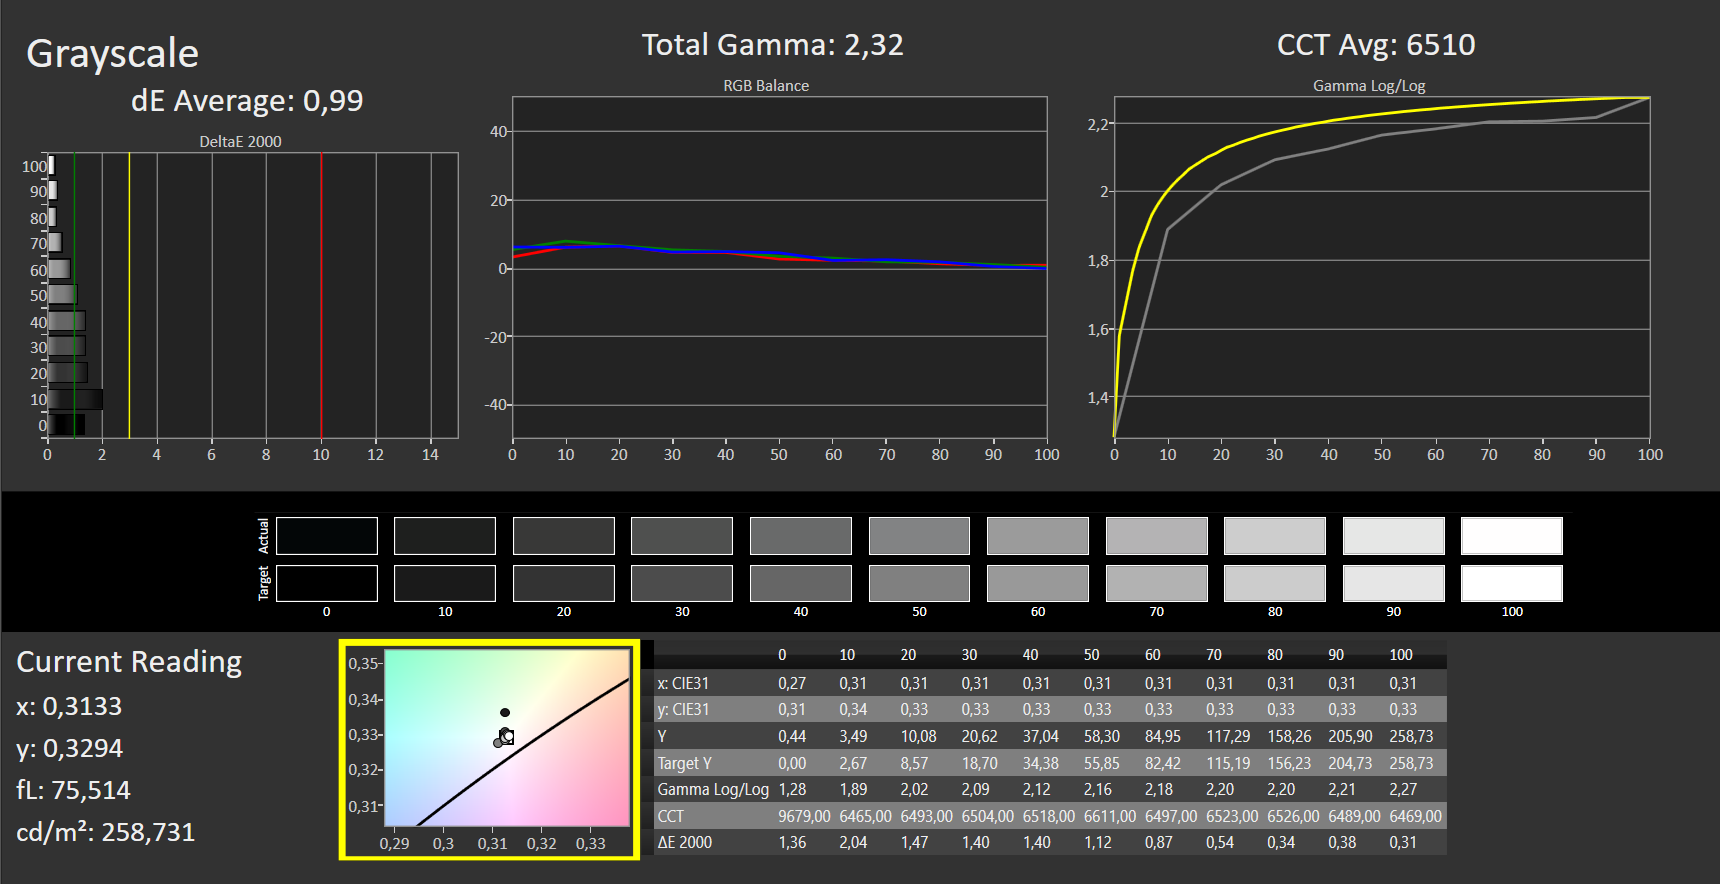
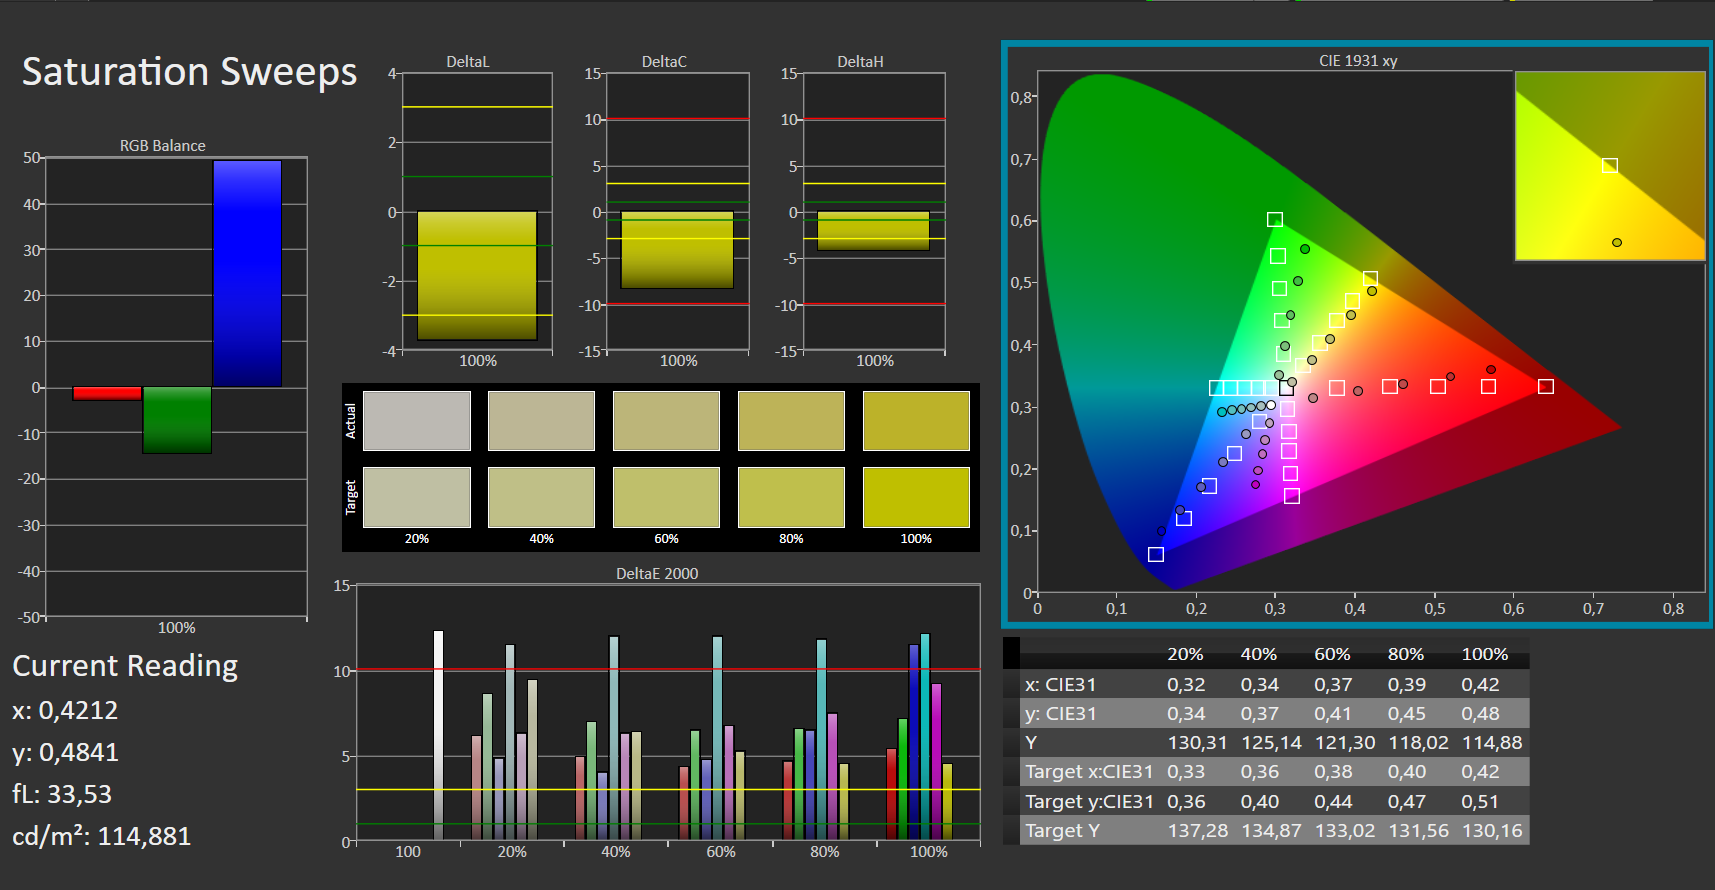
The screen shows poor color reproduction in its delivery state. With a DeltaE-2000 color deviation of 8, the target (DeltaE less than 3) is missed. At least the poor DeltaE can be eliminated through calibration, and the grayscale value is reduced from 8 to 1 in the process. As the owner of a 5320, you could try out our color profile linked in the box above, so you will get more accurate colors even without a photospectrometer. For the colors, the DeltaE only improves from 6 to 4.
The display does not suffer from a bluish cast, which is no longer common for IPS panels. The AdobeRGB (40%) and sRGB (59%) color spaces are not fully reproduced. The predecessor with its Chi Mei panel had much better rates here, and the brightness was also significantly higher. This is also the case for all other contenders, even if they partly have similarly poor color spaces (ThinkPad L13 Gen2, ThinkBook 14 G2 ITL).
Display Response Times
| ↔ Response Time Black to White | ||
|---|---|---|
| 29 ms ... rise ↗ and fall ↘ combined | ↗ 13 ms rise |  |
| ↘ 16 ms fall | ||
| The screen shows relatively slow response rates in our tests and may be too slow for gamers. In comparison, all tested devices range from 0.1 (minimum) to 240 (maximum) ms. » 73 % of all devices are better. This means that the measured response time is worse than the average of all tested devices (21.5 ms). | ||
| ↔ Response Time 50% Grey to 80% Grey | ||
| 36 ms ... rise ↗ and fall ↘ combined | ↗ 19 ms rise |  |
| ↘ 17 ms fall | ||
| The screen shows slow response rates in our tests and will be unsatisfactory for gamers. In comparison, all tested devices range from 0.2 (minimum) to 636 (maximum) ms. » 44 % of all devices are better. This means that the measured response time is similar to the average of all tested devices (33.7 ms). | ||
Screen Flickering / PWM (Pulse-Width Modulation)
| Screen flickering / PWM not detected |  | ||
In comparison: 53 % of all tested devices do not use PWM to dim the display. If PWM was detected, an average of 17924 (minimum: 5 - maximum: 3846000) Hz was measured. | |||
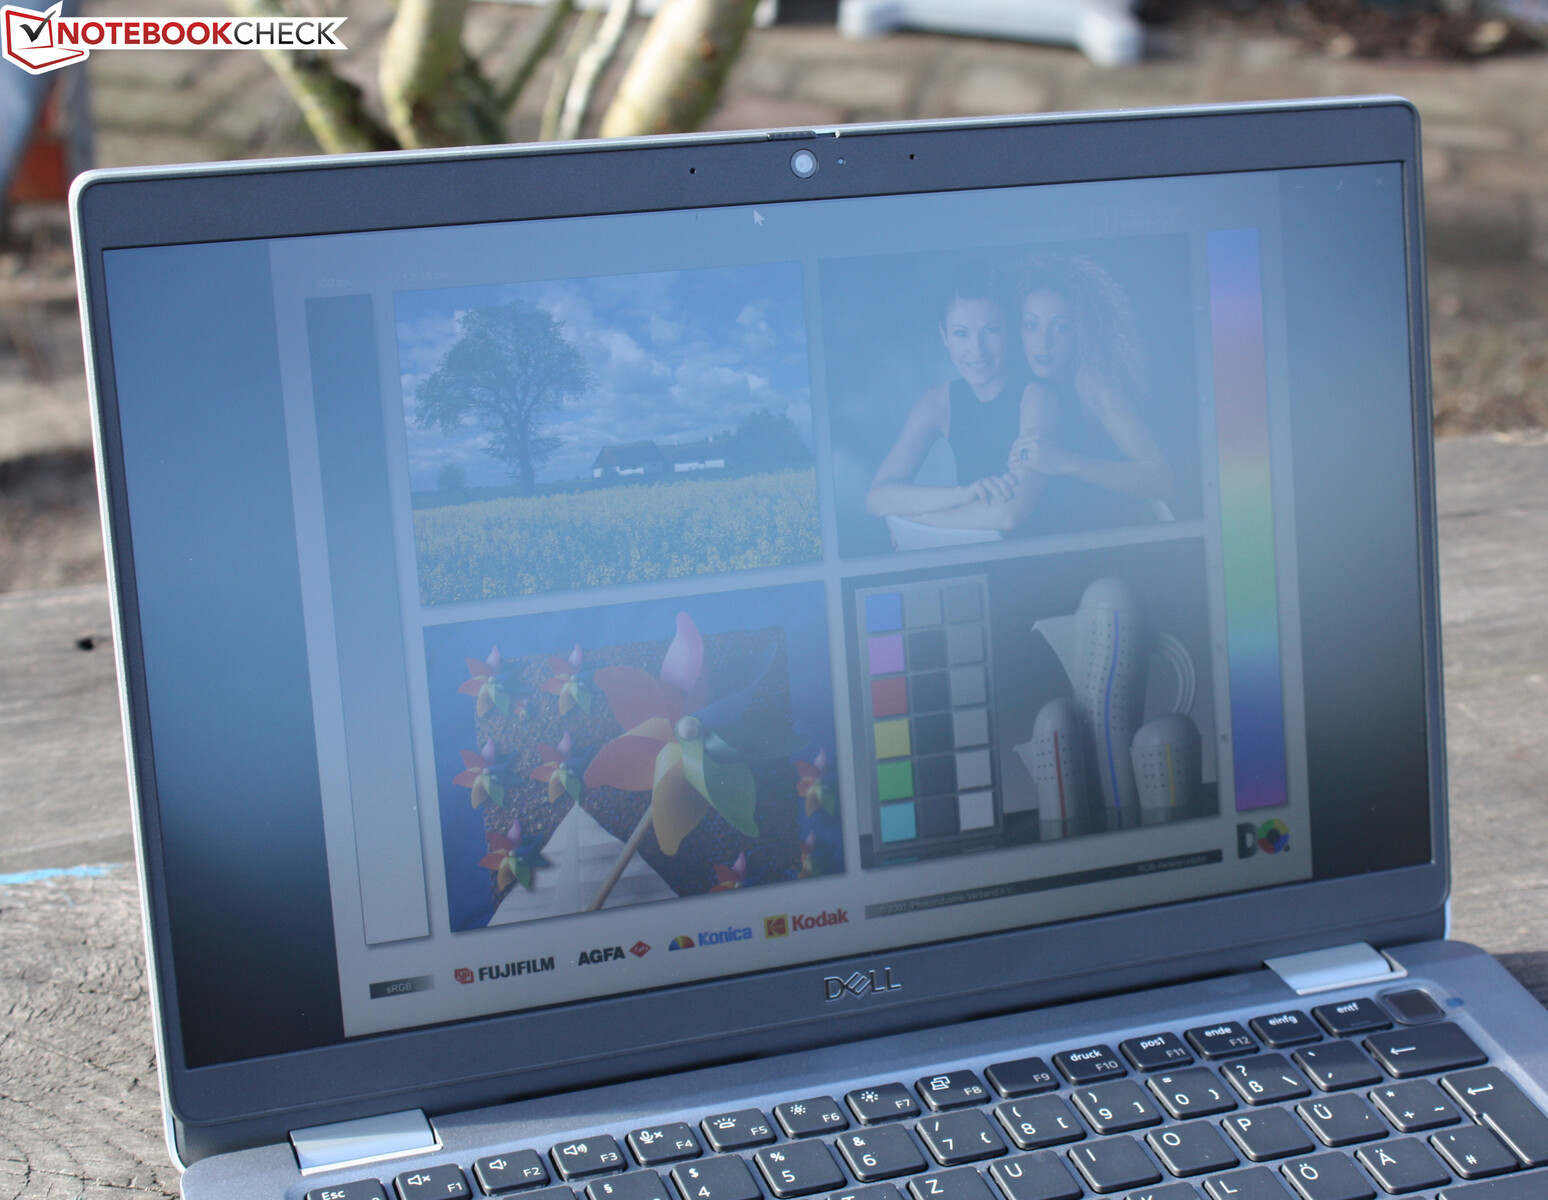
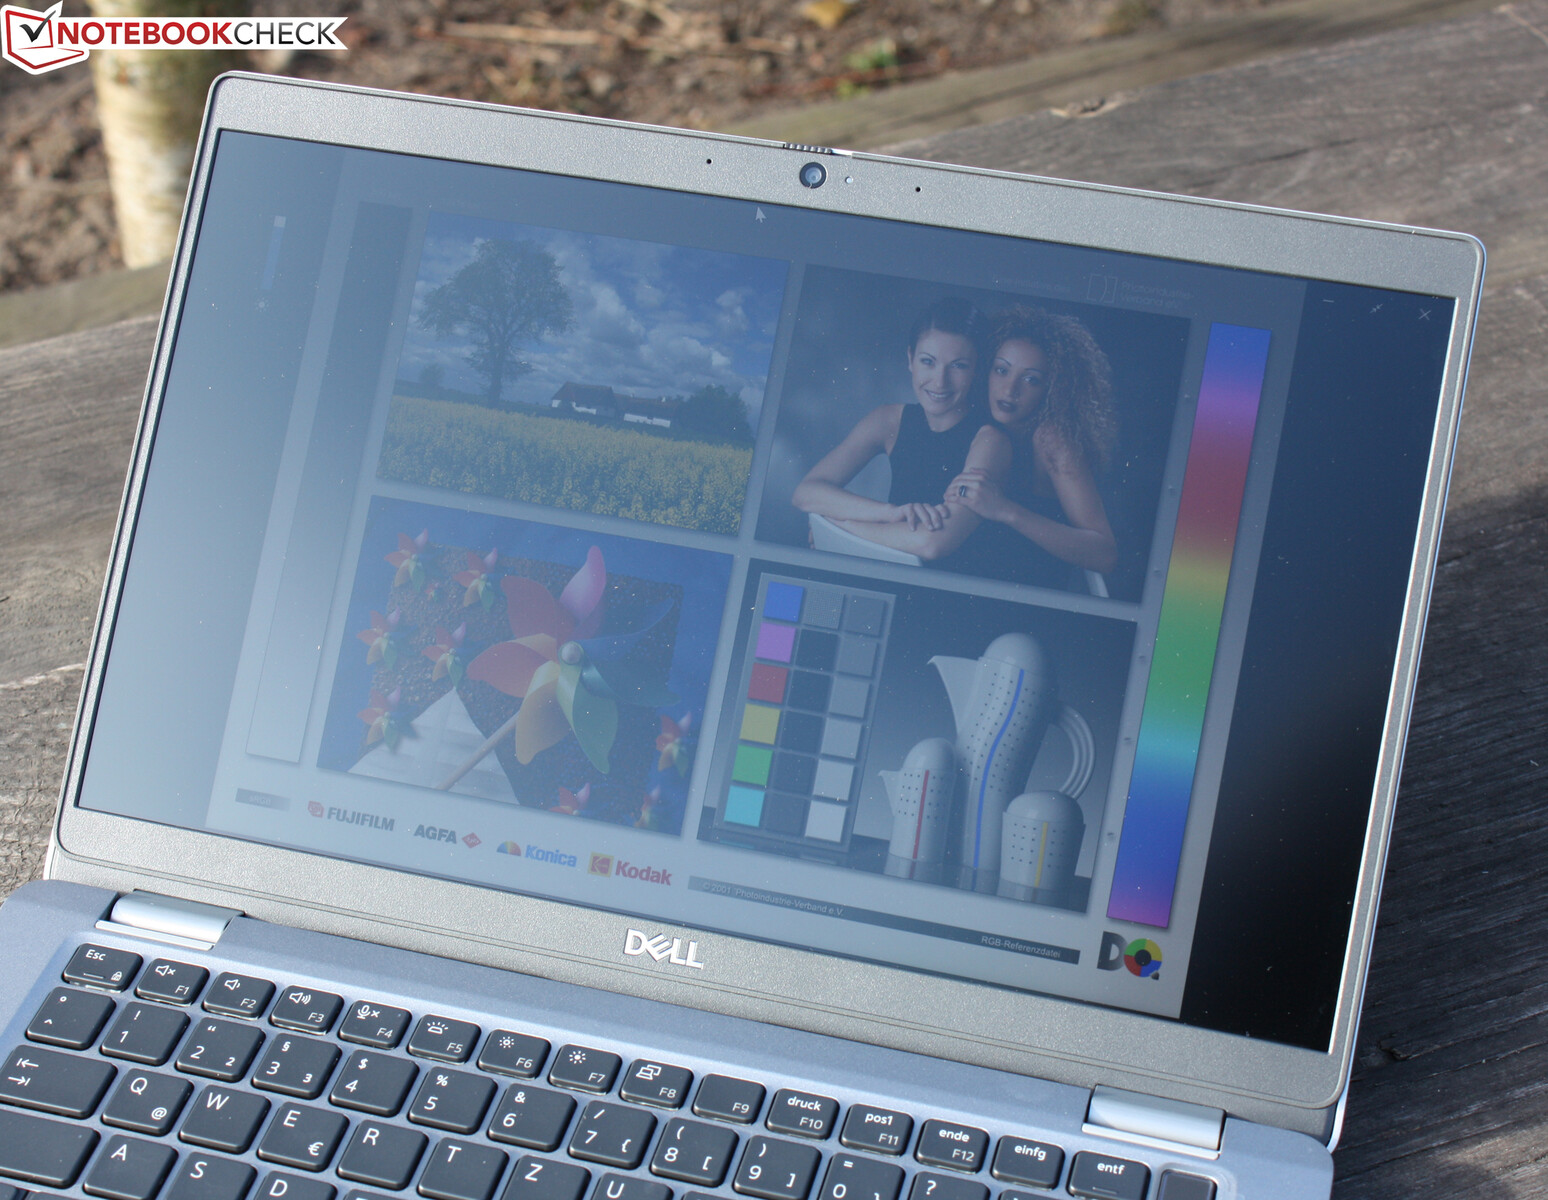
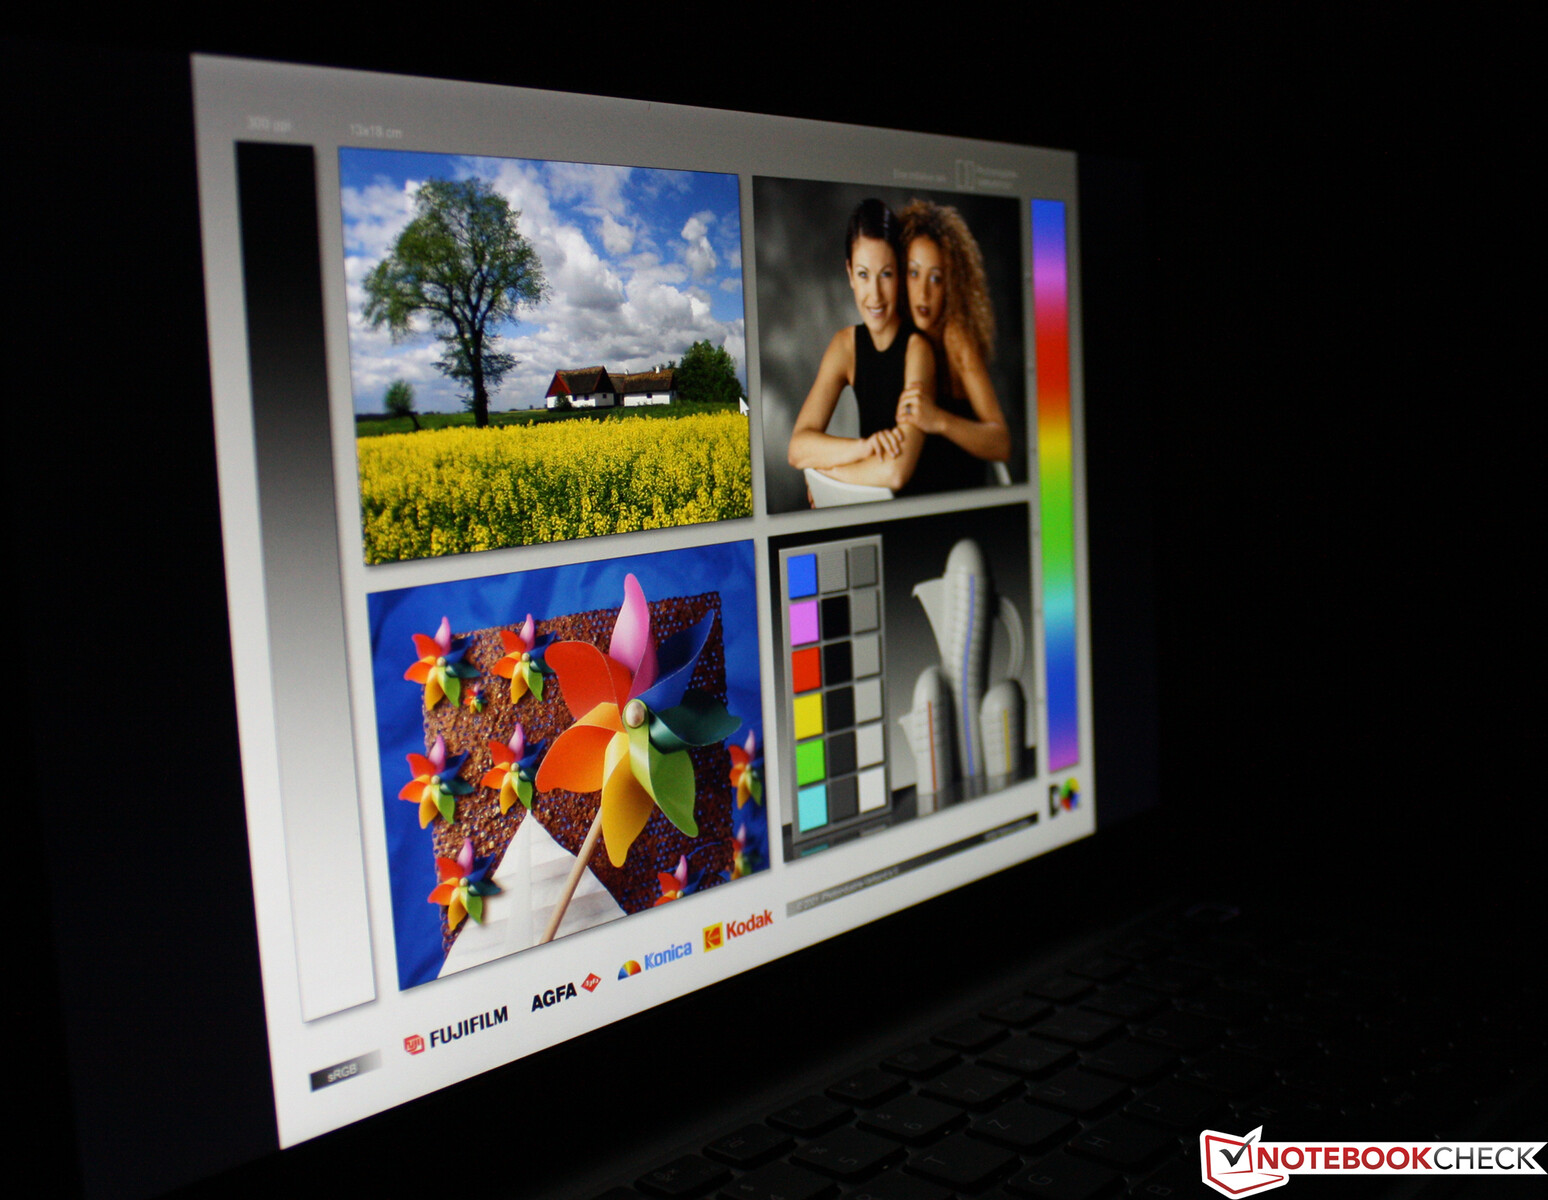
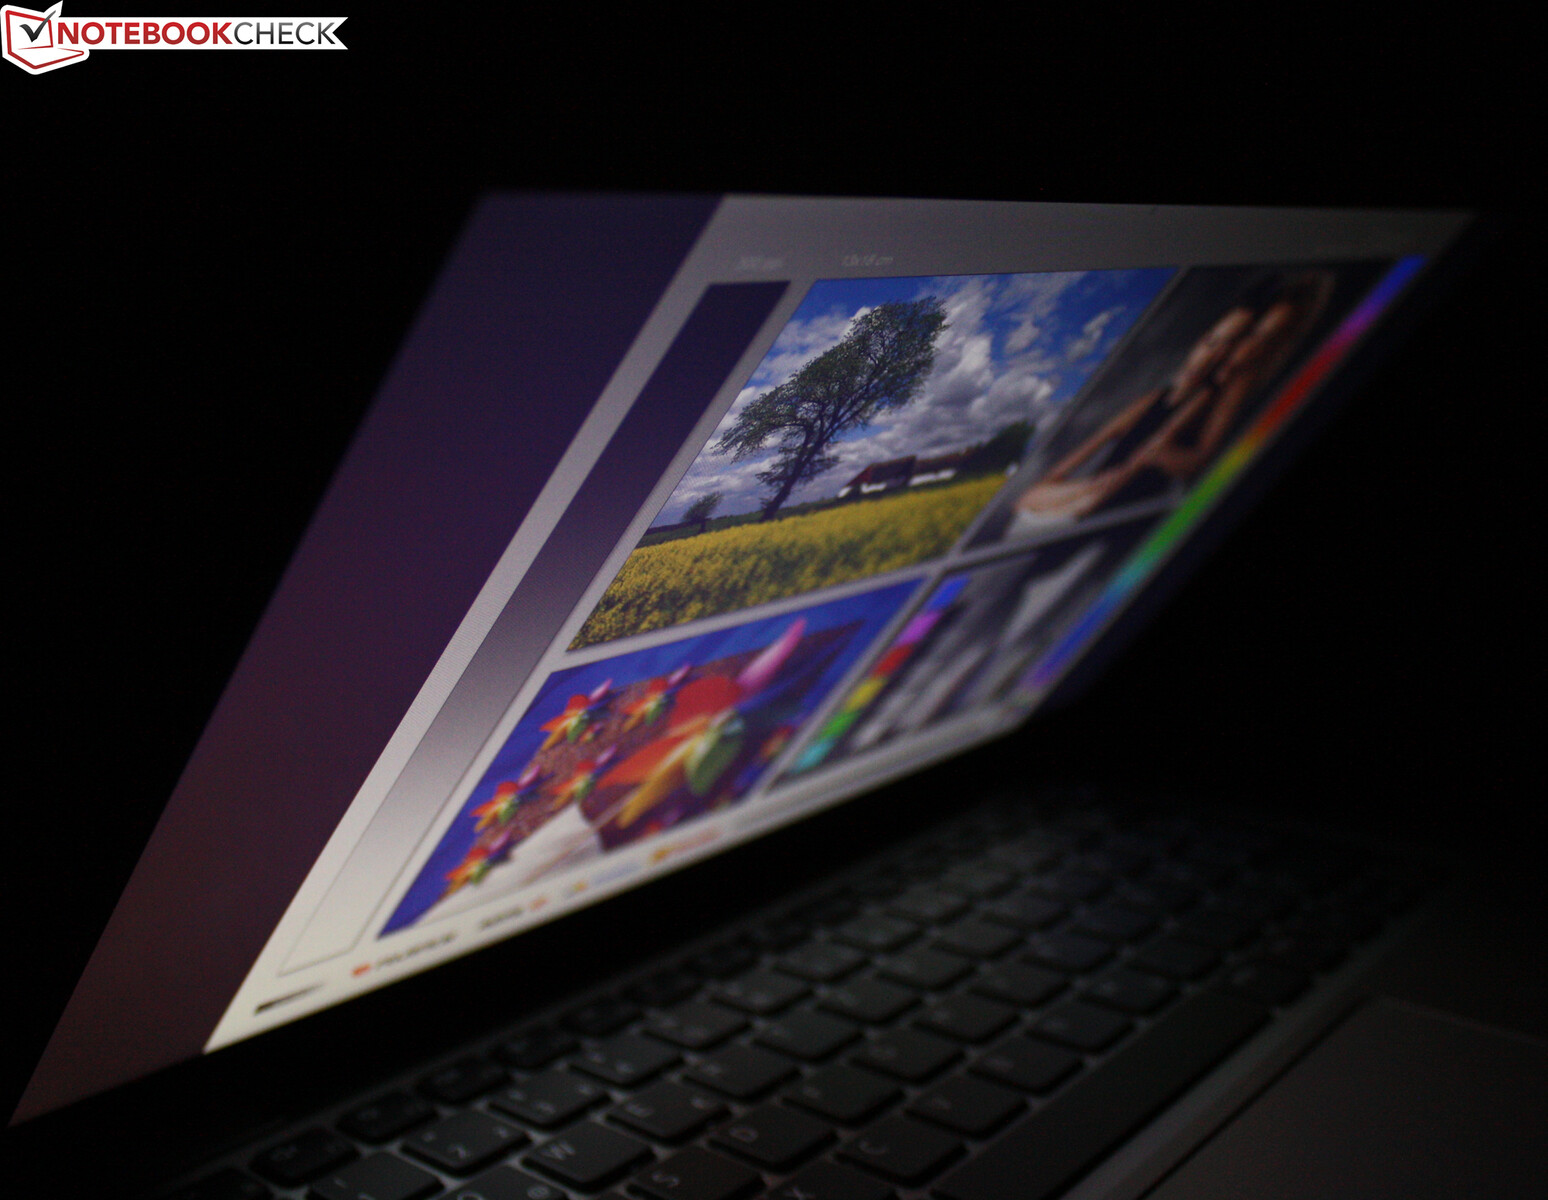
Dell equips the 5320 with an IPS panel that has stable viewing angles. Thus, the screen can be read from any position. Outdoors, reading the display is a problem due to the low brightness, at least when the sun is shining. The anti-reflective coating helps, but the maximum luminance of 249 cd/m² in the center of the screen is simply too low for good readability.
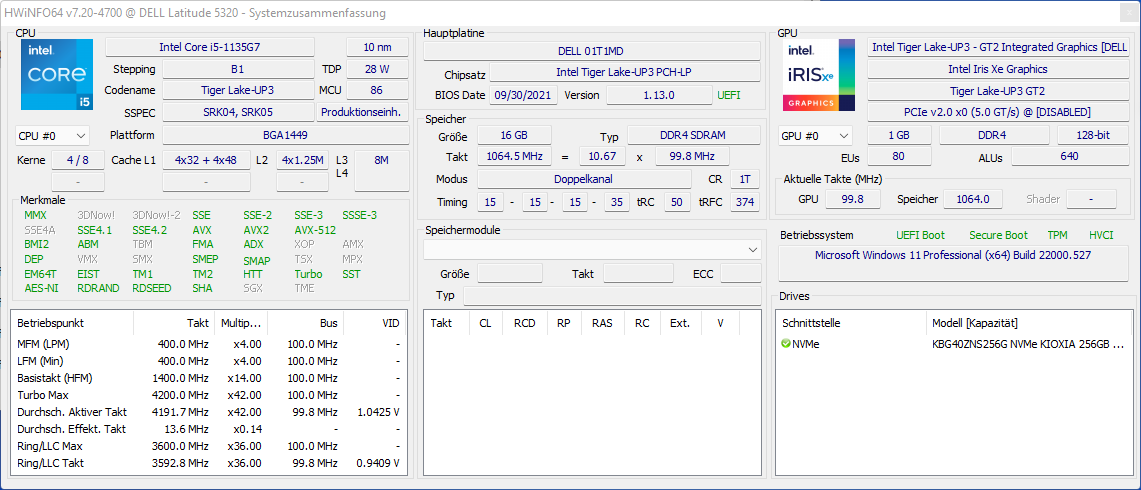
Performance - Slower than expected Core i5
Dell's Latitude 5320 is one of the mid-range business notebooks. The installed low-voltage processor offers enough computing power for office and Internet applications. Our test device is available in different configurations for 900 to 1250 Euros. Our model with Core i5, small 256 GB SSD, and non-touchscreen is the smallest configuration. Striking: Dell does not offer a Core i7 version in the stores, but it does in the in-house store (i7-1185G7).

Test conditions
We ran all benchmarks in Ultra Performance mode (Dell Power Manager/Temperature Management). We used the Optimized mode for the battery runtimes as well as for the temperature measurements at idle.
Processor
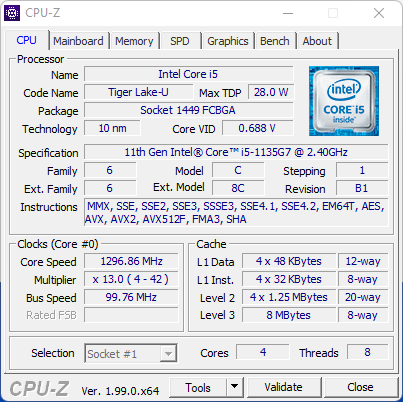
The installed Intel Core i5-1135G7 is a quad-core processor from Intel's Tiger Lake generation with a base clock of 2.4 GHz and a Turbo clock of up to 4.2 GHz. The performance is 5 to 10% below the average level, as all CPU benchmarks show.
The fact that Core i5-1135G7 can do more is shown by Lenovo's ThinkPad L14 G2 877 points instead of just 660 in the first run, and this gap does not decrease significantly over time.
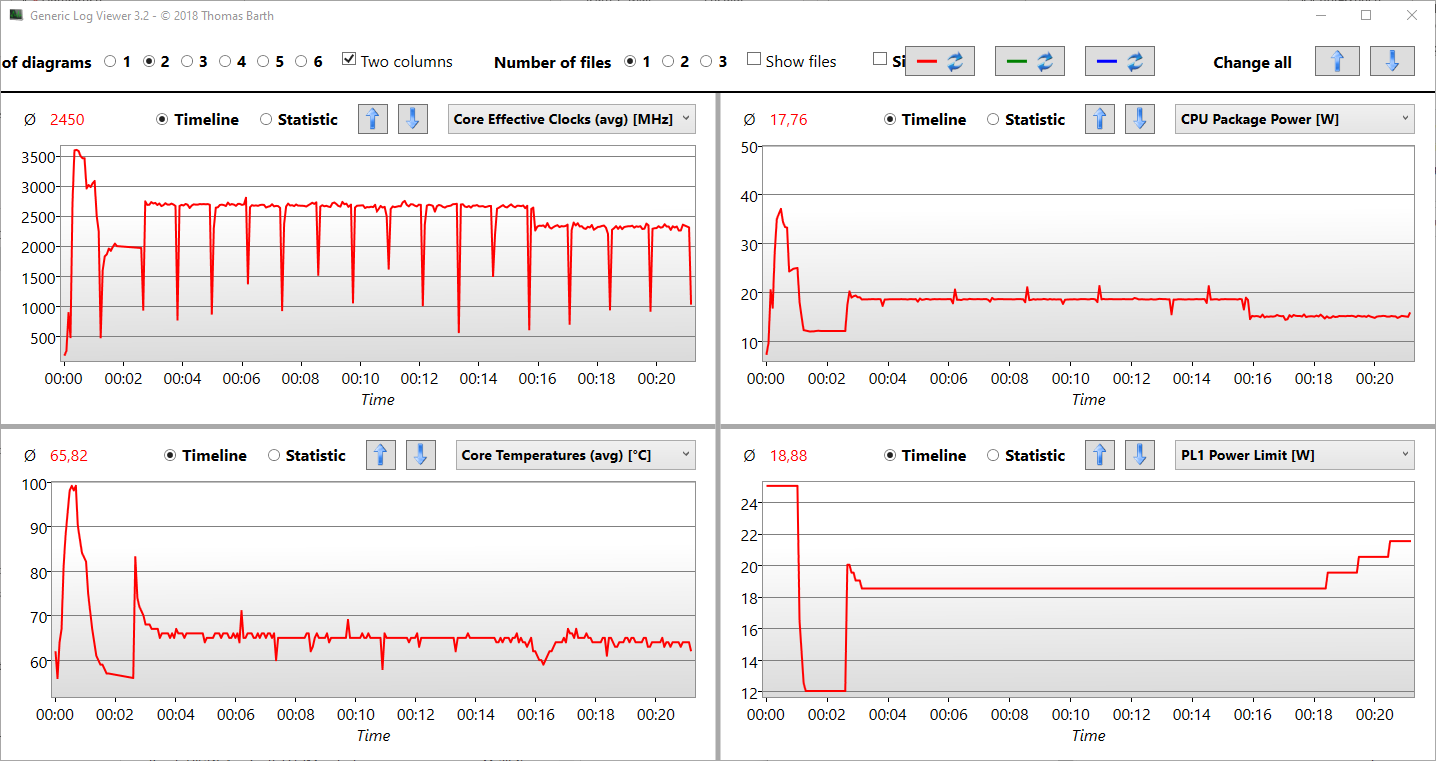
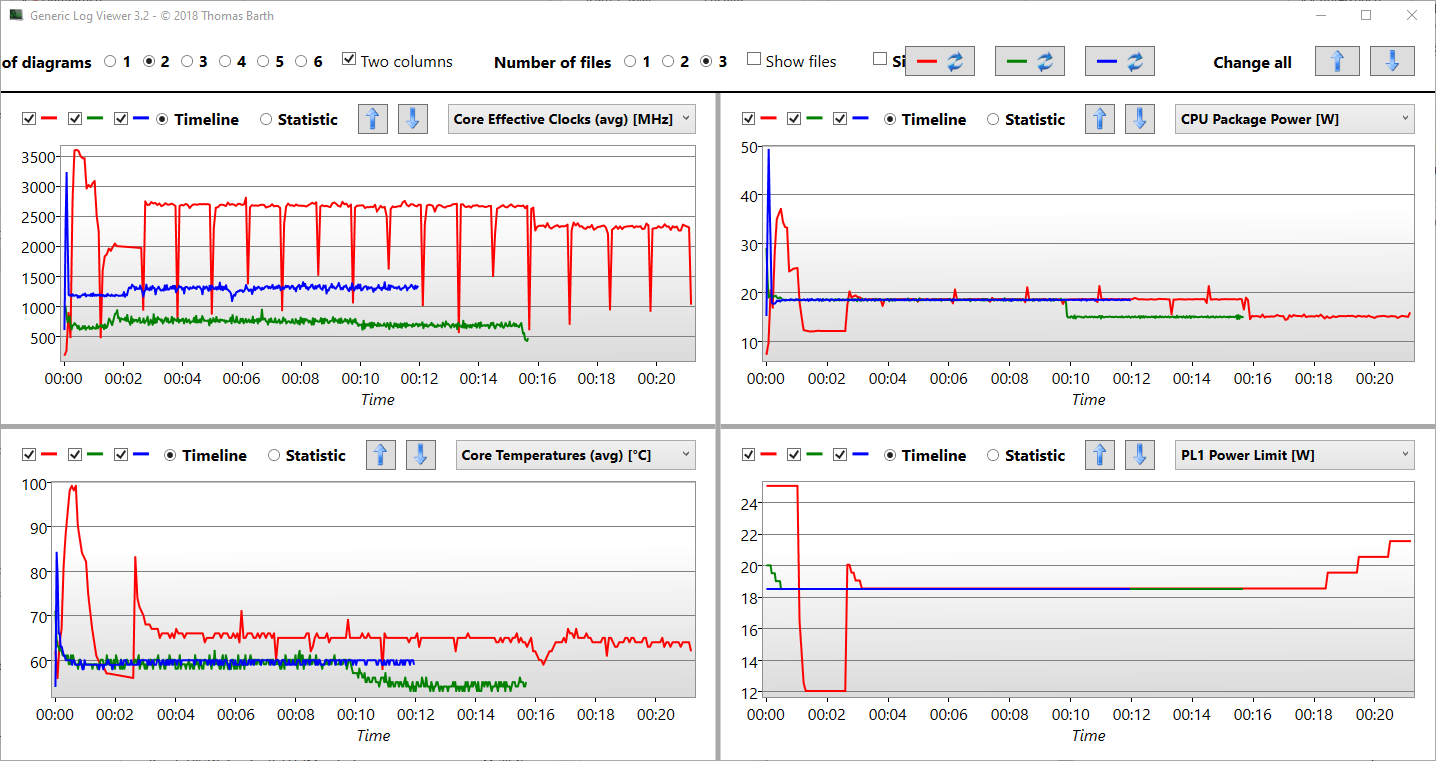
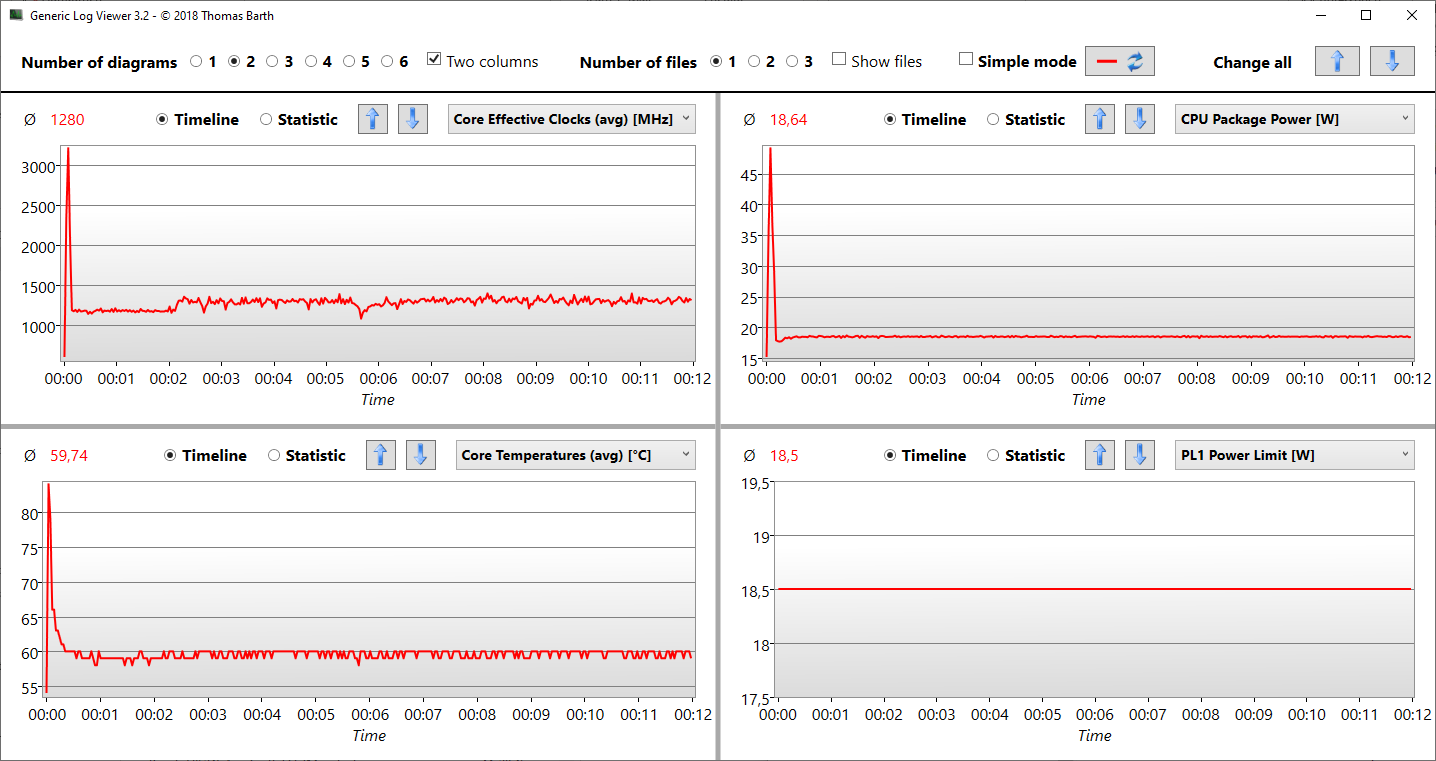
The constant performance in the loop is striking. Nevertheless, the SoC allows itself 3.6 GHz and almost 100 degrees Celsius for a few seconds in the first run. After that, the clock slows down to 2.0 GHz, the temperature drops significantly, and stays around 65 degrees Celsius for the rest of the run. The loop continues at a constant 2.6 GHz over time.
What do PL1 and PL2 do under Cinebench load on all cores? While the CPU package allows itself 37 watts for a very short time (a few seconds) at the start, it is a continuous 18 watts during the course of the test (PL1 duration).
We pulled the plug after 15 minutes: the package power drops to 16 watts, and the clock rate drops to 2.3 GHz. Thus, the processor's full performance cannot be used in battery mode.
Whether the performance of other notebooks can keep up here can be seen in our CPU benchmark list.
Cinebench R15 multi endurance test
Cinebench R23: Multi Core | Single Core
Cinebench R20: CPU (Multi Core) | CPU (Single Core)
Cinebench R15: CPU Multi 64Bit | CPU Single 64Bit
Blender: v2.79 BMW27 CPU
7-Zip 18.03: 7z b 4 | 7z b 4 -mmt1
Geekbench 5.5: Multi-Core | Single-Core
HWBOT x265 Benchmark v2.2: 4k Preset
LibreOffice : 20 Documents To PDF
R Benchmark 2.5: Overall mean
| CPU Performance Rating | |
| Average of class Subnotebook | |
| Lenovo ThinkBook 13s G3 20YA0005GE | |
| Lenovo ThinkPad L13 Gen2-21AB000PGE | |
| Lenovo ThinkPad L14 G2-20X1003WGE | |
| Average Intel Core i5-1135G7 | |
| Acer TravelMate P4 TMP414-51-59MR | |
| Dell XPS 13 9305 Core i5 FHD -2! | |
| Dell Latitude 5320-TM4V2 -1! | |
| Lenovo ThinkBook 14 G2 ITL 20VDS02G00 | |
| Dell Latitude 5310-23VP6 -2! | |
| Cinebench R23 / Multi Core | |
| Average of class Subnotebook (2485 - 16201, n=68, last 2 years) | |
| Lenovo ThinkBook 13s G3 20YA0005GE | |
| Lenovo ThinkPad L13 Gen2-21AB000PGE | |
| Dell XPS 13 9305 Core i5 FHD | |
| Lenovo ThinkPad L14 G2-20X1003WGE | |
| Acer TravelMate P4 TMP414-51-59MR | |
| Average Intel Core i5-1135G7 (2786 - 6136, n=55) | |
| Dell Latitude 5320-TM4V2 | |
| Lenovo ThinkBook 14 G2 ITL 20VDS02G00 | |
| Cinebench R23 / Single Core | |
| Average of class Subnotebook (598 - 1934, n=68, last 2 years) | |
| Lenovo ThinkBook 13s G3 20YA0005GE | |
| Acer TravelMate P4 TMP414-51-59MR | |
| Lenovo ThinkPad L13 Gen2-21AB000PGE | |
| Lenovo ThinkPad L14 G2-20X1003WGE | |
| Average Intel Core i5-1135G7 (1062 - 1373, n=53) | |
| Lenovo ThinkBook 14 G2 ITL 20VDS02G00 | |
| Dell XPS 13 9305 Core i5 FHD | |
| Dell Latitude 5320-TM4V2 | |
| Cinebench R20 / CPU (Multi Core) | |
| Average of class Subnotebook (810 - 6314, n=64, last 2 years) | |
| Lenovo ThinkBook 13s G3 20YA0005GE | |
| Lenovo ThinkPad L13 Gen2-21AB000PGE | |
| Lenovo ThinkPad L14 G2-20X1003WGE | |
| Dell XPS 13 9305 Core i5 FHD | |
| Average Intel Core i5-1135G7 (979 - 2382, n=62) | |
| Acer TravelMate P4 TMP414-51-59MR | |
| Dell Latitude 5320-TM4V2 | |
| Lenovo ThinkBook 14 G2 ITL 20VDS02G00 | |
| Dell Latitude 5310-23VP6 | |
| Cinebench R20 / CPU (Single Core) | |
| Average of class Subnotebook (216 - 738, n=64, last 2 years) | |
| Lenovo ThinkBook 13s G3 20YA0005GE | |
| Acer TravelMate P4 TMP414-51-59MR | |
| Lenovo ThinkPad L13 Gen2-21AB000PGE | |
| Lenovo ThinkPad L14 G2-20X1003WGE | |
| Lenovo ThinkBook 14 G2 ITL 20VDS02G00 | |
| Average Intel Core i5-1135G7 (375 - 527, n=62) | |
| Dell XPS 13 9305 Core i5 FHD | |
| Dell Latitude 5320-TM4V2 | |
| Dell Latitude 5310-23VP6 | |
| Cinebench R15 / CPU Multi 64Bit | |
| Lenovo ThinkBook 13s G3 20YA0005GE | |
| Lenovo ThinkBook 13s G3 20YA0005GE | |
| Average of class Subnotebook (514 - 2581, n=70, last 2 years) | |
| Lenovo ThinkPad L13 Gen2-21AB000PGE | |
| Lenovo ThinkPad L14 G2-20X1003WGE | |
| Acer TravelMate P4 TMP414-51-59MR | |
| Average Intel Core i5-1135G7 (431 - 941, n=65) | |
| Dell XPS 13 9305 Core i5 FHD | |
| Dell Latitude 5320-TM4V2 | |
| Dell Latitude 5310-23VP6 | |
| Lenovo ThinkBook 14 G2 ITL 20VDS02G00 | |
| Cinebench R15 / CPU Single 64Bit | |
| Average of class Subnotebook (91.8 - 280, n=62, last 2 years) | |
| Lenovo ThinkBook 13s G3 20YA0005GE | |
| Lenovo ThinkPad L13 Gen2-21AB000PGE | |
| Lenovo ThinkPad L14 G2-20X1003WGE | |
| Average Intel Core i5-1135G7 (141.4 - 205, n=61) | |
| Dell Latitude 5320-TM4V2 | |
| Lenovo ThinkBook 14 G2 ITL 20VDS02G00 | |
| Dell Latitude 5310-23VP6 | |
| Acer TravelMate P4 TMP414-51-59MR | |
| Blender / v2.79 BMW27 CPU | |
| Lenovo ThinkBook 14 G2 ITL 20VDS02G00 | |
| Dell Latitude 5310-23VP6 | |
| Average Intel Core i5-1135G7 (499 - 1044, n=60) | |
| Acer TravelMate P4 TMP414-51-59MR | |
| Dell XPS 13 9305 Core i5 FHD | |
| Dell Latitude 5320-TM4V2 | |
| Lenovo ThinkPad L14 G2-20X1003WGE | |
| Lenovo ThinkPad L13 Gen2-21AB000PGE | |
| Lenovo ThinkBook 13s G3 20YA0005GE | |
| Average of class Subnotebook (201 - 1600, n=66, last 2 years) | |
| 7-Zip 18.03 / 7z b 4 | |
| Average of class Subnotebook (16223 - 67444, n=57, last 2 years) | |
| Lenovo ThinkBook 13s G3 20YA0005GE | |
| Lenovo ThinkPad L13 Gen2-21AB000PGE | |
| Dell XPS 13 9305 Core i5 FHD | |
| Lenovo ThinkPad L14 G2-20X1003WGE | |
| Dell Latitude 5320-TM4V2 | |
| Acer TravelMate P4 TMP414-51-59MR | |
| Average Intel Core i5-1135G7 (14745 - 24873, n=62) | |
| Dell Latitude 5310-23VP6 | |
| Lenovo ThinkBook 14 G2 ITL 20VDS02G00 | |
| 7-Zip 18.03 / 7z b 4 -mmt1 | |
| Average of class Subnotebook (2197 - 6403, n=58, last 2 years) | |
| Lenovo ThinkBook 13s G3 20YA0005GE | |
| Lenovo ThinkPad L13 Gen2-21AB000PGE | |
| Acer TravelMate P4 TMP414-51-59MR | |
| Average Intel Core i5-1135G7 (3924 - 4921, n=62) | |
| Lenovo ThinkPad L14 G2-20X1003WGE | |
| Lenovo ThinkBook 14 G2 ITL 20VDS02G00 | |
| Dell XPS 13 9305 Core i5 FHD | |
| Dell Latitude 5320-TM4V2 | |
| Dell Latitude 5310-23VP6 | |
| Geekbench 5.5 / Multi-Core | |
| Average of class Subnotebook (4274 - 12580, n=65, last 2 years) | |
| Lenovo ThinkBook 13s G3 20YA0005GE | |
| Lenovo ThinkPad L13 Gen2-21AB000PGE | |
| Dell XPS 13 9305 Core i5 FHD | |
| Average Intel Core i5-1135G7 (3475 - 5472, n=58) | |
| Dell Latitude 5320-TM4V2 | |
| Acer TravelMate P4 TMP414-51-59MR | |
| Lenovo ThinkPad L14 G2-20X1003WGE | |
| Dell Latitude 5310-23VP6 | |
| Lenovo ThinkBook 14 G2 ITL 20VDS02G00 | |
| Geekbench 5.5 / Single-Core | |
| Average of class Subnotebook (672 - 2350, n=65, last 2 years) | |
| Lenovo ThinkBook 13s G3 20YA0005GE | |
| Average Intel Core i5-1135G7 (1147 - 1428, n=58) | |
| Dell XPS 13 9305 Core i5 FHD | |
| Acer TravelMate P4 TMP414-51-59MR | |
| Lenovo ThinkPad L13 Gen2-21AB000PGE | |
| Dell Latitude 5320-TM4V2 | |
| Lenovo ThinkPad L14 G2-20X1003WGE | |
| Lenovo ThinkBook 14 G2 ITL 20VDS02G00 | |
| Dell Latitude 5310-23VP6 | |
| HWBOT x265 Benchmark v2.2 / 4k Preset | |
| Average of class Subnotebook (1.5 - 19.4, n=56, last 2 years) | |
| Lenovo ThinkBook 13s G3 20YA0005GE | |
| Lenovo ThinkPad L13 Gen2-21AB000PGE | |
| Lenovo ThinkPad L14 G2-20X1003WGE | |
| Average Intel Core i5-1135G7 (3.57 - 7.6, n=57) | |
| Acer TravelMate P4 TMP414-51-59MR | |
| Dell Latitude 5310-23VP6 | |
| Lenovo ThinkBook 14 G2 ITL 20VDS02G00 | |
| LibreOffice / 20 Documents To PDF | |
| Dell Latitude 5310-23VP6 | |
| Dell XPS 13 9305 Core i5 FHD | |
| Dell Latitude 5320-TM4V2 | |
| Lenovo ThinkPad L13 Gen2-21AB000PGE | |
| Average Intel Core i5-1135G7 (44.2 - 62.9, n=60) | |
| Average of class Subnotebook (40.1 - 120.5, n=57, last 2 years) | |
| Acer TravelMate P4 TMP414-51-59MR | |
| Lenovo ThinkPad L14 G2-20X1003WGE | |
| Lenovo ThinkBook 13s G3 20YA0005GE | |
| Lenovo ThinkBook 14 G2 ITL 20VDS02G00 | |
| R Benchmark 2.5 / Overall mean | |
| Dell Latitude 5310-23VP6 | |
| Lenovo ThinkBook 14 G2 ITL 20VDS02G00 | |
| Dell Latitude 5320-TM4V2 | |
| Dell XPS 13 9305 Core i5 FHD | |
| Lenovo ThinkPad L14 G2-20X1003WGE | |
| Average Intel Core i5-1135G7 (0.619 - 0.727, n=59) | |
| Acer TravelMate P4 TMP414-51-59MR | |
| Lenovo ThinkPad L13 Gen2-21AB000PGE | |
| Lenovo ThinkBook 13s G3 20YA0005GE | |
| Average of class Subnotebook (0.4397 - 1.236, n=57, last 2 years) | |
* ... smaller is better
AIDA64: FP32 Ray-Trace | FPU Julia | CPU SHA3 | CPU Queen | FPU SinJulia | FPU Mandel | CPU AES | CPU ZLib | FP64 Ray-Trace | CPU PhotoWorxx
| Performance Rating | |
| Lenovo ThinkBook 13s G3 20YA0005GE | |
| Average of class Subnotebook | |
| Lenovo ThinkPad L13 Gen2-21AB000PGE | |
| Average Intel Core i5-1135G7 | |
| Lenovo ThinkPad L14 G2-20X1003WGE | |
| Acer TravelMate P4 TMP414-51-59MR | |
| Dell Latitude 5320-TM4V2 | |
| Dell Latitude 5310-23VP6 | |
| Lenovo ThinkBook 14 G2 ITL 20VDS02G00 | |
| AIDA64 / FP32 Ray-Trace | |
| Lenovo ThinkBook 13s G3 20YA0005GE | |
| Average of class Subnotebook (343 - 25961, n=57, last 2 years) | |
| Lenovo ThinkPad L13 Gen2-21AB000PGE | |
| Average Intel Core i5-1135G7 (4313 - 7952, n=45) | |
| Acer TravelMate P4 TMP414-51-59MR | |
| Lenovo ThinkPad L14 G2-20X1003WGE | |
| Dell Latitude 5320-TM4V2 | |
| Dell Latitude 5310-23VP6 | |
| Lenovo ThinkBook 14 G2 ITL 20VDS02G00 | |
| AIDA64 / FPU Julia | |
| Lenovo ThinkBook 13s G3 20YA0005GE | |
| Average of class Subnotebook (11867 - 111109, n=57, last 2 years) | |
| Lenovo ThinkPad L13 Gen2-21AB000PGE | |
| Average Intel Core i5-1135G7 (19402 - 32283, n=45) | |
| Lenovo ThinkPad L14 G2-20X1003WGE | |
| Dell Latitude 5310-23VP6 | |
| Acer TravelMate P4 TMP414-51-59MR | |
| Dell Latitude 5320-TM4V2 | |
| Lenovo ThinkBook 14 G2 ITL 20VDS02G00 | |
| AIDA64 / CPU SHA3 | |
| Lenovo ThinkBook 13s G3 20YA0005GE | |
| Average of class Subnotebook (453 - 4646, n=57, last 2 years) | |
| Average Intel Core i5-1135G7 (1316 - 2172, n=45) | |
| Lenovo ThinkPad L14 G2-20X1003WGE | |
| Acer TravelMate P4 TMP414-51-59MR | |
| Dell Latitude 5320-TM4V2 | |
| Lenovo ThinkPad L13 Gen2-21AB000PGE | |
| Dell Latitude 5310-23VP6 | |
| Lenovo ThinkBook 14 G2 ITL 20VDS02G00 | |
| AIDA64 / CPU Queen | |
| Lenovo ThinkBook 13s G3 20YA0005GE | |
| Average of class Subnotebook (15447 - 115300, n=57, last 2 years) | |
| Lenovo ThinkPad L13 Gen2-21AB000PGE | |
| Dell Latitude 5310-23VP6 | |
| Acer TravelMate P4 TMP414-51-59MR | |
| Lenovo ThinkPad L14 G2-20X1003WGE | |
| Average Intel Core i5-1135G7 (39000 - 46951, n=45) | |
| Dell Latitude 5320-TM4V2 | |
| Lenovo ThinkBook 14 G2 ITL 20VDS02G00 | |
| AIDA64 / FPU SinJulia | |
| Lenovo ThinkBook 13s G3 20YA0005GE | |
| Average of class Subnotebook (1223 - 14944, n=57, last 2 years) | |
| Lenovo ThinkPad L13 Gen2-21AB000PGE | |
| Dell Latitude 5310-23VP6 | |
| Acer TravelMate P4 TMP414-51-59MR | |
| Average Intel Core i5-1135G7 (3497 - 4445, n=45) | |
| Lenovo ThinkPad L14 G2-20X1003WGE | |
| Dell Latitude 5320-TM4V2 | |
| Lenovo ThinkBook 14 G2 ITL 20VDS02G00 | |
| AIDA64 / FPU Mandel | |
| Lenovo ThinkBook 13s G3 20YA0005GE | |
| Average of class Subnotebook (6379 - 59053, n=57, last 2 years) | |
| Lenovo ThinkPad L13 Gen2-21AB000PGE | |
| Average Intel Core i5-1135G7 (12569 - 19635, n=45) | |
| Acer TravelMate P4 TMP414-51-59MR | |
| Lenovo ThinkPad L14 G2-20X1003WGE | |
| Dell Latitude 5320-TM4V2 | |
| Dell Latitude 5310-23VP6 | |
| Lenovo ThinkBook 14 G2 ITL 20VDS02G00 | |
| AIDA64 / CPU AES | |
| Lenovo ThinkBook 13s G3 20YA0005GE | |
| Lenovo ThinkPad L14 G2-20X1003WGE | |
| Acer TravelMate P4 TMP414-51-59MR | |
| Average Intel Core i5-1135G7 (28988 - 67977, n=45) | |
| Average of class Subnotebook (638 - 161430, n=57, last 2 years) | |
| Lenovo ThinkBook 14 G2 ITL 20VDS02G00 | |
| Dell Latitude 5320-TM4V2 | |
| Lenovo ThinkPad L13 Gen2-21AB000PGE | |
| Dell Latitude 5310-23VP6 | |
| AIDA64 / CPU ZLib | |
| Average of class Subnotebook (270 - 1123, n=57, last 2 years) | |
| Lenovo ThinkBook 13s G3 20YA0005GE | |
| Lenovo ThinkPad L13 Gen2-21AB000PGE | |
| Lenovo ThinkPad L14 G2-20X1003WGE | |
| Acer TravelMate P4 TMP414-51-59MR | |
| Dell Latitude 5310-23VP6 | |
| Average Intel Core i5-1135G7 (265 - 373, n=51) | |
| Dell Latitude 5320-TM4V2 | |
| Lenovo ThinkBook 14 G2 ITL 20VDS02G00 | |
| AIDA64 / FP64 Ray-Trace | |
| Lenovo ThinkBook 13s G3 20YA0005GE | |
| Average of class Subnotebook (204 - 14018, n=57, last 2 years) | |
| Lenovo ThinkPad L13 Gen2-21AB000PGE | |
| Average Intel Core i5-1135G7 (2226 - 4291, n=45) | |
| Acer TravelMate P4 TMP414-51-59MR | |
| Lenovo ThinkPad L14 G2-20X1003WGE | |
| Dell Latitude 5320-TM4V2 | |
| Dell Latitude 5310-23VP6 | |
| Lenovo ThinkBook 14 G2 ITL 20VDS02G00 | |
| AIDA64 / CPU PhotoWorxx | |
| Average of class Subnotebook (7622 - 53954, n=57, last 2 years) | |
| Average Intel Core i5-1135G7 (9004 - 45366, n=45) | |
| Dell Latitude 5320-TM4V2 | |
| Lenovo ThinkBook 13s G3 20YA0005GE | |
| Lenovo ThinkPad L13 Gen2-21AB000PGE | |
| Dell Latitude 5310-23VP6 | |
| Acer TravelMate P4 TMP414-51-59MR | |
| Lenovo ThinkBook 14 G2 ITL 20VDS02G00 | |
| Lenovo ThinkPad L14 G2-20X1003WGE | |
System performance
The system performance is on a below-average level. Most competitors are faster here, especially those with AMD (+40%!). The review sample is on par with a Lenovo ThinkBook 14 G2 ITL, which has a Tiger Lake Core i3. Especially the productivity field is below average for the Latitude 5320.
In practical use, all everyday tasks could be completed almost without delays, there were no conspicuities. Thus, it is a measurable, but not a tangible underperformance.
CrossMark: Overall | Productivity | Creativity | Responsiveness
| PCMark 10 / Score | |
| Lenovo ThinkBook 13s G3 20YA0005GE | |
| Average of class Subnotebook (4384 - 7428, n=55, last 2 years) | |
| Lenovo ThinkPad L13 Gen2-21AB000PGE | |
| Dell XPS 13 9305 Core i5 FHD | |
| Acer TravelMate P4 TMP414-51-59MR | |
| Average Intel Core i5-1135G7, Intel Iris Xe Graphics G7 80EUs (4026 - 4952, n=53) | |
| Lenovo ThinkPad L14 G2-20X1003WGE | |
| Dell Latitude 5320-TM4V2 | |
| Lenovo ThinkBook 14 G2 ITL 20VDS02G00 | |
| Dell Latitude 5310-23VP6 | |
| PCMark 10 / Essentials | |
| Average of class Subnotebook (8890 - 11168, n=55, last 2 years) | |
| Lenovo ThinkBook 13s G3 20YA0005GE | |
| Lenovo ThinkPad L13 Gen2-21AB000PGE | |
| Dell XPS 13 9305 Core i5 FHD | |
| Average Intel Core i5-1135G7, Intel Iris Xe Graphics G7 80EUs (8149 - 9917, n=53) | |
| Dell Latitude 5320-TM4V2 | |
| Acer TravelMate P4 TMP414-51-59MR | |
| Lenovo ThinkBook 14 G2 ITL 20VDS02G00 | |
| Lenovo ThinkPad L14 G2-20X1003WGE | |
| Dell Latitude 5310-23VP6 | |
| PCMark 10 / Productivity | |
| Lenovo ThinkBook 13s G3 20YA0005GE | |
| Lenovo ThinkPad L13 Gen2-21AB000PGE | |
| Average of class Subnotebook (6213 - 10279, n=55, last 2 years) | |
| Dell Latitude 5310-23VP6 | |
| Lenovo ThinkBook 14 G2 ITL 20VDS02G00 | |
| Acer TravelMate P4 TMP414-51-59MR | |
| Dell XPS 13 9305 Core i5 FHD | |
| Lenovo ThinkPad L14 G2-20X1003WGE | |
| Average Intel Core i5-1135G7, Intel Iris Xe Graphics G7 80EUs (5040 - 6619, n=53) | |
| Dell Latitude 5320-TM4V2 | |
| PCMark 10 / Digital Content Creation | |
| Average of class Subnotebook (4093 - 9749, n=55, last 2 years) | |
| Lenovo ThinkBook 13s G3 20YA0005GE | |
| Lenovo ThinkPad L13 Gen2-21AB000PGE | |
| Acer TravelMate P4 TMP414-51-59MR | |
| Dell XPS 13 9305 Core i5 FHD | |
| Lenovo ThinkPad L14 G2-20X1003WGE | |
| Dell Latitude 5320-TM4V2 | |
| Average Intel Core i5-1135G7, Intel Iris Xe Graphics G7 80EUs (3548 - 5255, n=53) | |
| Lenovo ThinkBook 14 G2 ITL 20VDS02G00 | |
| Dell Latitude 5310-23VP6 | |
| CrossMark / Overall | |
| Average of class Subnotebook (718 - 1876, n=61, last 2 years) | |
| Lenovo ThinkBook 13s G3 20YA0005GE | |
| Average Intel Core i5-1135G7, Intel Iris Xe Graphics G7 80EUs (1058 - 1293, n=11) | |
| Acer TravelMate P4 TMP414-51-59MR | |
| Dell Latitude 5320-TM4V2 | |
| Lenovo ThinkBook 14 G2 ITL 20VDS02G00 | |
| CrossMark / Productivity | |
| Average of class Subnotebook (685 - 1829, n=61, last 2 years) | |
| Lenovo ThinkBook 13s G3 20YA0005GE | |
| Average Intel Core i5-1135G7, Intel Iris Xe Graphics G7 80EUs (1148 - 1332, n=11) | |
| Acer TravelMate P4 TMP414-51-59MR | |
| Lenovo ThinkBook 14 G2 ITL 20VDS02G00 | |
| Dell Latitude 5320-TM4V2 | |
| CrossMark / Creativity | |
| Average of class Subnotebook (776 - 2210, n=61, last 2 years) | |
| Lenovo ThinkBook 13s G3 20YA0005GE | |
| Average Intel Core i5-1135G7, Intel Iris Xe Graphics G7 80EUs (895 - 1263, n=11) | |
| Dell Latitude 5320-TM4V2 | |
| Acer TravelMate P4 TMP414-51-59MR | |
| Lenovo ThinkBook 14 G2 ITL 20VDS02G00 | |
| CrossMark / Responsiveness | |
| Average of class Subnotebook (652 - 1899, n=61, last 2 years) | |
| Average Intel Core i5-1135G7, Intel Iris Xe Graphics G7 80EUs (923 - 1320, n=11) | |
| Lenovo ThinkBook 13s G3 20YA0005GE | |
| Lenovo ThinkBook 14 G2 ITL 20VDS02G00 | |
| Acer TravelMate P4 TMP414-51-59MR | |
| Dell Latitude 5320-TM4V2 | |
| PCMark 10 Score | 4325 points | |
Help | ||
| AIDA64 / Memory Copy | |
| Average of class Subnotebook (22781 - 95353, n=57, last 2 years) | |
| Average Intel Core i5-1135G7 (17443 - 63889, n=45) | |
| Lenovo ThinkBook 13s G3 20YA0005GE | |
| Lenovo ThinkPad L13 Gen2-21AB000PGE | |
| Dell Latitude 5320-TM4V2 | |
| Dell Latitude 5310-23VP6 | |
| Lenovo ThinkPad L14 G2-20X1003WGE | |
| Acer TravelMate P4 TMP414-51-59MR | |
| Lenovo ThinkBook 14 G2 ITL 20VDS02G00 | |
| AIDA64 / Memory Read | |
| Average of class Subnotebook (23831 - 86433, n=57, last 2 years) | |
| Average Intel Core i5-1135G7 (19716 - 63705, n=45) | |
| Dell Latitude 5320-TM4V2 | |
| Lenovo ThinkPad L13 Gen2-21AB000PGE | |
| Lenovo ThinkBook 13s G3 20YA0005GE | |
| Acer TravelMate P4 TMP414-51-59MR | |
| Lenovo ThinkPad L14 G2-20X1003WGE | |
| Lenovo ThinkBook 14 G2 ITL 20VDS02G00 | |
| Dell Latitude 5310-23VP6 | |
| AIDA64 / Memory Write | |
| Average of class Subnotebook (23474 - 93382, n=57, last 2 years) | |
| Average Intel Core i5-1135G7 (18722 - 66778, n=45) | |
| Dell Latitude 5320-TM4V2 | |
| Lenovo ThinkBook 13s G3 20YA0005GE | |
| Lenovo ThinkPad L13 Gen2-21AB000PGE | |
| Acer TravelMate P4 TMP414-51-59MR | |
| Lenovo ThinkPad L14 G2-20X1003WGE | |
| Dell Latitude 5310-23VP6 | |
| Lenovo ThinkBook 14 G2 ITL 20VDS02G00 | |
| AIDA64 / Memory Latency | |
| Lenovo ThinkPad L13 Gen2-21AB000PGE | |
| Lenovo ThinkBook 13s G3 20YA0005GE | |
| Average of class Subnotebook (18.8 - 172, n=52, last 2 years) | |
| Dell Latitude 5310-23VP6 | |
| Lenovo ThinkBook 14 G2 ITL 20VDS02G00 | |
| Lenovo ThinkPad L14 G2-20X1003WGE | |
| Acer TravelMate P4 TMP414-51-59MR | |
| Dell Latitude 5320-TM4V2 | |
| Average Intel Core i5-1135G7 (68.3 - 107, n=51) | |
* ... smaller is better
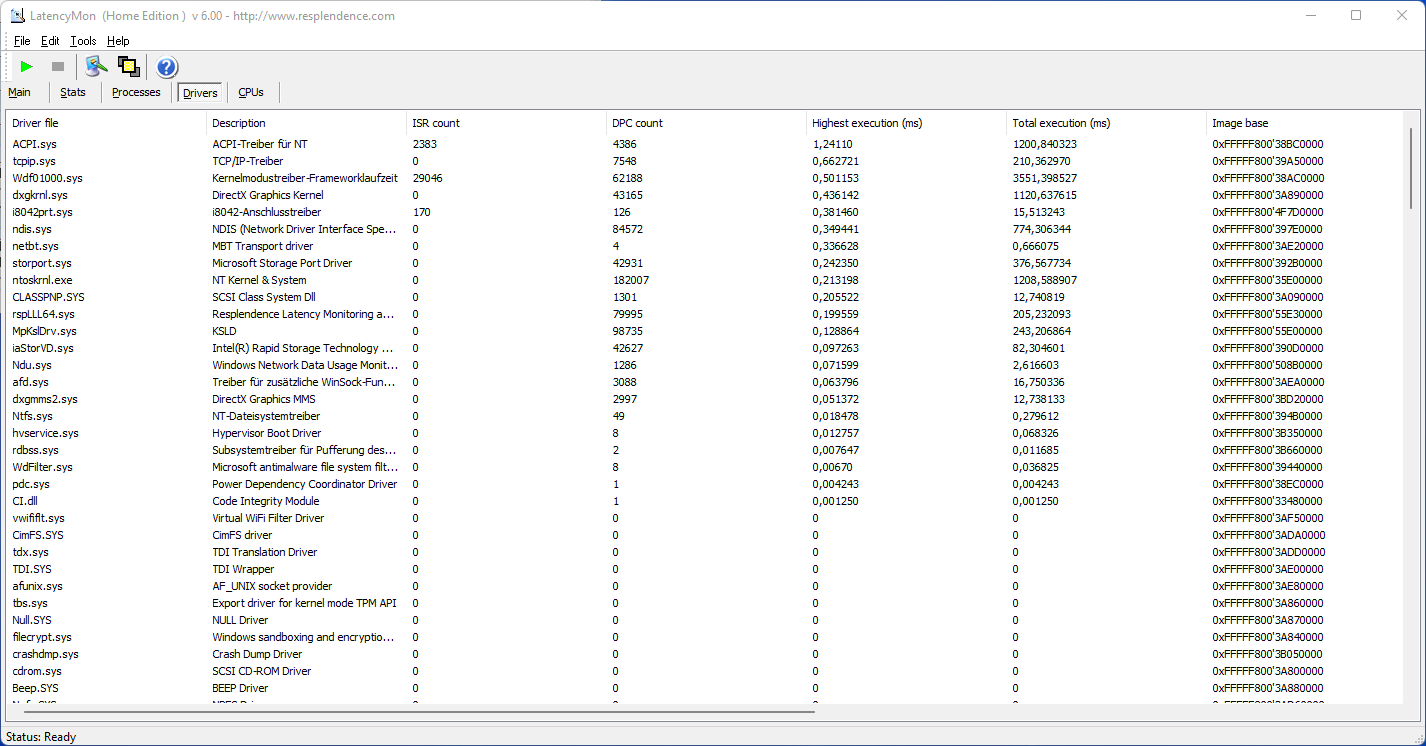
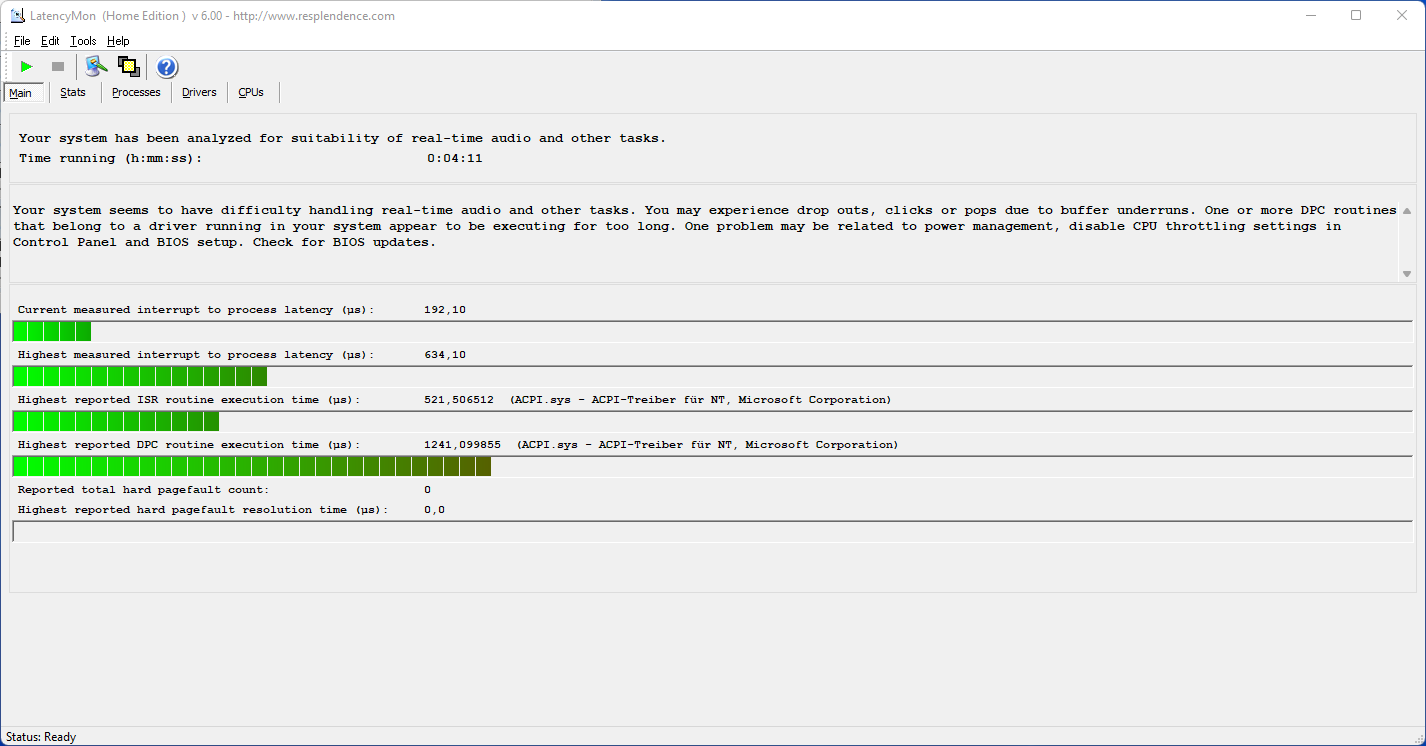
DPC latencies
We could only determine low interruptions in the LatencyMon DPC test with our Latitude 5320. The ACPI drivers of our device were the reason for this. The DPC test states the present driver configuration.
| DPC Latencies / LatencyMon - interrupt to process latency (max), Web, Youtube, Prime95 | |
| Acer TravelMate P4 TMP414-51-59MR | |
| Lenovo ThinkBook 14 G2 ITL 20VDS02G00 | |
| Lenovo ThinkPad L14 G2-20X1003WGE | |
| Dell Latitude 5320-TM4V2 | |
| Lenovo ThinkPad L13 Gen2-21AB000PGE | |
| Lenovo ThinkBook 13s G3 20YA0005GE | |
| Dell XPS 13 9305 Core i5 FHD | |
* ... smaller is better
Storage
The system drive in our review unit is a 256 GB SSD from Kioxia (formerly Toshiba's SSD division), which is connected via the M.2 PCIe 3 interface. The SSD's performance is almost 40% below the competition. This could be the reason for the low rating in PCMark 10.
More benchmarks of this and other SSDs are available in our technology section.

| Drive Performance Rating - Percent | |
| Average of class Subnotebook | |
| Lenovo ThinkPad L14 G2-20X1003WGE | |
| Dell XPS 13 9305 Core i5 FHD | |
| Lenovo ThinkPad L13 Gen2-21AB000PGE | |
| Lenovo ThinkBook 13s G3 20YA0005GE | |
| Lenovo ThinkBook 14 G2 ITL 20VDS02G00 | |
| Acer TravelMate P4 TMP414-51-59MR | |
| Average Toshiba KBG40ZNS256G NVMe | |
| Dell Latitude 5320-TM4V2 | |
* ... smaller is better
Continuous load read: DiskSpd Read Loop, Queue Depth 8
Graphics card
Dell relies on the iGPU for the graphics solution Intel Iris Xe G7 iGPU with 80 EUs. Its performance depends on the installed working memory configuration and the cooling solution effectiveness. The performance is average or just about average in the 3DMark tests.
| 3DMark Performance Rating - Percent | |
| Average of class Subnotebook | |
| Dell XPS 13 9305 Core i5 FHD | |
| Average Intel Iris Xe Graphics G7 80EUs | |
| Lenovo ThinkBook 13s G3 20YA0005GE | |
| Dell Latitude 5320-TM4V2 | |
| Lenovo ThinkPad L13 Gen2-21AB000PGE | |
| Acer TravelMate P4 TMP414-51-59MR | |
| Lenovo ThinkPad L14 G2-20X1003WGE | |
| Lenovo ThinkBook 14 G2 ITL 20VDS02G00 | |
| Dell Latitude 5310-23VP6 -2! | |
| 3DMark 11 - 1280x720 Performance GPU | |
| Average of class Subnotebook (2979 - 16904, n=55, last 2 years) | |
| Lenovo ThinkBook 13s G3 20YA0005GE | |
| Dell XPS 13 9305 Core i5 FHD | |
| Average Intel Iris Xe Graphics G7 80EUs (2246 - 6477, n=105) | |
| Dell Latitude 5320-TM4V2 | |
| Lenovo ThinkPad L13 Gen2-21AB000PGE | |
| Acer TravelMate P4 TMP414-51-59MR | |
| Lenovo ThinkPad L14 G2-20X1003WGE | |
| Lenovo ThinkBook 14 G2 ITL 20VDS02G00 | |
| 3DMark 11 Performance | 5287 points | |
| 3DMark Fire Strike Score | 3013 points | |
| 3DMark Time Spy Score | 1274 points | |
Help | ||
Gaming performance
The Latitude is not a gaming notebook. Playing current AAA titles is largely impossible. If you still want to play games on the device, you can connect an external display and an eGPU via the two Thunderbolt 4 ports. However, the benefits of such a setup are questionable, because the full performance of the built-in graphics card cannot be used at all. The bottleneck would not be Thunderbolt 4, but the low-voltage processor.
In games, the iGPU performs at a very low, but average level for its build. If you want to get a bit more out of it - without using a dGPU - you should look at devices with a Radeon RX Vega 8 such as the Lenovo ThinkBook 13s G3.
The performance of other graphics cards tested by us can be compared in our GPU benchmark list.
| Final Fantasy XV Benchmark - 1280x720 Lite Quality | |
| Average of class Subnotebook (18.9 - 130.6, n=54, last 2 years) | |
| Lenovo ThinkBook 13s G3 20YA0005GE | |
| Dell XPS 13 9305 Core i5 FHD | |
| Average Intel Iris Xe Graphics G7 80EUs (8.32 - 45.6, n=101) | |
| Dell Latitude 5320-TM4V2 | |
| Acer TravelMate P4 TMP414-51-59MR | |
| Lenovo ThinkPad L14 G2-20X1003WGE | |
| Lenovo ThinkBook 14 G2 ITL 20VDS02G00 | |
| Far Cry 5 - 1280x720 Low Preset AA:T | |
| Average of class Subnotebook (22 - 132, n=38, last 2 years) | |
| Average Intel Iris Xe Graphics G7 80EUs (14 - 63, n=48) | |
| Lenovo ThinkPad L13 Gen2-21AB000PGE | |
| Dell Latitude 5320-TM4V2 | |
| God of War - 1920x1080 Low Preset | |
| Average of class Subnotebook (last 2 years) | |
| Average Intel Iris Xe Graphics G7 80EUs (14 - 21.1, n=5) | |
| Dell Latitude 5320-TM4V2 | |
| Strange Brigade - 1920x1080 medium AA:medium AF:4 | |
| Average of class Subnotebook (29.4 - 126.9, n=55, last 2 years) | |
| Dell XPS 13 9305 Core i5 FHD | |
| Average Intel Iris Xe Graphics G7 80EUs (6 - 48.8, n=80) | |
| Lenovo ThinkPad L13 Gen2-21AB000PGE | |
| Dell Latitude 5320-TM4V2 | |
| Acer TravelMate P4 TMP414-51-59MR | |
| Lenovo ThinkBook 14 G2 ITL 20VDS02G00 | |
| Dell Latitude 5310-23VP6 | |
| low | med. | high | ultra | |
| The Witcher 3 (2015) | 54.7 | 36.5 | 13.6 | |
| Final Fantasy XV Benchmark (2018) | 29.2 | 18 | 11.9 | |
| Far Cry 5 (2018) | 30 | 18 | 17 | |
| Strange Brigade (2018) | 62.6 | 25.1 | 20.8 | 17.4 |
| God of War (2022) | 15.7 | 14.6 |
Emissions - Dell's mobile PC is mostly silent
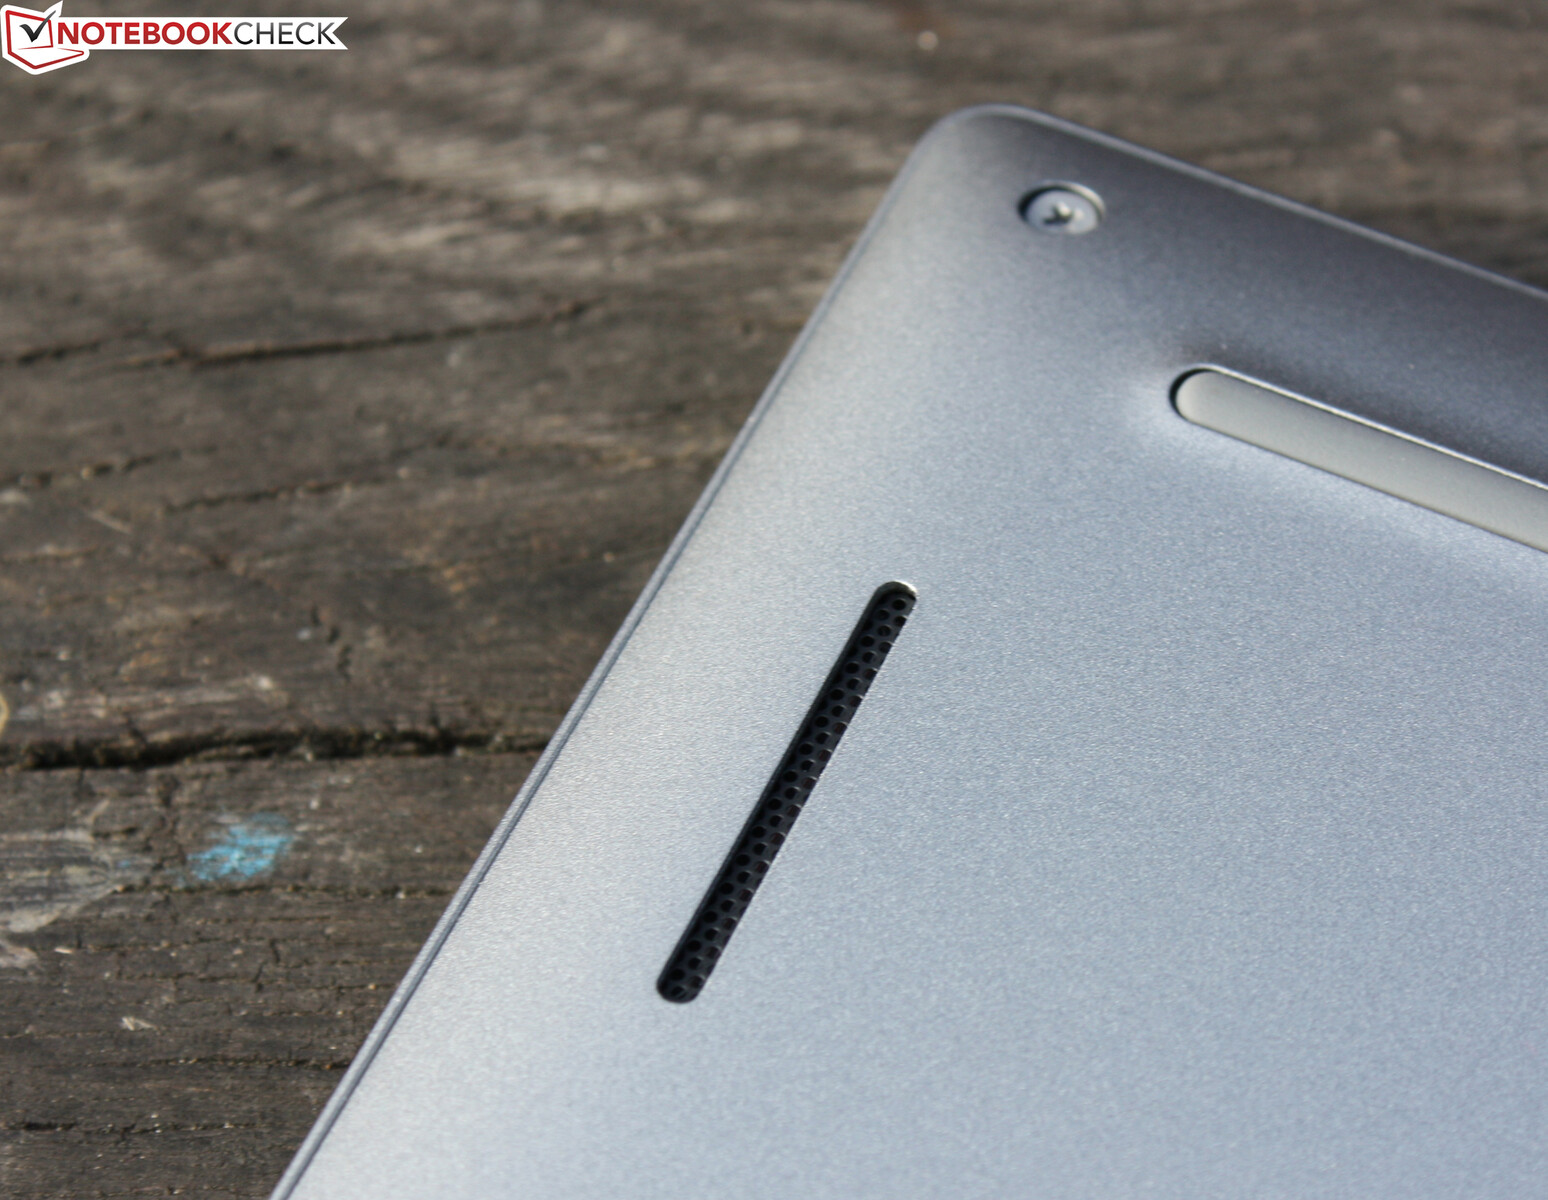
Noise emissions
The fan is often silent during idle and low load. Under load, however, it turns up the volume and we measured an impressive 51 dB(A) at the beginning of the stress test. Dell's Ultra Performance mode plays a role here - without it, the cooling does not turn up as loud. The simple load on the other hand is reasonable at 38 dB(A) in the same Temp mode.
Noise Level
| Idle |
| 26 / 26 / 27.5 dB(A) |
| Load |
| 38 / 51 dB(A) |
 | ||
30 dB silent 40 dB(A) audible 50 dB(A) loud |
||
min: | ||
| Dell Latitude 5320-TM4V2 Iris Xe G7 80EUs, i5-1135G7, Toshiba KBG40ZNS256G NVMe | Lenovo ThinkBook 13s G3 20YA0005GE Vega 8, R7 5800U, WDC PC SN530 SDBPNPZ-512G | Dell XPS 13 9305 Core i5 FHD Iris Xe G7 80EUs, i5-1135G7, Samsung PM9A1 MZVL2512HCJQ | Lenovo ThinkPad L13 Gen2-21AB000PGE Vega 7, R5 PRO 5650U, SK Hynix HFS512 GDE9X081N | Lenovo ThinkBook 14 G2 ITL 20VDS02G00 UHD Graphics Xe G4 48EUs, i3-1115G4, Samsung PM991A MZALQ256HBJD | |
|---|---|---|---|---|---|
| Noise | 1% | 9% | 1% | 5% | |
| off / environment * | 26 | 24.7 5% | 26 -0% | 25 4% | 24.6 5% |
| Idle Minimum * | 26 | 24.7 5% | 26 -0% | 25 4% | 24.6 5% |
| Idle Average * | 26 | 27 -4% | 26 -0% | 25 4% | 24.6 5% |
| Idle Maximum * | 27.5 | 29.8 -8% | 26 5% | 27.8 -1% | 26.7 3% |
| Load Average * | 38 | 42.4 -12% | 33.5 12% | 44.1 -16% | 38.9 -2% |
| Load Maximum * | 51 | 42.4 17% | 33.5 34% | 44.3 13% | 42.8 16% |
| Witcher 3 ultra * | 42.4 | 33.5 |
* ... smaller is better
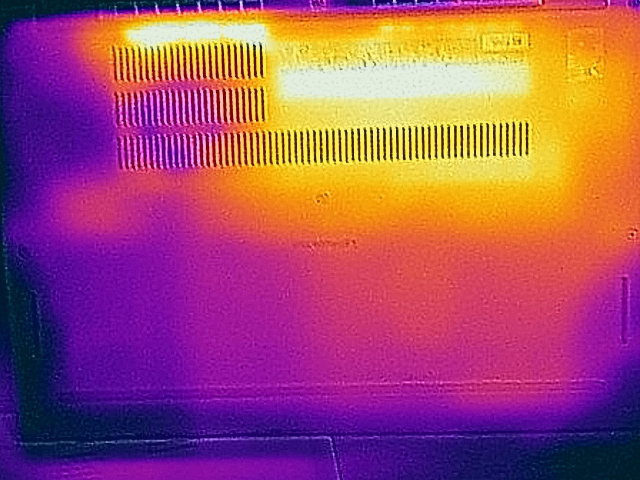
Temperature
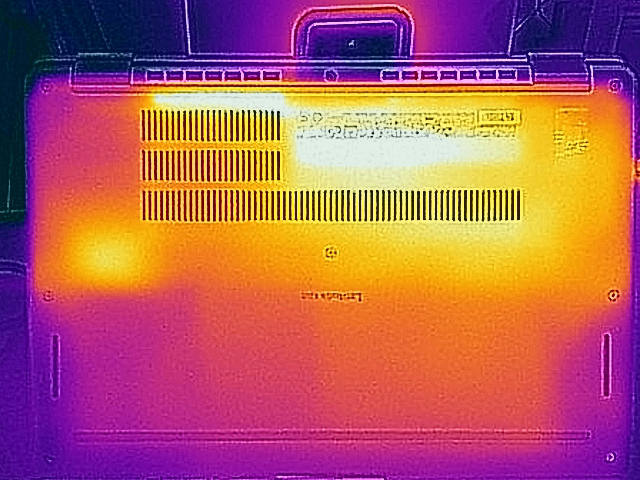
The Latitude does not heat up excessively even in the stress test. Meanwhile, we recorded temperatures of 43 degrees Celsius at some measuring points, but only selectively. In everyday use, the rates are consistently within the green zone, reaching just 35 degrees at some points.
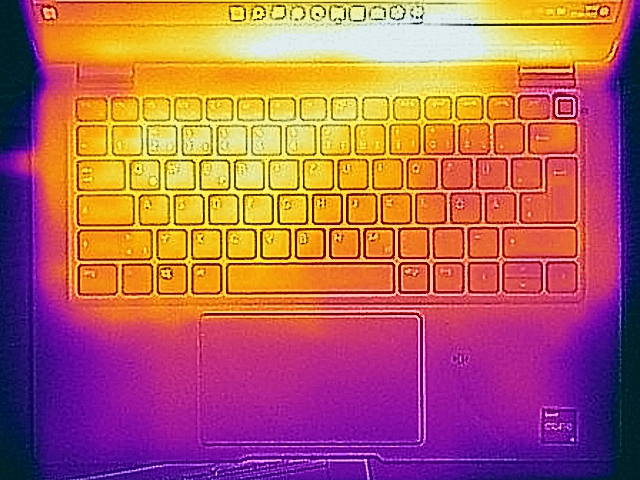
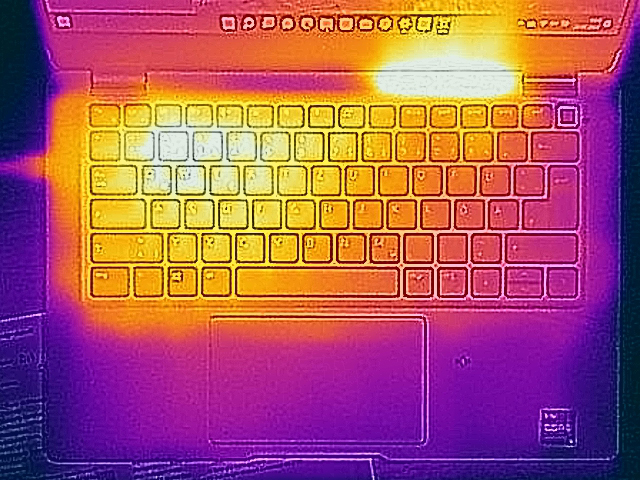
(+) The maximum temperature on the upper side is 38.6 °C / 101 F, compared to the average of 35.9 °C / 97 F, ranging from 21.4 to 59 °C for the class Subnotebook.
(±) The bottom heats up to a maximum of 42.9 °C / 109 F, compared to the average of 39.4 °C / 103 F
(+) In idle usage, the average temperature for the upper side is 28.5 °C / 83 F, compared to the device average of 30.7 °C / 87 F.
(+) The palmrests and touchpad are cooler than skin temperature with a maximum of 25.1 °C / 77.2 F and are therefore cool to the touch.
(+) The average temperature of the palmrest area of similar devices was 28.3 °C / 82.9 F (+3.2 °C / 5.7 F).
| Dell Latitude 5320-TM4V2 Intel Core i5-1135G7, Intel Iris Xe Graphics G7 80EUs | Lenovo ThinkBook 13s G3 20YA0005GE AMD Ryzen 7 5800U, AMD Radeon RX Vega 8 (Ryzen 4000/5000) | Dell XPS 13 9305 Core i5 FHD Intel Core i5-1135G7, Intel Iris Xe Graphics G7 80EUs | Lenovo ThinkPad L13 Gen2-21AB000PGE AMD Ryzen 5 PRO 5650U, AMD Radeon RX Vega 7 | Lenovo ThinkBook 14 G2 ITL 20VDS02G00 Intel Core i3-1115G4, Intel UHD Graphics Xe G4 48EUs | |
|---|---|---|---|---|---|
| Heat | 18% | 8% | -1% | 14% | |
| Maximum Upper Side * | 38.6 | 36.5 5% | 43.5 -13% | 42.7 -11% | 35 9% |
| Maximum Bottom * | 42.9 | 39.6 8% | 44.8 -4% | 44.9 -5% | 38 11% |
| Idle Upper Side * | 35.3 | 24.5 31% | 26.2 26% | 32.6 8% | 28 21% |
| Idle Bottom * | 34.9 | 25 28% | 26.4 24% | 33.9 3% | 30 14% |
* ... smaller is better
Stress test
Our stress test (Prime95 and Furmark run for at least one hour) processes the CPU with 3.1 GHz for a few seconds. Then the speed drops to 1.2 GHz (CPU) and remains at this level. The package power drops from 47 watts to 18 watts for a short time in this test. The stress test is an extreme scenario that does not occur in everyday use. We use this test to check whether the system runs stably even under full load.
Loudspeaker
The stereo speakers have found their place in the front area of the device's underside. They produce a decent, but not very loud sound. The speakers are treble and mid-range-heavy, and lows are neglected. The dual-array microphone next to the webcam delivers very good recordings, regardless of whether the speaker is talking half a meter or two meters in front of the device. A headset can be connected via the 3.5 mm jack combo port.
Dell Latitude 5320-TM4V2 audio analysis
(±) | speaker loudness is average but good (81 dB)
Bass 100 - 315 Hz
(-) | nearly no bass - on average 21.7% lower than median
(±) | linearity of bass is average (14.2% delta to prev. frequency)
Mids 400 - 2000 Hz
(+) | balanced mids - only 3.2% away from median
(+) | mids are linear (5.1% delta to prev. frequency)
Highs 2 - 16 kHz
(±) | higher highs - on average 5.2% higher than median
(+) | highs are linear (5.6% delta to prev. frequency)
Overall 100 - 16.000 Hz
(±) | linearity of overall sound is average (15.6% difference to median)
Compared to same class
» 30% of all tested devices in this class were better, 5% similar, 65% worse
» The best had a delta of 5%, average was 19%, worst was 53%
Compared to all devices tested
» 19% of all tested devices were better, 4% similar, 77% worse
» The best had a delta of 4%, average was 25%, worst was 134%
Lenovo ThinkPad L13 Gen2-21AB000PGE audio analysis
(+) | speakers can play relatively loud (82.4 dB)
Bass 100 - 315 Hz
(-) | nearly no bass - on average 25.6% lower than median
(±) | linearity of bass is average (13.8% delta to prev. frequency)
Mids 400 - 2000 Hz
(+) | balanced mids - only 3.3% away from median
(+) | mids are linear (4.6% delta to prev. frequency)
Highs 2 - 16 kHz
(+) | balanced highs - only 4.1% away from median
(+) | highs are linear (6.5% delta to prev. frequency)
Overall 100 - 16.000 Hz
(±) | linearity of overall sound is average (19% difference to median)
Compared to same class
» 53% of all tested devices in this class were better, 6% similar, 41% worse
» The best had a delta of 5%, average was 19%, worst was 53%
Compared to all devices tested
» 39% of all tested devices were better, 8% similar, 53% worse
» The best had a delta of 4%, average was 25%, worst was 134%
Power management - Business laptop with 10 hours runtime
Energy consumption
There are no conspicuities in terms of energy consumption. We measured the maximum power consumption of 7.8 watts in idle, less than any other model in the test field. During the stress test (Prime95 and Furmark), the value increases up to 67 watts for a few seconds. The rated power of the included USB Type-C power supply is 65 watts.
| Off / Standby | |
| Idle | |
| Load |
|
| Dell Latitude 5320-TM4V2 i5-1135G7, Iris Xe G7 80EUs, Toshiba KBG40ZNS256G NVMe, IPS, 1920x1080, 13.30 | Lenovo ThinkBook 13s G3 20YA0005GE R7 5800U, Vega 8, WDC PC SN530 SDBPNPZ-512G, IPS, 1920x1200, 13.30 | Lenovo ThinkPad L13 Gen2-21AB000PGE R5 PRO 5650U, Vega 7, SK Hynix HFS512 GDE9X081N, IPS, 1920x1080, 13.30 | Lenovo ThinkBook 14 G2 ITL 20VDS02G00 i3-1115G4, UHD Graphics Xe G4 48EUs, Samsung PM991A MZALQ256HBJD, a-Si IPS LED, 1920x1080, 14.00 | Average Intel Iris Xe Graphics G7 80EUs | Average of class Subnotebook | |
|---|---|---|---|---|---|---|
| Power Consumption | -17% | 1% | -30% | -10% | -25% | |
| Idle Minimum * | 3.4 | 5 -47% | 4.4 -29% | 6.3 -85% | 4.46 ? -31% | 4.9 ? -44% |
| Idle Average * | 6 | 8.2 -37% | 7.6 -27% | 9.5 -58% | 7.33 ? -22% | 8.36 ? -39% |
| Idle Maximum * | 7.8 | 9 -15% | 9.5 -22% | 10.4 -33% | 9.25 ? -19% | 10.4 ? -33% |
| Load Average * | 41 | 45 -10% | 33 20% | 32.7 20% | 36.1 ? 12% | 45.9 ? -12% |
| Witcher 3 ultra * | 37.9 | 45.1 -19% | 33.4 12% | |||
| Load Maximum * | 67 | 51.2 24% | 32.5 51% | 63.3 6% | 61.2 ? 9% | 66 ? 1% |
* ... smaller is better
Power consumption Witcher 3 / Stresstest
Power consumption with external monitor
Battery life
The 63 Wh battery runtimes are good. The 13.3-incher finished our WLAN test (opening websites via a script) after ten hours. That is not uncommon for modern notebooks, as the competition shows with two exceptions. Interesting: the predecessor Latitude 5310 lasts one hour longer. However, the real contender in terms of battery life is the Lenovo ThinkPad L13 Gen2 with its eleven hours, which the AMD 13-incher manages with only 46 watt-hours battery.
The ascertained maximum runtime is just over 21 hours. This is not of practical use because the brightness was reduced to a minimum and the wireless modules were disabled (idle, no load).
| Dell Latitude 5320-TM4V2 i5-1135G7, Iris Xe G7 80EUs, 63 Wh | Dell Latitude 5310-23VP6 i5-10310U, UHD Graphics 620, 60 Wh | Lenovo ThinkBook 13s G3 20YA0005GE R7 5800U, Vega 8, 56 Wh | Lenovo ThinkPad L13 Gen2-21AB000PGE R5 PRO 5650U, Vega 7, 46 Wh | Lenovo ThinkPad L14 G2-20X1003WGE i5-1135G7, Iris Xe G7 80EUs, 45 Wh | Lenovo ThinkBook 14 G2 ITL 20VDS02G00 i3-1115G4, UHD Graphics Xe G4 48EUs, 58 Wh | Average of class Subnotebook | |
|---|---|---|---|---|---|---|---|
| Battery Runtime | 10% | 9% | -10% | -31% | -24% | -3% | |
| Reader / Idle | 1275 | 1031 -19% | 793 -38% | 1252 ? -2% | |||
| WiFi v1.3 | 604 | 665 10% | 657 9% | 662 10% | 415 -31% | 454 -25% | 629 ? 4% |
| Load | 131 | 102 -22% | 121 -8% | 115.4 ? -12% | |||
| H.264 | 938 | 526 | 794 ? |
Pros
Cons
Verdict - Dell laptop fluffs the show

Dell's Latitude 5320 scores 84% in the rating. That is a good result, but it cannot keep up with the scores of Lenovo's rivals (86-88%). How can that be, since the runtimes are strong, there is Thunderbolt 4, and the emissions could not be lower?
The Latitude 5320 has a few weak points that should not have been there and that cost the device important points in total
These are the reasons for the downgrade in the rating: First, we were annoyed by the ClickPad without physical keys. There is almost no haptic feedback, which results in a barely perceptible pressure point. We did not enjoy using this touchpad.
Other weak points are the display - compared to the predecessor and the competition - which is weak in almost every respect: color space, brightness, and color reproduction - everything needs improvement. Finally, the RAM is also onboard, a step backward compared to the predecessor Latitude 5310.
Furthermore, the Tiger-Lake processor performs below average, the thermals only allow it a limited performance. Thus, the Intel machine falls even further behind compared to AMD laptops
You get more display and better input devices if you grab the predecessor 5310, which can currently still be found in stores. The processor performance of Comet Lake is only slightly lower, and the runtime is even an hour longer.
You get more runtime and more performance with the ThinkPad L13 Gen2 - but the display is not much better here. If performance and display should be good, then the ThinkBook 13s G3 could be an option: the AMD Ryzen brings significantly more performance to the table.
Price and availability
The review unit Latitude 5320-TM4V2 is currently available for 1,190 Euros at Cyberport. The Latitude 5320-TM4V2 is on the shelves for 1,000 Euros at notebooksbilliger.
Dell Latitude 5320-TM4V2
-
03/11/2022 v7
Sebastian Jentsch


Pricecompare

