Asus Zenbook S 13 OLED laptop review: Subnotebook impresses with fast AMD Ryzen 7 6800U
The new Asus Zenbook S 13 is an ultra-mobile notebook that weighs just 1 kilogram and offers the latest technology currently available. In addition to the 2.8K OLED screen (13.3 inches), customers get the latest mobile chip from AMD, the Ryzen 7 6800U, which also includes the fast Radeon 680M integrated graphics card. Alternatively, models with Intel's latest Alder Lake chips are also available. Here we are dealing with a traditional laptop, but those who prefer a convertible should take a look at the Zenbook S 13 Flip.
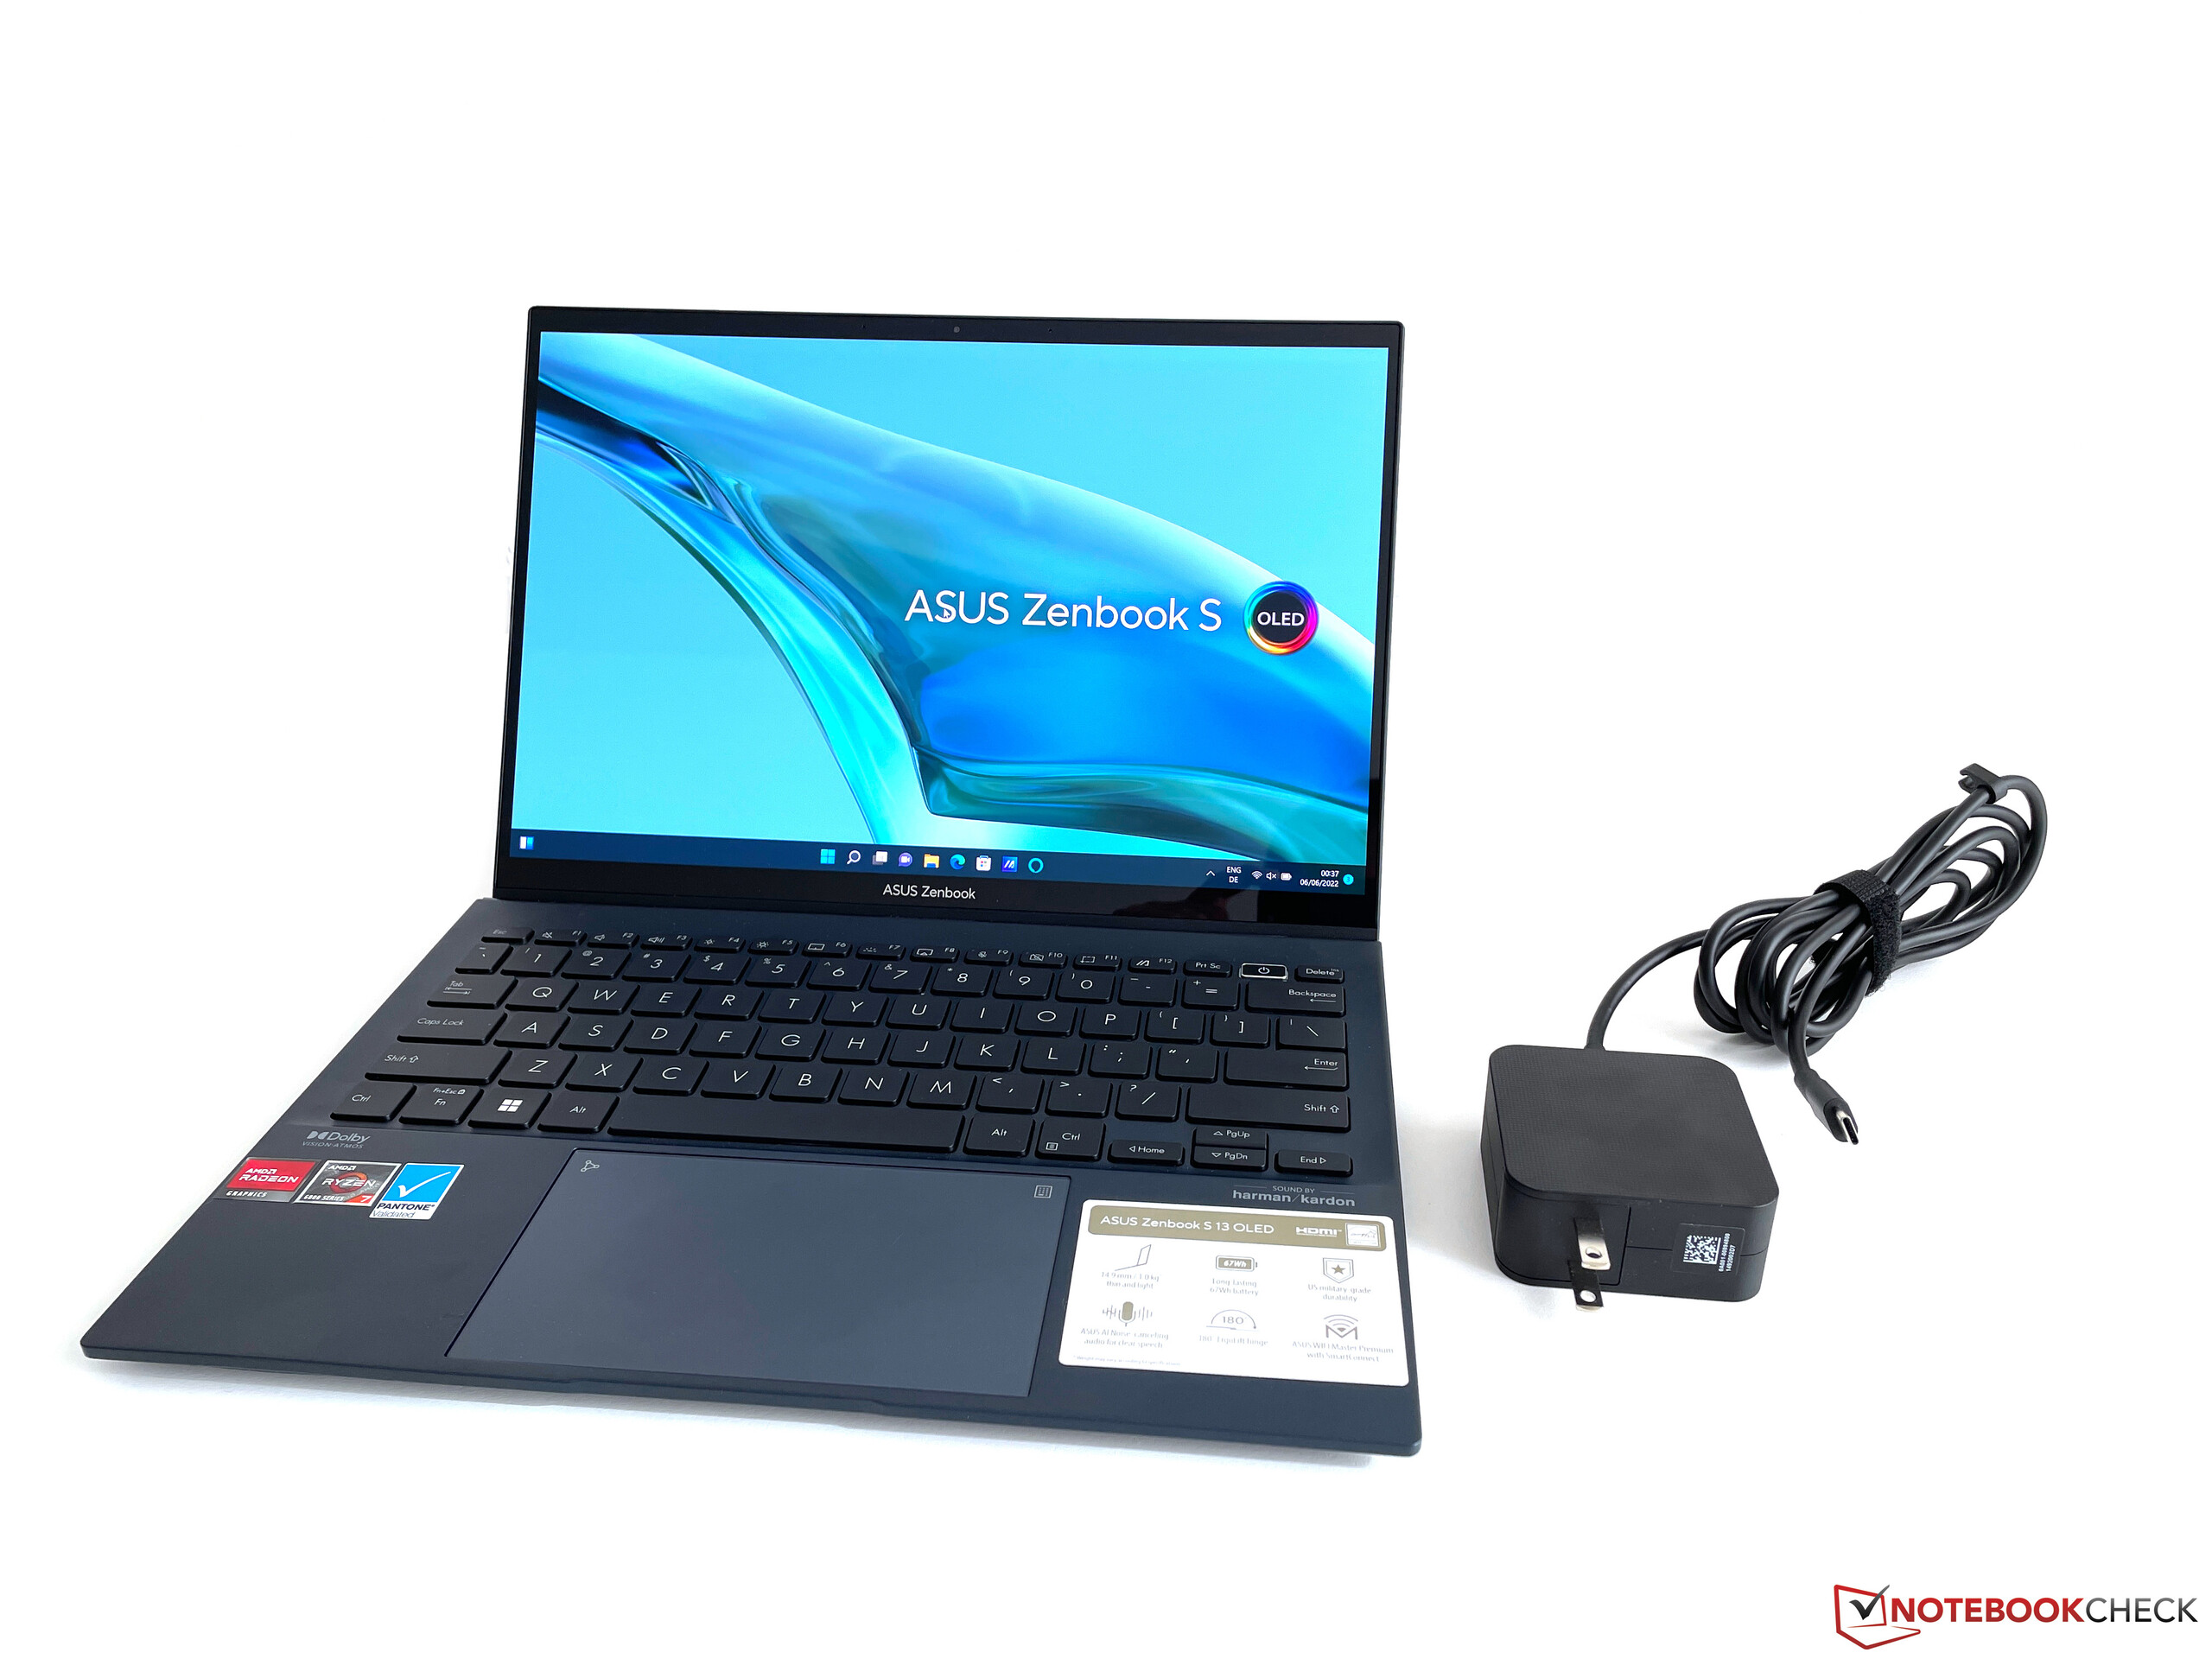
Our review unit is equipped with the new AMD Ryzen 7 6800U, fast Radeon 680M graphics, 16 GB of RAM, a 1 TB PCIe 4.0 SSD and a 2.8K OLED screen. At the time of writing, the Zenbook S 13 is not available in stores yet, but pricing is predicted to fall between US$ 1000 - 1500.
Possible Competitors in Comparison
Rating | Date | Model | Weight | Height | Size | Resolution | Price |
|---|---|---|---|---|---|---|---|
| 90.1 % v7 (old) | 07 / 2022 | Asus Zenbook S 13 OLED R7 6800U, Radeon 680M | 1.1 kg | 14.9 mm | 13.30" | 2880x1800 | |
| 91.1 % v7 (old) | 12 / 2020 | Apple MacBook Air 2020 M1 Entry M1, M1 7-Core GPU | 1.3 kg | 16.1 mm | 13.30" | 2560x1600 | |
| 88.3 % v7 (old) | 05 / 2021 | Dell XPS 13 9310 OLED i7-1185G7, Iris Xe G7 96EUs | 1.2 kg | 14.8 mm | 13.40" | 3456x2160 | |
| 86.7 % v7 (old) | 05 / 2022 | Samsung Galaxy Book2 Pro 13 NP930XED-KA1DE i5-1240P, Iris Xe G7 80EUs | 885 g | 11 mm | 13.30" | 1920x1080 | |
| 88.8 % v7 (old) | 02 / 2022 | Huawei MateBook 13s i5 11300H i5-11300H, Iris Xe G7 80EUs | 1.3 kg | 16.5 mm | 13.40" | 2520x1680 |
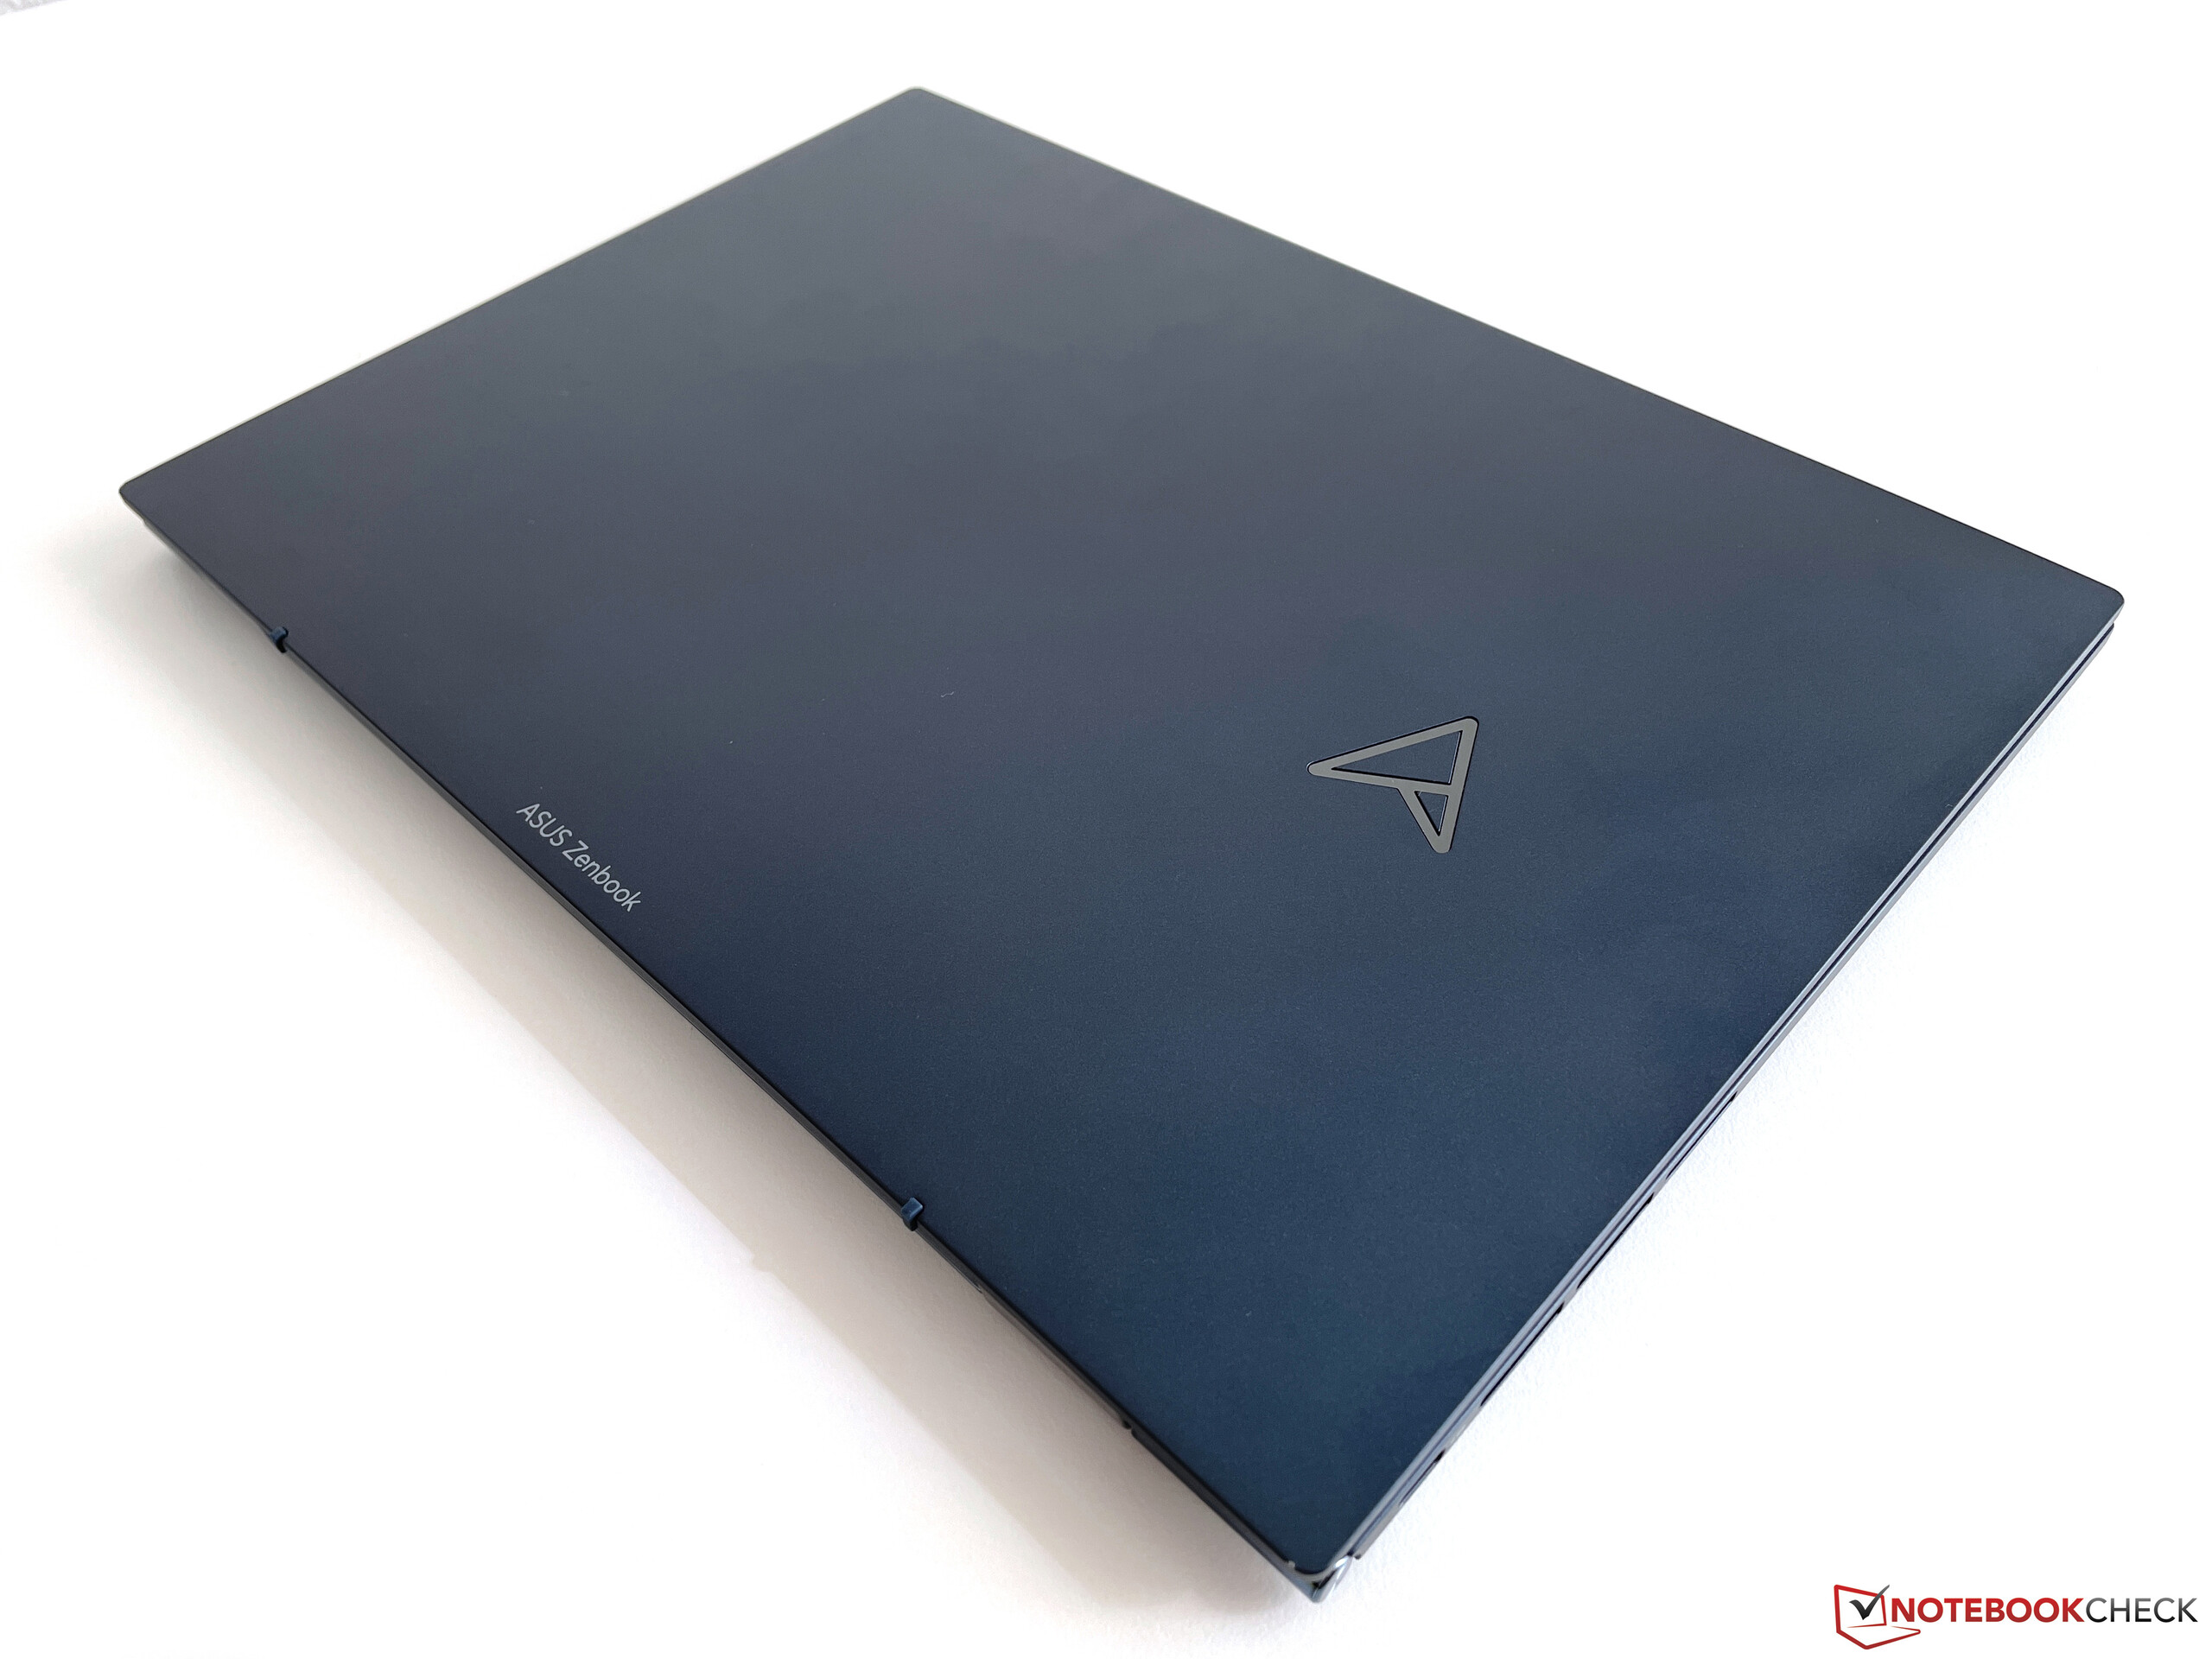
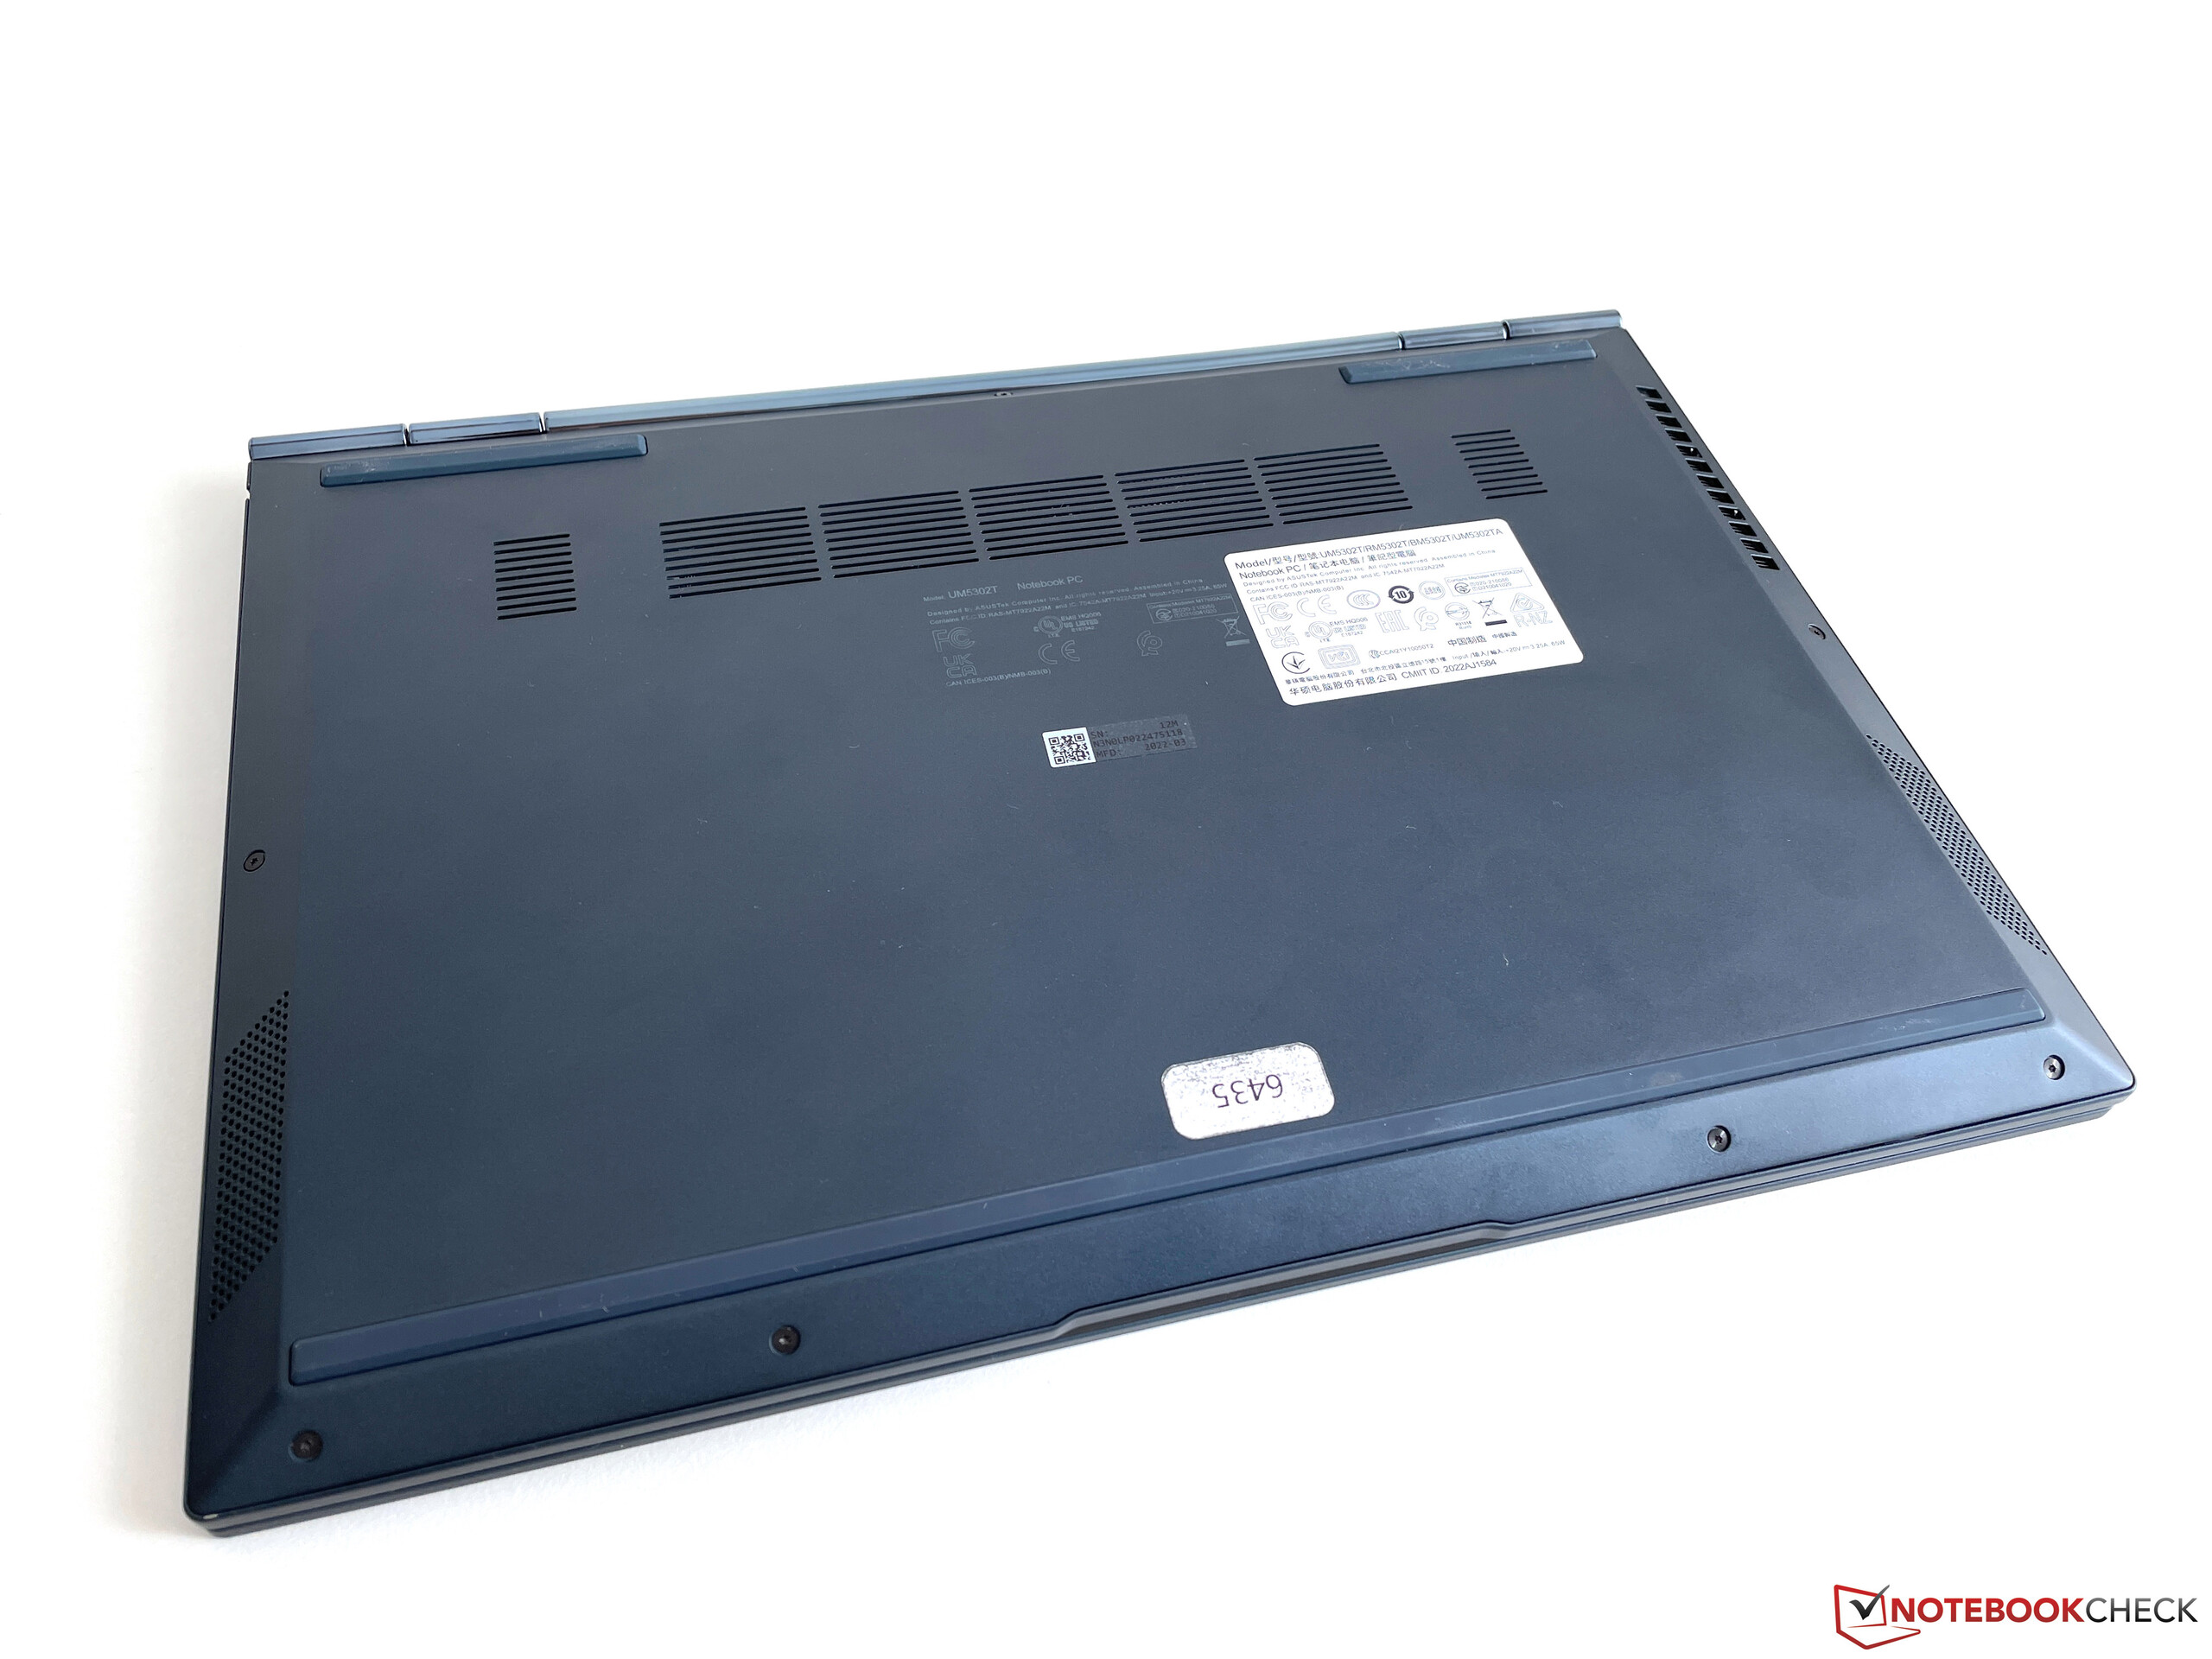
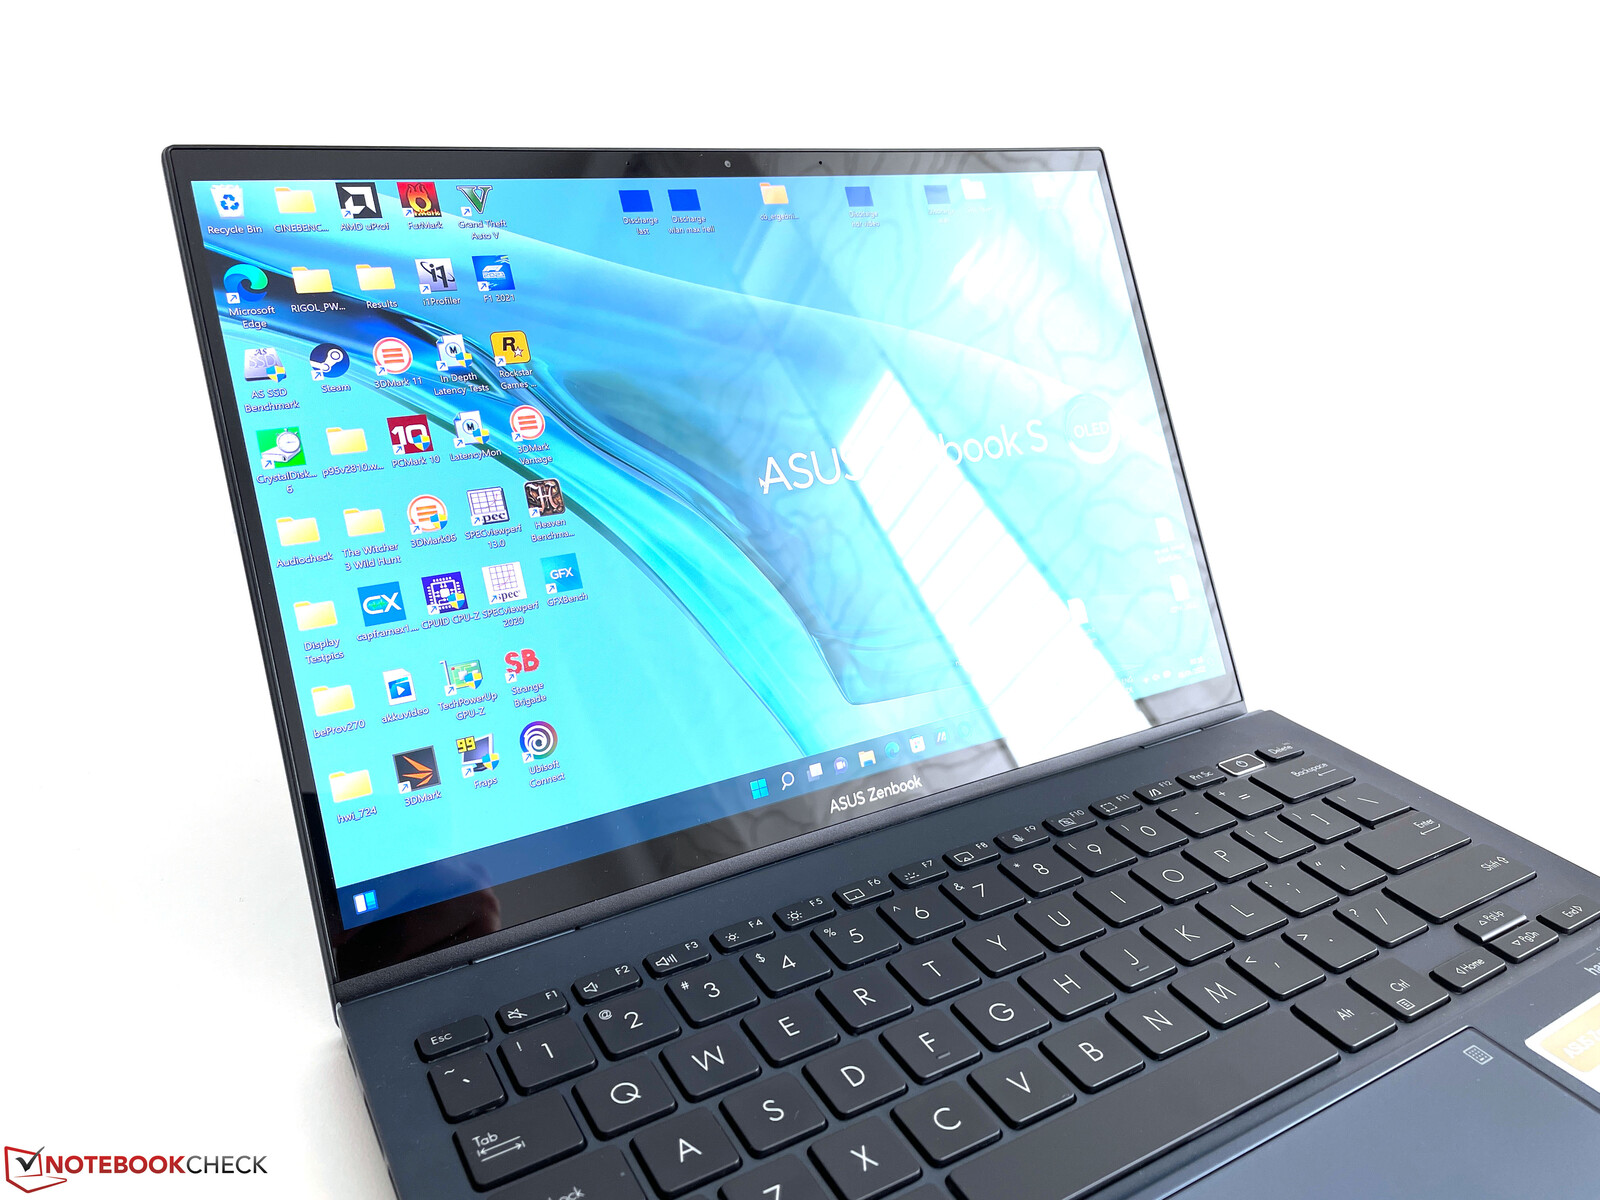
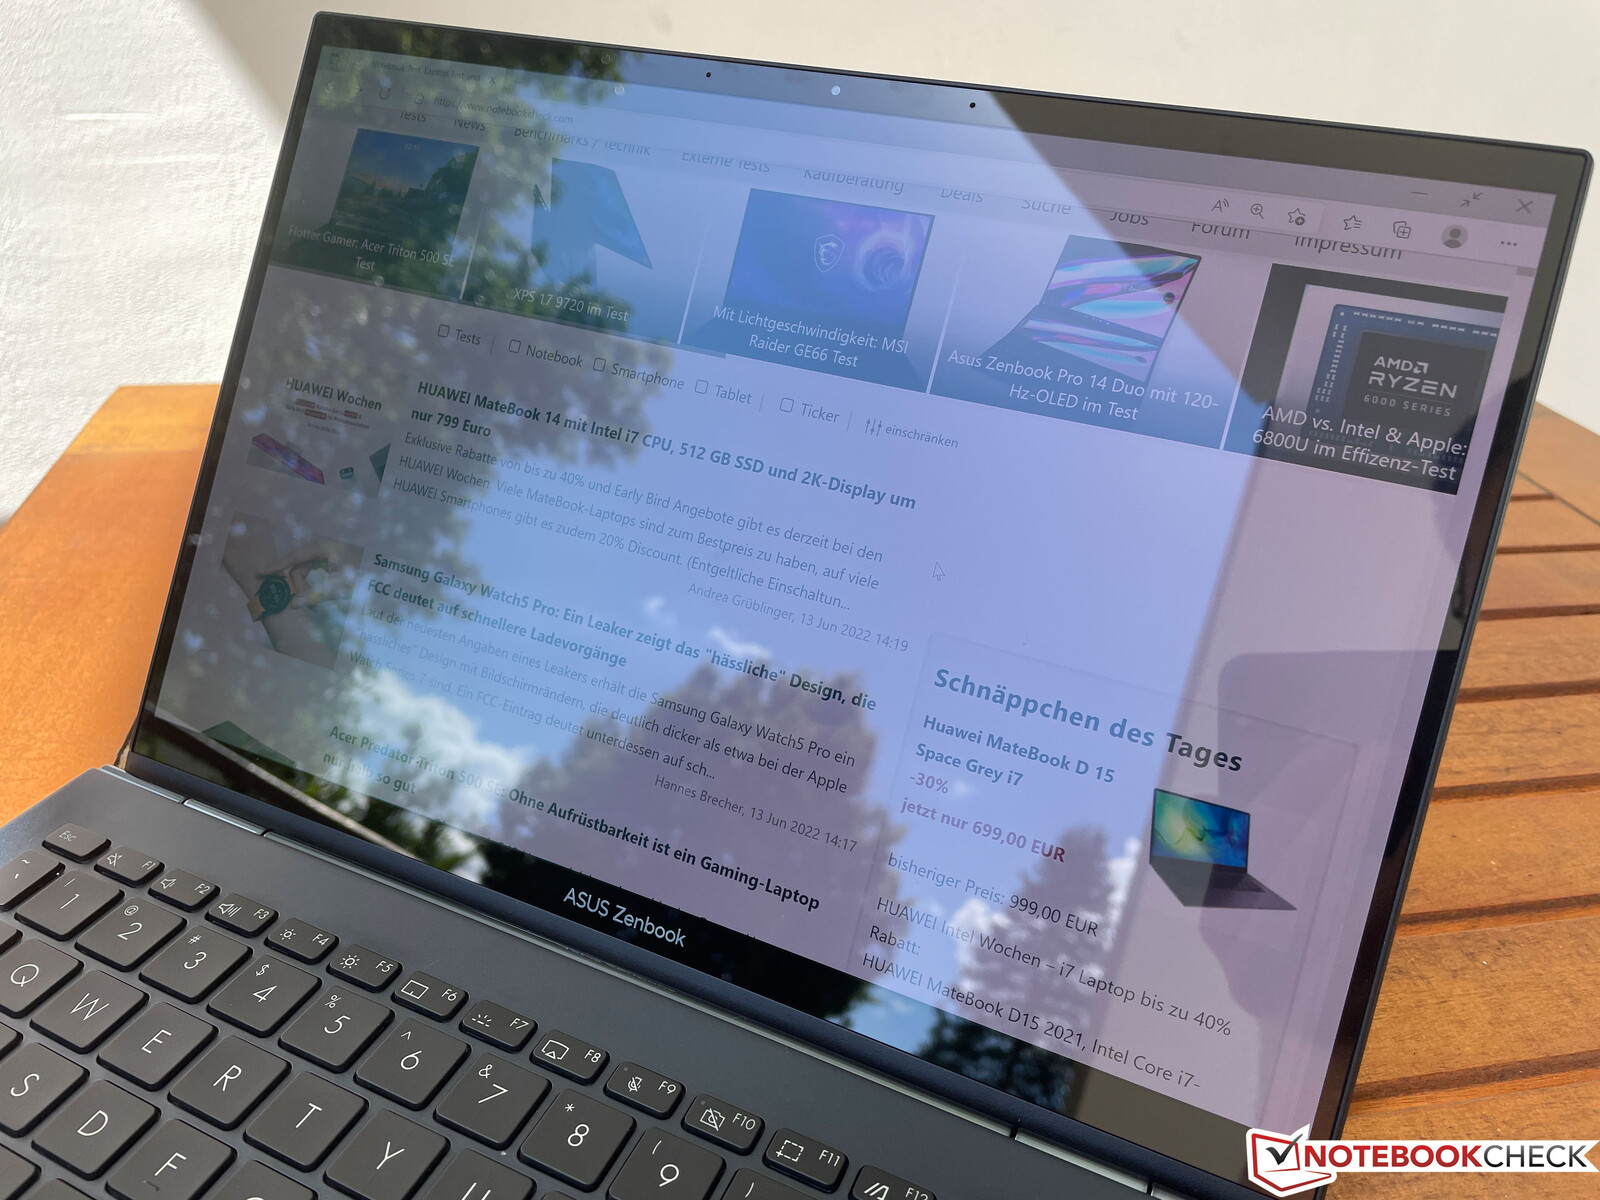
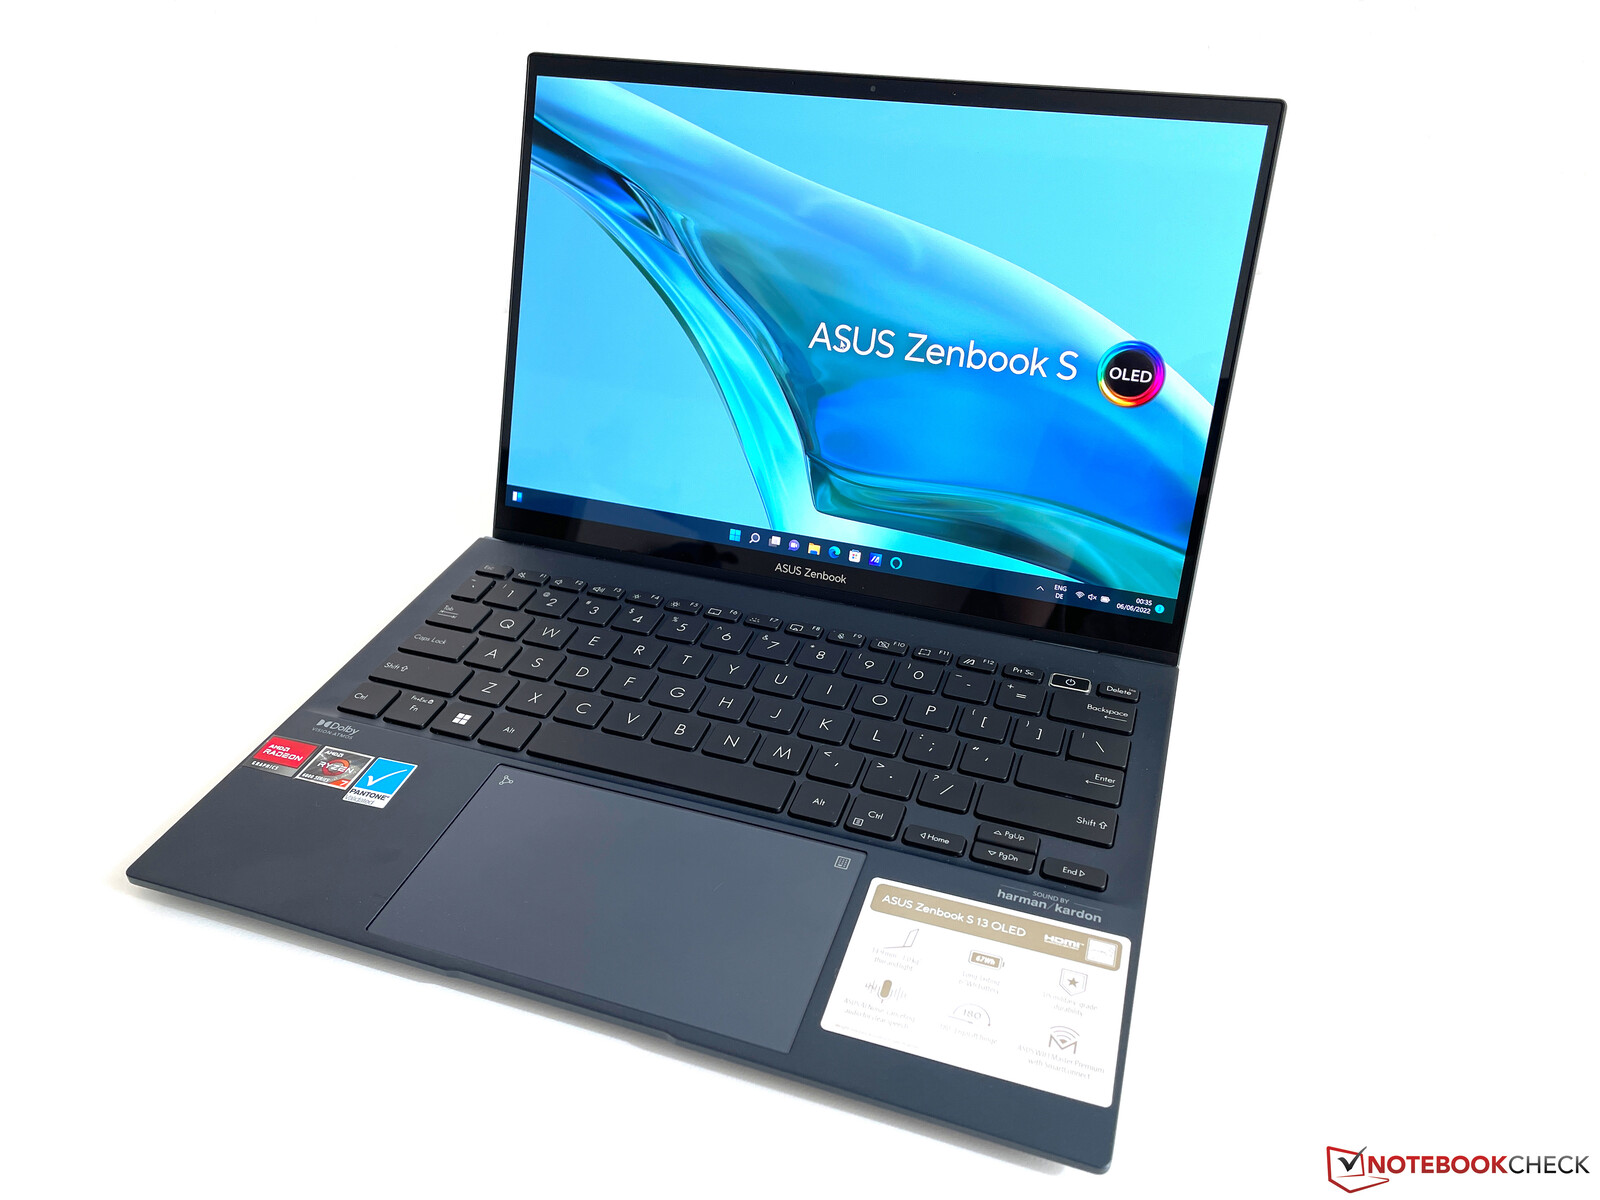
Case: Asus offers metal cases in four colors
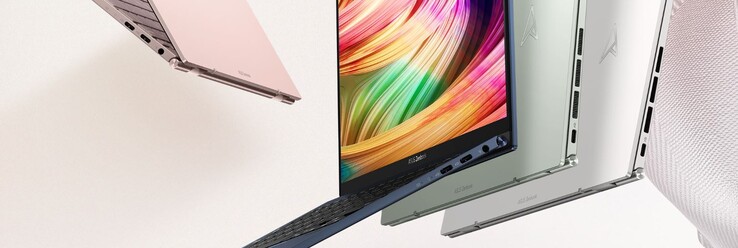
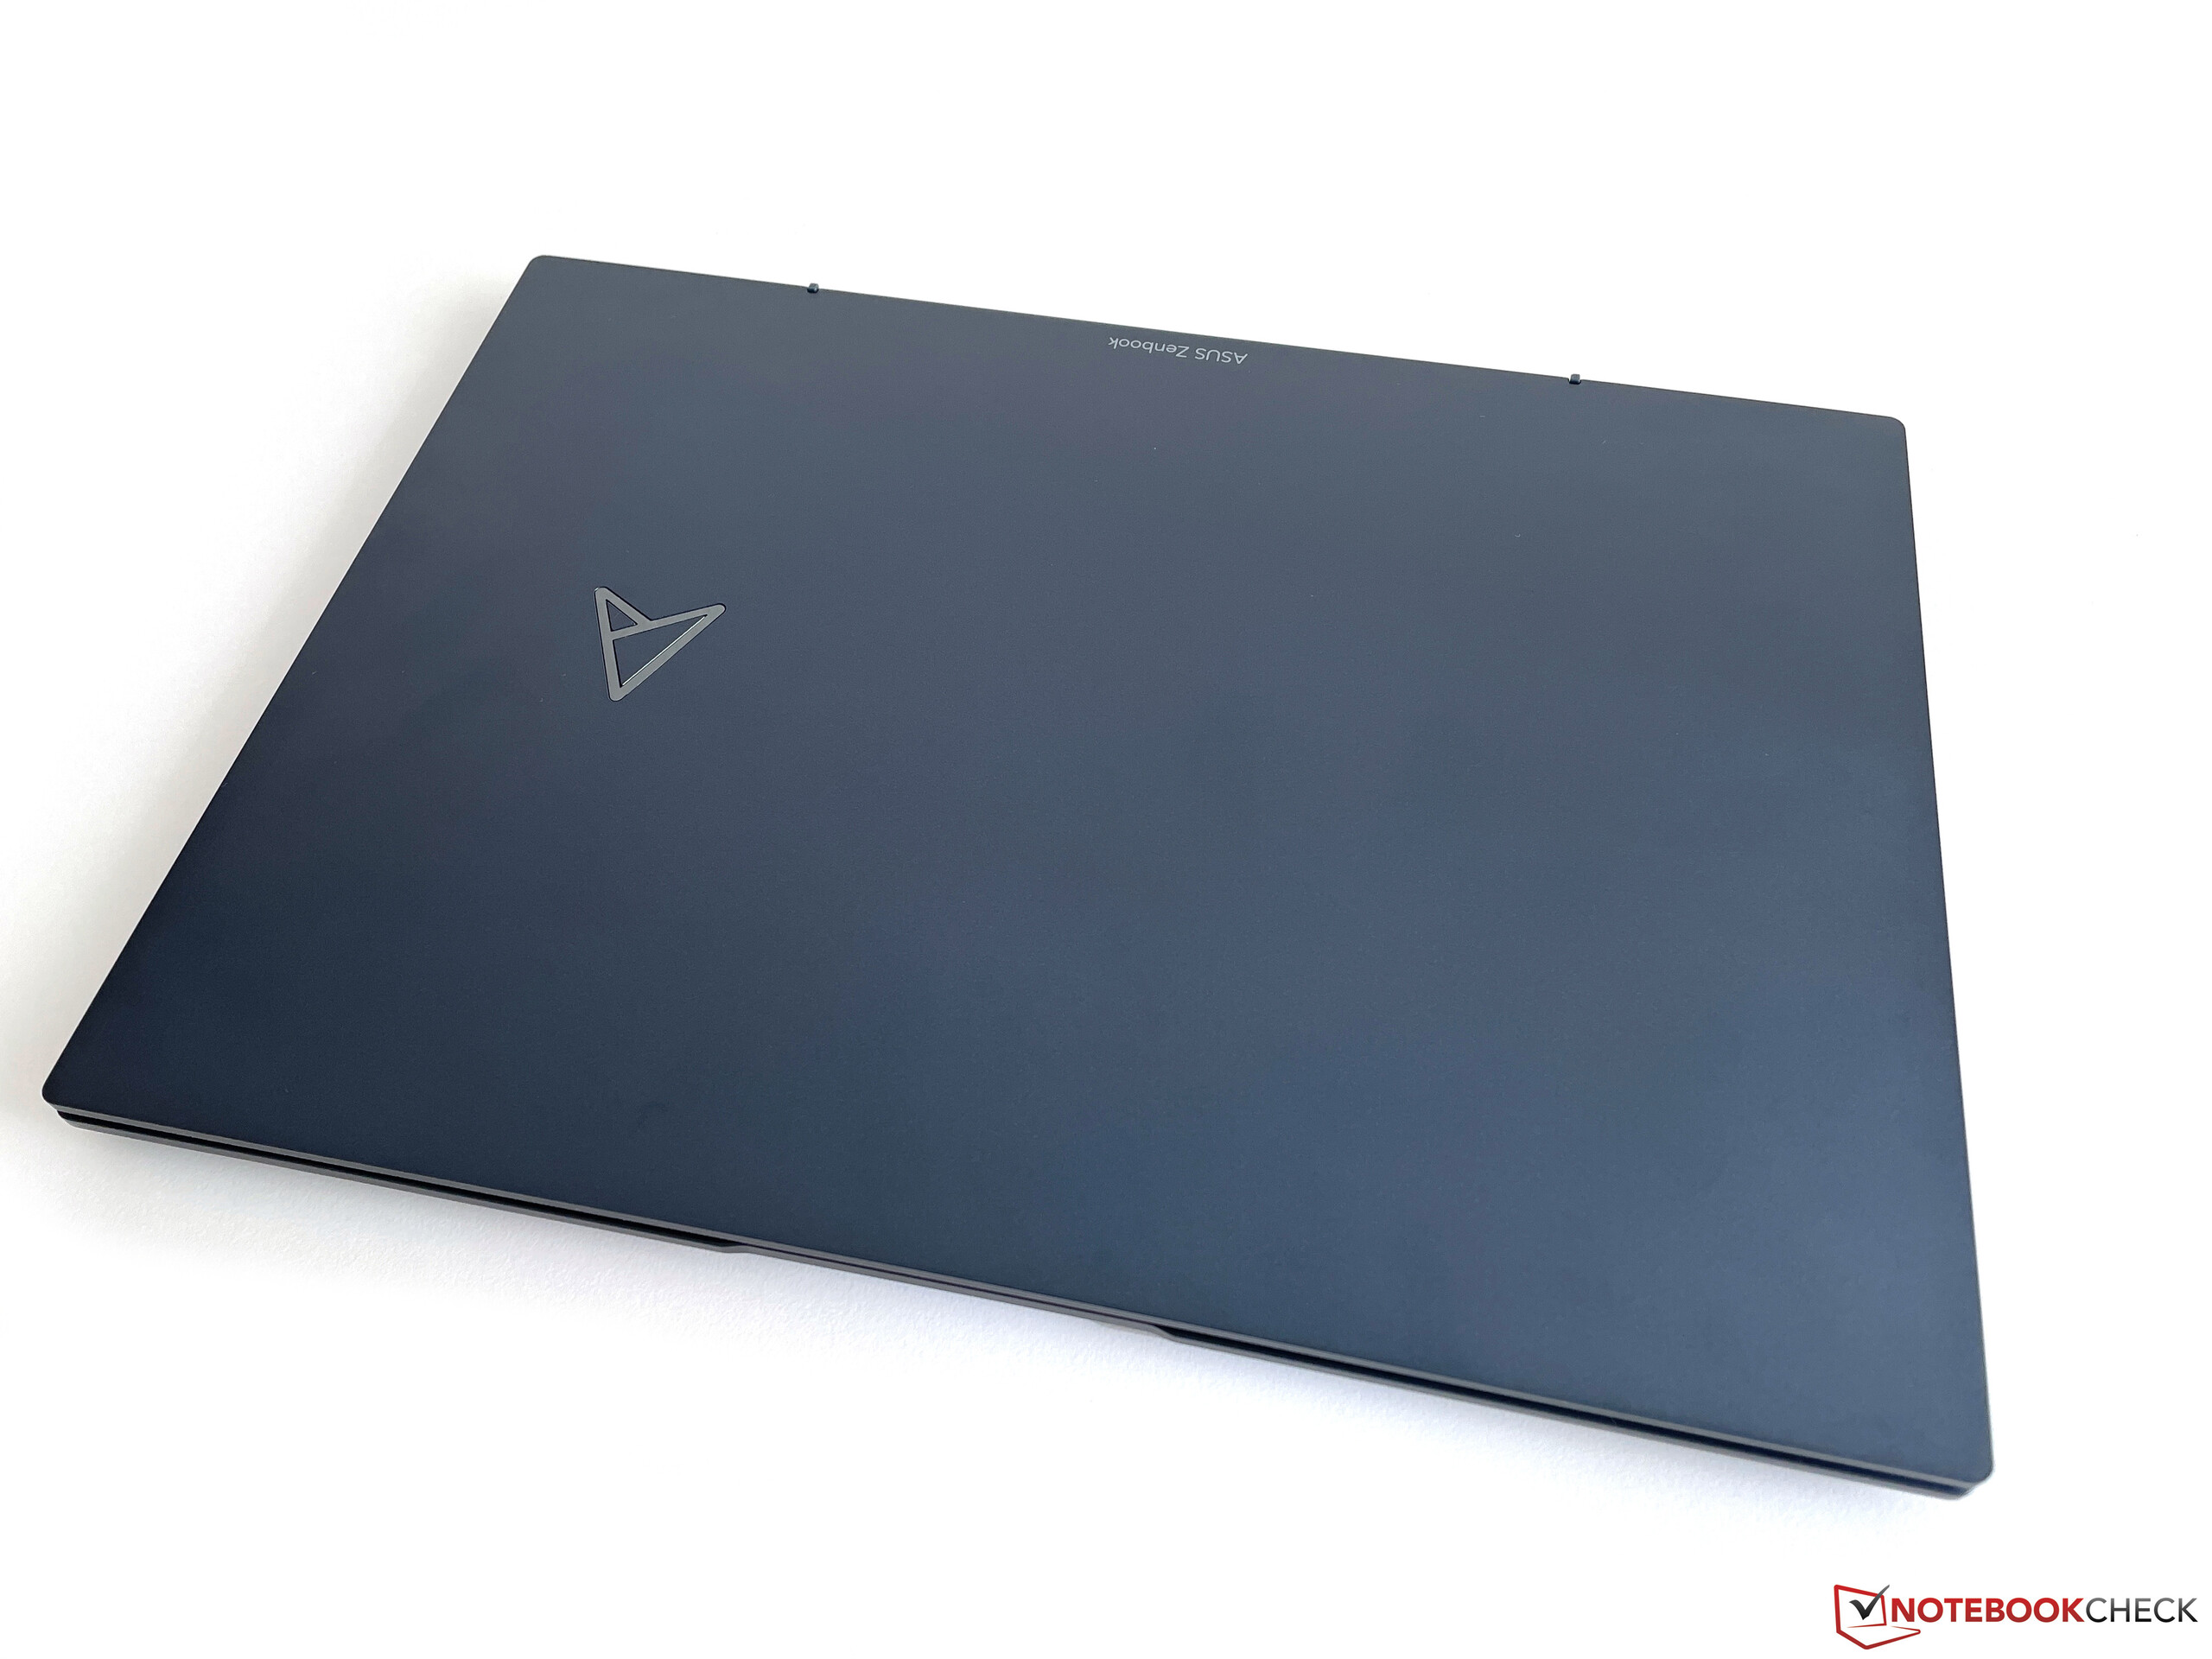
Asus makes use of magnesium-aluminum alloy for the case and the Zenbook comes across as very high-quality. It is also extremely compact and mobile with a weight of just over one kilogram. Our review unit comes in the Ponder Blue color variant and looks very elegant, and the slightly roughened surfaces also feel good. However, the surfaces are also quite fingerprint sensitive. Asus offers other optional color variants, the keyboards of which also change color. In addition to white, the Zenbook S13 is also available in light green and beige.
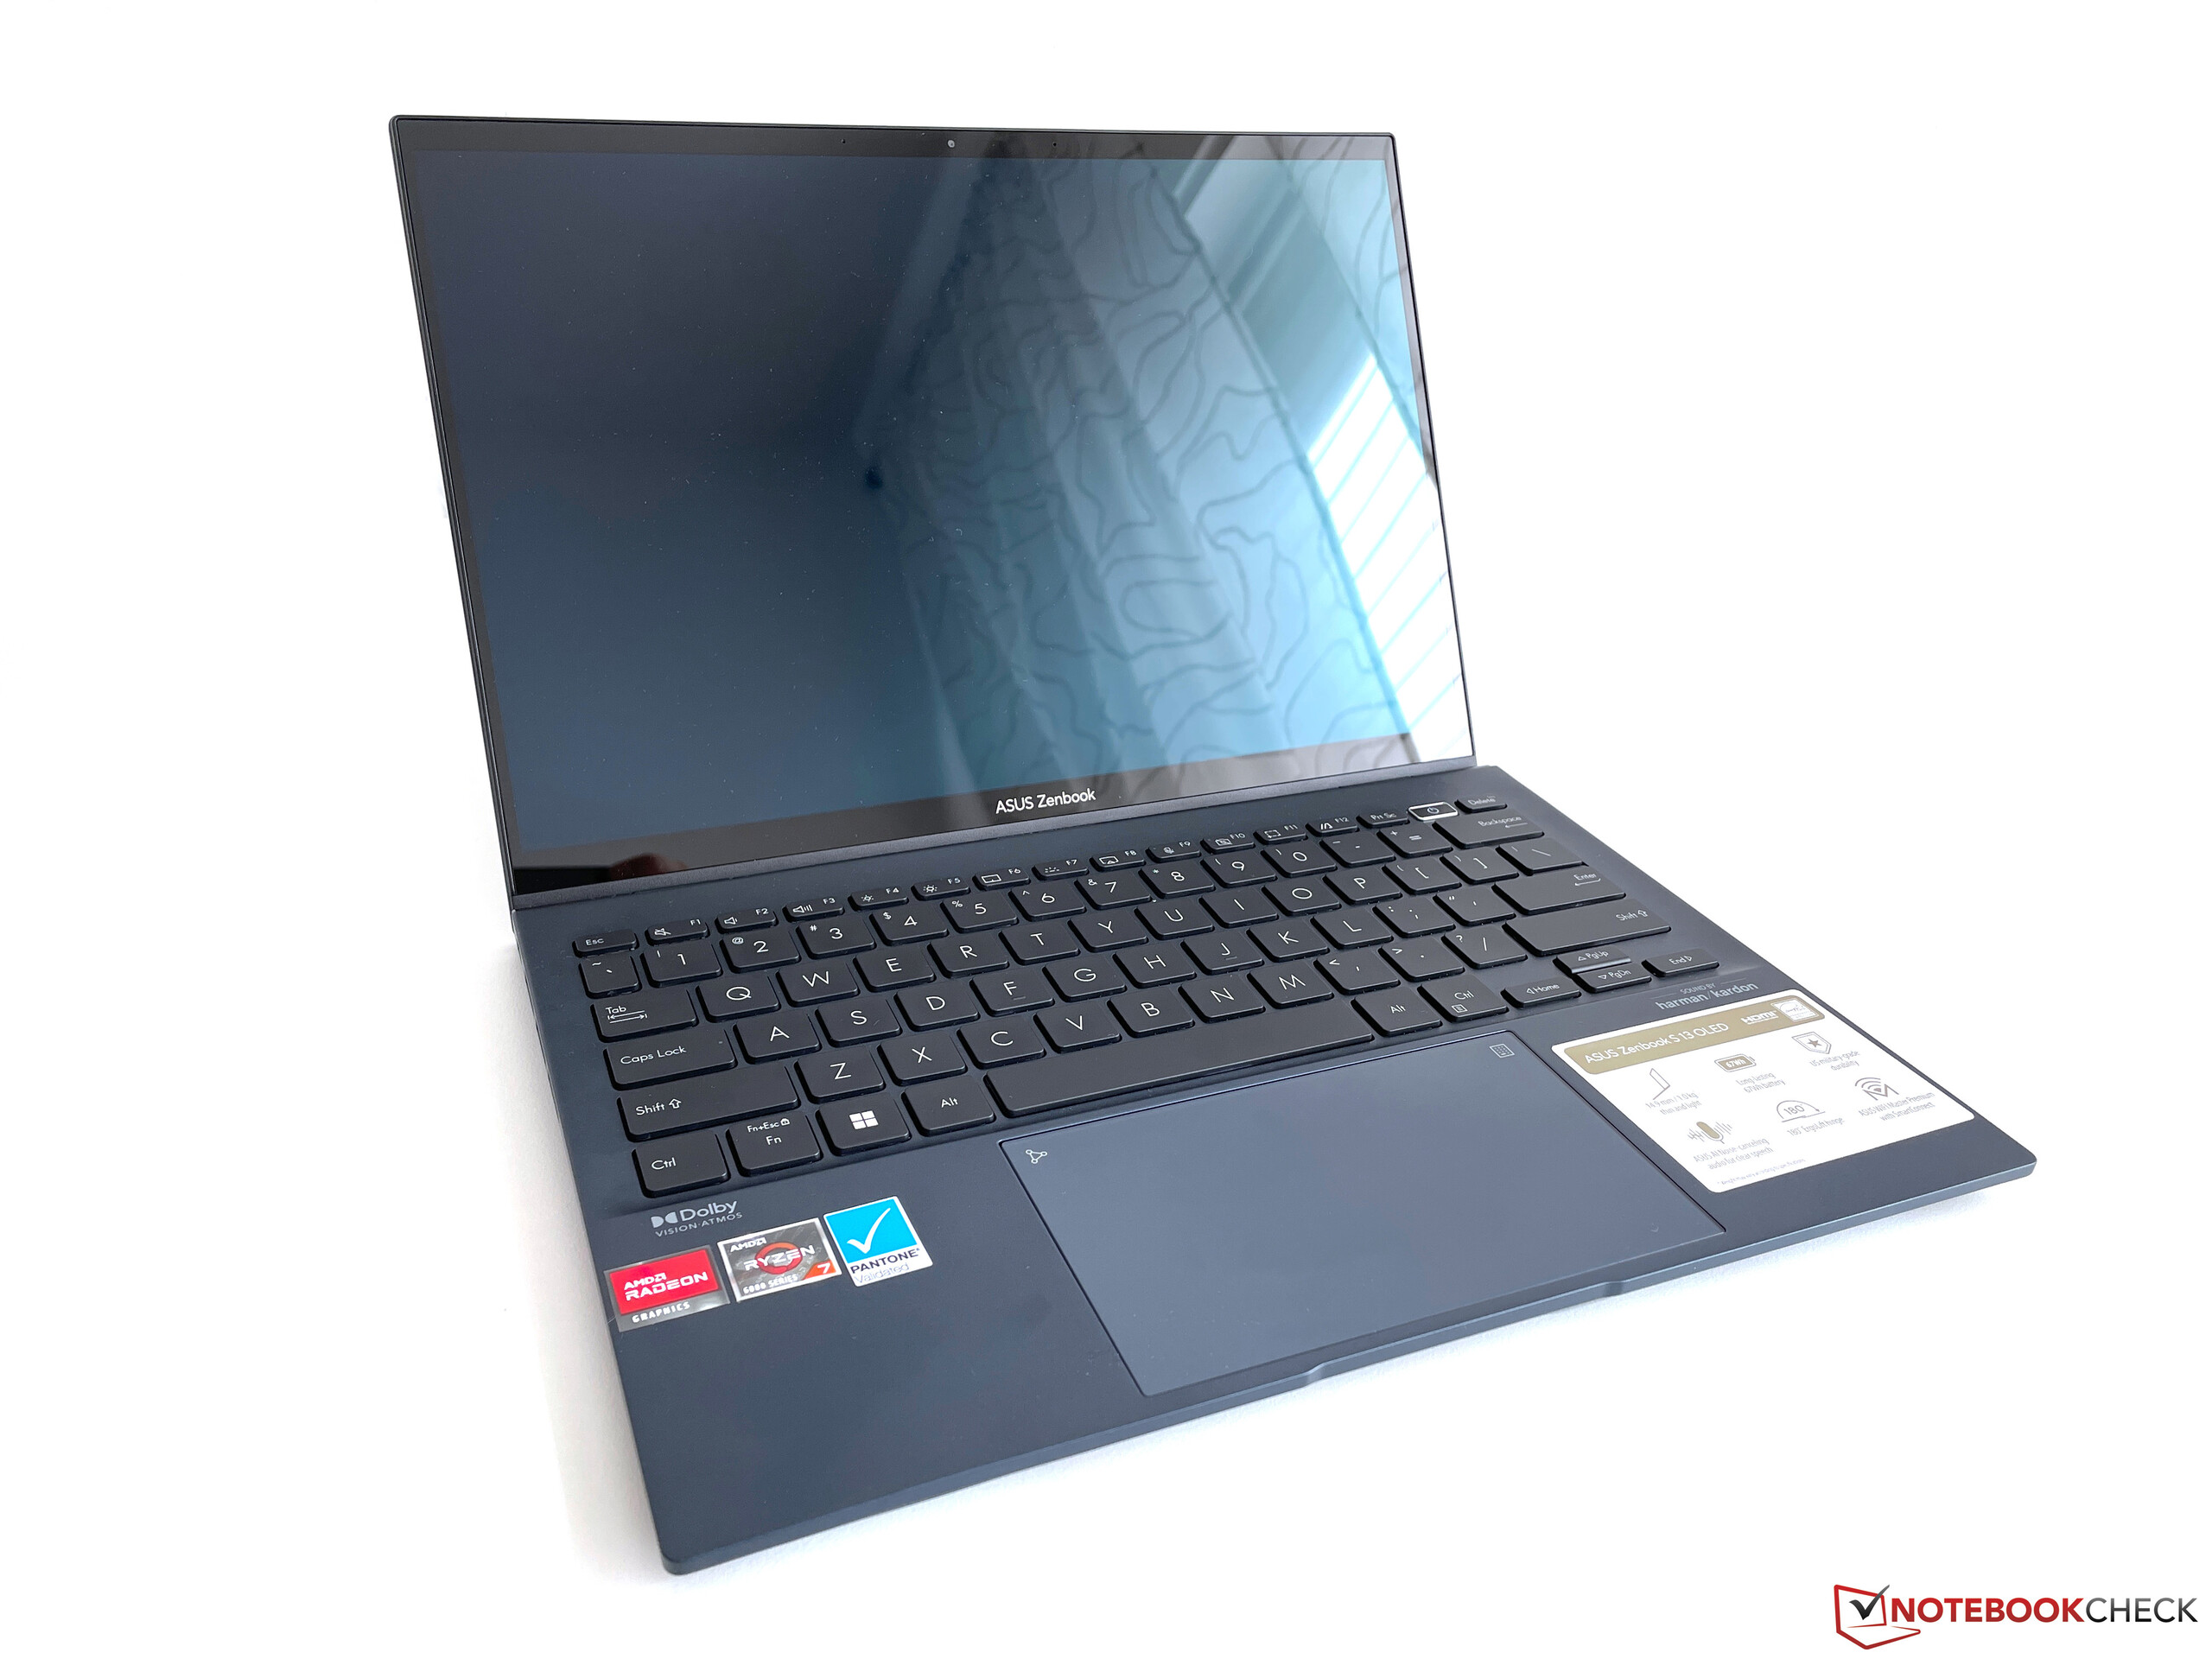
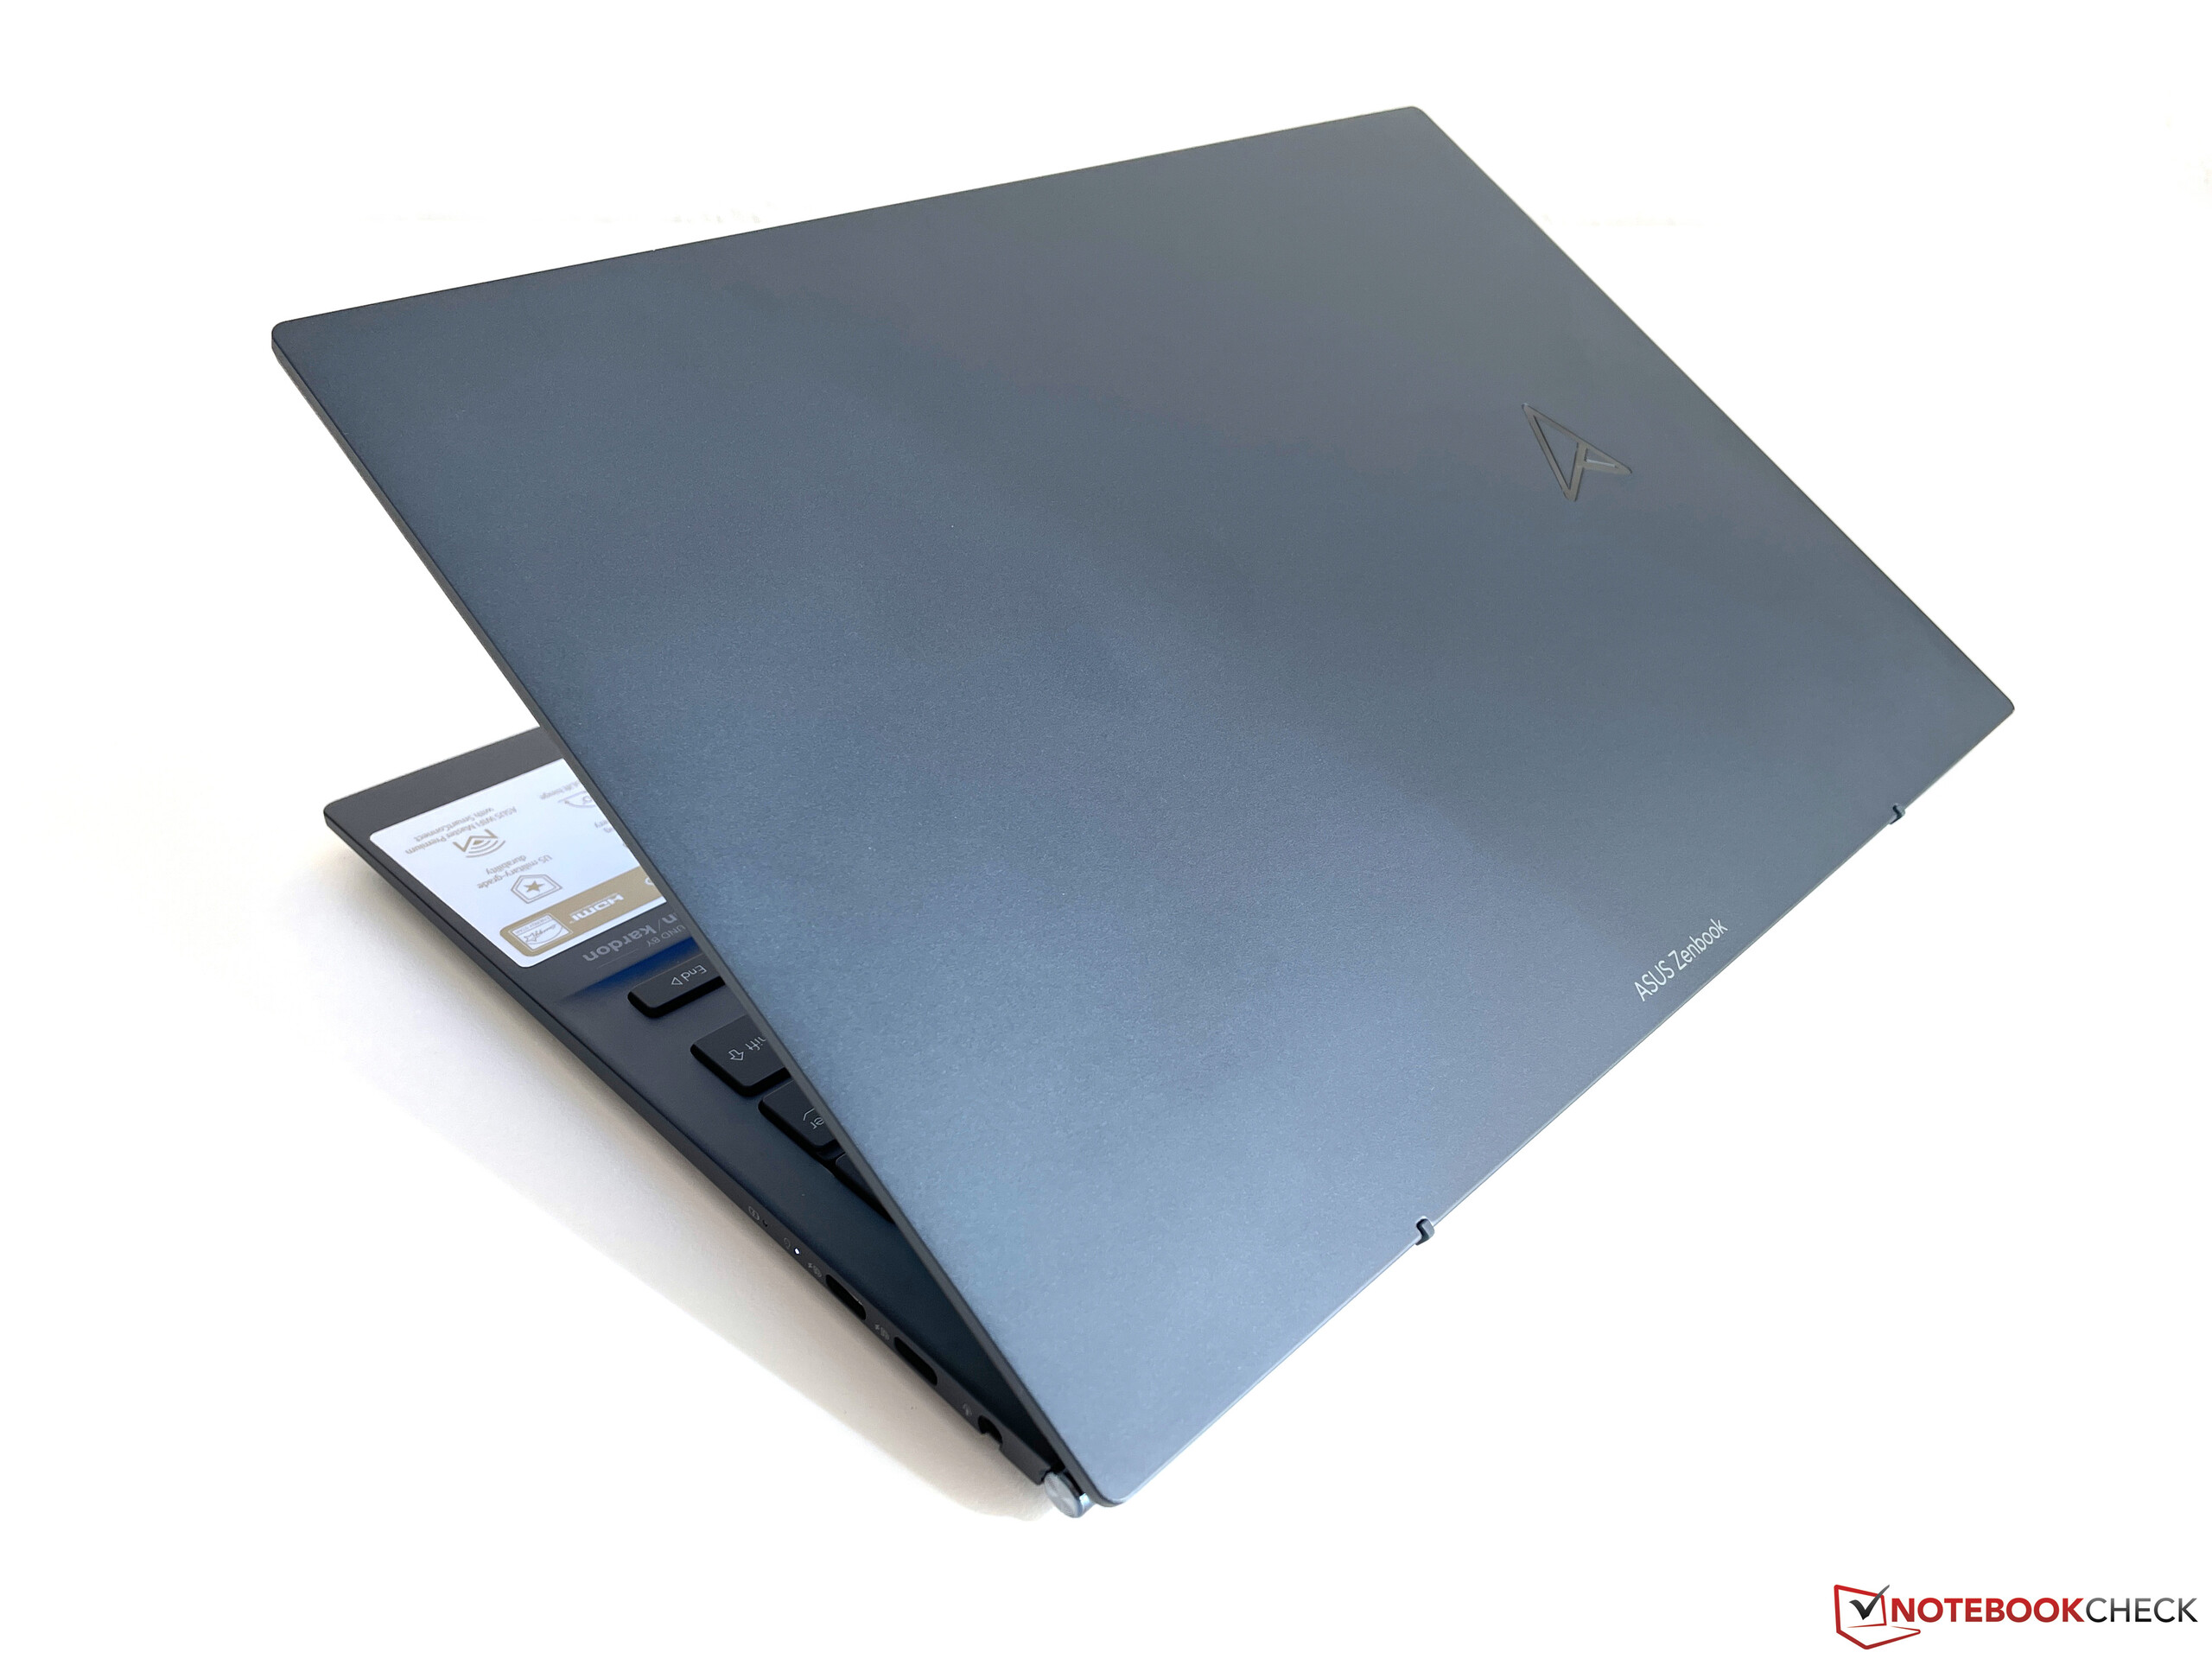
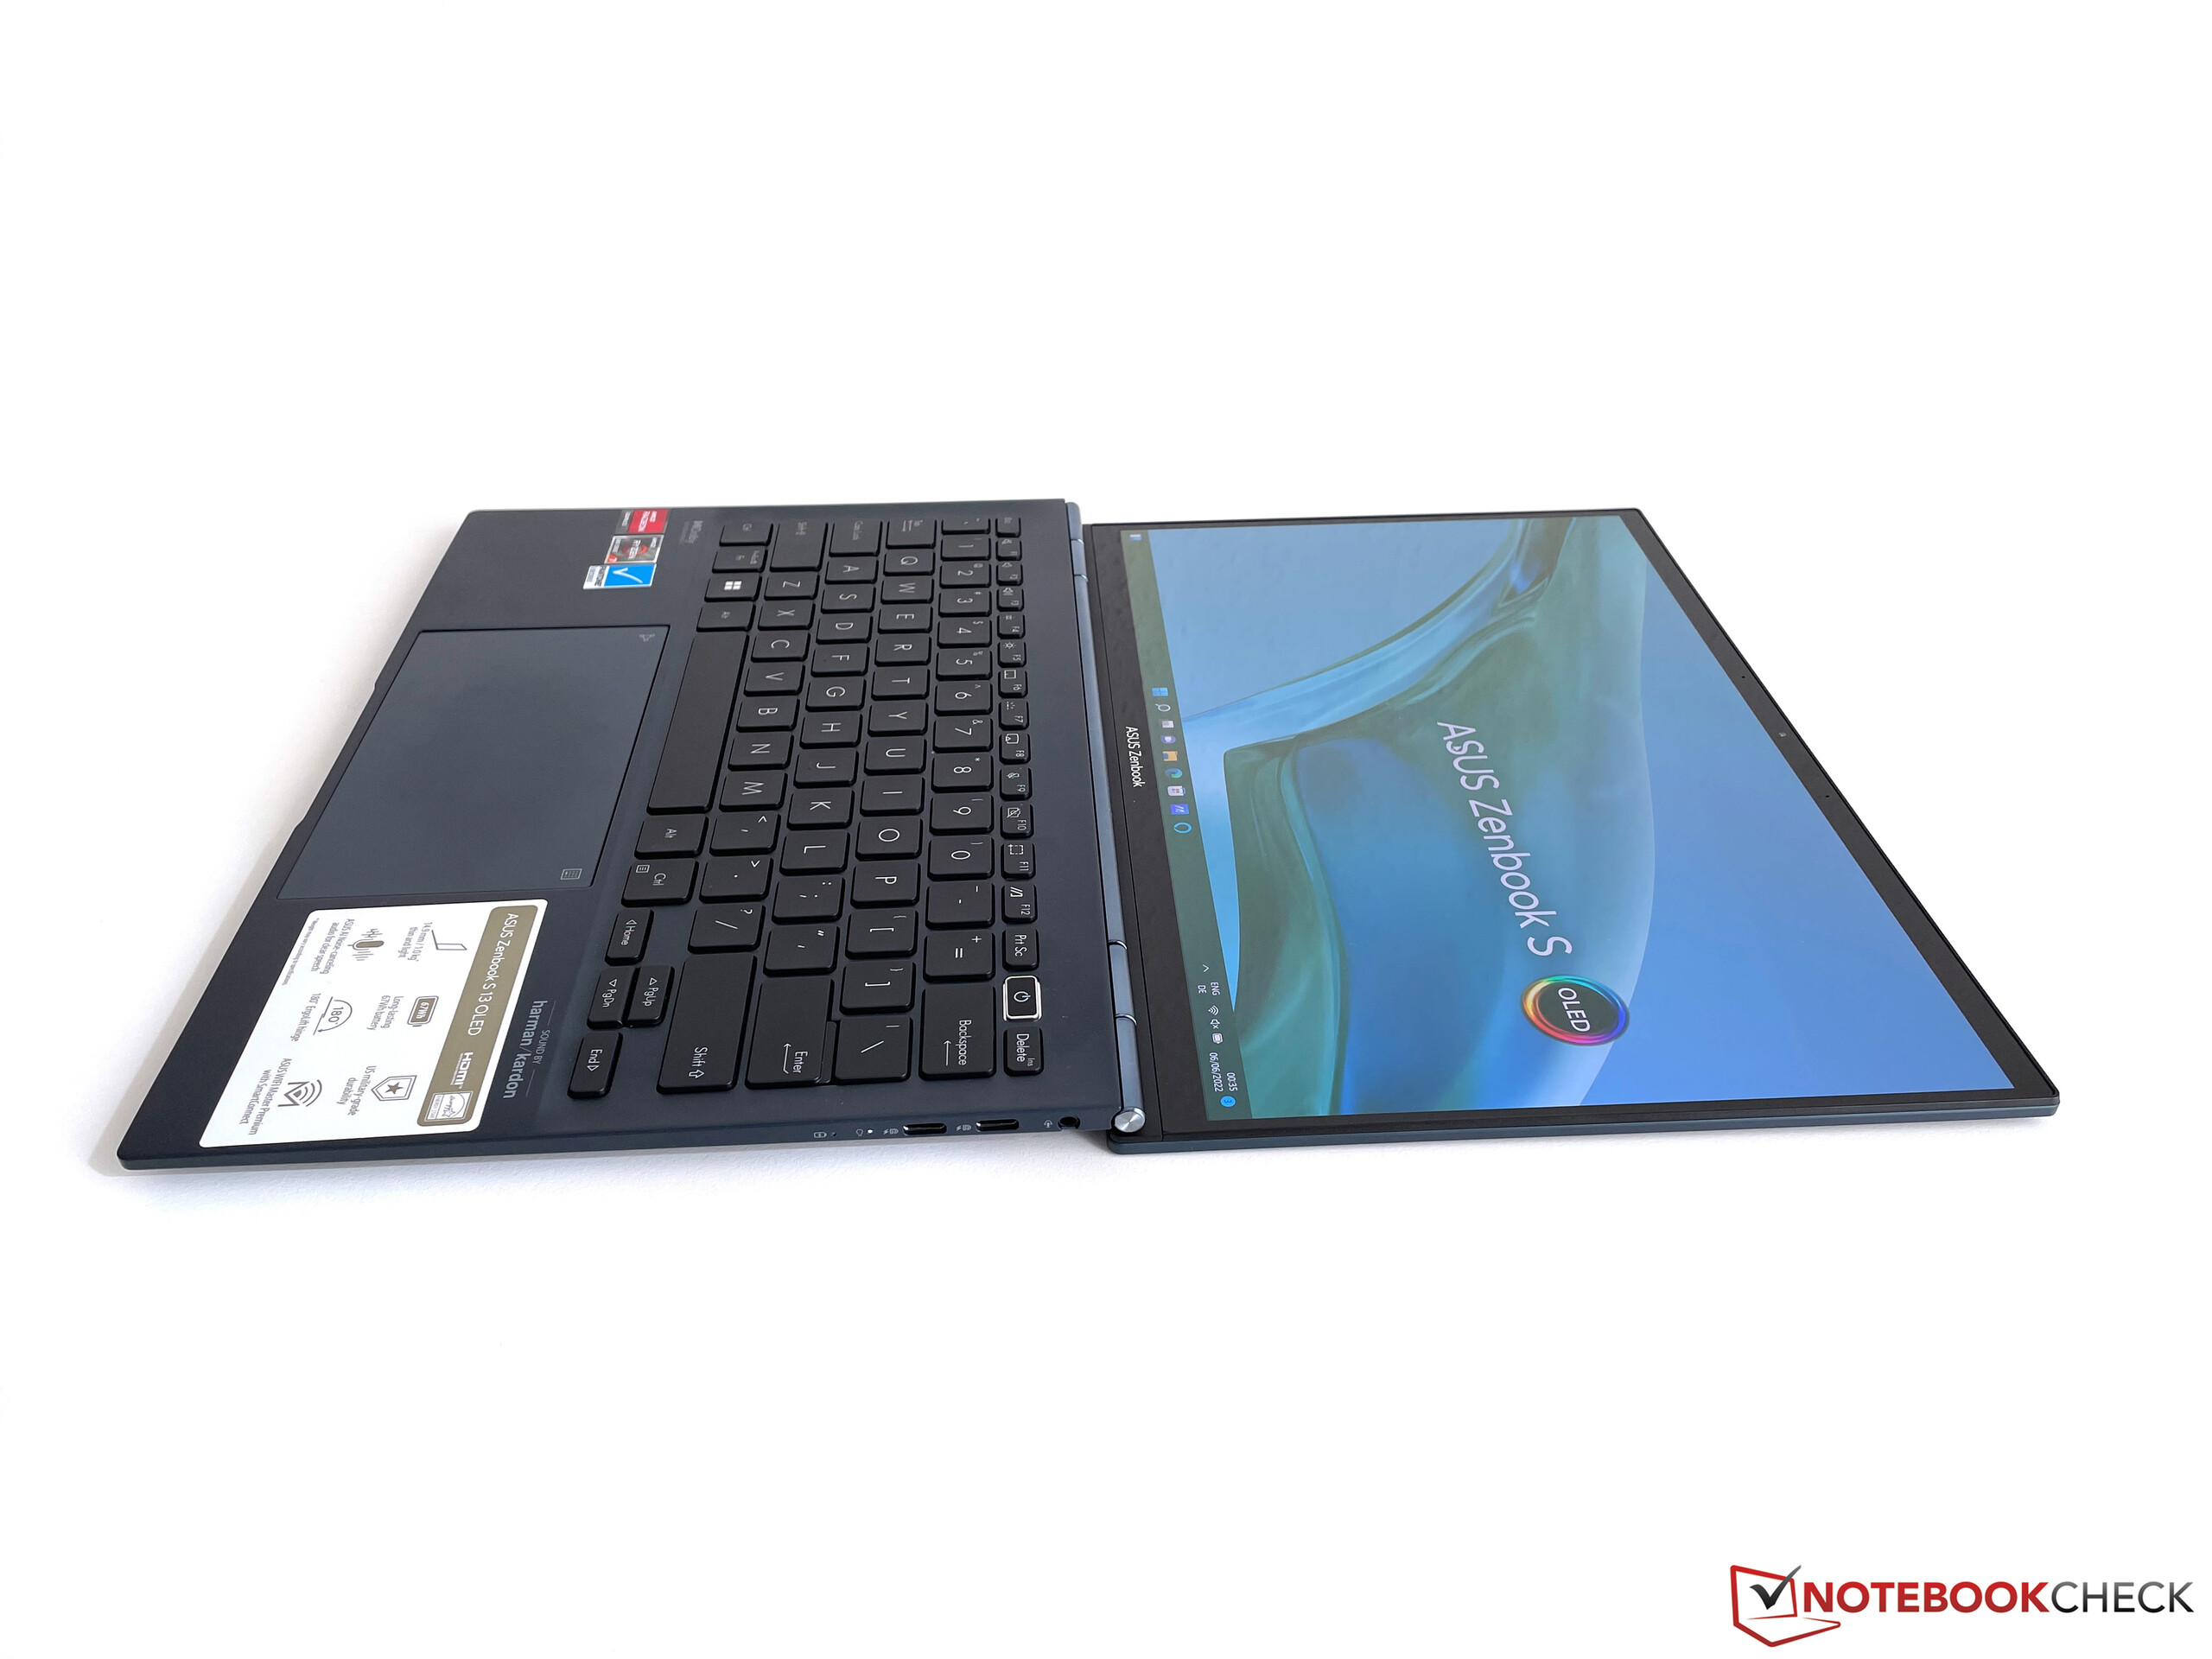
The screen's edges are particularly thin on the sides, but the top and bottom edges of the display leave room for improvement. The Zenbook thus achieves a body-to-screen ratio of only 81%. Like in other laptops, Asus uses a so-called Ergo-Lift hinge that slightly raises the base unit at the back. This improves the fresh air supply and also enables an opening angle of 180 degrees. The hinge itself is very taught and opening it with one hand requires some skill, but there is minimal teetering when adjusting the opening angle.
The stability of the base unit itself is very good and there are no creaking sounds. The keyboard area is slightly recessed compared to the palm rest area, allowing for a keyboard with more travel. Due to the slightly raised base, the rear center area of the keyboard yields under lots of pressure, but this requires a lot of exertion and should not pose an issue in everyday use. The display lid is very stable despite its thin build.

Our version with the touchscreen weighs 1.095 kg. Models without touch support are specified by Asus as weighing 100 grams less. The Zenbook can easily be stowed in any bag or backpack. Only the Dell XPS 13 takes up noticeably less space in our comparison group in terms of depth, but is also a bit heavier.
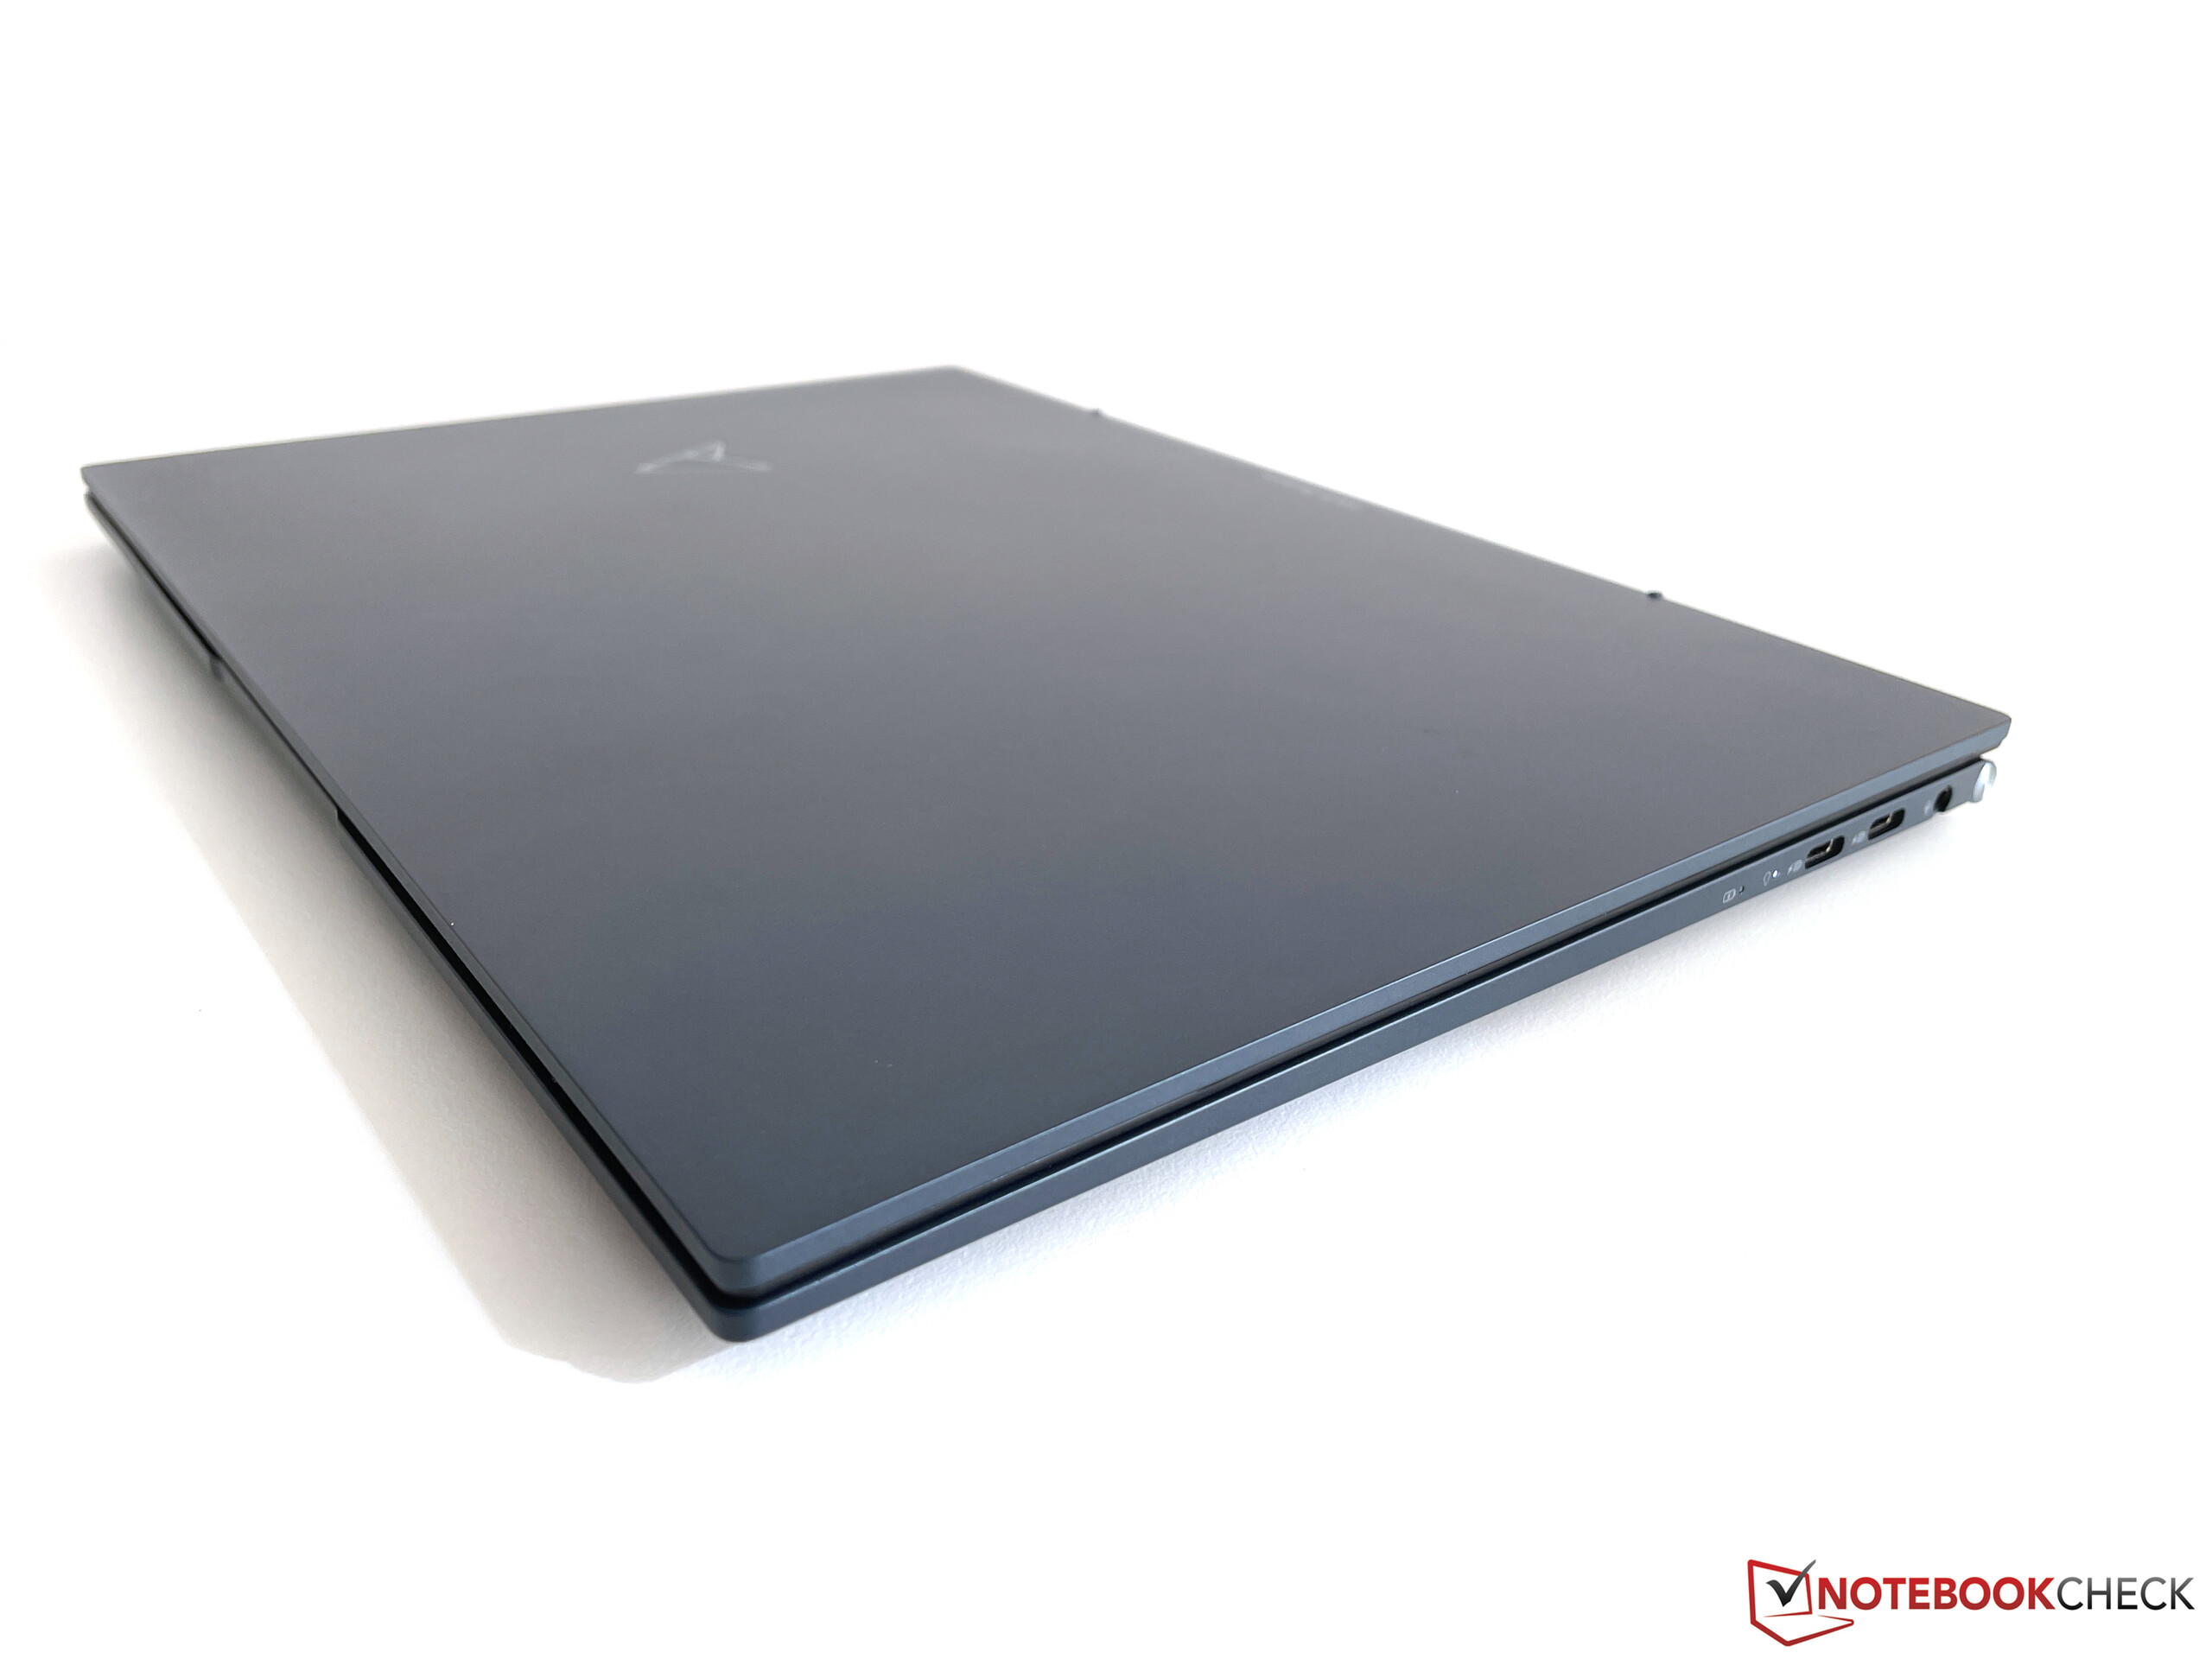
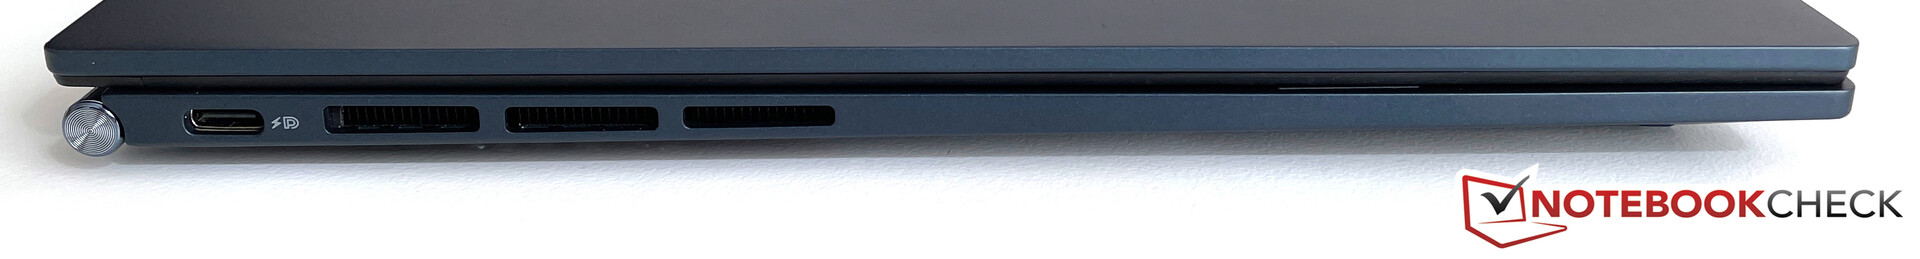
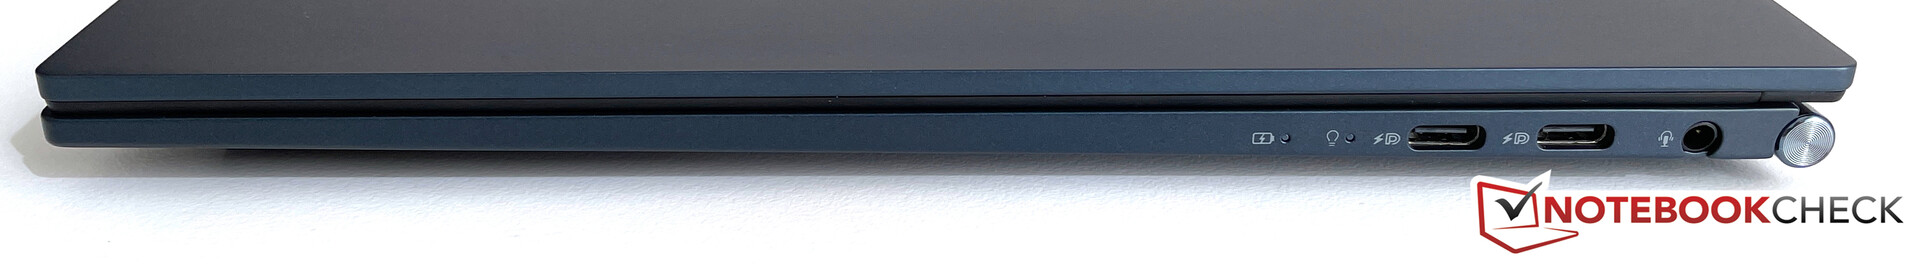
Equipment: AMD-Zenbook is USB-4 ready
Fundamentally, the Zenbook S 13 offers a 3.5 mm headphone jack and three USB-C ports. These only support the USB 3.2 standard, but can be later upgraded to USB 4 with the full 40 GBit/s via a BIOS update, and there is no difference to the Thunderbolt 4 protocol in terms of stock specifications. According to AMD, external graphics cards will also be supported in the future, and the corresponding update should be available shortly after the Zenbook's market launch.
Communication
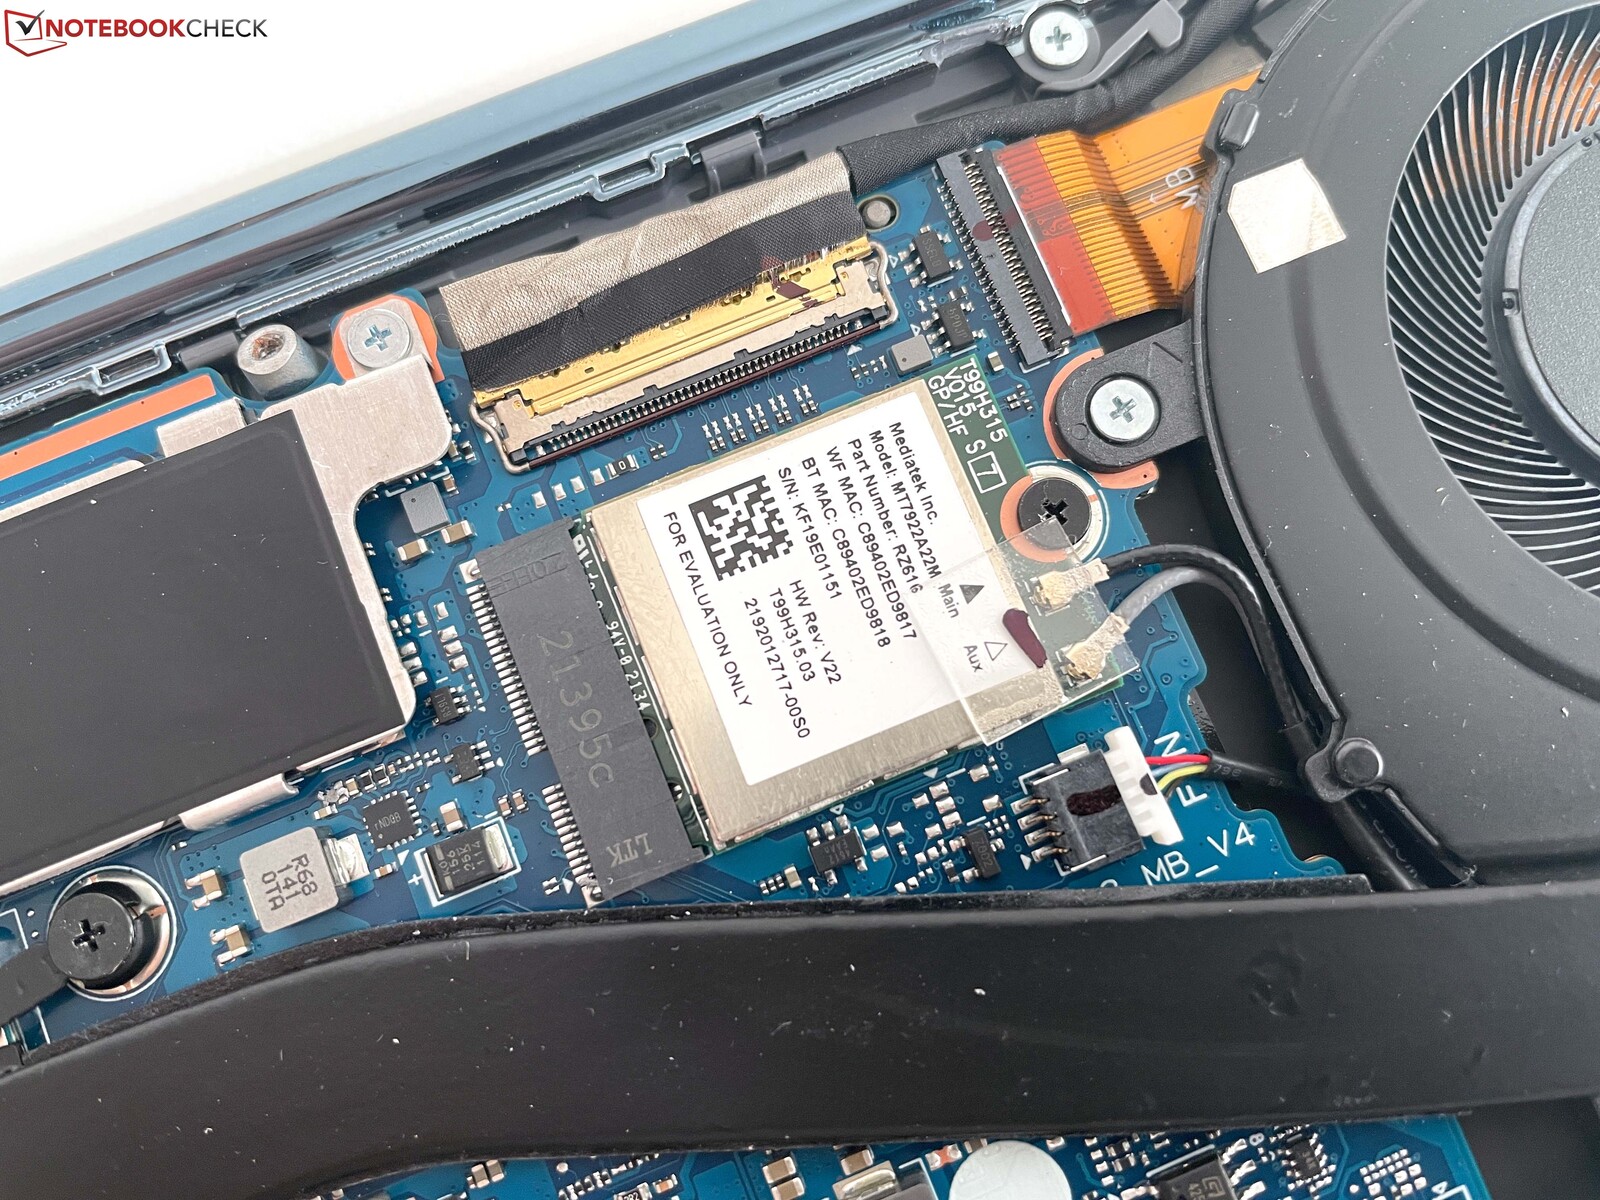
An up-to-date module from MediaTek is used as the Wi-Fi adapter (MT9972), which also supports the latest Wi-Fi 6E standard. At least in theory, because our US device of the Zenbook S 13 refused to connect to the 6 GHz network of our reference router from Asus.
Nonetheless, transfer rates are very good and stable on the normal 5 GHz network (Wi-Fi 6). Support for Bluetooth 5.2 is also available.
Webcam
Asus continues to use a 720p module for the webcam, which doesn't really take good pictures even under optimal lighting conditions.


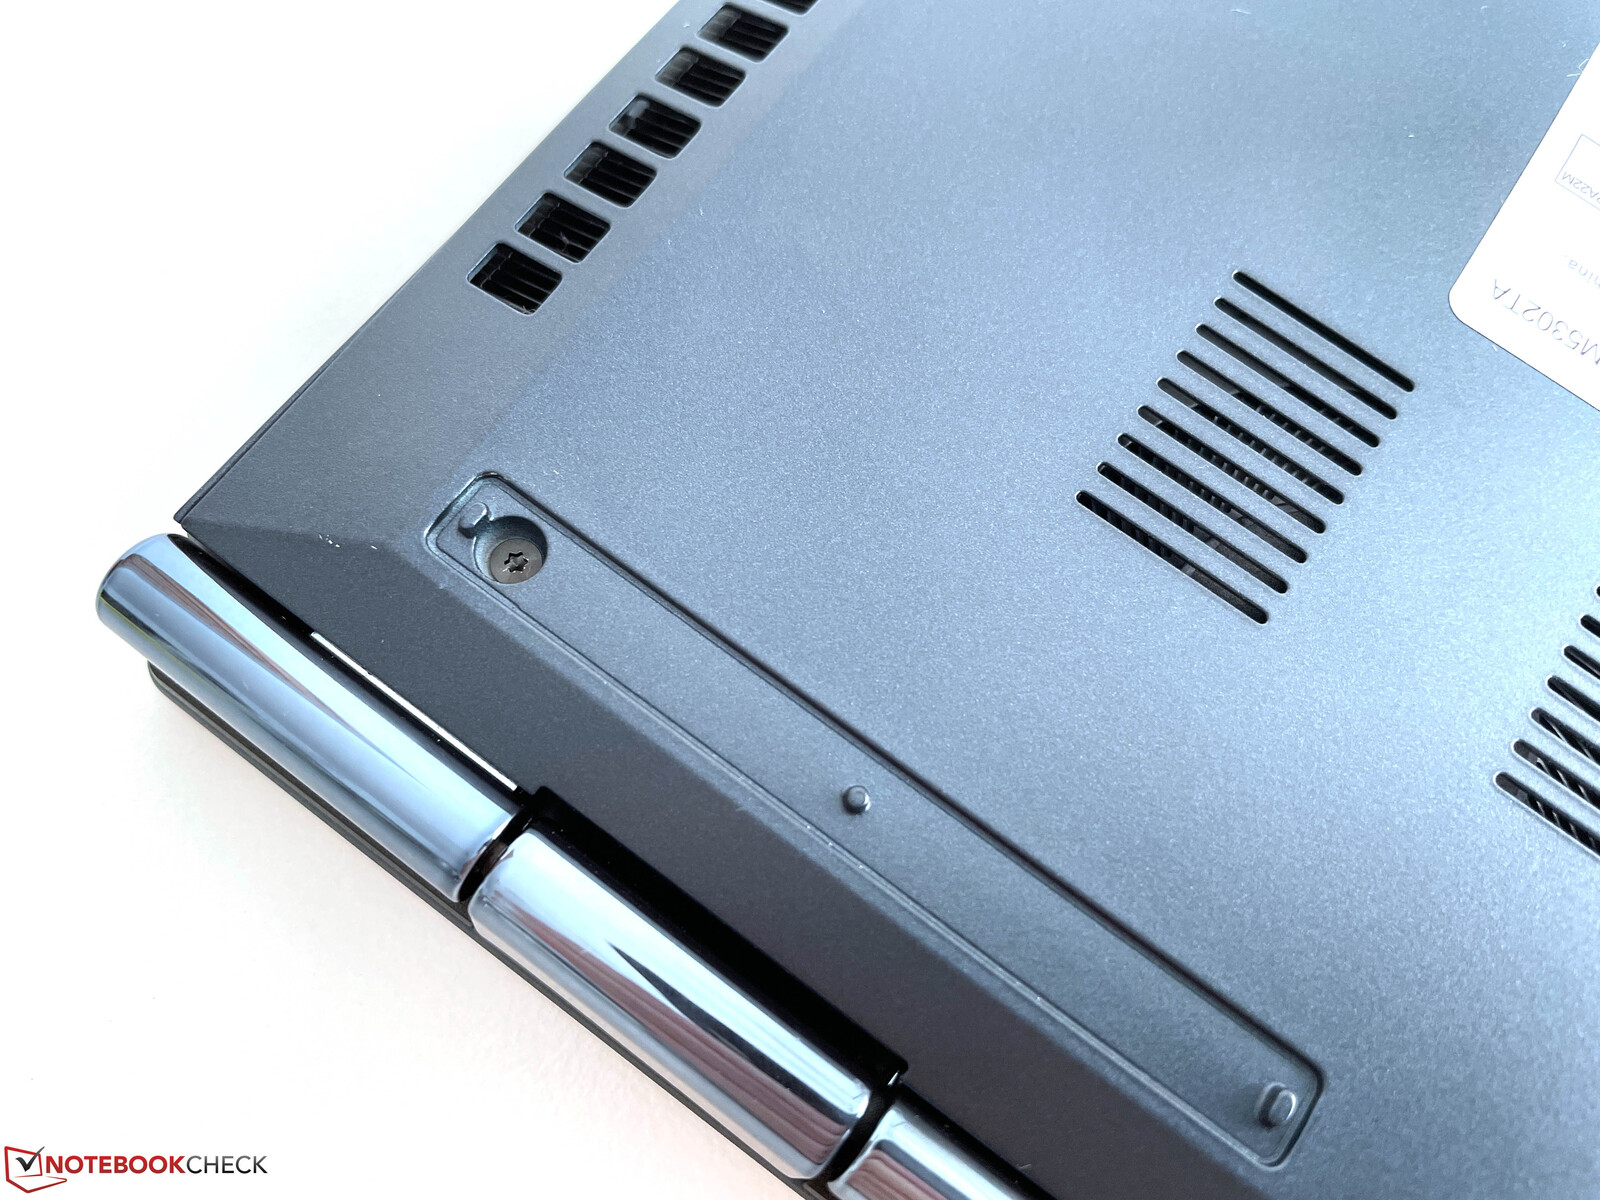
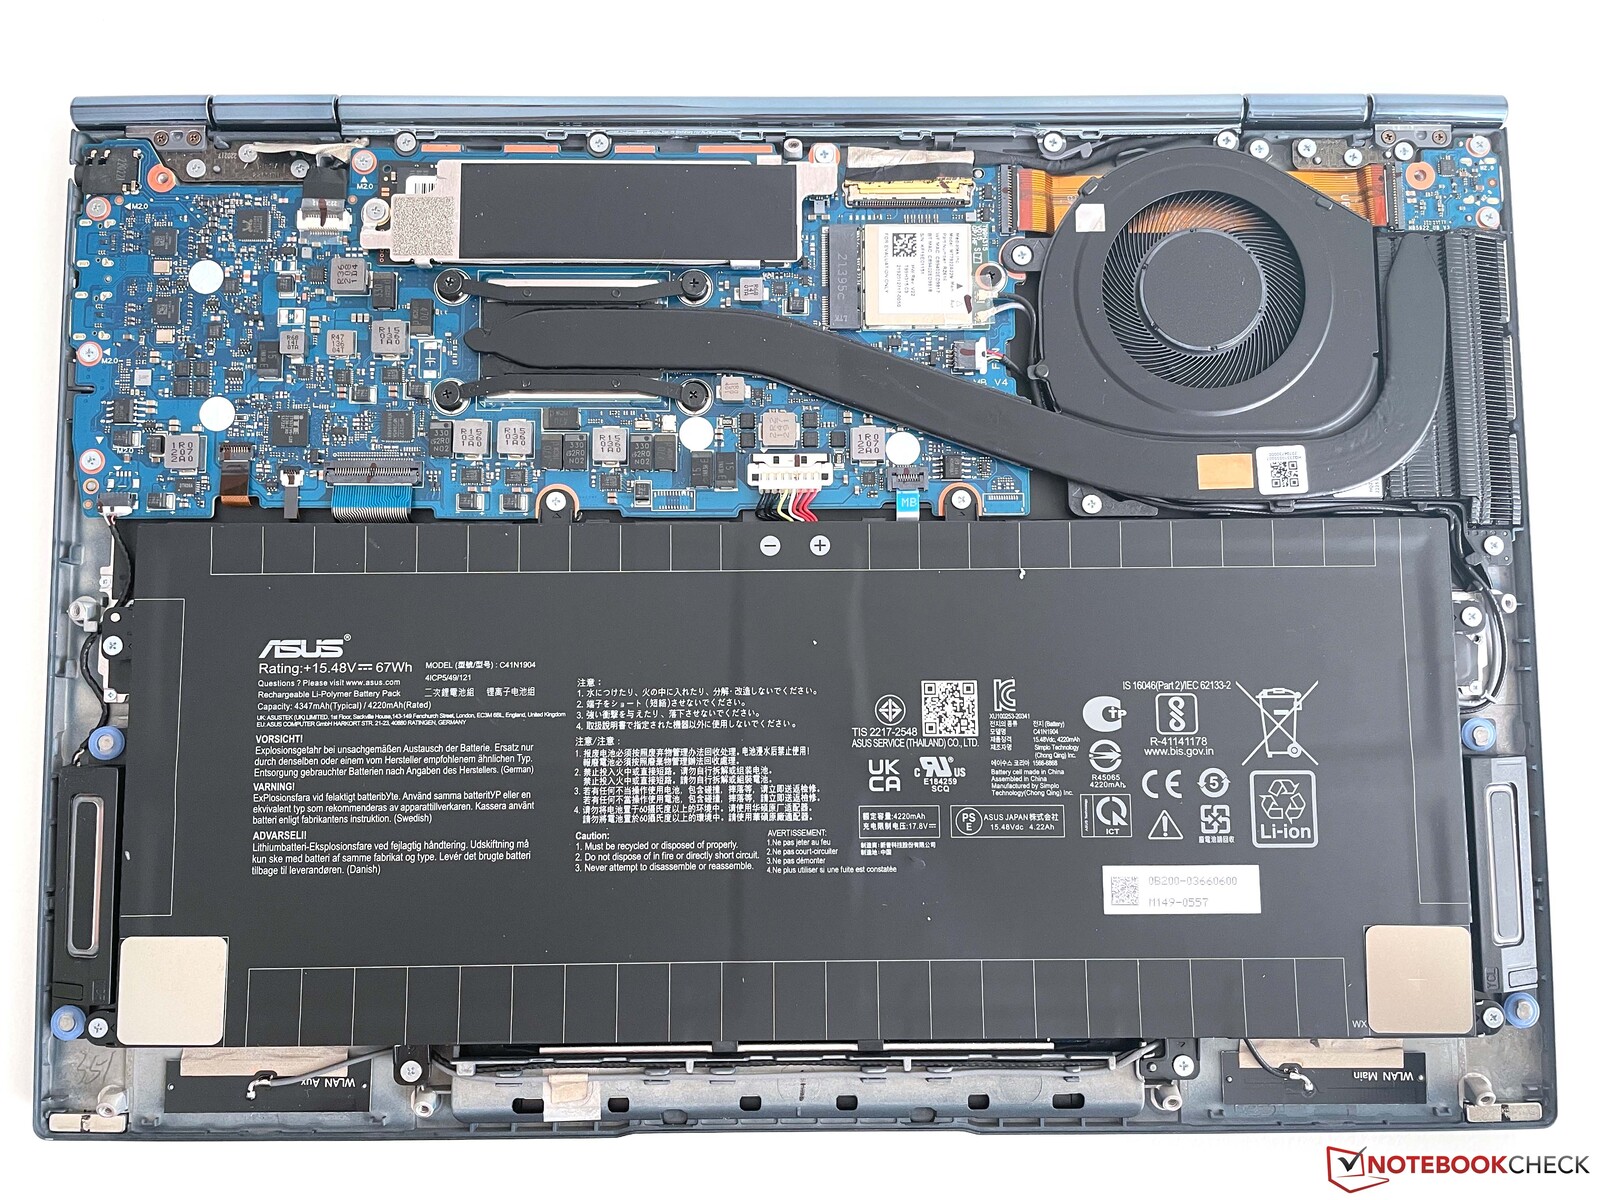
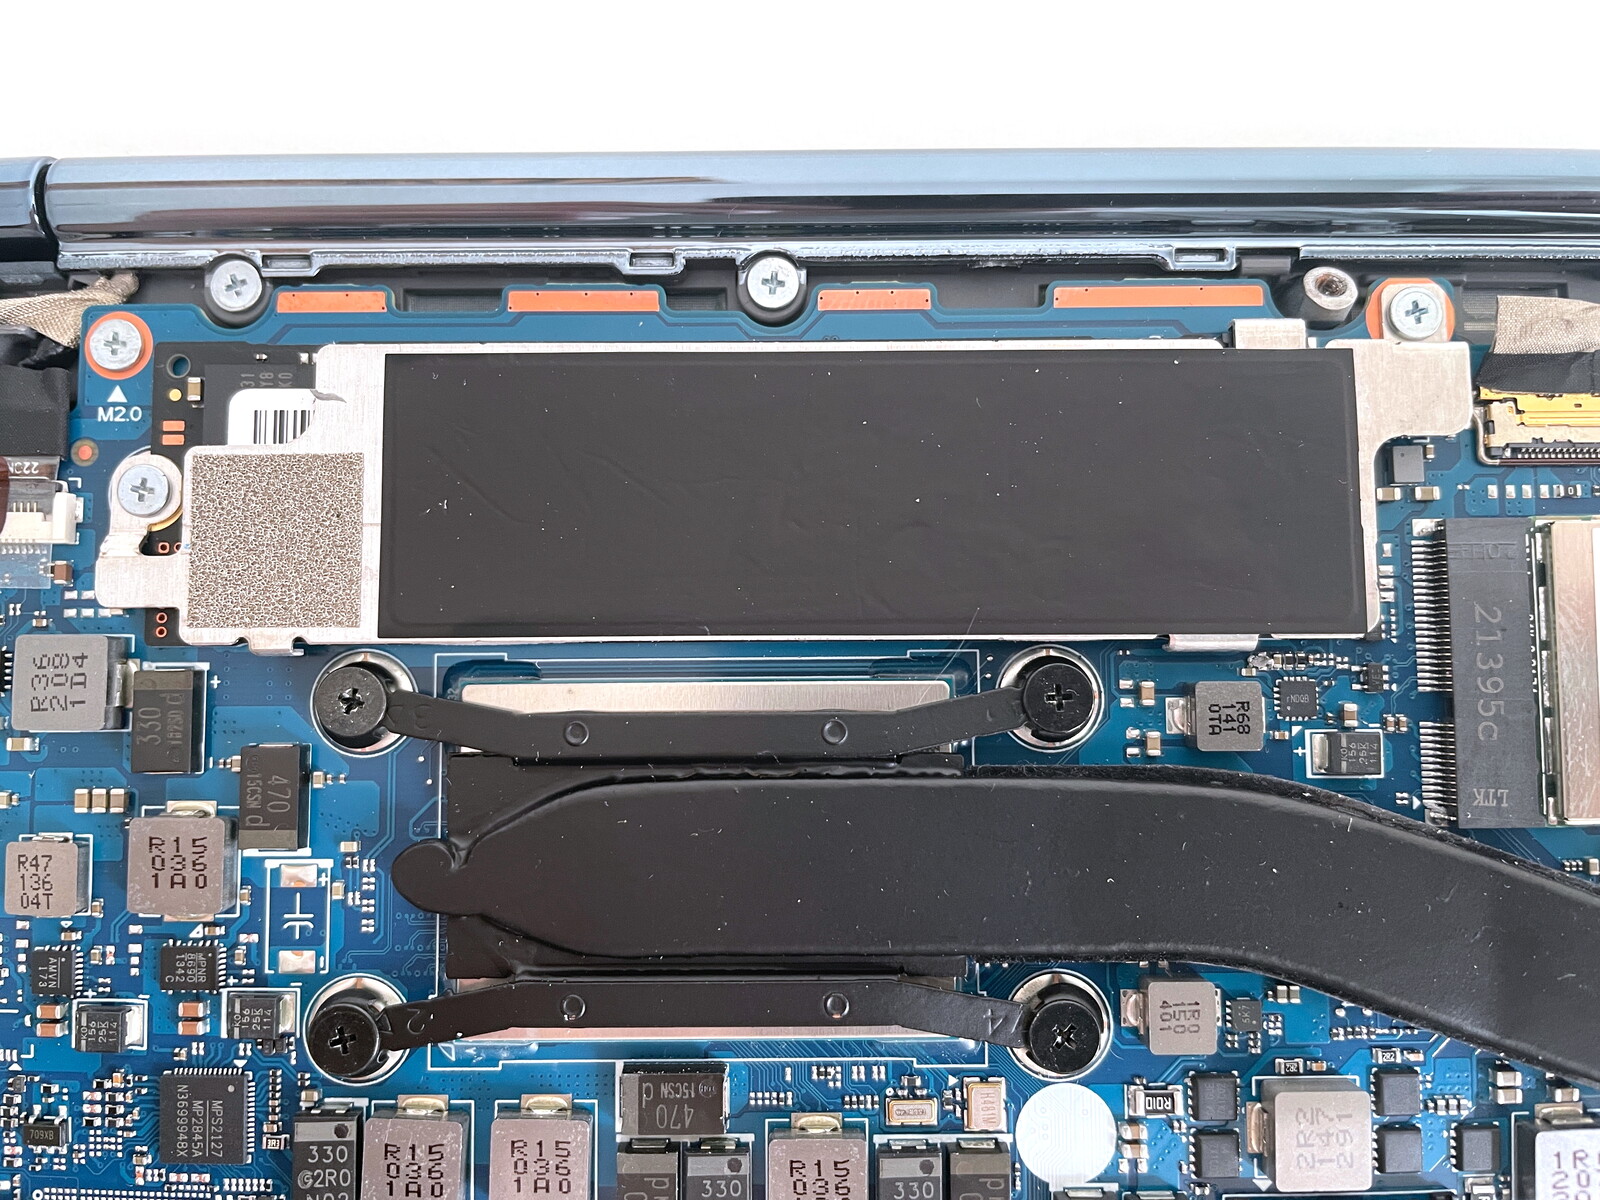
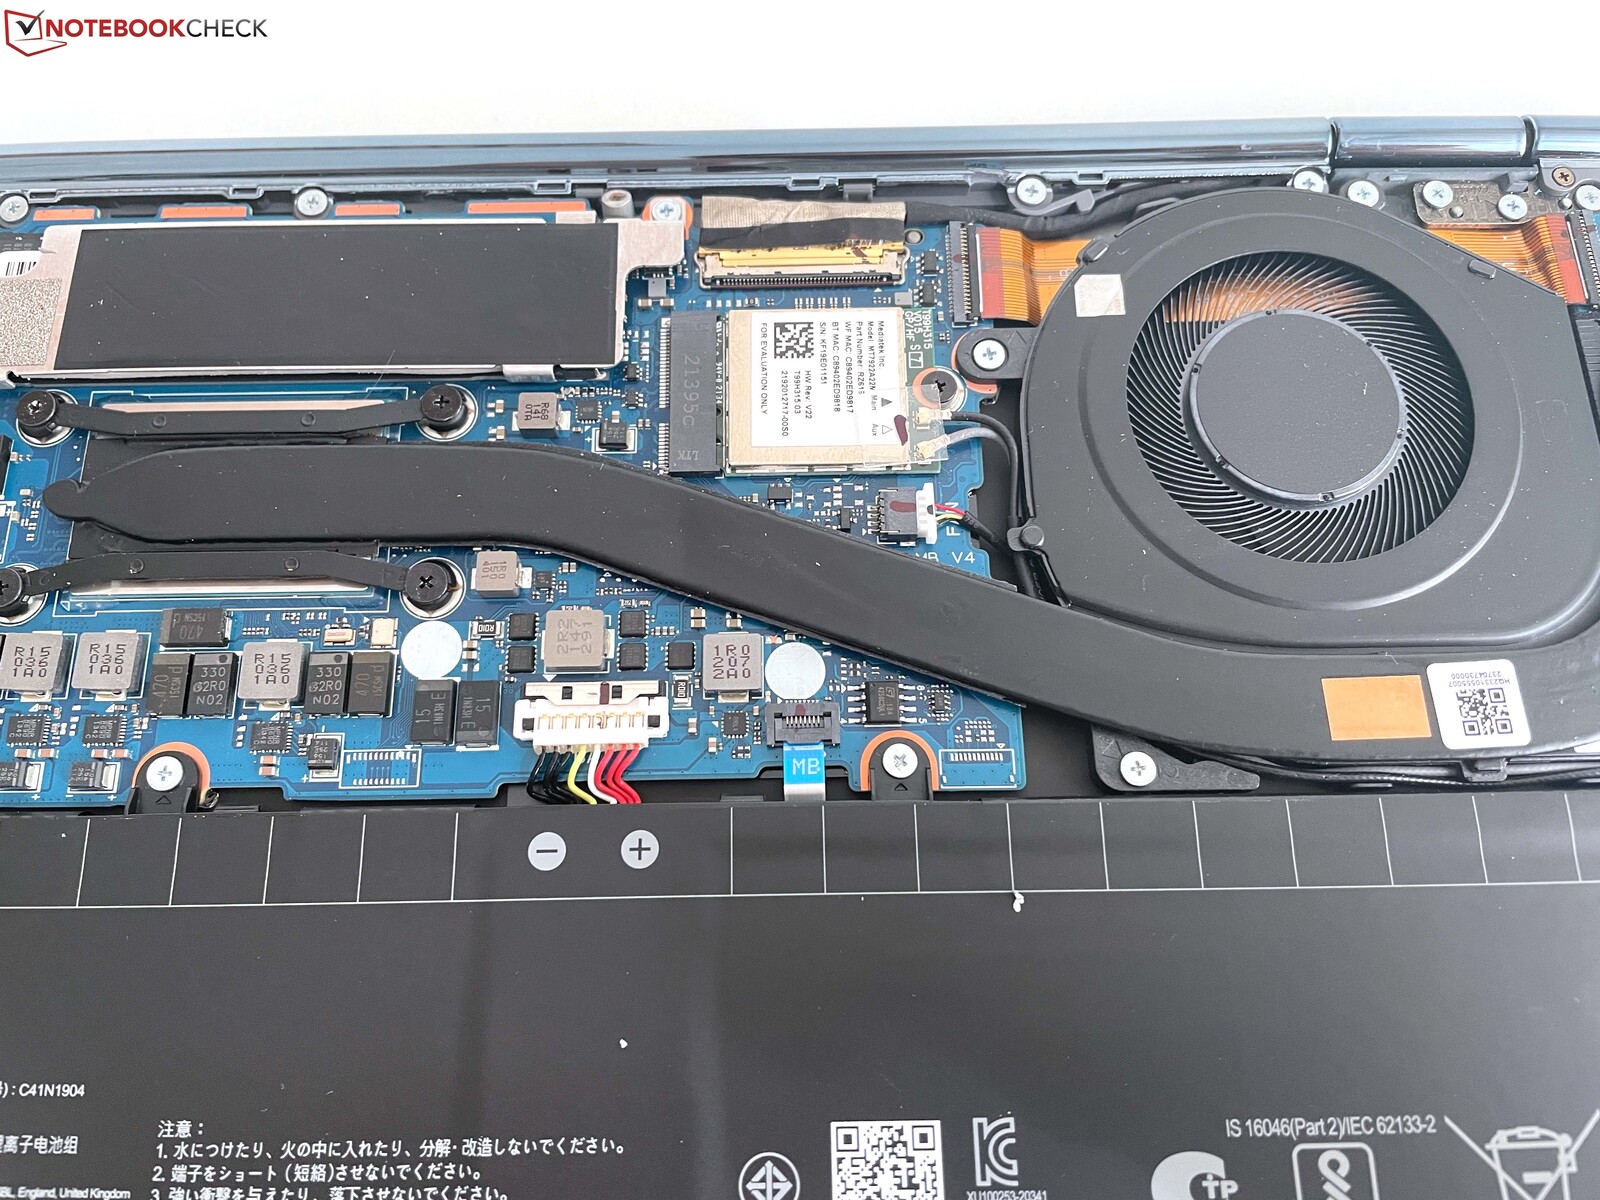
Maintenance
The baseplate is secured with small Torx screws (T5), but in addition to the visible screws, there are two hidden under the two rear rubber feet, which themselves are glued. It hardly gets any more complicated than this.
Once inside, there is not much that can be done in terms of maintenance or upgrades. Apart from fan cleaning and access to the M.2-2280 SSD, only the WLAN module can be replaced.
Input Devices: Asus installs a comfortable keyboard
Keyboard
For such a compact notebook, the Zenbook offers a comparatively generous key drop of 1.4 mm. The typing feel is very good overall and thanks to the precise feedback, typing longer texts poses no problems. However, the keystroke itself could be a bit quieter. The arrow keys are quite small, but otherwise the layout has no points of criticism. The power button is located at the top right of the keyboard and uses a slightly different mechanism with a shorter stroke and clicks a little louder. It also serves as a fingerprint scanner, which worked reliably in testing.
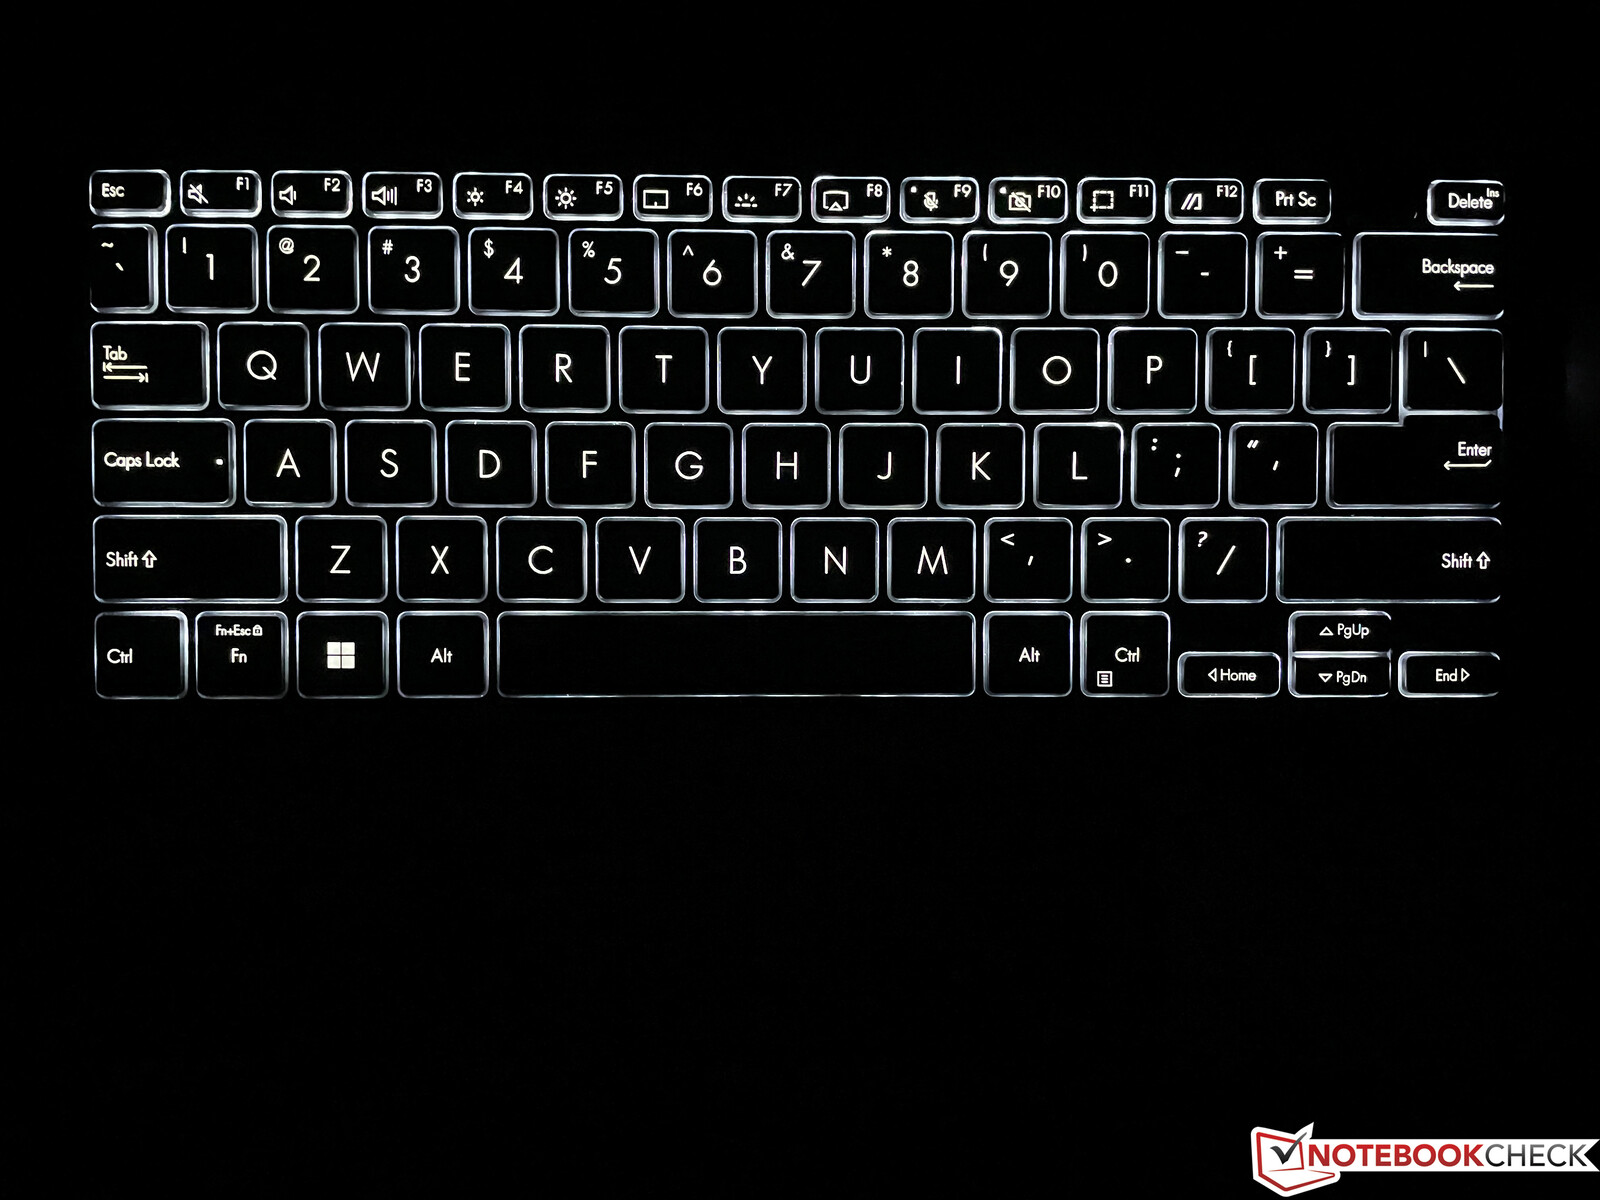
The three-stage white backlight helps in dark environments, but cannot be activated automatically via a sensor.
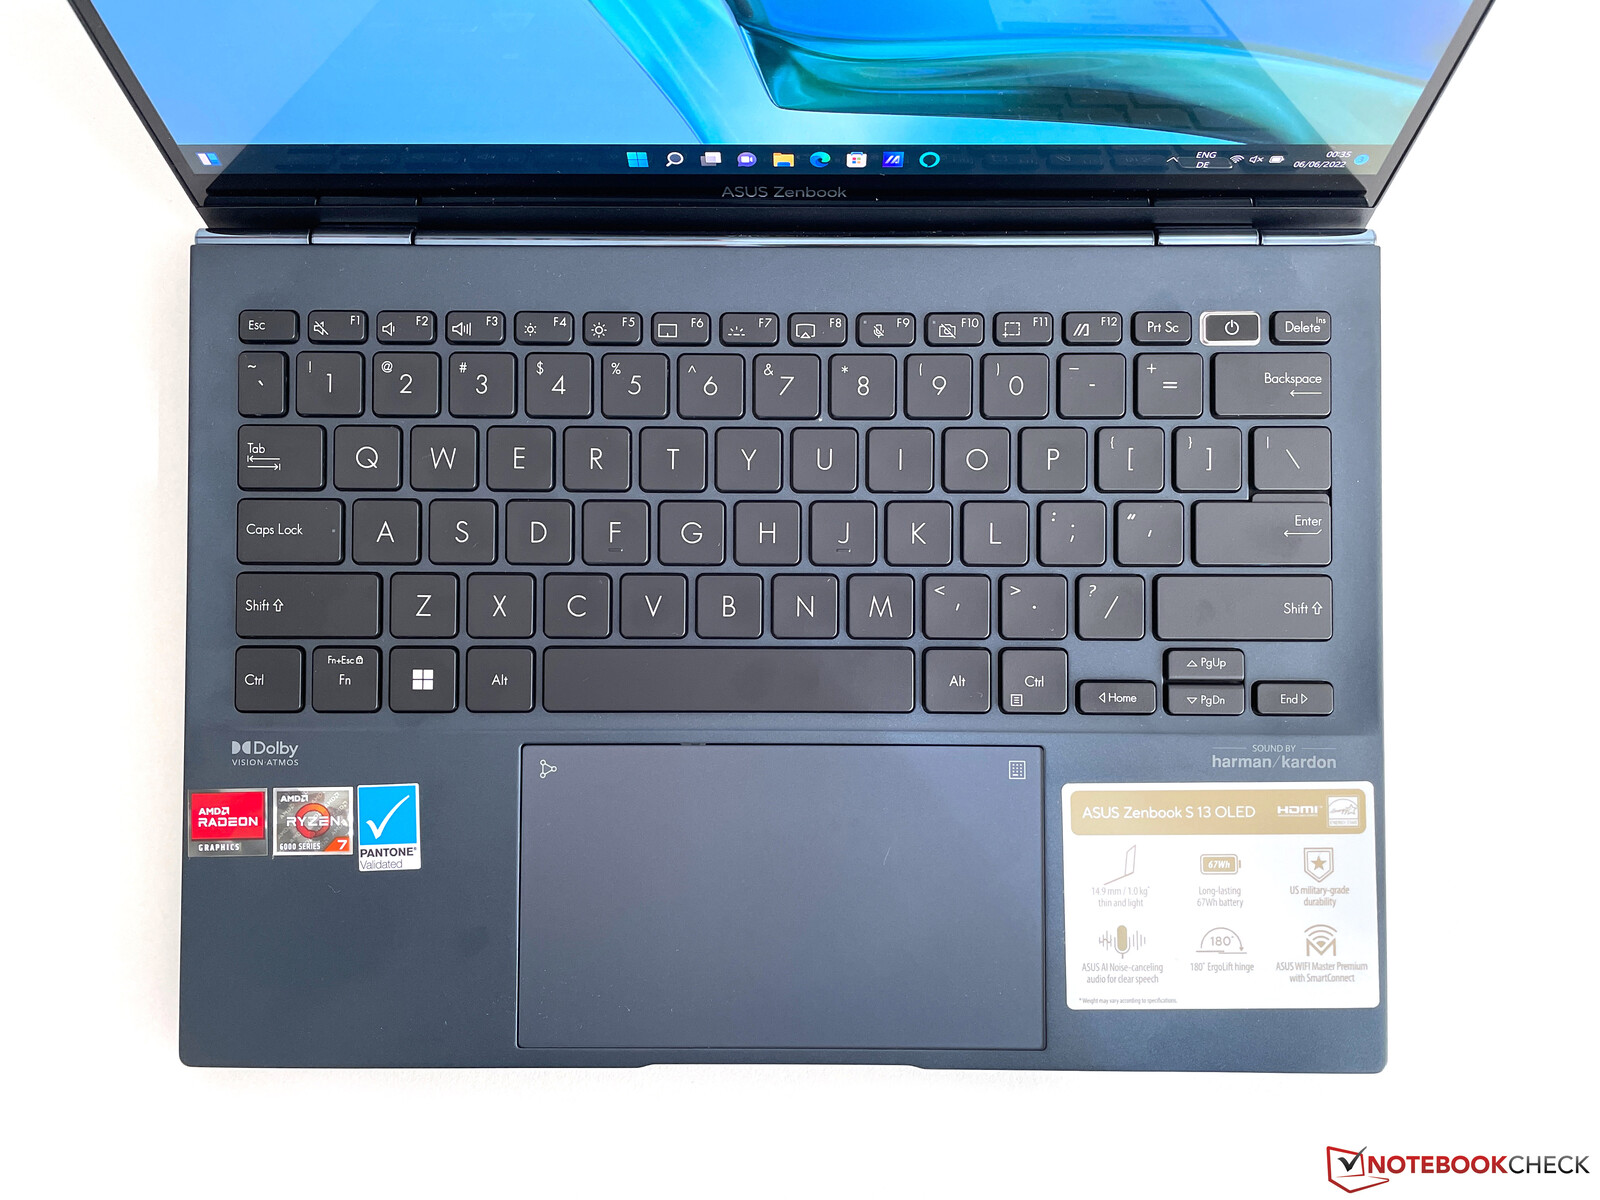
Touchpad & Touchscreen
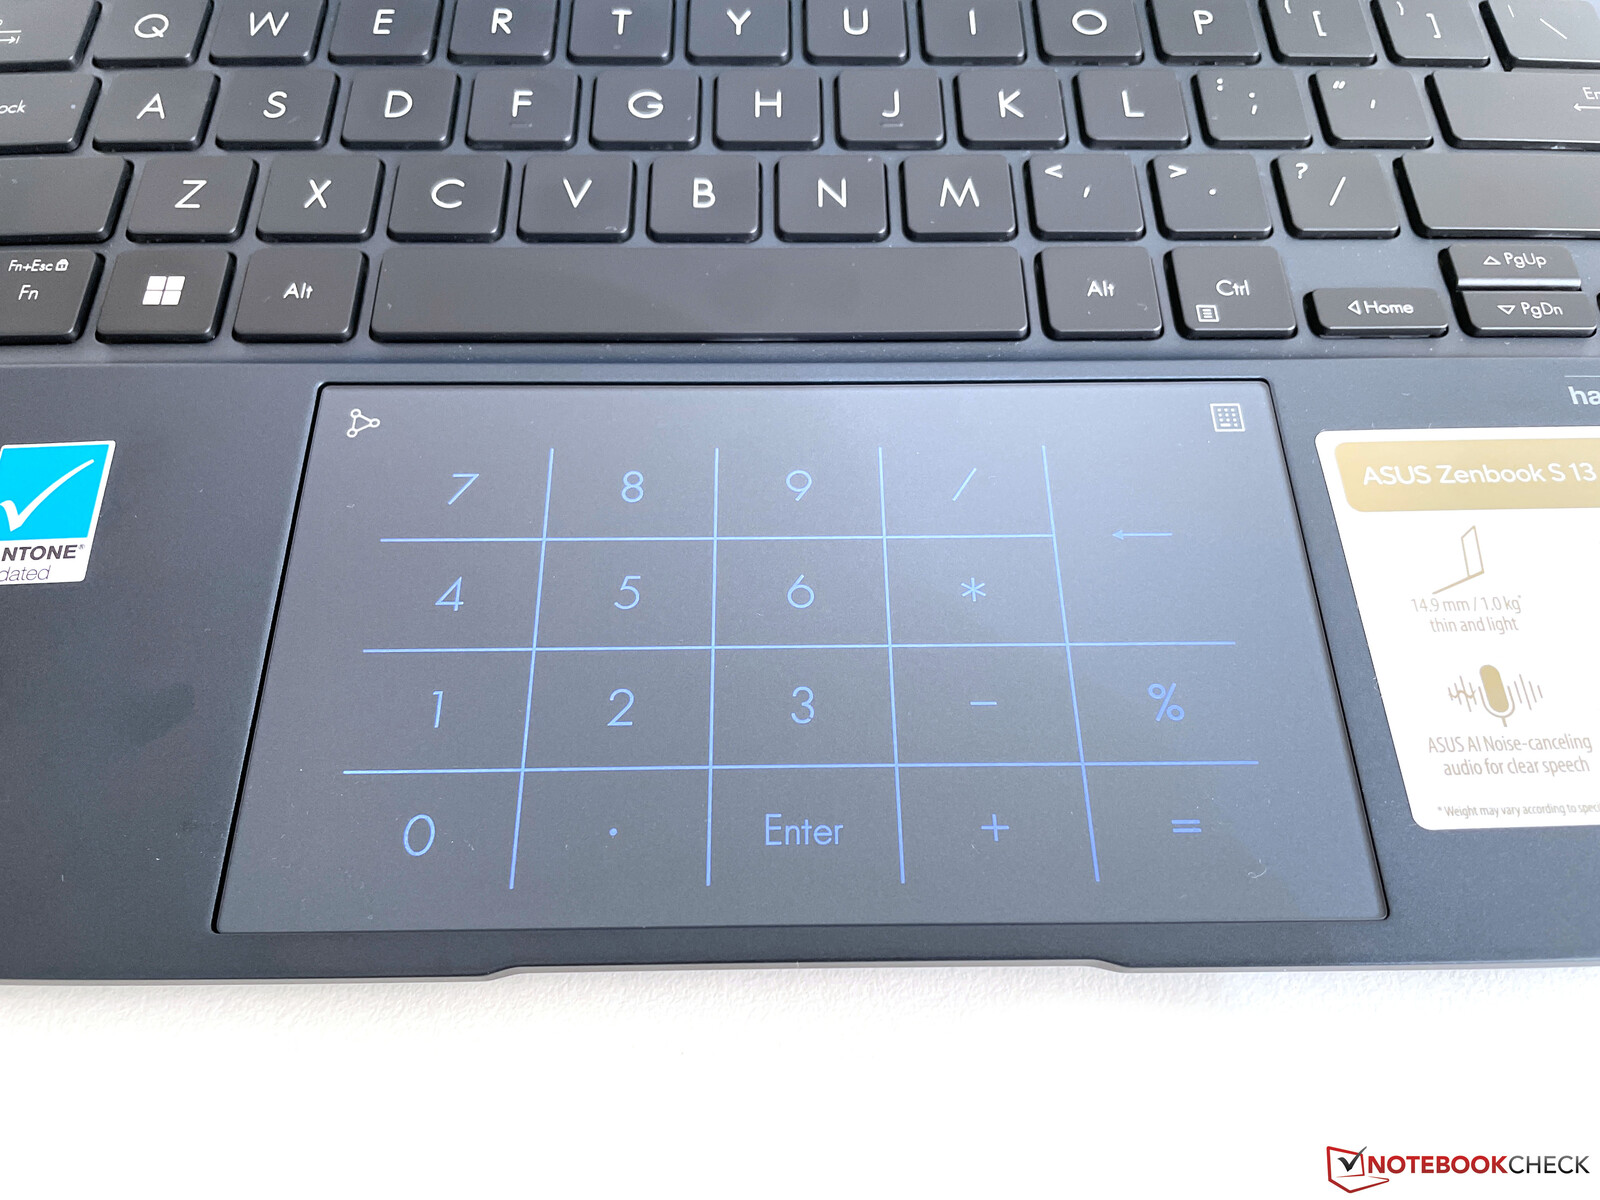
The large ClickPad works very well in practice and gestures with up to four fingers are also implemented correctly. Pressing the top right corner brings up a number pad on the touchpad, which works well and proves really useful when entering a lot of numbers. The normal cursor control also functions normally. The lower half of the pad can be clicked mechanically, but as with many other laptops, this is characterized by a very loud clicking noise.
Of course, the capacitive touchscreen is also available, which works flawlessly as expected. According to Asus, an stylus is also supported, but this was not provided with our review sample.
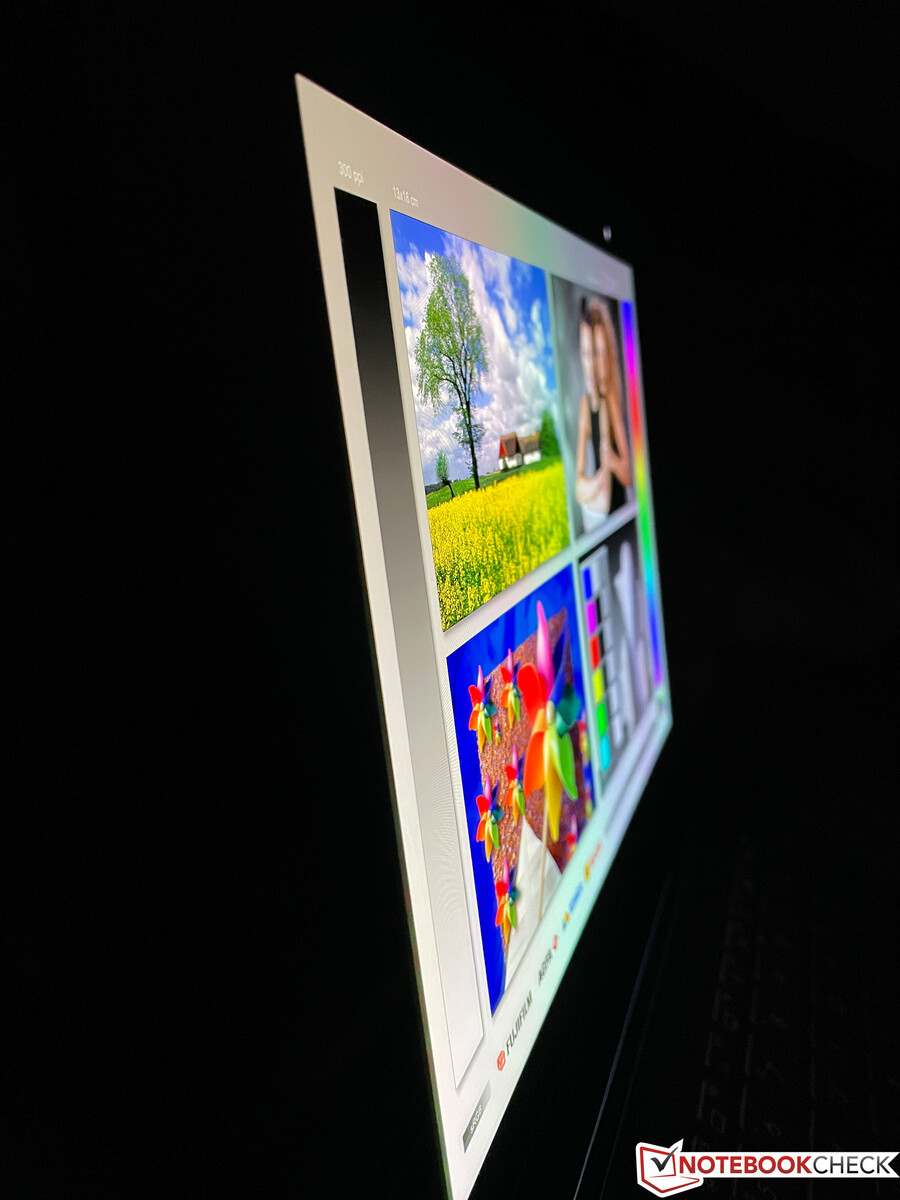
Display: Zenbook with software against PWM
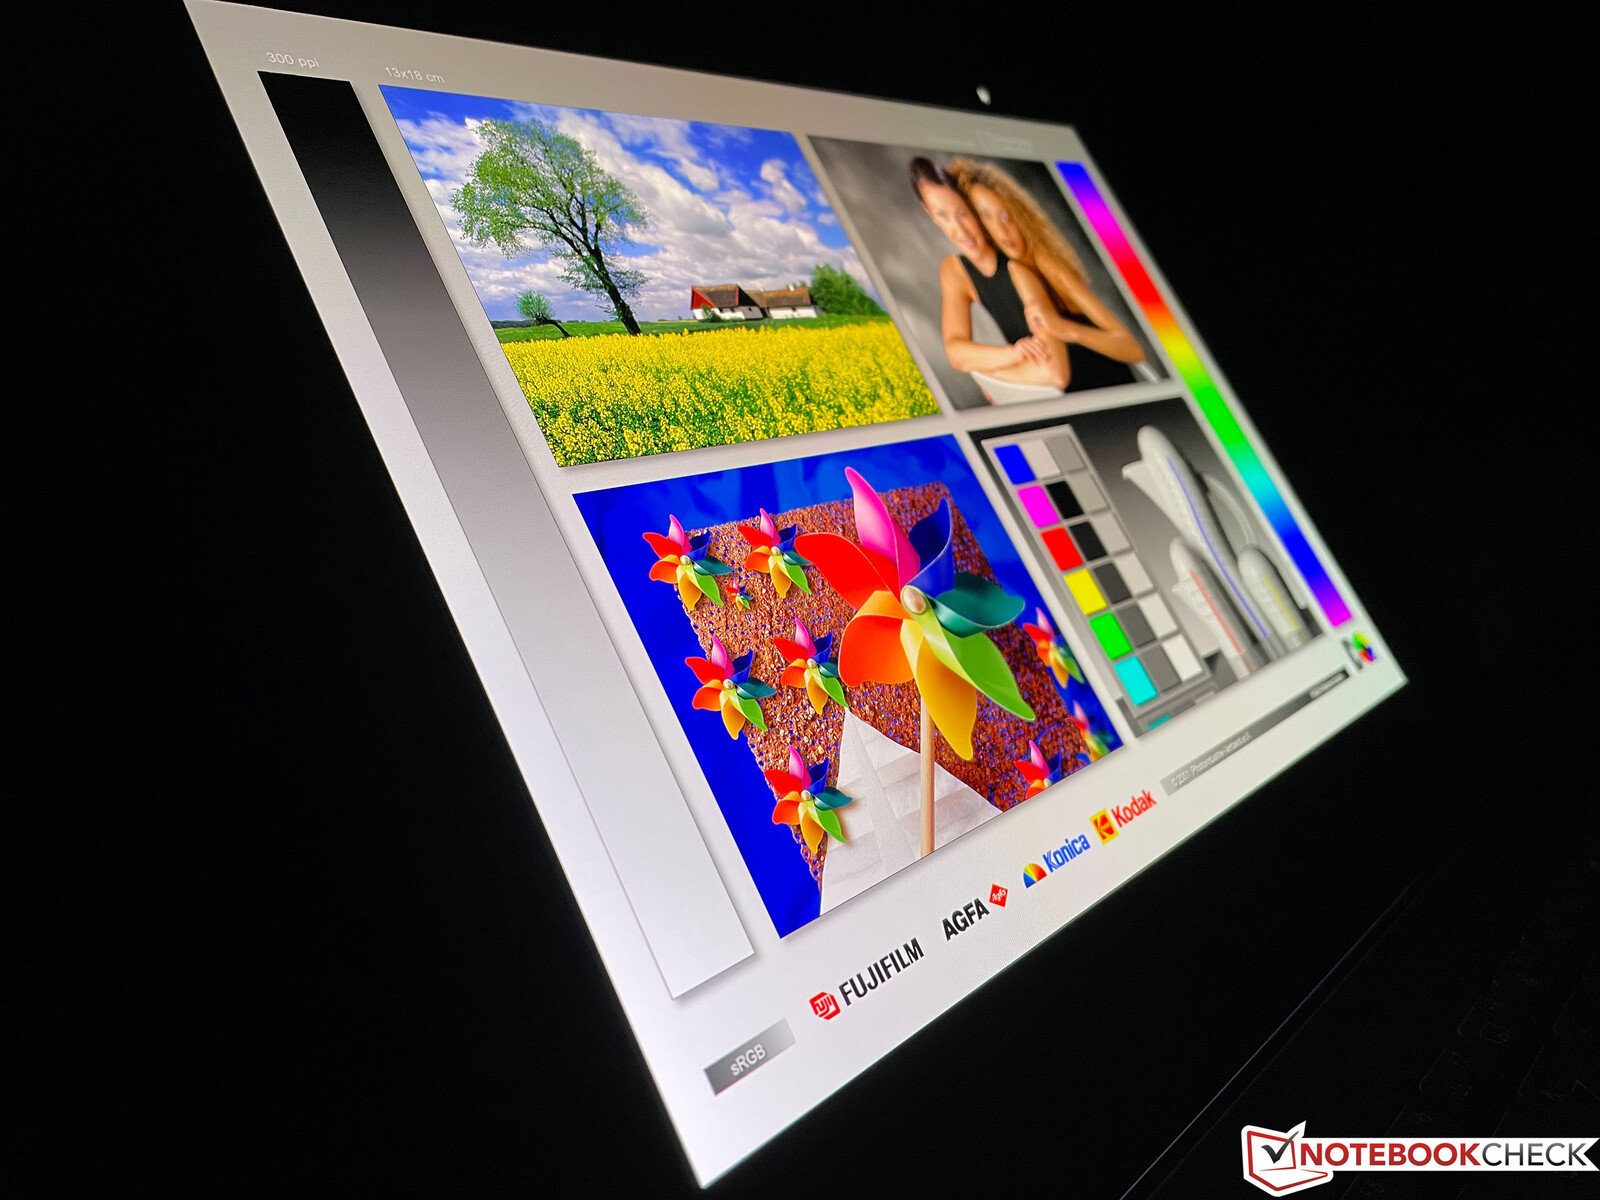
The Zenbook S 13 is equipped with a 16:10 OLED screen that offers a high resolution of 2,880 x 1,800 on its 13.3-inch diagonal. The subjective picture quality, with its with vivid colors and sharp content, is very good.
Asus specifies a maximum brightness of up to 550 cd/m², but this only applies to HDR content. Our measurements show a maximum of ~570 cd/m² for a small white image, which then becomes ~460 cd/m² for a near-complete white image. Unfortunately, HDR switching does not work automatically, but has to be activated manually in the Windows display settings.
Maximum brightness amounts to only 340 cd/m² for normal SDR content. The picture impression naturally benefits from the particularly low black value, which in turn leads to a very high contrast ratio. Halos are not a problem due to OLED technology and the response times are extremely fast. There are some features (e.g. pixel shifting) in the MyAsus app that are designed to prevent the burn-in of static content. An ambient light sensor for automatic brightness control, however, is lacking.
| |||||||||||||||||||||||||
Brightness Distribution: 99 %
Center on Battery: 335 cd/m²
Contrast: 16800:1 (Black: 0.02 cd/m²)
ΔE ColorChecker Calman: 1.8 | ∀{0.5-29.43 Ø4.75}
calibrated: 1.8
ΔE Greyscale Calman: 0.9 | ∀{0.09-98 Ø5}
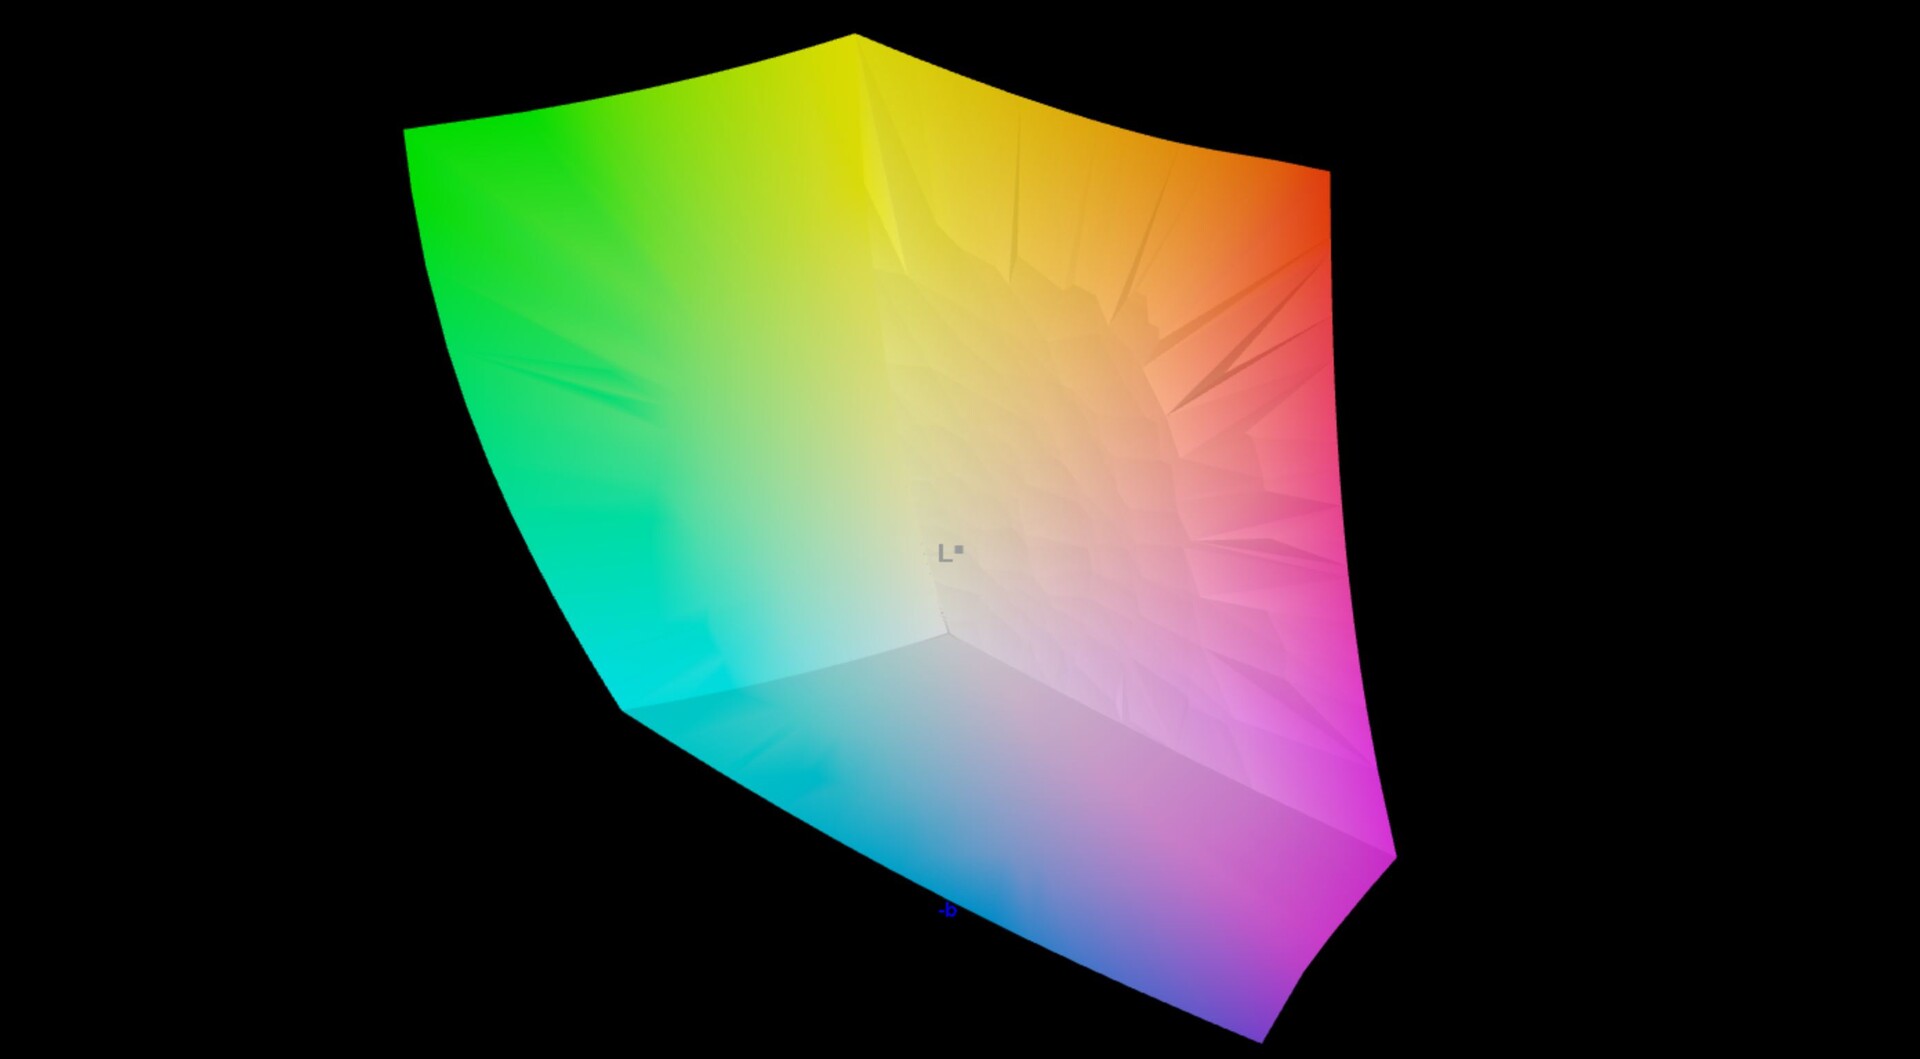
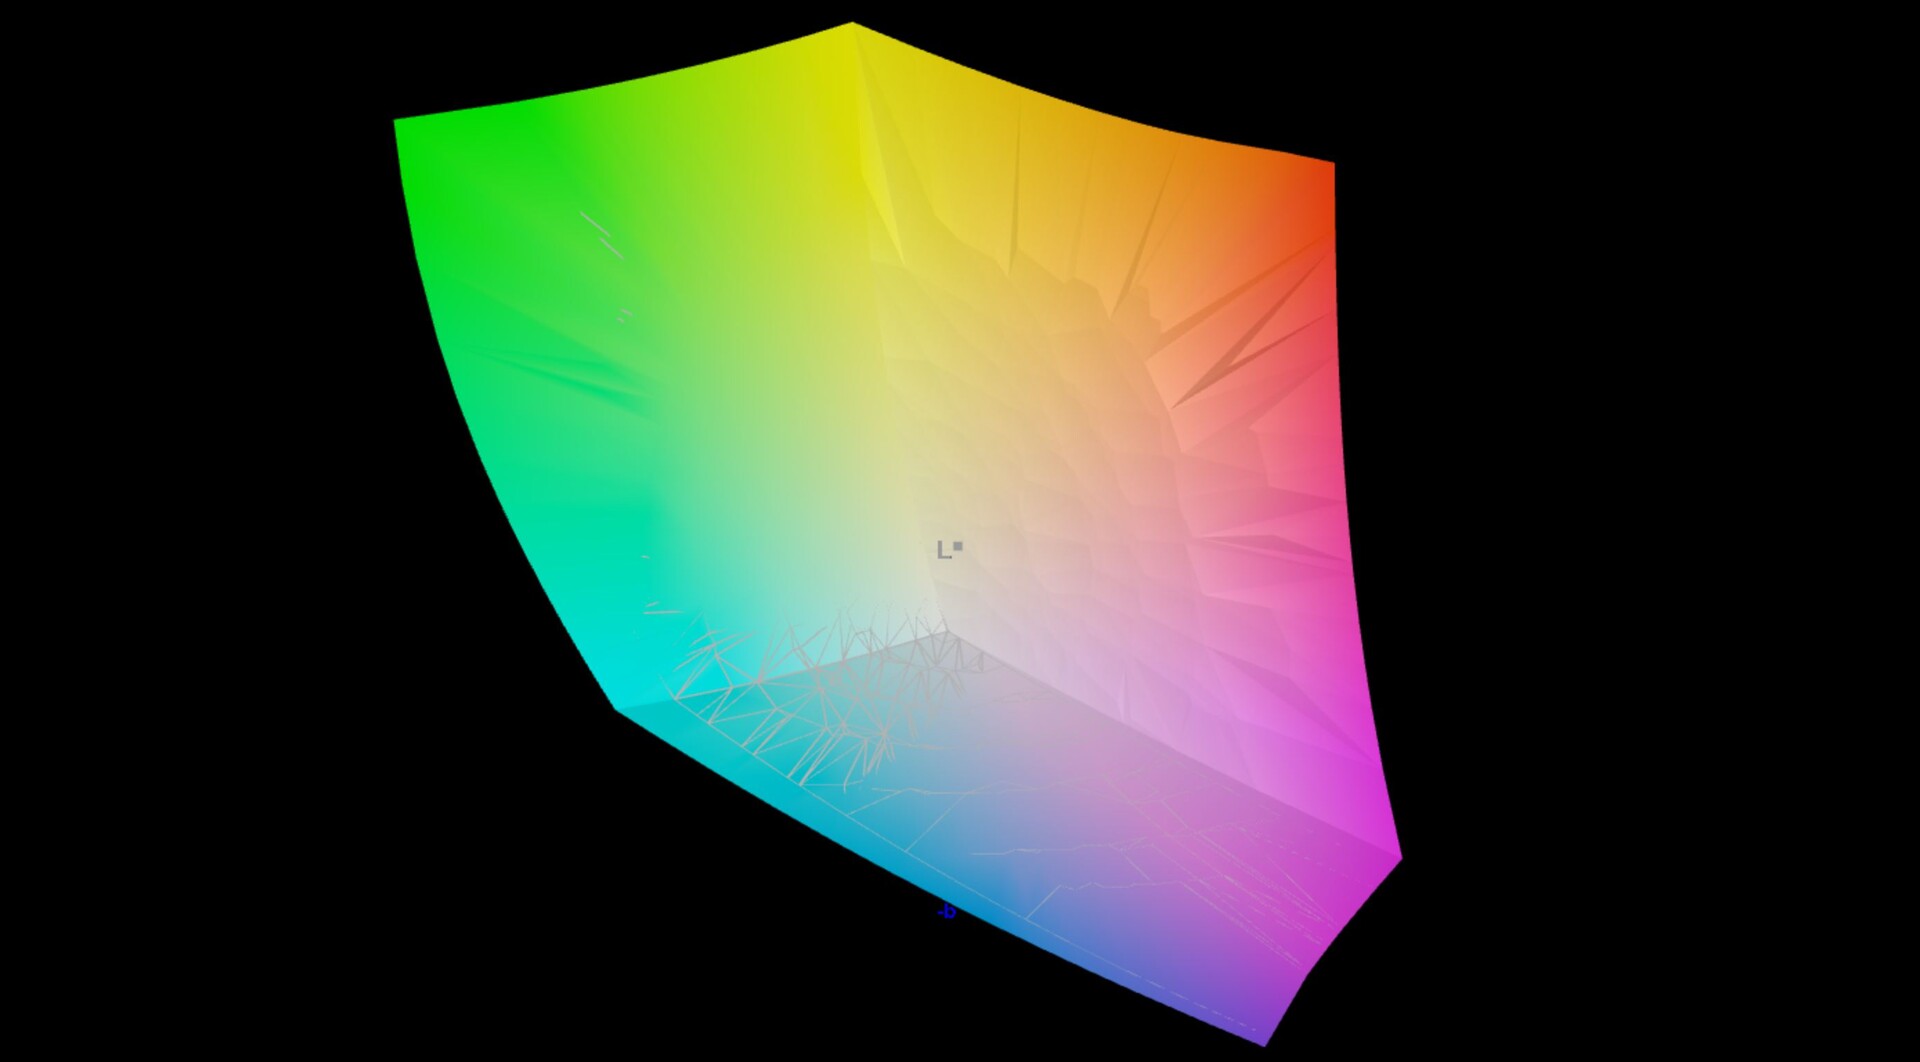
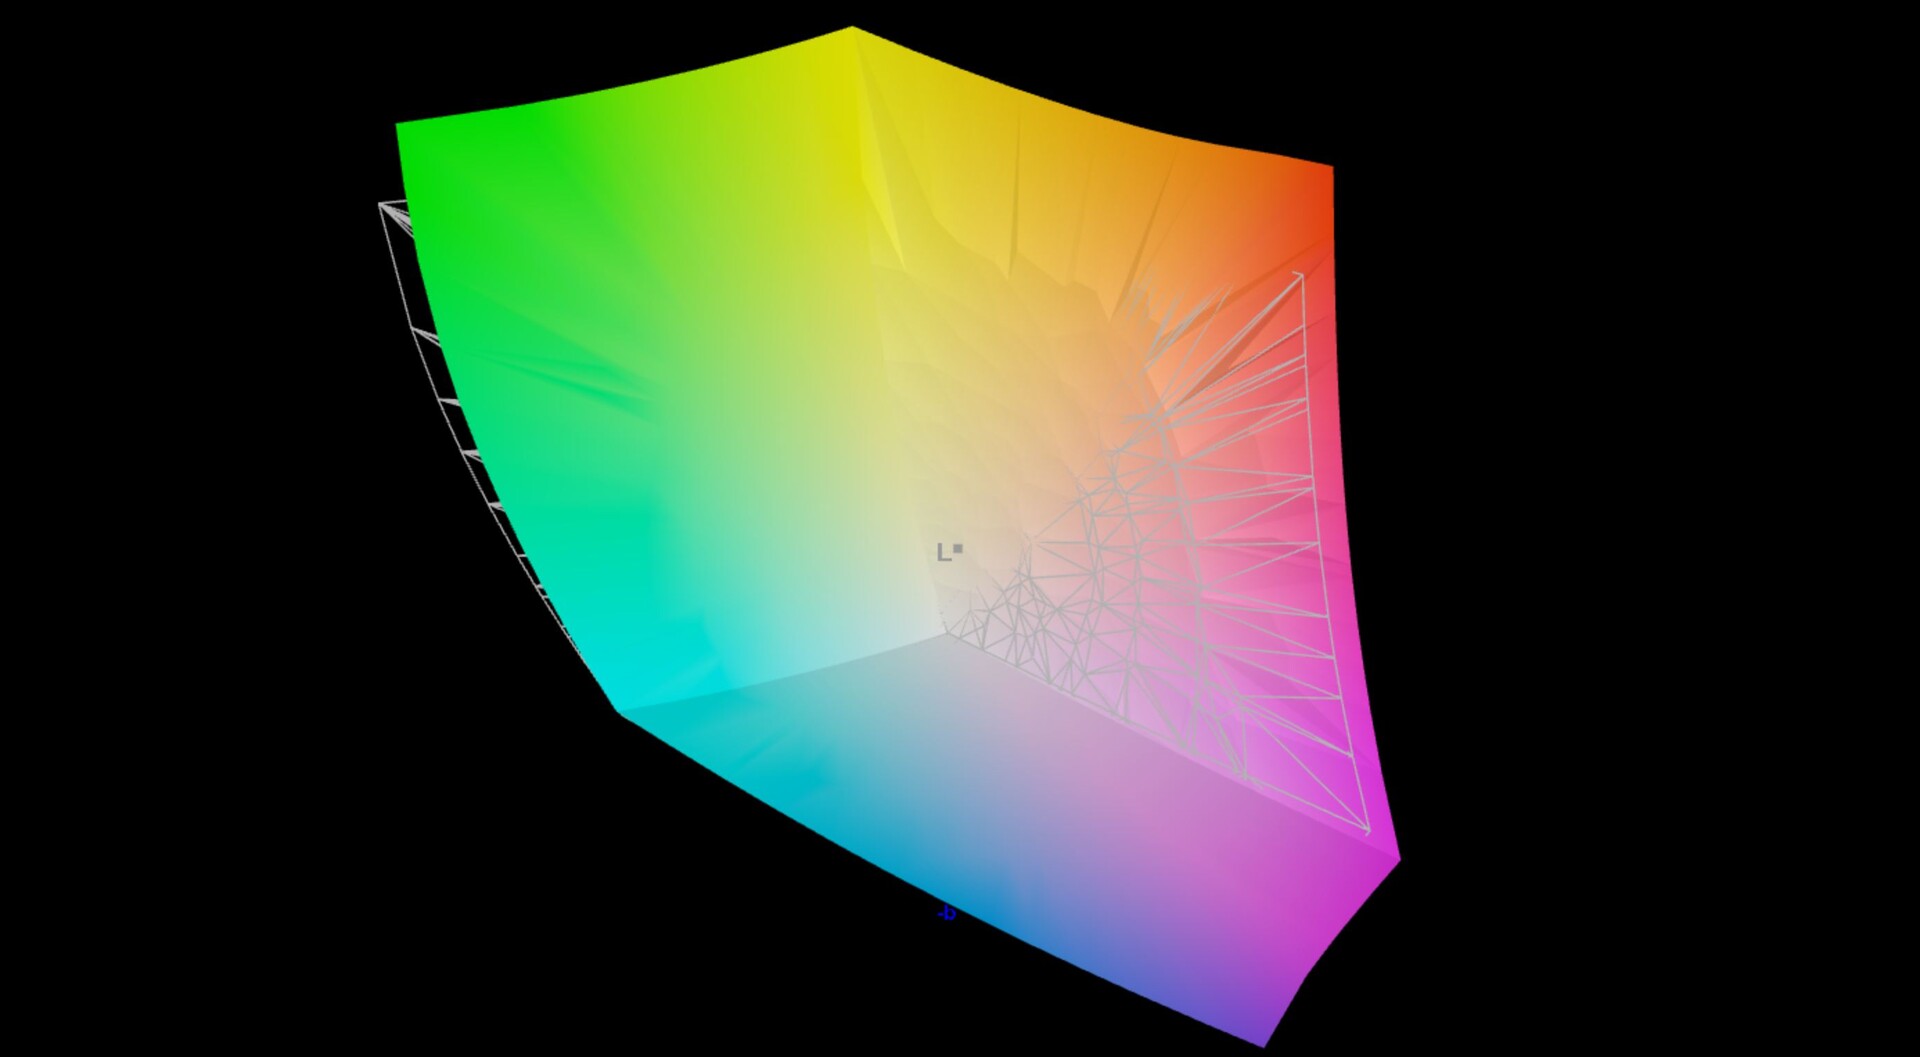
97.8% AdobeRGB 1998 (Argyll 3D)
100% sRGB (Argyll 3D)
99.8% Display P3 (Argyll 3D)
Gamma: 2.22
CCT: 6580 K
| Asus Zenbook S 13 OLED SDC4172, OLED, 2880x1800, 13.3" | Apple MacBook Air 2020 M1 Entry IPS, 2560x1600, 13.3" | Dell XPS 13 9310 OLED Samsung 134XK01, OLED, 3456x2160, 13.4" | Samsung Galaxy Book2 Pro 13 NP930XED-KA1DE ATNA33XC10-0, OLED, 1920x1080, 13.3" | Huawei MateBook 13s i5 11300H TL134GDXP02-0, LTPS, 2520x1680, 13.4" | |
|---|---|---|---|---|---|
| Display | -4% | 0% | -1% | -25% | |
| Display P3 Coverage (%) | 99.8 | 98.6 -1% | 99.7 0% | 99.81 0% | 65.2 -35% |
| sRGB Coverage (%) | 100 | 100 0% | 100 0% | 100 0% | 92 -8% |
| AdobeRGB 1998 Coverage (%) | 97.8 | 85.9 -12% | 97.7 0% | 95.55 -2% | 67.5 -31% |
| Response Times | -1415% | -18% | -55% | -1645% | |
| Response Time Grey 50% / Grey 80% * (ms) | 2.1 ? | 31 ? -1376% | 2.2 ? -5% | 4 ? -90% | 44.8 ? -2033% |
| Response Time Black / White * (ms) | 1.68 ? | 26.1 ? -1454% | 2.2 ? -31% | 2 ? -19% | 22.8 ? -1257% |
| PWM Frequency (Hz) | 240.4 ? | 118000 ? | 240.4 ? | 61 ? | 9804 ? |
| Screen | -208% | -62% | -40% | -145% | |
| Brightness middle (cd/m²) | 336 | 417 24% | 384 14% | 399 19% | 468 39% |
| Brightness (cd/m²) | 338 | 395 17% | 387 14% | 403 19% | 450 33% |
| Brightness Distribution (%) | 99 | 91 -8% | 97 -2% | 98 -1% | 92 -7% |
| Black Level * (cd/m²) | 0.02 | 0.39 -1850% | 0.07 -250% | 0.23 -1050% | |
| Contrast (:1) | 16800 | 1069 -94% | 5700 -66% | 2035 -88% | |
| Colorchecker dE 2000 * | 1.8 | 1.12 38% | 4.56 -153% | 1.35 25% | 2 -11% |
| Colorchecker dE 2000 max. * | 3.8 | 2.71 29% | 7.27 -91% | 2.77 27% | 5.5 -45% |
| Colorchecker dE 2000 calibrated * | 1.8 | 0.77 57% | 4.52 -151% | 1.35 25% | 1.5 17% |
| Greyscale dE 2000 * | 0.9 | 1.7 -89% | 1.5 -67% | 2.35 -161% | 2.6 -189% |
| Gamma | 2.22 99% | 2207 0% | 2.26 97% | 2.21 100% | 2.17 101% |
| CCT | 6580 99% | 6870 95% | 6219 105% | 6824 95% | 6511 100% |
| Color Space (Percent of AdobeRGB 1998) (%) | 87.1 | ||||
| Color Space (Percent of sRGB) (%) | 100 | ||||
| Total Average (Program / Settings) | -542% /
-337% | -27% /
-39% | -32% /
-34% | -605% /
-333% |
* ... smaller is better
Various settings for the color space are available in the preinstalled MyAsus app. We selected the preset "Native" mode for testing via the professional CalMAN software (X-Rite i1 Pro 2). Display quality is already very good in delivery state and there is no visible color cast or deviations in the color temperature. There are only two outliers in the colors, which are slightly above the important DeltaE-2000 deviation of 3.

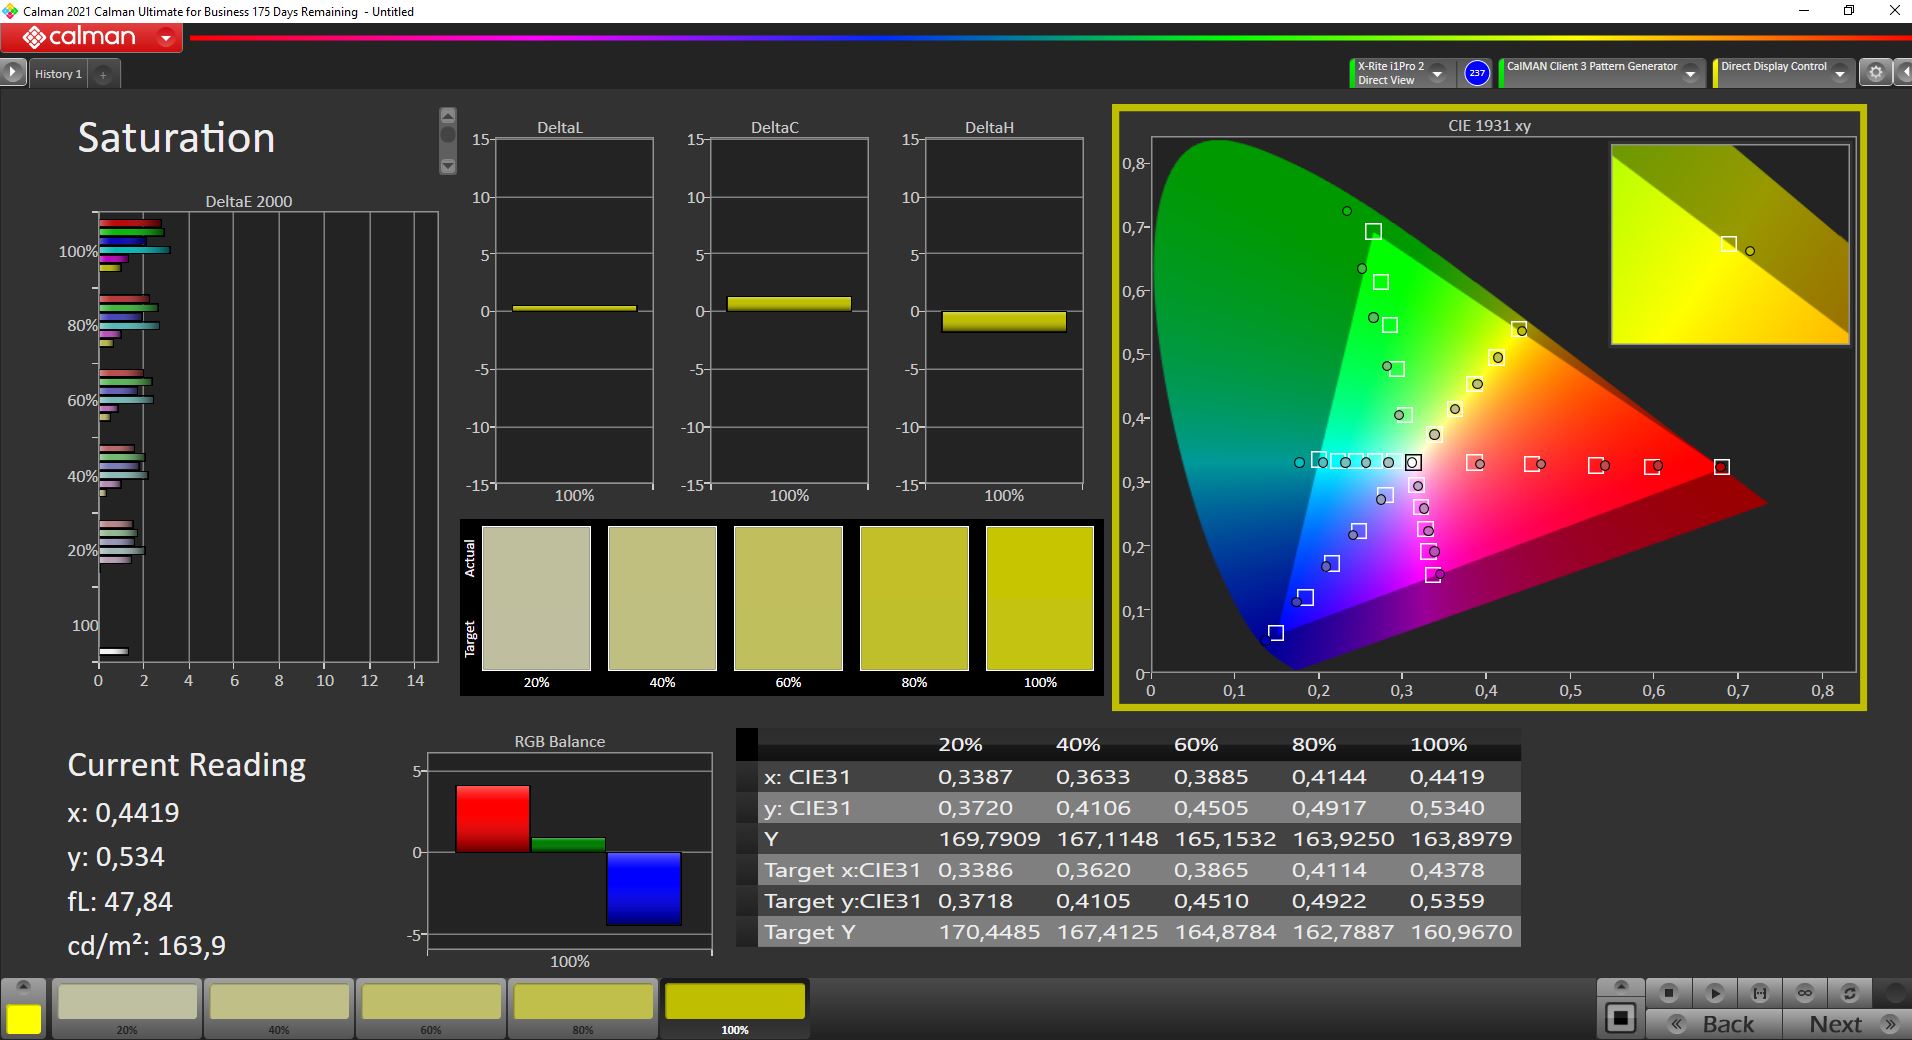
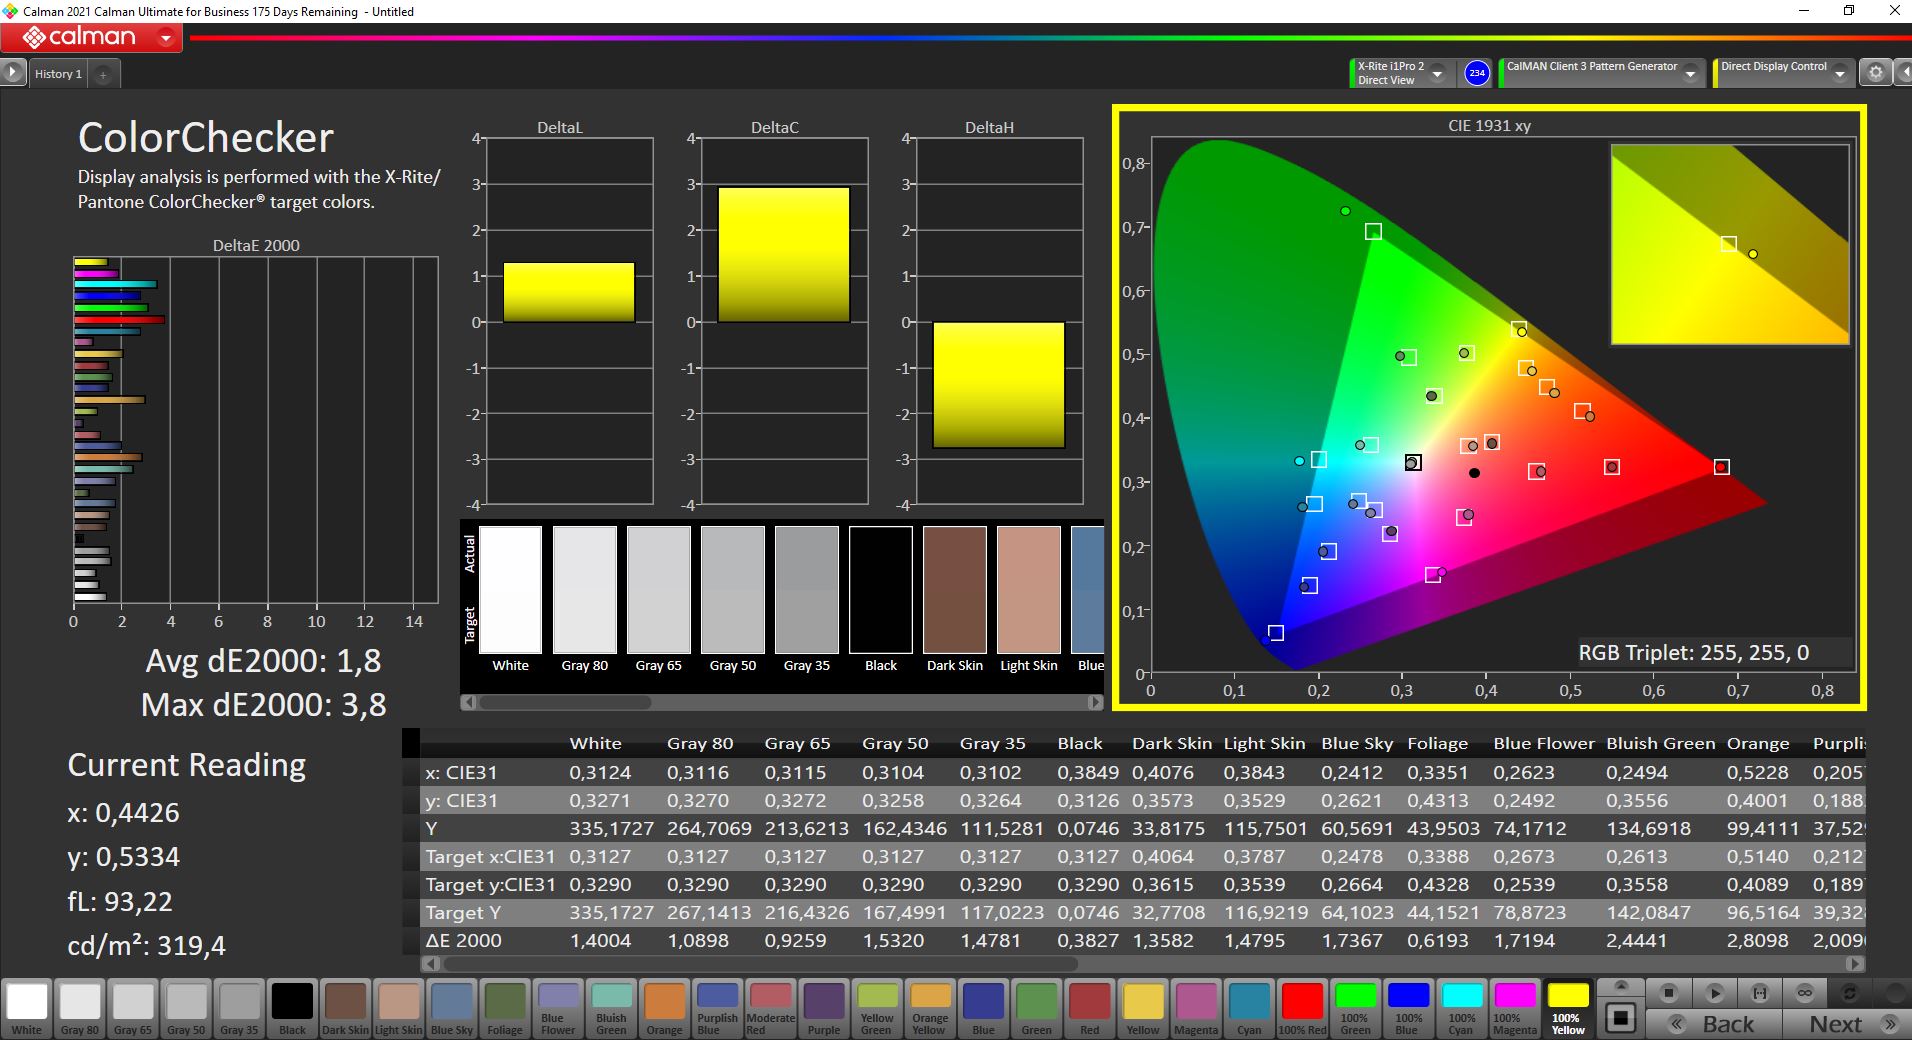
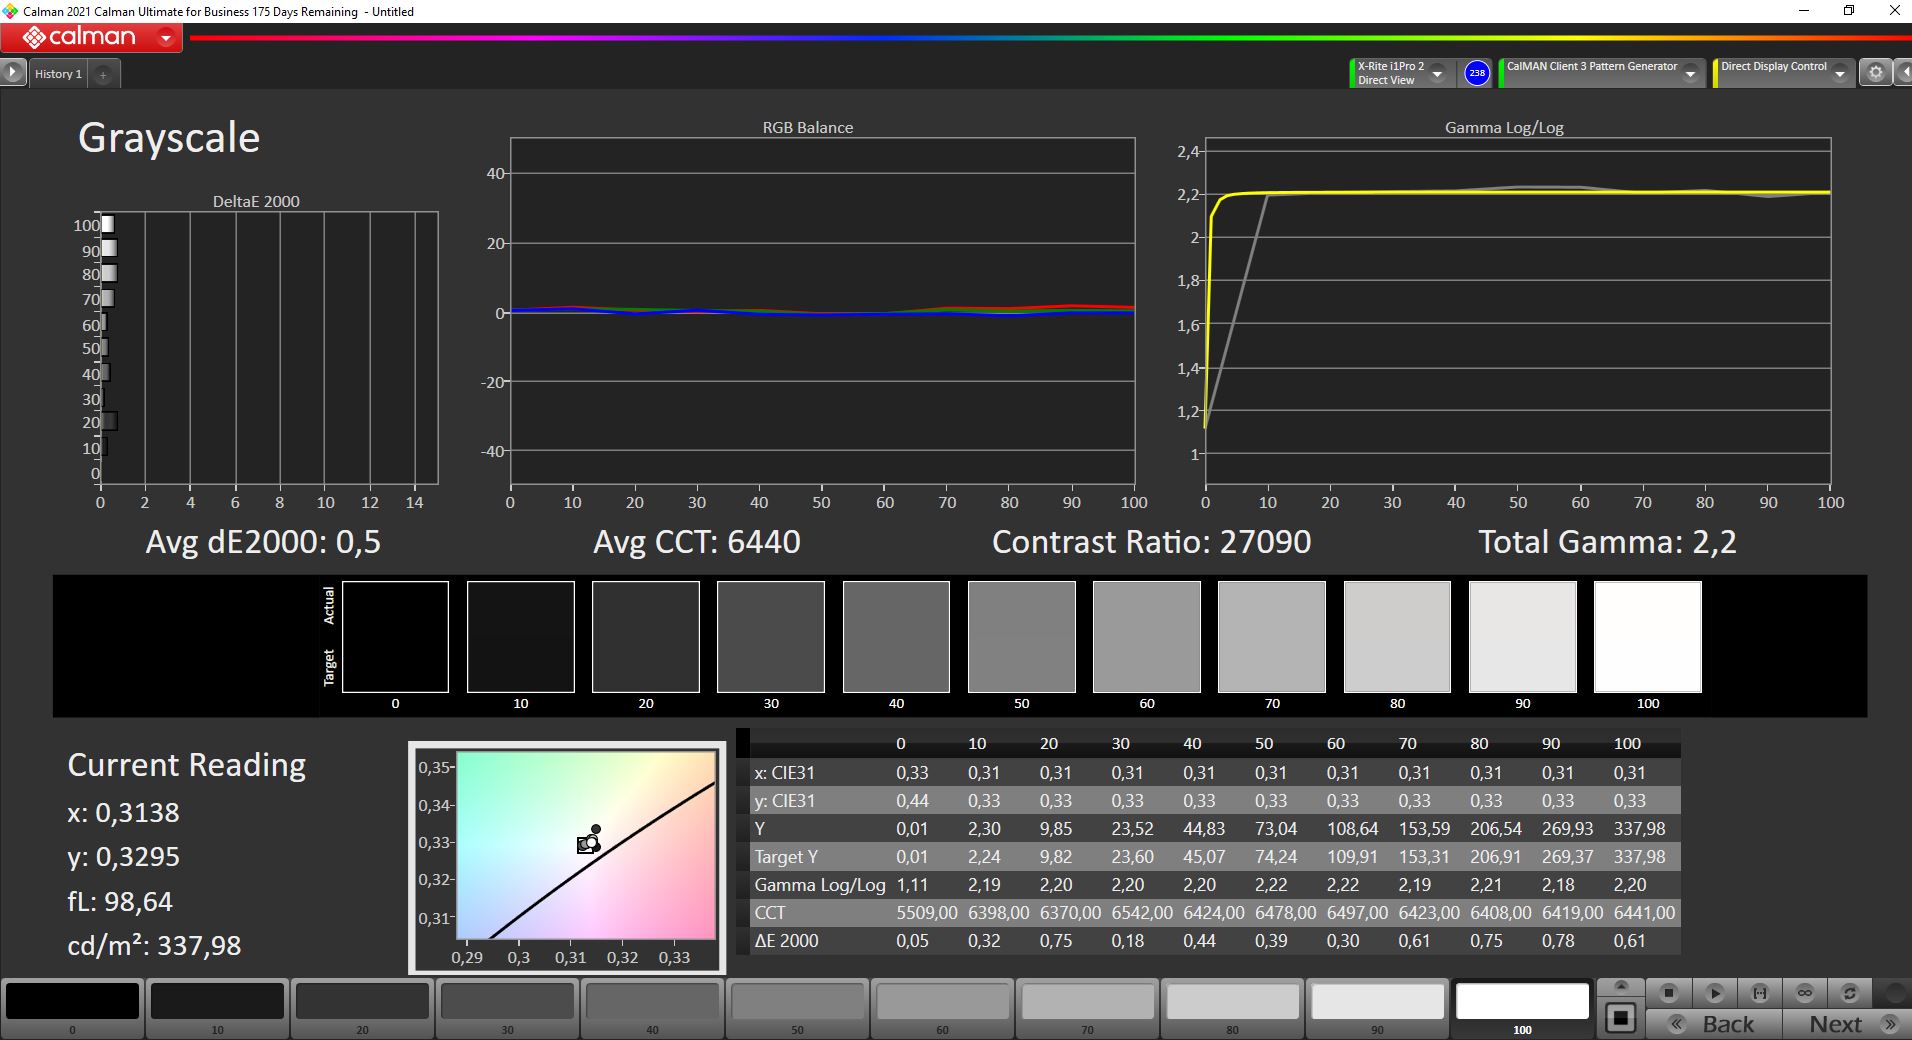
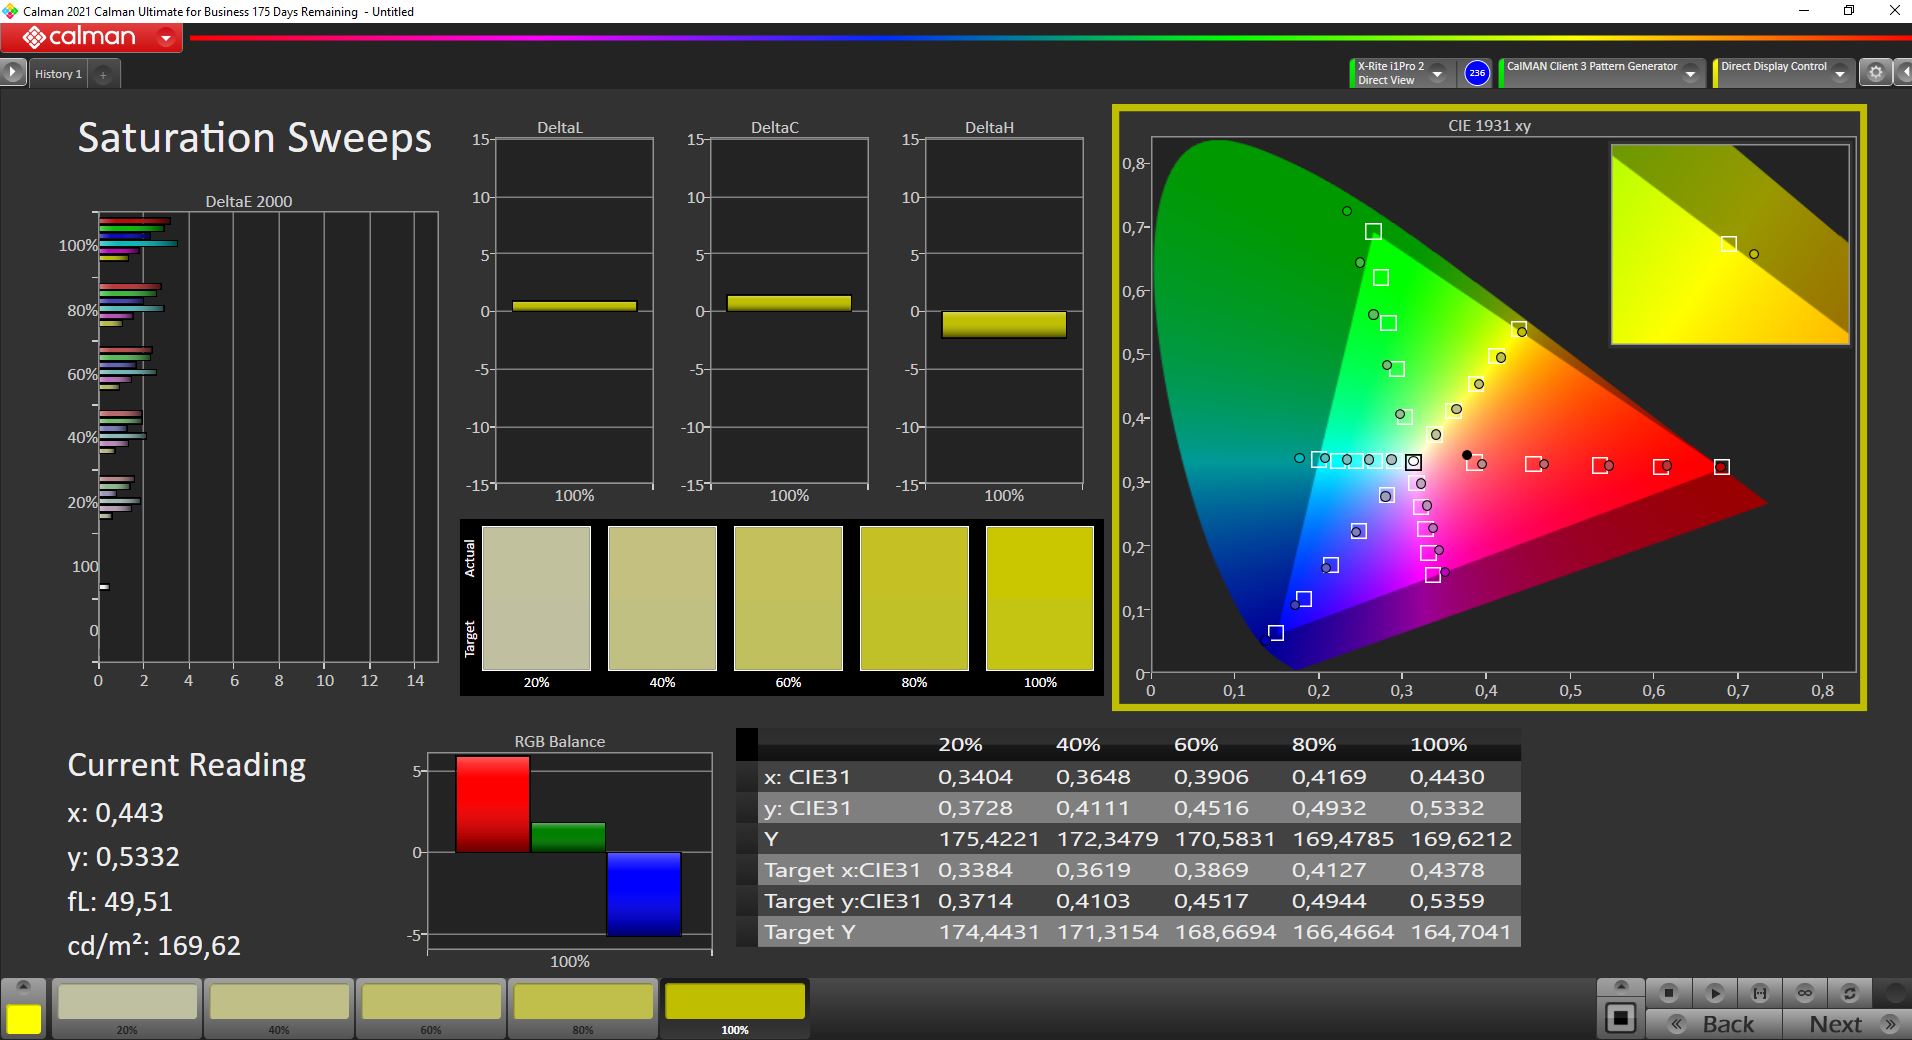

Naturally, we also calibrated the panel (the corresponding profile is available for download above) and we were also able to slightly improve the average DeltaE-2000 deviation of the grayscale, but there were no changes in the colors. A calibration after purchase is therefore not really necessary. The OLED panel almost completely covers the P3 color space, so you can edit pictures/videos on the Zenbook without issue.
Display Response Times
| ↔ Response Time Black to White | ||
|---|---|---|
| 1.68 ms ... rise ↗ and fall ↘ combined | ↗ 0.86 ms rise | 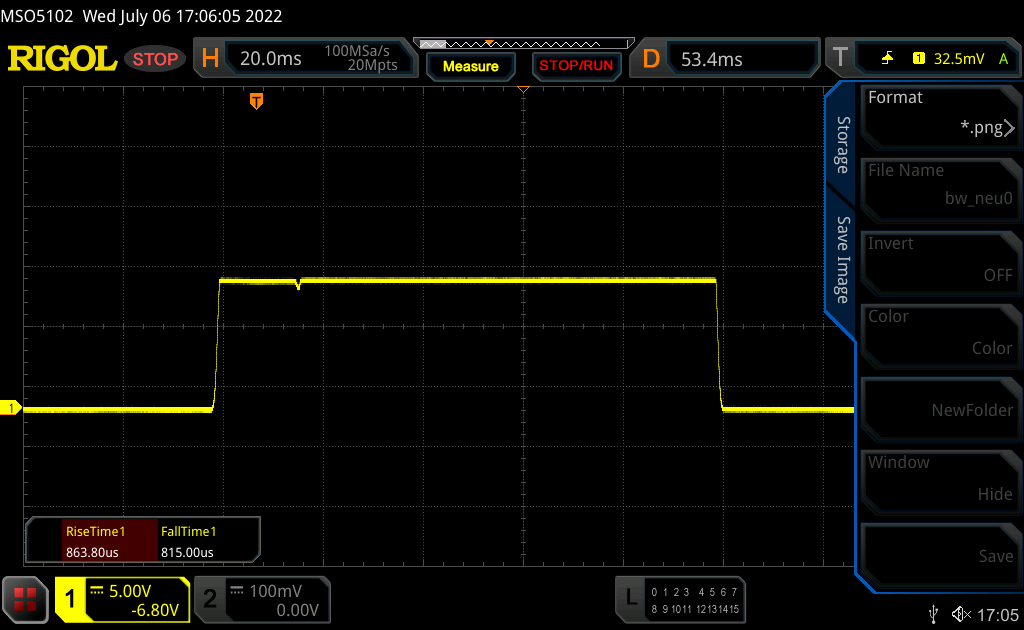 |
| ↘ 0.82 ms fall | ||
| The screen shows very fast response rates in our tests and should be very well suited for fast-paced gaming. In comparison, all tested devices range from 0.1 (minimum) to 240 (maximum) ms. » 9 % of all devices are better. This means that the measured response time is better than the average of all tested devices (20 ms). | ||
| ↔ Response Time 50% Grey to 80% Grey | ||
| 2.1 ms ... rise ↗ and fall ↘ combined | ↗ 1.1 ms rise | 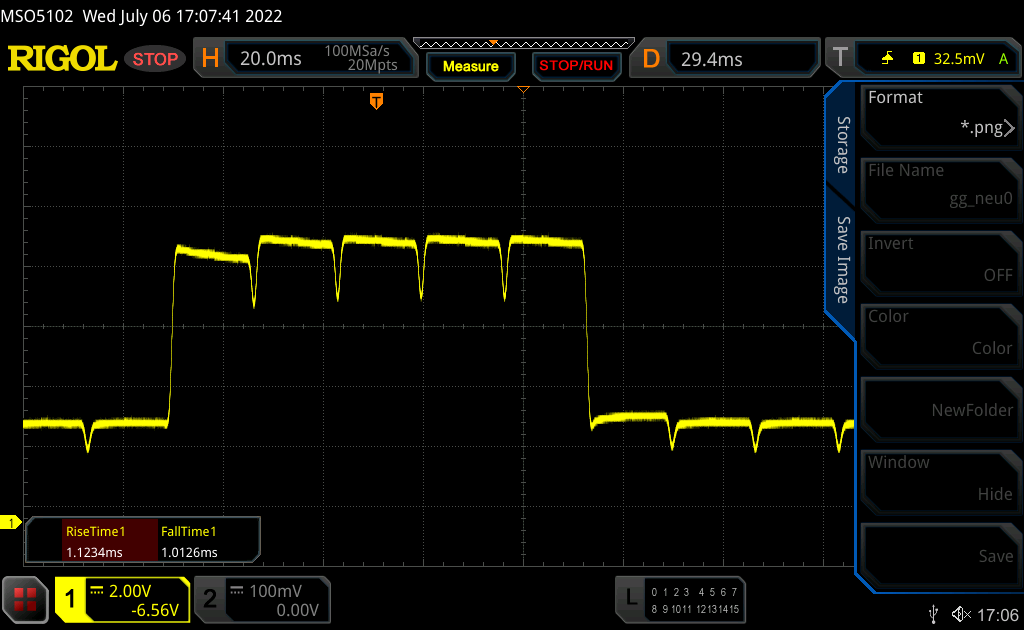 |
| ↘ 1 ms fall | ||
| The screen shows very fast response rates in our tests and should be very well suited for fast-paced gaming. In comparison, all tested devices range from 0.165 (minimum) to 636 (maximum) ms. » 10 % of all devices are better. This means that the measured response time is better than the average of all tested devices (31.4 ms). | ||
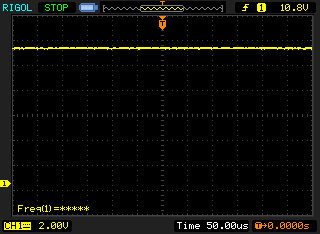
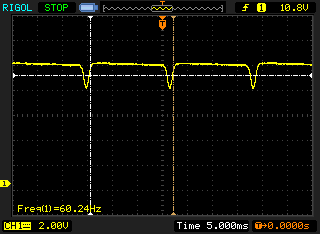
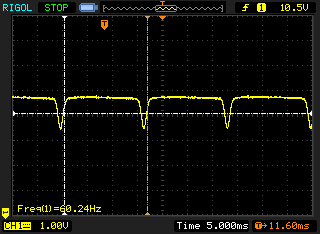
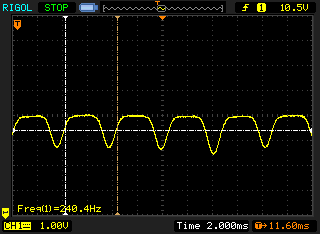
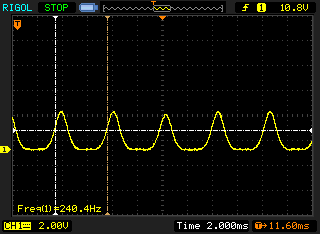
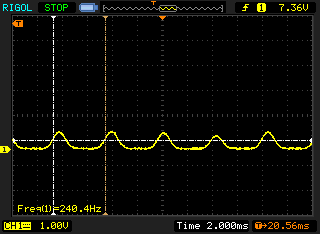
Screen Flickering / PWM (Pulse-Width Modulation)
| Screen flickering / PWM detected | 240.4 Hz | ≤ 53 % brightness setting | 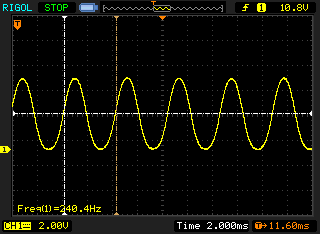 |
The display backlight flickers at 240.4 Hz (worst case, e.g., utilizing PWM) Flickering detected at a brightness setting of 53 % and below. There should be no flickering or PWM above this brightness setting. The frequency of 240.4 Hz is relatively low, so sensitive users will likely notice flickering and experience eyestrain at the stated brightness setting and below. In comparison: 53 % of all tested devices do not use PWM to dim the display. If PWM was detected, an average of 7979 (minimum: 5 - maximum: 343500) Hz was measured. | |||
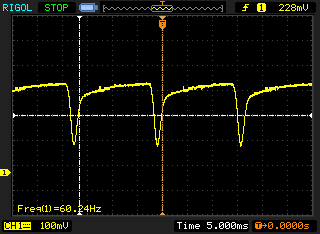
Like the ZenBook Pro 14 Duo, the OLED panel of the Zenbook S 13 displays PWM flickering at 240 Hz, which can lead to impairments. On the other hand, DC dimming is used for brightness values of 54% and more. Although the frequency is 60 Hz, it is not comparable with classic PWM and the amplitude is also significantly lower, so there should be no problems with DC dimming. Asus also offers a software-based solution for reducing the screen's brightness without falling into the PWM range and there is also a corresponding notification as soon as you reduce the normal brightness below 60%. For this, there is the flicker-free OLED dimming option in the MyAsus app. Users should keep in mind that when using OLED dimming, DC dimming is always used, even if the base brightness is set to 100%.
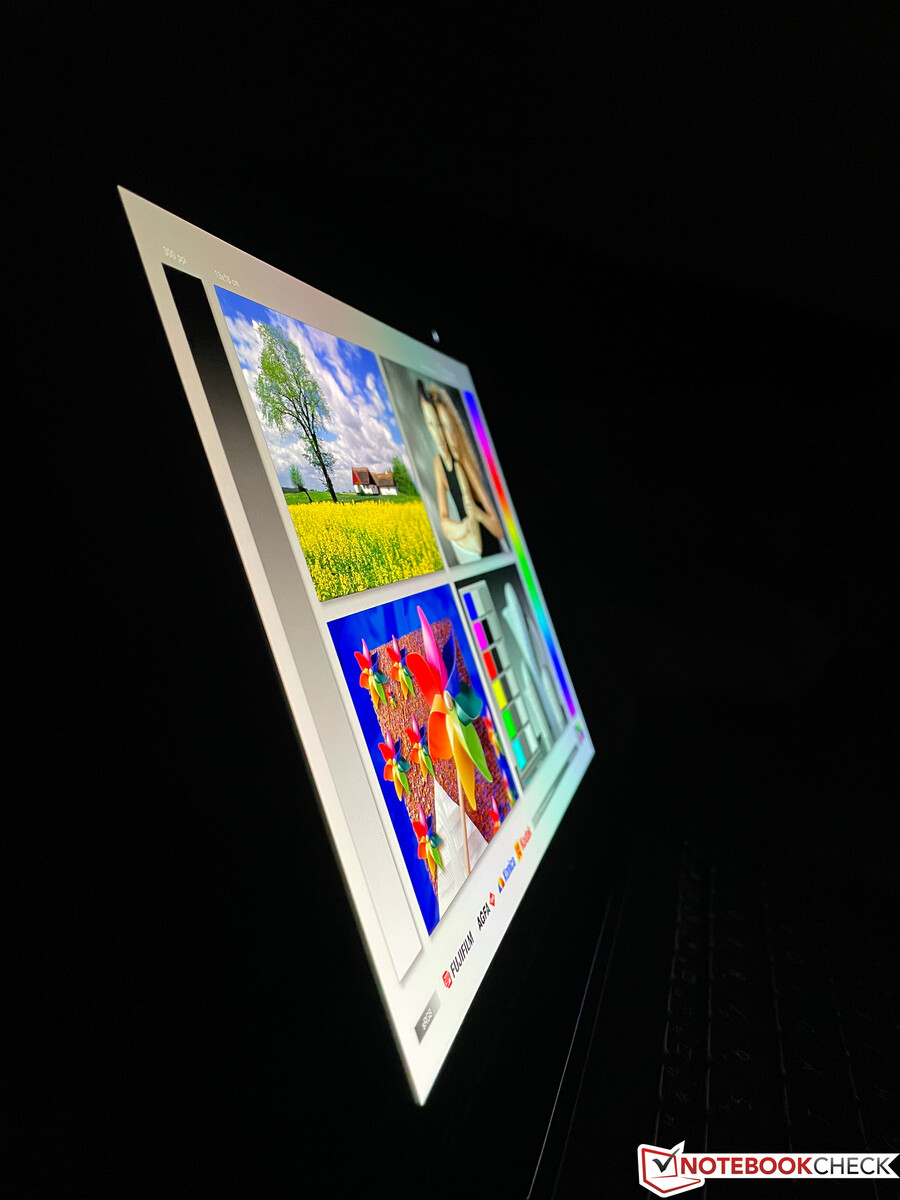
The OLED touchscreen is highly reflective, which can also cause reflections indoors. Of course, this also applies to outdoor use. Although the brightness is not so high, the very high contrast ratio helps in these situations. That said, avoiding reflections and reading screen content comfortably is not easy on bright days. Full HDR brightness in normal SDR mode would certainly be helpful here.
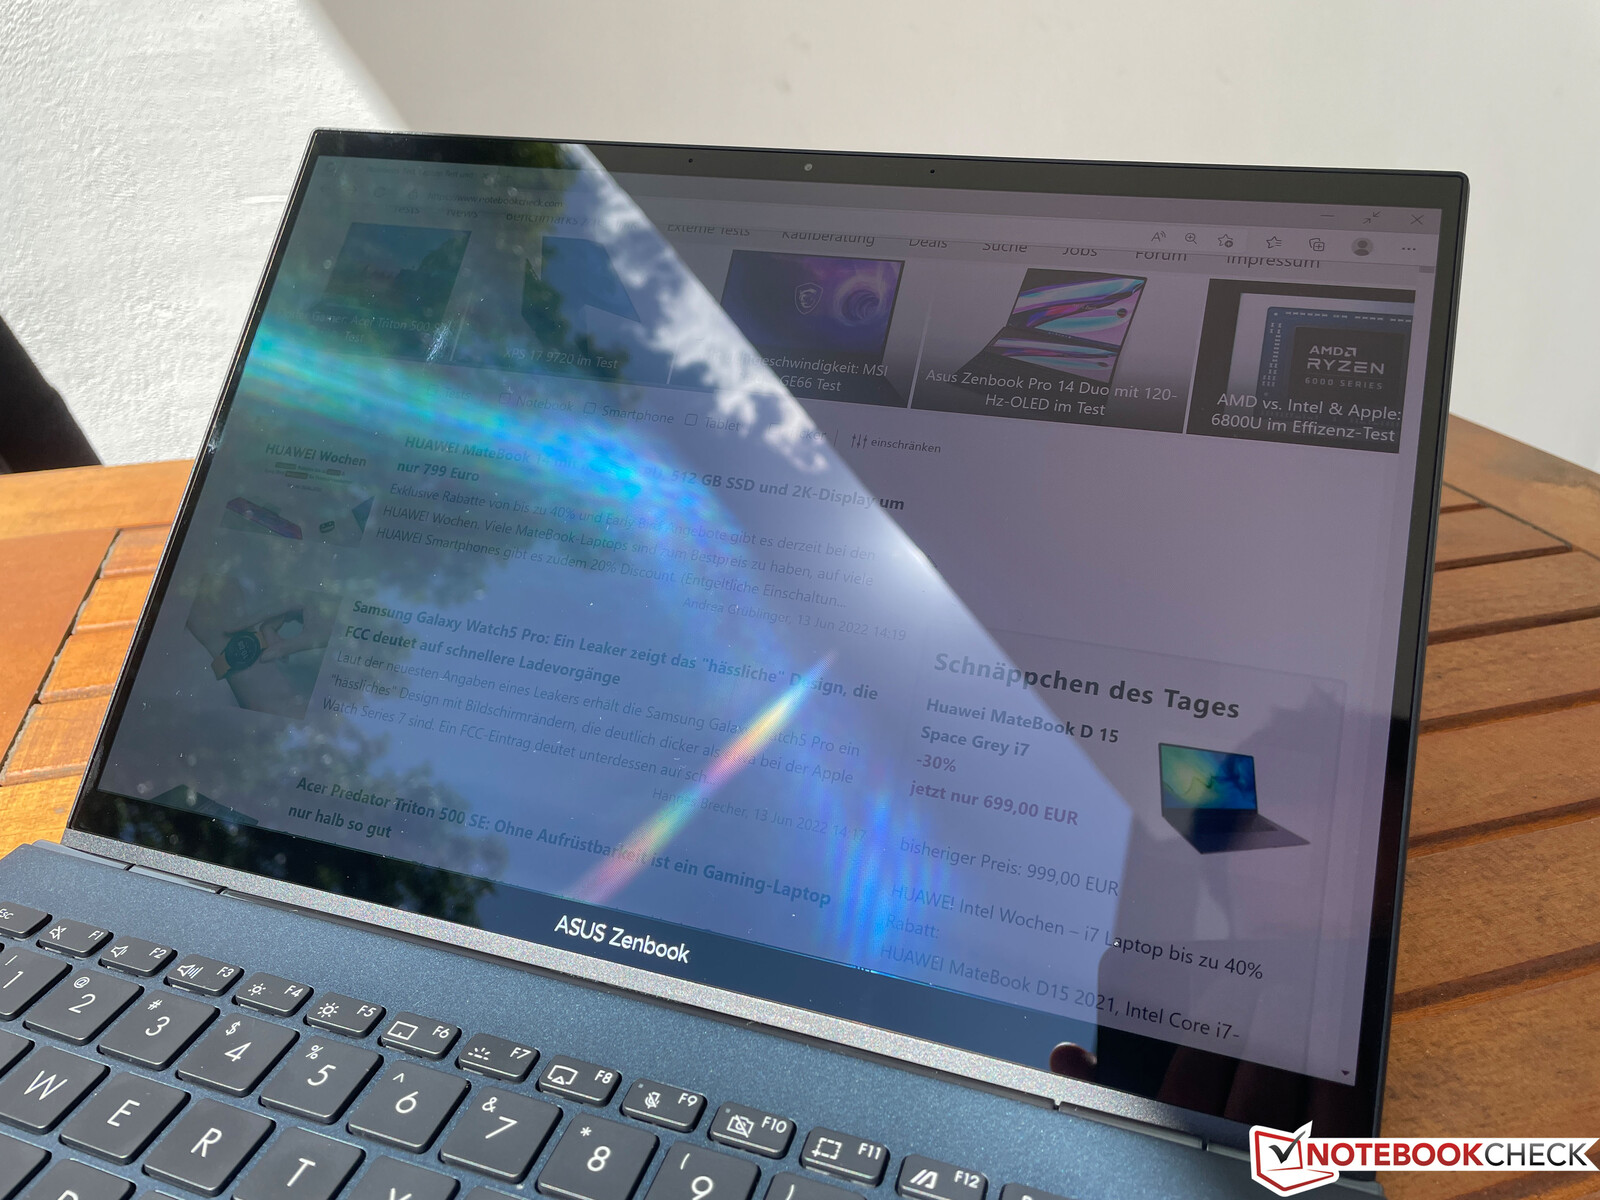
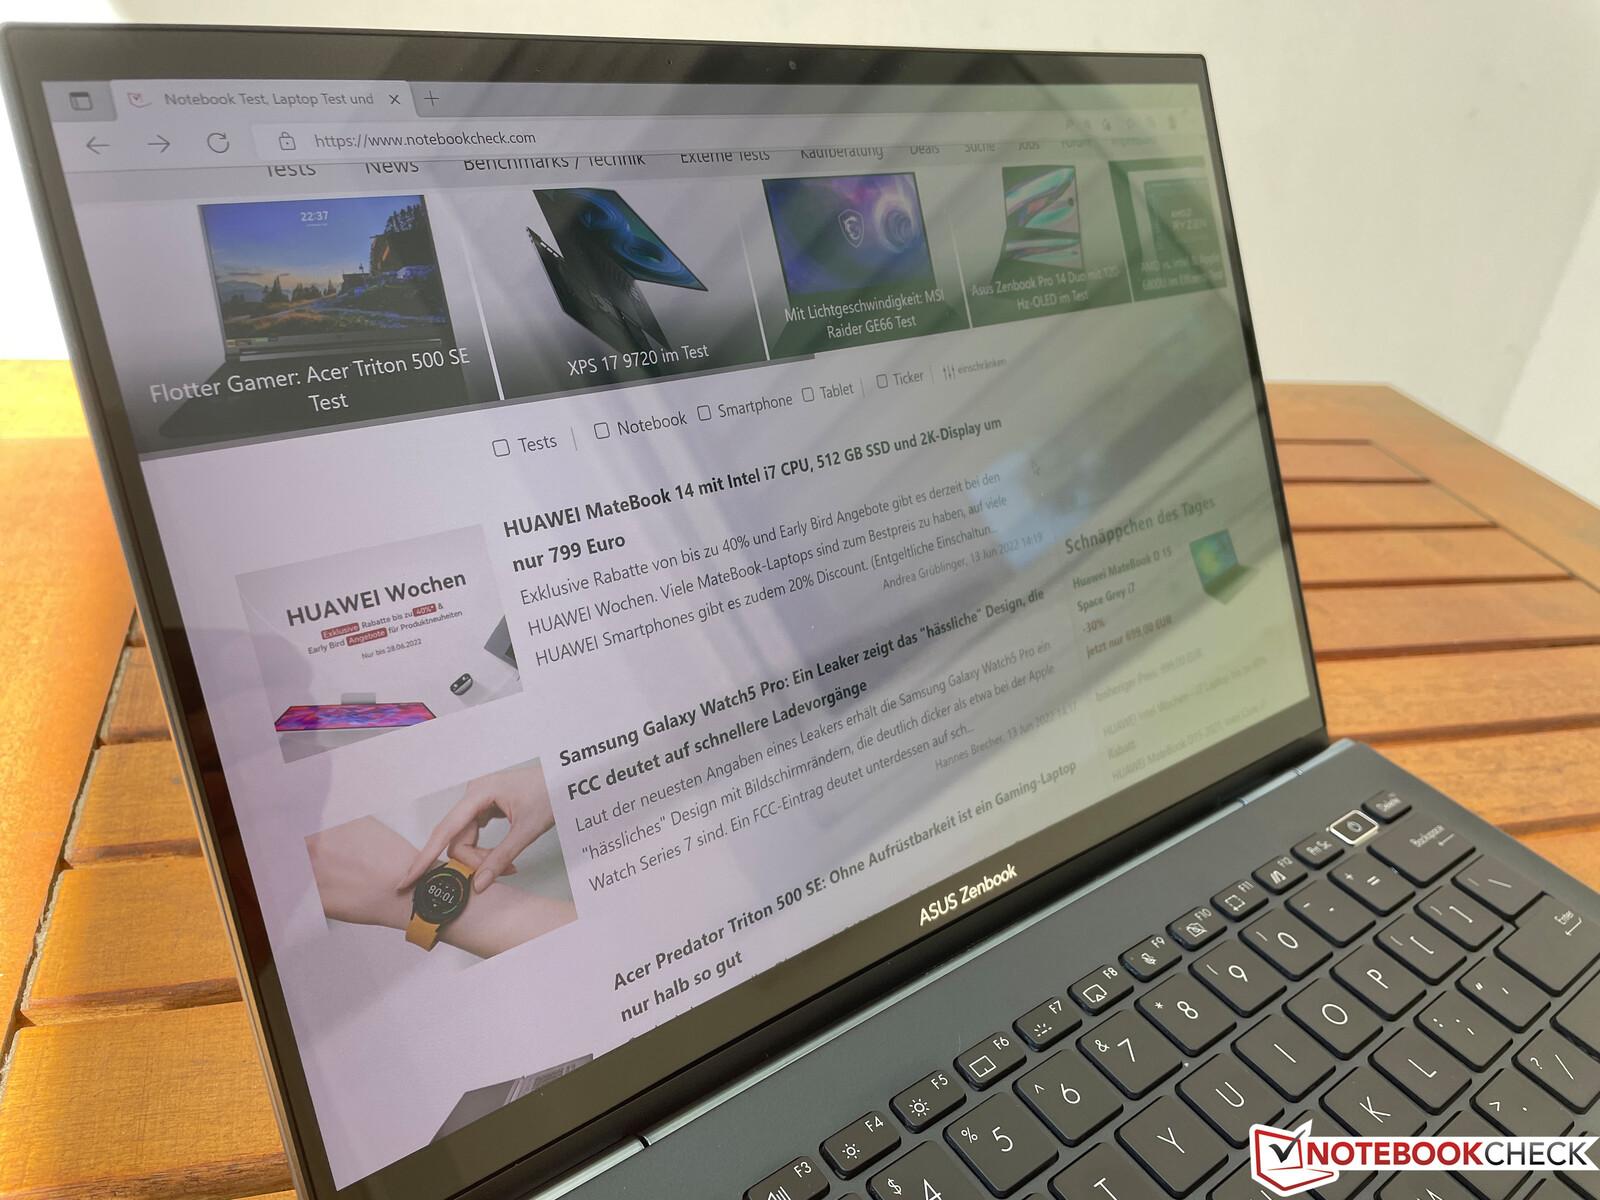
The viewing angle stability of the OLED screen is very good overall, but there is the typical OLED blue tinge at certain (limited) angles. Nevertheless, this does not cause any restrictions in practice.
Performance: AMD Zen3+ und RDNA2
Testing Conditions
We performed the following benchmarks and measurements under the (default) Balanced power mode in the MyAsus app, since the optional Performance mode (only available when plugged in) initially has no impact on TDP limits (30/25W each) and only leads to slightly more stable performance under permanent load, which is certainly not a crucial factor in such a mobile device. Balanced mode is simply more appropriate for the device in everyday use, and if you do indeed want to max out the device, you can easily switch to Performance mode. Nonetheless, we'll also look at the effects of Performance mode in some test areas. In the optional Whisper mode, processor consumption is limited to 12 watts.
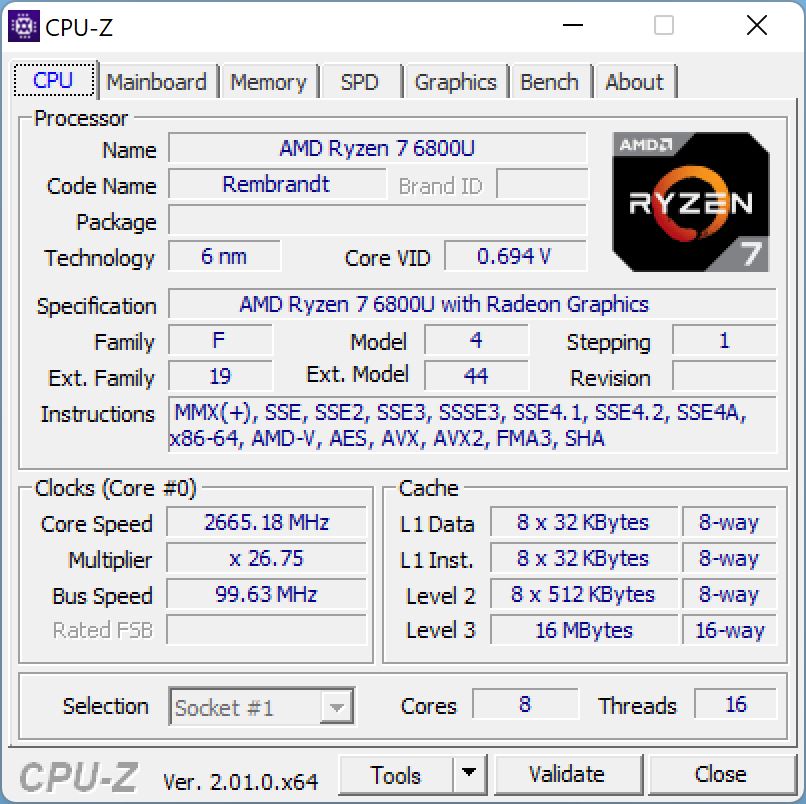
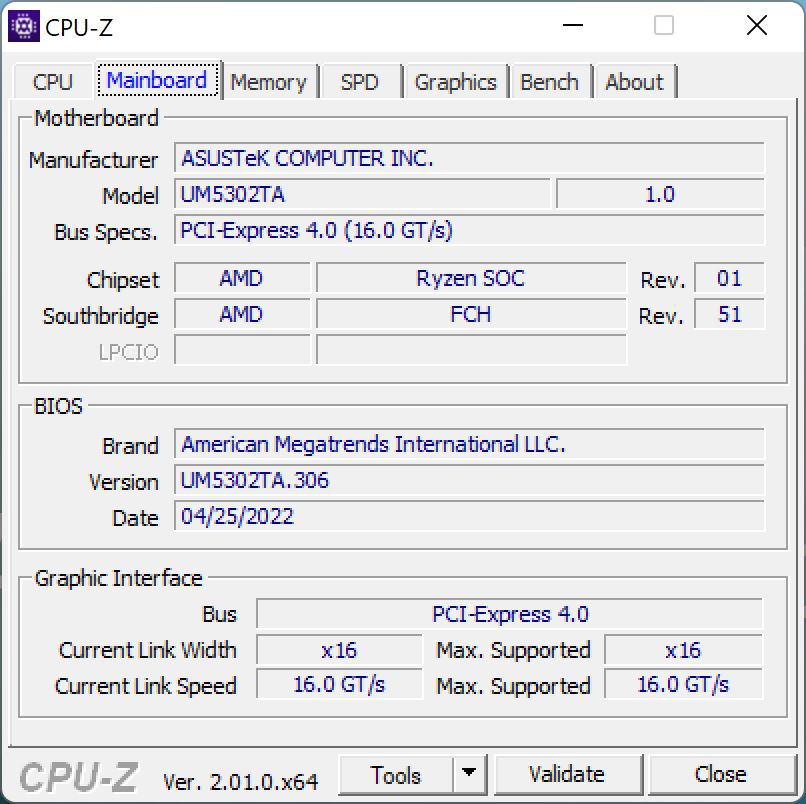
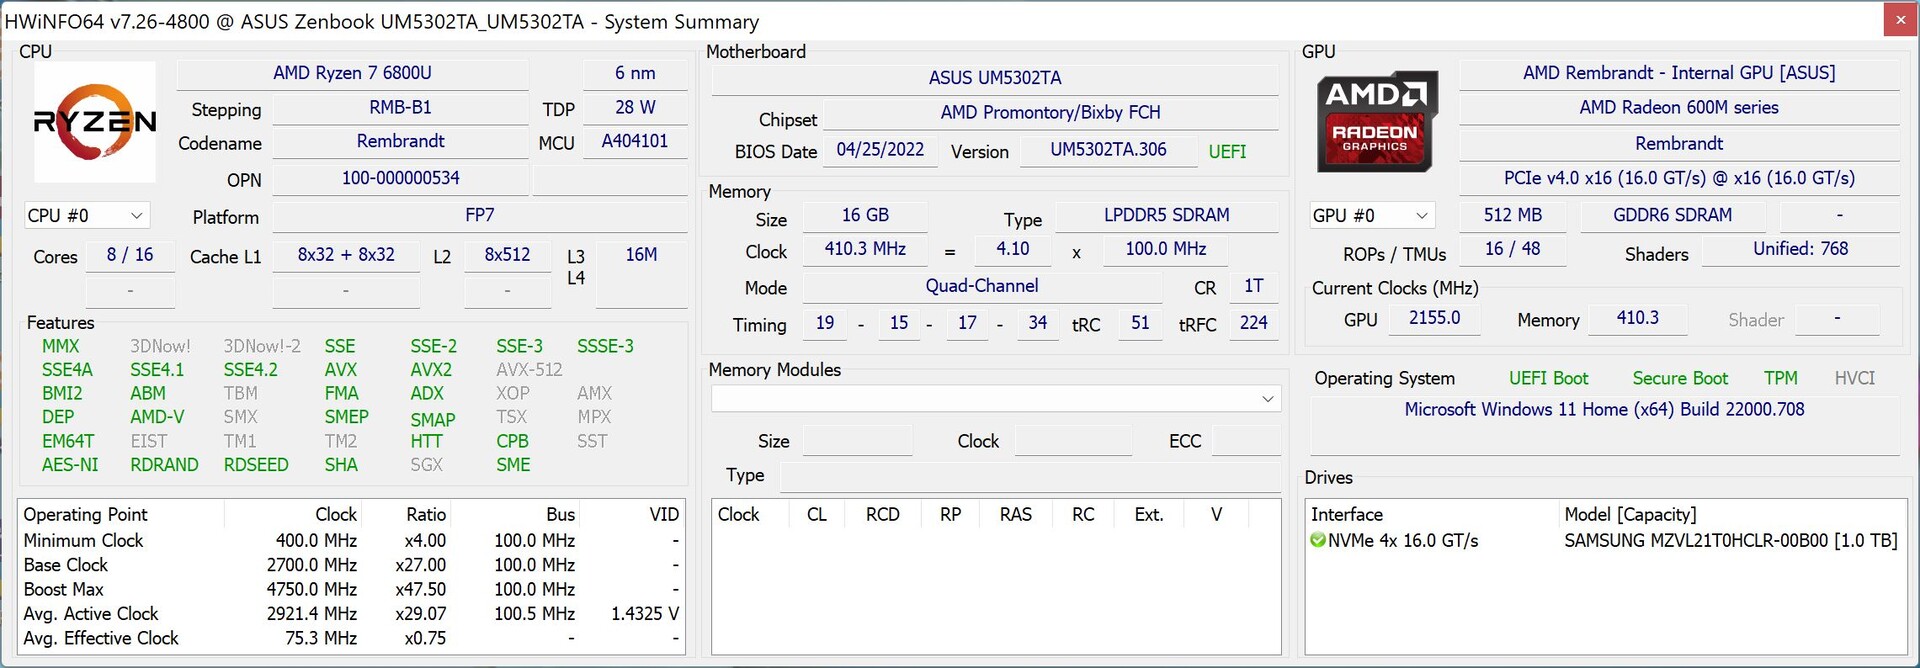
Processor: Ryzen 7 6800U with 8 cores
Like its Ryzen 7 5800U predecessor, the new AMD Ryzen 7 6800U continues to use 8 cores (16 threads), which are now manufactured using a 6 nm process. AMD specifies a TDP range of 15-28 watts for the chip, and in the case of the Zenbook, this is 30 watts for short periods of load and a stable 25 watts afterwards. Here we see a clear difference to the current Alder Lake processors from Intel, which have significantly higher power limits of more than 50 watts at their disposal.
Cinebench R15 Multi Sustained Load
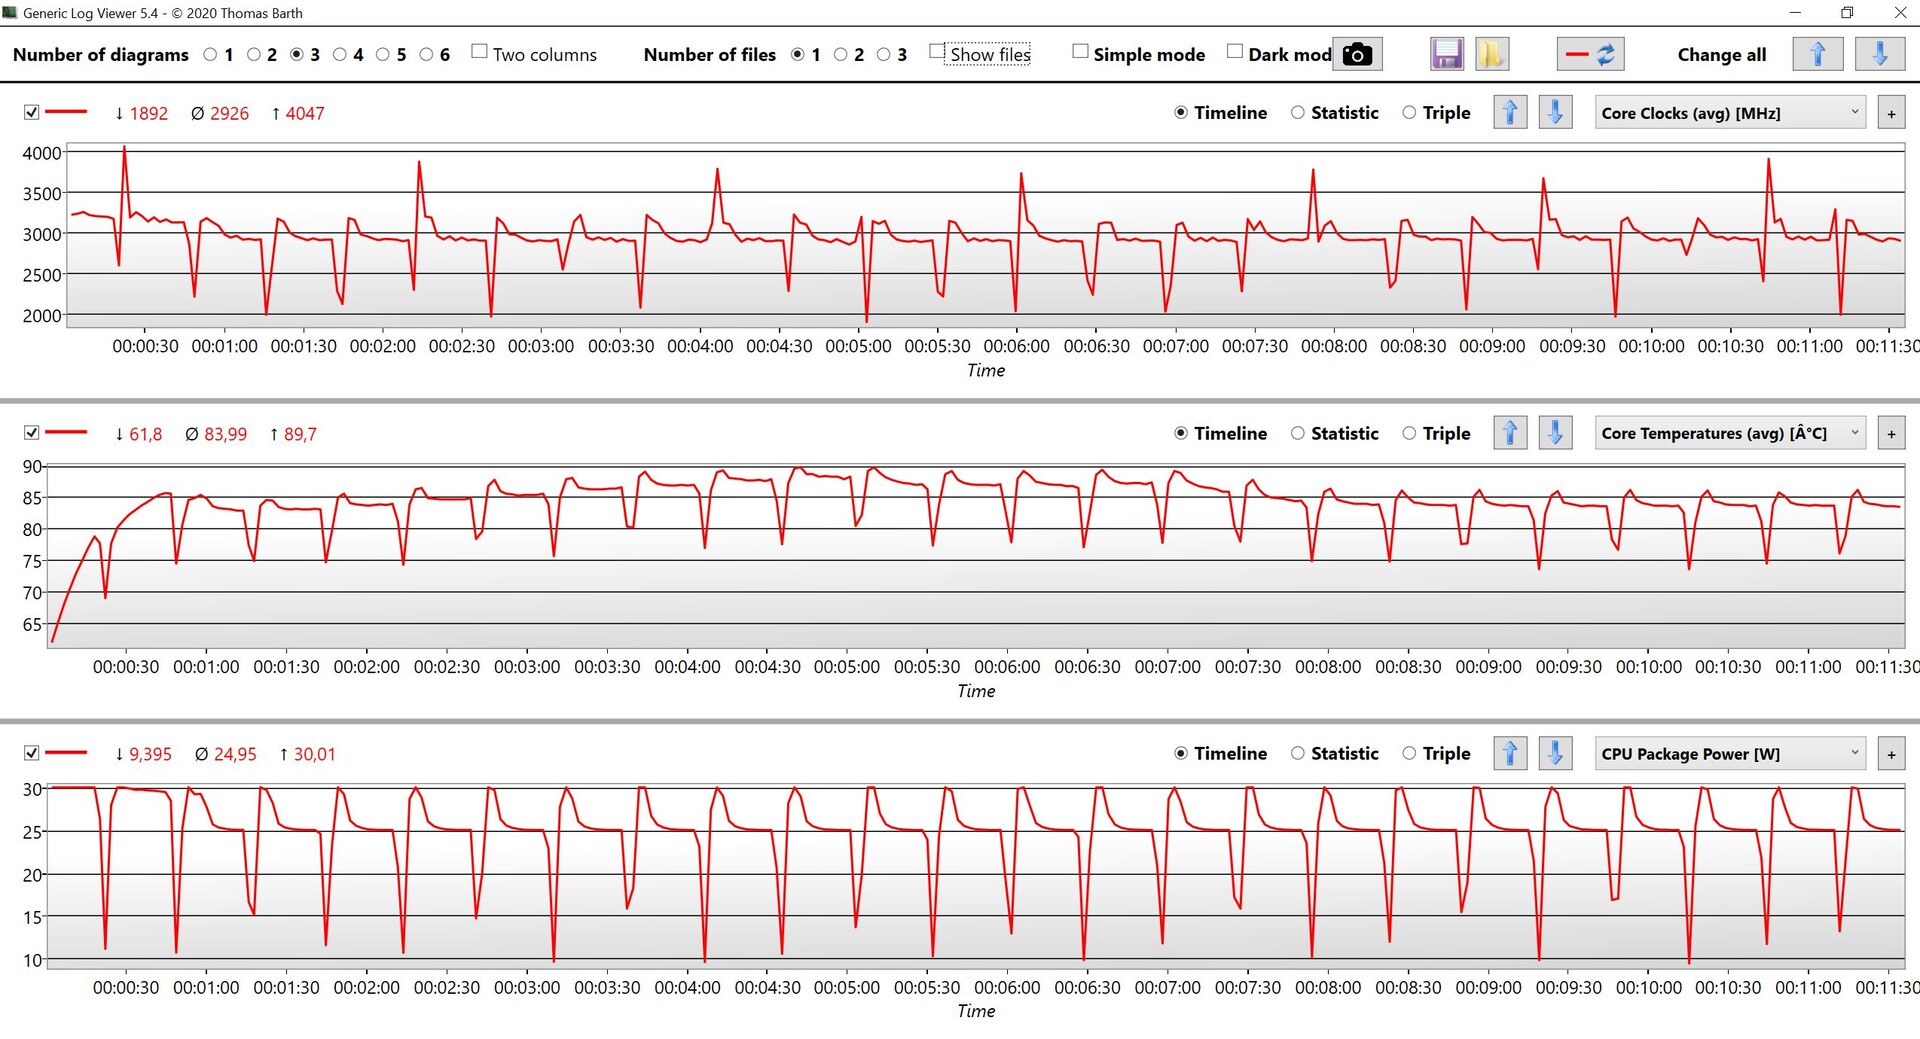
The Cinebench R15 multi-loop clearly shows that the Ryzen 7 6800U only loses a little performance after the first few runs before operating stably at 25 watts. However, there is no noticeable performance advantage over the old Ryzen 7 5800U either. The CB loop shows no benefits in performance mode.
The real competitor for the Ryzen 7 is the new Core i7-1255U, which we were able to test in the Dell Inspiron 14. This consumes up to 39 watts for short periods of time before quickly leveling out at 23 watts, which is comparable to the Ryzen 7 6800U. However, the multi-core performance [of the Core i7-1255U] is significantly lower (-30% during the CB loop). In fact, the Alder Lake P Core i7-1260P chip is comparable in terms of multi-core performance, although it naturally requires significantly more power (a constant 38 watts) due to the additional performance cores.
In terms of raw single-core performance, AMD and Apple are practically on par (although Apple is much more efficient here), but Intel gains the lead here thanks to the performance cores. However, this comes at the cost of higher clock rates and higher power consumption, which also usually leads to increased fan activity.
All in all, the new Ryzen 7 6800U, with its power limits, is a suitable processor for compact laptops. However, performance is somewhat reduced in battery mode because the processor is only allowed to consume a maximum of 18 watts, which drops to 16 watts after a few seconds. This does not affect single-core performance, while multi-core performance is about 25% lower. In Whisper mode at 12 watts, multi-core performance drops by around 35%.
More benchmarks are available in our tech section and we also recommend taking a look at our extensive CPU efficiency comparison review, where we compare the new AMD processor with the current chips from Apple and Intel.
Cinebench R23: Multi Core | Single Core
Cinebench R20: CPU (Multi Core) | CPU (Single Core)
Cinebench R15: CPU Multi 64Bit | CPU Single 64Bit
Blender: v2.79 BMW27 CPU
7-Zip 18.03: 7z b 4 | 7z b 4 -mmt1
Geekbench 5.5: Multi-Core | Single-Core
HWBOT x265 Benchmark v2.2: 4k Preset
LibreOffice : 20 Documents To PDF
R Benchmark 2.5: Overall mean
| CPU Performance rating | |
| Average of class Subnotebook | |
| Lenovo Yoga 9i 14 2022 i7-1260P | |
| Apple MacBook Pro 14 2021 M1 Pro Entry -8! | |
| Asus Zenbook S 13 OLED | |
| Average AMD Ryzen 7 6800U | |
| Lenovo ThinkBook 13s G3 20YA0005GE | |
| Dell Inspiron 14 7420 2-in-1 | |
| Apple MacBook Air 2020 M1 Entry -1! | |
| Huawei MateBook 13s i5 11300H | |
| Dell XPS 13 9310 OLED | |
| Samsung Galaxy Book2 Pro 13 NP930XED-KA1DE | |
| Cinebench R23 / Multi Core | |
| Average of class Subnotebook (1555 - 21812, n=64, last 2 years) | |
| Lenovo Yoga 9i 14 2022 i7-1260P | |
| Average AMD Ryzen 7 6800U (9130 - 11741, n=7) | |
| Asus Zenbook S 13 OLED | |
| Apple MacBook Pro 14 2021 M1 Pro Entry | |
| Lenovo ThinkBook 13s G3 20YA0005GE | |
| Apple MacBook Air 2020 M1 Entry | |
| Dell Inspiron 14 7420 2-in-1 | |
| Samsung Galaxy Book2 Pro 13 NP930XED-KA1DE | |
| Huawei MateBook 13s i5 11300H | |
| Dell XPS 13 9310 OLED | |
| Cinebench R23 / Single Core | |
| Lenovo Yoga 9i 14 2022 i7-1260P | |
| Dell Inspiron 14 7420 2-in-1 | |
| Average of class Subnotebook (358 - 2165, n=65, last 2 years) | |
| Apple MacBook Pro 14 2021 M1 Pro Entry | |
| Apple MacBook Air 2020 M1 Entry | |
| Asus Zenbook S 13 OLED | |
| Dell XPS 13 9310 OLED | |
| Lenovo ThinkBook 13s G3 20YA0005GE | |
| Average AMD Ryzen 7 6800U (878 - 1534, n=7) | |
| Huawei MateBook 13s i5 11300H | |
| Samsung Galaxy Book2 Pro 13 NP930XED-KA1DE | |
| Cinebench R20 / CPU (Multi Core) | |
| Average of class Subnotebook (579 - 8541, n=61, last 2 years) | |
| Average AMD Ryzen 7 6800U (3529 - 4574, n=8) | |
| Asus Zenbook S 13 OLED | |
| Lenovo Yoga 9i 14 2022 i7-1260P | |
| Lenovo ThinkBook 13s G3 20YA0005GE | |
| Dell Inspiron 14 7420 2-in-1 | |
| Samsung Galaxy Book2 Pro 13 NP930XED-KA1DE | |
| Huawei MateBook 13s i5 11300H | |
| Dell XPS 13 9310 OLED | |
| Apple MacBook Air 2020 M1 Entry | |
| Cinebench R20 / CPU (Single Core) | |
| Dell Inspiron 14 7420 2-in-1 | |
| Lenovo Yoga 9i 14 2022 i7-1260P | |
| Average of class Subnotebook (128 - 826, n=61, last 2 years) | |
| Asus Zenbook S 13 OLED | |
| Lenovo ThinkBook 13s G3 20YA0005GE | |
| Dell XPS 13 9310 OLED | |
| Average AMD Ryzen 7 6800U (341 - 602, n=8) | |
| Huawei MateBook 13s i5 11300H | |
| Apple MacBook Air 2020 M1 Entry | |
| Samsung Galaxy Book2 Pro 13 NP930XED-KA1DE | |
| Cinebench R15 / CPU Single 64Bit | |
| Average of class Subnotebook (72.4 - 322, n=61, last 2 years) | |
| Dell Inspiron 14 7420 2-in-1 | |
| Lenovo Yoga 9i 14 2022 i7-1260P | |
| Asus Zenbook S 13 OLED | |
| Lenovo ThinkBook 13s G3 20YA0005GE | |
| Average AMD Ryzen 7 6800U (142.6 - 246, n=6) | |
| Dell XPS 13 9310 OLED | |
| Apple MacBook Pro 14 2021 M1 Pro Entry | |
| Apple MacBook Air 2020 M1 Entry | |
| Huawei MateBook 13s i5 11300H | |
| Samsung Galaxy Book2 Pro 13 NP930XED-KA1DE | |
| Blender / v2.79 BMW27 CPU | |
| Apple MacBook Air 2020 M1 Entry | |
| Dell XPS 13 9310 OLED | |
| Samsung Galaxy Book2 Pro 13 NP930XED-KA1DE | |
| Huawei MateBook 13s i5 11300H | |
| Dell Inspiron 14 7420 2-in-1 | |
| Lenovo ThinkBook 13s G3 20YA0005GE | |
| Average of class Subnotebook (159 - 2271, n=62, last 2 years) | |
| Asus Zenbook S 13 OLED | |
| Average AMD Ryzen 7 6800U (272 - 347, n=7) | |
| Lenovo Yoga 9i 14 2022 i7-1260P | |
| 7-Zip 18.03 / 7z b 4 | |
| Average AMD Ryzen 7 6800U (40058 - 53934, n=6) | |
| Asus Zenbook S 13 OLED | |
| Lenovo Yoga 9i 14 2022 i7-1260P | |
| Average of class Subnotebook (11668 - 77867, n=62, last 2 years) | |
| Lenovo ThinkBook 13s G3 20YA0005GE | |
| Apple MacBook Air 2020 M1 Entry | |
| Dell Inspiron 14 7420 2-in-1 | |
| Huawei MateBook 13s i5 11300H | |
| Samsung Galaxy Book2 Pro 13 NP930XED-KA1DE | |
| Dell XPS 13 9310 OLED | |
| 7-Zip 18.03 / 7z b 4 -mmt1 | |
| Dell Inspiron 14 7420 2-in-1 | |
| Average of class Subnotebook (2643 - 6442, n=63, last 2 years) | |
| Apple MacBook Air 2020 M1 Entry | |
| Asus Zenbook S 13 OLED | |
| Lenovo ThinkBook 13s G3 20YA0005GE | |
| Lenovo Yoga 9i 14 2022 i7-1260P | |
| Average AMD Ryzen 7 6800U (3398 - 5511, n=6) | |
| Huawei MateBook 13s i5 11300H | |
| Dell XPS 13 9310 OLED | |
| Samsung Galaxy Book2 Pro 13 NP930XED-KA1DE | |
| Geekbench 5.5 / Multi-Core | |
| Average of class Subnotebook (2557 - 17218, n=54, last 2 years) | |
| Lenovo Yoga 9i 14 2022 i7-1260P | |
| Apple MacBook Pro 14 2021 M1 Pro Entry | |
| Average AMD Ryzen 7 6800U (6854 - 8935, n=9) | |
| Asus Zenbook S 13 OLED | |
| Apple MacBook Air 2020 M1 Entry | |
| Lenovo ThinkBook 13s G3 20YA0005GE | |
| Dell Inspiron 14 7420 2-in-1 | |
| Dell XPS 13 9310 OLED | |
| Huawei MateBook 13s i5 11300H | |
| Samsung Galaxy Book2 Pro 13 NP930XED-KA1DE | |
| Geekbench 5.5 / Single-Core | |
| Average of class Subnotebook (726 - 2132, n=54, last 2 years) | |
| Apple MacBook Pro 14 2021 M1 Pro Entry | |
| Lenovo Yoga 9i 14 2022 i7-1260P | |
| Apple MacBook Air 2020 M1 Entry | |
| Dell Inspiron 14 7420 2-in-1 | |
| Dell XPS 13 9310 OLED | |
| Asus Zenbook S 13 OLED | |
| Lenovo ThinkBook 13s G3 20YA0005GE | |
| Average AMD Ryzen 7 6800U (926 - 1555, n=9) | |
| Huawei MateBook 13s i5 11300H | |
| Samsung Galaxy Book2 Pro 13 NP930XED-KA1DE | |
| HWBOT x265 Benchmark v2.2 / 4k Preset | |
| Average AMD Ryzen 7 6800U (11.8 - 14.2, n=6) | |
| Average of class Subnotebook (0.97 - 25.1, n=61, last 2 years) | |
| Asus Zenbook S 13 OLED | |
| Lenovo Yoga 9i 14 2022 i7-1260P | |
| Lenovo ThinkBook 13s G3 20YA0005GE | |
| Dell Inspiron 14 7420 2-in-1 | |
| Huawei MateBook 13s i5 11300H | |
| Samsung Galaxy Book2 Pro 13 NP930XED-KA1DE | |
| Dell XPS 13 9310 OLED | |
| LibreOffice / 20 Documents To PDF | |
| Samsung Galaxy Book2 Pro 13 NP930XED-KA1DE | |
| Average AMD Ryzen 7 6800U (50.1 - 84.9, n=6) | |
| Average of class Subnotebook (38.5 - 220, n=60, last 2 years) | |
| Asus Zenbook S 13 OLED | |
| Lenovo ThinkBook 13s G3 20YA0005GE | |
| Dell Inspiron 14 7420 2-in-1 | |
| Huawei MateBook 13s i5 11300H | |
| Lenovo Yoga 9i 14 2022 i7-1260P | |
| Dell XPS 13 9310 OLED | |
| Apple MacBook Air 2020 M1 Entry | |
| R Benchmark 2.5 / Overall mean | |
| Samsung Galaxy Book2 Pro 13 NP930XED-KA1DE | |
| Apple MacBook Air 2020 M1 Entry | |
| Huawei MateBook 13s i5 11300H | |
| Dell XPS 13 9310 OLED | |
| Lenovo ThinkBook 13s G3 20YA0005GE | |
| Average of class Subnotebook (0.403 - 1.456, n=62, last 2 years) | |
| Asus Zenbook S 13 OLED | |
| Average AMD Ryzen 7 6800U (0.508 - 0.529, n=5) | |
| Lenovo Yoga 9i 14 2022 i7-1260P | |
| Dell Inspiron 14 7420 2-in-1 | |
* ... smaller is better
AIDA64: FP32 Ray-Trace | FPU Julia | CPU SHA3 | CPU Queen | FPU SinJulia | FPU Mandel | CPU AES | CPU ZLib | FP64 Ray-Trace | CPU PhotoWorxx
| Performance rating | |
| Average AMD Ryzen 7 6800U | |
| Asus Zenbook S 13 OLED | |
| Average of class Subnotebook | |
| Huawei MateBook 13s i5 11300H | |
| Dell XPS 13 9310 OLED | |
| Samsung Galaxy Book2 Pro 13 NP930XED-KA1DE | |
| AIDA64 / FP32 Ray-Trace | |
| Average of class Subnotebook (1135 - 32888, n=62, last 2 years) | |
| Average AMD Ryzen 7 6800U (10902 - 12818, n=6) | |
| Asus Zenbook S 13 OLED | |
| Huawei MateBook 13s i5 11300H | |
| Dell XPS 13 9310 OLED | |
| Samsung Galaxy Book2 Pro 13 NP930XED-KA1DE | |
| AIDA64 / FPU Julia | |
| Average AMD Ryzen 7 6800U (67503 - 84031, n=6) | |
| Asus Zenbook S 13 OLED | |
| Average of class Subnotebook (5218 - 123315, n=62, last 2 years) | |
| Huawei MateBook 13s i5 11300H | |
| Dell XPS 13 9310 OLED | |
| Samsung Galaxy Book2 Pro 13 NP930XED-KA1DE | |
| AIDA64 / CPU SHA3 | |
| Average of class Subnotebook (444 - 5287, n=62, last 2 years) | |
| Average AMD Ryzen 7 6800U (2296 - 2818, n=6) | |
| Asus Zenbook S 13 OLED | |
| Huawei MateBook 13s i5 11300H | |
| Dell XPS 13 9310 OLED | |
| Samsung Galaxy Book2 Pro 13 NP930XED-KA1DE | |
| AIDA64 / CPU Queen | |
| Average AMD Ryzen 7 6800U (62082 - 96306, n=6) | |
| Asus Zenbook S 13 OLED | |
| Average of class Subnotebook (10579 - 115682, n=61, last 2 years) | |
| Huawei MateBook 13s i5 11300H | |
| Dell XPS 13 9310 OLED | |
| Samsung Galaxy Book2 Pro 13 NP930XED-KA1DE | |
| AIDA64 / FPU SinJulia | |
| Average AMD Ryzen 7 6800U (7753 - 11982, n=6) | |
| Asus Zenbook S 13 OLED | |
| Average of class Subnotebook (744 - 18418, n=62, last 2 years) | |
| Huawei MateBook 13s i5 11300H | |
| Dell XPS 13 9310 OLED | |
| Samsung Galaxy Book2 Pro 13 NP930XED-KA1DE | |
| AIDA64 / FPU Mandel | |
| Average AMD Ryzen 7 6800U (37417 - 45748, n=6) | |
| Asus Zenbook S 13 OLED | |
| Average of class Subnotebook (3341 - 65433, n=62, last 2 years) | |
| Huawei MateBook 13s i5 11300H | |
| Dell XPS 13 9310 OLED | |
| Samsung Galaxy Book2 Pro 13 NP930XED-KA1DE | |
| AIDA64 / CPU AES | |
| Asus Zenbook S 13 OLED | |
| Average AMD Ryzen 7 6800U (50547 - 115681, n=6) | |
| Huawei MateBook 13s i5 11300H | |
| Average of class Subnotebook (638 - 124284, n=62, last 2 years) | |
| Dell XPS 13 9310 OLED | |
| Samsung Galaxy Book2 Pro 13 NP930XED-KA1DE | |
| AIDA64 / CPU ZLib | |
| Average of class Subnotebook (164.9 - 1379, n=62, last 2 years) | |
| Average AMD Ryzen 7 6800U (554 - 755, n=6) | |
| Asus Zenbook S 13 OLED | |
| Huawei MateBook 13s i5 11300H | |
| Samsung Galaxy Book2 Pro 13 NP930XED-KA1DE | |
| Dell XPS 13 9310 OLED | |
| AIDA64 / FP64 Ray-Trace | |
| Average of class Subnotebook (610 - 17495, n=62, last 2 years) | |
| Average AMD Ryzen 7 6800U (5825 - 6694, n=6) | |
| Asus Zenbook S 13 OLED | |
| Huawei MateBook 13s i5 11300H | |
| Dell XPS 13 9310 OLED | |
| Samsung Galaxy Book2 Pro 13 NP930XED-KA1DE | |
| AIDA64 / CPU PhotoWorxx | |
| Average of class Subnotebook (6569 - 64588, n=62, last 2 years) | |
| Huawei MateBook 13s i5 11300H | |
| Samsung Galaxy Book2 Pro 13 NP930XED-KA1DE | |
| Dell XPS 13 9310 OLED | |
| Average AMD Ryzen 7 6800U (24728 - 27274, n=6) | |
| Asus Zenbook S 13 OLED | |
System Performance
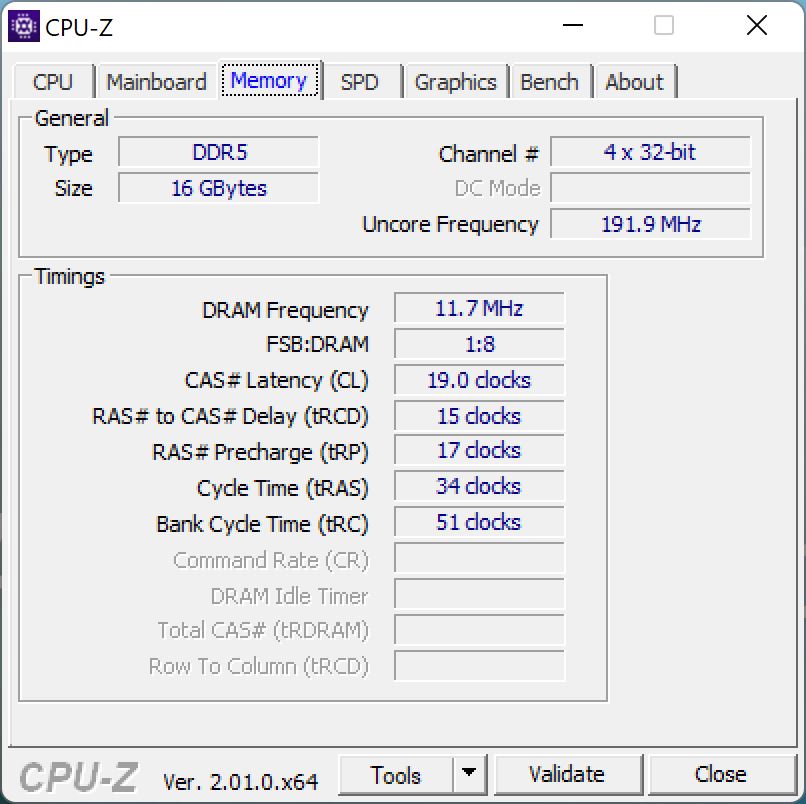
With the fast AMD processor, 16 GB of LPDDR5-6400 RAM and the PCIe 4.0 SSD, the Zenbook is a very powerful and responsive system. This is also confirmed by the synthetic benchmarks, in which our review device is almost always ahead of the competition. No problems were detected during normal use either.
CrossMark: Overall | Productivity | Creativity | Responsiveness
| PCMark 10 / Score | |
| Average of class Subnotebook (4920 - 8424, n=49, last 2 years) | |
| Asus Zenbook S 13 OLED | |
| Average AMD Ryzen 7 6800U, AMD Radeon 680M (5057 - 6639, n=7) | |
| Dell XPS 13 9310 OLED | |
| Huawei MateBook 13s i5 11300H | |
| Samsung Galaxy Book2 Pro 13 NP930XED-KA1DE | |
| PCMark 10 / Essentials | |
| Asus Zenbook S 13 OLED | |
| Dell XPS 13 9310 OLED | |
| Average of class Subnotebook (8552 - 11406, n=49, last 2 years) | |
| Average AMD Ryzen 7 6800U, AMD Radeon 680M (8143 - 10766, n=6) | |
| Huawei MateBook 13s i5 11300H | |
| Samsung Galaxy Book2 Pro 13 NP930XED-KA1DE | |
| PCMark 10 / Productivity | |
| Average of class Subnotebook (5435 - 16132, n=49, last 2 years) | |
| Asus Zenbook S 13 OLED | |
| Average AMD Ryzen 7 6800U, AMD Radeon 680M (6089 - 9328, n=6) | |
| Dell XPS 13 9310 OLED | |
| Samsung Galaxy Book2 Pro 13 NP930XED-KA1DE | |
| Huawei MateBook 13s i5 11300H | |
| PCMark 10 / Digital Content Creation | |
| Average of class Subnotebook (5722 - 12442, n=49, last 2 years) | |
| Average AMD Ryzen 7 6800U, AMD Radeon 680M (6066 - 8144, n=6) | |
| Asus Zenbook S 13 OLED | |
| Huawei MateBook 13s i5 11300H | |
| Dell XPS 13 9310 OLED | |
| Samsung Galaxy Book2 Pro 13 NP930XED-KA1DE | |
| CrossMark / Overall | |
| Average of class Subnotebook (365 - 2356, n=64, last 2 years) | |
| Asus Zenbook S 13 OLED | |
| Average AMD Ryzen 7 6800U, AMD Radeon 680M (1009 - 1575, n=7) | |
| Apple MacBook Air 2020 M1 Entry | |
| Huawei MateBook 13s i5 11300H | |
| CrossMark / Productivity | |
| Average of class Subnotebook (364 - 2277, n=64, last 2 years) | |
| Asus Zenbook S 13 OLED | |
| Average AMD Ryzen 7 6800U, AMD Radeon 680M (971 - 1596, n=7) | |
| Huawei MateBook 13s i5 11300H | |
| Apple MacBook Air 2020 M1 Entry | |
| CrossMark / Creativity | |
| Average of class Subnotebook (372 - 2743, n=64, last 2 years) | |
| Apple MacBook Air 2020 M1 Entry | |
| Asus Zenbook S 13 OLED | |
| Average AMD Ryzen 7 6800U, AMD Radeon 680M (1054 - 1686, n=7) | |
| Huawei MateBook 13s i5 11300H | |
| CrossMark / Responsiveness | |
| Huawei MateBook 13s i5 11300H | |
| Average of class Subnotebook (312 - 1889, n=64, last 2 years) | |
| Average AMD Ryzen 7 6800U, AMD Radeon 680M (994 - 1473, n=7) | |
| Asus Zenbook S 13 OLED | |
| Apple MacBook Air 2020 M1 Entry | |
| PCMark 10 Score | 6346 points | |
Help | ||
| AIDA64 / Memory Copy | |
| Average of class Subnotebook (14554 - 109734, n=62, last 2 years) | |
| Dell XPS 13 9310 OLED | |
| Samsung Galaxy Book2 Pro 13 NP930XED-KA1DE | |
| Huawei MateBook 13s i5 11300H | |
| Average AMD Ryzen 7 6800U (47010 - 52159, n=6) | |
| Asus Zenbook S 13 OLED | |
| AIDA64 / Memory Read | |
| Average of class Subnotebook (15948 - 127174, n=62, last 2 years) | |
| Huawei MateBook 13s i5 11300H | |
| Samsung Galaxy Book2 Pro 13 NP930XED-KA1DE | |
| Dell XPS 13 9310 OLED | |
| Average AMD Ryzen 7 6800U (39197 - 45084, n=6) | |
| Asus Zenbook S 13 OLED | |
| AIDA64 / Memory Write | |
| Average of class Subnotebook (15709 - 117898, n=62, last 2 years) | |
| Dell XPS 13 9310 OLED | |
| Huawei MateBook 13s i5 11300H | |
| Samsung Galaxy Book2 Pro 13 NP930XED-KA1DE | |
| Average AMD Ryzen 7 6800U (48723 - 51117, n=6) | |
| Asus Zenbook S 13 OLED | |
| AIDA64 / Memory Latency | |
| Asus Zenbook S 13 OLED | |
| Dell XPS 13 9310 OLED | |
| Average AMD Ryzen 7 6800U (106.3 - 123.1, n=6) | |
| Average of class Subnotebook (6.8 - 187.8, n=61, last 2 years) | |
| Huawei MateBook 13s i5 11300H | |
* ... smaller is better
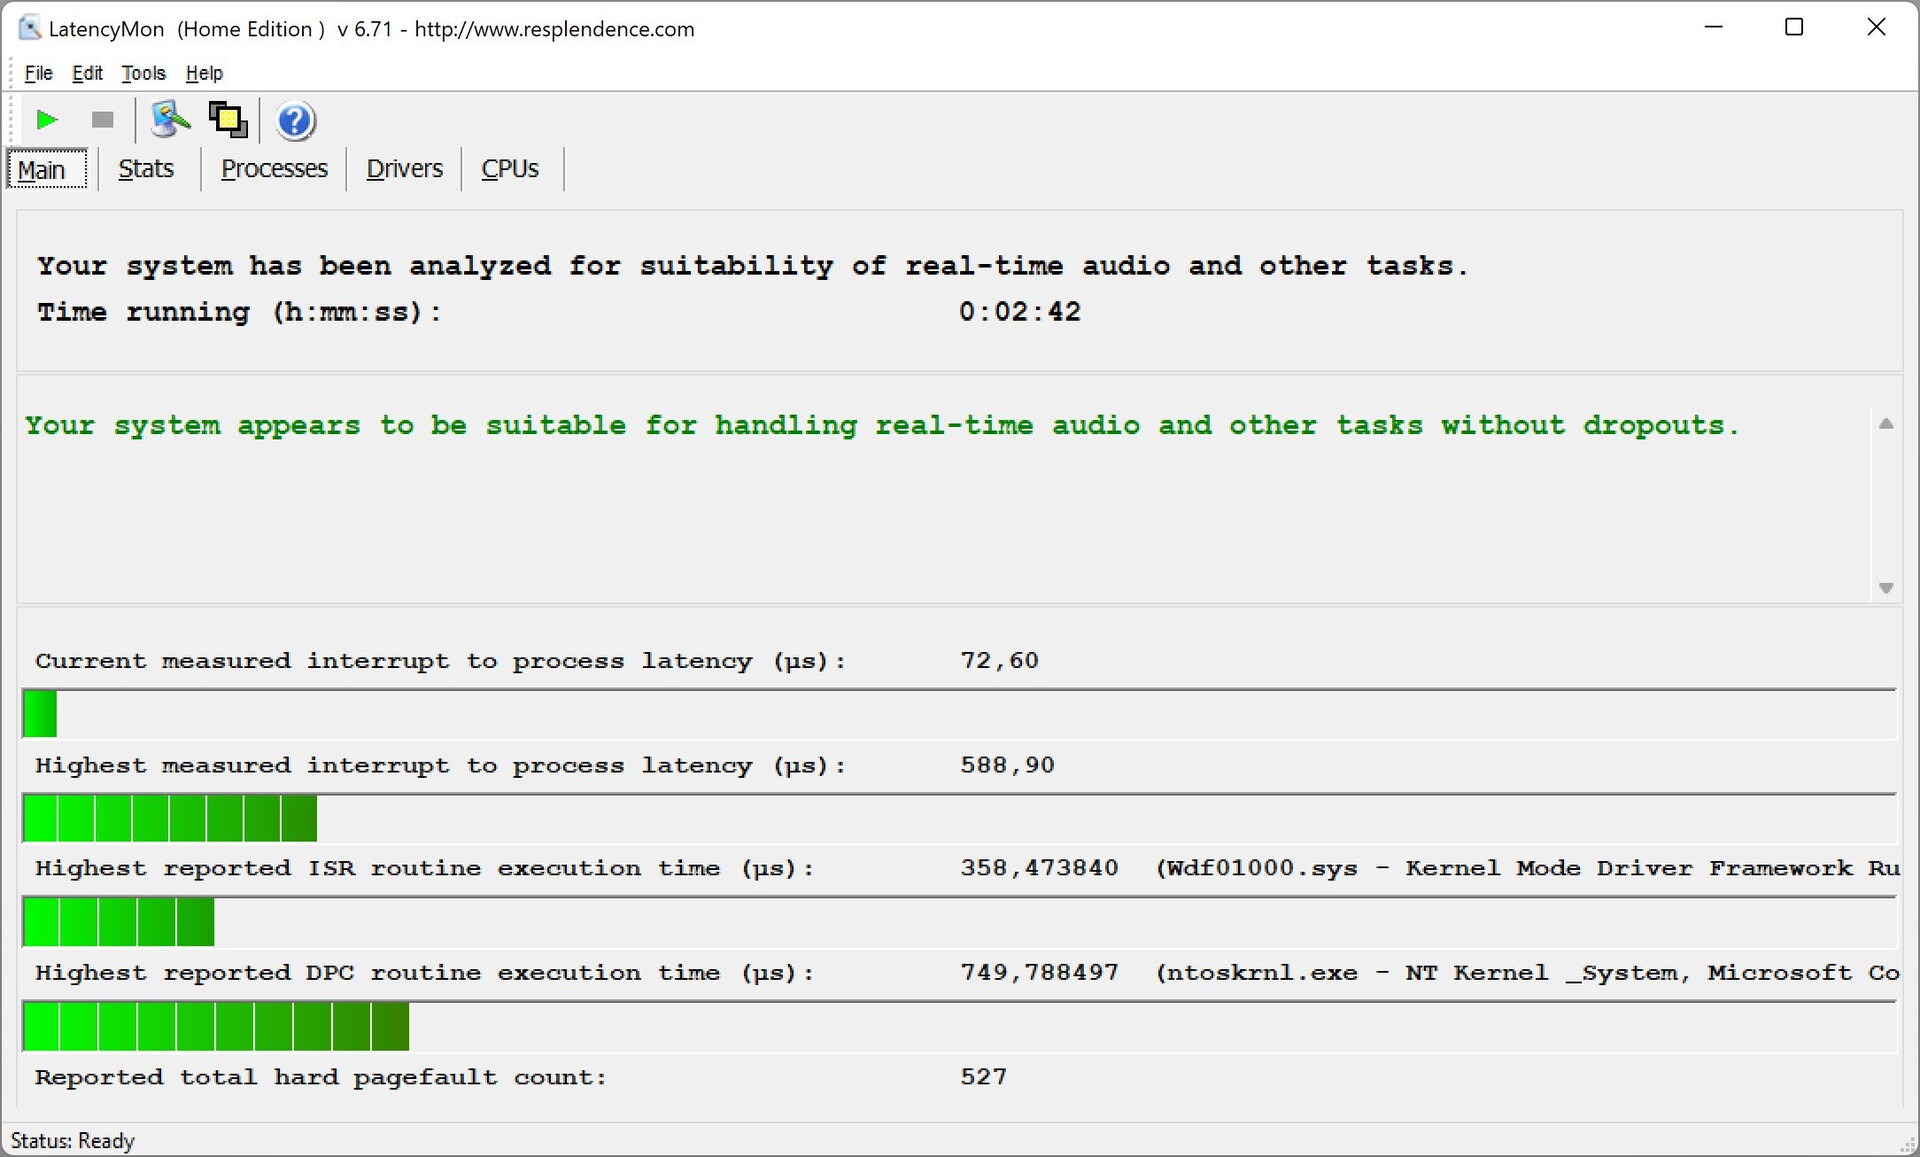
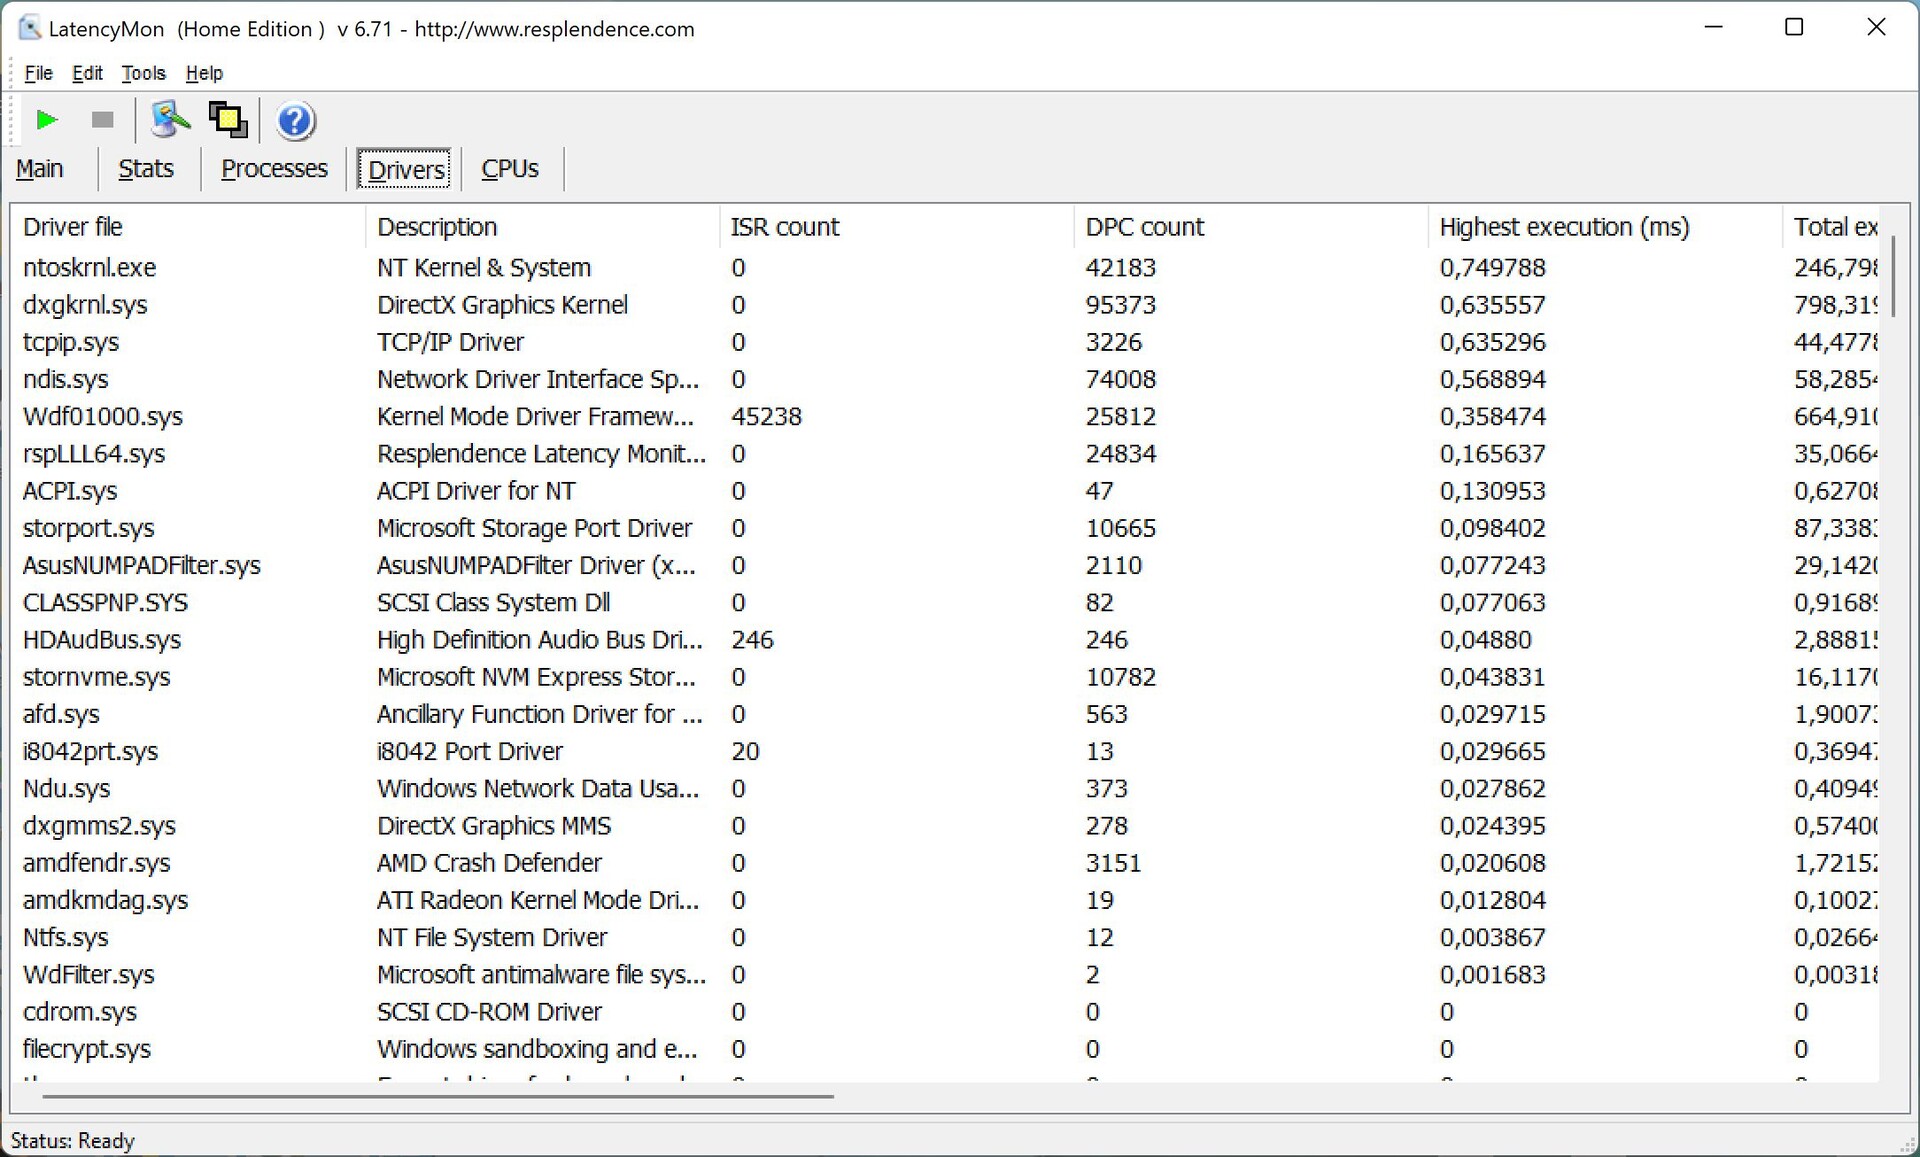
DPC Latency
In our latency test the Zenbook shows no problems, neither with latency nor with skipped frames, when playing a 4K YouTube video.
| DPC Latencies / LatencyMon - interrupt to process latency (max), Web, Youtube, Prime95 | |
| Samsung Galaxy Book2 Pro 13 NP930XED-KA1DE | |
| Dell XPS 13 9310 OLED | |
| Huawei MateBook 13s i5 11300H | |
| Asus Zenbook S 13 OLED | |
* ... smaller is better
Storage Devices
Asus uses a fast PCIe 4.0 SSD from Samsung. The PM9A1 (OEM version of the 980 Pro) offers a storage capacity of 1 TB, with around 904 GB available after the first start-up. In the benchmarks, the M.2-2280 drive achieves very high transfer rates of more than 6 GB/s and is thus currently one of the fastest SSDs in the mobile sector. Moreover, performance remains stable even under constant load despite the somewhat unfavorable positioning right next to the CPU, which not all devices with fast PCIe 4.0 SSDs can manage. More SSD benchmarks are available here.

* ... smaller is better
Sustained Read Performance: DiskSpd Read Loop, Queue Depth 8
GPU Performance
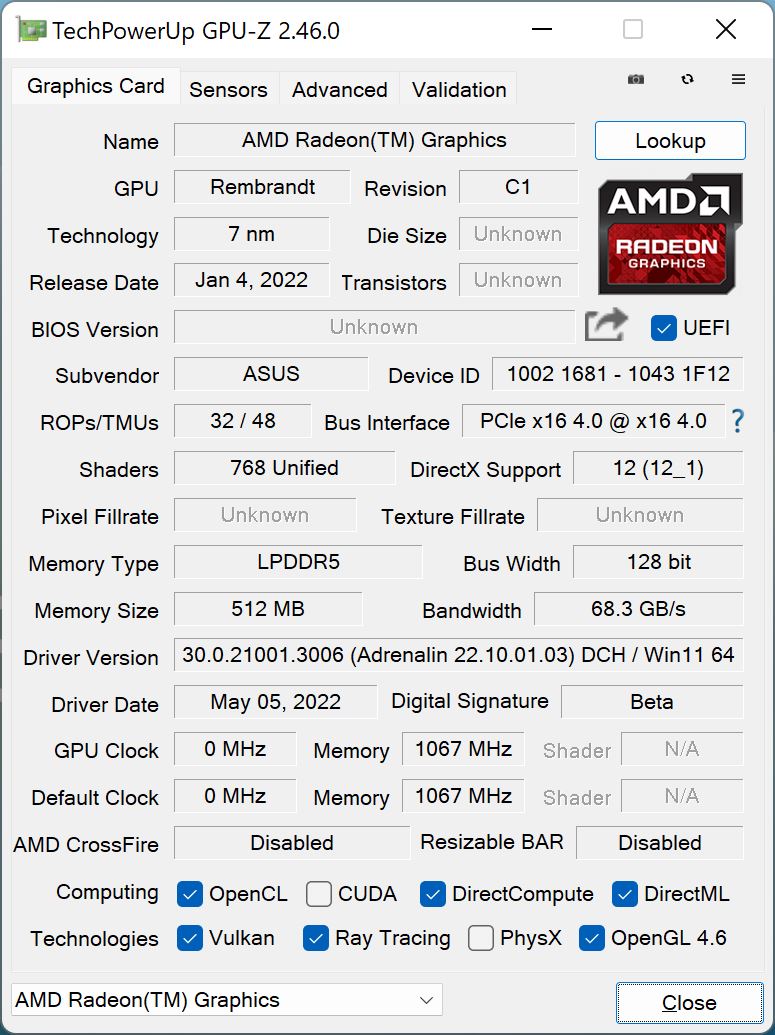
The biggest improvement of the new Ryzen 6000 CPUs is the integrated graphics card, the Radeon 680M. This is based on the RDNA2 architecture (as in the current Radeon 6000M graphics cards) and in combination with the Ryzen 7 6800U, the maximum clock is 2.2 GHz (up to 2.4 GHz in the H-CPUs). More technical details about the 680M can be found here.
In the synthetic benchmarks, the new Radeon 680M is about twice as fast as the old RX Vega 8 of the predecessor. Even the fastest versions of the Xe Graphics G7 witt 96 EUs are clearly surpassed, as is the dedicated Nvidia GeForce MX450. The newer MX550 is still a little faster, but the difference is not so significant. However, Apple's 7 core M1-GPU in the MacBook Air is faster, which also applies to the OpenGL and OpenCL benchmarks.
A big advantage of the Radeon 680M, especially in comparison with the current Xe Graphics G7 from the Alder Lake CPUs, is the very low GPU load during video playback, which is also noticeable in the battery runtime tests later in this review. While the Radeon only uses 4-5% of its capacity during playback of a 4K YouTube video, the current Xe Graphics G7 uses over 40%.
In Performance mode, the demanding Time Spy stress test is passed with 97%, and just under 90% in Balanced mode, so you should expect a performance loss of around 10%. Also worth noting is that Performance mode does not bring any advantages in the normal GPU benchmarks. Graphics performance drops by ~20% in battery mode. More GPU benchmarks are available here.
| 3DMark 11 Performance | 9140 points | |
| 3DMark Fire Strike Score | 6154 points | |
| 3DMark Time Spy Score | 2548 points | |
Help | ||
Gaming Performance
The performance in the synthetic tests is one thing, but the Radeon 680M also scores well in the gaming tests and is clearly ahead of the Xe Graphics G7 in most cases, especially in high graphics details, but the GeForce MX450 is still slightly faster. Overall, the performance is very good for an iGPU and in many cases you can play at medium or high details in 1080p, so long as the title is not too demanding. Cyberpunk 2077, for example, is barely playable as it is unable to exceed 30 FPS even at the lowest settings.
| F1 2021 | |
| 1920x1080 High Preset AA:T AF:16x | |
| Asus Zenbook S 13 OLED | |
| Average AMD Radeon 680M (26.8 - 69, n=21) | |
| Lenovo IdeaCentre AIO 3 24IAP7 | |
| Lenovo Yoga 9i 14 2022 i7-1260P | |
| 1920x1080 Ultra High Preset + Raytracing AA:T AF:16x | |
| Lenovo IdeaCentre AIO 3 24IAP7 | |
| Lenovo Yoga 9i 14 2022 i7-1260P | |
| Asus Zenbook S 13 OLED | |
| Average AMD Radeon 680M (16.1 - 29.1, n=18) | |
Gaming performance remains stable in our Witcher 3 prolonged test even in Balanced mode, but a performance loss of about 10% can occur after a short time in more demanding titles (similarly to the GPU stress test). A slight reduction in performance of around 20% also occurs in battery mode. For more gaming benchmarks, we refer to our tech section.
Witcher 3 FPS Chart
| low | med. | high | ultra | QHD | |
|---|---|---|---|---|---|
| GTA V (2015) | 136.1 | 120.4 | 47 | 21.3 | |
| The Witcher 3 (2015) | 123 | 40 | 23 | ||
| Dota 2 Reborn (2015) | 111.2 | 96.9 | 72.3 | 62.7 | |
| Final Fantasy XV Benchmark (2018) | 59.8 | 31.6 | 21.9 | 16.3 | |
| X-Plane 11.11 (2018) | 46.9 | 39.7 | 33.6 | ||
| Far Cry 5 (2018) | 57 | 36 | 33 | 31 | |
| Strange Brigade (2018) | 125.1 | 54.7 | 46.6 | 40.2 | 25.3 |
| F1 2021 (2021) | 156.5 | 76.7 | 57.7 | 24.7 | 16.9 |
| Farming Simulator 22 (2021) | 123 | 62 | 48 | 44 | |
| Cyberpunk 2077 1.6 (2022) | 32 | 24 | 18 | 14 |
Emissions: Zenbook with good speakers
System noise
The Zenbook S 13 is a very quiet companion in everyday use. In Balanced mode, short load peaks are even manageable without the fan coming into play. The Zenbook reaches about 40 dB(A) during gaming and near 42 dB(A) in the stress test. Of course, fan noise is audible, but it is by no means unpleasant or high-pitched. Furthermore, we did not detect any electronic noise such as coil whine in our review sample.
In the optional Performance mode (only in mains operation), the fan starts up quicker and we also observed a significantly louder fan noise under load (stress test and Witcher 3 both at 47 dB(A)). If you want silence under load, you should select Whisper mode, for the fan is barely audible here at 33 dB(A).
Noise level
| Idle |
| 24 / 24 / 24 dB(A) |
| Load |
| 33.1 / 41.7 dB(A) |
 | ||
30 dB silent 40 dB(A) audible 50 dB(A) loud |
||
min: | ||
| Asus Zenbook S 13 OLED Radeon 680M, R7 6800U, Samsung PM9A1 MZVL21T0HCLR | Dell XPS 13 9310 OLED Iris Xe G7 96EUs, i7-1185G7, Toshiba XG6 KXG60ZNV512G | Samsung Galaxy Book2 Pro 13 NP930XED-KA1DE Iris Xe G7 80EUs, i5-1240P, Samsung PM991a MZVLQ256HBJD | Huawei MateBook 13s i5 11300H Iris Xe G7 80EUs, i5-11300H, Phison Electronics PS5012 | |
|---|---|---|---|---|
| Noise | 5% | -5% | -2% | |
| off / environment * (dB) | 24 | 24.8 -3% | 24.6 -3% | 24.5 -2% |
| Idle Minimum * (dB) | 24 | 25 -4% | 24.6 -3% | 24.5 -2% |
| Idle Average * (dB) | 24 | 25 -4% | 24.6 -3% | 24.5 -2% |
| Idle Maximum * (dB) | 24 | 25 -4% | 26.3 -10% | 28 -17% |
| Load Average * (dB) | 33.1 | 25.3 24% | 38.4 -16% | 35.9 -8% |
| Witcher 3 ultra * (dB) | 40.2 | 35.8 11% | 35.9 11% | |
| Load Maximum * (dB) | 41.7 | 35.8 14% | 38.7 7% | 38.6 7% |
* ... smaller is better
Temperature
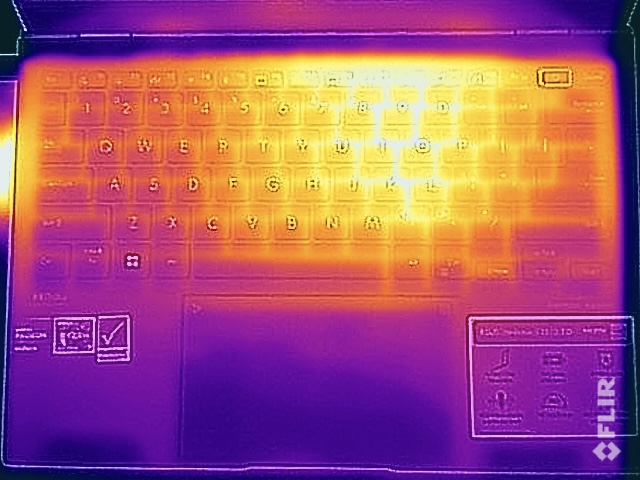
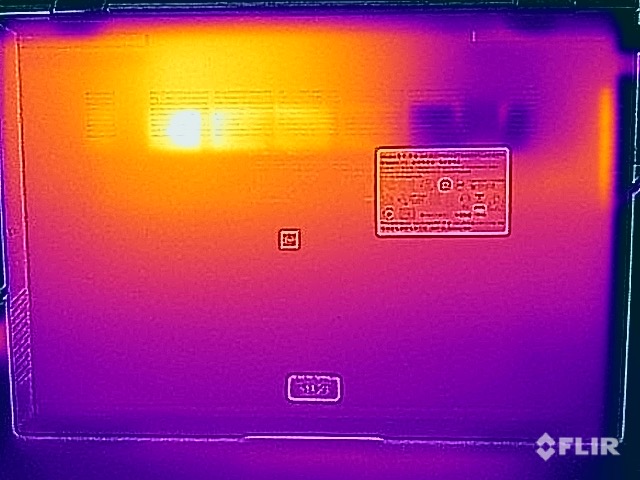
The Zenbook's surface temperatures are completely unproblematic during normal tasks, but you should not place the device on your thighs when gaming or under extreme load, since we occasionally registered temperatures of more than 50 °C. The keyboard also heats up strongly in these scenarios, but this does not prove restrictive for use.
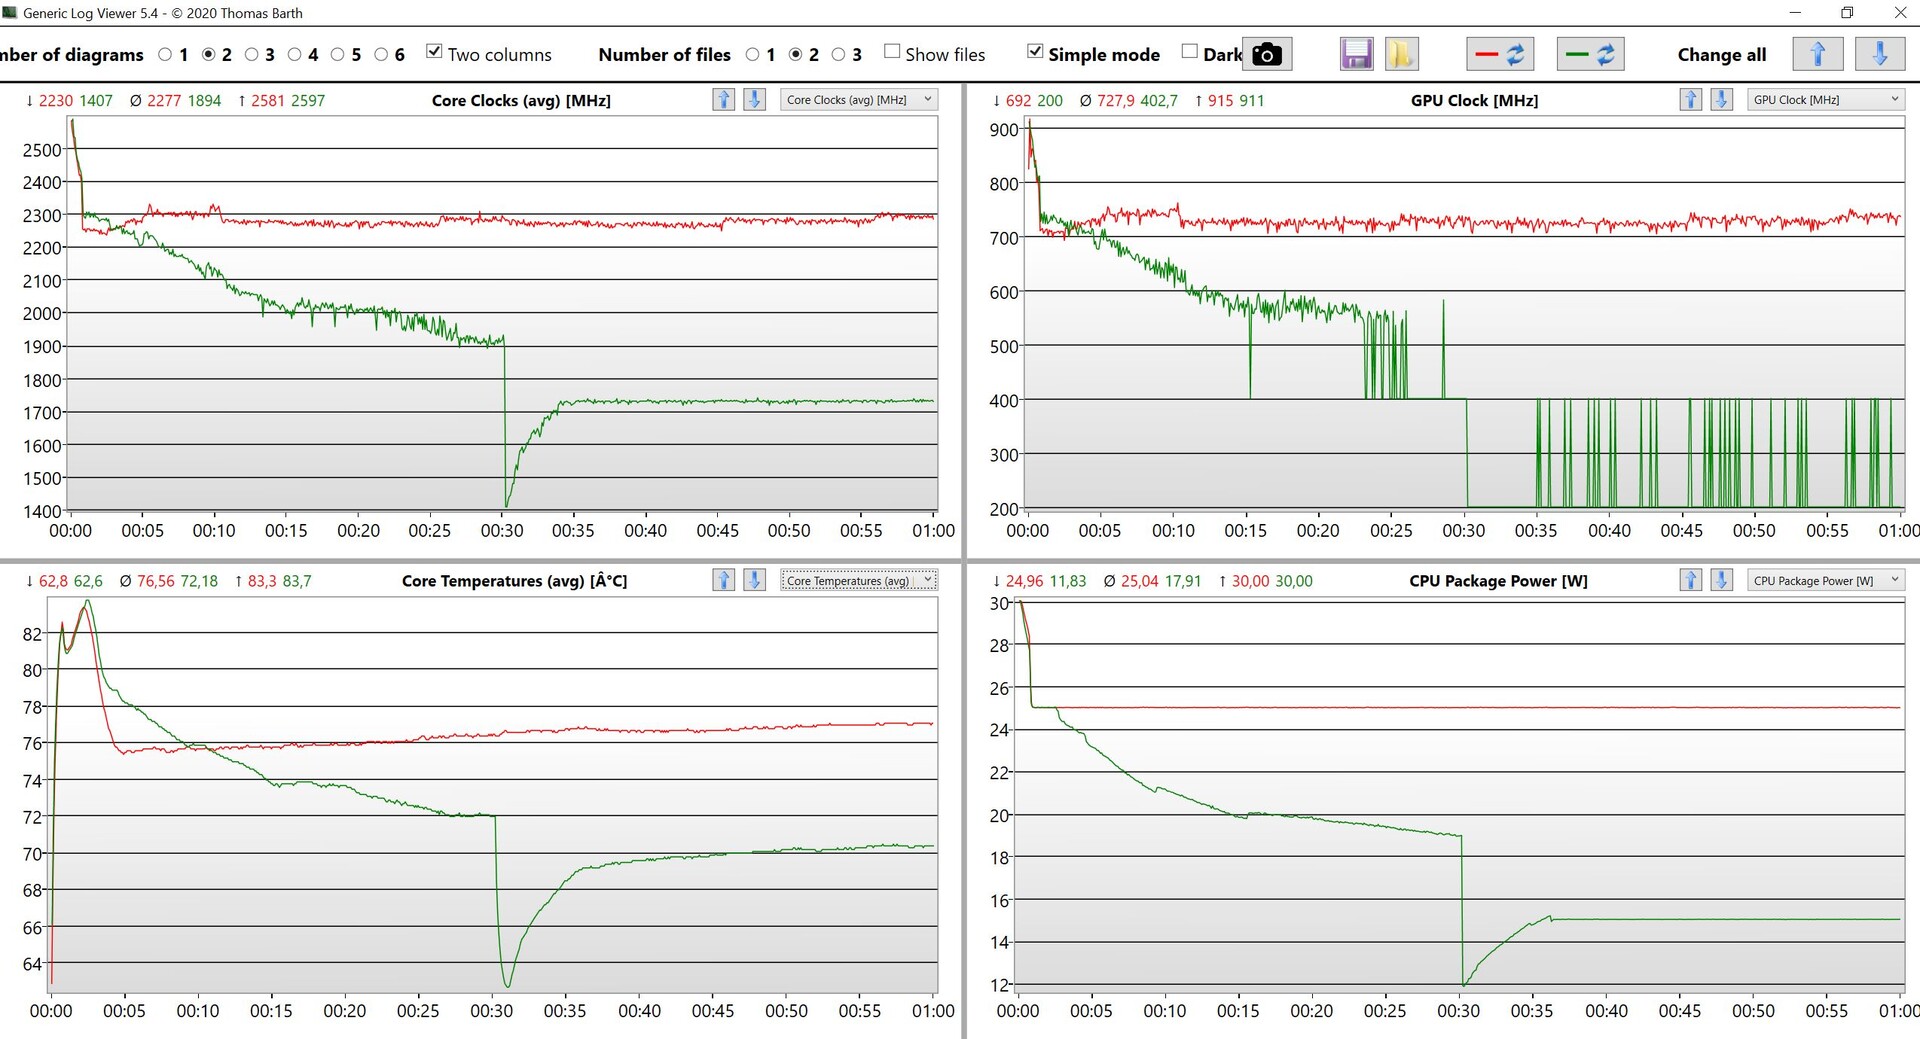
Due to the different fan speeds, surface temperatures under both the Balanced and Performance modes are almost identical after the one-hour stress test. In Performance mode, the TDP remains constant at 25 watts, while the consumption in Balanced mode falls gradually over the course of the test and eventually settles at 15 watts. Those who require maximum performance should thus use Performance mode.
(-) The maximum temperature on the upper side is 47.9 °C / 118 F, compared to the average of 35.9 °C / 97 F, ranging from 21.4 to 59 °C for the class Subnotebook.
(-) The bottom heats up to a maximum of 56.1 °C / 133 F, compared to the average of 39.2 °C / 103 F
(+) In idle usage, the average temperature for the upper side is 25.4 °C / 78 F, compared to the device average of 30.8 °C / 87 F.
(-) Playing The Witcher 3, the average temperature for the upper side is 38.8 °C / 102 F, compared to the device average of 30.8 °C / 87 F.
(+) The palmrests and touchpad are cooler than skin temperature with a maximum of 31.8 °C / 89.2 F and are therefore cool to the touch.
(-) The average temperature of the palmrest area of similar devices was 28.2 °C / 82.8 F (-3.6 °C / -6.4 F).
| Asus Zenbook S 13 OLED AMD Ryzen 7 6800U, AMD Radeon 680M | Apple MacBook Air 2020 M1 Entry Apple M1, Apple M1 7-Core GPU | Dell XPS 13 9310 OLED Intel Core i7-1185G7, Intel Iris Xe Graphics G7 96EUs | Samsung Galaxy Book2 Pro 13 NP930XED-KA1DE Intel Core i5-1240P, Intel Iris Xe Graphics G7 80EUs | Huawei MateBook 13s i5 11300H Intel Core i5-11300H, Intel Iris Xe Graphics G7 80EUs | |
|---|---|---|---|---|---|
| Heat | 8% | 4% | -1% | 10% | |
| Maximum Upper Side * (°C) | 47.9 | 44 8% | 46.6 3% | 47.9 -0% | 42.8 11% |
| Maximum Bottom * (°C) | 56.1 | 44 22% | 46 18% | 51.3 9% | 46.9 16% |
| Idle Upper Side * (°C) | 26.8 | 27 -1% | 26.6 1% | 28.5 -6% | 25.2 6% |
| Idle Bottom * (°C) | 27.3 | 27 1% | 29.2 -7% | 29.6 -8% | 26 5% |
* ... smaller is better
Speakers
The Zenbook S 13's sound system consists of two modules and the improvements of the Dolby Access app are activated by default. The app has various profiles as well as an equalizer that allows you to adjust the settings yourself. The overall result is very convincing: you can listen to music or watch videos without issue, so external speakers are not absolutely necessary. Only the bass is somewhat lacking due to the laptop's build, but this also applies to most competitors.
Asus Zenbook S 13 OLED audio analysis
(±) | speaker loudness is average but good (76.5 dB)
Bass 100 - 315 Hz
(±) | reduced bass - on average 12.6% lower than median
(±) | linearity of bass is average (11.1% delta to prev. frequency)
Mids 400 - 2000 Hz
(±) | higher mids - on average 5.8% higher than median
(+) | mids are linear (4.7% delta to prev. frequency)
Highs 2 - 16 kHz
(+) | balanced highs - only 2.6% away from median
(+) | highs are linear (5.3% delta to prev. frequency)
Overall 100 - 16.000 Hz
(+) | overall sound is linear (14.7% difference to median)
Compared to same class
» 30% of all tested devices in this class were better, 6% similar, 64% worse
» The best had a delta of 5%, average was 18%, worst was 53%
Compared to all devices tested
» 19% of all tested devices were better, 4% similar, 77% worse
» The best had a delta of 4%, average was 24%, worst was 134%
Apple MacBook Air 2020 M1 Entry audio analysis
(±) | speaker loudness is average but good (79.6 dB)
Bass 100 - 315 Hz
(±) | reduced bass - on average 7.1% lower than median
(±) | linearity of bass is average (9.5% delta to prev. frequency)
Mids 400 - 2000 Hz
(+) | balanced mids - only 2.2% away from median
(+) | mids are linear (5.3% delta to prev. frequency)
Highs 2 - 16 kHz
(+) | balanced highs - only 2.3% away from median
(+) | highs are linear (4% delta to prev. frequency)
Overall 100 - 16.000 Hz
(+) | overall sound is linear (8.7% difference to median)
Compared to same class
» 3% of all tested devices in this class were better, 1% similar, 96% worse
» The best had a delta of 5%, average was 18%, worst was 53%
Compared to all devices tested
» 2% of all tested devices were better, 1% similar, 97% worse
» The best had a delta of 4%, average was 24%, worst was 134%
Power Management: Zenbook remains economical
Power Consumption
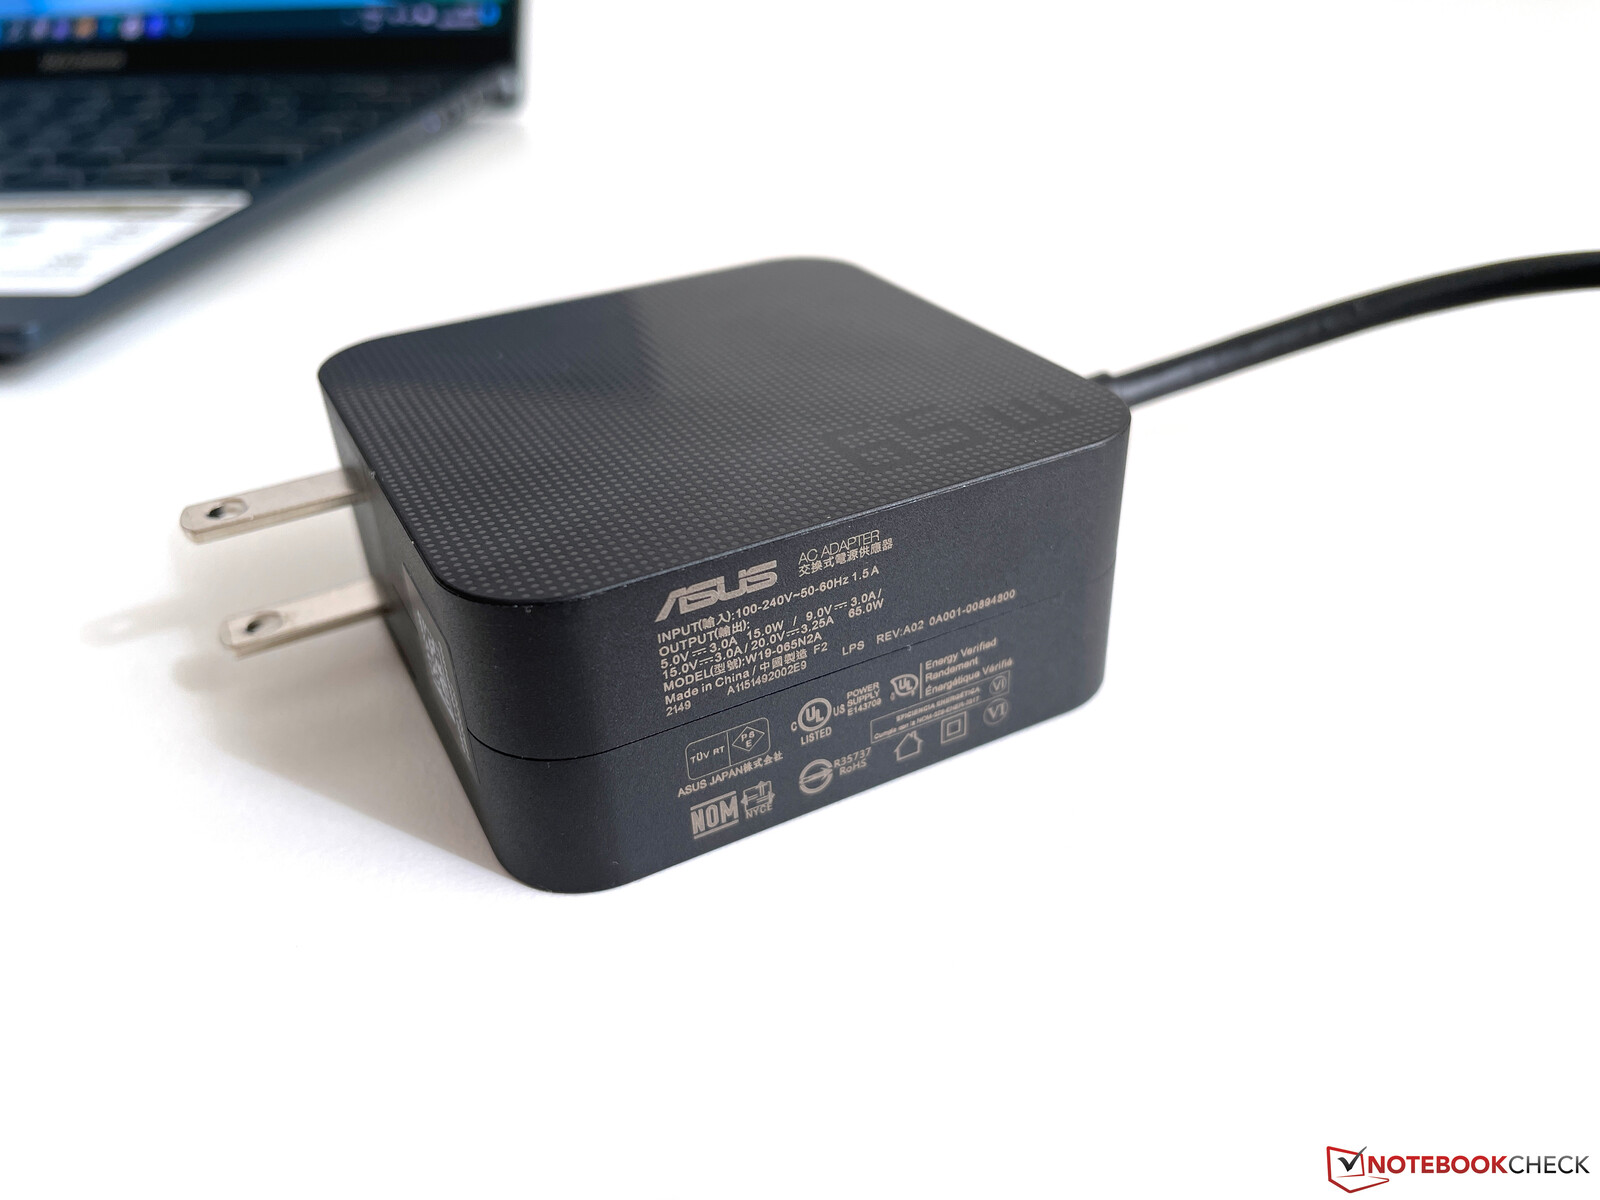
The OLED screen, with its high resolution, makes itself felt in the idle measurements, as idle consumption increases to up to 10 watts despite the limited SDR brightness. Under load, the advantage of the lower TDP values again becomes evident: in contrast to current Intel laptops, which often do not get enough power from their 65-watt power supplies and always have to briefly draw from the battery during peak load, we recorded a maximum consumption of just under 50 watts in the Zenbook, which then levels off at just under 35 watts (Balanced) or 45 watts (Performance) in the course of testing.
The 65-watt power supply is thus sufficiently sized even in the stress test, and there is even enough capacity to charge the battery.
| Off / Standby | |
| Idle | |
| Load |
|
Key:
min: | |
| Asus Zenbook S 13 OLED R7 6800U, Radeon 680M, Samsung PM9A1 MZVL21T0HCLR, OLED, 2880x1800, 13.3" | Apple MacBook Air 2020 M1 Entry M1, M1 7-Core GPU, Apple SSD AP0256Q, IPS, 2560x1600, 13.3" | Dell XPS 13 9310 OLED i7-1185G7, Iris Xe G7 96EUs, Toshiba XG6 KXG60ZNV512G, OLED, 3456x2160, 13.4" | Samsung Galaxy Book2 Pro 13 NP930XED-KA1DE i5-1240P, Iris Xe G7 80EUs, Samsung PM991a MZVLQ256HBJD, OLED, 1920x1080, 13.3" | Huawei MateBook 13s i5 11300H i5-11300H, Iris Xe G7 80EUs, Phison Electronics PS5012, LTPS, 2520x1680, 13.4" | Average AMD Radeon 680M | Average of class Subnotebook | |
|---|---|---|---|---|---|---|---|
| Power Consumption | 40% | 2% | 13% | 1% | -23% | 7% | |
| Idle Minimum * (Watt) | 4.8 | 1.9 60% | 5.7 -19% | 4.3 10% | 4.2 12% | 6.92 ? -44% | 3.9 ? 19% |
| Idle Average * (Watt) | 8.7 | 6.4 26% | 6 31% | 6 31% | 8.1 7% | 9.02 ? -4% | 6.91 ? 21% |
| Idle Maximum * (Watt) | 10.1 | 7 31% | 12.3 -22% | 8.8 13% | 9 11% | 10.6 ? -5% | 8.24 ? 18% |
| Load Average * (Watt) | 45.6 | 25 45% | 44.4 3% | 36 21% | 41.7 9% | 53.6 ? -18% | 42.1 ? 8% |
| Witcher 3 ultra * (Watt) | 42.4 | 36.5 14% | 32.9 22% | 40.1 5% | |||
| Load Maximum * (Watt) | 49.5 | 30.3 39% | 47.8 3% | 60 -21% | 68 -37% | 70.3 ? -42% | 64.2 ? -30% |
* ... smaller is better
Power consumption Witcher 3 / Stress test
Power consumption with external monitor
Battery Life
The Zenbook S 13 has a 67 Wh battery (4 cells) that ensures decent runtimes. The OLED panel is the biggest consumer in everyday use, which is why the maximum brightness also has a significant impact on the runtime. For example, our WLAN test at 150 cd/m² (corresponding to 70% of the maximum brightness) runs for a little more than 9 hours. At full SDR brightness, this runs for two hours less at around 7 hours.
Our HDR test video shows why the maximum HDR brightness is not always available: it only runs for a little more than 3 hours at full brightness. The other extreme is our normal video test at 150 cd/m², which shows just how efficient the new Radeon 680M GPU is. The runtime is just over 15 hours here, which we double-checked several times.
A full charge with the laptop turned on takes just over 2 hours, with speeds leveling off slightly after hitting the 60% mark (~41 minutes).
| Asus Zenbook S 13 OLED R7 6800U, Radeon 680M, 67 Wh | Apple MacBook Air 2020 M1 Entry M1, M1 7-Core GPU, 49.9 Wh | Dell XPS 13 9310 OLED i7-1185G7, Iris Xe G7 96EUs, 52 Wh | Samsung Galaxy Book2 Pro 13 NP930XED-KA1DE i5-1240P, Iris Xe G7 80EUs, 63 Wh | Huawei MateBook 13s i5 11300H i5-11300H, Iris Xe G7 80EUs, 60 Wh | Average of class Subnotebook | |
|---|---|---|---|---|---|---|
| Battery runtime | 74% | -29% | 2% | -20% | 11% | |
| H.264 (h) | 15.2 | 11.6 -24% | 11 -28% | 15.8 ? 4% | ||
| WiFi v1.3 (h) | 9.2 | 16 74% | 6.5 -29% | 11.6 26% | 9.4 2% | 13.7 ? 49% |
| Load (h) | 2.4 | 2.5 4% | 1.6 -33% | 1.933 ? -19% |
Pros
Cons
Verdict: The Zenbook is a very solid mobile companion
The Asus Zenbook S 13 is a very successful compact notebook that combines many modern technological features with the brand-new Ryzen 7 6800U from AMD. We did not encounter any real weak points in the review process and our positive impressions clearly outweigh the negative ones.
AMD's new mobile processor offers only slight improvements in the CPU field, but the integrated Radeon-680M-GPU has made a decent leap in performance and is even capable of competing with a dedicated GeForce MX450 in real gaming benchmarks. At the same time, the consumption rates of the SoC are not as absurdly high as those of the current Alder Lake chips (regardless of whether it is the P or U series), which is why the fan starts up much less frequently in everyday use. Moreover, the 65 watt power supply is also completely adequate.
But not only the new AMD chip is impressive: The high-quality magnesium case is very compact and we also like the input devices, particularly the keyboard, since the Zenbook offers a decent key drop of 1.4 mm for a very thin notebook. The optional number pad in the touchpad also proves useful. The ports (even if only USB-C) are suitable and will be expanded to USB 4 via a BIOS update in the future, which will then allow the connection of external graphics cards, for example. The battery life is good, the OLED screen offers very good image quality, and thanks to Asus' software solution, the panel can be dimmed without having to put up with the annoying PWM flickering. The additional control via the MyAsus app is somewhat cumbersome and we would like to see better integration with the standard brightness control here, but it's a step in the right direction.
The new Zenbook S 13 is a very good subnotebook that does not make any major blunders and offers a lot of performance. The new AMD Ryzen 7 6800U also makes a very good impression and works much more efficiently than comparable Intel Alder-Lake CPUs, making it better choice for compact laptops at the moment.
In terms of drawbacks, we should definitely mention the unnecessarily complicated access to the interior, and a 1080p webcam would certainly be more up-to-date than the 720p module. Another card reader would also be desirable. But these points hardly detract from the overall decent impression. Rather, we rather view the availability as more of a problem, as the Zenbook is not yet available in stores, and other laptops with the 6800U are also in short supply.
Despite the comparatively low power consumption, overall performance is clearly on par with the Alder Lake P chips, which in our reviews often consume significantly more power and present very compact laptops (or their cooling) with difficult tasks. The Samsung Galaxy Book 2 Pro 13 with its lower consumption rates also shows that the Alder-Lake i5-1240P is hardly competitive at 20 watts, and the Core i7-1255U only has an advantage in the single-core tests, but it also needs considerably more power. As soon as you use all cores or the graphics card, AMD is clearly ahead with the Ryzen 7 6800U. The old MacBook Air M1 remains a strong competitor and is still offered alongside the completely renewed MacBook Air M2. Despite passive cooling, it offers a lot of performance and is thus more efficient, but the display does not support HDR. We expect to be able to review the current Dell XPS 13 with its Intel Alder Lake in the coming weeks, but its performance will unlikely be able to keep up with the Zenbook S 13 based on our previous findings on the new Intel chips.
Price and Availability
The Asus Zenbook S 13 is not yet available, neither from Asus itself nor from the usual online stores. Interested buyers are advised to regularly check online and with their suppliers.
Asus Zenbook S 13 OLED
- 07/06/2022 v7 (old)
Andreas Osthoff
Price comparison

