 Deutsch
 English
 Español
 Français
 Italiano
 Nederlands
 Polski
 Português
 Русский
 Türkçe
 Svenska
 Chinese
 Magyar
HP ZBook Power 15 G8 laptop review: A lot of high-end in an affordable workstation
As an affordable workstation, the HP ZBook Power 15 G8 brings updates for CPU and GPU in the current generation, with the maximum configuration offering an Intel Tiger Lake Core i9-11950H and Nvidia RTX A2000. While in addition to a 4K display, vPRO CPUs are also available, unfortunately Xeon processors and with that also ECC RAM won't be available this year. But the device still offers many characteristics of a high-end workstation.
For about 1600 Euros (~$1630), our configuration is equipped with Intel's Core i7-11800H, Nvidia's T600 as a professional GPU, and an FHD display. As direct competitors in the entry-level workstation segment, we have the Lenovo ThinkPad P15v G2 and Dell's Precision 3551. Our test will show whether the ZBook Power 15 G8 with its fairly powerful components also brings a good price-performance ratio.
Possible Competitors in Comparison
Rating | Date | Model | Weight | Height | Size | Resolution | Best Price |
|---|---|---|---|---|---|---|---|
| 87.7 % | 07/2022 | HP ZBook Power 15 G8 313S5EA i7-11800H, T600 Laptop GPU | 2 kg | 22.8 mm | 15.60" | 1920x1080 | |
| 90.3 % | 10/2021 | HP ZBook Fury 15 G8 i9-11950H, RTX A5000 Laptop GPU | 2.5 kg | 25.9 mm | 15.60" | 3840x2160 | |
| 87.8 % | 08/2021 | HP ZBook Studio 15 G8 i9-11950H, GeForce RTX 3070 Laptop GPU | 1.9 kg | 18 mm | 15.60" | 3840x2160 | |
| 83.8 % | 04/2021 | HP ZBook Firefly 15 G8 2C9R7EA i7-1165G7, T500 Laptop GPU | 1.8 kg | 19.2 mm | 15.60" | 1920x1080 | |
| 86.2 % | 06/2022 | Lenovo ThinkPad P15v G2 21A9000XGE i7-11800H, T1200 Laptop GPU | 2.3 kg | 22.7 mm | 15.60" | 1920x1080 | |
| 81.2 % | 10/2020 | Dell Precision 3000 3551 i9-10885H, Quadro P620 | 2.2 kg | 24.92 mm | 15.60" | 1920x1080 |
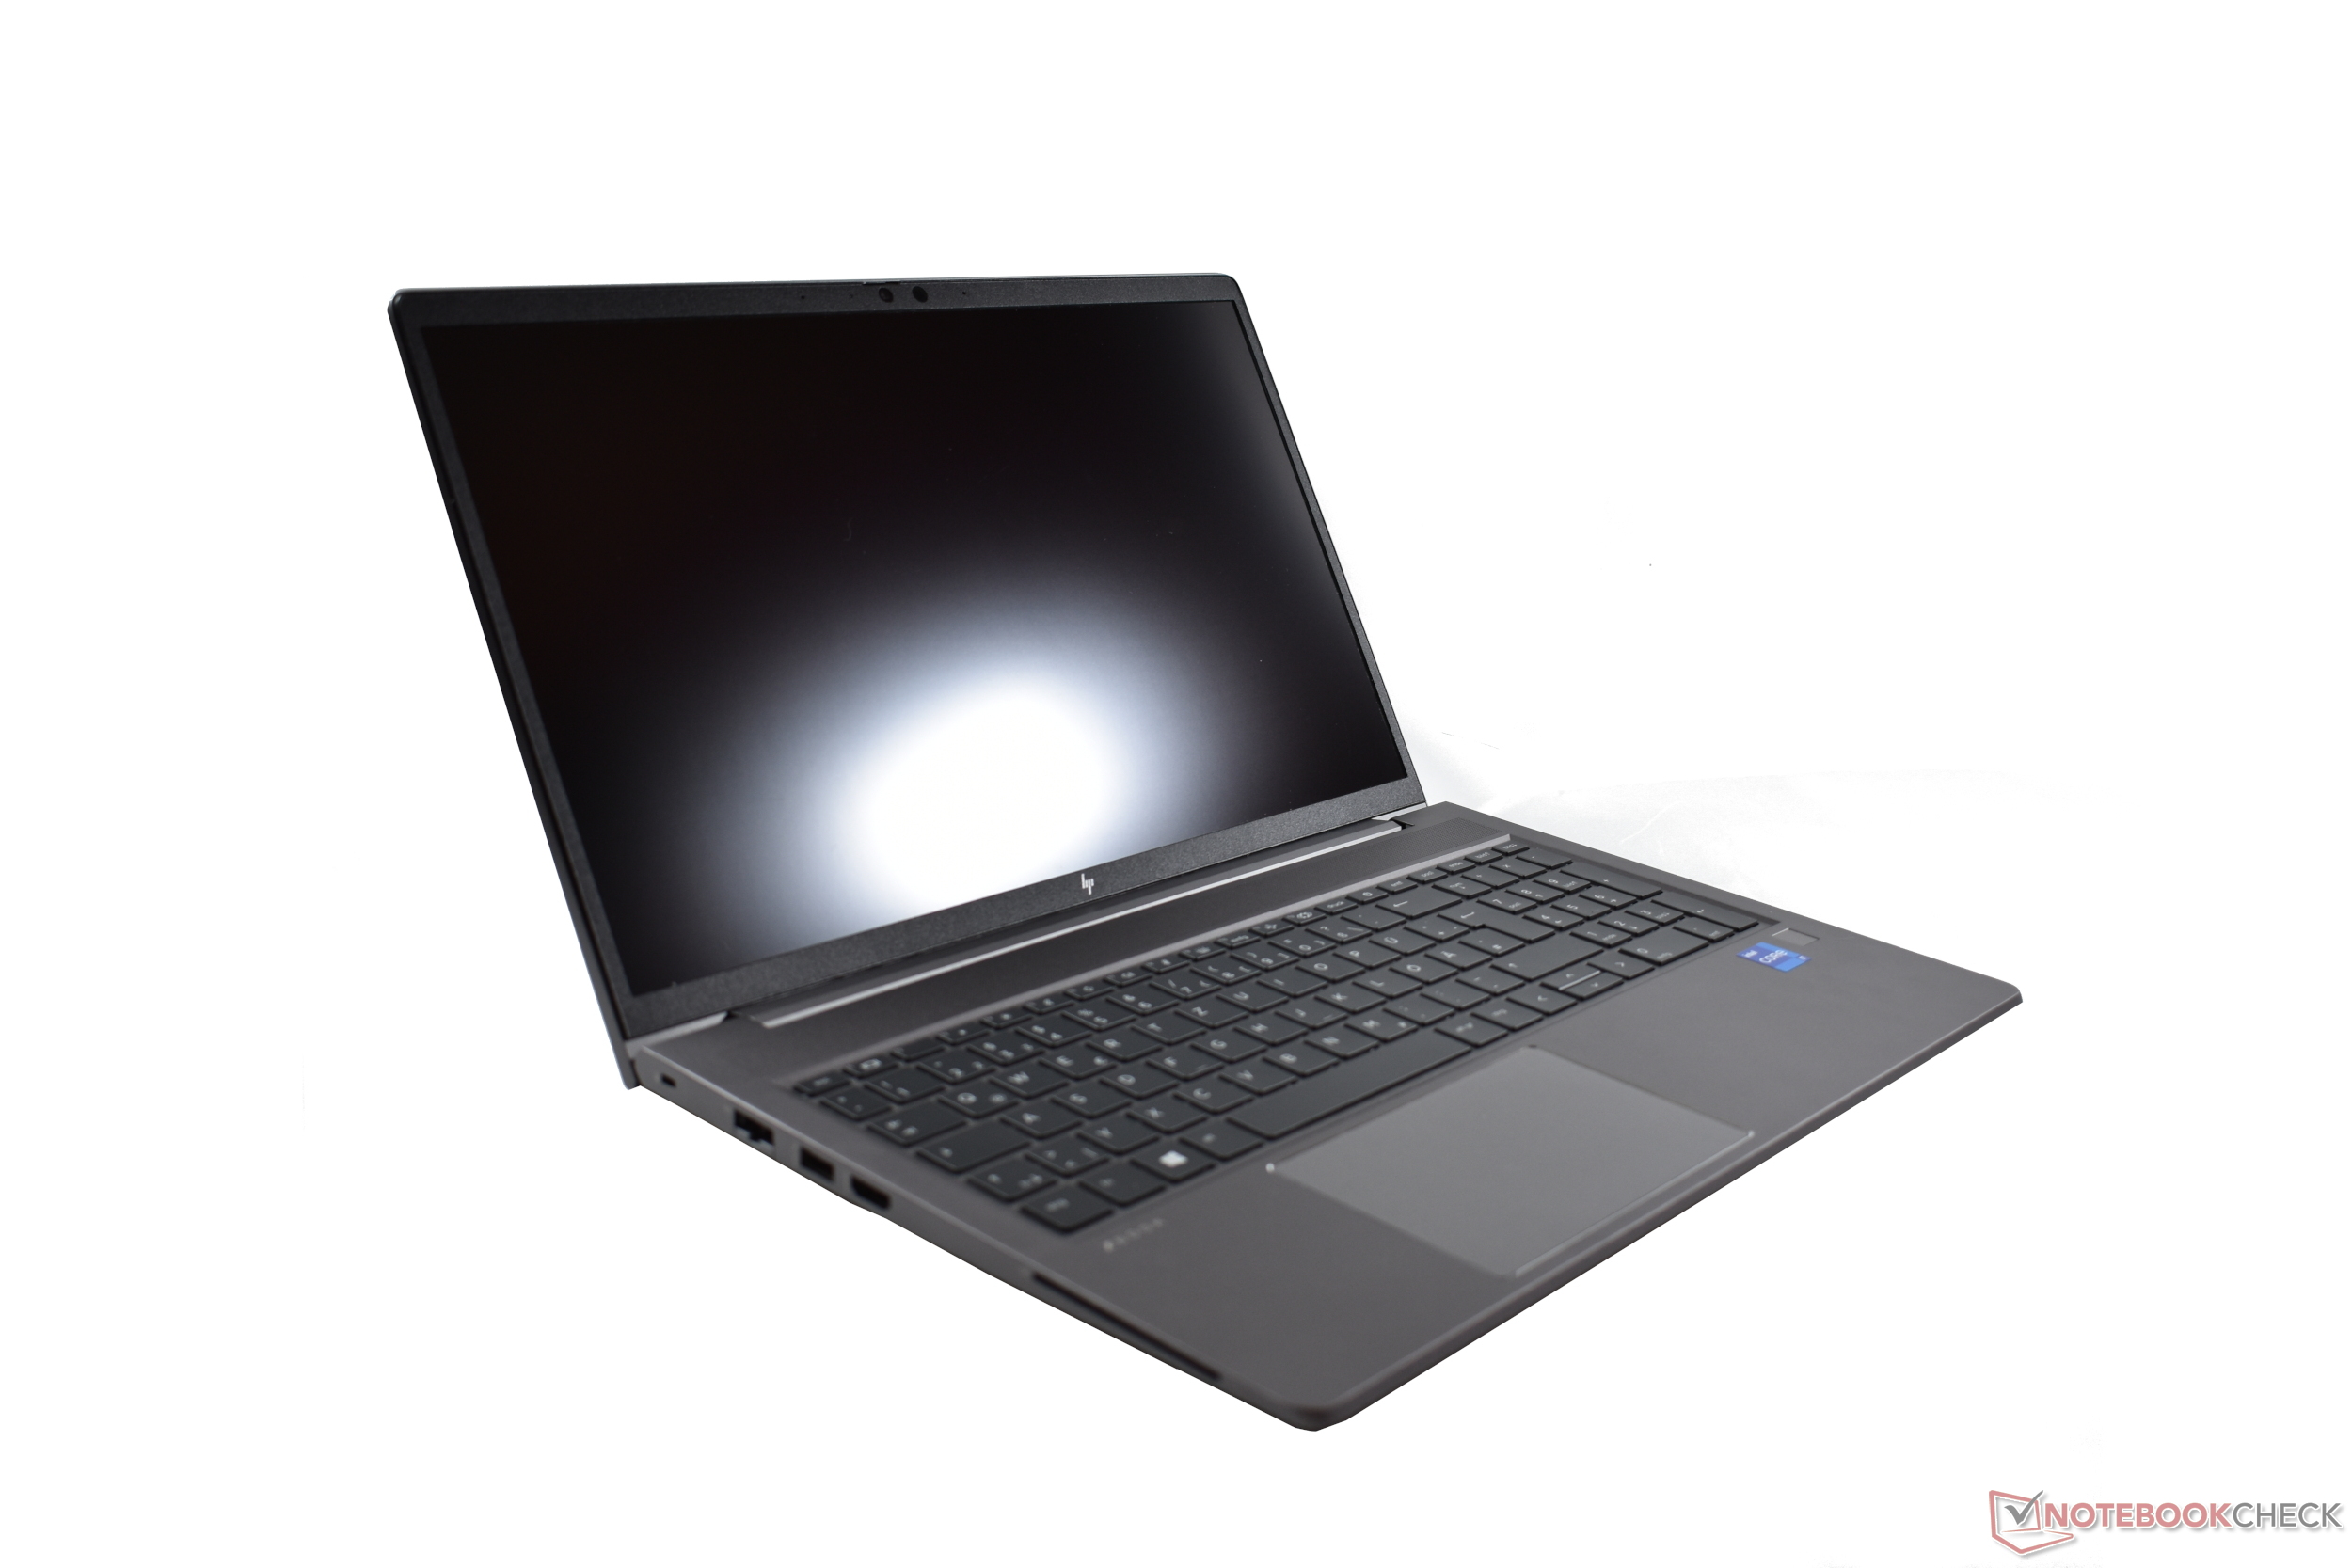
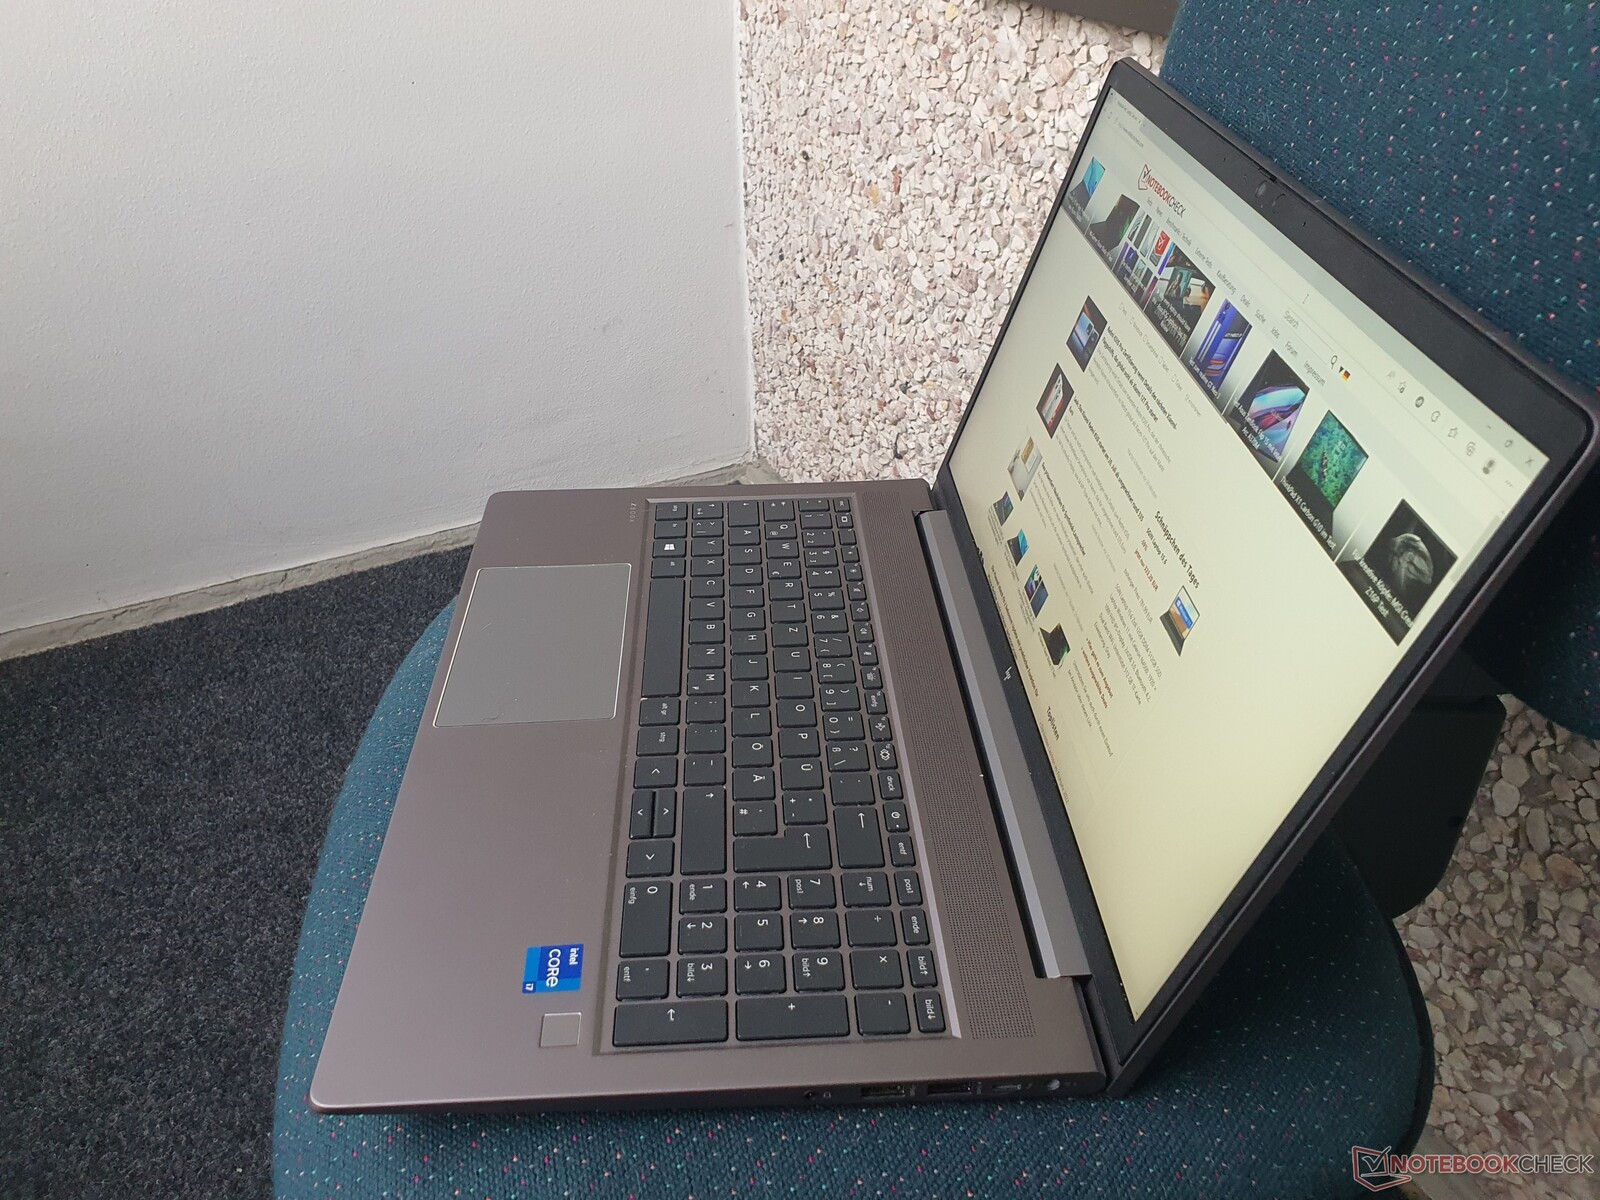
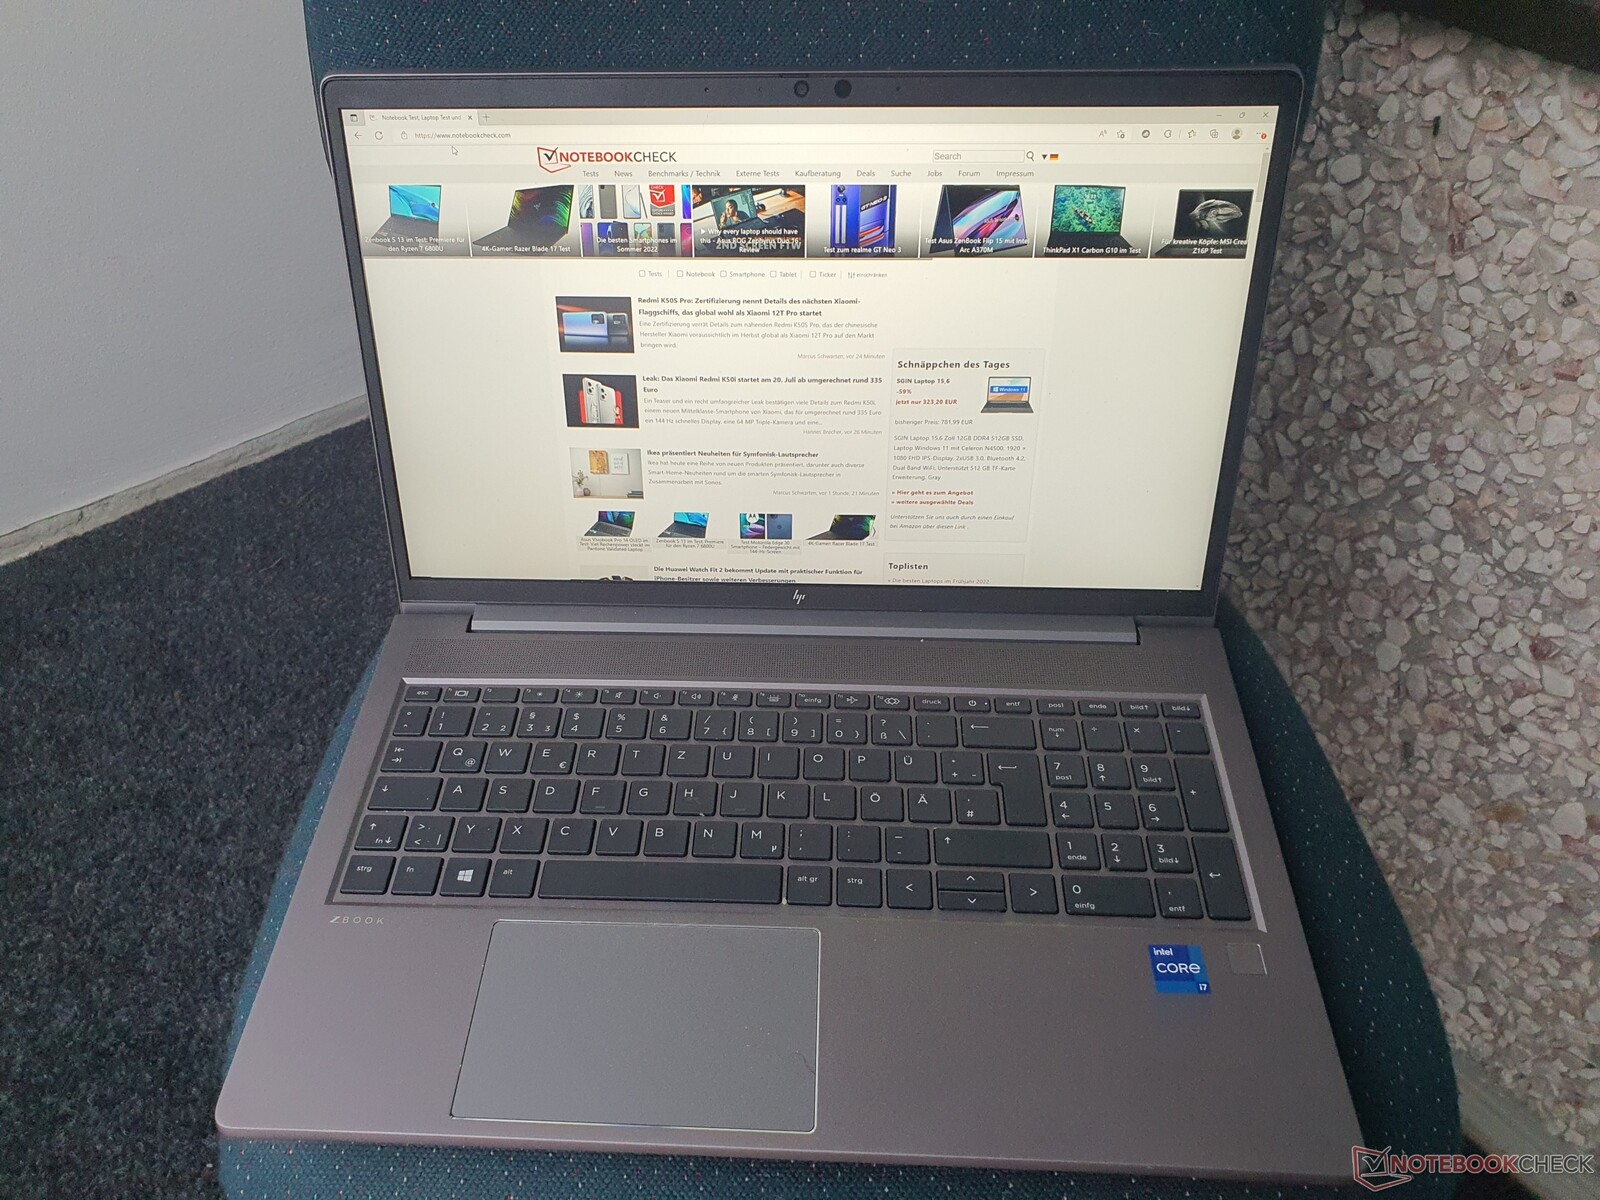
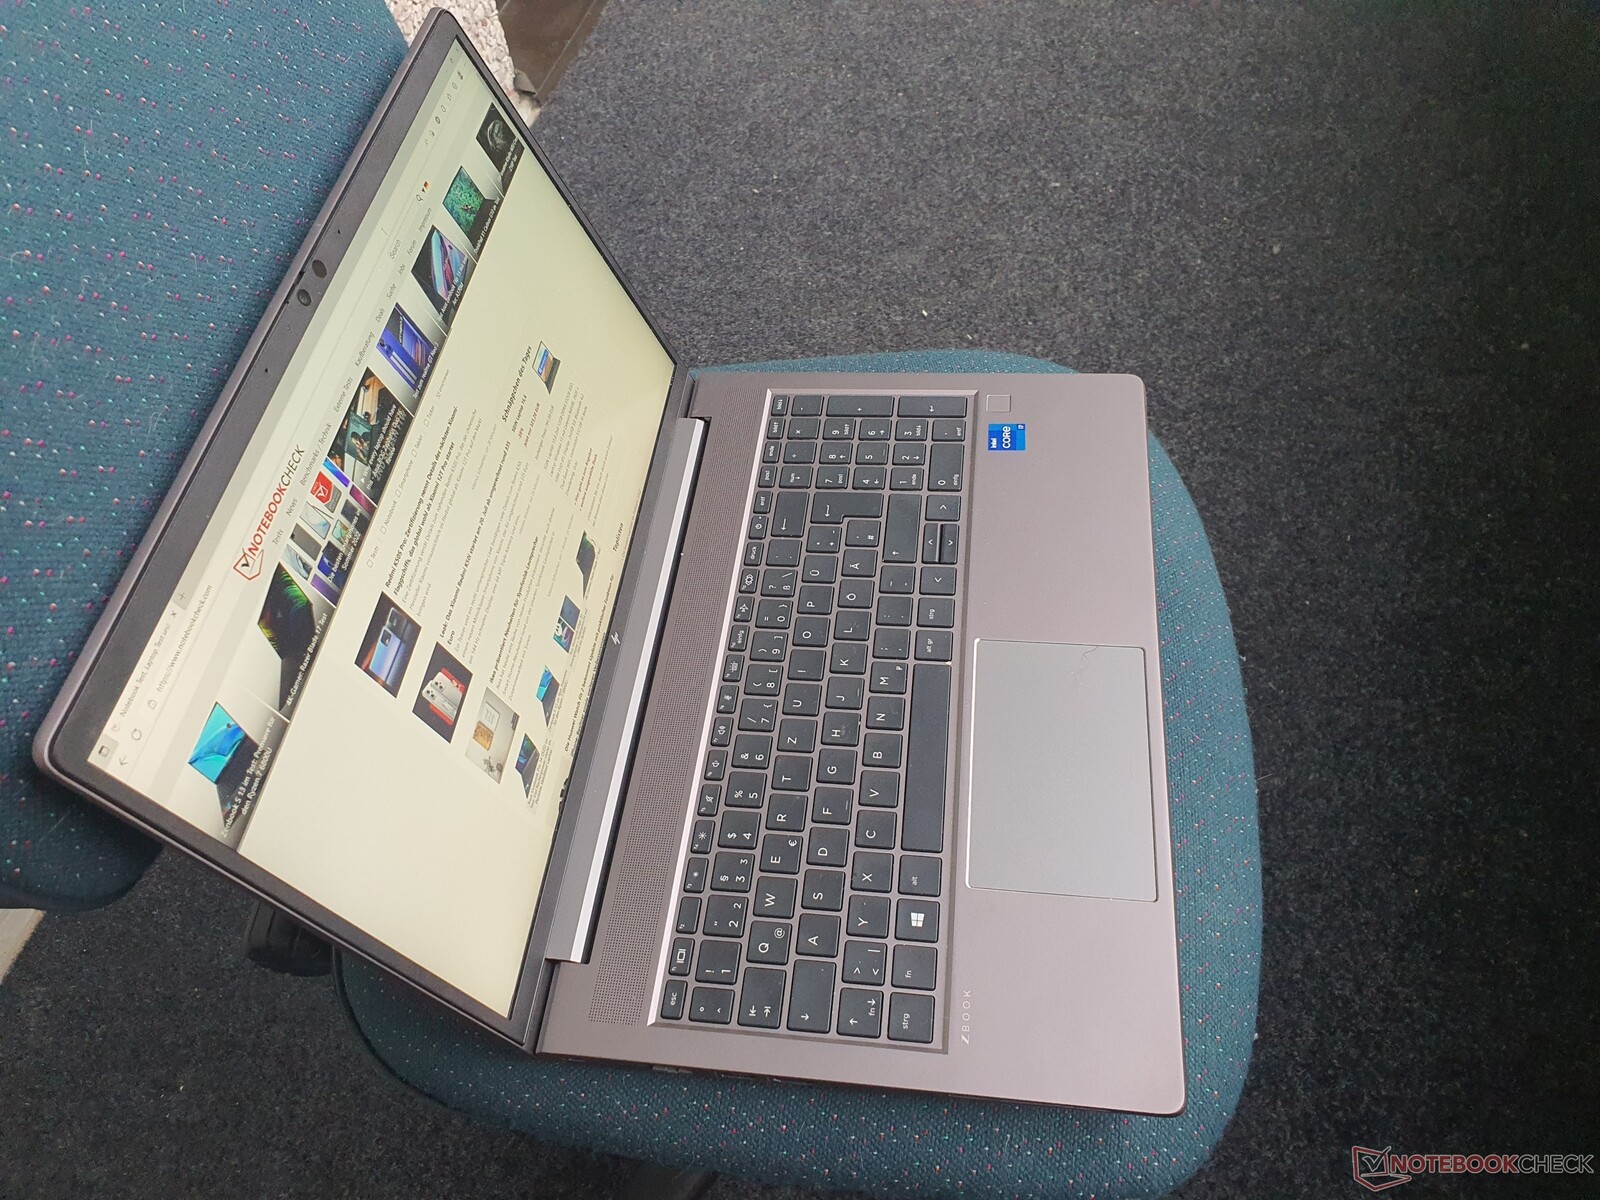
Case: ZBook Power made of robust aluminum
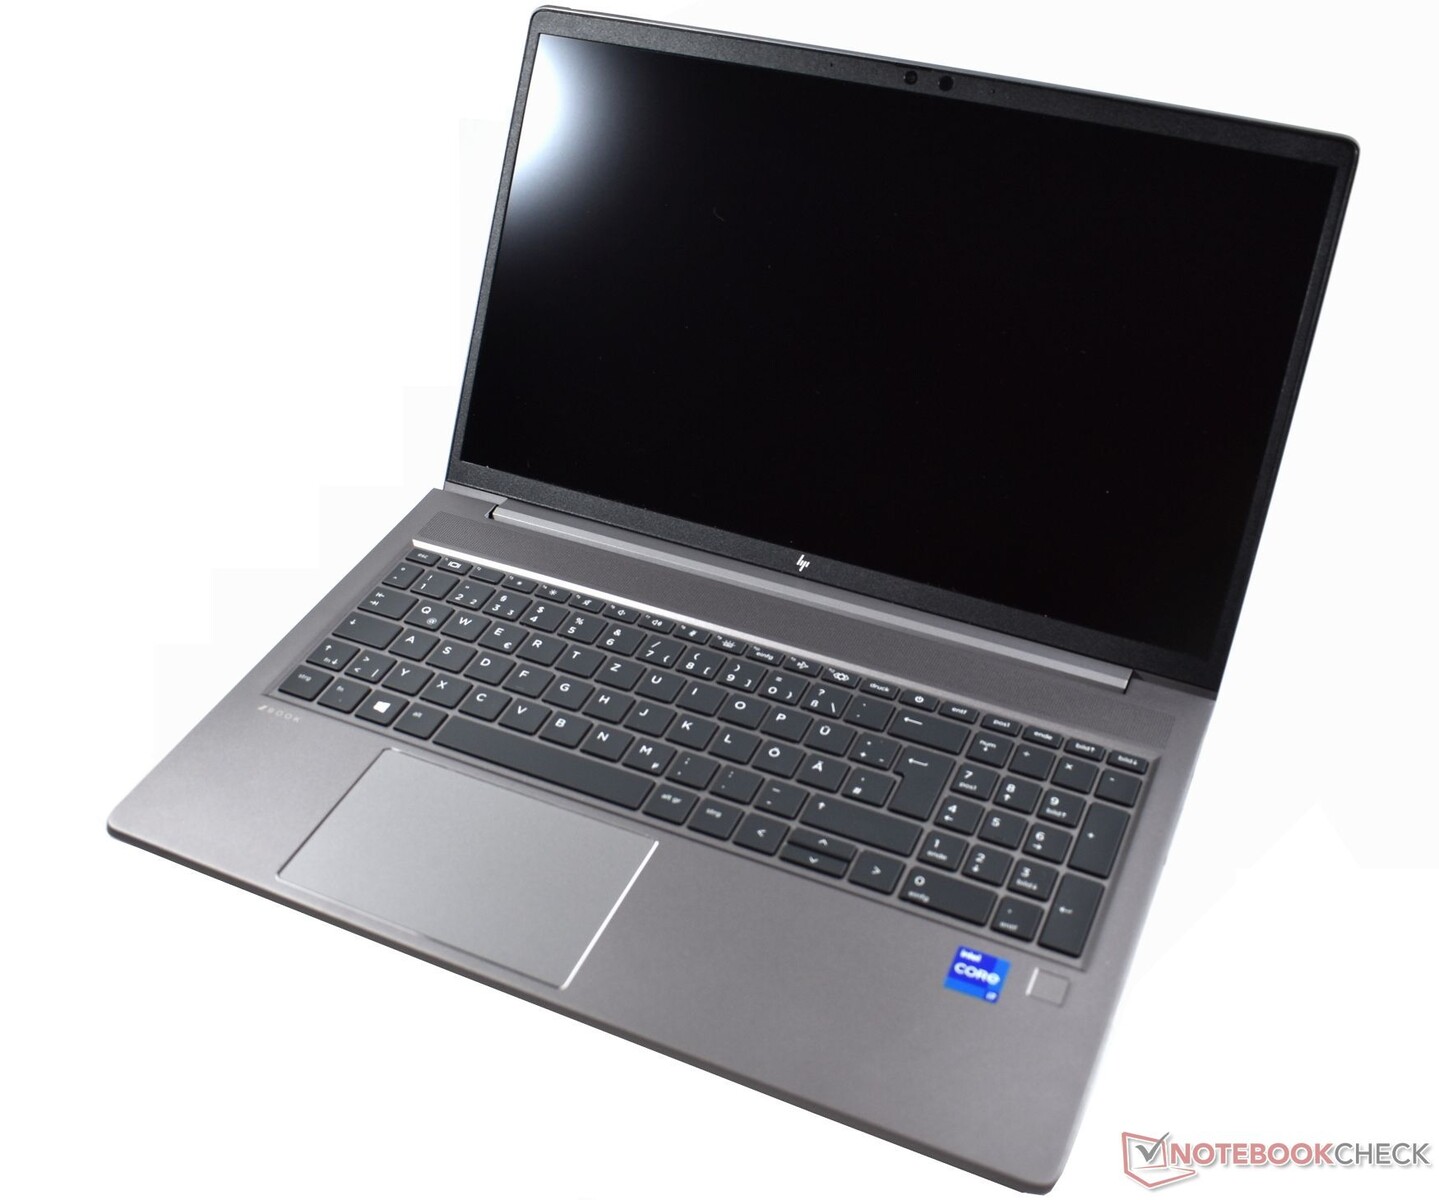
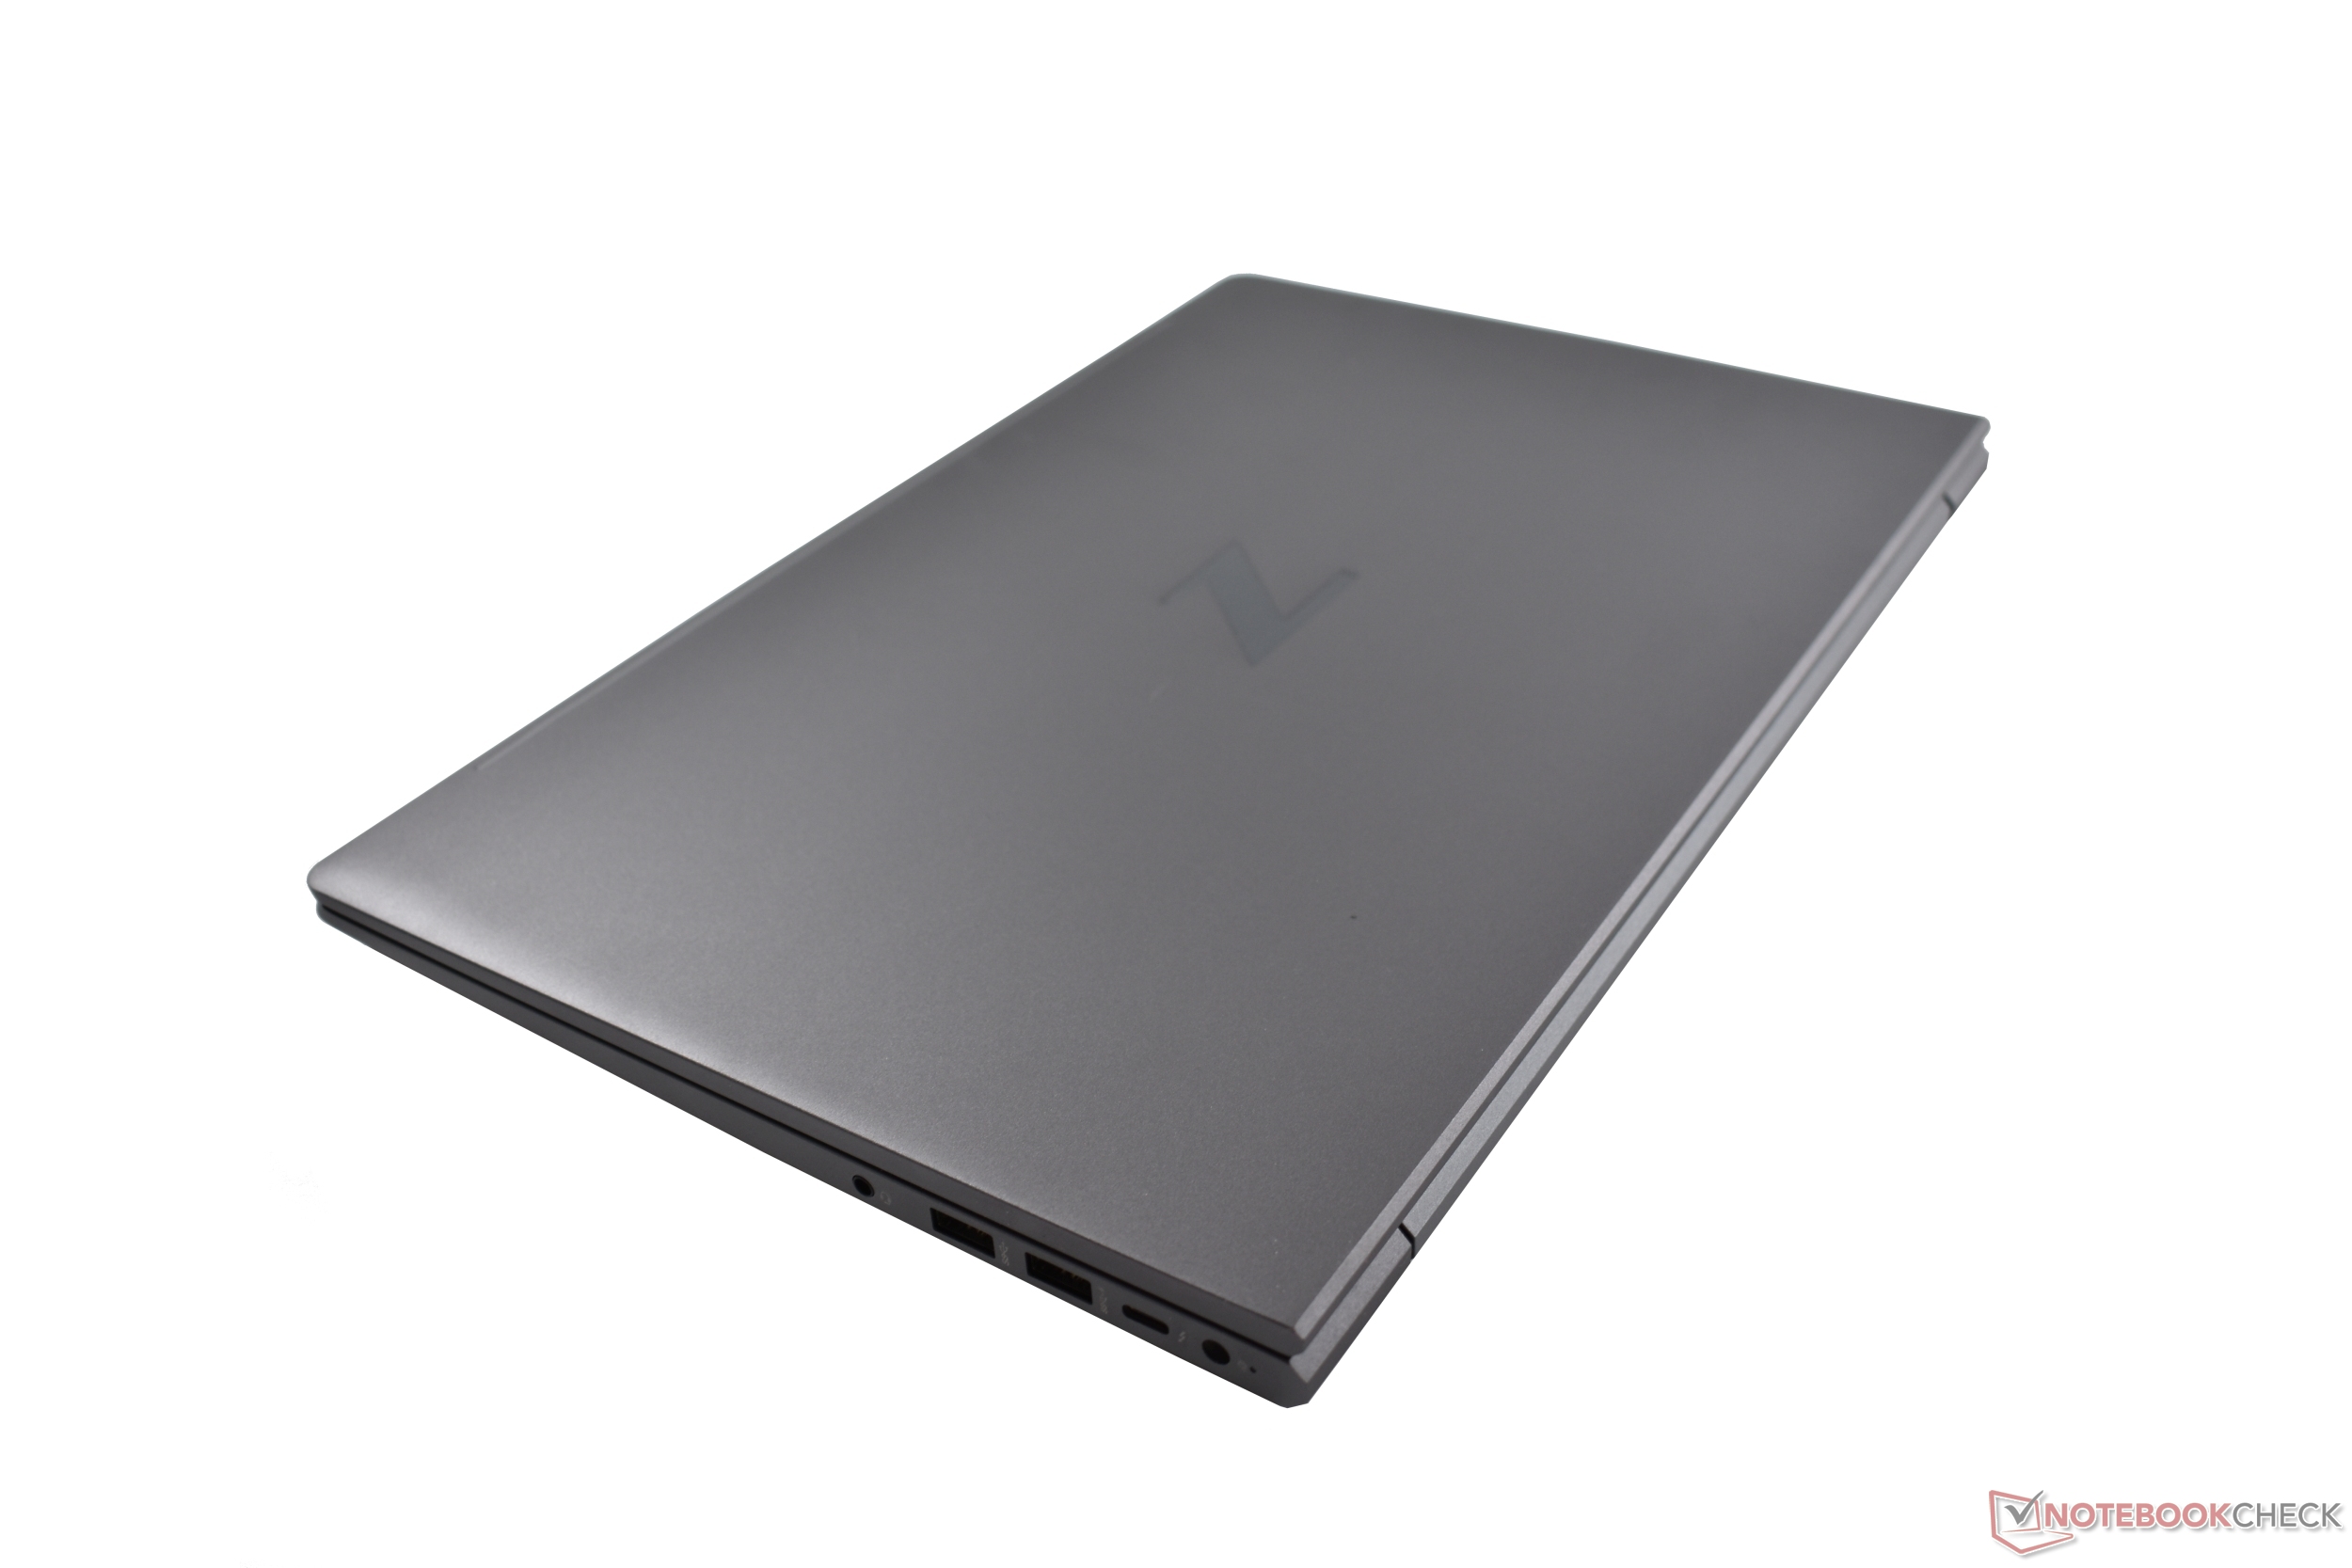
The dark-gray aluminum case gives the ZBook Power 15 elegant looks and a quite remarkable robustness, which is also confirmed by its MIL STD-810H certification. The haptics including the matte surfaces also leave nothing to be desired.
The device shows clean workmanship, and fingerprints are not a problem. The lid can be opened with a single hand, and the large hinge going all the way across is extremely sturdy.
On the other hand, the back of the lid can be easily pressed down with some single-point pressure, although this won't lead to any image distortions. Positive points are the facts that the lid with its slim bezels can only be twisted minimally and that the maximum opening angle is ~180 degrees.


Overall, the workstation is lighter at 1.97 kg (~4.34 lb) and also more compact than the competitors. However, as a premium workstation HP's ZBook Studio 15 is again slimmer at 18 mm (~0.7 in), and so is HP's light compact workstation, the Firefly 15, which also weighs only 1.75 kg (~3.96 lb).
Equipment: HP ZBook with USB-C PD and fast WiFi 6
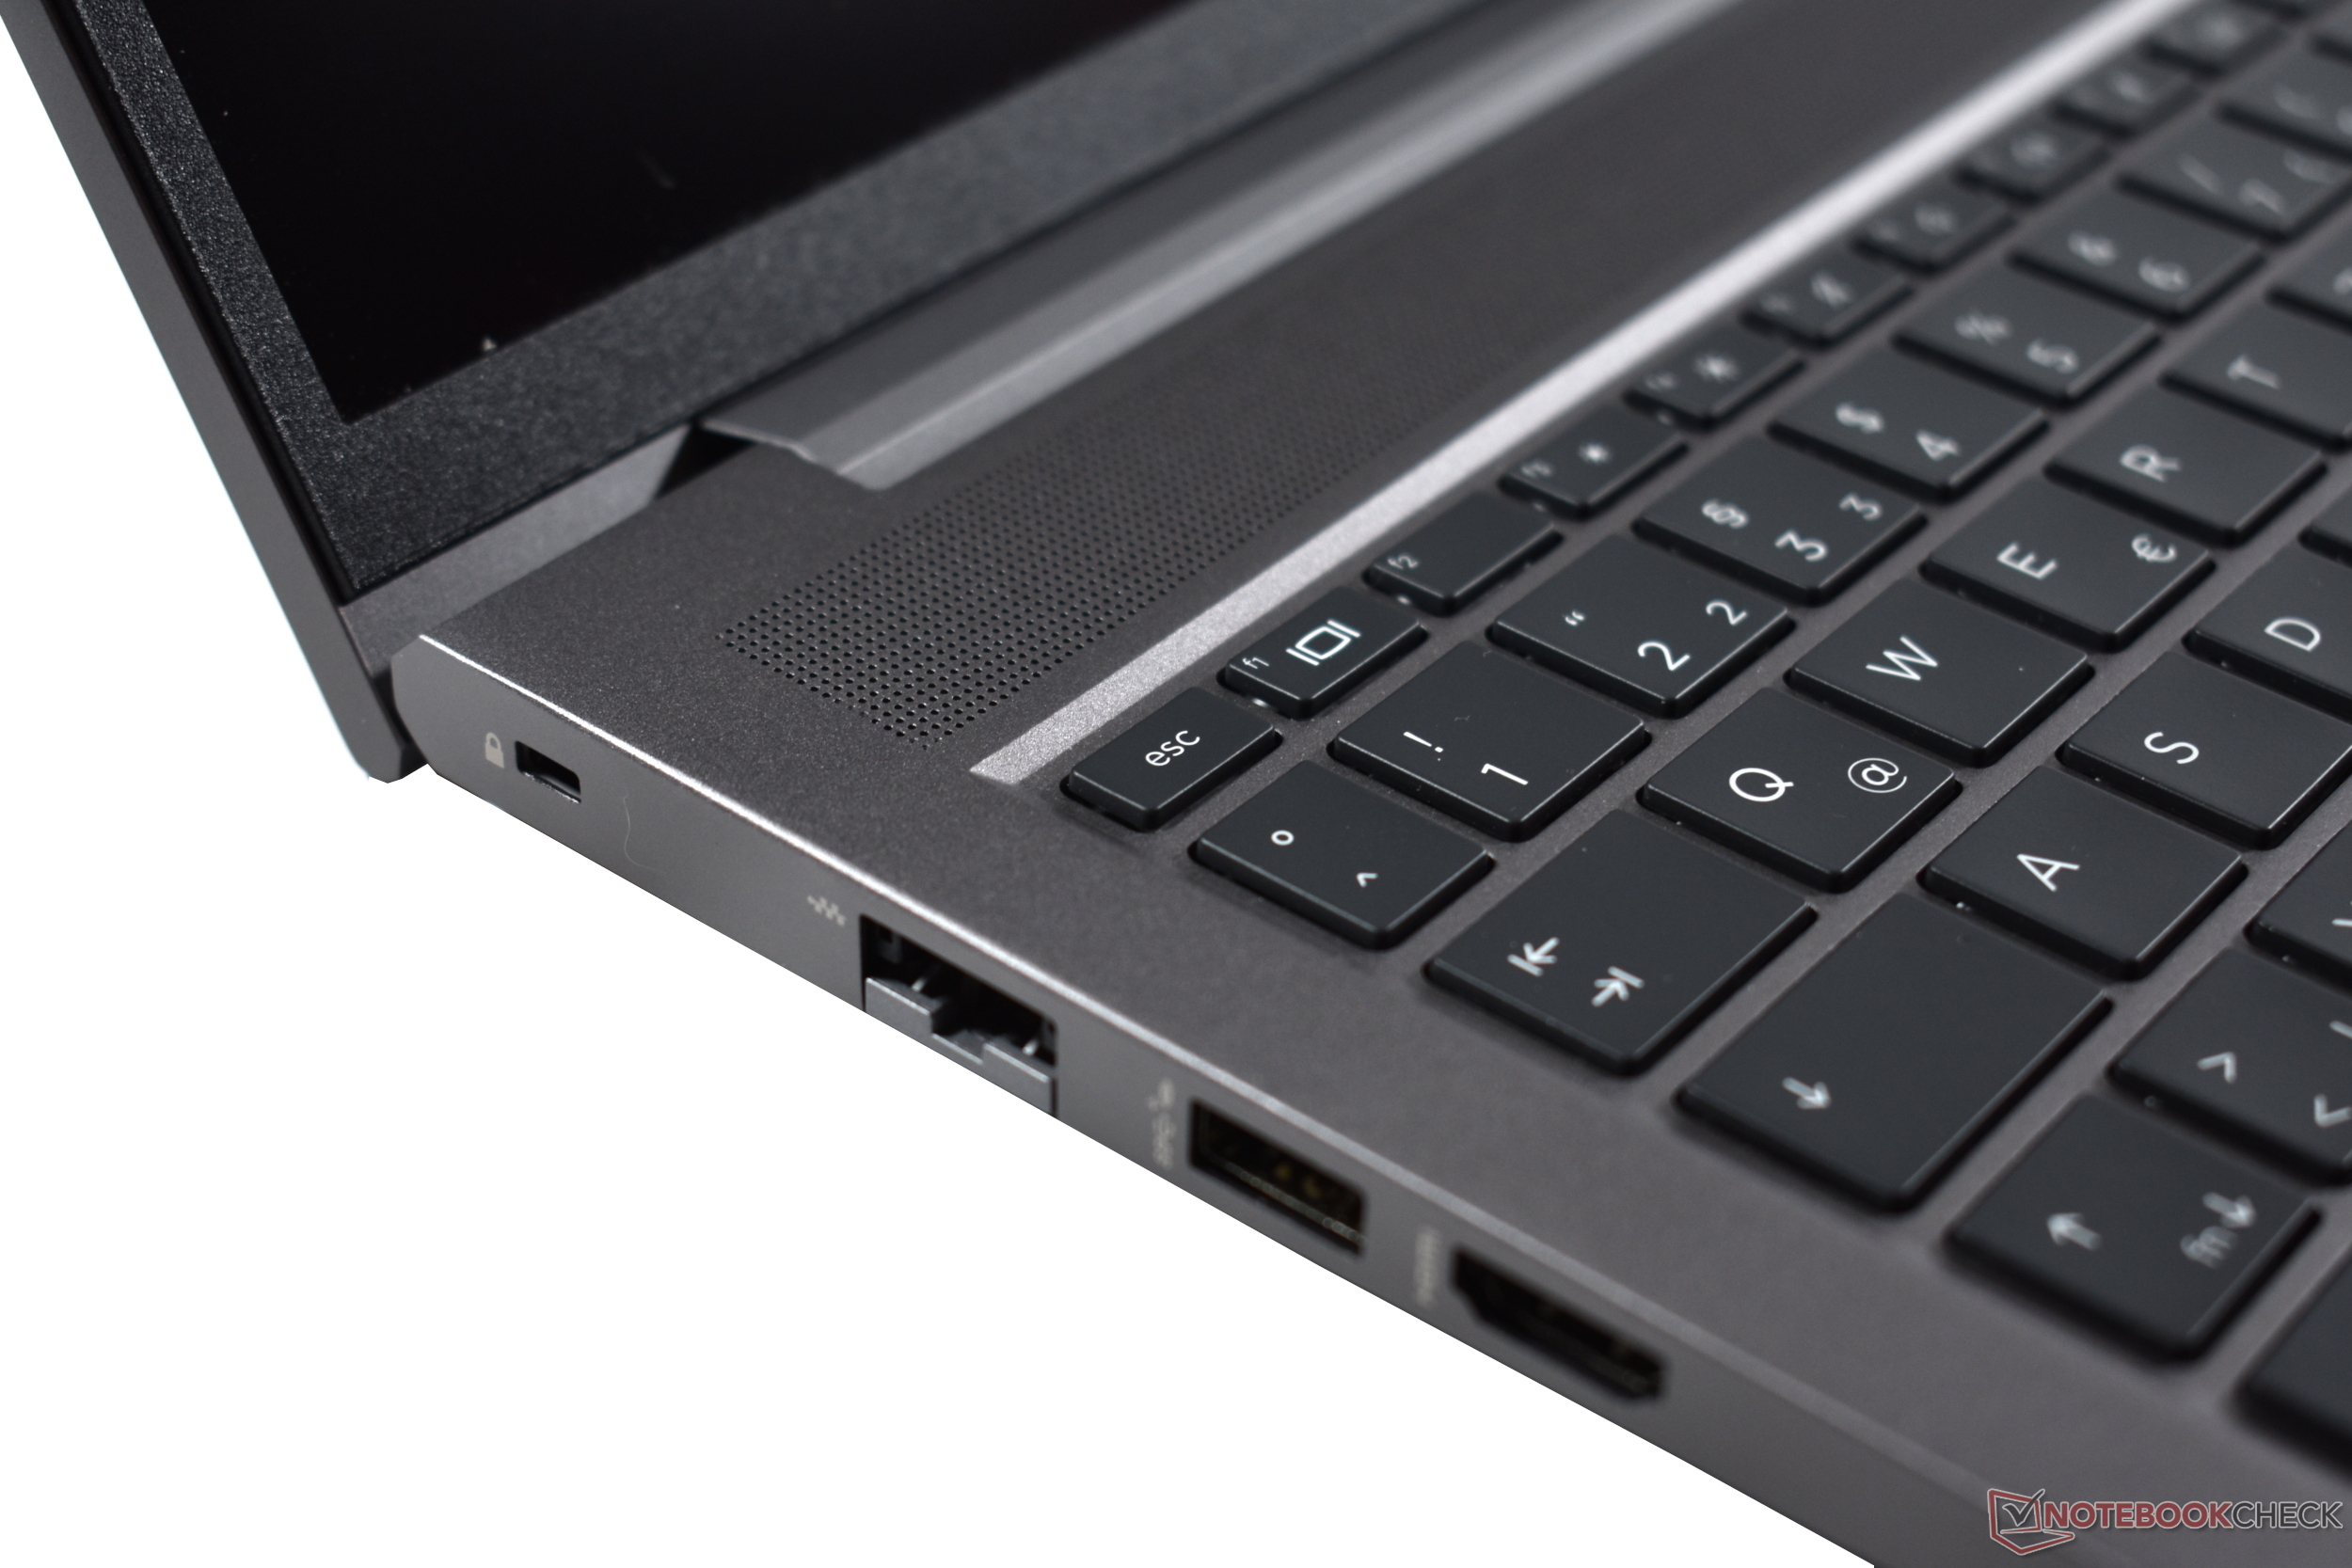
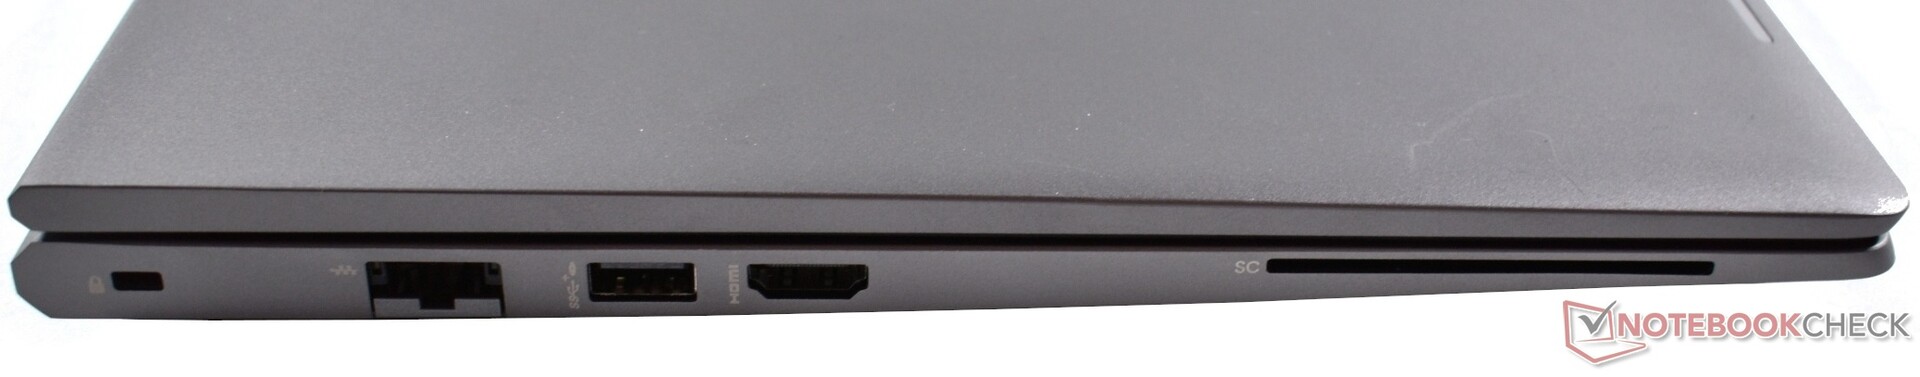
Even as an entry-level workstation, the ZBook 15 G8 delivers many important connections: There is Gbit LAN (even if it isn't 2.5 Gbps), there are a total of three USB-A 3.1 Gen1 (5 Gbps) ports, while there is only a single Thunderbolt 4 connection, and it also offers DisplayPort 1.4 and Power Delivery generally. We also appreciate seeing HDMI in version 2.0.
A SmartCard reader is optional, but there is always a Kensington Lock (nano). Together with the proprietary charging port, the whole package is rounded by a combo audio port. However, we miss an SD card slot.

Communication
In addition to Gbit LAN, Intel's Wi-Fi 6 AX201 + Bluetooth 5.2 is also available in soldered-in form. ~1.5 Gbps when sending and 1.33 Gbps when receiving corresponds to the high Wi-Fi speed of the competitors. While there is no WWAN slot, NFC is optionally available.
Webcam

The 720p webcam offers a SureShutter (cover), dual-array mics, and optional infrared for Windows Hello. However, the image quality is noisy.


Security
HP doesn't take half-measures in terms of security. On the side of hardware options, there is a SmartCard reader and an IR camera for Windows Hello. In addition, there is a mechanism for a security lock, a fingerprint reader, TPM 2.0, and a camera shutter.
On the software side, more security is provided by the HP System Safeguard against firmware attacks or sudden firmware errors, the HP Client Security Manager, HP Sure Click & Sure Sense against phishing and malware, and a "self healing" BIOS.
Accessories
A 150-Watt power supply (120 watts in the configurations without dGPU) is included. The packaging is plastic free (i.e., 10% only), most of it is cardboard (45% recycled) and paper cellulose. Optionally, HP offers various USB-C/Thunderbolt docks, but only the HP TB Dock G2 with combo cable (about 200 Euros, ~$204) includes Power Delivery.
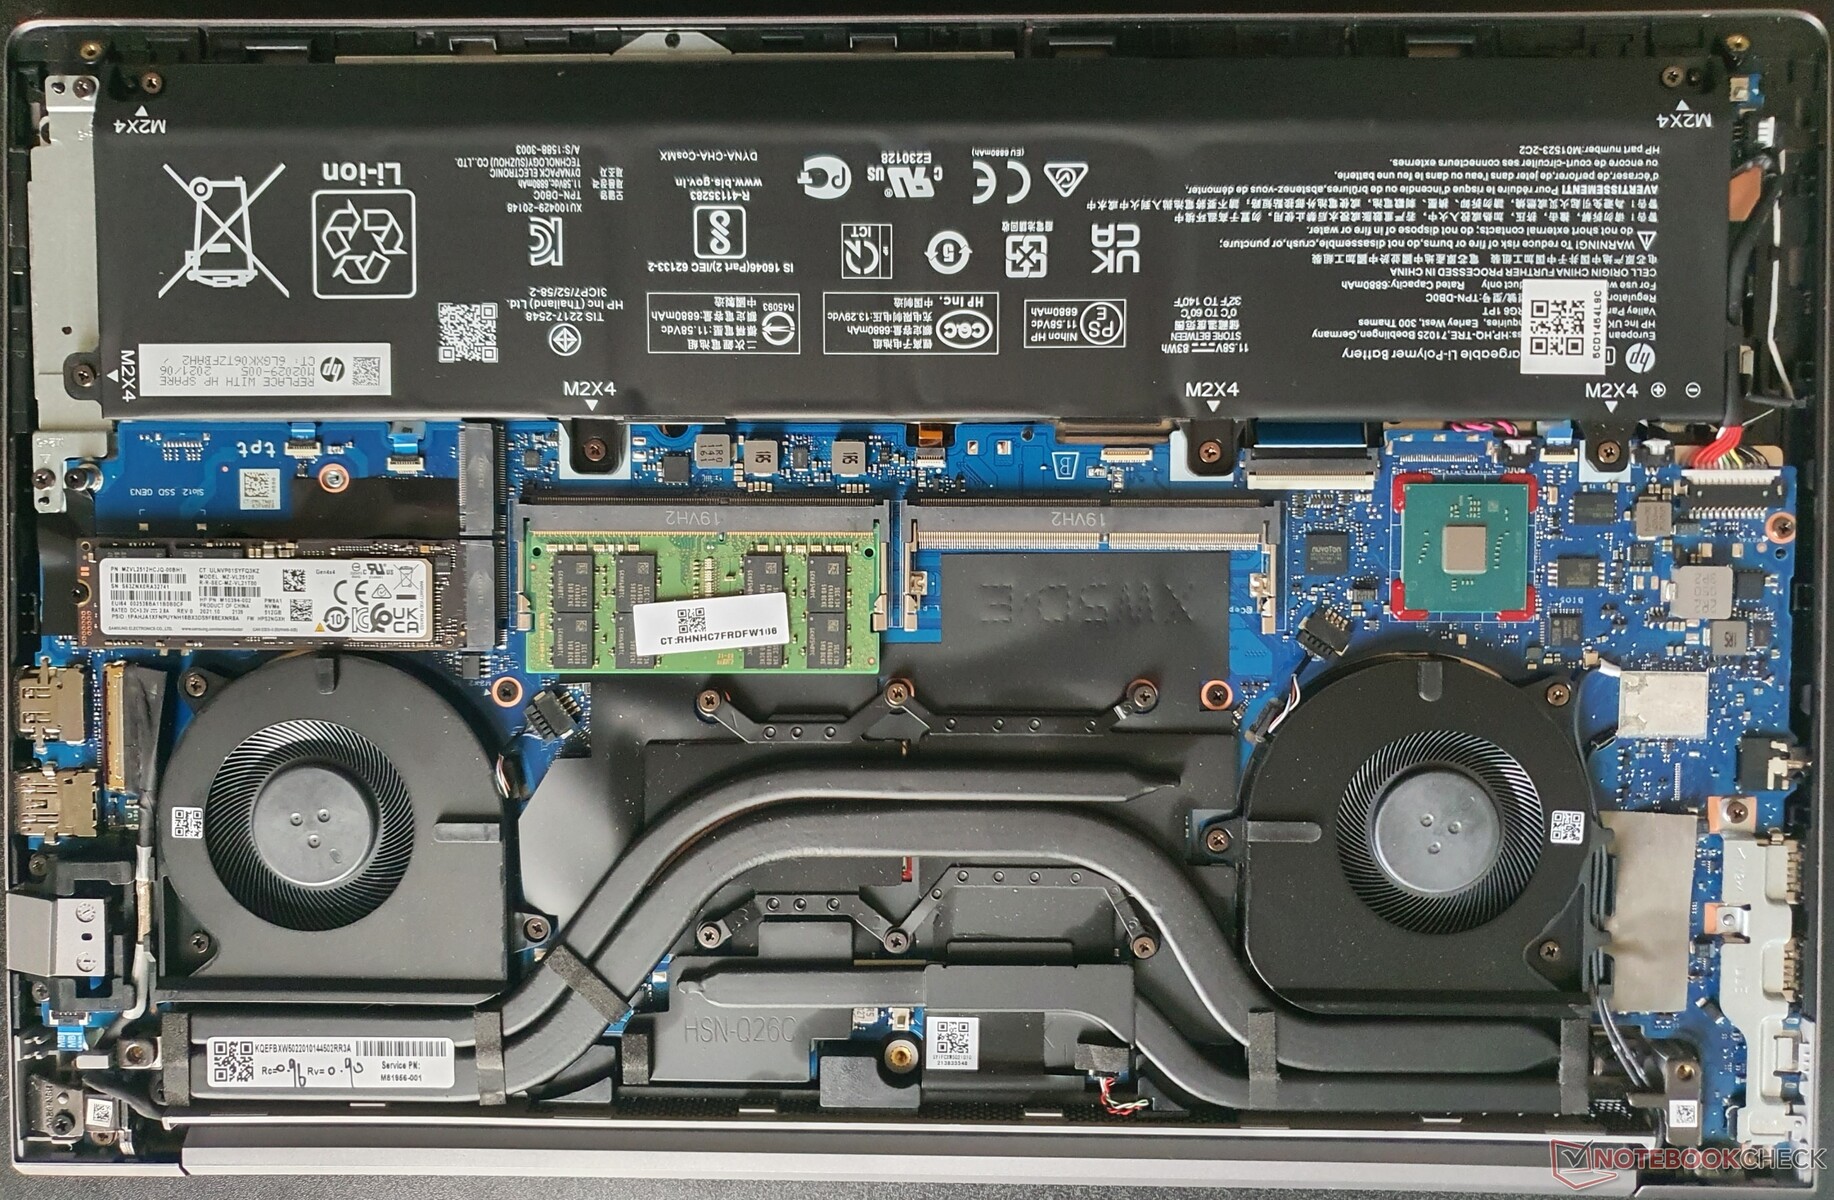
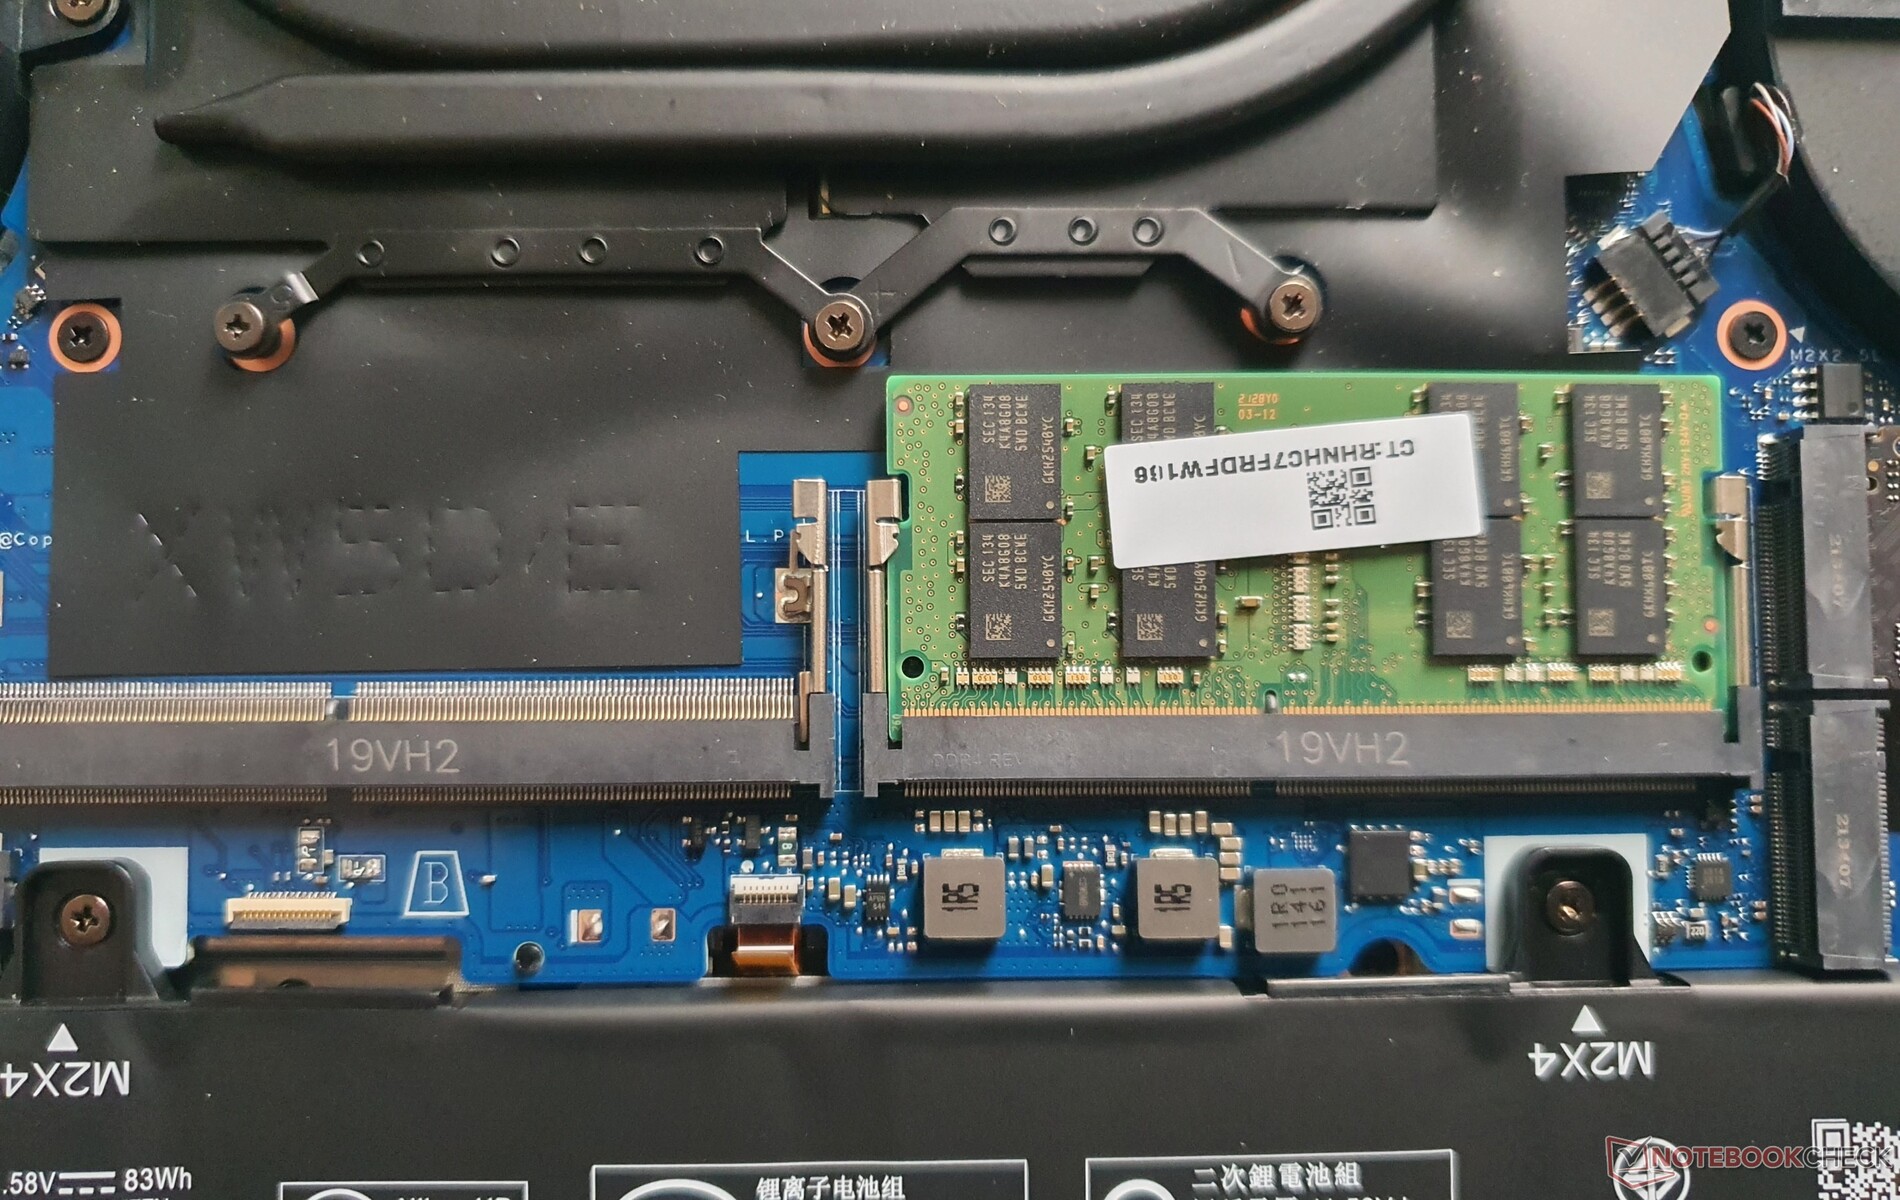
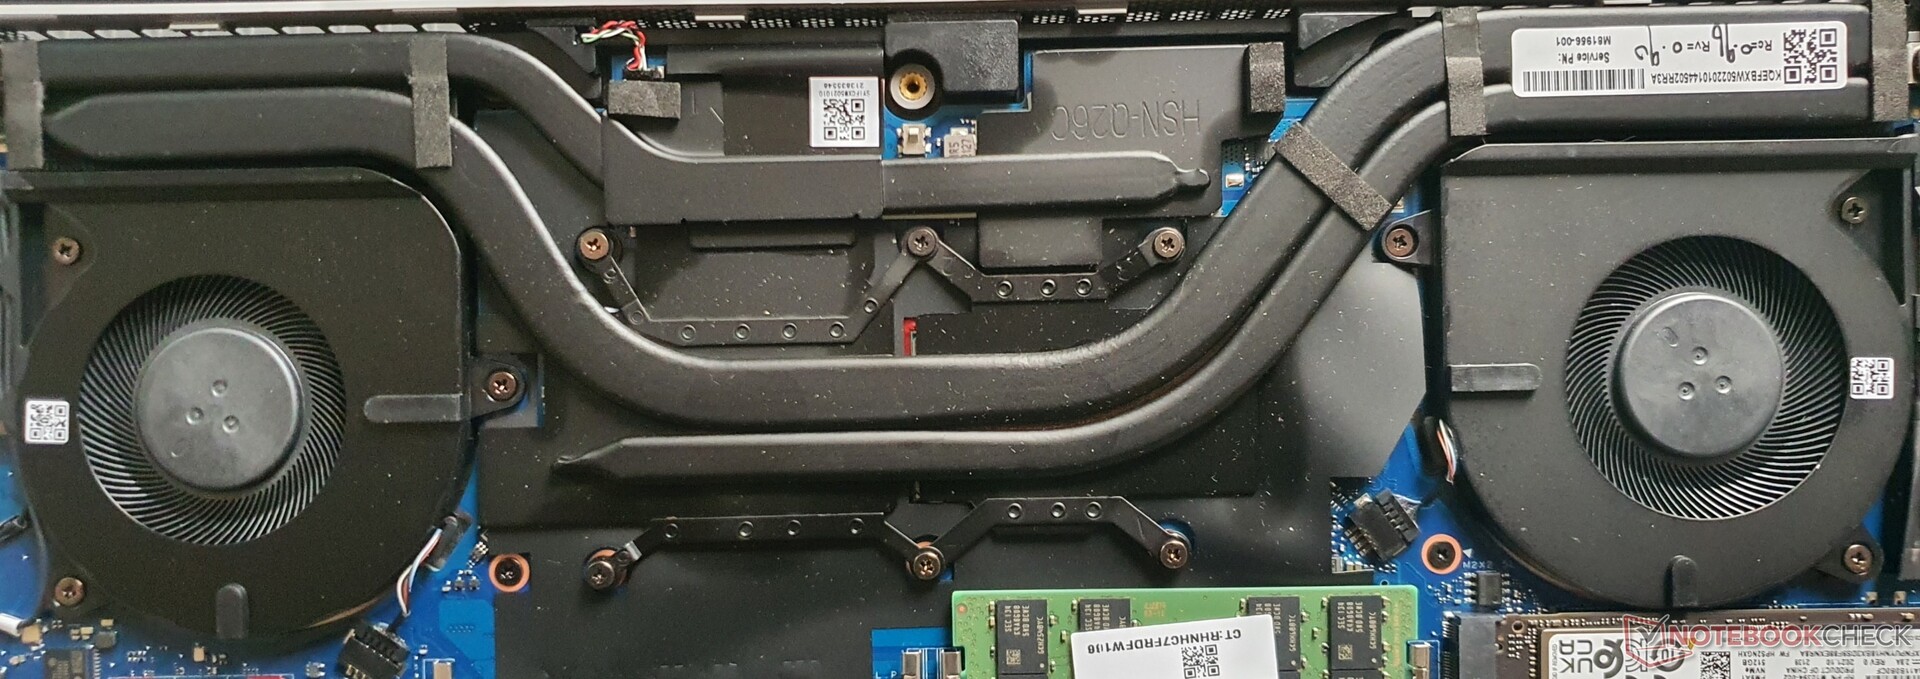
Maintenance
After removing only five Philips screws, the case bottom can be easily removed using a plastic prying tool. In this way, you get access to 2x SO DIMMs and 2x M.2-2280 slots, while the battery is also replaceable and the screwed-in cooling system can be maintained. The WLAN module is soldered in, and the keyboard is also fixed. There is no WWAN.


Warranty
In the German language area, HP offers a standard warranty of 3 years, which can be expanded up to 5 years. It includes pickup & return service, and on-site service costs extra. This corresponds to HP's policies for high-end business laptops.
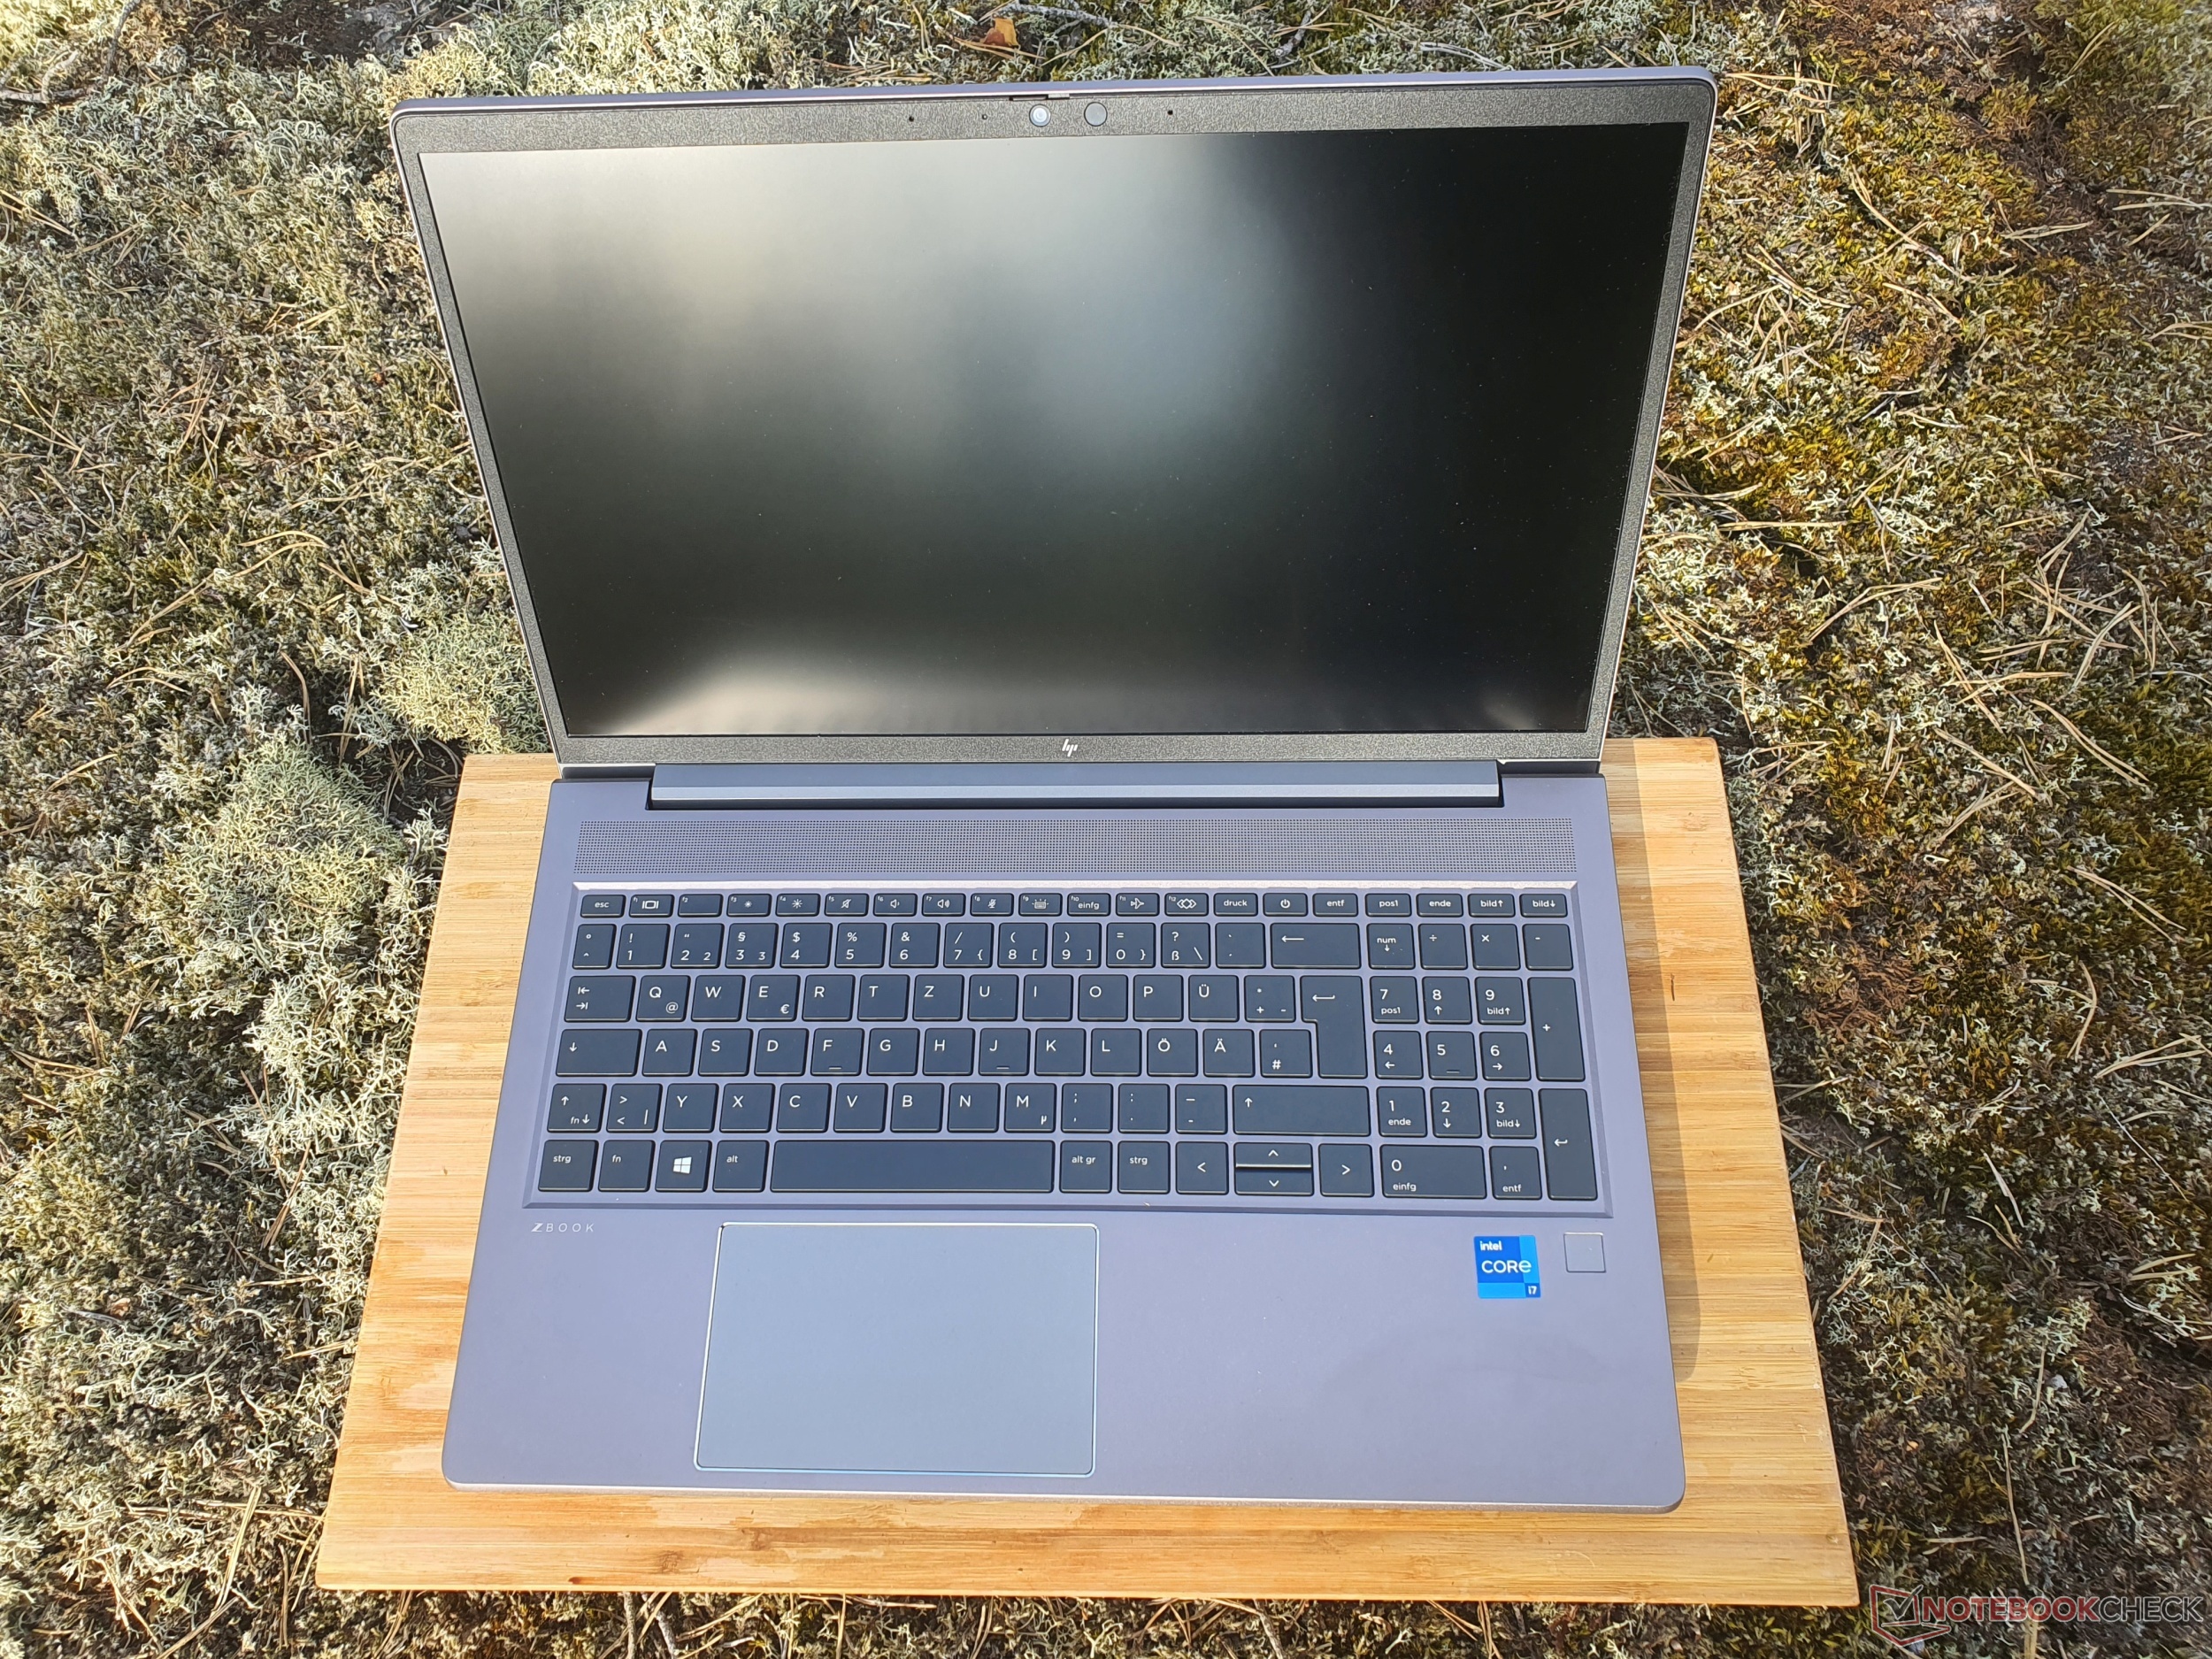
Input Devices: ZBook Power impresses with a crisp keyboard
Keyboard
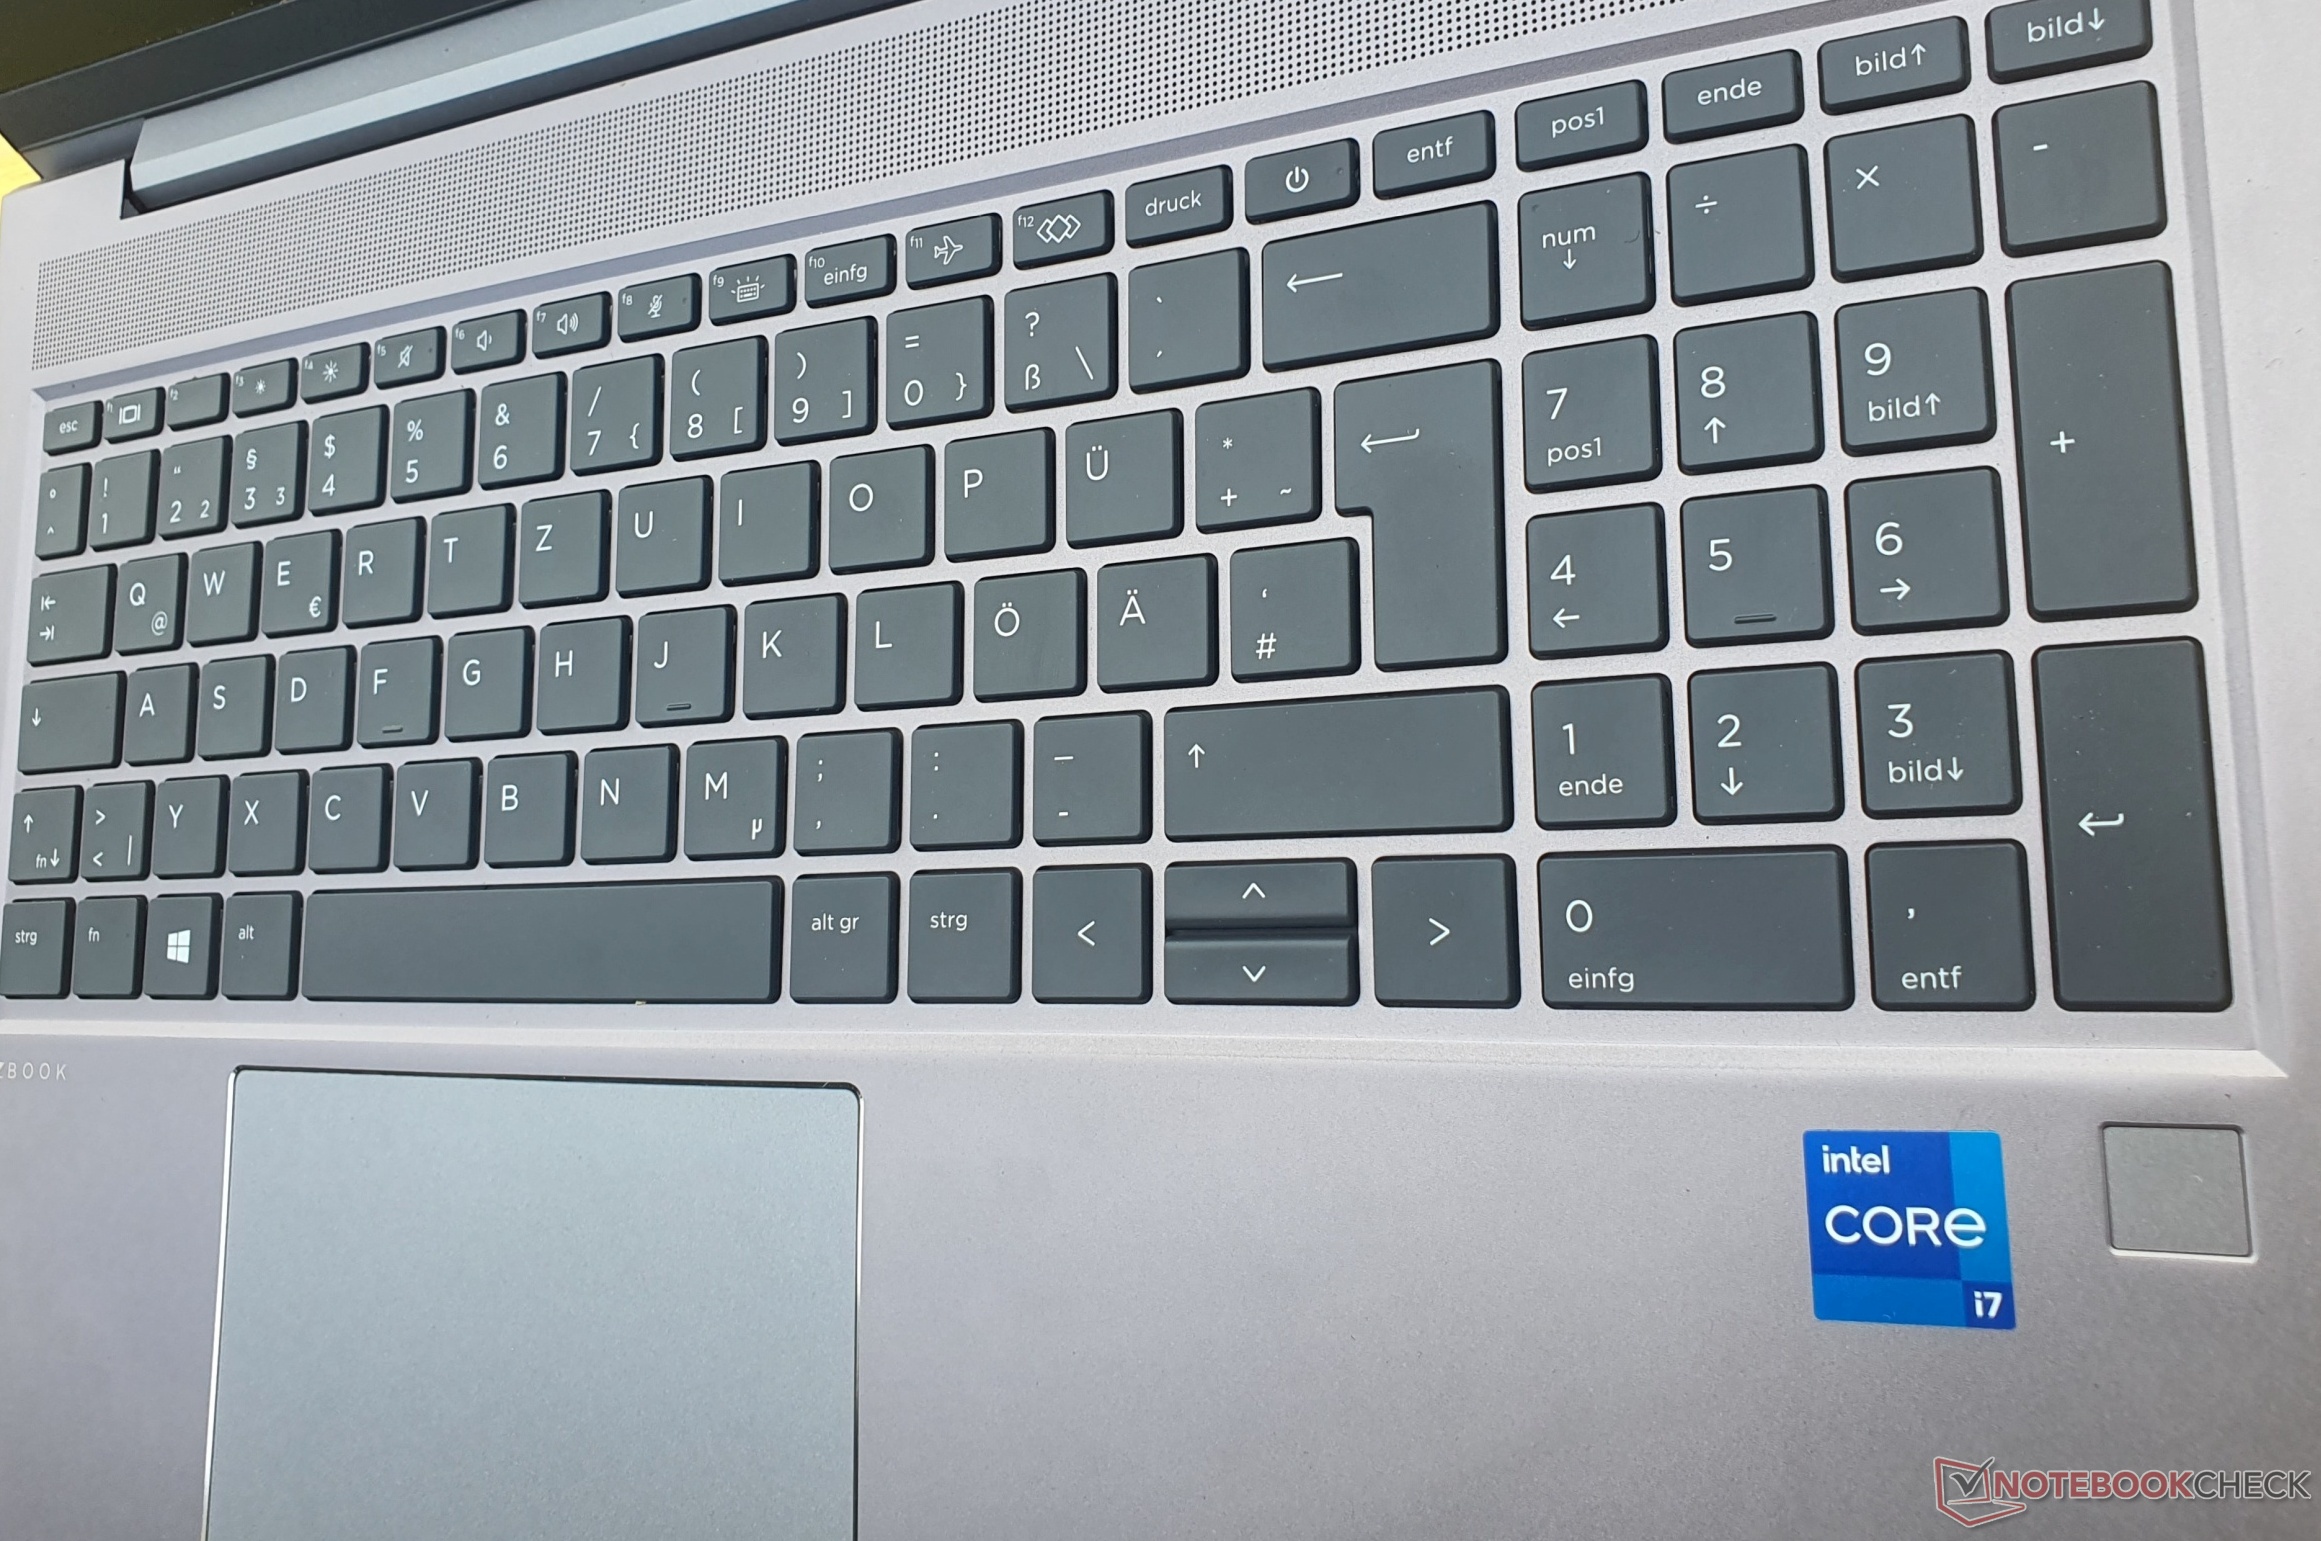
While the keyboard has slightly smaller keys (15 × 15 mm, ~0.6 x 0.6 in) and distances, the lettering is larger. It has a close resemblance to that of the ZBook Firefly and ZBook Fury, so the typing experience is just as crisp and the pressure point is clearly noticeable. The stroke of ~1.5 mm (~0.06 in) adds to the attractive overall impression.
The keyboard is splash proof and its operation remains attractively quiet. It can only be pressed down very slightly by applying some pressure to a single spot. It isn't necessarily any worse than that of the ThinkPad P15v.
The layout is very successful, but the keys that are smaller include the Enter, left Shift, vertical arrow keys, number block, and the top row. The power button is also integrated in the top row but pressing it accidentally won't cause the laptop to go to sleep. There is a two-step illumination, and its duration can be configured in the BIOS.


Touchpad
The 11.5 × 7 cm (~4.5 x 2.75 in) is extremely responsive and precise. The smooth glass surface offers very good sliding characteristics, and all the gestures are implemented flawlessly. The integrated keys have a medium stroke and produce a powerful and loud feedback.
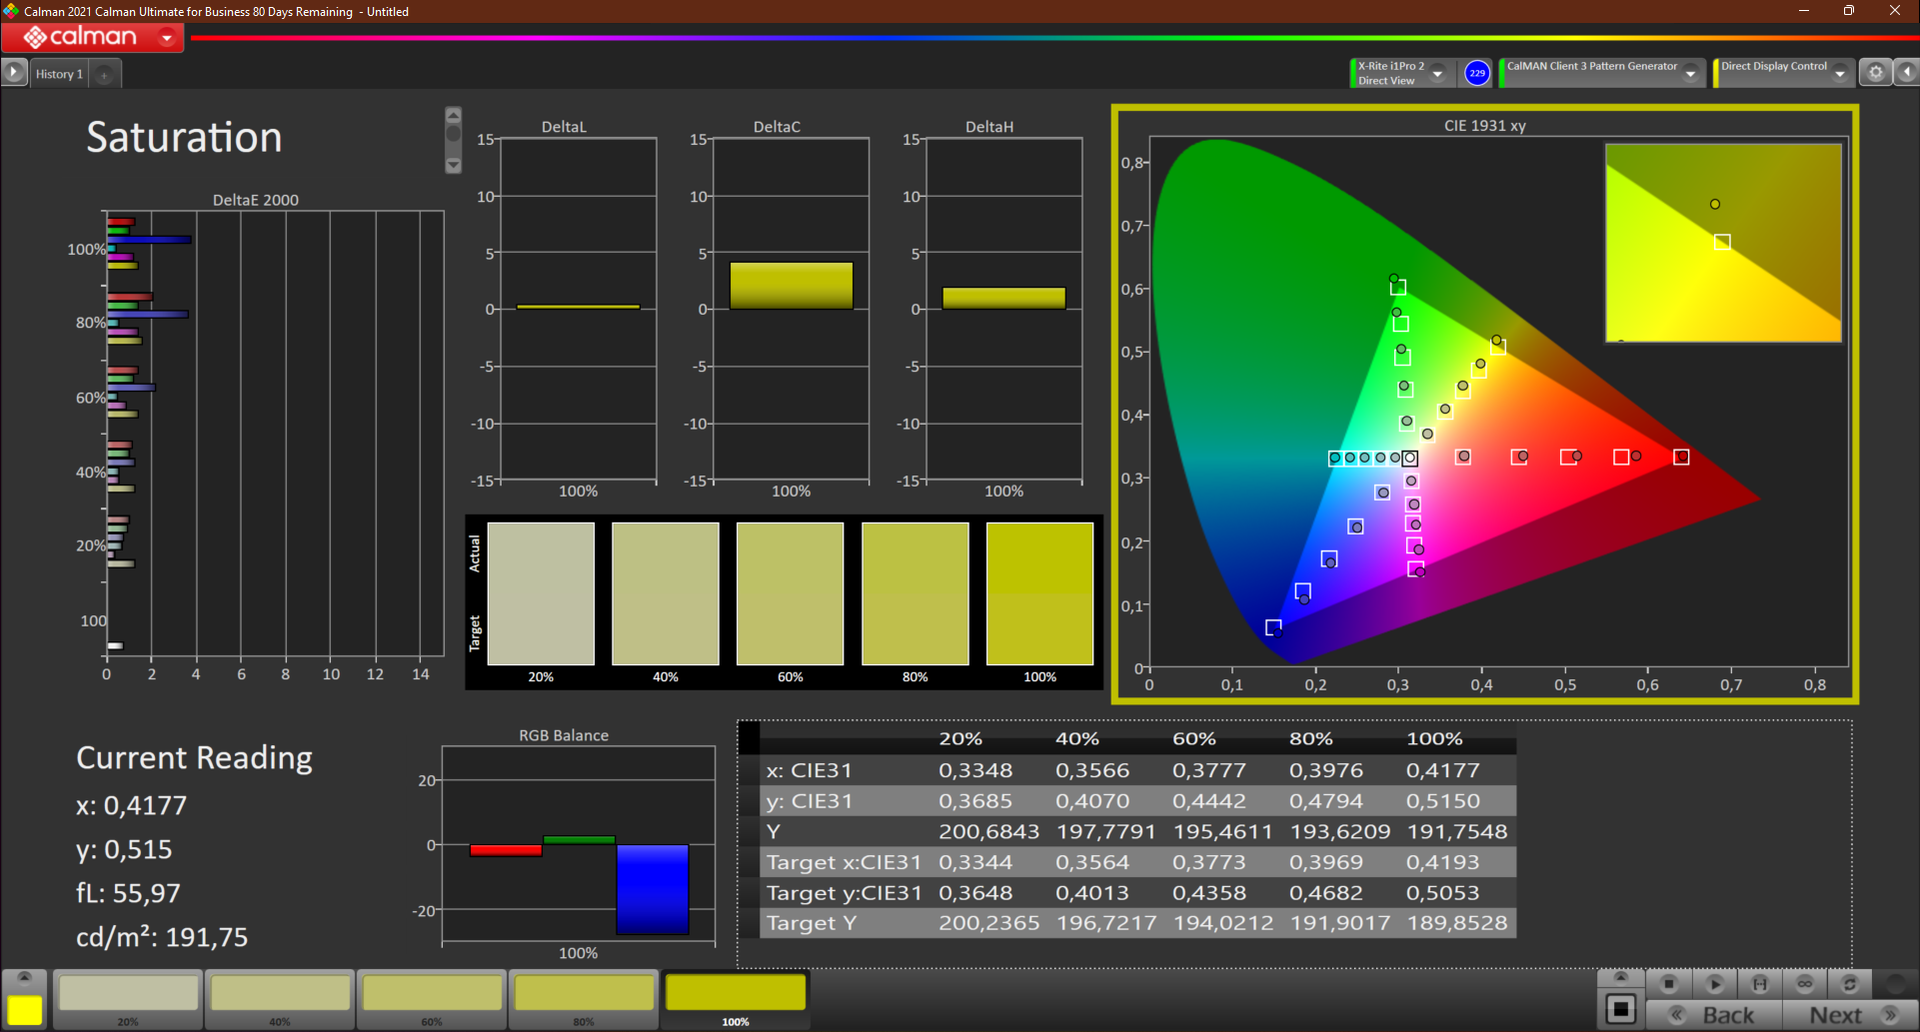
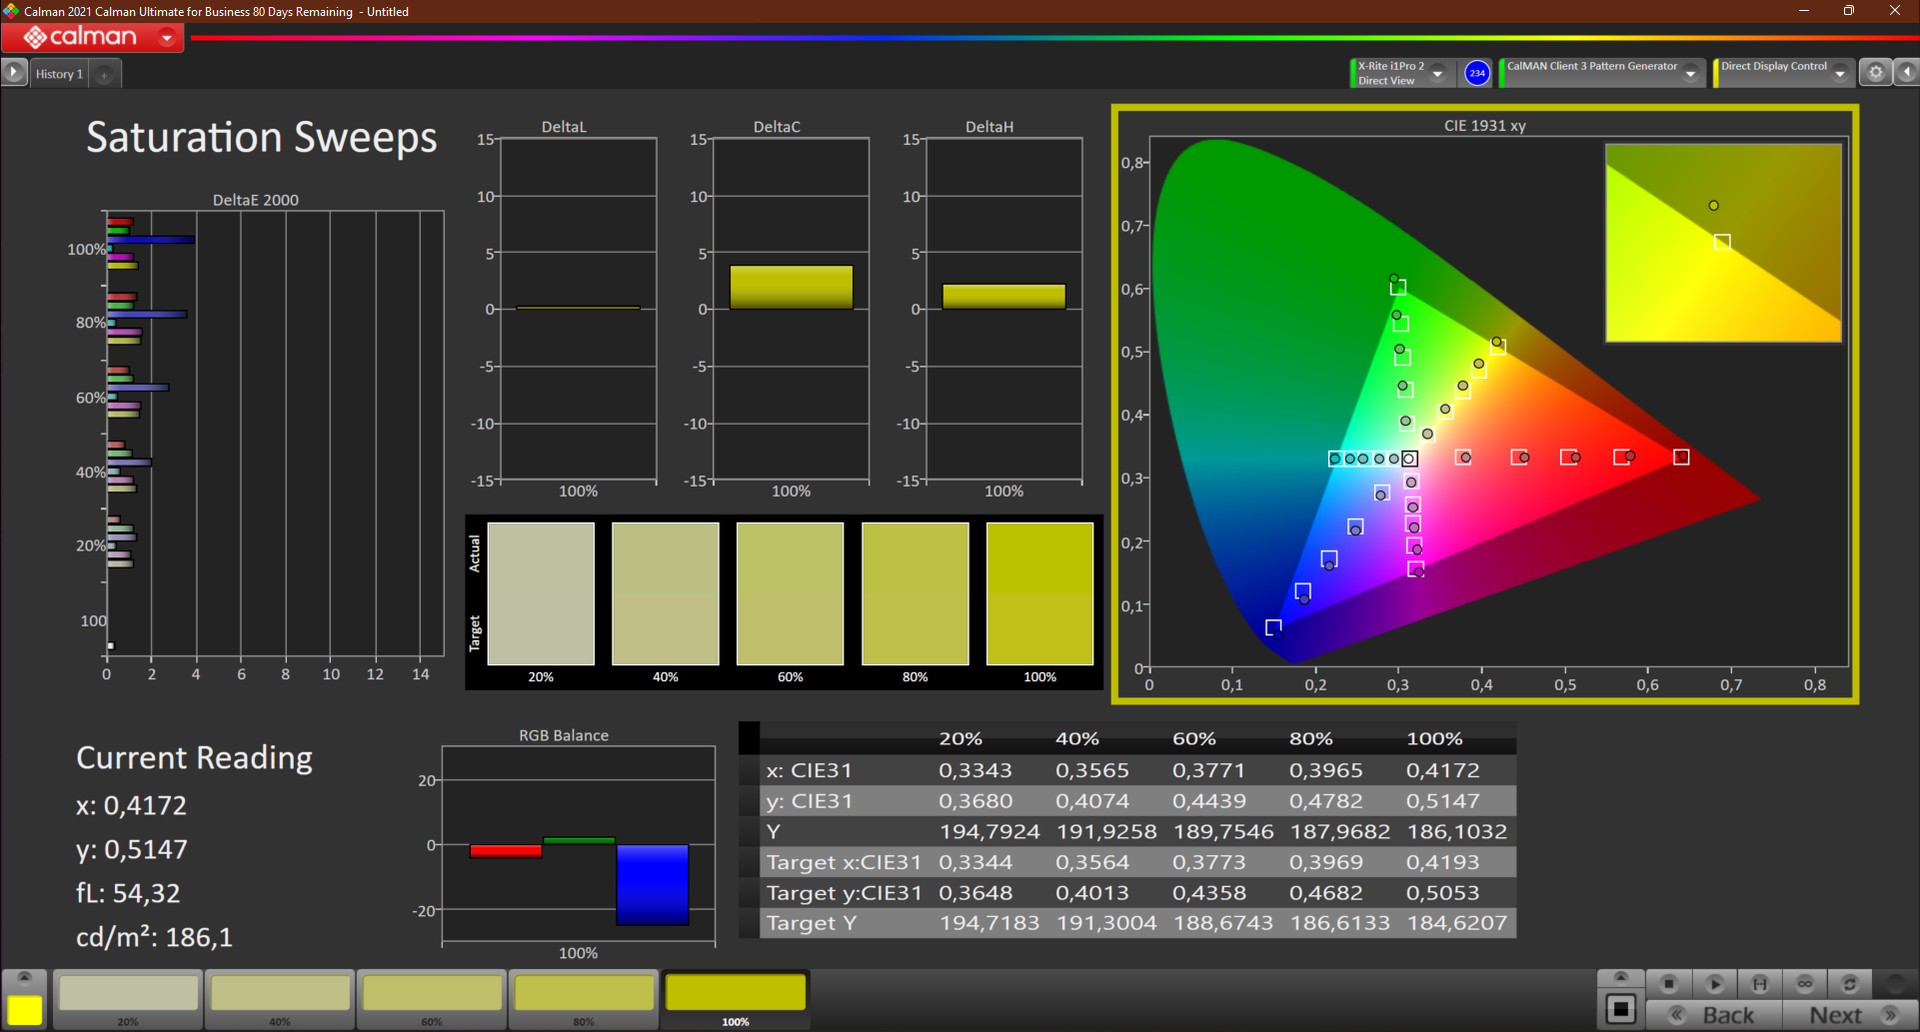
Bright and high-contrast FHD display in the ZBook Power
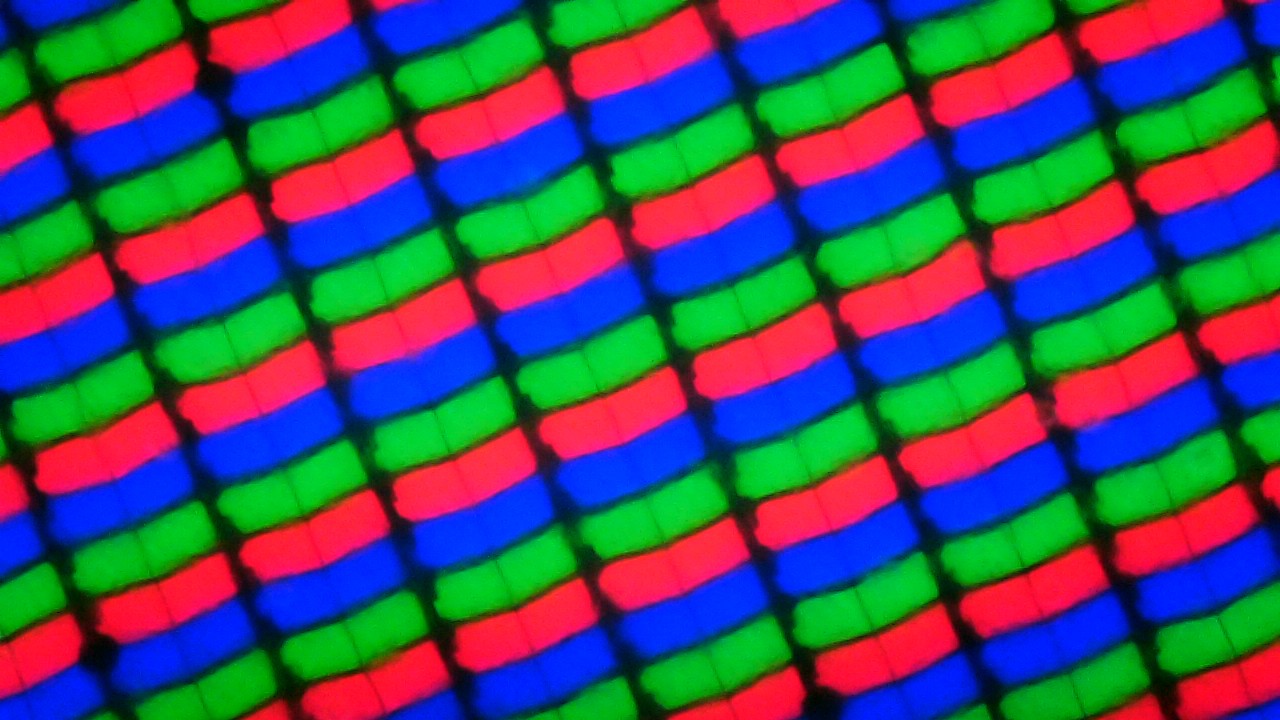

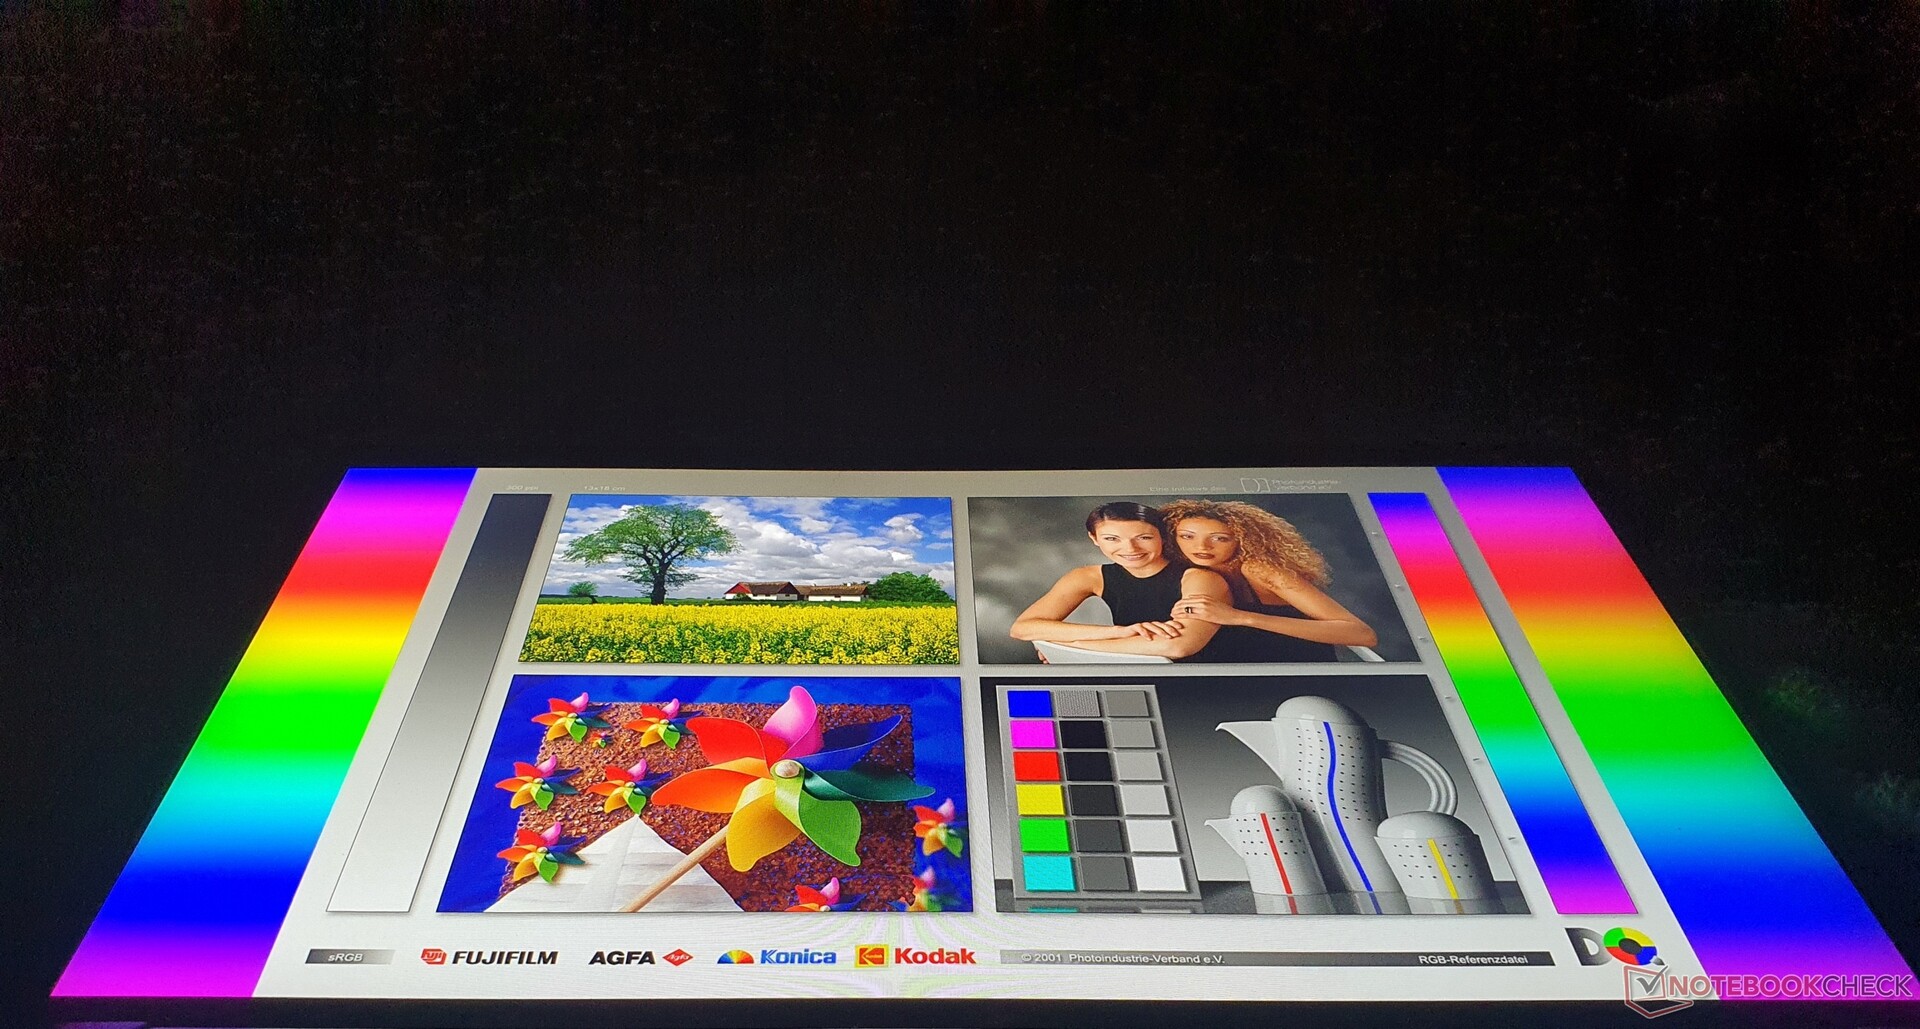
Our configuration includes the same matte, 15.6-inch, bright (400 nits), low-power FHD IPS panel (AUOA08B) in the 16:9 format as the predecessor. It is also used in several HP Elite and ProBooks, as well as in the HP Envy x360 15.
The 4K option (3840 x 2160 pixels) should reduce the battery life noticeably and according to the data sheet only offers complete coverage of the sRGB color space, like the 4K panel in the ZBook Firefly G7 - so you will look in vain for Dreamcolor. The entry-level panel uses FHD IPS with only 250 nits of brightness and with optional touch.
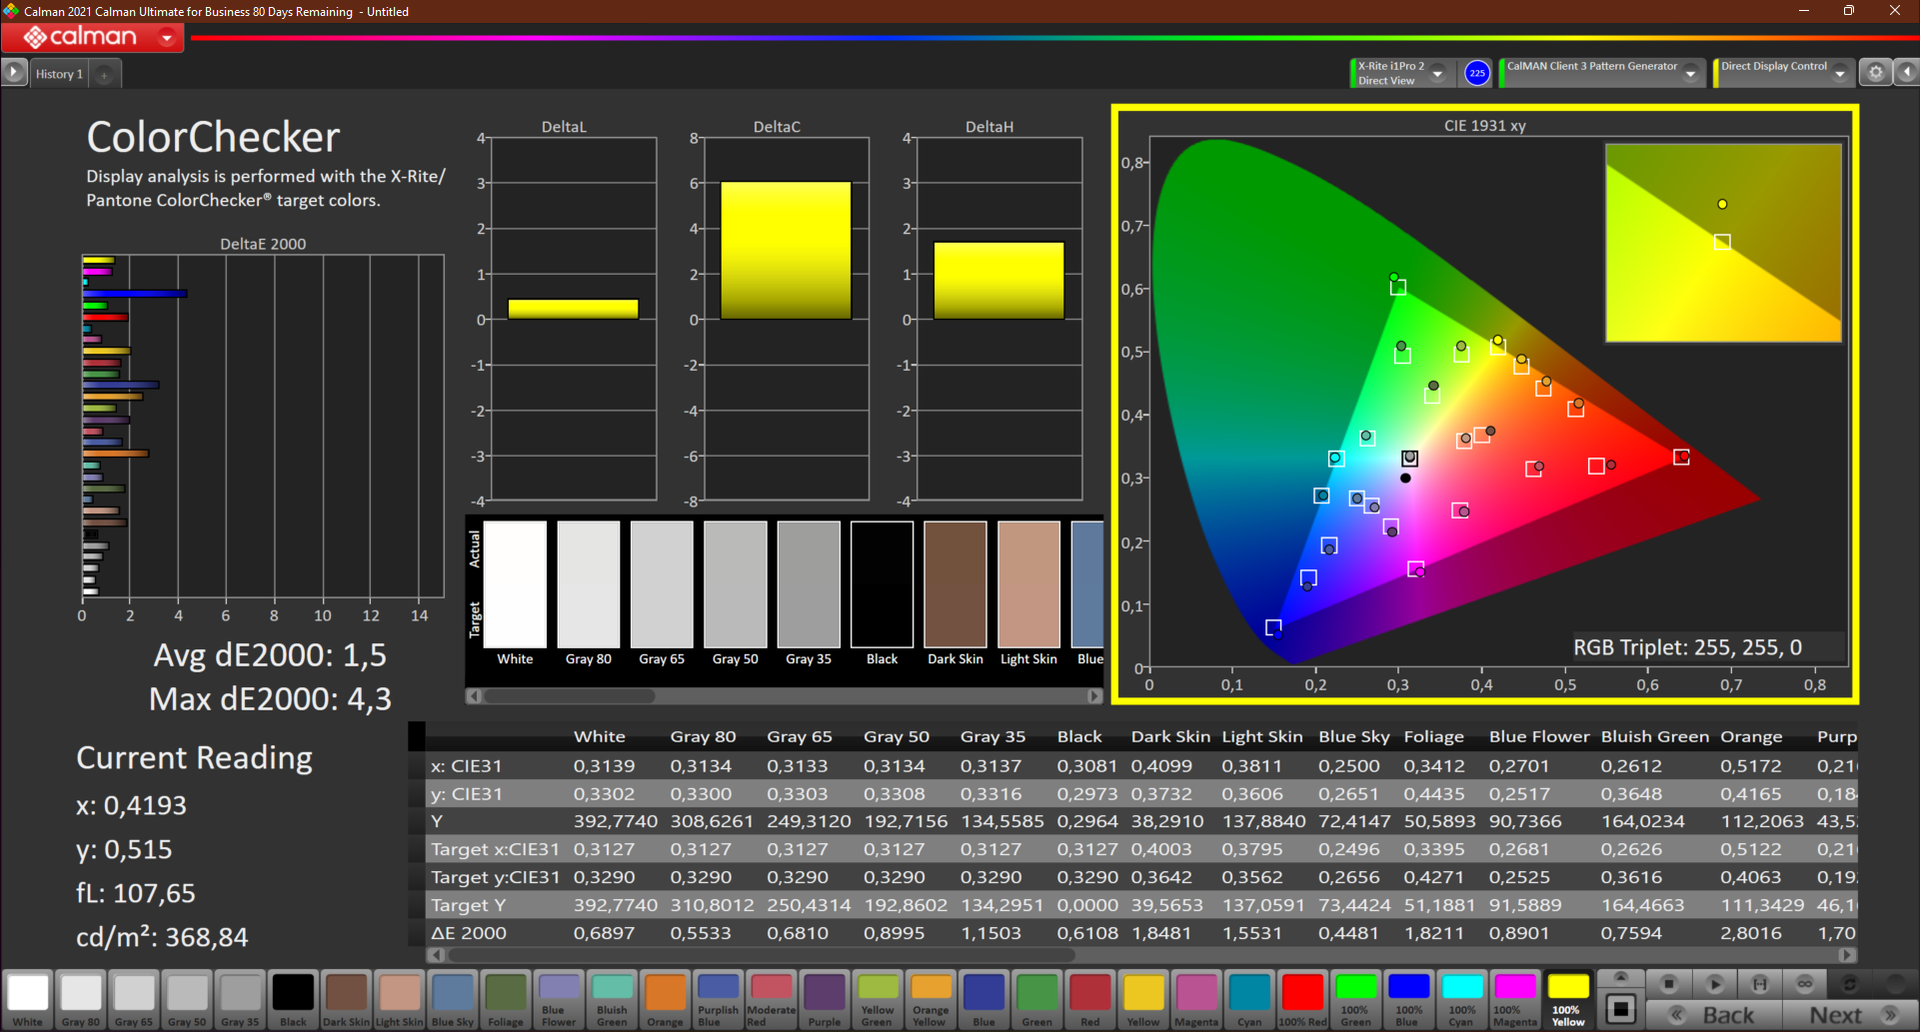
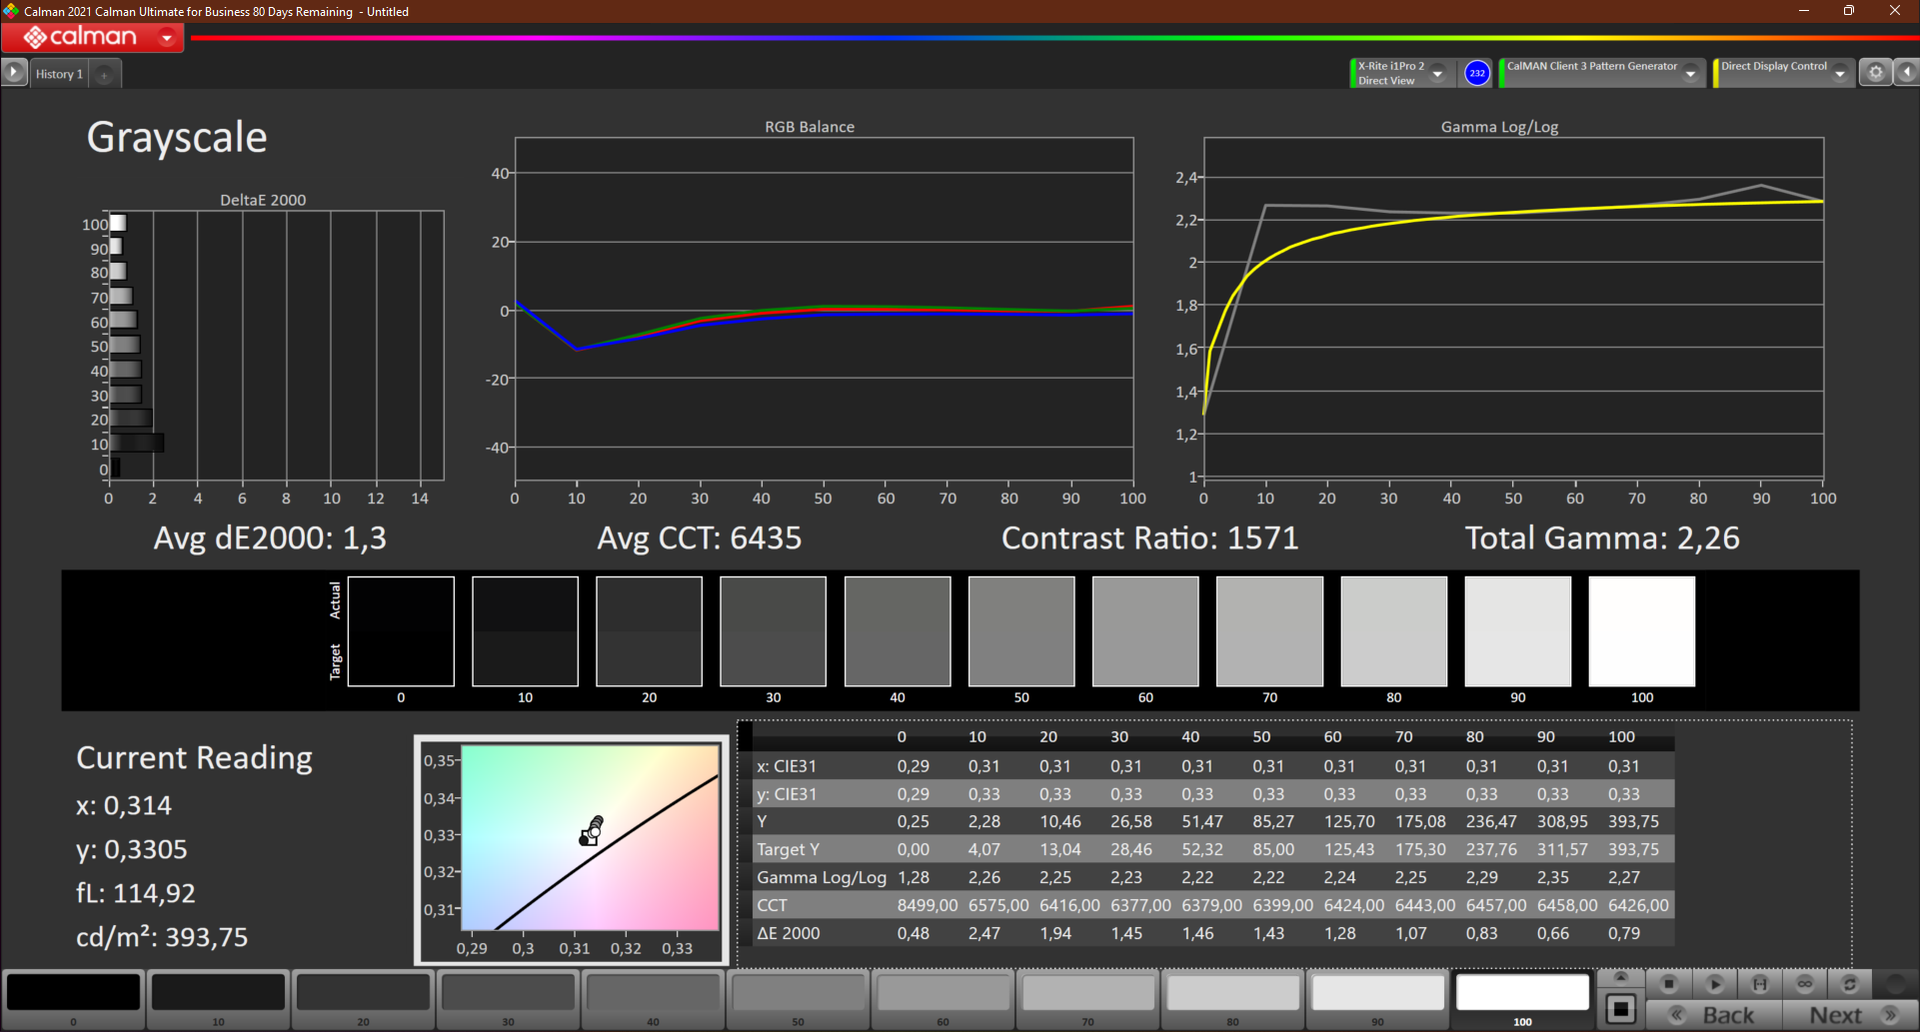
At an average of 385 nits, the panel gets significantly brighter than that of the ThinkPad P15v and Precision 3551. The DeltaE values (< 2) are also much more accurate. The contrast is a good 1574:1 and together with the black value of 0.25 nits produces a saturated black. The slow response times are a disadvantage. There is no PWM flickering.
| |||||||||||||||||||||||||
Brightness Distribution: 78 %
Center on Battery: 393 cd/m²
Contrast: 1572:1 (Black: 0.25 cd/m²)
ΔE Color 1.5 | 0.5-29.43 Ø5, calibrated: 1.4
ΔE Greyscale 1.3 | 0.57-98 Ø5.3
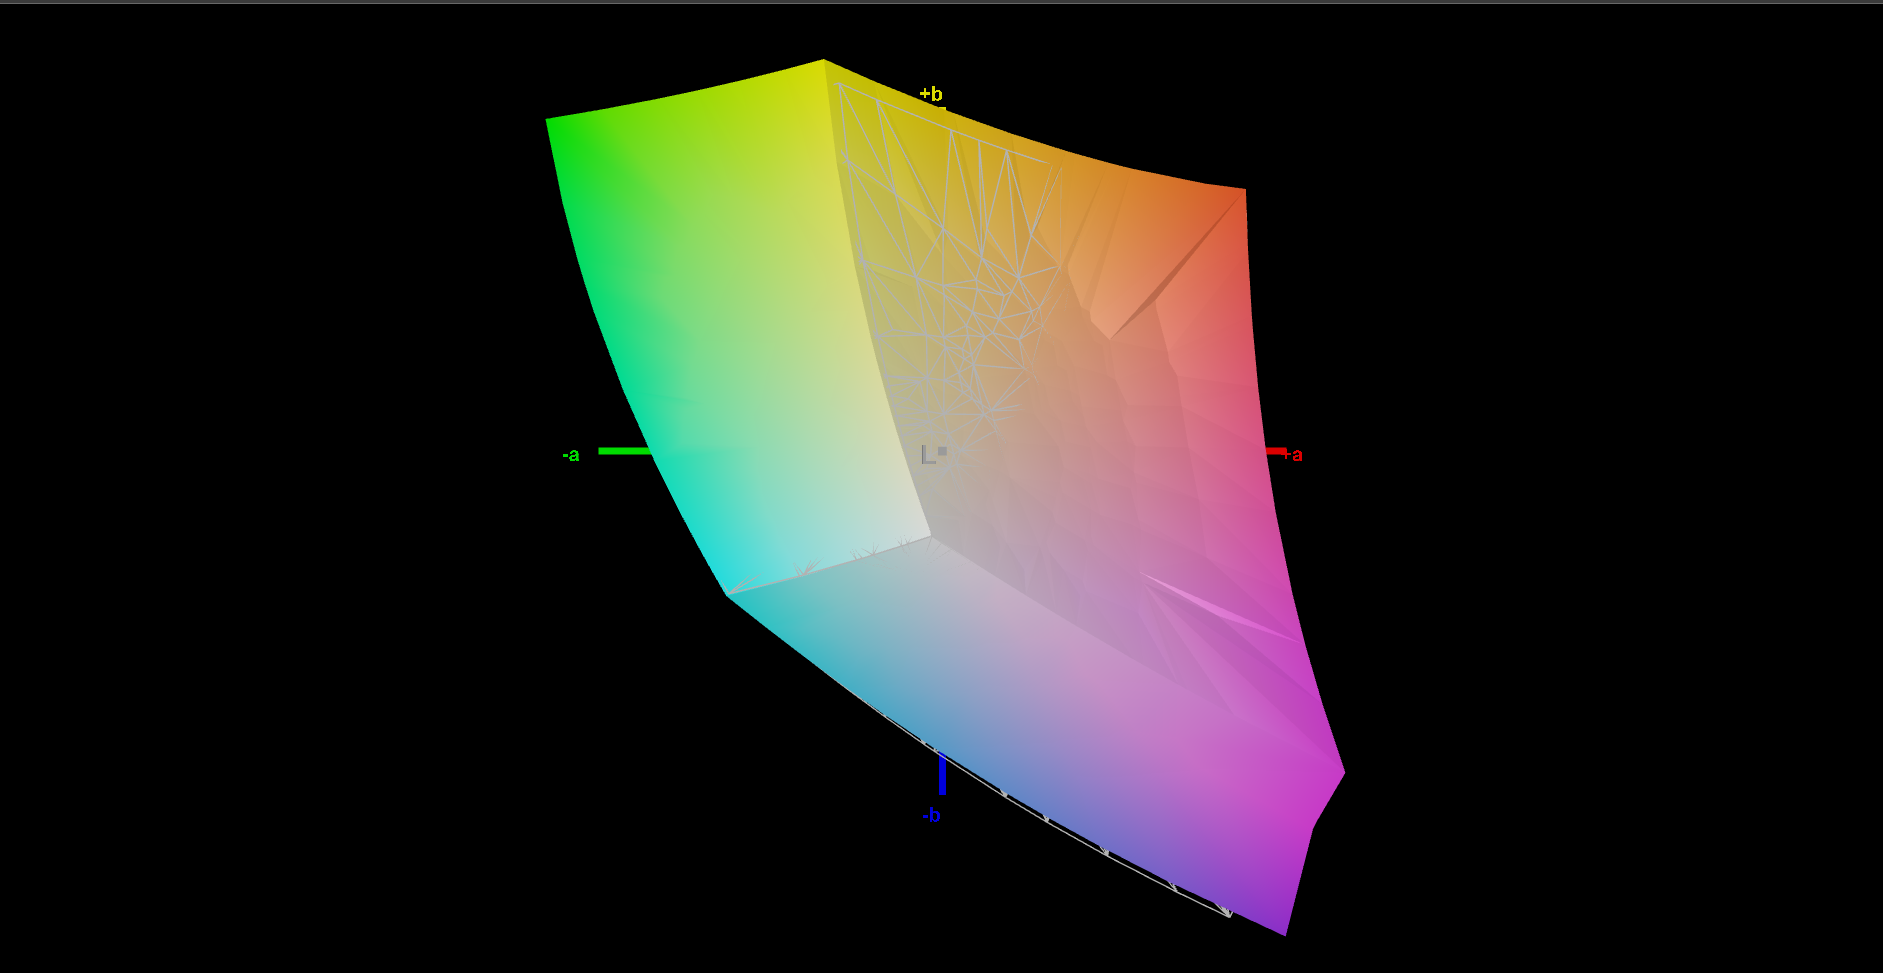
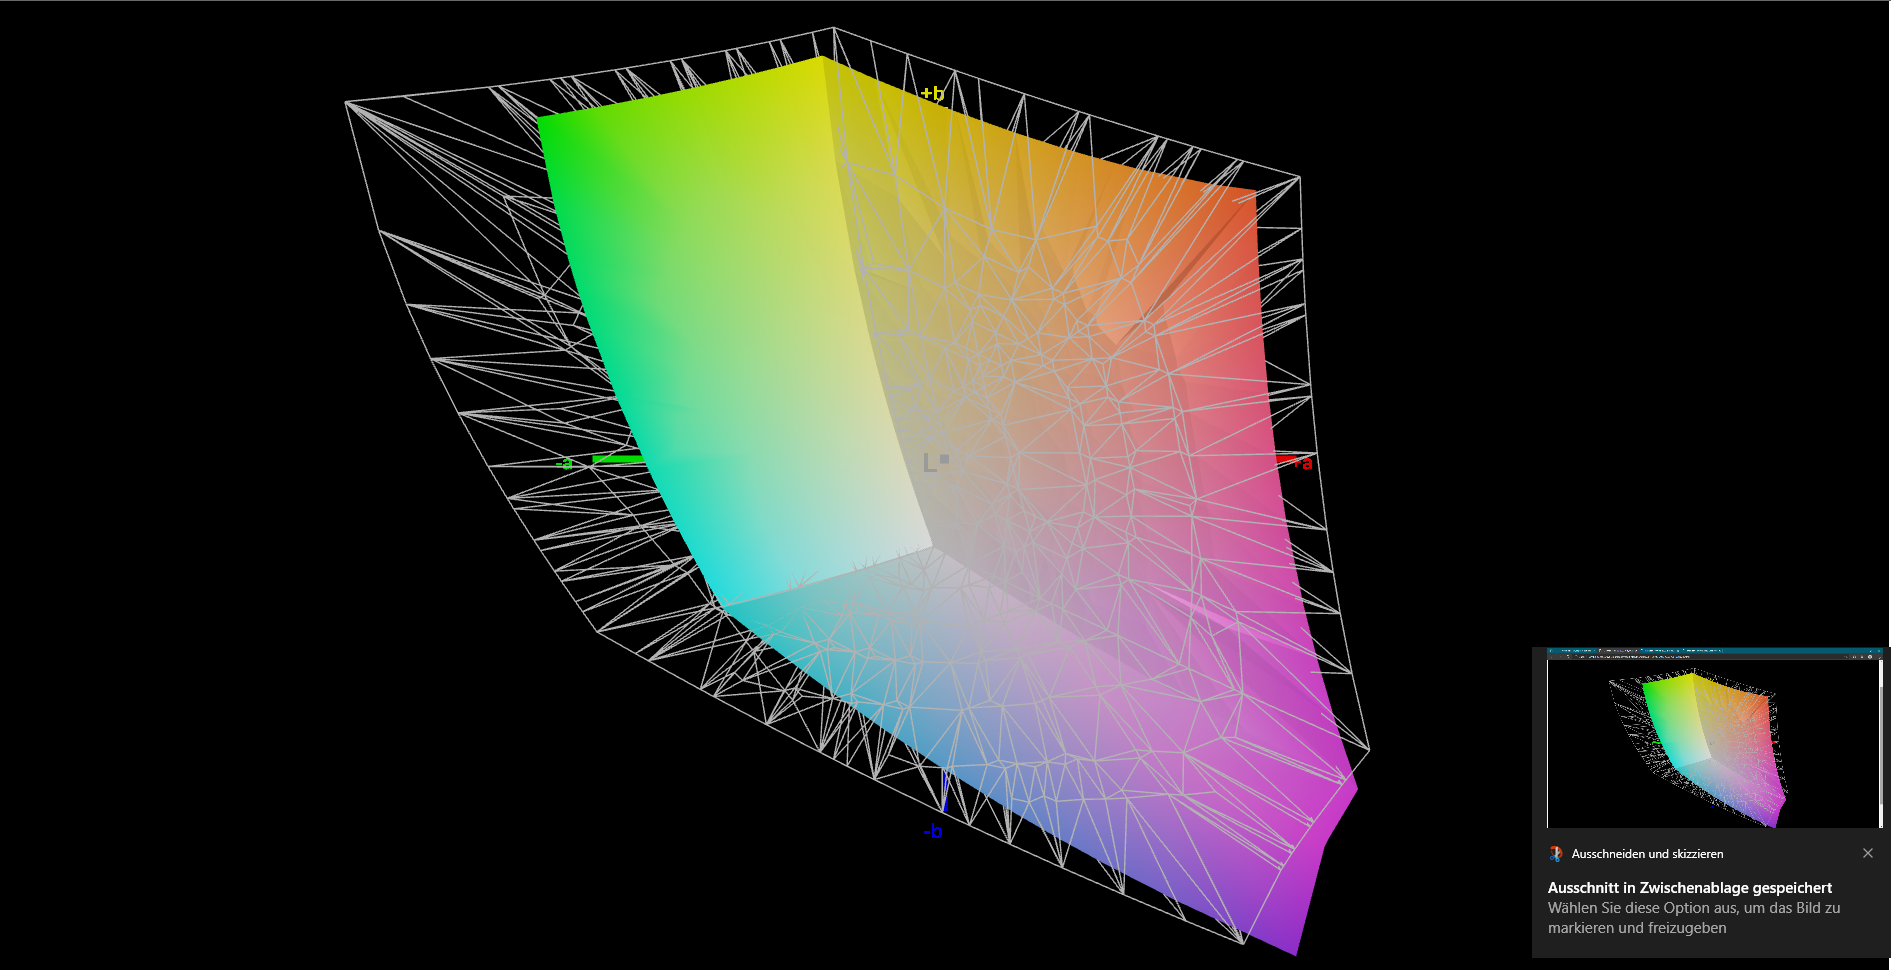
71.3% AdobeRGB 1998 (Argyll 2.2.0 3D)
99% sRGB (Argyll 2.2.0 3D)
70.5% Display P3 (Argyll 2.2.0 3D)
Gamma: 2.26
| HP ZBook Power 15 G8 313S5EA AUOA08B, IPS LED, 1920x1080, 15.60 | HP ZBook Fury 15 G8 BOE0969, IPS, 3840x2160, 15.60 | HP ZBook Studio 15 G8 SDC4145, OLED, 3840x2160, 15.60 | HP ZBook Firefly 15 G8 2C9R7EA LGD069B, IPS, 1920x1080, 15.60 | Lenovo ThinkPad P15v G2 21A9000XGE N156HCA-EAC, IPS LED, 1920x1080, 15.60 | Dell Precision 3000 3551 LG Philips 156WFD, IPS, 1920x1080, 15.60 | |
|---|---|---|---|---|---|---|
| Display | 20% | 26% | -2% | -36% | -45% | |
| Display P3 Coverage | 70.5 | 95.9 36% | 99.9 42% | 68.6 -3% | 43.7 -38% | 37.5 -47% |
| sRGB Coverage | 99 | 100 1% | 100 1% | 98.5 -1% | 65.1 -34% | 56.5 -43% |
| AdobeRGB 1998 Coverage | 71.3 | 87.3 22% | 95.3 34% | 70 -2% | 45.3 -36% | 38.74 -46% |
| Response Times | 74% | 95% | 12% | 24% | 41% | |
| Response Time Grey 50% / Grey 80% * | 61 | 14.8 ? 76% | 2.4 ? 96% | 56 ? 8% | 48 ? 21% | 29.6 ? 51% |
| Response Time Black / White * | 38 ? | 11 ? 71% | 2.4 ? 94% | 32 ? 16% | 28 ? 26% | 26.4 ? 31% |
| PWM Frequency | 240.4 ? | |||||
| Screen | -81% | -75% | -90% | -144% | -111% | |
| Brightness middle | 393 | 626 59% | 379.6 -3% | 397 1% | 305 -22% | 235.5 -40% |
| Brightness | 385 | 589 53% | 380 -1% | 402 4% | 281 -27% | 228 -41% |
| Brightness Distribution | 78 | 87 12% | 95 22% | 84 8% | 88 13% | 89 14% |
| Black Level * | 0.25 | 0.58 -132% | 0.13 48% | 0.32 -28% | 0.25 -0% | |
| Contrast | 1572 | 1079 -31% | 3054 94% | 953 -39% | 942 -40% | |
| Colorchecker dE 2000 * | 1.5 | 5.41 -261% | 5.15 -243% | 5.9 -293% | 5.9 -293% | 5.44 -263% |
| Colorchecker dE 2000 max. * | 4.3 | 9.05 -110% | 7.79 -81% | 9.4 -119% | 20.1 -367% | 13.58 -216% |
| Colorchecker dE 2000 calibrated * | 1.4 | 0.6 57% | 3.1 -121% | 1.1 21% | 4.5 -221% | 5.2 -271% |
| Greyscale dE 2000 * | 1.3 | 6.2 -377% | 2.6 -100% | 8.8 -577% | 5.3 -308% | 3.1 -138% |
| Gamma | 2.26 97% | 2.66 83% | 1.99 111% | 2.47 89% | 2.1 105% | 2.42 91% |
| CCT | 6435 101% | 6101 107% | 6166 105% | 6416 101% | 6307 103% | 7070 92% |
| Color Space (Percent of AdobeRGB 1998) | 63.7 | 35.5 | ||||
| Color Space (Percent of sRGB) | 98.5 | 56.1 | ||||
| Total Average (Program / Settings) | 4% /
-37% | 15% /
-22% | -27% /
-57% | -52% /
-97% | -38% /
-75% |
* ... smaller is better
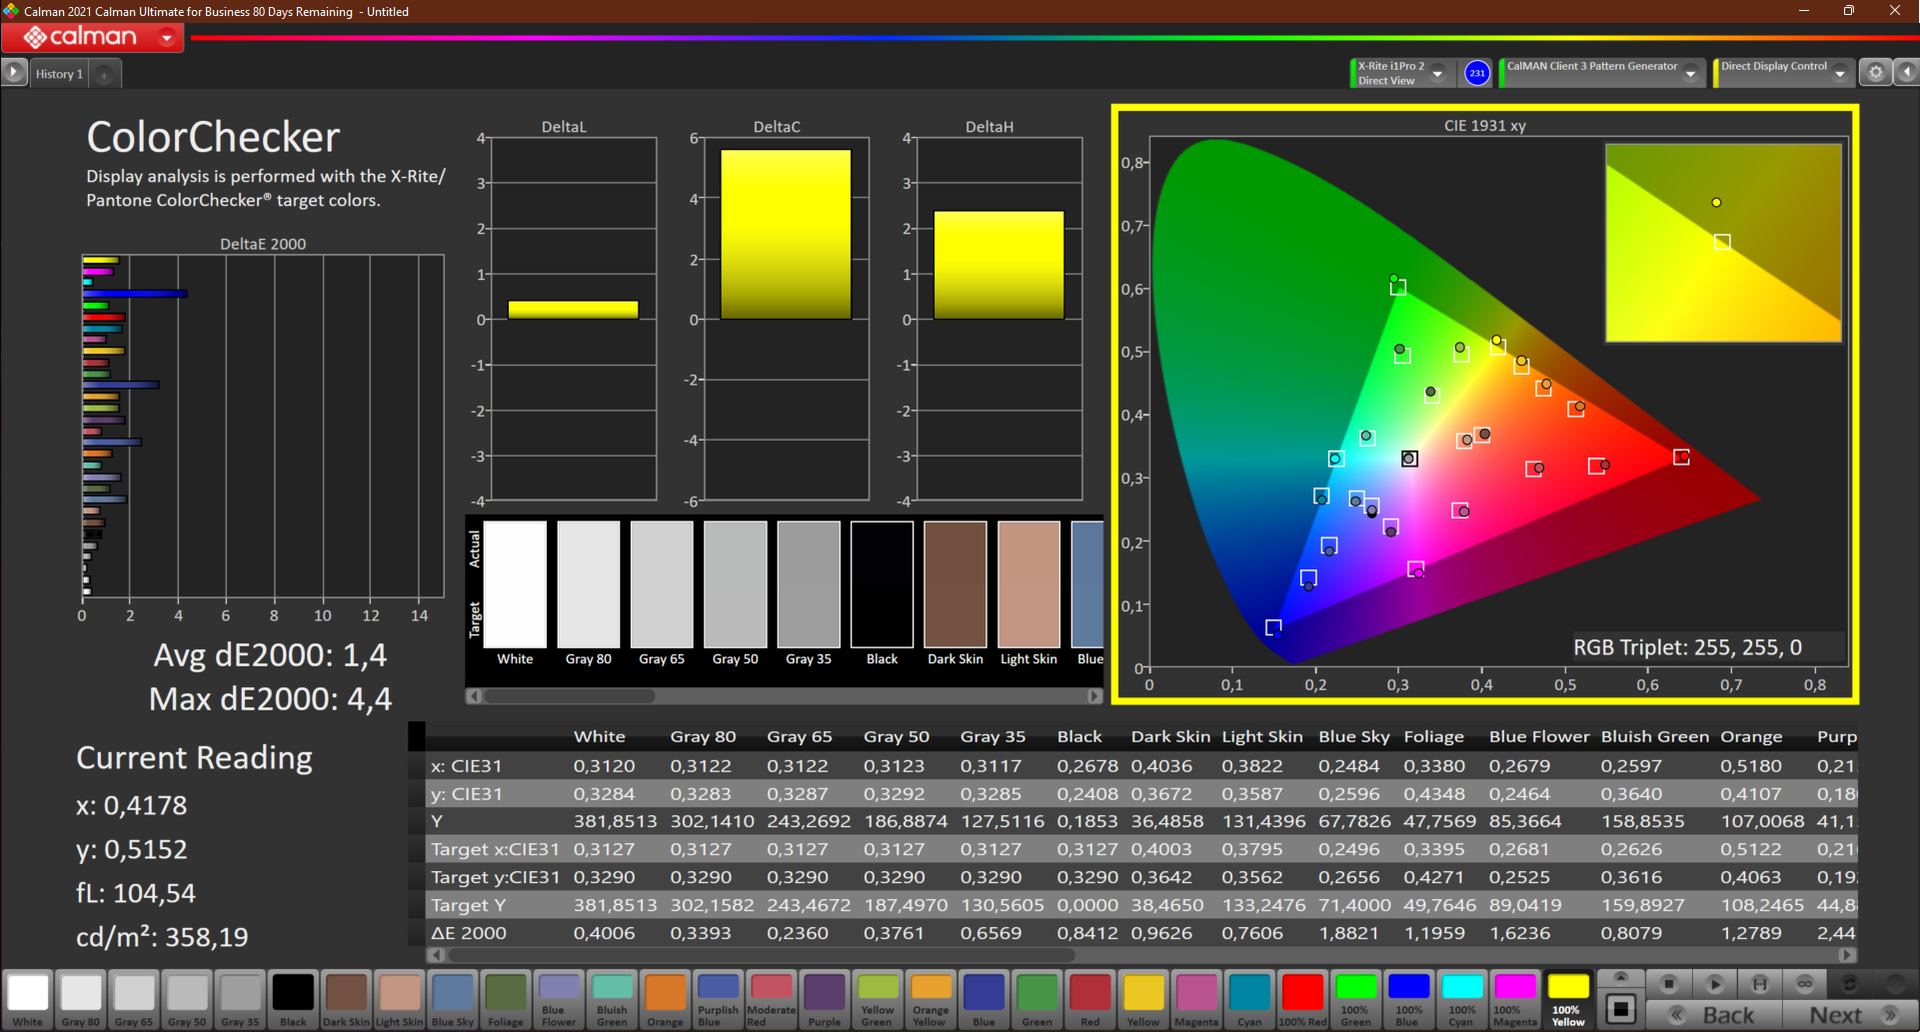
The sRGB color space is covered to 99%, but only ~71% of DCI-P3 and AdobeRGB are reproduced. With this, you can use the laptop for image and video processing at a semi-professional level. The ThinkPad P15v G2 does significantly worse (sRGB < 57%) here as well.

At a DeltaE of 4.3, the largest deviation is in the blue color, even after the calibration. However, the RGB balance is good overall. After the calibration, the contrast even increases to 2151:1, while the brightness is reduced by only 10 nits. As always, our ICC color profile is available for your free download next to the brightness distribution graphic above.

Display Response Times
| ↔ Response Time Black to White | ||
|---|---|---|
| 38 ms ... rise ↗ and fall ↘ combined | ↗ 19 ms rise | 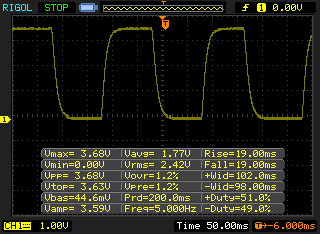 |
| ↘ 19 ms fall | ||
| The screen shows slow response rates in our tests and will be unsatisfactory for gamers. In comparison, all tested devices range from 0.1 (minimum) to 240 (maximum) ms. » 95 % of all devices are better. This means that the measured response time is worse than the average of all tested devices (21.5 ms). | ||
| ↔ Response Time 50% Grey to 80% Grey | ||
| 61 ms ... rise ↗ and fall ↘ combined | ↗ ms rise |  |
| ↘ ms fall | ||
| The screen shows slow response rates in our tests and will be unsatisfactory for gamers. In comparison, all tested devices range from 0.2 (minimum) to 636 (maximum) ms. » 96 % of all devices are better. This means that the measured response time is worse than the average of all tested devices (33.8 ms). | ||
Screen Flickering / PWM (Pulse-Width Modulation)
| Screen flickering / PWM not detected |  | ||
In comparison: 53 % of all tested devices do not use PWM to dim the display. If PWM was detected, an average of 17942 (minimum: 5 - maximum: 3846000) Hz was measured. | |||
The matte display surface together with the high brightness of 385 nits make the ZBook Power 15 suitable for outdoor operation. However, you should still avoid direct sunlight.
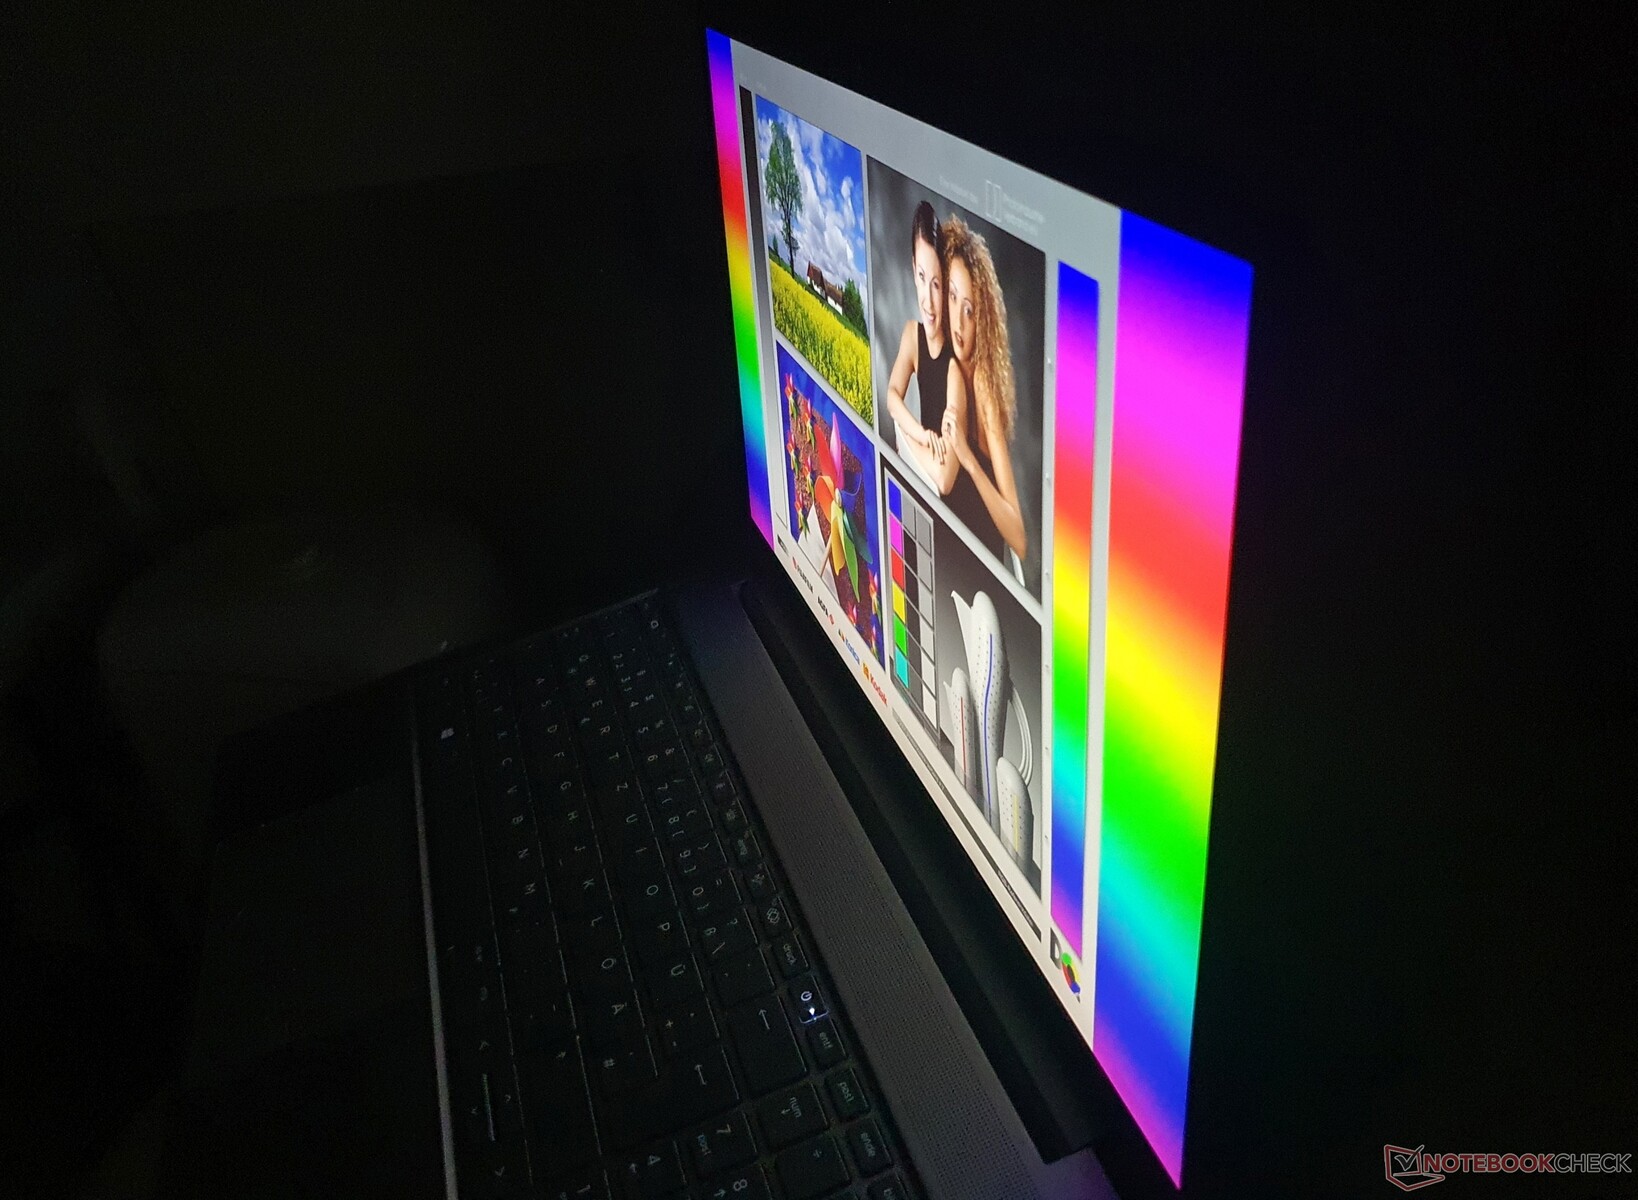
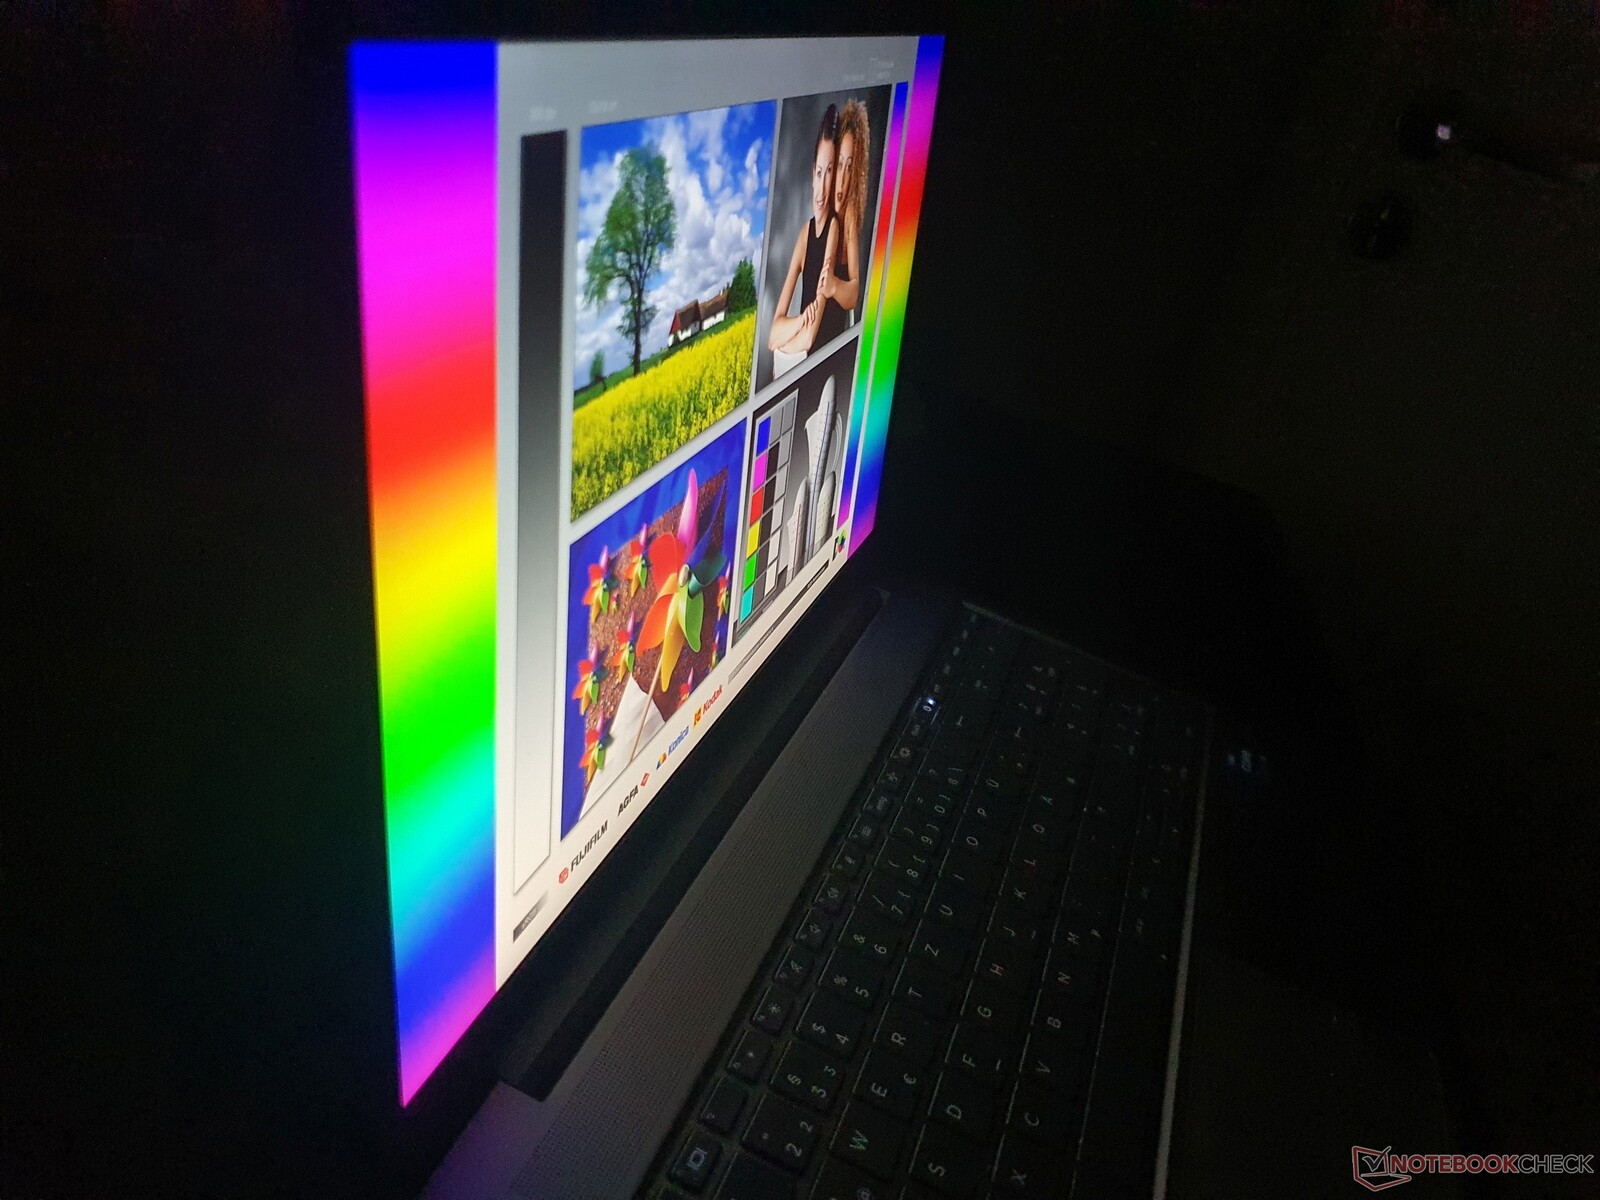
As typical for IPS displays, the viewing angle stability is at a very high level, never creating any problems, for example, if you want to watch videos together with several people.

High performance limited by HP's own AI?
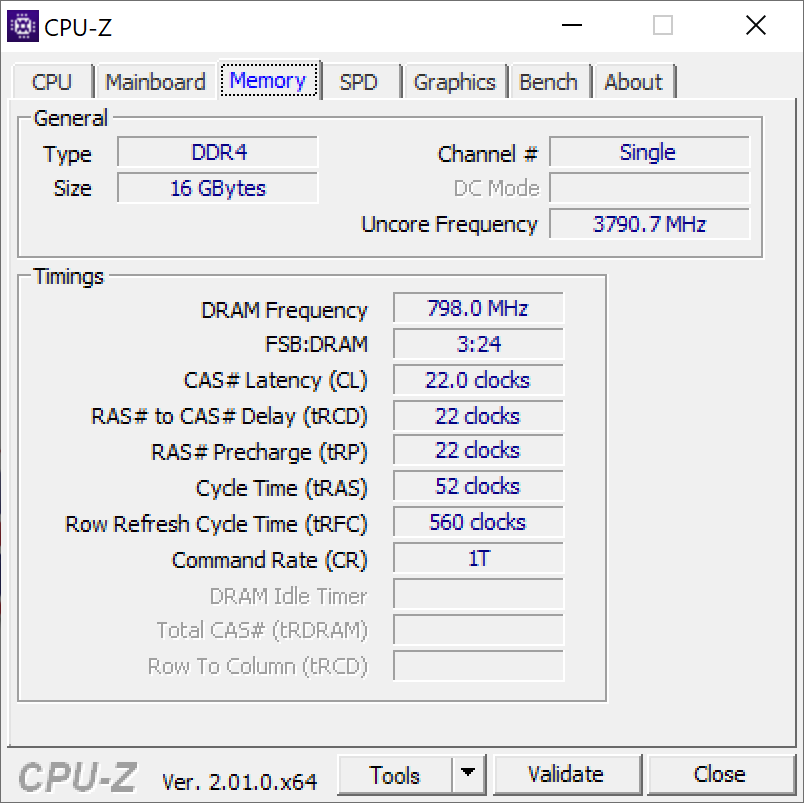
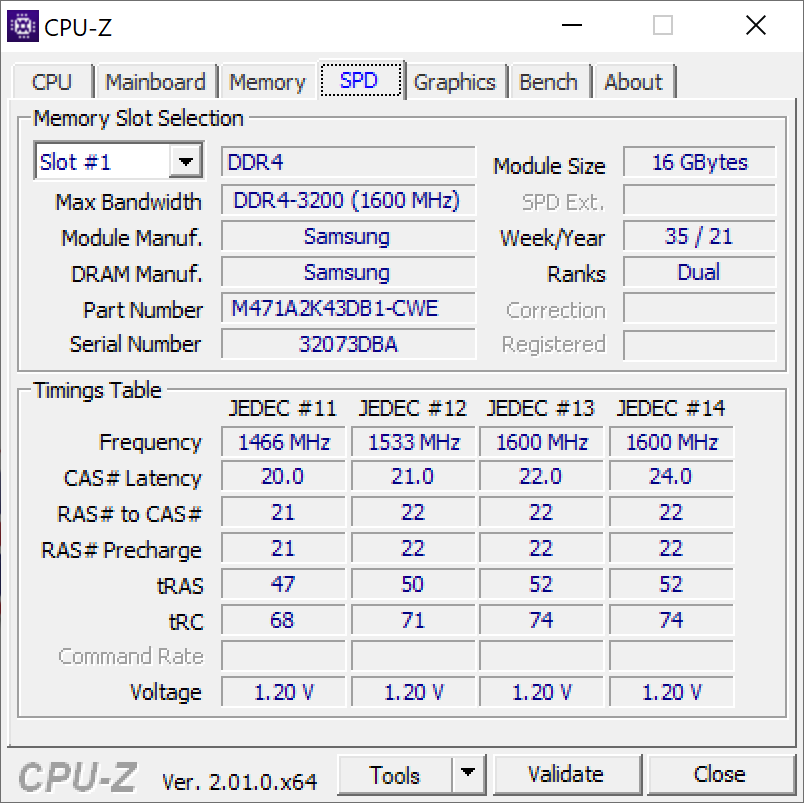
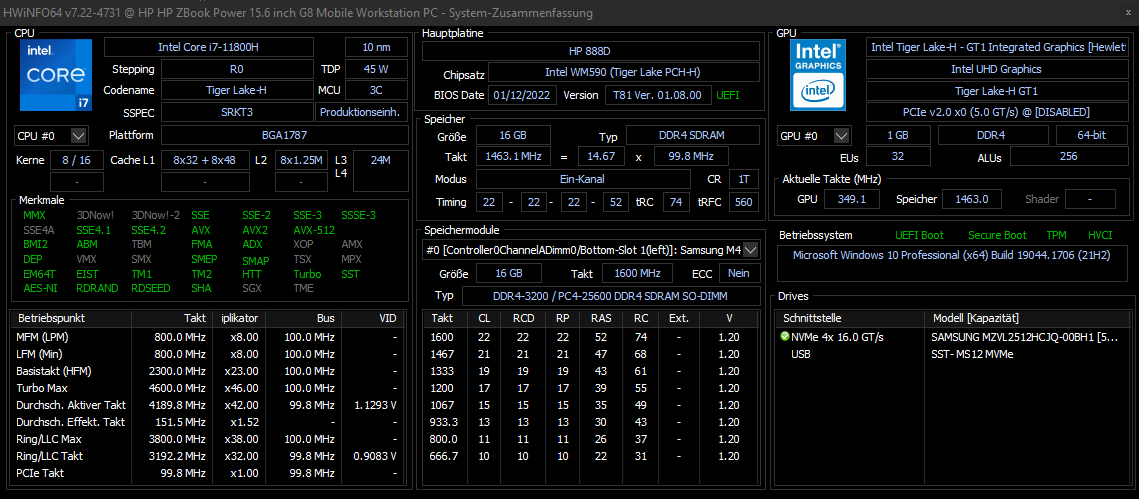
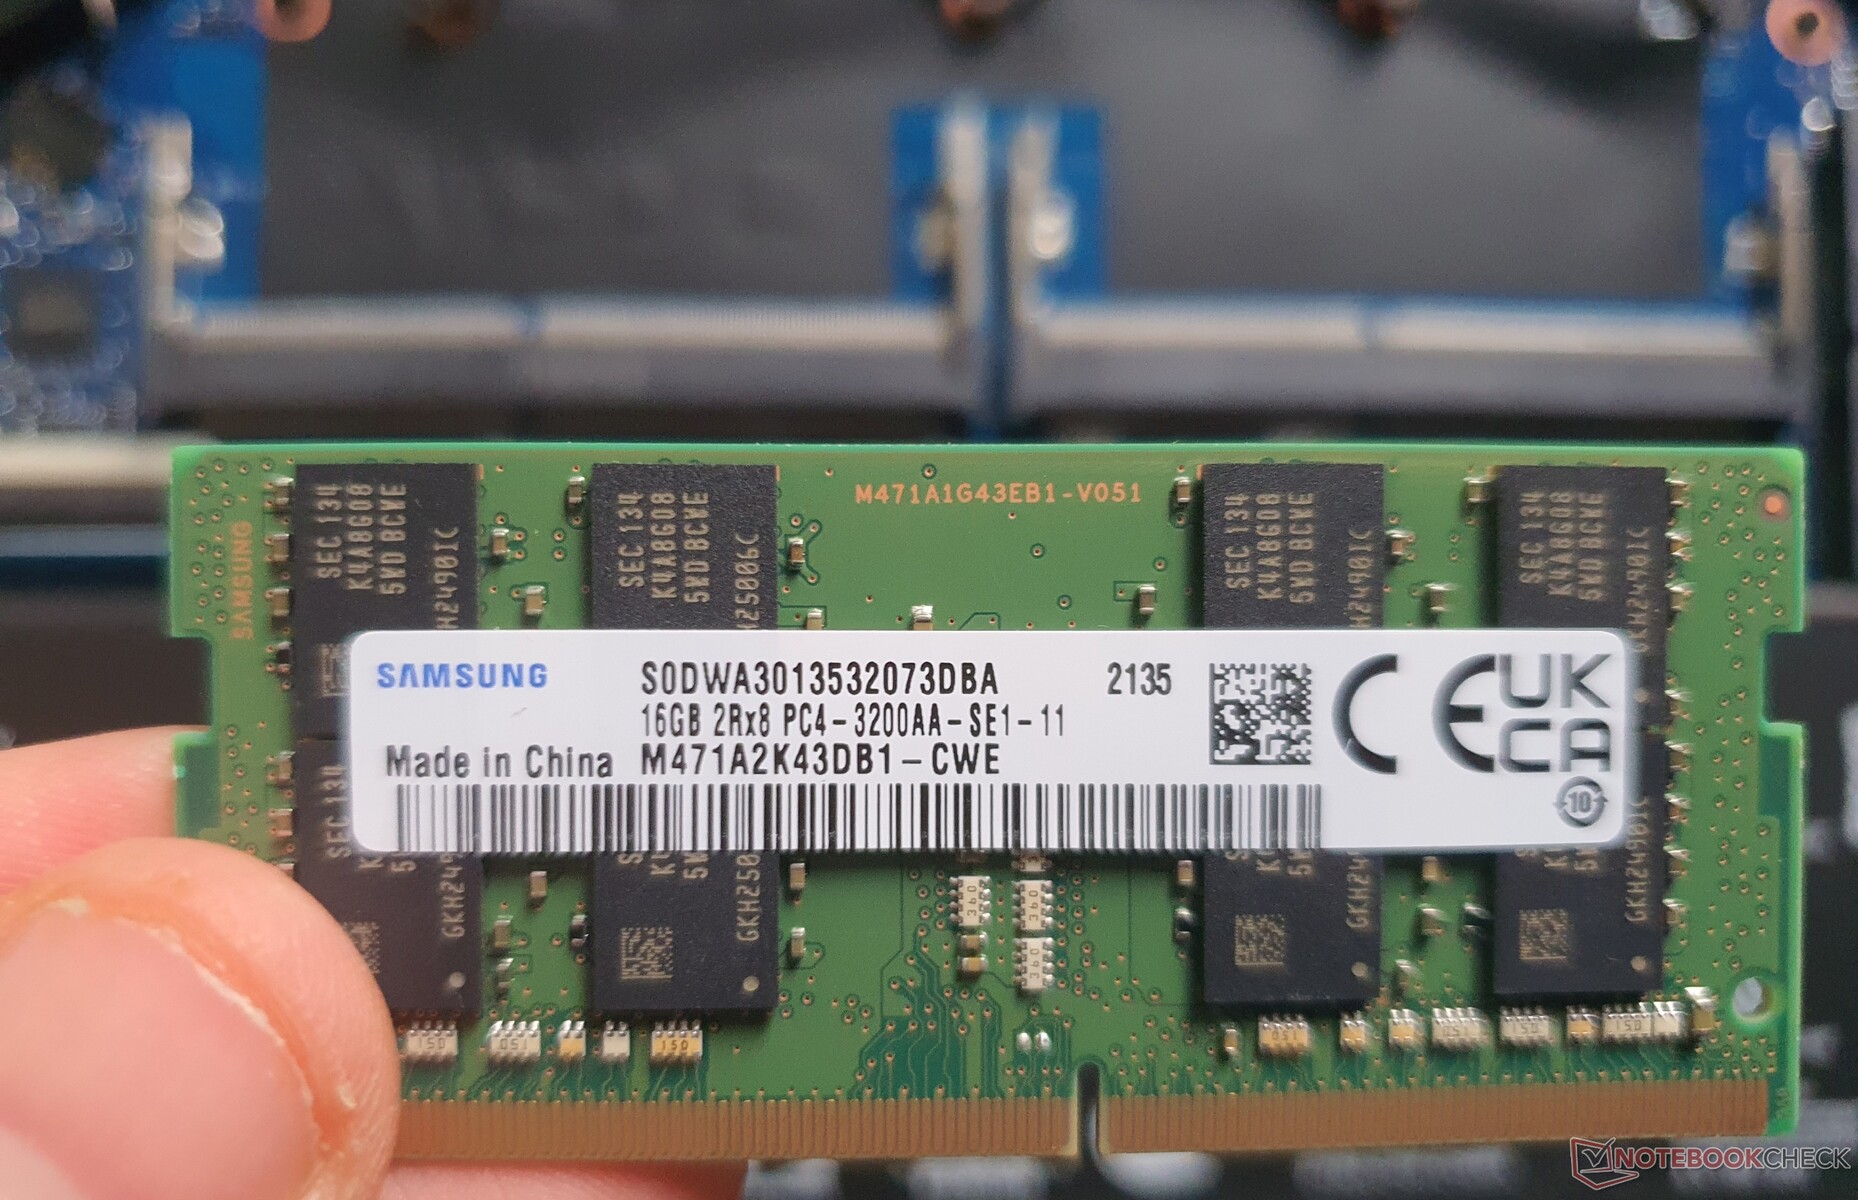
Our test unit offers an Intel Core i7-11800H (Tiger Lake, without vPRO) and the Nvidia T600 dGPU, together with the integrated Intel UHD Xe (32 EUs). This is completed by a 16-GB RAM module (DDR4-3200 @DDR4-2933) and a 512-GB PCIe4x4 SSD. Xeon CPUs and ECC RAM are not available this year.
The maximum configuration includes Intel's Core i9-11950H (vPRO), Nvidia's RTX A2000, two 32-GB RAM modules, and two 2-TB M.2-2280 SSDs. More affordable models with an Intel Core i5 (hexa-core) and with or without Nvidia GPU are also available.


Test Conditions
HP controls the performance and fan behavior in the ZBook 15 G8 by using an AI called "Z Algorithms," which operates using Intel's Dynamic Tuning. However, this doesn't seem to be quite mature yet, since the performance is not constant. One time, our Cinebench R15 test loop achieves a constant 1,550 points in 25 runs, while another loop results in only ~1,100 points and a third in ~1,300 points.
A BIOS update from v1.01 to v1.09 didn't improve things but resulted in the contrary: The initially achieved 2,075 points (constant: 1,826) in CBR15 are not reproduceable at any point anymore, but the fans are now significantly less aggressive. Depending on the result, the constant consumption was 40 watts one time and 47 watts another time, or a maximum of 55 watts constantly.
Processor

With the described AI behavior, the real performance of the Intel Core i7-11800H in combination with the cooling capacity is hard to pin down.
While all the CPU tests were performed with the old BIOS v1.01 when the AI was still more benevolent, the ZBook Power 15 led the test field most of the times. After the BIOS update, the performance falls barely above that of the ThinkPad P15v G2 on average.
There doesn't seem to be a short-term Turbo (PL2) anymore either. In addition, the fans start revving up very late (just before the completion of the first run) and run quieter than originally, whether this is due to the new BIOS or a power supply that doesn't work right. In battery operation, the performance is again reduced by about 25%.
Cinebench R15 Multi Constant Load Test
Cinebench R23: Multi Core | Single Core
Cinebench R20: CPU (Multi Core) | CPU (Single Core)
Cinebench R15: CPU Multi 64Bit | CPU Single 64Bit
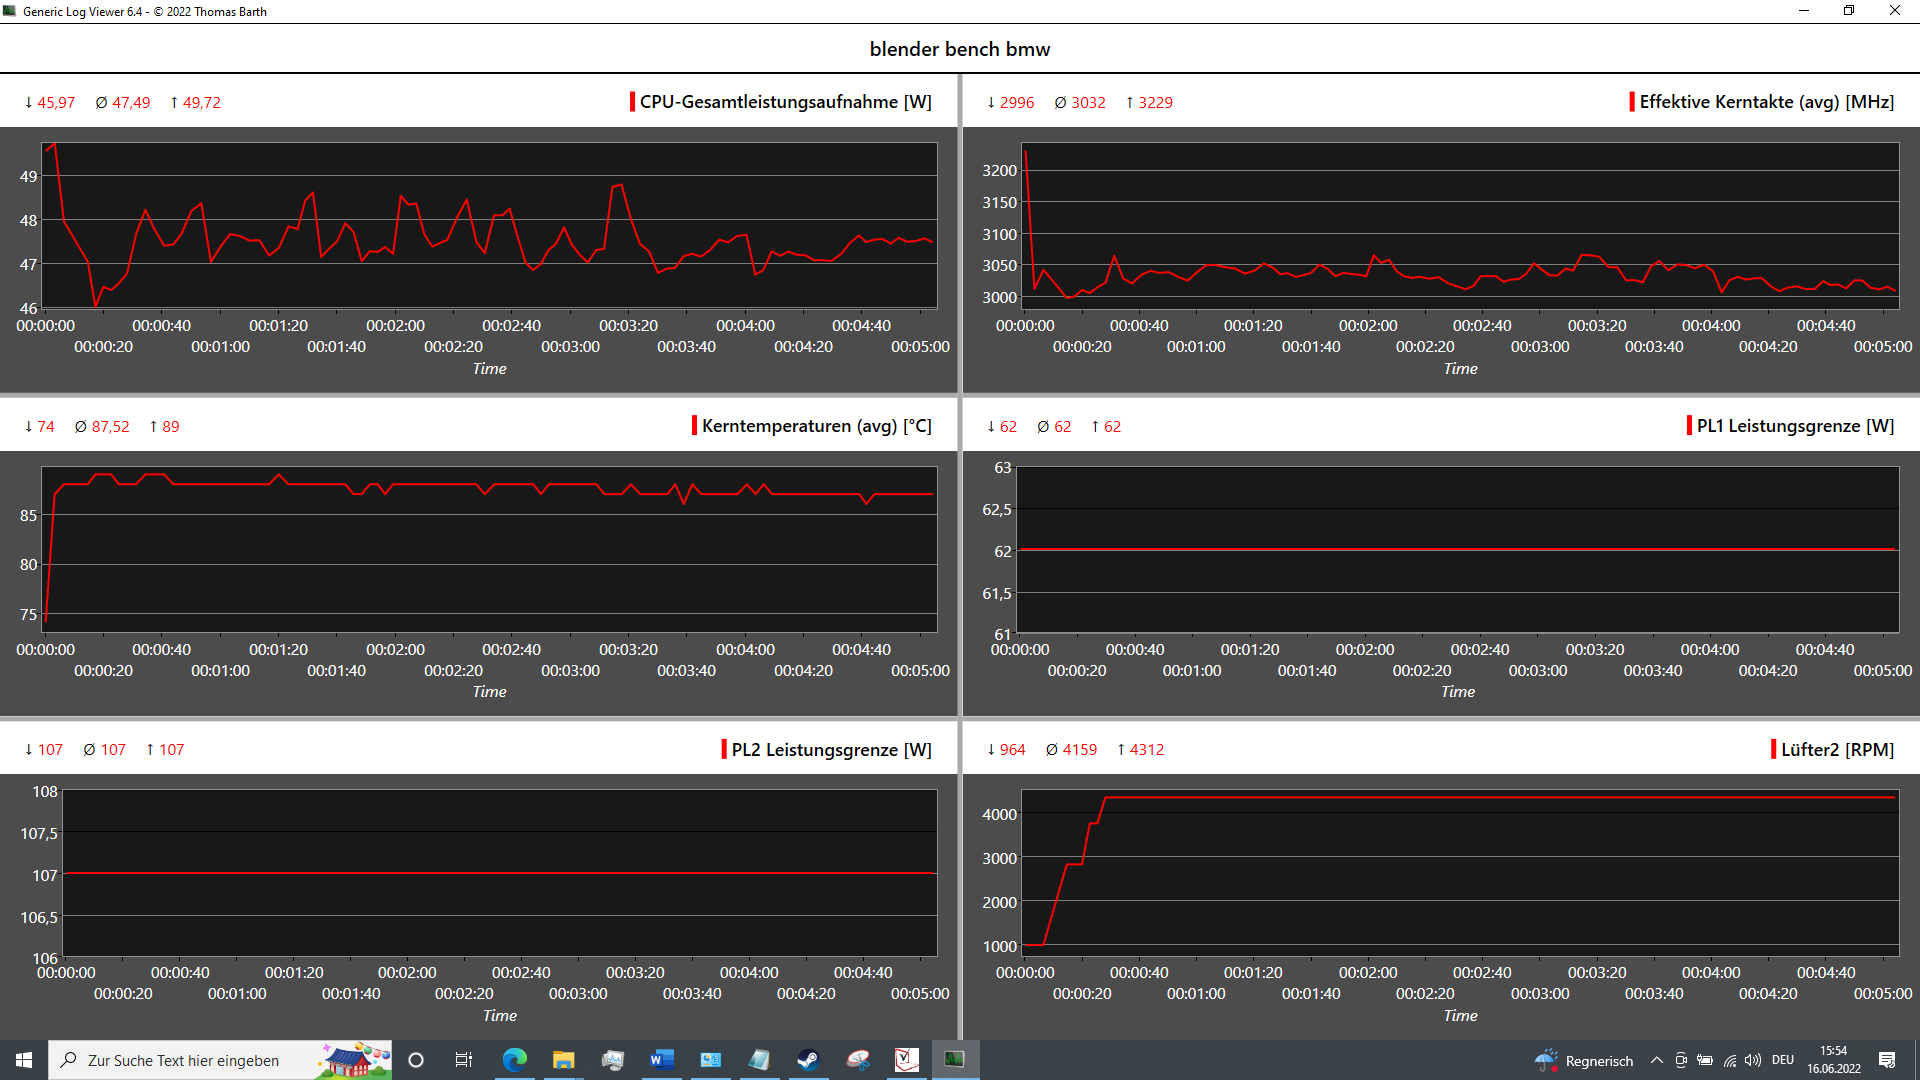
Blender: v2.79 BMW27 CPU
7-Zip 18.03: 7z b 4 | 7z b 4 -mmt1
Geekbench 5.5: Multi-Core | Single-Core
HWBOT x265 Benchmark v2.2: 4k Preset
LibreOffice : 20 Documents To PDF
R Benchmark 2.5: Overall mean
Octane V2: Total Score
Jetstream 2: Total Score
| CPU Performance Rating | |
| Average of class Workstation | |
| HP ZBook Studio 15 G8 -1! | |
| HP ZBook Power 15 G8 313S5EA | |
| HP ZBook Fury 15 G8 -3! | |
| Average Intel Core i7-11800H | |
| Lenovo ThinkPad P15v G2 21A9000XGE -3! | |
| Dell Precision 3000 3551 -4! | |
| HP ZBook Firefly 15 G8 2C9R7EA -4! | |
| Cinebench R23 / Multi Core | |
| Average of class Workstation (4332 - 24560, n=27, last 2 years) | |
| HP ZBook Power 15 G8 313S5EA | |
| HP ZBook Fury 15 G8 | |
| HP ZBook Studio 15 G8 | |
| Average Intel Core i7-11800H (6508 - 14088, n=48) | |
| Lenovo ThinkPad P15v G2 21A9000XGE | |
| Cinebench R23 / Single Core | |
| Average of class Workstation (1144 - 2106, n=27, last 2 years) | |
| HP ZBook Fury 15 G8 | |
| HP ZBook Studio 15 G8 | |
| HP ZBook Power 15 G8 313S5EA | |
| Average Intel Core i7-11800H (1386 - 1522, n=45) | |
| Cinebench R20 / CPU (Multi Core) | |
| Average of class Workstation (1669 - 9329, n=28, last 2 years) | |
| HP ZBook Fury 15 G8 | |
| HP ZBook Studio 15 G8 | |
| Average Intel Core i7-11800H (2498 - 5408, n=50) | |
| HP ZBook Power 15 G8 313S5EA | |
| Lenovo ThinkPad P15v G2 21A9000XGE | |
| Dell Precision 3000 3551 | |
| HP ZBook Firefly 15 G8 2C9R7EA | |
| Cinebench R20 / CPU (Single Core) | |
| Average of class Workstation (528 - 816, n=28, last 2 years) | |
| HP ZBook Fury 15 G8 | |
| HP ZBook Studio 15 G8 | |
| HP ZBook Firefly 15 G8 2C9R7EA | |
| HP ZBook Power 15 G8 313S5EA | |
| Average Intel Core i7-11800H (520 - 586, n=47) | |
| Lenovo ThinkPad P15v G2 21A9000XGE | |
| Dell Precision 3000 3551 | |
| Cinebench R15 / CPU Multi 64Bit | |
| Average of class Workstation (706 - 3625, n=27, last 2 years) | |
| HP ZBook Power 15 G8 313S5EA | |
| HP ZBook Power 15 G8 313S5EA | |
| Average Intel Core i7-11800H (1342 - 2173, n=50) | |
| HP ZBook Studio 15 G8 | |
| HP ZBook Fury 15 G8 | |
| Lenovo ThinkPad P15v G2 21A9000XGE | |
| Dell Precision 3000 3551 | |
| HP ZBook Firefly 15 G8 2C9R7EA | |
| Cinebench R15 / CPU Single 64Bit | |
| Average of class Workstation (166.2 - 301, n=27, last 2 years) | |
| HP ZBook Fury 15 G8 | |
| HP ZBook Studio 15 G8 | |
| HP ZBook Power 15 G8 313S5EA | |
| HP ZBook Firefly 15 G8 2C9R7EA | |
| Average Intel Core i7-11800H (201 - 231, n=46) | |
| Lenovo ThinkPad P15v G2 21A9000XGE | |
| Dell Precision 3000 3551 | |
| Blender / v2.79 BMW27 CPU | |
| HP ZBook Firefly 15 G8 2C9R7EA | |
| Dell Precision 3000 3551 | |
| Lenovo ThinkPad P15v G2 21A9000XGE | |
| Average Intel Core i7-11800H (217 - 454, n=46) | |
| HP ZBook Fury 15 G8 | |
| HP ZBook Power 15 G8 313S5EA | |
| HP ZBook Studio 15 G8 | |
| Average of class Workstation (137 - 684, n=27, last 2 years) | |
| 7-Zip 18.03 / 7z b 4 | |
| Average of class Workstation (20087 - 99351, n=27, last 2 years) | |
| HP ZBook Fury 15 G8 | |
| HP ZBook Studio 15 G8 | |
| HP ZBook Power 15 G8 313S5EA | |
| Average Intel Core i7-11800H (33718 - 56758, n=46) | |
| Lenovo ThinkPad P15v G2 21A9000XGE | |
| Dell Precision 3000 3551 | |
| HP ZBook Firefly 15 G8 2C9R7EA | |
| 7-Zip 18.03 / 7z b 4 -mmt1 | |
| Average of class Workstation (4777 - 6670, n=27, last 2 years) | |
| HP ZBook Studio 15 G8 | |
| HP ZBook Fury 15 G8 | |
| HP ZBook Power 15 G8 313S5EA | |
| Average Intel Core i7-11800H (5138 - 5732, n=46) | |
| HP ZBook Firefly 15 G8 2C9R7EA | |
| Dell Precision 3000 3551 | |
| Lenovo ThinkPad P15v G2 21A9000XGE | |
| Geekbench 5.5 / Multi-Core | |
| Average of class Workstation (5022 - 17487, n=27, last 2 years) | |
| Average Intel Core i7-11800H (4655 - 9851, n=40) | |
| HP ZBook Power 15 G8 313S5EA | |
| HP ZBook Studio 15 G8 | |
| Dell Precision 3000 3551 | |
| Lenovo ThinkPad P15v G2 21A9000XGE | |
| HP ZBook Firefly 15 G8 2C9R7EA | |
| Geekbench 5.5 / Single-Core | |
| Average of class Workstation (1474 - 2095, n=27, last 2 years) | |
| HP ZBook Studio 15 G8 | |
| Average Intel Core i7-11800H (1429 - 1625, n=40) | |
| HP ZBook Firefly 15 G8 2C9R7EA | |
| HP ZBook Power 15 G8 313S5EA | |
| Lenovo ThinkPad P15v G2 21A9000XGE | |
| Dell Precision 3000 3551 | |
| HWBOT x265 Benchmark v2.2 / 4k Preset | |
| Average of class Workstation (5.09 - 26, n=27, last 2 years) | |
| HP ZBook Studio 15 G8 | |
| HP ZBook Fury 15 G8 | |
| HP ZBook Power 15 G8 313S5EA | |
| Average Intel Core i7-11800H (7.38 - 17.4, n=46) | |
| Lenovo ThinkPad P15v G2 21A9000XGE | |
| Dell Precision 3000 3551 | |
| HP ZBook Firefly 15 G8 2C9R7EA | |
| LibreOffice / 20 Documents To PDF | |
| Lenovo ThinkPad P15v G2 21A9000XGE | |
| HP ZBook Fury 15 G8 | |
| HP ZBook Studio 15 G8 | |
| Average of class Workstation (36.5 - 95.2, n=27, last 2 years) | |
| Average Intel Core i7-11800H (38.6 - 59.9, n=45) | |
| Dell Precision 3000 3551 | |
| HP ZBook Power 15 G8 313S5EA | |
| HP ZBook Firefly 15 G8 2C9R7EA | |
| R Benchmark 2.5 / Overall mean | |
| HP ZBook Power 15 G8 313S5EA | |
| Lenovo ThinkPad P15v G2 21A9000XGE | |
| Dell Precision 3000 3551 | |
| Average Intel Core i7-11800H (0.548 - 0.615, n=46) | |
| HP ZBook Firefly 15 G8 2C9R7EA | |
| HP ZBook Studio 15 G8 | |
| HP ZBook Fury 15 G8 | |
| Average of class Workstation (0.3876 - 0.544, n=27, last 2 years) | |
| Octane V2 / Total Score | |
| Average of class Workstation (68050 - 100022, n=10, last 2 years) | |
| Average Intel Core i7-11800H (63248 - 70549, n=10) | |
| HP ZBook Power 15 G8 313S5EA | |
| Jetstream 2 / Total Score | |
| Average of class Workstation (274 - 340, n=18, last 2 years) | |
| HP ZBook Power 15 G8 313S5EA | |
| HP ZBook Fury 15 G8 | |
| HP ZBook Studio 15 G8 | |
| Average Intel Core i7-11800H (159.8 - 214, n=16) | |
* ... smaller is better
AIDA64: FP32 Ray-Trace | FPU Julia | CPU SHA3 | CPU Queen | FPU SinJulia | FPU Mandel | CPU AES | CPU ZLib | FP64 Ray-Trace | CPU PhotoWorxx
| Performance Rating | |
| Average of class Workstation | |
| HP ZBook Fury 15 G8 | |
| HP ZBook Studio 15 G8 | |
| HP ZBook Power 15 G8 313S5EA | |
| Average Intel Core i7-11800H | |
| Lenovo ThinkPad P15v G2 21A9000XGE | |
| HP ZBook Firefly 15 G8 2C9R7EA | |
| AIDA64 / FP32 Ray-Trace | |
| Average of class Workstation (2619 - 25776, n=27, last 2 years) | |
| HP ZBook Power 15 G8 313S5EA | |
| HP ZBook Fury 15 G8 | |
| HP ZBook Studio 15 G8 | |
| Average Intel Core i7-11800H (8772 - 15961, n=20) | |
| Lenovo ThinkPad P15v G2 21A9000XGE | |
| HP ZBook Firefly 15 G8 2C9R7EA | |
| AIDA64 / FPU Julia | |
| Average of class Workstation (12909 - 109059, n=27, last 2 years) | |
| HP ZBook Fury 15 G8 | |
| HP ZBook Studio 15 G8 | |
| HP ZBook Power 15 G8 313S5EA | |
| Average Intel Core i7-11800H (39404 - 65636, n=20) | |
| Lenovo ThinkPad P15v G2 21A9000XGE | |
| HP ZBook Firefly 15 G8 2C9R7EA | |
| AIDA64 / CPU SHA3 | |
| HP ZBook Power 15 G8 313S5EA | |
| HP ZBook Fury 15 G8 | |
| HP ZBook Studio 15 G8 | |
| Average Intel Core i7-11800H (2599 - 4439, n=20) | |
| Average of class Workstation (824 - 4981, n=27, last 2 years) | |
| Lenovo ThinkPad P15v G2 21A9000XGE | |
| HP ZBook Firefly 15 G8 2C9R7EA | |
| AIDA64 / CPU Queen | |
| HP ZBook Studio 15 G8 | |
| Average of class Workstation (26716 - 131931, n=27, last 2 years) | |
| HP ZBook Fury 15 G8 | |
| HP ZBook Power 15 G8 313S5EA | |
| Average Intel Core i7-11800H (85233 - 91941, n=20) | |
| Lenovo ThinkPad P15v G2 21A9000XGE | |
| HP ZBook Firefly 15 G8 2C9R7EA | |
| AIDA64 / FPU SinJulia | |
| Average of class Workstation (3105 - 14742, n=27, last 2 years) | |
| HP ZBook Fury 15 G8 | |
| HP ZBook Studio 15 G8 | |
| HP ZBook Power 15 G8 313S5EA | |
| Average Intel Core i7-11800H (6420 - 9792, n=20) | |
| Lenovo ThinkPad P15v G2 21A9000XGE | |
| HP ZBook Firefly 15 G8 2C9R7EA | |
| AIDA64 / FPU Mandel | |
| Average of class Workstation (6967 - 58181, n=27, last 2 years) | |
| HP ZBook Fury 15 G8 | |
| HP ZBook Power 15 G8 313S5EA | |
| HP ZBook Studio 15 G8 | |
| Average Intel Core i7-11800H (23365 - 39464, n=20) | |
| Lenovo ThinkPad P15v G2 21A9000XGE | |
| HP ZBook Firefly 15 G8 2C9R7EA | |
| AIDA64 / CPU AES | |
| Average Intel Core i7-11800H (74617 - 149388, n=20) | |
| HP ZBook Power 15 G8 313S5EA | |
| HP ZBook Studio 15 G8 | |
| HP ZBook Fury 15 G8 | |
| Lenovo ThinkPad P15v G2 21A9000XGE | |
| Average of class Workstation (19489 - 132156, n=27, last 2 years) | |
| HP ZBook Firefly 15 G8 2C9R7EA | |
| AIDA64 / CPU ZLib | |
| Average of class Workstation (314 - 1472, n=27, last 2 years) | |
| HP ZBook Power 15 G8 313S5EA | |
| HP ZBook Studio 15 G8 | |
| HP ZBook Fury 15 G8 | |
| Lenovo ThinkPad P15v G2 21A9000XGE | |
| HP ZBook Firefly 15 G8 2C9R7EA | |
| Average Intel Core i7-11800H (461 - 830, n=43) | |
| AIDA64 / FP64 Ray-Trace | |
| Average of class Workstation (1473 - 13800, n=27, last 2 years) | |
| HP ZBook Power 15 G8 313S5EA | |
| HP ZBook Fury 15 G8 | |
| HP ZBook Studio 15 G8 | |
| Average Intel Core i7-11800H (4545 - 8717, n=21) | |
| Lenovo ThinkPad P15v G2 21A9000XGE | |
| HP ZBook Firefly 15 G8 2C9R7EA | |
| AIDA64 / CPU PhotoWorxx | |
| Average of class Workstation (18157 - 48483, n=27, last 2 years) | |
| HP ZBook Fury 15 G8 | |
| HP ZBook Studio 15 G8 | |
| Average Intel Core i7-11800H (11898 - 26757, n=21) | |
| HP ZBook Firefly 15 G8 2C9R7EA | |
| HP ZBook Power 15 G8 313S5EA | |
| Lenovo ThinkPad P15v G2 21A9000XGE | |
Workstation Performance
The performance in the workstation related applications was evaluated with the new BIOS (v1.09). Here, it places about 10% behind the ThinkPad P15v G2 with the Nvidia T1200, while the HP Firefly with the Nvidia T500 is surpassed by about 45%. On the other hand, the ZBook Fury with RTX A5000 offers twice the performance most of the time.
The RTX A2000, which is the maximum you can select for the ZBook Power 15, should run about 50% faster.
| V-Ray 5 Benchmark | |
| CPU | |
| HP ZBook Fury 15 G8 | |
| Lenovo ThinkPad P15v G2 21A9000XGE | |
| GPU CUDA | |
| Lenovo ThinkPad P15v G2 21A9000XGE | |
| HP ZBook Power 15 G8 313S5EA | |
| Geekbench 5.5 - OpenCL Score | |
| Lenovo ThinkPad P15v G2 21A9000XGE | |
| HP ZBook Power 15 G8 313S5EA | |
| HP ZBook Firefly 15 G8 2C9R7EA | |
| Dell Precision 3000 3551 | |
System Performance
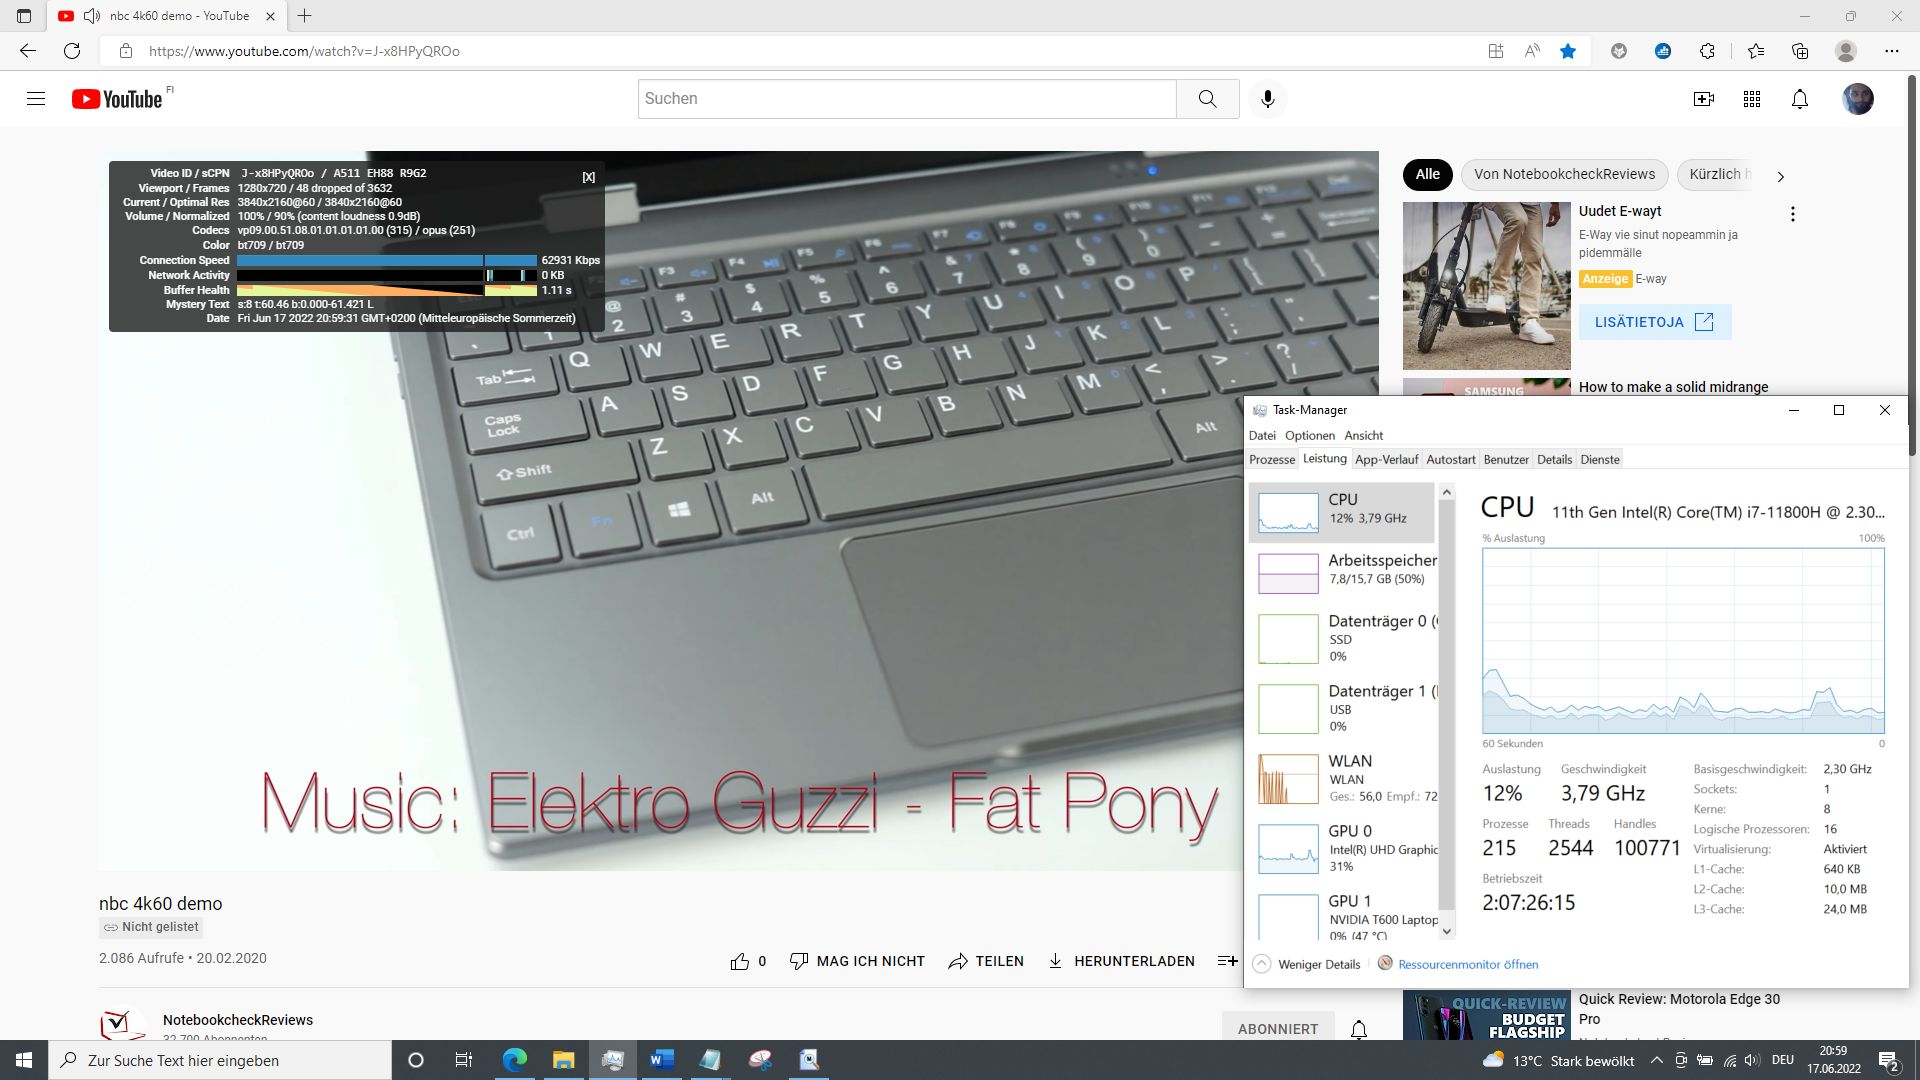
Despite the single-channel RAM, the system runs absolutely free from any delays, even when working with multiple browser tabs while a 4K YouTube video also runs in the background.
With the new BIOS, about 15% of the performance is lost, so that our test unit ends up last in the PCMark 10 benchmark. Particularly the Content Creation score has dropped by around 28%.


CrossMark: Overall | Productivity | Creativity | Responsiveness
| PCMark 10 / Score | |
| Average of class Workstation (5488 - 8587, n=26, last 2 years) | |
| HP ZBook Fury 15 G8 | |
| HP ZBook Studio 15 G8 | |
| Lenovo ThinkPad P15v G2 21A9000XGE | |
| HP ZBook Firefly 15 G8 2C9R7EA | |
| Dell Precision 3000 3551 | |
| HP ZBook Power 15 G8 313S5EA | |
| Average Intel Core i7-11800H, NVIDIA T600 Laptop GPU () | |
| PCMark 10 / Essentials | |
| Average of class Workstation (9151 - 12197, n=26, last 2 years) | |
| Dell Precision 3000 3551 | |
| HP ZBook Fury 15 G8 | |
| HP ZBook Studio 15 G8 | |
| Lenovo ThinkPad P15v G2 21A9000XGE | |
| HP ZBook Firefly 15 G8 2C9R7EA | |
| HP ZBook Power 15 G8 313S5EA | |
| Average Intel Core i7-11800H, NVIDIA T600 Laptop GPU () | |
| PCMark 10 / Productivity | |
| Average of class Workstation (7846 - 10820, n=26, last 2 years) | |
| HP ZBook Firefly 15 G8 2C9R7EA | |
| HP ZBook Fury 15 G8 | |
| HP ZBook Studio 15 G8 | |
| Lenovo ThinkPad P15v G2 21A9000XGE | |
| Dell Precision 3000 3551 | |
| HP ZBook Power 15 G8 313S5EA | |
| Average Intel Core i7-11800H, NVIDIA T600 Laptop GPU () | |
| PCMark 10 / Digital Content Creation | |
| HP ZBook Fury 15 G8 | |
| HP ZBook Studio 15 G8 | |
| Average of class Workstation (5399 - 13947, n=26, last 2 years) | |
| Lenovo ThinkPad P15v G2 21A9000XGE | |
| HP ZBook Firefly 15 G8 2C9R7EA | |
| HP ZBook Power 15 G8 313S5EA | |
| Average Intel Core i7-11800H, NVIDIA T600 Laptop GPU () | |
| Dell Precision 3000 3551 | |
| CrossMark / Overall | |
| Average of class Workstation (1154 - 1972, n=26, last 2 years) | |
| HP ZBook Power 15 G8 313S5EA | |
| Average Intel Core i7-11800H, NVIDIA T600 Laptop GPU () | |
| Lenovo ThinkPad P15v G2 21A9000XGE | |
| CrossMark / Productivity | |
| Average of class Workstation (1188 - 1842, n=26, last 2 years) | |
| HP ZBook Power 15 G8 313S5EA | |
| Average Intel Core i7-11800H, NVIDIA T600 Laptop GPU () | |
| Lenovo ThinkPad P15v G2 21A9000XGE | |
| CrossMark / Creativity | |
| Average of class Workstation (1180 - 2248, n=26, last 2 years) | |
| HP ZBook Power 15 G8 313S5EA | |
| Average Intel Core i7-11800H, NVIDIA T600 Laptop GPU () | |
| Lenovo ThinkPad P15v G2 21A9000XGE | |
| CrossMark / Responsiveness | |
| Average of class Workstation (990 - 1865, n=26, last 2 years) | |
| HP ZBook Power 15 G8 313S5EA | |
| Average Intel Core i7-11800H, NVIDIA T600 Laptop GPU () | |
| Lenovo ThinkPad P15v G2 21A9000XGE | |
| PCMark 10 Score | 4960 points | |
Help | ||
| AIDA64 / Memory Copy | |
| Average of class Workstation (30324 - 74486, n=27, last 2 years) | |
| HP ZBook Fury 15 G8 | |
| HP ZBook Studio 15 G8 | |
| Average Intel Core i7-11800H (24508 - 48144, n=21) | |
| HP ZBook Power 15 G8 313S5EA | |
| HP ZBook Firefly 15 G8 2C9R7EA | |
| Lenovo ThinkPad P15v G2 21A9000XGE | |
| AIDA64 / Memory Read | |
| Average of class Workstation (30787 - 73331, n=27, last 2 years) | |
| HP ZBook Studio 15 G8 | |
| HP ZBook Fury 15 G8 | |
| Average Intel Core i7-11800H (25882 - 50365, n=20) | |
| HP ZBook Power 15 G8 313S5EA | |
| Lenovo ThinkPad P15v G2 21A9000XGE | |
| HP ZBook Firefly 15 G8 2C9R7EA | |
| AIDA64 / Memory Write | |
| Average of class Workstation (32728 - 92336, n=27, last 2 years) | |
| HP ZBook Studio 15 G8 | |
| HP ZBook Fury 15 G8 | |
| Average Intel Core i7-11800H (22240 - 46214, n=20) | |
| HP ZBook Firefly 15 G8 2C9R7EA | |
| HP ZBook Power 15 G8 313S5EA | |
| Lenovo ThinkPad P15v G2 21A9000XGE | |
| AIDA64 / Memory Latency | |
| Average of class Workstation (83.4 - 138.9, n=27, last 2 years) | |
| Lenovo ThinkPad P15v G2 21A9000XGE | |
| HP ZBook Fury 15 G8 | |
| HP ZBook Studio 15 G8 | |
| HP ZBook Power 15 G8 313S5EA | |
| HP ZBook Firefly 15 G8 2C9R7EA | |
| Average Intel Core i7-11800H (71.9 - 104.1, n=44) | |
* ... smaller is better
DPC Latencies
At only 537.6 µs, the DPC latency of the ZBook Power 15 looks very good. However, the analysis still shows that the network driver causes some delays, so that video and audio processing in real-time will only work without using Intel's AX201 Wi-Fi.
Reproducing a 4K YouTube video causes a load of 30% on the iGPU and 12% on CPU, but we still notice a few dropped frames.


| DPC Latencies / LatencyMon - interrupt to process latency (max), Web, Youtube, Prime95 (sort by value) | |
| HP ZBook Power 15 G8 313S5EA | |
| HP ZBook Fury 15 G8 | |
| HP ZBook Firefly 15 G8 2C9R7EA | |
| HP ZBook Studio 15 G8 | |
| Dell Precision 3000 3551 | |
| Lenovo ThinkPad P15v G2 21A9000XGE | |
* ... smaller is better
Storage Solution
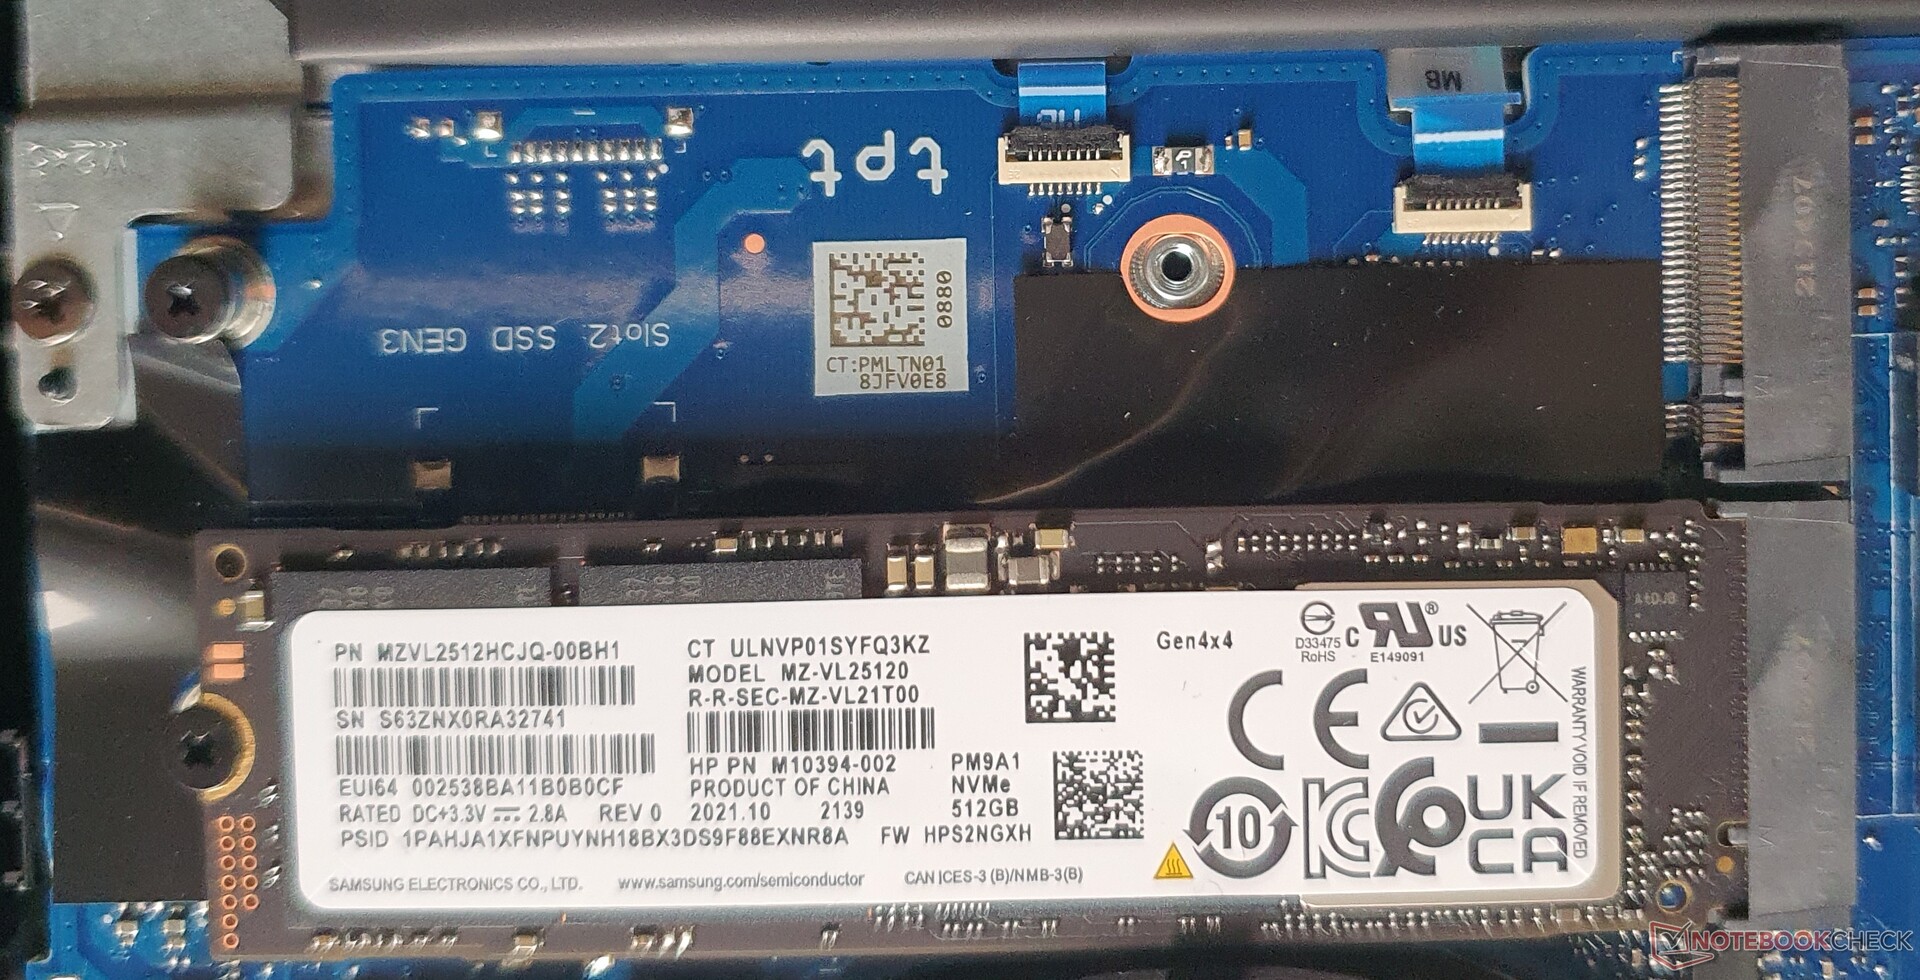
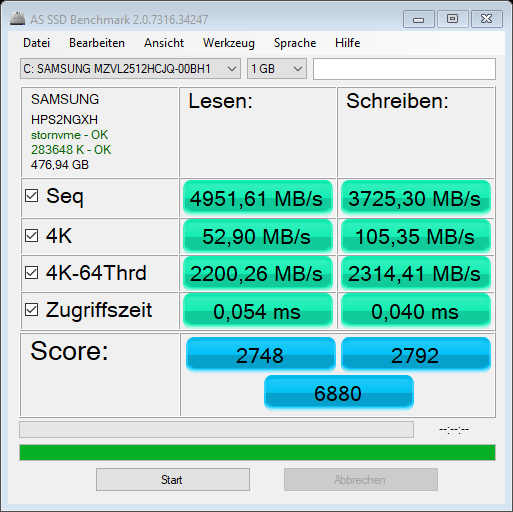
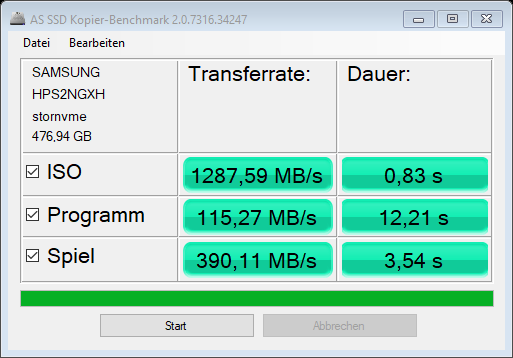
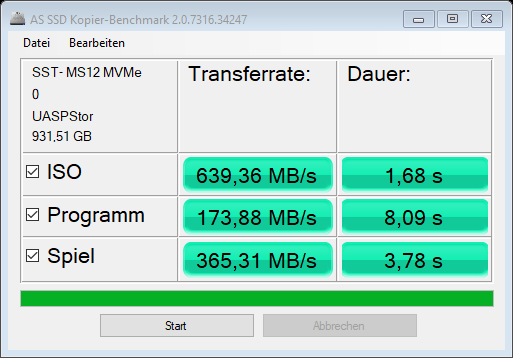
The Samsung PM9A1 offers space for 512 GB, of which about 418 GB remain available for the user in the state of delivery. Thanks to PCIe Gen4x4, the speeds including 4K values and access times look very good initially. A second slot (PCIe Gen3x4) is also available, and both are certified up to 2 TB.
However, when copying a larger program, for example, AS SSD shows very weak transfer rates of 115 MB/s instead of the 1074 MB/s of the ZBook Studio 15 G8. Even the affordable Dell Precision 3511 manages significantly higher copy rates. Our external 10-Gbps SSD also copies programs faster.
| HP ZBook Power 15 G8 313S5EA T600 Laptop GPU, i7-11800H, Samsung PM9A1 MZVL2512HCJQ | HP ZBook Fury 15 G8 RTX A5000 Laptop GPU, i9-11950H, Samsung PM981a MZVLB1T0HBLR | HP ZBook Studio 15 G8 GeForce RTX 3070 Laptop GPU, i9-11950H, Samsung PM981a MZVLB2T0HALB | HP ZBook Firefly 15 G8 2C9R7EA T500 Laptop GPU, i7-1165G7, Toshiba XG6 KXG60ZNV1T02 | Lenovo ThinkPad P15v G2 21A9000XGE T1200 Laptop GPU, i7-11800H, Toshiba XG6 KXG6AZNV512G | Dell Precision 3000 3551 Quadro P620, i9-10885H, Toshiba Kioxia XG6 KXG60PNV512G | |
|---|---|---|---|---|---|---|
| AS SSD | -35% | 64% | -26% | -9% | 24% | |
| Seq Read | 4951 | 2937 -41% | 2953 -40% | 2599 -48% | 2684 -46% | 1833 -63% |
| Seq Write | 3725 | 1688 -55% | 1691 -55% | 1305 -65% | 1352 -64% | 1283 -66% |
| 4K Read | 52.9 | 44.27 -16% | 43.98 -17% | 49.65 -6% | 43.68 -17% | 44.56 -16% |
| 4K Write | 105.35 | 105.8 0% | 105.4 0% | 128.1 22% | 105.56 0% | 112.4 7% |
| 4K-64 Read | 2200.26 | 873 -60% | 1065 -52% | 1157 -47% | 976.92 -56% | 1106 -50% |
| 4K-64 Write | 2314.41 | 1996 -14% | 1957 -15% | 1475 -36% | 1452.09 -37% | 1262 -45% |
| Access Time Read * | 0.054 | 0.048 11% | 0.04 26% | 0.057 -6% | 0.124 -130% | 0.084 -56% |
| Access Time Write * | 0.04 | 0.107 -168% | 0.105 -163% | 0.03 25% | 0.038 5% | 0.105 -163% |
| Score Read | 2748 | 1211 -56% | 1404 -49% | 1467 -47% | 1289 -53% | 1334 -51% |
| Score Write | 2792 | 2271 -19% | 2232 -20% | 1734 -38% | 1693 -39% | 1503 -46% |
| Score Total | 6880 | 4046 -41% | 4297 -38% | 3894 -43% | 3582 -48% | 3498 -49% |
| Copy ISO MB/s | 1287.6 | 901 -30% | 2474 92% | 1760.5 37% | 2940 128% | |
| Copy Program MB/s | 115.3 | 118.7 3% | 1074 831% | 355 208% | 733 536% | |
| Copy Game MB/s | 390.1 | 372 -5% | 1929 394% | 849 118% | 1442 270% |
* ... smaller is better
* ... smaller is better
Constant Performance Reading: DiskSpd Read Loop, Queue Depth 8
Graphics Card

The Nvidia T600 used here is the professional version of the GeForce GTX 1650 (non-Ti) with 4 GB of GDDR6 VRAM and a 25-Watt TGP and boosts up to 1395 MHz.
In many benchmarks, it remains ~15% behind the Nvidia T1200 of the ThinkPad P15v G2 and between 30 and 50% ahead of the Nvidia T500 in the ZBook Firefly 15 G8.
In battery operation, you will lose about 20% of the graphics power, which will still allow you to work on GPU tasks in mobile operation.


| 3DMark Performance Rating - Percent | |
| HP ZBook Fury 15 G8 -4! | |
| Average of class Workstation | |
| HP ZBook Studio 15 G8 -4! | |
| HP ZBook Power 15 G8 313S5EA | |
| Average NVIDIA T600 Laptop GPU | |
| Lenovo ThinkPad P15v G2 21A9000XGE -3! | |
| Dell Precision 3000 3551 -3! | |
| HP ZBook Firefly 15 G8 2C9R7EA -4! | |
| 3DMark 06 - 1280x1024 Standard Score AA:0x AF:0x | |
| HP ZBook Power 15 G8 313S5EA | |
| Average NVIDIA T600 Laptop GPU () | |
| Average of class Workstation (31003 - 53707, n=4, last 2 years) | |
| Lenovo ThinkPad P15v G2 21A9000XGE | |
| Dell Precision 3000 3551 | |
| 3DMark Vantage | |
| 1280x1024 P Result | |
| HP ZBook Power 15 G8 313S5EA | |
| Average NVIDIA T600 Laptop GPU () | |
| Average of class Workstation (25155 - 58312, n=4, last 2 years) | |
| 1280x1024 P GPU no PhysX | |
| Average of class Workstation (24697 - 53510, n=4, last 2 years) | |
| HP ZBook Power 15 G8 313S5EA | |
| Average NVIDIA T600 Laptop GPU () | |
| 1280x1024 P CPU no PhysX | |
| HP ZBook Power 15 G8 313S5EA | |
| Average NVIDIA T600 Laptop GPU () | |
| Average of class Workstation (26635 - 79794, n=4, last 2 years) | |
| 3DMark 06 Standard Score | 43438 points | |
| 3DMark Vantage P Result | 39112 points | |
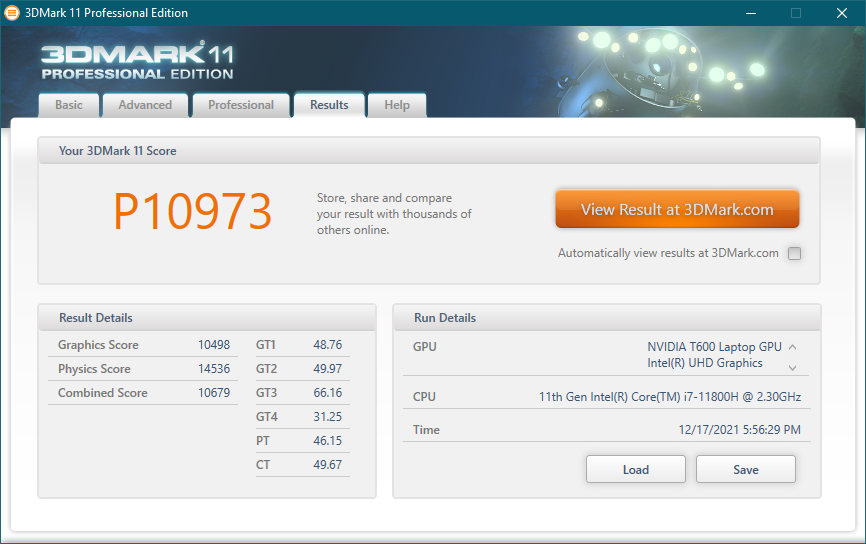
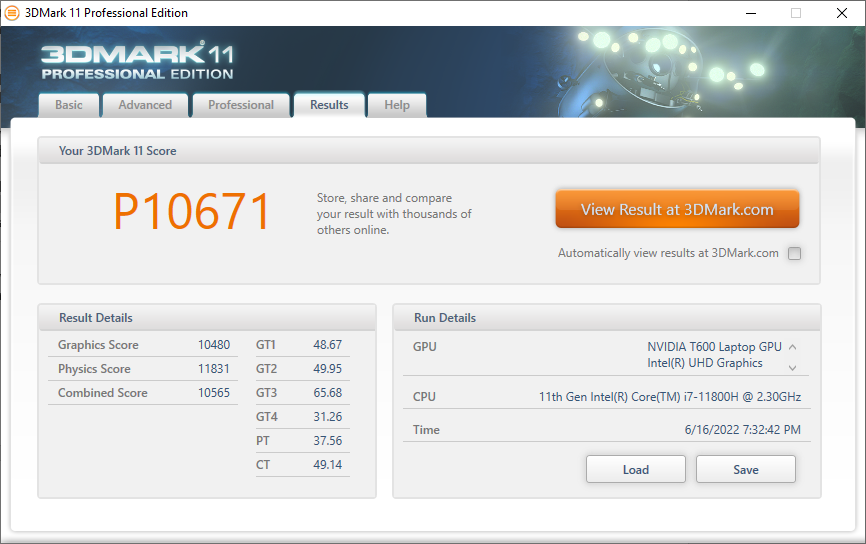
| 3DMark 11 Performance | 10973 points | |
| 3DMark Ice Storm Standard Score | 76482 points | |
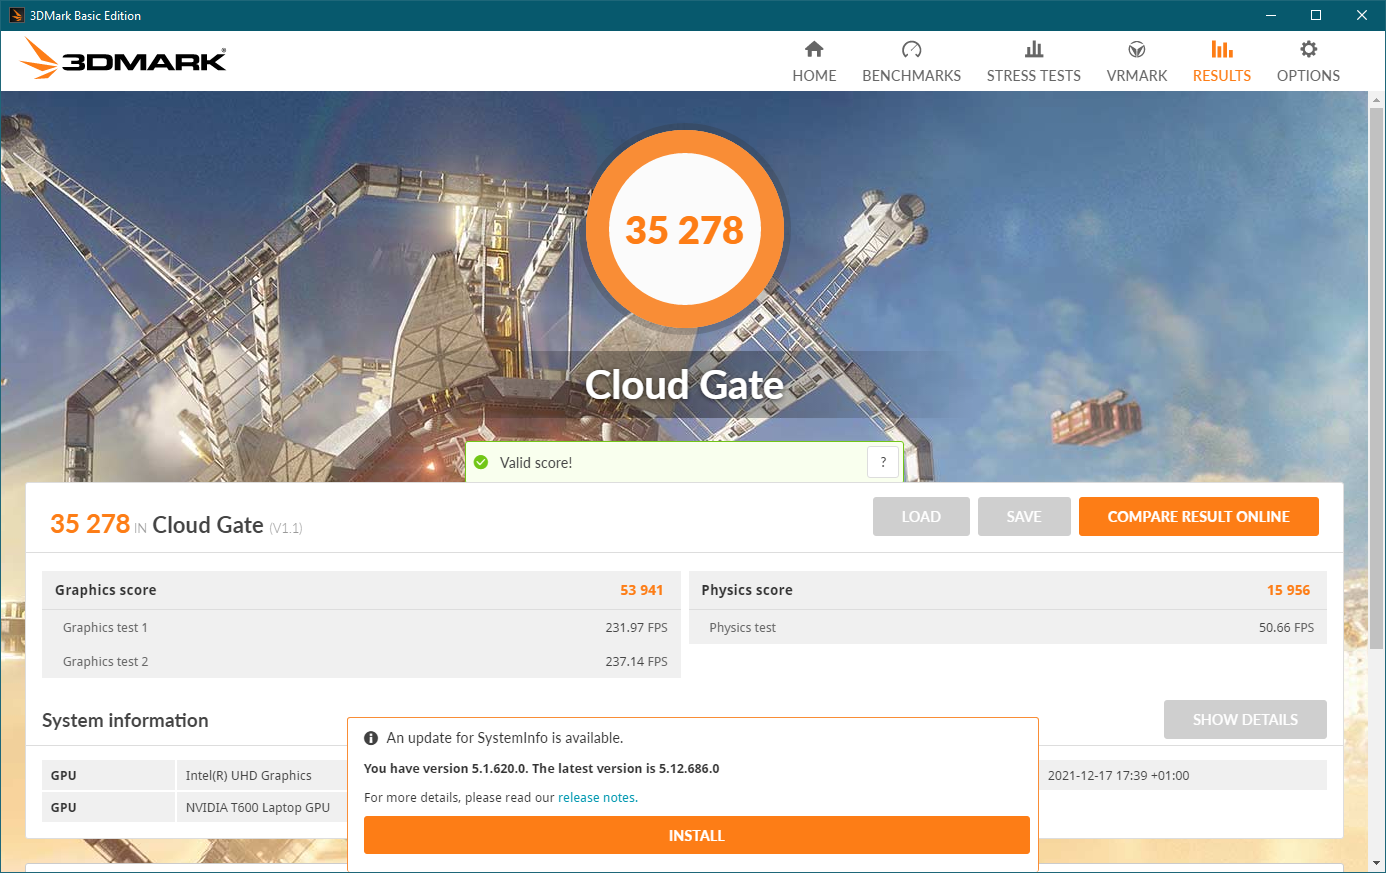
| 3DMark Cloud Gate Standard Score | 35278 points | |
| 3DMark Fire Strike Score | 7475 points | |
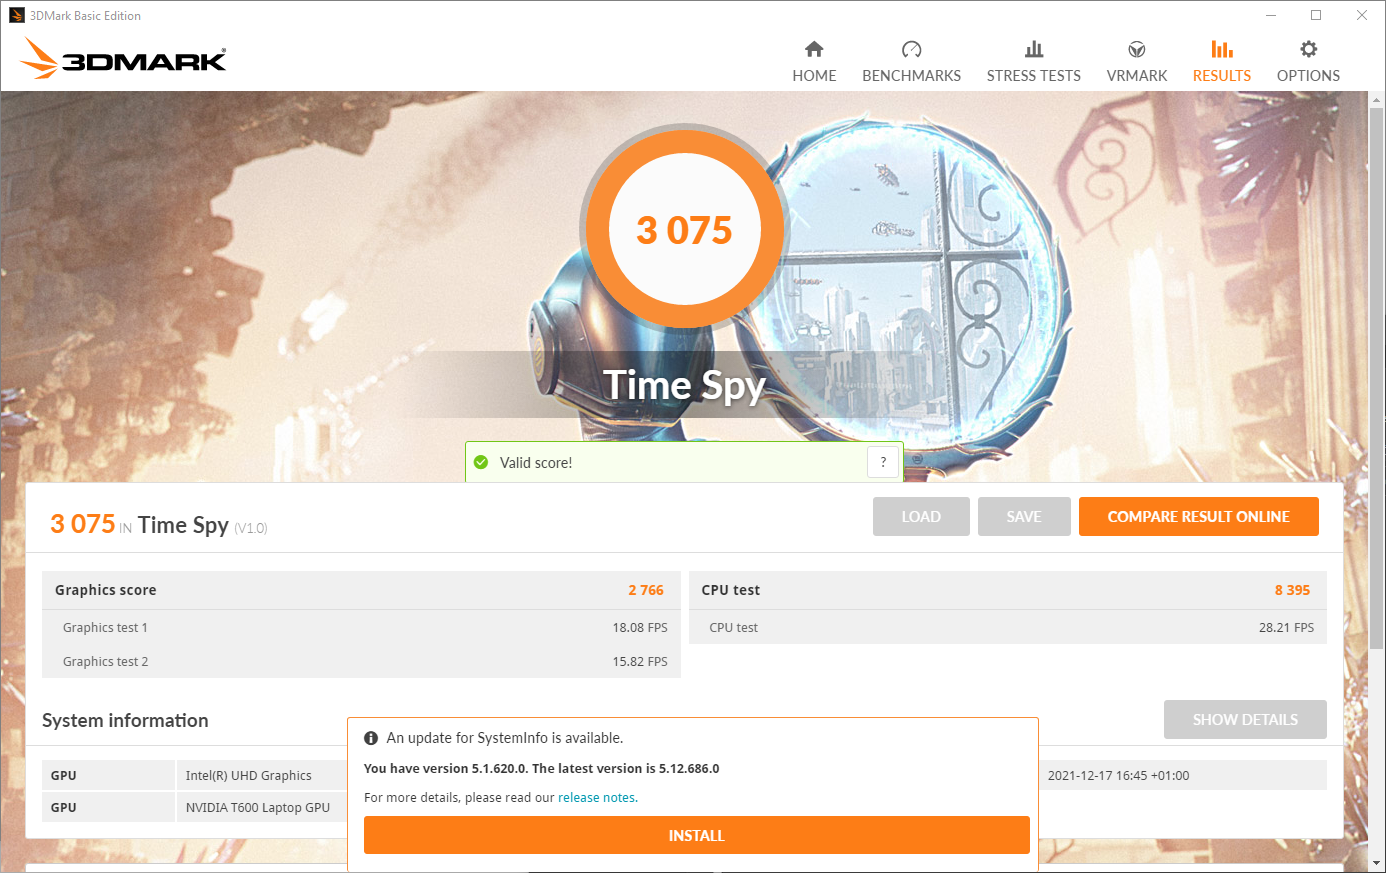
| 3DMark Time Spy Score | 3075 points | |
Help | ||
Gaming Performance

While gaming, the Nvidia T600 is able to maintain its full boost clock speed. At less than 60 °C (140 °F), it doesn't get particularly hot. In modern games, the performance is sufficient for medium details at Full-HD resolution. However, the ZBook is not designed for gaming. The system draws ~60 watts in this scenario overall, with the full 25 watts going to the GPU.
Although the ThinkPad P15v only provides 10 watts more for its dGPU, it consumes a total of 100 watts overall during gaming, while the Nvidia T1200 delivers only ~15% more frames per second. The ZBook Firefly 15 with the Nvidia T500 is 40% slower on average but still consumes the same 60 watts overall during gaming. In the hour-long The Witcher 3 test, we do not notice any performance drop.
The Witcher 3 FPS Chart
| The Witcher 3 | |
| 1366x768 Medium Graphics & Postprocessing | |
| HP ZBook Studio 15 G8 | |
| HP ZBook Fury 15 G8 | |
| Average of class Workstation (73 - 430, n=26, last 2 years) | |
| HP ZBook Power 15 G8 313S5EA | |
| Average NVIDIA T600 Laptop GPU () | |
| Dell Precision 3000 3551 | |
| 1920x1080 High Graphics & Postprocessing (Nvidia HairWorks Off) | |
| HP ZBook Studio 15 G8 | |
| HP ZBook Fury 15 G8 | |
| Average of class Workstation (34.9 - 298, n=27, last 2 years) | |
| Lenovo ThinkPad P15v G2 21A9000XGE | |
| HP ZBook Power 15 G8 313S5EA | |
| Average NVIDIA T600 Laptop GPU () | |
| Dell Precision 3000 3551 | |
| 1920x1080 Ultra Graphics & Postprocessing (HBAO+) | |
| HP ZBook Fury 15 G8 | |
| HP ZBook Studio 15 G8 | |
| Average of class Workstation (19.6 - 156.5, n=28, last 2 years) | |
| Lenovo ThinkPad P15v G2 21A9000XGE | |
| HP ZBook Power 15 G8 313S5EA | |
| Average NVIDIA T600 Laptop GPU () | |
| HP ZBook Firefly 15 G8 2C9R7EA | |
| Dell Precision 3000 3551 | |
| GTA V | |
| 1366x768 Normal/Off AF:4x | |
| HP ZBook Fury 15 G8 | |
| Average of class Workstation (103.3 - 185.3, n=24, last 2 years) | |
| Lenovo ThinkPad P15v G2 21A9000XGE | |
| HP ZBook Power 15 G8 313S5EA | |
| Average NVIDIA T600 Laptop GPU () | |
| 1920x1080 High/On (Advanced Graphics Off) AA:2xMSAA + FX AF:8x | |
| HP ZBook Fury 15 G8 | |
| Average of class Workstation (47.6 - 177.7, n=26, last 2 years) | |
| Lenovo ThinkPad P15v G2 21A9000XGE | |
| HP ZBook Power 15 G8 313S5EA | |
| Average NVIDIA T600 Laptop GPU () | |
| 1920x1080 Highest Settings possible AA:4xMSAA + FX AF:16x | |
| HP ZBook Fury 15 G8 | |
| Average of class Workstation (18.3 - 124.4, n=26, last 2 years) | |
| Lenovo ThinkPad P15v G2 21A9000XGE | |
| HP ZBook Power 15 G8 313S5EA | |
| Average NVIDIA T600 Laptop GPU () | |
| Shadow of the Tomb Raider | |
| 1280x720 Lowest Preset | |
| HP ZBook Fury 15 G8 | |
| HP ZBook Power 15 G8 313S5EA | |
| Average NVIDIA T600 Laptop GPU () | |
| Lenovo ThinkPad P15v G2 21A9000XGE | |
| 1920x1080 Medium Preset | |
| HP ZBook Fury 15 G8 | |
| Lenovo ThinkPad P15v G2 21A9000XGE | |
| HP ZBook Power 15 G8 313S5EA | |
| Average NVIDIA T600 Laptop GPU () | |
| 1920x1080 High Preset AA:SM | |
| HP ZBook Fury 15 G8 | |
| Lenovo ThinkPad P15v G2 21A9000XGE | |
| HP ZBook Power 15 G8 313S5EA | |
| Average NVIDIA T600 Laptop GPU () | |
| Resident Evil Village | |
| 1920x1080 Balanced Preset | |
| Lenovo ThinkPad P15v G2 21A9000XGE | |
| HP ZBook Power 15 G8 313S5EA | |
| Average NVIDIA T600 Laptop GPU () | |
| 1920x1080 Prioritize Graphics Preset | |
| Lenovo ThinkPad P15v G2 21A9000XGE | |
| HP ZBook Power 15 G8 313S5EA | |
| Average NVIDIA T600 Laptop GPU () | |
| 1920x1080 Max Preset | |
| Lenovo ThinkPad P15v G2 21A9000XGE | |
| HP ZBook Power 15 G8 313S5EA | |
| Average NVIDIA T600 Laptop GPU () | |
| Vampire Bloodhunt | |
| 1920x1080 Medium Preset | |
| Average of class Workstation (last 2 years) | |
| Lenovo ThinkPad P15v G2 21A9000XGE | |
| HP ZBook Power 15 G8 313S5EA | |
| Average NVIDIA T600 Laptop GPU () | |
| 1920x1080 High Preset | |
| Average of class Workstation (last 2 years) | |
| Lenovo ThinkPad P15v G2 21A9000XGE | |
| HP ZBook Power 15 G8 313S5EA | |
| Average NVIDIA T600 Laptop GPU () | |
| 1920x1080 Ultra Preset | |
| Average of class Workstation (last 2 years) | |
| Lenovo ThinkPad P15v G2 21A9000XGE | |
| HP ZBook Power 15 G8 313S5EA | |
| Average NVIDIA T600 Laptop GPU () | |
| Mafia Definitive Edition | |
| 1280x720 Low Preset | |
| Lenovo ThinkPad P15v G2 21A9000XGE | |
| HP ZBook Power 15 G8 313S5EA | |
| Average NVIDIA T600 Laptop GPU () | |
| 1920x1080 Medium Preset | |
| Lenovo ThinkPad P15v G2 21A9000XGE | |
| HP ZBook Power 15 G8 313S5EA | |
| Average NVIDIA T600 Laptop GPU () | |
| 1920x1080 High Preset | |
| Lenovo ThinkPad P15v G2 21A9000XGE | |
| HP ZBook Power 15 G8 313S5EA | |
| Average NVIDIA T600 Laptop GPU () | |
| Elex 2 | |
| 1920x1080 Medium / On AA:FX AF:16x | |
| Lenovo ThinkPad P15v G2 21A9000XGE | |
| HP ZBook Power 15 G8 313S5EA | |
| Average NVIDIA T600 Laptop GPU () | |
| 1920x1080 High / On AA:FX AF:16x | |
| Lenovo ThinkPad P15v G2 21A9000XGE | |
| HP ZBook Power 15 G8 313S5EA | |
| Average NVIDIA T600 Laptop GPU () | |
| 1920x1080 Ultra / On AA:SM AF:16x | |
| Lenovo ThinkPad P15v G2 21A9000XGE | |
| HP ZBook Power 15 G8 313S5EA | |
| Average NVIDIA T600 Laptop GPU () | |
| Farming Simulator 22 | |
| 1920x1080 Medium Preset | |
| Lenovo ThinkPad P15v G2 21A9000XGE | |
| HP ZBook Power 15 G8 313S5EA | |
| Average NVIDIA T600 Laptop GPU () | |
| 1920x1080 High Preset | |
| Lenovo ThinkPad P15v G2 21A9000XGE | |
| HP ZBook Power 15 G8 313S5EA | |
| Average NVIDIA T600 Laptop GPU () | |
| 1920x1080 Very High Preset | |
| Lenovo ThinkPad P15v G2 21A9000XGE | |
| HP ZBook Power 15 G8 313S5EA | |
| Average NVIDIA T600 Laptop GPU () | |
| Ghostwire Tokyo | |
| 1920x1080 Medium Settings | |
| Lenovo ThinkPad P15v G2 21A9000XGE | |
| HP ZBook Power 15 G8 313S5EA | |
| Average NVIDIA T600 Laptop GPU () | |
| 1920x1080 High Settings | |
| Lenovo ThinkPad P15v G2 21A9000XGE | |
| HP ZBook Power 15 G8 313S5EA | |
| Average NVIDIA T600 Laptop GPU () | |
| 1920x1080 Highest Settings | |
| HP ZBook Power 15 G8 313S5EA | |
| Average NVIDIA T600 Laptop GPU () | |
| Lenovo ThinkPad P15v G2 21A9000XGE | |
| Riders Republic | |
| 1920x1080 Medium Preset | |
| HP ZBook Power 15 G8 313S5EA | |
| Average NVIDIA T600 Laptop GPU () | |
| Lenovo ThinkPad P15v G2 21A9000XGE | |
| 1920x1080 High Preset | |
| Lenovo ThinkPad P15v G2 21A9000XGE | |
| HP ZBook Power 15 G8 313S5EA | |
| Average NVIDIA T600 Laptop GPU () | |
| 1920x1080 Ultra Preset | |
| Lenovo ThinkPad P15v G2 21A9000XGE | |
| HP ZBook Power 15 G8 313S5EA | |
| Average NVIDIA T600 Laptop GPU () | |
| Tiny Tina's Wonderlands | |
| 1920x1080 Medium Preset (DX12) | |
| Average of class Workstation (110.5 - 228, n=6, last 2 years) | |
| HP ZBook Power 15 G8 313S5EA | |
| Average NVIDIA T600 Laptop GPU () | |
| 1920x1080 High Preset (DX12) | |
| Average of class Workstation (74 - 171.7, n=6, last 2 years) | |
| HP ZBook Power 15 G8 313S5EA | |
| Average NVIDIA T600 Laptop GPU () | |
| 1920x1080 Badass Preset (DX12) | |
| Average of class Workstation (57 - 139.4, n=7, last 2 years) | |
| HP ZBook Power 15 G8 313S5EA | |
| Average NVIDIA T600 Laptop GPU () | |
| Deathloop | |
| 1920x1080 Medium Preset | |
| HP ZBook Power 15 G8 313S5EA | |
| Average NVIDIA T600 Laptop GPU () | |
| 1920x1080 High Preset | |
| HP ZBook Power 15 G8 313S5EA | |
| Average NVIDIA T600 Laptop GPU () | |
| 1920x1080 Ultra Preset | |
| HP ZBook Power 15 G8 313S5EA | |
| Average NVIDIA T600 Laptop GPU () | |
| Immortals Fenyx Rising | |
| 1920x1080 Medium Preset | |
| HP ZBook Fury 15 G8 | |
| HP ZBook Power 15 G8 313S5EA | |
| Average NVIDIA T600 Laptop GPU () | |
| 1920x1080 High Preset | |
| HP ZBook Fury 15 G8 | |
| HP ZBook Power 15 G8 313S5EA | |
| Average NVIDIA T600 Laptop GPU () | |
| 1920x1080 Very High Preset | |
| HP ZBook Fury 15 G8 | |
| HP ZBook Power 15 G8 313S5EA | |
| Average NVIDIA T600 Laptop GPU () | |
| low | med. | high | ultra | |
| GTA V (2015) | 142.6 | 137.6 | 82.3 | 44.1 |
| The Witcher 3 (2015) | 158.6 | 92.7 | 52.2 | 27.6 |
| Dota 2 Reborn (2015) | 149.4 | 127.6 | 115.8 | 107.1 |
| Final Fantasy XV Benchmark (2018) | 86 | 43.9 | 31 | |
| X-Plane 11.11 (2018) | 107.9 | 92.4 | 77 | |
| Far Cry 5 (2018) | 105 | 53 | 49 | 45 |
| Strange Brigade (2018) | 190.4 | 76.2 | 60.7 | 52.7 |
| Shadow of the Tomb Raider (2018) | 98 | 53 | 42 | 36 |
| Mafia Definitive Edition (2020) | 83.6 | 40.4 | 34.9 | |
| Immortals Fenyx Rising (2020) | 72 | 45 | 36 | 31 |
| Resident Evil Village (2021) | 113.6 | 58.6 | 52.1 | 44 |
| Deathloop (2021) | 68.9 | 34.4 | 28.4 | 25.2 |
| Riders Republic (2021) | 91 | 52 | 39 | 30 |
| Farming Simulator 22 (2021) | 175.4 | 87.5 | 63.5 | 53.9 |
| Dying Light 2 (2022) | 31.7 | 23 | 18.3 | |
| GRID Legends (2022) | 104.1 | 71 | 57.7 | 41.9 |
| Elden Ring (2022) | 52.4 | 45 | 39 | 29.9 |
| Elex 2 (2022) | 38.5 | 35.7 | 30.5 | 26.9 |
| Ghostwire Tokyo (2022) | 45.7 | 44.3 | 43.9 | 41.8 |
| Tiny Tina's Wonderlands (2022) | 57.5 | 32.8 | 48.3 | 27.2 |
| Vampire Bloodhunt (2022) | 119 | 64.5 | 61.8 | 60.1 |
Emissions: The cool ZBook workstation runs quietly at times
Noise Emissions
The tester only has the measurements using the old BIOS, which still allowed for a significantly higher fan speed and resulted in a noise level of up to 51db(A) in the load scenario. However, with the v1.09 BIOS, HP's AI only allows a maximum fan speed of about 4300 upm, which could be an advantage in sensitive business environments, though.
With its two fans and three heat pipes, the cooling should be able to dissipate more heat than that of the ThinkPad P15v G2 whose 75 watts are successfully cooled by its single fan. However, with the limiting AI, the HP ZBook fans cool a maximum of 65 to 80 watts under combined load (CPU + GPU). The fan vents are at the bottom between the display and the case, drawing air from the bottom of the case, which makes using it on your lap less than optimal.
During regular surfing on the Internet, the fans remain quiet, but if you are used to working faster in the net, they turn on constantly and fairly noisily. At least there is no coil whine. With components that are similarly powerful, Lenovo's ThinkPad P15v G2 is more subdued in all the scenarios, and HP's own ZBook Fury also runs quieter. On the other hand, the fans of Dell's Precision 3551 really like to blow a lot.
Noise Level
| Idle |
| 25.54 / 25.54 / 25.54 dB(A) |
| Load |
| 48.85 / 50.98 dB(A) |
 | ||
30 dB silent 40 dB(A) audible 50 dB(A) loud |
||
min: | ||
| HP ZBook Power 15 G8 313S5EA T600 Laptop GPU, i7-11800H, Samsung PM9A1 MZVL2512HCJQ | HP ZBook Fury 15 G8 RTX A5000 Laptop GPU, i9-11950H, Samsung PM981a MZVLB1T0HBLR | HP ZBook Studio 15 G8 GeForce RTX 3070 Laptop GPU, i9-11950H, Samsung PM981a MZVLB2T0HALB | HP ZBook Firefly 15 G8 2C9R7EA T500 Laptop GPU, i7-1165G7, Toshiba XG6 KXG60ZNV1T02 | Lenovo ThinkPad P15v G2 21A9000XGE T1200 Laptop GPU, i7-11800H, Toshiba XG6 KXG6AZNV512G | Dell Precision 3000 3551 Quadro P620, i9-10885H, Toshiba Kioxia XG6 KXG60PNV512G | |
|---|---|---|---|---|---|---|
| Noise | 9% | 3% | 14% | 9% | -1% | |
| off / environment * | 25.54 | 24.1 6% | 23.5 8% | 24.1 6% | 25.21 1% | 25.8 -1% |
| Idle Minimum * | 25.54 | 24.1 6% | 25.3 1% | 24.1 6% | 25.21 1% | 26.2 -3% |
| Idle Average * | 25.54 | 24.1 6% | 25.3 1% | 24.1 6% | 25.21 1% | 26.2 -3% |
| Idle Maximum * | 25.54 | 24.8 3% | 25.3 1% | 27.1 -6% | 25.21 1% | 26.2 -3% |
| Load Average * | 48.85 | 37.8 23% | 41.2 16% | 32.8 33% | 39.09 20% | 51.2 -5% |
| Witcher 3 ultra * | 46.58 | 44.2 5% | 49.4 -6% | 36.1 22% | 36.6 21% | 42.7 8% |
| Load Maximum * | 50.98 | 44.2 13% | 49.4 3% | 36.1 29% | 43.53 15% | 50.7 1% |
* ... smaller is better
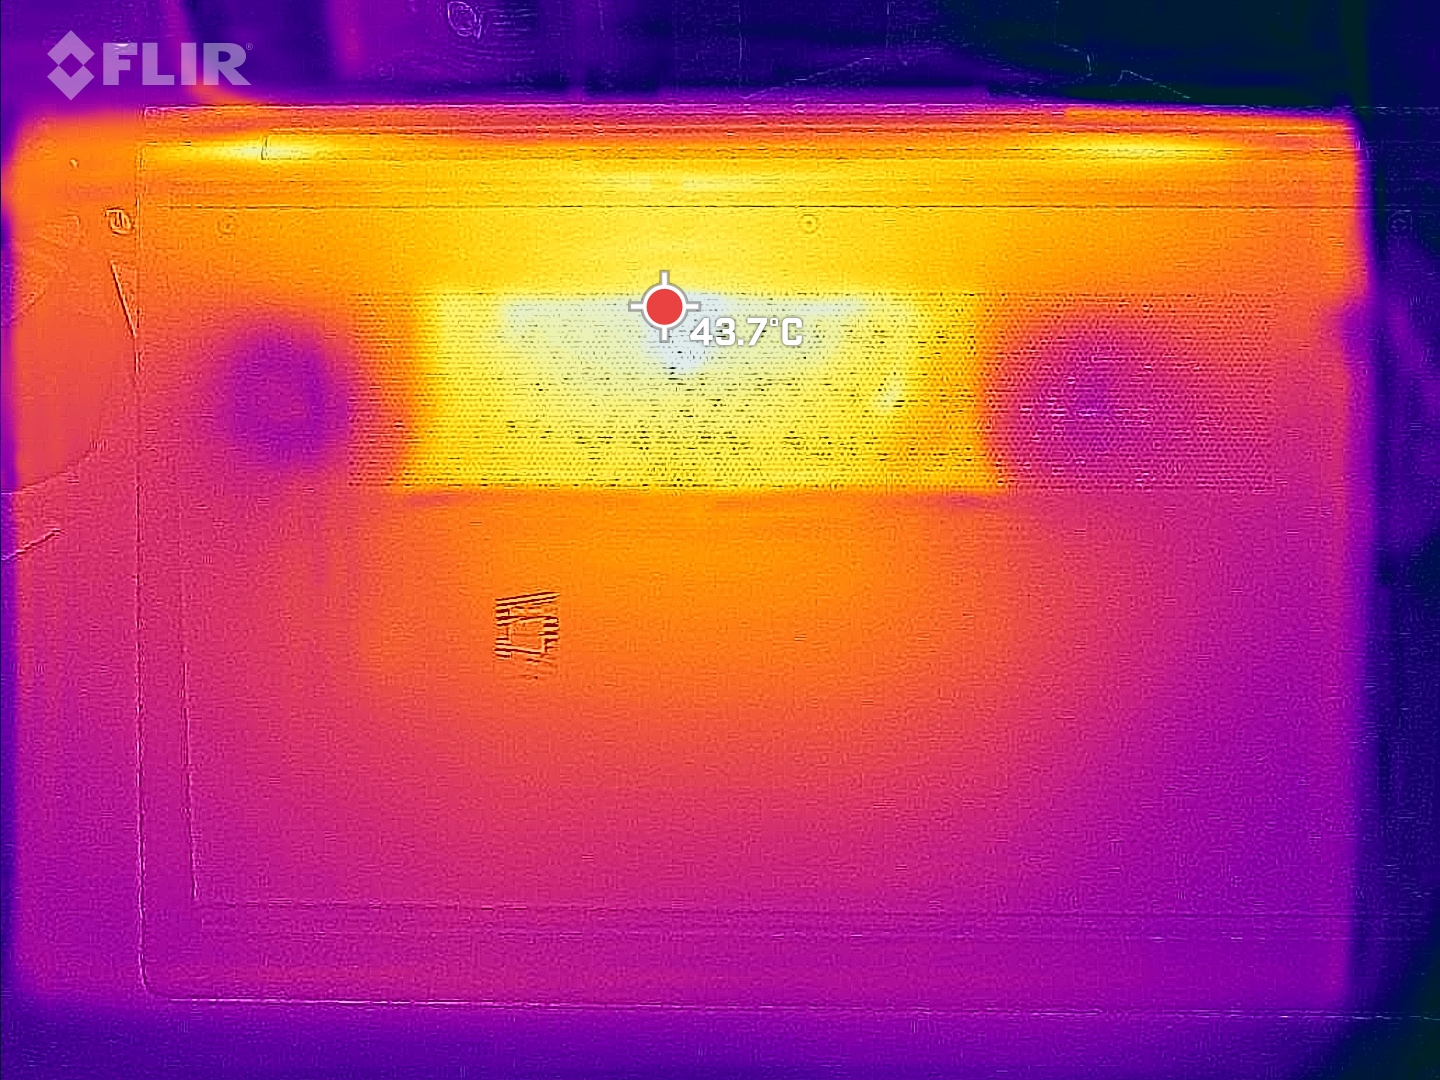
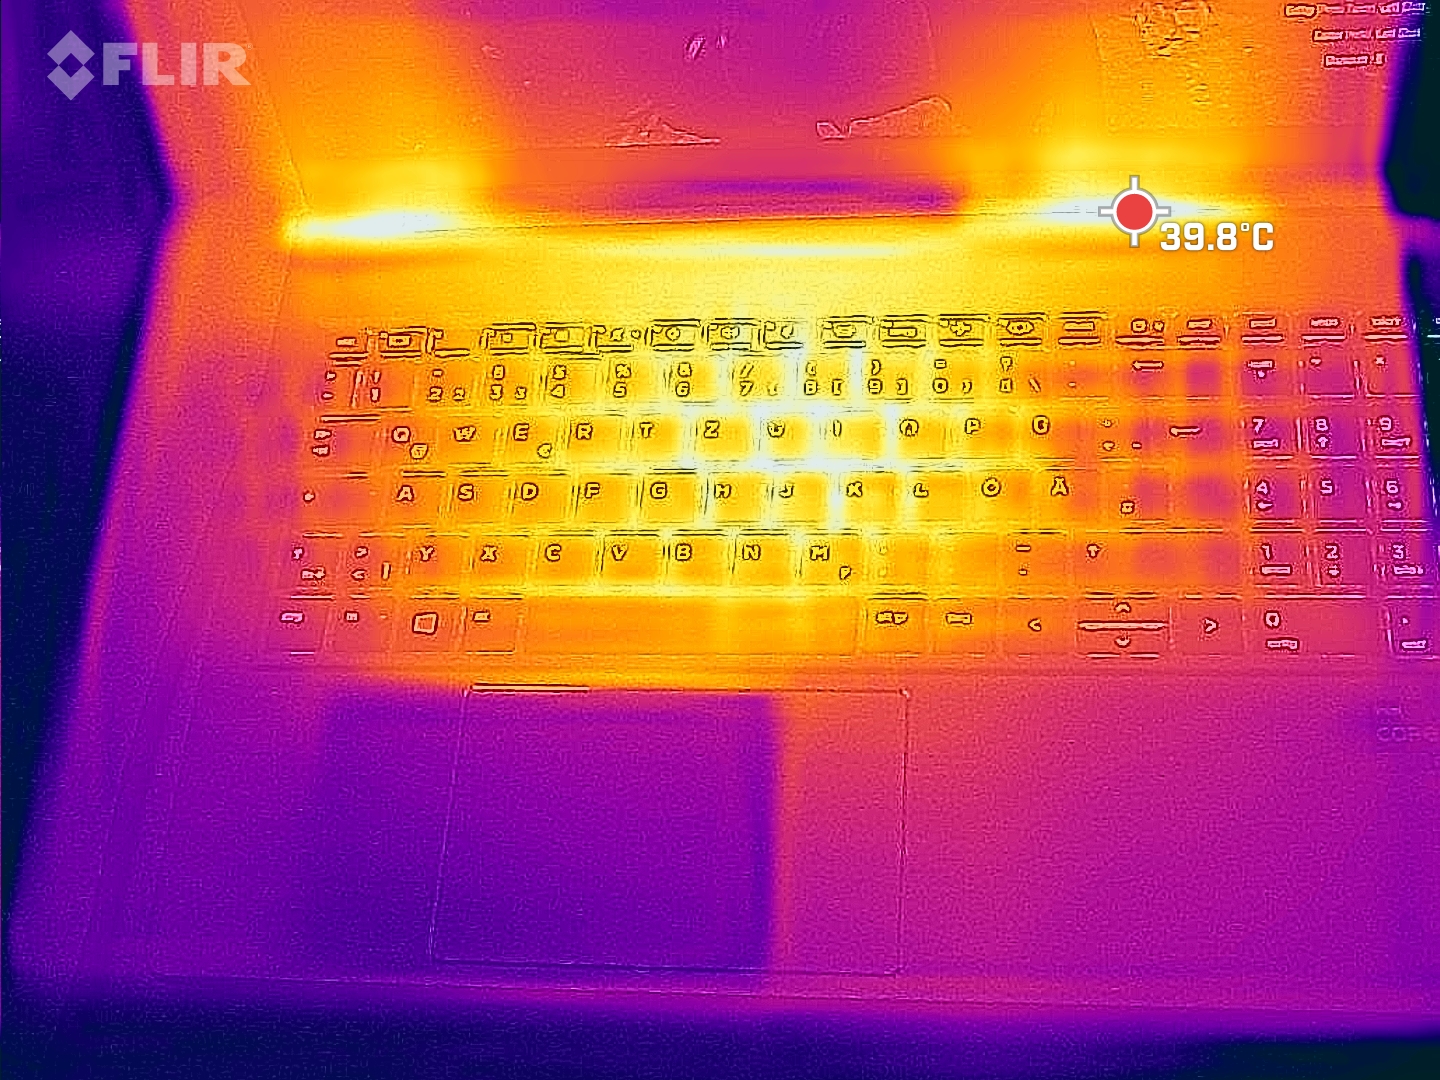
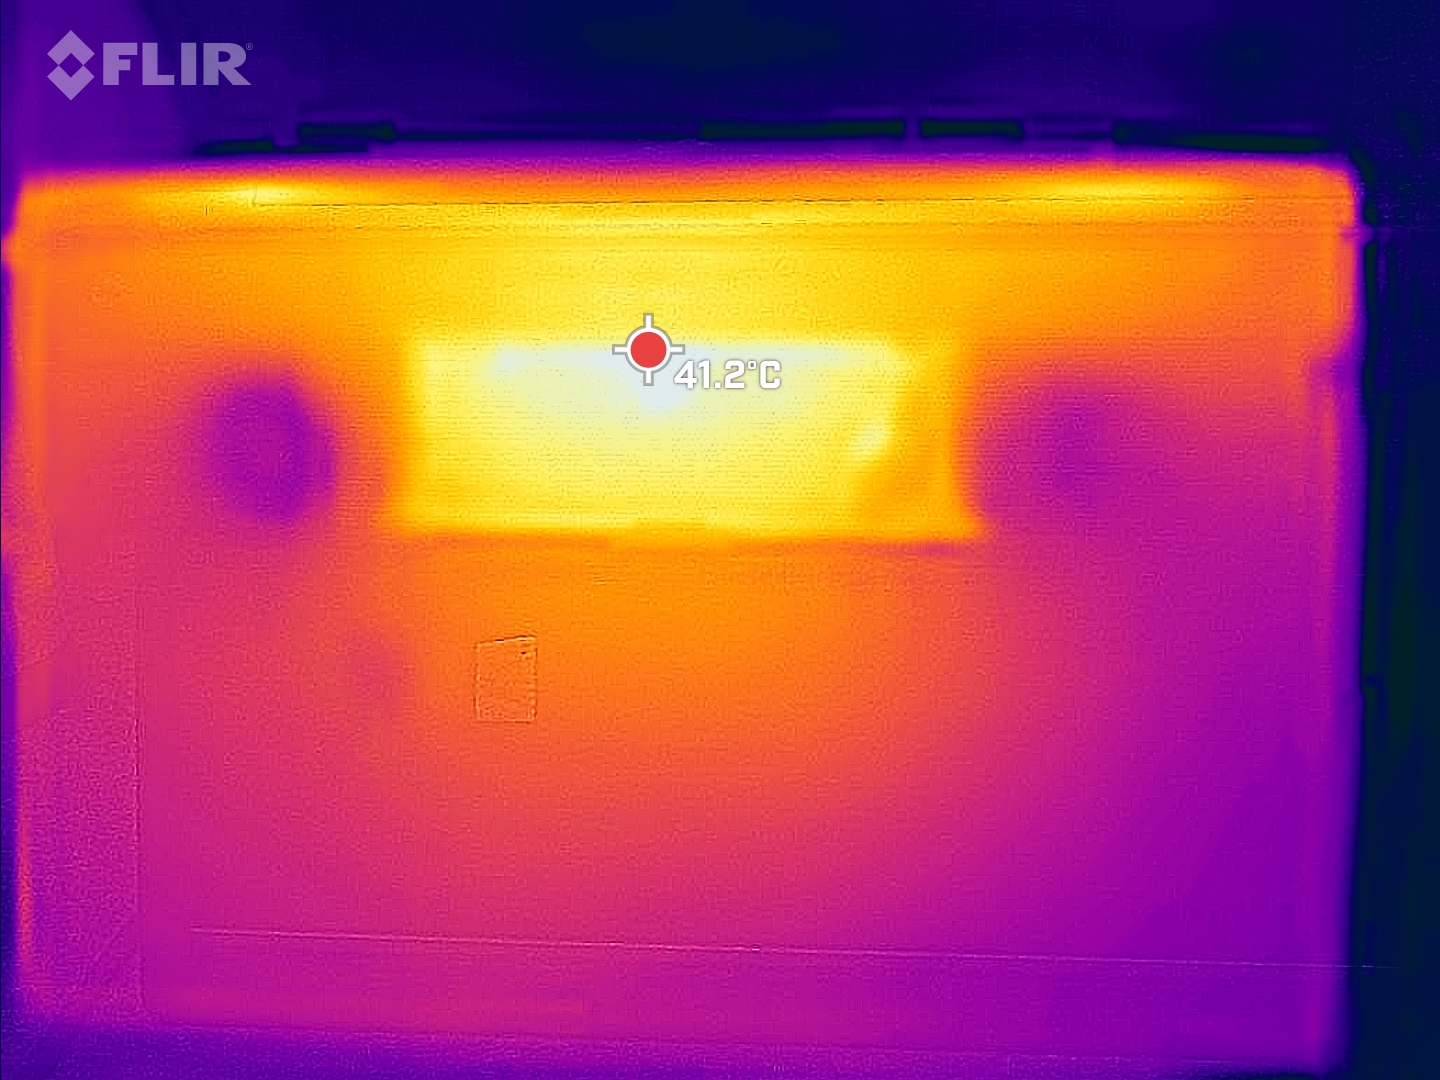
Temperatures
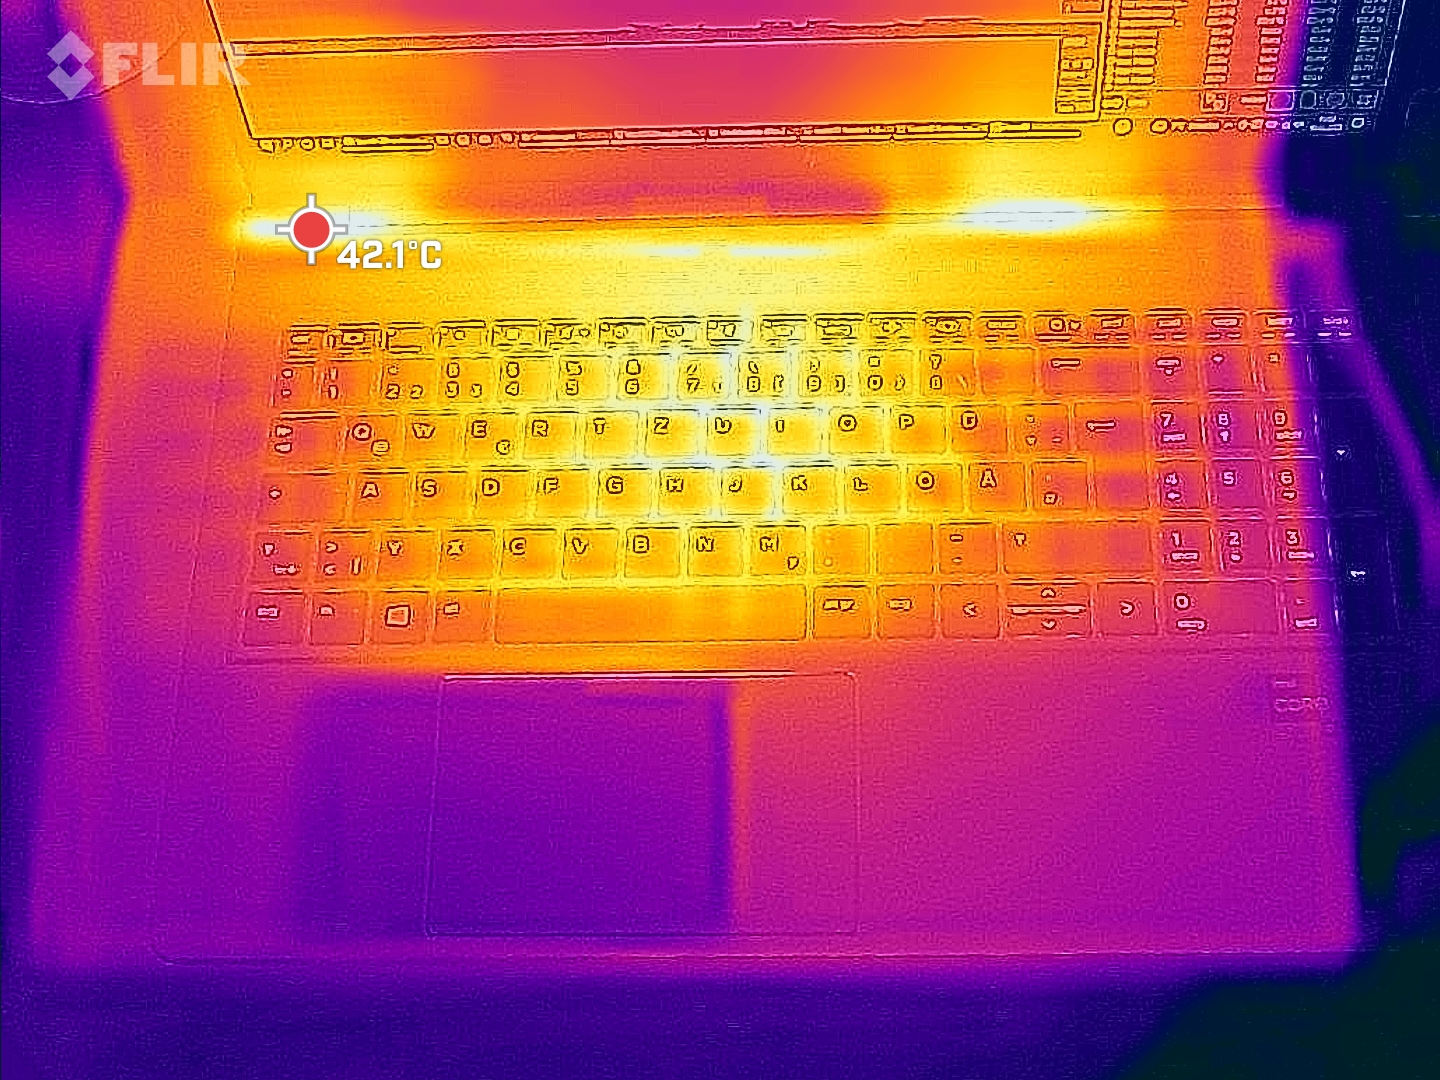
The only warmer spots are in the center above the keyboard as well as in the corresponding place at the case bottom, and that only during the stress test. However, since the fans don't speed up as much, these warm spots are noticeable even during gaming or while rendering, and even in the center of the keyboard. But they never become annoyingly hot.
(±) The maximum temperature on the upper side is 41.4 °C / 107 F, compared to the average of 38.1 °C / 101 F, ranging from 22.2 to 69.8 °C for the class Workstation.
(±) The bottom heats up to a maximum of 41.5 °C / 107 F, compared to the average of 41.3 °C / 106 F
(+) In idle usage, the average temperature for the upper side is 22.9 °C / 73 F, compared to the device average of 32 °C / 90 F.
(+) Playing The Witcher 3, the average temperature for the upper side is 30.4 °C / 87 F, compared to the device average of 32 °C / 90 F.
(+) The palmrests and touchpad are cooler than skin temperature with a maximum of 28.4 °C / 83.1 F and are therefore cool to the touch.
(±) The average temperature of the palmrest area of similar devices was 27.8 °C / 82 F (-0.6 °C / -1.1 F).
| HP ZBook Power 15 G8 313S5EA Intel Core i7-11800H, NVIDIA T600 Laptop GPU | HP ZBook Fury 15 G8 Intel Core i9-11950H, NVIDIA RTX A5000 Laptop GPU | HP ZBook Studio 15 G8 Intel Core i9-11950H, NVIDIA GeForce RTX 3070 Laptop GPU | HP ZBook Firefly 15 G8 2C9R7EA Intel Core i7-1165G7, NVIDIA T500 Laptop GPU | Lenovo ThinkPad P15v G2 21A9000XGE Intel Core i7-11800H, NVIDIA T1200 Laptop GPU | Dell Precision 3000 3551 Intel Core i9-10885H, NVIDIA Quadro P620 | |
|---|---|---|---|---|---|---|
| Heat | -18% | -20% | -3% | -21% | -20% | |
| Maximum Upper Side * | 41.4 | 45.6 -10% | 49 -18% | 41.2 -0% | 53.8 -30% | 47 -14% |
| Maximum Bottom * | 41.5 | 57.6 -39% | 54.2 -31% | 47.2 -14% | 52.1 -26% | 54.6 -32% |
| Idle Upper Side * | 23.8 | 26 -9% | 26.2 -10% | 23.7 -0% | 27.6 -16% | 27.8 -17% |
| Idle Bottom * | 25 | 28.8 -15% | 30.2 -21% | 23.9 4% | 27.7 -11% | 29.2 -17% |
* ... smaller is better
Stress Test
The CPU is able to benefit from the BIOS update only during the stress test. In the combined stress (Prime95 + FurMark), the CPU still runs at its basic clock speed (2.3 GHz), while it only ran at 1.7 GHz before. On the other hand, at 1080 MHz, the GPU clock speed drops by 150 MHz. In the pure CPU stress, 2.65 GHz are maintained at a power consumption of 50 watts and temperature of 92 °C (198 °F).
Under pure graphics load, the GPU runs at ~1100 MHz, which is significantly below its boost speed of 1395 MHz. However, the temperature remains at only 56 °C (133 °F), and we suspect another inconsistency of the AI.

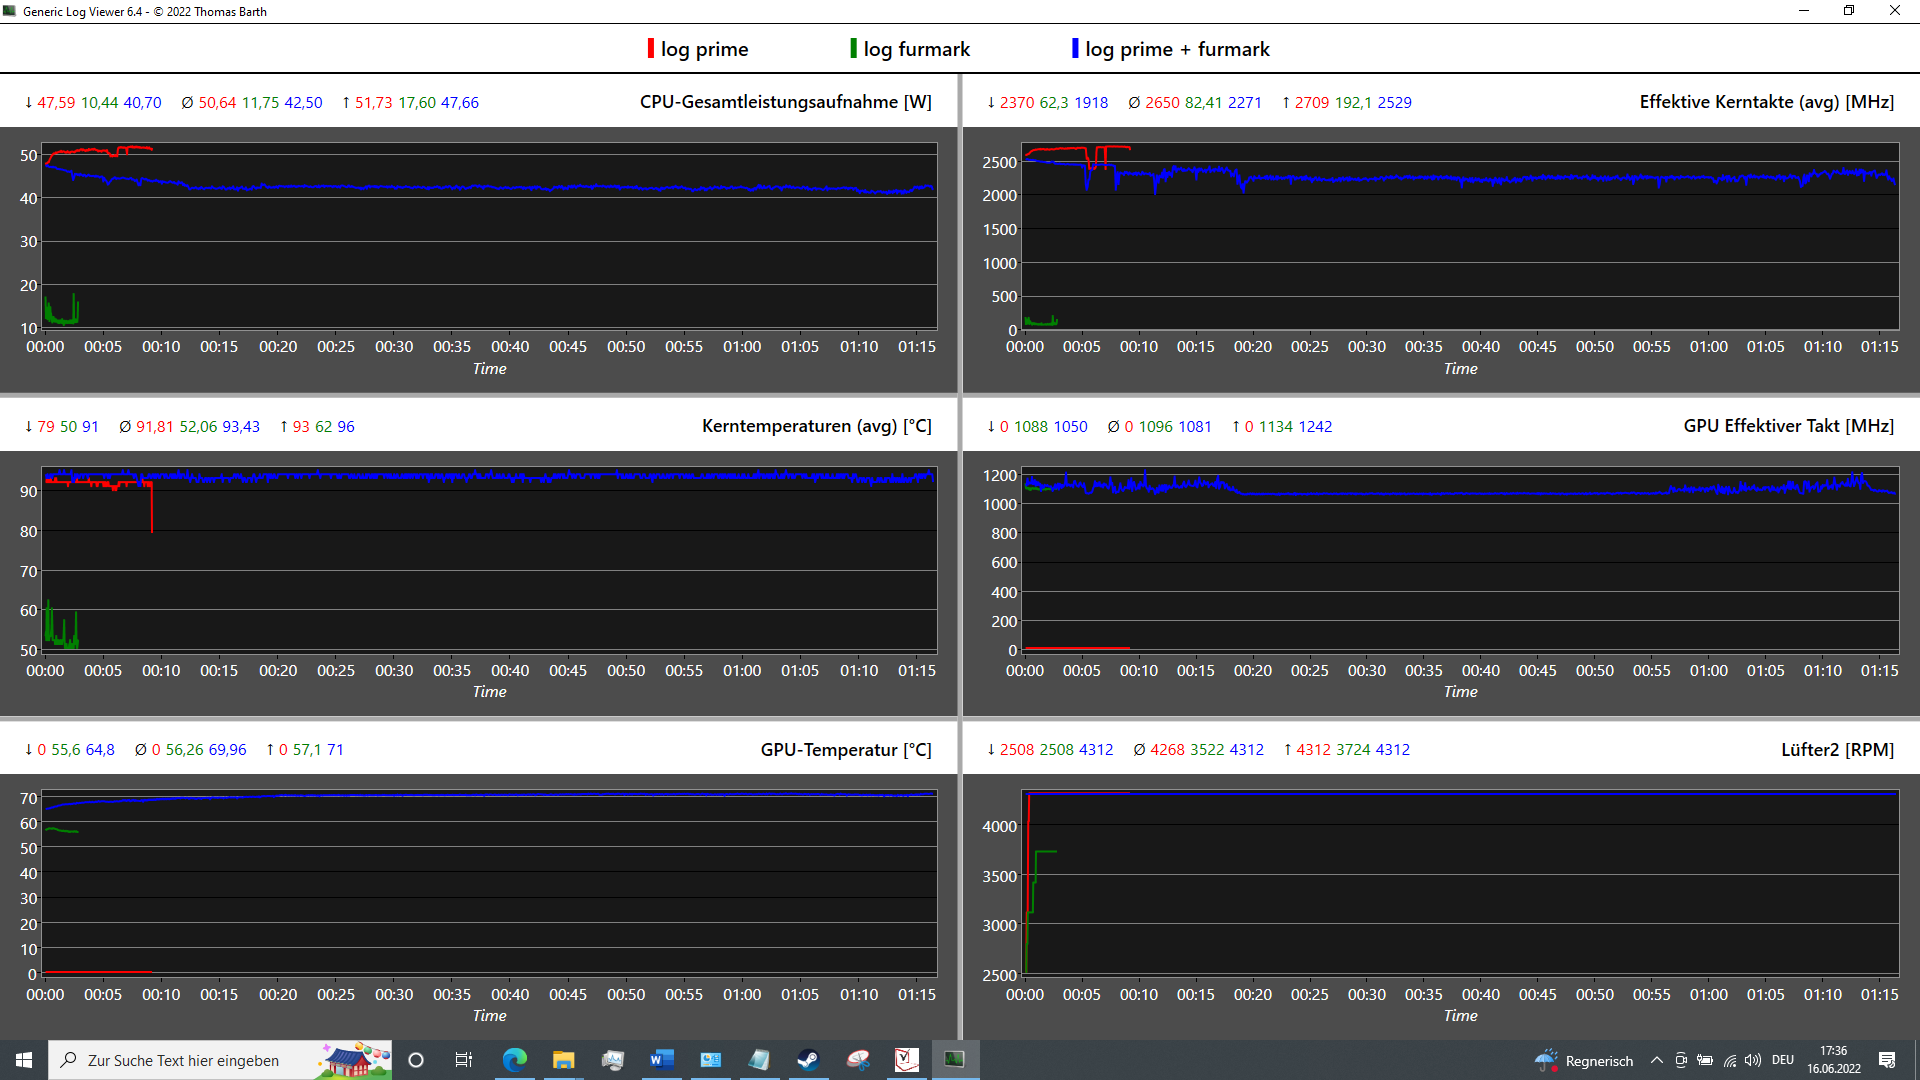
| CPU Clock (GHz) | GPU Clock (MHz) | Average CPU Temperature (°C) | Average GPU Temperature (°C) | |
| System Idle | 1.3 | 350 | 35 | 35 |
| Prime95 Stress | 2.65 | 350 | 91.8 | -- |
| Prime95 + FurMark Stress | 2.27 | 1081 | 93.4 | 56 |
| FurMark Stress | 1.3 | 1100 | 52 | 70 |
Speakers
The sound from the upward pointing 2-Watt stereo speakers is fairly balanced, but they lack bass and don't get particularly loud either. The HP Fury 15 houses a significantly more attractive sound system.
While it might be sufficient for office tasks, in order to enjoy multimedia, we recommend using the 3.5-mm connection or Bluetooth for external audio peripherals.
HP ZBook Power 15 G8 313S5EA audio analysis
(±) | speaker loudness is average but good (72.3 dB)
Bass 100 - 315 Hz
(-) | nearly no bass - on average 23.3% lower than median
(±) | linearity of bass is average (11.8% delta to prev. frequency)
Mids 400 - 2000 Hz
(+) | balanced mids - only 2.5% away from median
(+) | mids are linear (5.1% delta to prev. frequency)
Highs 2 - 16 kHz
(+) | balanced highs - only 4.1% away from median
(+) | highs are linear (3.1% delta to prev. frequency)
Overall 100 - 16.000 Hz
(±) | linearity of overall sound is average (21.4% difference to median)
Compared to same class
» 72% of all tested devices in this class were better, 6% similar, 22% worse
» The best had a delta of 7%, average was 18%, worst was 35%
Compared to all devices tested
» 55% of all tested devices were better, 7% similar, 38% worse
» The best had a delta of 4%, average was 25%, worst was 134%
Lenovo ThinkPad P15v G2 21A9000XGE audio analysis
(-) | not very loud speakers (70.7 dB)
Bass 100 - 315 Hz
(±) | reduced bass - on average 13.4% lower than median
(±) | linearity of bass is average (13.6% delta to prev. frequency)
Mids 400 - 2000 Hz
(+) | balanced mids - only 4.7% away from median
(+) | mids are linear (6.2% delta to prev. frequency)
Highs 2 - 16 kHz
(+) | balanced highs - only 3.2% away from median
(+) | highs are linear (5.7% delta to prev. frequency)
Overall 100 - 16.000 Hz
(±) | linearity of overall sound is average (21.2% difference to median)
Compared to same class
» 71% of all tested devices in this class were better, 7% similar, 22% worse
» The best had a delta of 7%, average was 18%, worst was 35%
Compared to all devices tested
» 54% of all tested devices were better, 7% similar, 39% worse
» The best had a delta of 4%, average was 25%, worst was 134%
Power Management: The ZBook Power is as efficient as an ultrabook
Power Consumption
At an average of 6.32 watts, the idle values of the ZBook Power 15 are as good as those from systems with a 15-Watt CPU. The ZBook Fury and ZBook Power consume almost three times as much. During standby, the ZBook Power only consumes 0.95 watts, so that you won't have to recharge it for almost four days when it is folded up. The 150-Watt power supply is also able to handle the load peaks of 110 watts without any trouble and recharge the ZBook up to 80% in about 1.5 hours.


| Off / Standby | |
| Idle | |
| Load |
|
| HP ZBook Power 15 G8 313S5EA i7-11800H, T600 Laptop GPU, Samsung PM9A1 MZVL2512HCJQ, IPS LED, 1920x1080, 15.60 | HP ZBook Fury 15 G8 i9-11950H, RTX A5000 Laptop GPU, Samsung PM981a MZVLB1T0HBLR, IPS, 3840x2160, 15.60 | HP ZBook Studio 15 G8 i9-11950H, GeForce RTX 3070 Laptop GPU, Samsung PM981a MZVLB2T0HALB, OLED, 3840x2160, 15.60 | HP ZBook Firefly 15 G8 2C9R7EA i7-1165G7, T500 Laptop GPU, Toshiba XG6 KXG60ZNV1T02, IPS, 1920x1080, 15.60 | Lenovo ThinkPad P15v G2 21A9000XGE i7-11800H, T1200 Laptop GPU, Toshiba XG6 KXG6AZNV512G, IPS LED, 1920x1080, 15.60 | Dell Precision 3000 3551 i9-10885H, Quadro P620, Toshiba Kioxia XG6 KXG60PNV512G, IPS, 1920x1080, 15.60 | Average NVIDIA T600 Laptop GPU | Average of class Workstation | |
|---|---|---|---|---|---|---|---|---|
| Power Consumption | -130% | -155% | 14% | -33% | -23% | 0% | -83% | |
| Idle Minimum * | 4.17 | 8.3 -99% | 11 -164% | 3.3 21% | 5.96 -43% | 5.7 -37% | 4.17 ? -0% | 7.82 ? -88% |
| Idle Average * | 6.32 | 19.9 -215% | 18.8 -197% | 5.6 11% | 8.37 -32% | 8.7 -38% | 6.32 ? -0% | 12.7 ? -101% |
| Idle Maximum * | 7.1 | 21.8 -207% | 31.7 -346% | 8.7 -23% | 9.05 -27% | 9 -27% | 7.1 ? -0% | 18.7 ? -163% |
| Load Average * | 80.41 | 110.9 -38% | 105.2 -31% | 64.4 20% | 91.82 -14% | 100.2 -25% | 80.4 ? -0% | 96.5 ? -20% |
| Witcher 3 ultra * | 62.3 | 165 -165% | 148 -138% | 53 15% | 102 -64% | 56 10% | ||
| Load Maximum * | 110.18 | 171.8 -56% | 171.8 -56% | 69 37% | 126.38 -15% | 133.2 -21% | 110.2 ? -0% | 158.9 ? -44% |
* ... smaller is better
Power Consumption The Witcher 3 / Stress Test
Power Consumption With External Monitor
Battery Life
While web surfing at 150 nits, the ZBook lasts for a surprising 12:19 hours. The ThinkPad P15v remains significantly behind at only ~7.5 hours, while Dell's Precision 3551 is able to crack the 13-hour mark. At more than 2 hours under load, the ZBook lasts fairly long, which is also due in parts to its throttling.
| HP ZBook Power 15 G8 313S5EA i7-11800H, T600 Laptop GPU, 83 Wh | HP ZBook Fury 15 G8 i9-11950H, RTX A5000 Laptop GPU, 94 Wh | HP ZBook Studio 15 G8 i9-11950H, GeForce RTX 3070 Laptop GPU, 83 Wh | HP ZBook Firefly 15 G8 2C9R7EA i7-1165G7, T500 Laptop GPU, 56 Wh | Lenovo ThinkPad P15v G2 21A9000XGE i7-11800H, T1200 Laptop GPU, 68 Wh | Dell Precision 3000 3551 i9-10885H, Quadro P620, 97 Wh | Average of class Workstation | |
|---|---|---|---|---|---|---|---|
| Battery Runtime | -50% | -26% | 16% | -25% | 11% | -16% | |
| Reader / Idle | 893 | 774 -13% | 1029 15% | 700 ? -22% | |||
| H.264 | 603 | 917 52% | 482 -20% | 717 ? 19% | |||
| WiFi v1.3 | 739 | 370 -50% | 369 -50% | 631 -15% | 452 -39% | 818 11% | 536 ? -27% |
| Load | 126 | 106 -16% | 139 10% | 54 -57% | 81.3 ? -35% |
Pros
Cons
Verdict: Affordable ZBook Power 15 for professional creators

At a price of around 1300 Euros (~$1324), the ZBook Power 15 G8 (Core i7, Nvidia T600, 8 GB / 256 GB) offers some clear price-performance advantages, while still keeping many characteristics of a high-end workstation. The strengths of the ZBook include the input devices, battery life, security features, upgradability, as well as a good workstation performance.
While our tested FHD display isn't fully suited for product design and Adobe, it still offers good brightness and contrast values. The target group of this configuration mainly consists of students and professionals in the area of Autodesk SolidWorks, product development, architecture, construction, engineering, 2D design, and virtual reality creation.
The disadvantages include the inconsistent performance development, but we are unable to confirm whether this is due to HP's own AI. In addition, you have to live without Xeon processors together with ECC RAM in this affordable workstation. It also lacks WWAN and an SD card reader and only offers a single Thunderbolt 4 port. And finally, the sound reproduction and webcam are fairly abysmal.
"The HP ZBook Power 15 G8 is a solid workstation for students, engineers, and (semi-)professionals without high-end demands. Unfortunately, the optional 4K panel doesn't expand the target group to creative tasks at all, where a high color accuracy is required. Otherwise, all the other core aspects are at a high level."
The ThinkPad P15v G2 offers a similar performance and input devices, also at a good price. However, it runs significantly quieter and offers an SD card reader and possibly the more color-accurate 4K display option. On the other hand, the ThinkPad doesn't support charging via USB-C, and the battery life is significantly lower. In addition, it is heavier and more bulky. Dell's Precision 3551 is also an endurance champion that isn't much worse than the ZBook Power, except in terms of the raw performance, as long as you equip it with the right display. However, its successor should offer a higher performance.
Price and Availability
A configuration of the HP ZBook Power G8 mobile workstation with a Core i7-11850H, 32 GB of RAM, and 512 GB SSD is currently available for ~$2400 from Amazon. The HP online store also offers many configurable options.
HP ZBook Power 15 G8 313S5EA
-
07/07/2022 v7
Marvin Gollor
More articles related to this device
HP ZBook Power 15 G8 313S5EA (ZBook Power 15 Series)Related Articles


Pricecompare

