

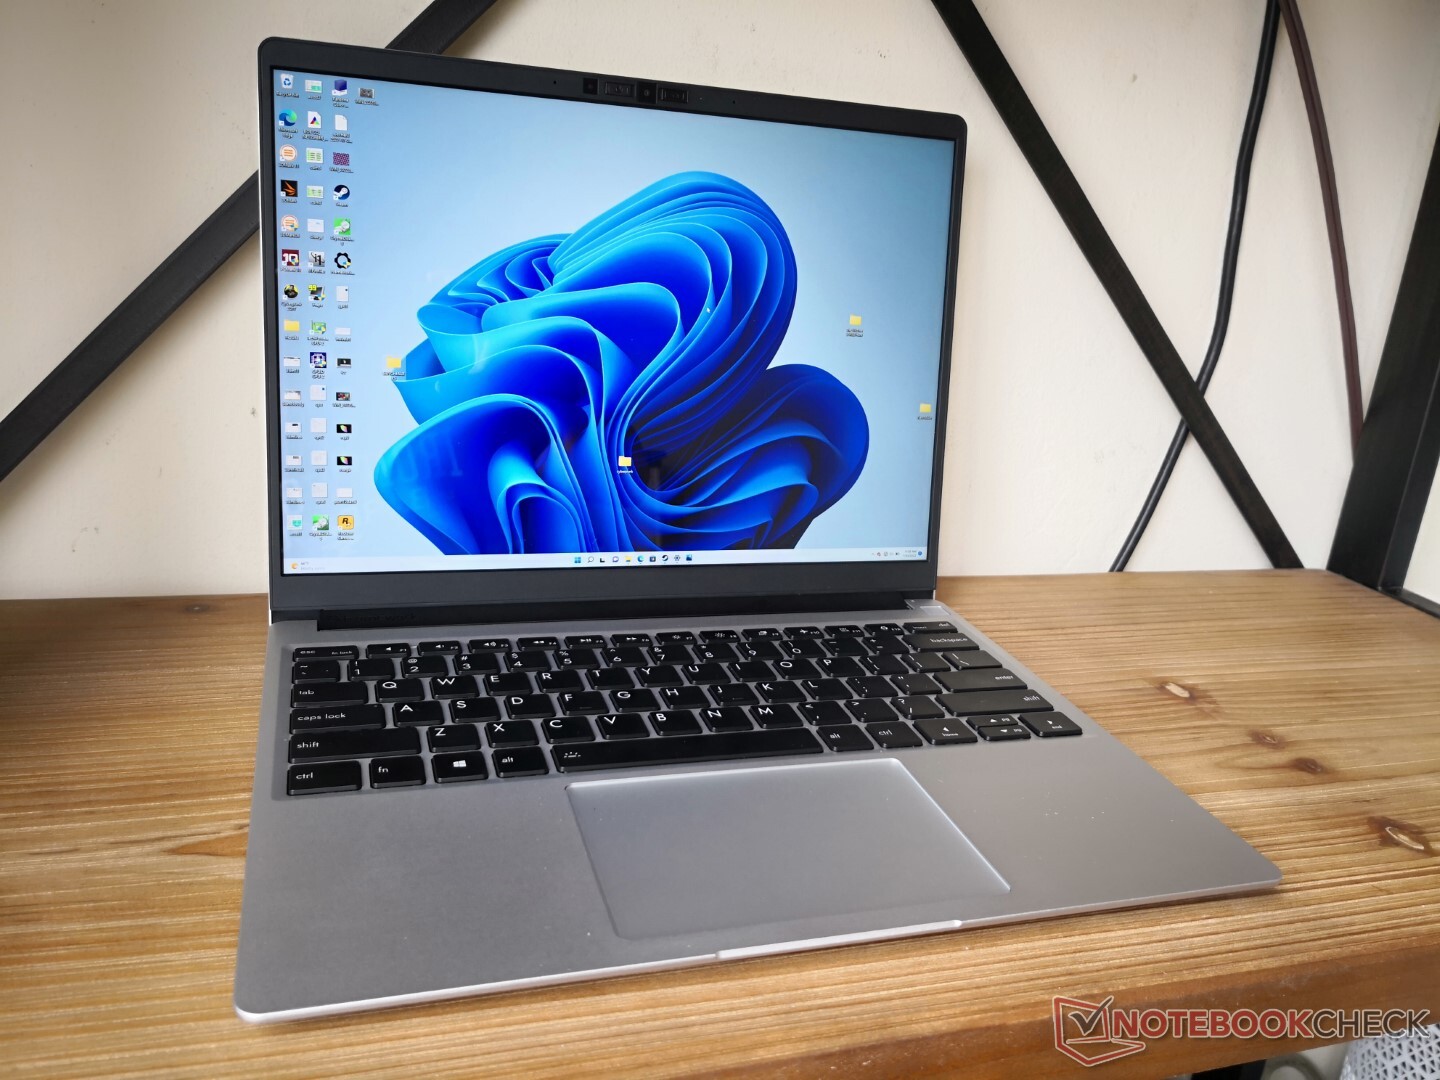
Framework Laptop 13.5 Intel 12th gen review: Like the Microsoft Surface, but actually repairable
The original 13.5-inch Framework Laptop launched in 2021 equipped with Intel 11th gen Tiger Lake-U processors. In stark contrast to other ultra-thin models from larger manufacturers which are often closed and difficult to service, the Framework design would prioritize repairability and encourage end-user upgrades. In fact, the maker openly sells individual Framework Laptop components a la carte should owners need to replace any parts. The latest 2022 model is now available with faster Intel 12th gen Alder Lake-P CPUs but with the same overall chassis design to preserve backwards compatibility with existing accessories and components.
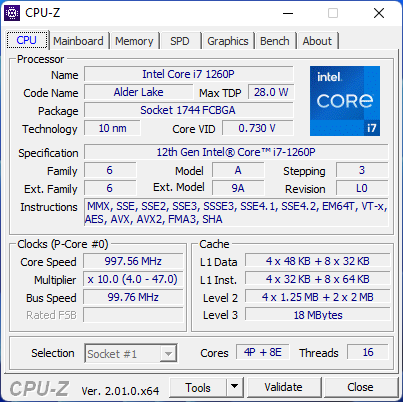
Since the skeleton has not changed, we recommend checking out our existing review on the 2021 model for more information on the physical attributes of the 2022 model. Everything from the display to the keyboard and most materials are all back with no major changes. Our particular review unit comes with the Core i7-1260P for approximately $1450 USD but users can configure with the lesser i5-1240P or higher i7-1280P if desired. All SKUs still come with the same 2256 x 1504 IPS panel, however.
Alternatives to the Framework Laptop include other 13-inch Ultrabooks like the HP Spectre x360 14, Lenovo ThinkPad X1, Asus Zenbook S13, and of course the Microsoft Surface Laptop 4 13.
Potential Competitors in Comparison
Rating | Date | Model | Weight | Height | Size | Resolution | Price |
|---|---|---|---|---|---|---|---|
| 85.1 % v7 (old) | 07 / 2022 | Framework Laptop 13.5 12th Gen Intel i7-1260P, Iris Xe G7 96EUs | 1.3 kg | 15.85 mm | 13.50" | 2256x1504 | |
| 85.4 % v7 (old) | 07 / 2021 | Framework Laptop 13.5 i7-1165G7, Iris Xe G7 96EUs | 1.3 kg | 15.85 mm | 13.50" | 2256x1504 | |
| 88.5 % v7 (old) | 03 / 2022 | Lenovo ThinkPad X1 Titanium Yoga G1 20QB0016GE i5-1140G7, Iris Xe G7 80EUs | 1.2 kg | 11.5 mm | 13.50" | 2256x1504 | |
| 84 % v7 (old) | 08 / 2021 | HP EliteBook Folio 13.5-3G2L2EA SD 8cx Gen 2 5G, Adreno 680 | 1.3 kg | 16 mm | 13.50" | 1920x1280 | |
| 85.2 % v7 (old) | 05 / 2021 | Microsoft Surface Laptop 4 13 Ryzen 5 R5 4680U, Vega 7 | 1.3 kg | 14 mm | 13.50" | 2256x1504 | |
| 89.5 % v7 (old) | 05 / 2021 | HP Spectre x360 14-ea0378ng i7-1165G7, Iris Xe G7 96EUs | 1.3 kg | 16.9 mm | 13.50" | 3000x2000 |
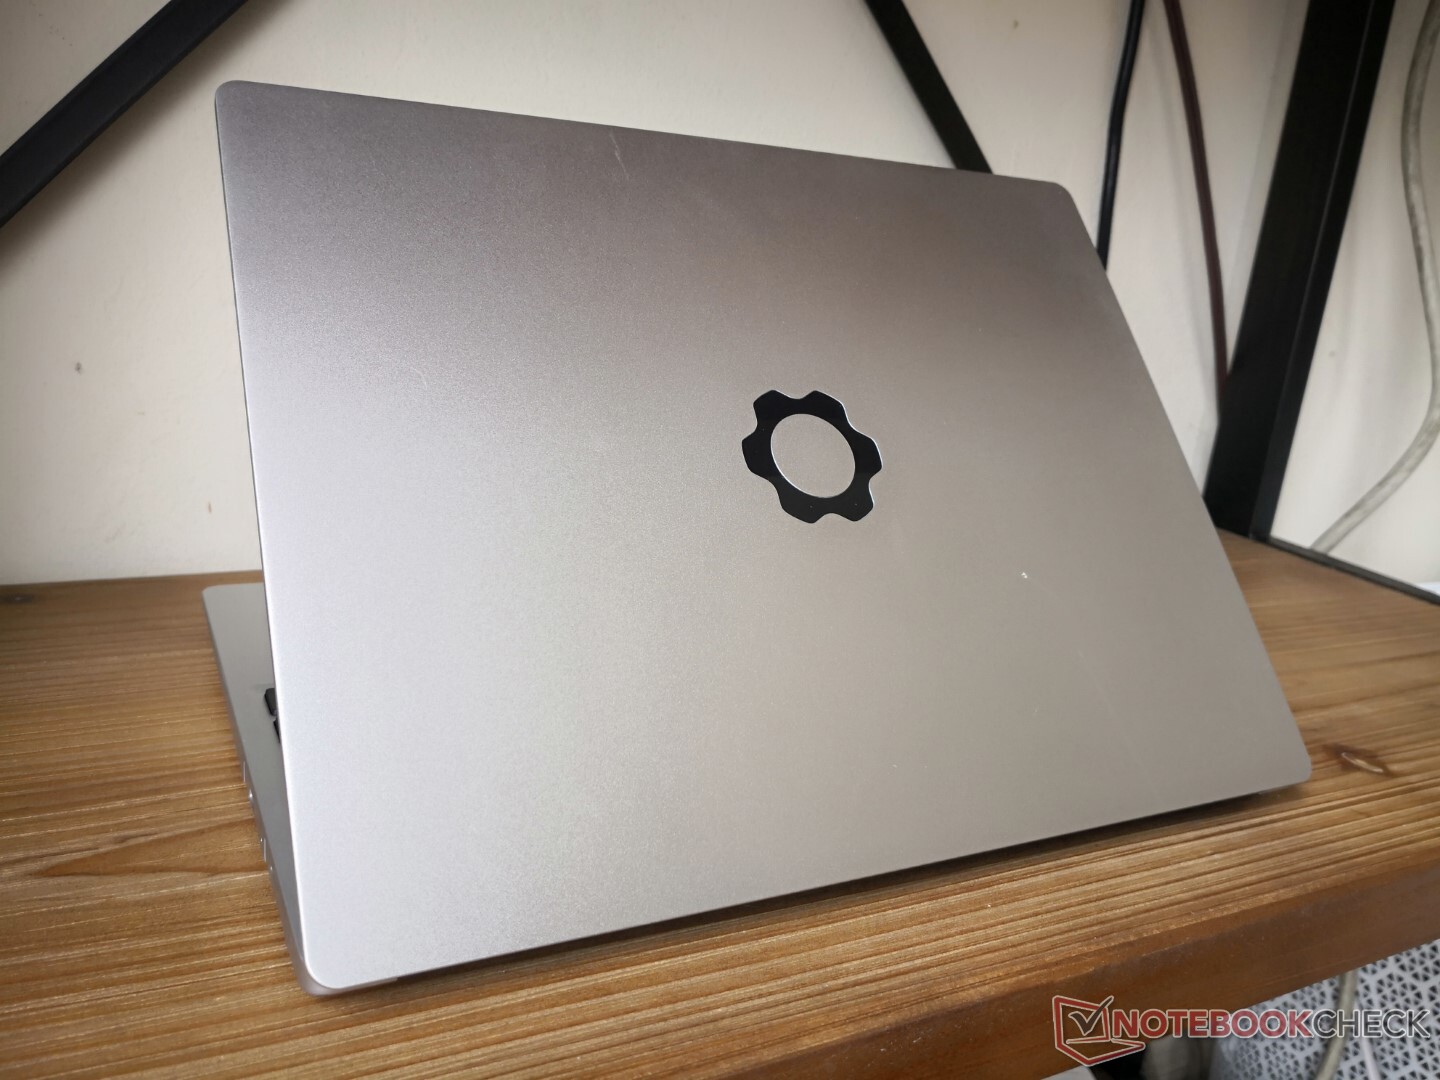
Case
The only change made to the chassis involves a switch to CNC manufacturing and assembly for the top cover to improve the rigidity of the lid without changing the overall dimensions. We found the lid to be flimsy on the 2021 version and so the newer design is a welcomed change. Even so, the lids on most competing alternatives like the XPS 13, Spectre x360 14, Zenbook S13, Razer Blade Stealth, or MateBook X series continue to be much stronger and more rigid. The Framework design noticeably lacks any Gorilla Glass options which would have reinforced and stiffened the lid.
SD Card Reader
| SD Card Reader | |
| average JPG Copy Test (av. of 3 runs) | |
| HP Spectre x360 14-ea0378ng (Toshiba Exceria Pro M501 microSDXC 64GB) | |
| Framework Laptop 13.5 (AV Pro UHS-II V60) | |
| Framework Laptop 13.5 12th Gen Intel (AV Pro UHS-II V60) | |
| maximum AS SSD Seq Read Test (1GB) | |
| HP Spectre x360 14-ea0378ng (Toshiba Exceria Pro M501 microSDXC 64GB) | |
| Framework Laptop 13.5 (AV Pro UHS-II V60) | |
| Framework Laptop 13.5 12th Gen Intel (AV Pro UHS-II V60) | |
Communication
Though the Intel AX210 module hasn't changed from last year's model, we've since upgraded our test routers to support 6 GHz connectivity and thus faster average transfer rates can be recorded as shown below.
There are still no 4G or WAN options available.
| Networking | |
| iperf3 transmit AX12 | |
| Microsoft Surface Laptop 4 13 Ryzen 5 | |
| Framework Laptop 13.5 | |
| HP Spectre x360 14-ea0378ng | |
| HP EliteBook Folio 13.5-3G2L2EA | |
| iperf3 receive AX12 | |
| Microsoft Surface Laptop 4 13 Ryzen 5 | |
| Framework Laptop 13.5 | |
| HP Spectre x360 14-ea0378ng | |
| HP EliteBook Folio 13.5-3G2L2EA | |
| iperf3 receive AXE11000 6GHz | |
| Framework Laptop 13.5 12th Gen Intel | |
| iperf3 transmit AXE11000 6GHz | |
| Framework Laptop 13.5 12th Gen Intel | |
Webcam


Maintenance
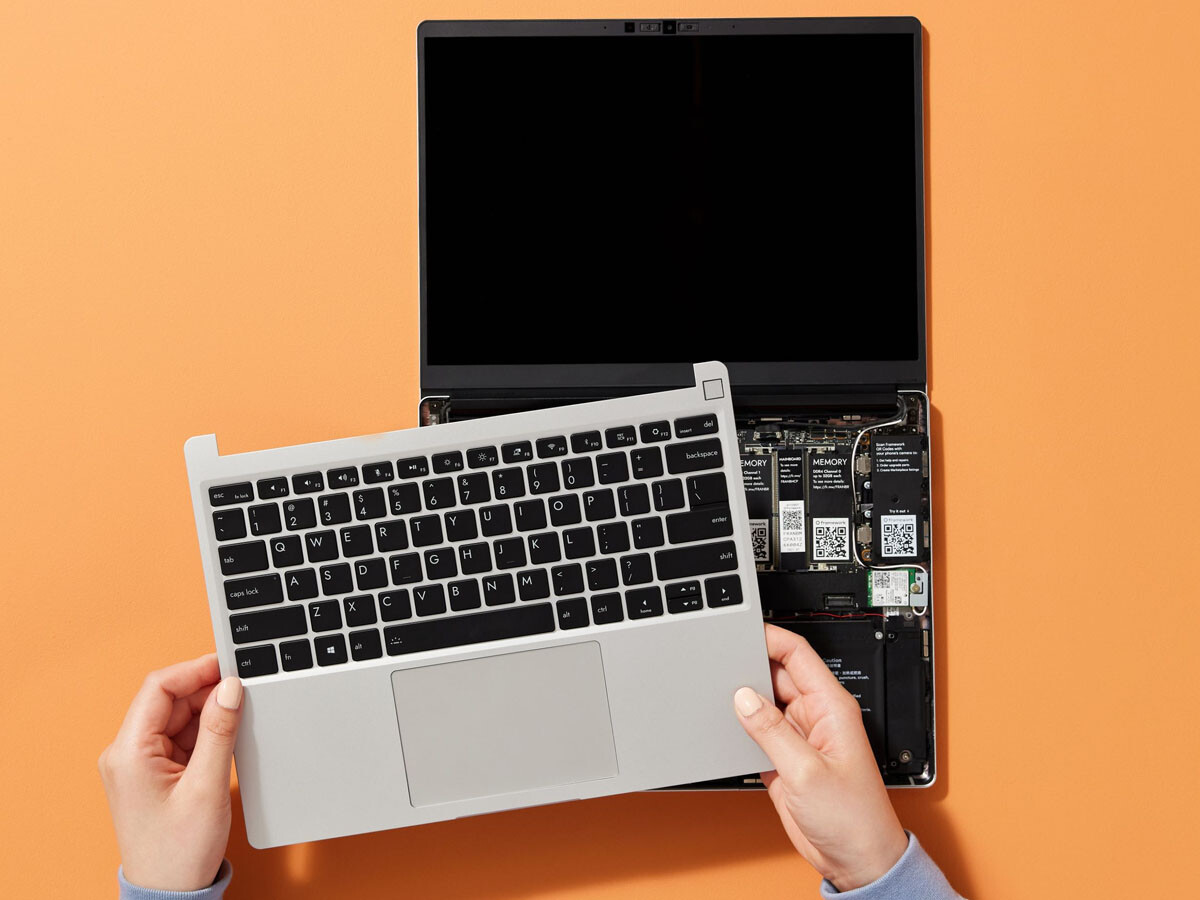
The unit is one of the easiest laptop models to service as one would expect. Framework also sells motherboards and DIY kits for users who wish to assemble the laptop themselves.
Accessories
The unique USB-C-based expansion cards have all returned this year in addition to a new Ethernet expansion card supporting up to 2.5 Gbit speeds. All are optional and configurable at checkout. The manufacturer will continue to develop different expansion cards based on user demand.
Each retail box includes a Torx wrench for servicing the unit.
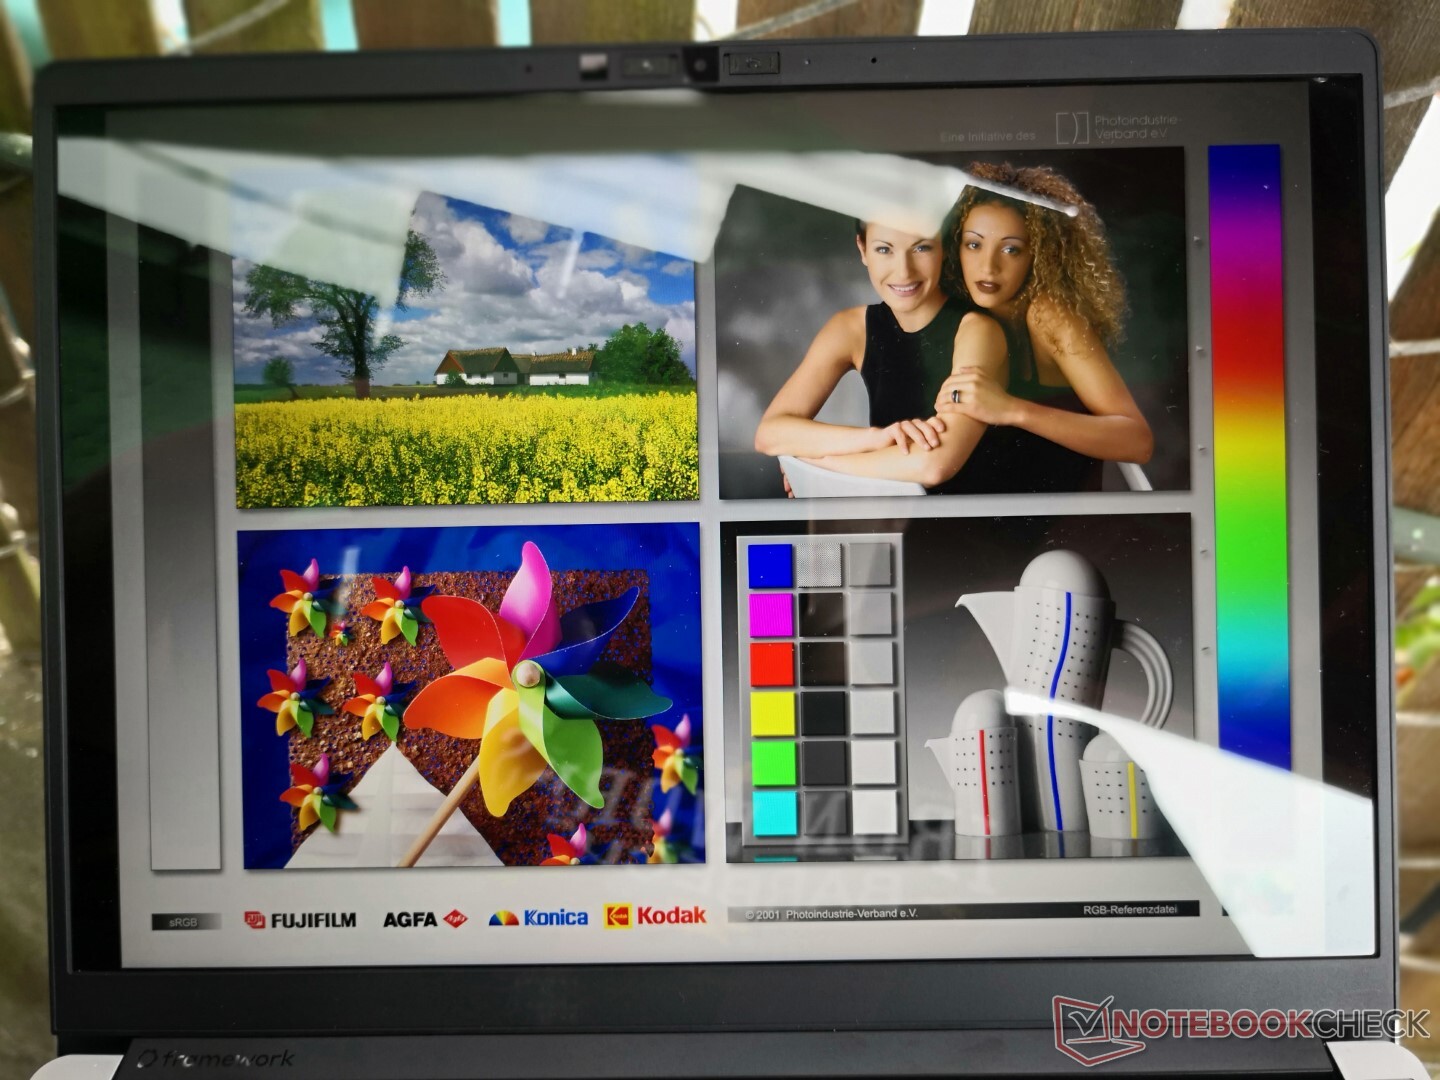
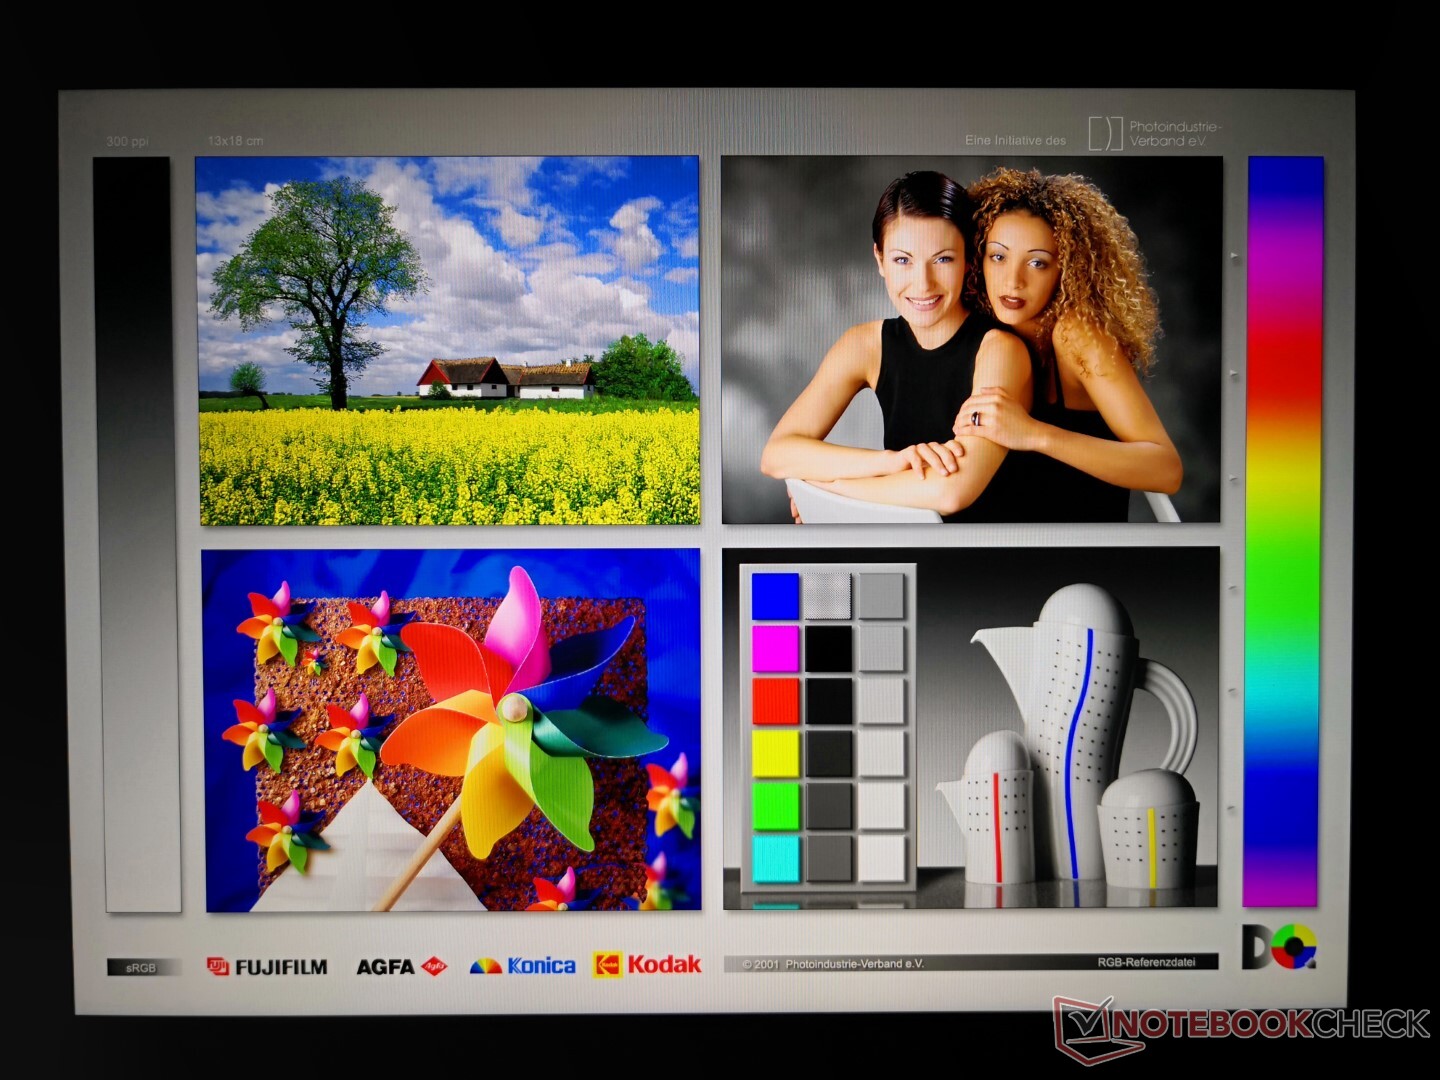
Display

| |||||||||||||||||||||||||
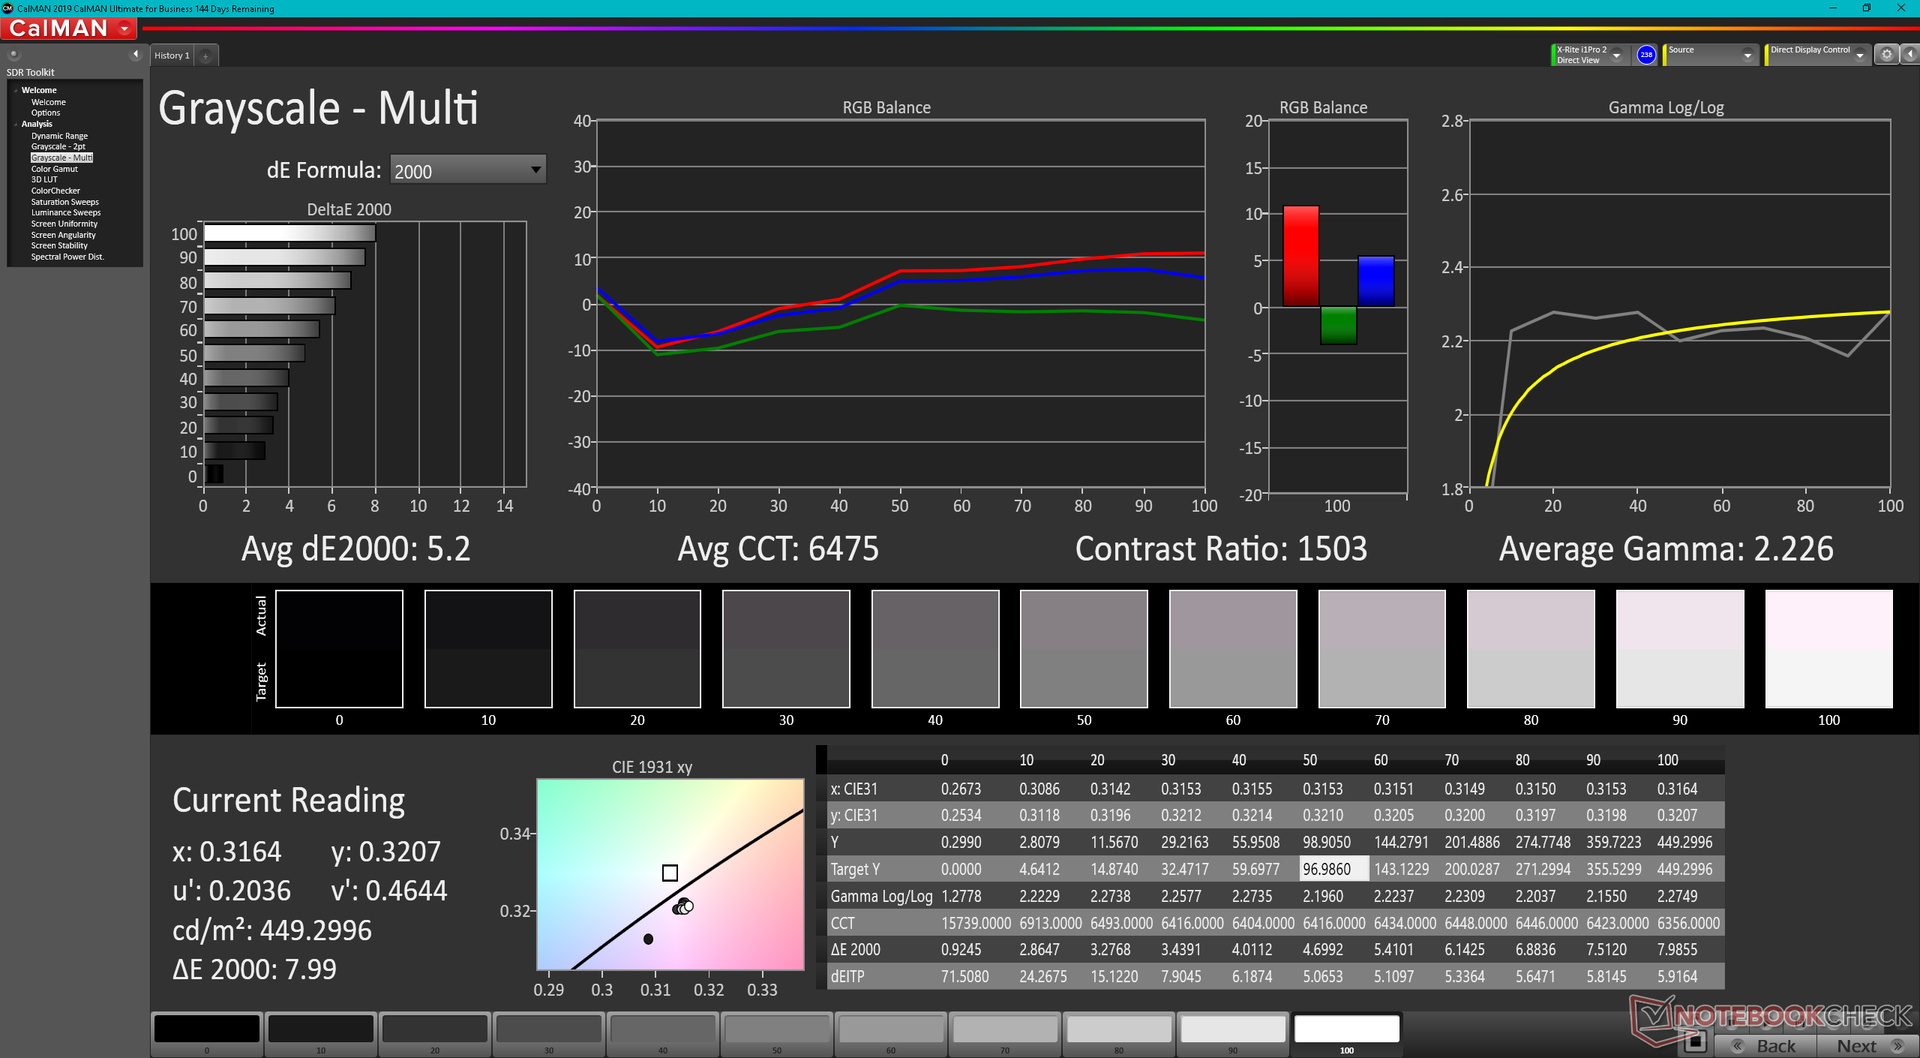
Brightness Distribution: 90 %
Center on Battery: 449.6 cd/m²
Contrast: 1450:1 (Black: 0.31 cd/m²)
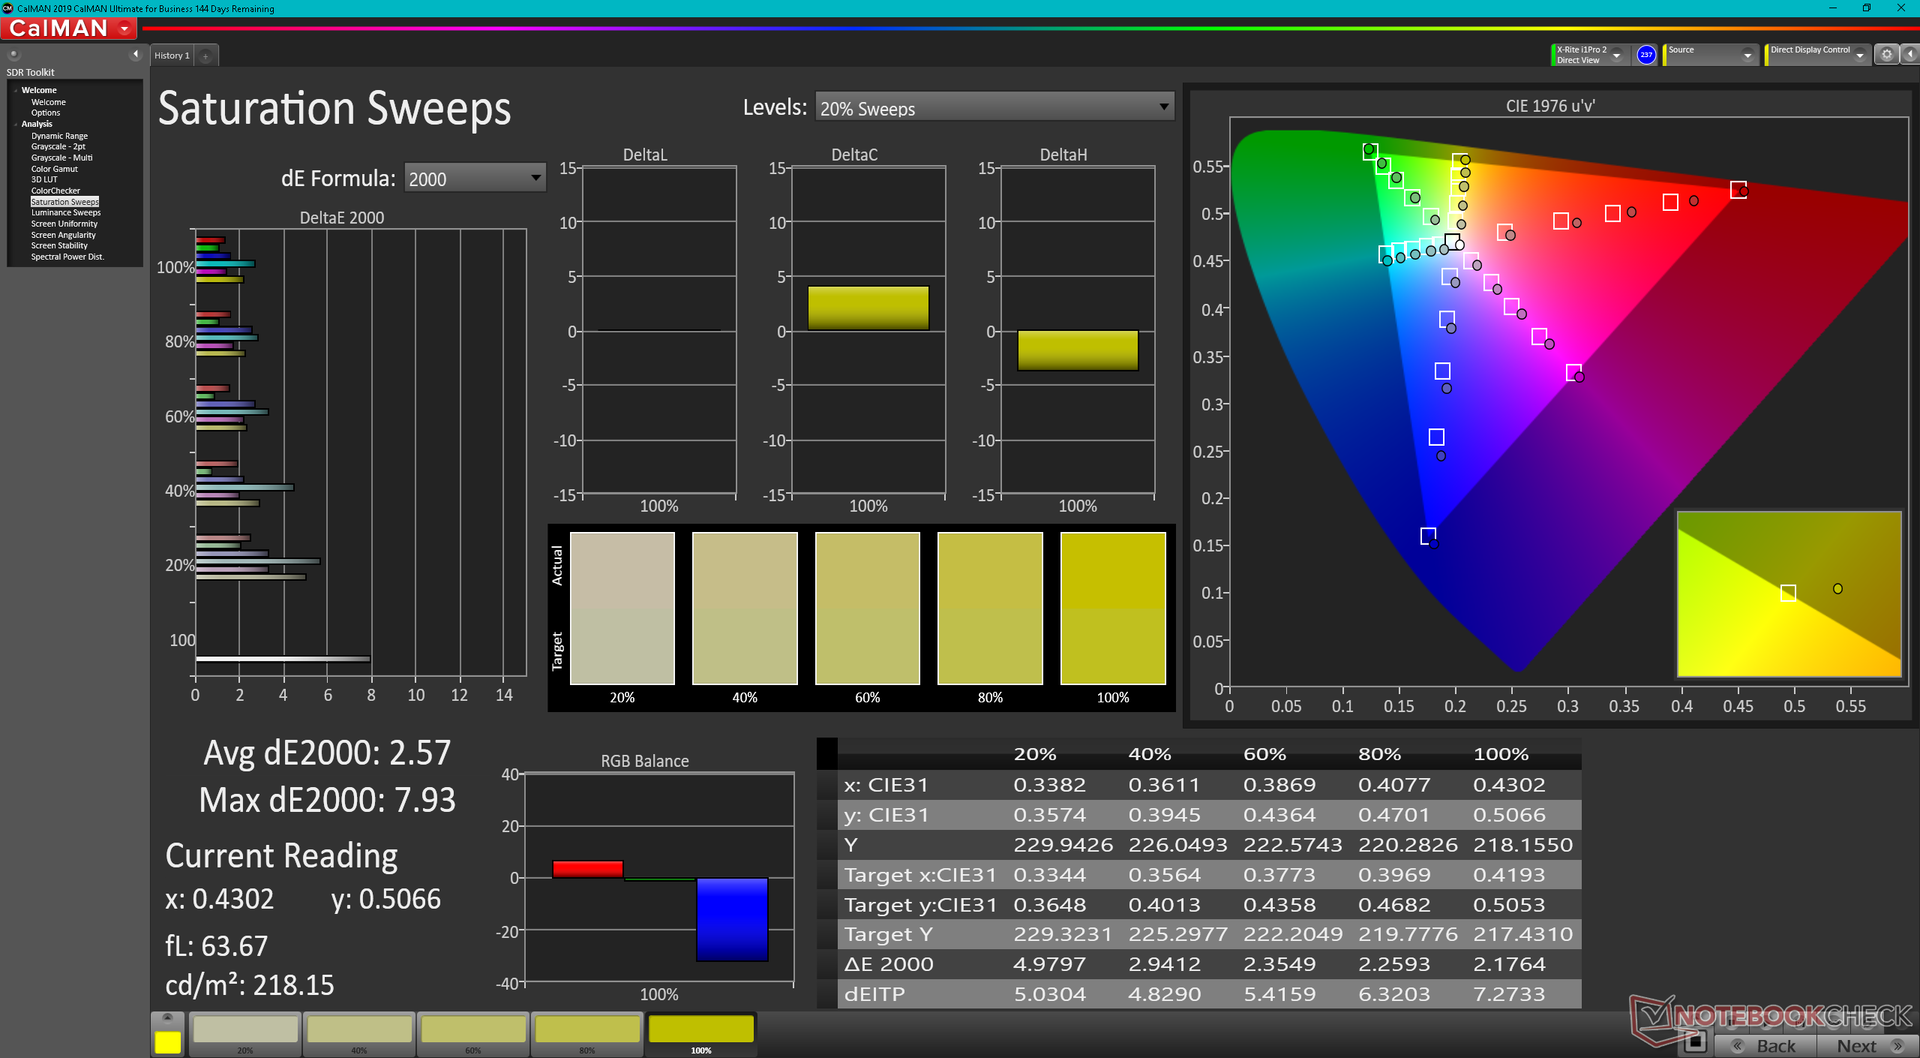
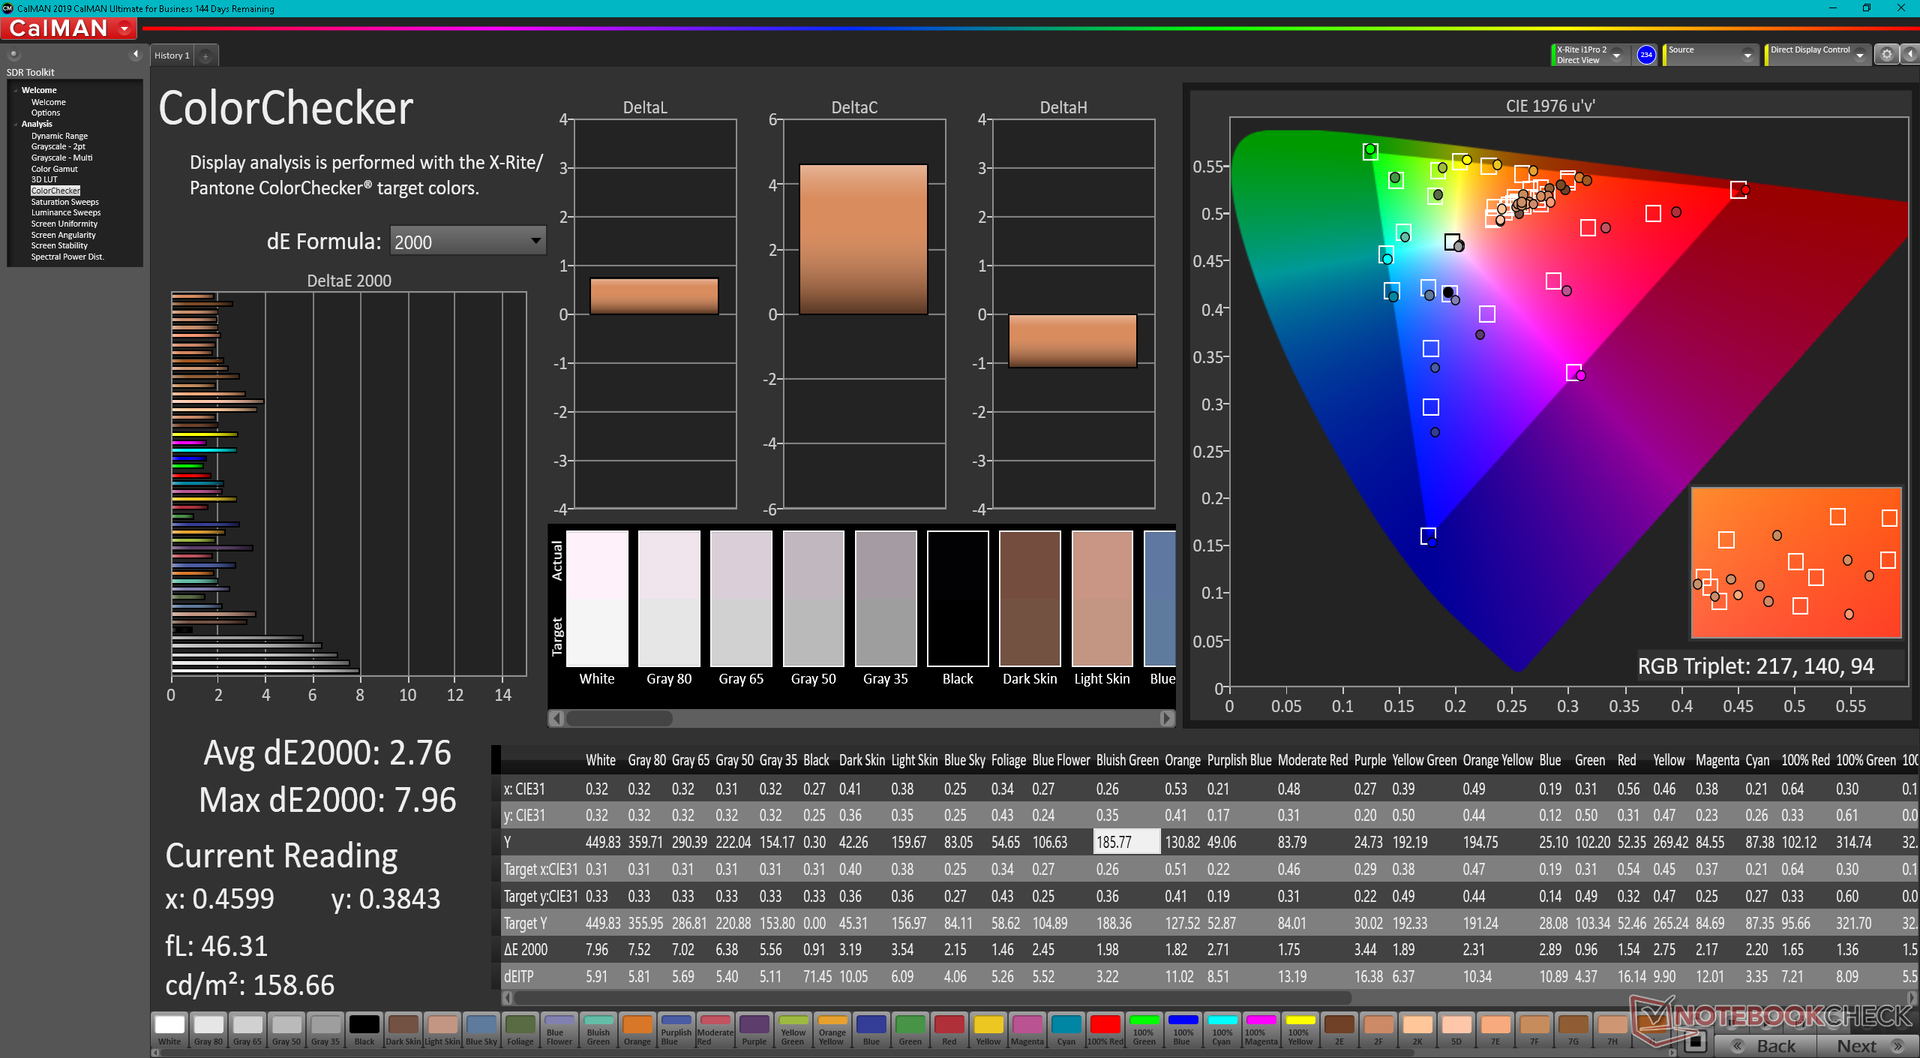
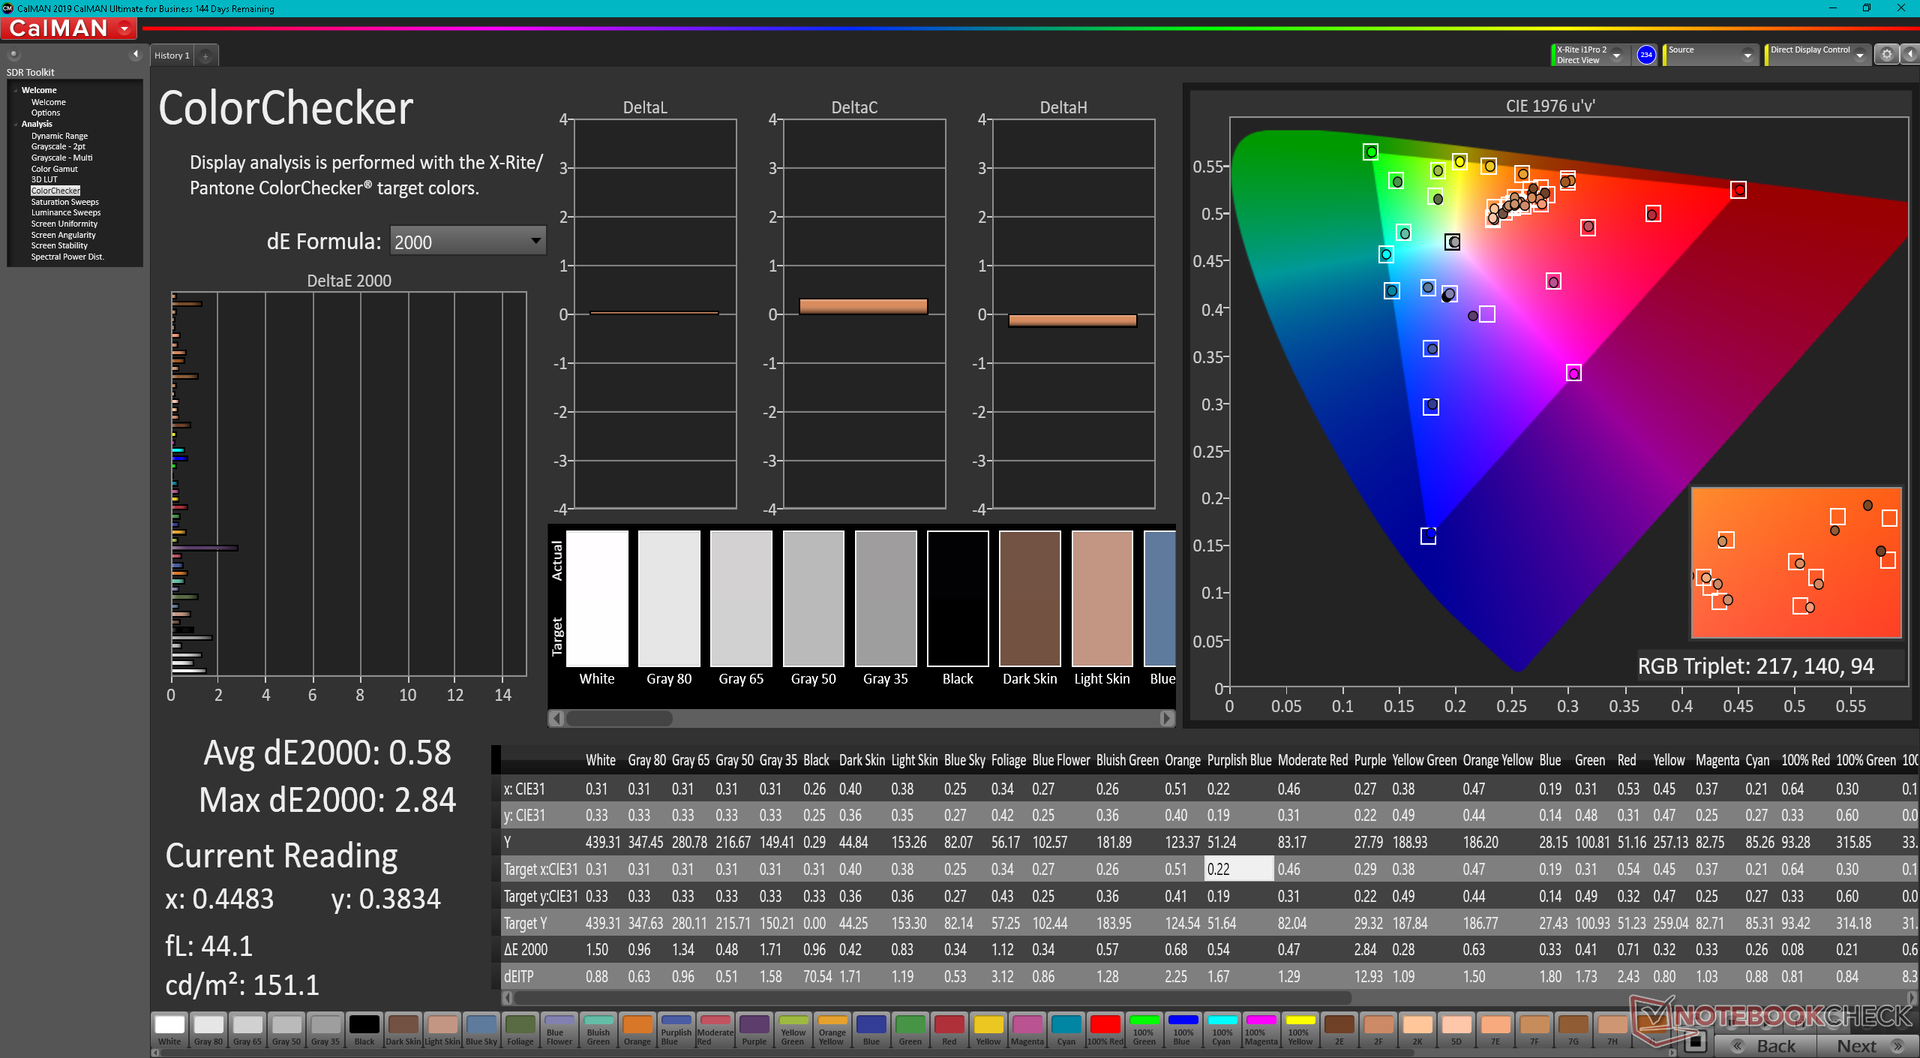
ΔE ColorChecker Calman: 2.76 | ∀{0.5-29.43 Ø4.81}
calibrated: 0.58
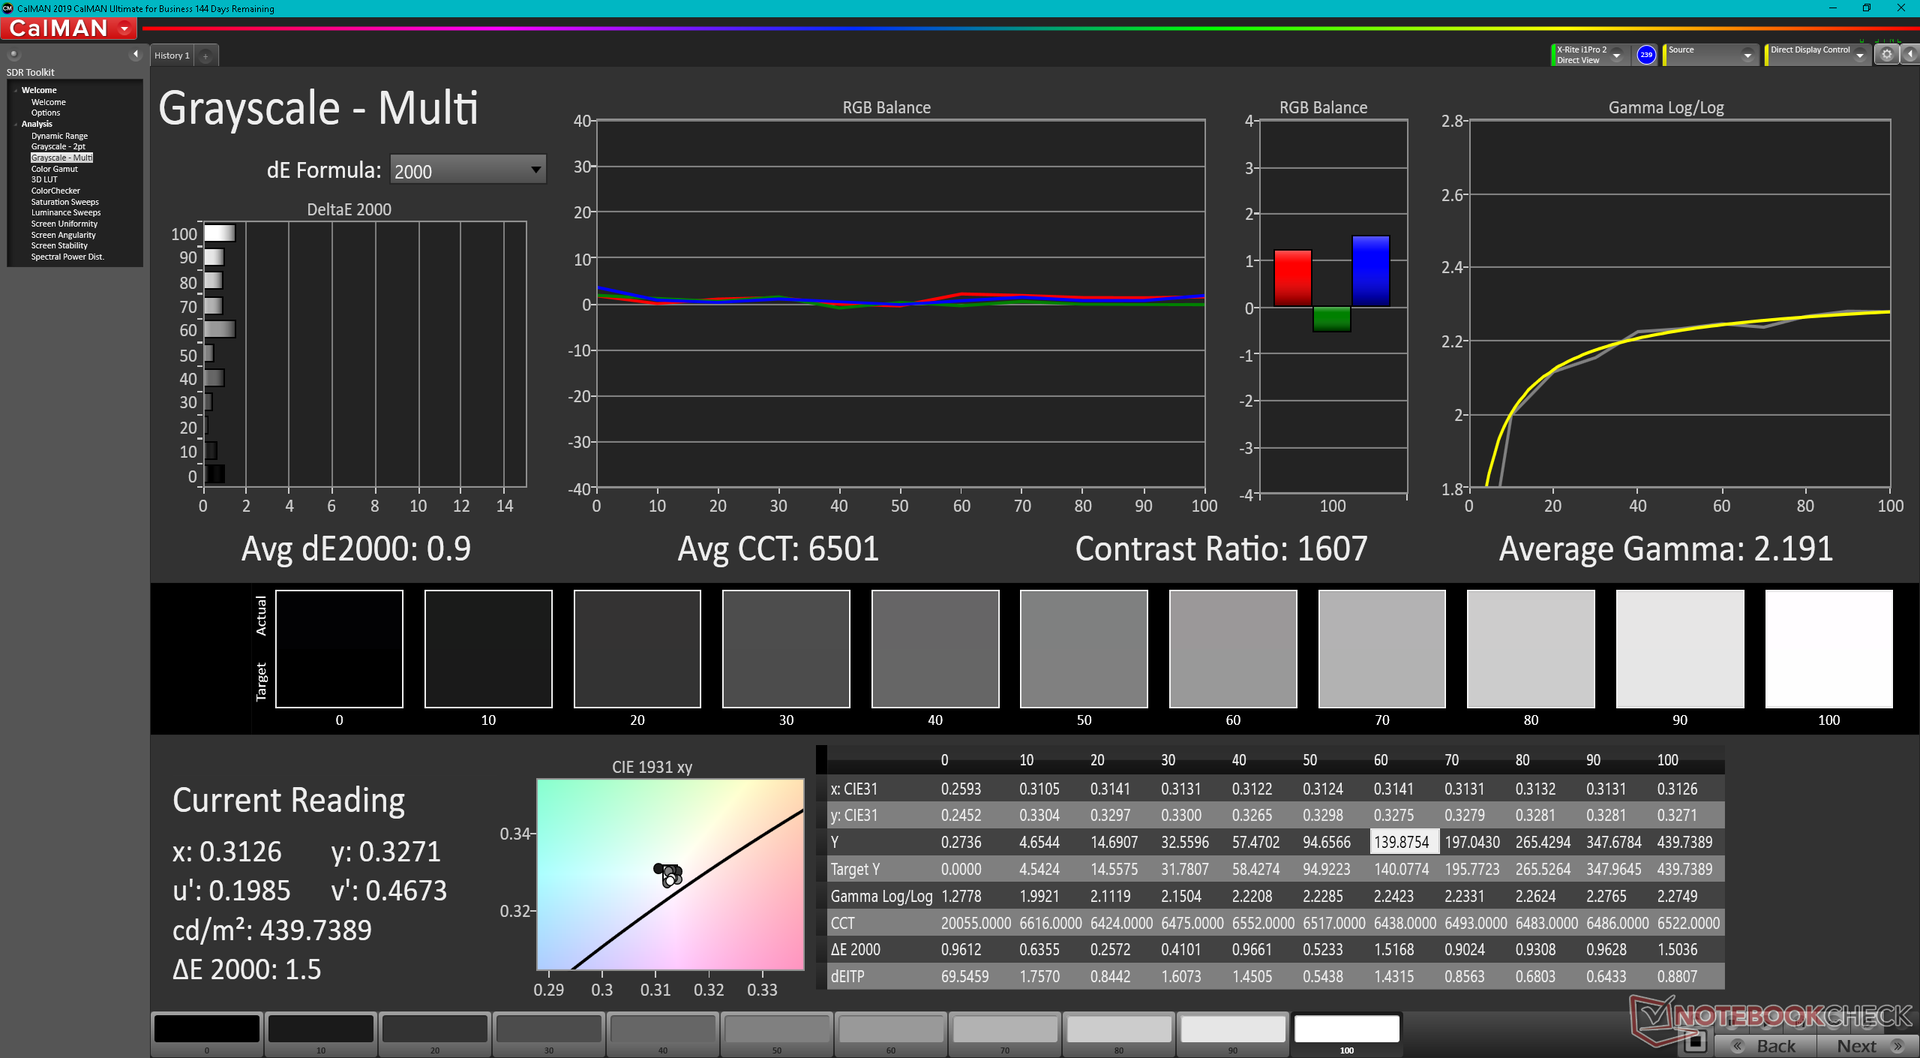
ΔE Greyscale Calman: 5.2 | ∀{0.09-98 Ø5.1}
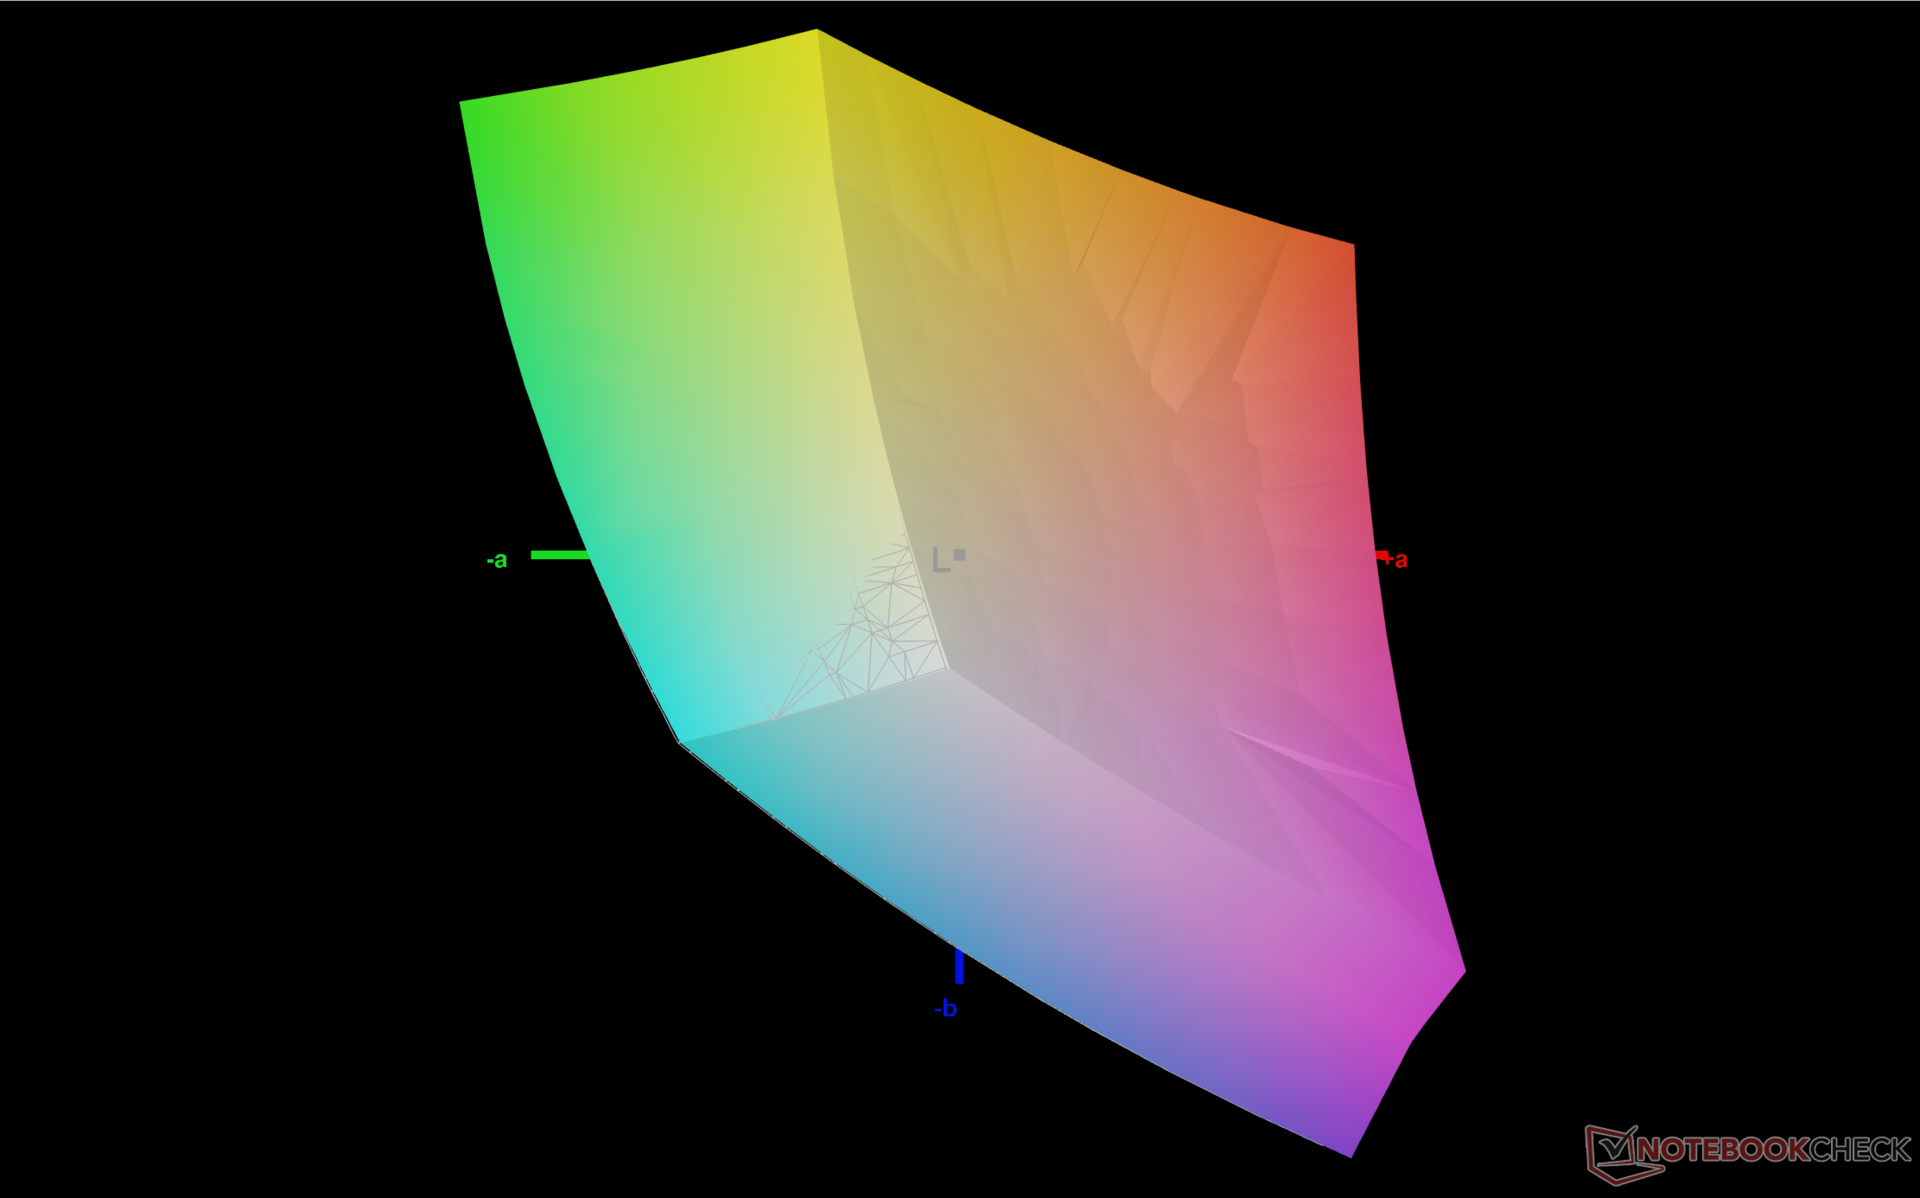
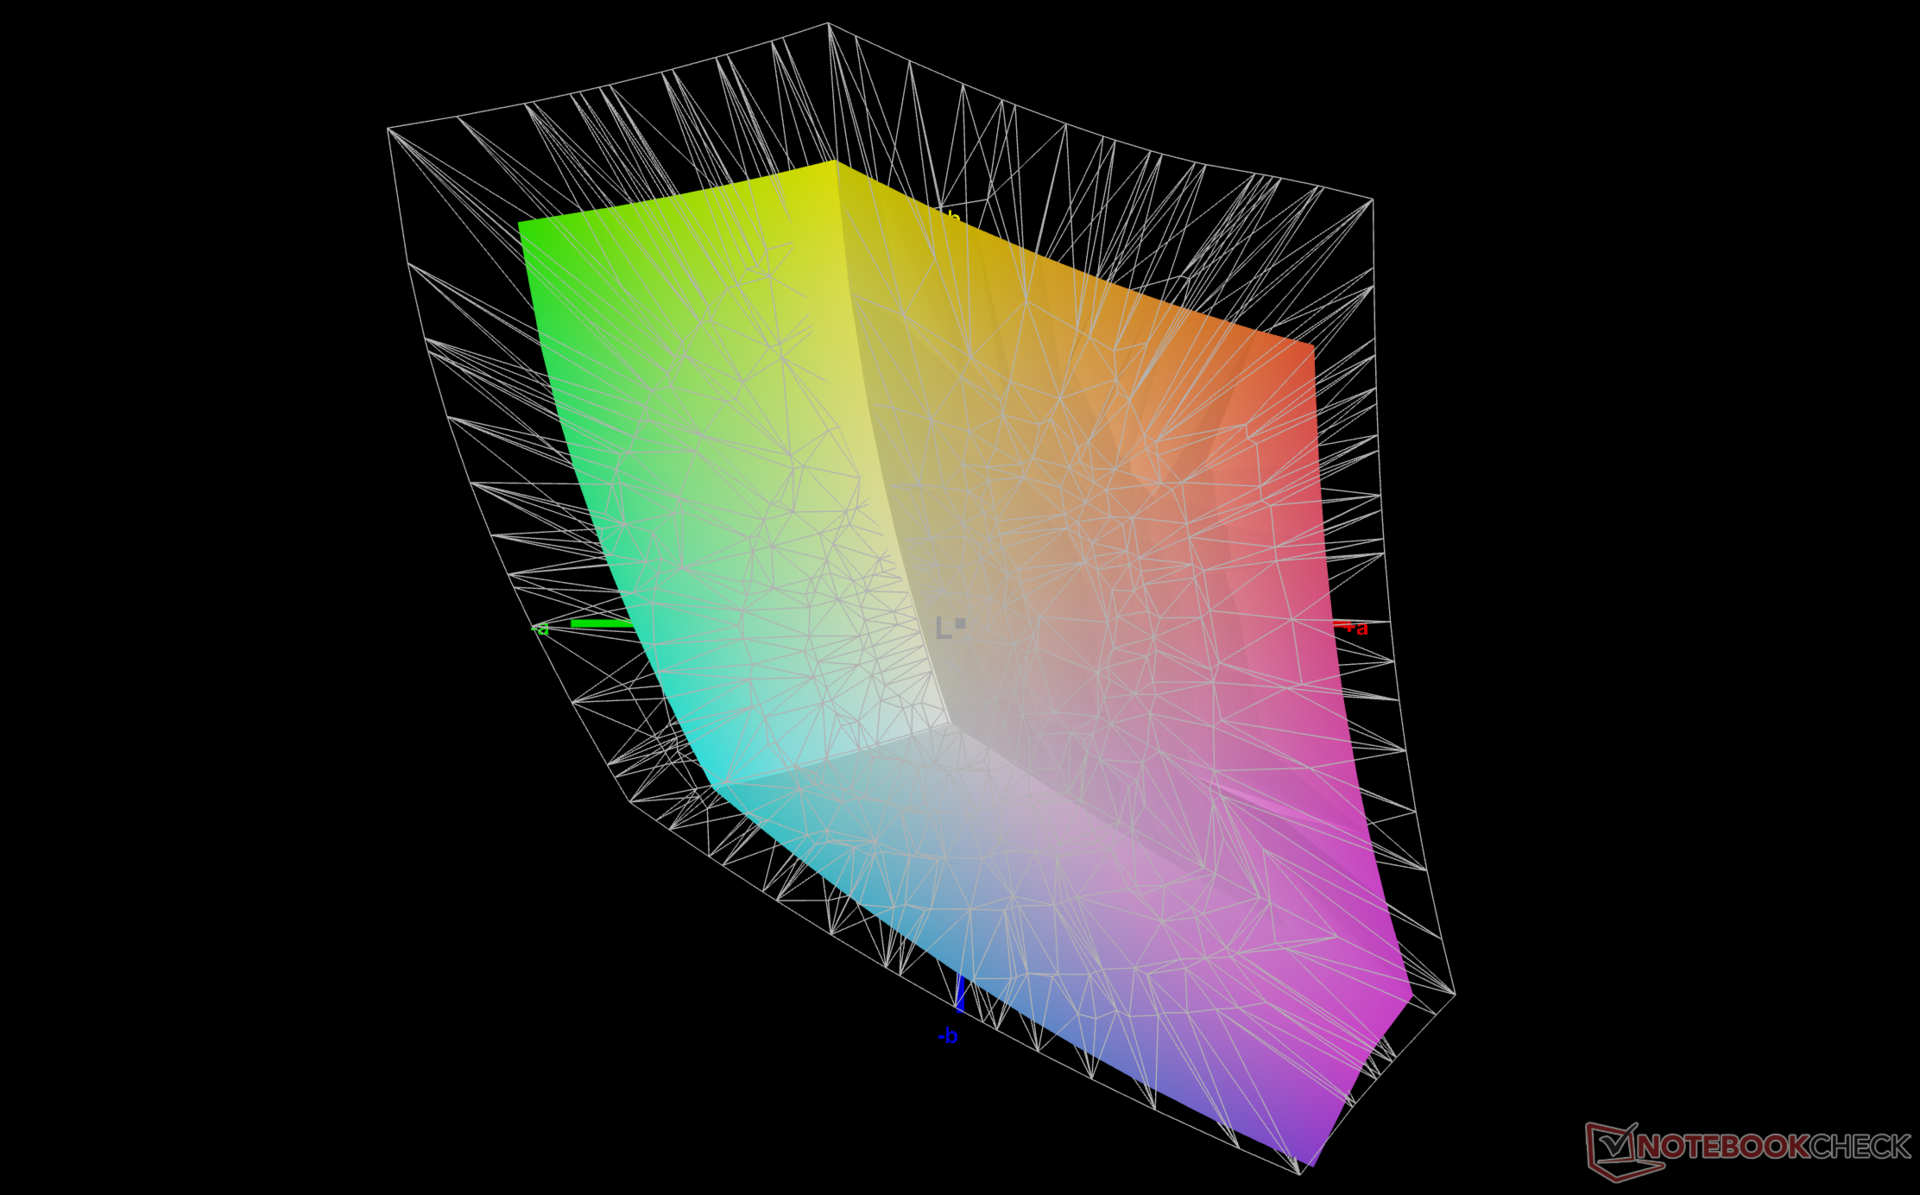
71.1% AdobeRGB 1998 (Argyll 3D)
99.4% sRGB (Argyll 3D)
69.9% Display P3 (Argyll 3D)
Gamma: 2.23
CCT: 6475 K
| Framework Laptop 13.5 12th Gen Intel BOE CQ NE135FBM-N41, IPS, 2256x1504, 13.5" | Framework Laptop 13.5 BOE CQ NE135FBM-N41, IPS, 2256x1504, 13.5" | Lenovo ThinkPad X1 Titanium Yoga G1 20QB0016GE LPM135M467, IPS LED, 2256x1504, 13.5" | HP EliteBook Folio 13.5-3G2L2EA LGD0663, IPS, 1920x1280, 13.5" | HP Spectre x360 14-ea0378ng Samsung SDC4148, OLED, 3000x2000, 13.5" | Microsoft Surface Laptop 4 13 i7 LQ135P1JX51, IPS, 2256x1504, 13.5" | |
|---|---|---|---|---|---|---|
| Display | -1% | -3% | 26% | -5% | ||
| Display P3 Coverage (%) | 69.9 | 69 -1% | 66.8 -4% | 99.9 43% | 64.7 -7% | |
| sRGB Coverage (%) | 99.4 | 99.3 0% | 98 -1% | 100 1% | 97.2 -2% | |
| AdobeRGB 1998 Coverage (%) | 71.1 | 70.3 -1% | 68.6 -4% | 96.1 35% | 66.9 -6% | |
| Response Times | -46% | -72% | -13% | 94% | -63% | |
| Response Time Grey 50% / Grey 80% * (ms) | 34.7 ? | 55.6 ? -60% | 64 ? -84% | 44 ? -27% | 2 ? 94% | 62.8 ? -81% |
| Response Time Black / White * (ms) | 27.5 ? | 36 ? -31% | 44 ? -60% | 27 ? 2% | 2 ? 93% | 39.8 ? -45% |
| PWM Frequency (Hz) | 250 ? | 21930 ? | ||||
| Screen | -8% | 14% | -9% | 259% | 3% | |
| Brightness middle (cd/m²) | 449.6 | 449 0% | 465 3% | 250 -44% | 370 -18% | 413 -8% |
| Brightness (cd/m²) | 431 | 435 1% | 451 5% | 226 -48% | 374 -13% | 400 -7% |
| Brightness Distribution (%) | 90 | 93 3% | 92 2% | 82 -9% | 90 0% | 94 4% |
| Black Level * (cd/m²) | 0.31 | 0.39 -26% | 0.28 10% | 0.215 31% | 0.01 97% | 0.29 6% |
| Contrast (:1) | 1450 | 1151 -21% | 1661 15% | 1163 -20% | 37000 2452% | 1424 -2% |
| Colorchecker dE 2000 * | 2.76 | 2.34 15% | 2 28% | 3.59 -30% | 2.57 7% | 2.8 -1% |
| Colorchecker dE 2000 max. * | 7.96 | 7.07 11% | 4.7 41% | 5.9 26% | 4.52 43% | 7.2 10% |
| Colorchecker dE 2000 calibrated * | 0.58 | 0.96 -66% | 0.7 -21% | 2.31 -298% | 0.8 -38% | |
| Greyscale dE 2000 * | 5.2 | 4.7 10% | 2.9 44% | 3.99 23% | 2.2 58% | 1.9 63% |
| Gamma | 2.23 99% | 2.29 96% | 2.09 105% | 2.98 74% | 2.36 93% | 2.12 104% |
| CCT | 6475 100% | 6760 96% | 6181 105% | 6765 96% | 6154 106% | 6510 100% |
| Color Space (Percent of AdobeRGB 1998) (%) | 85.8 | 61.6 | ||||
| Color Space (Percent of sRGB) (%) | 100 | 97.2 | ||||
| Total Average (Program / Settings) | -18% /
-12% | -20% /
-2% | -11% /
-10% | 126% /
185% | -22% /
-8% |
* ... smaller is better
The manufacturer does not calibrate its Framework Laptop at factory which is a shame since the panel offers full sRGB coverage. Average grayscale and color DeltaE values on our test unit would be 5.2 and 2.76 out-of-the-box, respectively, compared to just 0.9 and 0.58 after calibrating the panel ourselves. Color temperature in particular is far too warm without a proper calibration. We recommend applying our ICM profile above to get the most out of the display.
Display Response Times
| ↔ Response Time Black to White | ||
|---|---|---|
| 27.5 ms ... rise ↗ and fall ↘ combined | ↗ 14.8 ms rise | 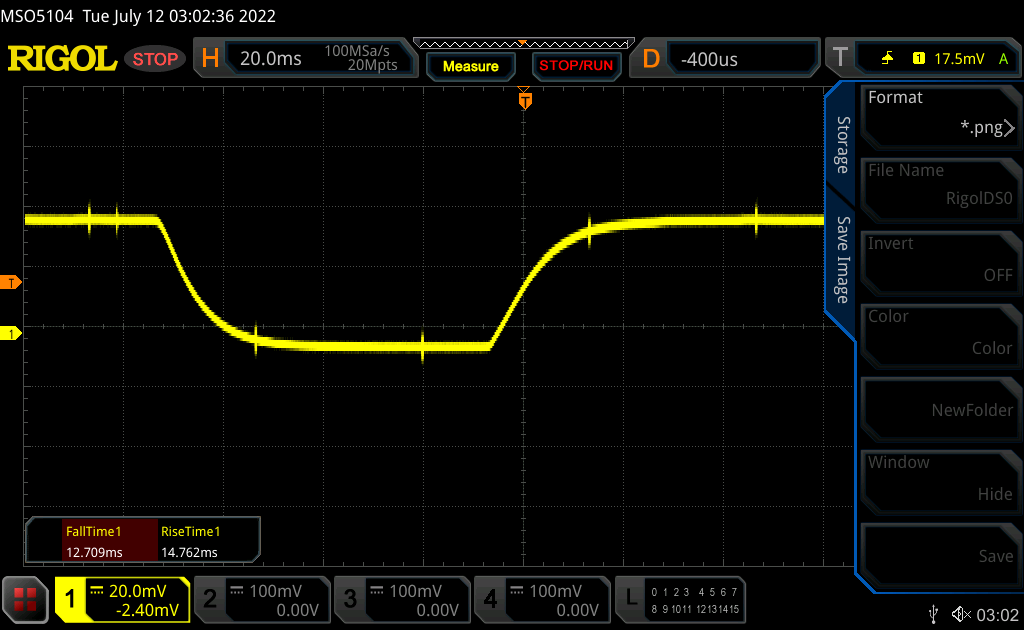 |
| ↘ 12.7 ms fall | ||
| The screen shows relatively slow response rates in our tests and may be too slow for gamers. In comparison, all tested devices range from 0.1 (minimum) to 240 (maximum) ms. » 69 % of all devices are better. This means that the measured response time is worse than the average of all tested devices (20.4 ms). | ||
| ↔ Response Time 50% Grey to 80% Grey | ||
| 34.7 ms ... rise ↗ and fall ↘ combined | ↗ 17.7 ms rise | 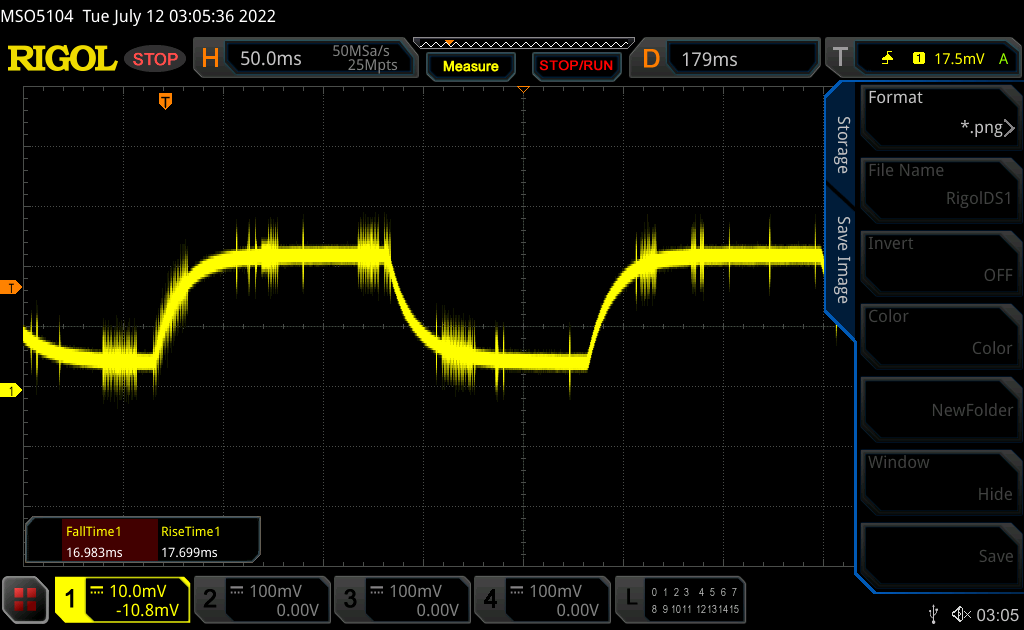 |
| ↘ 17 ms fall | ||
| The screen shows slow response rates in our tests and will be unsatisfactory for gamers. In comparison, all tested devices range from 0.165 (minimum) to 636 (maximum) ms. » 46 % of all devices are better. This means that the measured response time is similar to the average of all tested devices (31.9 ms). | ||
Screen Flickering / PWM (Pulse-Width Modulation)
| Screen flickering / PWM not detected | 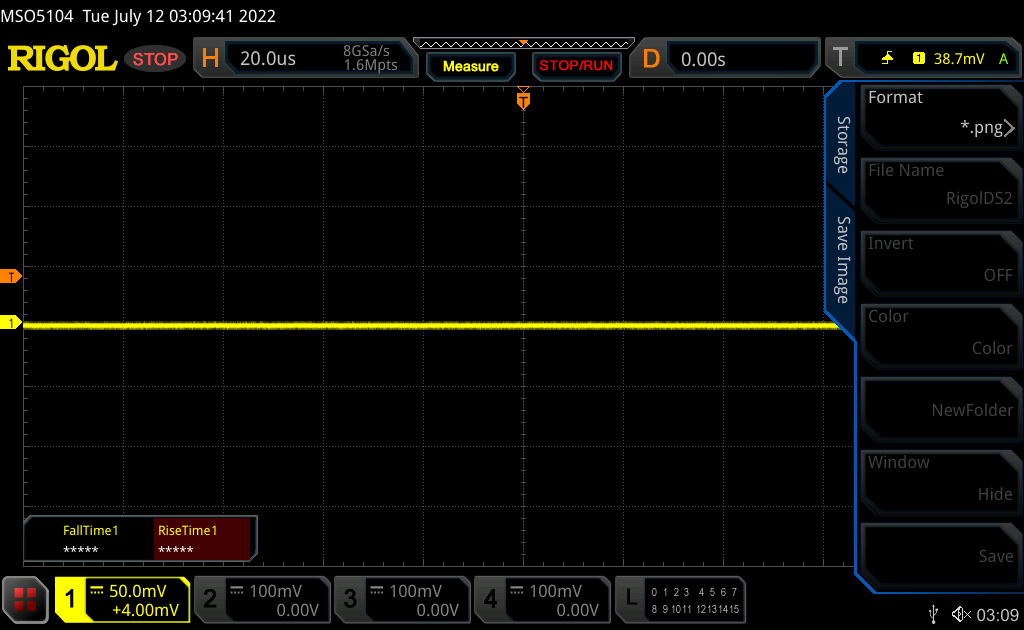 | ||
In comparison: 53 % of all tested devices do not use PWM to dim the display. If PWM was detected, an average of 8255 (minimum: 5 - maximum: 343500) Hz was measured. | |||

Performance
Testing Conditions
We set our unit to Performance mode via Windows prior to running any performance benchmarks below.
Processor
When compared to the Core i7-1165G7 in the original Framework Laptop, the Core i7-1260P in the 2022 Framework model can offer 20 percent and 90 percent faster single-thread and multi-thread performance, respectively. In fact, the Framework model runs 20 to 25 percent faster than the average laptop in our database running on the same Core i7-1260P CPU thus far. We're glad to see the manufacturer offering 12th gen P-series CPUs instead of the 12th gen U-series as the Core i5-1235U and i7-1255U offer much smaller performance benefits over the 11th gen U-series.
Downgrading to the Core i5-1240P option from our Core i7-1260P is expected to entail a 45 percent multi-thread performance deficit while upgrading to the Core i7-1280P would only increase performance by about 10 percent. As such, the Core i7-1260P SKU is the most recommended option.
Cinebench R15 Multi Loop
Cinebench R23: Multi Core | Single Core
Cinebench R15: CPU Multi 64Bit | CPU Single 64Bit
Blender: v2.79 BMW27 CPU
7-Zip 18.03: 7z b 4 | 7z b 4 -mmt1
Geekbench 5.5: Multi-Core | Single-Core
HWBOT x265 Benchmark v2.2: 4k Preset
LibreOffice : 20 Documents To PDF
R Benchmark 2.5: Overall mean
Cinebench R23: Multi Core | Single Core
Cinebench R15: CPU Multi 64Bit | CPU Single 64Bit
Blender: v2.79 BMW27 CPU
7-Zip 18.03: 7z b 4 | 7z b 4 -mmt1
Geekbench 5.5: Multi-Core | Single-Core
HWBOT x265 Benchmark v2.2: 4k Preset
LibreOffice : 20 Documents To PDF
R Benchmark 2.5: Overall mean
* ... smaller is better
AIDA64: FP32 Ray-Trace | FPU Julia | CPU SHA3 | CPU Queen | FPU SinJulia | FPU Mandel | CPU AES | CPU ZLib | FP64 Ray-Trace | CPU PhotoWorxx
| Performance Rating | |
| Microsoft Surface Laptop 4 13 Ryzen 5 | |
| Framework Laptop 13.5 12th Gen Intel | |
| Average Intel Core i7-1260P | |
| Framework Laptop 13.5 | |
| HP Spectre x360 14-ea0378ng | |
| Lenovo ThinkPad X1 Titanium Yoga G1 20QB0016GE | |
| AIDA64 / FP32 Ray-Trace | |
| Microsoft Surface Laptop 4 13 Ryzen 5 | |
| Framework Laptop 13.5 | |
| Average Intel Core i7-1260P (2176 - 10898, n=26) | |
| Framework Laptop 13.5 12th Gen Intel | |
| HP Spectre x360 14-ea0378ng | |
| Lenovo ThinkPad X1 Titanium Yoga G1 20QB0016GE | |
| AIDA64 / FPU Julia | |
| Microsoft Surface Laptop 4 13 Ryzen 5 | |
| Average Intel Core i7-1260P (11015 - 56906, n=26) | |
| Framework Laptop 13.5 | |
| Framework Laptop 13.5 12th Gen Intel | |
| Lenovo ThinkPad X1 Titanium Yoga G1 20QB0016GE | |
| HP Spectre x360 14-ea0378ng | |
| AIDA64 / CPU SHA3 | |
| Framework Laptop 13.5 | |
| Framework Laptop 13.5 12th Gen Intel | |
| Average Intel Core i7-1260P (669 - 2709, n=26) | |
| Microsoft Surface Laptop 4 13 Ryzen 5 | |
| Lenovo ThinkPad X1 Titanium Yoga G1 20QB0016GE | |
| HP Spectre x360 14-ea0378ng | |
| AIDA64 / CPU Queen | |
| Framework Laptop 13.5 12th Gen Intel | |
| Average Intel Core i7-1260P (42571 - 82493, n=26) | |
| Microsoft Surface Laptop 4 13 Ryzen 5 | |
| HP Spectre x360 14-ea0378ng | |
| Framework Laptop 13.5 | |
| Lenovo ThinkPad X1 Titanium Yoga G1 20QB0016GE | |
| AIDA64 / FPU SinJulia | |
| Microsoft Surface Laptop 4 13 Ryzen 5 | |
| Framework Laptop 13.5 12th Gen Intel | |
| Average Intel Core i7-1260P (2901 - 6975, n=26) | |
| Framework Laptop 13.5 | |
| HP Spectre x360 14-ea0378ng | |
| Lenovo ThinkPad X1 Titanium Yoga G1 20QB0016GE | |
| AIDA64 / FPU Mandel | |
| Microsoft Surface Laptop 4 13 Ryzen 5 | |
| Framework Laptop 13.5 | |
| Average Intel Core i7-1260P (5950 - 26376, n=26) | |
| Framework Laptop 13.5 12th Gen Intel | |
| HP Spectre x360 14-ea0378ng | |
| Lenovo ThinkPad X1 Titanium Yoga G1 20QB0016GE | |
| AIDA64 / CPU AES | |
| Framework Laptop 13.5 | |
| Framework Laptop 13.5 12th Gen Intel | |
| Lenovo ThinkPad X1 Titanium Yoga G1 20QB0016GE | |
| HP Spectre x360 14-ea0378ng | |
| Average Intel Core i7-1260P (16041 - 92356, n=26) | |
| Microsoft Surface Laptop 4 13 Ryzen 5 | |
| AIDA64 / CPU ZLib | |
| Framework Laptop 13.5 12th Gen Intel | |
| Average Intel Core i7-1260P (259 - 771, n=26) | |
| Microsoft Surface Laptop 4 13 Ryzen 5 | |
| Framework Laptop 13.5 | |
| HP Spectre x360 14-ea0378ng | |
| Lenovo ThinkPad X1 Titanium Yoga G1 20QB0016GE | |
| AIDA64 / FP64 Ray-Trace | |
| Microsoft Surface Laptop 4 13 Ryzen 5 | |
| Framework Laptop 13.5 | |
| Average Intel Core i7-1260P (1237 - 5858, n=26) | |
| Framework Laptop 13.5 12th Gen Intel | |
| HP Spectre x360 14-ea0378ng | |
| Lenovo ThinkPad X1 Titanium Yoga G1 20QB0016GE | |
| AIDA64 / CPU PhotoWorxx | |
| HP Spectre x360 14-ea0378ng | |
| Lenovo ThinkPad X1 Titanium Yoga G1 20QB0016GE | |
| Average Intel Core i7-1260P (13261 - 43652, n=26) | |
| Framework Laptop 13.5 12th Gen Intel | |
| Microsoft Surface Laptop 4 13 Ryzen 5 | |
| Framework Laptop 13.5 | |
System Performance
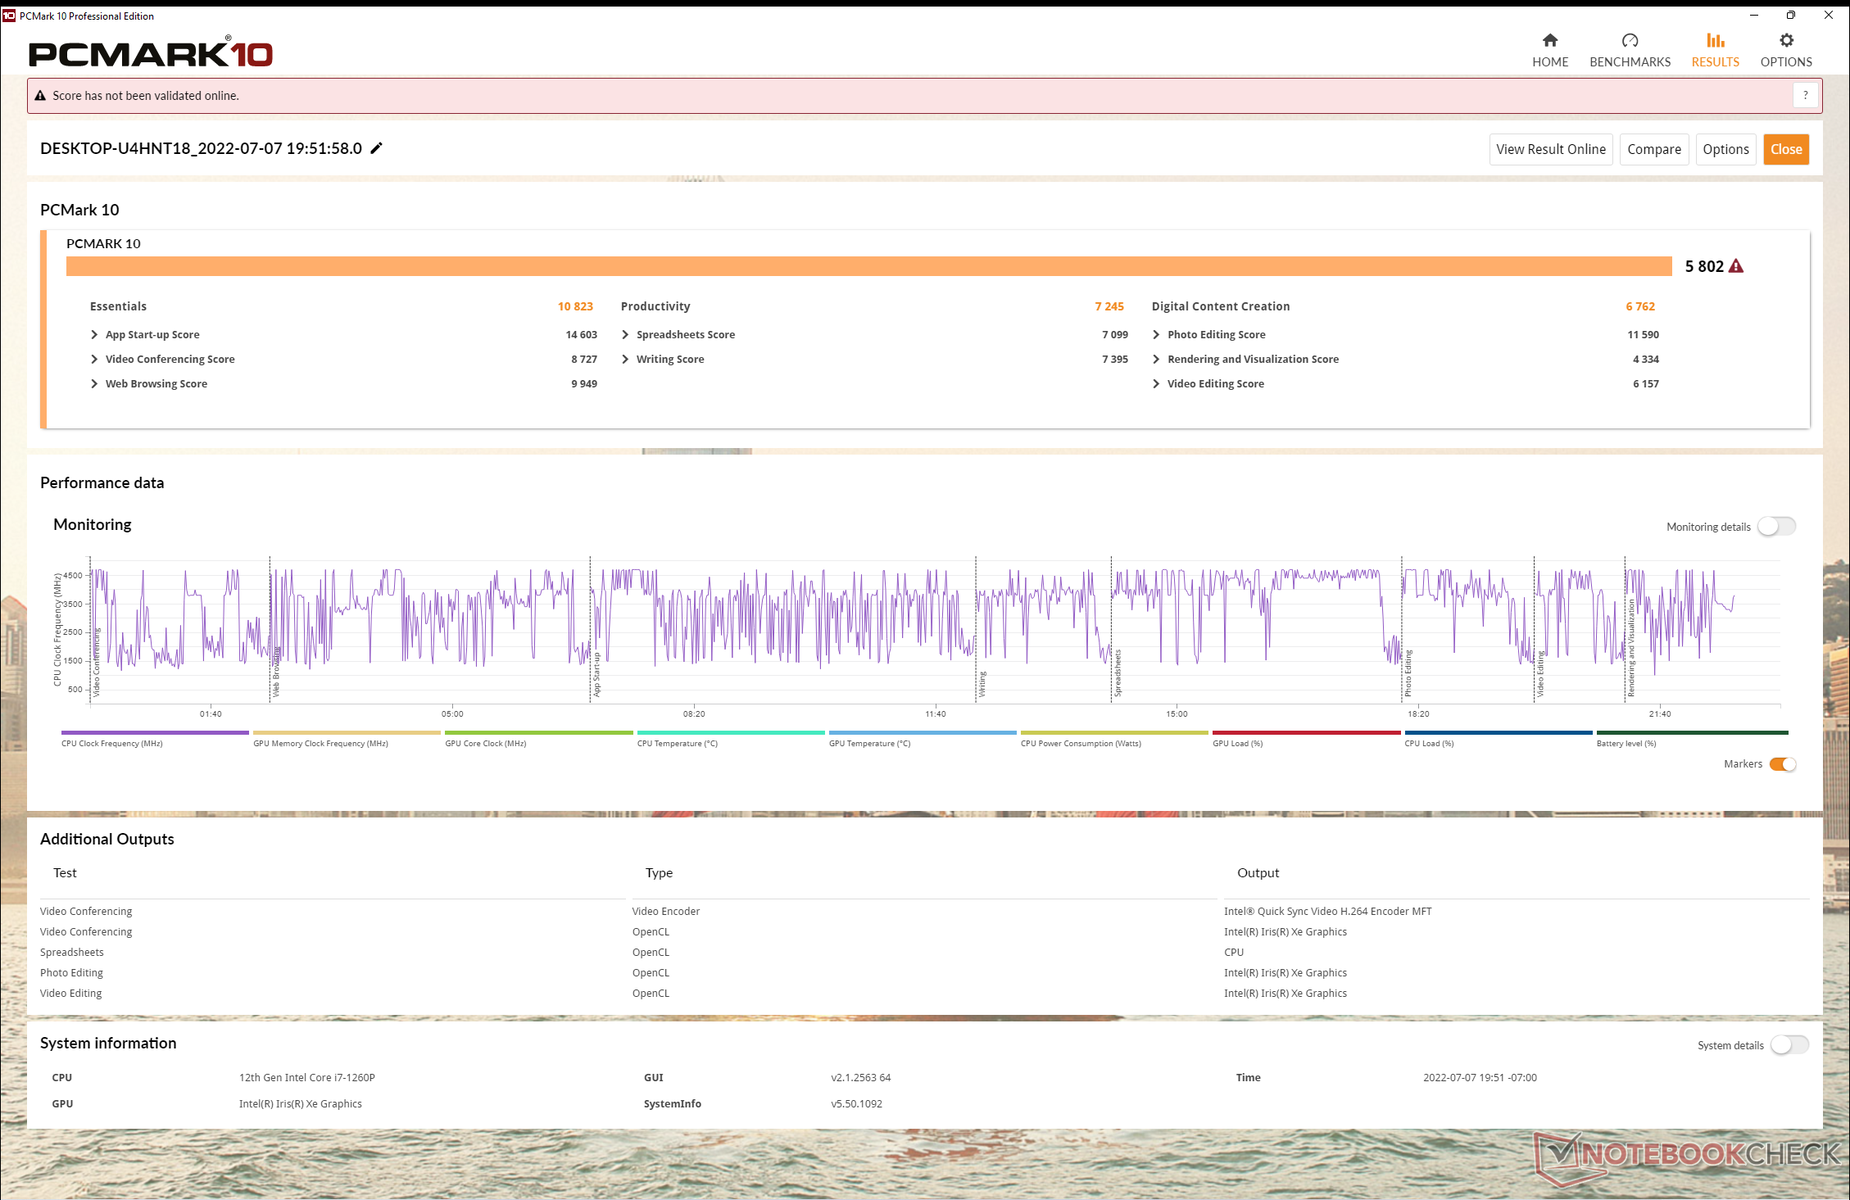
PCMark 10 results are consistently higher than on last year's Framework Laptop and most other Ultrabooks running on 11th gen or older CPUs for that matter.
CrossMark: Overall | Productivity | Creativity | Responsiveness
| PCMark 10 / Score | |
| Framework Laptop 13.5 12th Gen Intel | |
| Average Intel Core i7-1260P, Intel Iris Xe Graphics G7 96EUs (4796 - 6068, n=17) | |
| Framework Laptop 13.5 | |
| Microsoft Surface Laptop 4 13 Ryzen 5 | |
| HP Spectre x360 14-ea0378ng | |
| Lenovo ThinkPad X1 Titanium Yoga G1 20QB0016GE | |
| PCMark 10 / Essentials | |
| Framework Laptop 13.5 12th Gen Intel | |
| Average Intel Core i7-1260P, Intel Iris Xe Graphics G7 96EUs (9260 - 11251, n=17) | |
| Framework Laptop 13.5 | |
| Lenovo ThinkPad X1 Titanium Yoga G1 20QB0016GE | |
| HP Spectre x360 14-ea0378ng | |
| Microsoft Surface Laptop 4 13 Ryzen 5 | |
| PCMark 10 / Productivity | |
| Framework Laptop 13.5 12th Gen Intel | |
| Average Intel Core i7-1260P, Intel Iris Xe Graphics G7 96EUs (6167 - 8629, n=17) | |
| Microsoft Surface Laptop 4 13 Ryzen 5 | |
| HP Spectre x360 14-ea0378ng | |
| Lenovo ThinkPad X1 Titanium Yoga G1 20QB0016GE | |
| Framework Laptop 13.5 | |
| PCMark 10 / Digital Content Creation | |
| Framework Laptop 13.5 12th Gen Intel | |
| Average Intel Core i7-1260P, Intel Iris Xe Graphics G7 96EUs (5231 - 6908, n=17) | |
| Framework Laptop 13.5 | |
| Microsoft Surface Laptop 4 13 Ryzen 5 | |
| HP Spectre x360 14-ea0378ng | |
| Lenovo ThinkPad X1 Titanium Yoga G1 20QB0016GE | |
| CrossMark / Overall | |
| Framework Laptop 13.5 12th Gen Intel | |
| Average Intel Core i7-1260P, Intel Iris Xe Graphics G7 96EUs (1484 - 1811, n=16) | |
| CrossMark / Productivity | |
| Framework Laptop 13.5 12th Gen Intel | |
| Average Intel Core i7-1260P, Intel Iris Xe Graphics G7 96EUs (1486 - 1755, n=16) | |
| CrossMark / Creativity | |
| Framework Laptop 13.5 12th Gen Intel | |
| Average Intel Core i7-1260P, Intel Iris Xe Graphics G7 96EUs (1451 - 1872, n=16) | |
| CrossMark / Responsiveness | |
| Framework Laptop 13.5 12th Gen Intel | |
| Average Intel Core i7-1260P, Intel Iris Xe Graphics G7 96EUs (1253 - 1807, n=16) | |
| PCMark 10 Score | 5802 points | |
Help | ||
| AIDA64 / Memory Copy | |
| HP Spectre x360 14-ea0378ng | |
| Lenovo ThinkPad X1 Titanium Yoga G1 20QB0016GE | |
| Average Intel Core i7-1260P (25125 - 71544, n=25) | |
| Framework Laptop 13.5 12th Gen Intel | |
| Microsoft Surface Laptop 4 13 Ryzen 5 | |
| Framework Laptop 13.5 | |
| AIDA64 / Memory Read | |
| Lenovo ThinkPad X1 Titanium Yoga G1 20QB0016GE | |
| Average Intel Core i7-1260P (24983 - 72065, n=25) | |
| HP Spectre x360 14-ea0378ng | |
| Framework Laptop 13.5 12th Gen Intel | |
| Microsoft Surface Laptop 4 13 Ryzen 5 | |
| Framework Laptop 13.5 | |
| AIDA64 / Memory Write | |
| Lenovo ThinkPad X1 Titanium Yoga G1 20QB0016GE | |
| HP Spectre x360 14-ea0378ng | |
| Average Intel Core i7-1260P (23512 - 66799, n=25) | |
| Framework Laptop 13.5 12th Gen Intel | |
| Microsoft Surface Laptop 4 13 Ryzen 5 | |
| Framework Laptop 13.5 | |
| AIDA64 / Memory Latency | |
| Microsoft Surface Laptop 4 13 Ryzen 5 | |
| Lenovo ThinkPad X1 Titanium Yoga G1 20QB0016GE | |
| HP Spectre x360 14-ea0378ng | |
| Framework Laptop 13.5 12th Gen Intel | |
| Average Intel Core i7-1260P (77.9 - 118.4, n=21) | |
| Framework Laptop 13.5 | |
* ... smaller is better
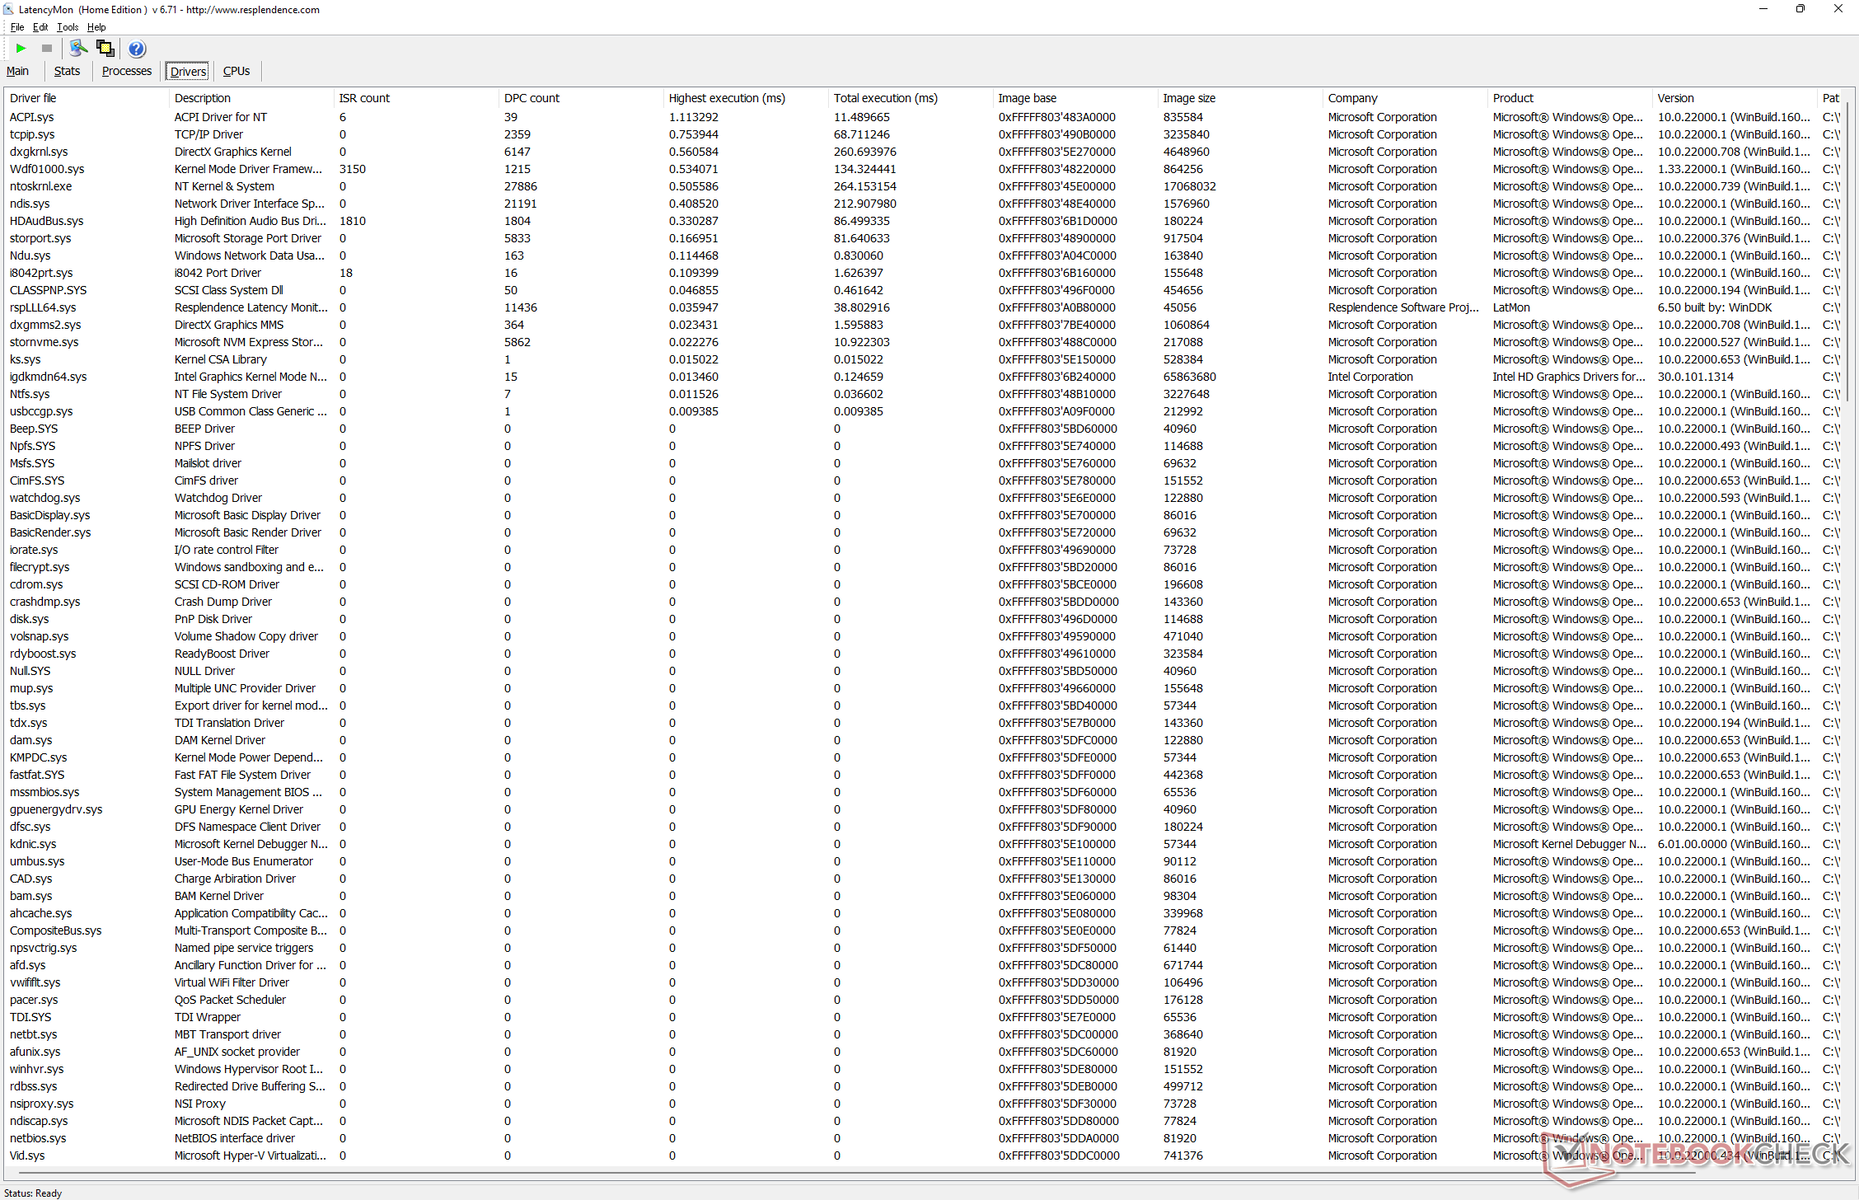
DPC Latency
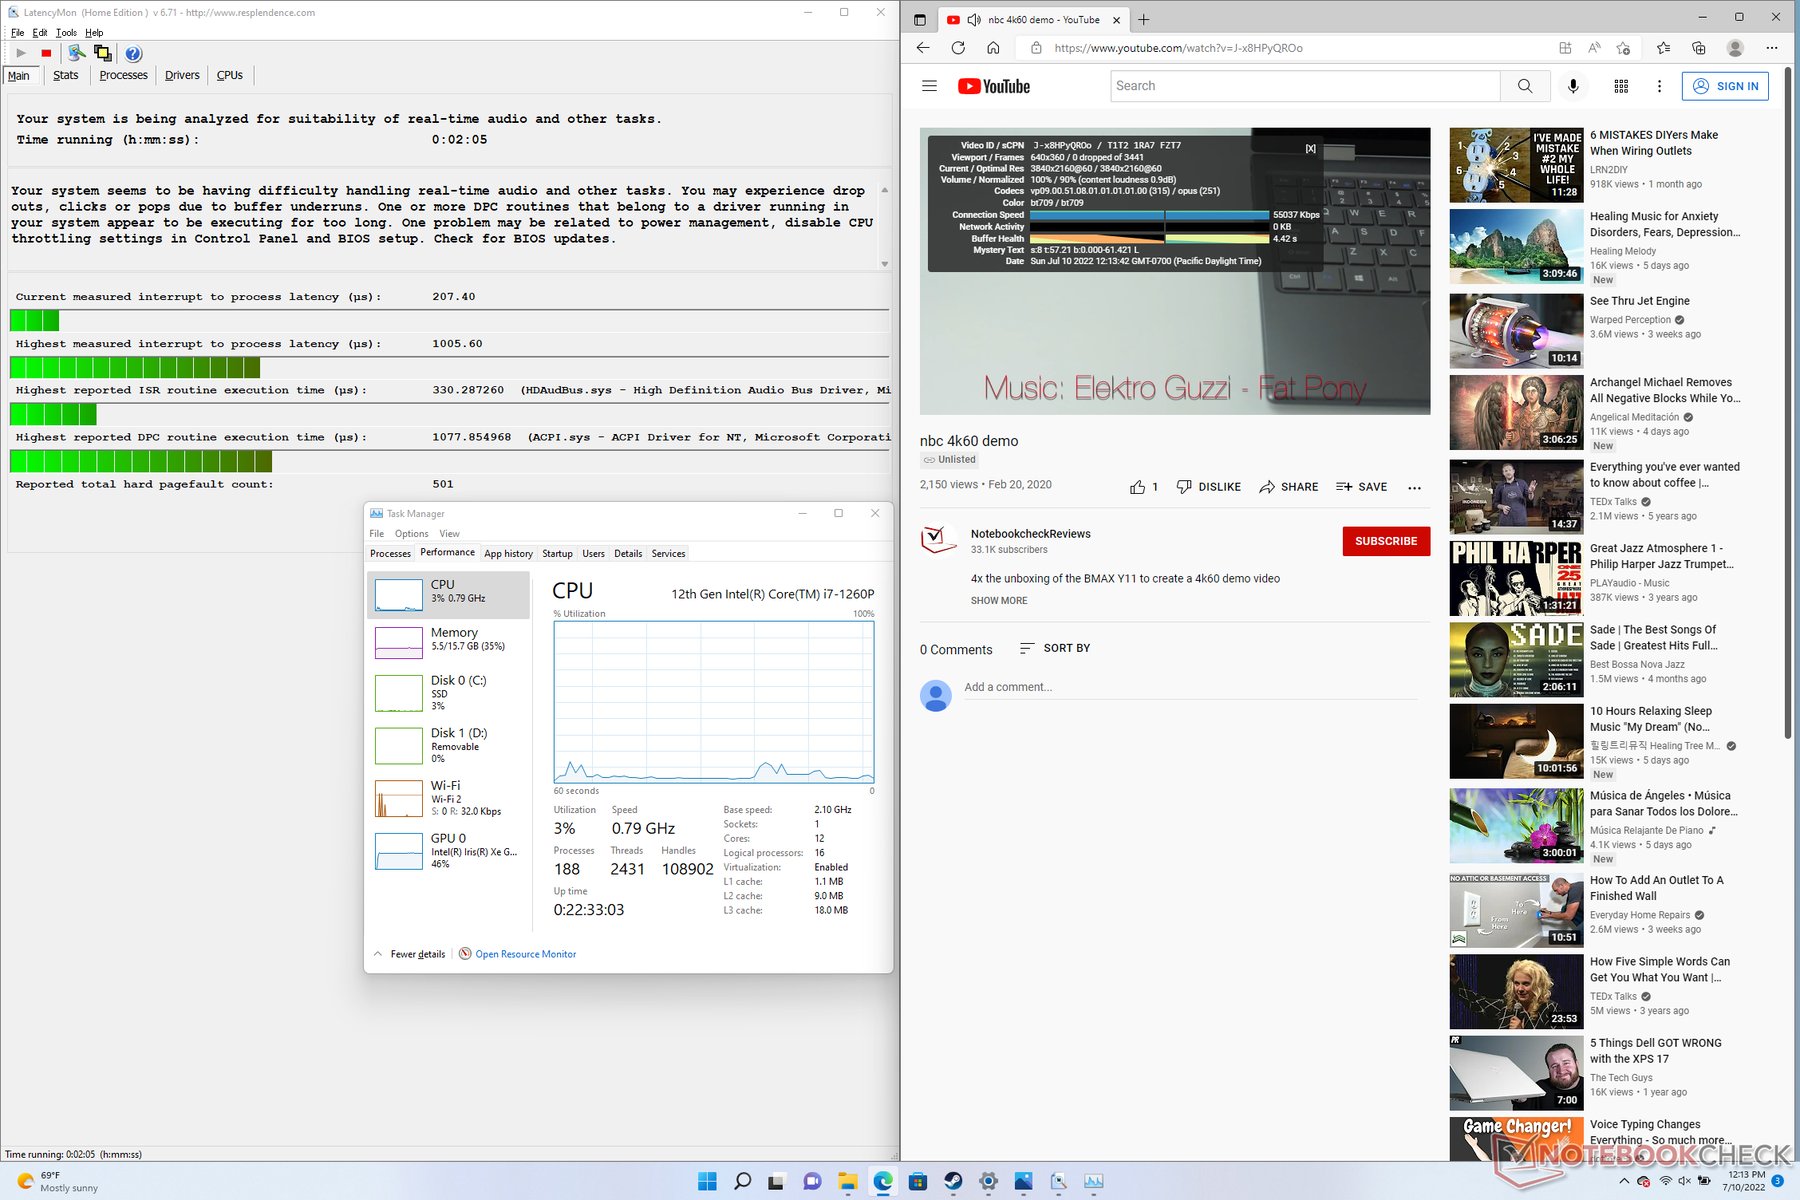
LatencyMon reveals minor DPC issues when opening multiple browser tabs of our homepage. 4K video playback at 60 FPS is otherwise perfect and with no dropped frames.
| DPC Latencies / LatencyMon - interrupt to process latency (max), Web, Youtube, Prime95 | |
| Framework Laptop 13.5 | |
| HP Spectre x360 14-ea0378ng | |
| Framework Laptop 13.5 12th Gen Intel | |
| Microsoft Surface Laptop 4 13 Ryzen 5 | |
| Lenovo ThinkPad X1 Titanium Yoga G1 20QB0016GE | |
* ... smaller is better
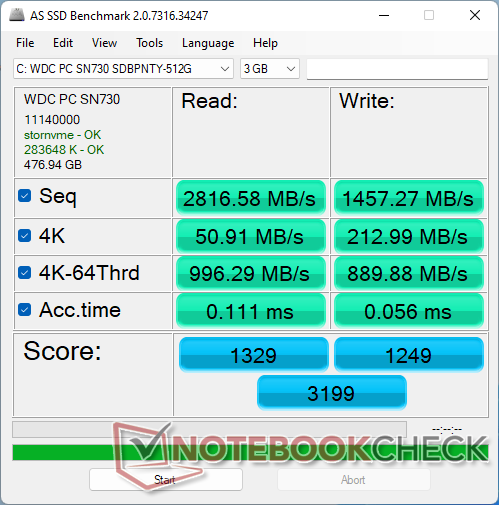
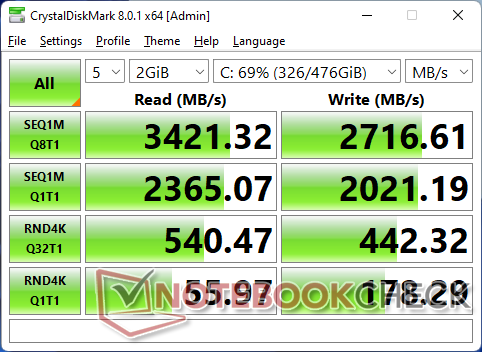
Storage Devices
While our 2021 Framework unit would ship with a PCIe4 x4 WD SN850 M.2 NVMe SSD, our 2022 unit would ship with a slower PCIe3 x4 WD SN730 SSD instead. Users can still upgrade to a faster PCIe4 x4 SSD, of course.
Only one internal drive is supported.

* ... smaller is better
Disk Throttling: DiskSpd Read Loop, Queue Depth 8
GPU Performance
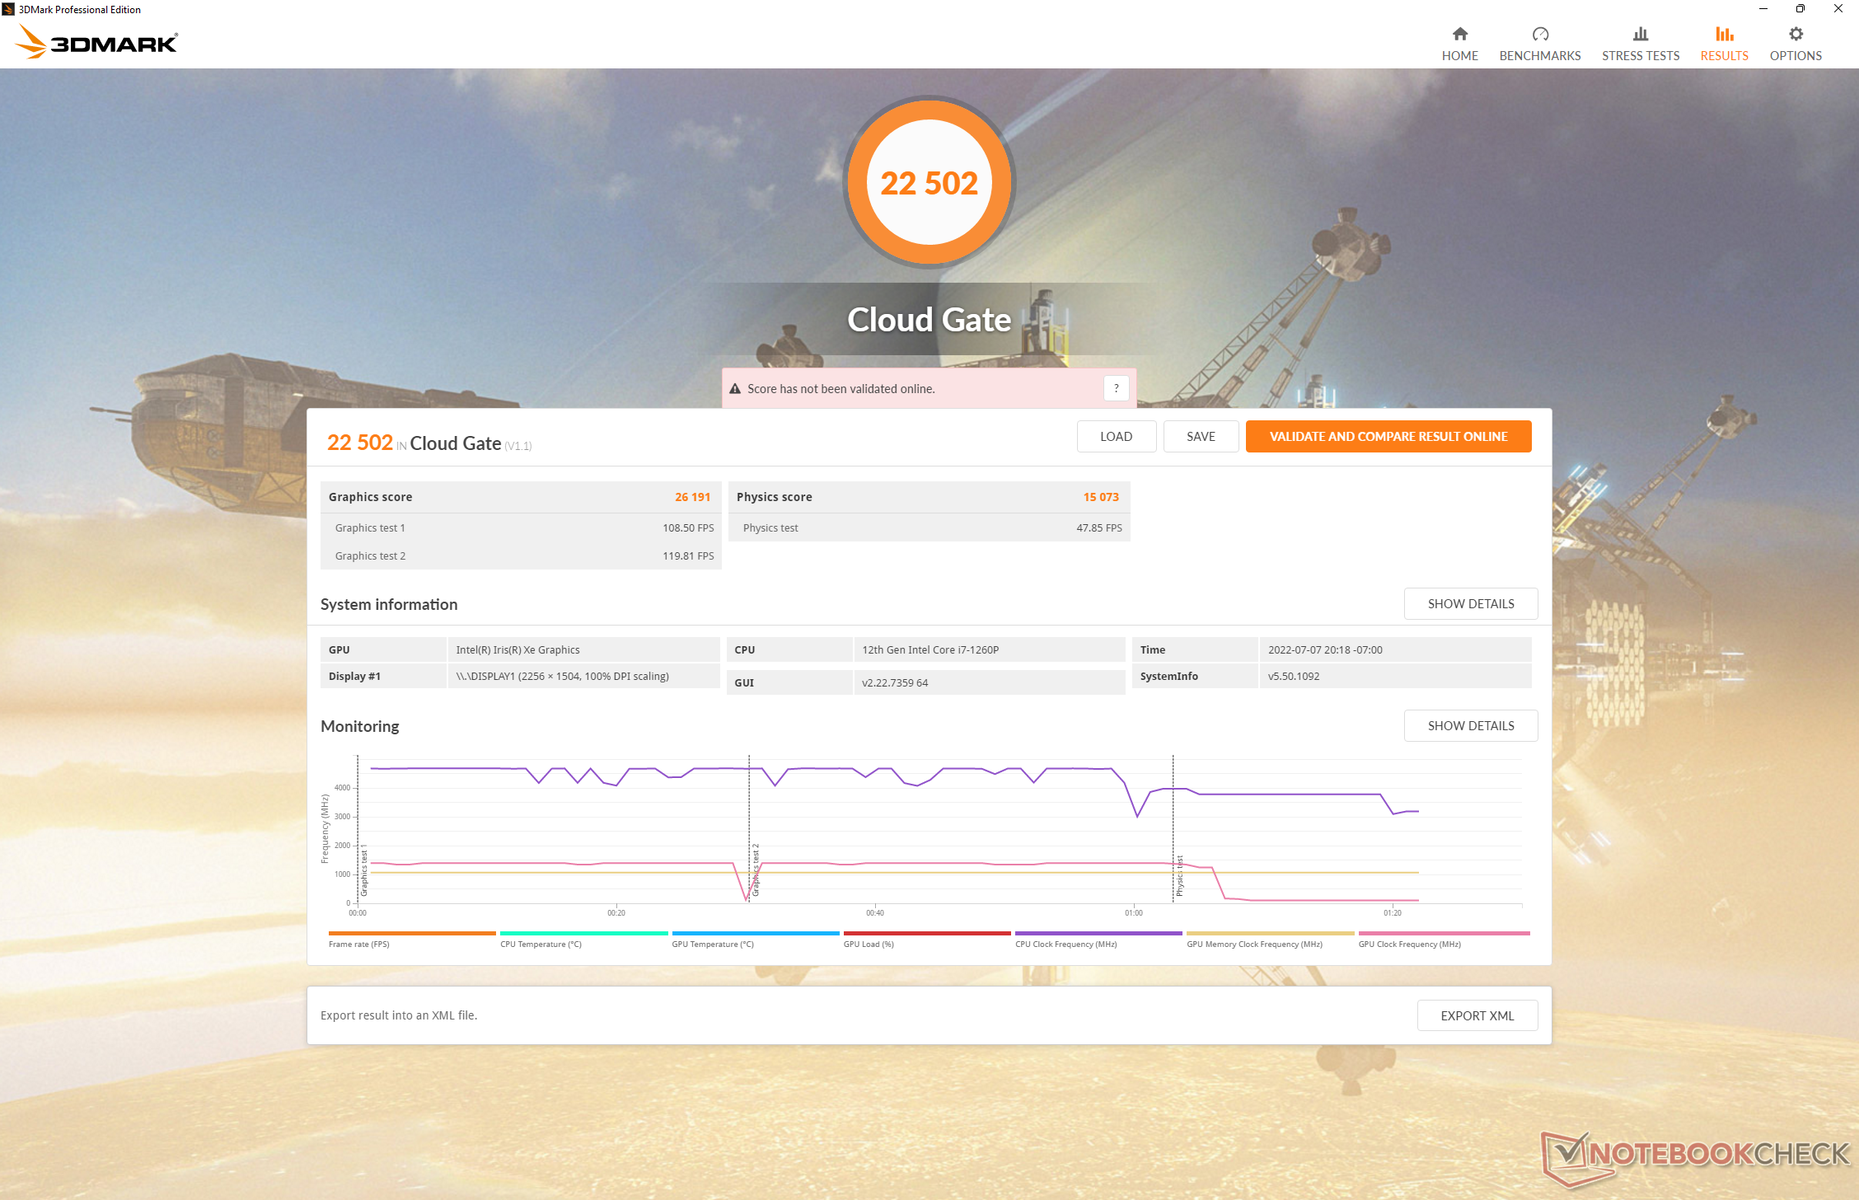
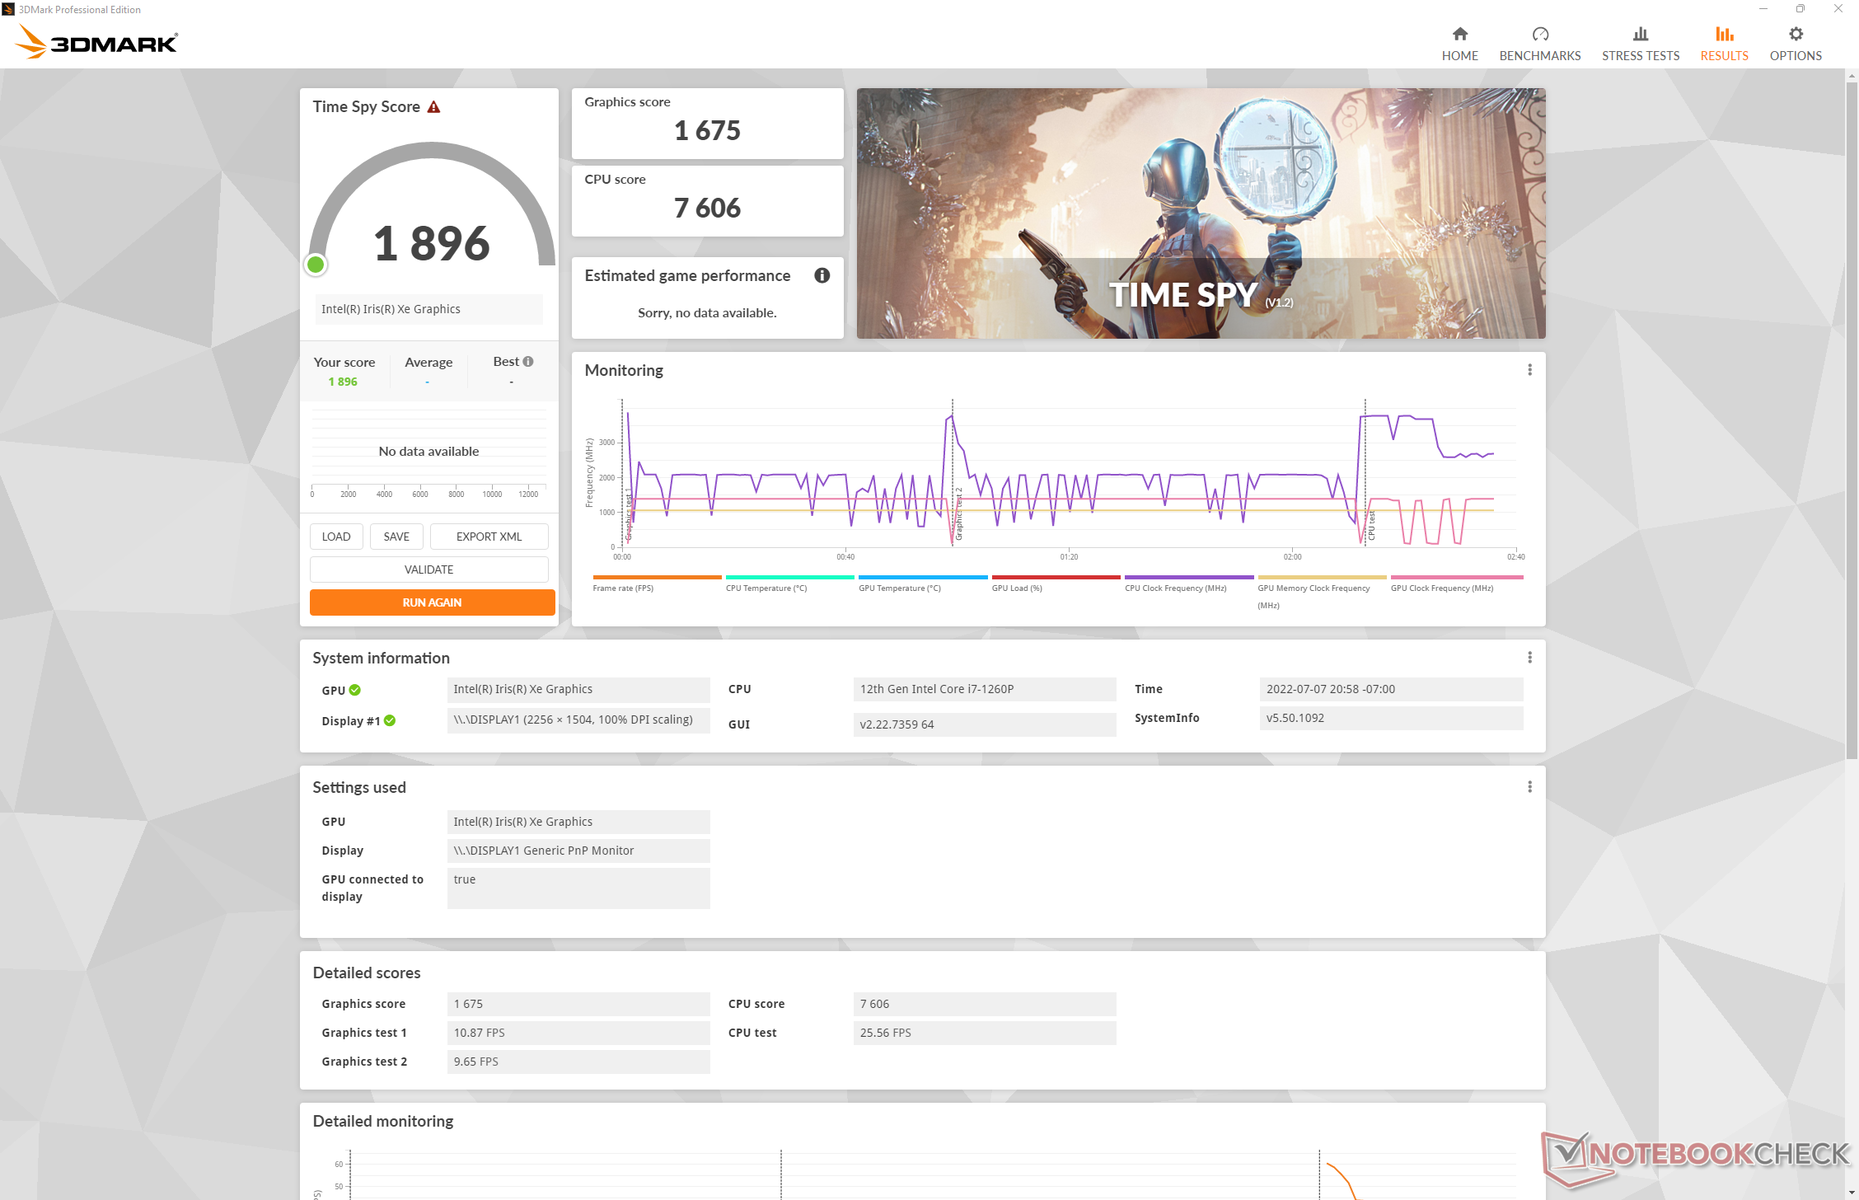
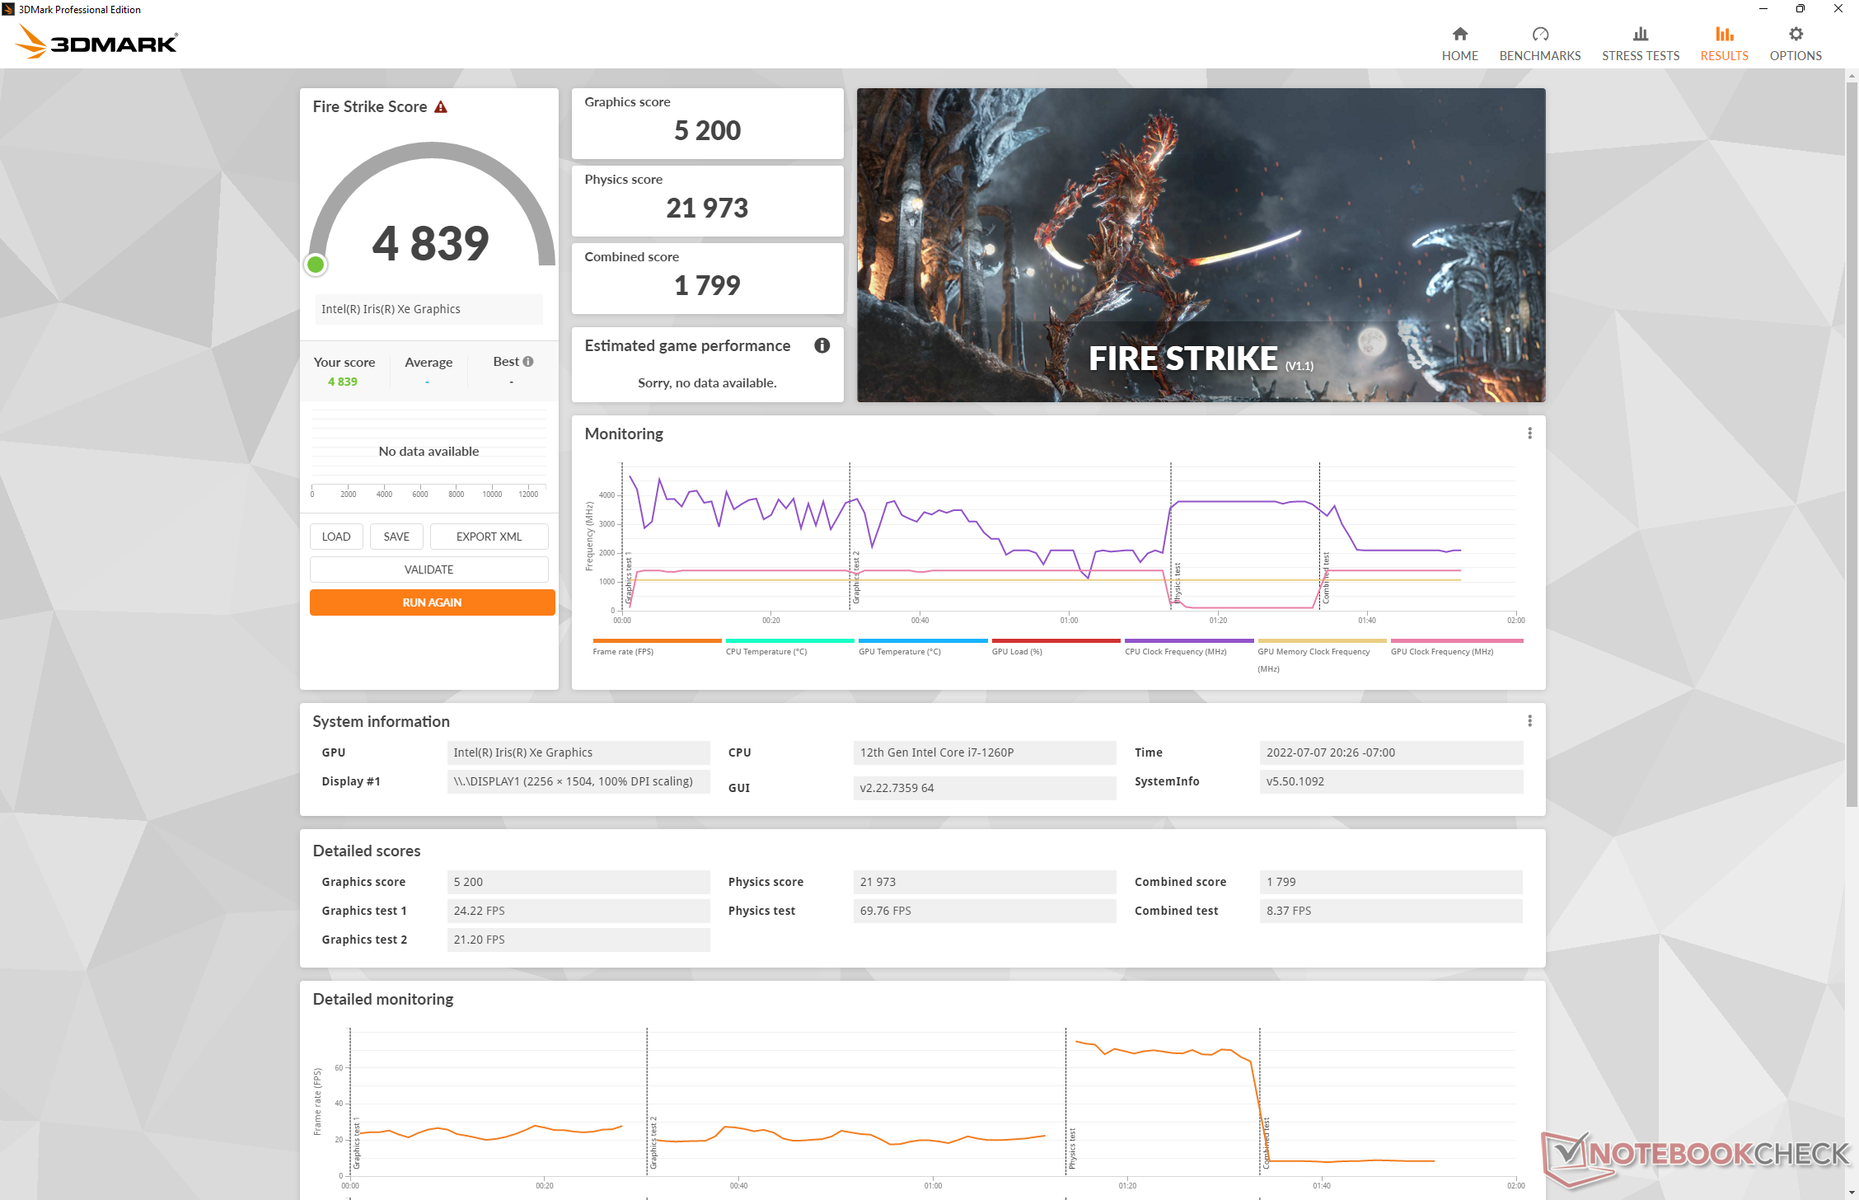
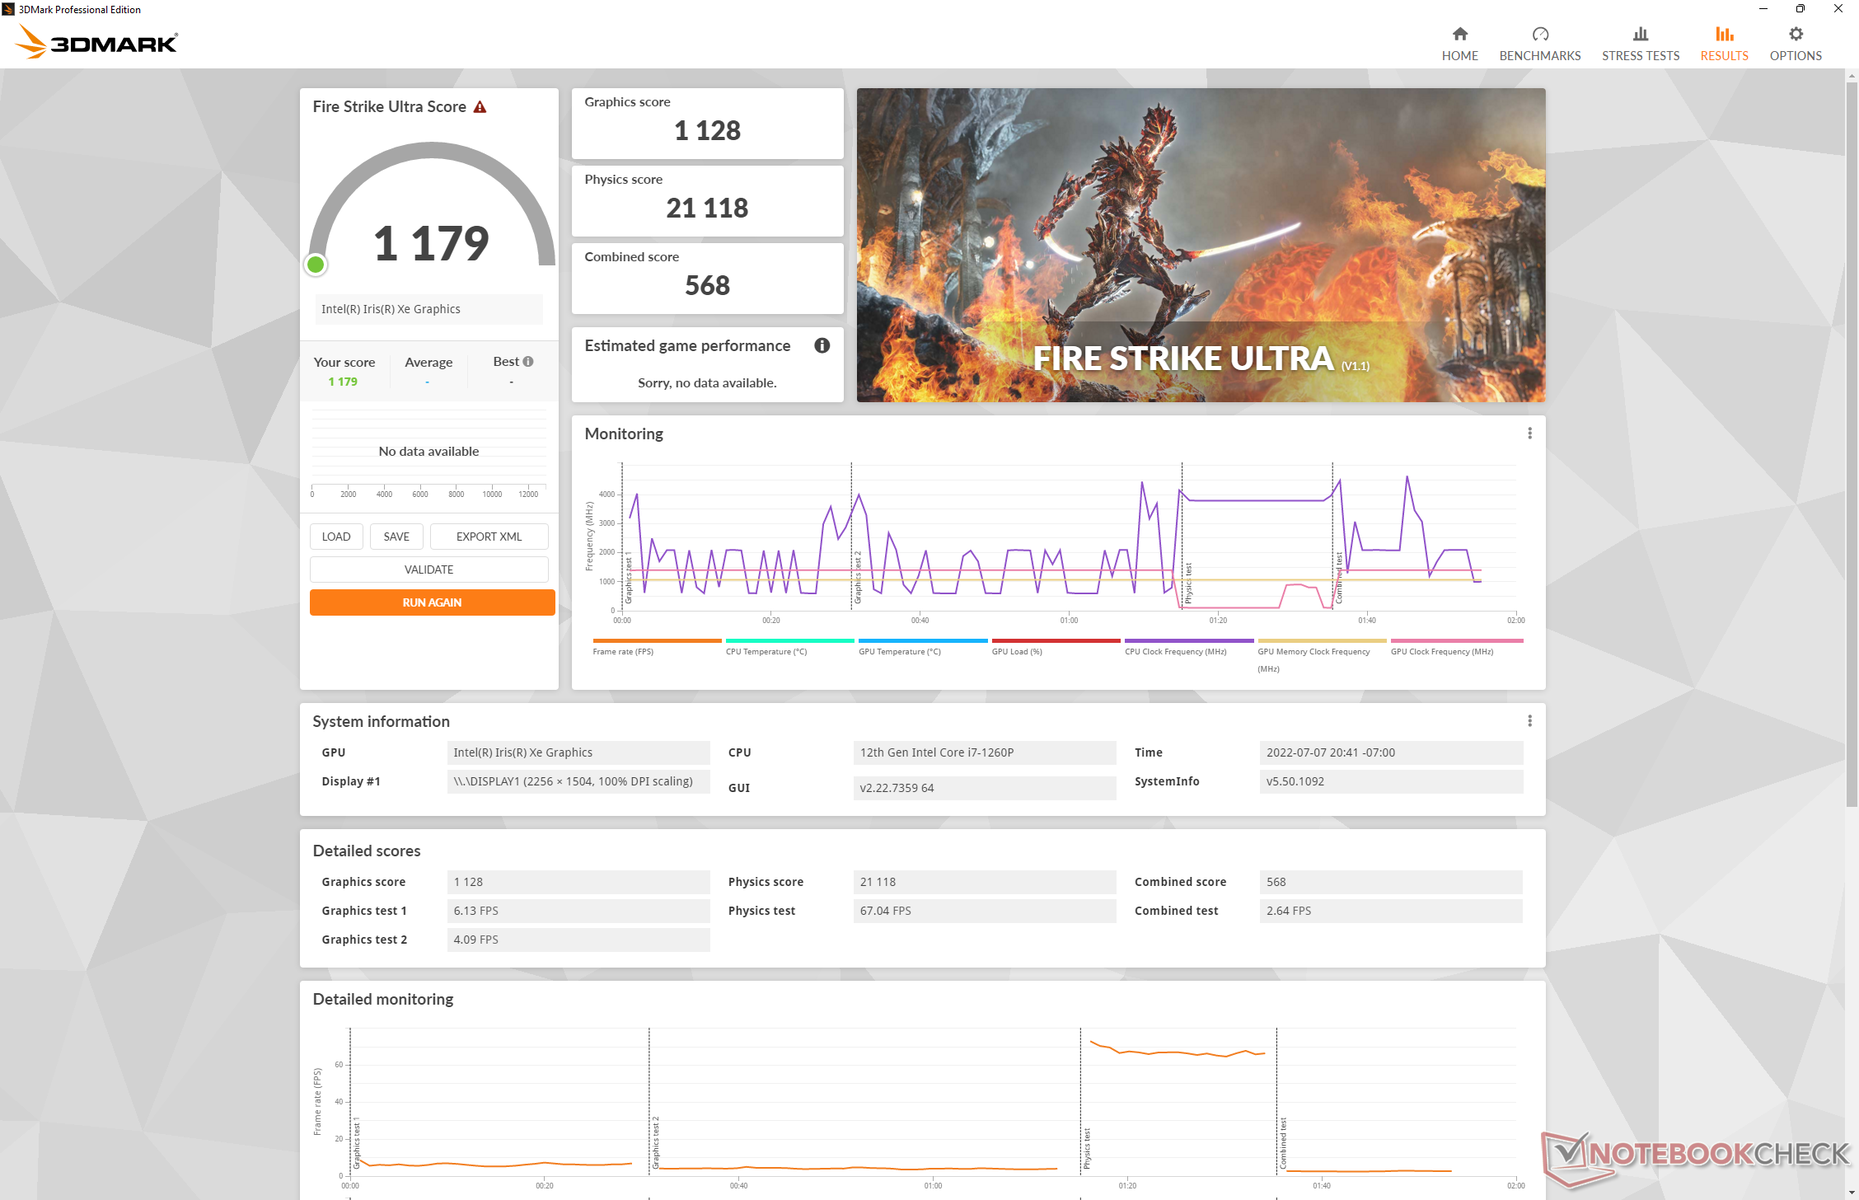
Graphics performance is about 5 to 15 percent faster than the average laptop in our database equipped with the same integrated Iris Xe 96 EUs. Performance was much slower on our original 2021 test unit due to it running on single-channel memory. If graphics are important for your workloads, then it's highly recommended to configure with dual-channel memory.
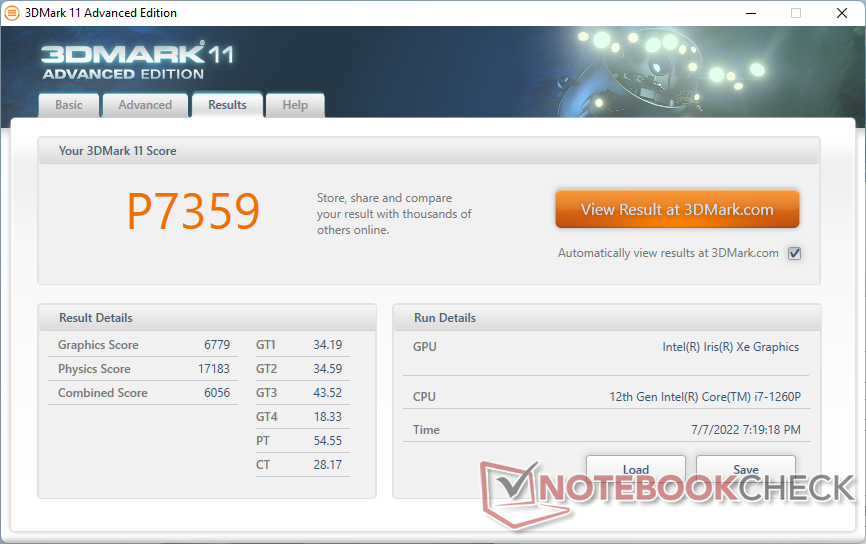
| 3DMark 11 Performance | 7359 points | |
| 3DMark Cloud Gate Standard Score | 22502 points | |
| 3DMark Fire Strike Score | 4839 points | |
| 3DMark Time Spy Score | 1896 points | |
Help | ||
| Cyberpunk 2077 1.6 | |
| 1920x1080 Low Preset | |
| Asus Zenbook S 13 OLED | |
| Framework Laptop 13.5 12th Gen Intel | |
| Average Intel Iris Xe Graphics G7 96EUs (13 - 25.9, n=42) | |
| 1920x1080 Medium Preset | |
| Asus Zenbook S 13 OLED | |
| Framework Laptop 13.5 12th Gen Intel | |
| Average Intel Iris Xe Graphics G7 96EUs (10.8 - 21.7, n=37) | |
| 1920x1080 High Preset | |
| Asus Zenbook S 13 OLED | |
| Framework Laptop 13.5 12th Gen Intel | |
| Average Intel Iris Xe Graphics G7 96EUs (9.8 - 16.9, n=34) | |
| 1920x1080 Ultra Preset | |
| Asus Zenbook S 13 OLED | |
| Framework Laptop 13.5 12th Gen Intel | |
| Average Intel Iris Xe Graphics G7 96EUs (7.4 - 16.8, n=32) | |
Witcher 3 FPS Chart
| low | med. | high | ultra | |
|---|---|---|---|---|
| GTA V (2015) | 117.5 | 96.9 | 20 | 8.36 |
| The Witcher 3 (2015) | 97.5 | 60.5 | 32.3 | 15.1 |
| Dota 2 Reborn (2015) | 121.7 | 90.3 | 62.6 | 57.7 |
| Final Fantasy XV Benchmark (2018) | 42.5 | 23.3 | 23.3 | |
| X-Plane 11.11 (2018) | 62.6 | 45.9 | 41.3 | |
| Strange Brigade (2018) | 90.2 | 39.6 | 32.6 | 26.2 |
| Cyberpunk 2077 1.6 (2022) | 21.9 | 18.5 | 13.7 | 11.2 |
Emissions
System Noise
Fan noise remains louder than on most other Ultrabooks particularly when under load. Running the first benchmark scene of 3DMark 06 to simulate average loads would result in a fan noise of 47 dB(A) to be one of the louder U-series-powered subnotebooks we've tested. If gaming, fan noise tends to hover between 41 and 47 dB(A). Expect a loud system if you intend on running demanding loads to exploit the fast processor performance.
If running less demanding loads like browsing or video streaming, fan noise tends to remain below 28 dB(A) against a silent background of 22.8 dB(A). Fan pulsing in this range is not loud enough to be distracting.
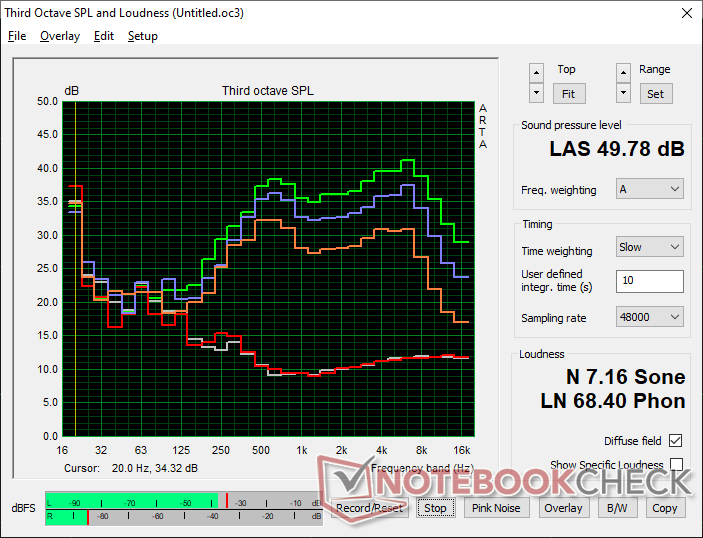
Noise Level
| Idle |
| 23 / 23 / 23 dB(A) |
| Load |
| 47.3 / 49.8 dB(A) |
 | ||
30 dB silent 40 dB(A) audible 50 dB(A) loud |
||
min: | ||
| Framework Laptop 13.5 12th Gen Intel Iris Xe G7 96EUs, i7-1260P, WDC PC SN730 SDBPNTY-512G | Framework Laptop 13.5 Iris Xe G7 96EUs, i7-1165G7, Western Digital WD_BLACK SN850 WDS100T1X0E | Lenovo ThinkPad X1 Titanium Yoga G1 20QB0016GE Iris Xe G7 80EUs, i5-1140G7, Lenovo UMIS RPJTJ256MEE1OWX | Microsoft Surface Laptop 4 13 Ryzen 5 Vega 7, R5 4680U, Samsung PM991 MZ9LQ256HBJQ | HP Spectre x360 14-ea0378ng Iris Xe G7 96EUs, i7-1165G7, Intel Optane Memory H10 with Solid State Storage 32GB + 1TB HBRPEKNX0203AH(L/H) | |
|---|---|---|---|---|---|
| Noise | -1% | -2% | 1% | -1% | |
| off / environment * (dB) | 22.8 | 23.9 -5% | 25.61 -12% | 24.6 -8% | 26 -14% |
| Idle Minimum * (dB) | 23 | 23.9 -4% | 25.61 -11% | 24.6 -7% | 26 -13% |
| Idle Average * (dB) | 23 | 23.9 -4% | 25.61 -11% | 24.6 -7% | 26 -13% |
| Idle Maximum * (dB) | 23 | 23.9 -4% | 25.61 -11% | 24.6 -7% | 26 -13% |
| Load Average * (dB) | 47.3 | 45.6 4% | 40.14 15% | 39.5 16% | 37.5 21% |
| Witcher 3 ultra * (dB) | 47.3 | 47.1 -0% | |||
| Load Maximum * (dB) | 49.8 | 47.9 4% | 40.14 19% | 39.5 21% | 36.3 27% |
* ... smaller is better
Temperature
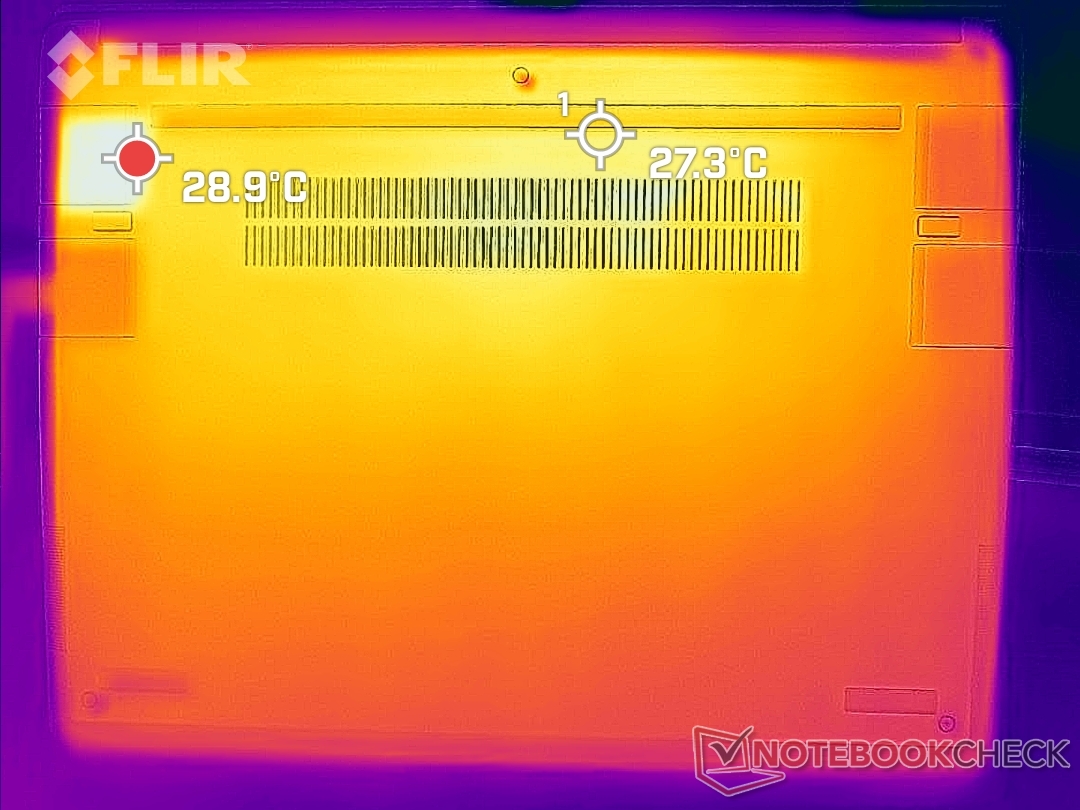
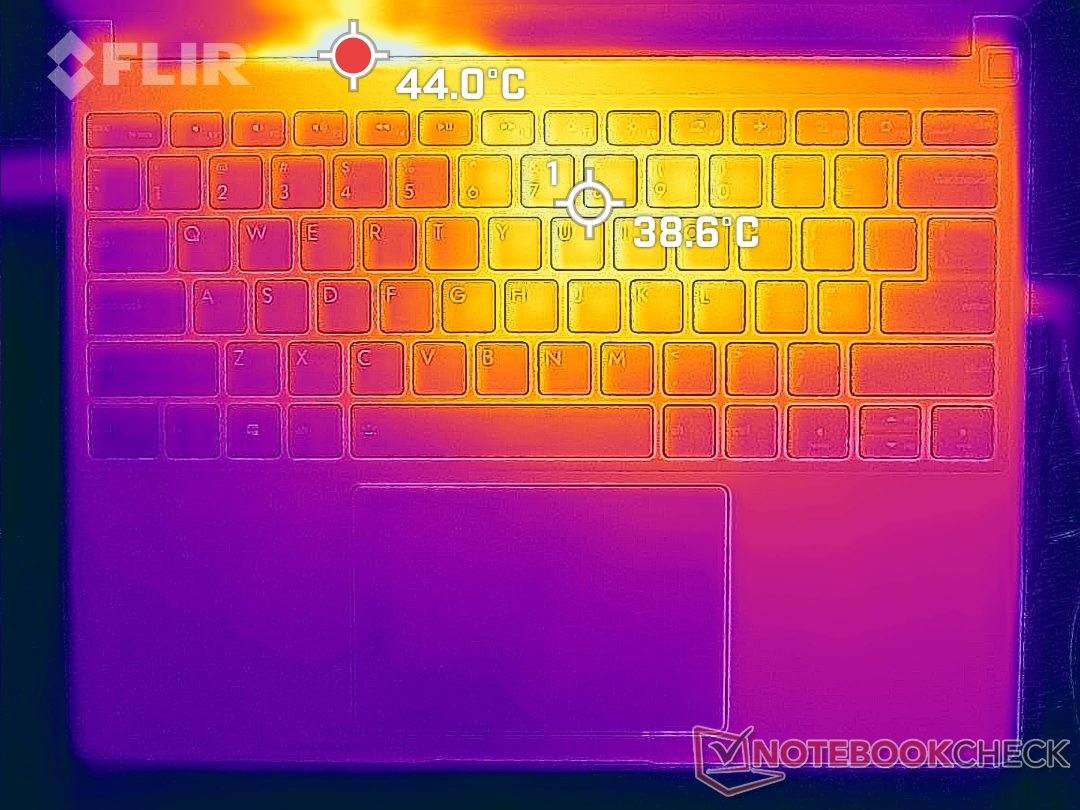
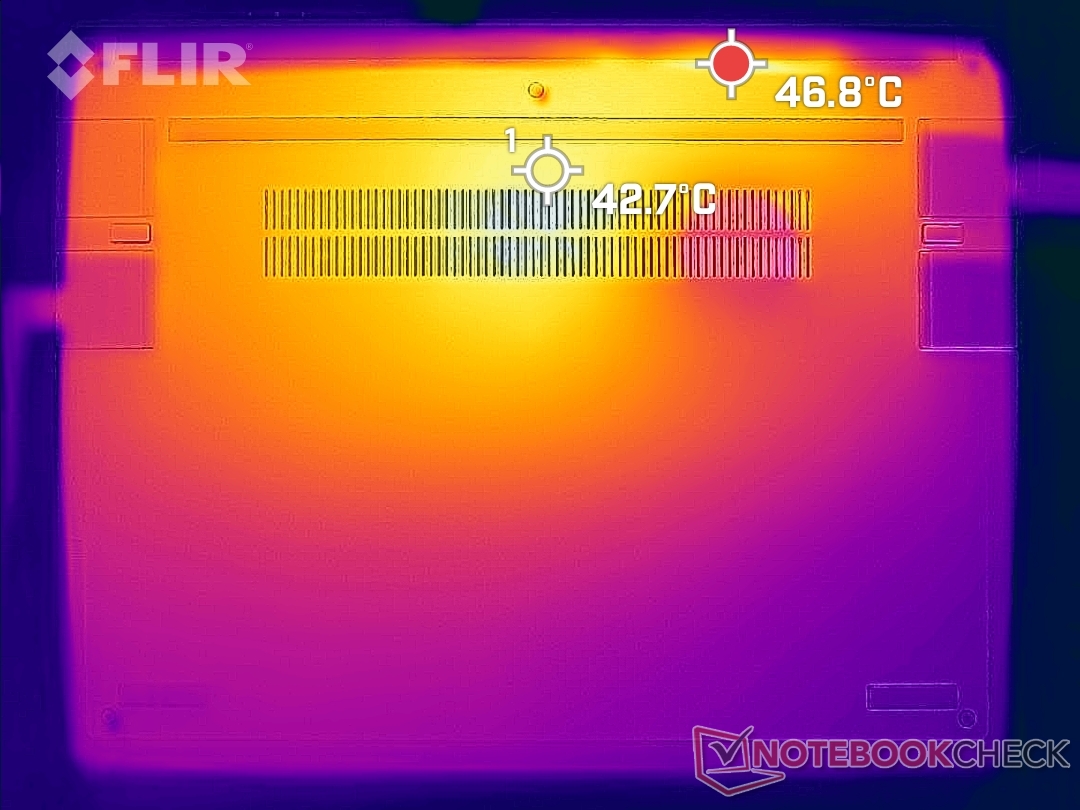
Surface hot spots can reach 39 C and 43 C on the top and bottom, respectively, compared to 45 C and 46 C on the Surface Laptop 4 13 or 40 C and 51 C on the HP Spectre x360 14. It's not warm enough to be bothersome, but it's definitely noticeable during use. Larger ventilation grilles on the bottom could have potentially improved thermals.
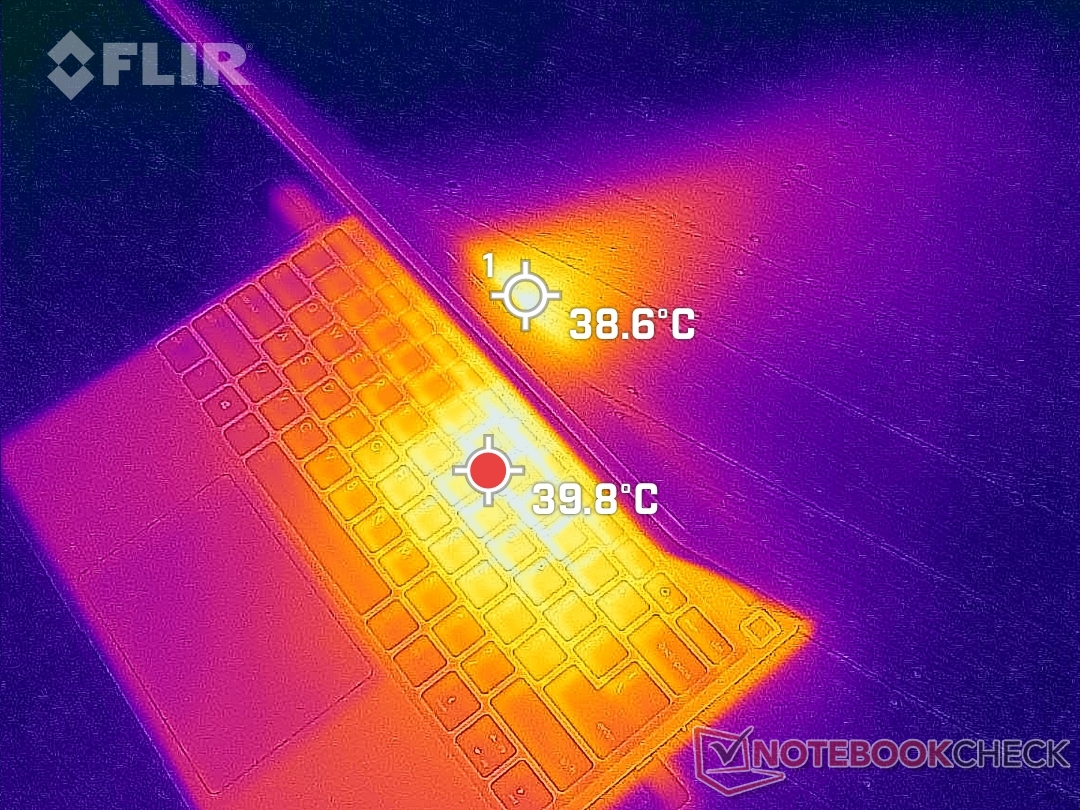
(+) The maximum temperature on the upper side is 36.8 °C / 98 F, compared to the average of 34.3 °C / 94 F, ranging from 21.2 to 62.5 °C for the class Office.
(±) The bottom heats up to a maximum of 42.4 °C / 108 F, compared to the average of 36.8 °C / 98 F
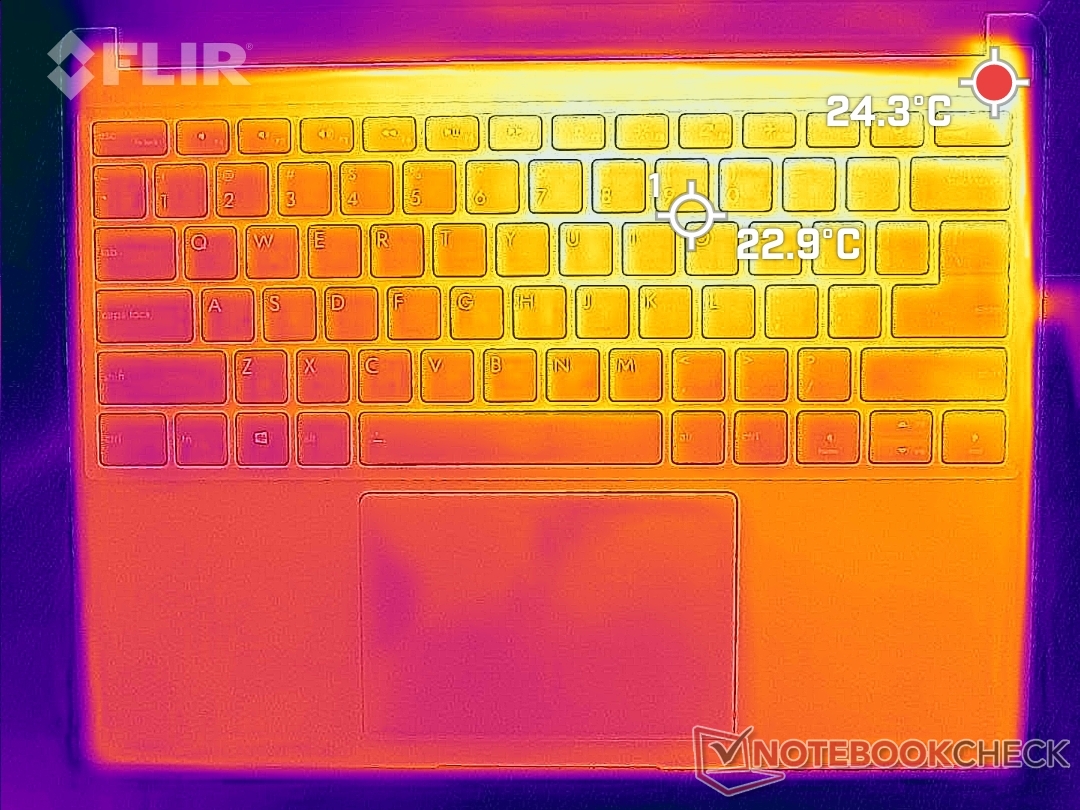
(+) In idle usage, the average temperature for the upper side is 21.2 °C / 70 F, compared to the device average of 29.5 °C / 85 F.
(+) The palmrests and touchpad are cooler than skin temperature with a maximum of 24.4 °C / 75.9 F and are therefore cool to the touch.
(+) The average temperature of the palmrest area of similar devices was 27.6 °C / 81.7 F (+3.2 °C / 5.8 F).
| Framework Laptop 13.5 12th Gen Intel Intel Core i7-1260P, Intel Iris Xe Graphics G7 96EUs | Framework Laptop 13.5 Intel Core i7-1165G7, Intel Iris Xe Graphics G7 96EUs | Lenovo ThinkPad X1 Titanium Yoga G1 20QB0016GE Intel Core i5-1140G7, Intel Iris Xe Graphics G7 80EUs | HP EliteBook Folio 13.5-3G2L2EA Qualcomm Snapdragon 8cx Gen 2 5G, Qualcomm Adreno 680 | Microsoft Surface Laptop 4 13 Ryzen 5 AMD Ryzen 5 4680U, AMD Radeon RX Vega 7 | HP Spectre x360 14-ea0378ng Intel Core i7-1165G7, Intel Iris Xe Graphics G7 96EUs | |
|---|---|---|---|---|---|---|
| Heat | -5% | -9% | 8% | -6% | -6% | |
| Maximum Upper Side * (°C) | 36.8 | 47.2 -28% | 46.3 -26% | 34.3 7% | 45.8 -24% | 37.1 -1% |
| Maximum Bottom * (°C) | 42.4 | 39.4 7% | 43.3 -2% | 35.4 17% | 45.5 -7% | 43.1 -2% |
| Idle Upper Side * (°C) | 24.2 | 25.2 -4% | 26.8 -11% | 25.7 -6% | 24.9 -3% | 29 -20% |
| Idle Bottom * (°C) | 29 | 27.8 4% | 28.3 2% | 25.1 13% | 25.7 11% | 28.6 1% |
* ... smaller is better
Stress Test
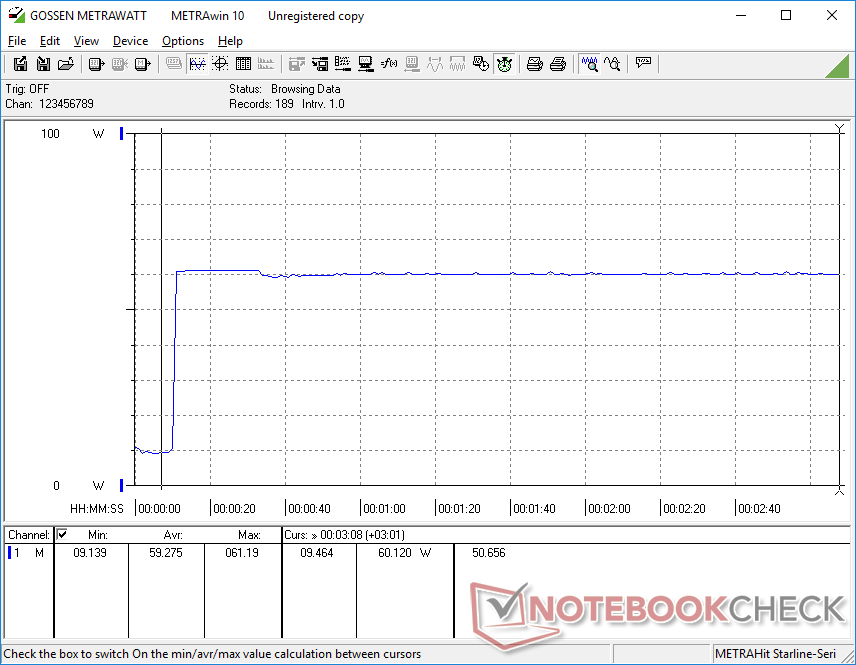
When running Prime95, CPU clock rates would boost to 3.5 GHz for the first 10 seconds or so until hitting a core temperature of 94 C. Clock rates and CPU power package would then fall to the 2.4 to 2.6 GHz range and from 52 W to 30 W, respectively, in order to maintain a cooler core temperature of 87 C. Overall core temperatures are still noticeably warmer than what we recorded on last year's model where temperatures would stabilize at 82 C when under similar conditions.
When running Witcher 3 to represent gaming loads, core temperature would again be warmer than on last year's model (83 C vs. 73 C).
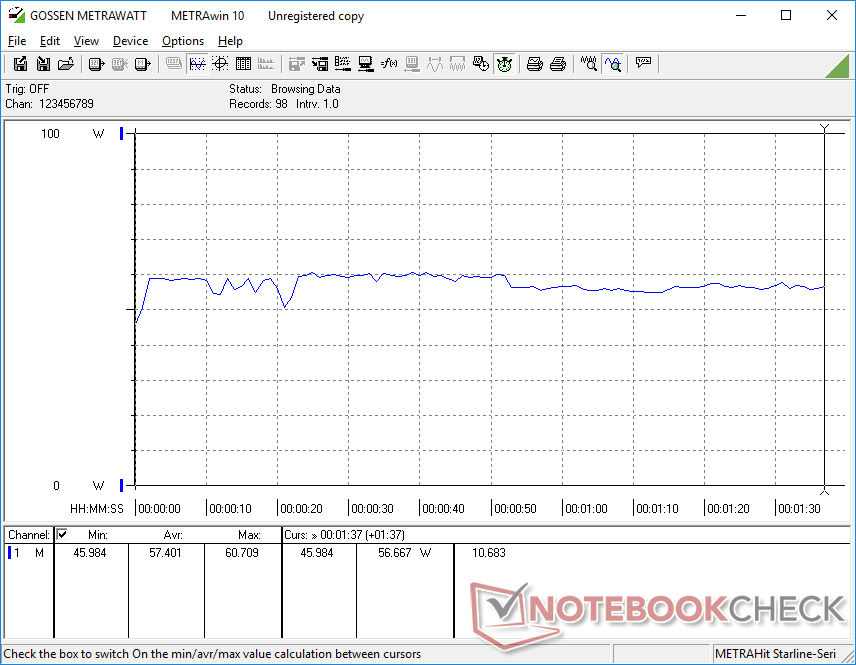
Running on battery power may impact CPU performance slightly. A 3DMark 11 test on batteries would return Physics and Graphics scores of 14919 and 6604 points, respectively, compared to 17183 and 6779 points when on mains.
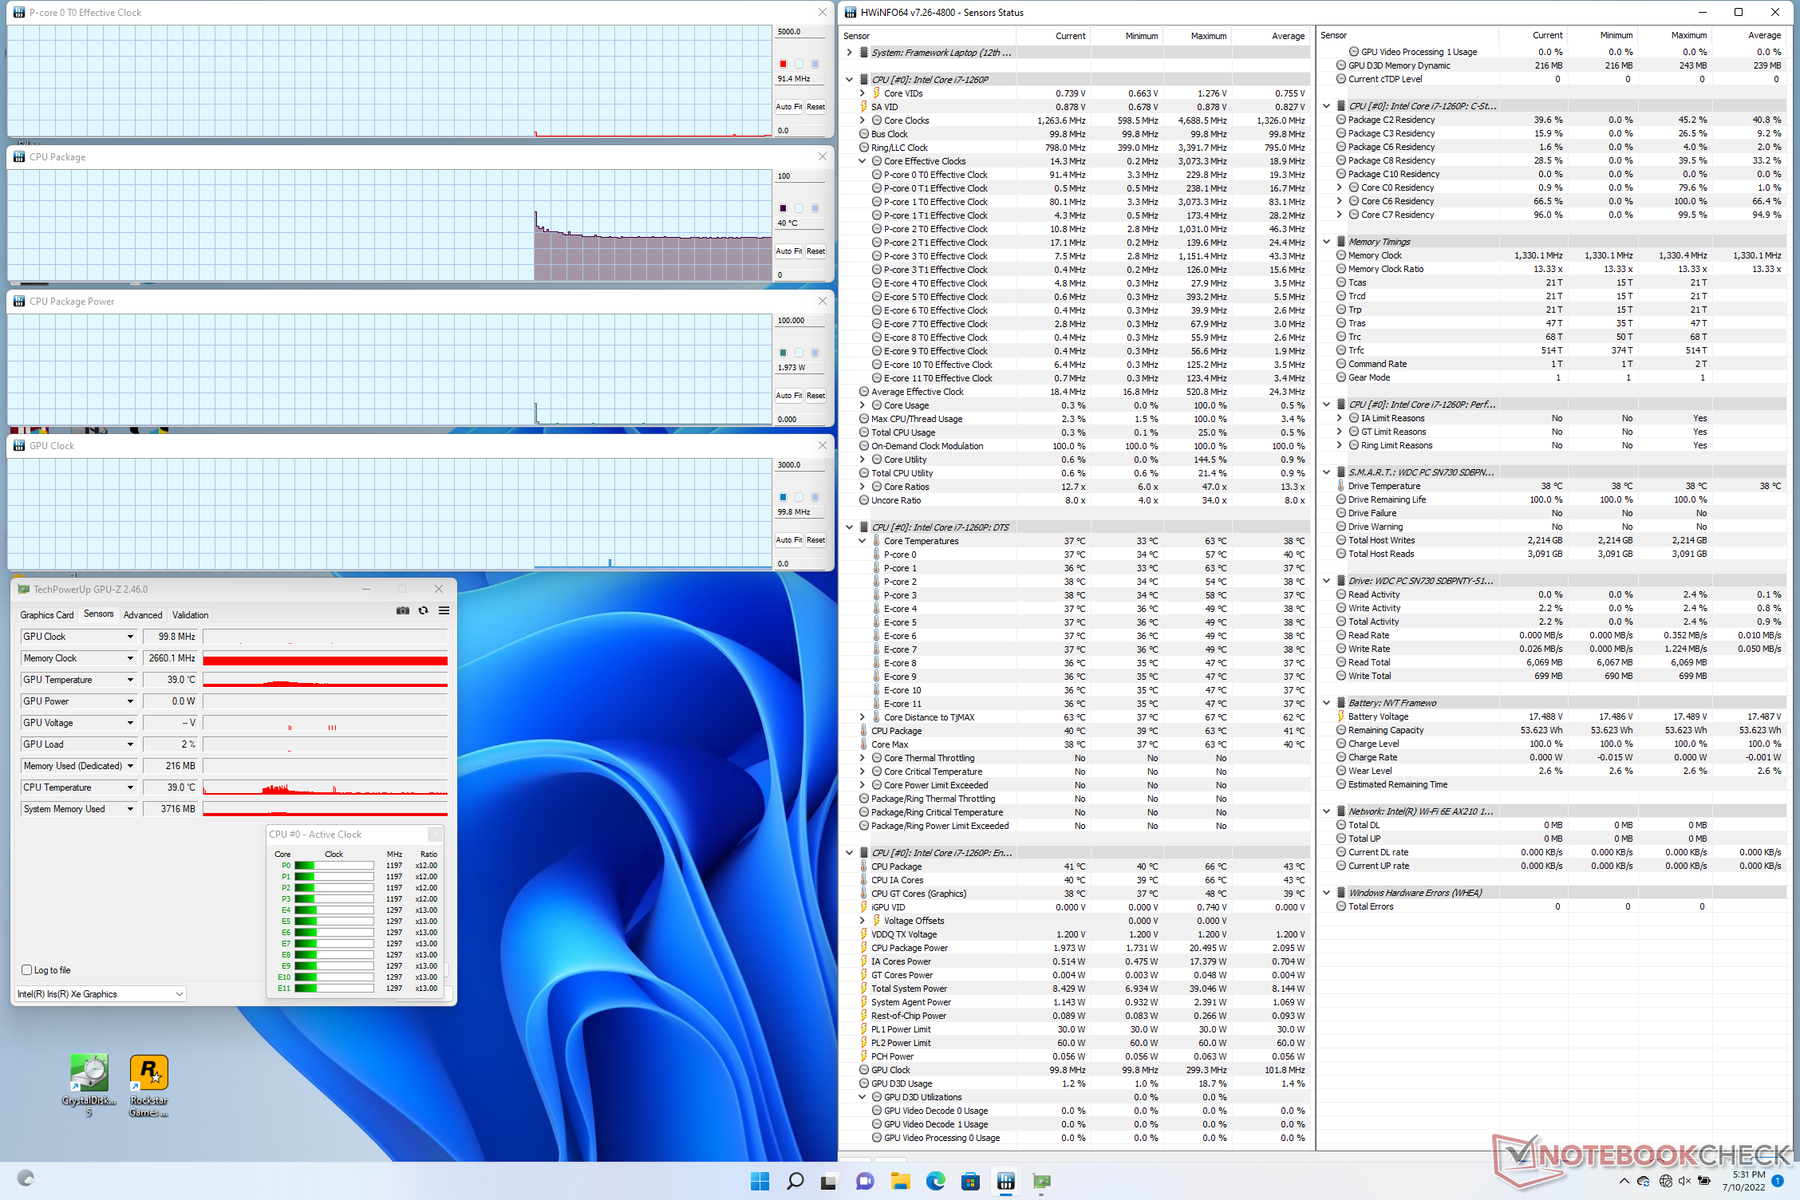
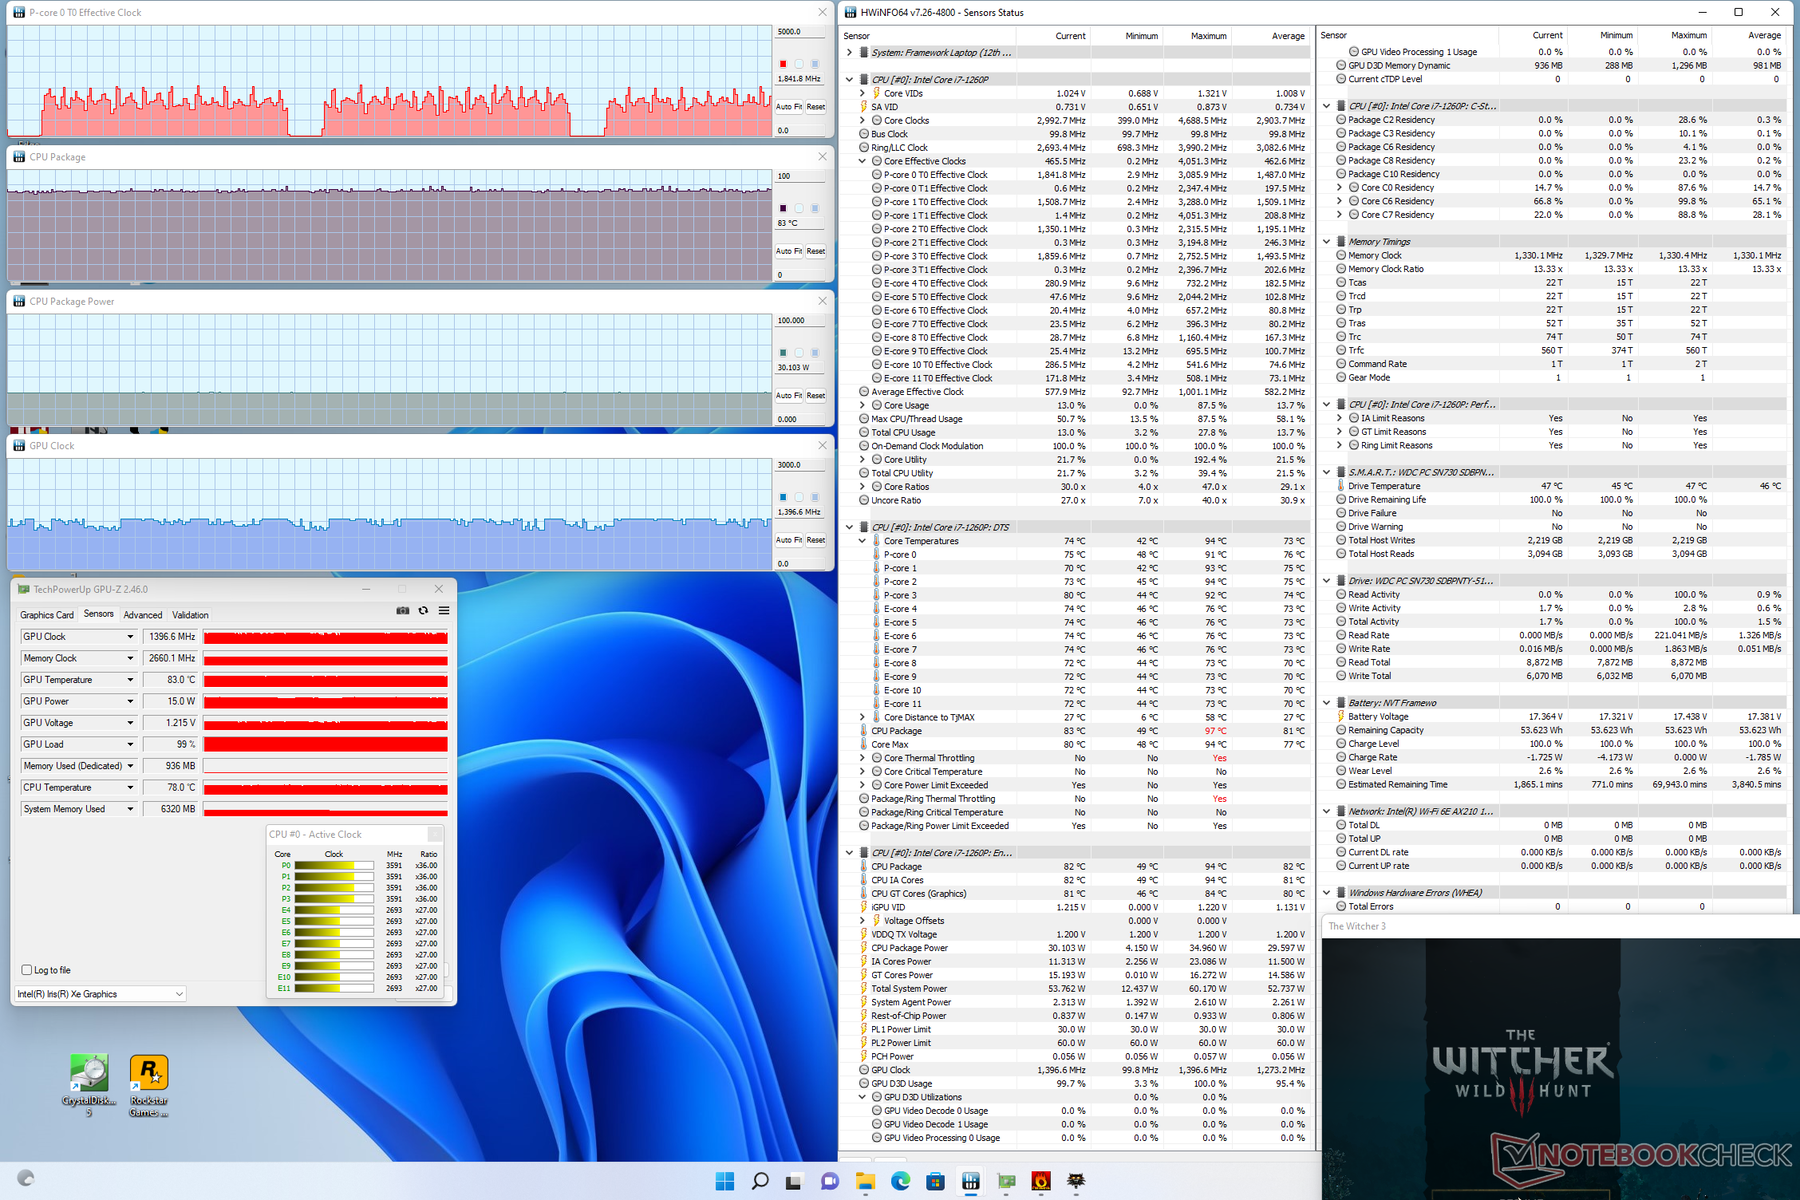
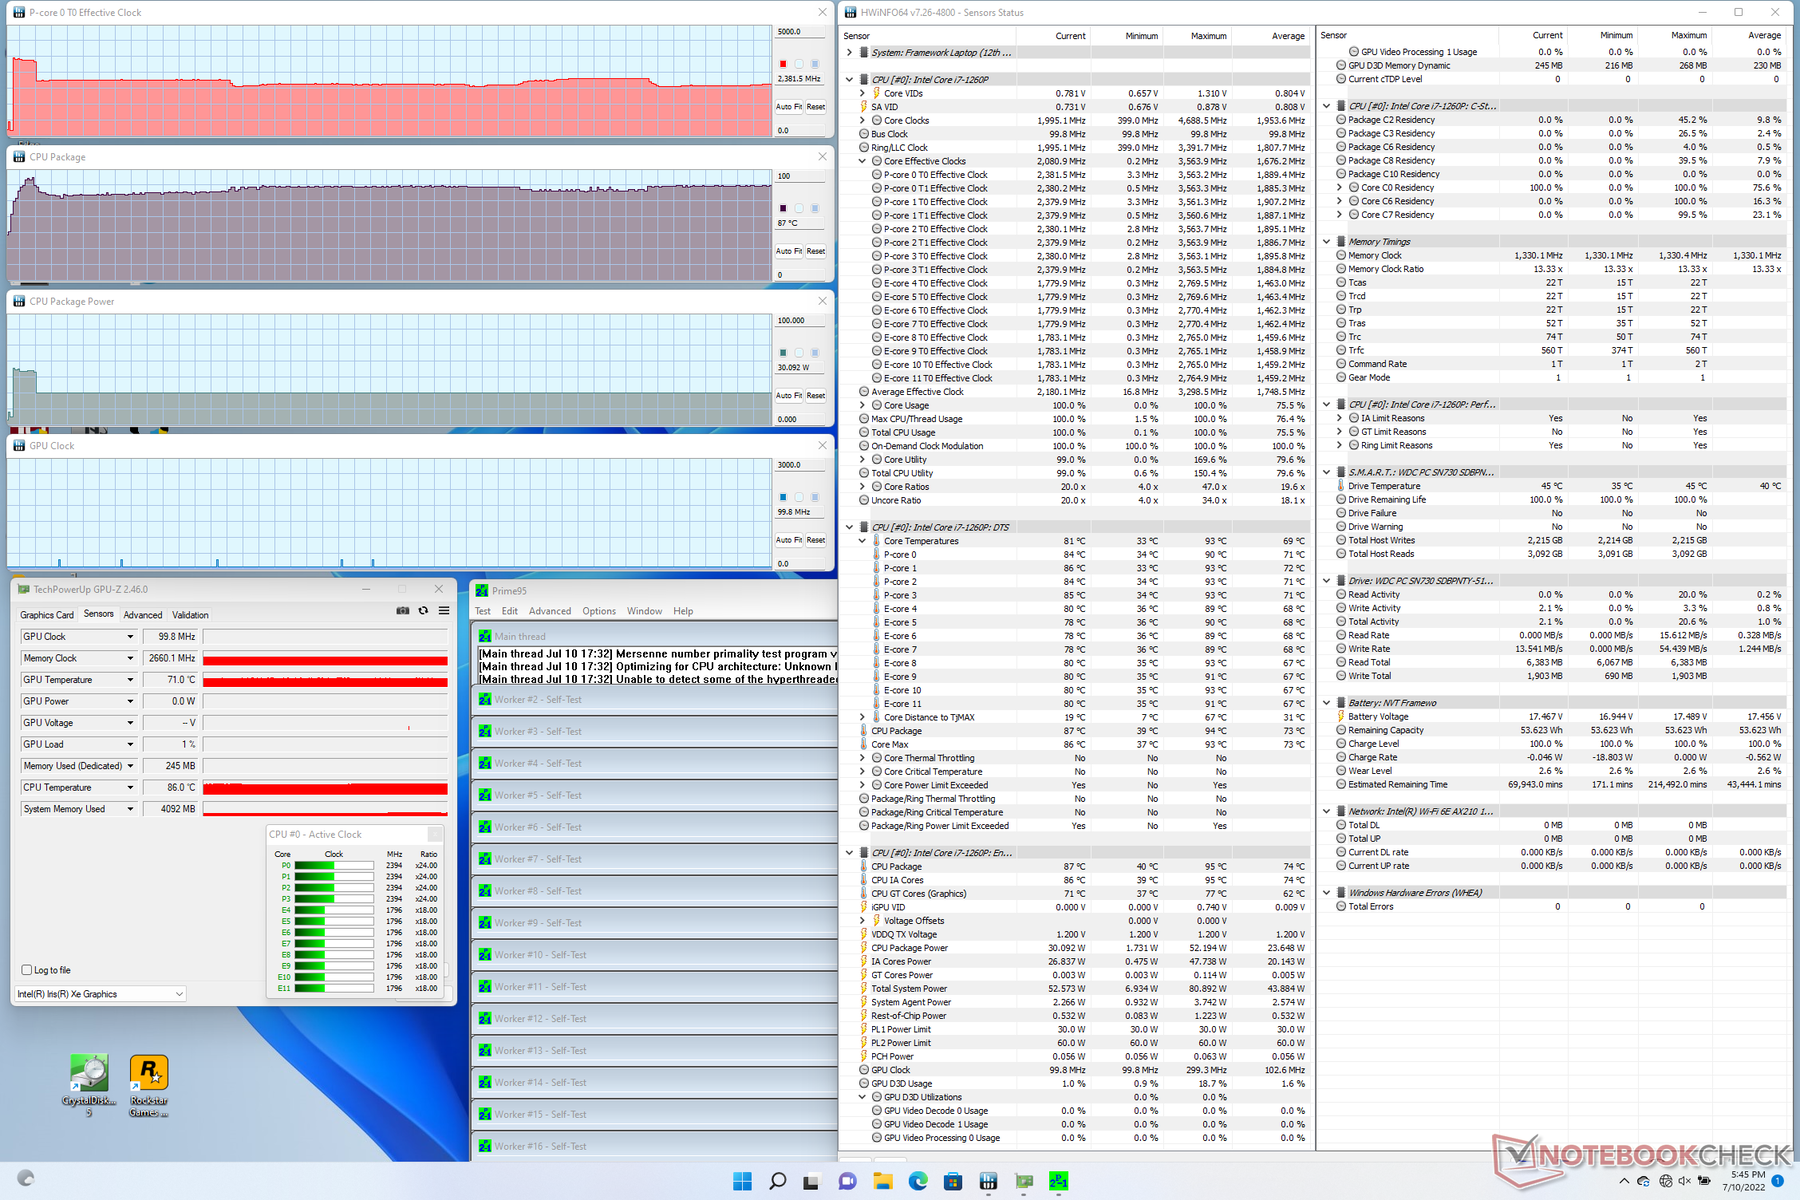
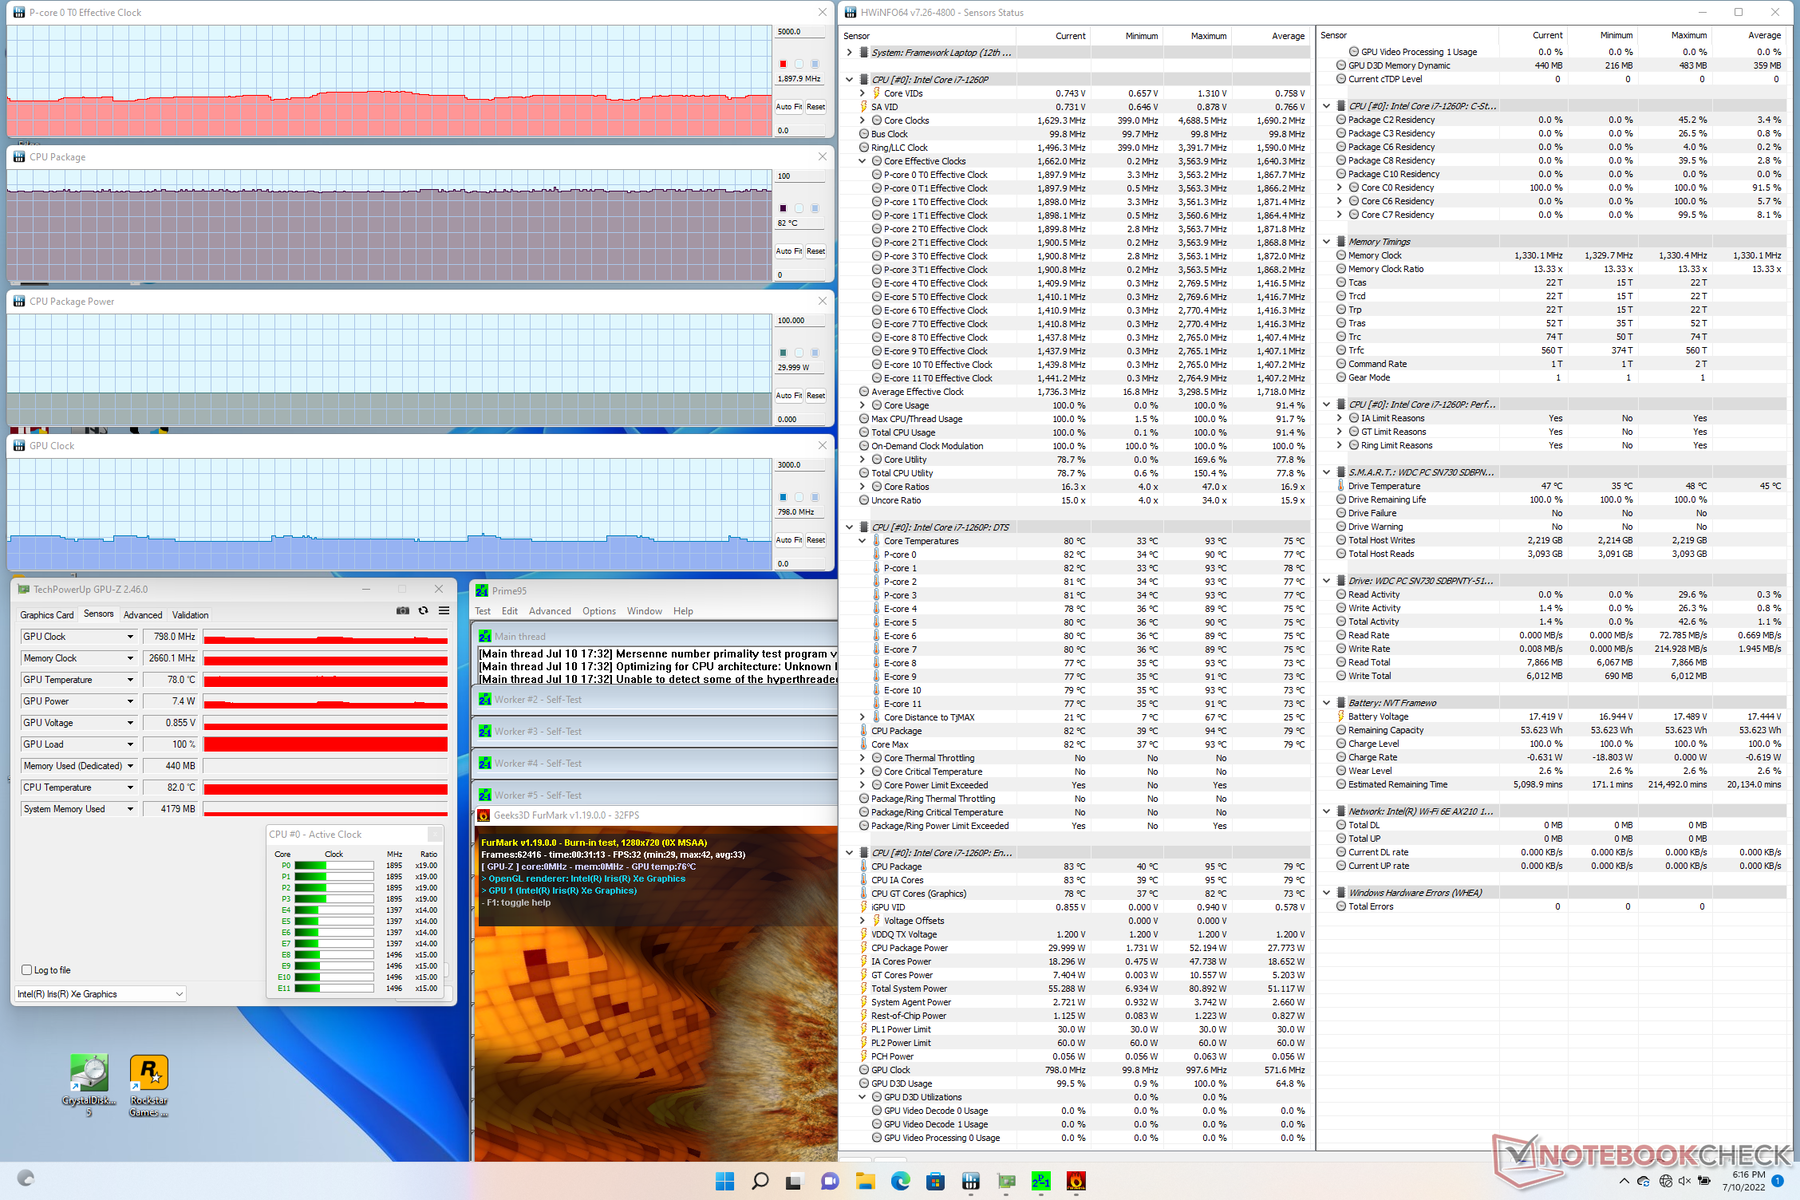
| CPU Clock (GHz) | GPU Clock (MHz) | Average CPU Temperature (°C) | |
| System Idle | -- | -- | 40 |
| Prime95 Stress | 2.4 - 2.6 | -- | 87 |
| Prime95 + FurMark Stress | 1.7 - 1.9 | 0.8 - 0.9 | 82 |
| Witcher 3 Stress | ~1.8 | 1396 | 83 |
Speakers
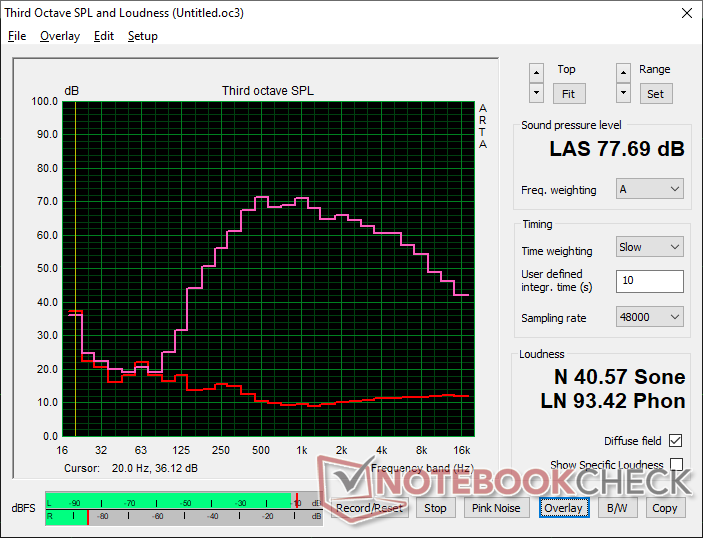
Framework Laptop 13.5 12th Gen Intel audio analysis
(±) | speaker loudness is average but good (77.7 dB)
Bass 100 - 315 Hz
(-) | nearly no bass - on average 16.1% lower than median
(±) | linearity of bass is average (14.3% delta to prev. frequency)
Mids 400 - 2000 Hz
(±) | higher mids - on average 7.5% higher than median
(+) | mids are linear (5.9% delta to prev. frequency)
Highs 2 - 16 kHz
(+) | balanced highs - only 4% away from median
(+) | highs are linear (5% delta to prev. frequency)
Overall 100 - 16.000 Hz
(±) | linearity of overall sound is average (20.7% difference to median)
Compared to same class
» 45% of all tested devices in this class were better, 10% similar, 45% worse
» The best had a delta of 7%, average was 21%, worst was 53%
Compared to all devices tested
» 54% of all tested devices were better, 8% similar, 38% worse
» The best had a delta of 4%, average was 24%, worst was 134%
Apple MacBook Pro 16 2021 M1 Pro audio analysis
(+) | speakers can play relatively loud (84.7 dB)
Bass 100 - 315 Hz
(+) | good bass - only 3.8% away from median
(+) | bass is linear (5.2% delta to prev. frequency)
Mids 400 - 2000 Hz
(+) | balanced mids - only 1.3% away from median
(+) | mids are linear (2.1% delta to prev. frequency)
Highs 2 - 16 kHz
(+) | balanced highs - only 1.9% away from median
(+) | highs are linear (2.7% delta to prev. frequency)
Overall 100 - 16.000 Hz
(+) | overall sound is linear (4.6% difference to median)
Compared to same class
» 0% of all tested devices in this class were better, 0% similar, 100% worse
» The best had a delta of 5%, average was 18%, worst was 45%
Compared to all devices tested
» 0% of all tested devices were better, 0% similar, 100% worse
» The best had a delta of 4%, average was 24%, worst was 134%
Energy Management
Power Consumption
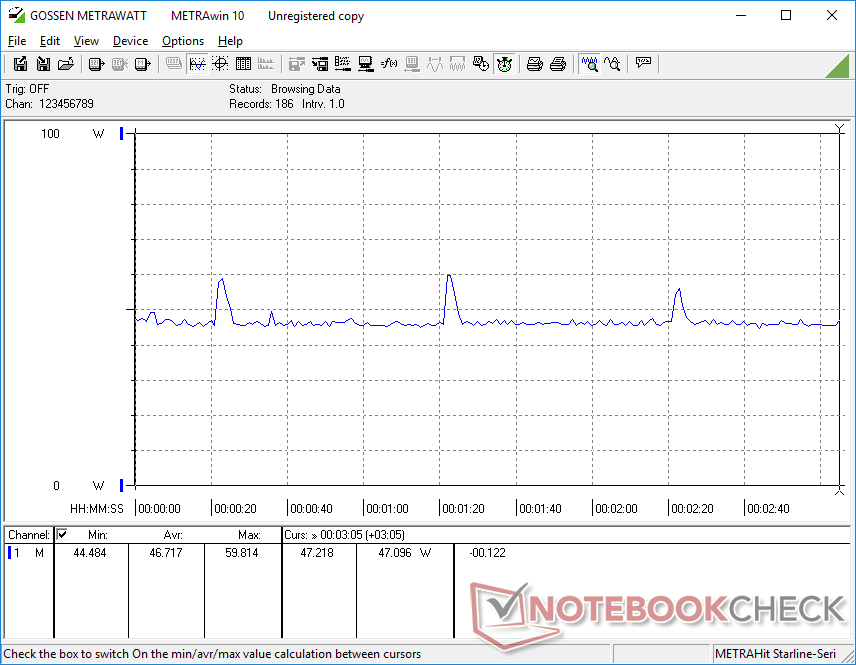
As expected from a 12th gen Alder Lake-P system, overall power consumption is higher than many laptops running on 11th gen Tiger Lake-U processors including last year's Framework model. Running Prime95 would consume 60 W to be 25 percent more demanding year-over-year. The higher processor performance doesn't come free in this regard.
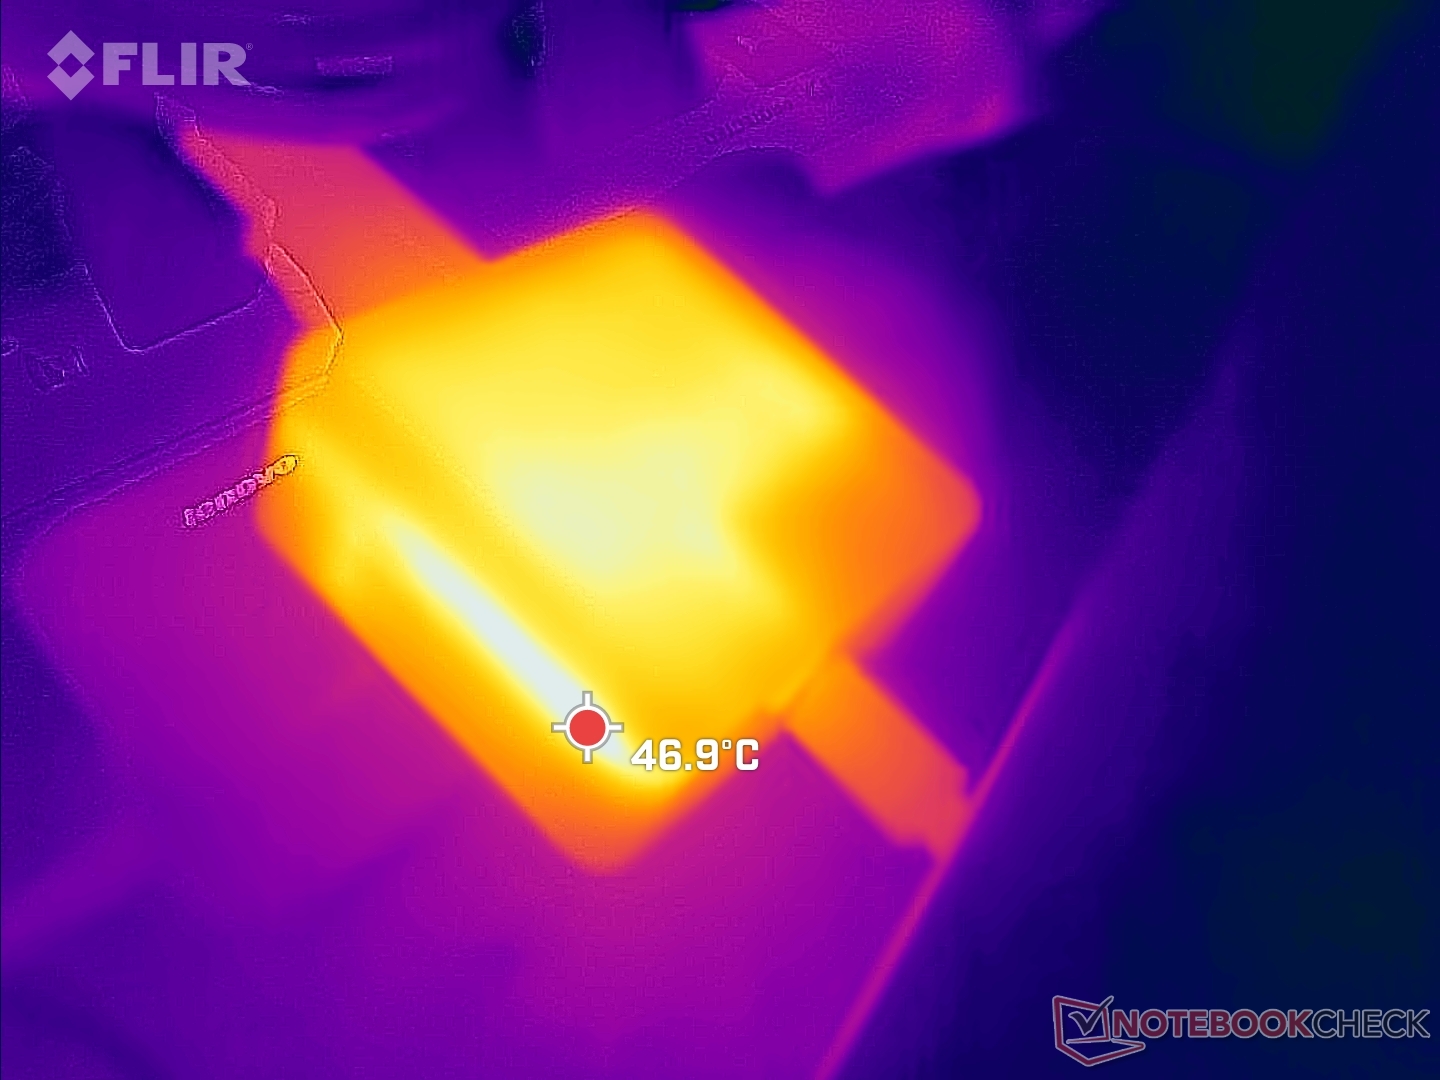
We're able to record a maximum consumption of 61.2 W from the small (~5.8 x 5.8 x 2.7 cm) 60 W AC adapter when running Prime95 loads. The manufacturer has made no changes to the AC adapter even though the newer processor is more demanding this year. A higher capacity AC adapter could have potentially allowed for better Turbo Boost performance or faster charging when running demanding loads. The GPD Win Max 2, for example, comes with the same Core i7-1260P CPU and yet it ships with a 100 W AC adapter.

| Off / Standby | |
| Idle | |
| Load |
|
Key:
min: | |
| Framework Laptop 13.5 12th Gen Intel i7-1260P, Iris Xe G7 96EUs, WDC PC SN730 SDBPNTY-512G, IPS, 2256x1504, 13.5" | Framework Laptop 13.5 i7-1165G7, Iris Xe G7 96EUs, Western Digital WD_BLACK SN850 WDS100T1X0E, IPS, 2256x1504, 13.5" | Lenovo ThinkPad X1 Titanium Yoga G1 20QB0016GE i5-1140G7, Iris Xe G7 80EUs, Lenovo UMIS RPJTJ256MEE1OWX, IPS LED, 2256x1504, 13.5" | HP EliteBook Folio 13.5-3G2L2EA SD 8cx Gen 2 5G, Adreno 680, Toshiba XG6 KXG60ZNV512G, IPS, 1920x1280, 13.5" | Microsoft Surface Laptop 4 13 Ryzen 5 R5 4680U, Vega 7, Samsung PM991 MZ9LQ256HBJQ, IPS, 2256x1504, 13.5" | HP Spectre x360 14-ea0378ng i7-1165G7, Iris Xe G7 96EUs, Intel Optane Memory H10 with Solid State Storage 32GB + 1TB HBRPEKNX0203AH(L/H), OLED, 3000x2000, 13.5" | |
|---|---|---|---|---|---|---|
| Power Consumption | 12% | 30% | 60% | 24% | 3% | |
| Idle Minimum * (Watt) | 5.3 | 4.3 19% | 3.75 29% | 2.3 57% | 3.4 36% | 6.3 -19% |
| Idle Average * (Watt) | 8.4 | 8.2 2% | 7.75 8% | 3.7 56% | 6.3 25% | 11.2 -33% |
| Idle Maximum * (Watt) | 11.2 | 8.7 22% | 8.69 22% | 5.6 50% | 8.1 28% | 13.3 -19% |
| Load Average * (Watt) | 57.4 | 43.5 24% | 33.12 42% | 13 77% | 36.2 37% | 32 44% |
| Witcher 3 ultra * (Watt) | 46.7 | 43.5 7% | 28.7 39% | |||
| Load Maximum * (Watt) | 61.2 | 61.8 -1% | 35.19 42% | 25 59% | 64.1 -5% | 35.6 42% |
* ... smaller is better
Power Consumption Witcher 3 / Stresstest
Power Consumption external Monitor
Battery Life
Runtimes are shorter by just half an hour when compared to last year's model despite the much faster processor performance. 7.5 hours of real-world WLAN usage should be enough for the majority of users even though it's several hours shorter than on the Surface Laptop 4 13.
Charging from empty to full capacity with the included AC adapter takes about 90 minutes. However, charging will slow significantly when running demanding loads due to the 60 W AC adapter as mentioned above.
| Framework Laptop 13.5 12th Gen Intel i7-1260P, Iris Xe G7 96EUs, 55 Wh | Framework Laptop 13.5 i7-1165G7, Iris Xe G7 96EUs, 55 Wh | Lenovo ThinkPad X1 Titanium Yoga G1 20QA001RGE i7-1160G7, Iris Xe G7 96EUs, 44.5 Wh | HP EliteBook Folio 13.5-3G2L2EA SD 8cx Gen 2 5G, Adreno 680, 46 Wh | Microsoft Surface Laptop 4 13 Ryzen 5 R5 4680U, Vega 7, 47.4 Wh | HP Spectre x360 14-ea0378ng i7-1165G7, Iris Xe G7 96EUs, 66 Wh | |
|---|---|---|---|---|---|---|
| Battery Runtime | 7% | 12% | 95% | 45% | 4% | |
| WiFi v1.3 (h) | 7.5 | 8 7% | 8.4 12% | 14.6 95% | 10.9 45% | 7.8 4% |
| H.264 (h) | 11.4 | 11.1 | ||||
| Load (h) | 1.9 | 4.2 | 2.6 | |||
| Reader / Idle (h) | 13.4 |
Pros
Cons
Verdict — A Long Term Solution
Framework had promised that its laptop design would allow for easy upgrades whenever the latest processor generation became available. The 2022 model has done exactly that with both DIY motherboard upgrade kits for existing owners or ready-to-go configurations for newcomers wanting to jump onboard. When compared to the 2021 model with Intel 11th gen, the 2022 model can offer a CPU performance boost of up to 90 percent that enthusiasts can surely appreciate. It comes at the cost of warmer core temperatures and slightly shorter battery life, however, but the trade-offs may be worth it depending on the usage scenarios.
Other than the CPU upgrade, the experience remains the same which can be both good and bad. It's good for the guaranteed consistency and predictability between yearly refreshes, but it's also bad as certain drawbacks can't be addressed very easily. Newer Ultrabooks like those from Asus, for example, are starting to ship with both Intel/AMD and high refresh rate OLED displays while the Framework model continues to have just one display option and no Ryzen CPUs. The base and lid are still more susceptible to creaking and twisting than the flagship models from Dell, HP, or Lenovo. We would love to see WAN and IR options as well perhaps in the form of an expansion card if internal motherboard changes are not possible. Including some of these features could be difficult as the manufacturer is limited to its original 2021 chassis design and parts.
Even with the perceived challenges in mind, they don't take away from the high customization or user-friendly design of the Framework Laptop. Owners who value repairability and easy-to-acquire replacement parts for their expensive products will find the Framework Laptop less frustrating to use than a closed alternative like the Surface Laptop.
Price and Availability
Framework is now taking orders for its 12th gen Intel Laptop starting at $1050 USD for the Core i5 version or $1450 USD for our review configuration.
Framework Laptop 13.5 12th Gen Intel
- 07/12/2022 v7 (old)
Allen Ngo
More articles related to this device
Framework Laptop 13.5 12th Gen Intel (Laptop Series)Related Articles


Price comparison
