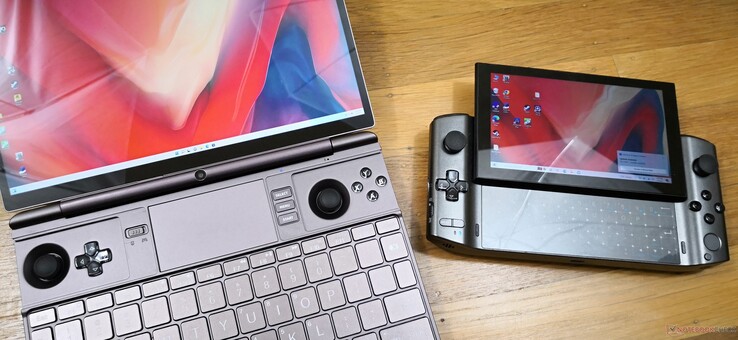
GPD Win Max 2 handheld gaming PC review: Intel Core i7-1260P or AMD Ryzen 7 6800U?
GPD has been making headlines with its growing lineup of handheld PCs equipped with hardware fast enough for gaming purposes. Last year alone saw the launch of three such models: the Win 3, Win Max, and Pocket 3 each with their own unique designs and twists on how gaming-on-the-go can be like.
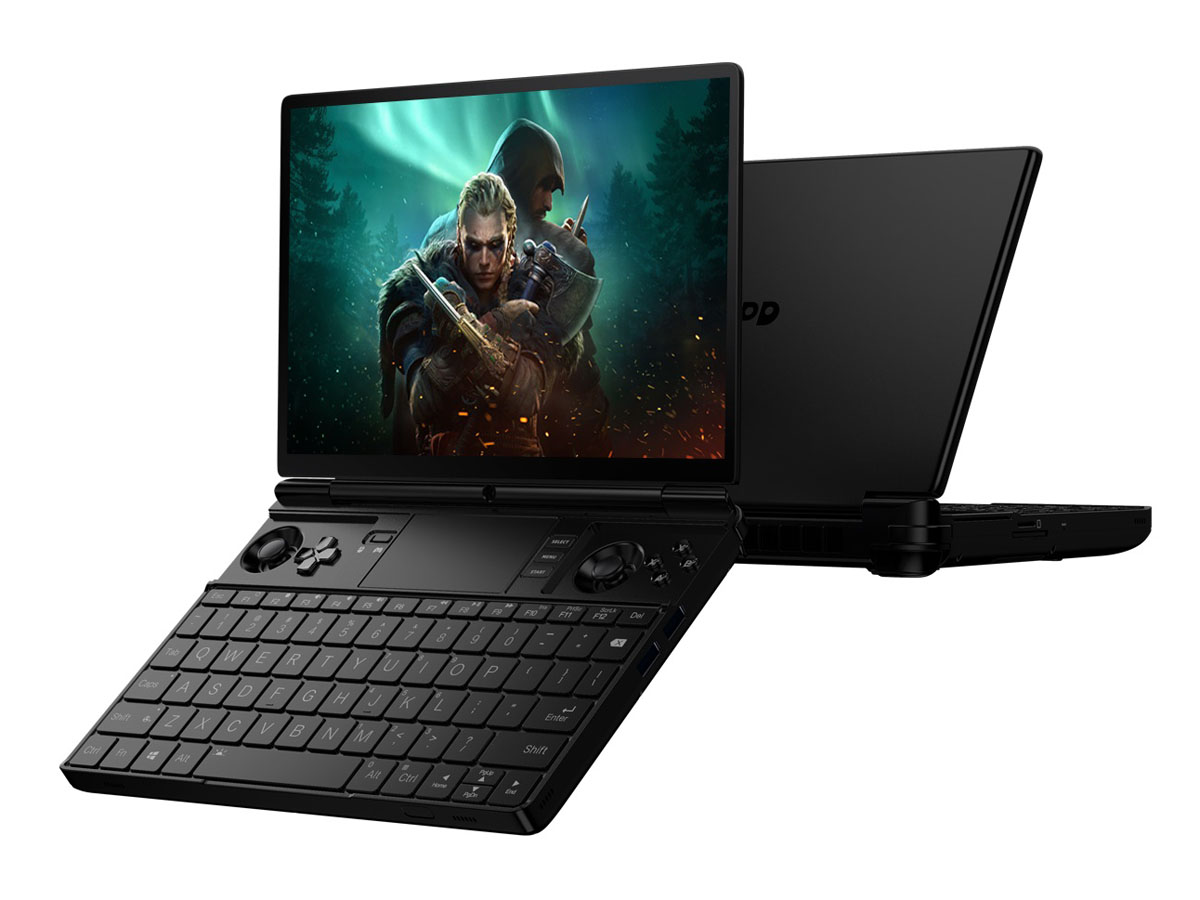
For 2022, GPD has introduced the Win Max 2 to directly replace the first generation 2021 Win Max. This latest model is a complete redesign of the first model with even more auxiliary features and faster hardware. Users can choose between the Intel 12th gen Core i7-1260P or AMD Ryzen 7 6800U with integrated Iris Xe or Radeon 680M graphics, respectively. Each version is expected to retail for $1000 USD.
The Win Max 2 is unique in its space as it is one of the only 10.1-inch laptops shipping with an Intel Alder Lake-P CPU for a very high level of performance relative to its size category. More information and specifications can be found on its official product page here. This review focuses on the Intel version of the model.
More GPD reviews:
Potential Competitors in Comparison
Rating | Date | Model | Weight | Height | Size | Resolution | Price |
|---|---|---|---|---|---|---|---|
| 84.5 % v7 (old) | 07 / 2022 | GPD Win Max 2 i7-1260P, Iris Xe G7 96EUs | 1 kg | 23 mm | 10.10" | 2560x1600 | |
| 86.3 % v7 (old) | 11 / 2021 | GPD Pocket 3 i7-1195G7, Iris Xe G7 96EUs | 730 g | 20 mm | 8.00" | 1920x1200 | |
| 79.3 % v7 (old) | 08 / 2021 | GPD Win Max 2021 R7 4800U, Vega 8 | 850 g | 26 mm | 8.00" | 1280x800 | |
v (old) | 01 / 2021 | GPD Win 3 i5-1135G7, Iris Xe G7 80EUs | 553 g | 27 mm | 5.50" | 1280x720 | |
| 85.3 % v7 (old) | 10 / 2021 | Microsoft Surface Go 3 Core i3 i3-10100Y, UHD Graphics 615 | 783 g | 8.3 mm | 10.50" | 1920x1280 | |
| 78.1 % v7 (old) | 07 / 2020 | Lenovo IdeaPad Flex 3 11IGL05 Celeron N4020, UHD Graphics 600 | 1.1 kg | 17.5 mm | 11.60" | 1366x768 |
Case — Familiar Feel
GPD utilizes similar metal materials across its products and so they all share the same texture, feel, and look. Even so, build quality is better than on the original Win Max as both the base and lid exhibit only minimal flexing and almost no creaking. It's also an improvement over the Win 3 which we found to be somewhat fragile in regards to its sliding mechanism.
New to the series are the two removable magnetic covers for the joysticks. Their usefulness is mostly superficial for users who want to cover up the controller buttons during classrooms or meetings.
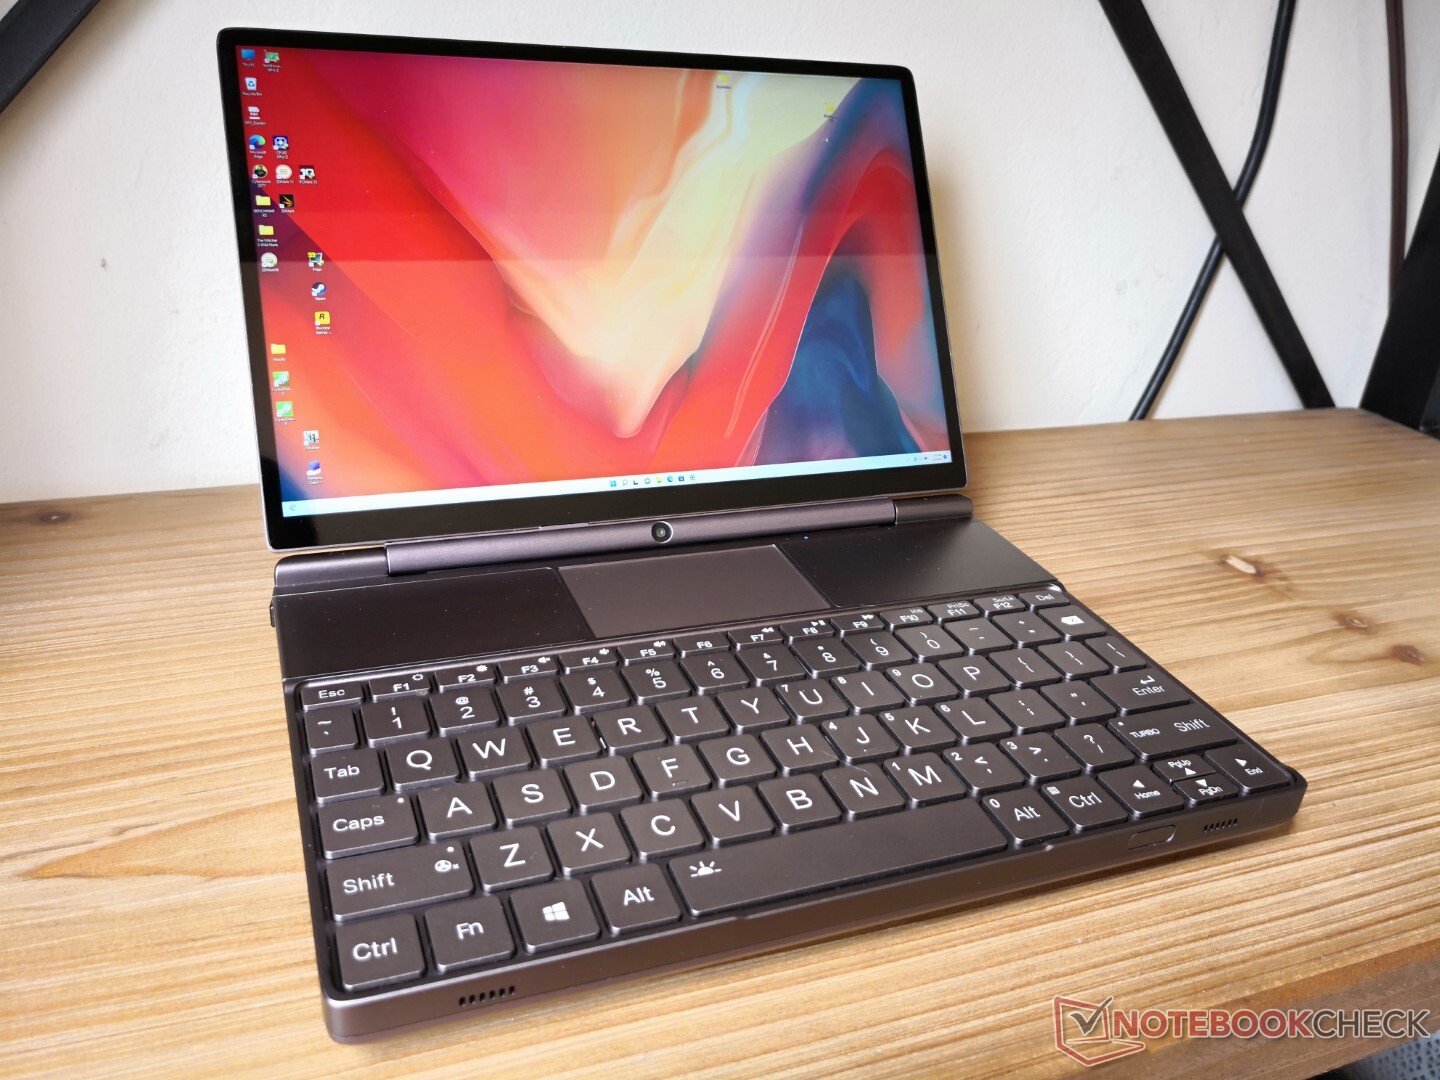
The much larger screen size of the Win Max 2 over the original Win Max means the newer model is both heavier and larger than its predecessor even after accounting for the narrower display bezels. Nonetheless, it is still lighter than most laptops at just over 1 kg and its portability can't be understated.
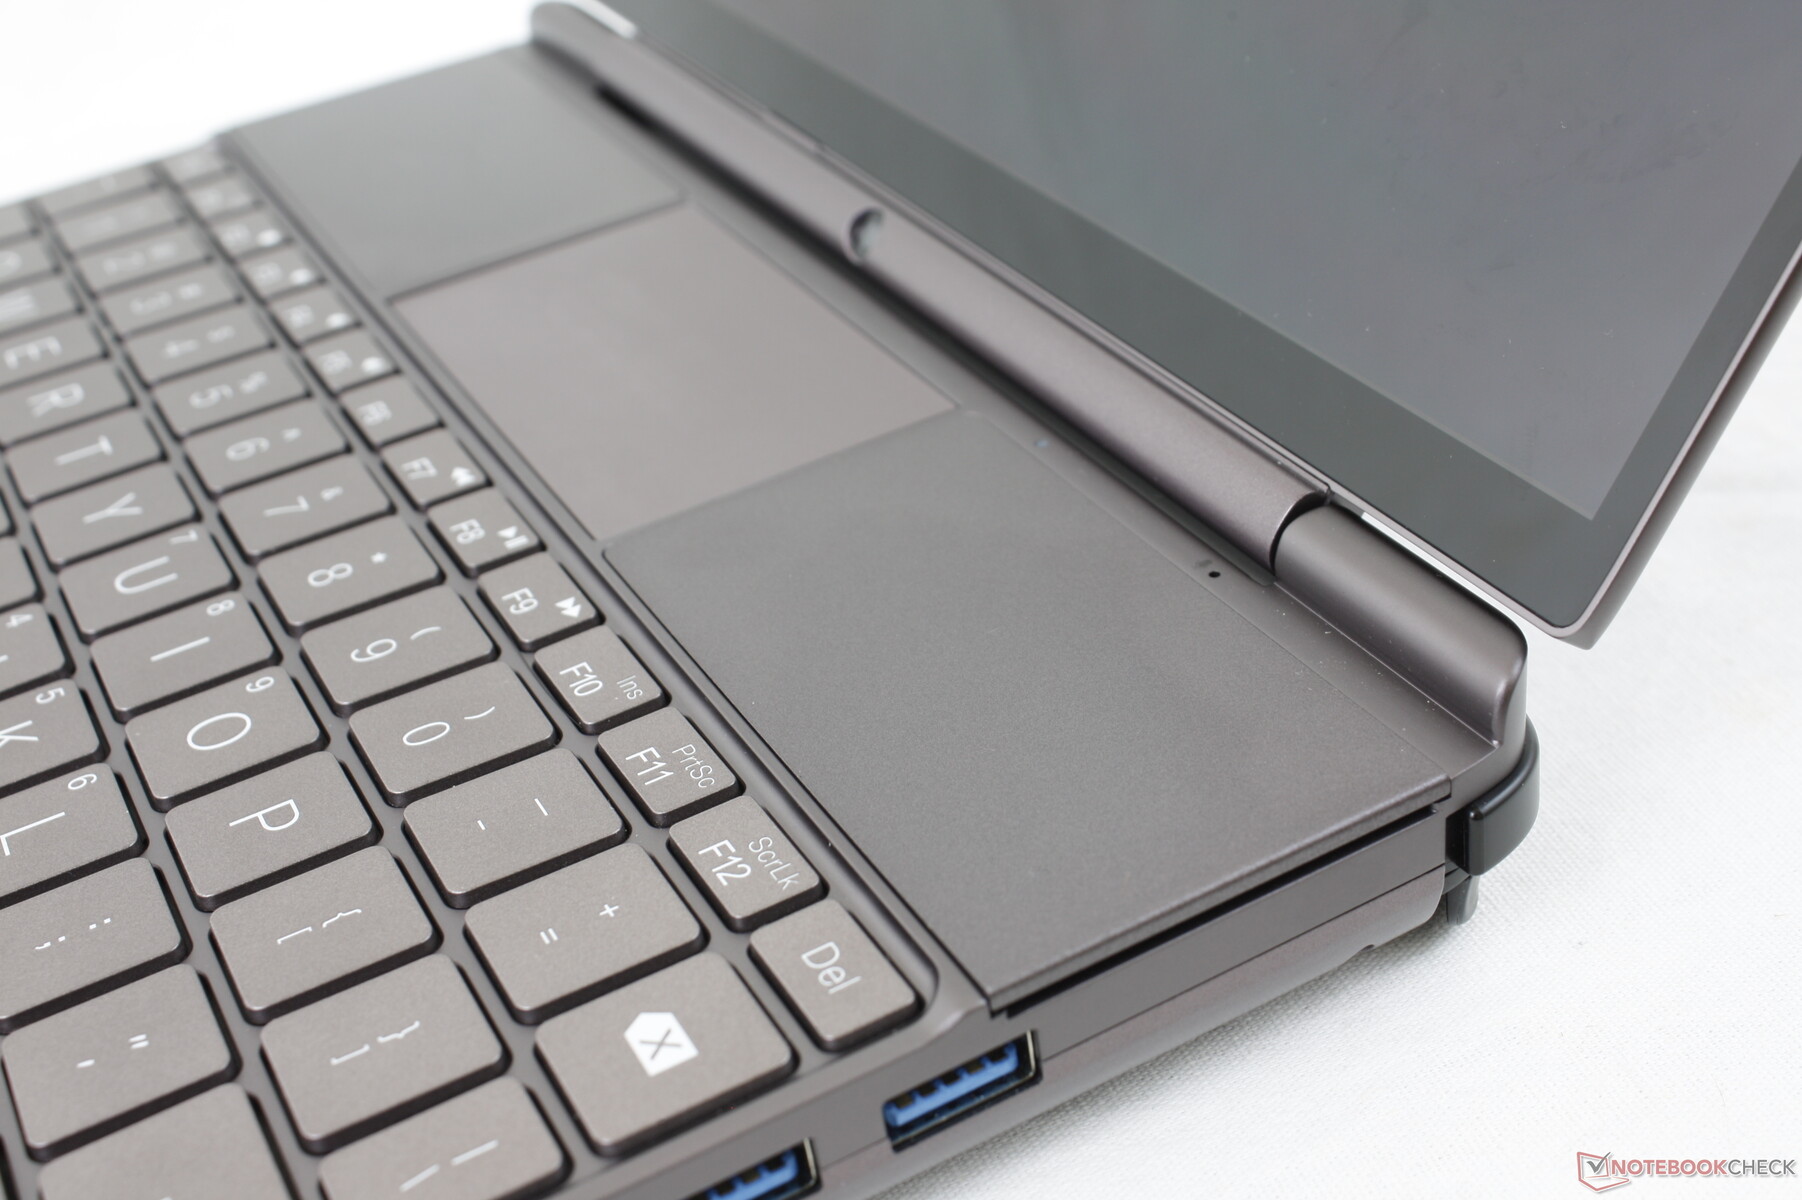

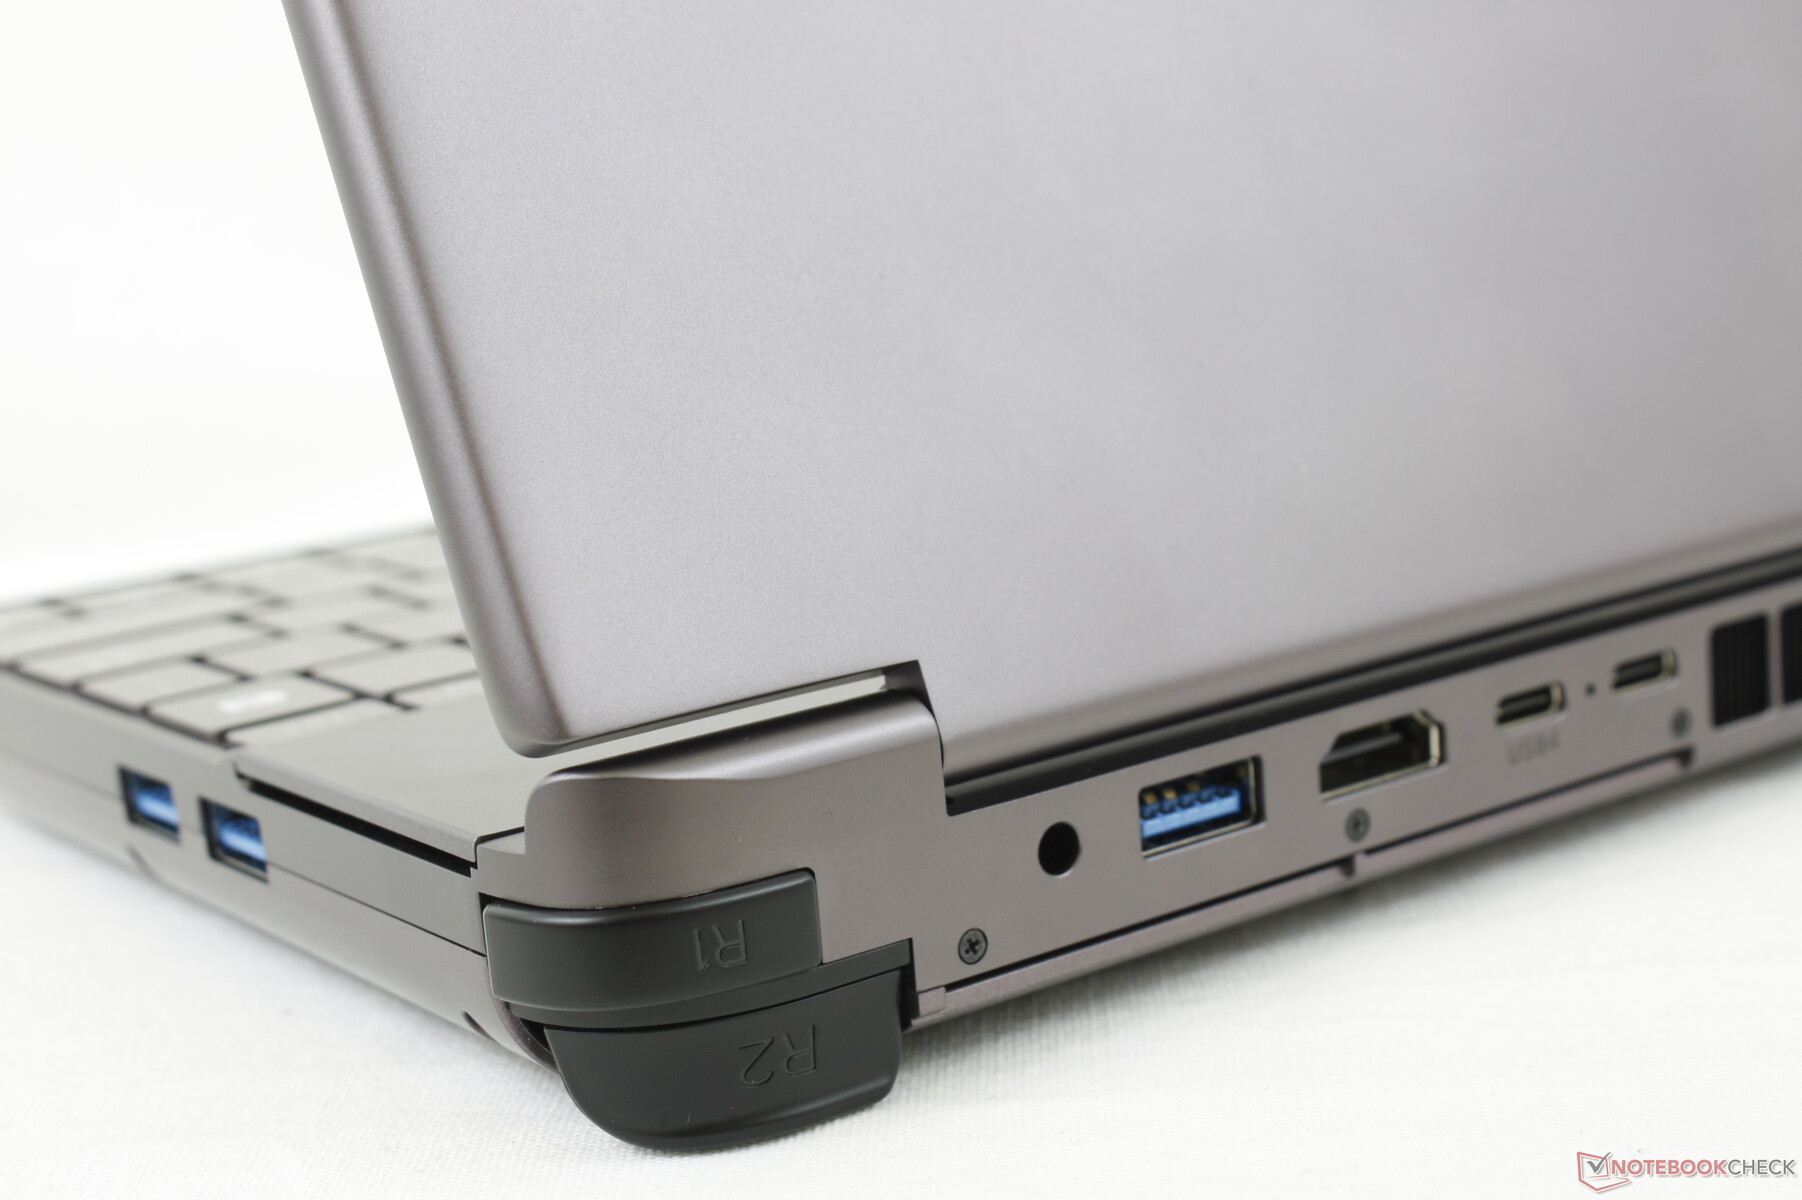
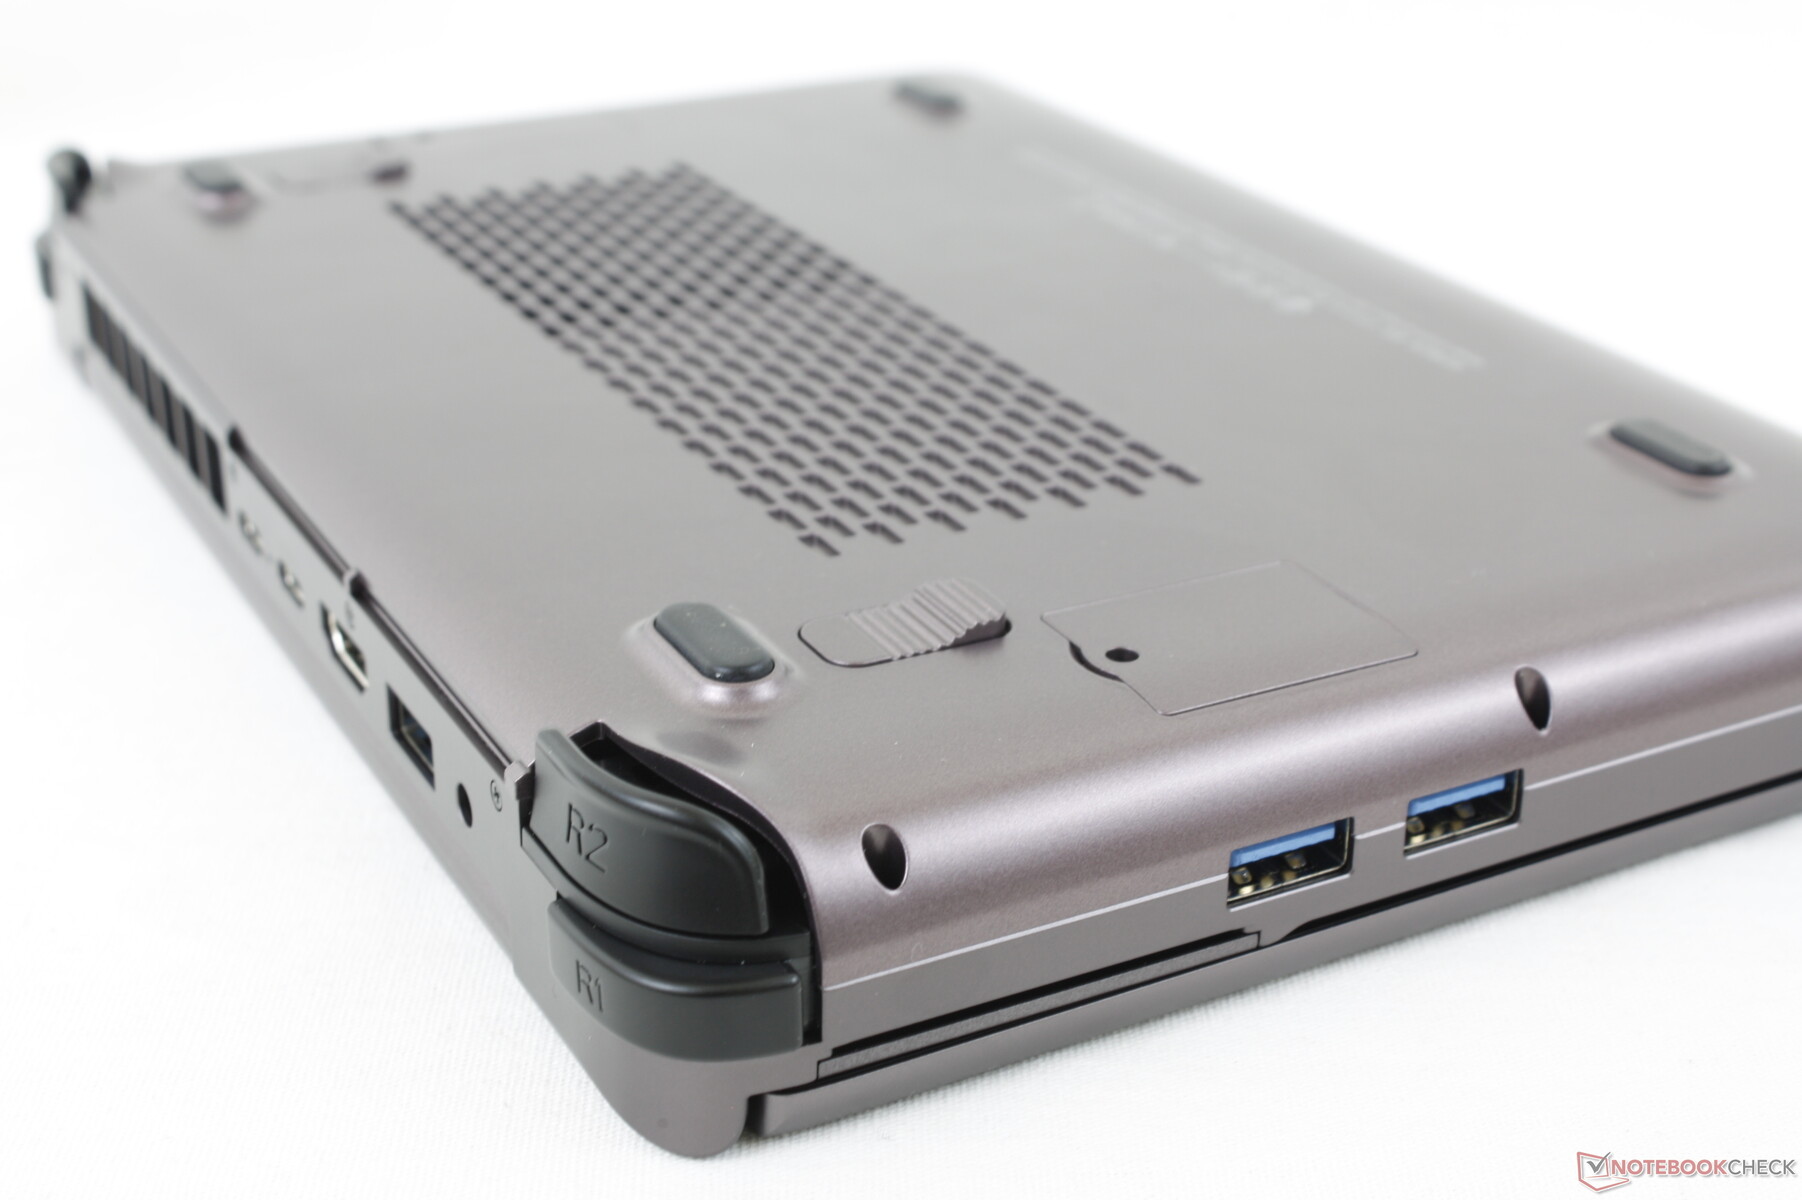
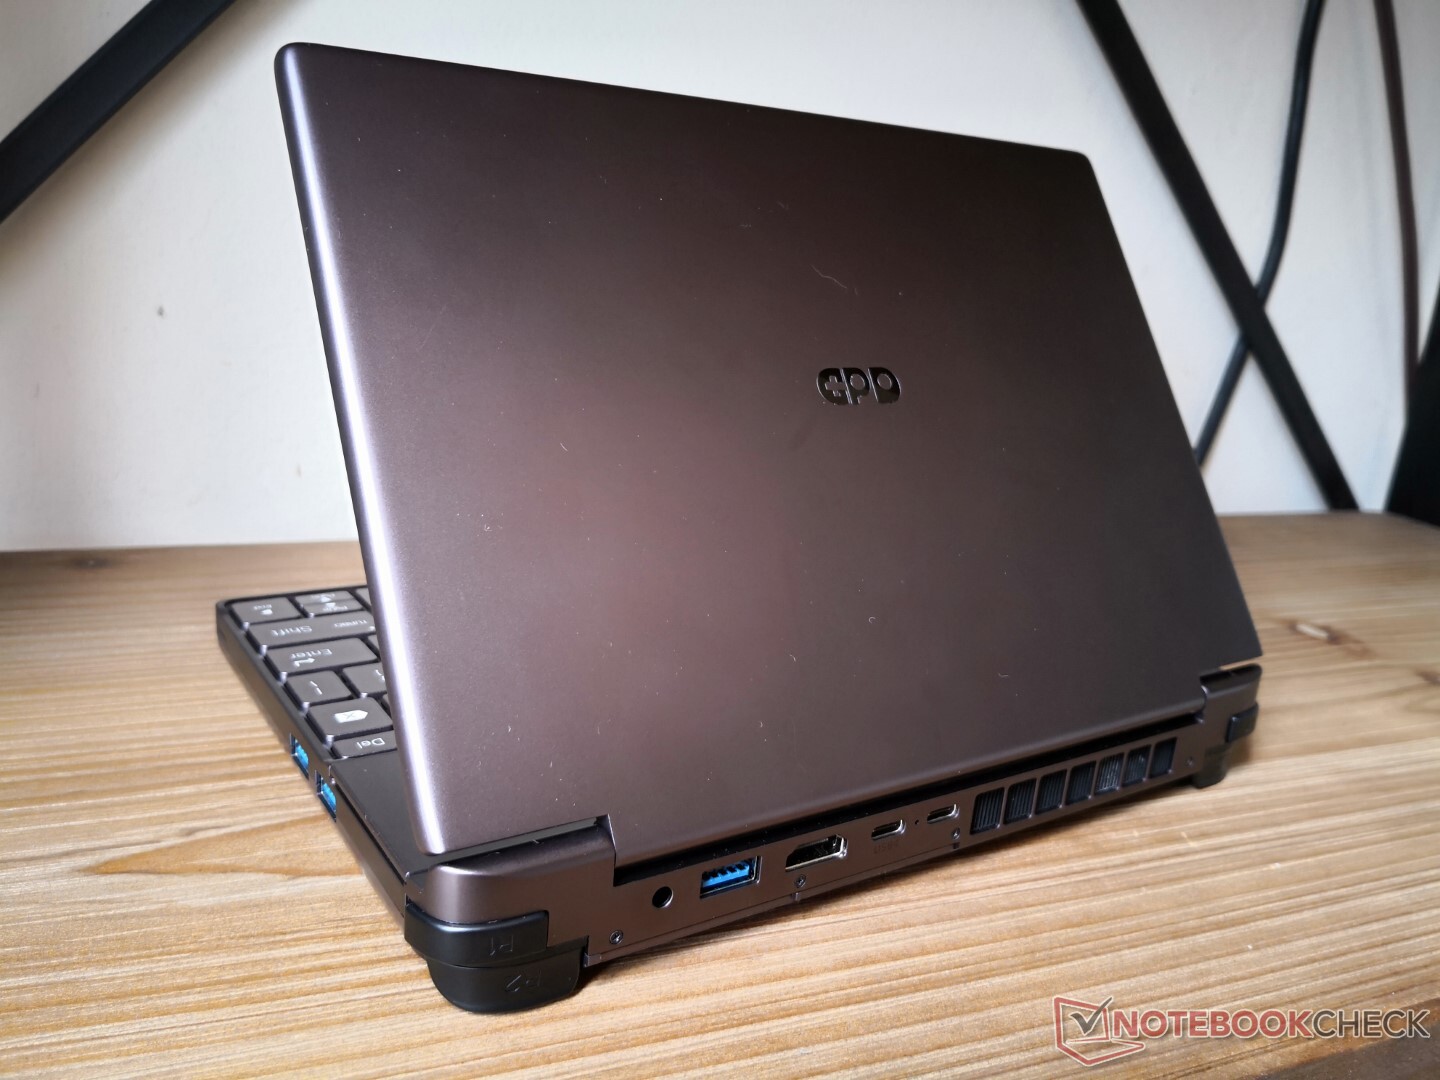
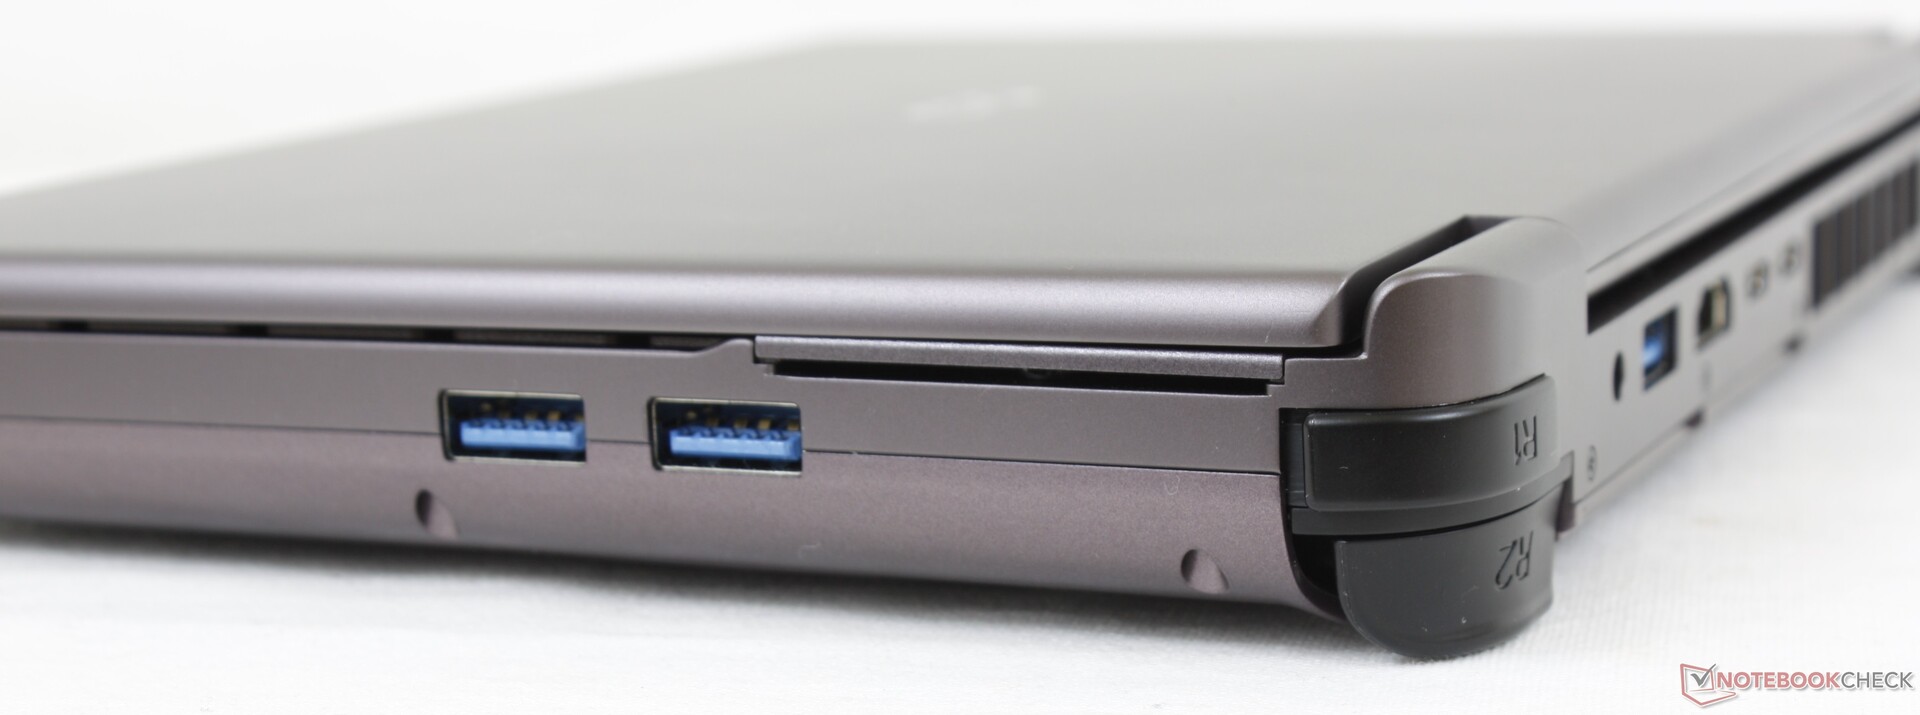
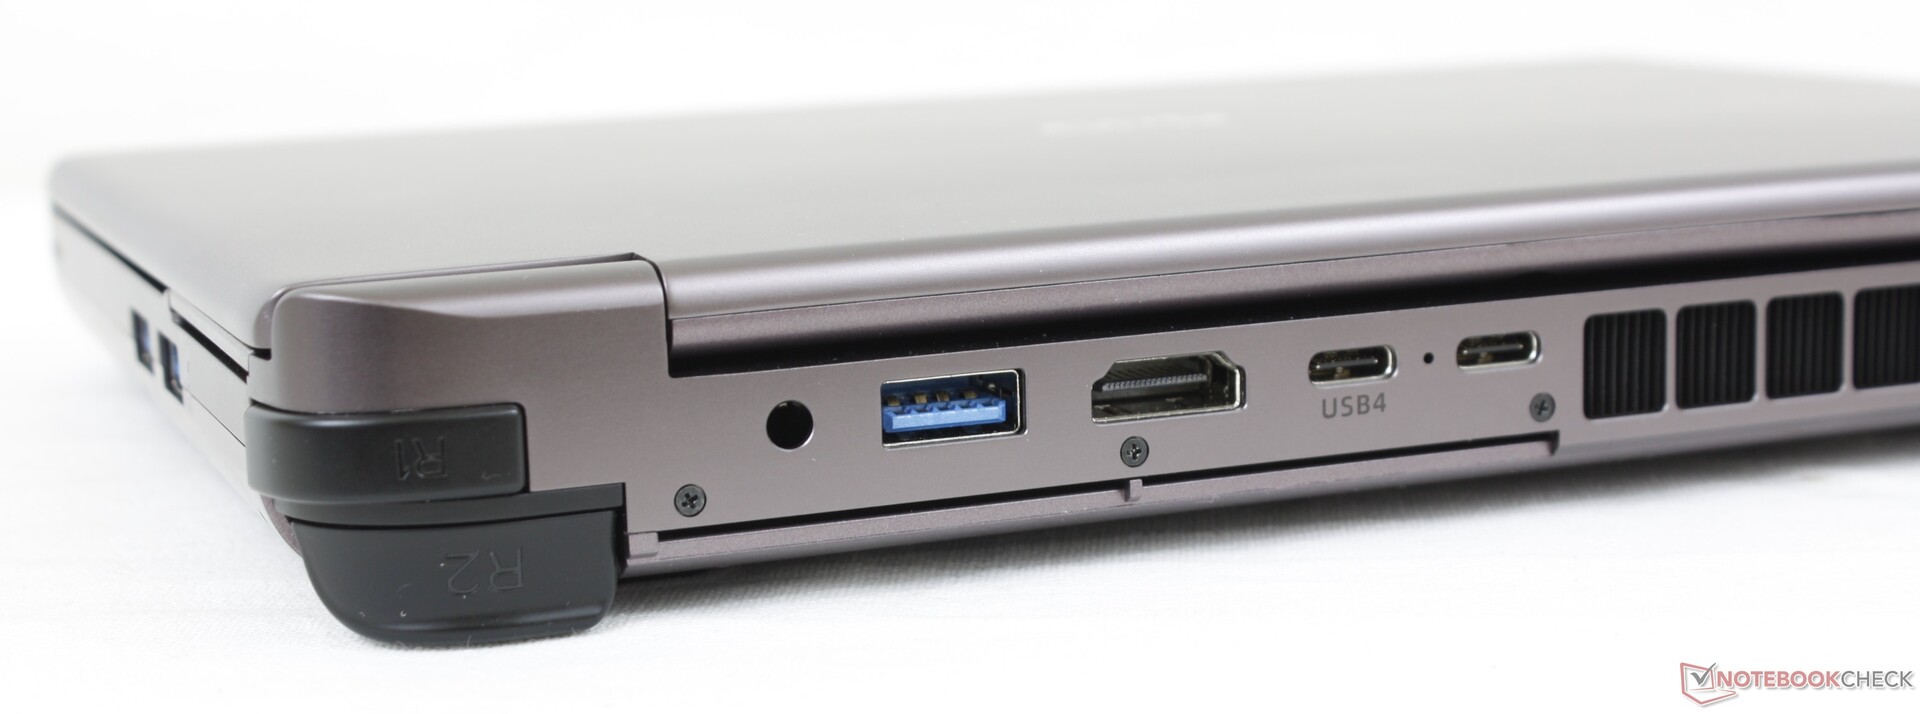
Connectivity — No Thunderbolt For AMD Version
The Win Max 2 has dropped the RJ-45 port as found on the original Win Max for an extra USB-A port and a full-size SD card reader. Thunderbolt 4 is supported only for the Intel SKU.
Note that the HDMI and USB-A ports are upside-down which can be a little annoying as they are almost always right-side up on laptops.
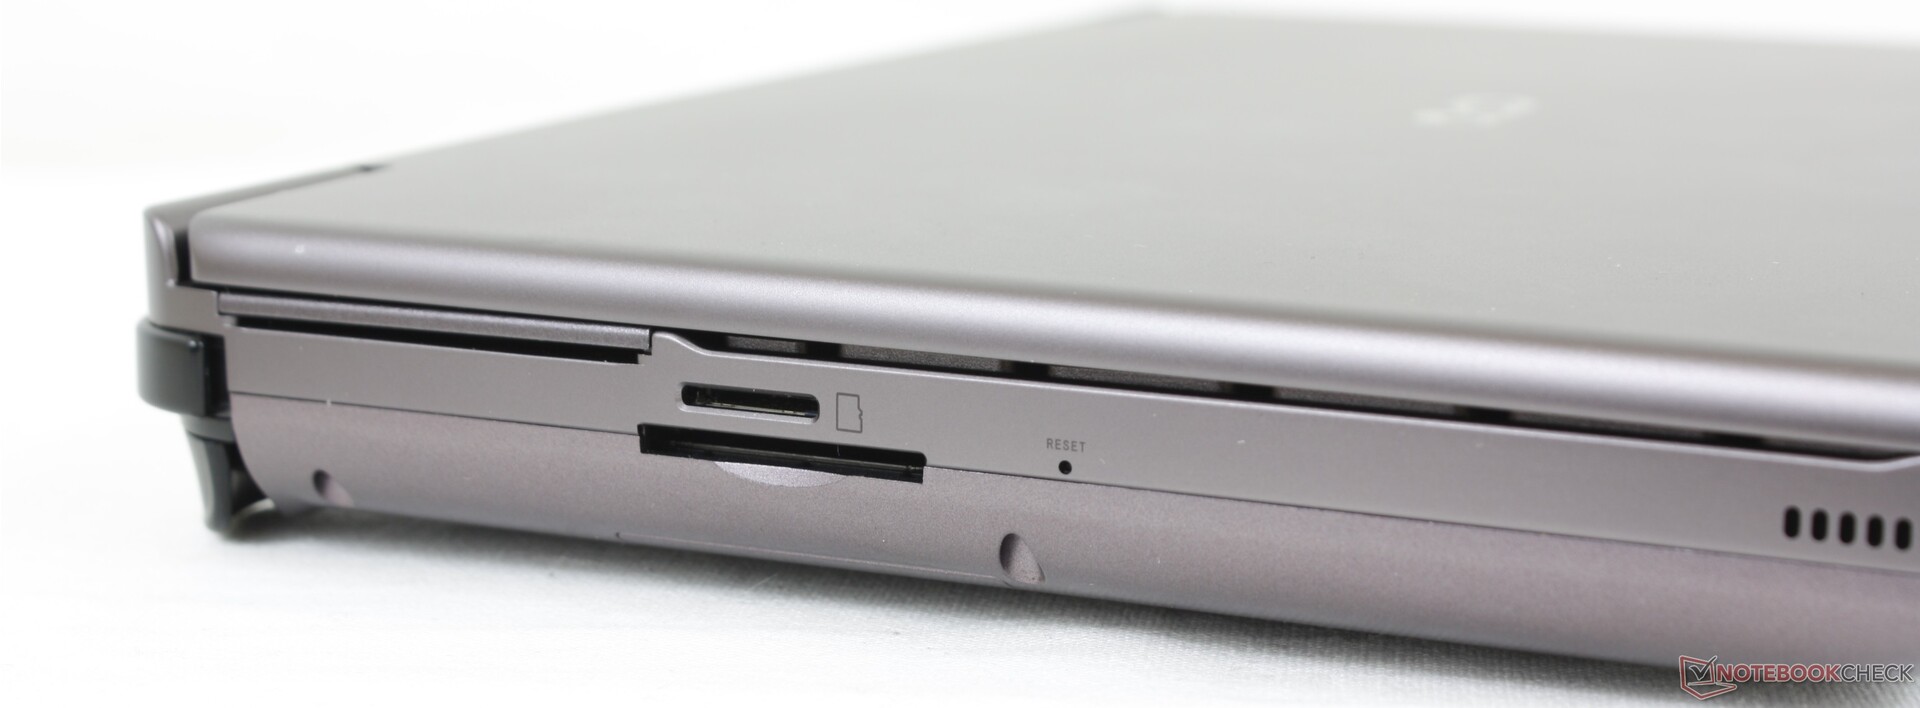
SD Card Reader — Two To Choose From
The Win Max 2 is one of the few devices with both MicroSD and standard size SD readers. Not only that, but their transfer rates differ from one another as well. Our UHS-II test card on the full-size reader would show transfer rates of 239 MB/s compared to only 91 MB/s on the MicroSD reader. Thus, you're going to want to stick with the full-size SD slot when transferring large files.
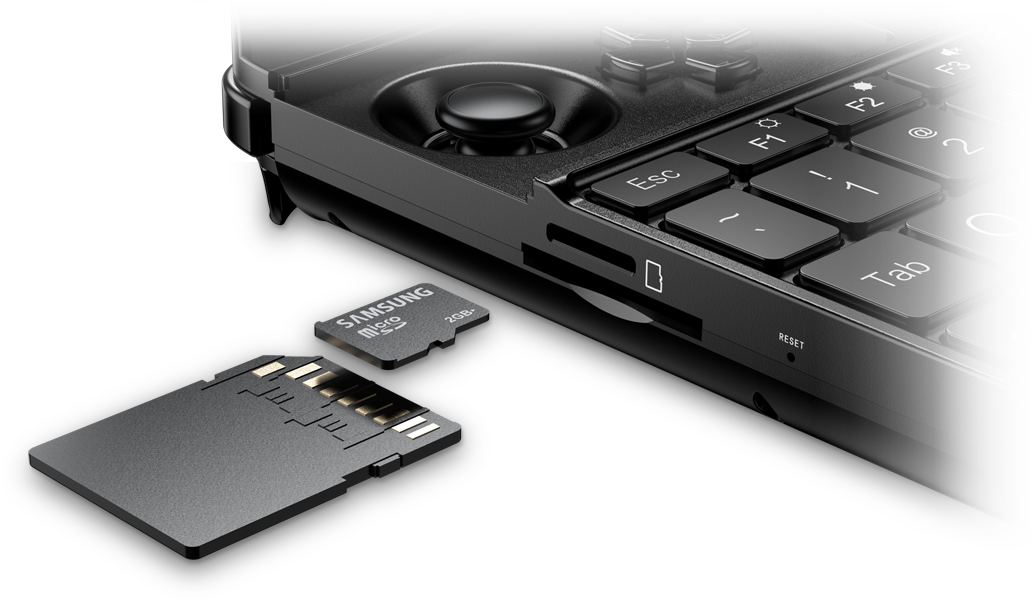
Keep in mind that the full-size SD card must be inserted upside-down while the MicroSD card should be inserted right-side up as shown by the official GPD image.
| SD Card Reader | |
| average JPG Copy Test (av. of 3 runs) | |
| GPD Win Max 2 (Toshiba Exceria Pro SDXC 64 GB UHS-II) | |
| GPD Win 3 (Toshiba Exceria Pro M501 32 GB UHS-II) | |
| Microsoft Surface Go 3 Core i3 (AV Pro V60) | |
| Lenovo IdeaPad Flex 3 11IGL05 (Toshiba Exceria Pro SDXC 64 GB UHS-II) | |
| maximum AS SSD Seq Read Test (1GB) | |
| GPD Win Max 2 (Toshiba Exceria Pro SDXC 64 GB UHS-II) | |
| GPD Win 3 (Toshiba Exceria Pro M501 32 GB UHS-II) | |
| Lenovo IdeaPad Flex 3 11IGL05 (Toshiba Exceria Pro SDXC 64 GB UHS-II) | |
| Microsoft Surface Go 3 Core i3 (AV Pro V60) | |
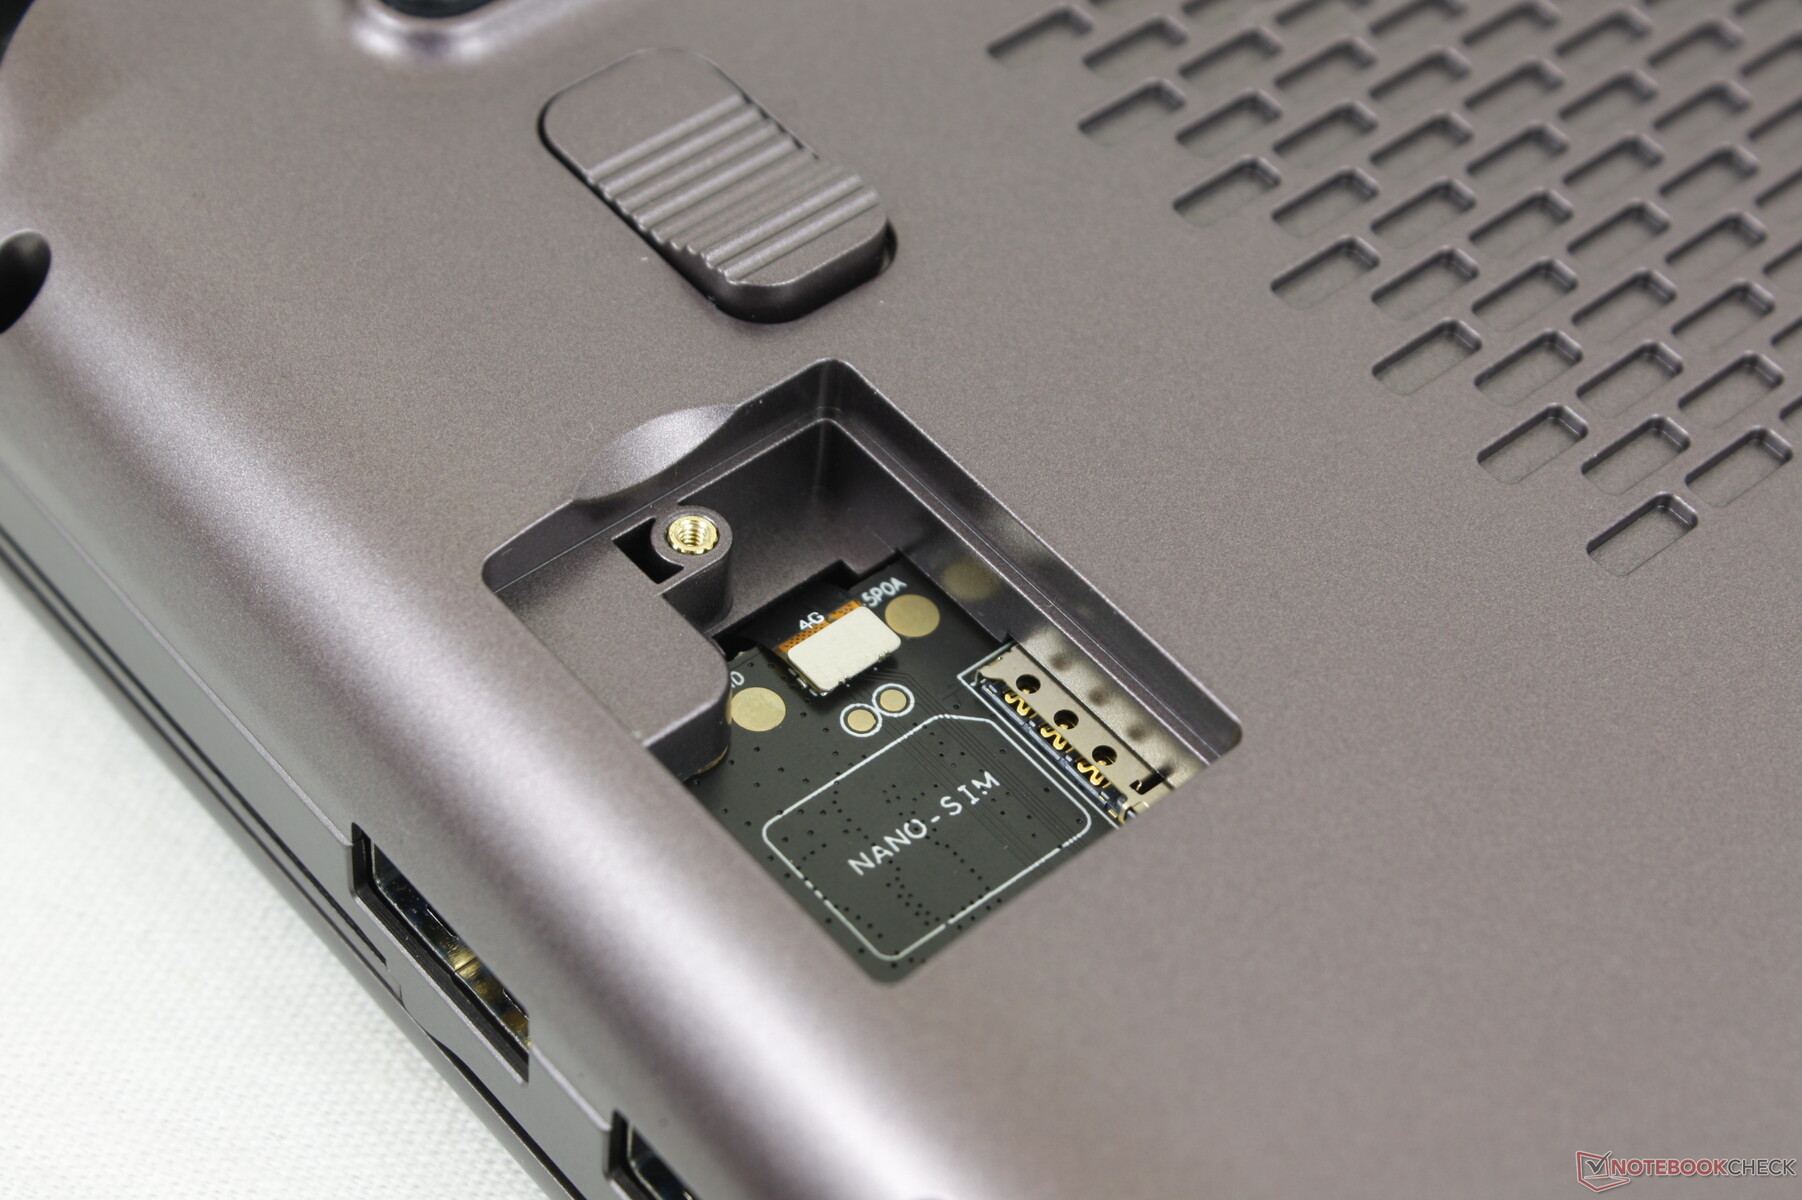
Communication — Wi-Fi 6E Standard
We experienced no performance issues when connected to our 6 GHz network. The AX210 is a huge upgrade over the Intel 7265 in last year's Win Max that was limited to only Wi-Fi 5 speeds.
| Networking | |
| iperf3 transmit AX12 | |
| Microsoft Surface Go 3 Core i3 | |
| GPD Win 3 | |
| GPD Pocket 3 | |
| Lenovo IdeaPad Flex 3 11IGL05 | |
| GPD Win Max 2021 | |
| iperf3 receive AX12 | |
| GPD Win 3 | |
| Microsoft Surface Go 3 Core i3 | |
| GPD Pocket 3 | |
| Lenovo IdeaPad Flex 3 11IGL05 | |
| GPD Win Max 2021 | |
| iperf3 receive AXE11000 6GHz | |
| GPD Win Max 2 | |
| iperf3 transmit AXE11000 6GHz | |
| GPD Win Max 2 | |
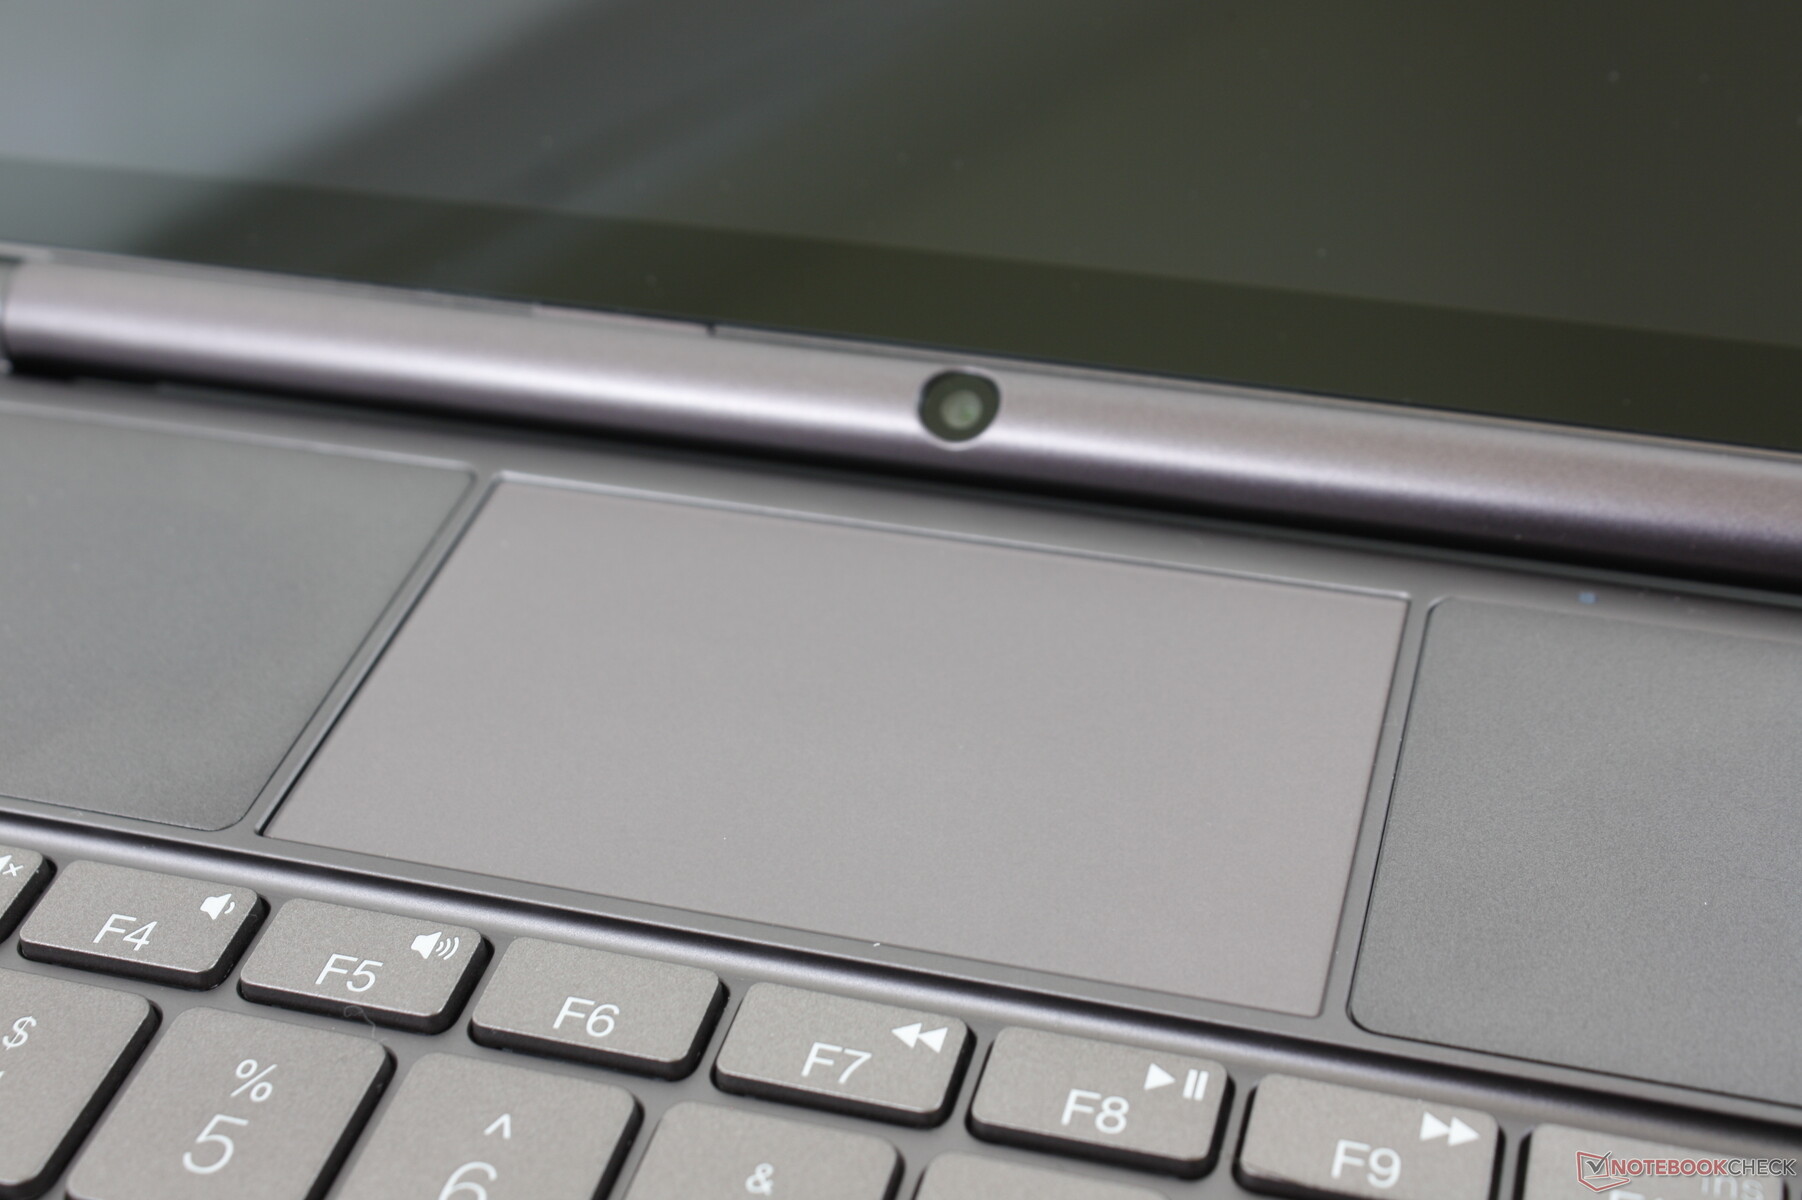
Webcam
The 2 MP camera is disappointing due to both its muddy picture quality and suboptimal positioning along the bottom edge of the screen instead of the top. It's essentially the "nose cam" all over again. Furthermore, there is no privacy shutter or Windows Hello IR support.


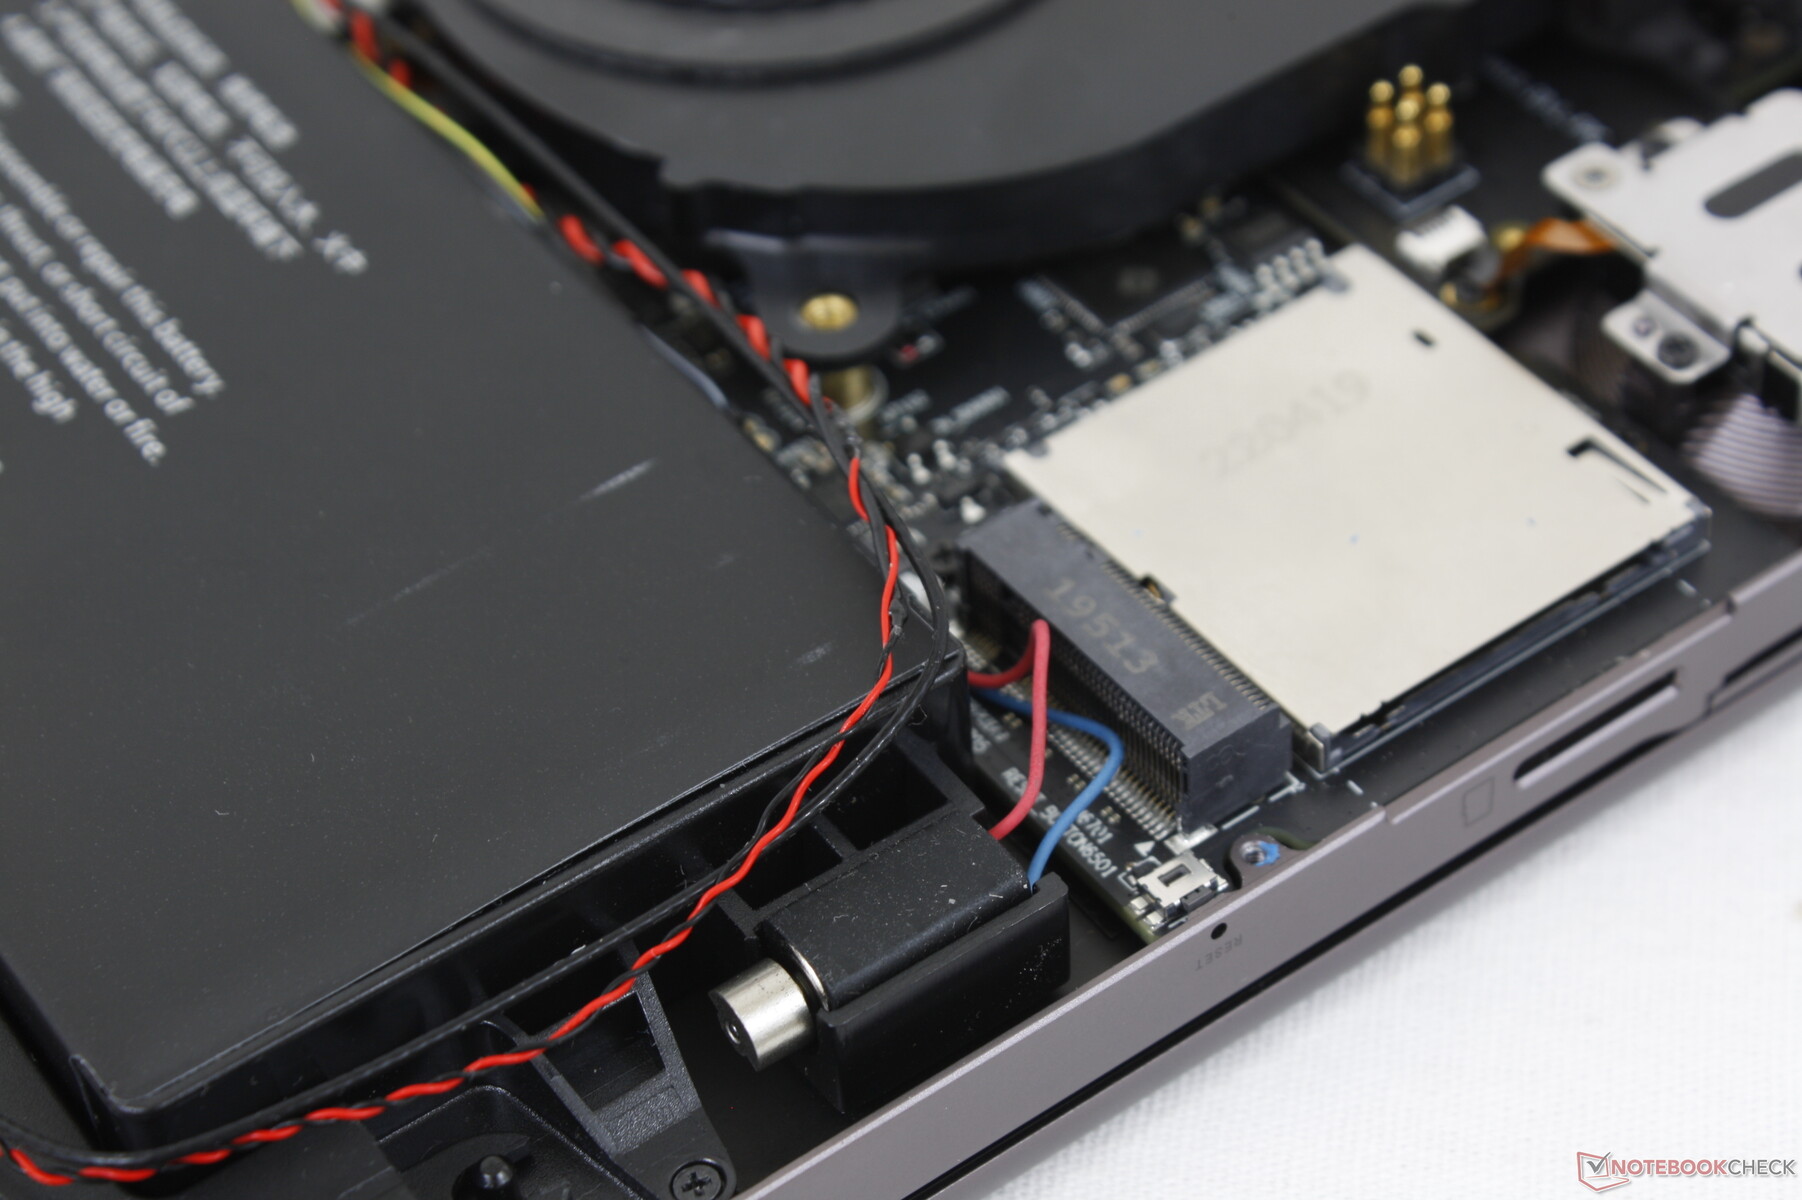
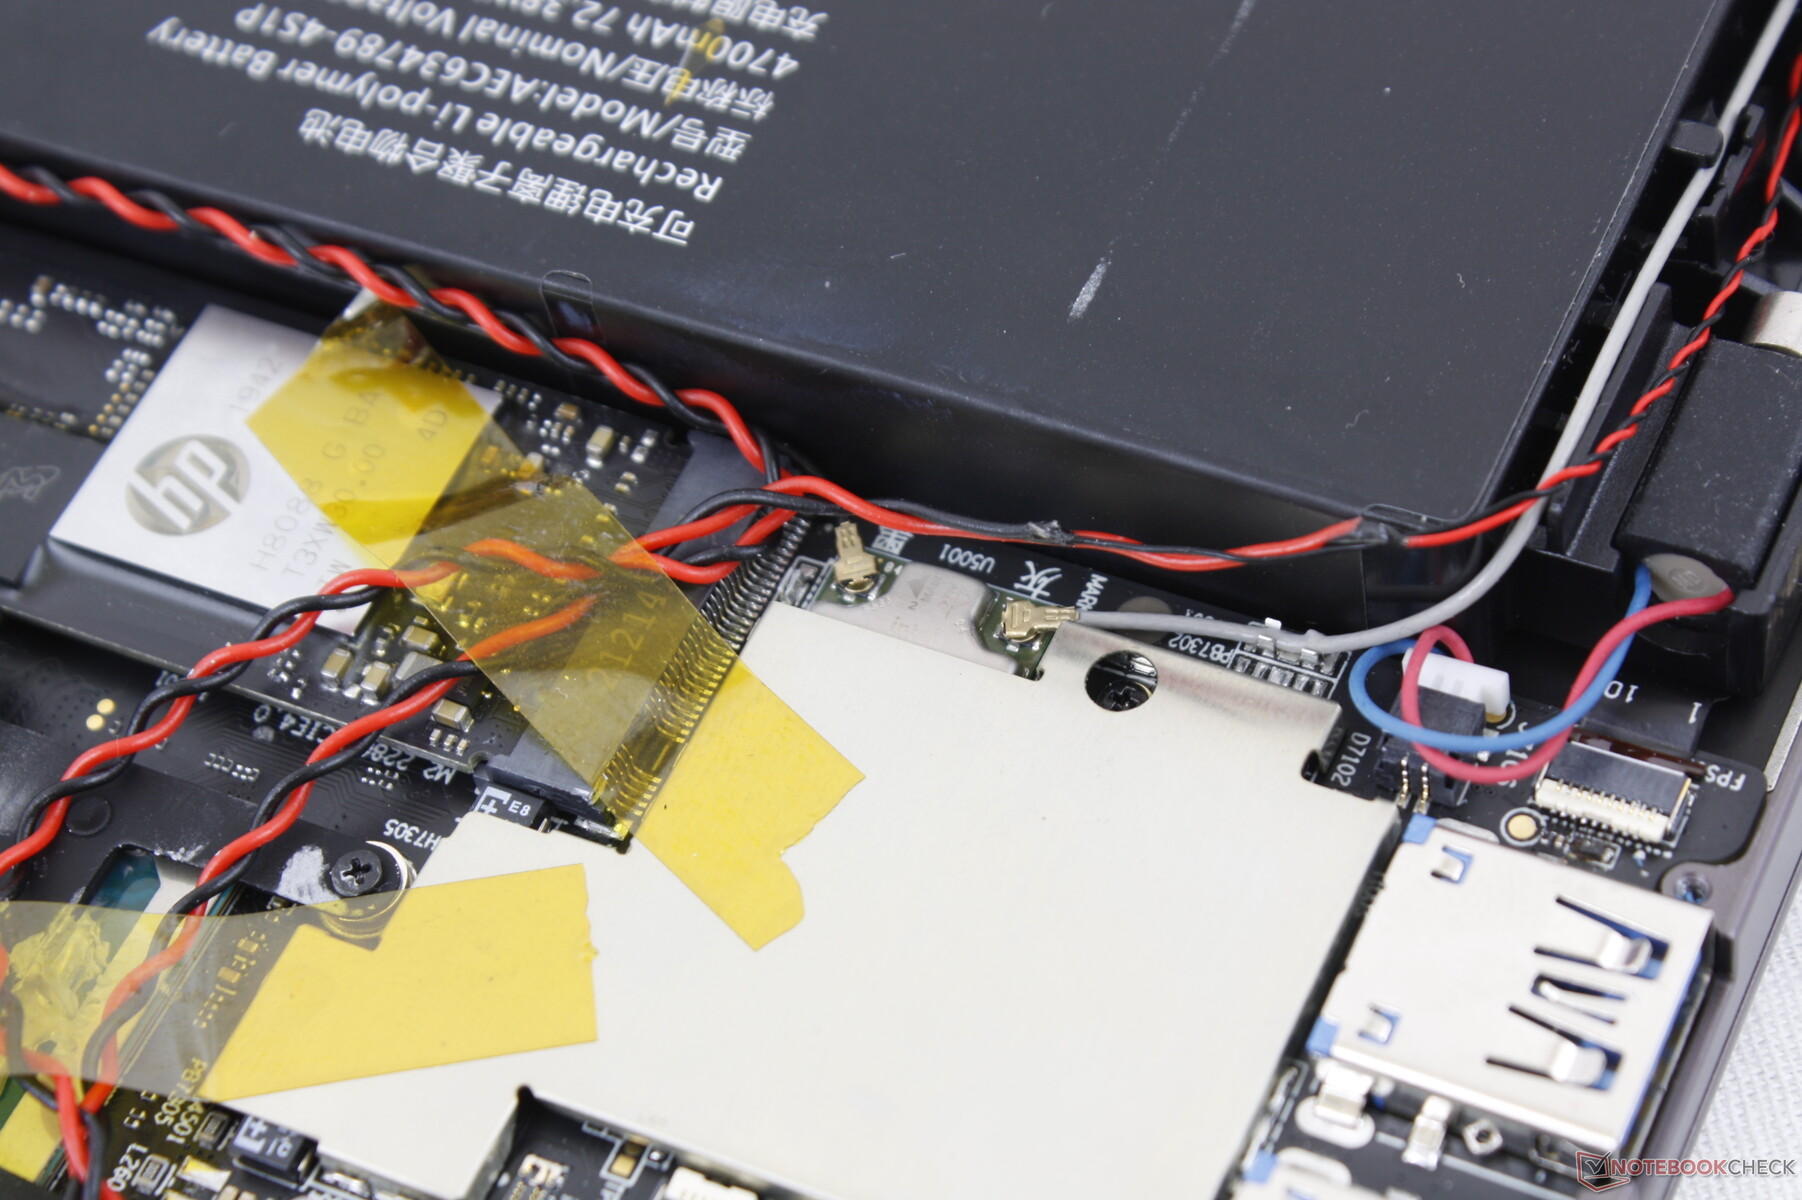
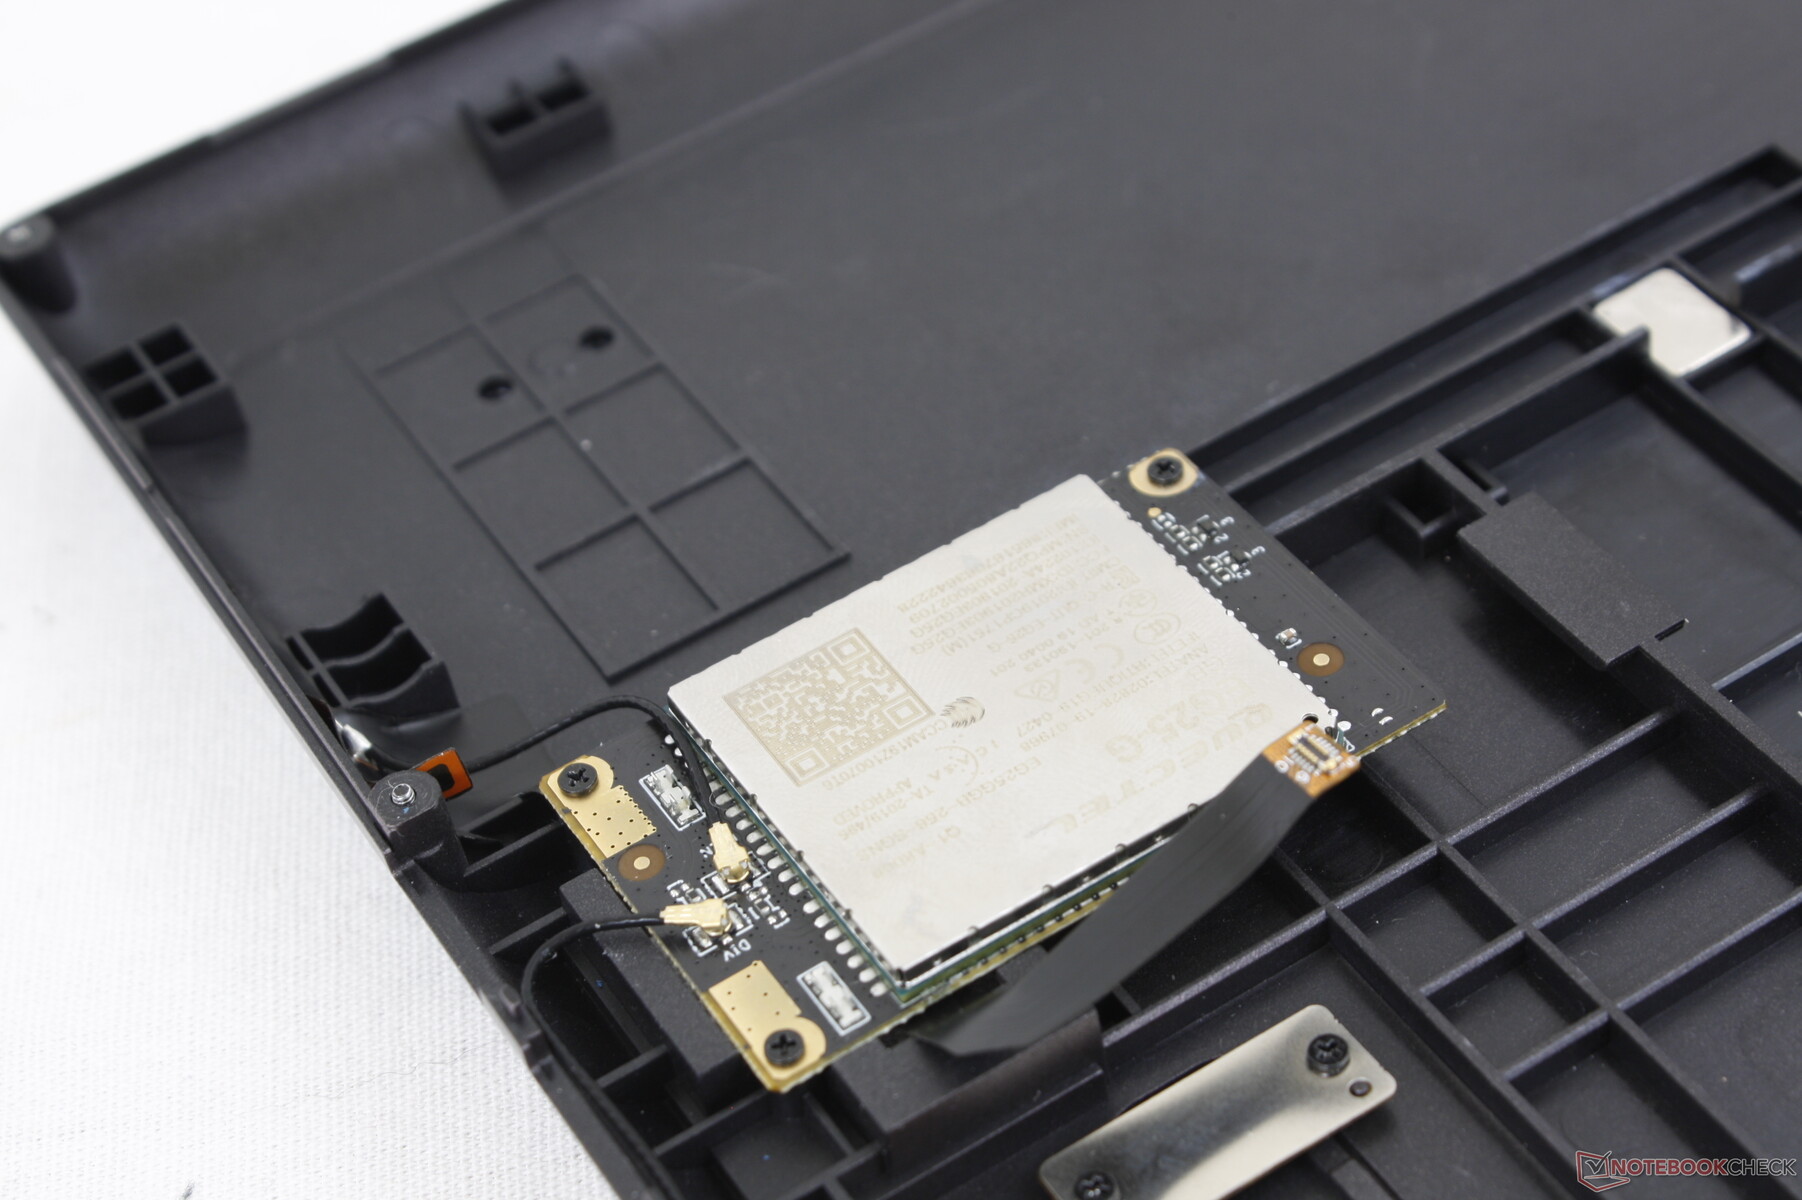
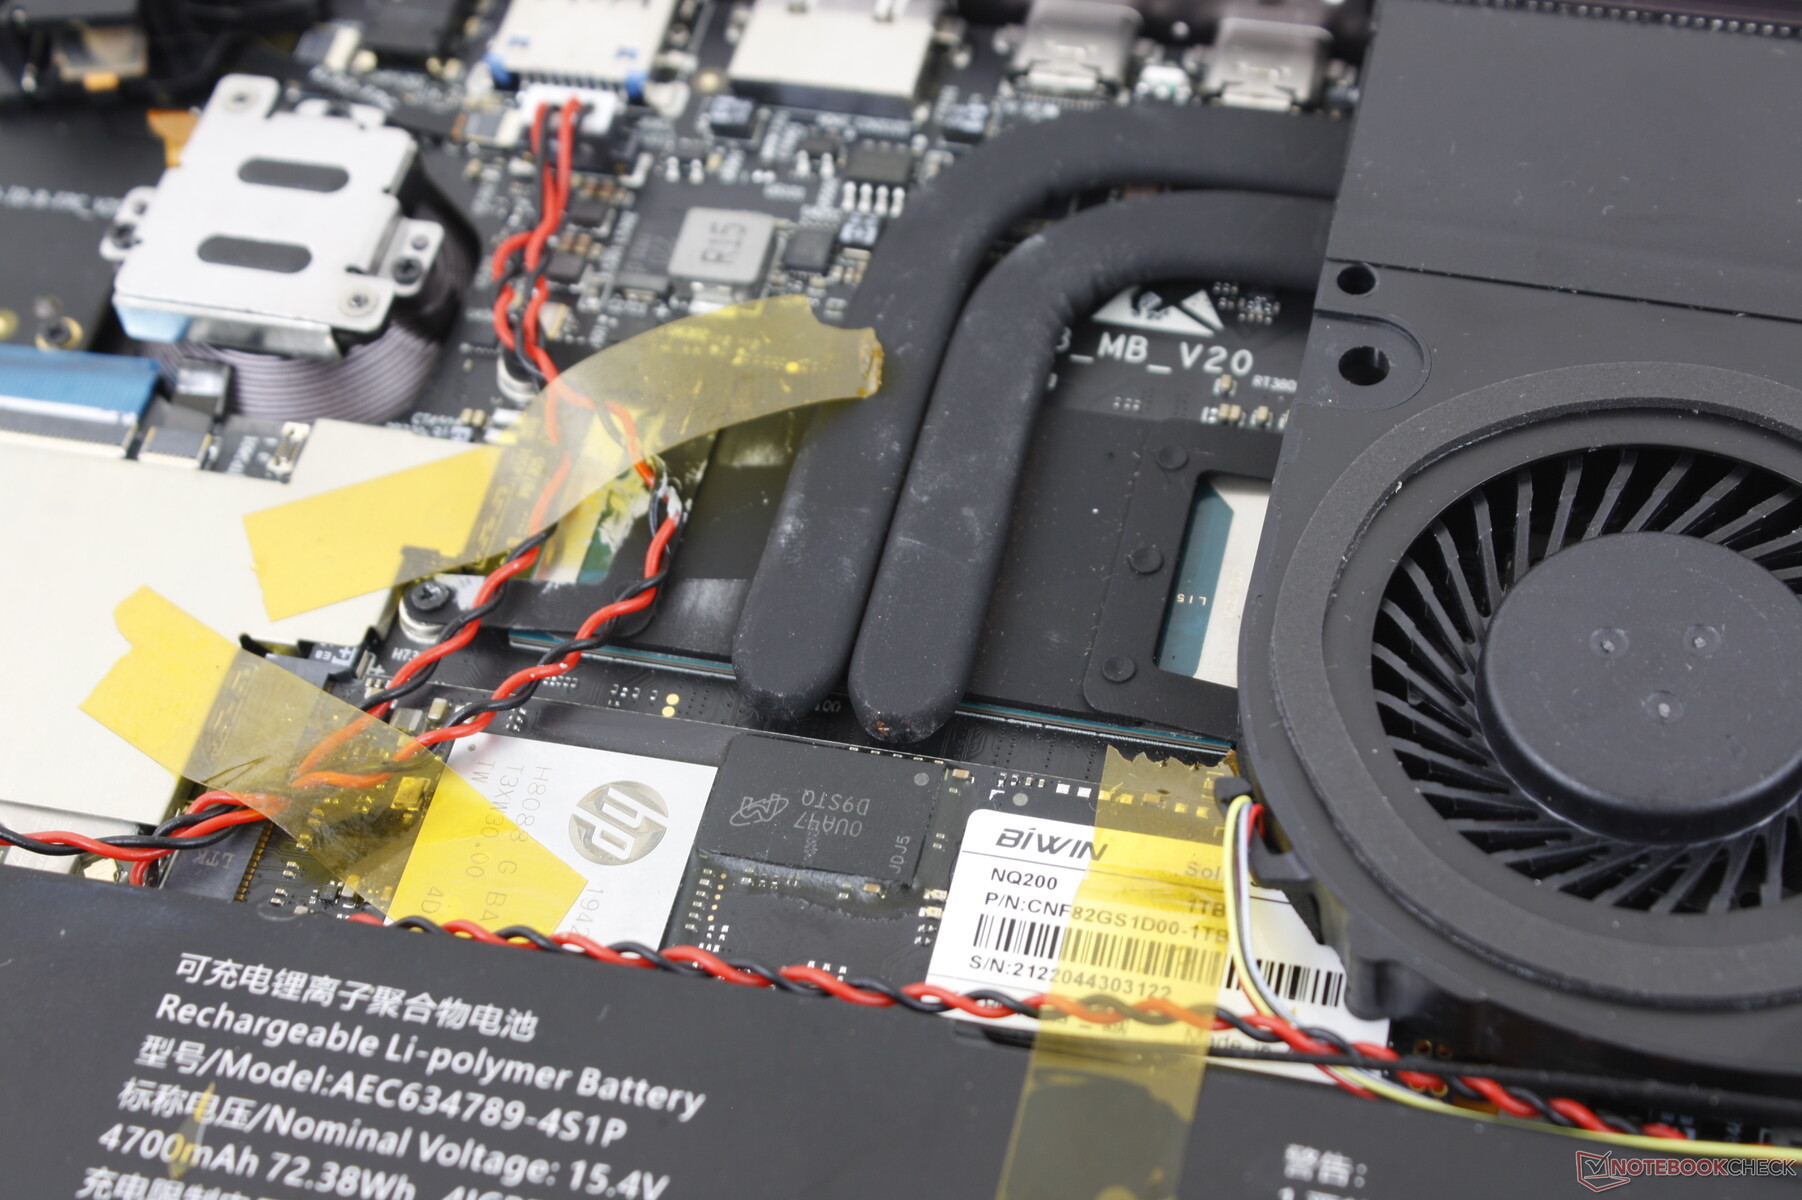
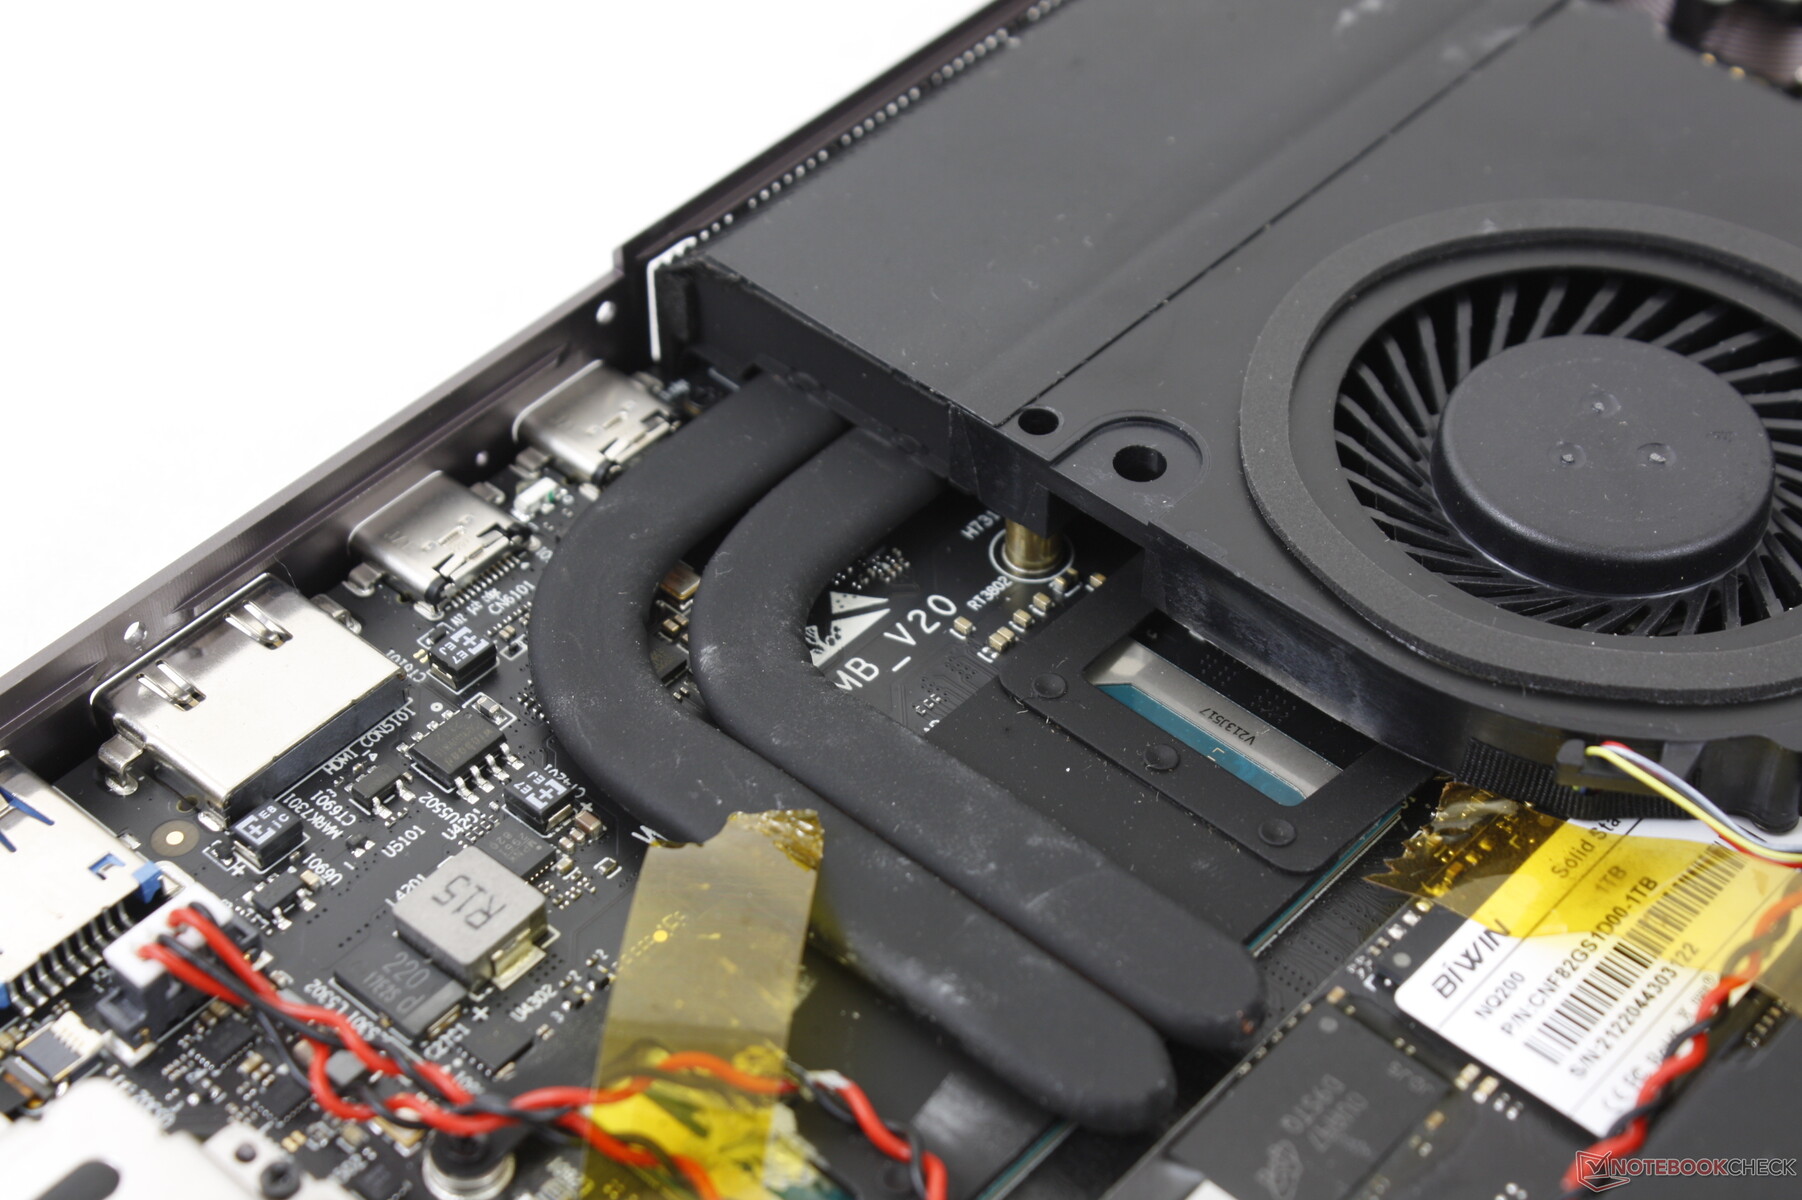
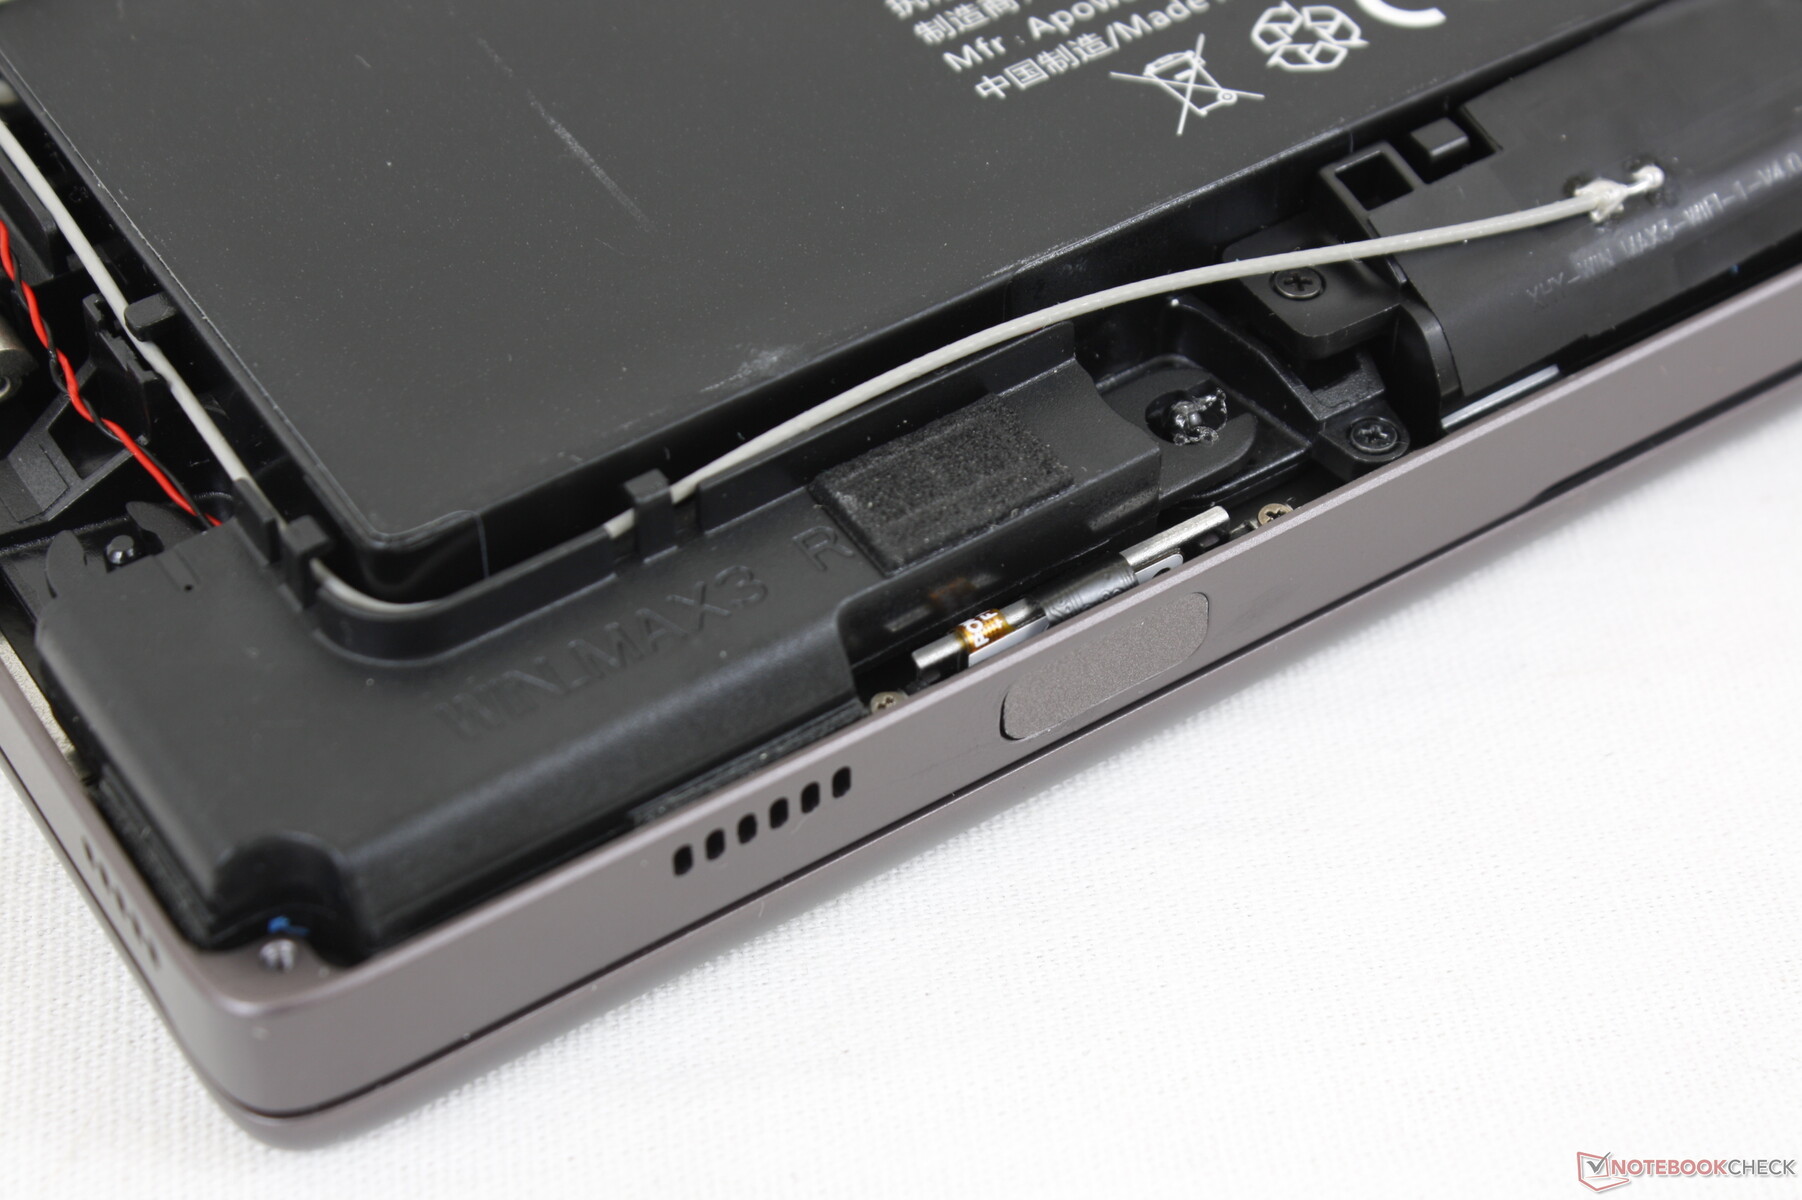
Maintenance
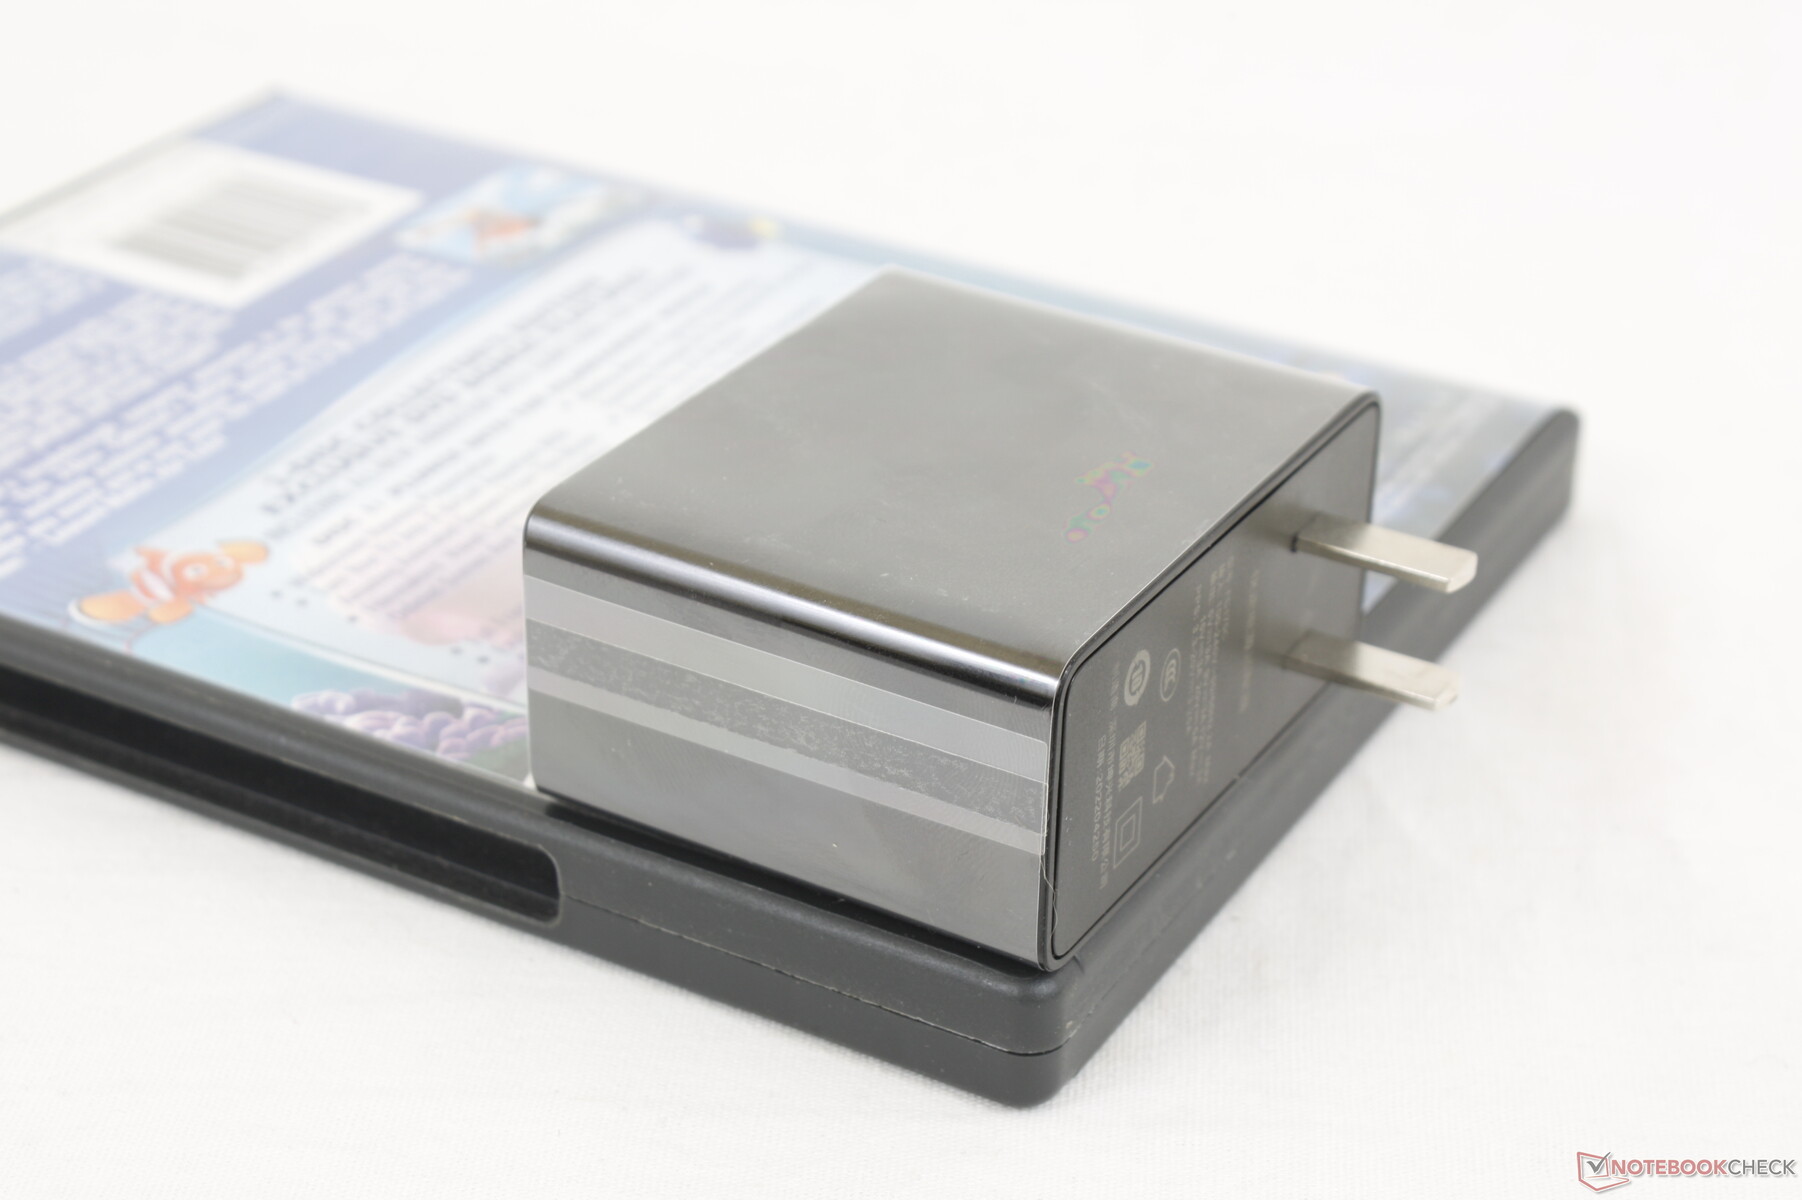
The bottom panel is secured by 13 very small Philips screws that are relatively easy to remove. The main issue, however, is that the WAN module rests on the bottom panel instead of on the motherboard. The ribbon cable connecting the WAN module to the motherboard must therefore be detached whenever the bottom panel is removed. Reattaching this cable to the motherboard during reassembly is extremely difficult because of how short it is.
Accessories and Warranty
There are no extras in the box other than the AC adapter and paperwork. A one-year limited warranty applies if purchased in the US, but GPD says any return shipping charges will not be covered.
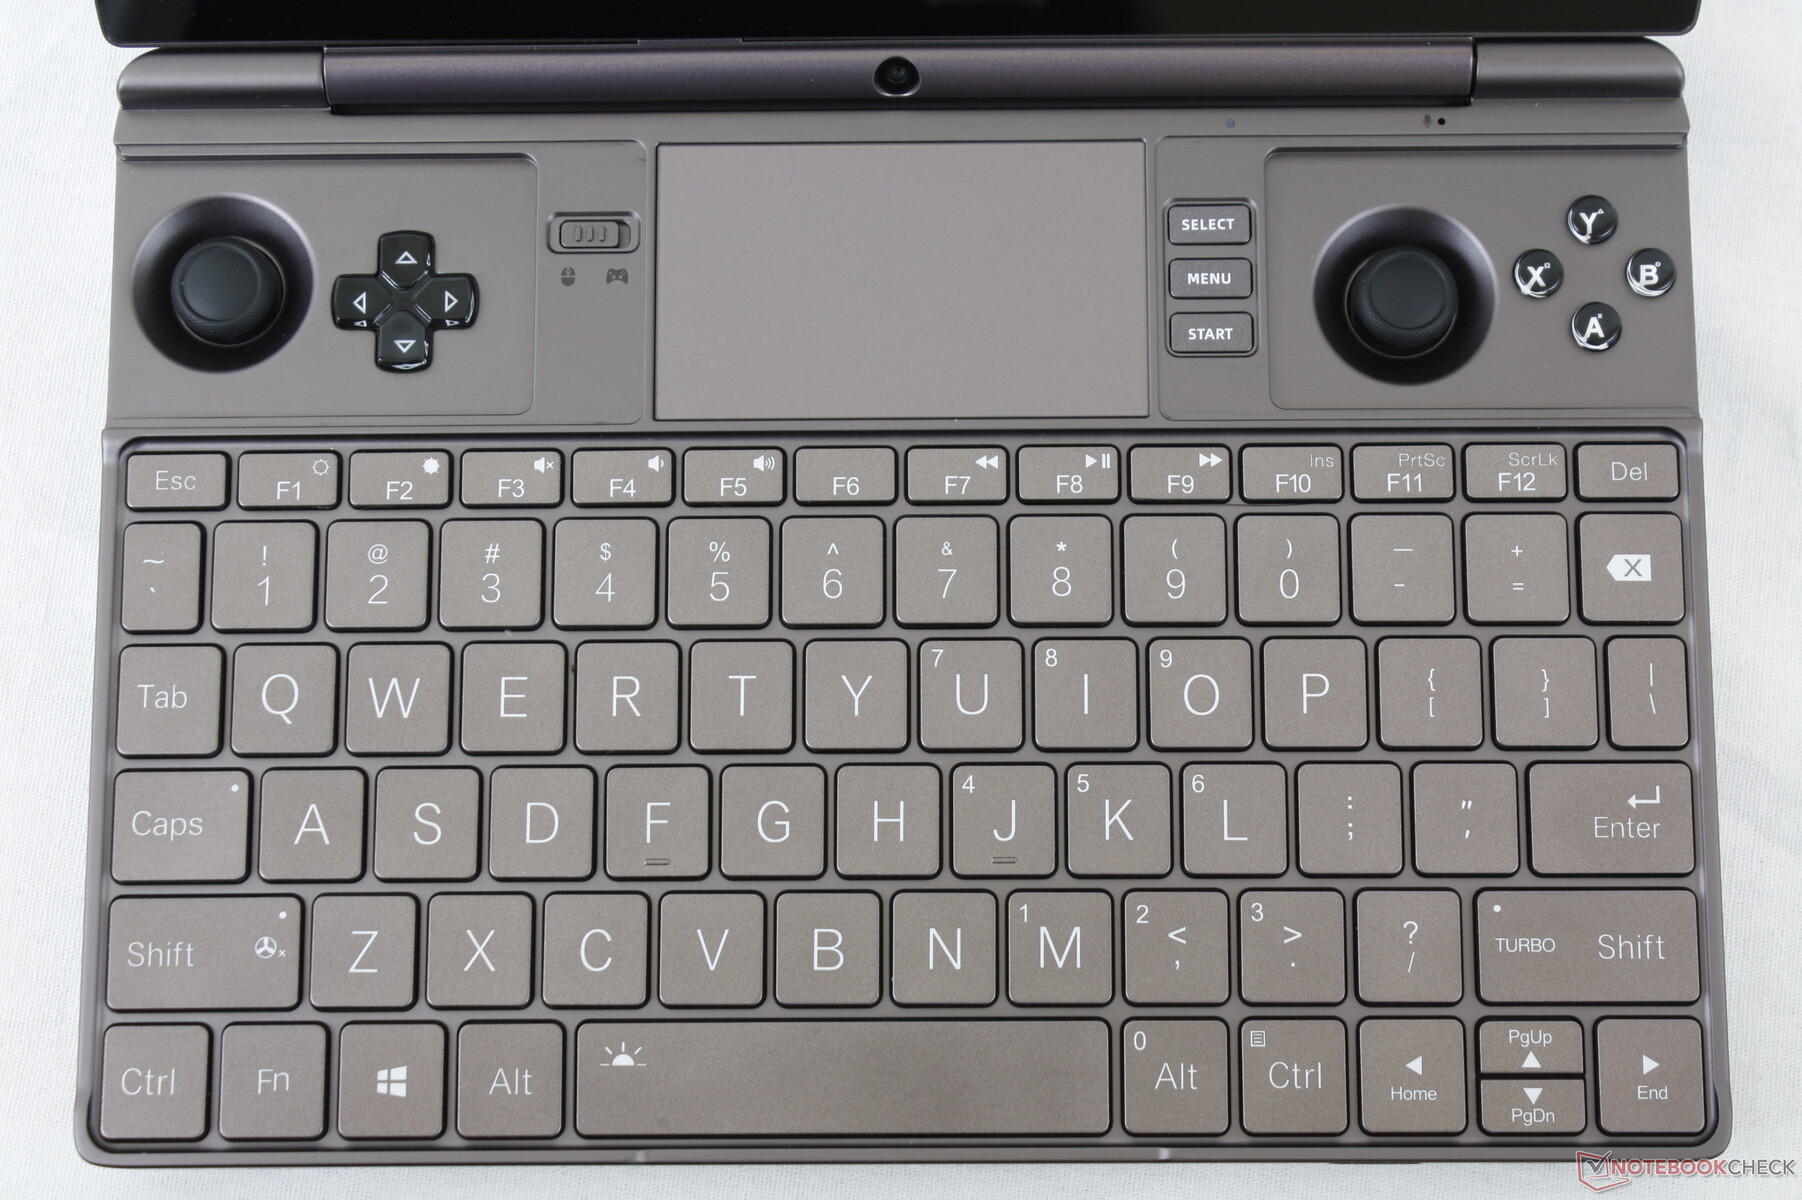
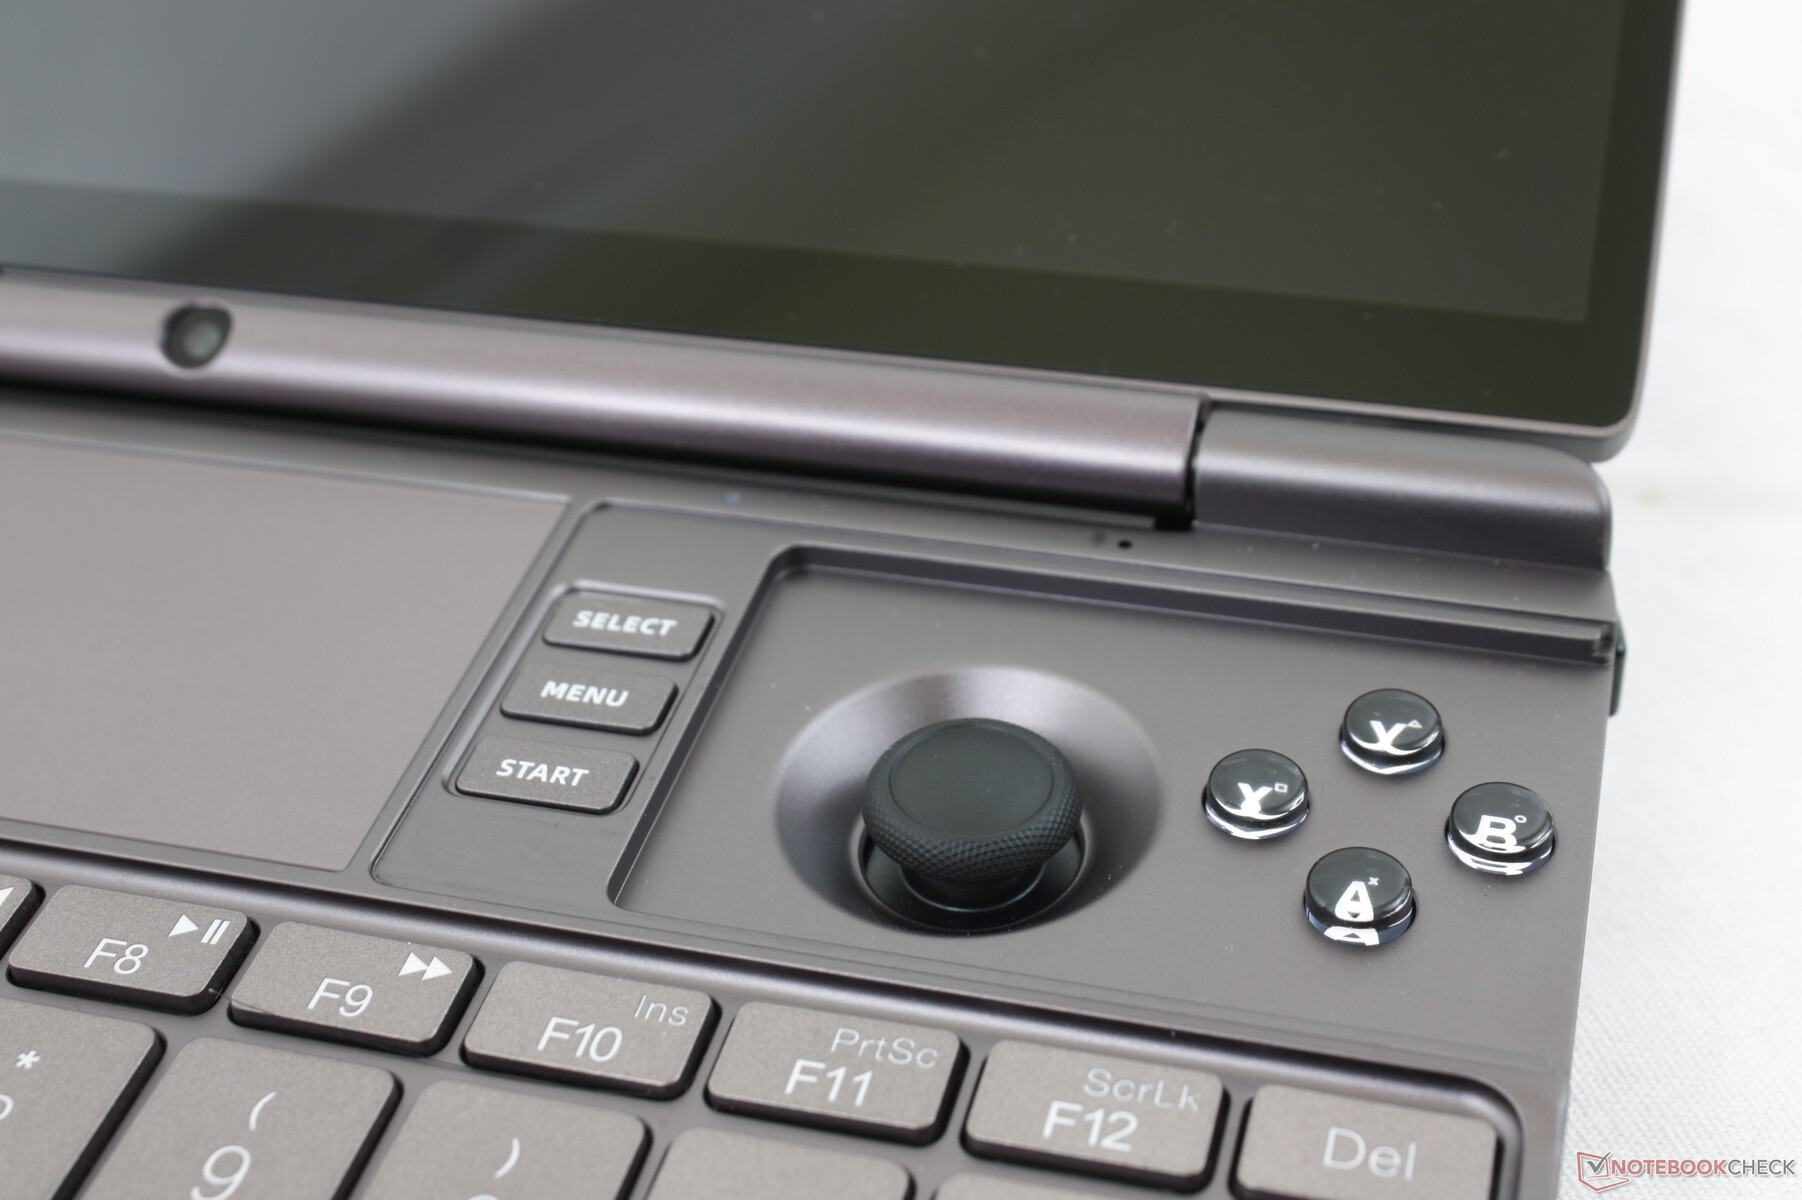
Input Devices — Tiring To Hold For Long Periods
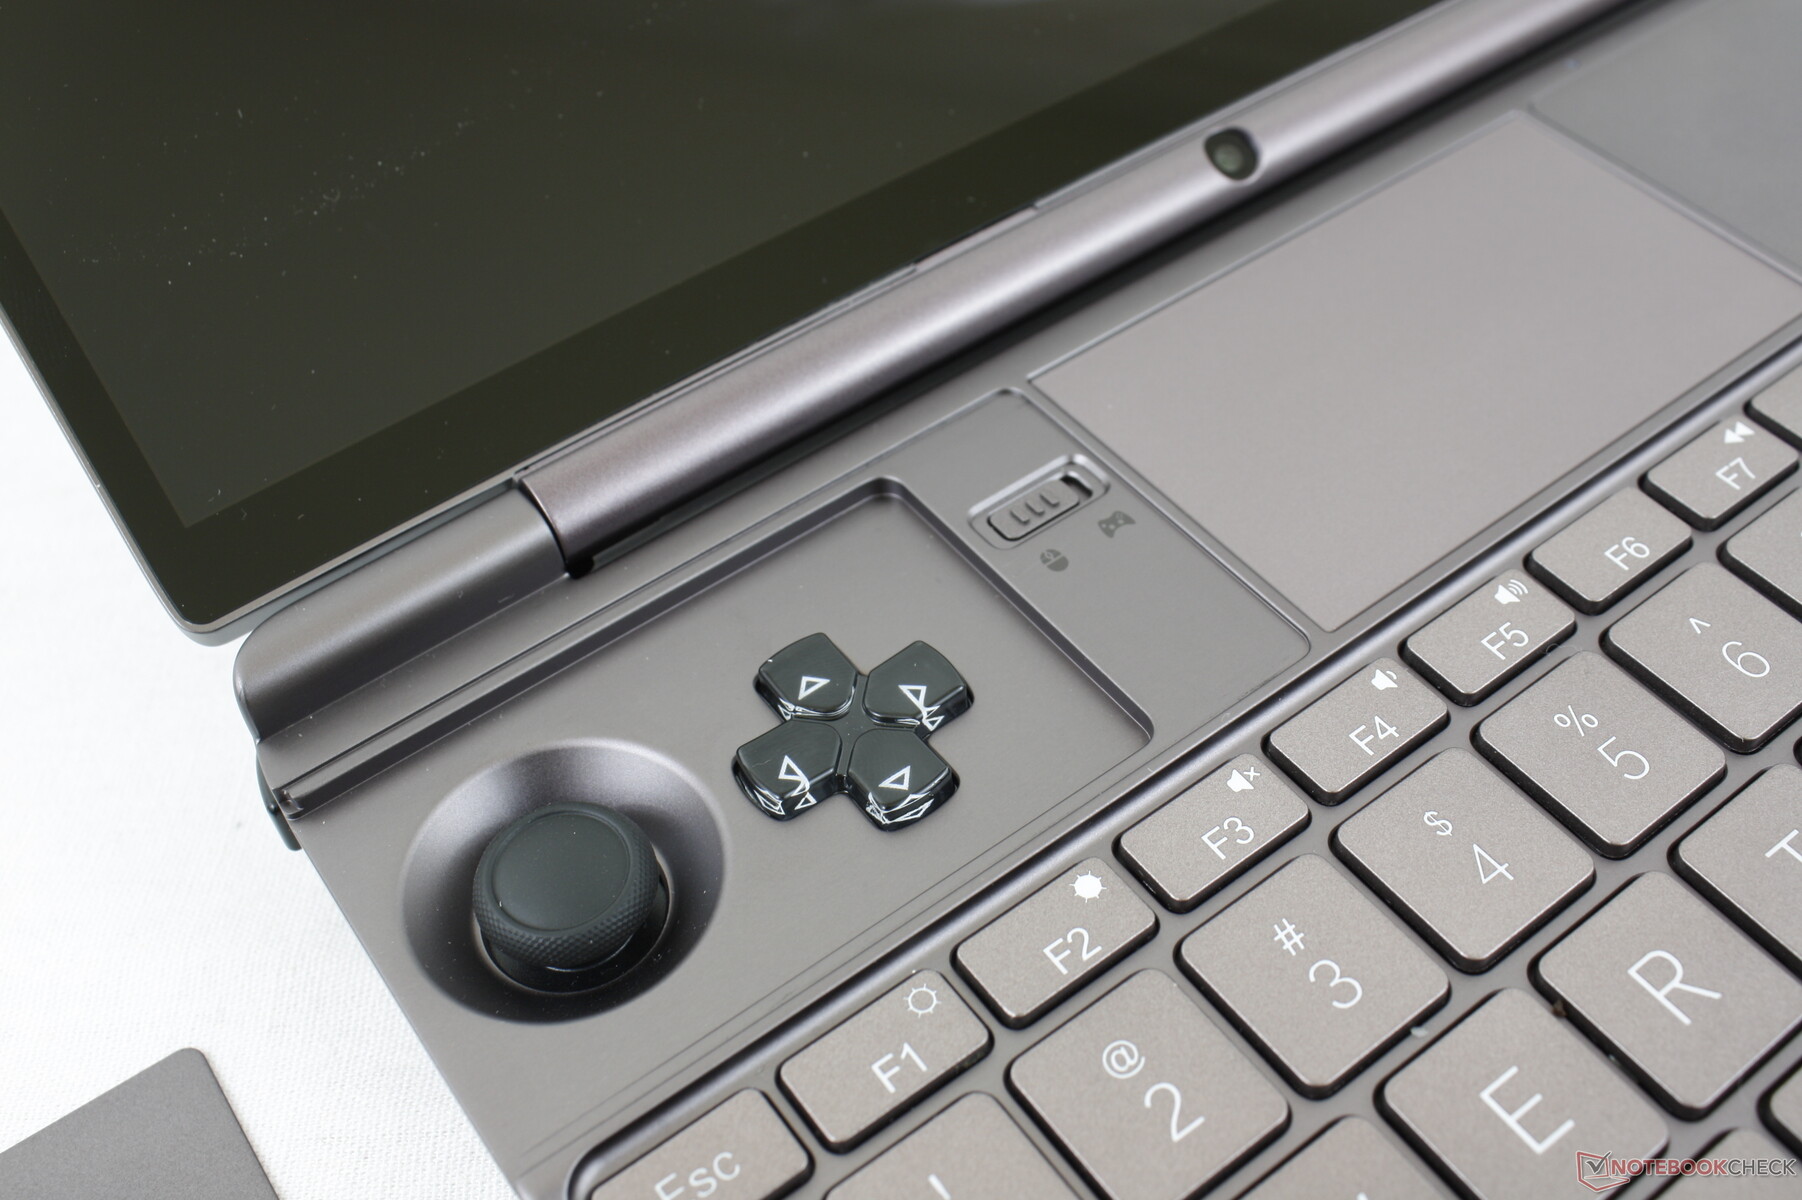
Controller
The controller can toggle between two modes via a switch: Standard and Gaming. When in Standard mode, the buttons are set to the following by default:
- Left joystick: W, A, S, D
- Right joystick: Cursor control
- Left directional pad: Home
- Right directional pad: End
- Up directional pad and Y buttons: Up
- Down directional pad and A buttons: Down
- X button: Left
- B button: Right
The shoulder buttons have their own functions as well including Ctrl+Alt+Del for the right trigger. The problem here is that it is easy to accidentally press a shoulder button and input something unintended. There is no special pre-installed software to easily remap or disable the buttons. A third mode to completely disable the controller would have been helpful.
When in Gaming mode, the keys will be recognized by Windows as a generic XBox controller and so they will be treated and mapped as such. The buttons and joysticks here are closer to the feel, size, and feedback of the Nintendo Joy-cons rather than the more comfortable PS or XBox controllers.
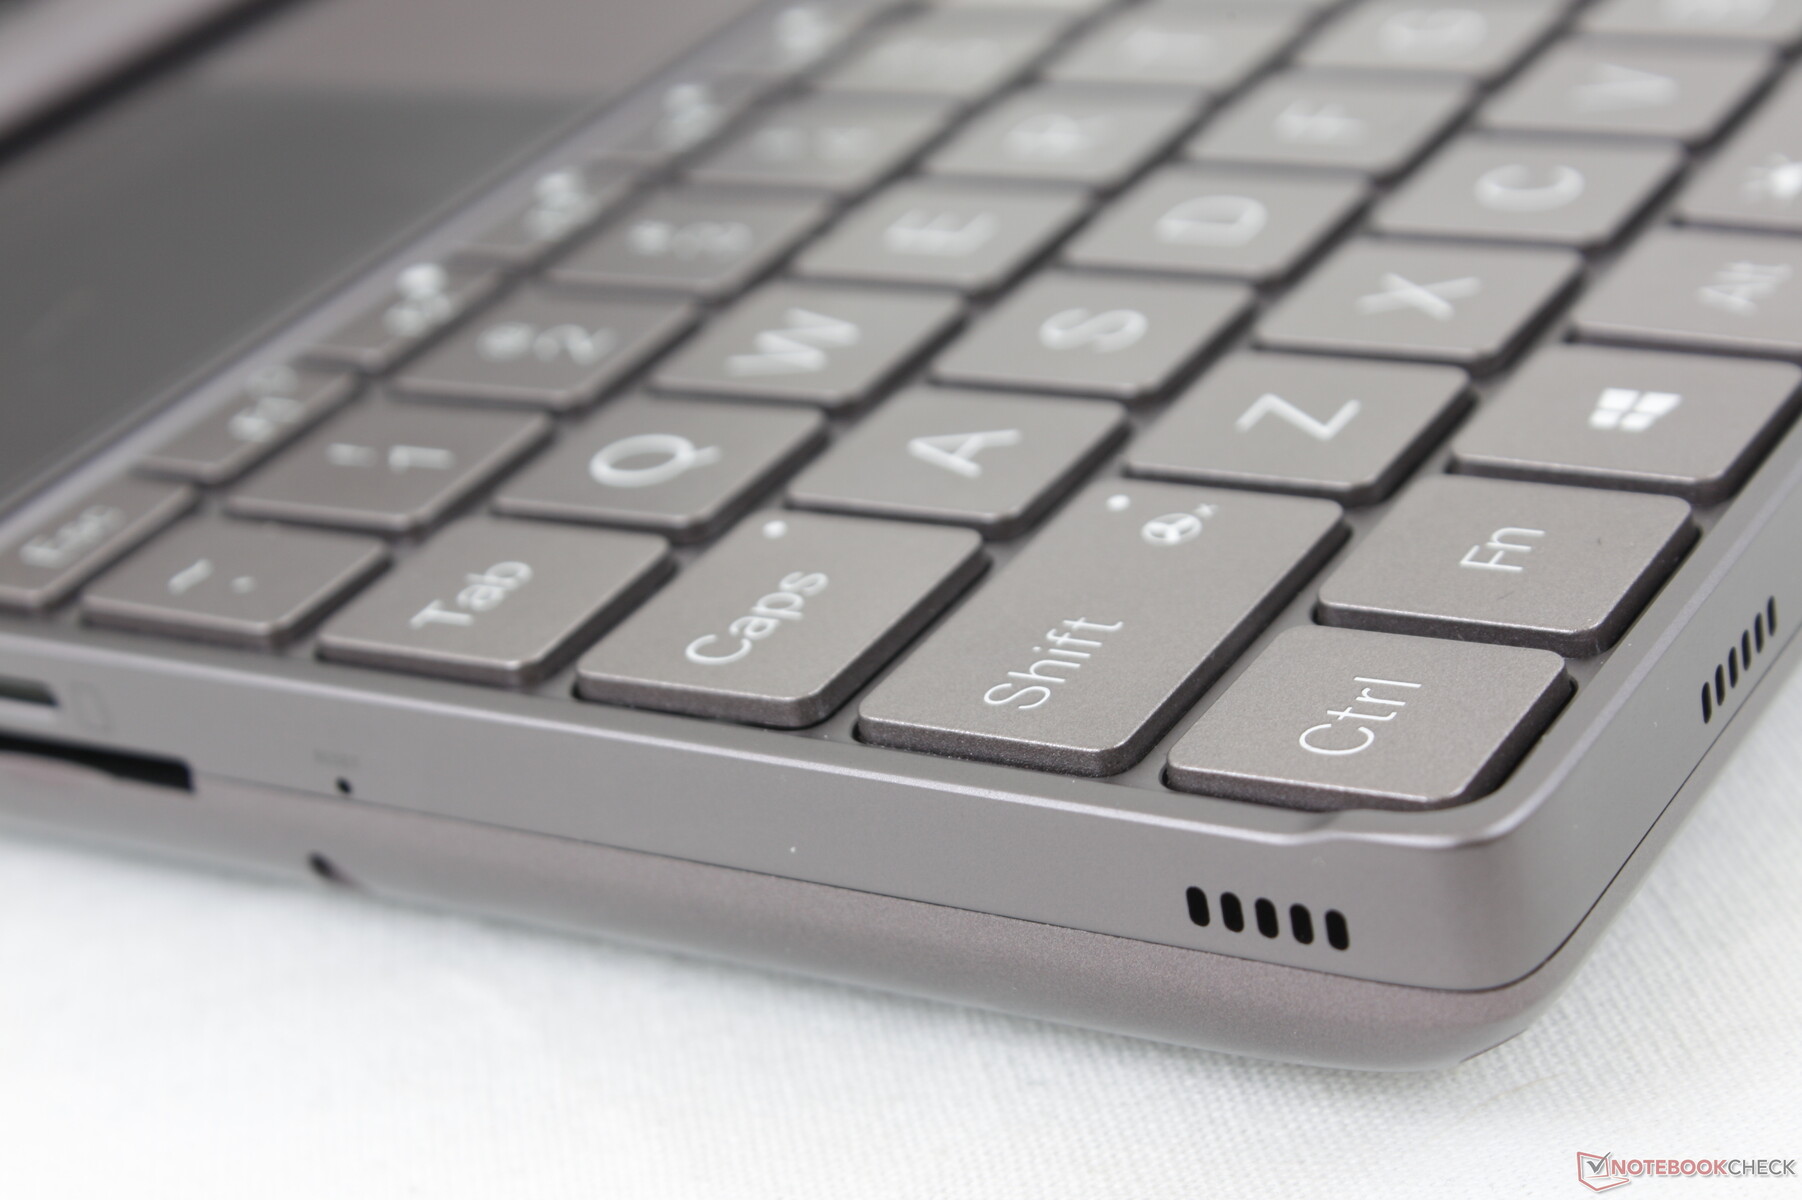
Keyboard
The keyboard is an improvement over the original Win Max in terms of size and layout. The number keys, Caps Lock, and Shift key, for example, are now larger and closer to what users have come to expect from a QWERTY layout. Feedback is similar to most larger Ultrabooks albeit more cramped, of course.
The keyboard seems to have issues recognizing more than 2 keys at once. Fn+Alt+PrtSc, for example, would not register on our unit.
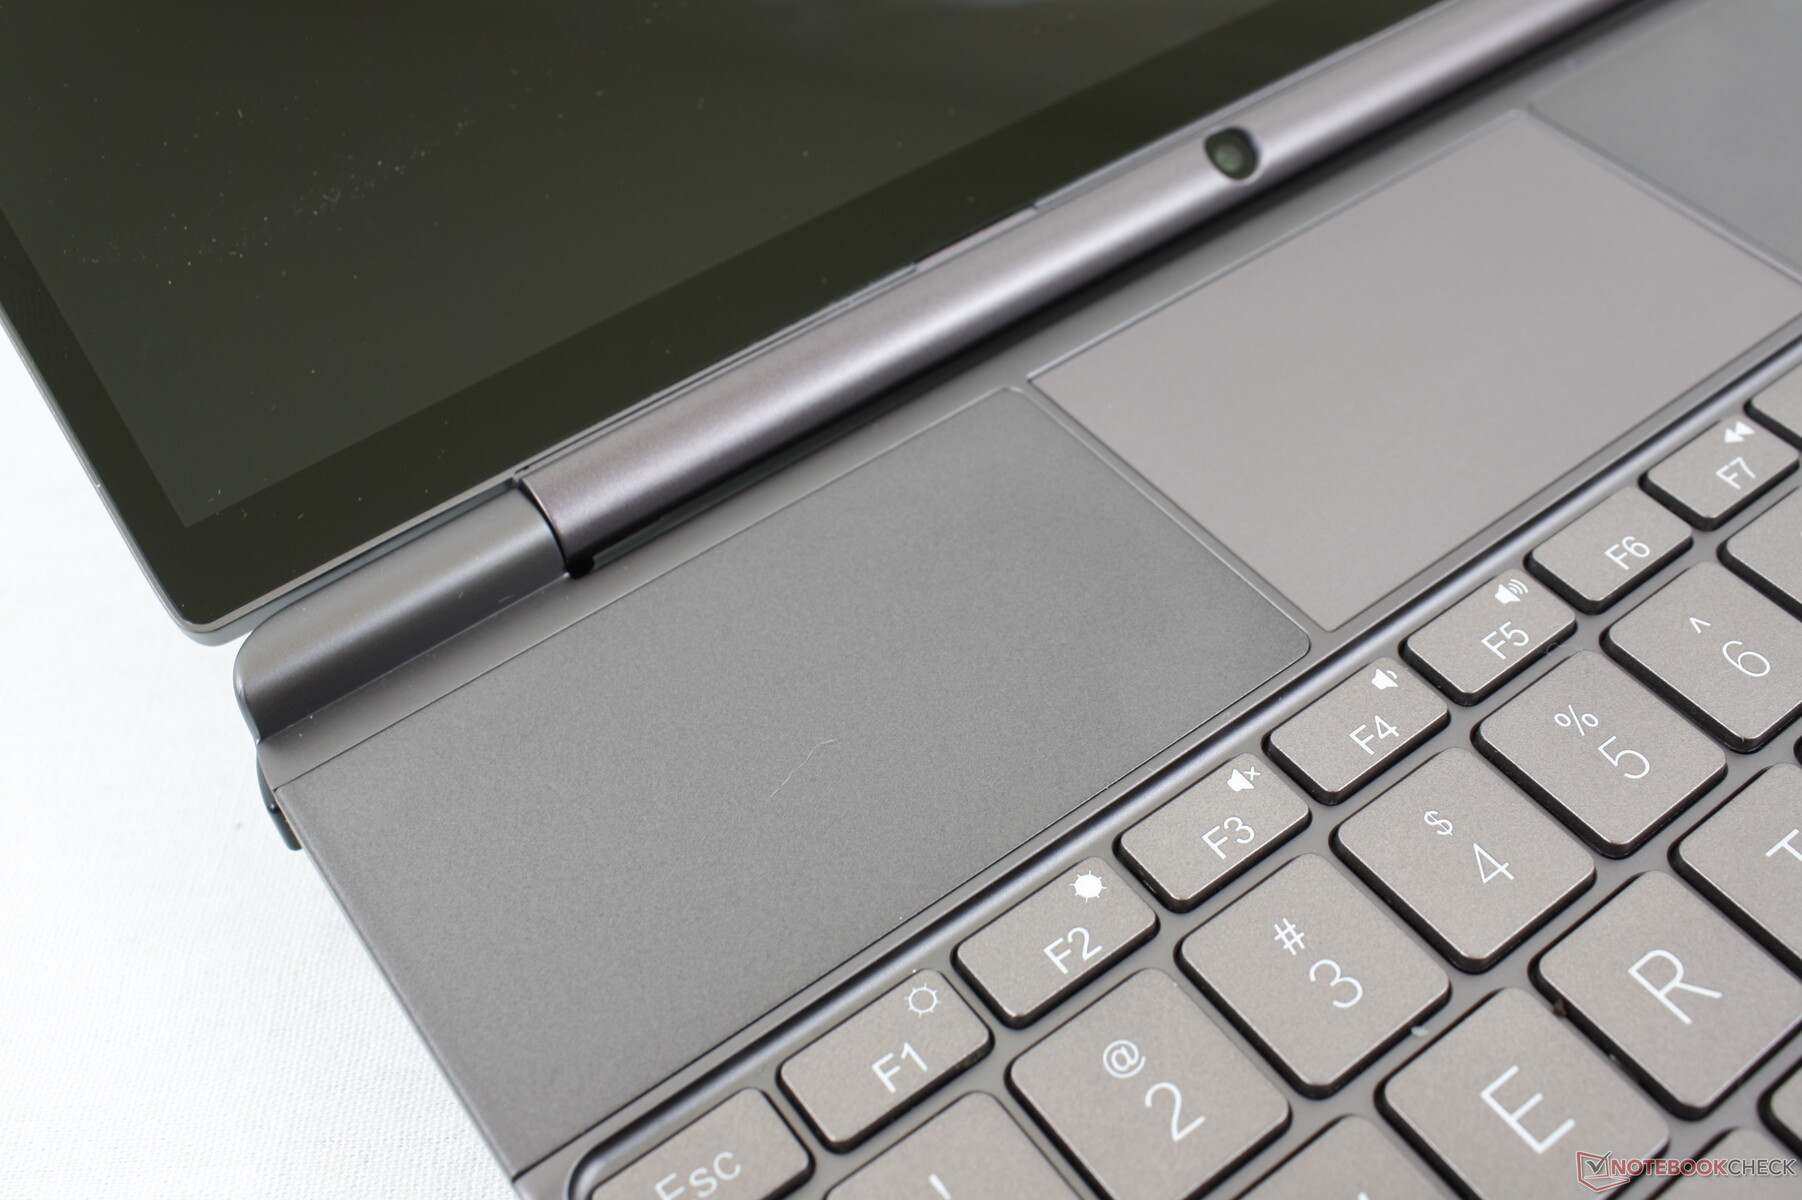
Touchpad
The clickpad is expectedly small at just 7.0 x 4.1 cm, but it is still larger than the 5.8 x 3.3 cm clickpad on the 2021 Win Max. Traction is smooth when gliding at medium or higher speeds while there is a bit of sticking at slower speeds for more accurate clicks. Clicking on the clickpad is surprisingly firm and with strong feedback as well, but it is loud as a result.

Display — High Resolution With sRGB Colors
The 10.1-inch touchscreen is another massive improvement over the 8-inch one on the 2021 Win Max. Not only are the bezels narrower, but the panel offers both better colors and faster black-white response times for a higher quality viewing experience. Contrast and refresh rate haven't changed, however. It would be great to see 90 Hz or 120 Hz options alongside adaptive sync support on future models.
Though the display is very sharp at its native resolution of 2560 x 1600, keep in mind that the integrated GPU is not powerful enough to run most titles at such high resolutions smoothly.


| |||||||||||||||||||||||||
Brightness Distribution: 89 %
Center on Battery: 396.7 cd/m²
Contrast: 1102:1 (Black: 0.36 cd/m²)
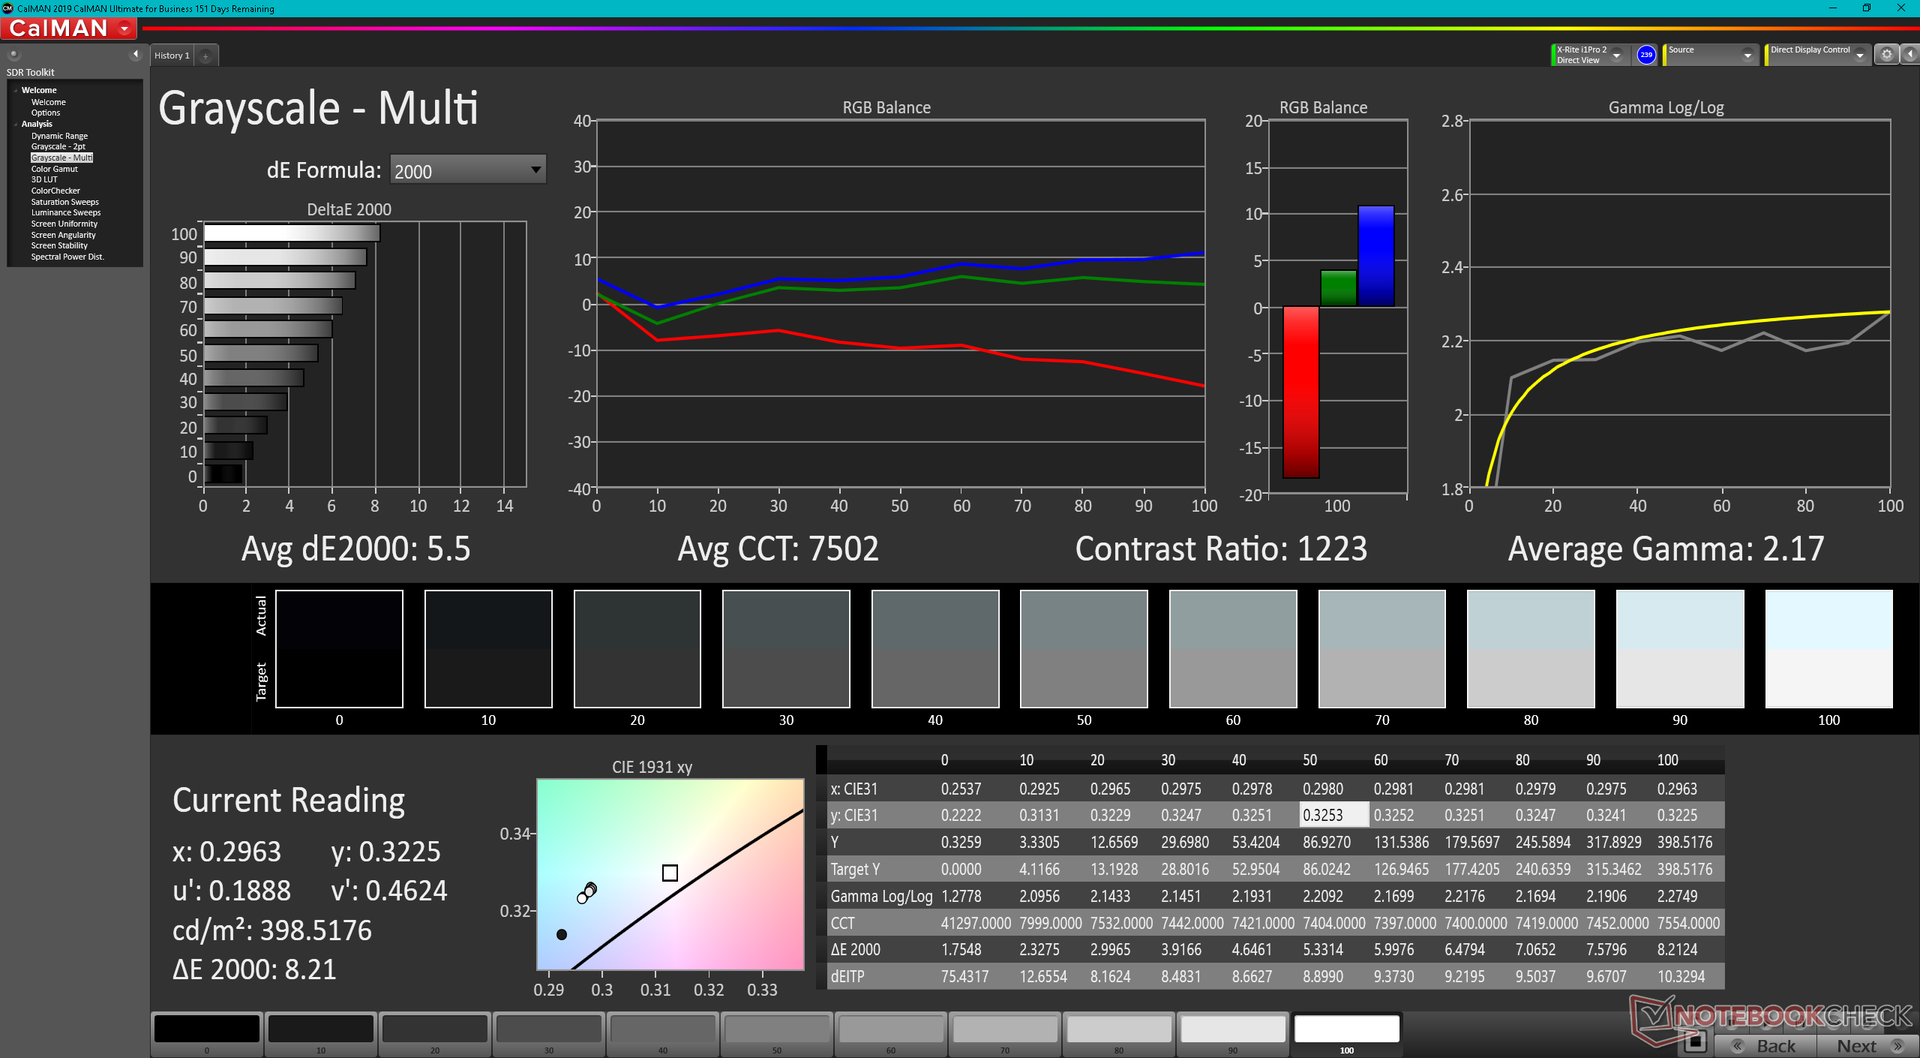
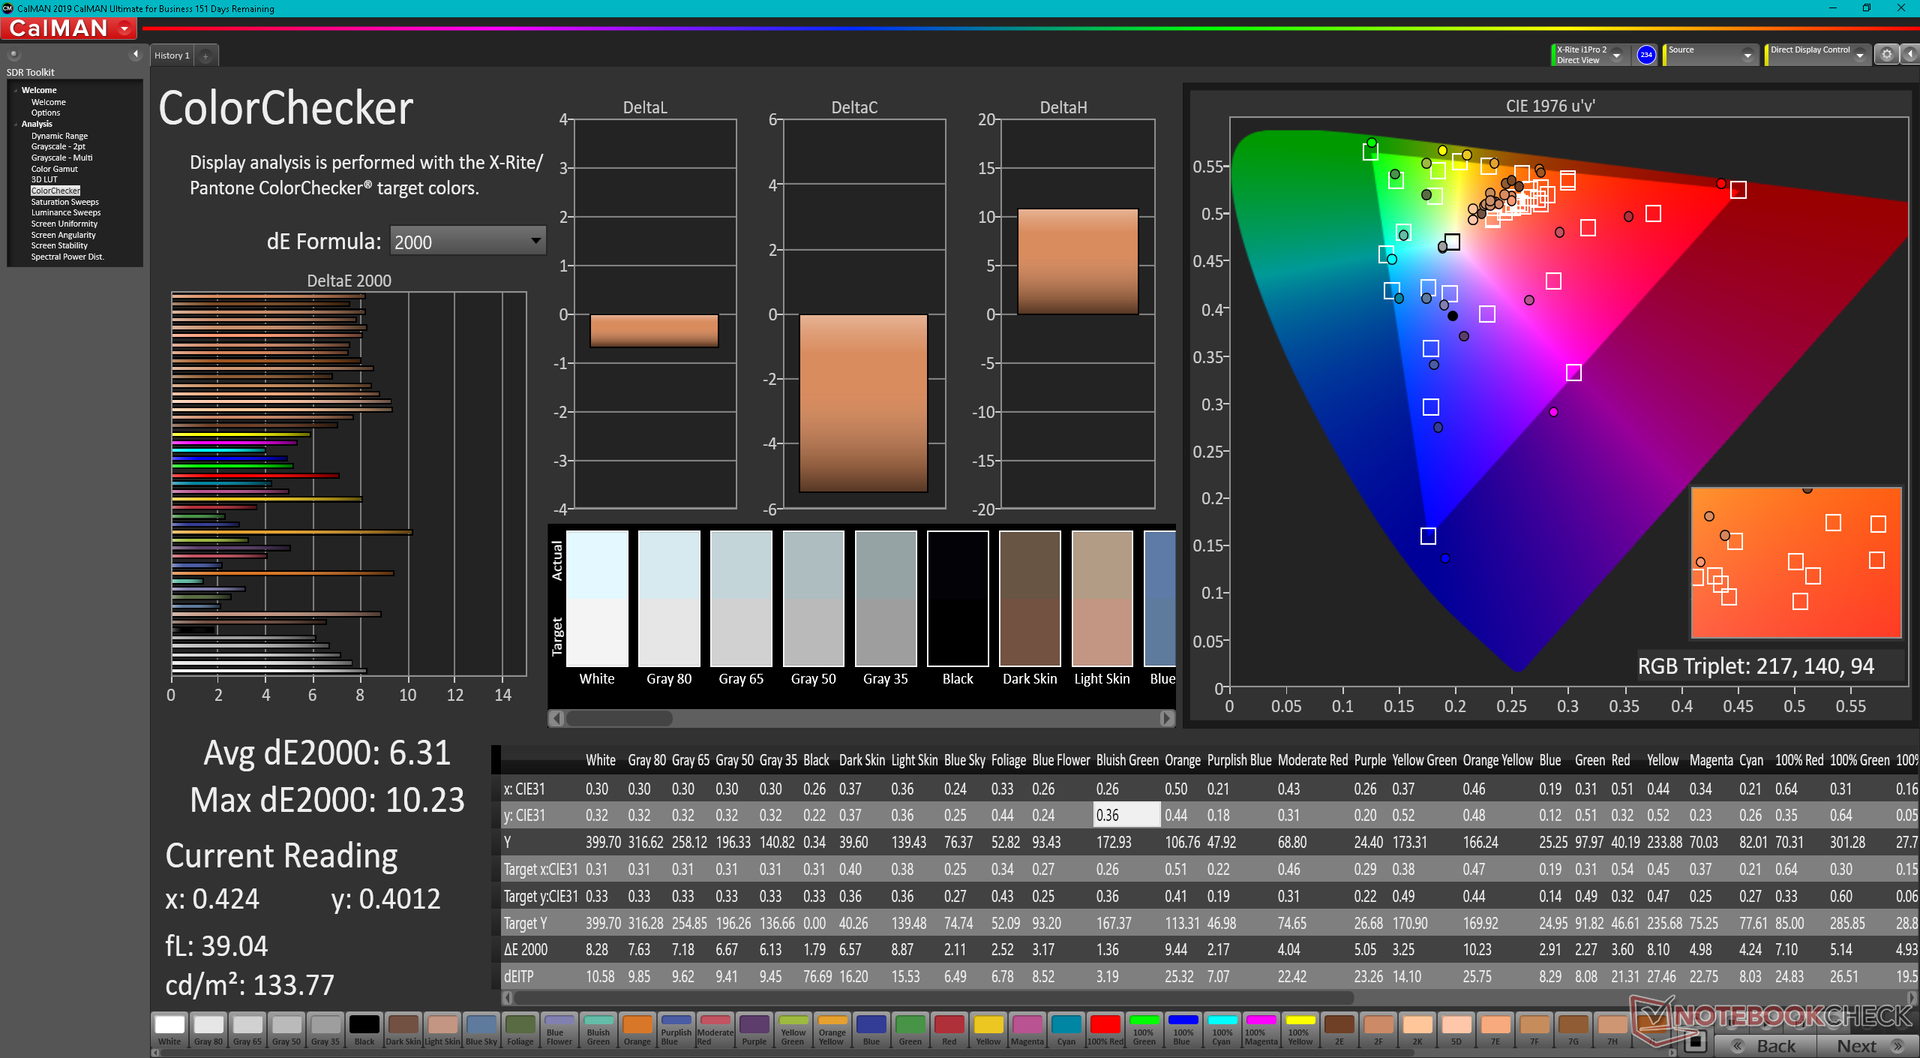
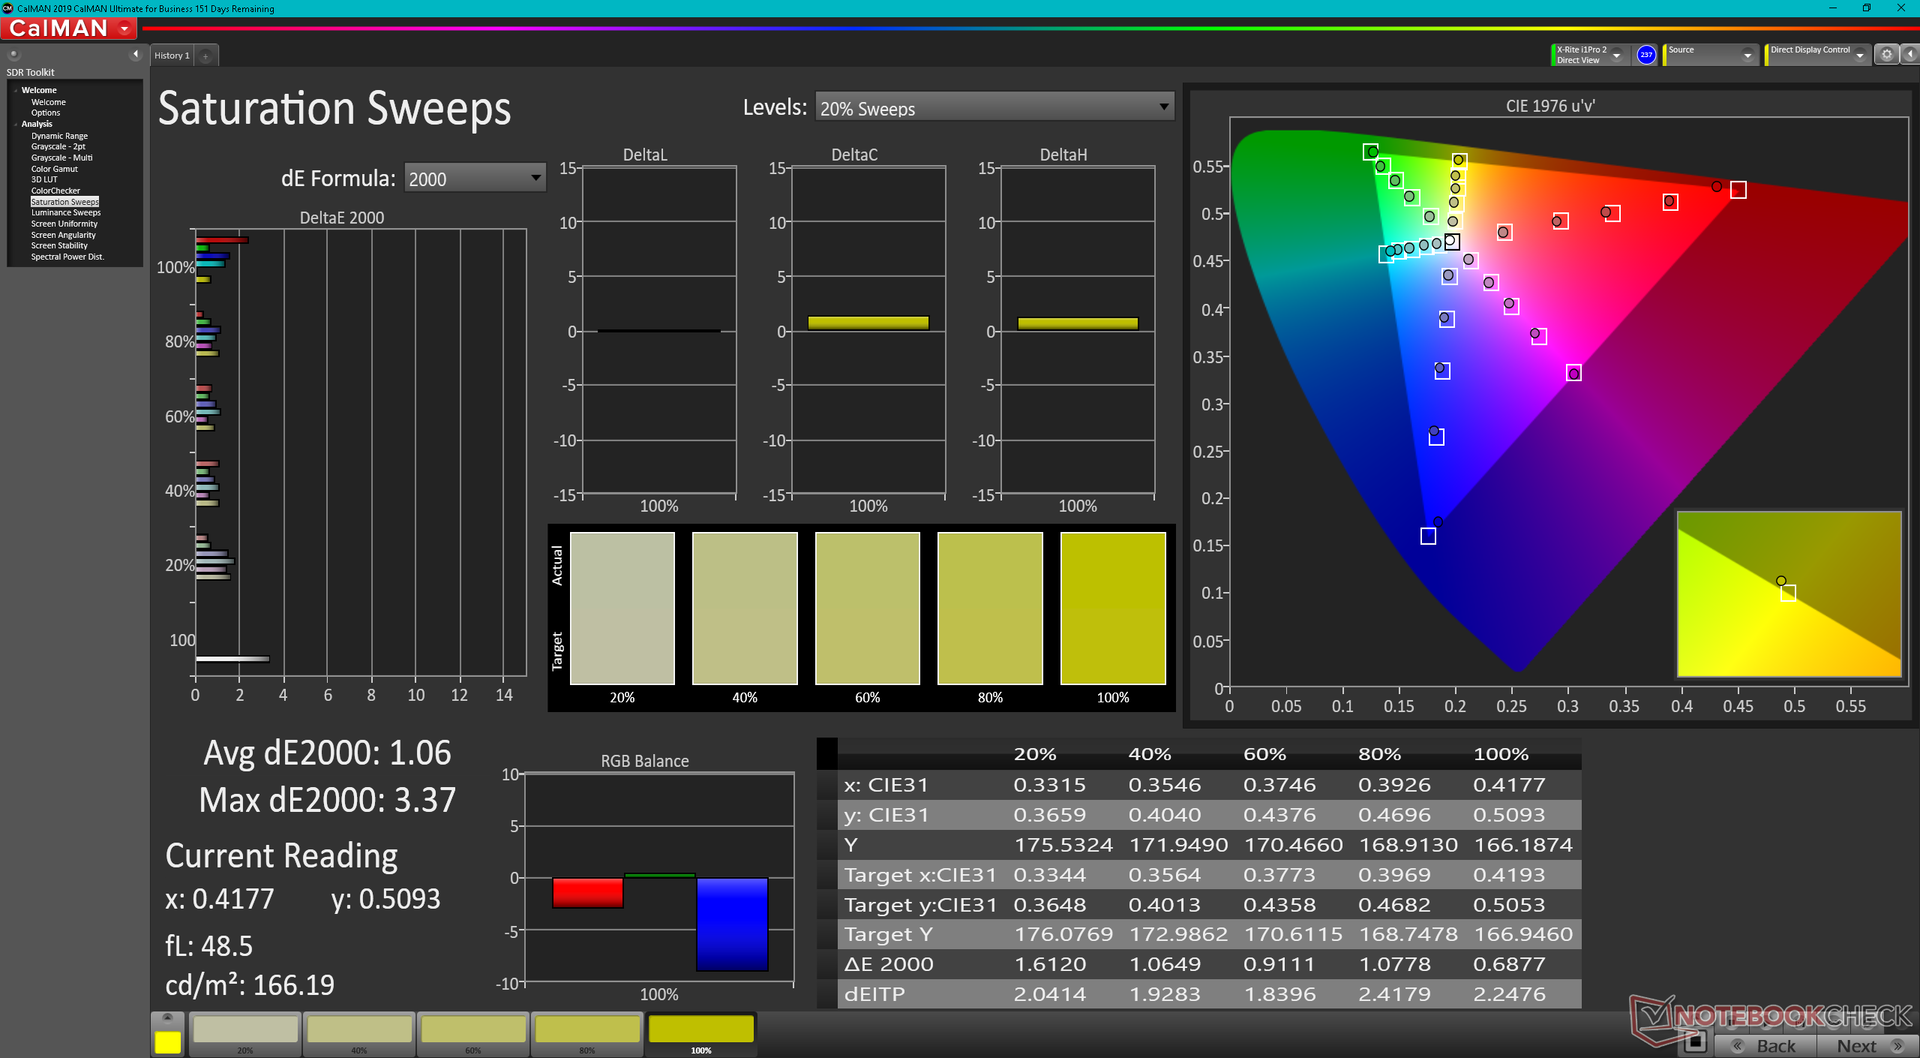
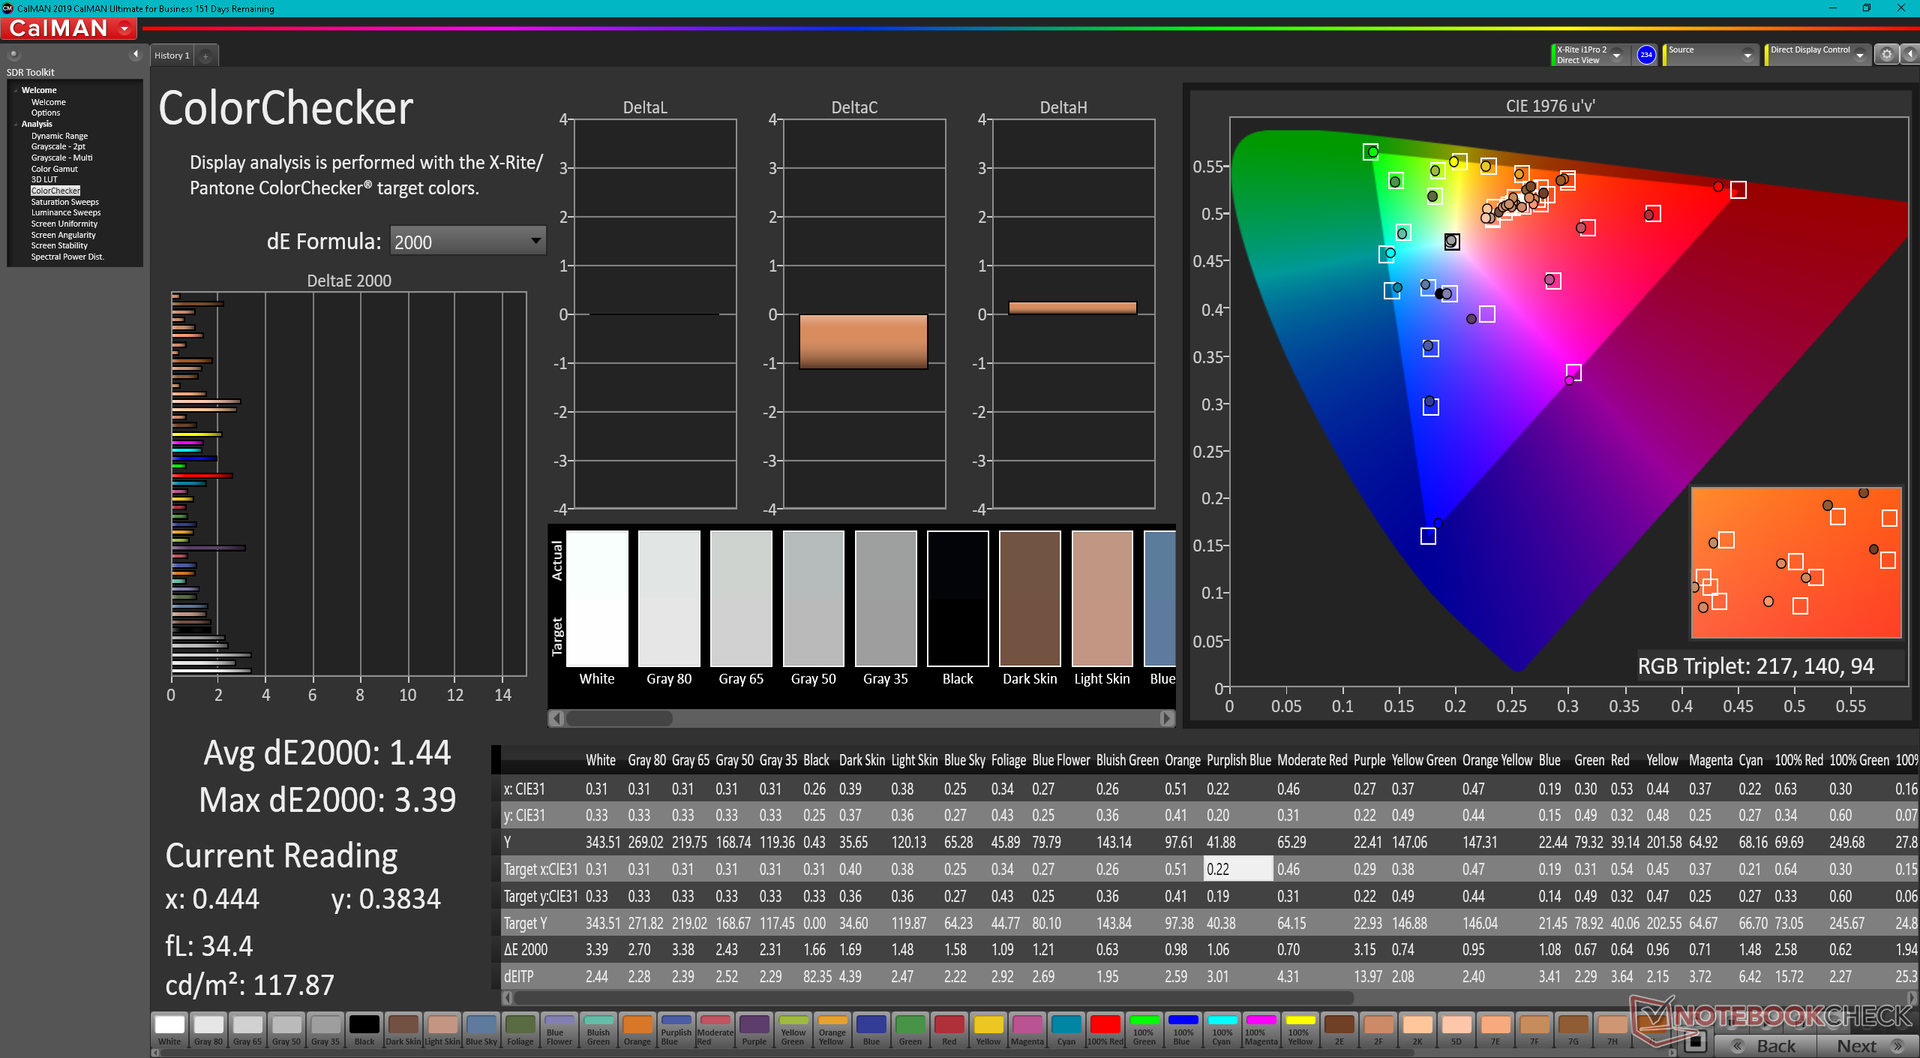
ΔE ColorChecker Calman: 6.31 | ∀{0.5-29.43 Ø4.73}
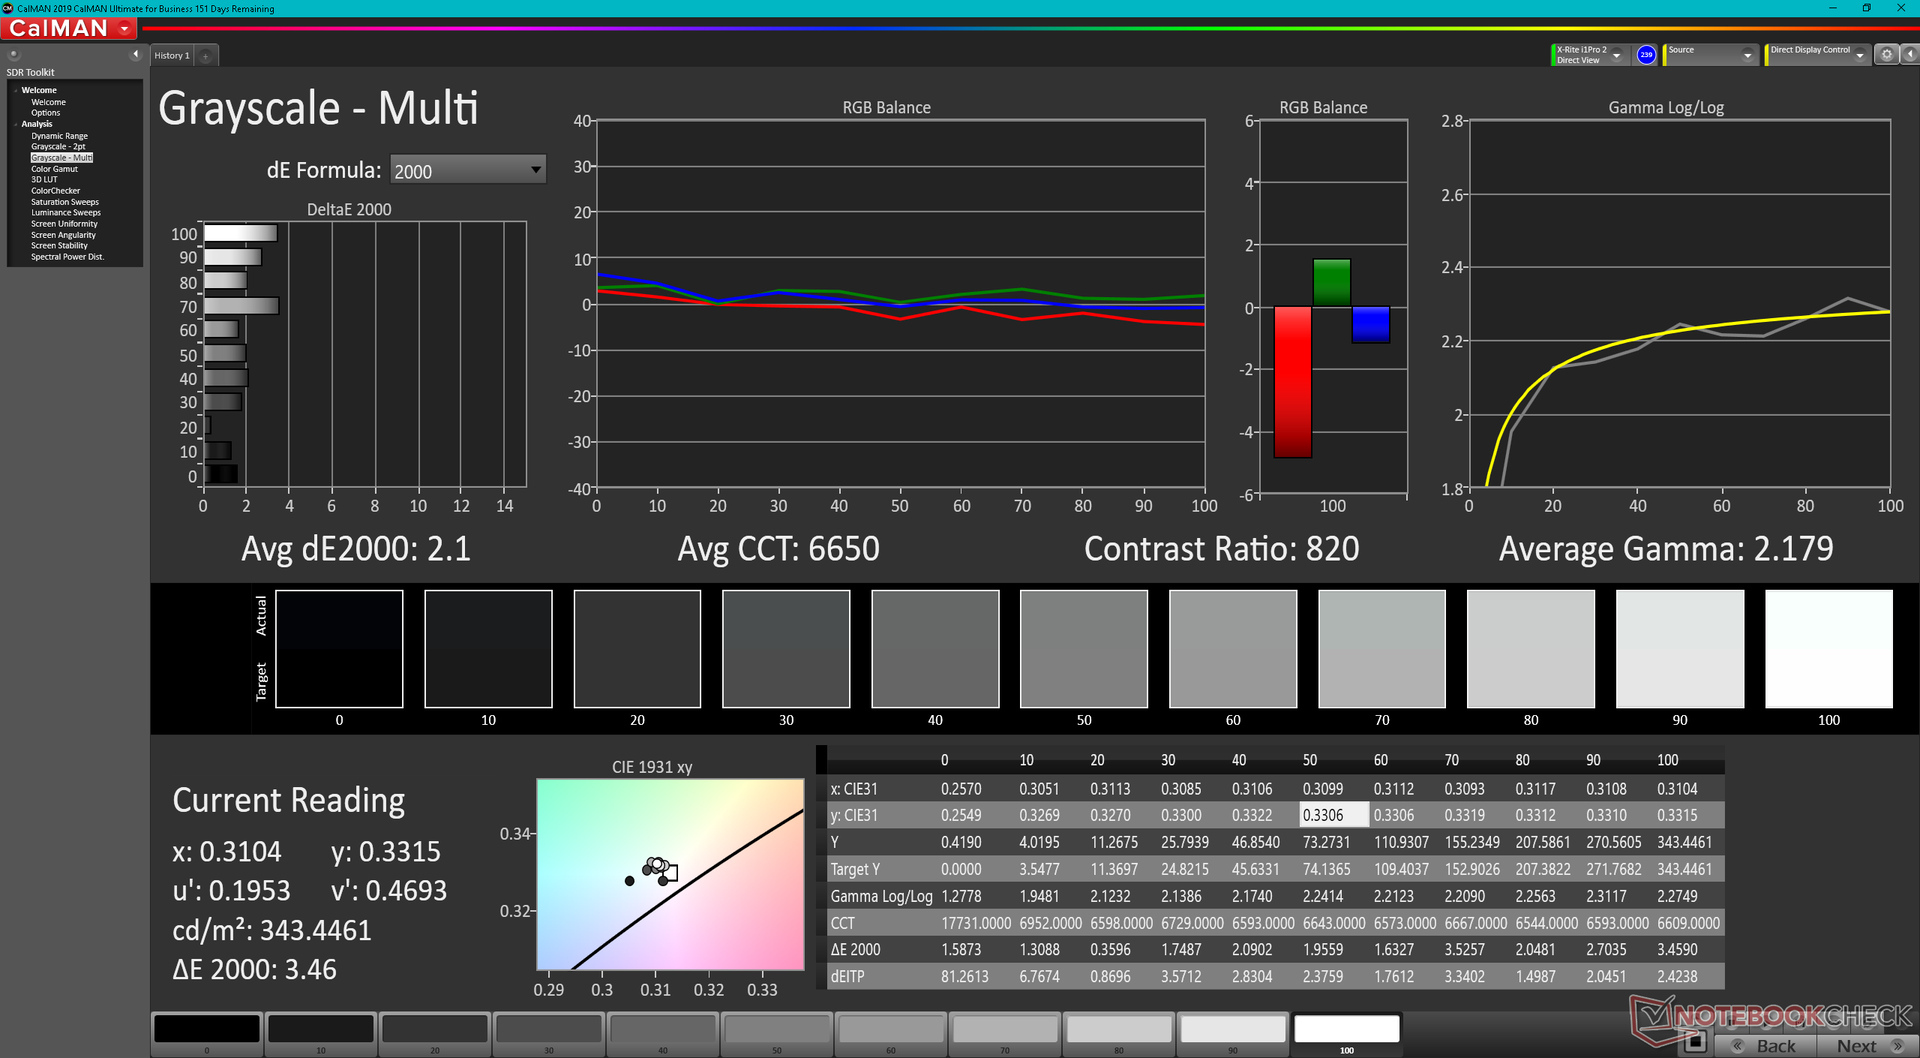
calibrated: 1.44
ΔE Greyscale Calman: 5.5 | ∀{0.09-98 Ø4.97}
66.6% AdobeRGB 1998 (Argyll 3D)
91% sRGB (Argyll 3D)
69.8% Display P3 (Argyll 3D)
Gamma: 2.17
CCT: 7502 K
| GPD Win Max 2 Toshiba HX_10.1_LCD, IPS, 2560x1600, 10.1" | GPD Pocket 3 Digital Flat Panel, IPS, 1920x1200, 8" | GPD Win Max 2021 LT7911D, IPS, 1280x800, 8" | GPD Win 3 IPS, 1280x720, 5.5" | Microsoft Surface Go 3 Core i3 NV105WAM-N31, IPS , 1920x1280, 10.5" | Lenovo IdeaPad Flex 3 11IGL05 N116BCA-EA1, IPS LED, 1366x768, 11.6" | |
|---|---|---|---|---|---|---|
| Display | -22% | -30% | -8% | 4% | -30% | |
| Display P3 Coverage (%) | 69.8 | 51.1 -27% | 47.2 -32% | 59.5 -15% | 69 -1% | 45.35 -35% |
| sRGB Coverage (%) | 91 | 74.7 -18% | 65.2 -28% | 89.6 -2% | 99.1 9% | 67.7 -26% |
| AdobeRGB 1998 Coverage (%) | 66.6 | 52.8 -21% | 47.6 -29% | 61.4 -8% | 69.8 5% | 46.93 -30% |
| Response Times | -71% | -135% | -63% | -49% | -57% | |
| Response Time Grey 50% / Grey 80% * (ms) | 21.2 ? | 37.2 ? -75% | 56.8 ? -168% | 40 ? -89% | 37.2 ? -75% | 38 ? -79% |
| Response Time Black / White * (ms) | 18.7 ? | 31.2 ? -67% | 37.6 ? -101% | 25.6 ? -37% | 22.8 ? -22% | 25 ? -34% |
| PWM Frequency (Hz) | 201.6 ? | 962 ? | 250 ? | |||
| Screen | -13% | -34% | -24% | 36% | -9% | |
| Brightness middle (cd/m²) | 396.7 | 438.4 11% | 374.6 -6% | 468.8 18% | 418 5% | 270 -32% |
| Brightness (cd/m²) | 381 | 421 10% | 361 -5% | 460 21% | 415 9% | 259 -32% |
| Brightness Distribution (%) | 89 | 92 3% | 92 3% | 93 4% | 90 1% | 76 -15% |
| Black Level * (cd/m²) | 0.36 | 0.4 -11% | 0.45 -25% | 0.45 -25% | 0.28 22% | 0.195 46% |
| Contrast (:1) | 1102 | 1096 -1% | 832 -25% | 1042 -5% | 1493 35% | 1385 26% |
| Colorchecker dE 2000 * | 6.31 | 5.02 20% | 6.21 2% | 9 -43% | 1.2 81% | 3.98 37% |
| Colorchecker dE 2000 max. * | 10.23 | 9.59 6% | 9.89 3% | 15.5 -52% | 2.6 75% | 8.46 17% |
| Colorchecker dE 2000 calibrated * | 1.44 | 4.05 -181% | 5.4 -275% | 1.91 -33% | 1 31% | 4 -178% |
| Greyscale dE 2000 * | 5.5 | 4 27% | 4.5 18% | 10.9 -98% | 1.8 67% | 2.57 53% |
| Gamma | 2.17 101% | 2.29 96% | 2.49 88% | 2.13 103% | 2.21 100% | 2.3 96% |
| CCT | 7502 87% | 7087 92% | 6726 97% | 10972 59% | 6225 104% | 6332 103% |
| Color Space (Percent of AdobeRGB 1998) (%) | 56.6 | 43 | ||||
| Color Space (Percent of sRGB) (%) | 89.2 | 67 | ||||
| Total Average (Program / Settings) | -35% /
-23% | -66% /
-48% | -32% /
-26% | -3% /
17% | -32% /
-20% |
* ... smaller is better
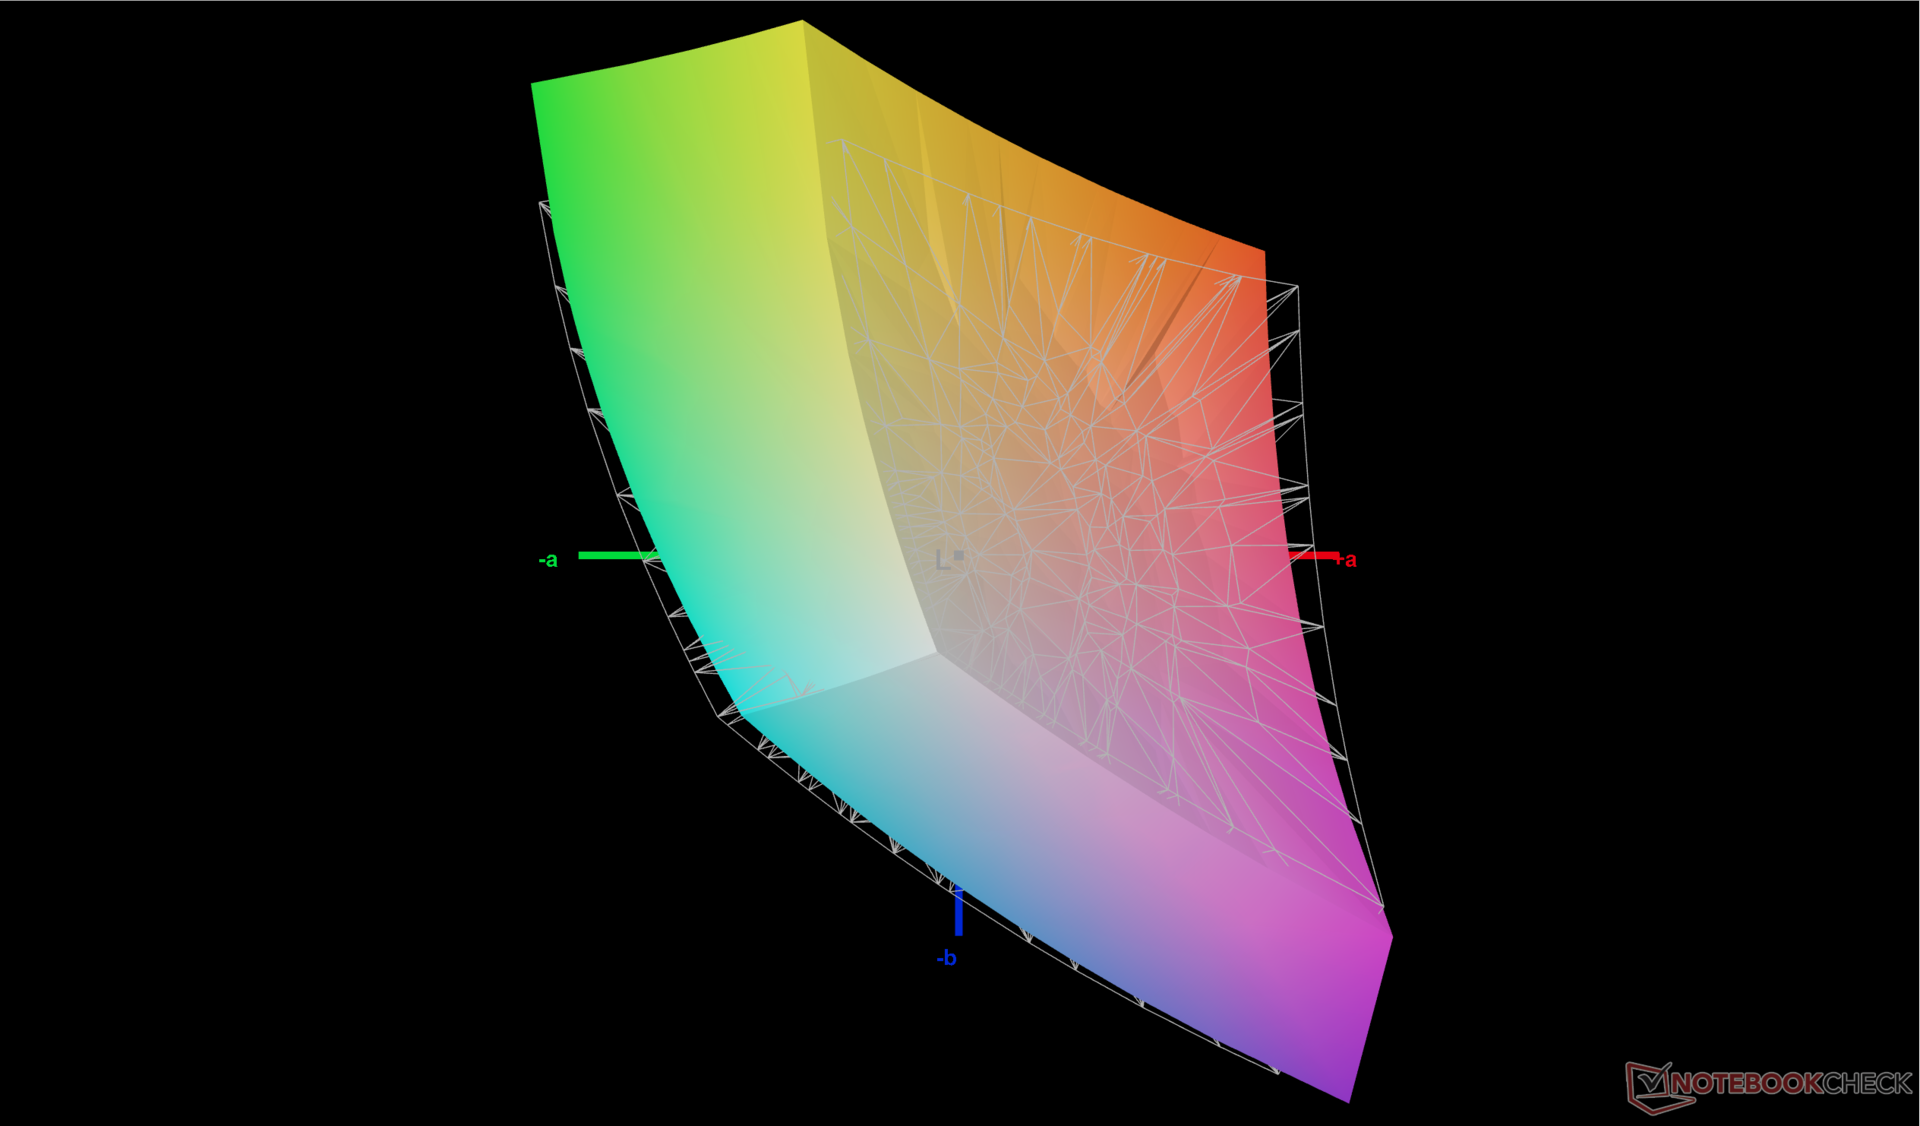
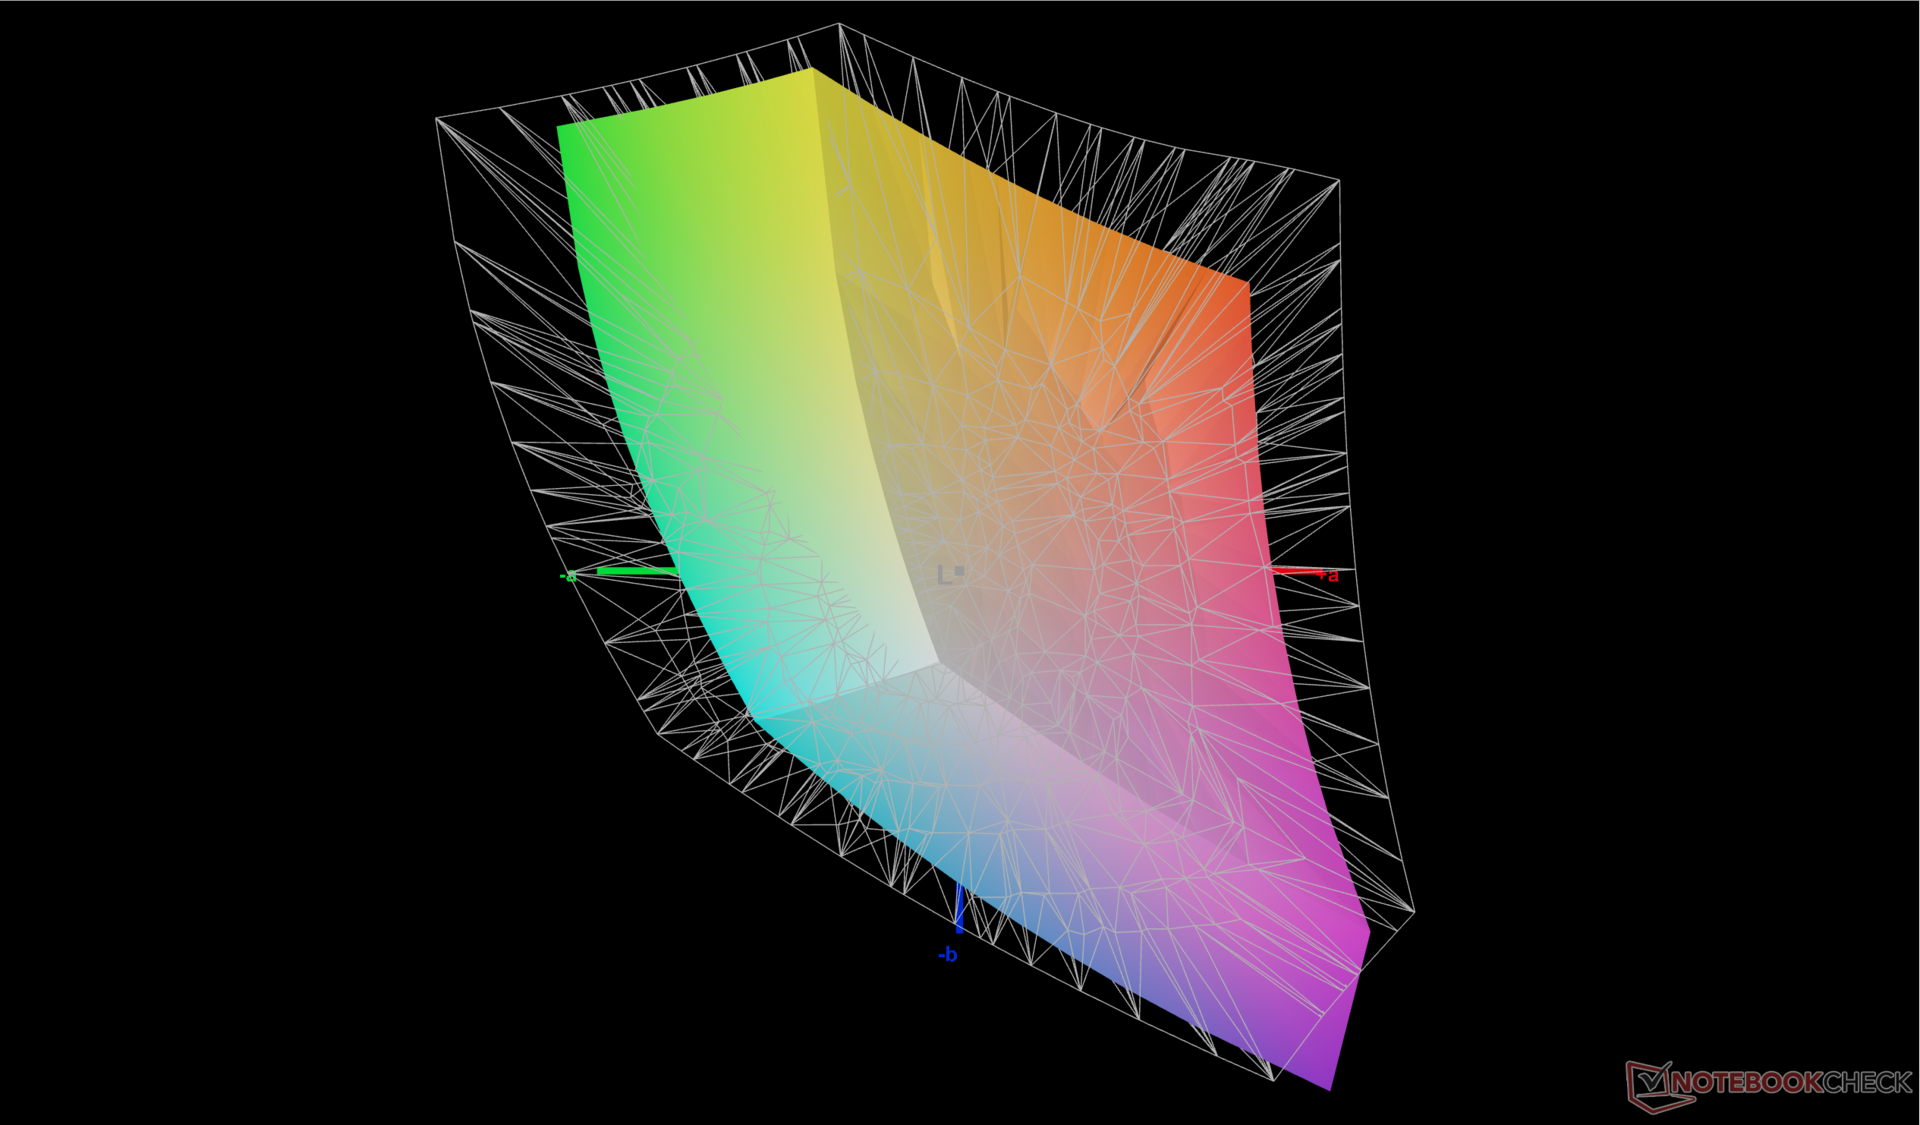
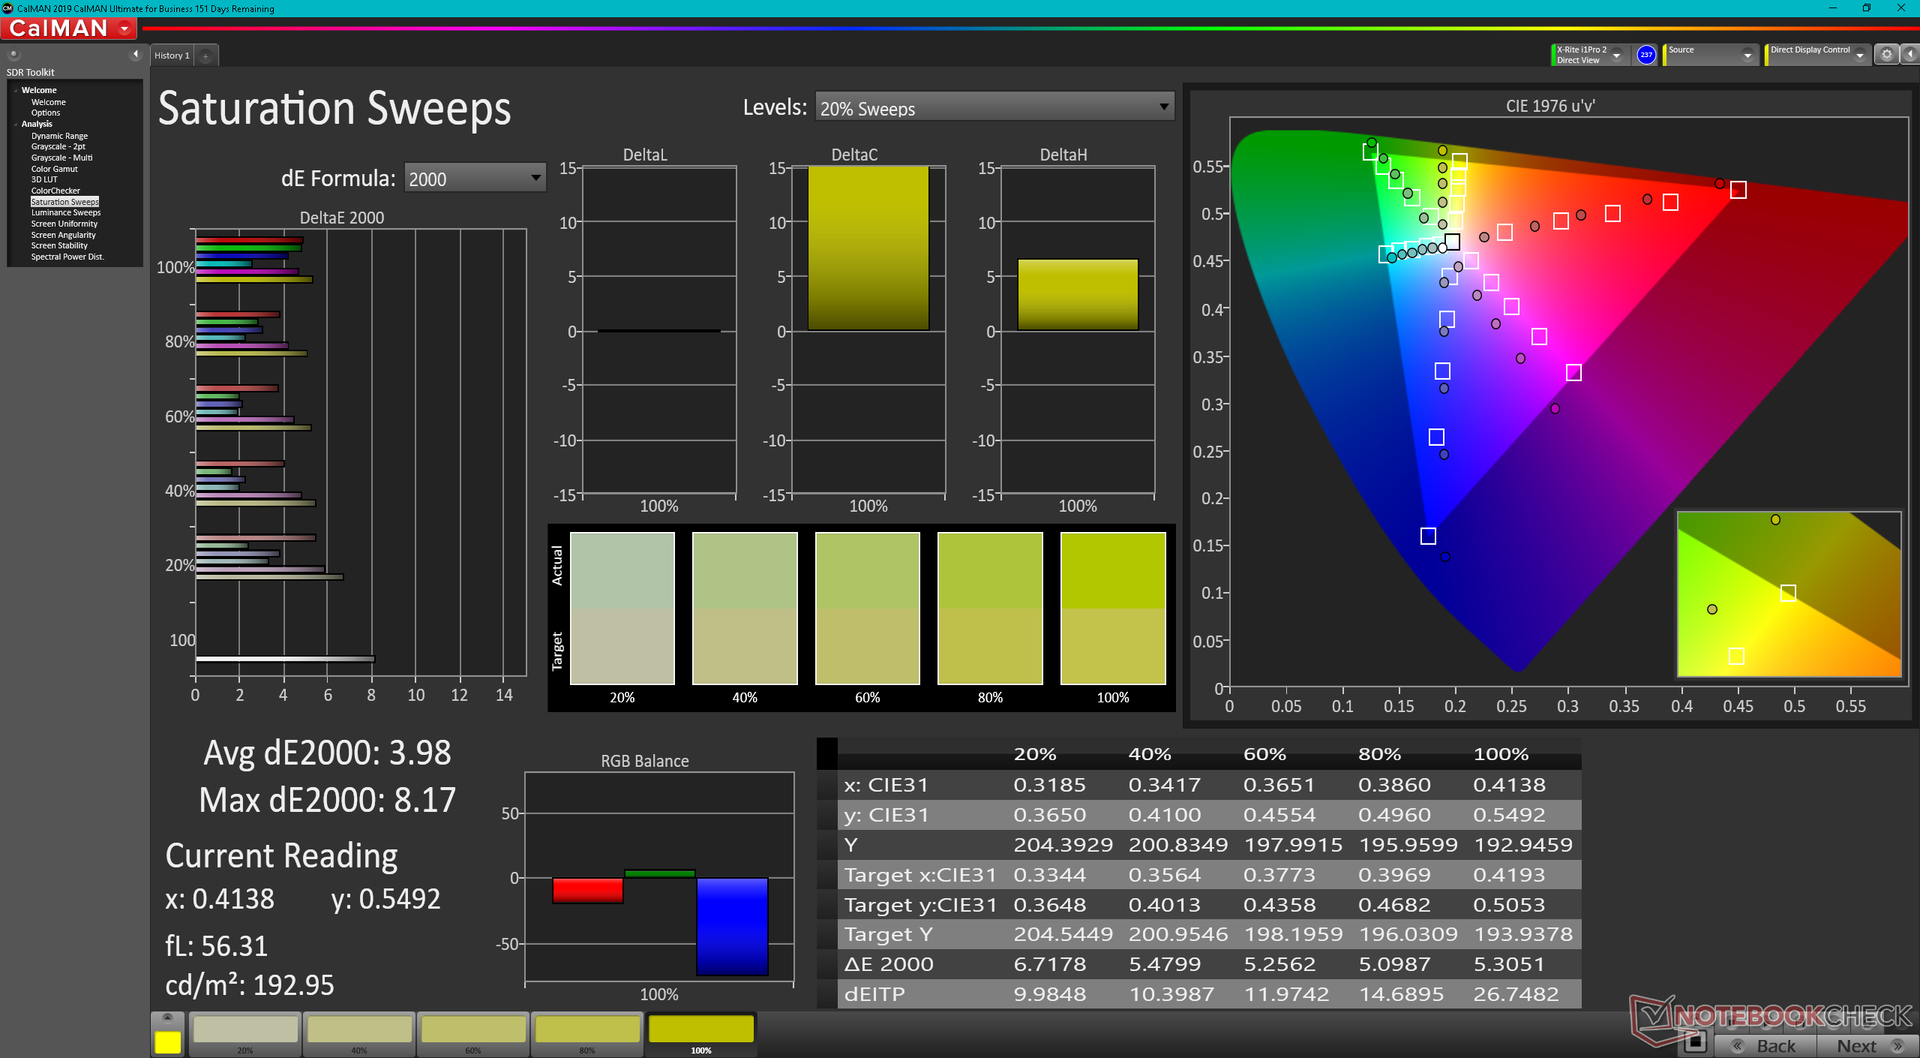
The display is not very well calibrated out of the box which is a shame because of its relatively wide >90 percent sRGB coverage. The default average grayscale and color DeltaE values of 5.5 and 6.31 would improve to just 2.1 and 1.44, respectively, after calibrating the panel ourselves. We recommend applying our calibrated ICM profile above to get more accurate colors from the display.
Display Response Times
| ↔ Response Time Black to White | ||
|---|---|---|
| 18.7 ms ... rise ↗ and fall ↘ combined | ↗ 9.1 ms rise | 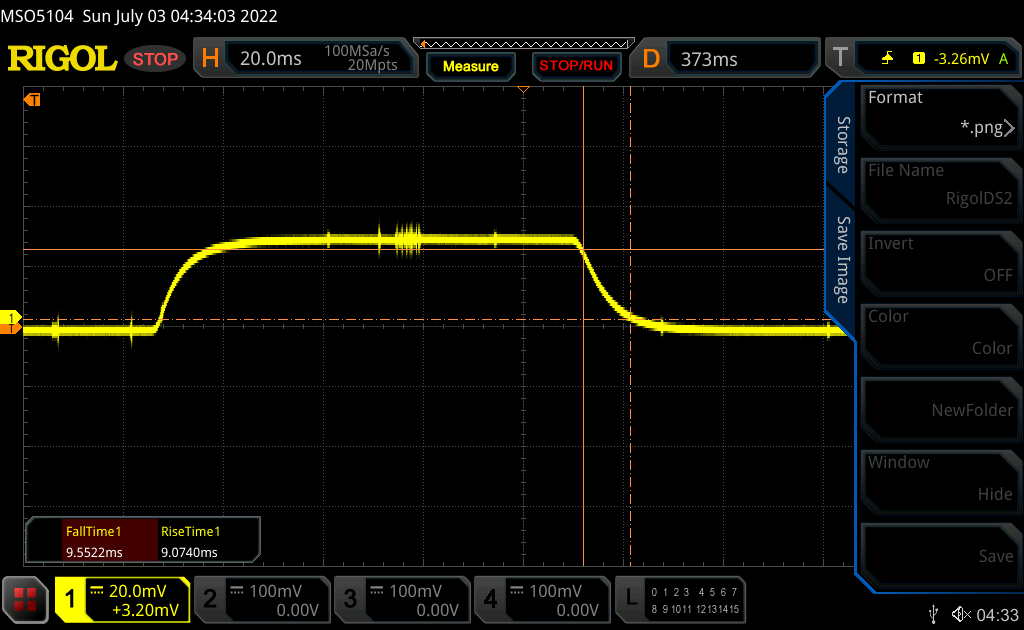 |
| ↘ 9.6 ms fall | ||
| The screen shows good response rates in our tests, but may be too slow for competitive gamers. In comparison, all tested devices range from 0.1 (minimum) to 240 (maximum) ms. » 41 % of all devices are better. This means that the measured response time is similar to the average of all tested devices (19.9 ms). | ||
| ↔ Response Time 50% Grey to 80% Grey | ||
| 21.2 ms ... rise ↗ and fall ↘ combined | ↗ 9.5 ms rise | 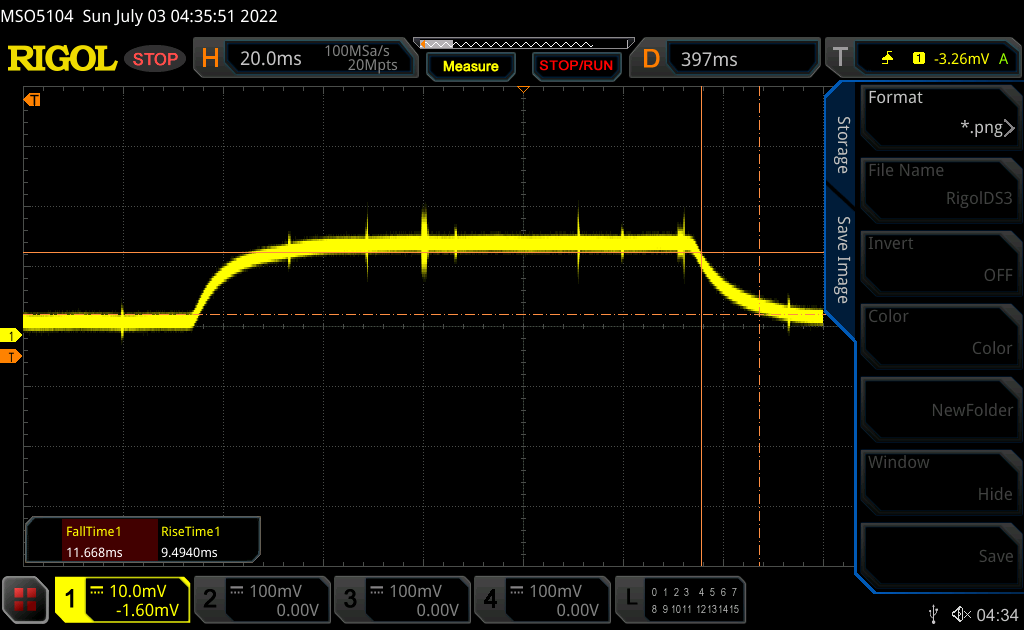 |
| ↘ 11.7 ms fall | ||
| The screen shows good response rates in our tests, but may be too slow for competitive gamers. In comparison, all tested devices range from 0.165 (minimum) to 636 (maximum) ms. » 33 % of all devices are better. This means that the measured response time is better than the average of all tested devices (31.1 ms). | ||
Screen Flickering / PWM (Pulse-Width Modulation)
| Screen flickering / PWM not detected | 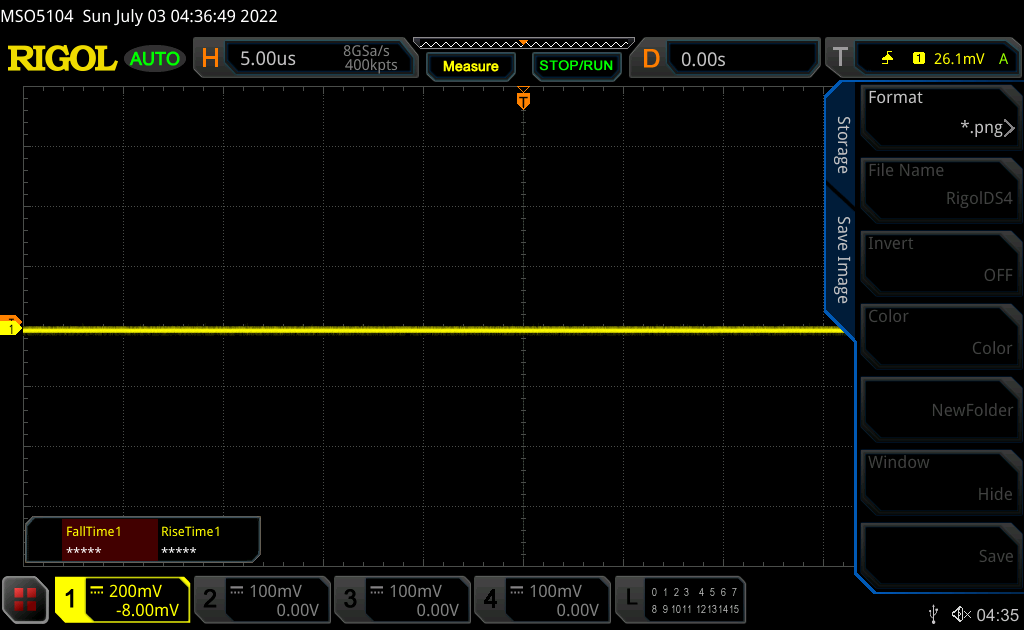 | ||
In comparison: 52 % of all tested devices do not use PWM to dim the display. If PWM was detected, an average of 7801 (minimum: 5 - maximum: 343500) Hz was measured. | |||
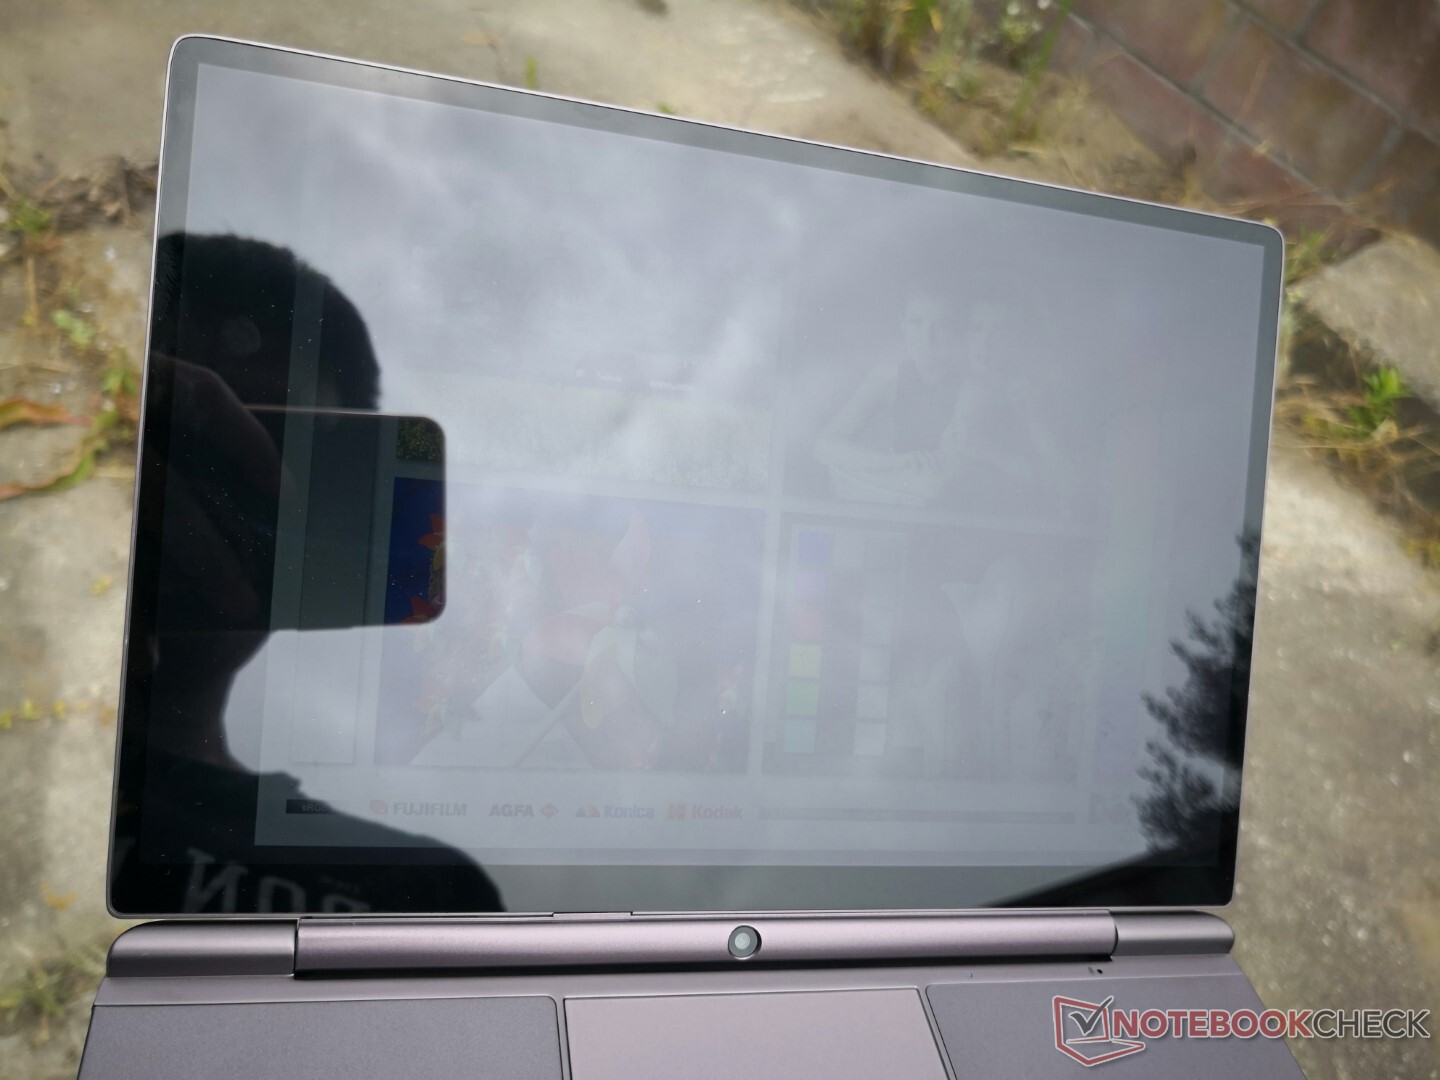
At 400-nits maximum, the display is bright enough to be viewed comfortably when under shade. Brighter ambient lighting will wash out the colors or produce too heavy of a glare on the glossy touchscreen.


Performance — Red Or Blue?
Testing Conditions
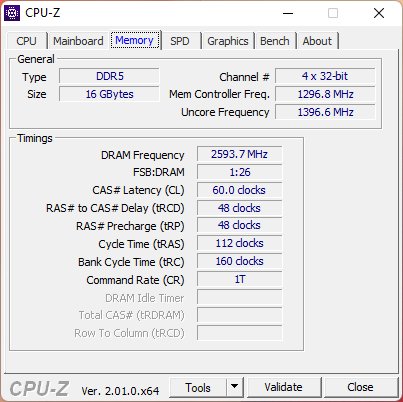
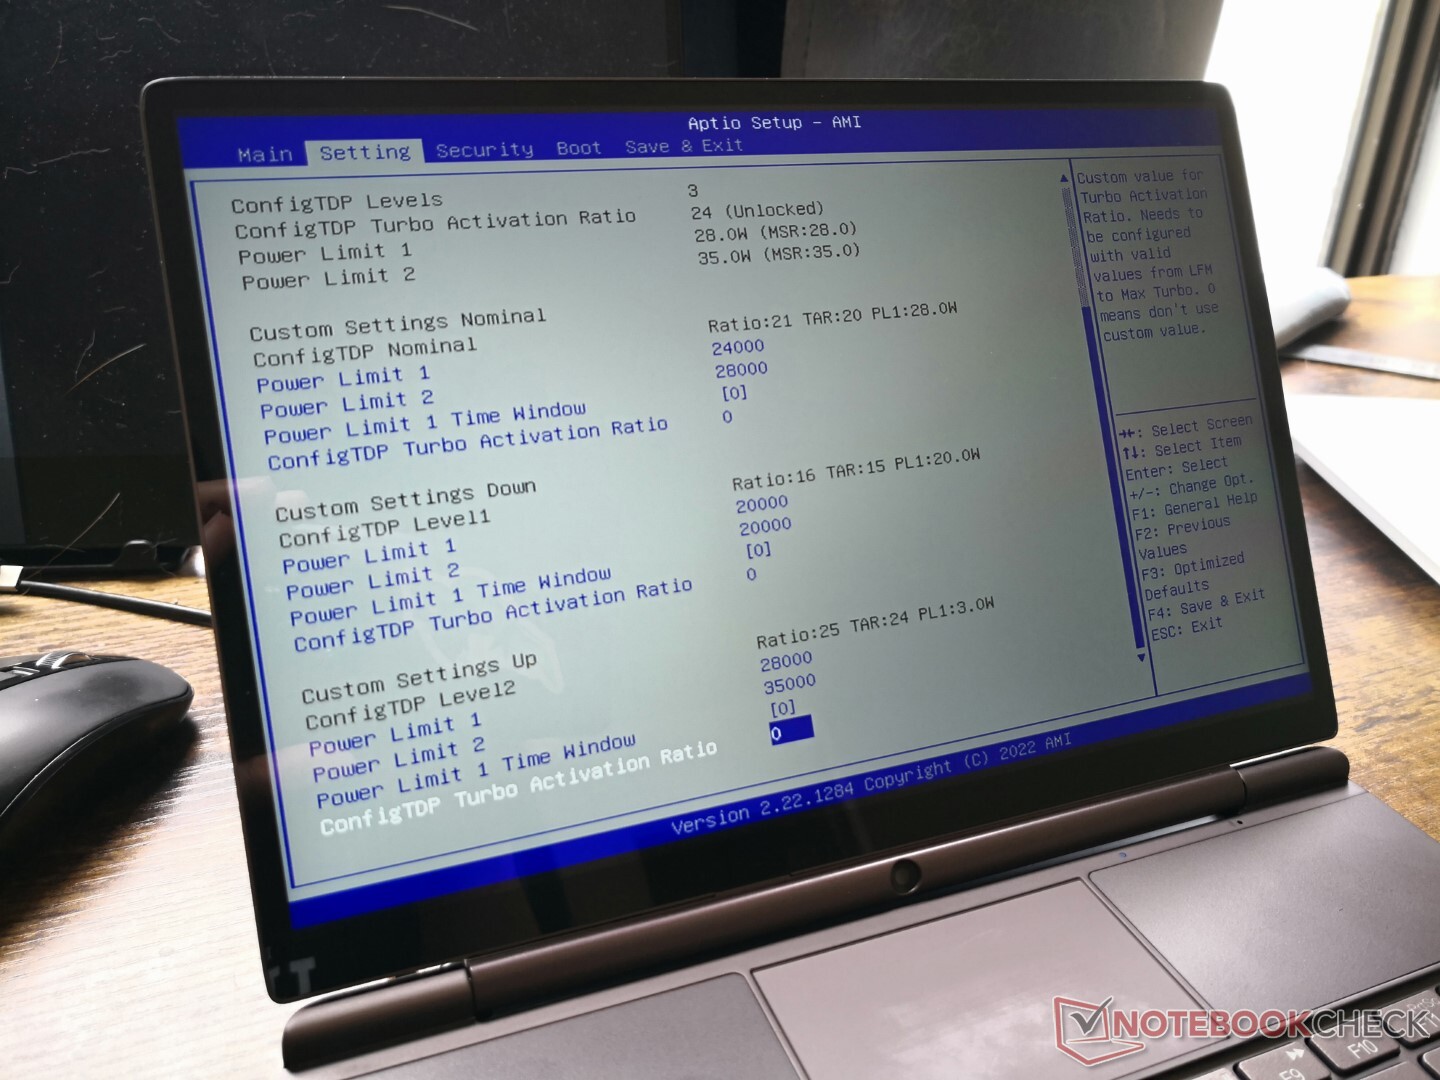
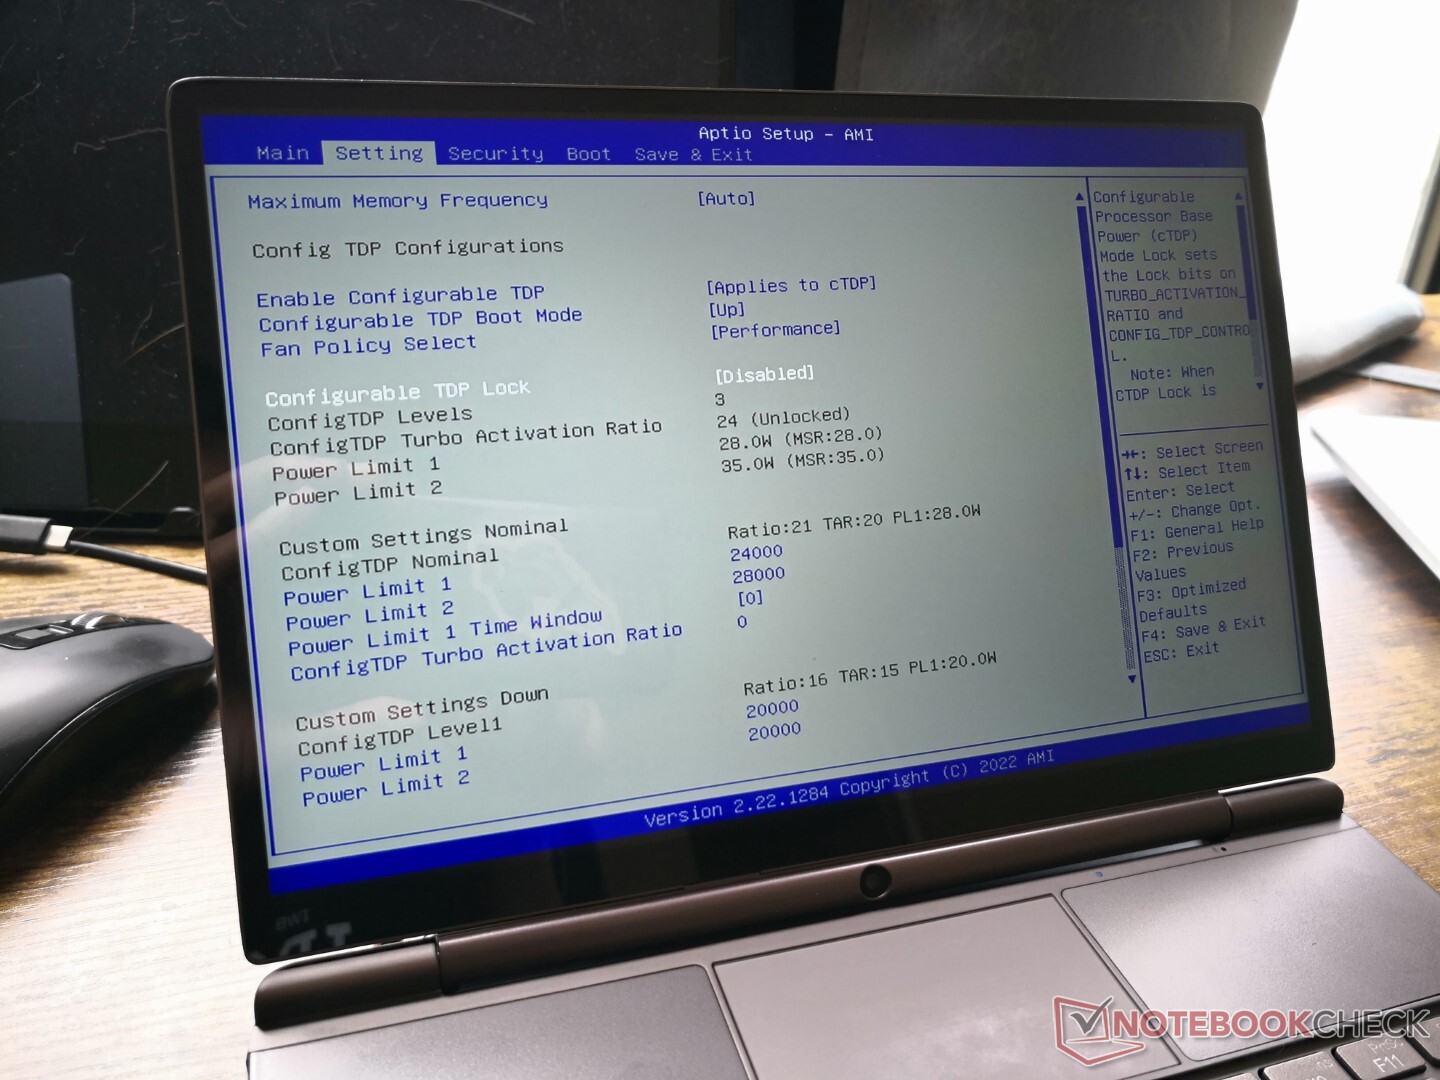
Much like on other GPD products, the BIOS screen offers configurable TDP settings. The three preset modes are Nominal, Down, and Up each with varying levels of PL1 and PL2 targets as described below:
- Nominal: PL1=24 W, PL2=28 W
- Down: PL1=20 W, PL2=20 W
- Up: PL1=28 W, PL2=35 W
We set our unit to the Up preset and the Fan Policy to Performance prior to running any performance benchmarks below. We also enabled the "Turbo" setting on the keyboard and made sure that Windows was on Performance mode as well.
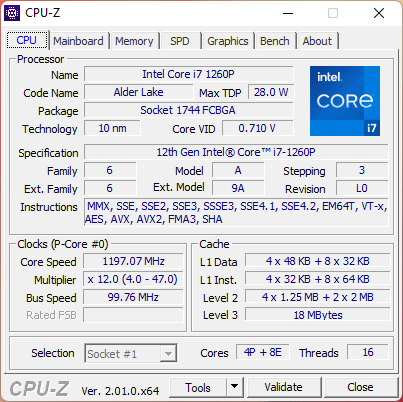
Processor
Multi-thread CPU performance is roughly 15 percent slower than the average laptop in our database equipped with the same Core i7-1260P processor. Conversely, single-thread performance is roughly 10 to 15 faster than the average. There's definitely a feeling that the Win Max 2 isn't fully exploiting the capabilities of Intel's new 12th gen CPU in this regard, but it is still significantly faster than the older 11th gen CPU options as found on the GPD Win 3 or Pocket 3 by 50 percent or greater. If you want the best that the Core i7-1260P has to offer, however, then you may want to instead look at full-fledged laptops like the Dell Inspiron 16 7620 2-in-1 which can run the same CPU up to 40 percent faster.
Many AMD Zen 3 CPUs are able to offer slightly faster multi-thread performance but slower single-thread performance than our Core i7-1260P in the Win Max 2 including the Ryzen 5 5500U, Ryzen 7 5700U, or even the older Zen 2 Ryzen 7 4800U. Opting for the Ryzen 7 6800U SKU will increase multi-thread performance by 50 percent while single-thread performance will drop by almost 20 percent.
Cinebench R15 Multi Loop
Cinebench R23: Multi Core | Single Core
Cinebench R15: CPU Multi 64Bit | CPU Single 64Bit
Blender: v2.79 BMW27 CPU
7-Zip 18.03: 7z b 4 | 7z b 4 -mmt1
Geekbench 5.5: Multi-Core | Single-Core
HWBOT x265 Benchmark v2.2: 4k Preset
LibreOffice : 20 Documents To PDF
R Benchmark 2.5: Overall mean
Cinebench R23: Multi Core | Single Core
Cinebench R15: CPU Multi 64Bit | CPU Single 64Bit
Blender: v2.79 BMW27 CPU
7-Zip 18.03: 7z b 4 | 7z b 4 -mmt1
Geekbench 5.5: Multi-Core | Single-Core
HWBOT x265 Benchmark v2.2: 4k Preset
LibreOffice : 20 Documents To PDF
R Benchmark 2.5: Overall mean
* ... smaller is better
AIDA64: FP32 Ray-Trace | FPU Julia | CPU SHA3 | CPU Queen | FPU SinJulia | FPU Mandel | CPU AES | CPU ZLib | FP64 Ray-Trace | CPU PhotoWorxx
| Performance rating | |
| GPD Win Max 2021 | |
| Average Intel Core i7-1260P | |
| Lenovo Yoga 9 14IAP7 82LU0001US | |
| GPD Win Max 2 | |
| GPD Pocket 3 | |
| AIDA64 / FP32 Ray-Trace | |
| GPD Win Max 2021 | |
| Average Intel Core i7-1260P (2176 - 10898, n=26) | |
| Lenovo Yoga 9 14IAP7 82LU0001US | |
| GPD Pocket 3 | |
| GPD Win Max 2 | |
| AIDA64 / FPU Julia | |
| GPD Win Max 2021 | |
| Average Intel Core i7-1260P (11015 - 56906, n=26) | |
| Lenovo Yoga 9 14IAP7 82LU0001US | |
| GPD Pocket 3 | |
| GPD Win Max 2 | |
| AIDA64 / CPU SHA3 | |
| Lenovo Yoga 9 14IAP7 82LU0001US | |
| Average Intel Core i7-1260P (669 - 2709, n=26) | |
| GPD Win Max 2021 | |
| GPD Pocket 3 | |
| GPD Win Max 2 | |
| AIDA64 / CPU Queen | |
| GPD Win Max 2021 | |
| Lenovo Yoga 9 14IAP7 82LU0001US | |
| Average Intel Core i7-1260P (42571 - 82493, n=26) | |
| GPD Win Max 2 | |
| GPD Pocket 3 | |
| AIDA64 / FPU SinJulia | |
| GPD Win Max 2021 | |
| Lenovo Yoga 9 14IAP7 82LU0001US | |
| GPD Win Max 2 | |
| Average Intel Core i7-1260P (2901 - 6975, n=26) | |
| GPD Pocket 3 | |
| AIDA64 / FPU Mandel | |
| GPD Win Max 2021 | |
| Average Intel Core i7-1260P (5950 - 26376, n=26) | |
| Lenovo Yoga 9 14IAP7 82LU0001US | |
| GPD Pocket 3 | |
| GPD Win Max 2 | |
| AIDA64 / CPU AES | |
| GPD Pocket 3 | |
| GPD Win Max 2021 | |
| GPD Win Max 2 | |
| Average Intel Core i7-1260P (16041 - 92356, n=26) | |
| Lenovo Yoga 9 14IAP7 82LU0001US | |
| AIDA64 / CPU ZLib | |
| Lenovo Yoga 9 14IAP7 82LU0001US | |
| Average Intel Core i7-1260P (259 - 771, n=26) | |
| GPD Win Max 2021 | |
| GPD Win Max 2 | |
| GPD Pocket 3 | |
| AIDA64 / FP64 Ray-Trace | |
| GPD Win Max 2021 | |
| Average Intel Core i7-1260P (1237 - 5858, n=26) | |
| Lenovo Yoga 9 14IAP7 82LU0001US | |
| GPD Pocket 3 | |
| GPD Win Max 2 | |
| AIDA64 / CPU PhotoWorxx | |
| Lenovo Yoga 9 14IAP7 82LU0001US | |
| GPD Win Max 2 | |
| GPD Pocket 3 | |
| Average Intel Core i7-1260P (13261 - 43652, n=26) | |
| GPD Win Max 2021 | |
System Performance
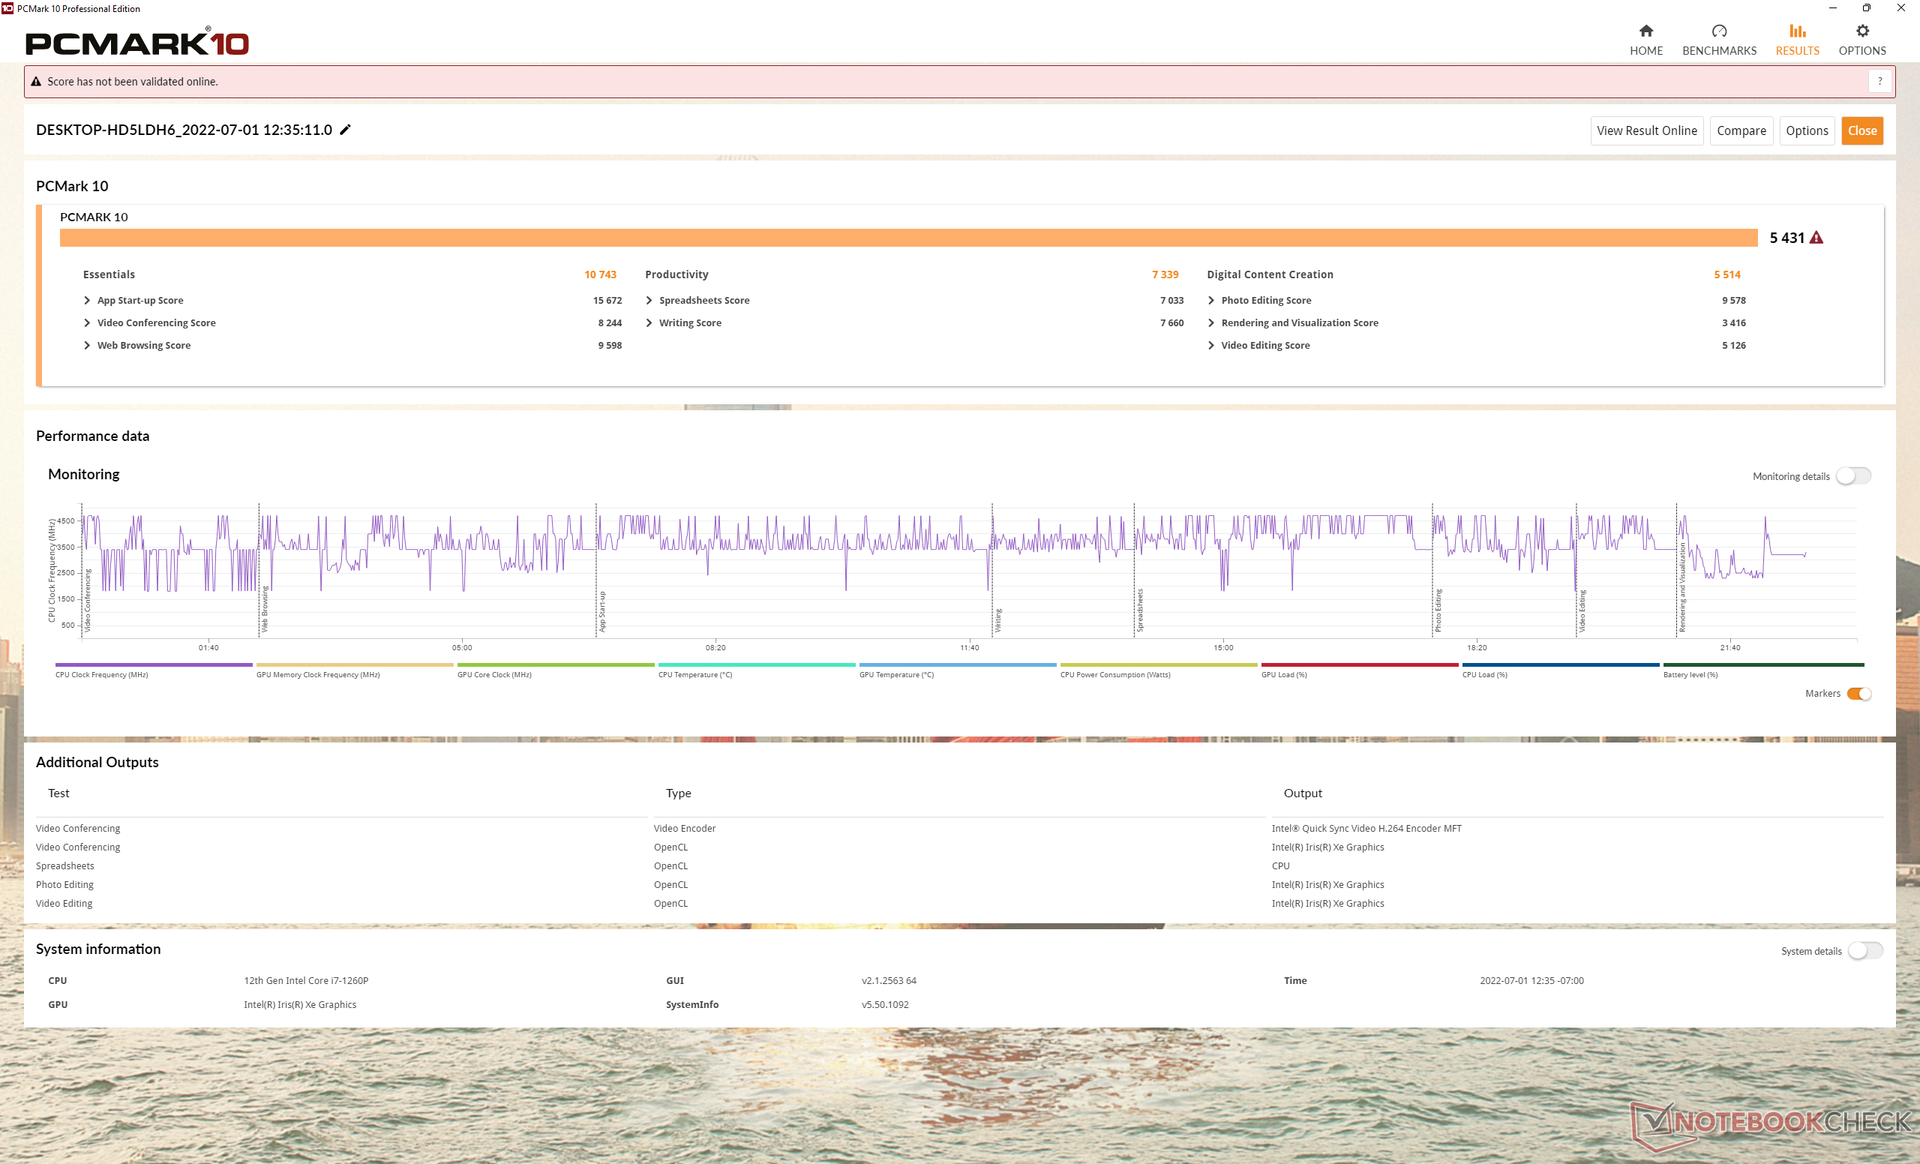
PCMark 10 scores are generally higher than any GPD product that came before our Win Max 2 to be essentially on equal footing with full-size laptops like the Dell Inspiron 16 7620 2-in-1. Interestingly, the original AMD-powered Win Max has a higher Productivity subscore likely due to its faster multi-thread CPU performance.
CrossMark: Overall | Productivity | Creativity | Responsiveness
| PCMark 10 / Score | |
| Average Intel Core i7-1260P, Intel Iris Xe Graphics G7 96EUs (4796 - 6068, n=17) | |
| GPD Win Max 2 | |
| GPD Win Max 2021 | |
| GPD Pocket 3 | |
| GPD Win 3 | |
| Microsoft Surface Go 3 Core i3 | |
| Lenovo IdeaPad Flex 3 11IGL05 | |
| PCMark 10 / Essentials | |
| GPD Win Max 2 | |
| GPD Pocket 3 | |
| Average Intel Core i7-1260P, Intel Iris Xe Graphics G7 96EUs (9260 - 11251, n=17) | |
| GPD Win 3 | |
| GPD Win Max 2021 | |
| Microsoft Surface Go 3 Core i3 | |
| Lenovo IdeaPad Flex 3 11IGL05 | |
| PCMark 10 / Productivity | |
| GPD Win Max 2021 | |
| GPD Pocket 3 | |
| GPD Win Max 2 | |
| Average Intel Core i7-1260P, Intel Iris Xe Graphics G7 96EUs (6167 - 8629, n=17) | |
| GPD Win 3 | |
| Microsoft Surface Go 3 Core i3 | |
| Lenovo IdeaPad Flex 3 11IGL05 | |
| PCMark 10 / Digital Content Creation | |
| Average Intel Core i7-1260P, Intel Iris Xe Graphics G7 96EUs (5231 - 6908, n=17) | |
| GPD Win Max 2 | |
| GPD Win Max 2021 | |
| GPD Pocket 3 | |
| GPD Win 3 | |
| Microsoft Surface Go 3 Core i3 | |
| Lenovo IdeaPad Flex 3 11IGL05 | |
| CrossMark / Overall | |
| GPD Win Max 2 | |
| Average Intel Core i7-1260P, Intel Iris Xe Graphics G7 96EUs (1484 - 1811, n=16) | |
| CrossMark / Productivity | |
| GPD Win Max 2 | |
| Average Intel Core i7-1260P, Intel Iris Xe Graphics G7 96EUs (1486 - 1755, n=16) | |
| CrossMark / Creativity | |
| Average Intel Core i7-1260P, Intel Iris Xe Graphics G7 96EUs (1451 - 1872, n=16) | |
| GPD Win Max 2 | |
| CrossMark / Responsiveness | |
| GPD Win Max 2 | |
| Average Intel Core i7-1260P, Intel Iris Xe Graphics G7 96EUs (1253 - 1807, n=16) | |
| PCMark 10 Score | 5431 points | |
Help | ||
| AIDA64 / Memory Copy | |
| GPD Win Max 2 | |
| GPD Pocket 3 | |
| Average Intel Core i7-1260P (25125 - 71544, n=25) | |
| GPD Win Max 2021 | |
| AIDA64 / Memory Read | |
| GPD Win Max 2 | |
| Average Intel Core i7-1260P (24983 - 72065, n=25) | |
| GPD Pocket 3 | |
| GPD Win Max 2021 | |
| AIDA64 / Memory Write | |
| GPD Win Max 2 | |
| GPD Pocket 3 | |
| Average Intel Core i7-1260P (23512 - 66799, n=25) | |
| GPD Win Max 2021 | |
| AIDA64 / Memory Latency | |
| GPD Win Max 2021 | |
| GPD Win Max 2 | |
| GPD Pocket 3 | |
| Average Intel Core i7-1260P (77.9 - 118.4, n=21) | |
| Microsoft Surface Go 3 Core i3 | |
* ... smaller is better
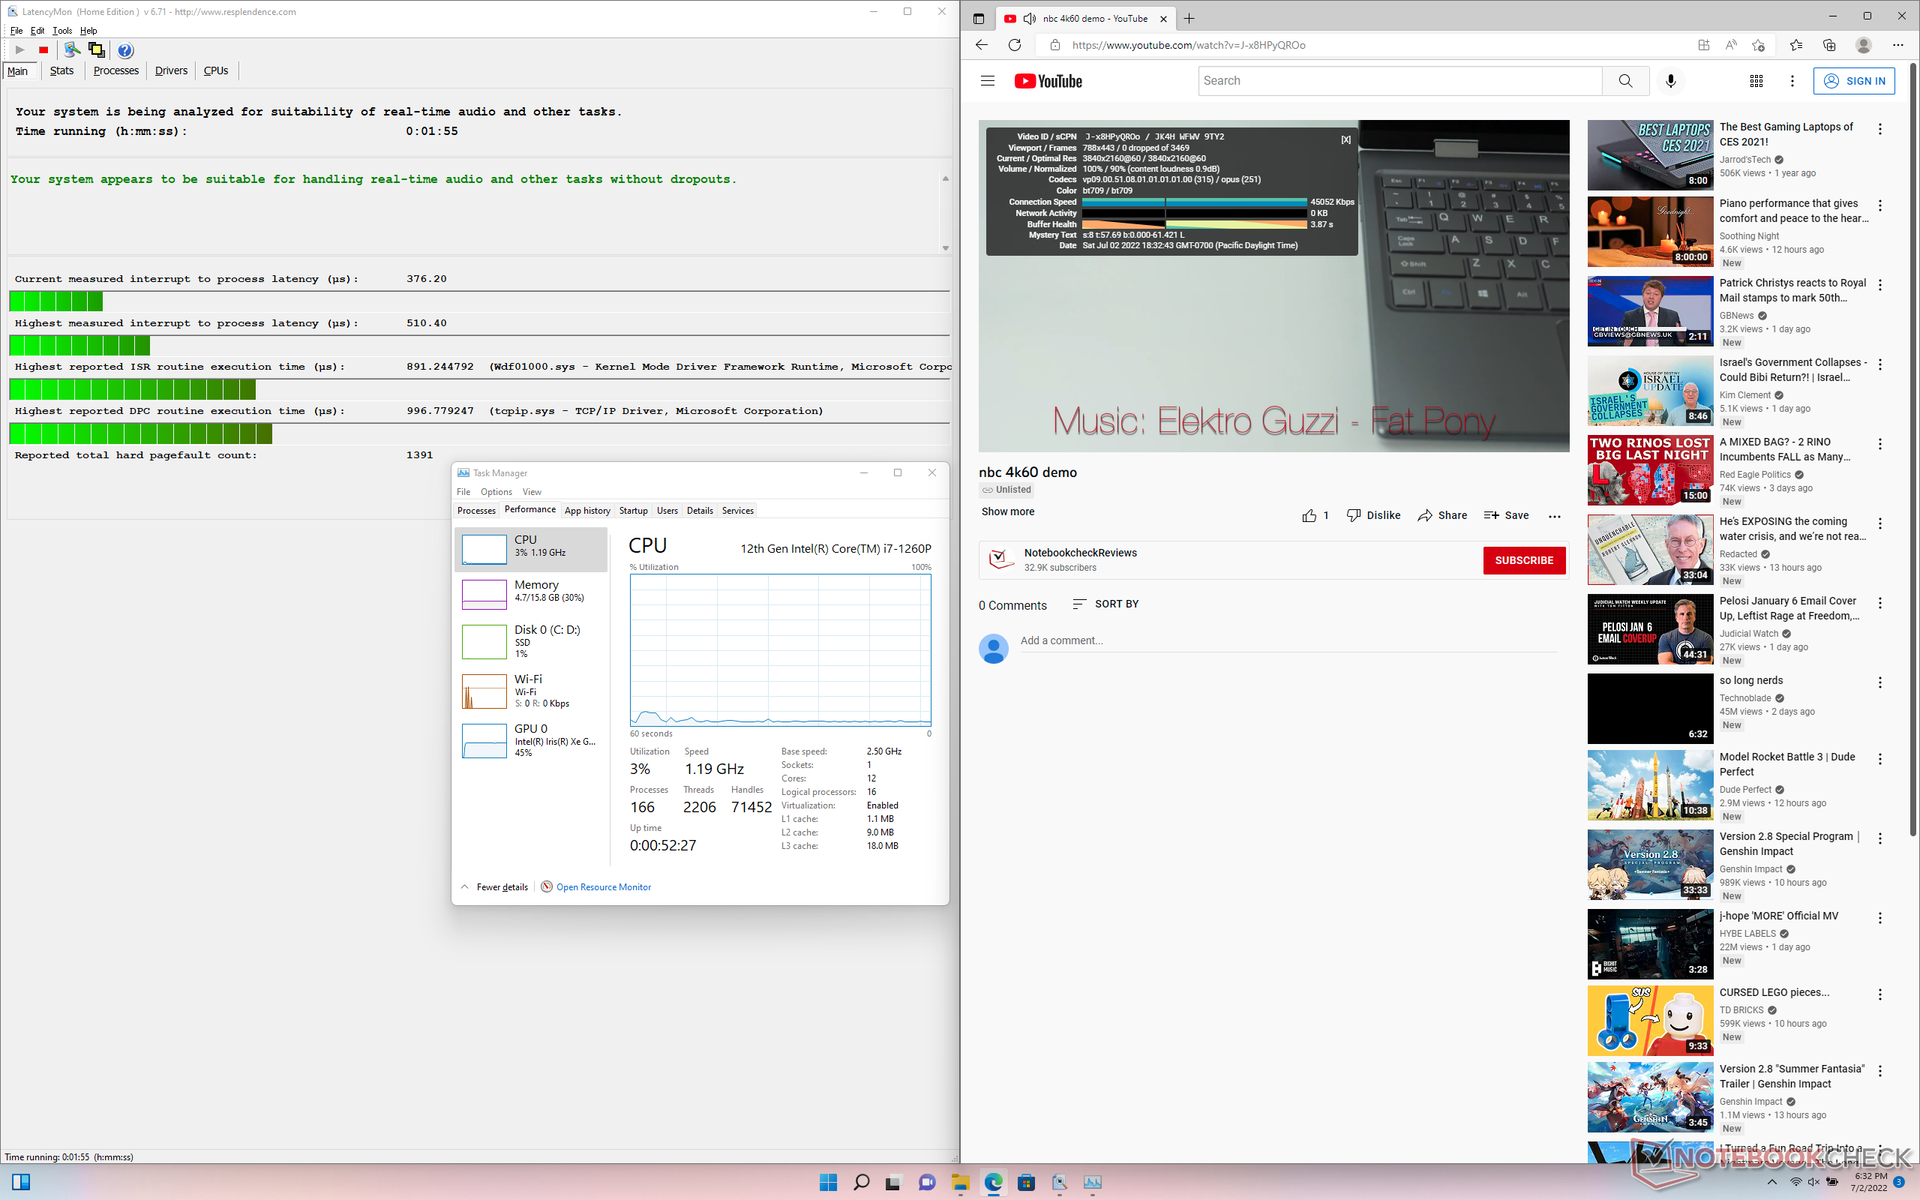
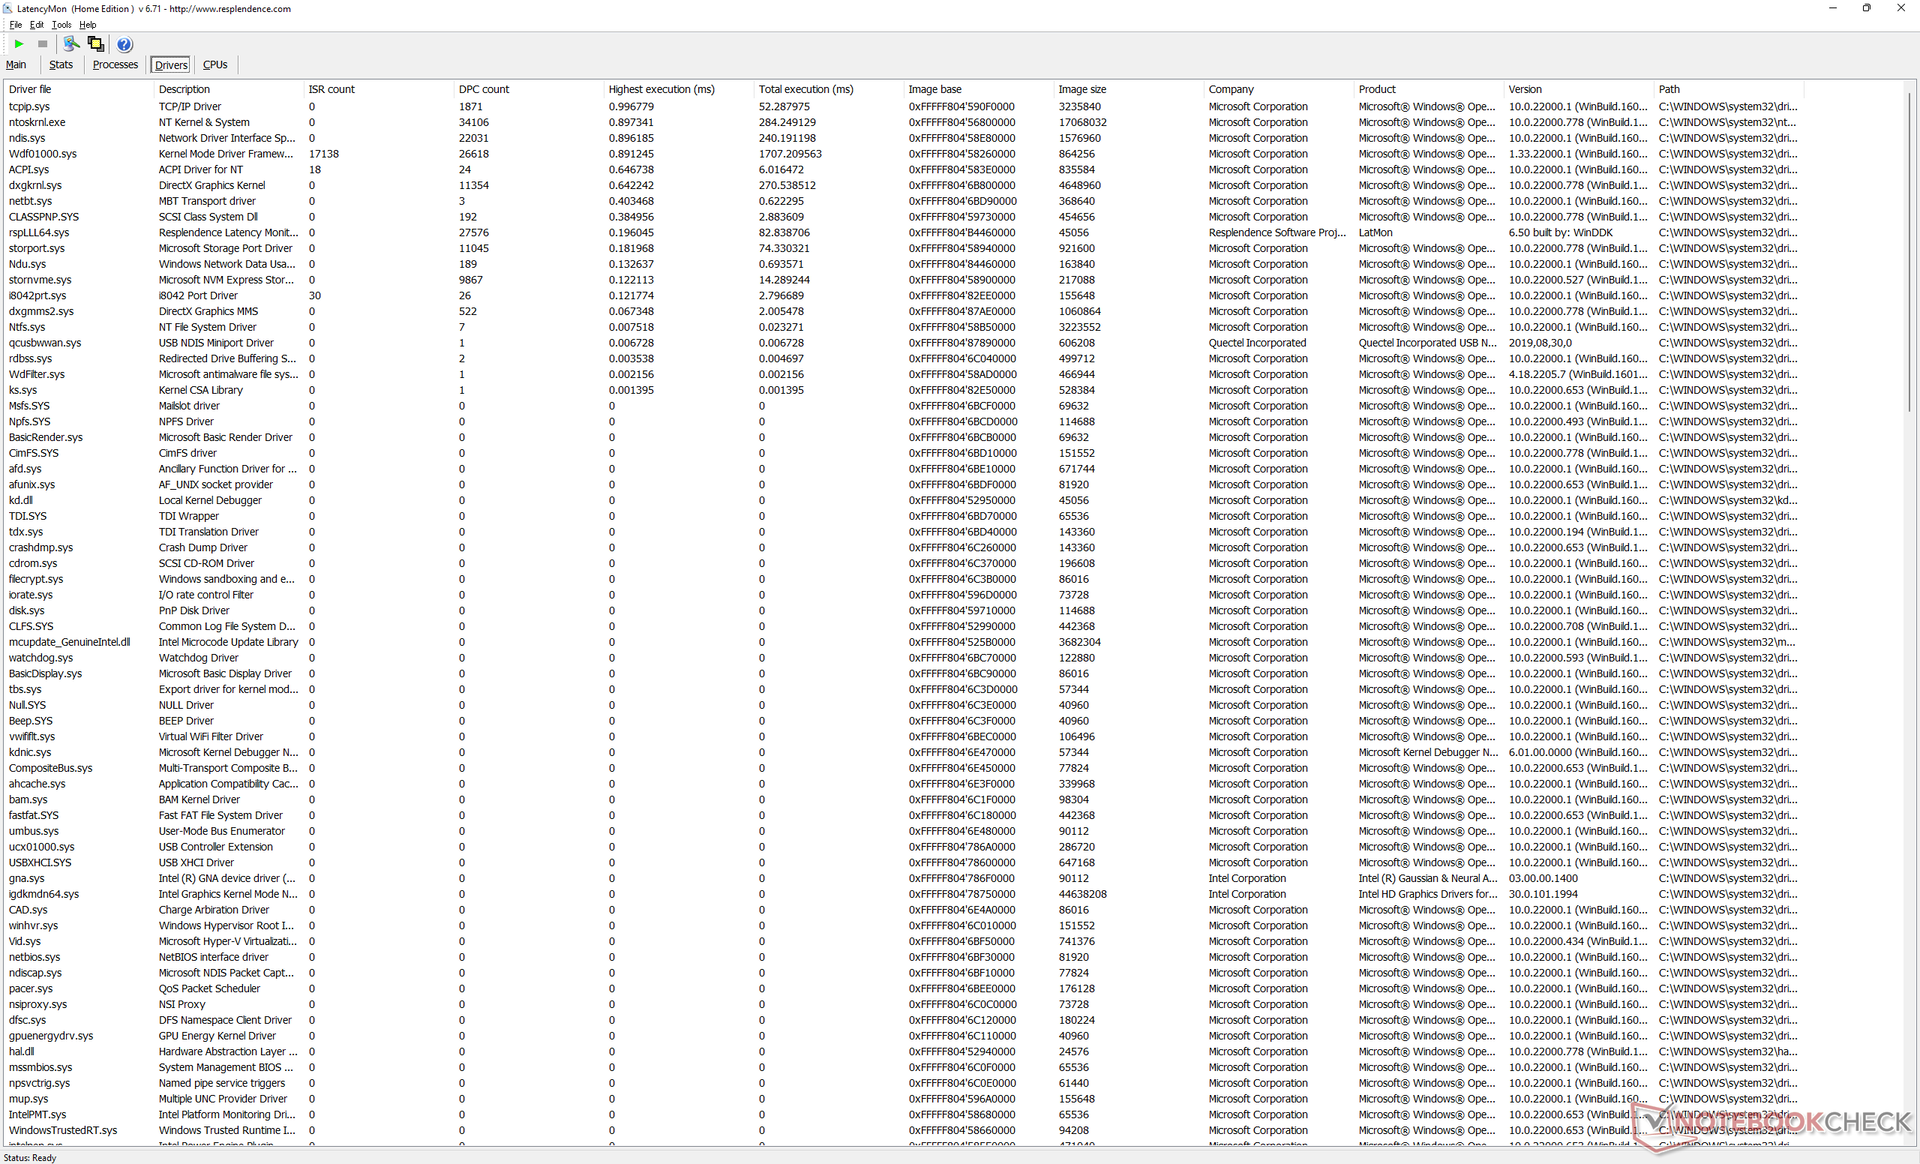
DPC Latency
LatencyMon shows no DPC issues when opening multiple browser tabs on our homepage or when running Prime95. 4K video playback at 60 FPS is also smooth with no dropped frames.
| DPC Latencies / LatencyMon - interrupt to process latency (max), Web, Youtube, Prime95 | |
| Microsoft Surface Go 3 Core i3 | |
| GPD Win Max 2021 | |
| Lenovo IdeaPad Flex 3 11IGL05 | |
| GPD Win 3 | |
| GPD Pocket 3 | |
| GPD Win Max 2 | |
* ... smaller is better
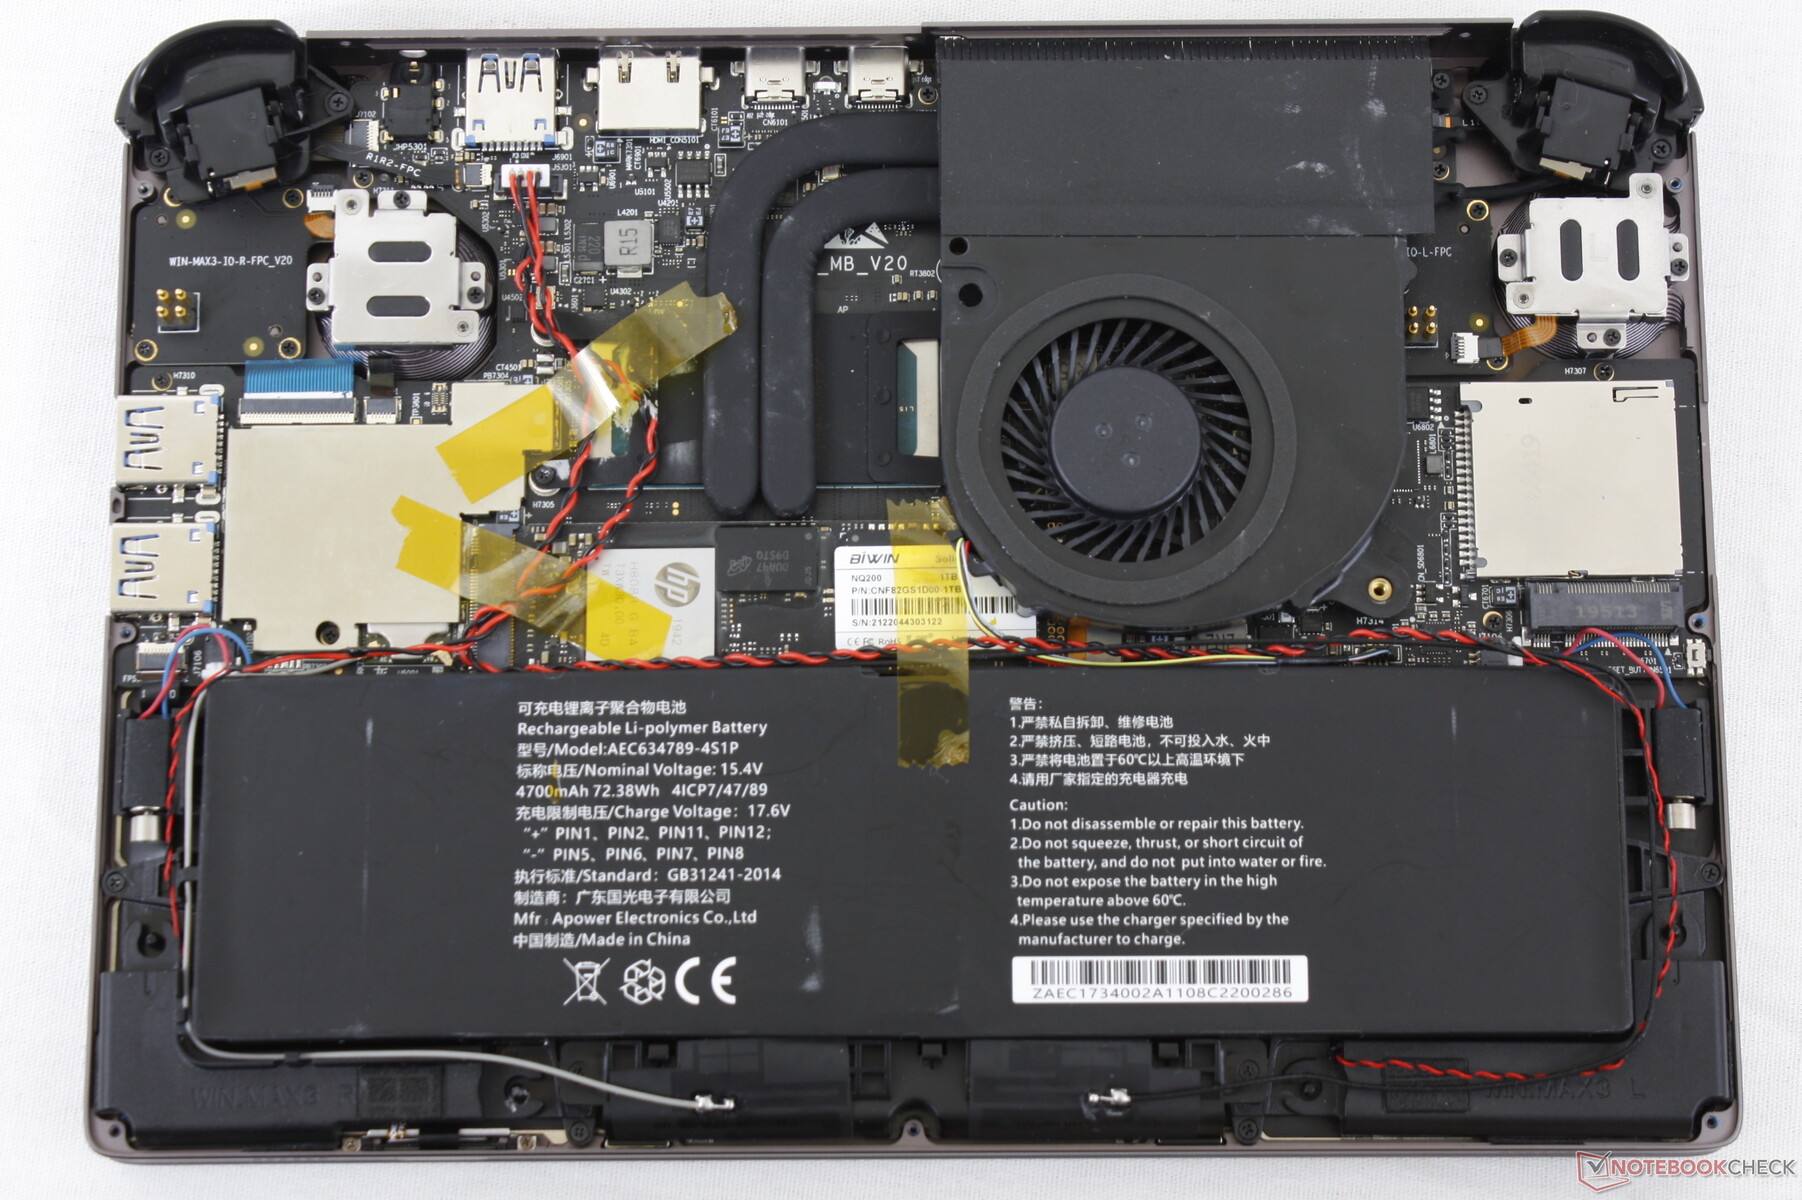
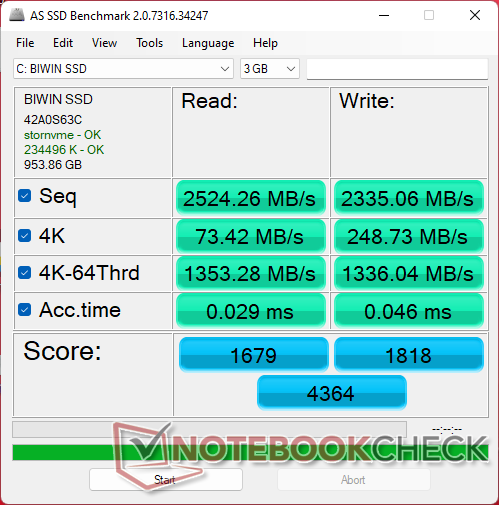
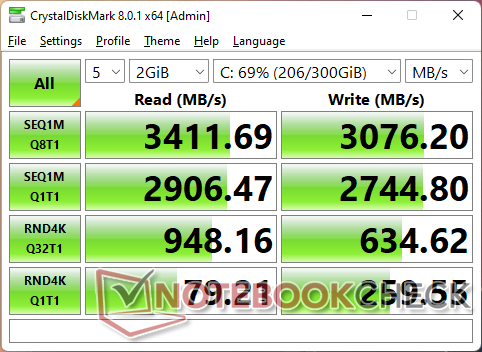
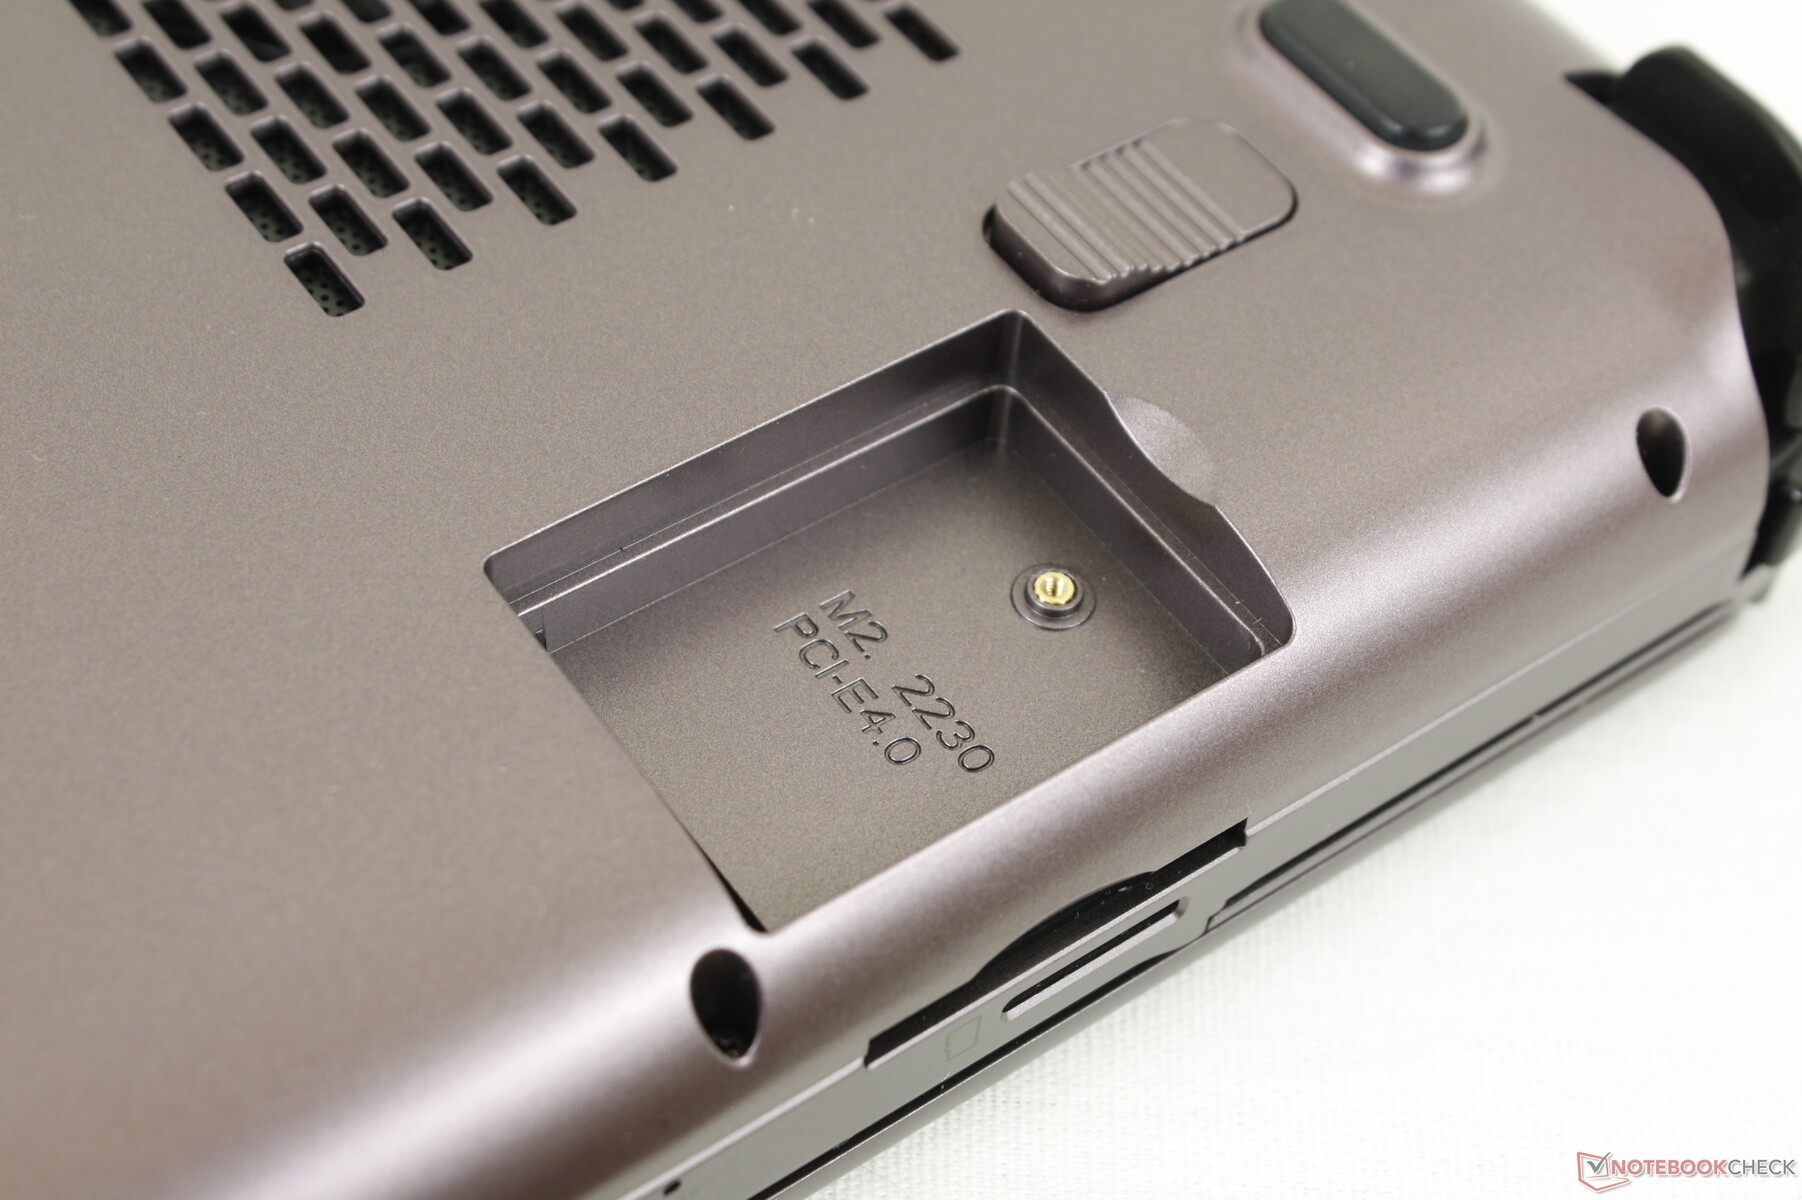
Storage Devices — PCIe3 and PCIe4 Support
The model can support up to two PCIe4 x4 SSDs even though our unit shipped with a 1 TB BiWin NQ200 PCIe3 x4 drive. Even so, our PCIe3 drive would have issues sustaining transfer rates above 3300 MB/s as shown by our DiskSpd loop test below due to thermal limitations. If you do decide to install a PCIe4 x4 drive, then don't expect it to run at its advertised maximum specifications for long periods.

| Drive Performance rating - Percent | |
| GPD Win Max 2 | |
| Average BiWin NQ200 1TB CNF82GS1D00-1TB | |
| GPD Pocket 3 | |
| GPD Win 3 | |
| GPD Win Max 2021 | |
| Microsoft Surface Go 3 Core i3 | |
| Lenovo IdeaPad Flex 3 11IGL05 | |
* ... smaller is better
Disk Throttling: DiskSpd Read Loop, Queue Depth 8
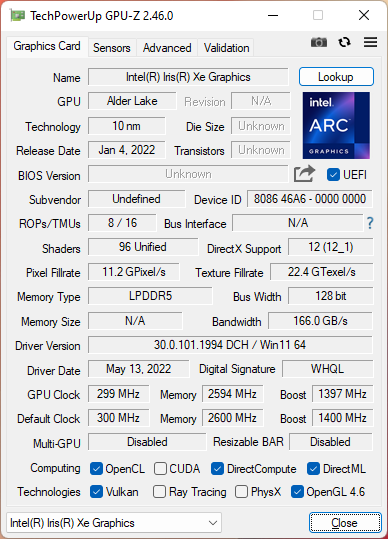
GPU Performance — Iris Xe Is Slower Than The Radeon 680M
Despite the slower-than-expected CPU performance, graphics performance remains excellent. 3DMark results are 15 to 20 percent higher than the average laptop in our database equipped with the same integrated Iris Xe 96 EUs GPU. This is good enough to be able to run some older 3D games at 1080p and 30 FPS on medium to high settings including Witcher 3, but we recommend lowering the settings and engaging vsync to smoothen the gaming experience. It's unfortunate that the display does not support adaptive sync as such a feature would have helped tremendously when gaming.
When compared to the GPD Win 3 running on the Iris Xe 80 EUs, our Win Max 2 can offer 15 to 30 percent faster graphics performance. Opting for the AMD Radeon 680M SKU will increase graphics performance by 20 to 30 percent over our Intel SKU.
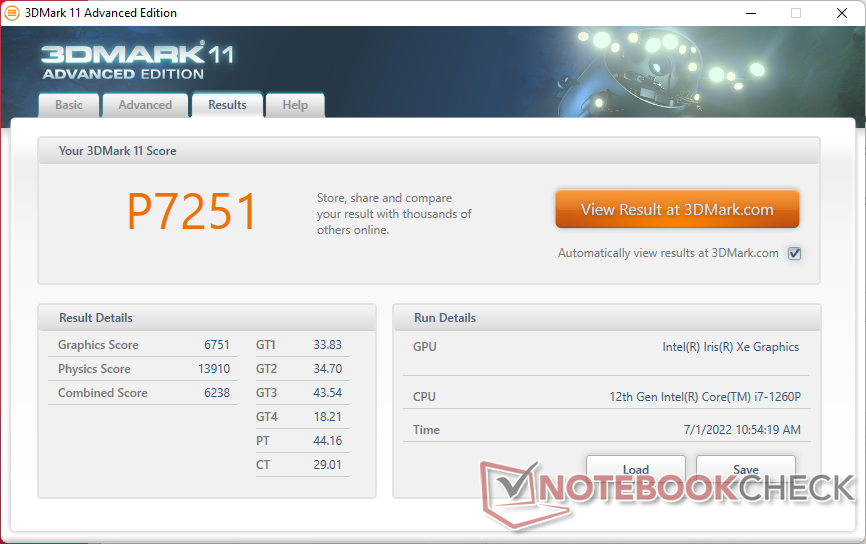
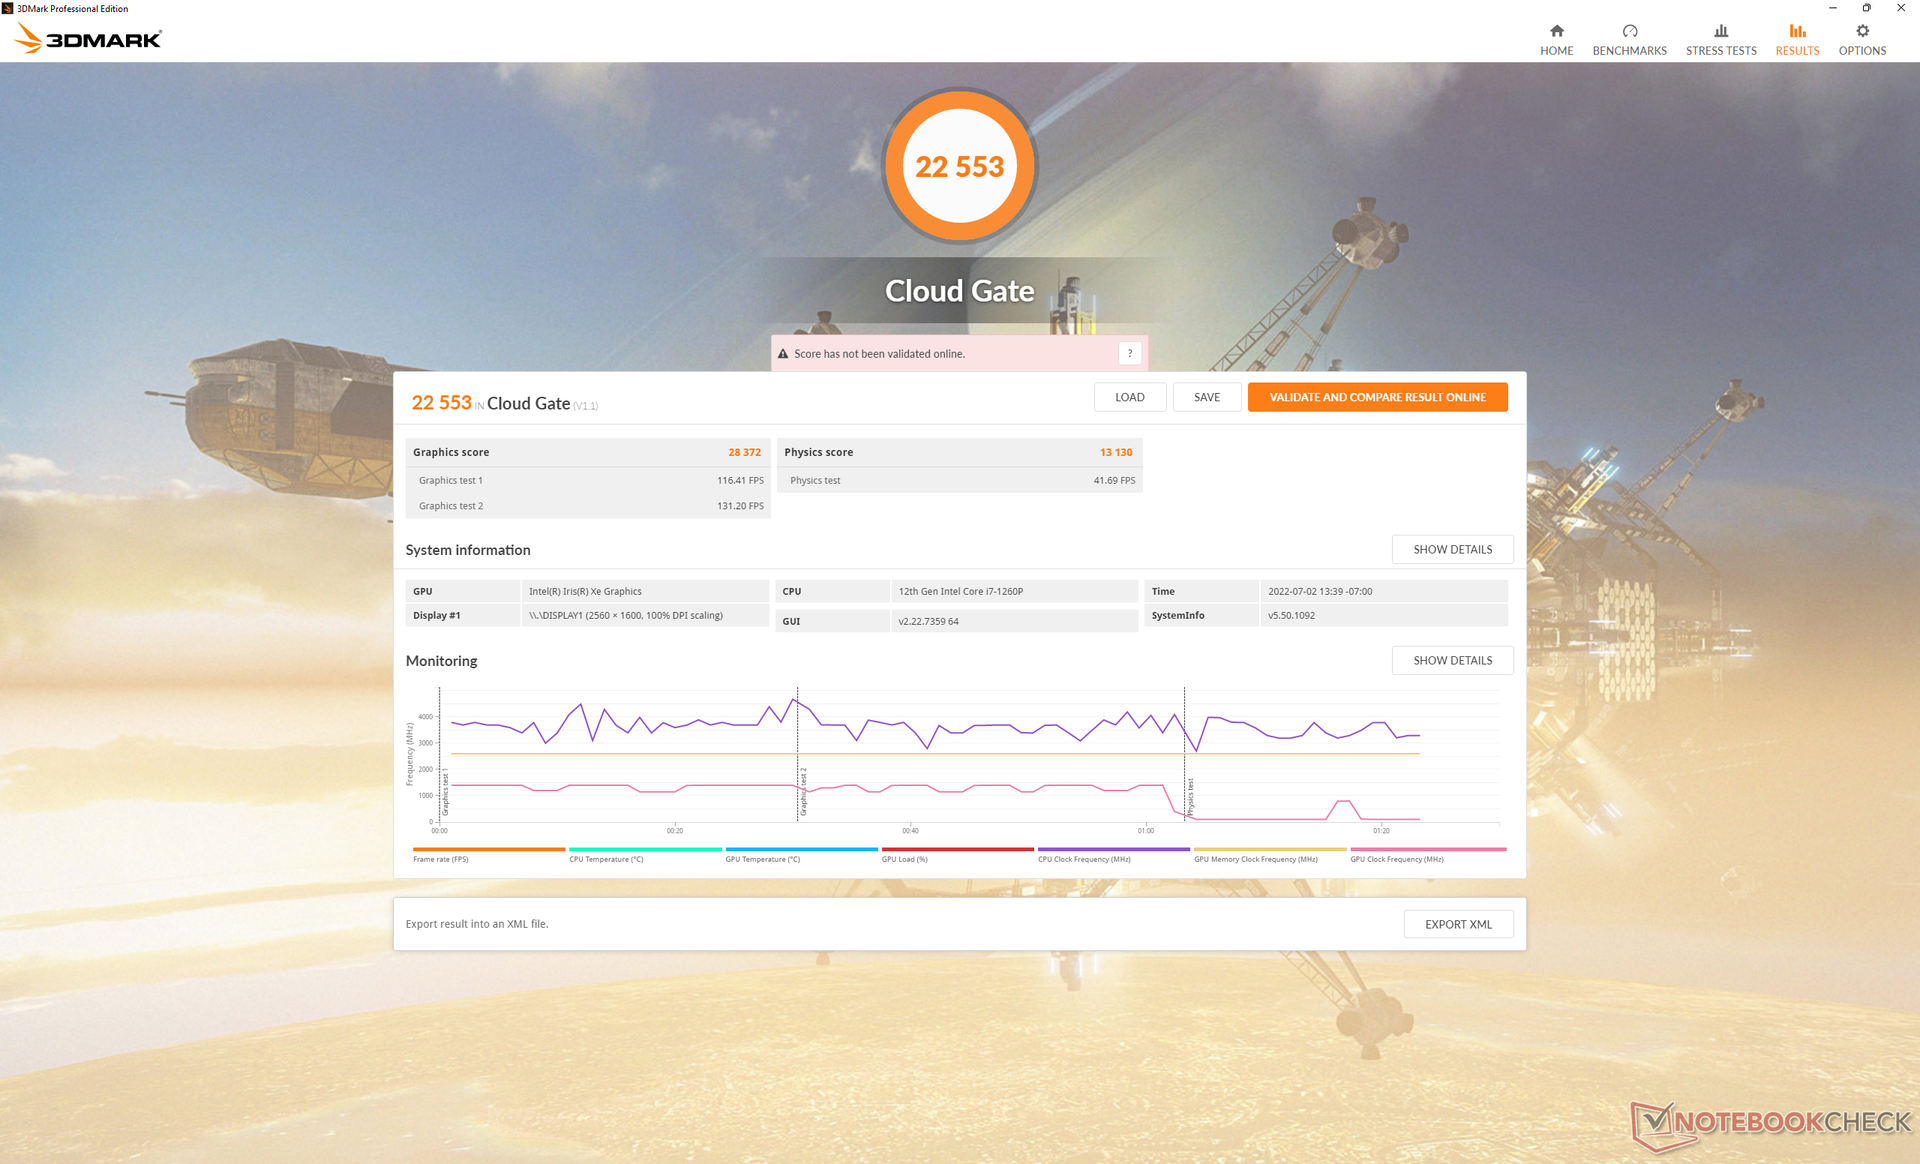
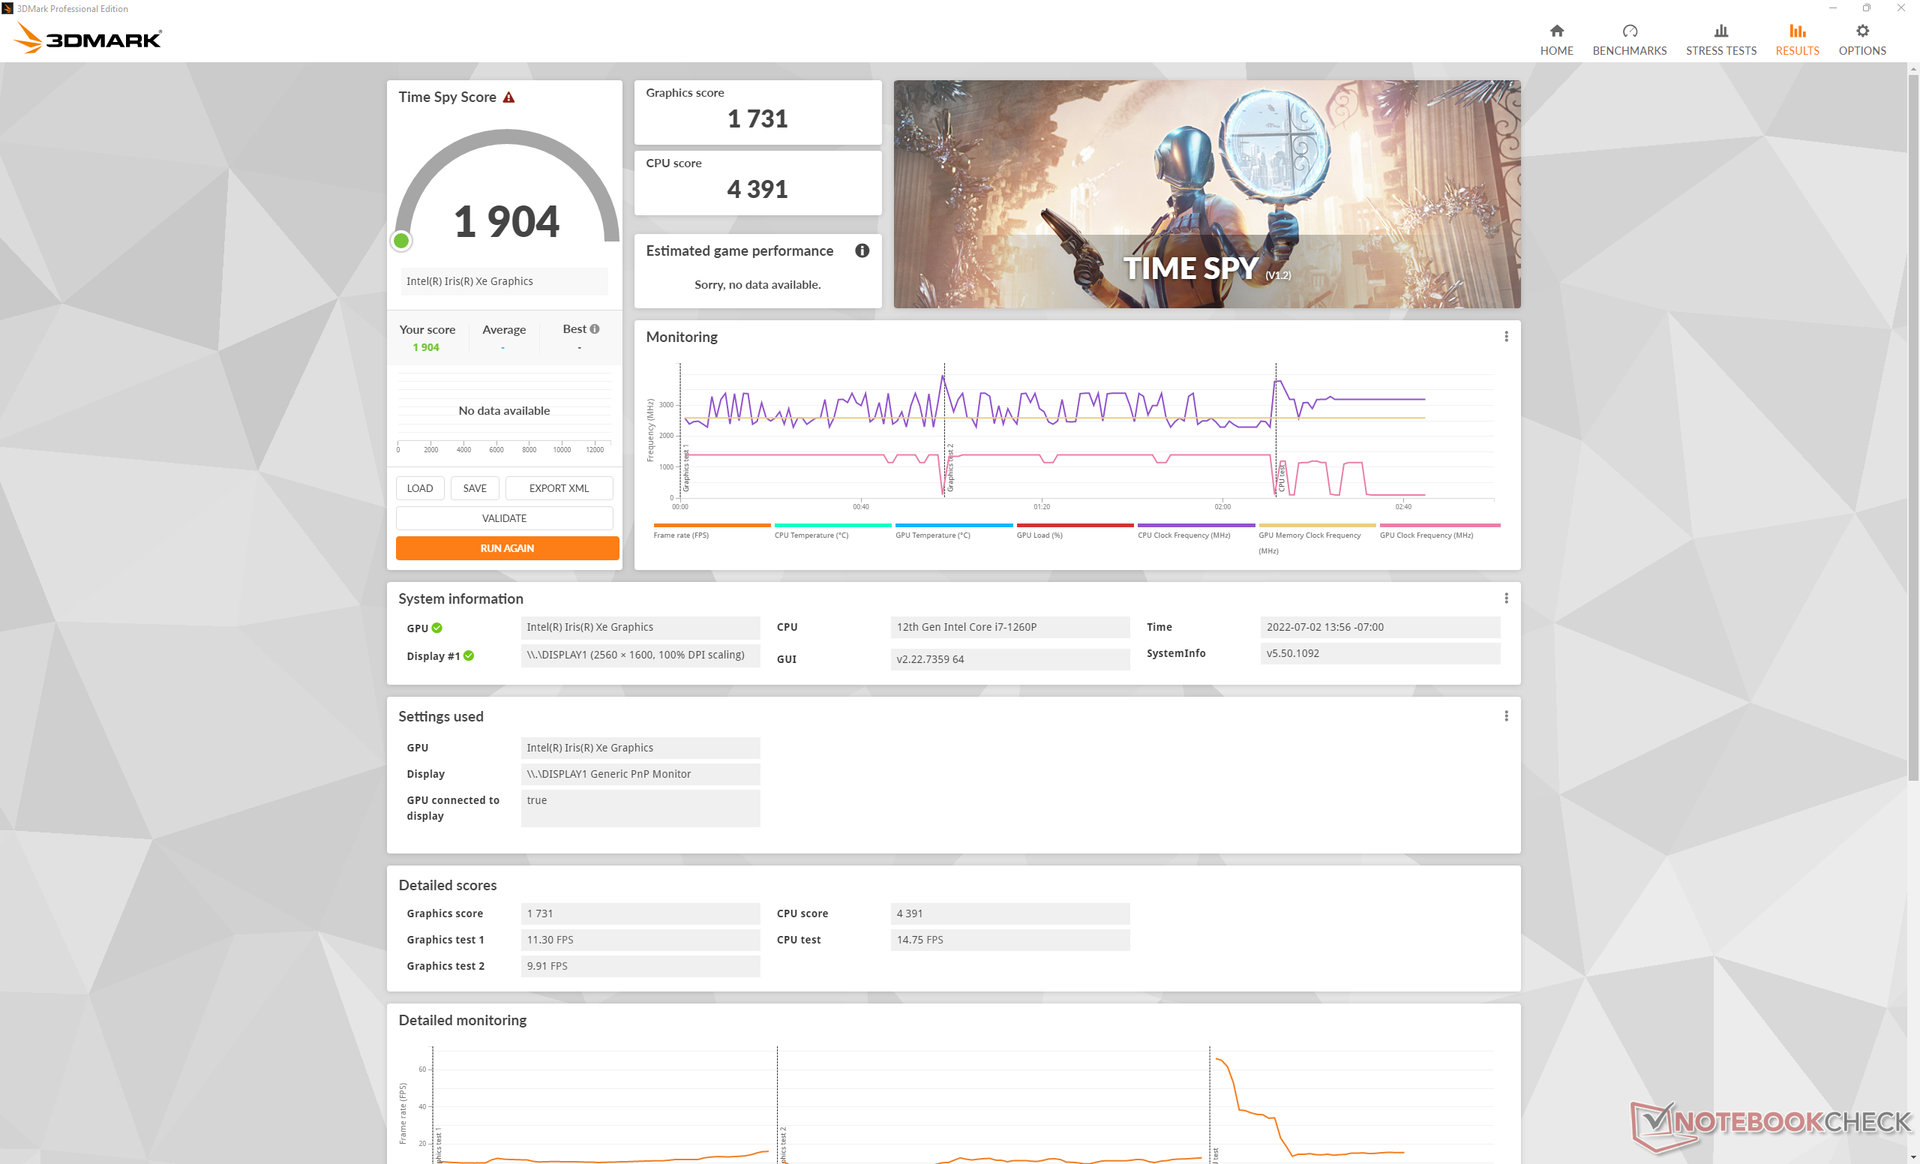
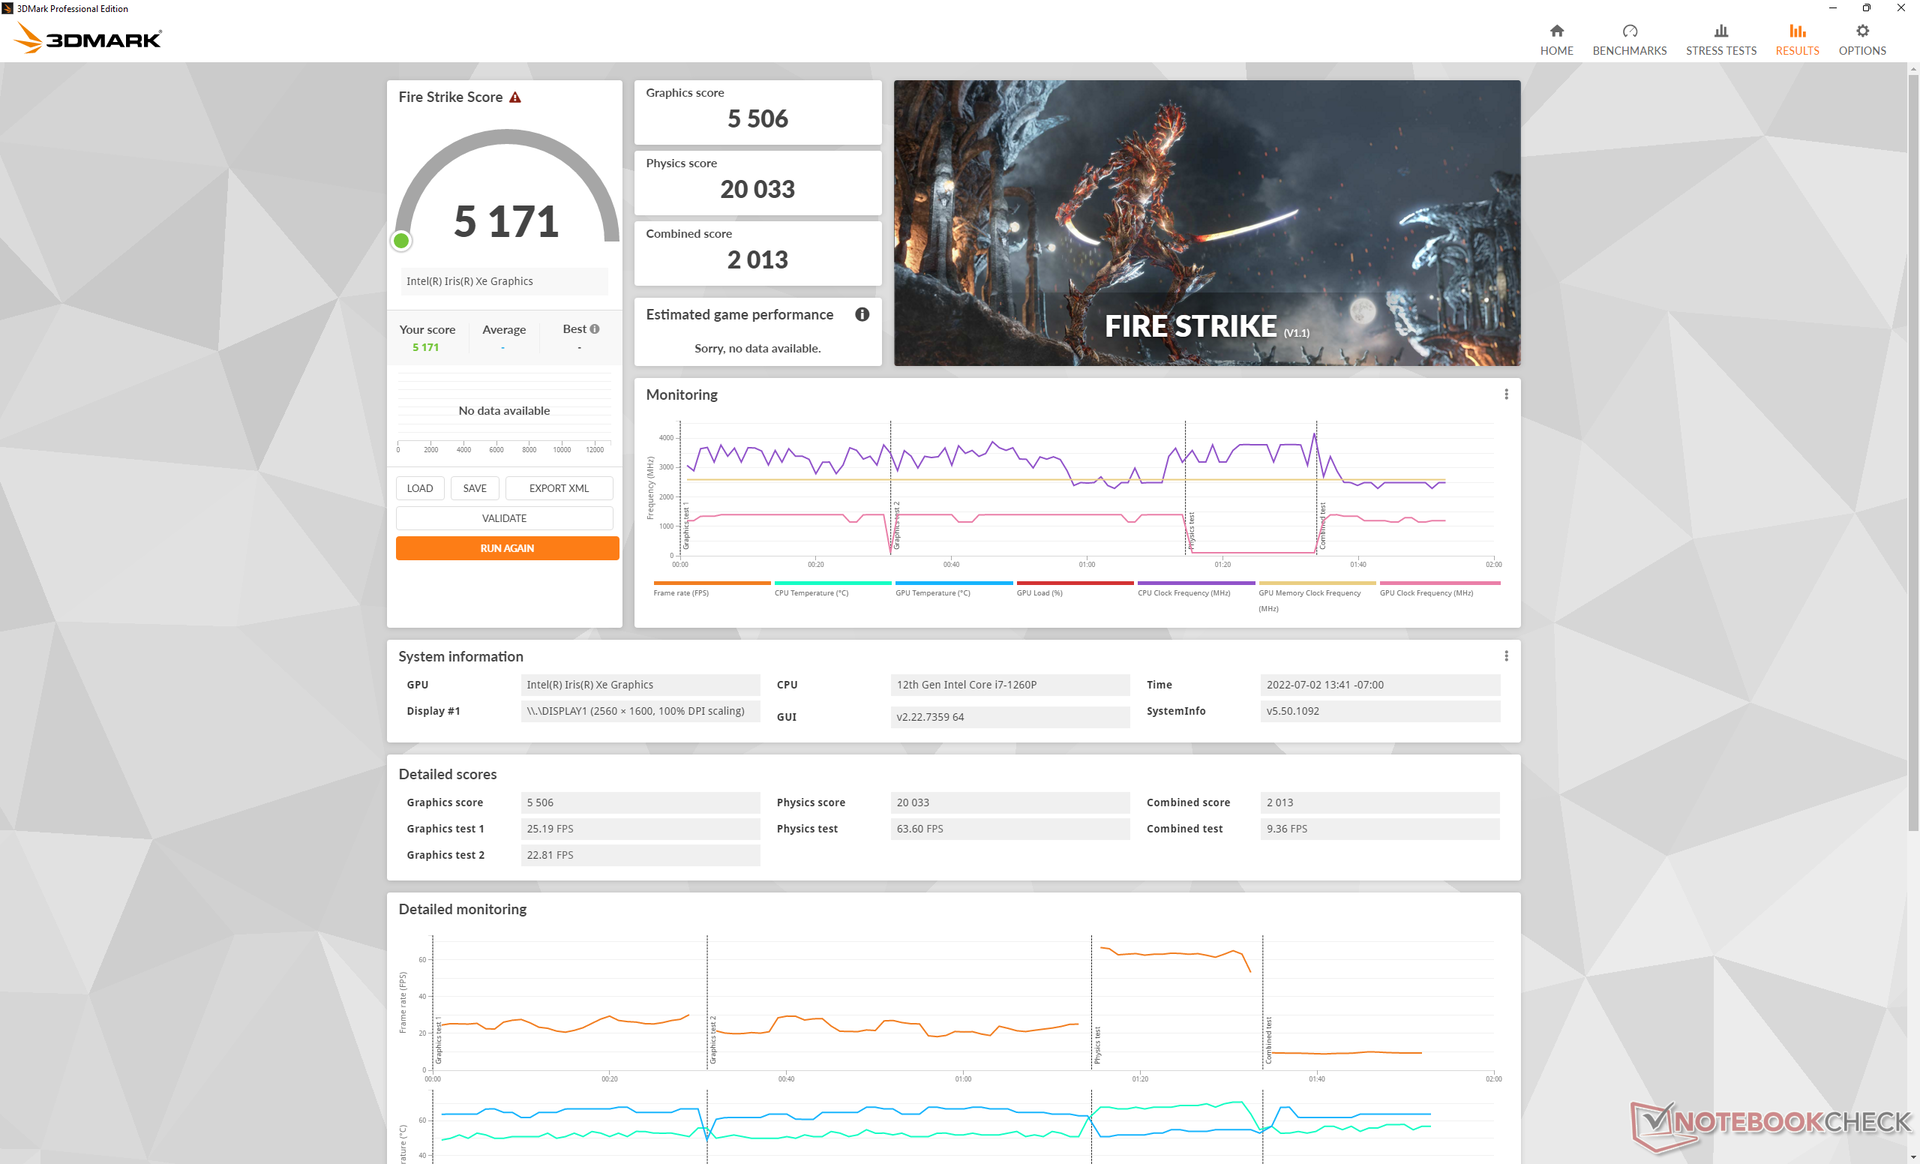
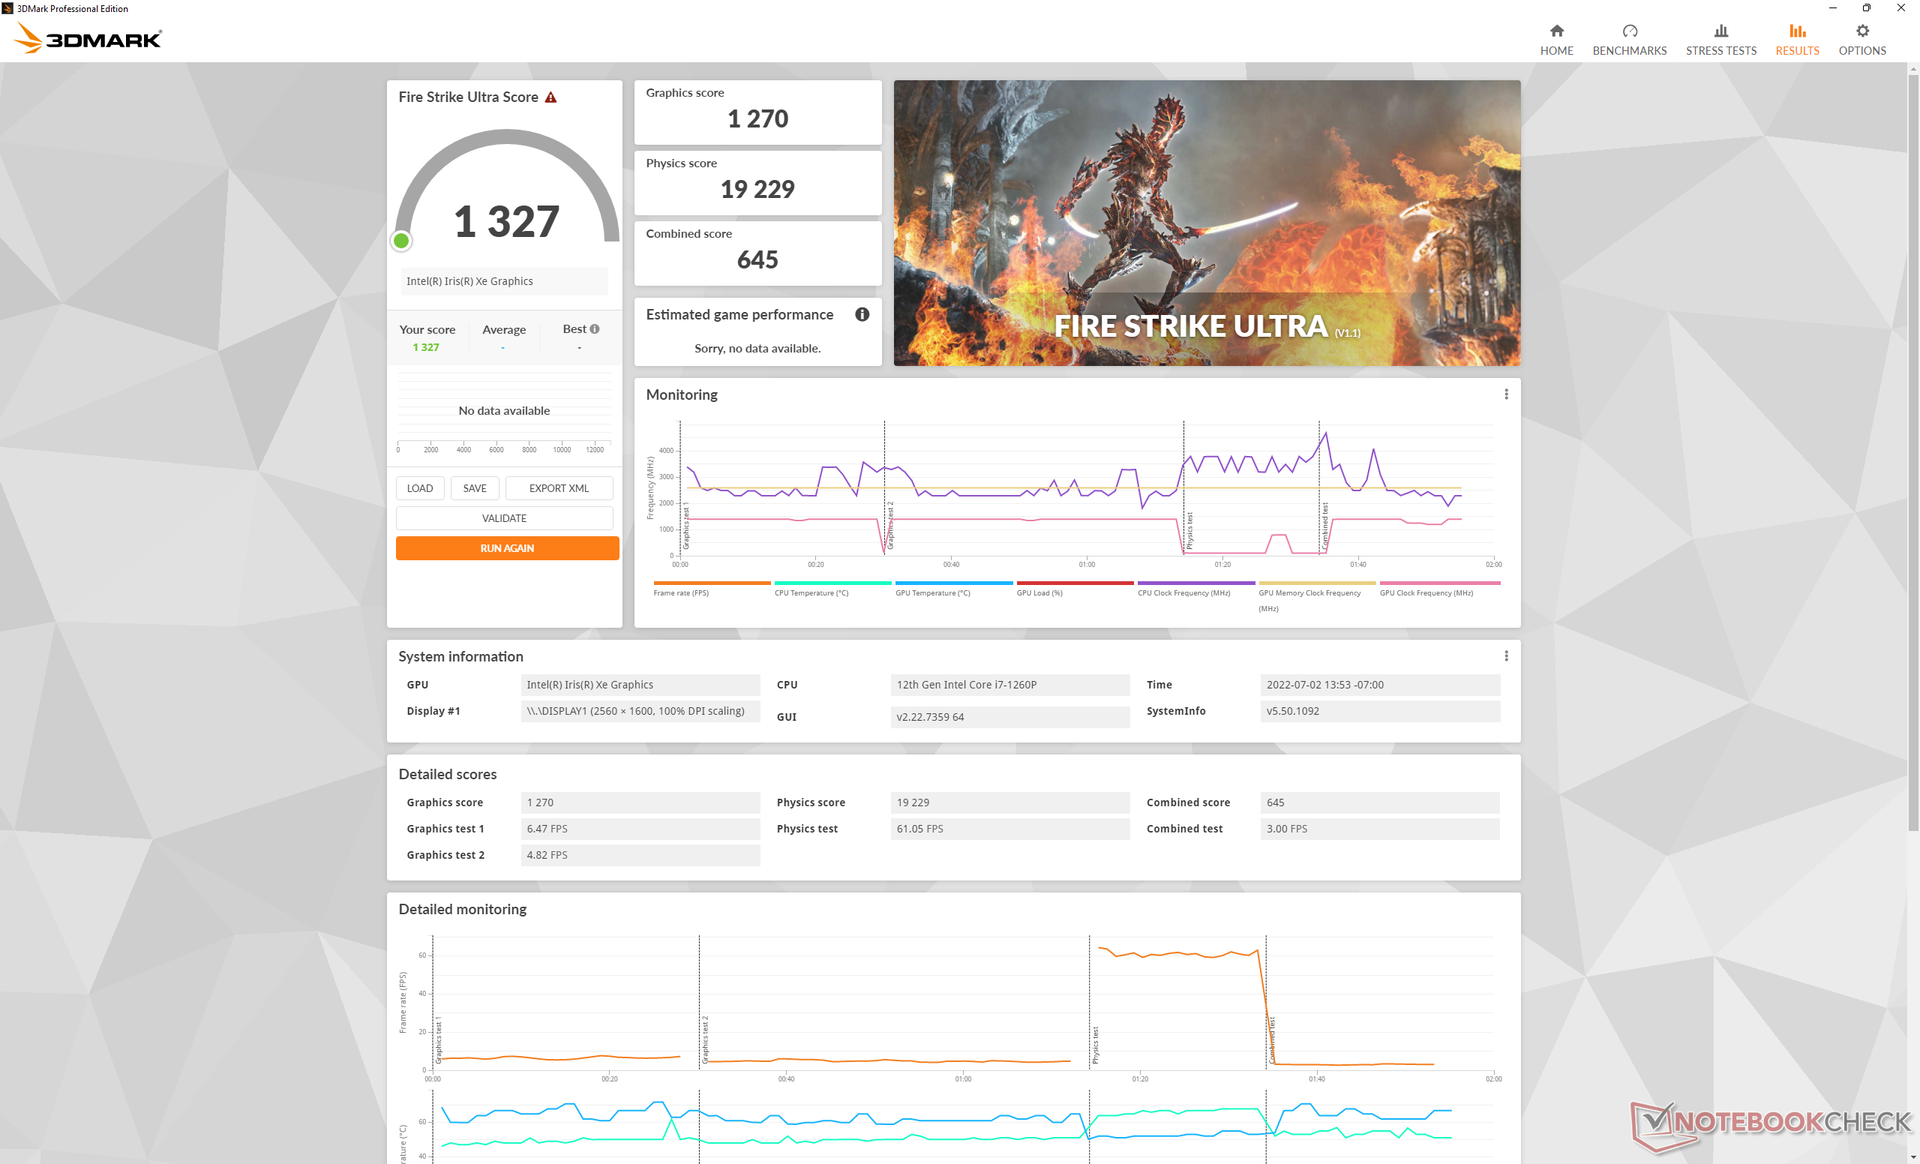
| 3DMark 11 Performance | 7251 points | |
| 3DMark Cloud Gate Standard Score | 22553 points | |
| 3DMark Fire Strike Score | 5171 points | |
| 3DMark Time Spy Score | 1904 points | |
Help | ||
| Cyberpunk 2077 1.6 | |
| 1280x720 Low Preset | |
| Asus Zenbook S 13 OLED | |
| GPD Win Max 2 | |
| Average Intel Iris Xe Graphics G7 96EUs (20.6 - 44.7, n=17) | |
| 1920x1080 Low Preset | |
| Asus Zenbook S 13 OLED | |
| GPD Win Max 2 | |
| Average Intel Iris Xe Graphics G7 96EUs (13 - 25.9, n=42) | |
| 1920x1080 Medium Preset | |
| Asus Zenbook S 13 OLED | |
| GPD Win Max 2 | |
| Average Intel Iris Xe Graphics G7 96EUs (10.8 - 21.7, n=37) | |
| 1920x1080 High Preset | |
| Asus Zenbook S 13 OLED | |
| GPD Win Max 2 | |
| Average Intel Iris Xe Graphics G7 96EUs (9.8 - 16.9, n=34) | |
| 1920x1080 Ultra Preset | |
| Asus Zenbook S 13 OLED | |
| GPD Win Max 2 | |
| Average Intel Iris Xe Graphics G7 96EUs (7.4 - 16.8, n=32) | |
Witcher 3 FPS Chart
| low | med. | high | ultra | QHD | |
|---|---|---|---|---|---|
| GTA V (2015) | 107.9 | 95.2 | 23 | 9.96 | 6.6 |
| The Witcher 3 (2015) | 84.7 | 57 | 31.4 | 14.6 | |
| Dota 2 Reborn (2015) | 105.9 | 80.8 | 63.5 | 58.2 | |
| Final Fantasy XV Benchmark (2018) | 43.1 | 24.3 | 17.5 | ||
| X-Plane 11.11 (2018) | 47.7 | 35 | 32.2 | ||
| Strange Brigade (2018) | 85.1 | 42.1 | 33.8 | 27.3 | 20.1 |
| Cyberpunk 2077 1.6 (2022) | 20.4 | 17.3 | 13.3 | 10.7 |
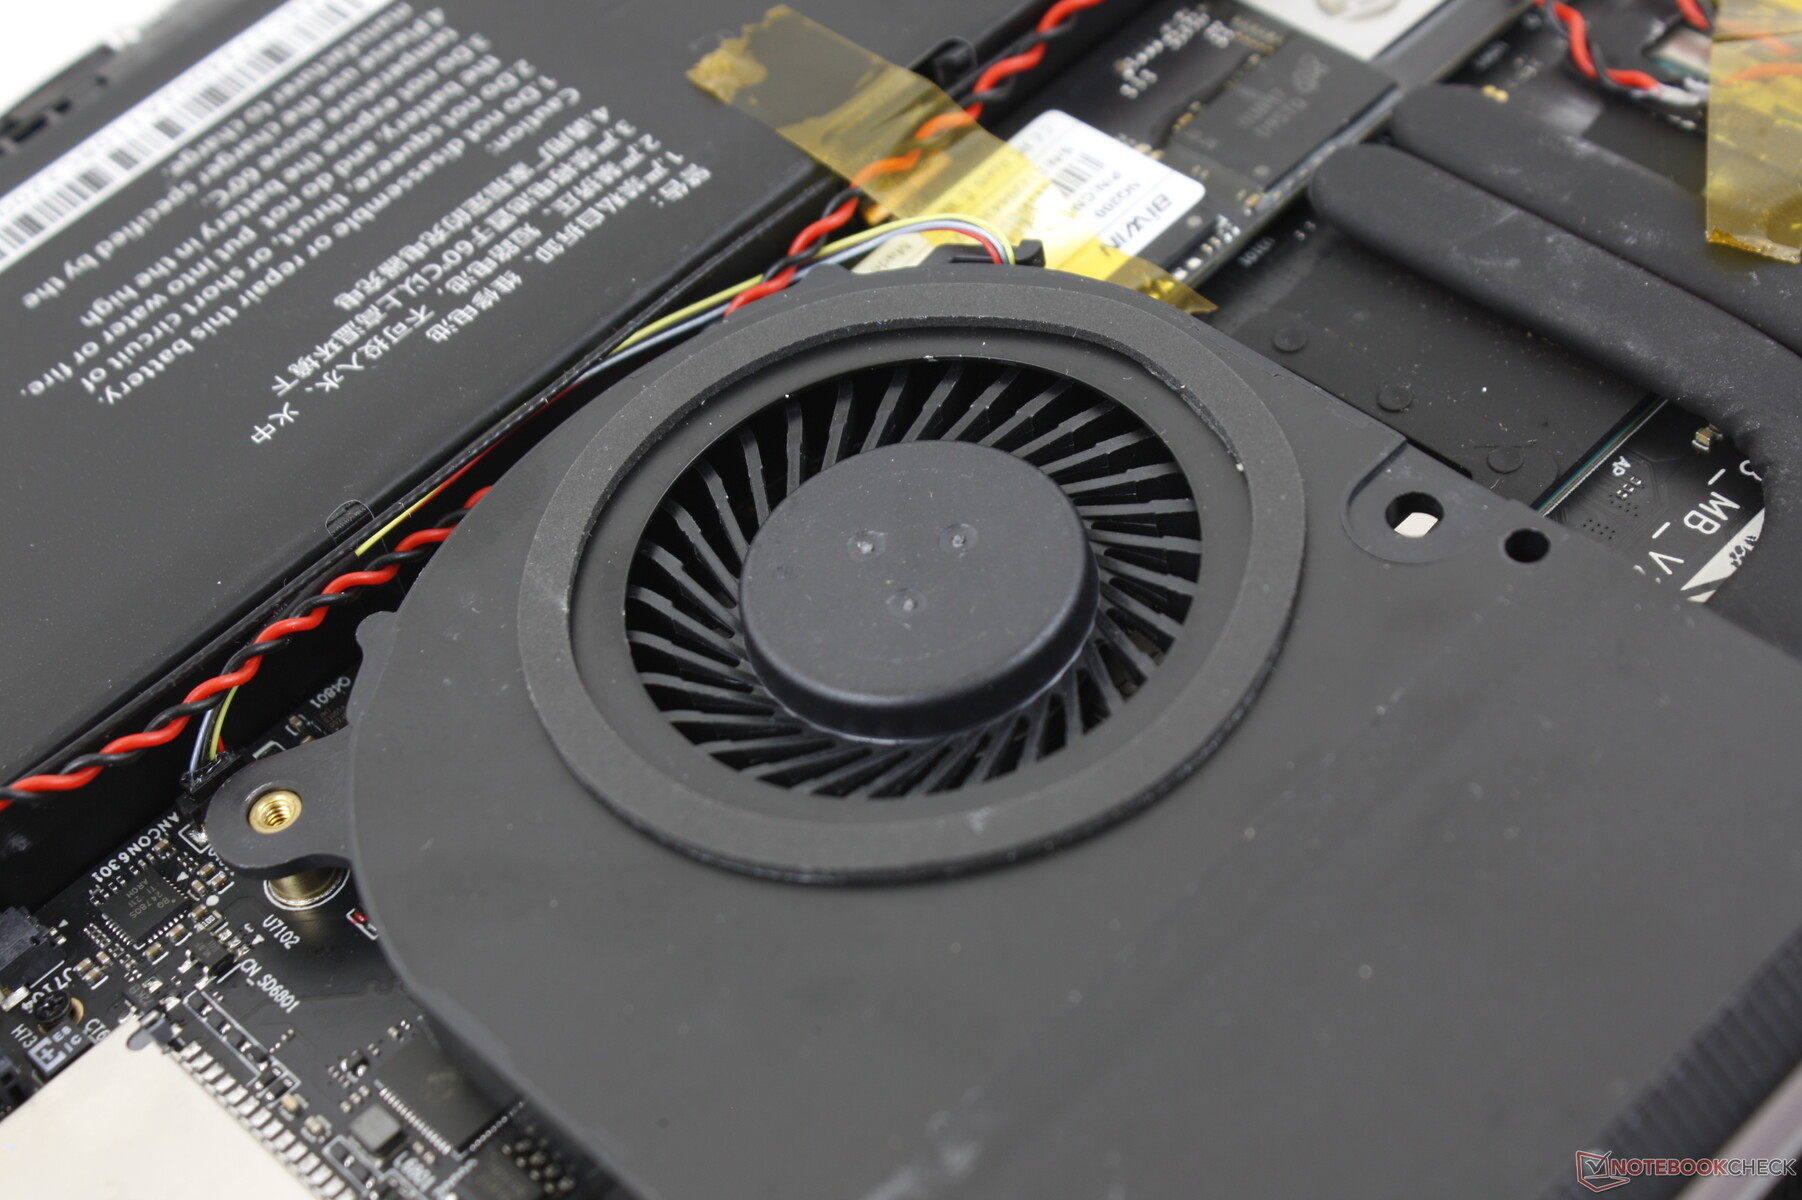
Emissions
System Noise — Definitely Louder Than The Nintendo Switch
Fan noise tends to remain between 22.7 dB(A) and 28.5 dB(A) against a background of 22.6 dB(A) when browsing or video streaming. Though not loud or particularly bothersome, the RPM changes can be sudden and noticeable.
When running Witcher 3 on Turbo fan mode, fan noise would top out at just 40 dB(A) to be much quieter than what we experienced on the 2021 Win Max where fan noise could reach 49 dB(A). The low 40 dB(A) range is typical of many U-series-powered laptops when running heavy loads, but the noise is again more noticeable on the Win Max 2 due to the high frequency of the small diameter fan and the fact that the device is held closer to the user during gameplay. We find the noise level to be acceptable in public spaces like trains.
Noise level
| Idle |
| 23.7 / 23.7 / 28.5 dB(A) |
| Load |
| 36.5 / 40.5 dB(A) |
 | ||
30 dB silent 40 dB(A) audible 50 dB(A) loud |
||
min: | ||
| GPD Win Max 2 Iris Xe G7 96EUs, i7-1260P, BiWin NQ200 1TB CNF82GS1D00-1TB | GPD Pocket 3 Iris Xe G7 96EUs, i7-1195G7, BiWin NQ200 1TB CNF82GS1D00-1TB | GPD Win Max 2021 Vega 8, R7 4800U, BIWIN NS200 512GB CNF82GS1G00-512 | GPD Win 3 Iris Xe G7 80EUs, i5-1135G7, BIWIN NS200 1TB CNF82GS1G02-1TB | Lenovo Yoga 9 14IAP7 82LU0001US Iris Xe G7 96EUs, i7-1260P, Samsung PM9A1 MZVL2512HCJQ | |
|---|---|---|---|---|---|
| Noise | -2% | -13% | -15% | 1% | |
| off / environment * (dB) | 22.6 | 23.4 -4% | 23.3 -3% | 27.4 -21% | 22.9 -1% |
| Idle Minimum * (dB) | 23.7 | 24.3 -3% | 26.6 -12% | 29.1 -23% | 23.3 2% |
| Idle Average * (dB) | 23.7 | 25.6 -8% | 26.6 -12% | 29.1 -23% | 23.5 1% |
| Idle Maximum * (dB) | 28.5 | 25.6 10% | 26.6 7% | 29.1 -2% | 23.5 18% |
| Load Average * (dB) | 36.5 | 38.3 -5% | 46.9 -28% | 40.7 -12% | 33.2 9% |
| Witcher 3 ultra * (dB) | 39.8 | 40.7 -2% | 49 -23% | 42.8 -8% | 44.9 -13% |
| Load Maximum * (dB) | 40.5 | 40.7 -0% | 49.2 -21% | 46.3 -14% | 44.6 -10% |
* ... smaller is better
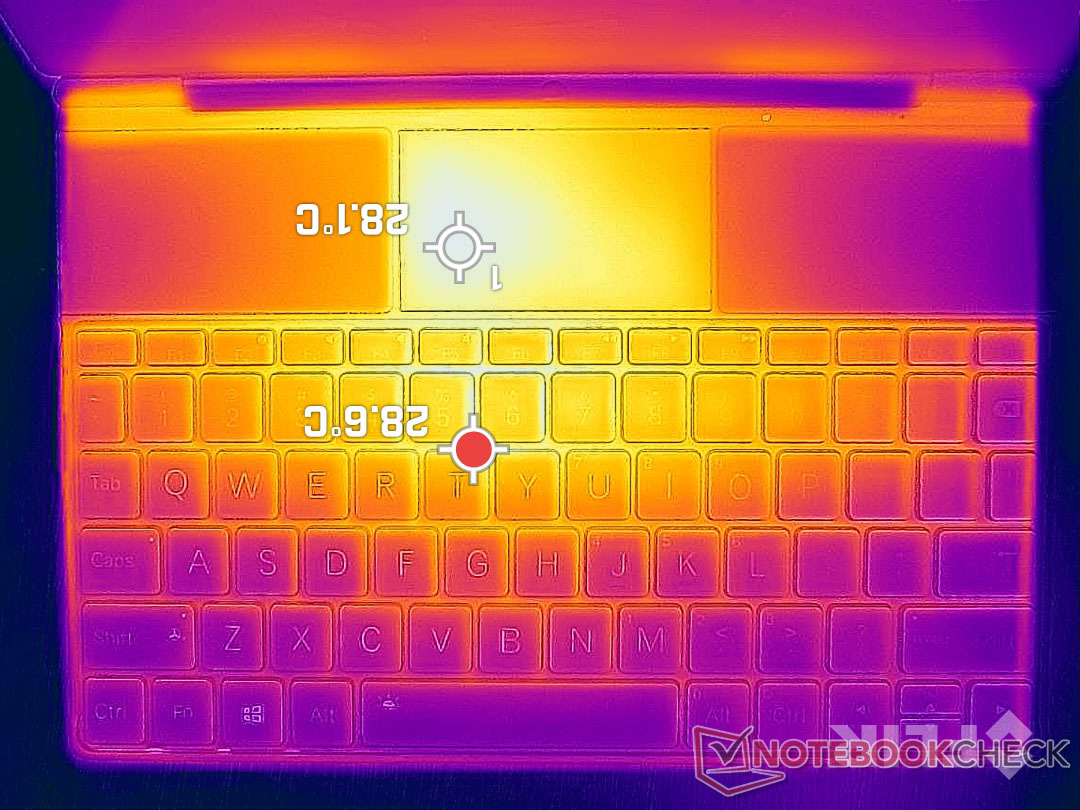
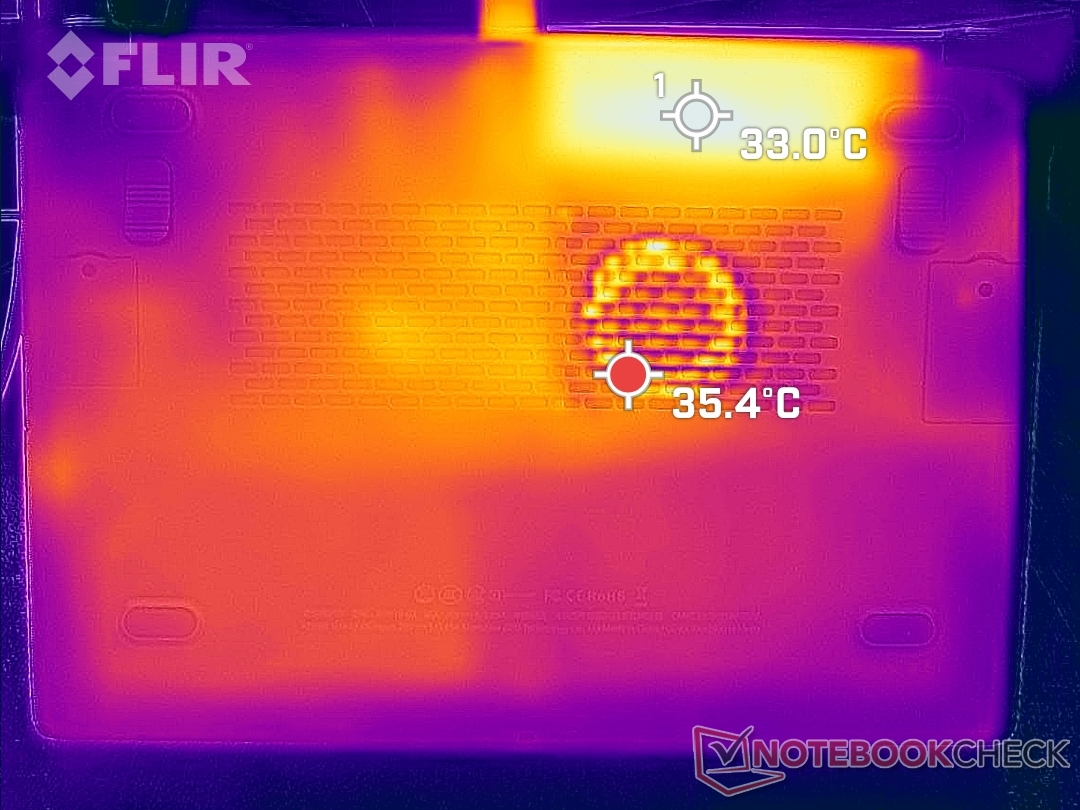
Temperature — Never Too Warm
Much like what we observed on the 2021 Win Max, the 2022 Win Max 2 runs surprisingly cool relative to its small size and 12th gen Core-P series CPU. When gaming, hot spots near the rear of the unit would reach just 28 C and 33 C on the top and bottom sides, respectively. We're able to handle the integrated joysticks and buttons without them feeling uncomfortably warm.
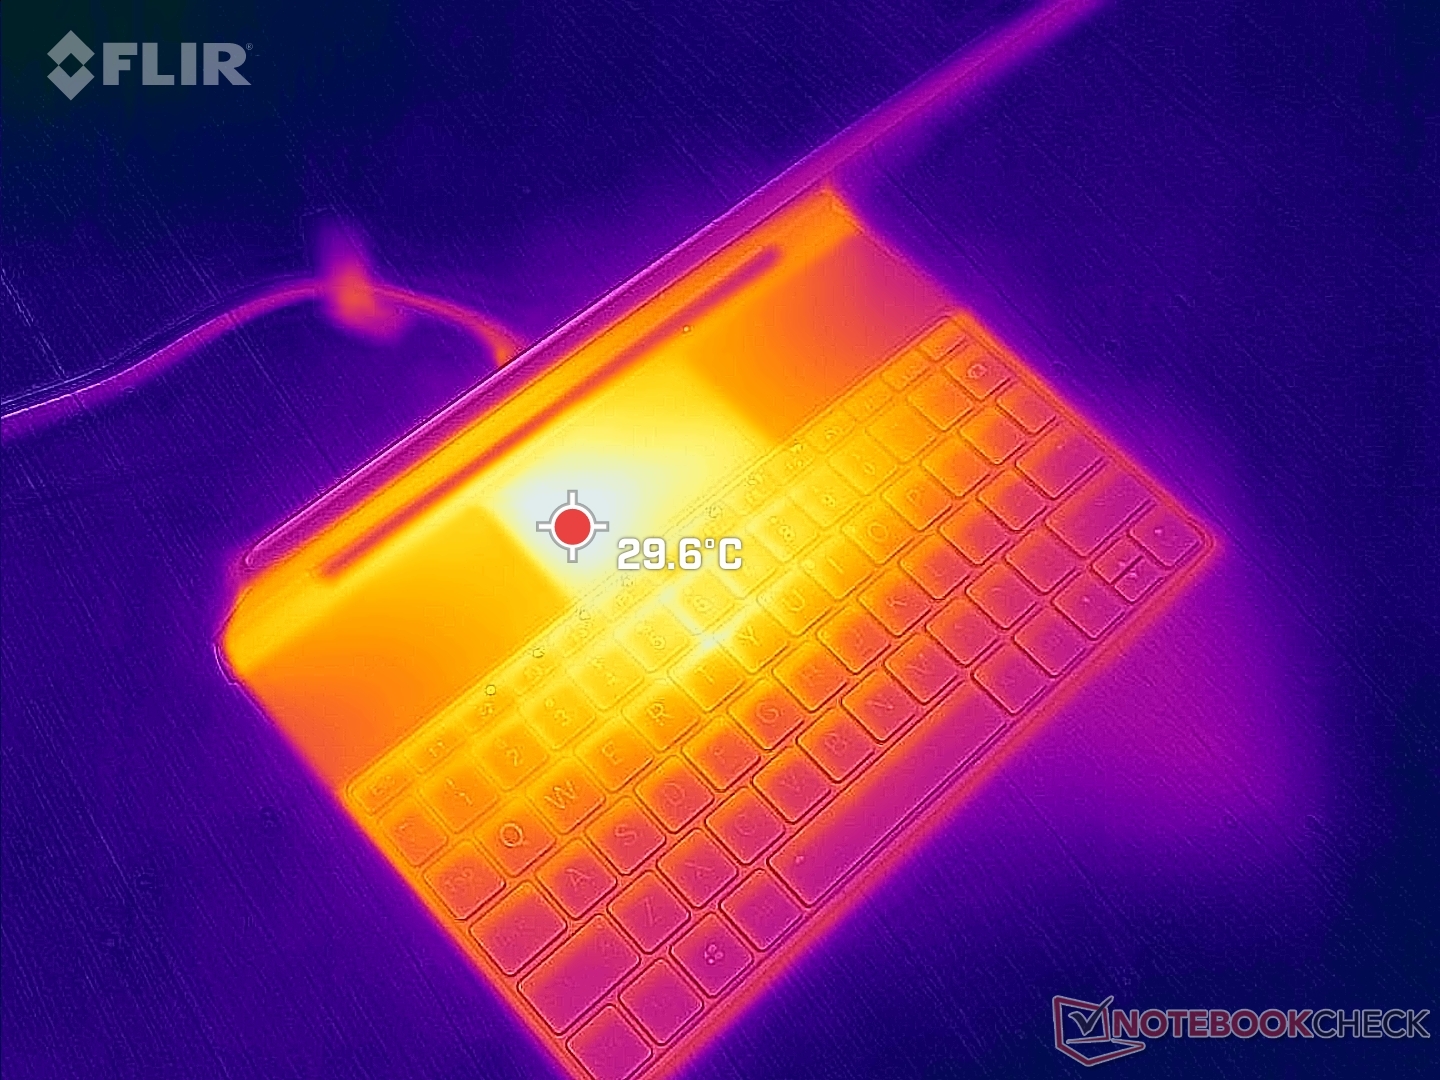
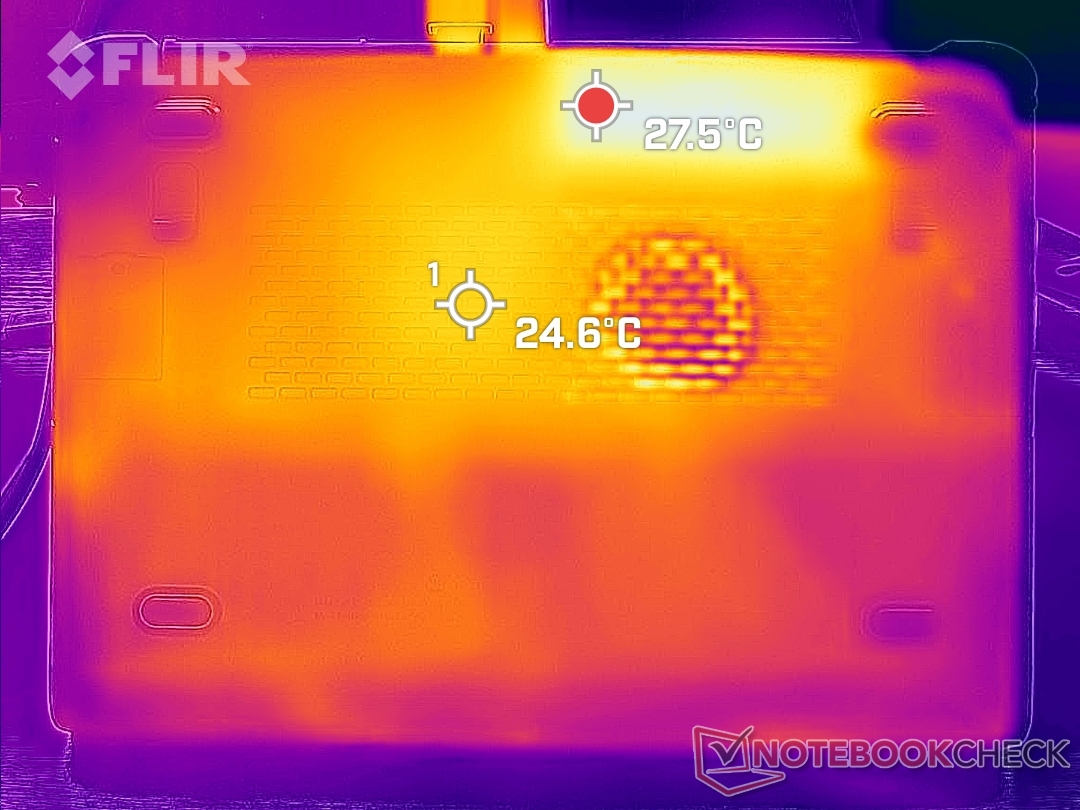
(+) The maximum temperature on the upper side is 28.6 °C / 83 F, compared to the average of 35.9 °C / 97 F, ranging from 21.4 to 59 °C for the class Subnotebook.
(+) The bottom heats up to a maximum of 33 °C / 91 F, compared to the average of 39.2 °C / 103 F
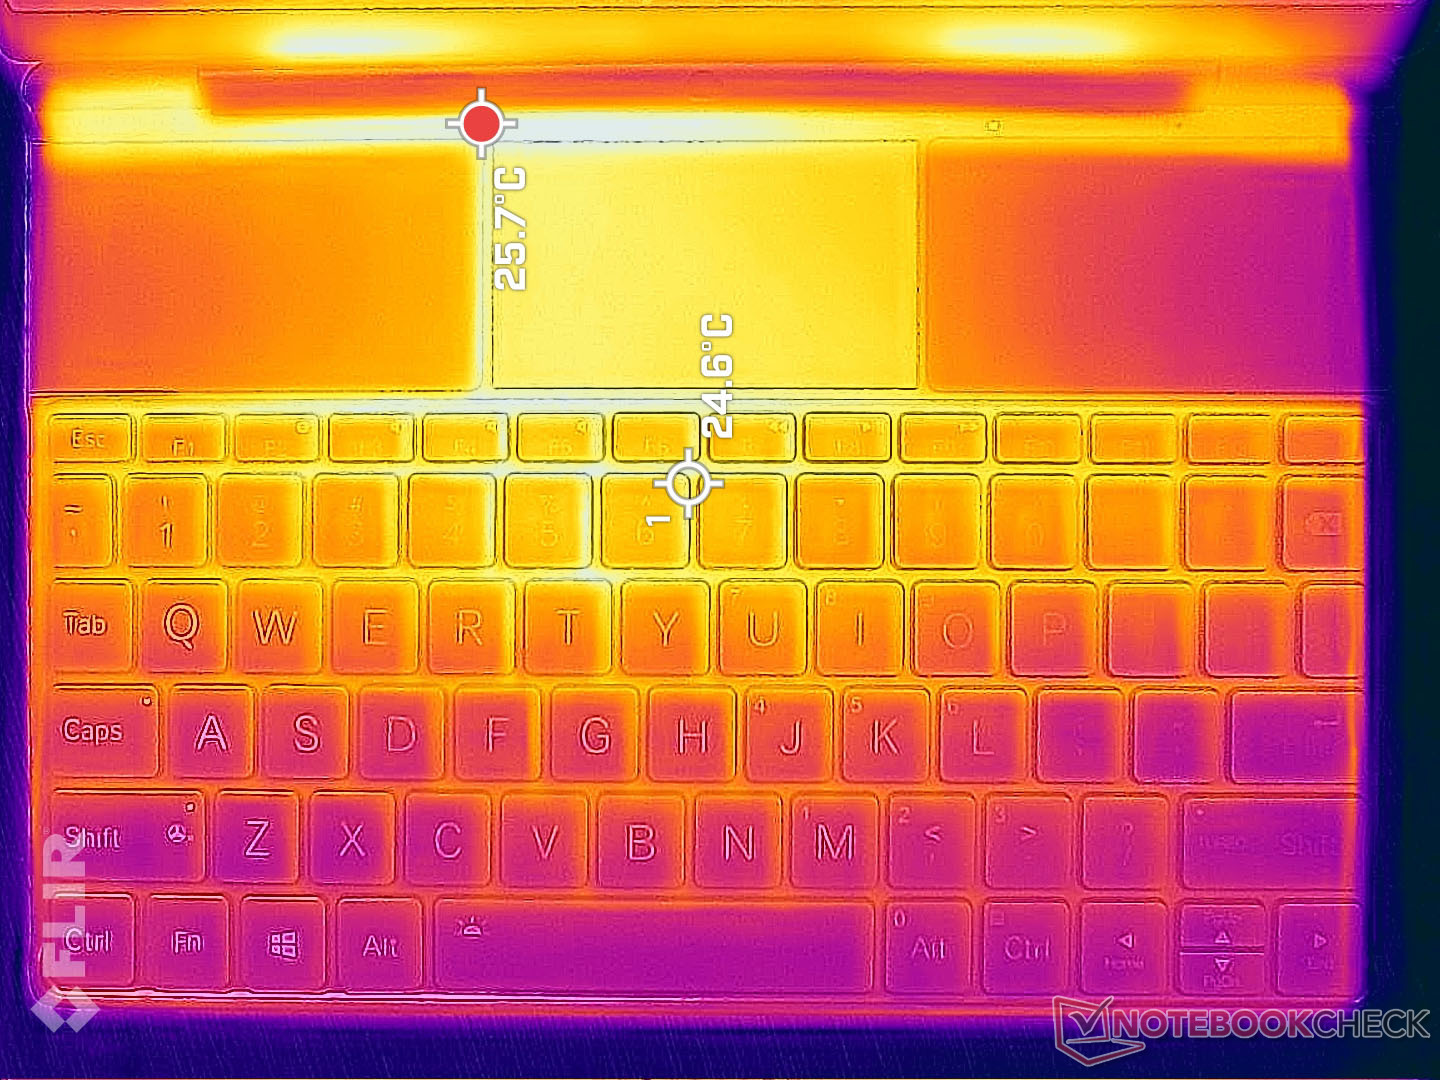
(+) In idle usage, the average temperature for the upper side is 22.3 °C / 72 F, compared to the device average of 30.8 °C / 87 F.
(+) The palmrests and touchpad are cooler than skin temperature with a maximum of 21.4 °C / 70.5 F and are therefore cool to the touch.
(+) The average temperature of the palmrest area of similar devices was 28.2 °C / 82.8 F (+6.8 °C / 12.3 F).
| GPD Win Max 2 Intel Core i7-1260P, Intel Iris Xe Graphics G7 96EUs | GPD Pocket 3 Intel Core i7-1195G7, Intel Iris Xe Graphics G7 96EUs | GPD Win Max 2021 AMD Ryzen 7 4800U, AMD Radeon RX Vega 8 (Ryzen 4000/5000) | Microsoft Surface Go 3 Core i3 Intel Core i3-10100Y, Intel UHD Graphics 615 | Lenovo IdeaPad Flex 3 11IGL05 Intel Celeron N4020, Intel UHD Graphics 600 | |
|---|---|---|---|---|---|
| Heat | -30% | -17% | -21% | -16% | |
| Maximum Upper Side * (°C) | 28.6 | 40.4 -41% | 38 -33% | 46.1 -61% | 37.4 -31% |
| Maximum Bottom * (°C) | 33 | 39.4 -19% | 36.4 -10% | 42.7 -29% | 41.4 -25% |
| Idle Upper Side * (°C) | 24.6 | 32.6 -33% | 30 -22% | 25 -2% | 27.2 -11% |
| Idle Bottom * (°C) | 27.6 | 34.4 -25% | 28 -1% | 25 9% | 27 2% |
* ... smaller is better
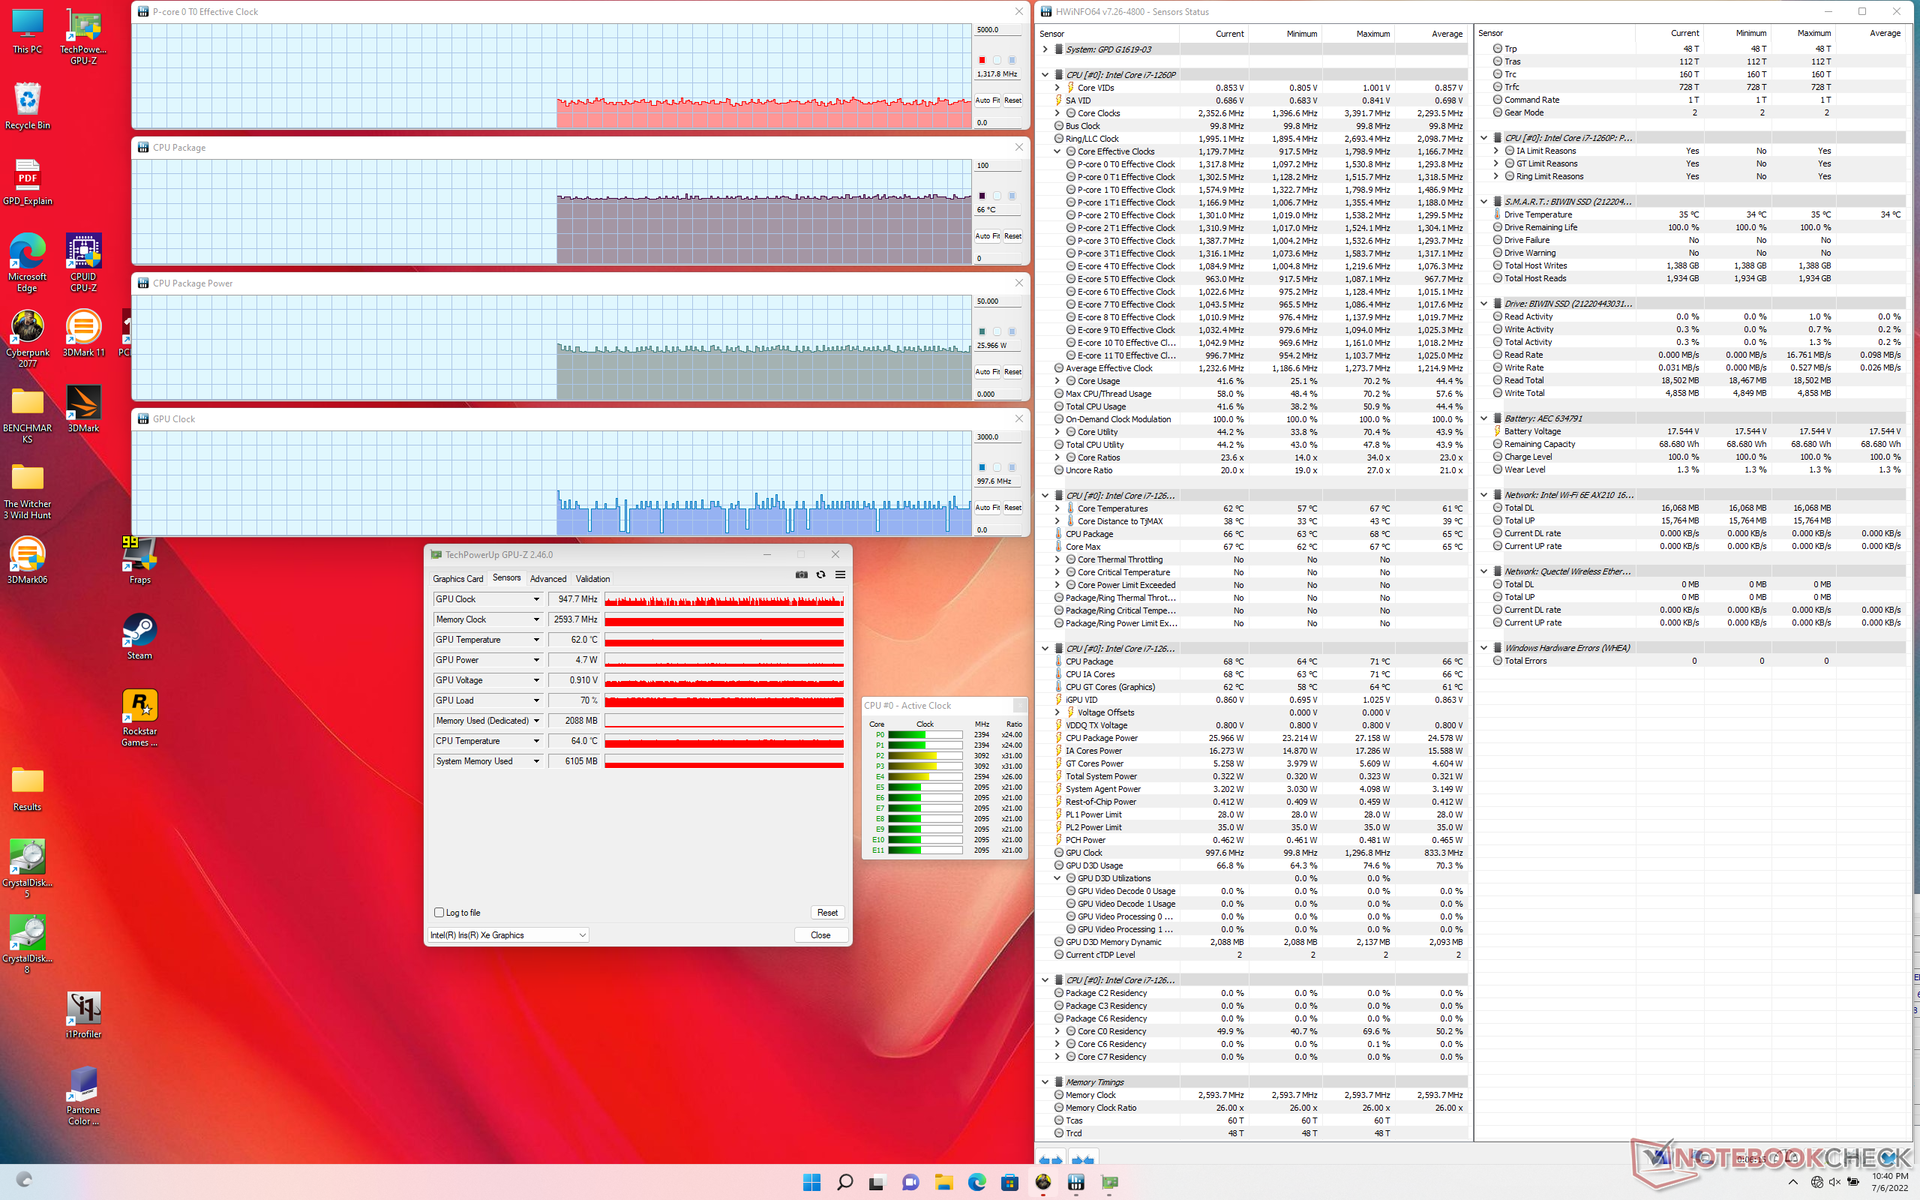
Stress Test
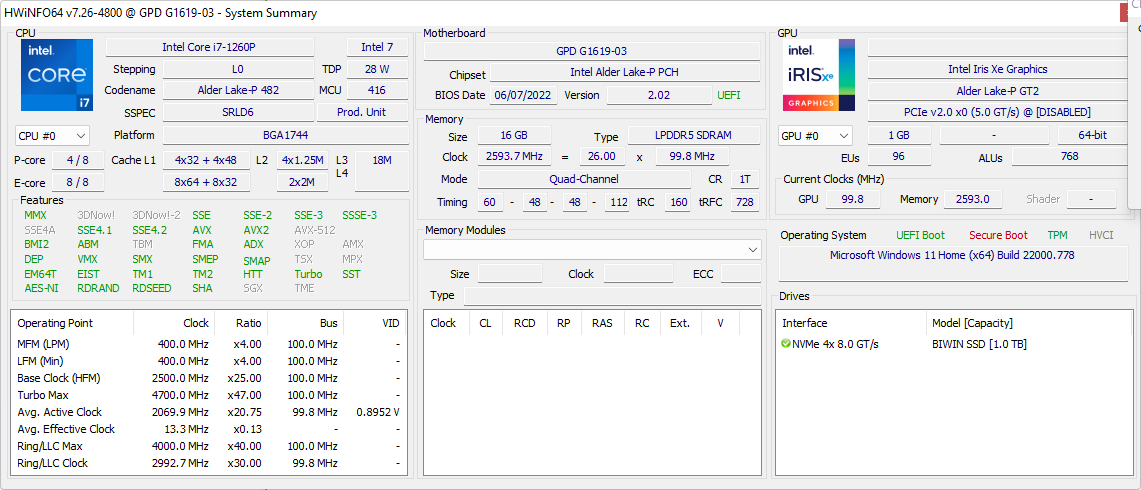
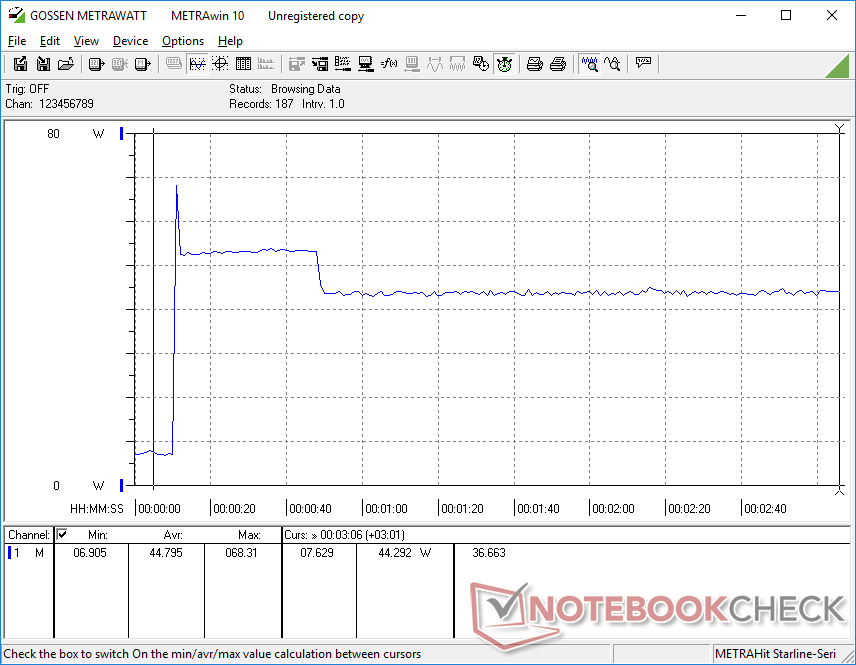
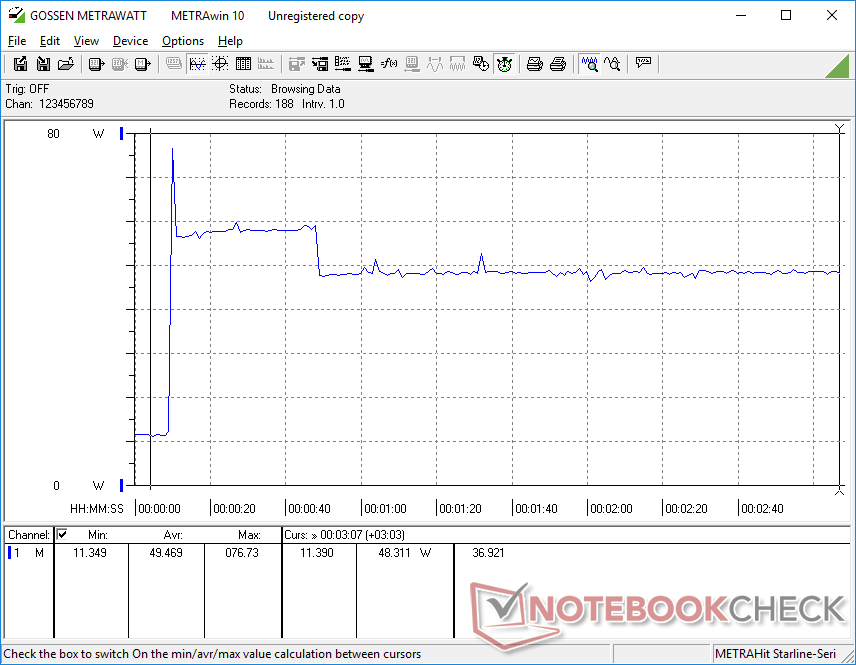
Initiating Prime95 to stress the CPU reveals something unusual: the performance P-cores would downclock to just 400 MHz while the efficient E-cores would run at 2.5 GHz. In comparison, running this same test on the Lenovo Yoga 9 14 equipped with the same CPU would show all the P-cores and E-cores running in the 1.7 to 1.9 GHz range. This behavior is the probable cause of the slower-than-average multi-thread performance recorded above.
CPU package power draw would be as high as 35 W during the first few seconds before stabilizing at 28 W thereafter which matches the preset BIOS settings. In comparison, the same CPU in the aforementioned Lenovo system would boost higher to 64 W before stabilizing at 28 W.
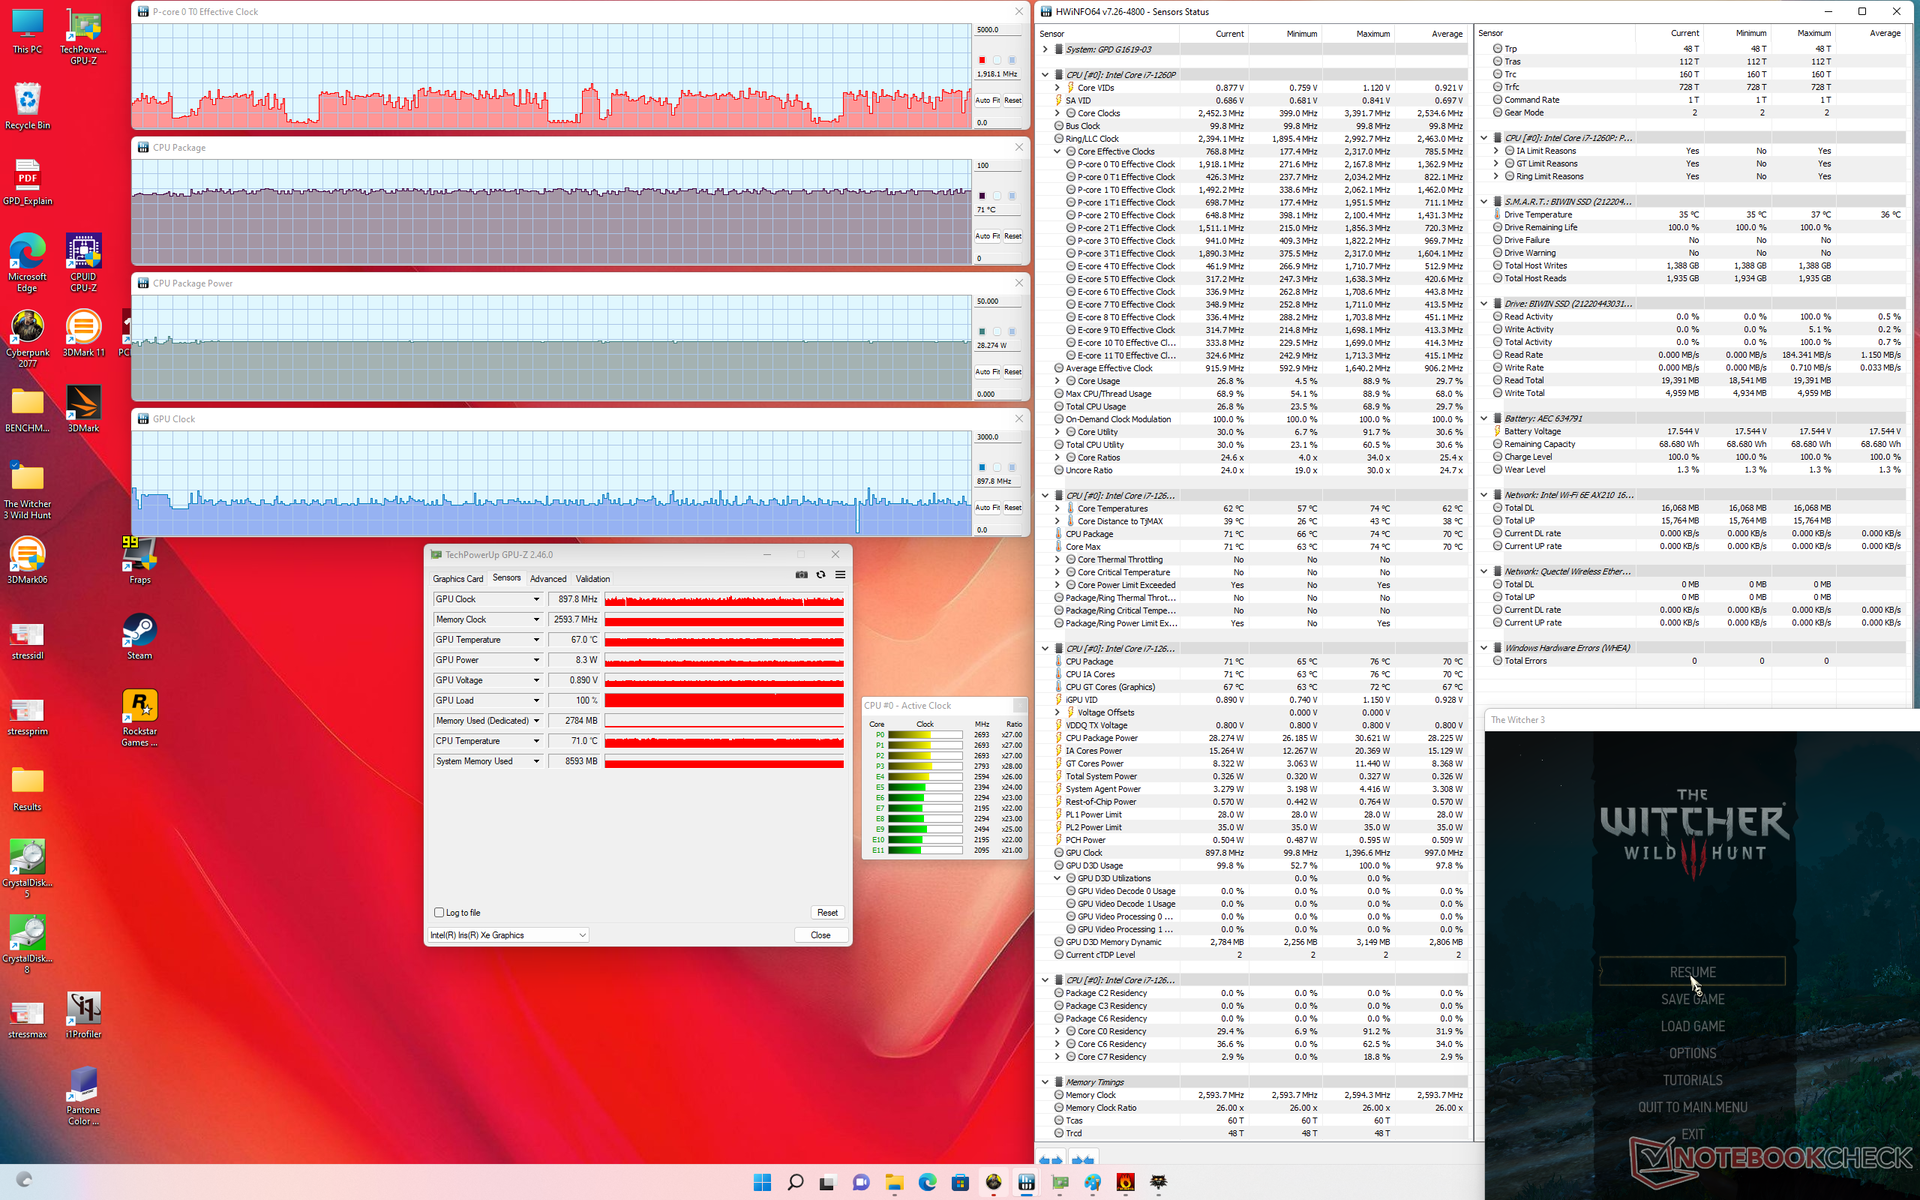
When running Witcher 3, GPU clock rates and temperature would stabilize at 898 MHz and 71 C, respectively, compared to 1147 MHz and 65 C on the Lenovo. Consequently, the Lenovo is also able to offer 3 to 5 percent higher 3DMark results than our GPD.
Running on battery power will not reduce CPU or GPU performance. Our 3DMark 11 scores would remain essentially the same between battery and mains.
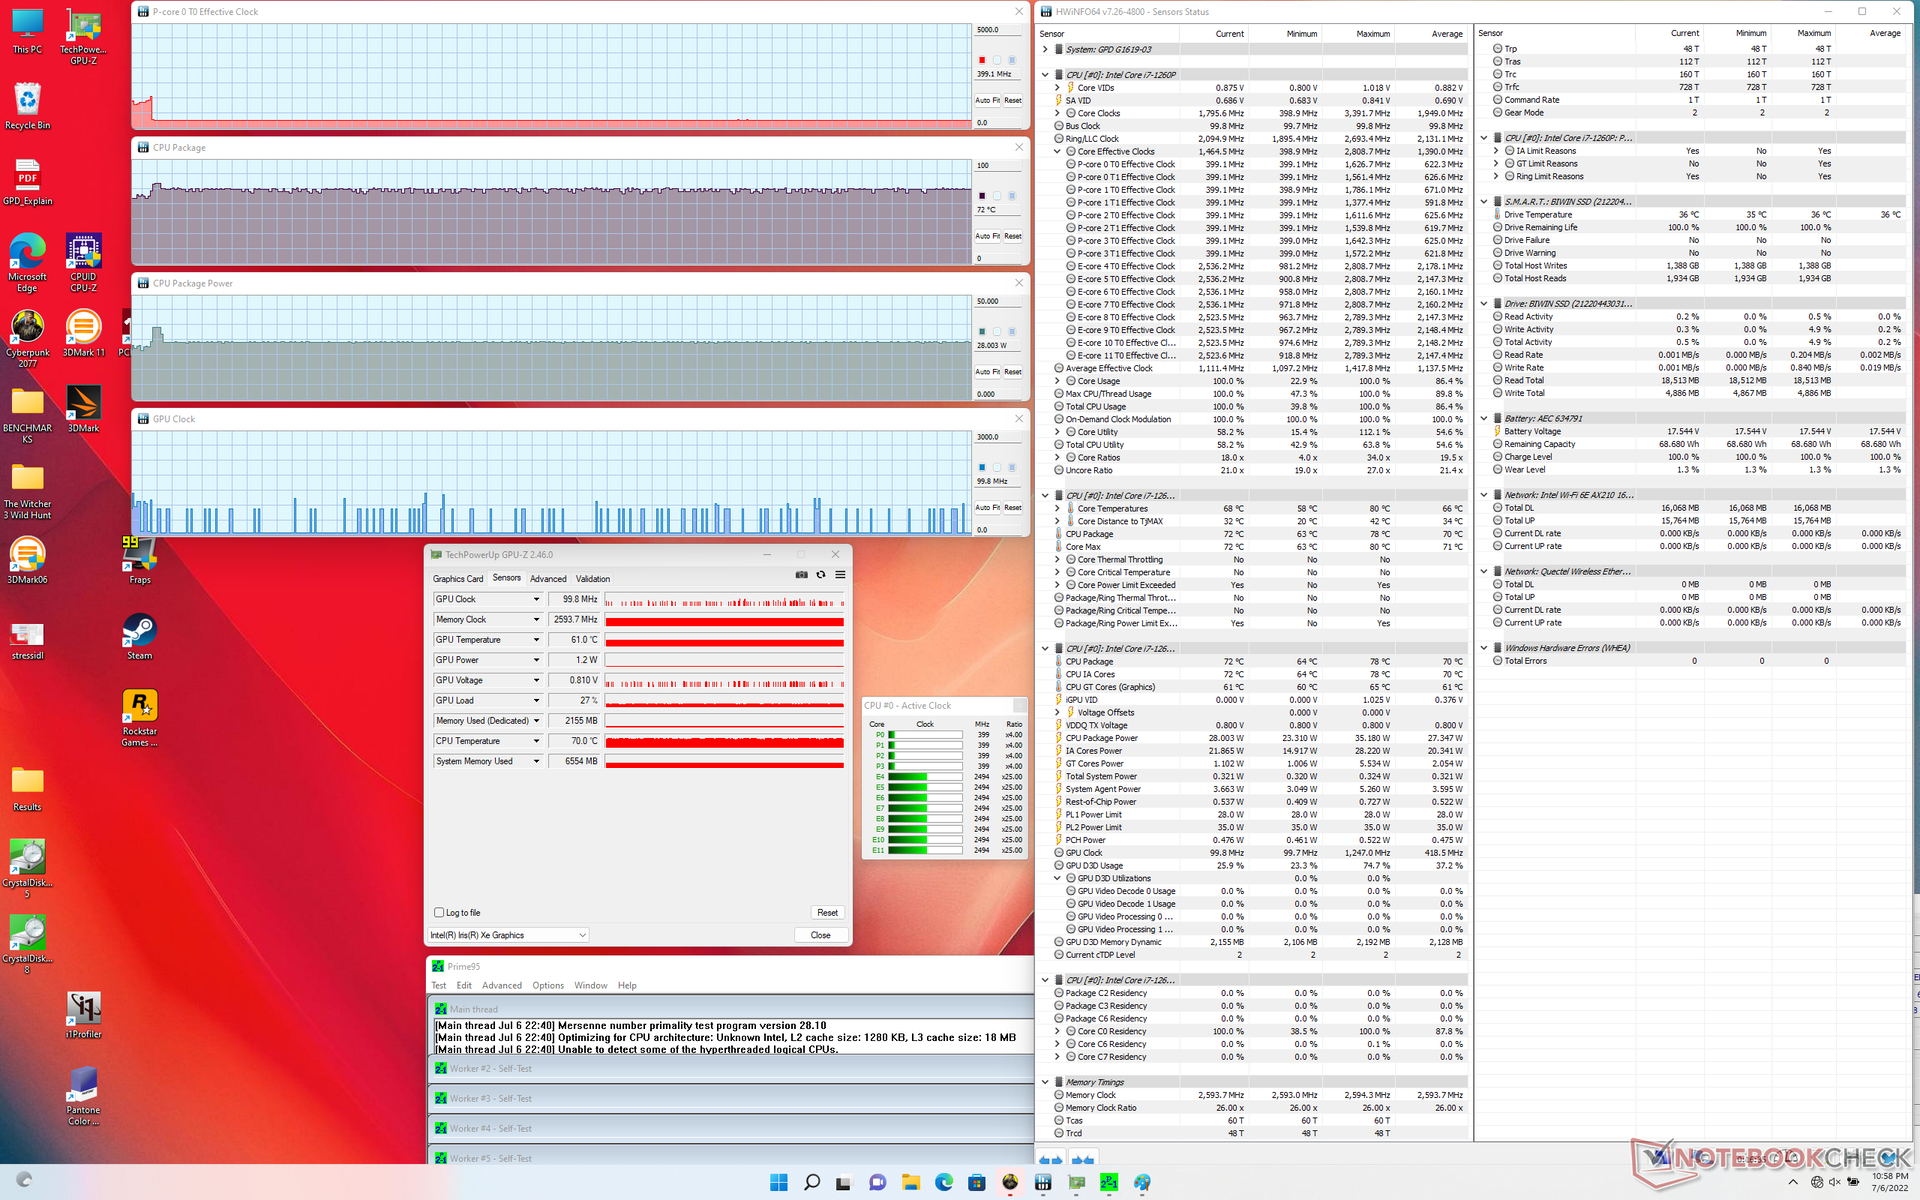
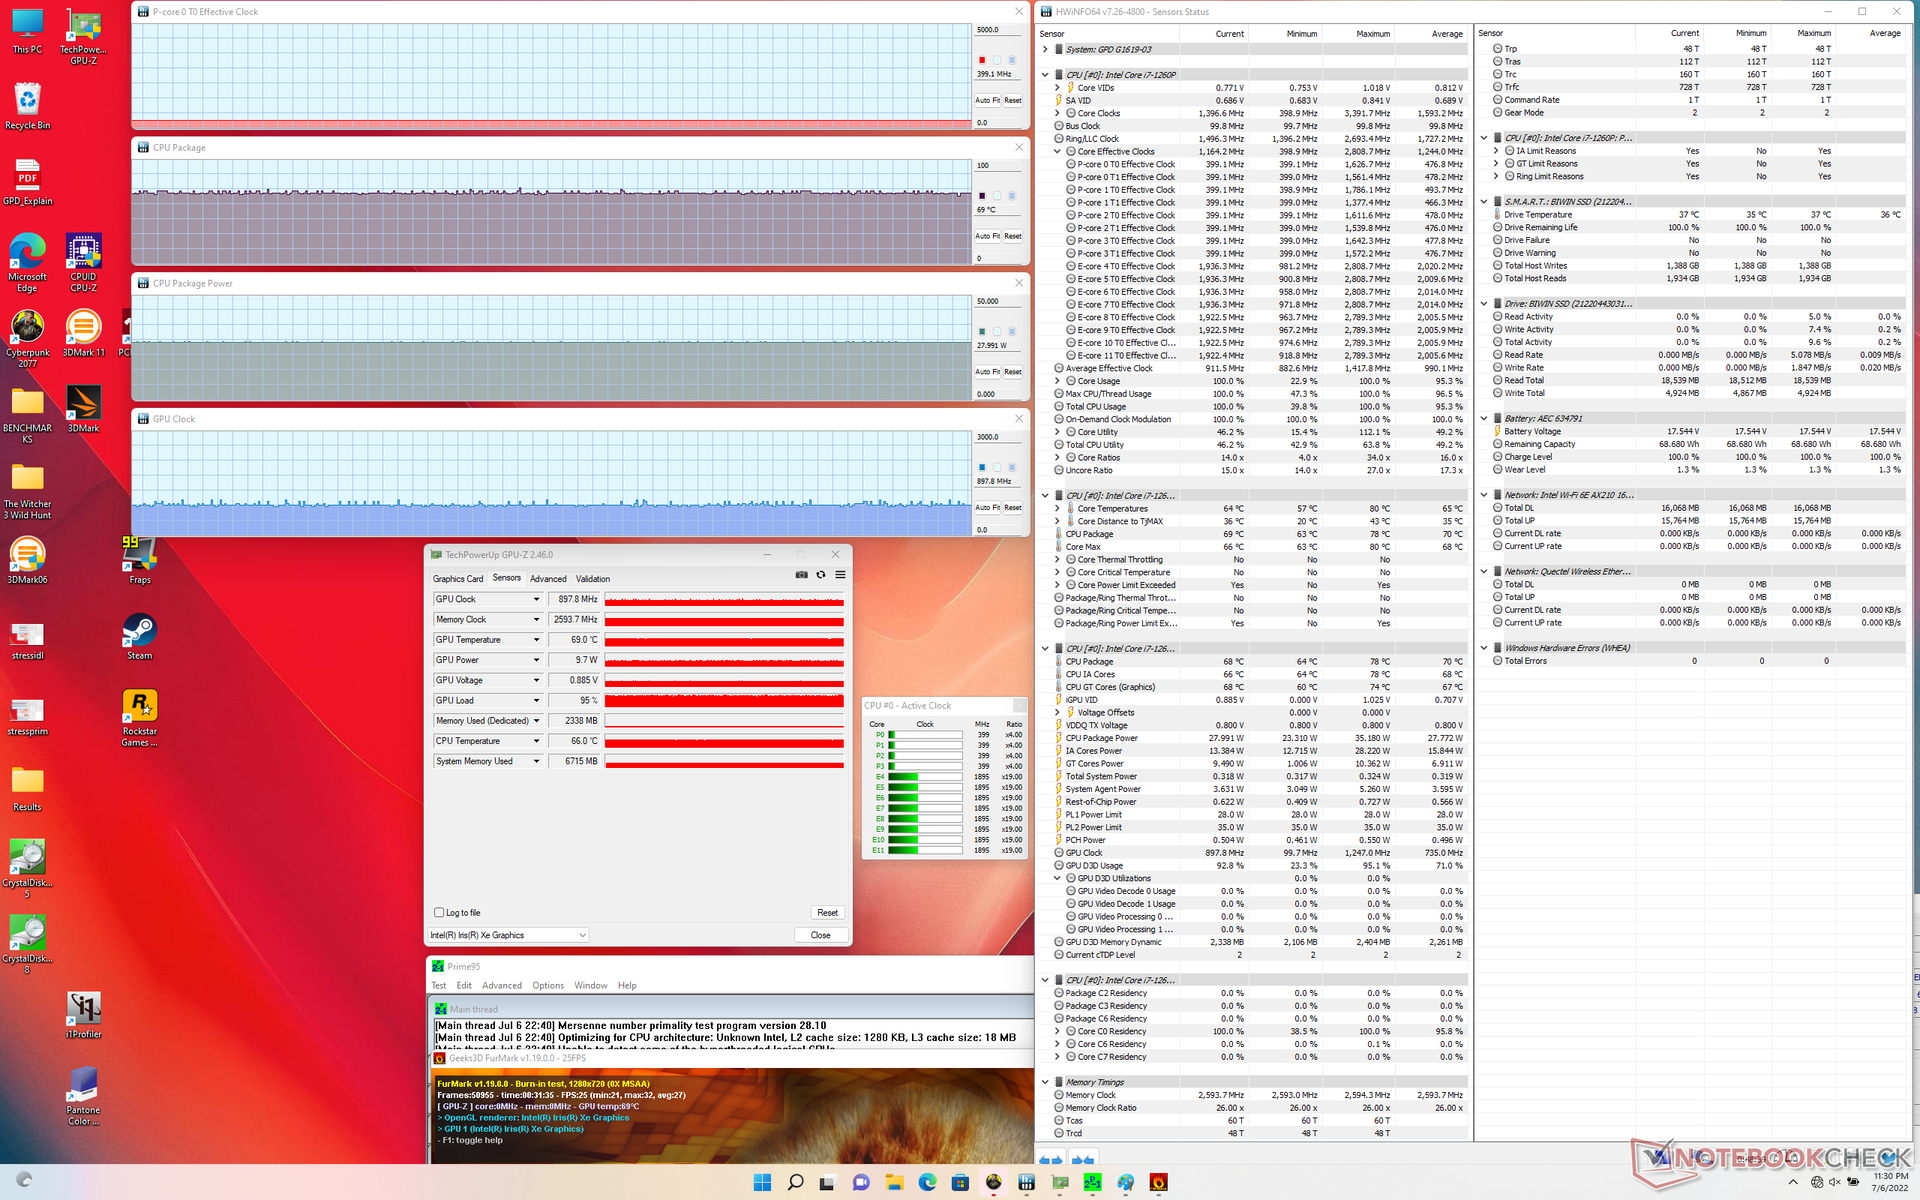
| CPU Clock (GHz) | GPU Clock (MHz) | Average CPU Temperature (°C) | |
| System Idle | -- | -- | 66 |
| Prime95 Stress | 0.4 | -- | 72 |
| Prime95 + FurMark Stress | 0.4 | 898 | 69 |
| Witcher 3 Stress | ~0.4 - 2.0 | 898 | 71 |
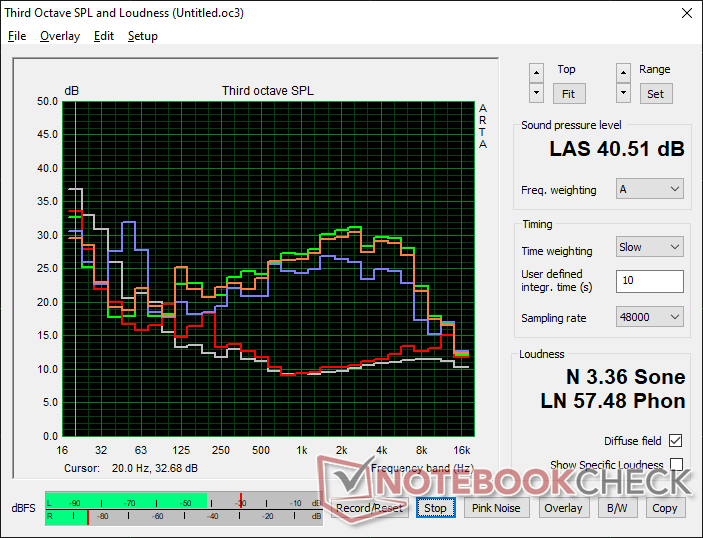
Speakers
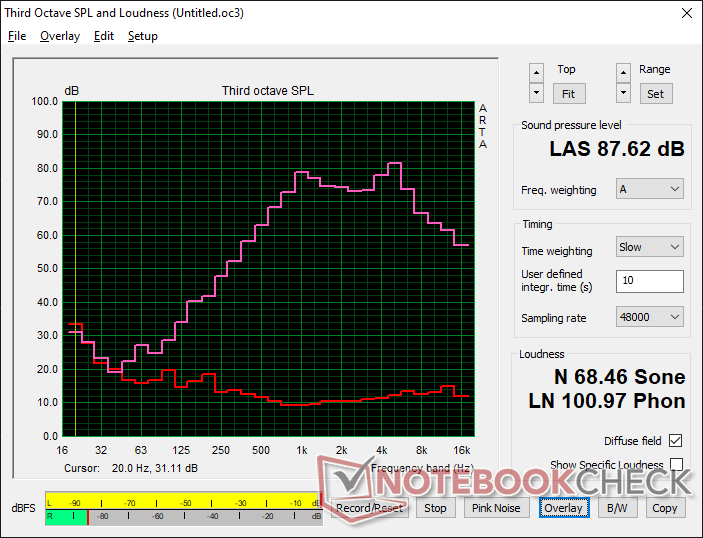
GPD Win Max 2 audio analysis
(+) | speakers can play relatively loud (87.6 dB)
Bass 100 - 315 Hz
(-) | nearly no bass - on average 27.6% lower than median
(±) | linearity of bass is average (8.2% delta to prev. frequency)
Mids 400 - 2000 Hz
(±) | higher mids - on average 6.4% higher than median
(+) | mids are linear (6.9% delta to prev. frequency)
Highs 2 - 16 kHz
(±) | higher highs - on average 6.4% higher than median
(±) | linearity of highs is average (7% delta to prev. frequency)
Overall 100 - 16.000 Hz
(±) | linearity of overall sound is average (21.3% difference to median)
Compared to same class
» 72% of all tested devices in this class were better, 5% similar, 23% worse
» The best had a delta of 5%, average was 18%, worst was 53%
Compared to all devices tested
» 59% of all tested devices were better, 7% similar, 33% worse
» The best had a delta of 4%, average was 24%, worst was 134%
Apple MacBook Pro 16 2021 M1 Pro audio analysis
(+) | speakers can play relatively loud (84.7 dB)
Bass 100 - 315 Hz
(+) | good bass - only 3.8% away from median
(+) | bass is linear (5.2% delta to prev. frequency)
Mids 400 - 2000 Hz
(+) | balanced mids - only 1.3% away from median
(+) | mids are linear (2.1% delta to prev. frequency)
Highs 2 - 16 kHz
(+) | balanced highs - only 1.9% away from median
(+) | highs are linear (2.7% delta to prev. frequency)
Overall 100 - 16.000 Hz
(+) | overall sound is linear (4.6% difference to median)
Compared to same class
» 0% of all tested devices in this class were better, 0% similar, 100% worse
» The best had a delta of 5%, average was 17%, worst was 45%
Compared to all devices tested
» 0% of all tested devices were better, 0% similar, 100% worse
» The best had a delta of 4%, average was 24%, worst was 134%
Energy Management
Power Consumption — High Performance, High Power Cost
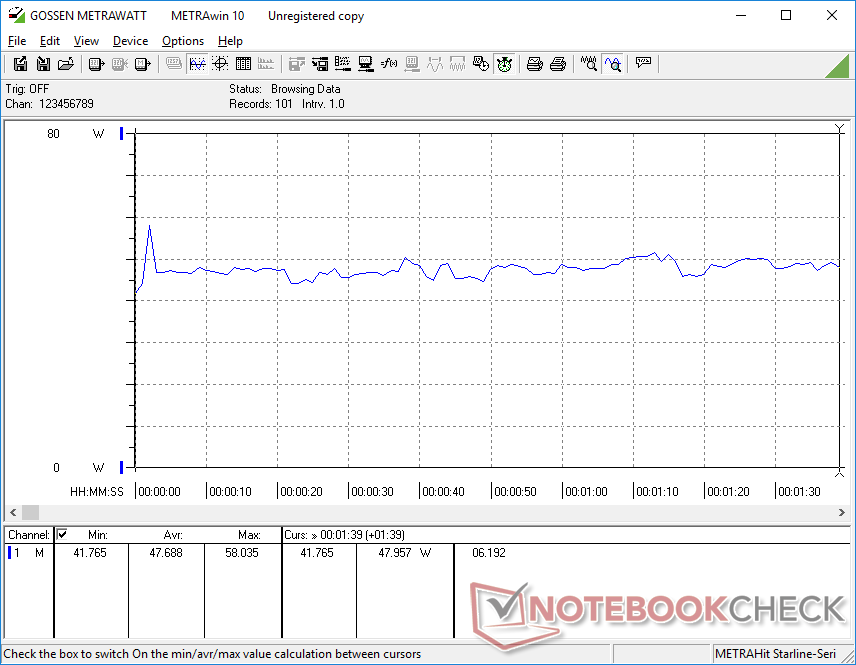
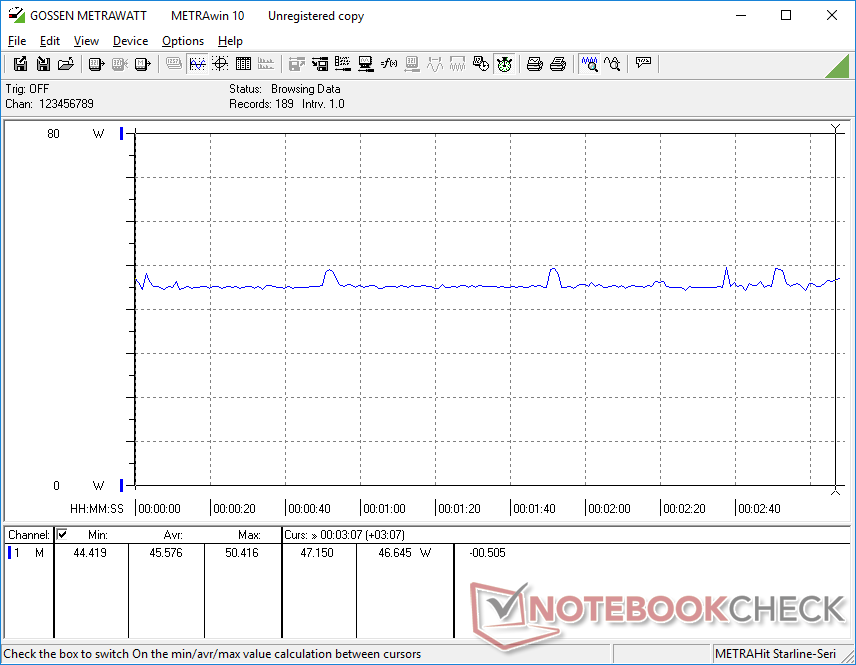
Power consumption is higher across the board when compared to last year's GPD products due to the larger screen size, higher native resolution, and more demanding Intel 12th gen processor. Running Witcher 3 would draw around 46 W to be almost 60 percent higher than on the Win 3 with an 11th gen Tiger Lake-U CPU. Fortunately, the manufacturer has accounted for the higher power consumption by installing a larger battery pack in the Win Max 2 as shown by the next section below.
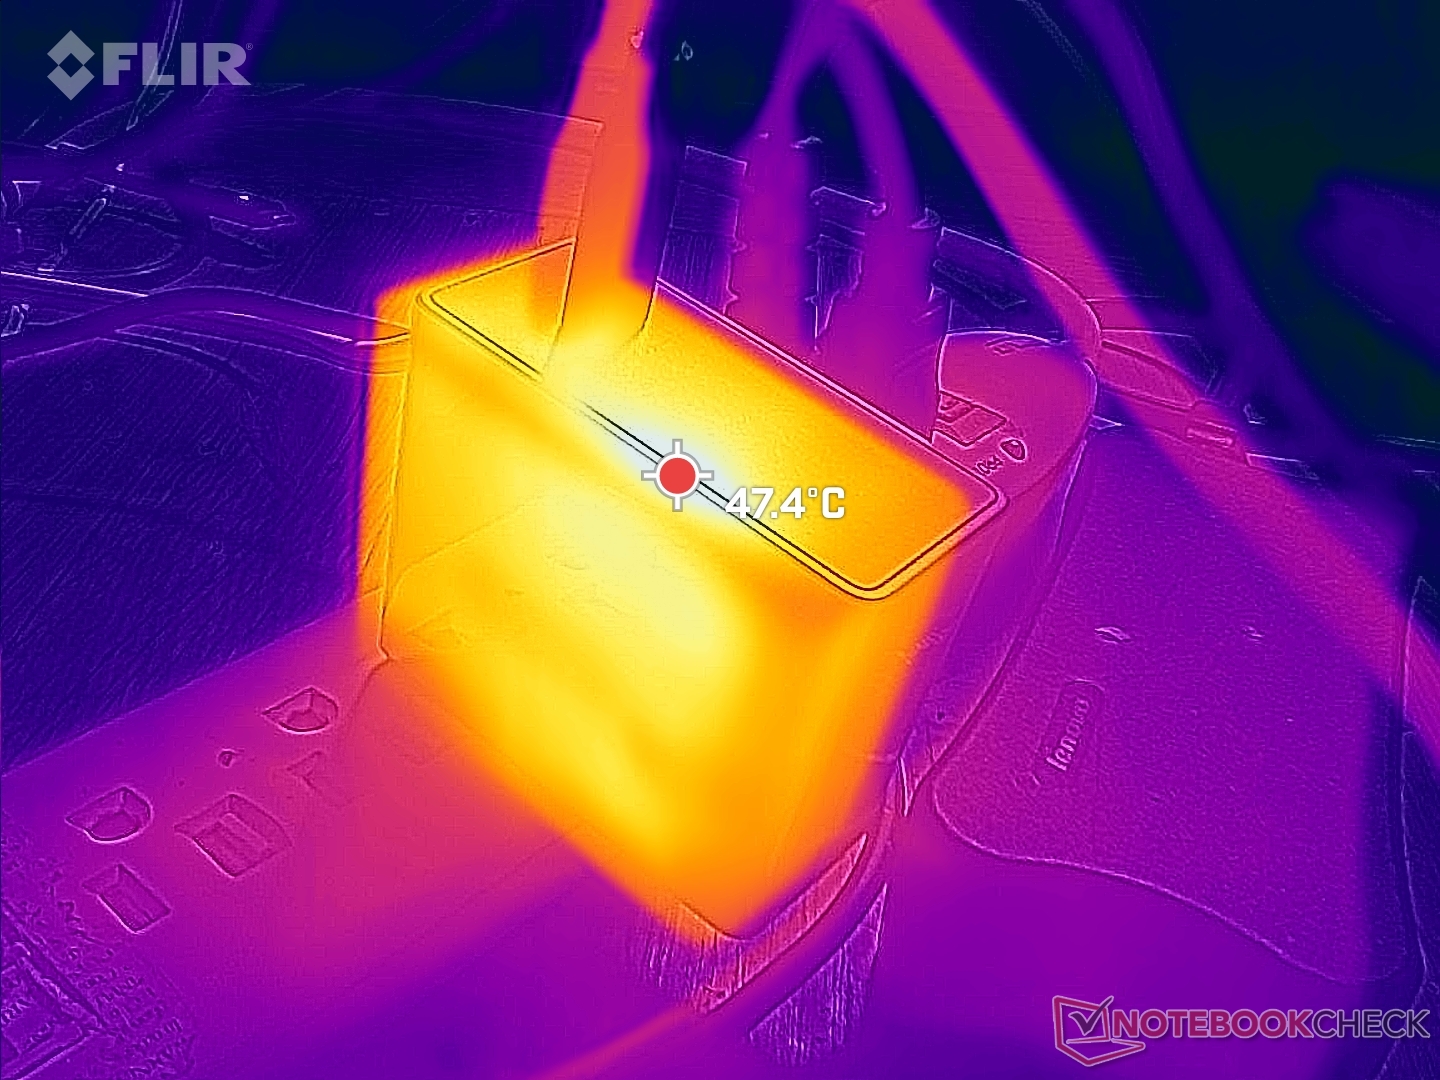
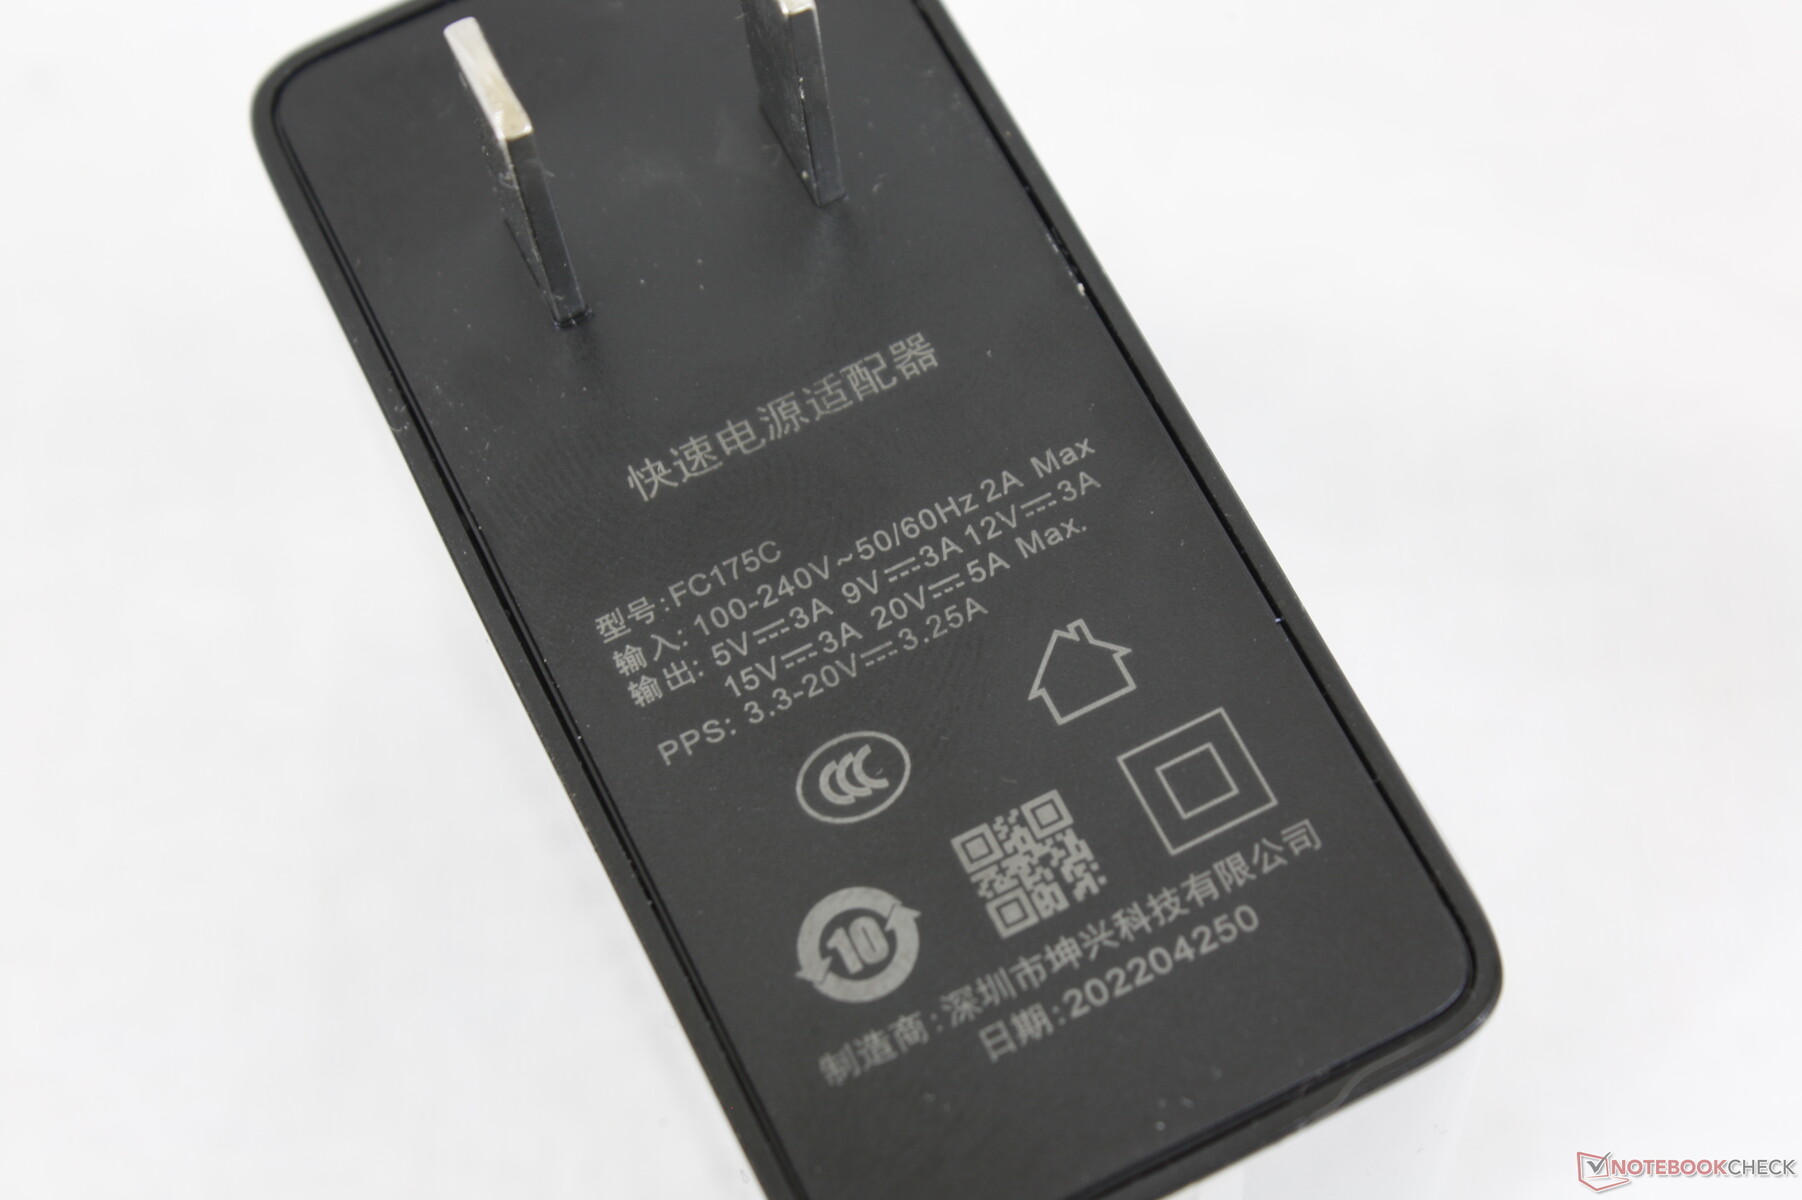
We're able to record a temporary maximum draw of 76 W from the small (~6.6 x 5.3 x 3.2 cm) 100 W USB-C AC adapter. The adapter can be used to quick charge most other USB-C devices as well.
| Off / Standby | |
| Idle | |
| Load |
|
Key:
min: | |
| GPD Win Max 2 i7-1260P, Iris Xe G7 96EUs, BiWin NQ200 1TB CNF82GS1D00-1TB, IPS, 2560x1600, 10.1" | GPD Pocket 3 i7-1195G7, Iris Xe G7 96EUs, BiWin NQ200 1TB CNF82GS1D00-1TB, IPS, 1920x1200, 8" | GPD Win Max 2021 R7 4800U, Vega 8, BIWIN NS200 512GB CNF82GS1G00-512, IPS, 1280x800, 8" | GPD Win 3 i5-1135G7, Iris Xe G7 80EUs, BIWIN NS200 1TB CNF82GS1G02-1TB, IPS, 1280x720, 5.5" | Microsoft Surface Go 3 Core i3 i3-10100Y, UHD Graphics 615, SK hynix HFB1M8MQ331C0MR, IPS , 1920x1280, 10.5" | Lenovo IdeaPad Flex 3 11IGL05 Celeron N4020, UHD Graphics 600, SanDisk DA4064, IPS LED, 1366x768, 11.6" | |
|---|---|---|---|---|---|---|
| Power Consumption | 1% | 28% | 45% | 55% | 66% | |
| Idle Minimum * (Watt) | 5.8 | 9.6 -66% | 5.2 10% | 2.9 50% | 2.6 55% | 2.4 59% |
| Idle Average * (Watt) | 10.2 | 11 -8% | 6.5 36% | 4.5 56% | 5.1 50% | 4.5 56% |
| Idle Maximum * (Watt) | 11.5 | 11.8 -3% | 7.4 36% | 4.5 61% | 5.9 49% | 4.6 60% |
| Load Average * (Watt) | 47.7 | 39 18% | 37.2 22% | 38.5 19% | 22.9 52% | 12.8 73% |
| Witcher 3 ultra * (Watt) | 45.6 | 36.4 20% | 38.1 16% | 28.9 37% | ||
| Load Maximum * (Watt) | 76.8 | 42 45% | 39 49% | 41.4 46% | 24.6 68% | 14.3 81% |
* ... smaller is better
Power Consumption Witcher 3 / Stresstest
Power Consumption external Monitor
Battery Life — Great For The Size
The 70 Wh battery is large for such a small form factor. In comparison, the original 2021 Win Max or 11.6-inch Lenovo IdeaPad Flex 3 11 laptop would ship with smaller 57 Wh and 37 Wh batteries, respectively.
Users can expect almost 9 hours of real-world browsing use to be just as long or even longer than most current Ultrabooks under similar loads. Gaming time is much shorter, however, at only about 2 to 3 hours.
Charging from empty to full capacity with the included AC adapter takes roughly 1.5 hours.
| GPD Win Max 2 i7-1260P, Iris Xe G7 96EUs, 70 Wh | GPD Pocket 3 i7-1195G7, Iris Xe G7 96EUs, 39 Wh | GPD Win Max 2021 R7 4800U, Vega 8, 57 Wh | GPD Win 3 i5-1135G7, Iris Xe G7 80EUs, 44 Wh | Microsoft Surface Go 3 Core i3 i3-10100Y, UHD Graphics 615, 28 Wh | Lenovo IdeaPad Flex 3 11IGL05 Celeron N4020, UHD Graphics 600, 37.5 Wh | |
|---|---|---|---|---|---|---|
| Battery runtime | -31% | 7% | 3% | -20% | 7% | |
| Reader / Idle (h) | 15.4 | |||||
| WiFi v1.3 (h) | 8.7 | 6 -31% | 9.3 7% | 11.3 30% | 7 -20% | 9.3 7% |
| Load (h) | 1.7 | 1.3 -24% |
Pros
Cons
Verdict — Good With Intel, Better With AMD
We weren't too impressed by the original 2021 Win Max. Though it was fun to play on, it was also hard to look past its narrow color gamut, noticeable ghosting, awkward keyboard layout, creaky chassis design, slow Wi-Fi, and lack of an integrated webcam. The 2022 Win Max 2 has addressed all these concerns for an experience that feels worthy of its asking price. Users are getting a lot more from such a small chassis in terms of performance, display quality, and connectivity. Even if you don't intend to game very much on the Win Max 2, its high resolution touchscreen, 4G LTE, excellent docking capabilities, and compact size can certainly come in handy for other usage scenarios.
The GPD Win Max 2 does a lot of things right by offering both Intel and AMD options and a higher quality chassis with a vibrant 1600p IPS touchscreen.
If you're going to game, however, you'll want to keep in mind that the AMD SKU can offer faster performance for the same price at the cost of dropping Thunderbolt support. The relatively heavy system and suboptimal positioning of the joysticks make handling more tiring than on a lighter Nintendo Switch or Win 3. A few strange design choices, such as the upside-down USB and HDMI ports, difficult-to-connect WAN ribbon cable, and inability to easily disable the shoulder buttons are some minor annoyances to deal with. We'd love to see 120 Hz OLED in the future and maybe even a lighter design for more comfortable handheld gaming.
Price and Availability
GPD is running an Indiegogo for the Win Max 2 as of this writing. Both the Intel and AMD SKUs are expected to launch by September for $1000 USD each.
GPD Win Max 2
- 07/09/2022 v7 (old)
Allen Ngo
Price comparison
