

GPD Pocket 3 convertible UMPC review: Faster than many Intel EVO laptops

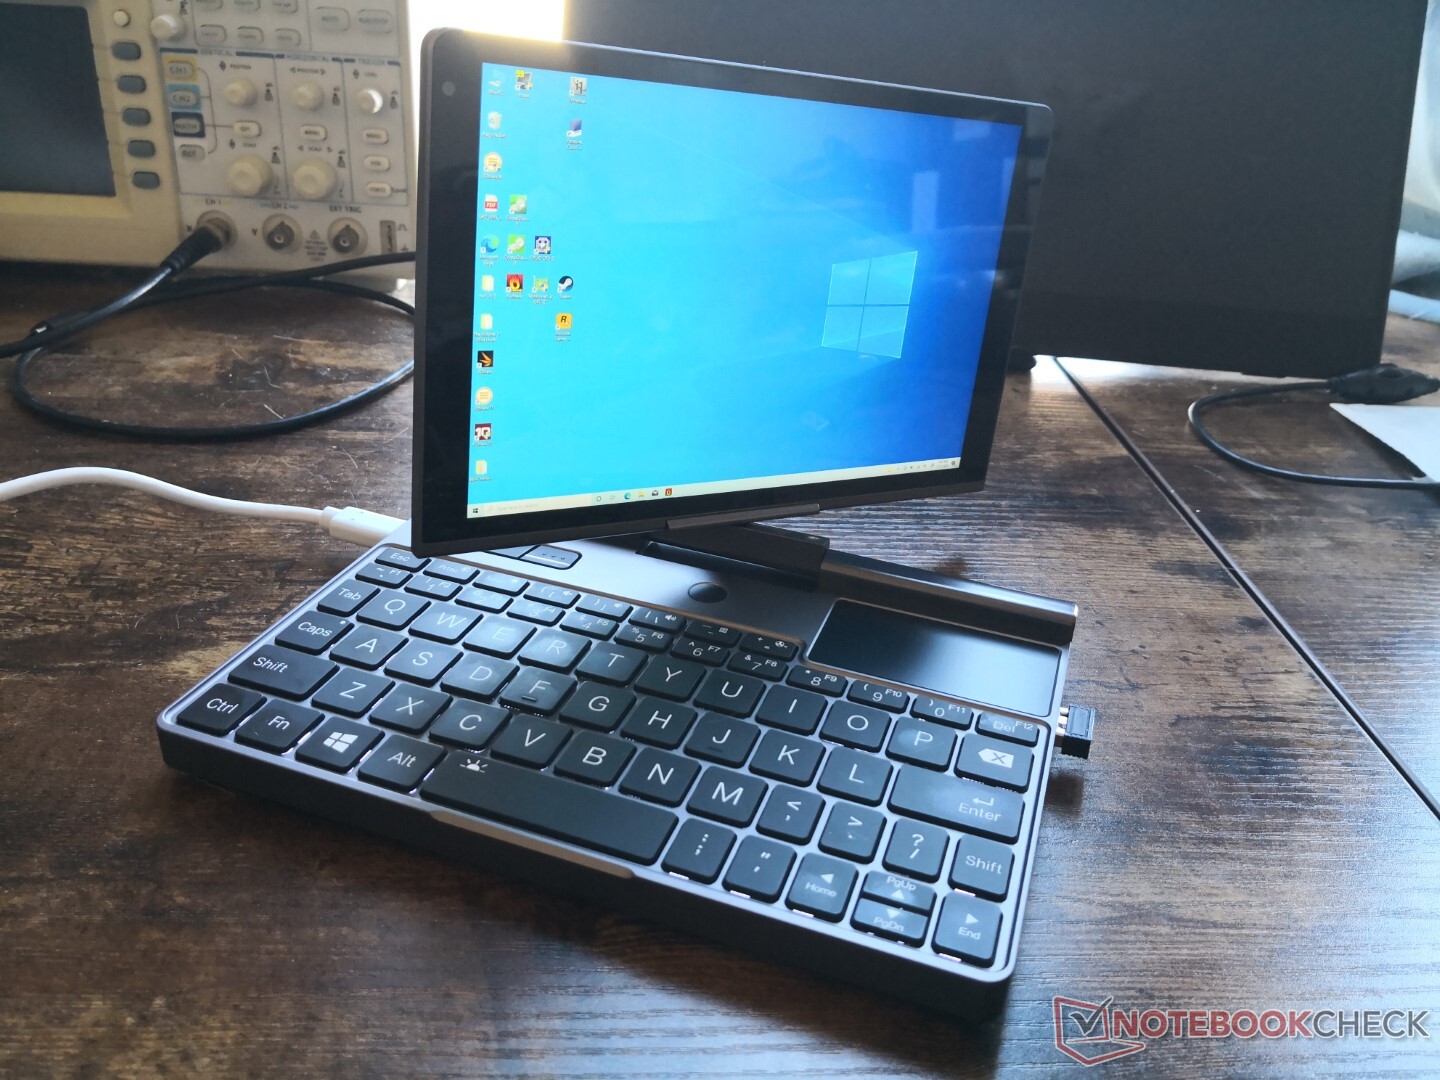
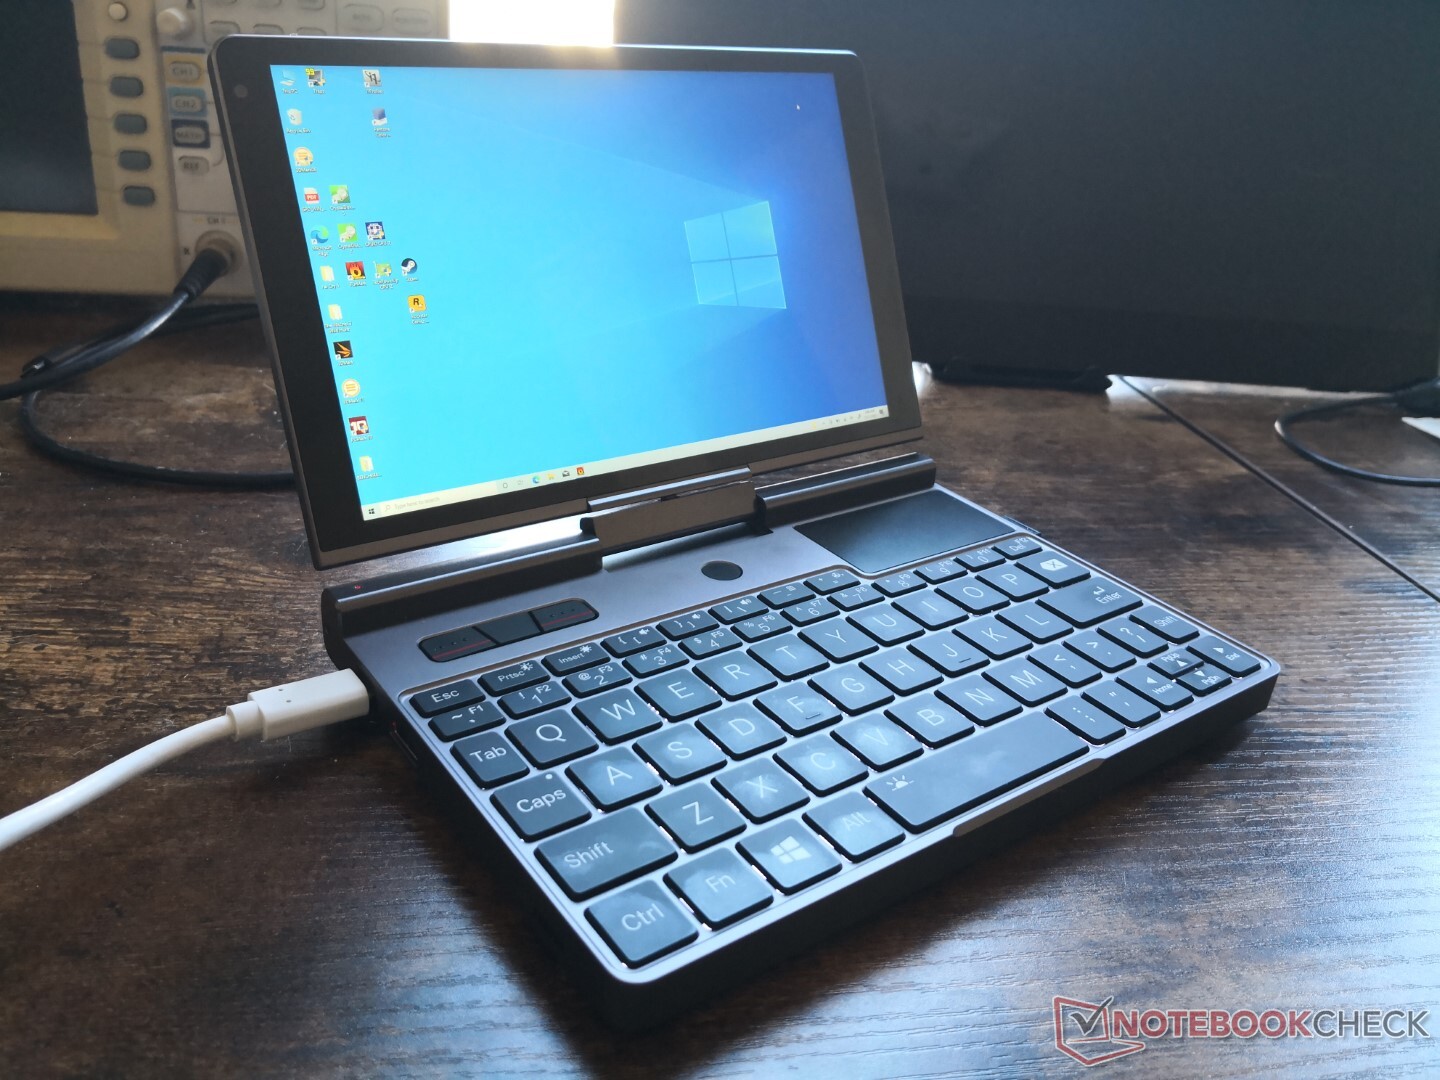
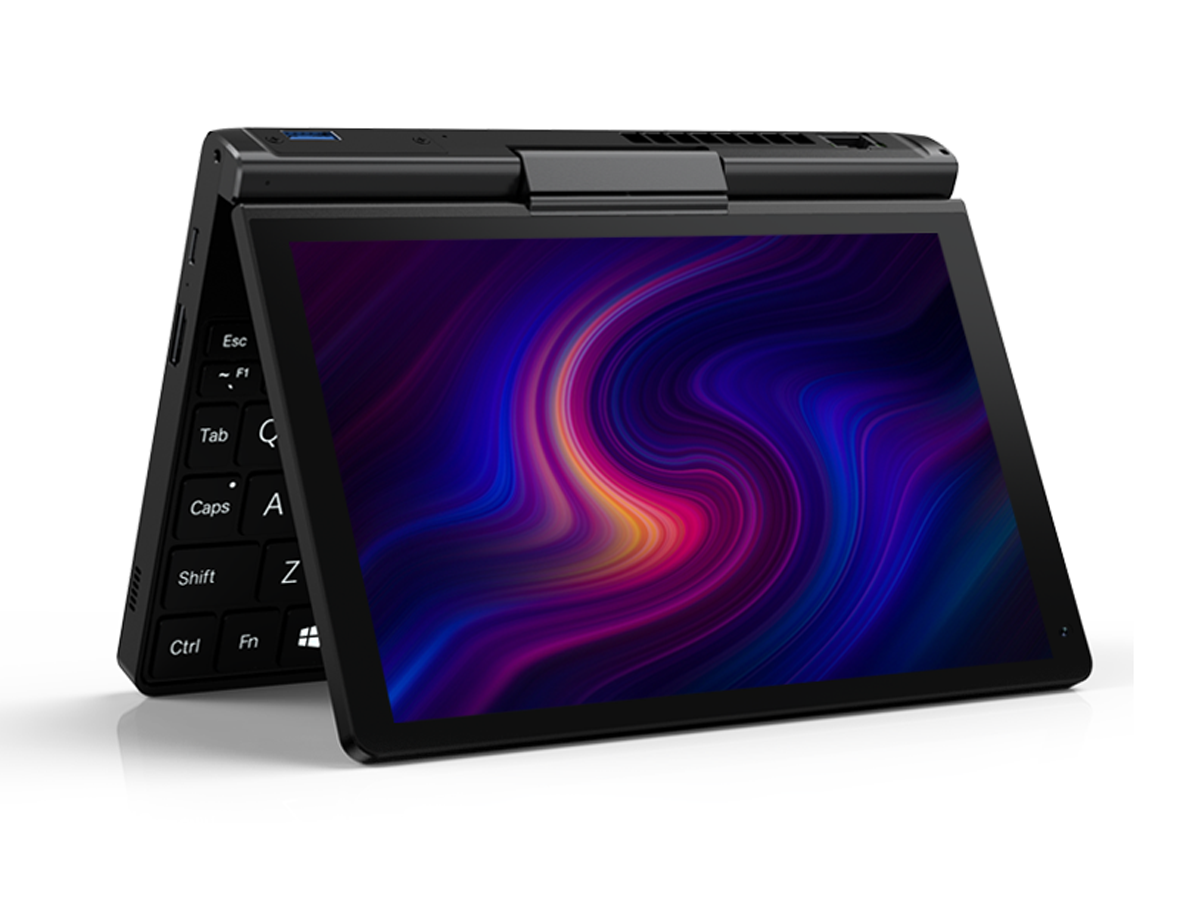
After the somewhat disappointing Win Max gaming UMPC hybrid earlier this year, the new GPD Pocket 3 is a return to form on a more traditional UMPC without any of the integrated gamepad buttons. Instead, the Pocket 3 features a rotatable touchscreen a la the old HP tx1000 or Lenovo ThinkPad Twist for switching between laptop mode and tablet mode.
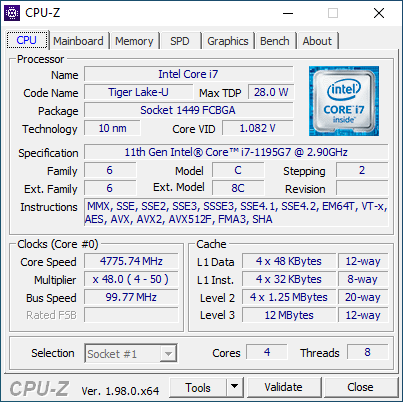
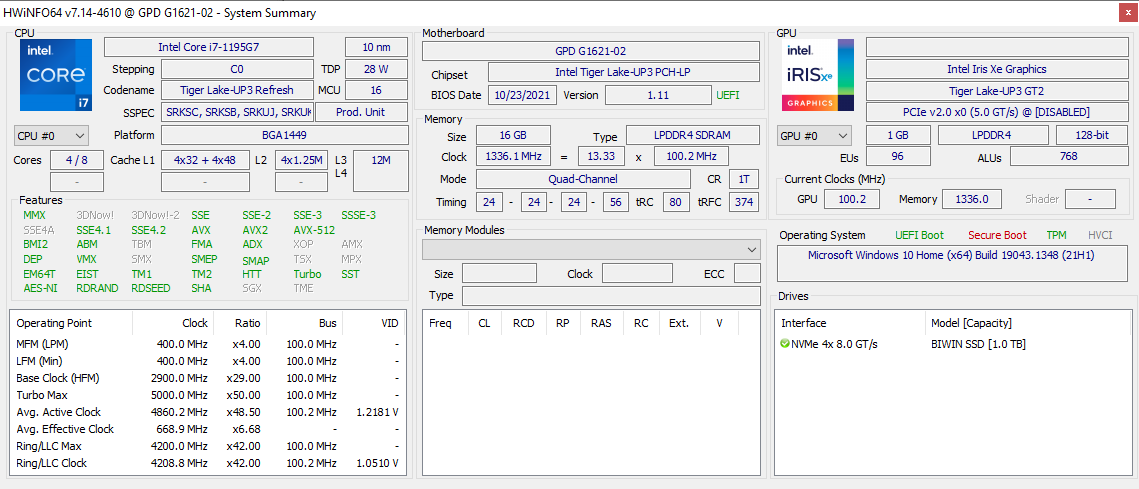
Core specifications are impressive for such a small 16:10 8-inch form factor as the system is powered by the same hardware found on the latest Intel Evo laptops. The Tiger Lake-U Core i7-1195G7 CPU, Iris Xe GPU, 1200p IPS display, Thunderbolt 4, and even PCIe4 NVMe SSD are all available here on the highest-end configuration. Alternatively, the lower-end option comes with the Pentium N6000 instead.
Our test unit is a higher-end Core i7 pre-production unit that's missing a few auxiliary features from the final retail model. Nonetheless, it is still an accurate representation of what users can expect in terms of performance and display quality from the final model. Users can check out the official Pocket 3 Indiegogo page for the full specifications.
More GPD reviews:
Potential Competitors in Comparison
Rating | Date | Model | Weight | Height | Size | Resolution | Price |
|---|---|---|---|---|---|---|---|
| 86.3 % v7 (old) | 11 / 2021 | GPD Pocket 3 i7-1195G7, Iris Xe G7 96EUs | 730 g | 20 mm | 8.00" | 1920x1200 | |
| 79.3 % v7 (old) | 08 / 2021 | GPD Win Max 2021 R7 4800U, Vega 8 | 850 g | 26 mm | 8.00" | 1280x800 | |
v (old) | 01 / 2021 | GPD Win 3 i5-1135G7, Iris Xe G7 80EUs | 553 g | 27 mm | 5.50" | 1280x720 | |
| 88.5 % v7 (old) | 04 / 2021 | Lenovo ThinkPad X12 20UVS03G00 i7-1160G7, Iris Xe G7 96EUs | 1.1 kg | 14.5 mm | 12.30" | 1920x1280 | |
| 86.7 % v7 (old) | 10 / 2021 | Dell XPS 13 9310 2-in-1 i7-1165G7, Iris Xe G7 96EUs | 1.3 kg | 14.35 mm | 13.40" | 1920x1200 | |
| 89.4 % v7 (old) | 12 / 2020 | HP Spectre x360 14t-ea000 i7-1165G7, Iris Xe G7 96EUs | 1.3 kg | 17.2 mm | 13.50" | 1920x1280 |
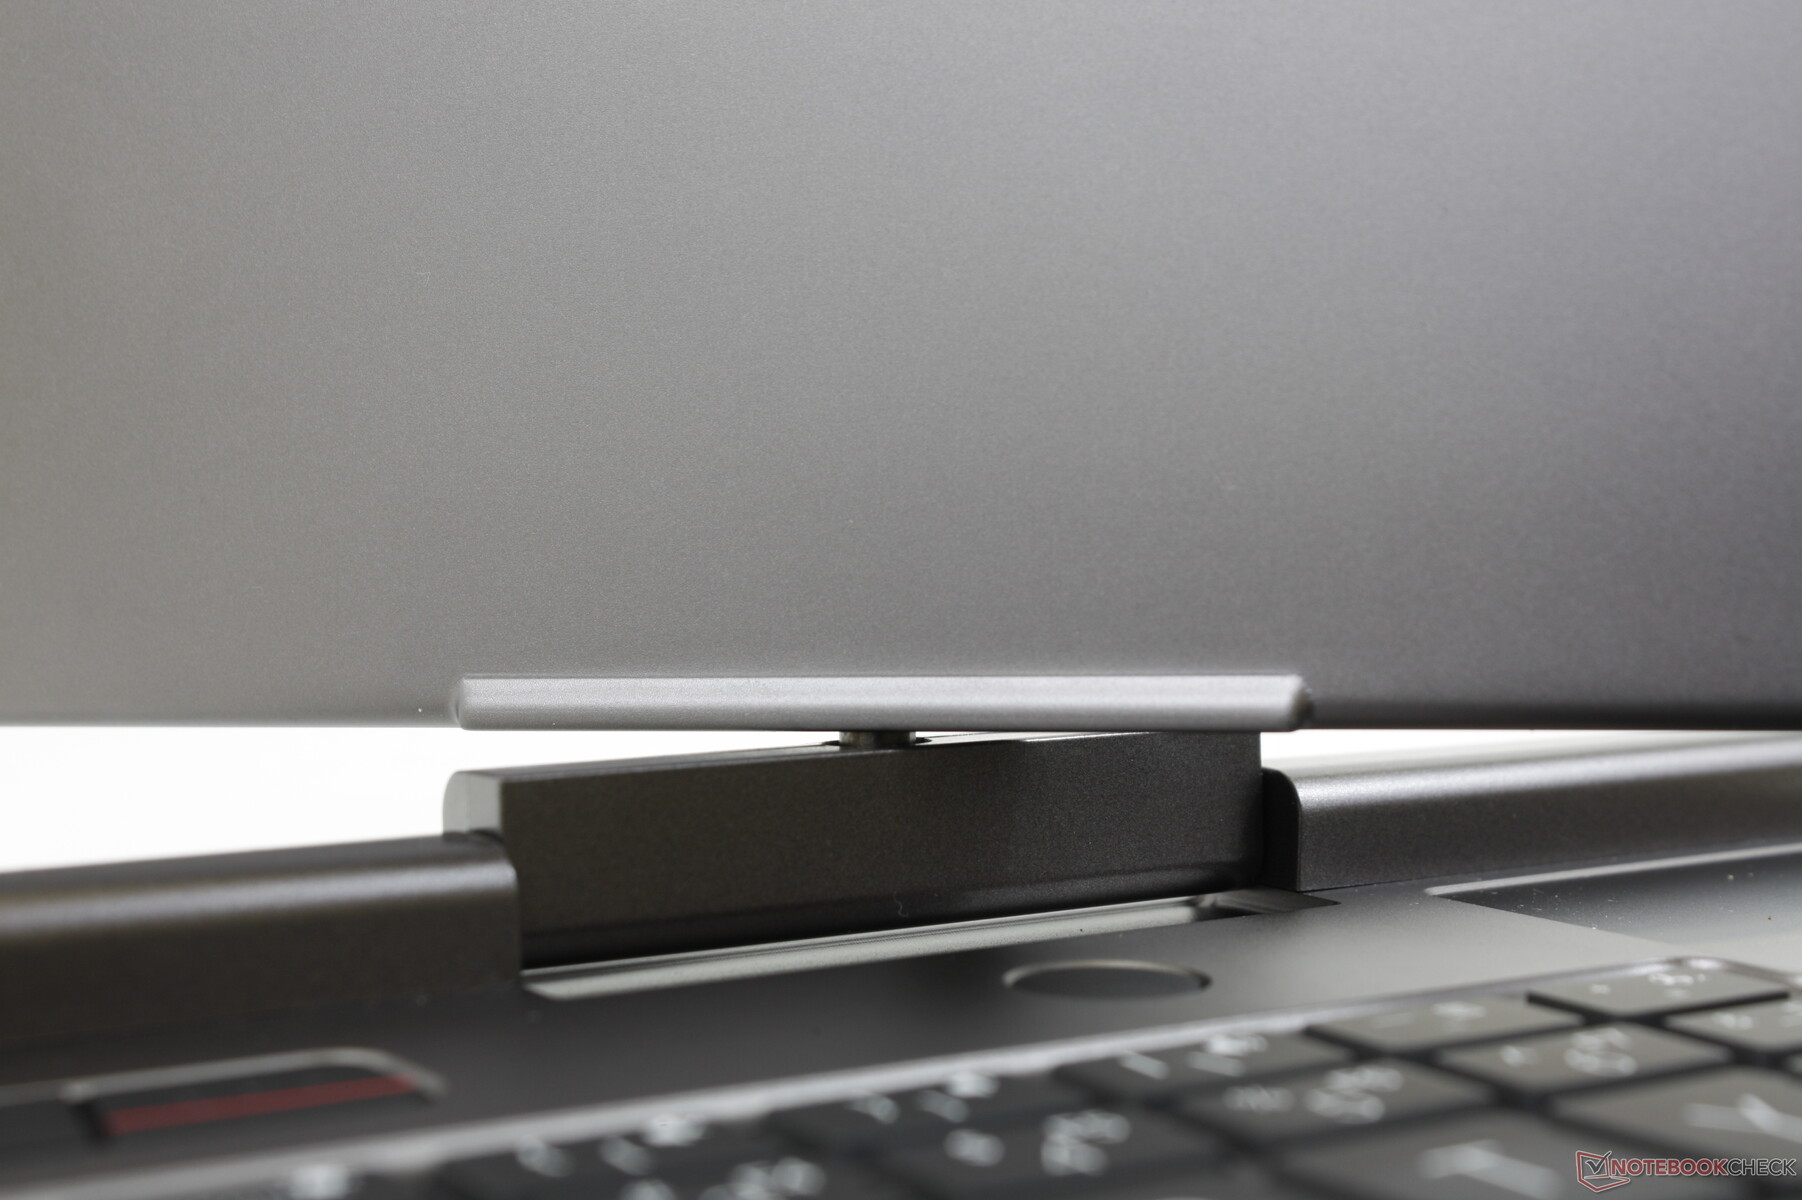
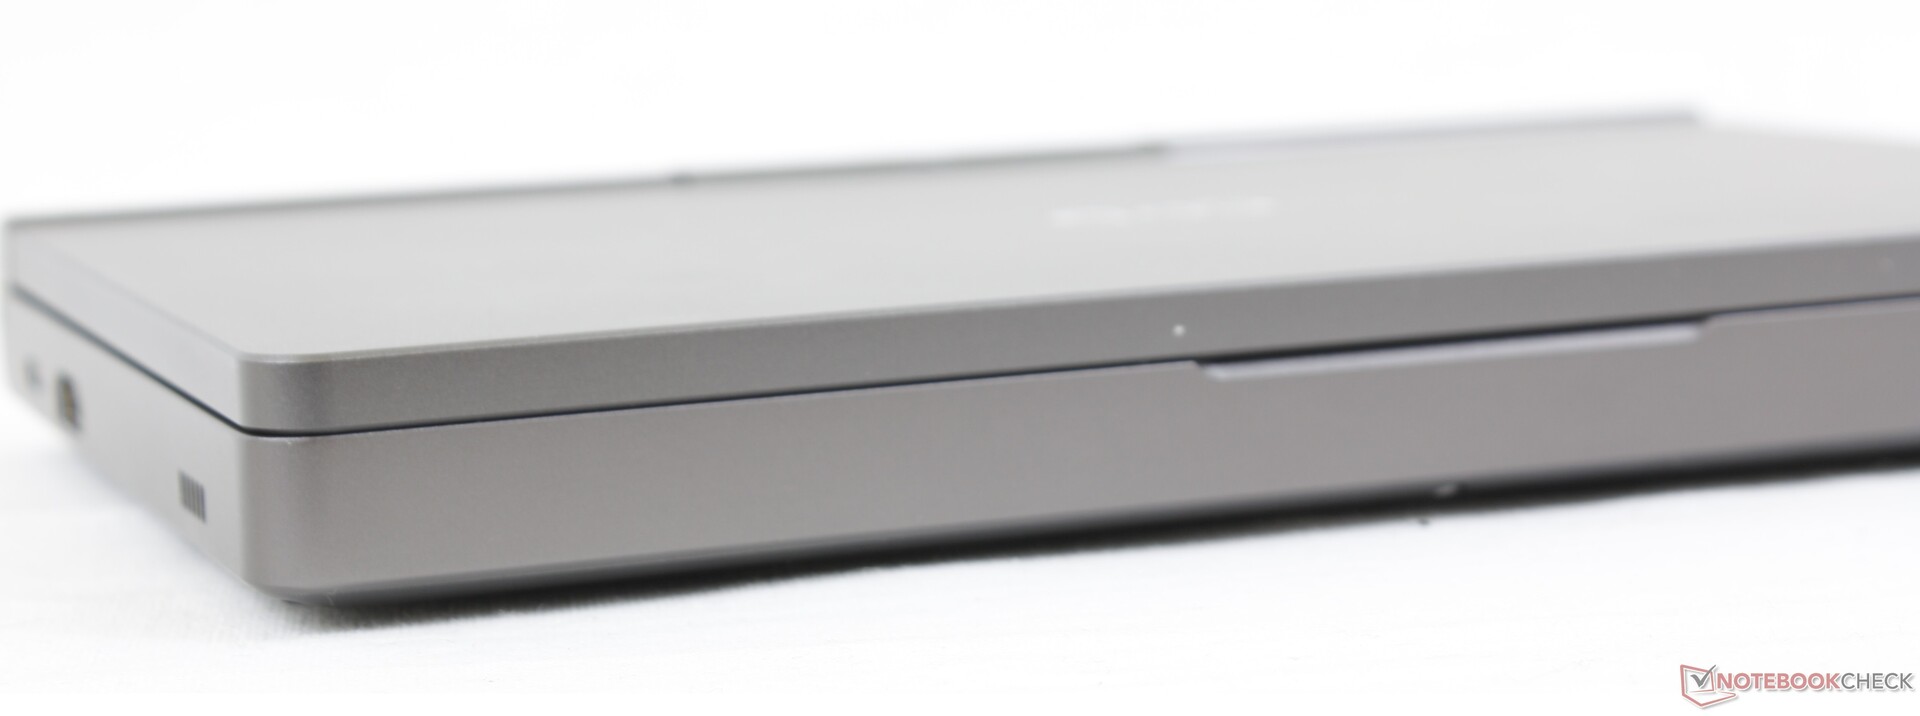
Case — Sleek and Mostly Strong
GPD uses the same metal chassis materials between the Pocket 3, Win Max, and Win 3 for a similar feel and texture between the lineup. Though the base is strong and rigid, the rotating touchscreen is attached to a very small joint that feels prone to weakening or breaking over time. This is something we'll have to test more thoroughly over the course of a year to see if the joint can hold up to constant use.
The lack of any integrated controller buttons allows the 8-inch Pocket 3 to be both lighter and smaller than the 8-inch Win Max in all three dimensions.
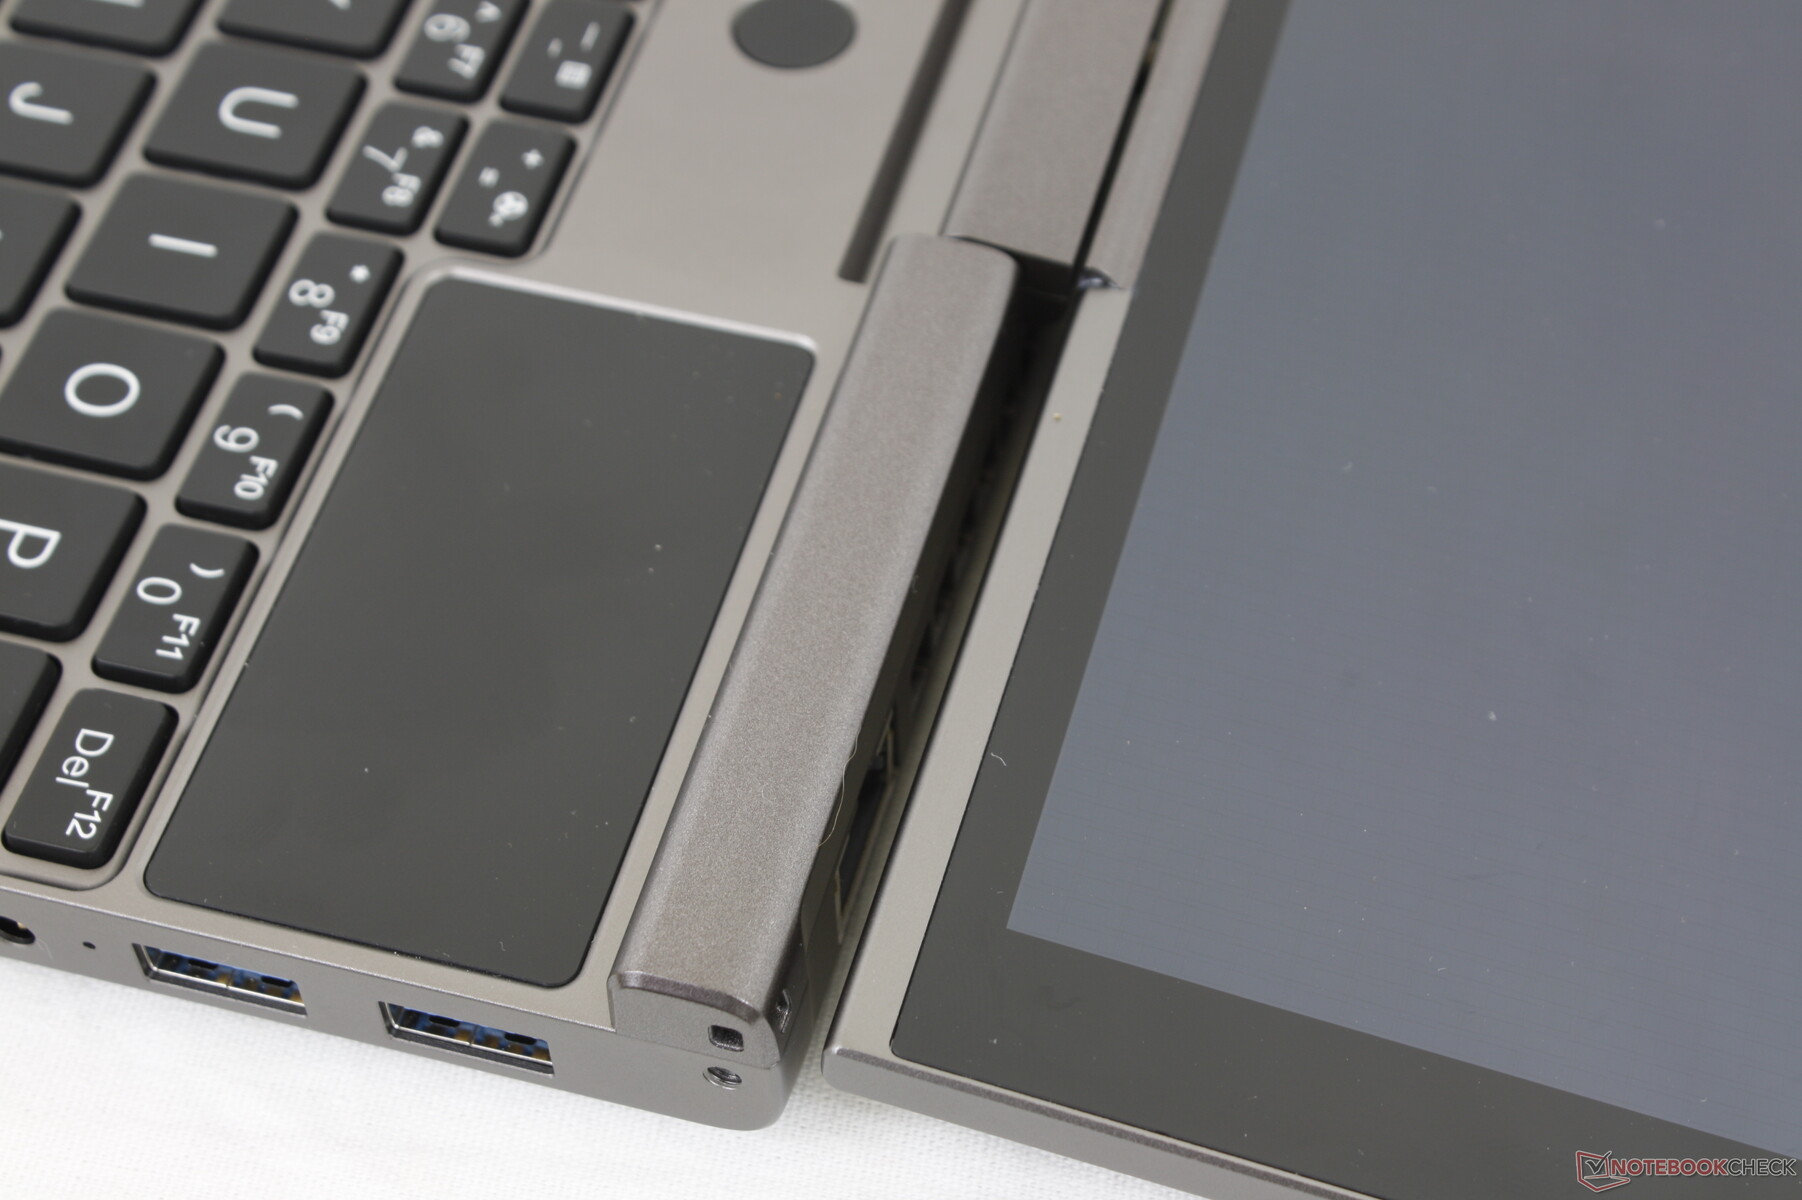
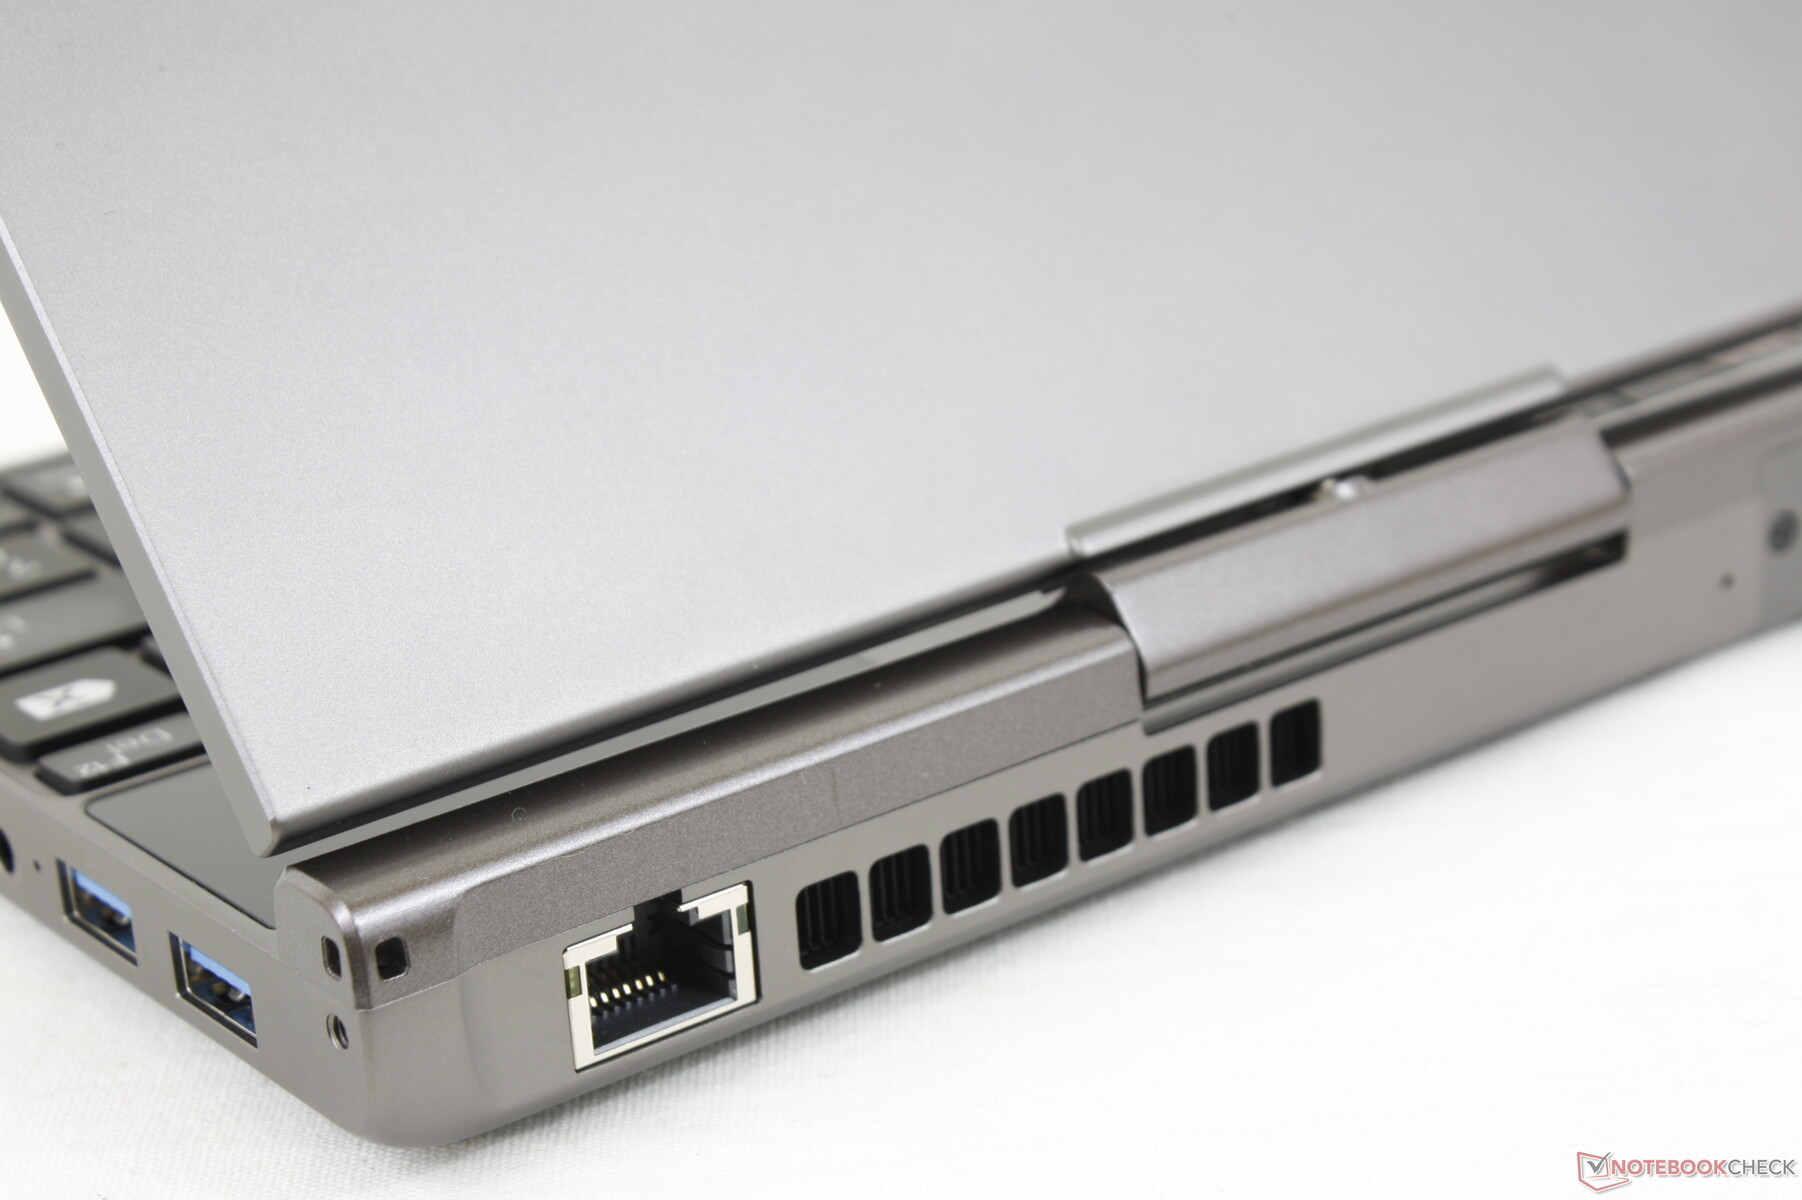
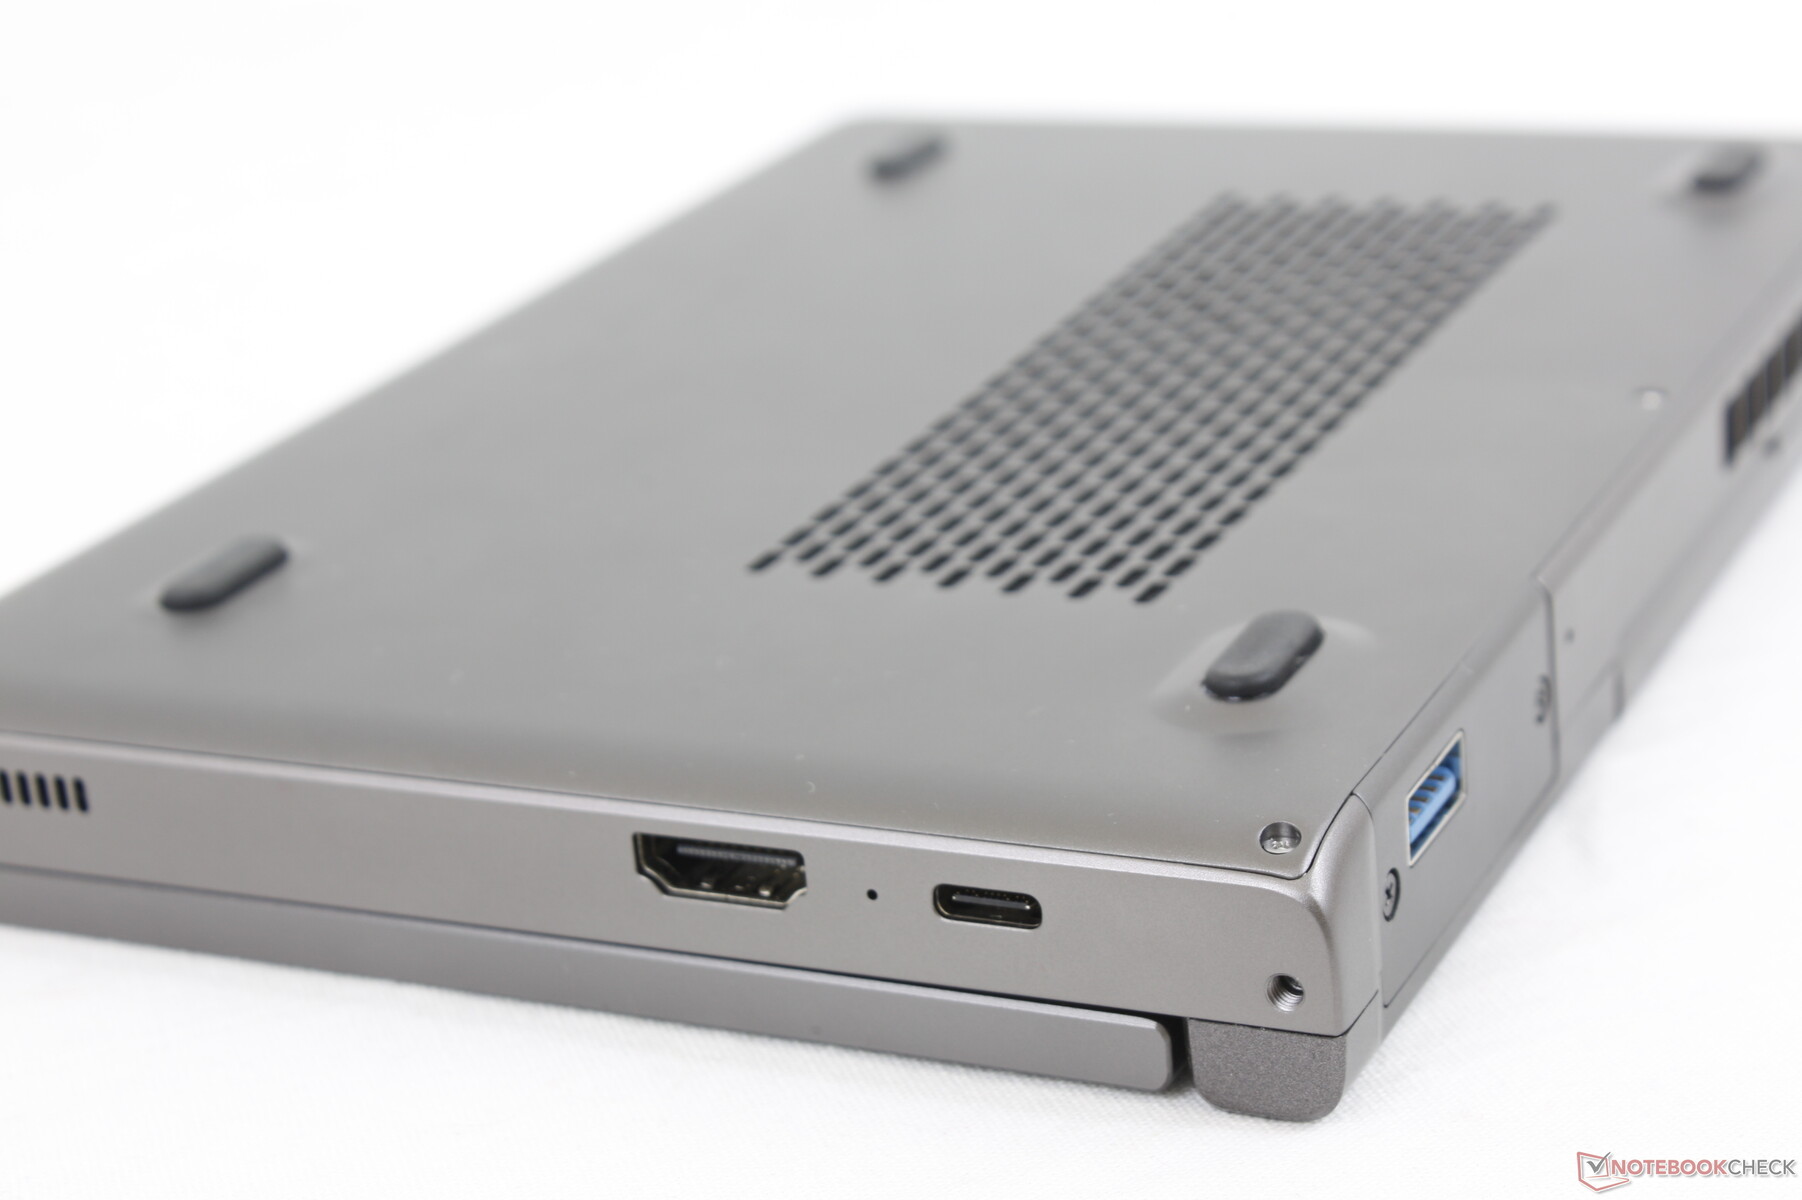
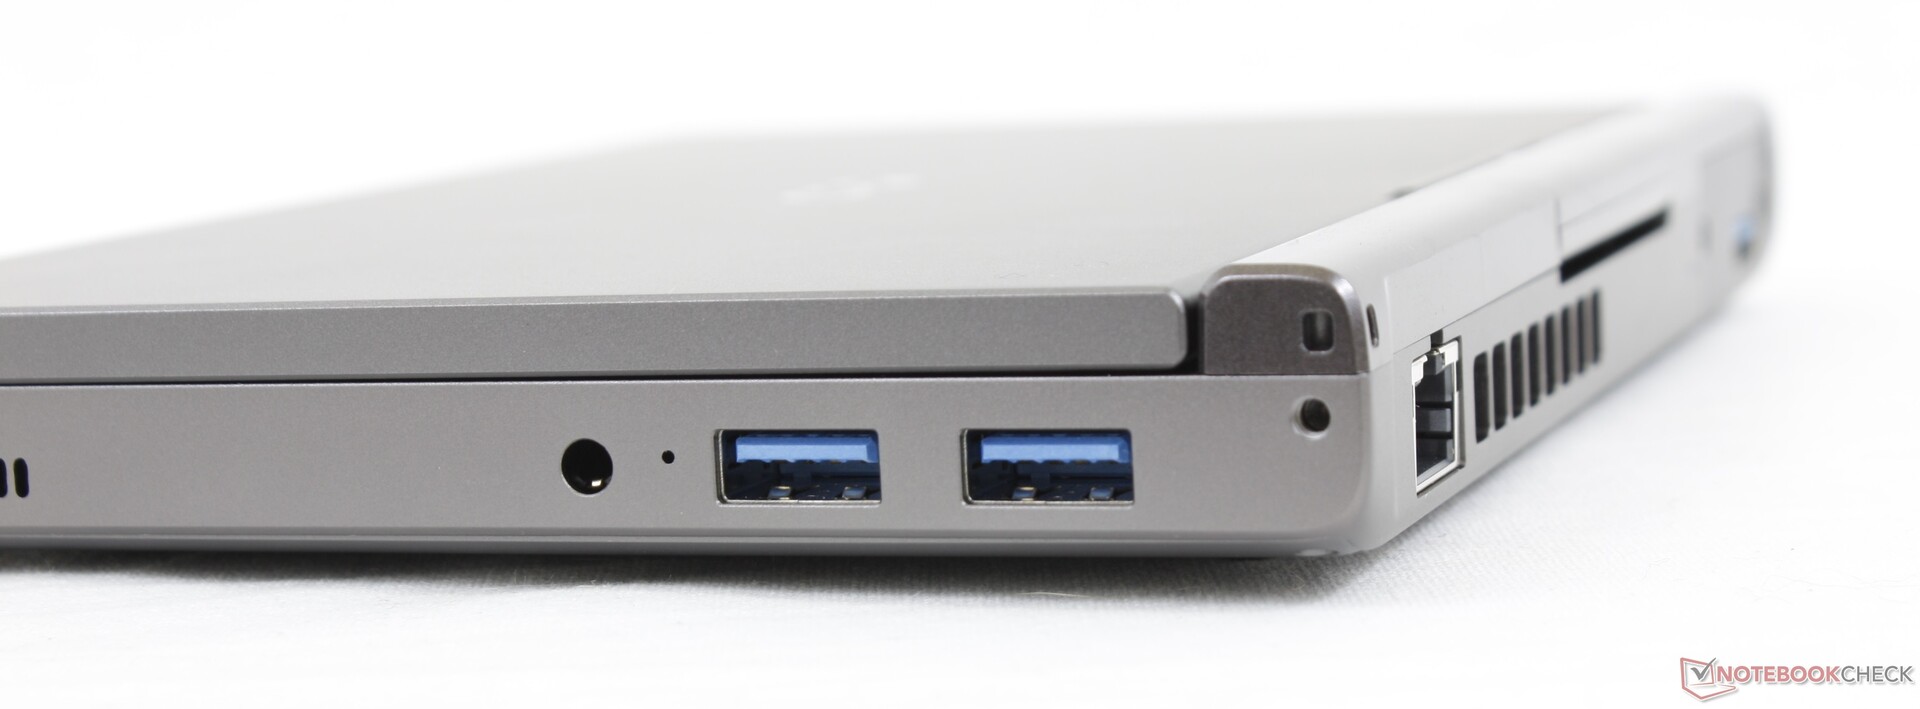
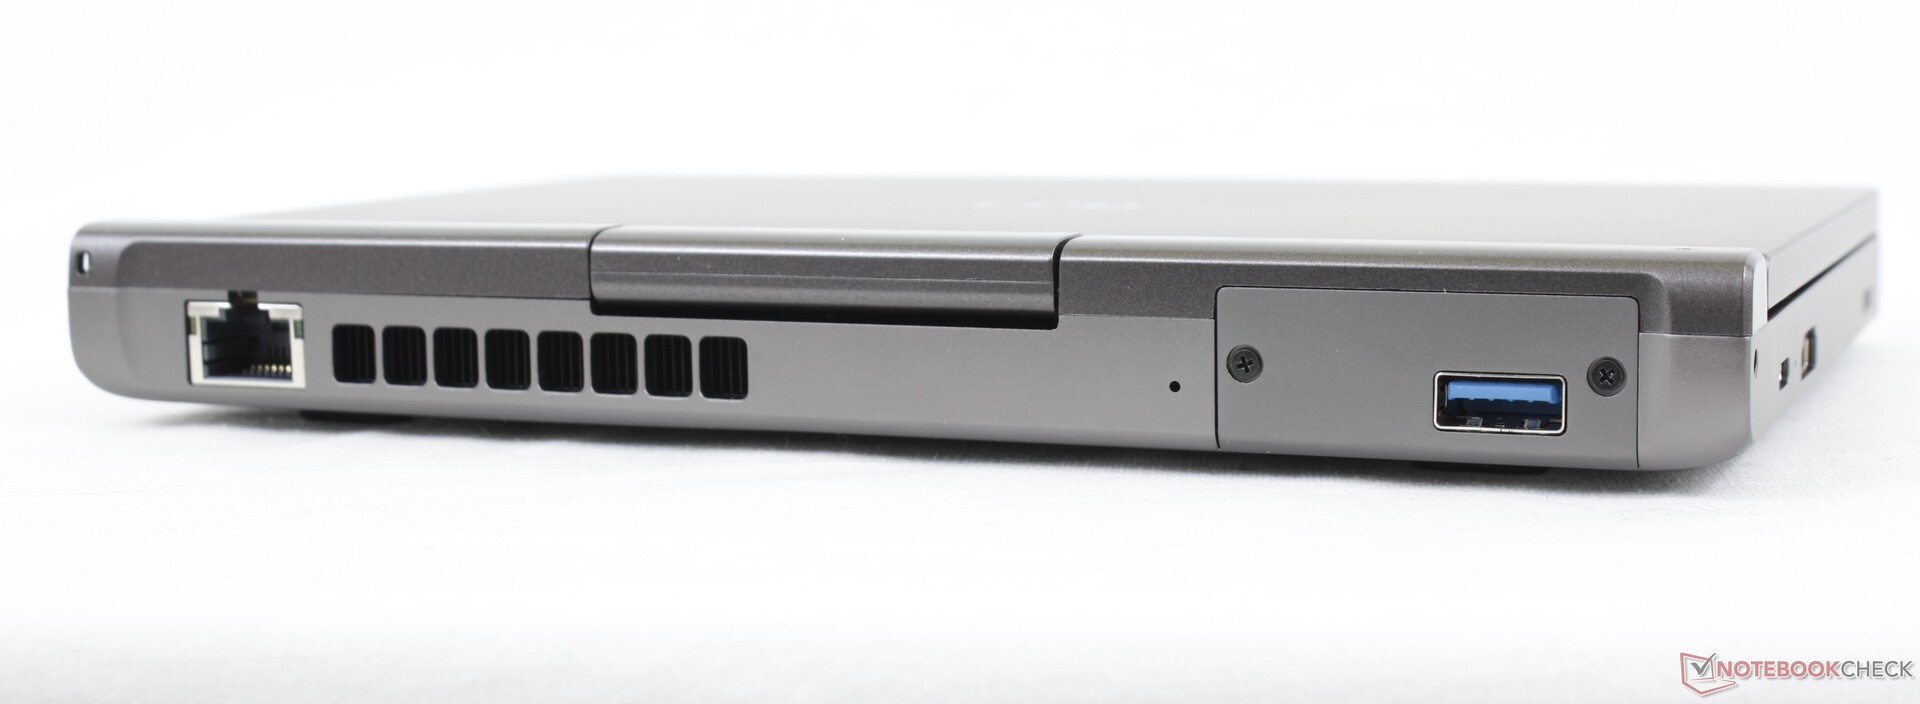
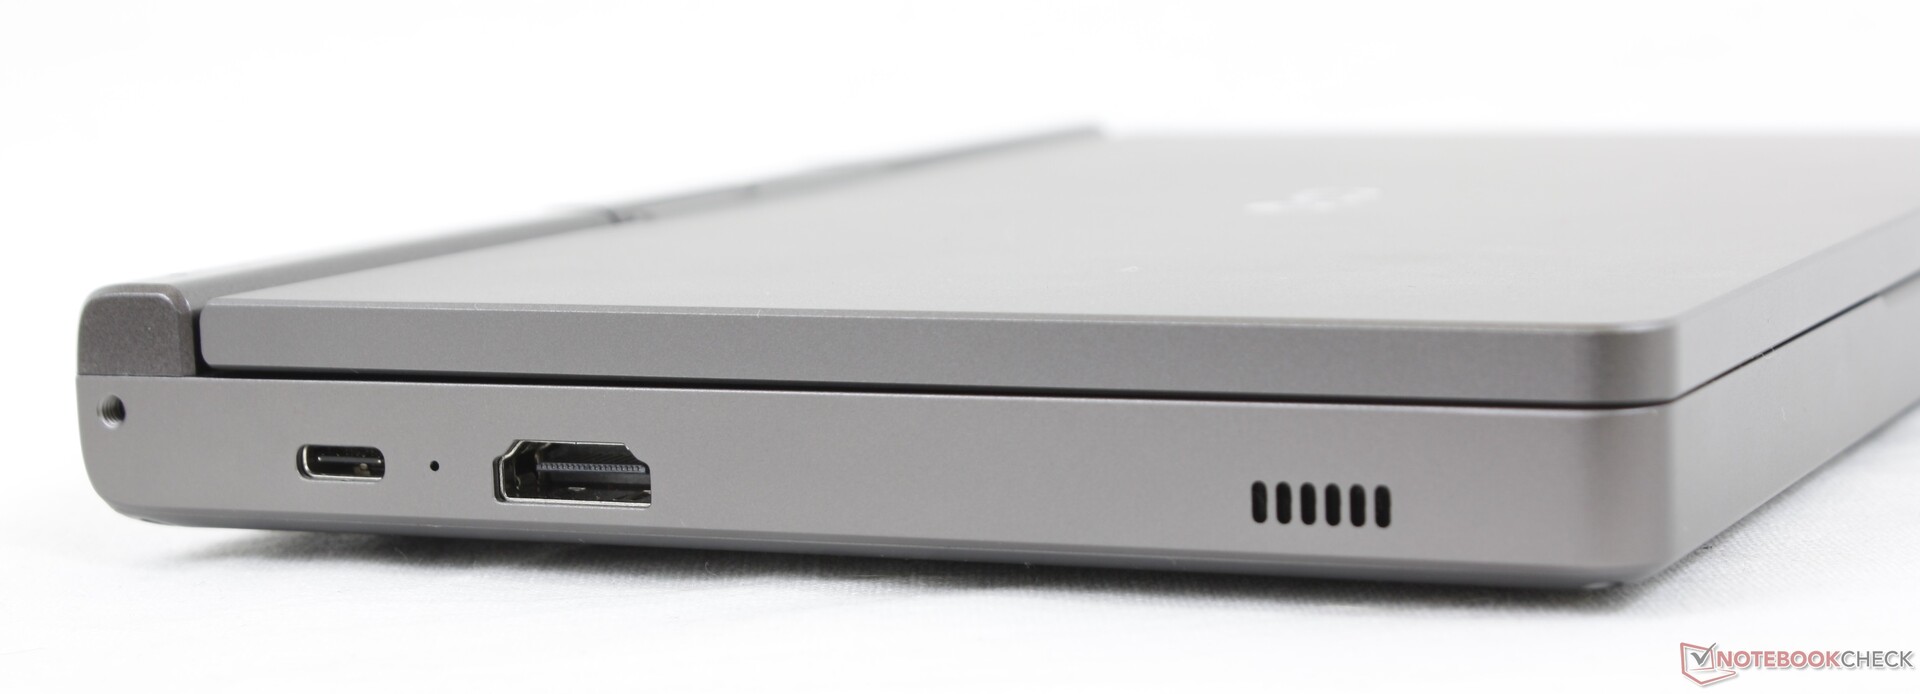
Connectivity — Needs More USB-C Ports
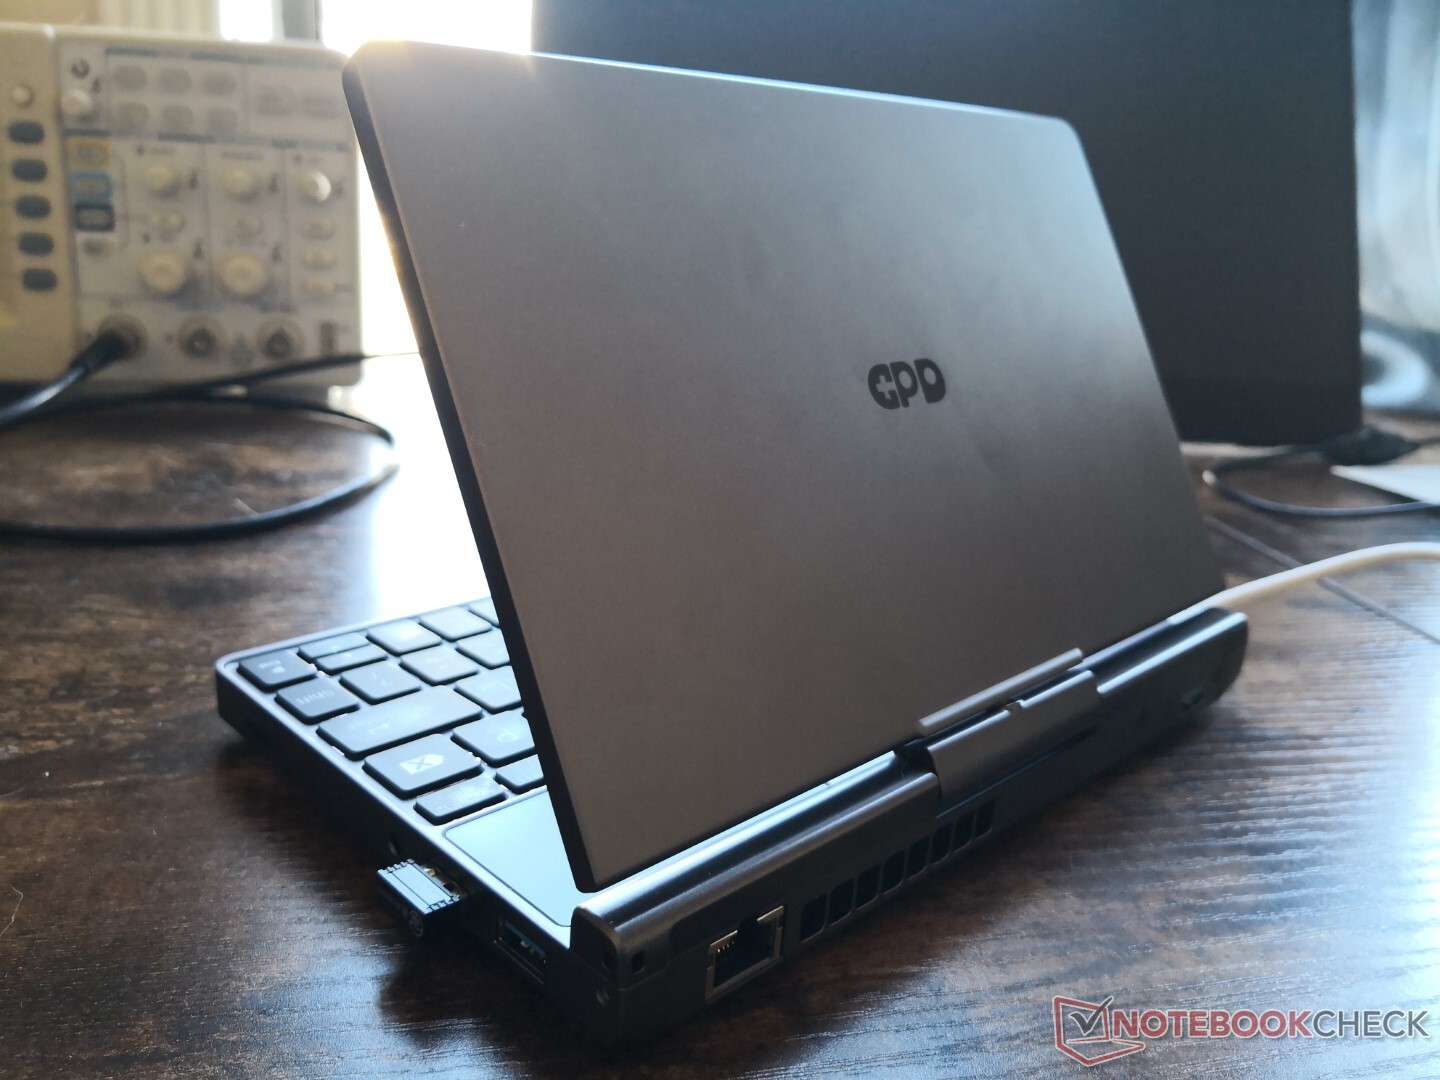
Port options are varied save for one annoying limitation: there is just a single USB-C port for both Thunderbolt 4 and charging. Attaching external monitors, docking stations, or external graphics may therefore prevent you from charging the Pocket 3 if said devices do not support USB charging passthrough. The lesser Pentium Pocket 3 SKU does not come with Thunderbolt support.
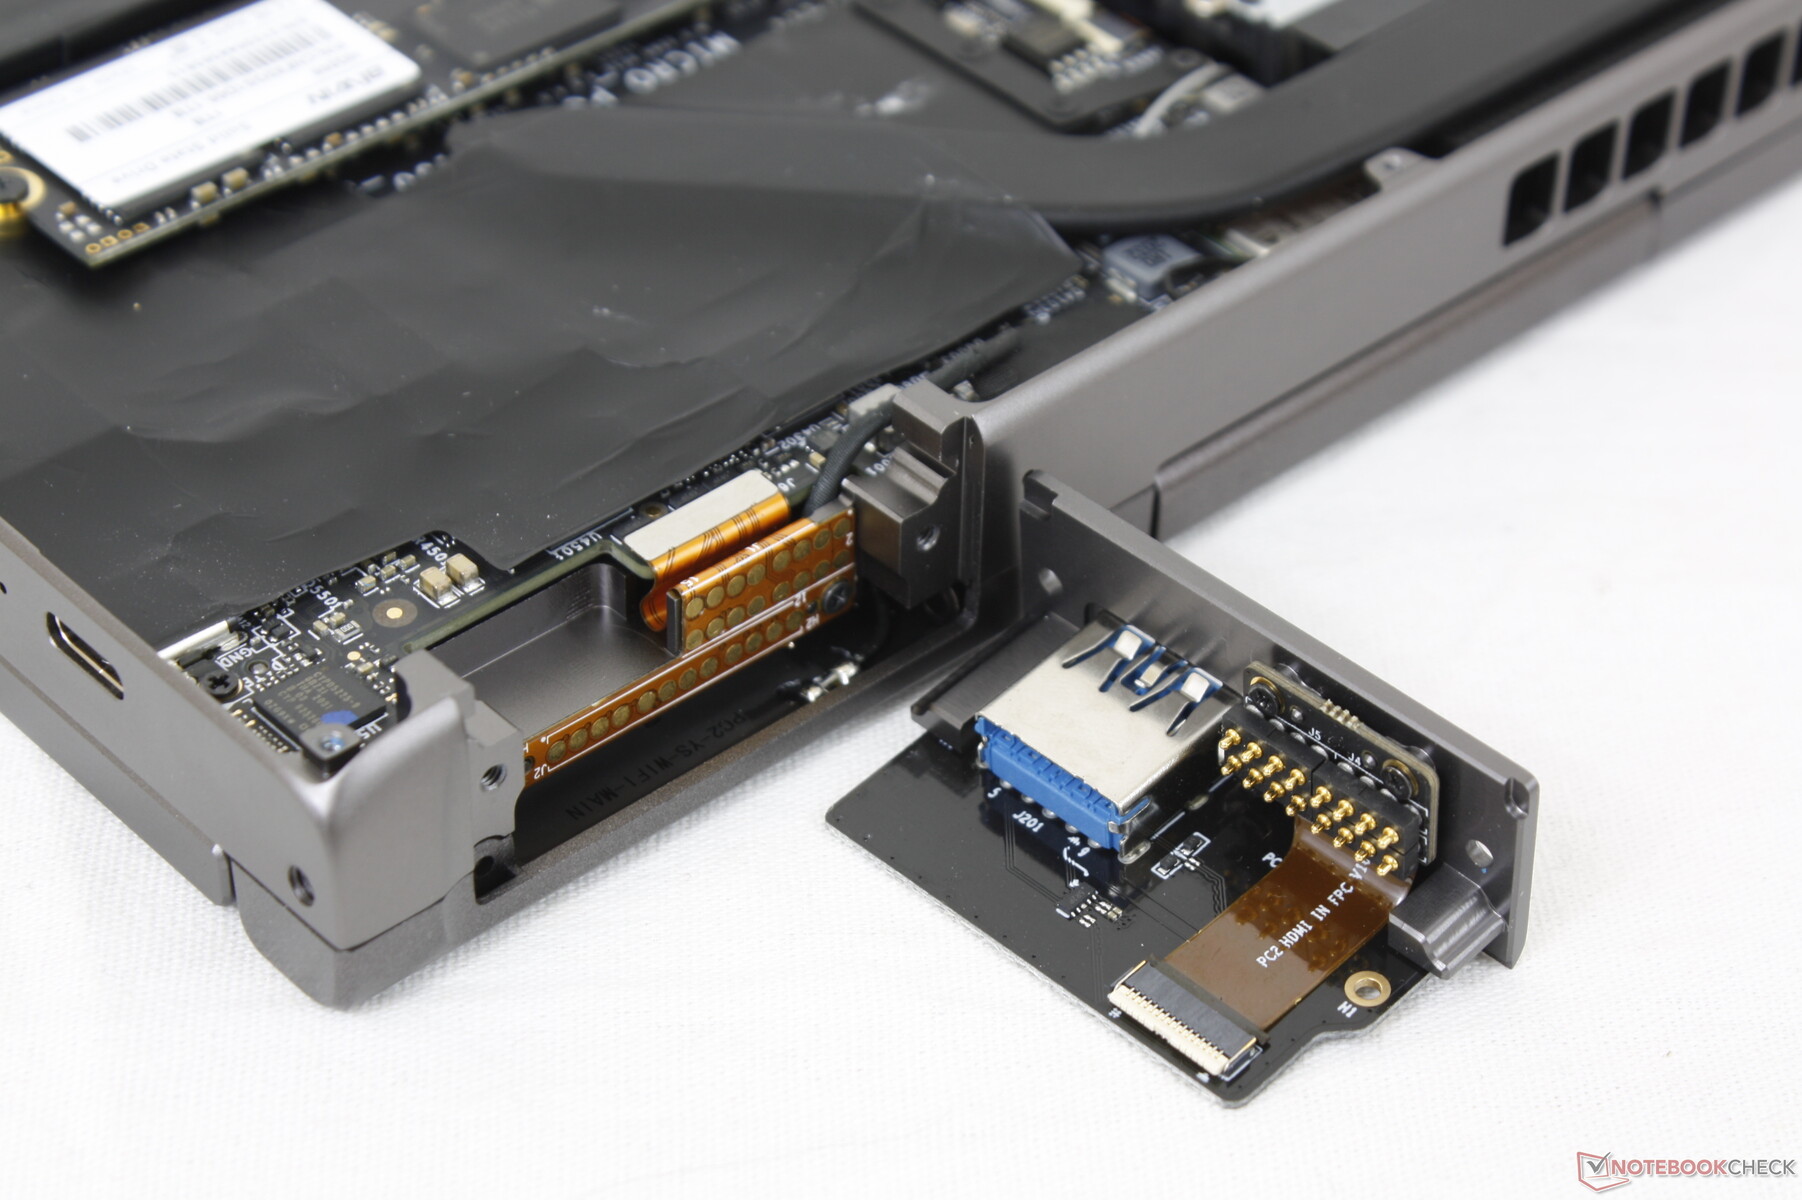
Unique to the Pocket 3 is its KVM port which can be converted to HDMI-in or USB-in as shown in the picture to the right. Users would then be able to to control external devices with the integrated Pocket 3 keyboard or use the internal display for external hosts.
Though our pre-production test unit doesn't include one, GPD says retail models will integrate a MicroSD card reader.
Communication
Webcam — Off-Centered
Image quality from the 2 MP webcam is sharper than on many other laptops, but color accuracy remain poor. The webcam is also off-centered as it is on the top left corner of the display instead of the top center. There is no webcam shutter or IR camera, either.


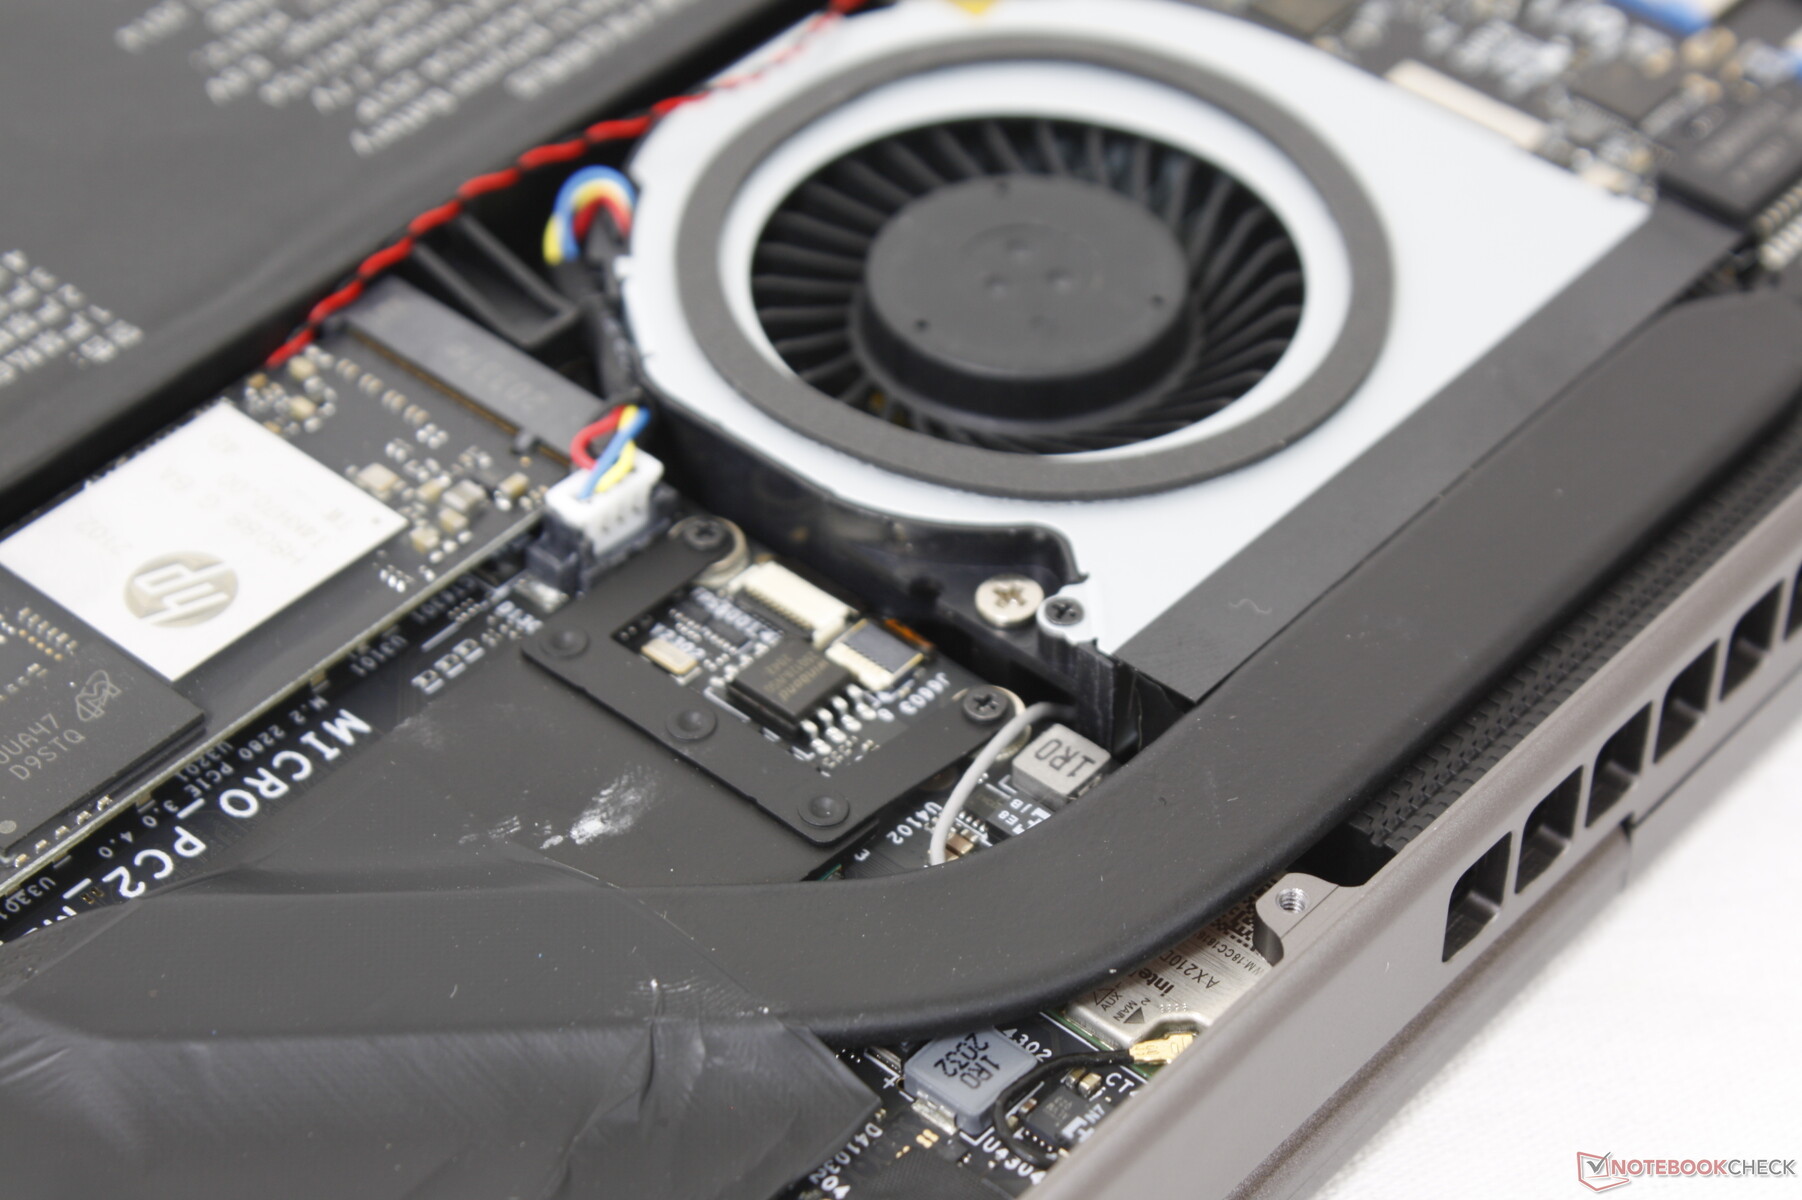
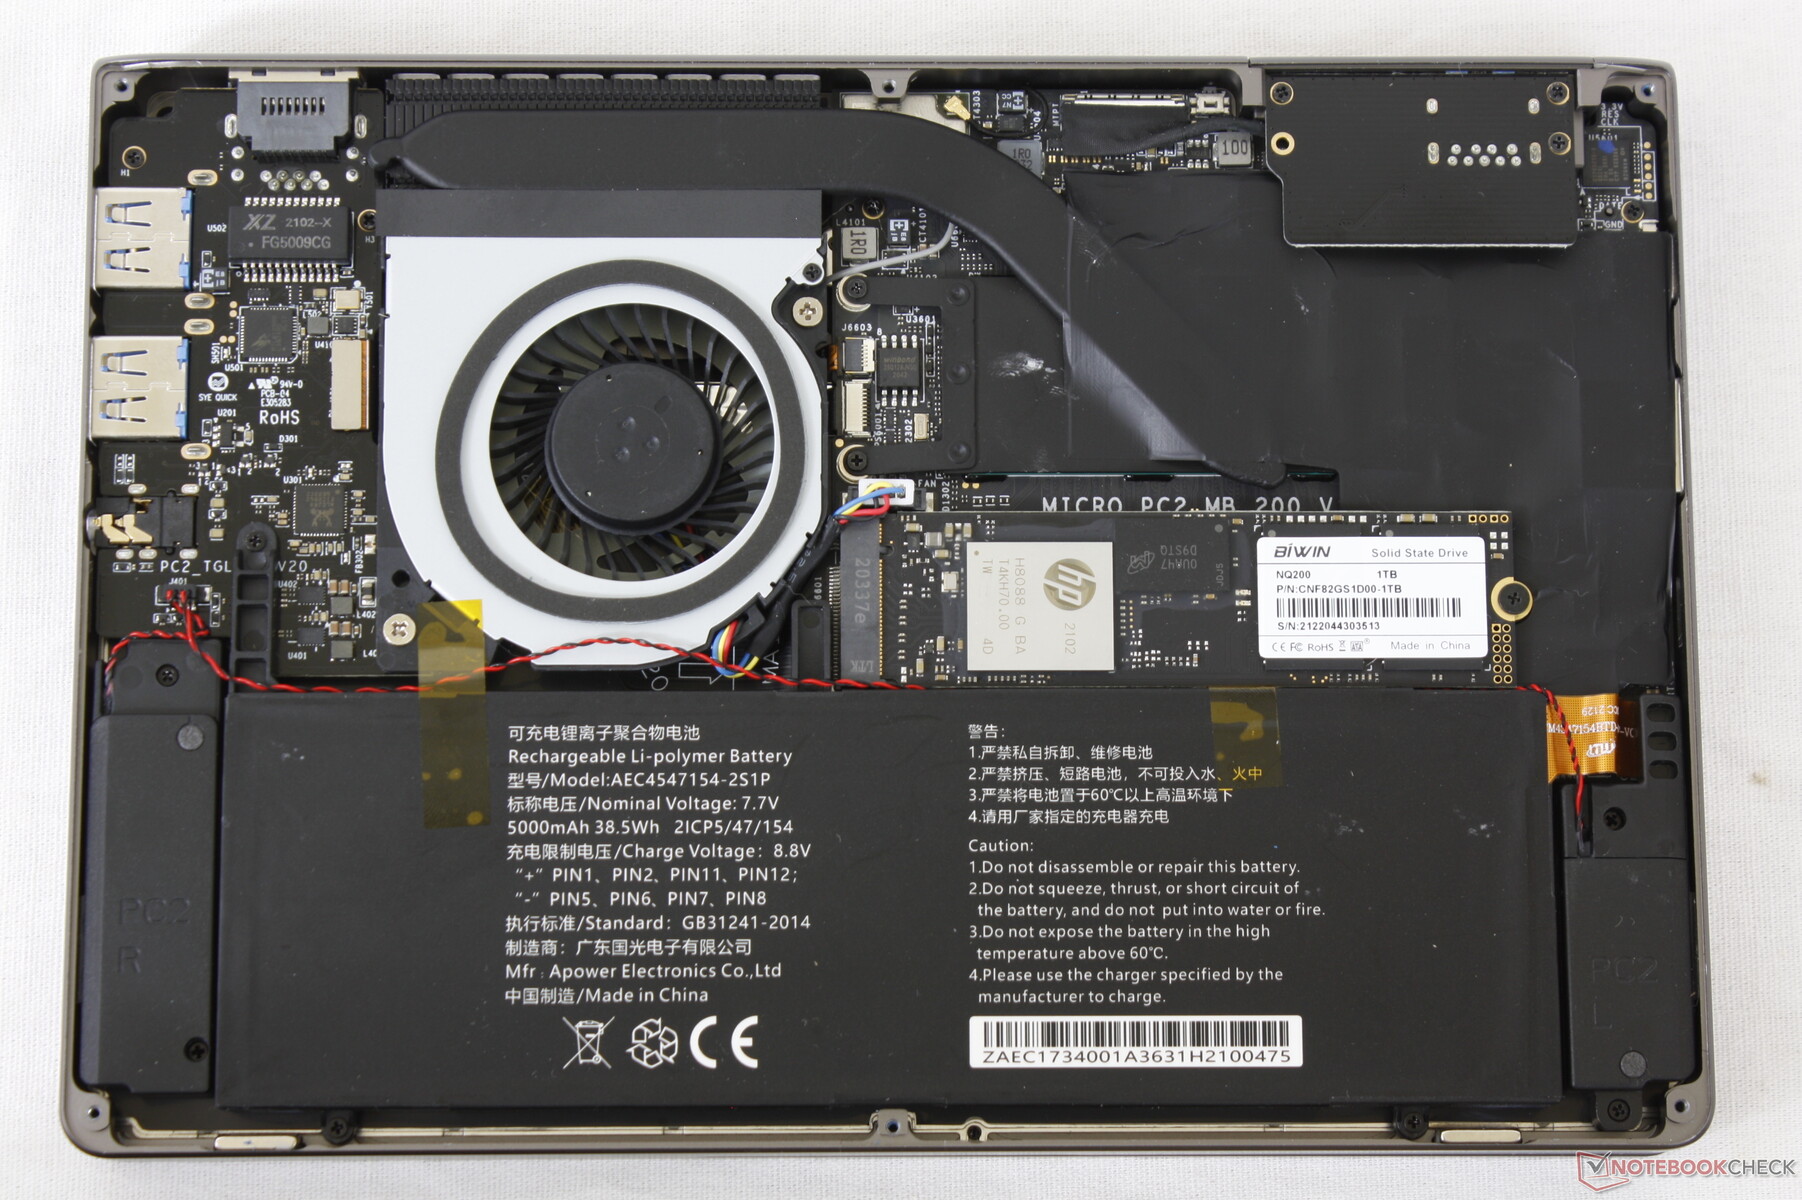
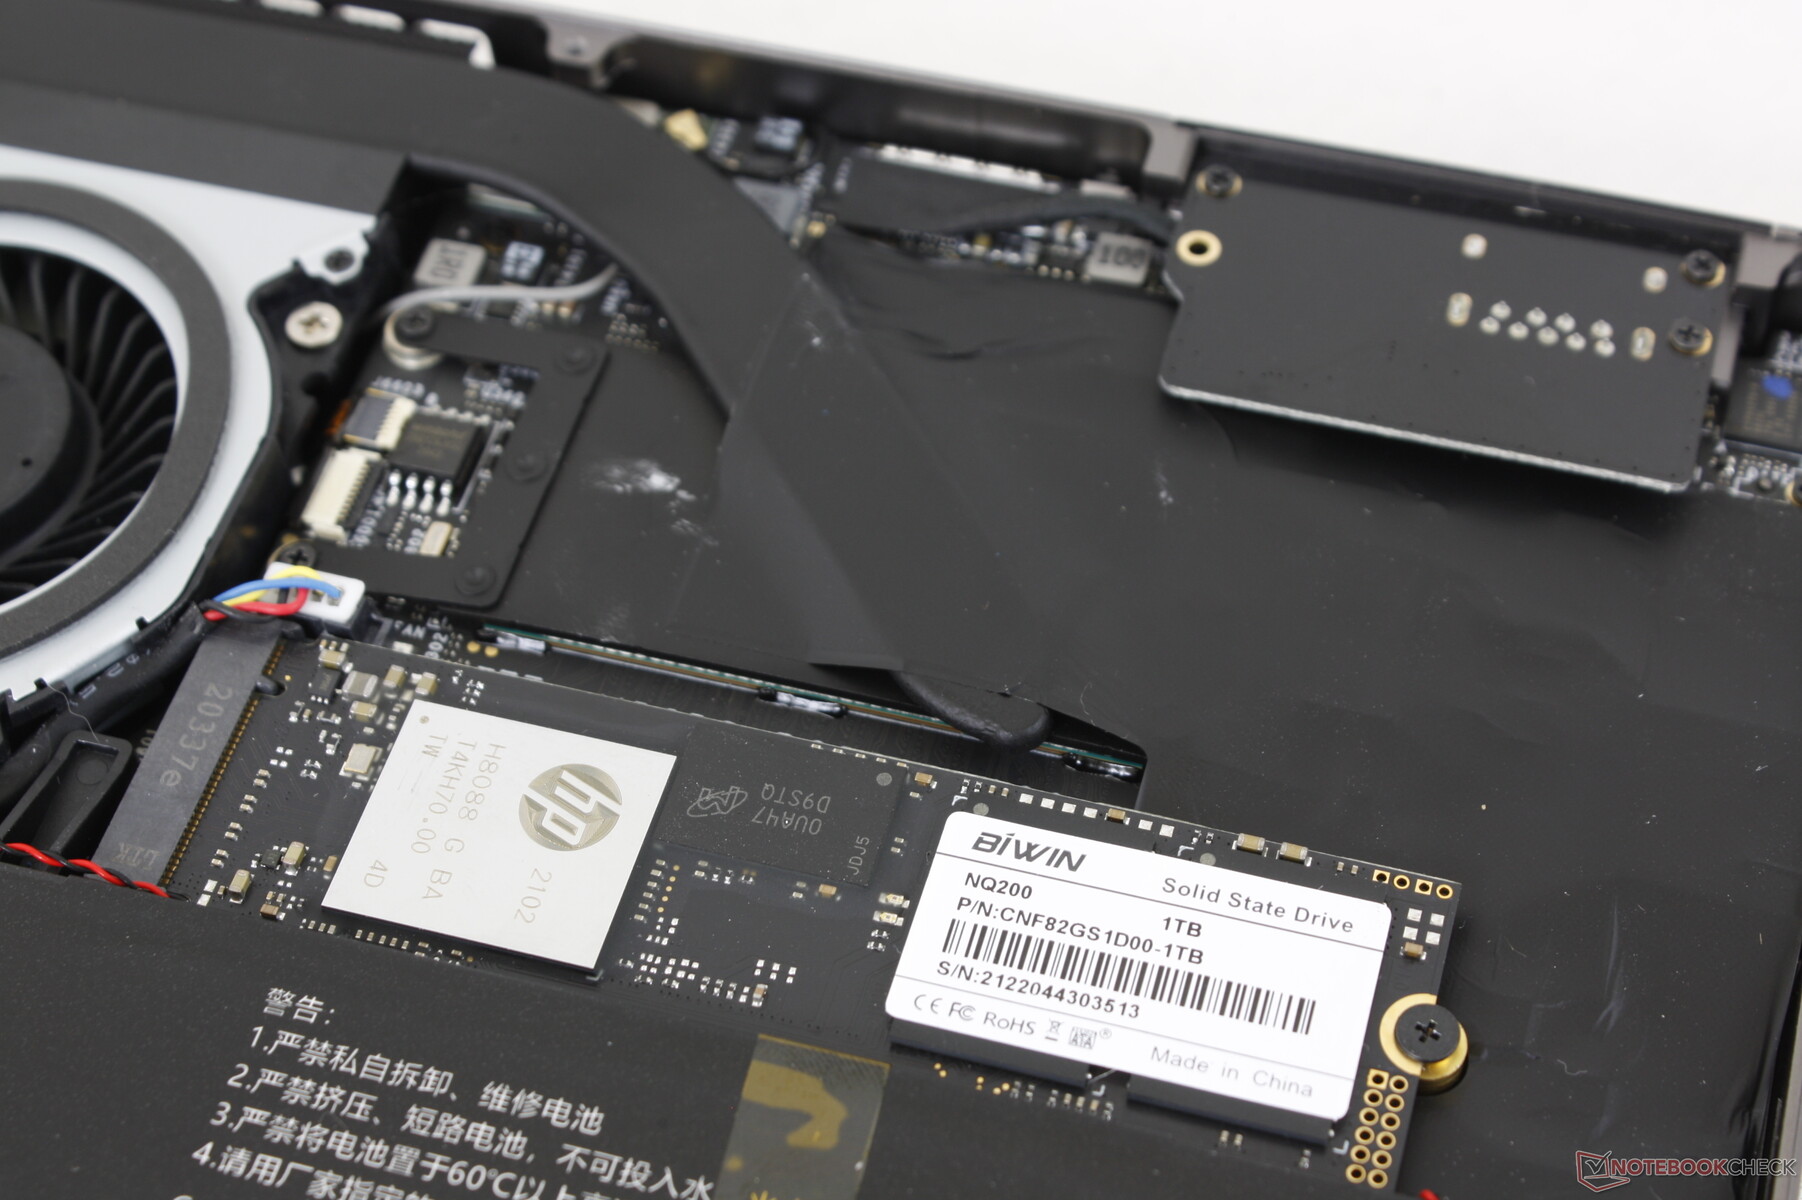
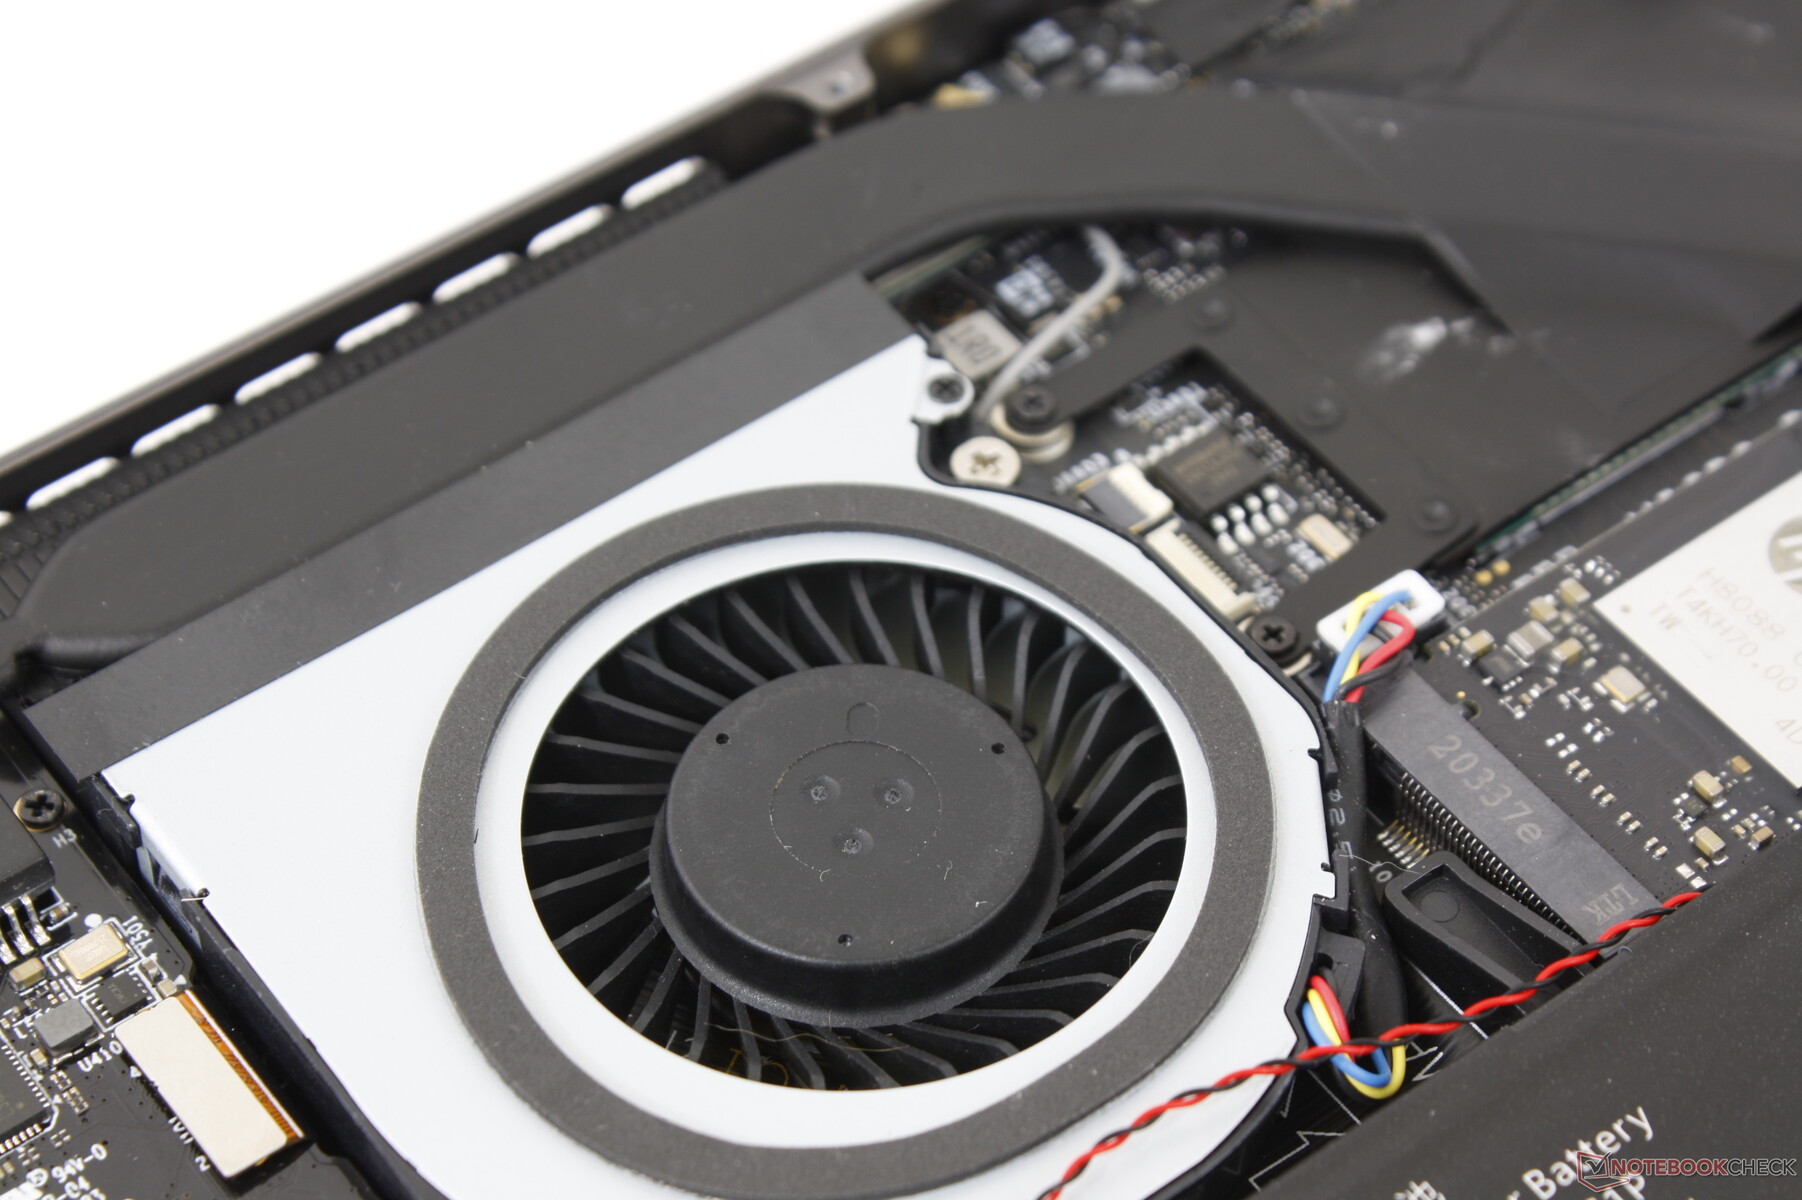
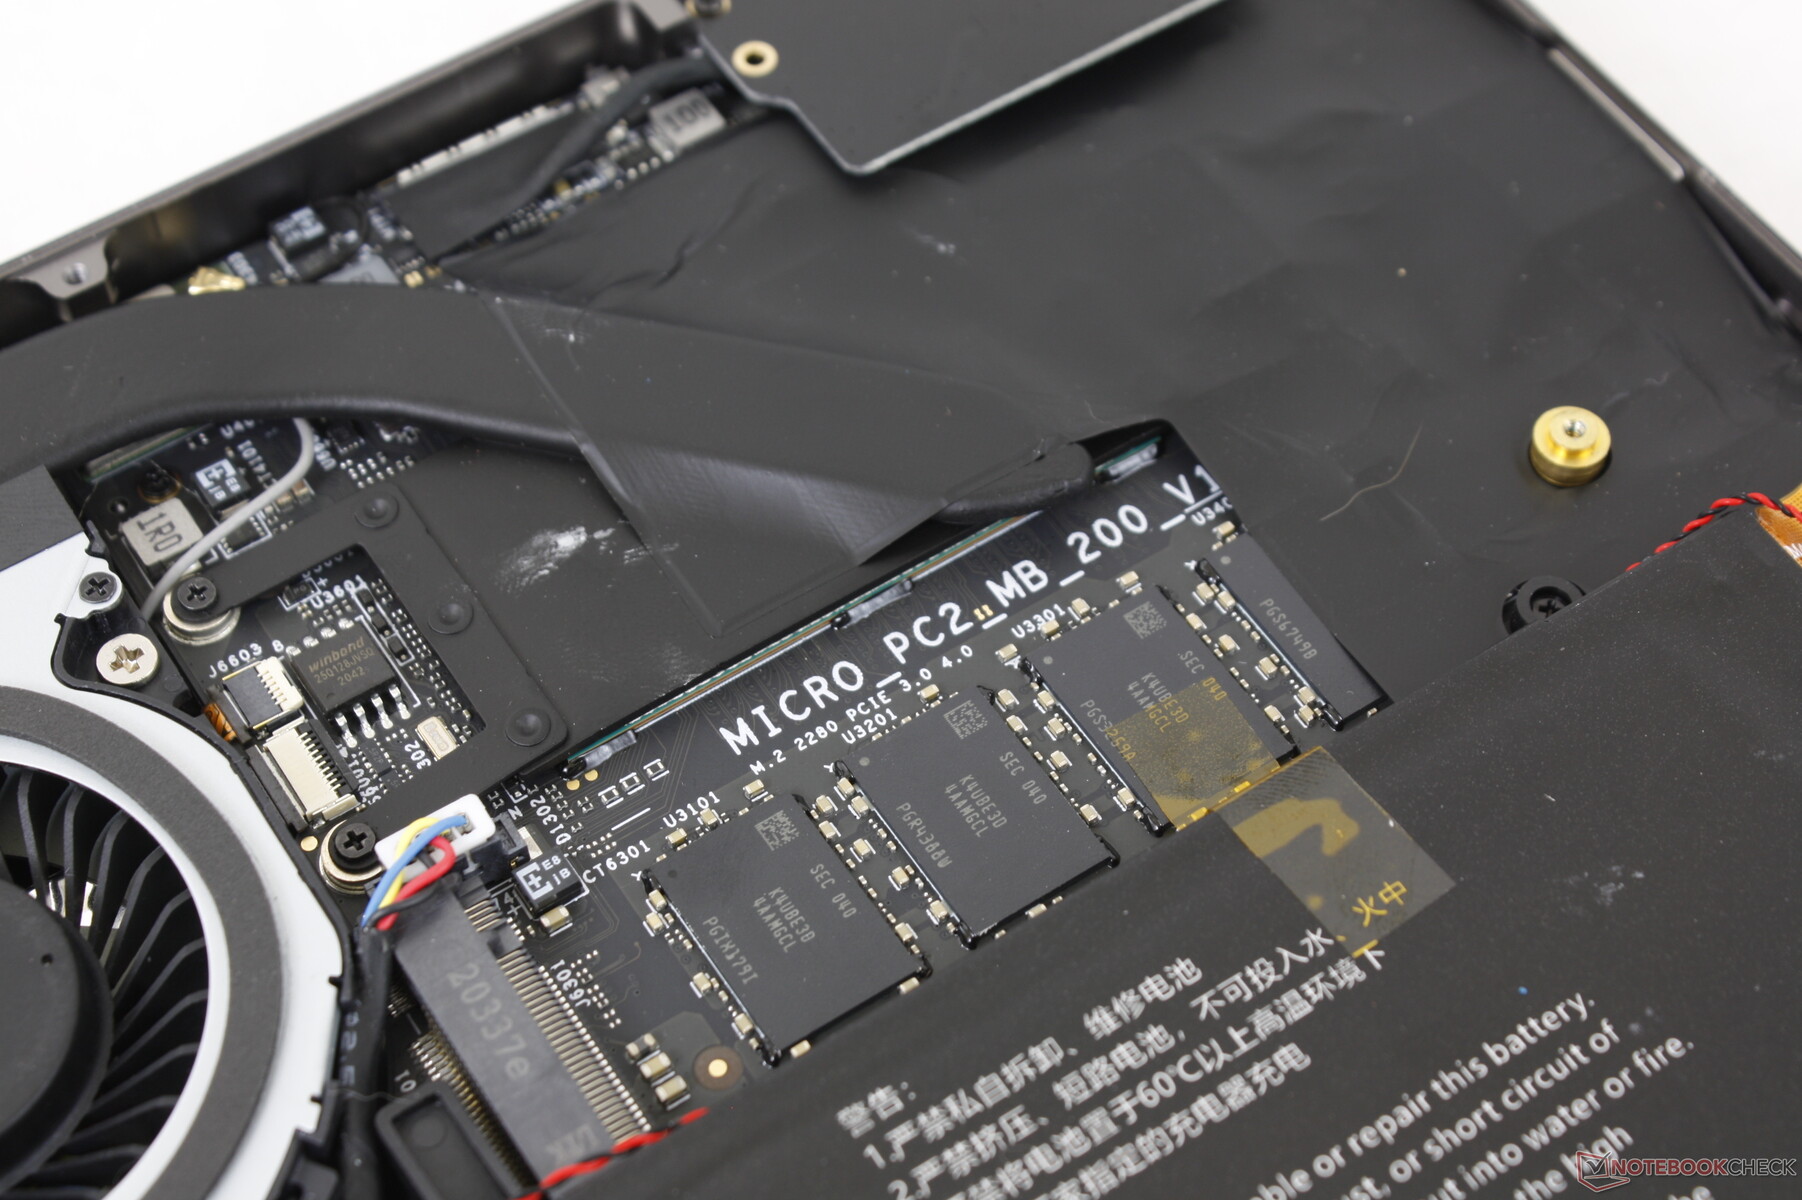
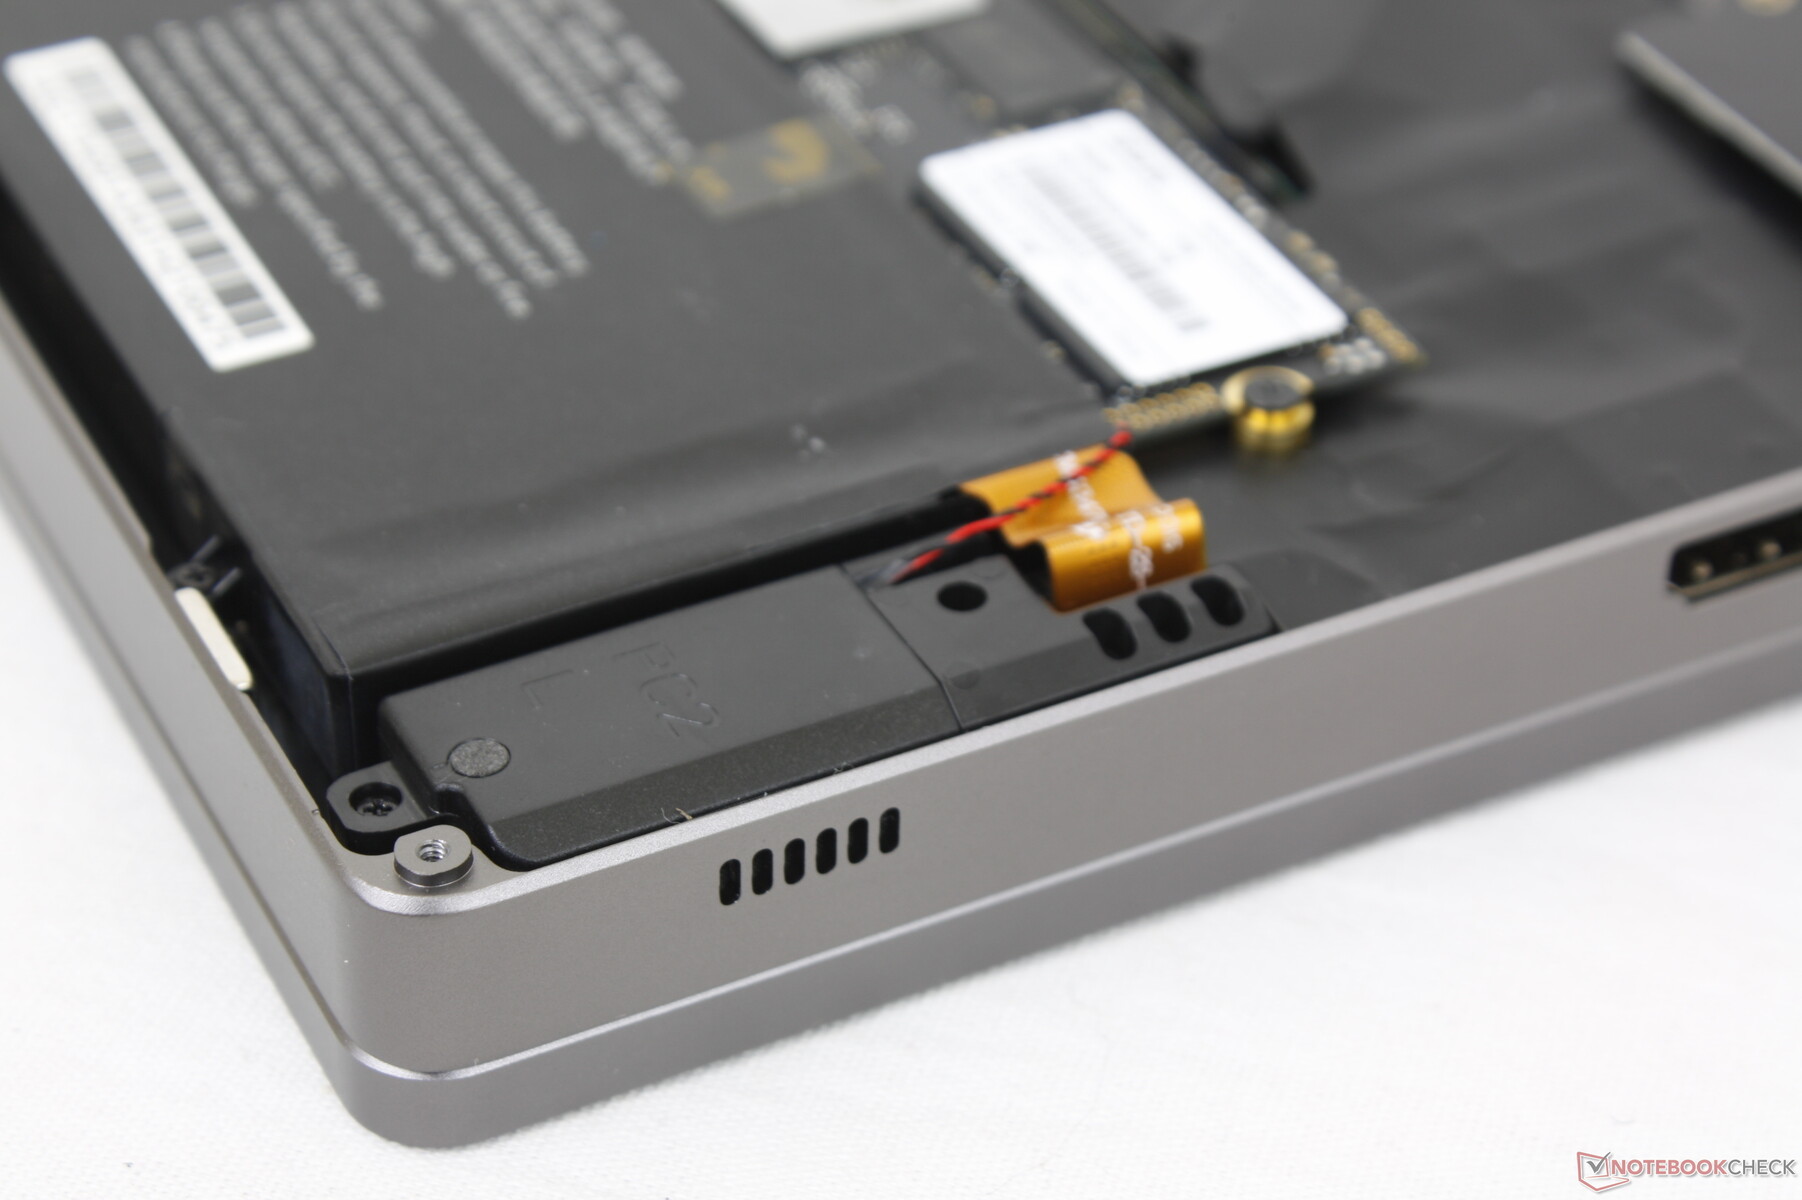
Maintenance
Bottom panel can be easily removed with just a Philips screwdriver. Only the M.2 SSD and battery can be serviced.
Accessories and Warranty
Removable KVM modules and an active stylus are included with certain bundles. A one-year limited warranty applies, but users will have to pay for shipping.
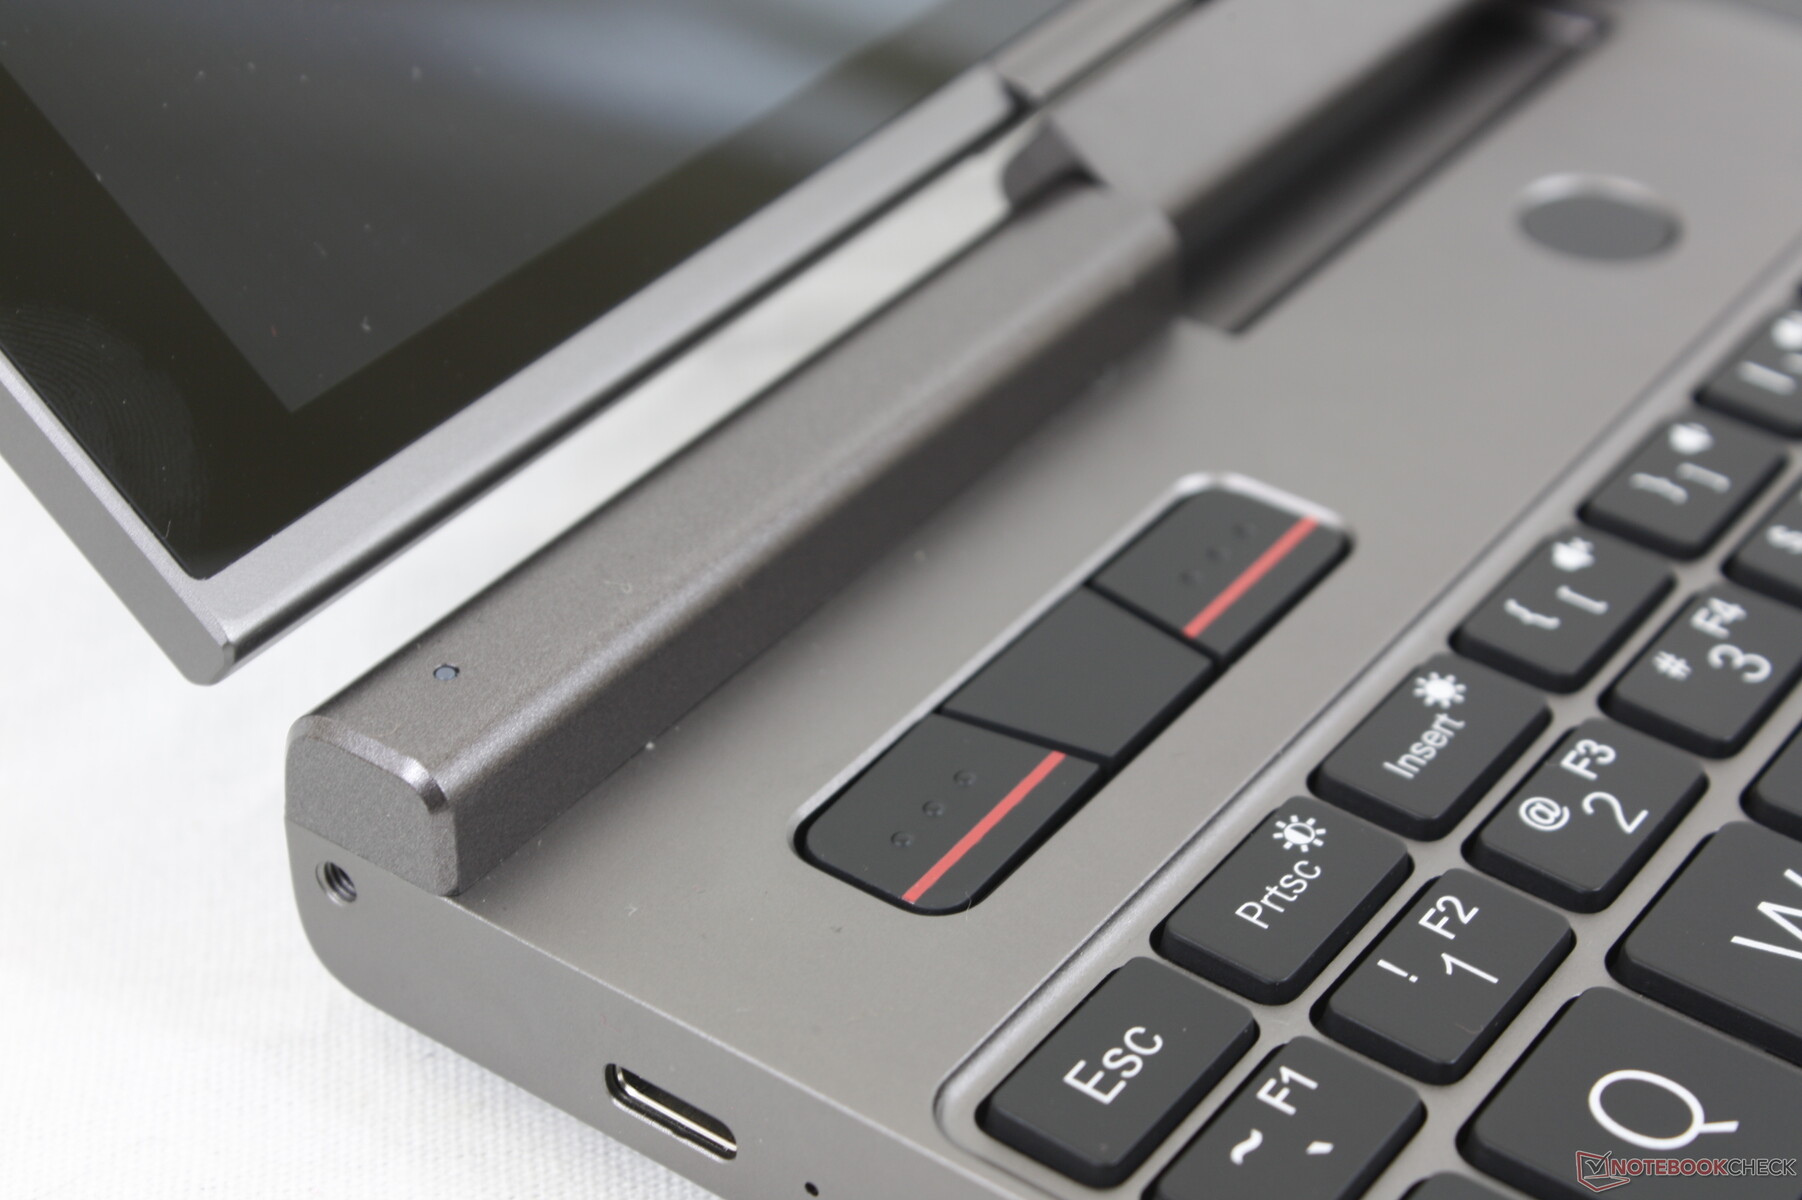
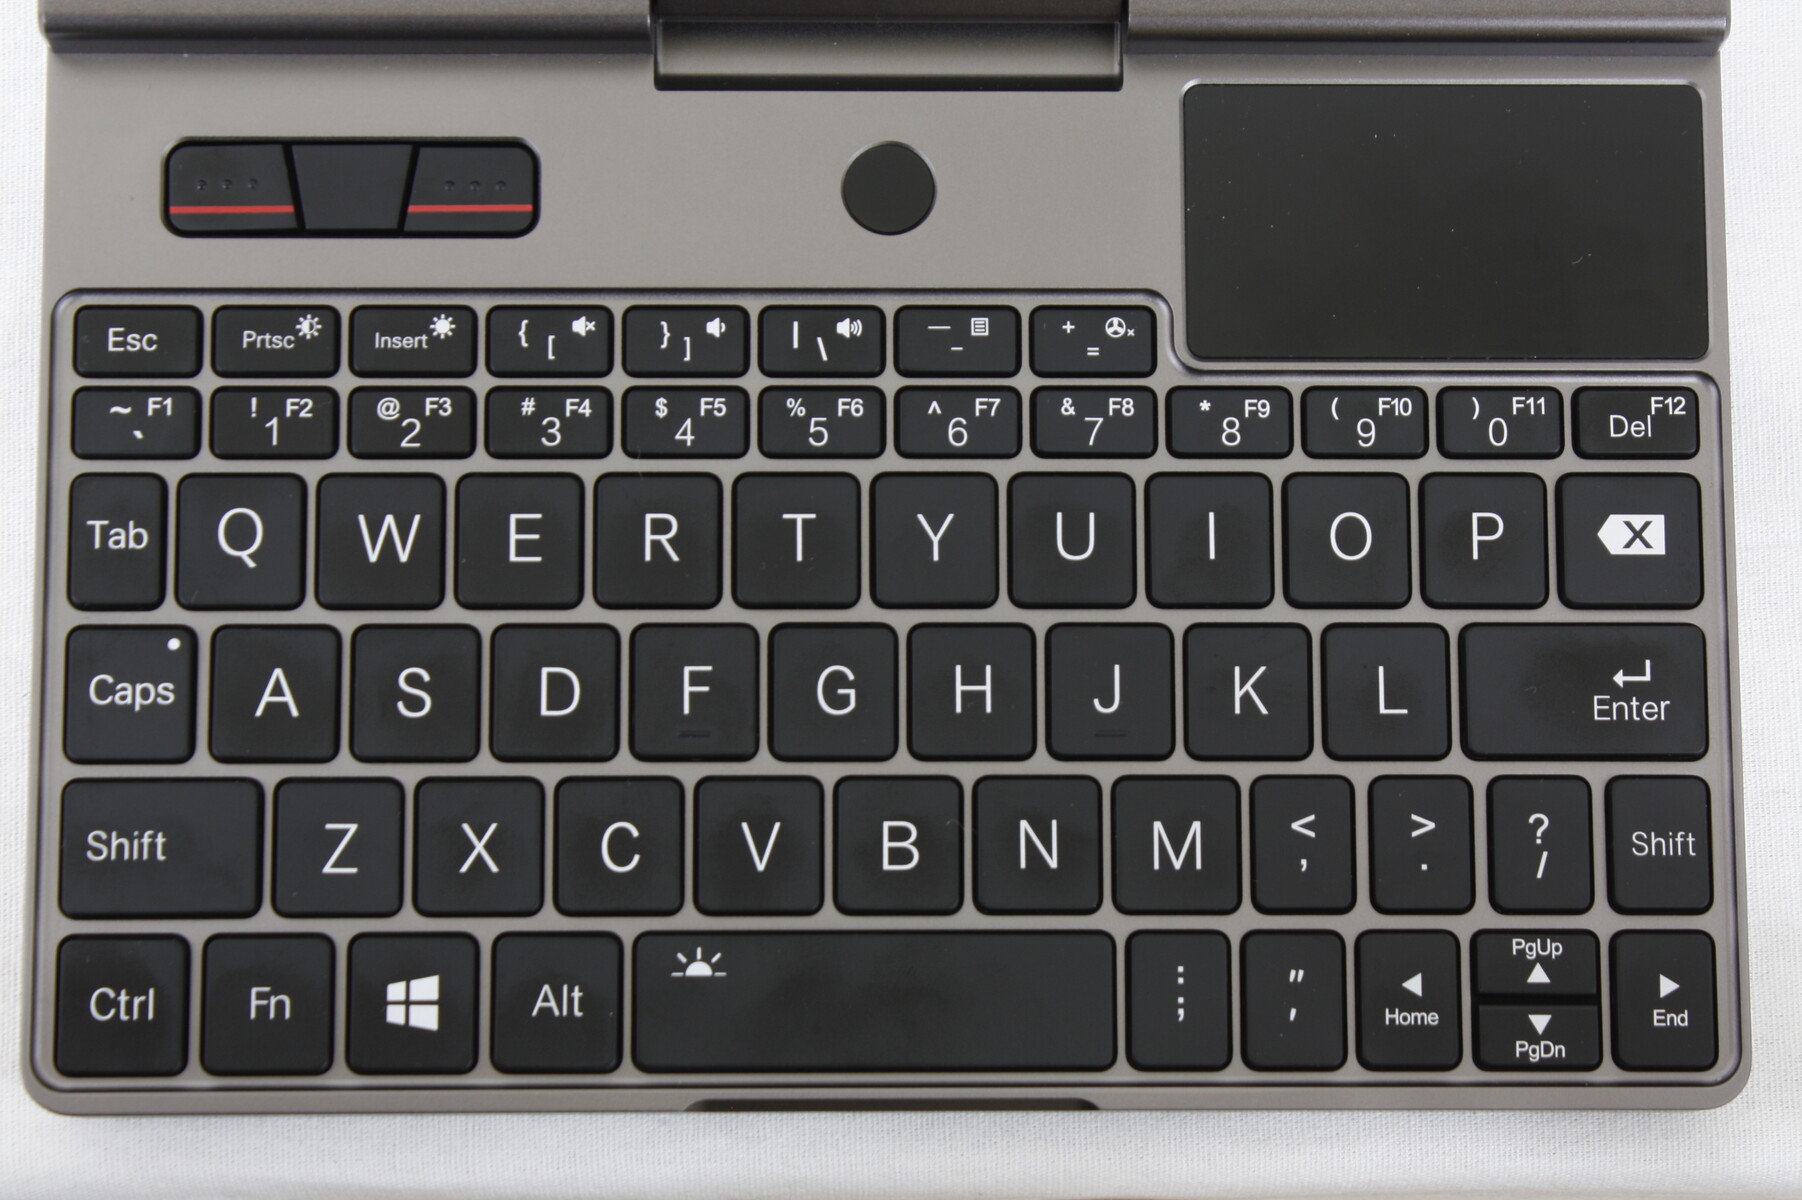
Input Devices — Surprisingly Good for the Size
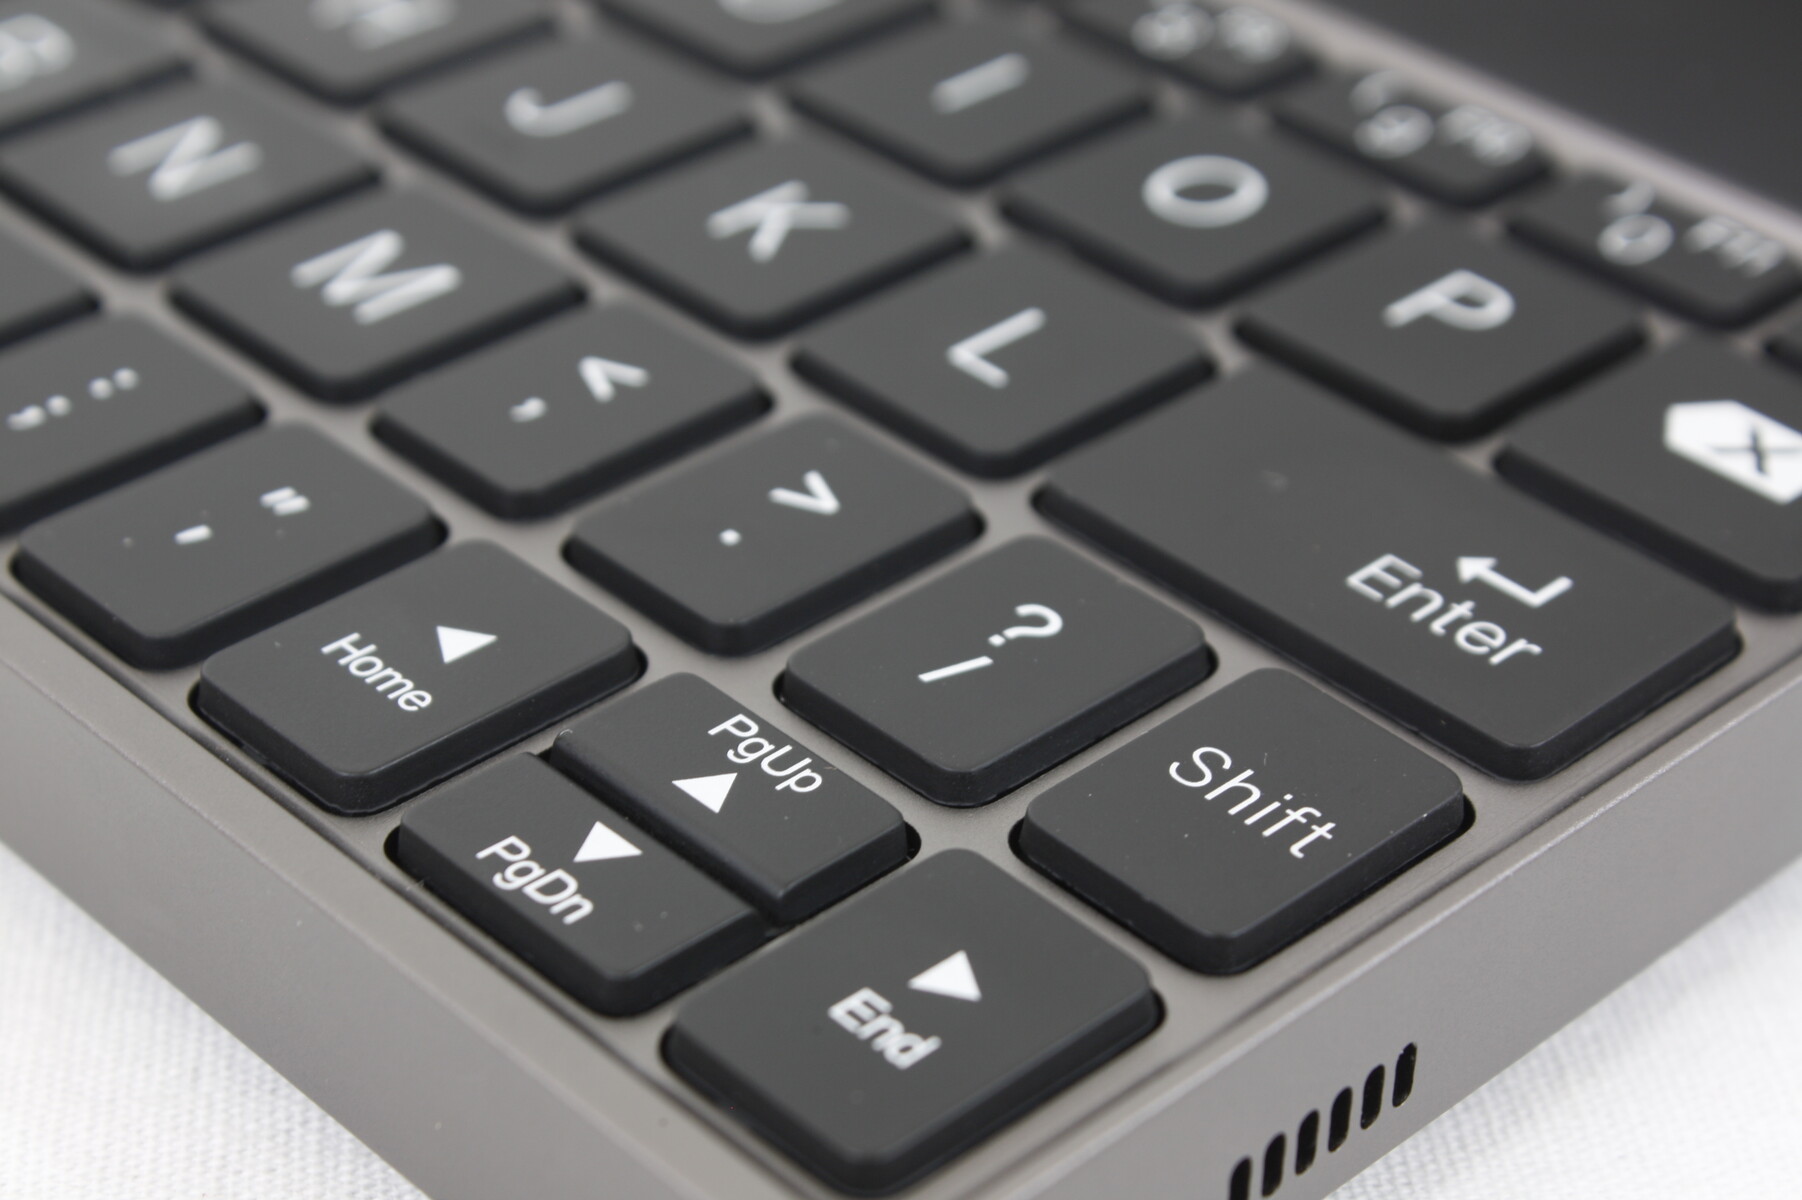
Keyboard
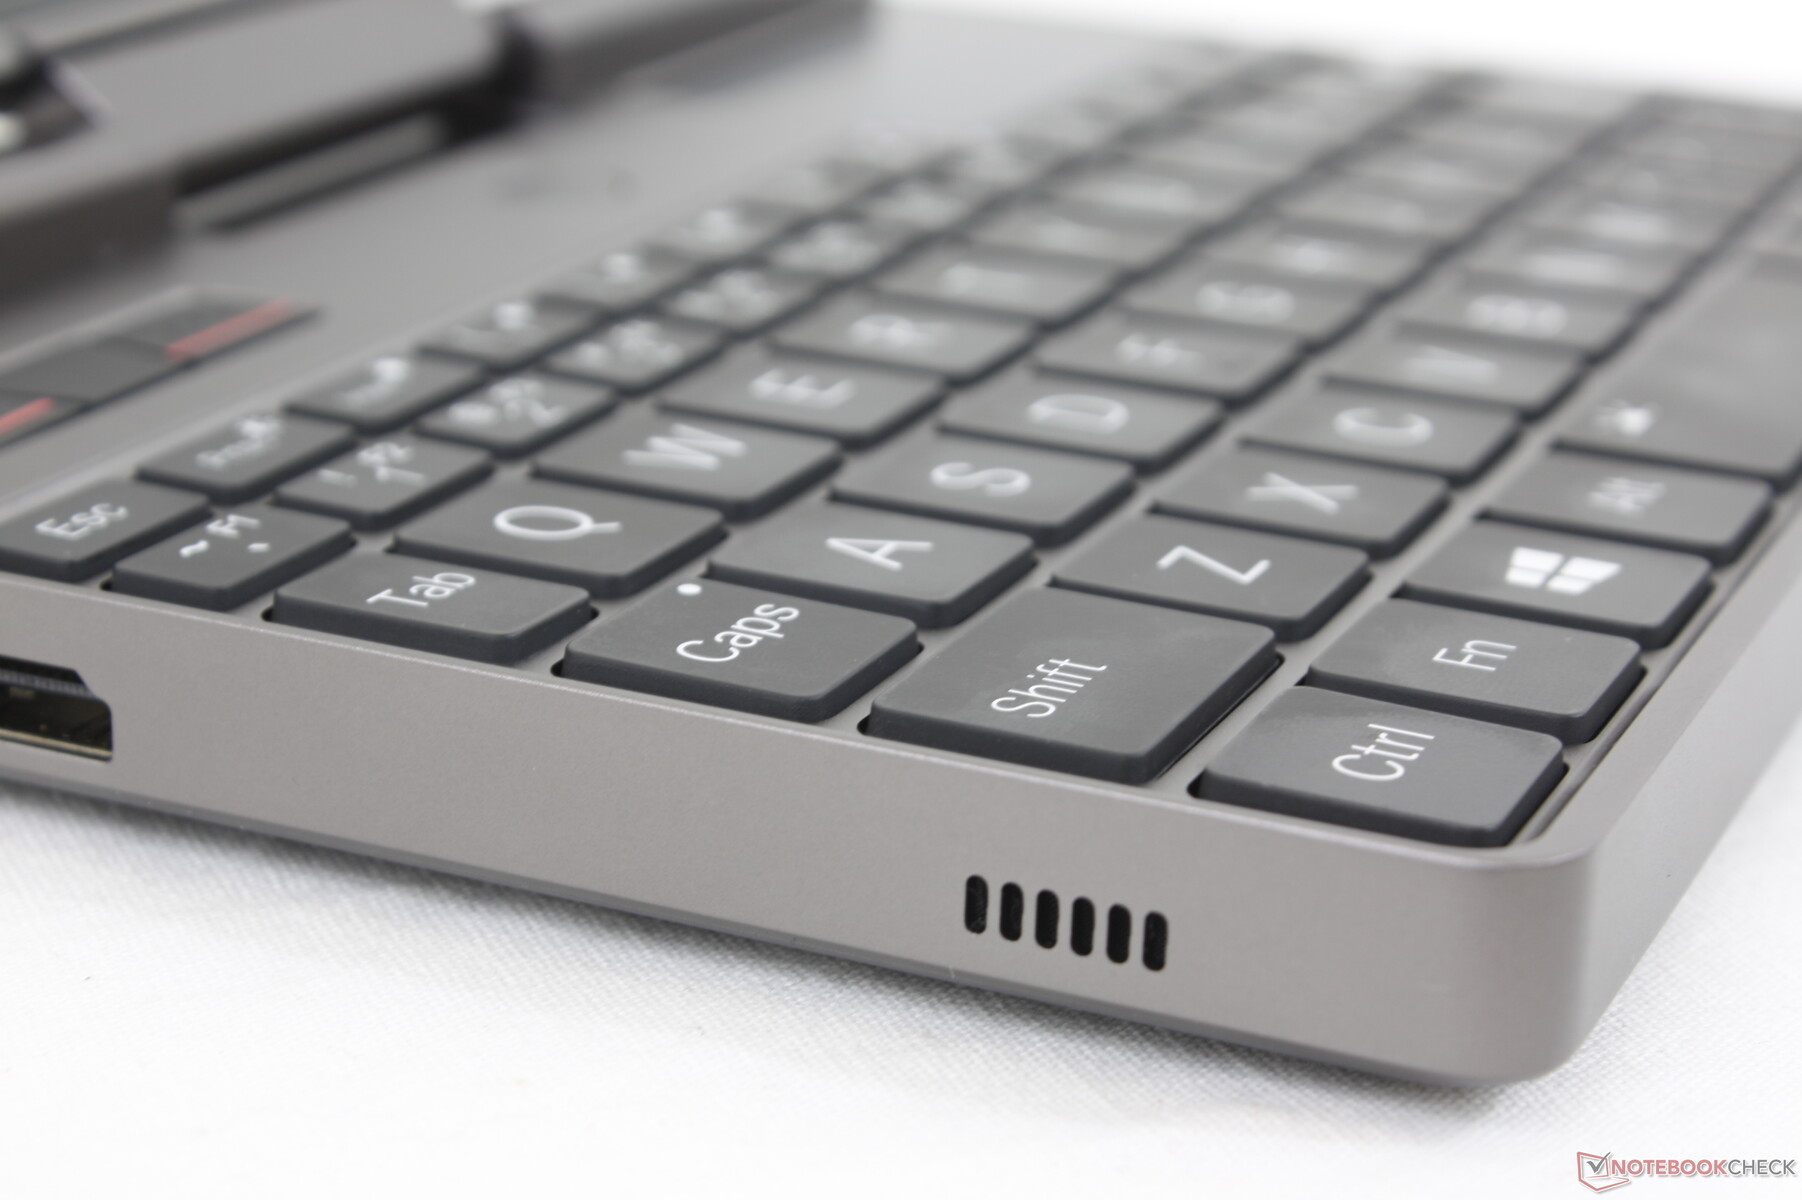
Interestingly, the keys are slightly clickier and louder than the keys on the Win Max for a relatively more comfortable typing experience. Users will have to get used to the inevitably small surface area.
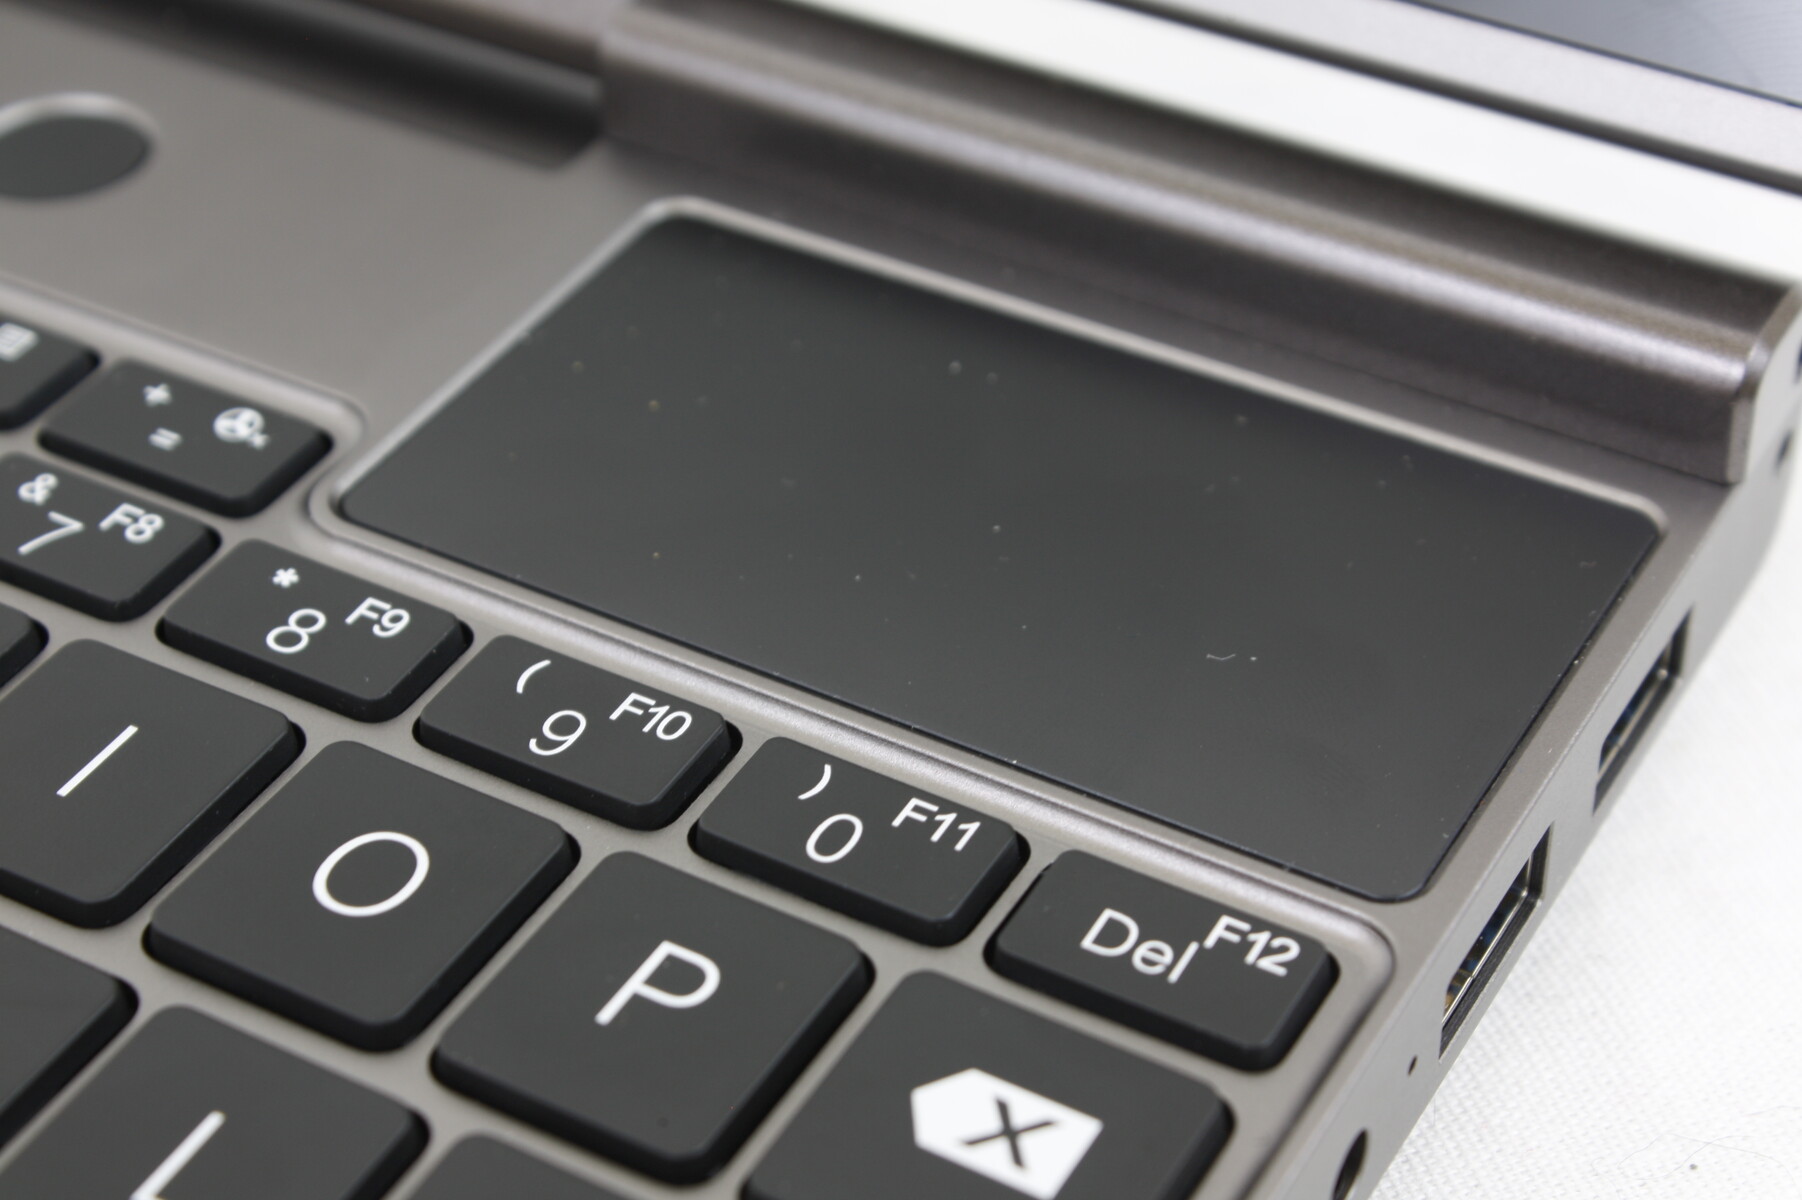
Touchpad
The small touchpad (~6.3 x 3.3 cm) works reliably and with no jumping or skipping no matter the glide speed. GPD says final retail units will have glass (frosted stalinite) touchpads instead of matte plastic on our pre-production unit. Meanwhile, the mouse keys are quiet yet firm and with decent travel when pressed.

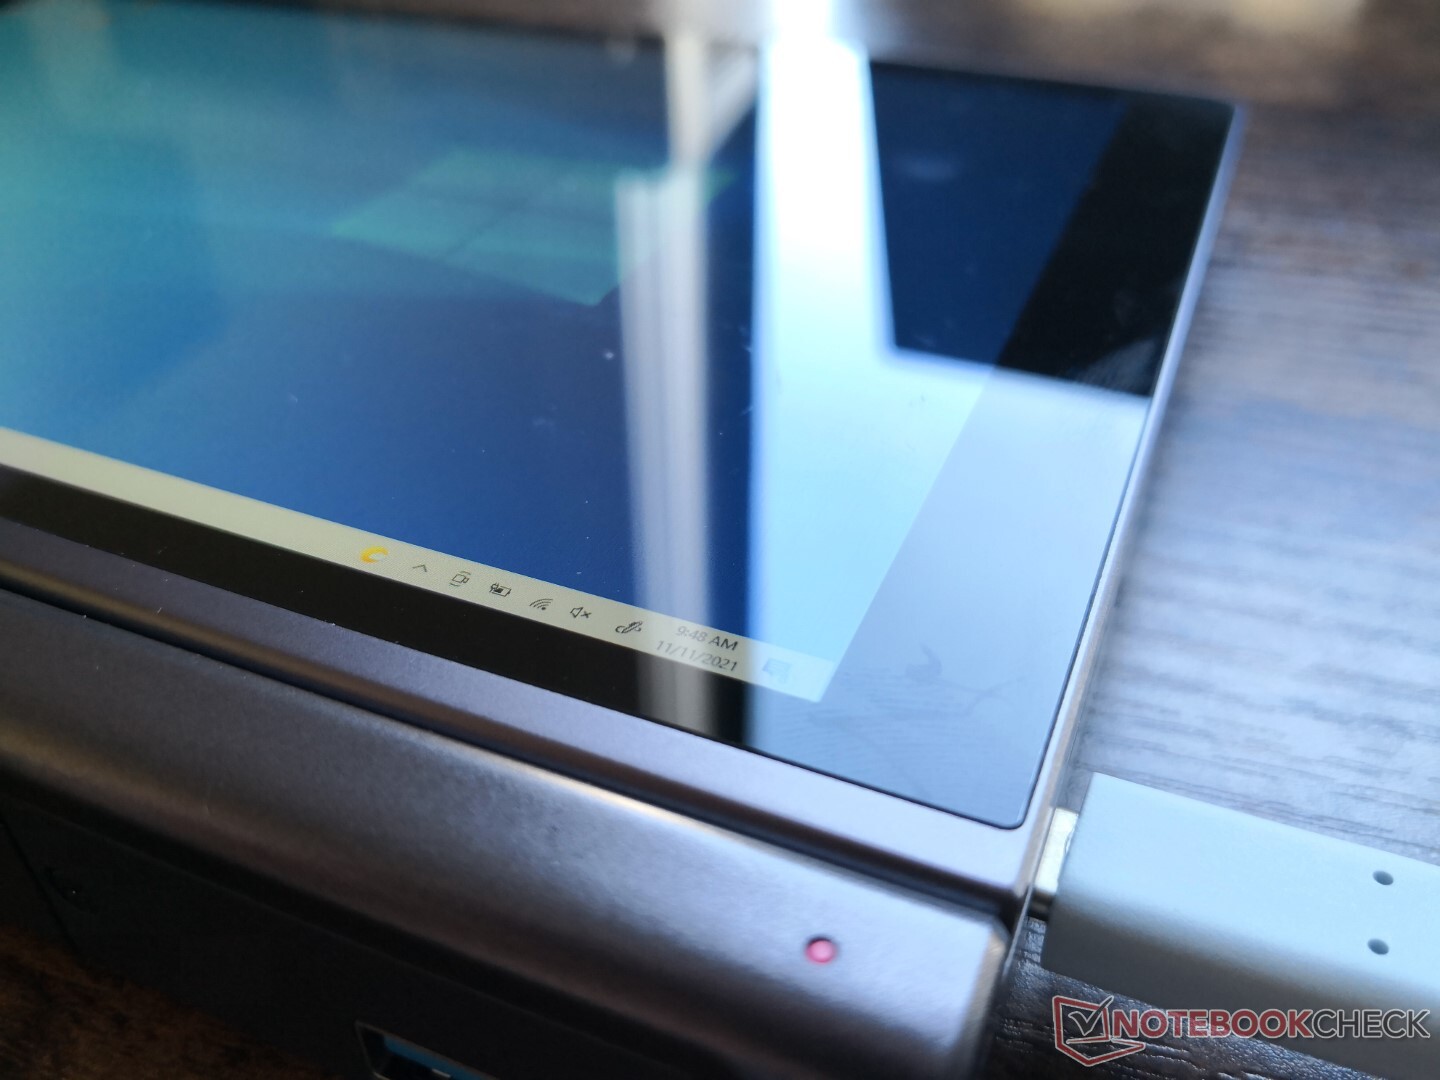
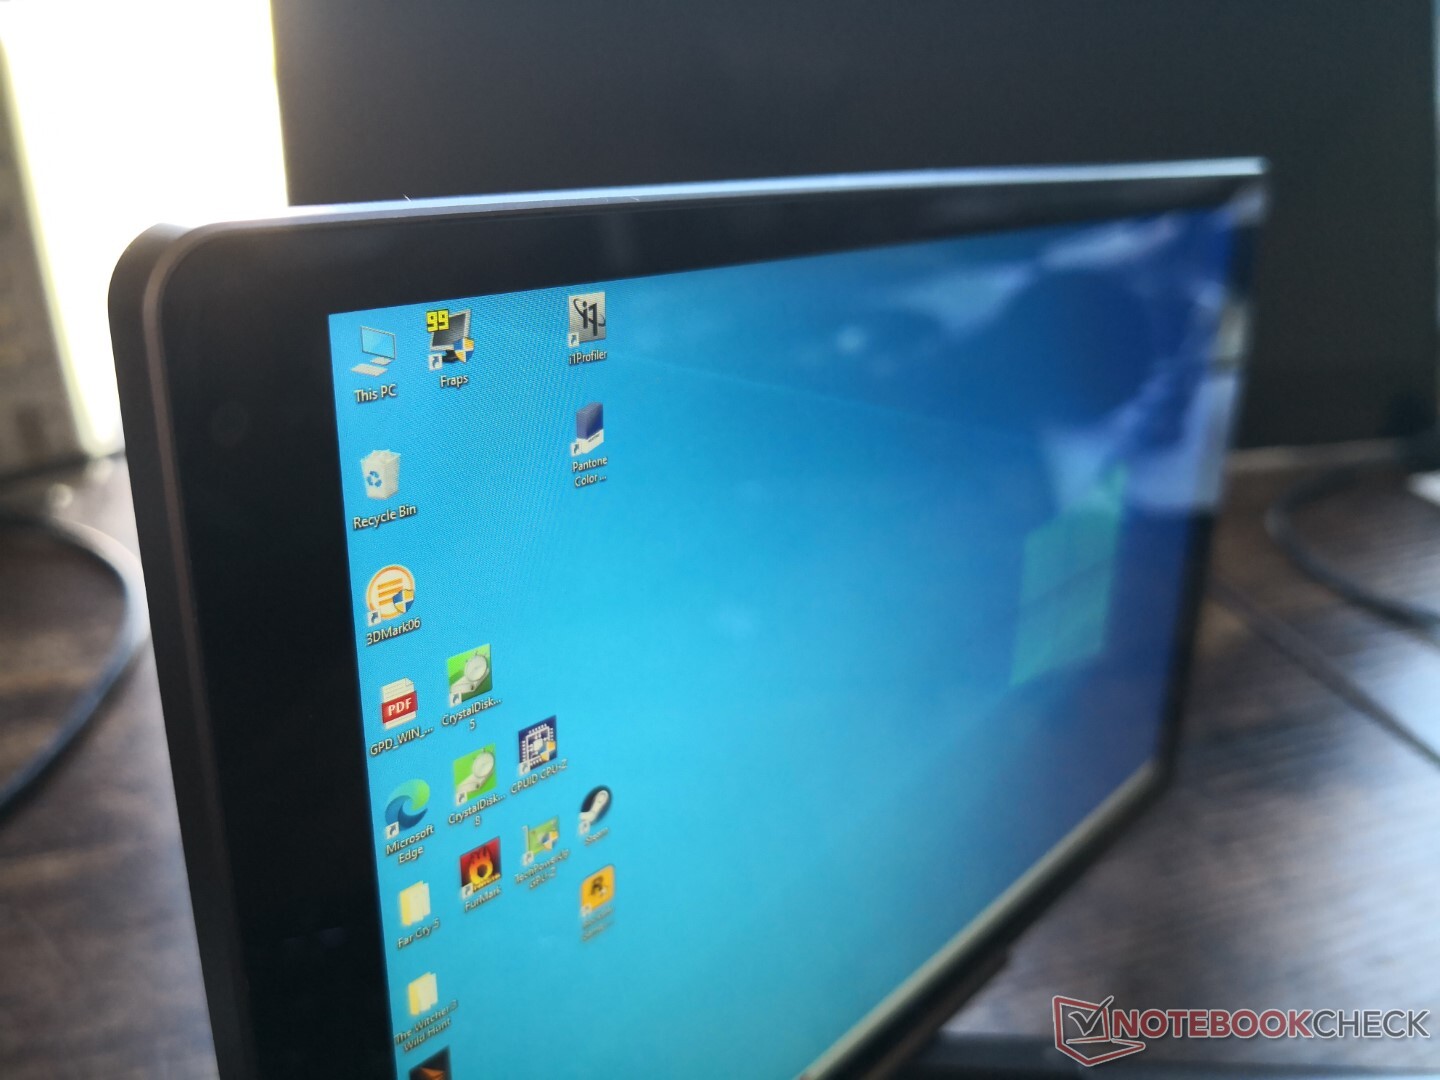
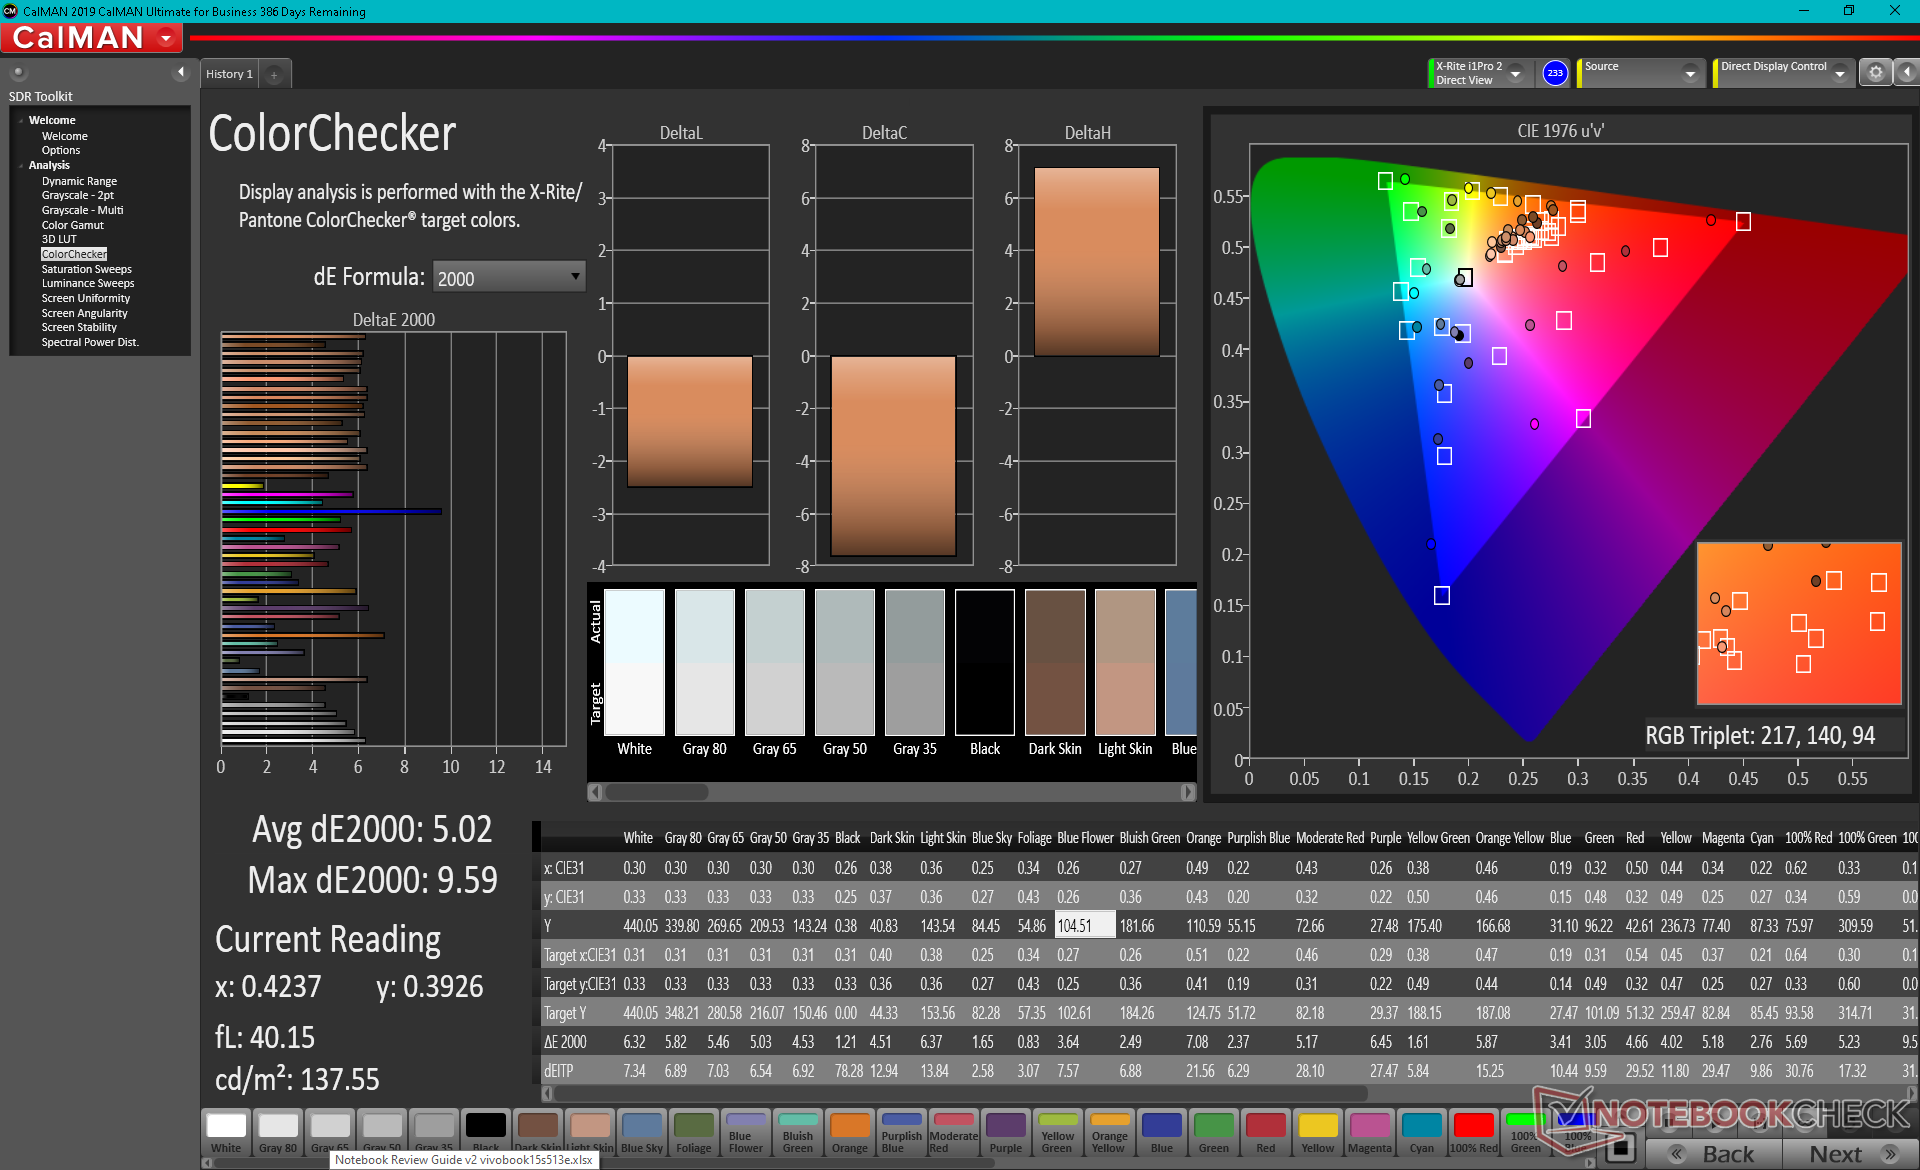
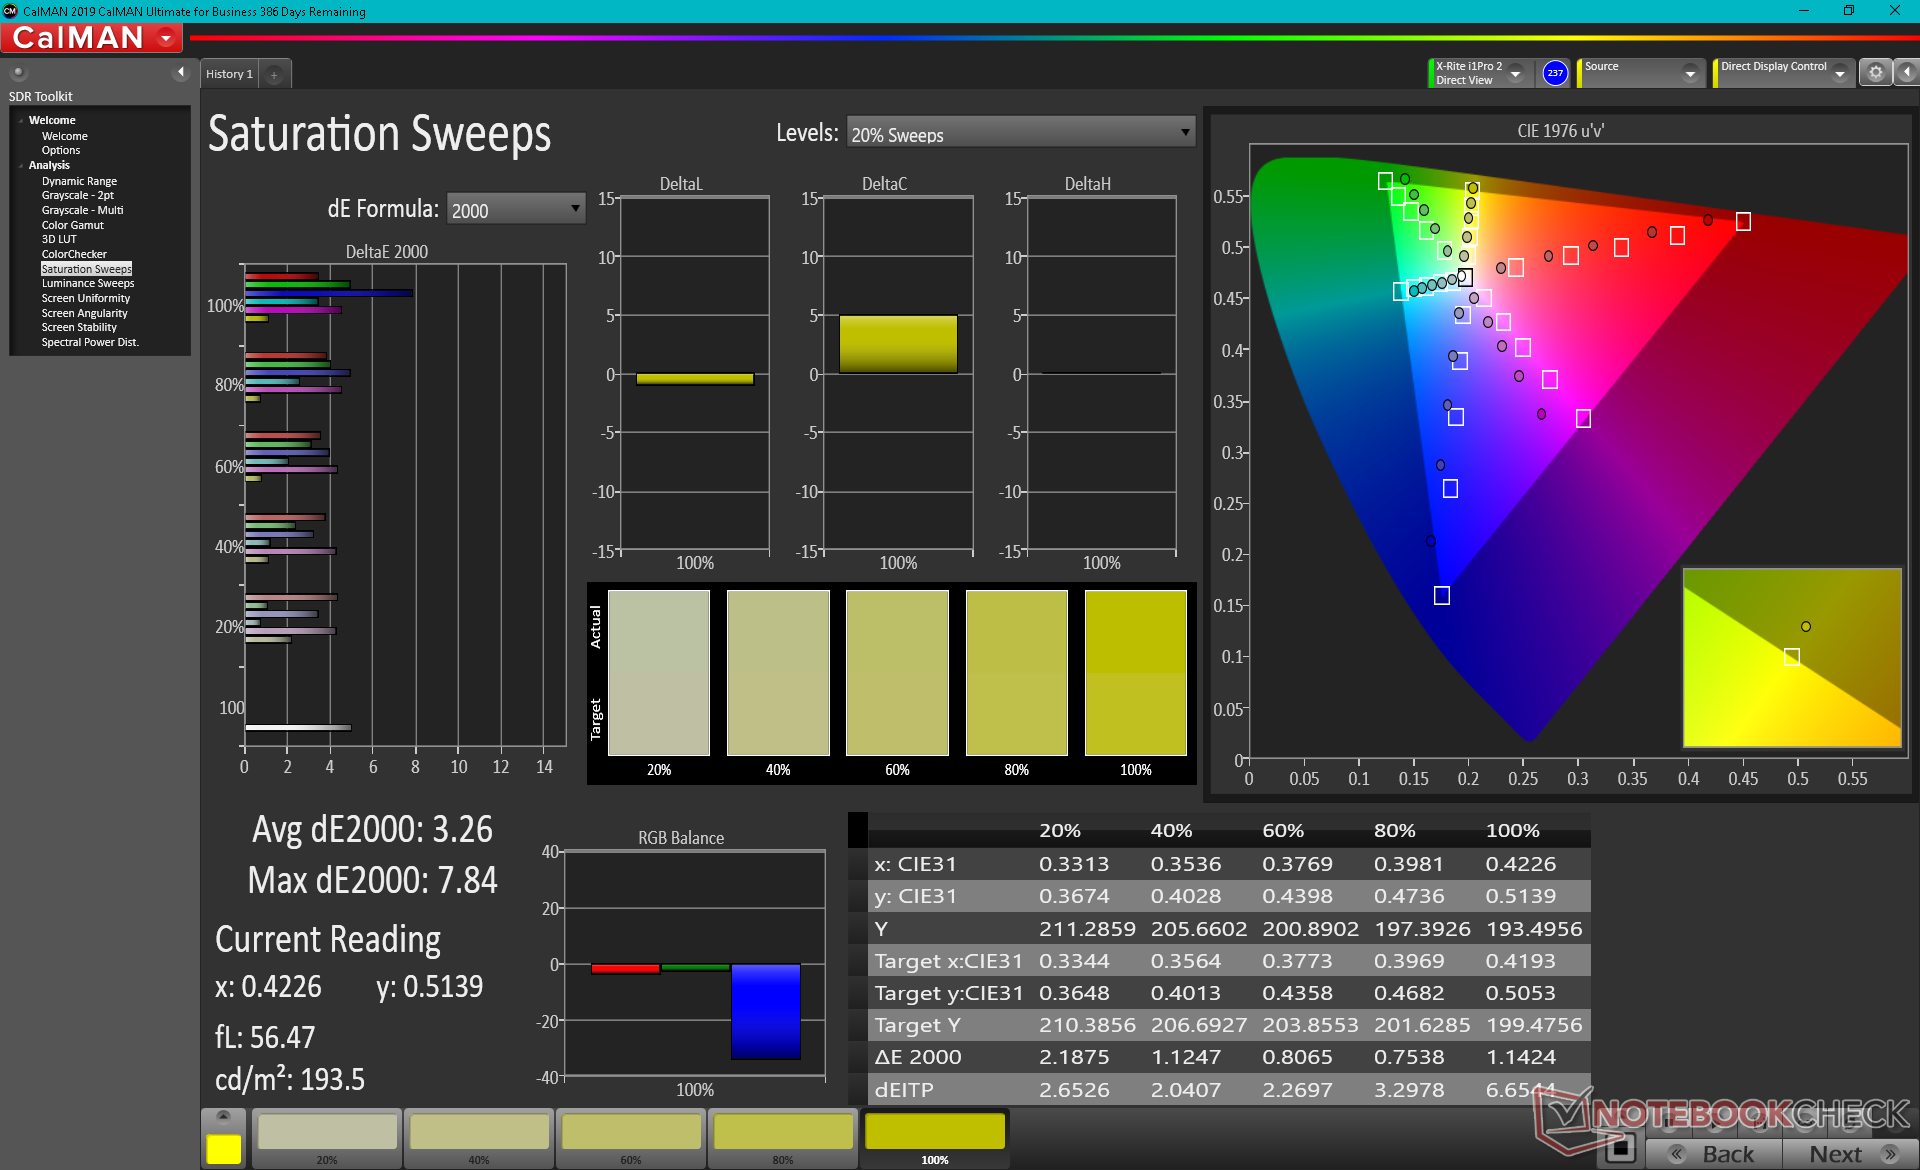
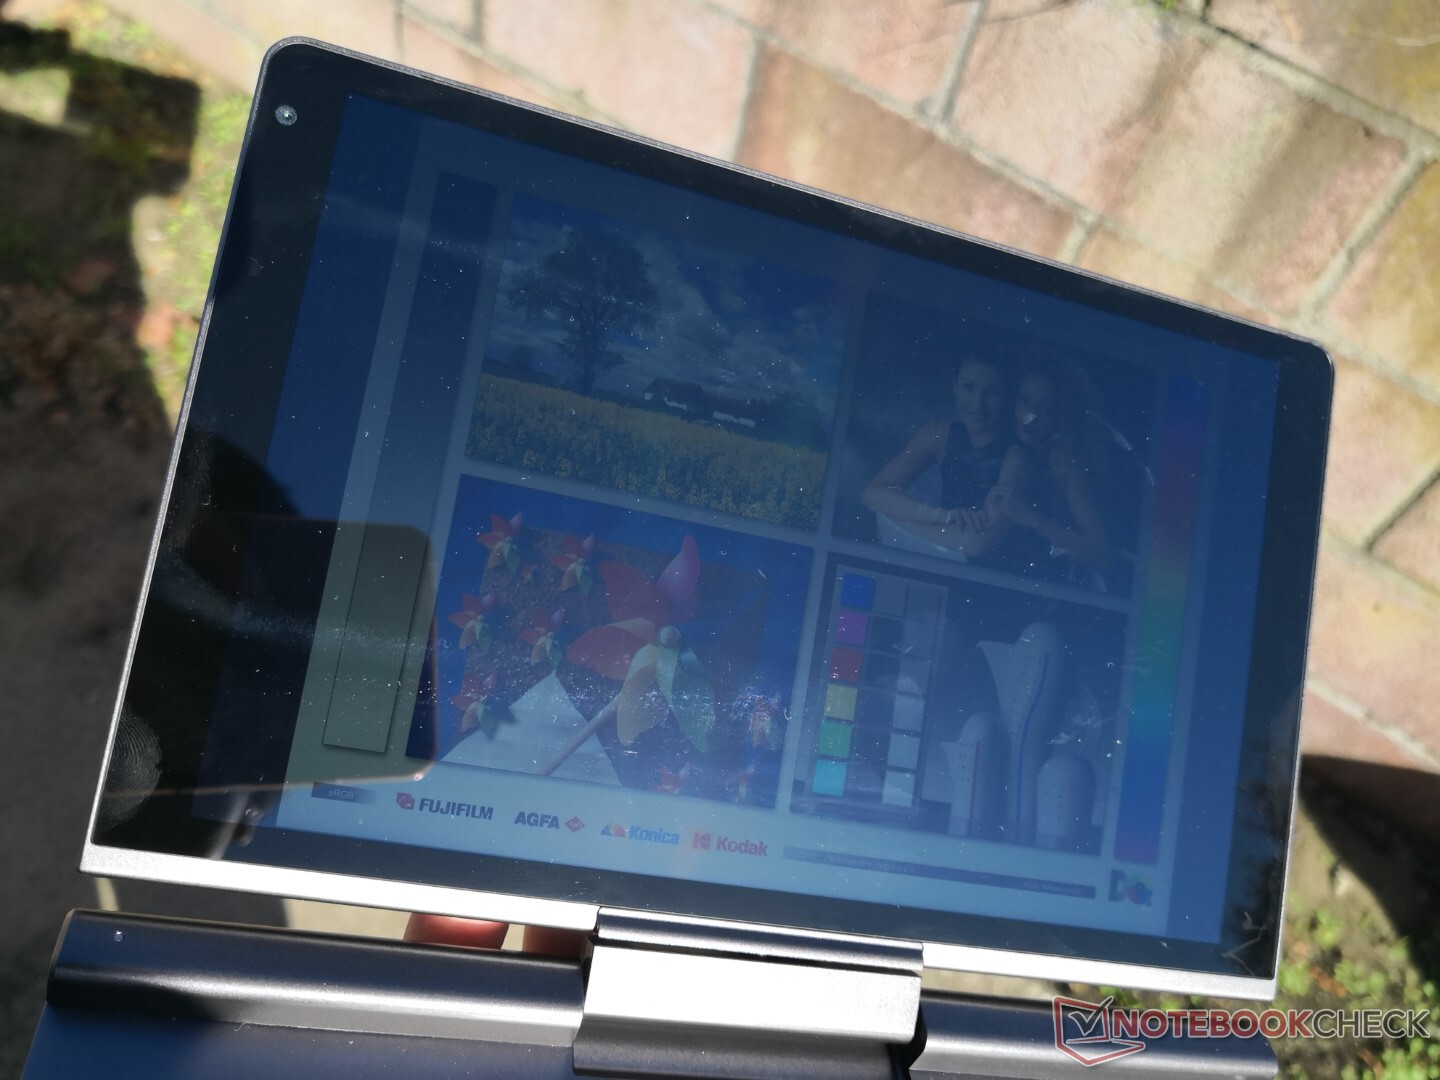
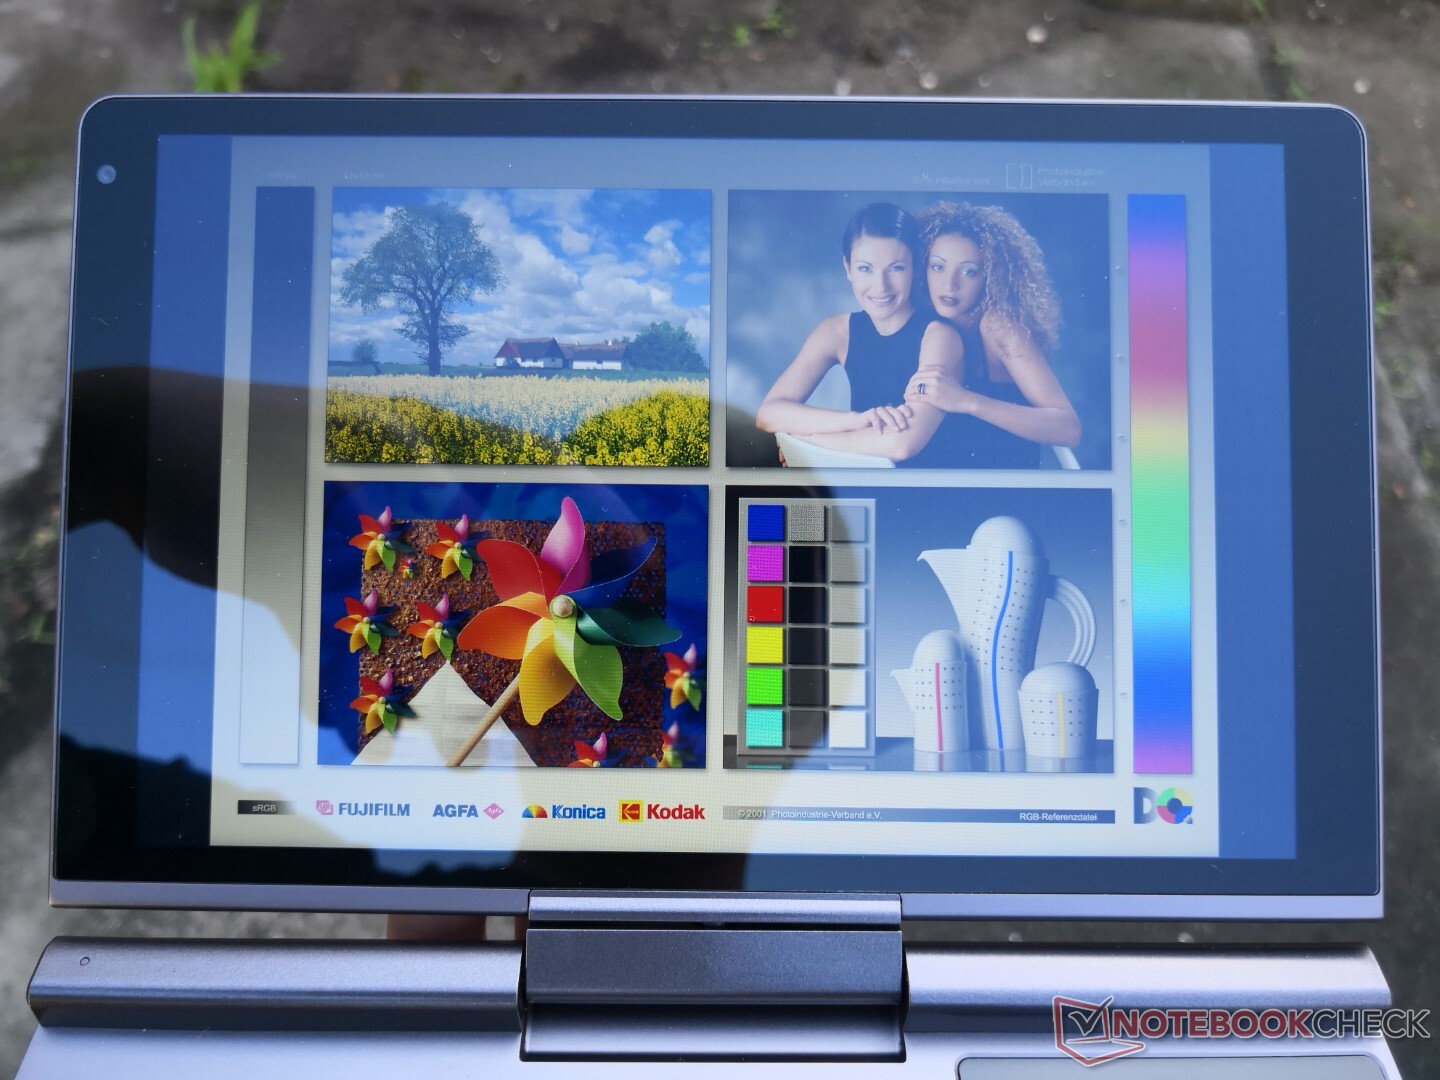
Display — Crisp and Colorful
Display quality from the 8-inch 1200p panel is sharp due to the high PPI. Colors and brightness are in between that of the Win Max and Win 3 which should be more than sufficient for office-type work and multimedia playback. Color coverage is unfortunately narrower than on many mid-range Ultrabooks where >95 percent sRGB has become the norm. The internal display is therefore not recommended for any serious graphics editing.


| |||||||||||||||||||||||||
Brightness Distribution: 92 %
Center on Battery: 438.4 cd/m²
Contrast: 1096:1 (Black: 0.4 cd/m²)
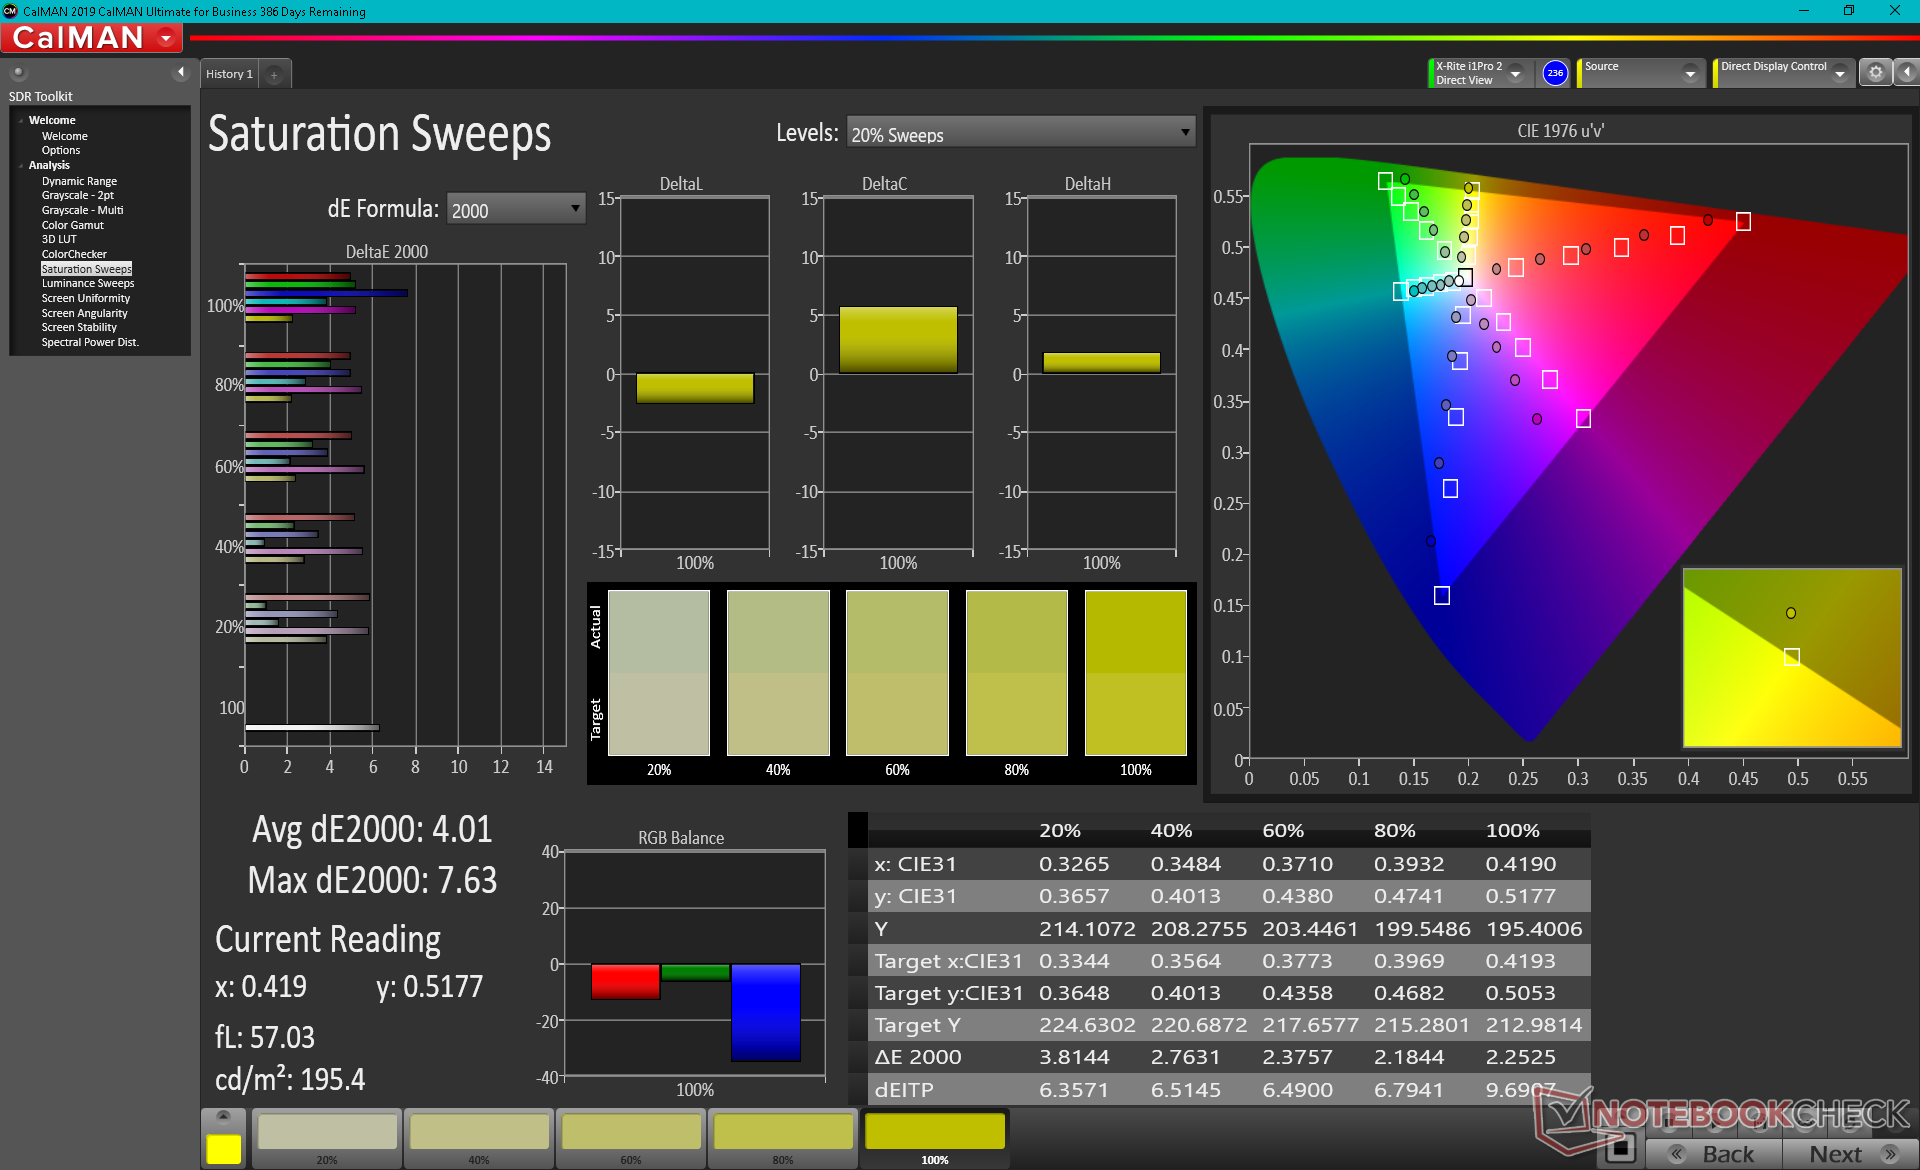
ΔE ColorChecker Calman: 5.02 | ∀{0.5-29.43 Ø4.79}
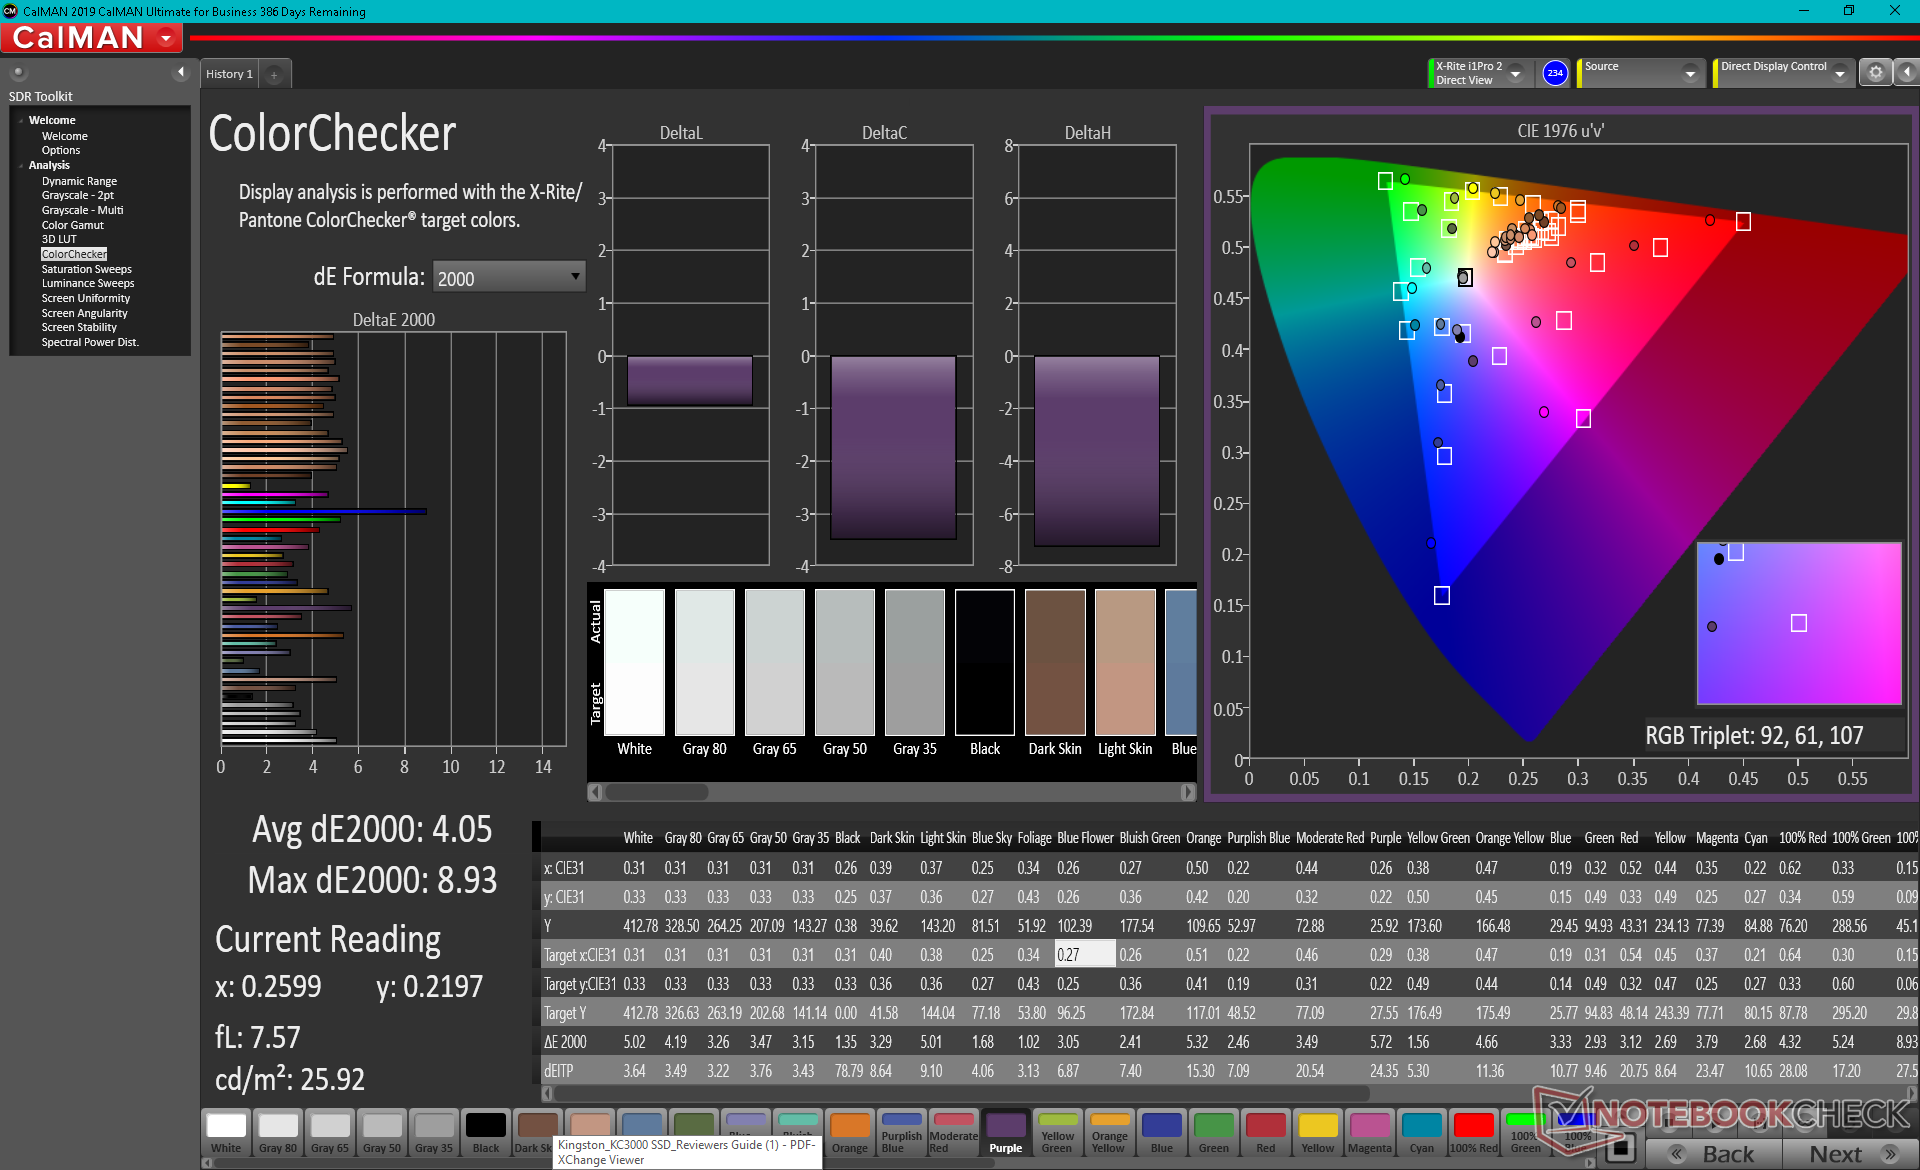
calibrated: 4.05
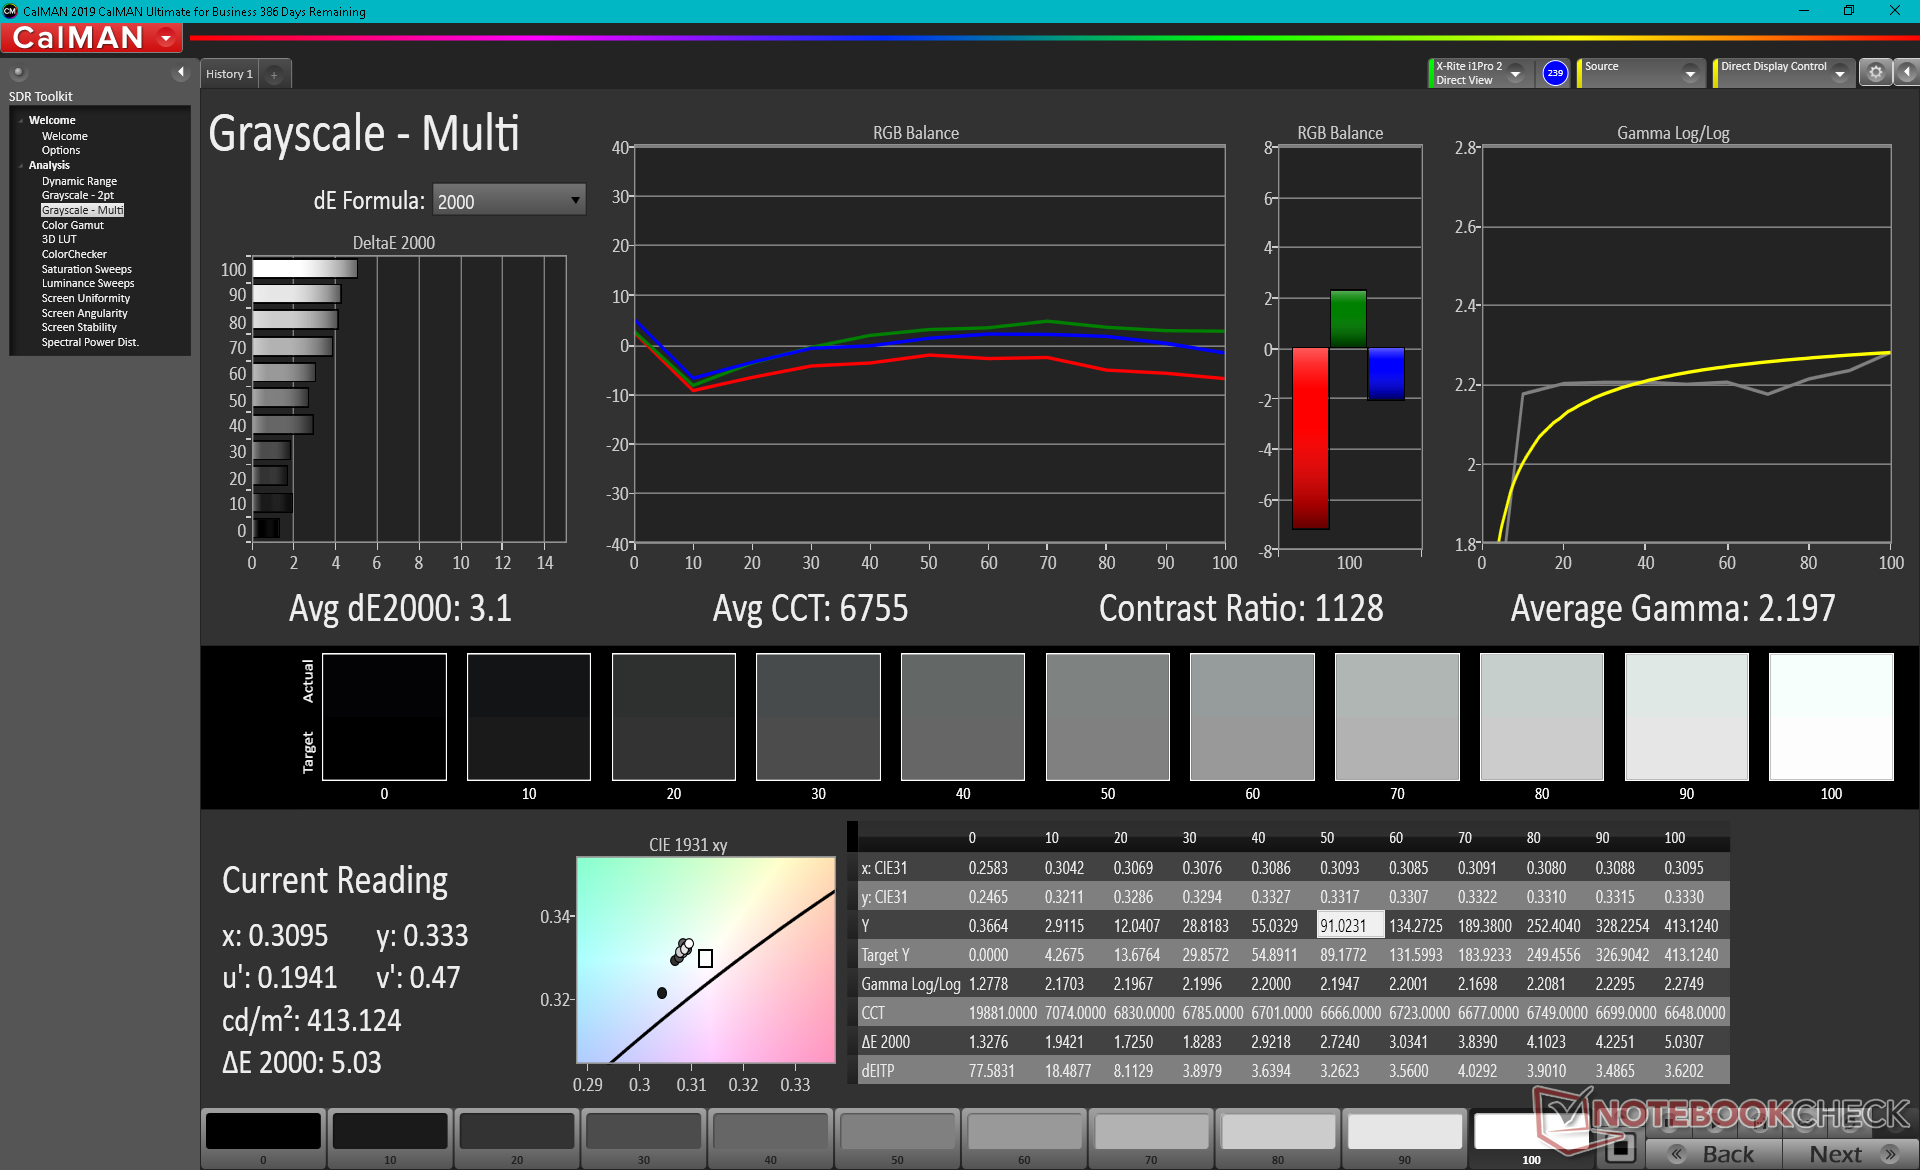
ΔE Greyscale Calman: 4 | ∀{0.09-98 Ø5}
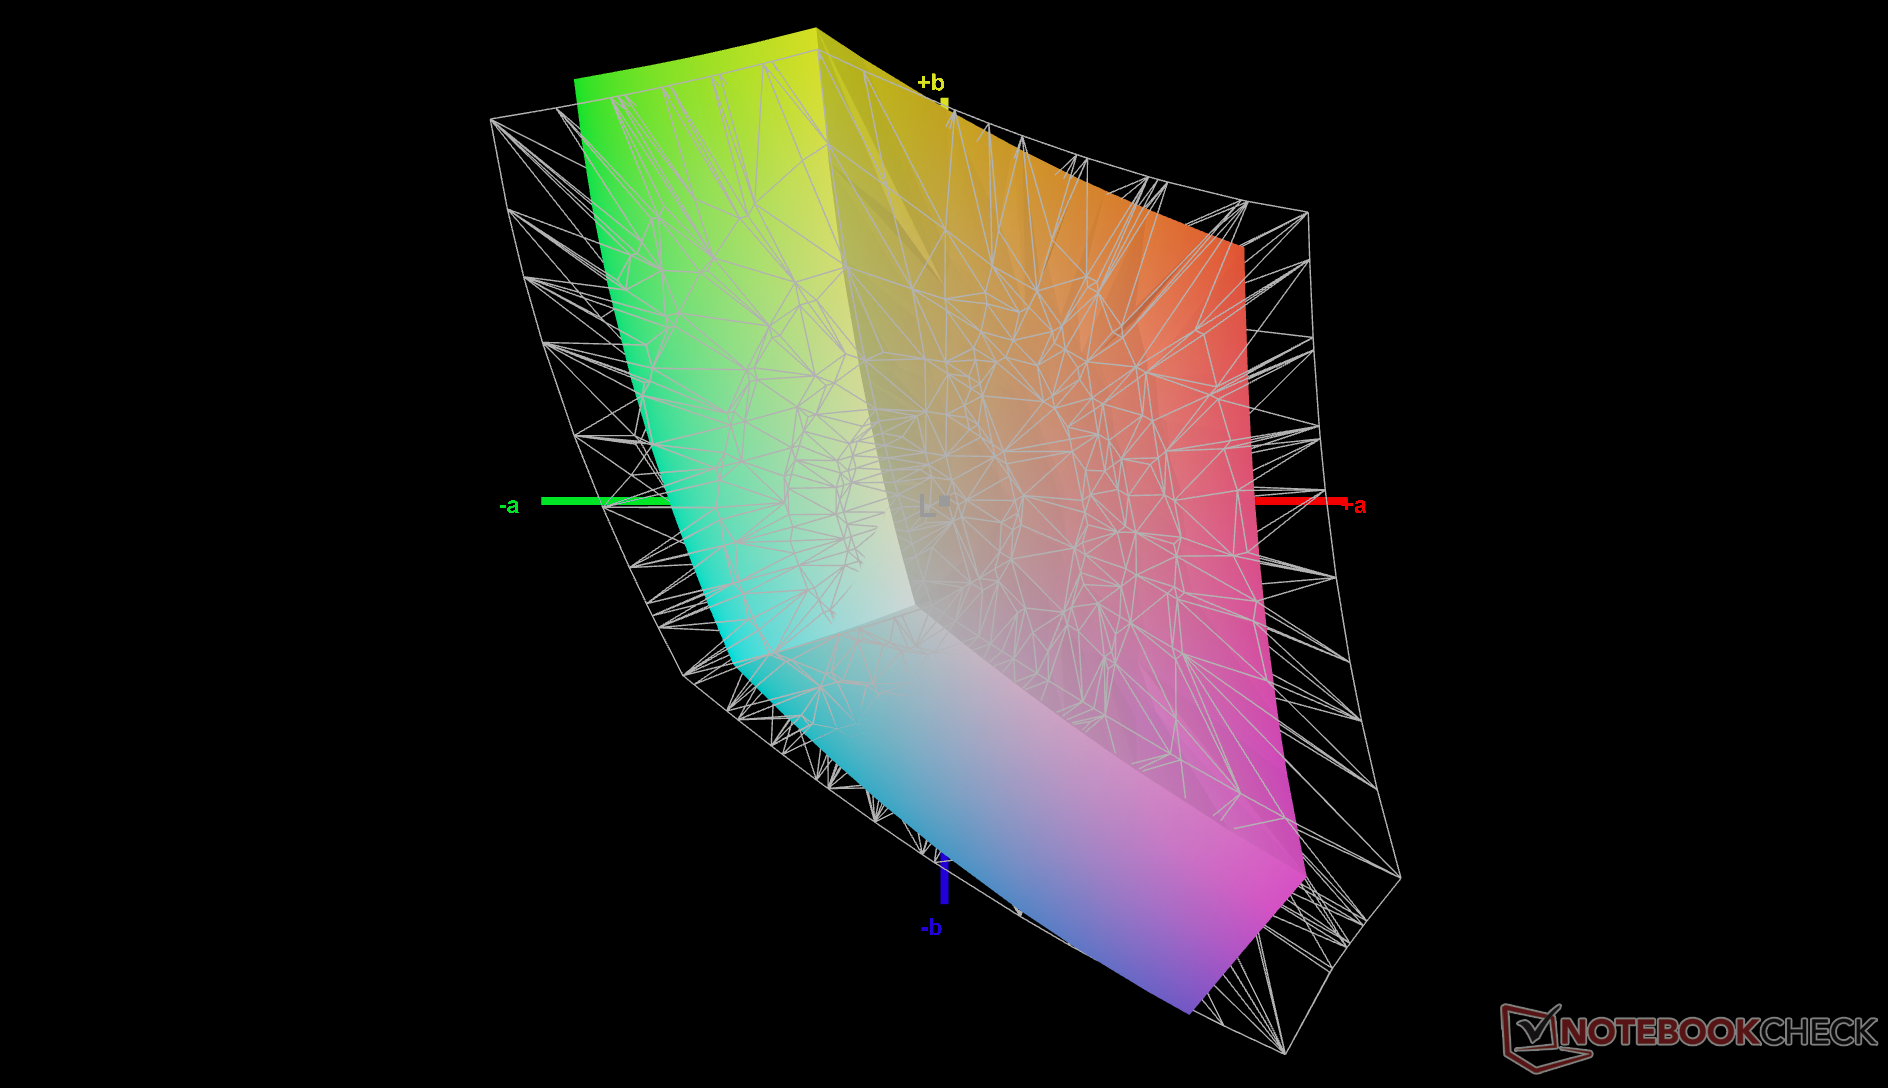
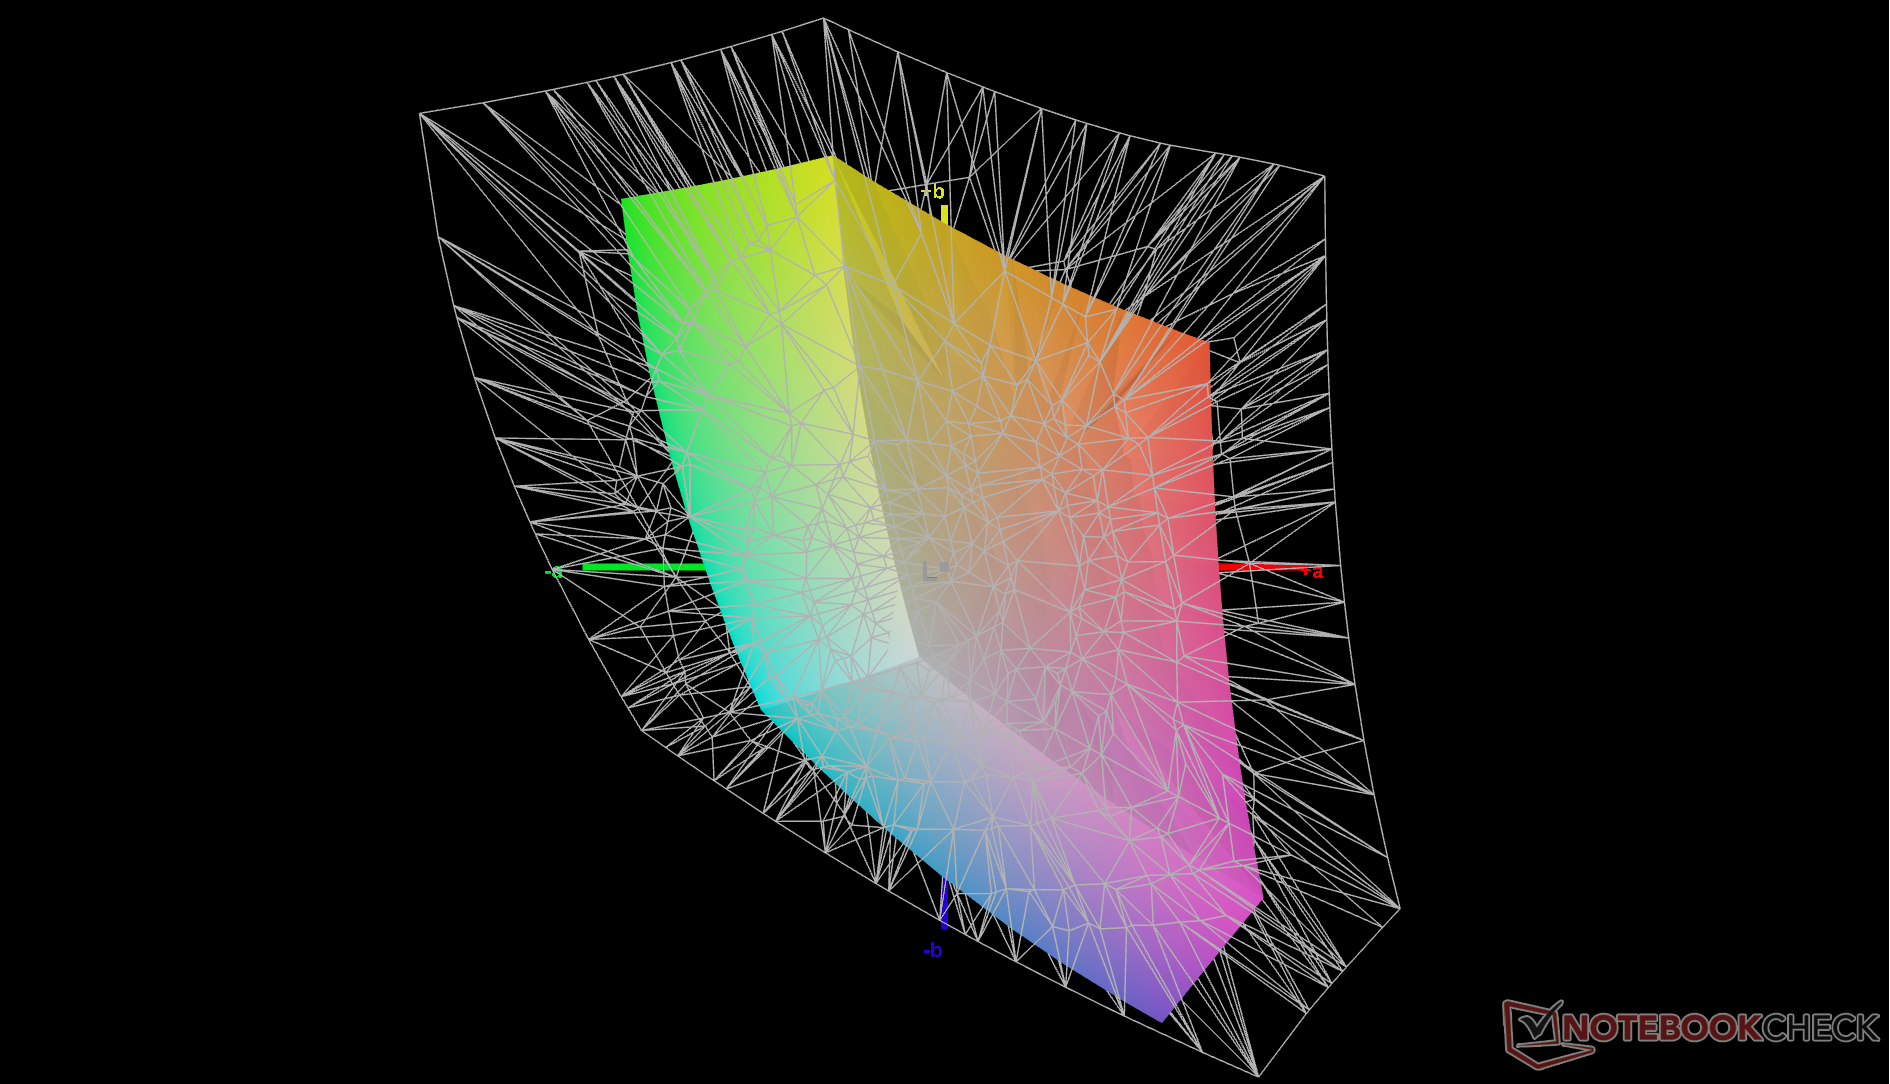
52.8% AdobeRGB 1998 (Argyll 3D)
74.7% sRGB (Argyll 3D)
51.1% Display P3 (Argyll 3D)
Gamma: 2.29
CCT: 7087 K
| GPD Pocket 3 Digital Flat Panel, IPS, 1920x1200, 8" | GPD Win Max 2021 LT7911D, IPS, 1280x800, 8" | GPD Win 3 IPS, 1280x720, 5.5" | Lenovo ThinkPad X12 20UVS03G00 N123NCA-GS1, a-Si IPS LED, 1920x1280, 12.3" | Dell XPS 13 9310 2-in-1 Sharp LQ134N1, IPS, 1920x1200, 13.4" | HP Spectre x360 14t-ea000 LG Philips LGD0663, IPS, 1920x1280, 13.5" | |
|---|---|---|---|---|---|---|
| Display | -10% | 17% | 31% | 35% | 30% | |
| Display P3 Coverage (%) | 51.1 | 47.2 -8% | 59.5 16% | 67 31% | 69.7 36% | 65.8 29% |
| sRGB Coverage (%) | 74.7 | 65.2 -13% | 89.6 20% | 99.2 33% | 99 33% | 98.2 31% |
| AdobeRGB 1998 Coverage (%) | 52.8 | 47.6 -10% | 61.4 16% | 68.8 30% | 71.7 36% | 67.9 29% |
| Response Times | -37% | 5% | -43% | -39% | -47% | |
| Response Time Grey 50% / Grey 80% * (ms) | 37.2 ? | 56.8 ? -53% | 40 ? -8% | 63.2 ? -70% | 55.6 ? -49% | 62 ? -67% |
| Response Time Black / White * (ms) | 31.2 ? | 37.6 ? -21% | 25.6 ? 18% | 36 ? -15% | 40.4 ? -29% | 39.6 ? -27% |
| PWM Frequency (Hz) | 201.6 ? | 2500 ? | ||||
| Screen | -15% | -29% | 45% | 17% | 36% | |
| Brightness middle (cd/m²) | 438.4 | 374.6 -15% | 468.8 7% | 419 -4% | 555.7 27% | 443.5 1% |
| Brightness (cd/m²) | 421 | 361 -14% | 460 9% | 406 -4% | 528 25% | 394 -6% |
| Brightness Distribution (%) | 92 | 92 0% | 93 1% | 94 2% | 90 -2% | 78 -15% |
| Black Level * (cd/m²) | 0.4 | 0.45 -13% | 0.45 -13% | 0.23 42% | 0.35 12% | 0.17 57% |
| Contrast (:1) | 1096 | 832 -24% | 1042 -5% | 1822 66% | 1588 45% | 2609 138% |
| Colorchecker dE 2000 * | 5.02 | 6.21 -24% | 9 -79% | 1.1 78% | 4.83 4% | 2.7 46% |
| Colorchecker dE 2000 max. * | 9.59 | 9.89 -3% | 15.5 -62% | 2.2 77% | 8.46 12% | 4.36 55% |
| Colorchecker dE 2000 calibrated * | 4.05 | 5.4 -33% | 1.91 53% | 0.5 88% | 0.76 81% | 2.61 36% |
| Greyscale dE 2000 * | 4 | 4.5 -13% | 10.9 -173% | 1.5 62% | 6.1 -53% | 3.4 15% |
| Gamma | 2.29 96% | 2.49 88% | 2.13 103% | 2.06 107% | 1.98 111% | 2.09 105% |
| CCT | 7087 92% | 6726 97% | 10972 59% | 6524 100% | 6686 97% | 6144 106% |
| Color Space (Percent of AdobeRGB 1998) (%) | 56.6 | 62.8 | 62.1 | |||
| Color Space (Percent of sRGB) (%) | 89.2 | 99.2 | 98.5 | |||
| Total Average (Program / Settings) | -21% /
-17% | -2% /
-14% | 11% /
30% | 4% /
13% | 6% /
23% |
* ... smaller is better
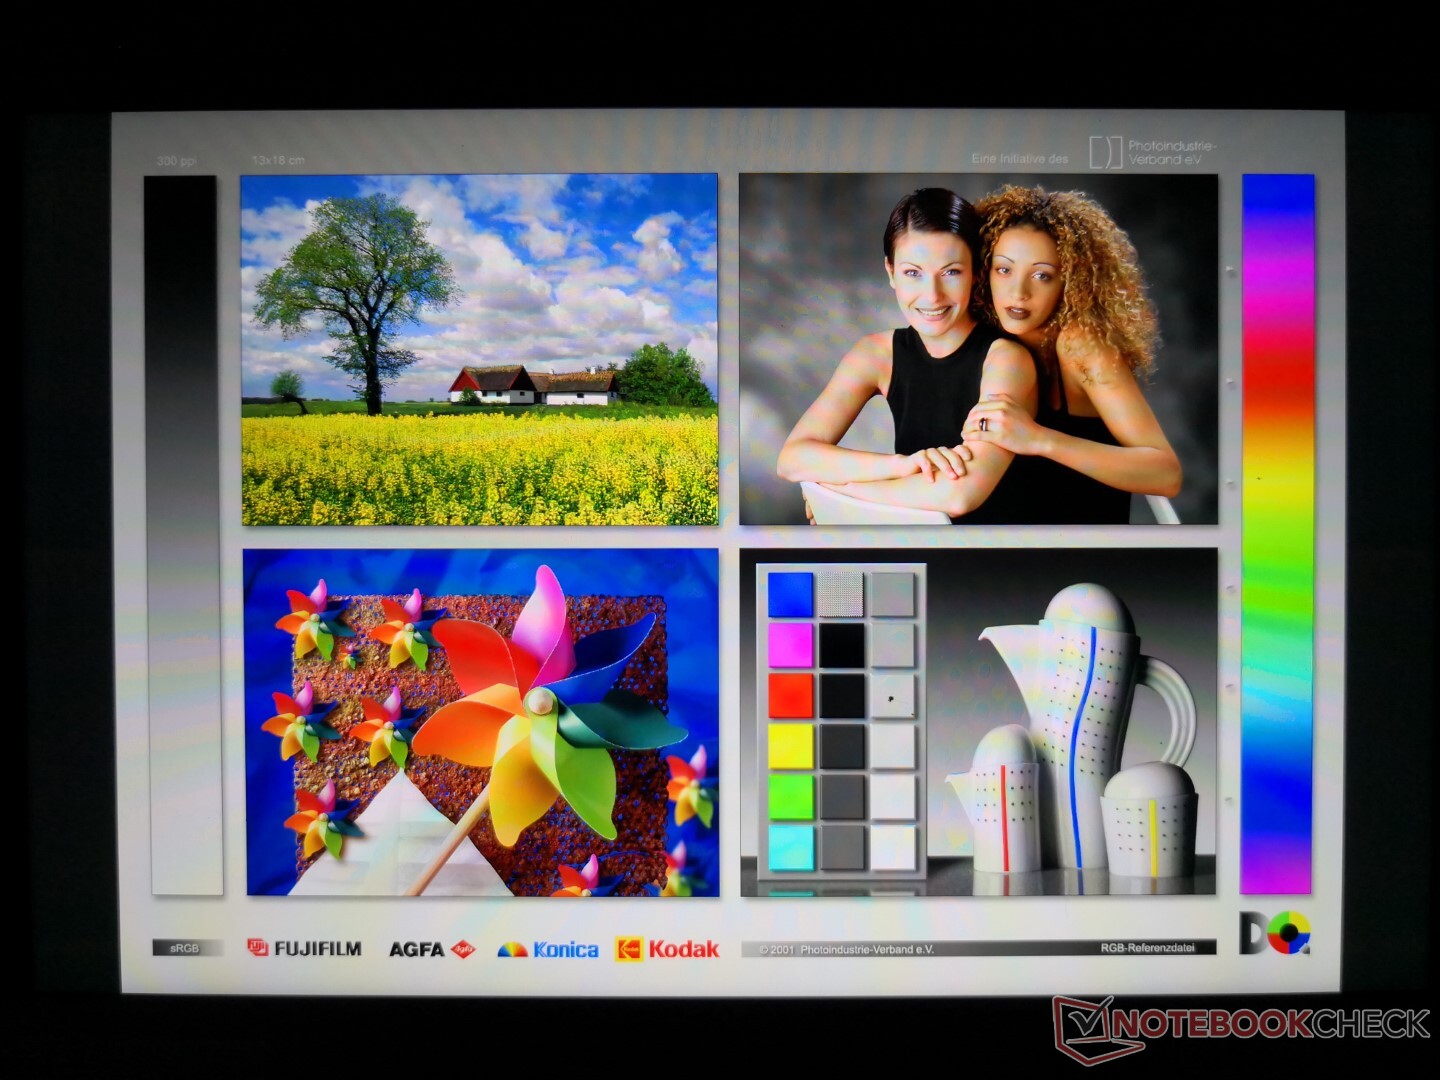
The default color temperature is on the cool side for a slightly bluish tone. Colors are otherwise decently calibrated with no major differences before or after our calibration efforts.

Display Response Times
| ↔ Response Time Black to White | ||
|---|---|---|
| 31.2 ms ... rise ↗ and fall ↘ combined | ↗ 17.2 ms rise | 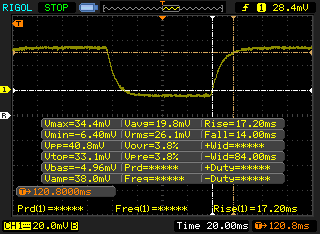 |
| ↘ 14 ms fall | ||
| The screen shows slow response rates in our tests and will be unsatisfactory for gamers. In comparison, all tested devices range from 0.1 (minimum) to 240 (maximum) ms. » 84 % of all devices are better. This means that the measured response time is worse than the average of all tested devices (20.3 ms). | ||
| ↔ Response Time 50% Grey to 80% Grey | ||
| 37.2 ms ... rise ↗ and fall ↘ combined | ↗ 17.6 ms rise | 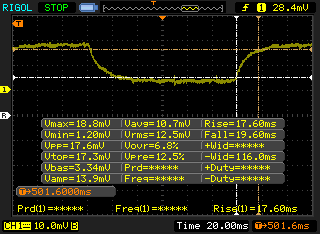 |
| ↘ 19.6 ms fall | ||
| The screen shows slow response rates in our tests and will be unsatisfactory for gamers. In comparison, all tested devices range from 0.165 (minimum) to 636 (maximum) ms. » 53 % of all devices are better. This means that the measured response time is worse than the average of all tested devices (31.7 ms). | ||
Screen Flickering / PWM (Pulse-Width Modulation)
| Screen flickering / PWM not detected | 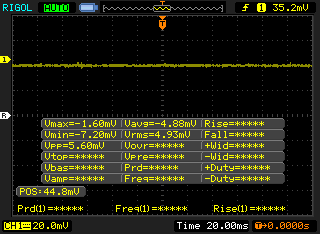 | ||
In comparison: 53 % of all tested devices do not use PWM to dim the display. If PWM was detected, an average of 8156 (minimum: 5 - maximum: 343500) Hz was measured. | |||
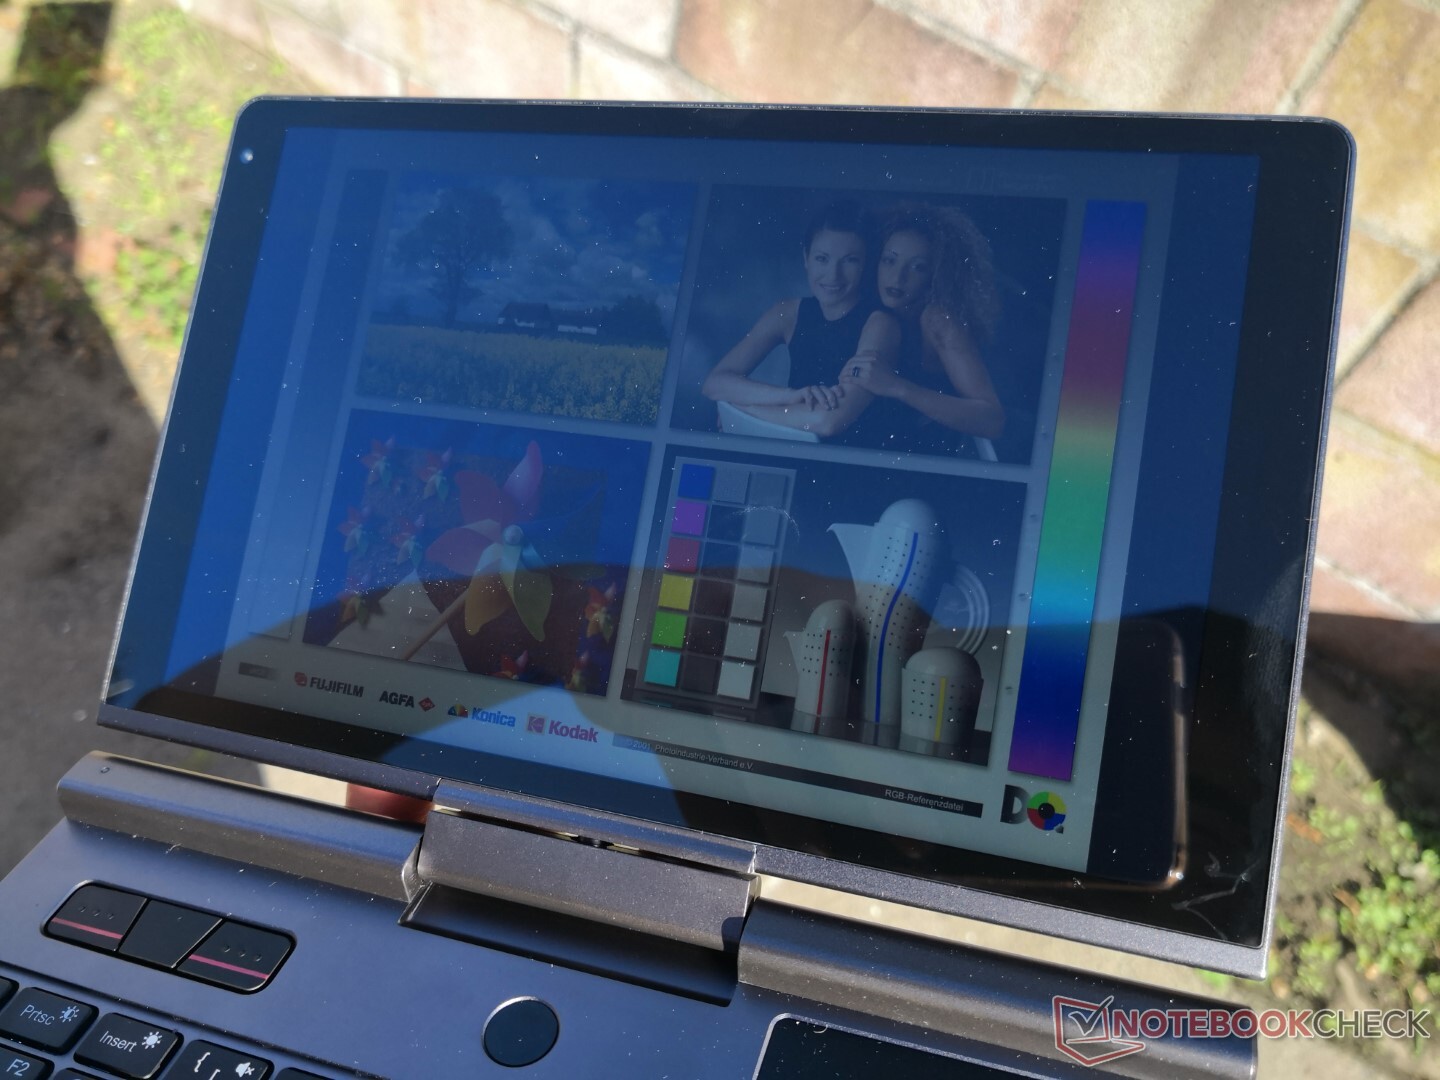
Outdoor visibility is most similar to the Win 3 due to both units having almost the same contrast levels. Glare is largely unavoidable on the glossy touchscreen and so users will want to increase the font scaling for easier readability. Colors become washed out if under direct sunlight.

Performance — Highly Dependent on BIOS Settings
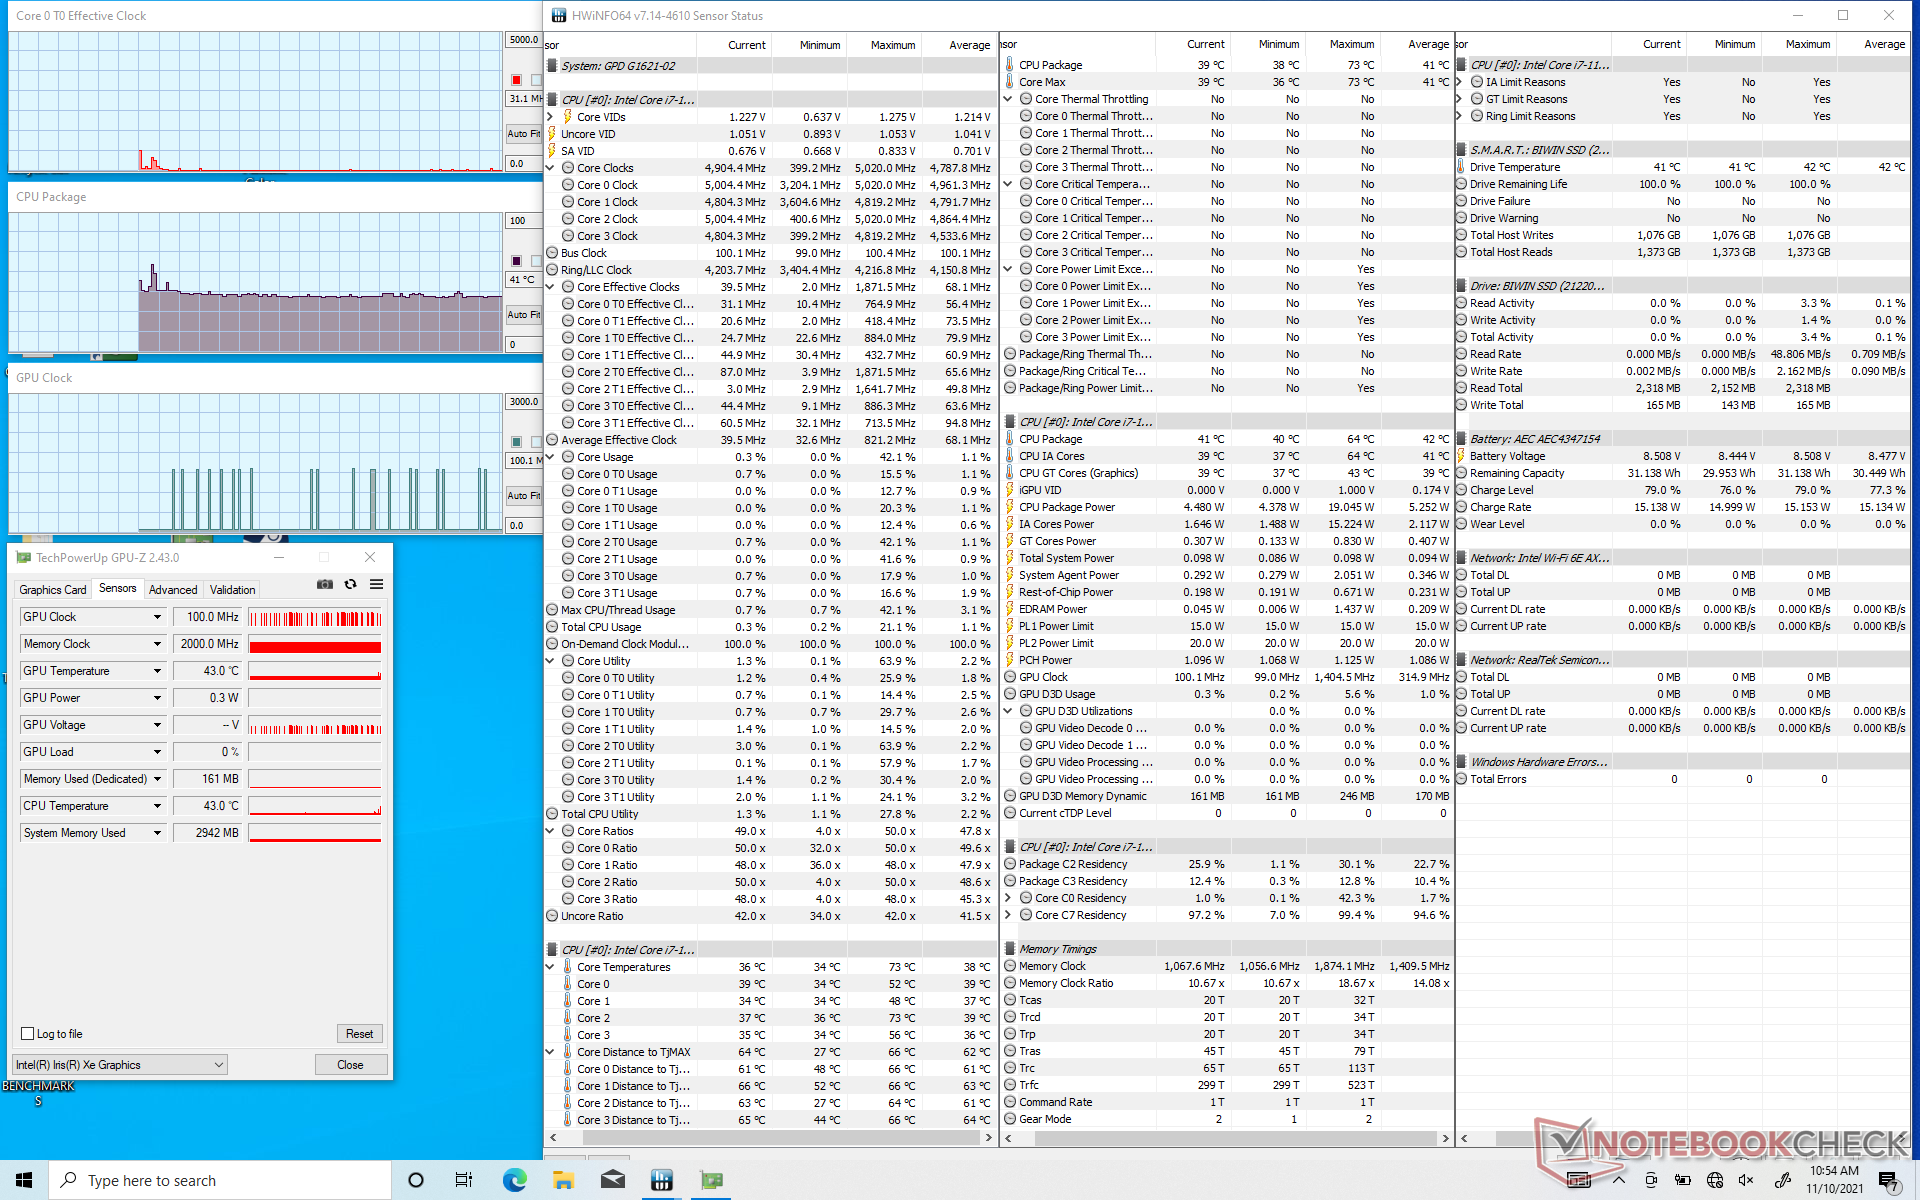
Testing Conditions
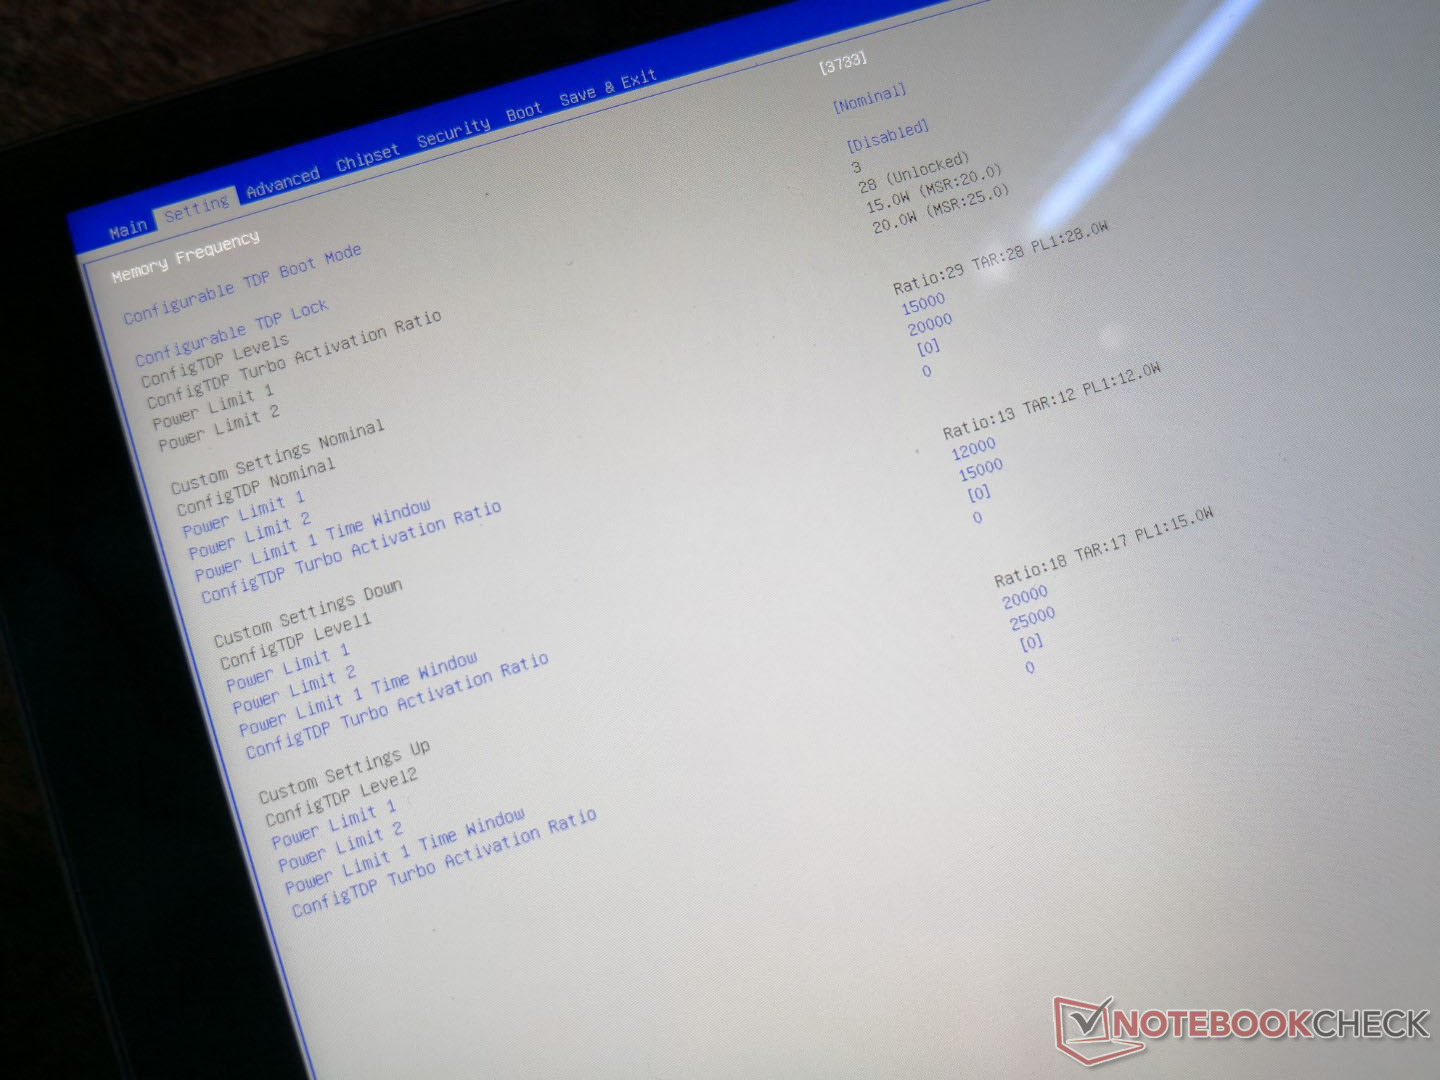
The processor power limits can be adjusted via the BIOS menu. For our benchmark tests, we used the default power settings as shipped by the manufacturer (PL1=15, PL2=20) as shown by the picture below. Users can alternatively run the processor at a higher power limit (PL1=20, PL2=25) or lower power limit (PL1=12, PL2=15) if desired. We will be comparing what differences users can expect between the default and higher power settings.
Processor
Multi-thread CPU performance is roughly 30 to 35 percent slower than the average Core i7-1195G7 in our database when running on the default BIOS power level. If running on the higher BIOS power level, this performance deficit will become narrower at just 10 percent. On the flip side, single-thread performance changes little between the two power level settings.
Upgrading from the lesser Pentium N6000 SKU will boost raw CPU performance by 2x to 3x.
Cinebench R15 Multi Loop
Cinebench R23: Multi Core | Single Core
Cinebench R20: CPU (Multi Core) | CPU (Single Core)
Cinebench R15: CPU Multi 64Bit | CPU Single 64Bit
Blender: v2.79 BMW27 CPU
7-Zip 18.03: 7z b 4 | 7z b 4 -mmt1
Geekbench 5.5: Multi-Core | Single-Core
HWBOT x265 Benchmark v2.2: 4k Preset
LibreOffice : 20 Documents To PDF
R Benchmark 2.5: Overall mean
| CPU Performance rating | |
| MSI Prestige 15 A10SC -10! | |
| GPD Win Max 2021 -2! | |
| Lenovo Yoga 6 13ALC6 -2! | |
| Asus Zenbook 14X UX5400E | |
| Average Intel Core i7-1195G7 | |
| Lenovo Yoga Slim 7 14ITL05 82A300CNGE | |
| GPD Win 3 | |
| GPD Pocket 3 -2! | |
| Infinix INBook X1 Pro -2! | |
| HP Envy 13-ba0001ng -2! | |
| Asus VivoBook S13 S333JA-DS51 | |
| Asus ZenBook 14 UX434FL-DB77 -2! | |
| Acer Swift 1 SF114-34-P6U1 | |
| Cinebench R23 / Multi Core | |
| GPD Win Max 2021 | |
| Lenovo Yoga 6 13ALC6 | |
| Asus Zenbook 14X UX5400E | |
| Lenovo Yoga Slim 7 14ITL05 82A300CNGE | |
| Average Intel Core i7-1195G7 (3142 - 6806, n=9) | |
| GPD Win 3 | |
| Infinix INBook X1 Pro | |
| Asus VivoBook S13 S333JA-DS51 | |
| GPD Pocket 3 | |
| Acer Swift 1 SF114-34-P6U1 | |
| Cinebench R23 / Single Core | |
| Asus Zenbook 14X UX5400E | |
| Average Intel Core i7-1195G7 (1290 - 1624, n=9) | |
| GPD Pocket 3 | |
| GPD Win 3 | |
| Lenovo Yoga Slim 7 14ITL05 82A300CNGE | |
| Lenovo Yoga 6 13ALC6 | |
| GPD Win Max 2021 | |
| Infinix INBook X1 Pro | |
| Asus VivoBook S13 S333JA-DS51 | |
| Acer Swift 1 SF114-34-P6U1 | |
| Geekbench 5.5 / Multi-Core | |
| Asus Zenbook 14X UX5400E | |
| Average Intel Core i7-1195G7 (4241 - 6349, n=7) | |
| GPD Win 3 | |
| Lenovo Yoga Slim 7 14ITL05 82A300CNGE | |
| Asus VivoBook S13 S333JA-DS51 | |
| HP Envy 13-ba0001ng | |
| Asus ZenBook 14 UX434FL-DB77 | |
| Acer Swift 1 SF114-34-P6U1 | |
| Geekbench 5.5 / Single-Core | |
| Average Intel Core i7-1195G7 (1519 - 1649, n=7) | |
| Asus Zenbook 14X UX5400E | |
| GPD Win 3 | |
| Lenovo Yoga Slim 7 14ITL05 82A300CNGE | |
| HP Envy 13-ba0001ng | |
| Asus ZenBook 14 UX434FL-DB77 | |
| Asus VivoBook S13 S333JA-DS51 | |
| Acer Swift 1 SF114-34-P6U1 | |
| HWBOT x265 Benchmark v2.2 / 4k Preset | |
| GPD Win Max 2021 | |
| Lenovo Yoga 6 13ALC6 | |
| Asus Zenbook 14X UX5400E | |
| Average Intel Core i7-1195G7 (4.23 - 8.8, n=9) | |
| GPD Win 3 | |
| Infinix INBook X1 Pro | |
| Lenovo Yoga Slim 7 14ITL05 82A300CNGE | |
| Asus VivoBook S13 S333JA-DS51 | |
| Asus ZenBook 14 UX434FL-DB77 | |
| GPD Pocket 3 | |
| HP Envy 13-ba0001ng | |
| Acer Swift 1 SF114-34-P6U1 | |
| LibreOffice / 20 Documents To PDF | |
| Acer Swift 1 SF114-34-P6U1 | |
| Asus ZenBook 14 UX434FL-DB77 | |
| Lenovo Yoga 6 13ALC6 | |
| GPD Win Max 2021 | |
| Asus VivoBook S13 S333JA-DS51 | |
| Infinix INBook X1 Pro | |
| HP Envy 13-ba0001ng | |
| Lenovo Yoga Slim 7 14ITL05 82A300CNGE | |
| Asus Zenbook 14X UX5400E | |
| Average Intel Core i7-1195G7 (39.2 - 83.9, n=9) | |
| GPD Win 3 | |
| GPD Pocket 3 | |
Cinebench R23: Multi Core | Single Core
Cinebench R20: CPU (Multi Core) | CPU (Single Core)
Cinebench R15: CPU Multi 64Bit | CPU Single 64Bit
Blender: v2.79 BMW27 CPU
7-Zip 18.03: 7z b 4 | 7z b 4 -mmt1
Geekbench 5.5: Multi-Core | Single-Core
HWBOT x265 Benchmark v2.2: 4k Preset
LibreOffice : 20 Documents To PDF
R Benchmark 2.5: Overall mean
* ... smaller is better
AIDA64: FP32 Ray-Trace | FPU Julia | CPU SHA3 | CPU Queen | FPU SinJulia | FPU Mandel | CPU AES | CPU ZLib | FP64 Ray-Trace | CPU PhotoWorxx
| Performance rating | |
| GPD Win Max 2021 | |
| Dell XPS 13 9310 2-in-1 | |
| Average Intel Core i7-1195G7 | |
| GPD Pocket 3 | |
| Lenovo ThinkPad X12 20UVS03G00 | |
| AIDA64 / FP32 Ray-Trace | |
| GPD Win Max 2021 | |
| Dell XPS 13 9310 2-in-1 | |
| Average Intel Core i7-1195G7 (4378 - 7361, n=9) | |
| GPD Pocket 3 | |
| Lenovo ThinkPad X12 20UVS03G00 | |
| AIDA64 / FPU Julia | |
| GPD Win Max 2021 | |
| Dell XPS 13 9310 2-in-1 | |
| Average Intel Core i7-1195G7 (20576 - 30422, n=9) | |
| GPD Pocket 3 | |
| Lenovo ThinkPad X12 20UVS03G00 | |
| AIDA64 / CPU SHA3 | |
| Dell XPS 13 9310 2-in-1 | |
| Average Intel Core i7-1195G7 (1310 - 2026, n=9) | |
| GPD Win Max 2021 | |
| GPD Pocket 3 | |
| Lenovo ThinkPad X12 20UVS03G00 | |
| AIDA64 / CPU Queen | |
| GPD Win Max 2021 | |
| Dell XPS 13 9310 2-in-1 | |
| Average Intel Core i7-1195G7 (38530 - 56262, n=9) | |
| Lenovo ThinkPad X12 20UVS03G00 | |
| GPD Pocket 3 | |
| AIDA64 / FPU SinJulia | |
| GPD Win Max 2021 | |
| Dell XPS 13 9310 2-in-1 | |
| Average Intel Core i7-1195G7 (3209 - 4937, n=9) | |
| GPD Pocket 3 | |
| Lenovo ThinkPad X12 20UVS03G00 | |
| AIDA64 / FPU Mandel | |
| GPD Win Max 2021 | |
| Dell XPS 13 9310 2-in-1 | |
| Average Intel Core i7-1195G7 (12142 - 18123, n=9) | |
| GPD Pocket 3 | |
| Lenovo ThinkPad X12 20UVS03G00 | |
| AIDA64 / CPU AES | |
| Dell XPS 13 9310 2-in-1 | |
| Average Intel Core i7-1195G7 (30854 - 70936, n=9) | |
| GPD Pocket 3 | |
| GPD Win Max 2021 | |
| Lenovo ThinkPad X12 20UVS03G00 | |
| AIDA64 / CPU ZLib | |
| GPD Win Max 2021 | |
| Dell XPS 13 9310 2-in-1 | |
| Average Intel Core i7-1195G7 (231 - 399, n=10) | |
| GPD Pocket 3 | |
| Lenovo ThinkPad X12 20UVS03G00 | |
| AIDA64 / FP64 Ray-Trace | |
| GPD Win Max 2021 | |
| Dell XPS 13 9310 2-in-1 | |
| Average Intel Core i7-1195G7 (2300 - 3949, n=9) | |
| GPD Pocket 3 | |
| Lenovo ThinkPad X12 20UVS03G00 | |
| AIDA64 / CPU PhotoWorxx | |
| Dell XPS 13 9310 2-in-1 | |
| Lenovo ThinkPad X12 20UVS03G00 | |
| GPD Pocket 3 | |
| Average Intel Core i7-1195G7 (13455 - 35235, n=9) | |
| GPD Win Max 2021 | |
System Performance
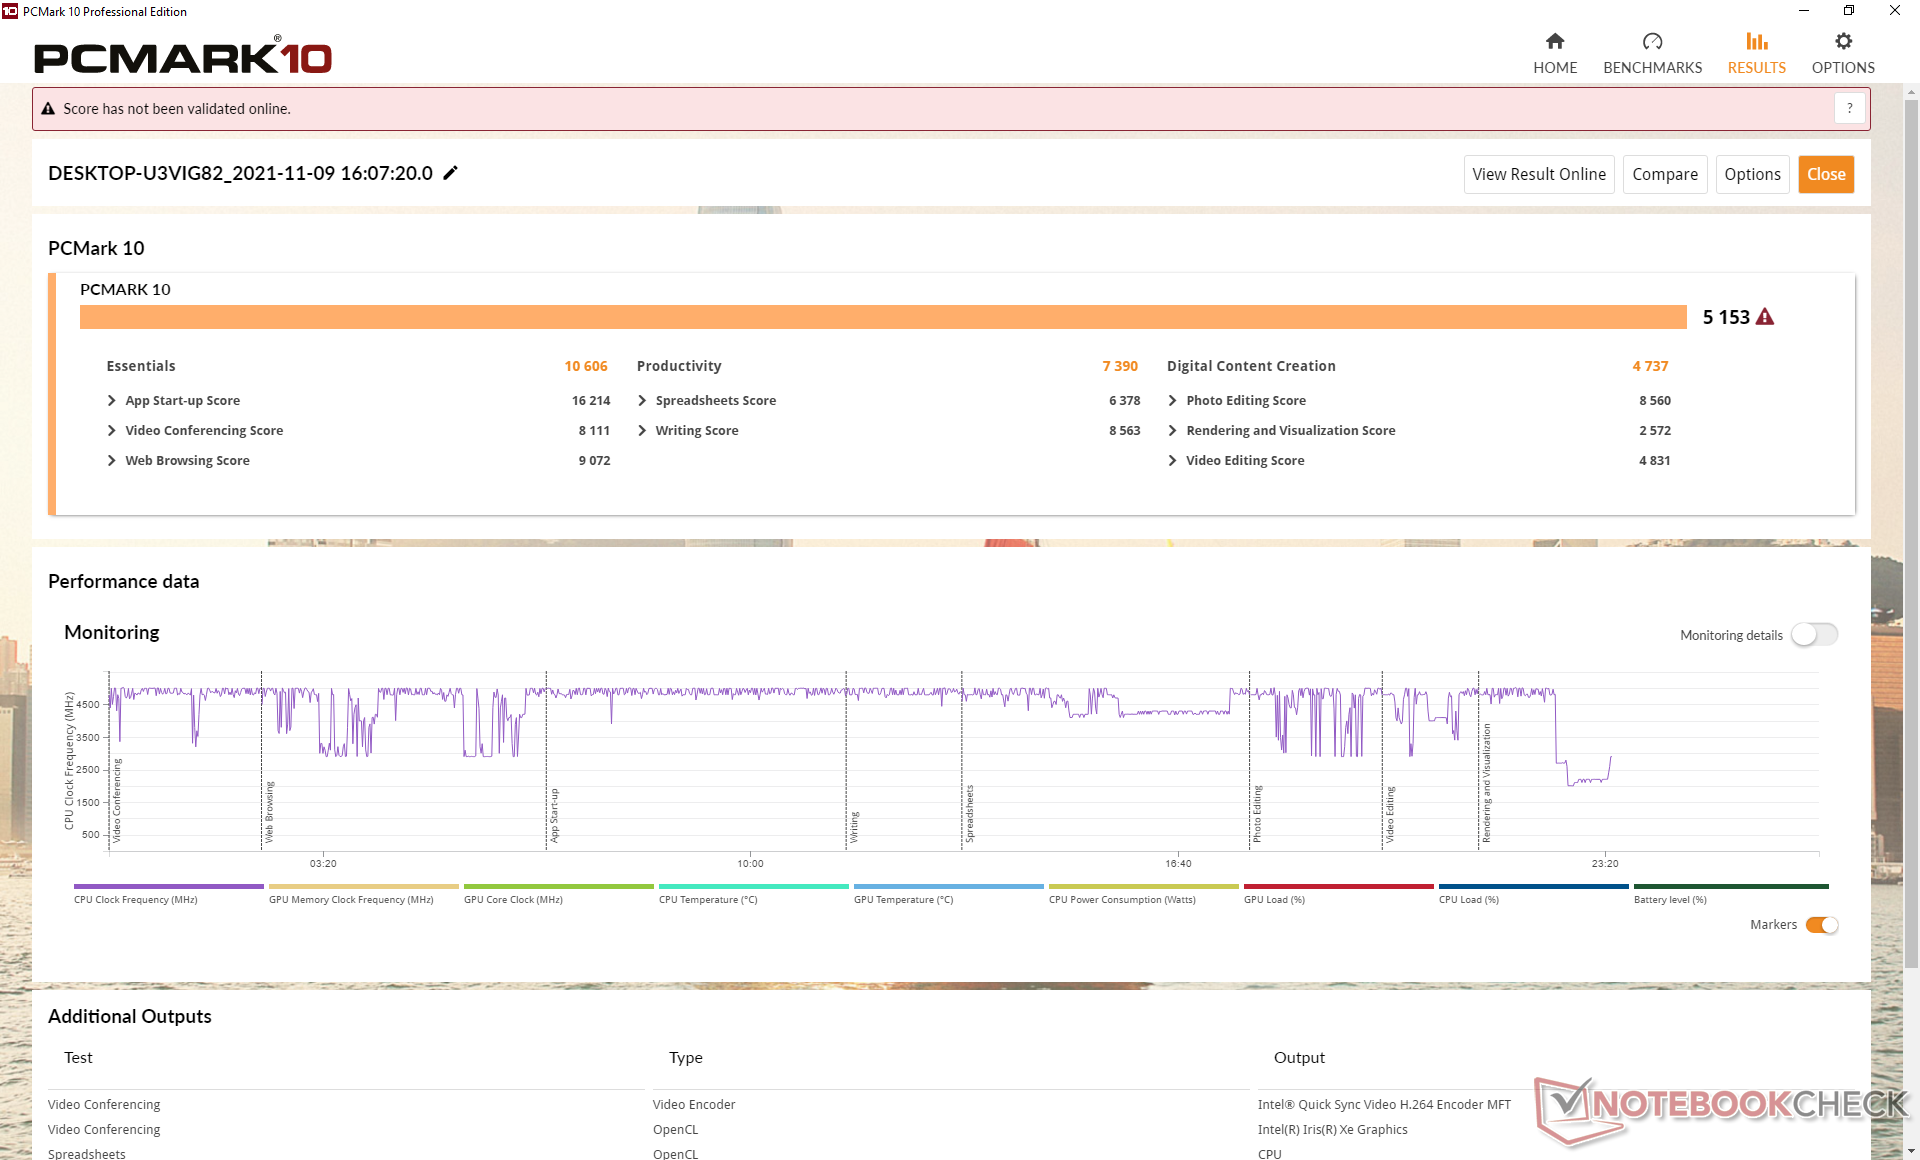
PCMark scores are excellent in spite of the below average CPU and GPU performance when on the default BIOS power level. We appreciate that the system isn't loaded with any bloatware.
| PCMark 10 / Score | |
| GPD Win Max 2021 | |
| Average Intel Core i7-1195G7, Intel Iris Xe Graphics G7 96EUs (5067 - 5406, n=6) | |
| Dell XPS 13 9310 2-in-1 | |
| GPD Pocket 3 | |
| HP Spectre x360 14t-ea000 | |
| GPD Win 3 | |
| Lenovo ThinkPad X12 20UVS03G00 | |
| PCMark 10 / Essentials | |
| GPD Pocket 3 | |
| Dell XPS 13 9310 2-in-1 | |
| Average Intel Core i7-1195G7, Intel Iris Xe Graphics G7 96EUs (10156 - 10614, n=6) | |
| HP Spectre x360 14t-ea000 | |
| GPD Win 3 | |
| Lenovo ThinkPad X12 20UVS03G00 | |
| GPD Win Max 2021 | |
| PCMark 10 / Productivity | |
| GPD Win Max 2021 | |
| GPD Pocket 3 | |
| Average Intel Core i7-1195G7, Intel Iris Xe Graphics G7 96EUs (6637 - 7390, n=6) | |
| Dell XPS 13 9310 2-in-1 | |
| HP Spectre x360 14t-ea000 | |
| GPD Win 3 | |
| Lenovo ThinkPad X12 20UVS03G00 | |
| PCMark 10 / Digital Content Creation | |
| Dell XPS 13 9310 2-in-1 | |
| Average Intel Core i7-1195G7, Intel Iris Xe Graphics G7 96EUs (4737 - 5941, n=6) | |
| GPD Win Max 2021 | |
| HP Spectre x360 14t-ea000 | |
| GPD Pocket 3 | |
| Lenovo ThinkPad X12 20UVS03G00 | |
| GPD Win 3 | |
| PCMark 10 Score | 5153 points | |
Help | ||
| AIDA64 / Memory Copy | |
| Dell XPS 13 9310 2-in-1 | |
| GPD Pocket 3 | |
| Lenovo ThinkPad X12 20UVS03G00 | |
| Average Intel Core i7-1195G7 (23332 - 57053, n=10) | |
| GPD Win Max 2021 | |
| AIDA64 / Memory Read | |
| Dell XPS 13 9310 2-in-1 | |
| Lenovo ThinkPad X12 20UVS03G00 | |
| GPD Pocket 3 | |
| GPD Win Max 2021 | |
| Average Intel Core i7-1195G7 (24068 - 53332, n=10) | |
| AIDA64 / Memory Write | |
| Dell XPS 13 9310 2-in-1 | |
| Lenovo ThinkPad X12 20UVS03G00 | |
| GPD Pocket 3 | |
| Average Intel Core i7-1195G7 (22151 - 59019, n=10) | |
| GPD Win Max 2021 | |
| AIDA64 / Memory Latency | |
| GPD Win Max 2021 | |
| Lenovo ThinkPad X12 20UVS03G00 | |
| Average Intel Core i7-1195G7 (69.8 - 114.4, n=10) | |
| Dell XPS 13 9310 2-in-1 | |
| GPD Pocket 3 | |
* ... smaller is better
DPC Latency
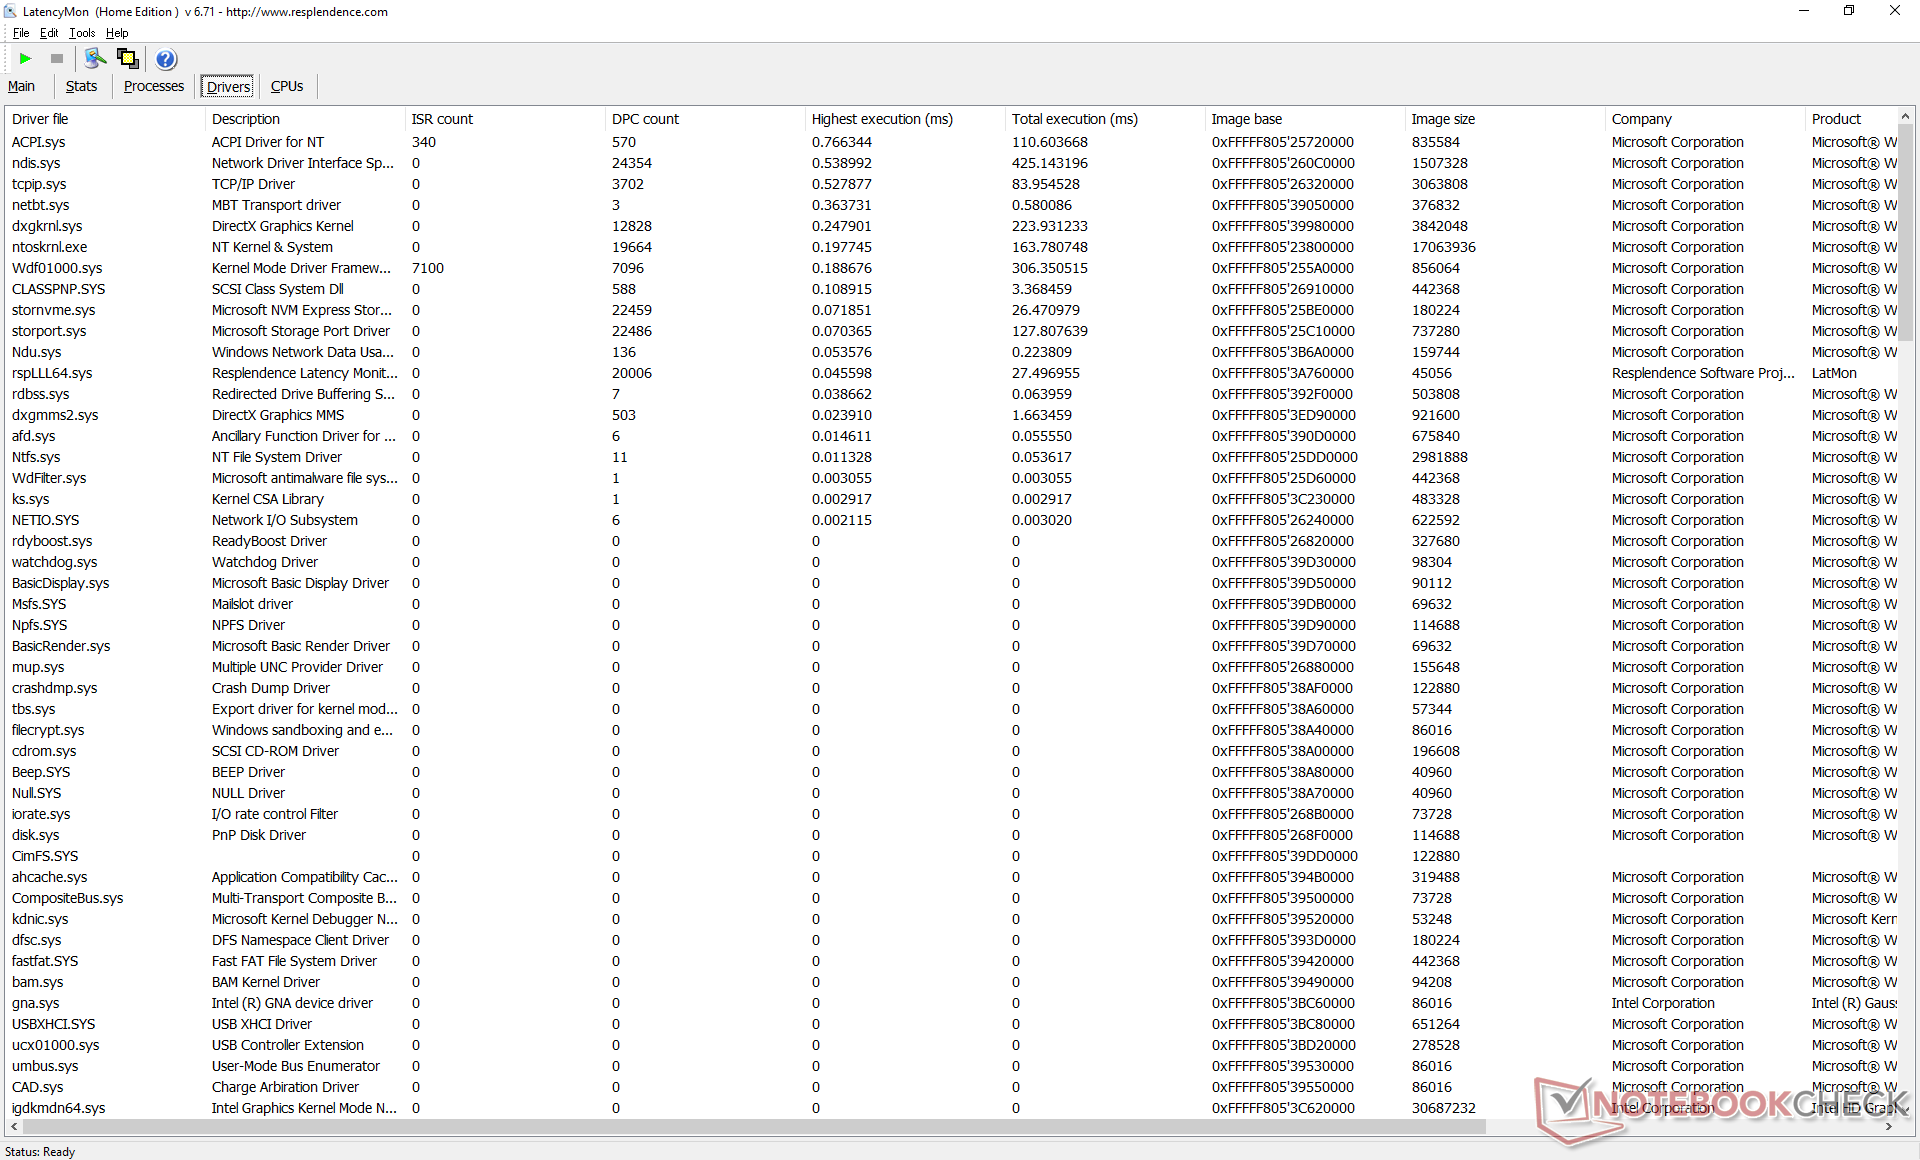
LatencyMon shows no DPC issues when opening multiple browser tabs on our homepage. 4K video playback at 60 FPS is smooth and with no dropped frames as well.
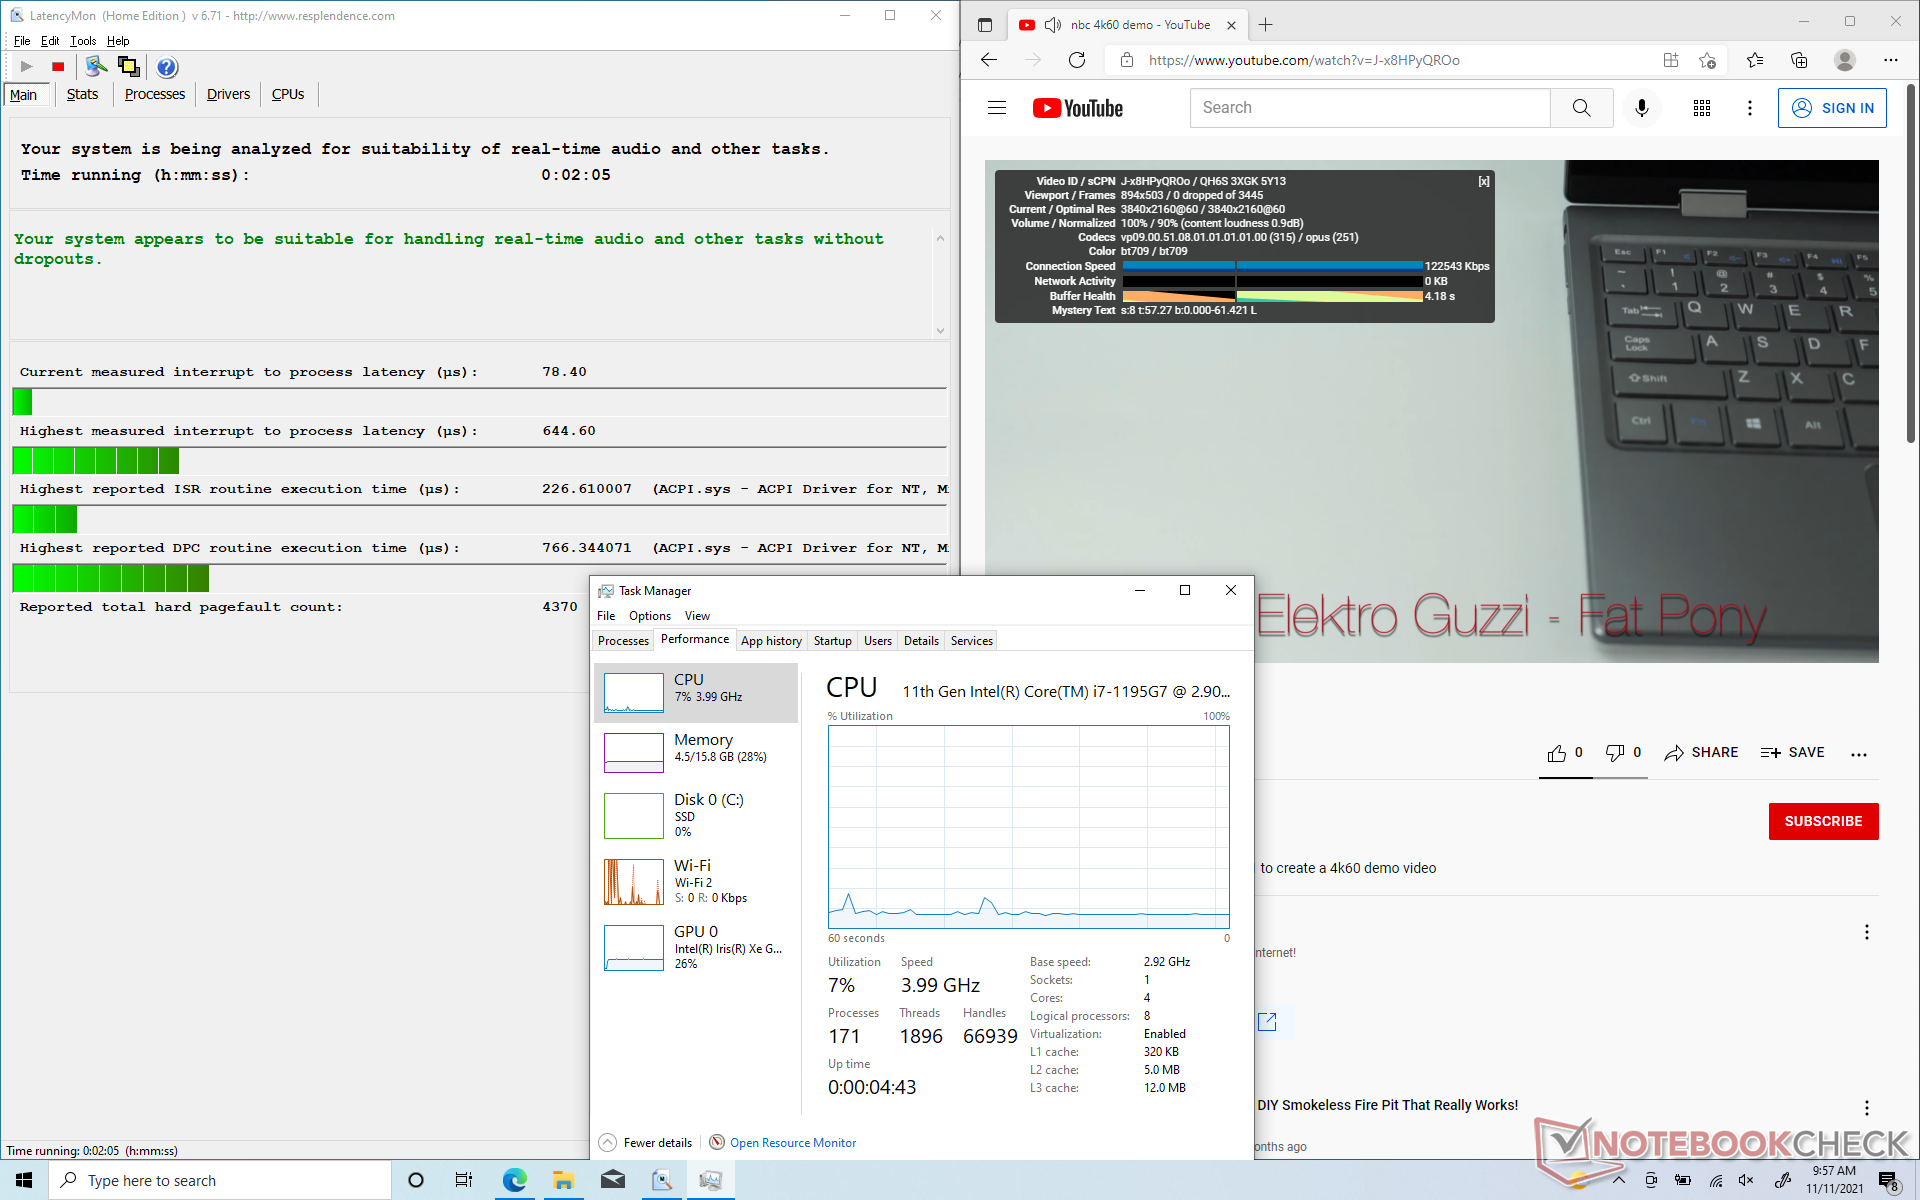
| DPC Latencies / LatencyMon - interrupt to process latency (max), Web, Youtube, Prime95 | |
| GPD Win Max 2021 | |
| HP Spectre x360 14t-ea000 | |
| GPD Win 3 | |
| GPD Pocket 3 | |
| Dell XPS 13 9310 2-in-1 | |
| Lenovo ThinkPad X12 20UVS03G00 | |
* ... smaller is better
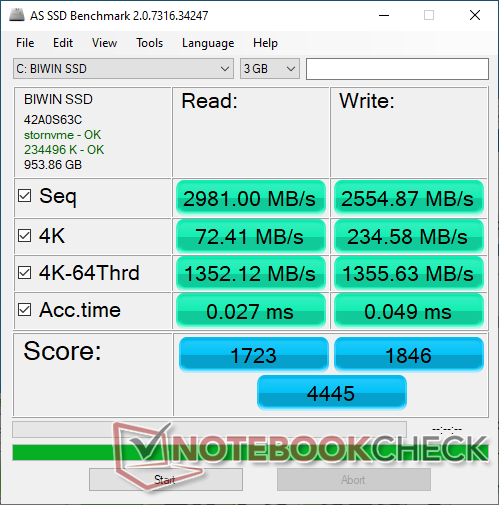
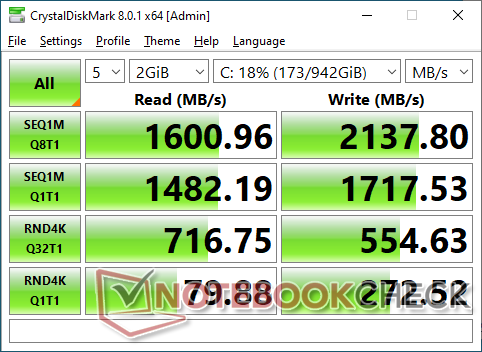
Storage Devices — Full Support for PCIe4 x4 Drives
Sequential read and write rates on our 1 TB BIWIN NQ200 drive top out at about 3500 MB/s and 2800 MB/s, respectively, according to CrystalDiskMark 5. However, performance degrades rather quickly after just a couple of minutes according to our DiskSpd loop test since the drive lacks a heat spreader.

| Drive Performance rating - Percent | |
| Average BiWin NQ200 1TB CNF82GS1D00-1TB | |
| GPD Pocket 3 | |
| GPD Win 3 | |
| GPD Win Max 2021 | |
| HP Spectre x360 14t-ea000 | |
| Dell XPS 13 9310 2-in-1 | |
| Lenovo ThinkPad X12 20UVS03G00 | |
* ... smaller is better
Disk Throttling: DiskSpd Read Loop, Queue Depth 8
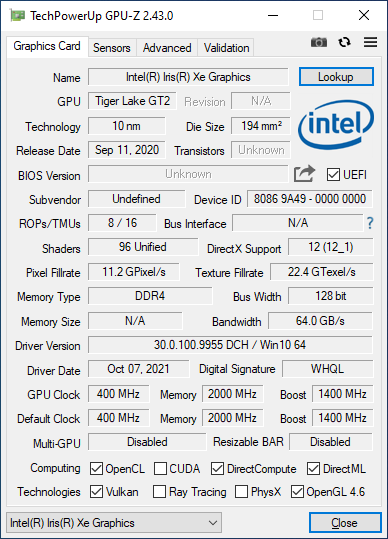
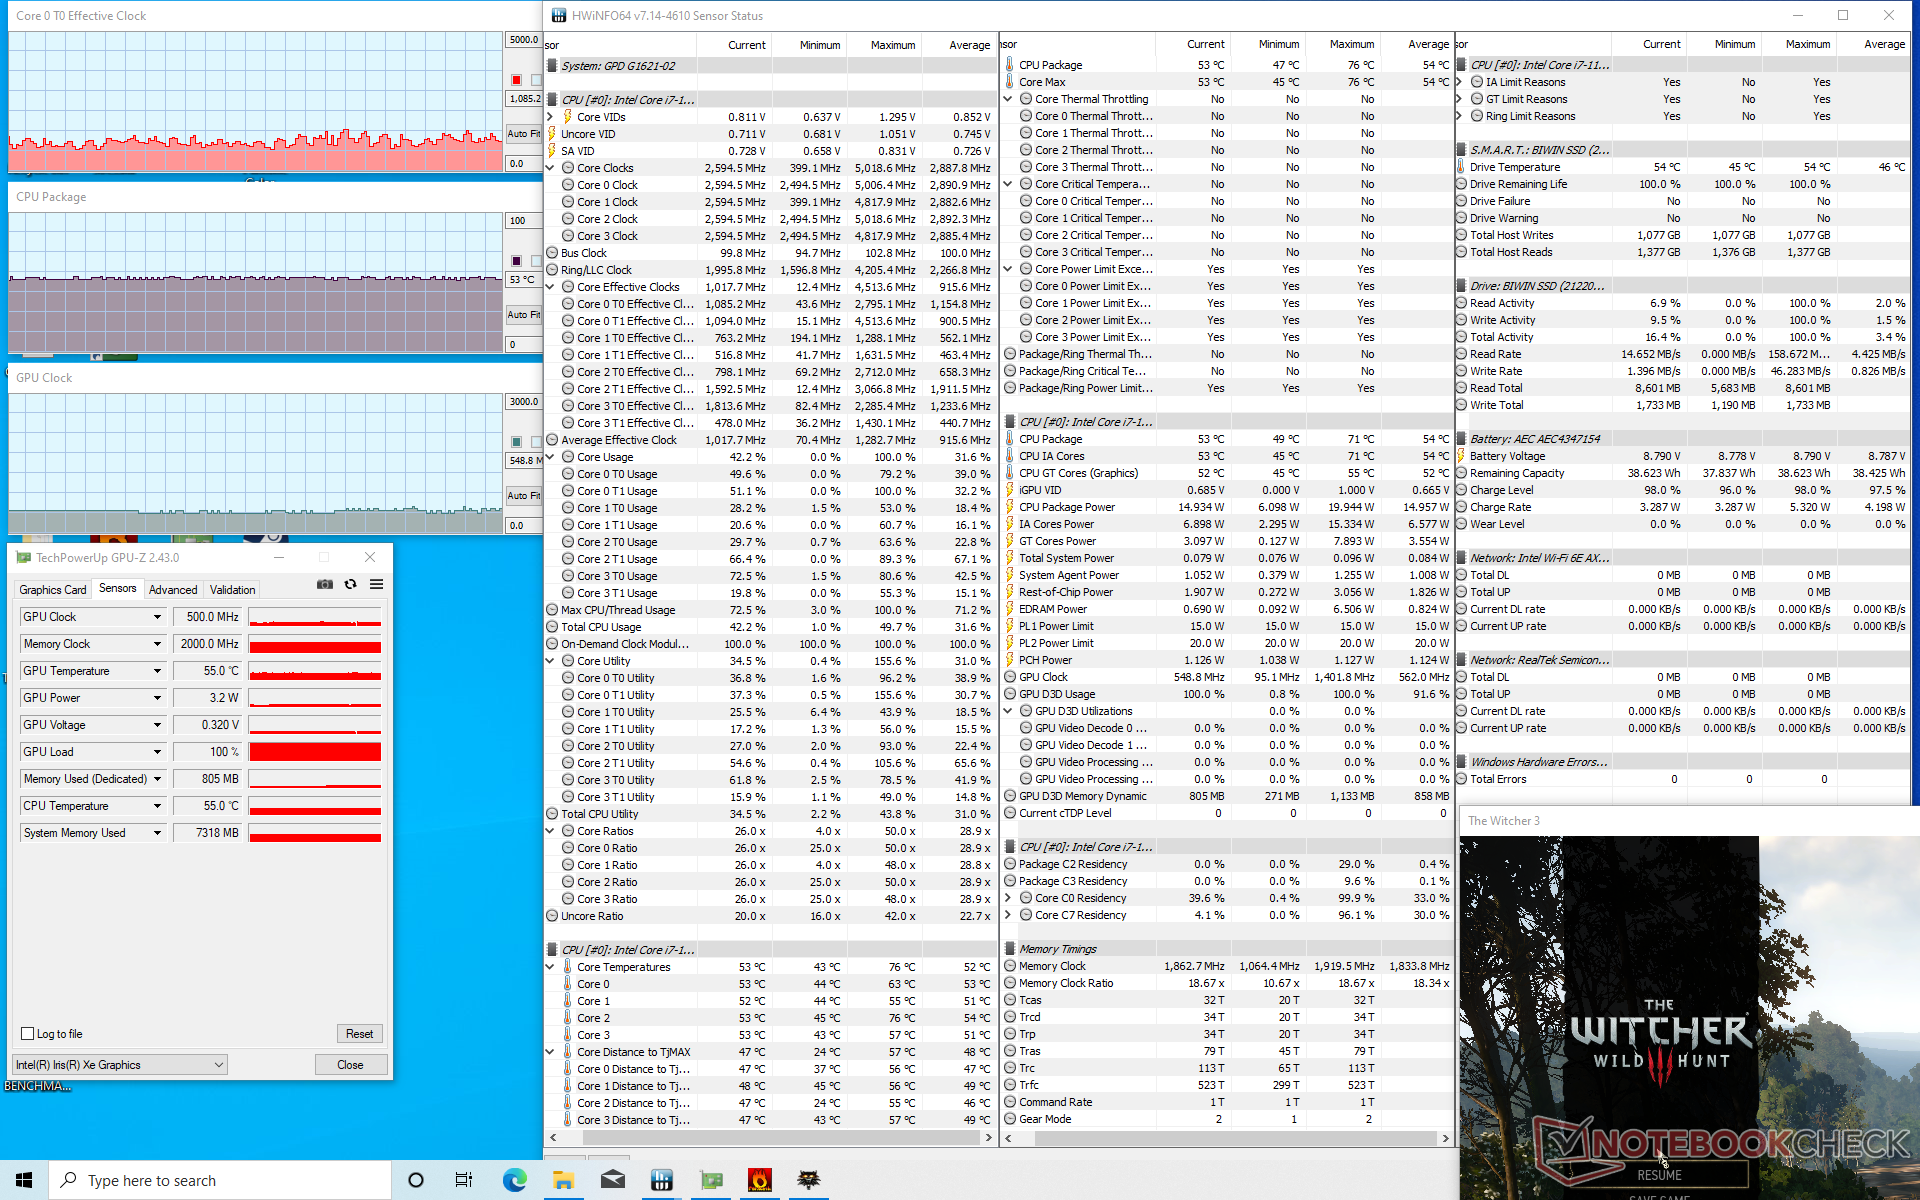
GPU Performance — Iris Xe
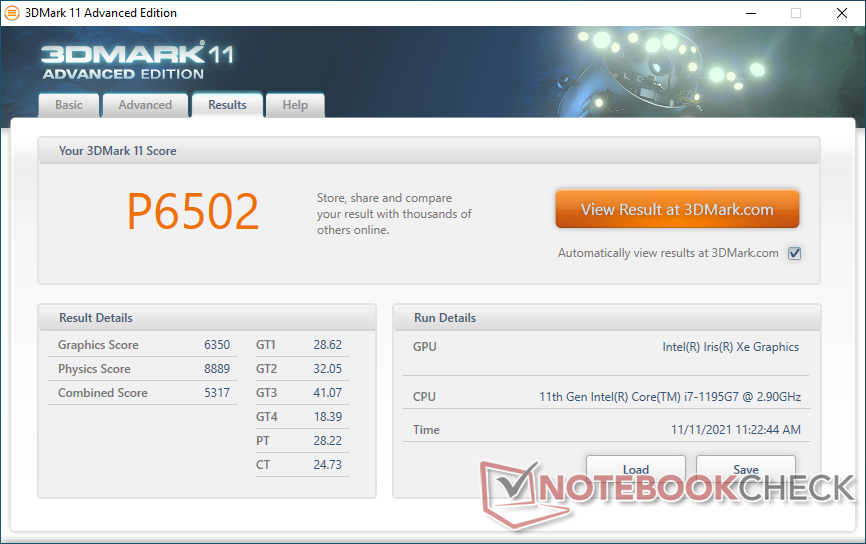
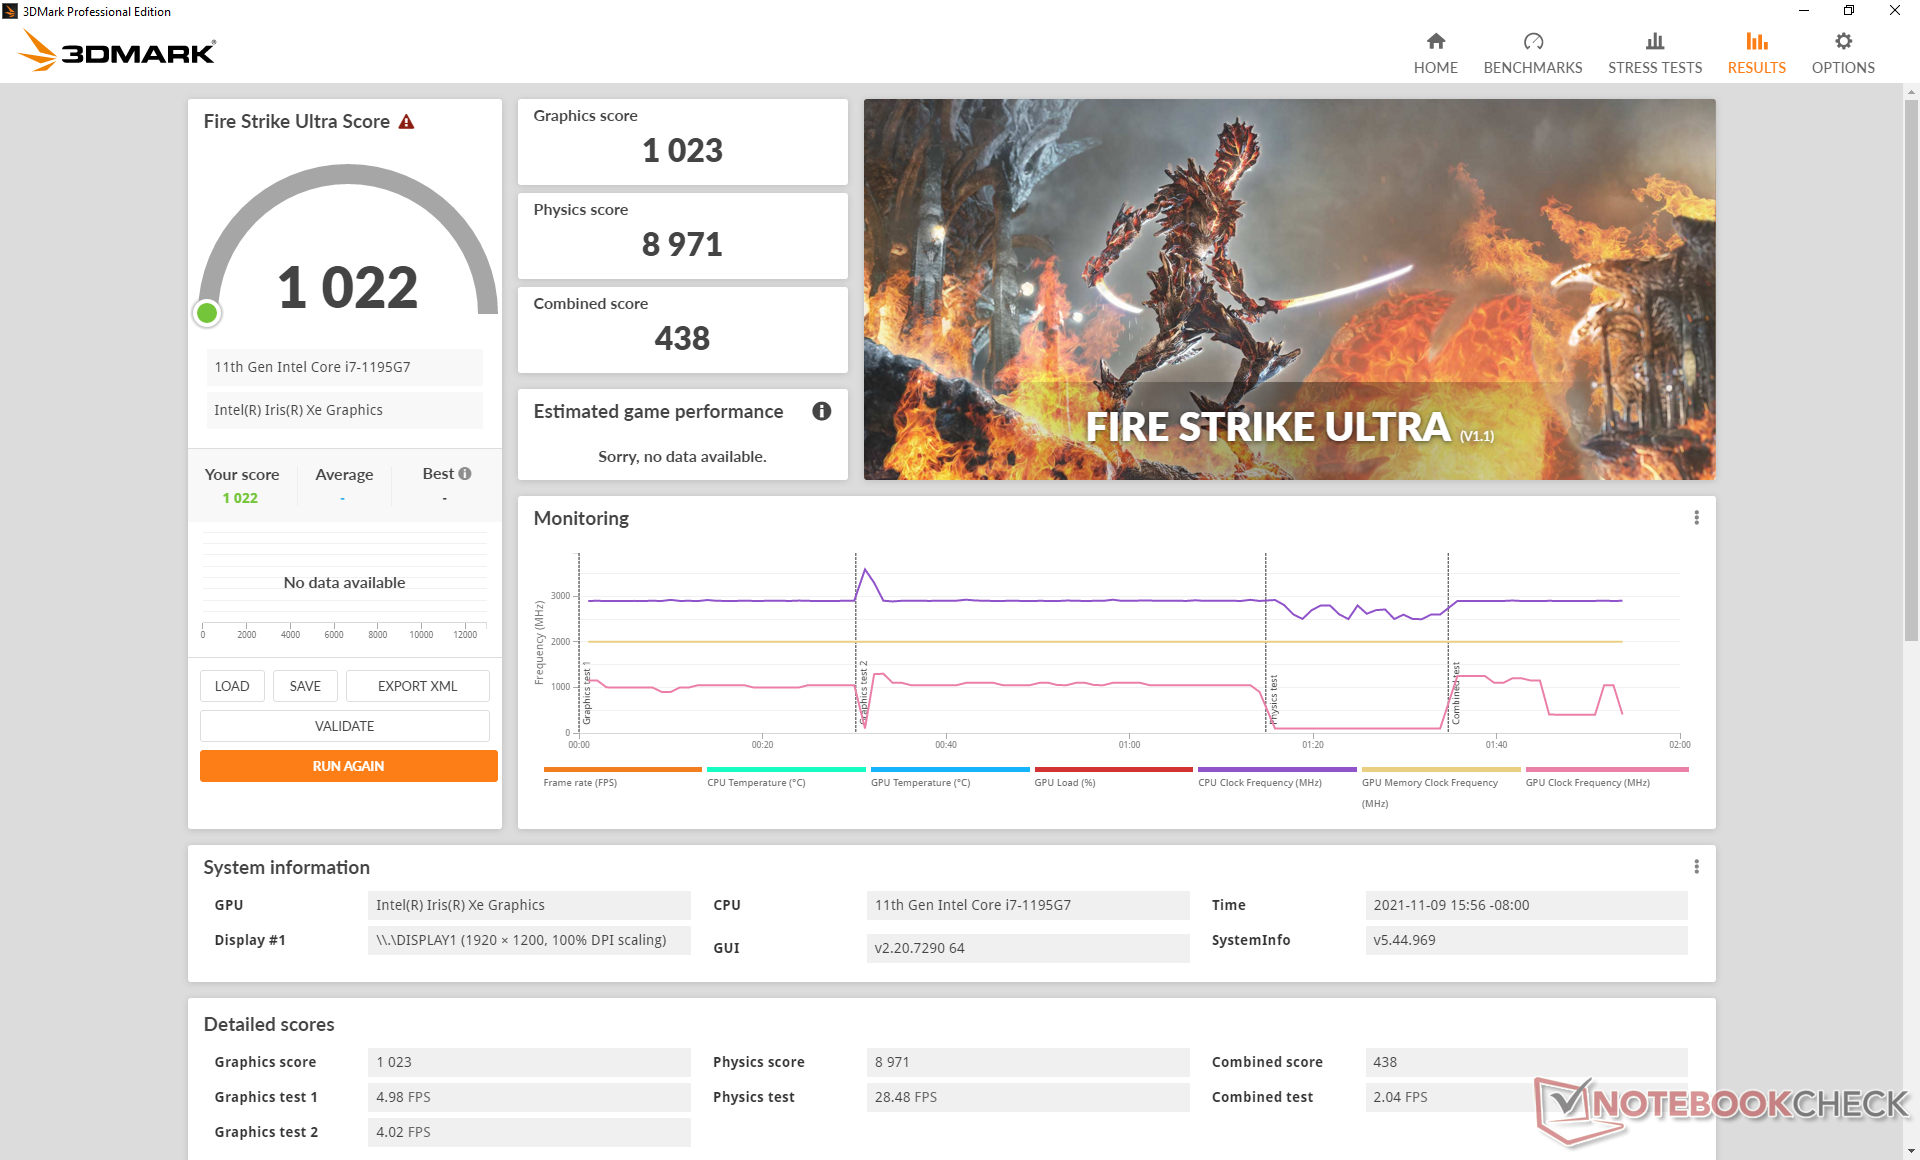
Graphics performance at the default BIOS power level is disappointing at 30 to 35 percent slower than the average Iris Xe 96 EUs in our database. Fortunately, running on the higher BIOS power level will boost our GPU to match where we would expect the average Iris Xe 96 EUs to perform. Running 3DMark 11 on the higher power level, for example, would return a GPU score of 6350 points compared to only 2942 points if on the default power level. Similar differences can be observed when gaming as well.
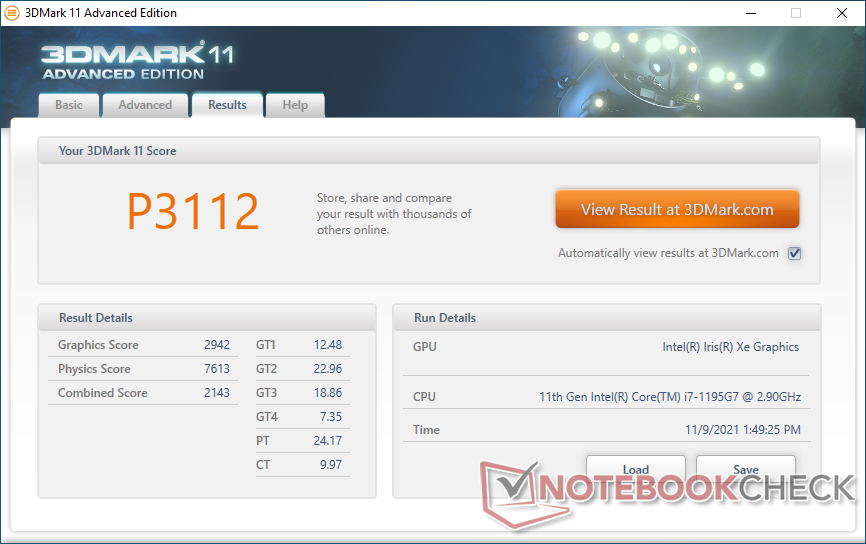
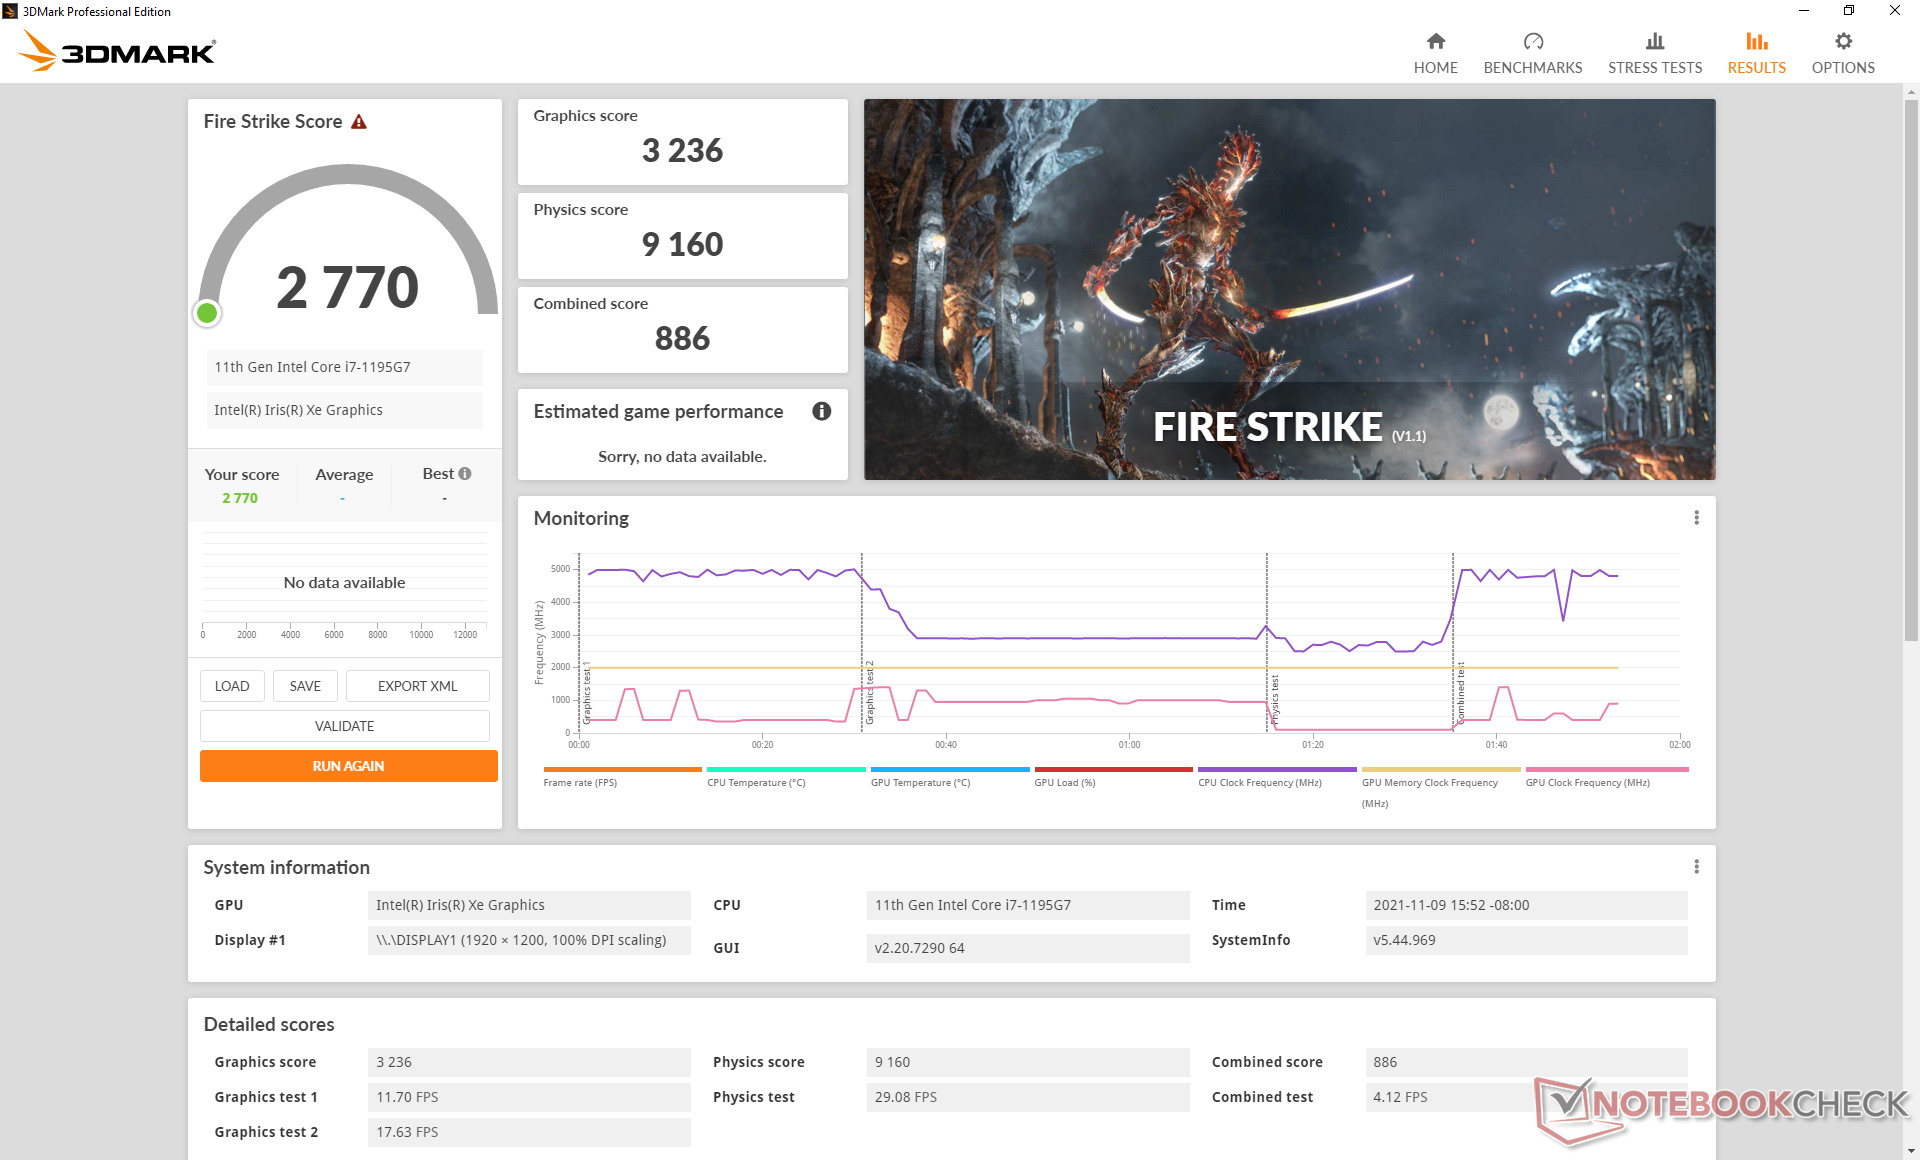
| 3DMark 11 Performance | 3112 points | |
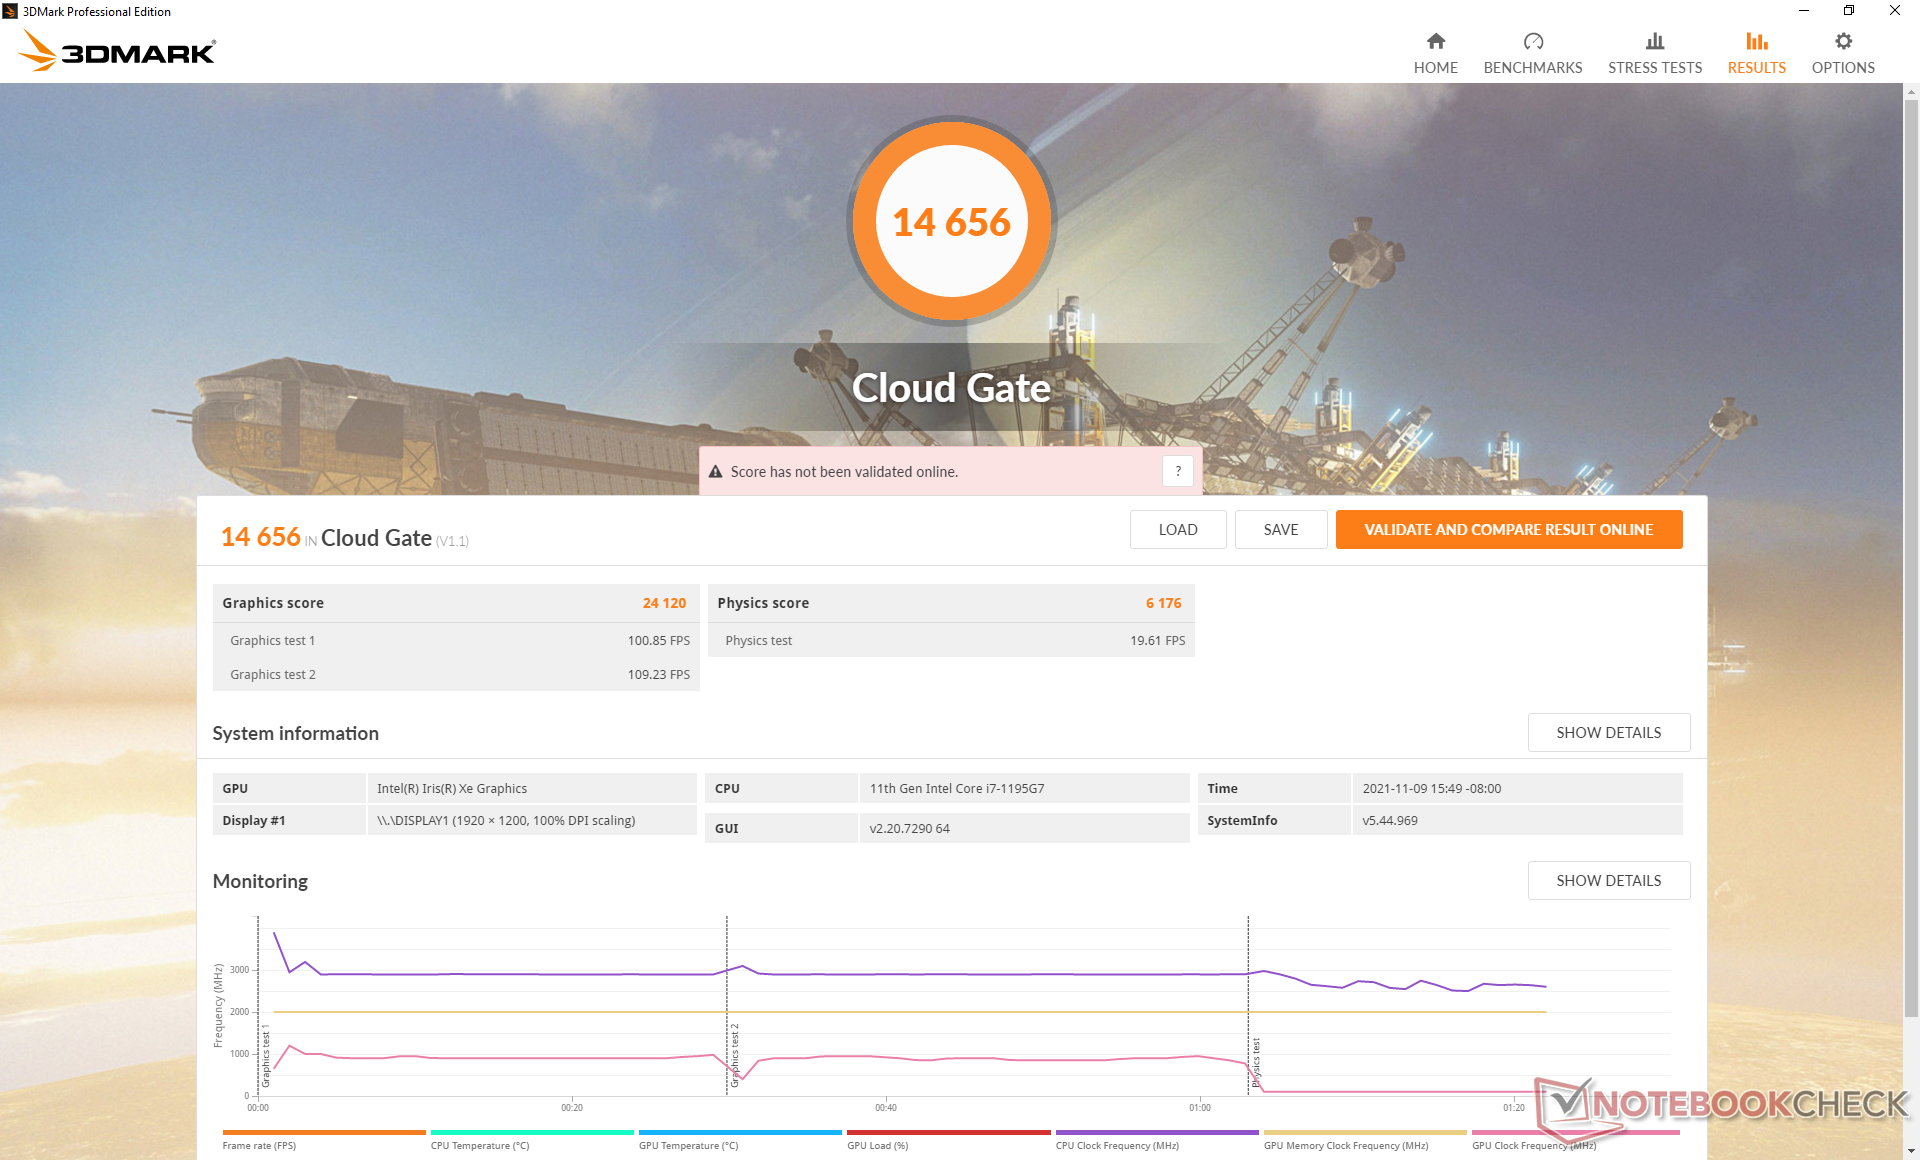
| 3DMark Cloud Gate Standard Score | 14656 points | |
| 3DMark Fire Strike Score | 2770 points | |
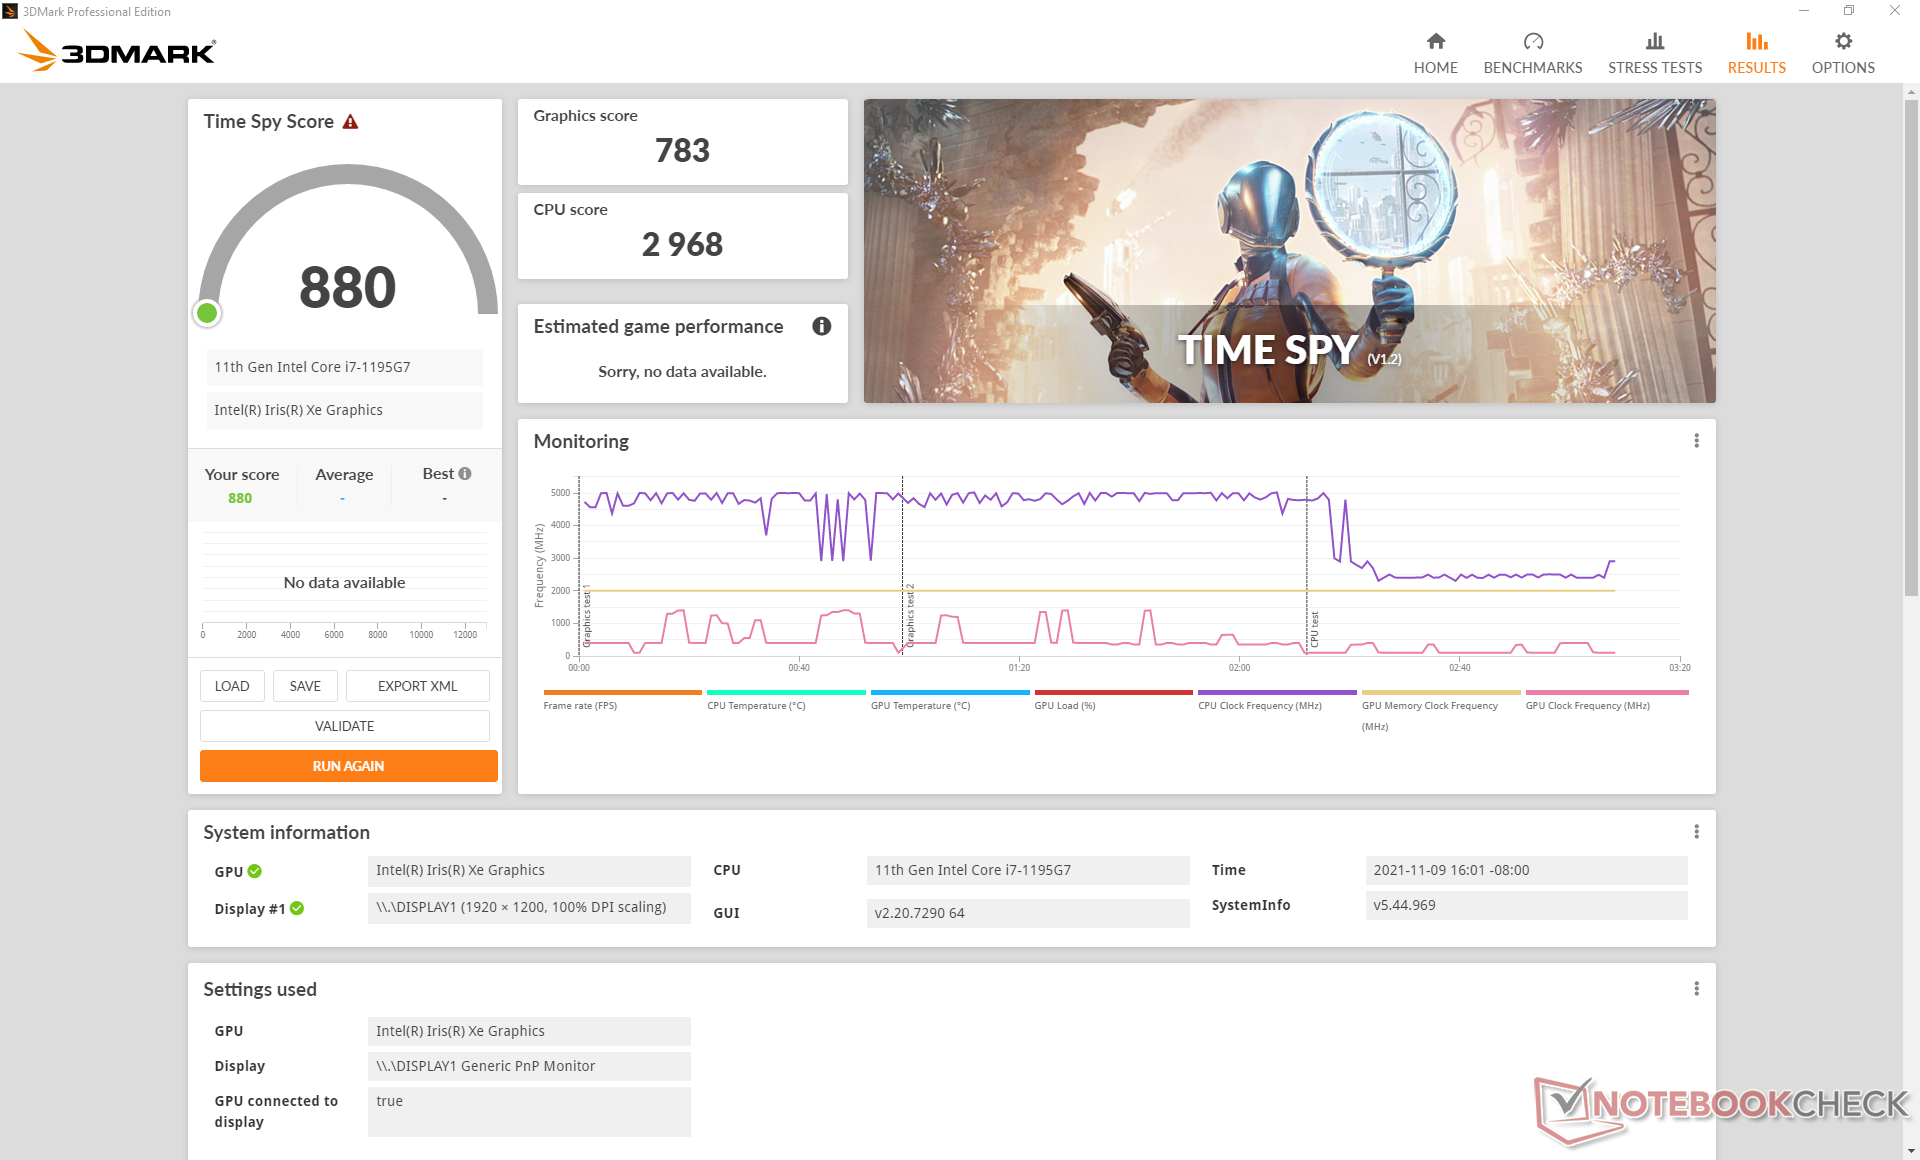
| 3DMark Time Spy Score | 880 points | |
Help | ||
Witcher 3 FPS Chart
| low | med. | high | ultra | |
|---|---|---|---|---|
| GTA V (2015) | 66.1 | 61.3 | 20.6 | 8.99 |
| The Witcher 3 (2015) | 45.3 | 36.8 | 21.2 | 10.5 |
| Dota 2 Reborn (2015) | 95.9 | 68.9 | 45.4 | 41.2 |
| Final Fantasy XV Benchmark (2018) | 27.7 | 16.8 | 11.9 | |
| X-Plane 11.11 (2018) | 22 | 18.8 | 19 | |
| Far Cry 5 (2018) | 44 | 28 | 25 | 24 |
| Strange Brigade (2018) | 70.6 | 32.4 | 26.7 | 21.8 |
Emissions
System Noise — High-Pitched when Under Load
A Turbo Fan mode key can be found next to touchpad. If enabled, the fan will pulse rather frequently to as high as 31.4 dB(A) against a silent background of 23.4 dB(A) when web browsing or video streaming. Thus, it's recommended to turn the mode off when running lower loads or when working in noise-sensitive environments.
Fan noise maxes out at just under 41 dB(A) when running higher loads like games even when on the higher BIOS power level setting. Though the fan is somewhat high-pitched, it is at least generally quieter than the Win Max or Win 3 under similar conditions.
Noise level
| Idle |
| 24.3 / 25.6 / 25.6 dB(A) |
| DVD |
| 40.7 / dB(A) |
| Load |
| 38.3 / 40.7 dB(A) |
 | ||
30 dB silent 40 dB(A) audible 50 dB(A) loud |
||
min: | ||
| GPD Pocket 3 Iris Xe G7 96EUs, i7-1195G7, BiWin NQ200 1TB CNF82GS1D00-1TB | GPD Win Max 2021 Vega 8, R7 4800U, BIWIN NS200 512GB CNF82GS1G00-512 | GPD Win 3 Iris Xe G7 80EUs, i5-1135G7, BIWIN NS200 1TB CNF82GS1G02-1TB | Lenovo ThinkPad X12 20UVS03G00 Iris Xe G7 96EUs, i7-1160G7, Toshiba BG4 KBG40ZNT512G | Dell XPS 13 9310 2-in-1 Iris Xe G7 96EUs, i7-1165G7, Toshiba BG4 KBG40ZPZ512G | HP Spectre x360 14t-ea000 Iris Xe G7 96EUs, i7-1165G7, Samsung SSD PM981a MZVLB512HBJQ | |
|---|---|---|---|---|---|---|
| Noise | -11% | -13% | 3% | 1% | 3% | |
| off / environment * (dB) | 23.4 | 23.3 -0% | 27.4 -17% | 25.1 -7% | 24.3 -4% | 25.8 -10% |
| Idle Minimum * (dB) | 24.3 | 26.6 -9% | 29.1 -20% | 25.1 -3% | 24.8 -2% | 25.9 -7% |
| Idle Average * (dB) | 25.6 | 26.6 -4% | 29.1 -14% | 25.1 2% | 24.8 3% | 25.9 -1% |
| Idle Maximum * (dB) | 25.6 | 26.6 -4% | 29.1 -14% | 26 -2% | 24.8 3% | 25.9 -1% |
| Load Average * (dB) | 38.3 | 46.9 -22% | 40.7 -6% | 34.6 10% | 38 1% | 26.4 31% |
| Witcher 3 ultra * (dB) | 40.7 | 49 -20% | 42.8 -5% | 34.6 15% | 38 7% | 36.9 9% |
| Load Maximum * (dB) | 40.7 | 49.2 -21% | 46.3 -14% | 37 9% | 41.5 -2% | 41.5 -2% |
* ... smaller is better
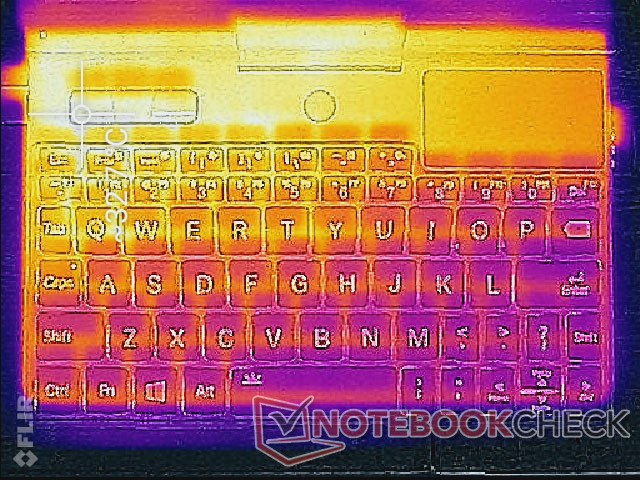
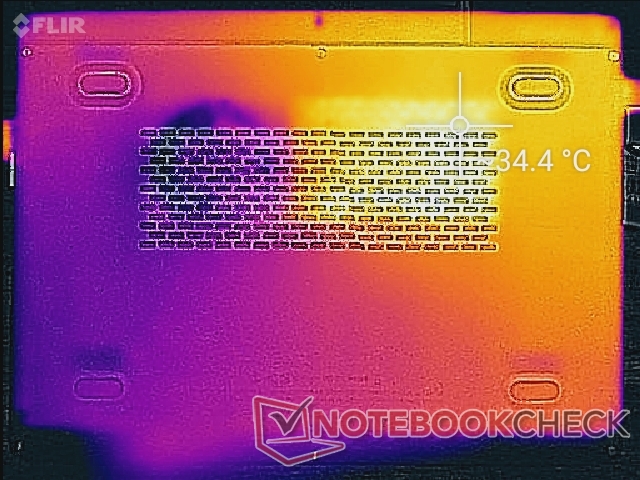
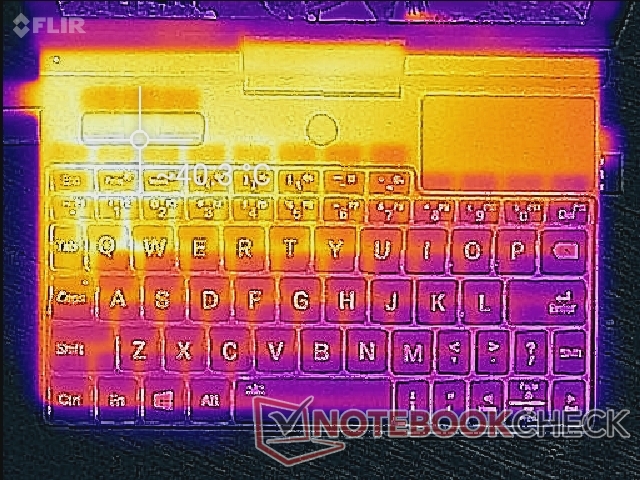
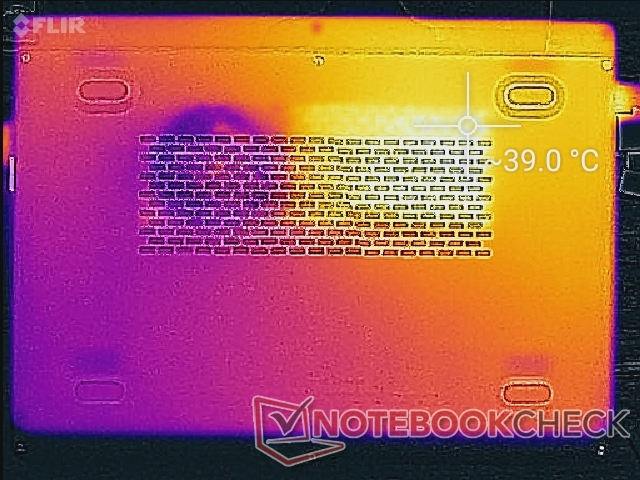
Temperature
Hot spots are more toward the rear of the chassis in order to keep the keyboard keys as cool as possible. The dedicated mouse buttons near the top right corner can reach over 40 C when running demanding loads like games.
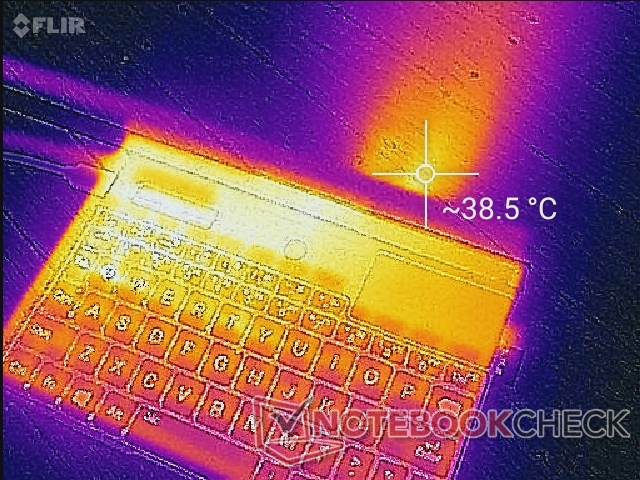
(±) The maximum temperature on the upper side is 40.4 °C / 105 F, compared to the average of 37.9 °C / 100 F, ranging from 26.6 to 55 °C for the class Handheld / UMPC.
(+) The bottom heats up to a maximum of 39.4 °C / 103 F, compared to the average of 37.3 °C / 99 F
(+) In idle usage, the average temperature for the upper side is 29.4 °C / 85 F, compared to the device average of 32.1 °C / 90 F.
(+) The palmrests and touchpad are cooler than skin temperature with a maximum of 31.8 °C / 89.2 F and are therefore cool to the touch.
(±) The average temperature of the palmrest area of similar devices was 31.4 °C / 88.5 F (-0.4 °C / -0.7 F).
| GPD Pocket 3 Intel Core i7-1195G7, Intel Iris Xe Graphics G7 96EUs | GPD Win Max 2021 AMD Ryzen 7 4800U, AMD Radeon RX Vega 8 (Ryzen 4000/5000) | Lenovo ThinkPad X12 20UVS03G00 Intel Core i7-1160G7, Intel Iris Xe Graphics G7 96EUs | Dell XPS 13 9310 2-in-1 Intel Core i7-1165G7, Intel Iris Xe Graphics G7 96EUs | HP Spectre x360 14t-ea000 Intel Core i7-1165G7, Intel Iris Xe Graphics G7 96EUs | HP Envy 13-ba0001ng Intel Core i7-10510U, NVIDIA GeForce MX350 | |
|---|---|---|---|---|---|---|
| Heat | 10% | 11% | 1% | -1% | 16% | |
| Maximum Upper Side * (°C) | 40.4 | 38 6% | 39 3% | 51 -26% | 40.4 -0% | 38 6% |
| Maximum Bottom * (°C) | 39.4 | 36.4 8% | 41.7 -6% | 45.4 -15% | 52.8 -34% | 37.1 6% |
| Idle Upper Side * (°C) | 32.6 | 30 8% | 25.6 21% | 24.4 25% | 27.2 17% | 24.5 25% |
| Idle Bottom * (°C) | 34.4 | 28 19% | 25.6 26% | 27.4 20% | 29.2 15% | 25 27% |
* ... smaller is better
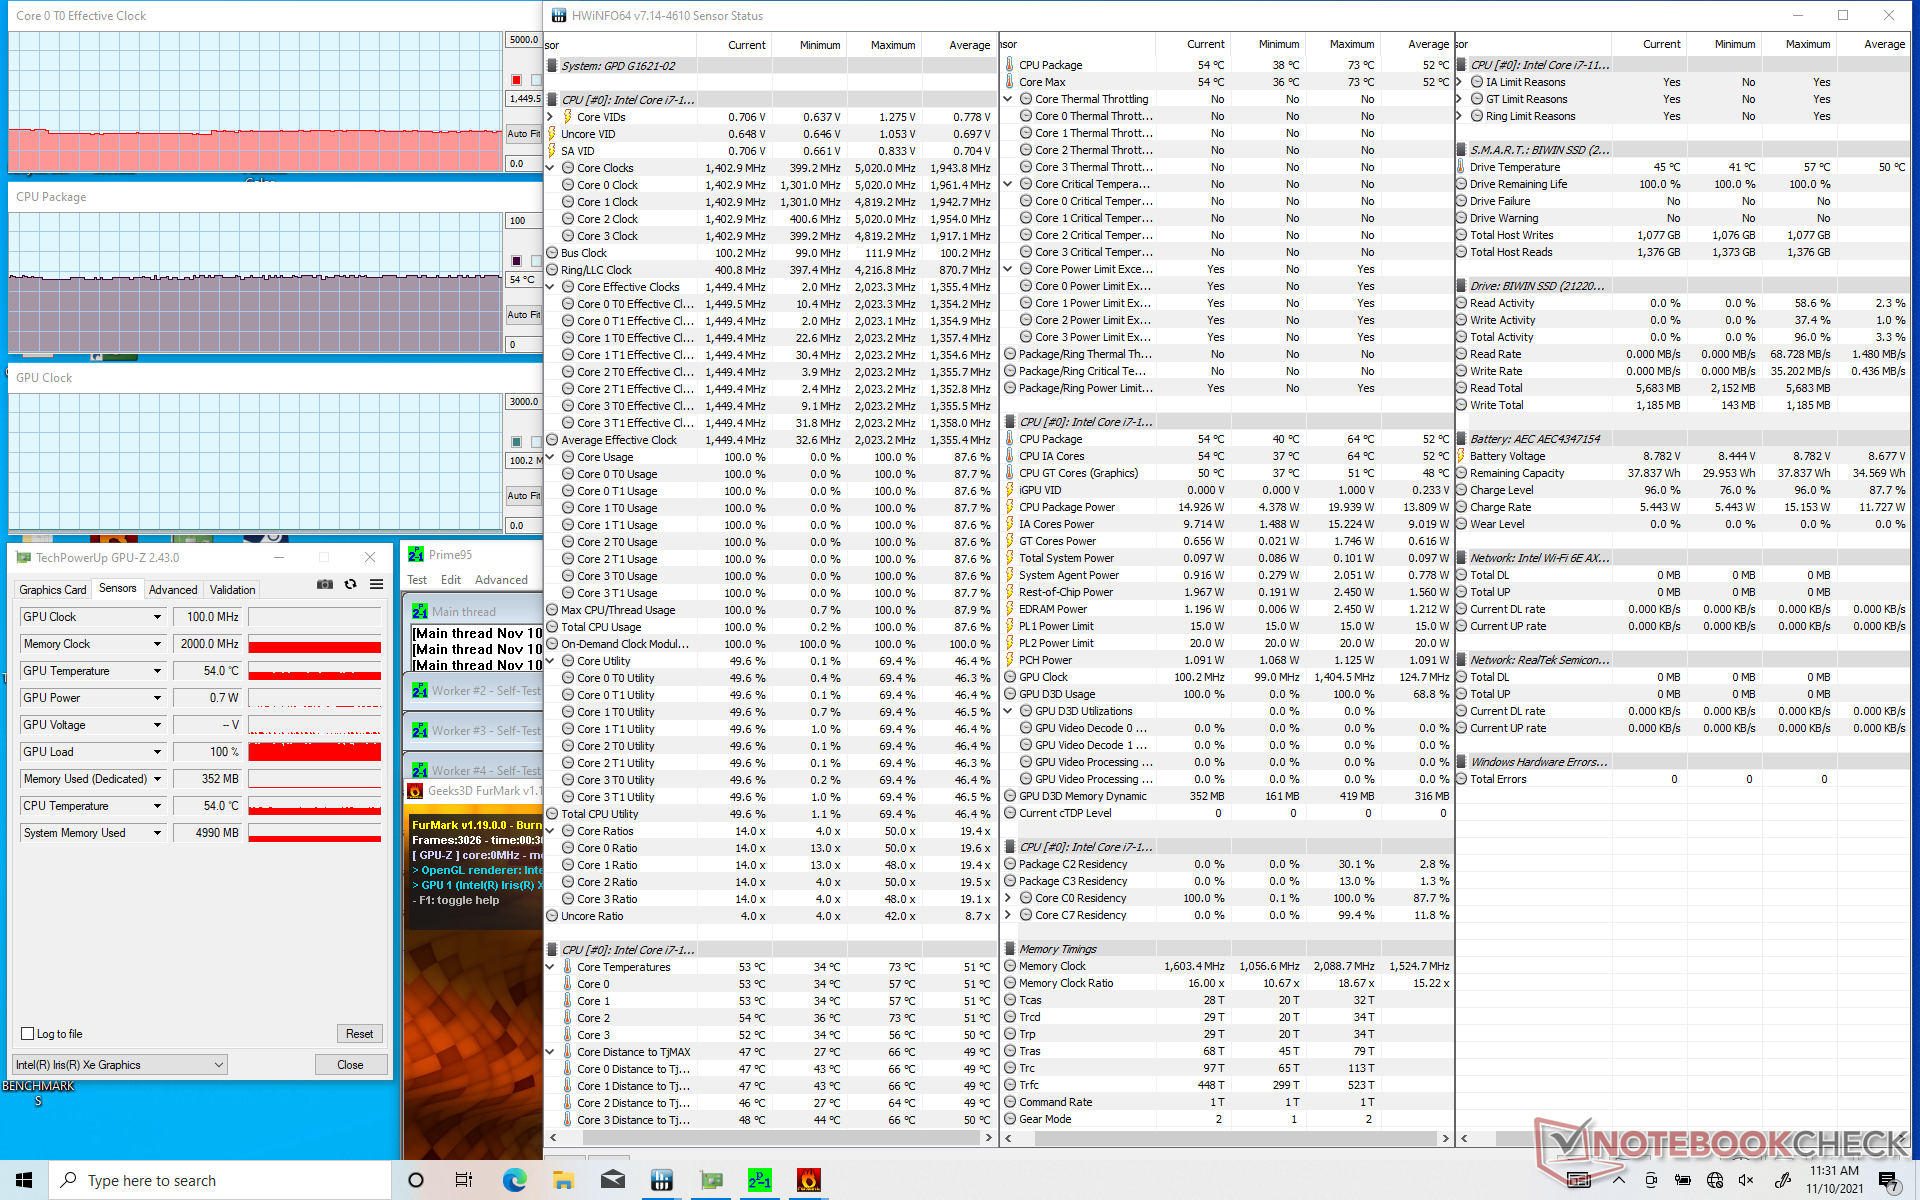
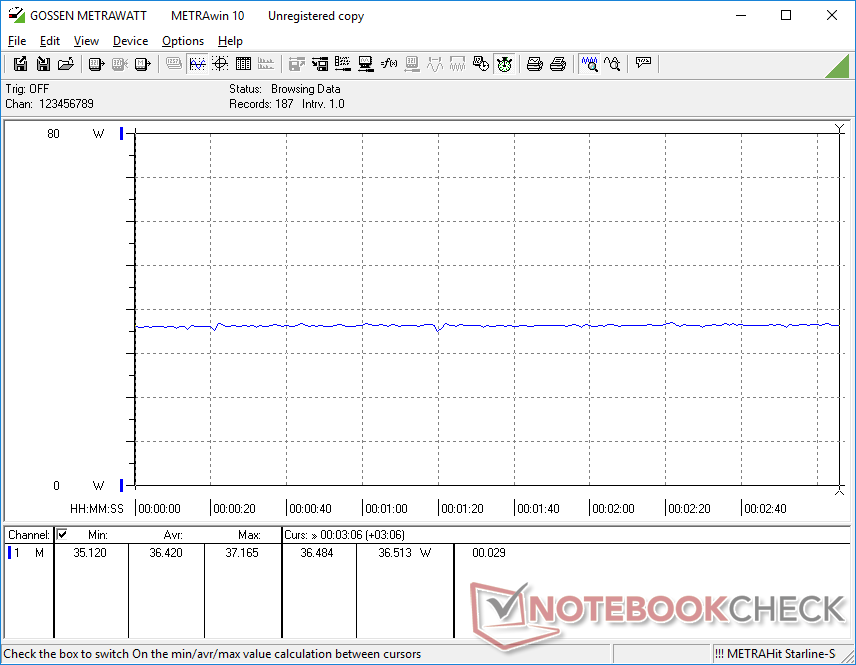
Stress Test
We stress the system on its default BIOS power level to show how much slower it can be when compared to the higher power level setting. Running Prime95, for example, shows the CPU stabilizing in the 1.5 to 1.8 GHz compared to 3.2 GHz on the XPG Xenia 14 equipped with a similar Core i7 CPU. Our Iris Xe GPU would also stabilize at at just 500 MHz compared to 1300 MHz on the aforementioned XPG when running Witcher 3.
Running on batteries will not impact performance. A 3DMark 11 test on battery power and on the higher BIOS power level would return Physics and graphics scores of 9082 and 6618 points, respectively, compared to 8889 and 6350 points when on mains.
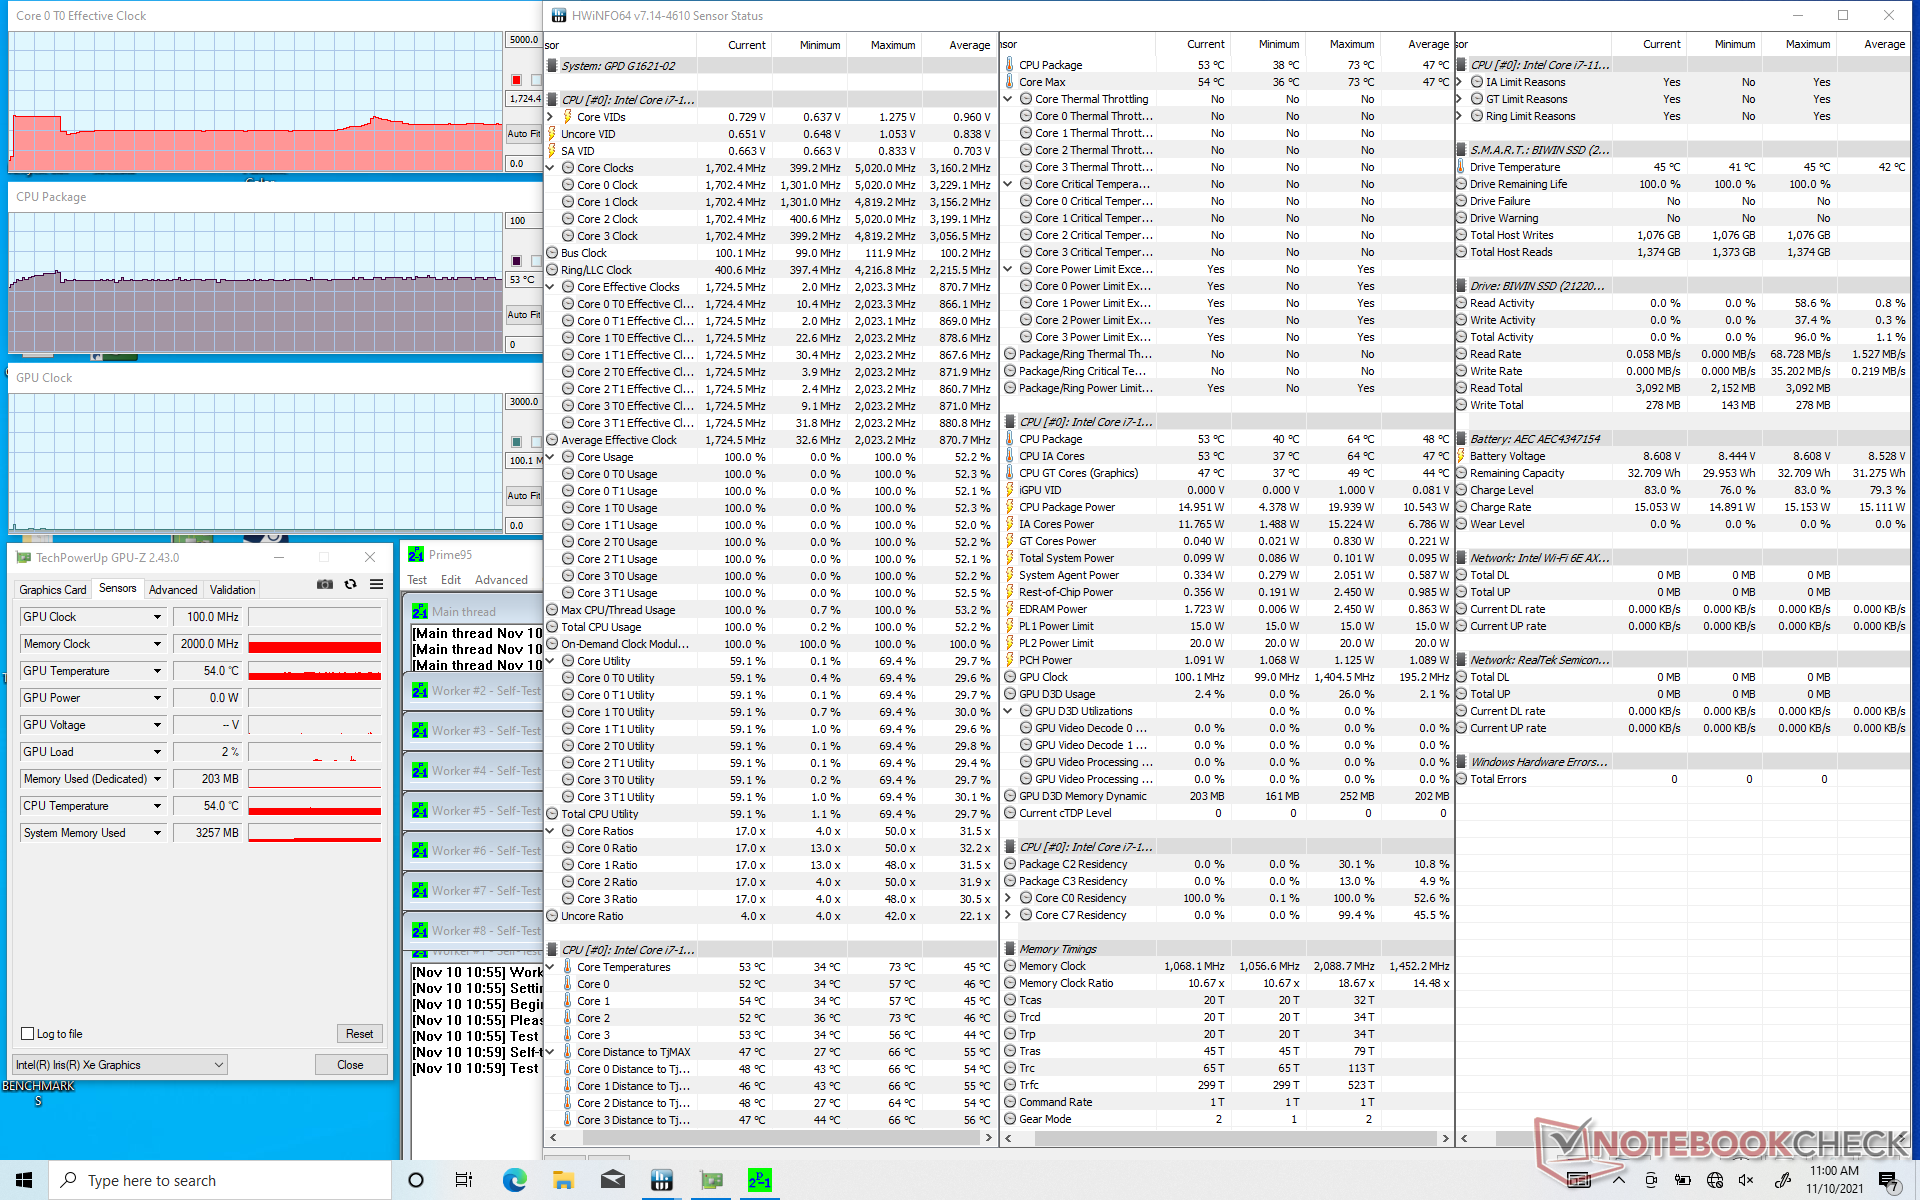
| CPU Clock (GHz) | GPU Clock (MHz) | Average CPU Temperature (°C) | |
| System Idle (Default power level) | -- | -- | 41 |
| Prime95 Stress (Default power level) | 1.5 - 1.8 | -- | 53 |
| Prime95 + FurMark Stress (Default power level) | 1.5 | 100 | 54 |
| Witcher 3 Stress (Default power level) | 0.5 - 1.5 | 500 | 53 |
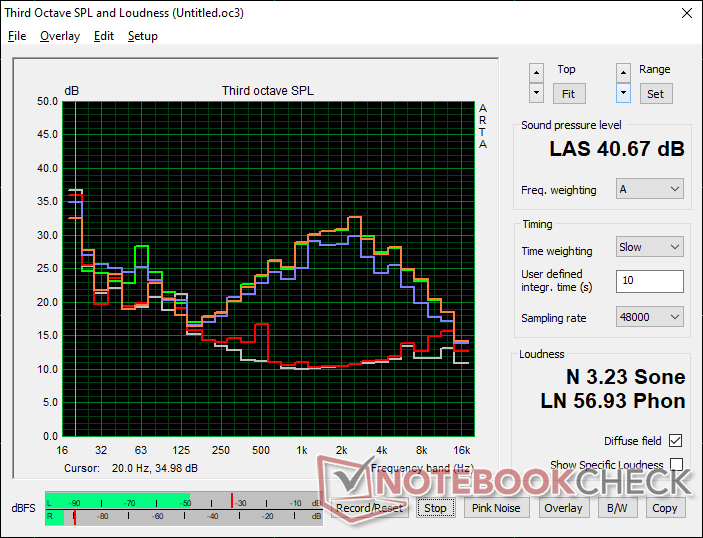
Speakers — High Volume, Low Quality
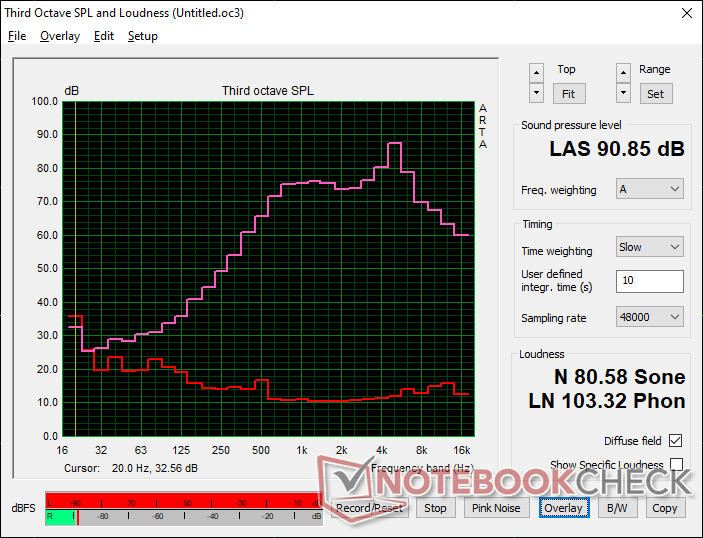
GPD Pocket 3 audio analysis
(+) | speakers can play relatively loud (90.9 dB)
Bass 100 - 315 Hz
(-) | nearly no bass - on average 28.6% lower than median
(+) | bass is linear (6.5% delta to prev. frequency)
Mids 400 - 2000 Hz
(+) | balanced mids - only 4.3% away from median
(+) | mids are linear (5.2% delta to prev. frequency)
Highs 2 - 16 kHz
(±) | higher highs - on average 6.4% higher than median
(±) | linearity of highs is average (8.1% delta to prev. frequency)
Overall 100 - 16.000 Hz
(±) | linearity of overall sound is average (20.2% difference to median)
Compared to same class
» 67% of all tested devices in this class were better, 14% similar, 19% worse
» The best had a delta of 12%, average was 18%, worst was 23%
Compared to all devices tested
» 51% of all tested devices were better, 8% similar, 40% worse
» The best had a delta of 4%, average was 24%, worst was 134%
Apple MacBook 12 (Early 2016) 1.1 GHz audio analysis
(+) | speakers can play relatively loud (83.6 dB)
Bass 100 - 315 Hz
(±) | reduced bass - on average 11.3% lower than median
(±) | linearity of bass is average (14.2% delta to prev. frequency)
Mids 400 - 2000 Hz
(+) | balanced mids - only 2.4% away from median
(+) | mids are linear (5.5% delta to prev. frequency)
Highs 2 - 16 kHz
(+) | balanced highs - only 2% away from median
(+) | highs are linear (4.5% delta to prev. frequency)
Overall 100 - 16.000 Hz
(+) | overall sound is linear (10.2% difference to median)
Compared to same class
» 7% of all tested devices in this class were better, 2% similar, 91% worse
» The best had a delta of 5%, average was 18%, worst was 53%
Compared to all devices tested
» 4% of all tested devices were better, 1% similar, 94% worse
» The best had a delta of 4%, average was 24%, worst was 134%
Energy Management
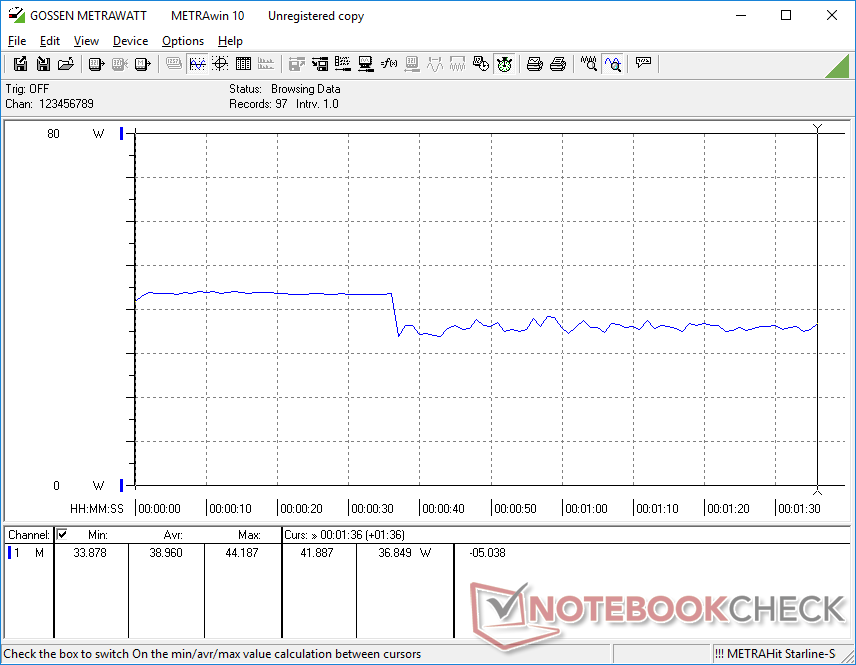
Power Consumption
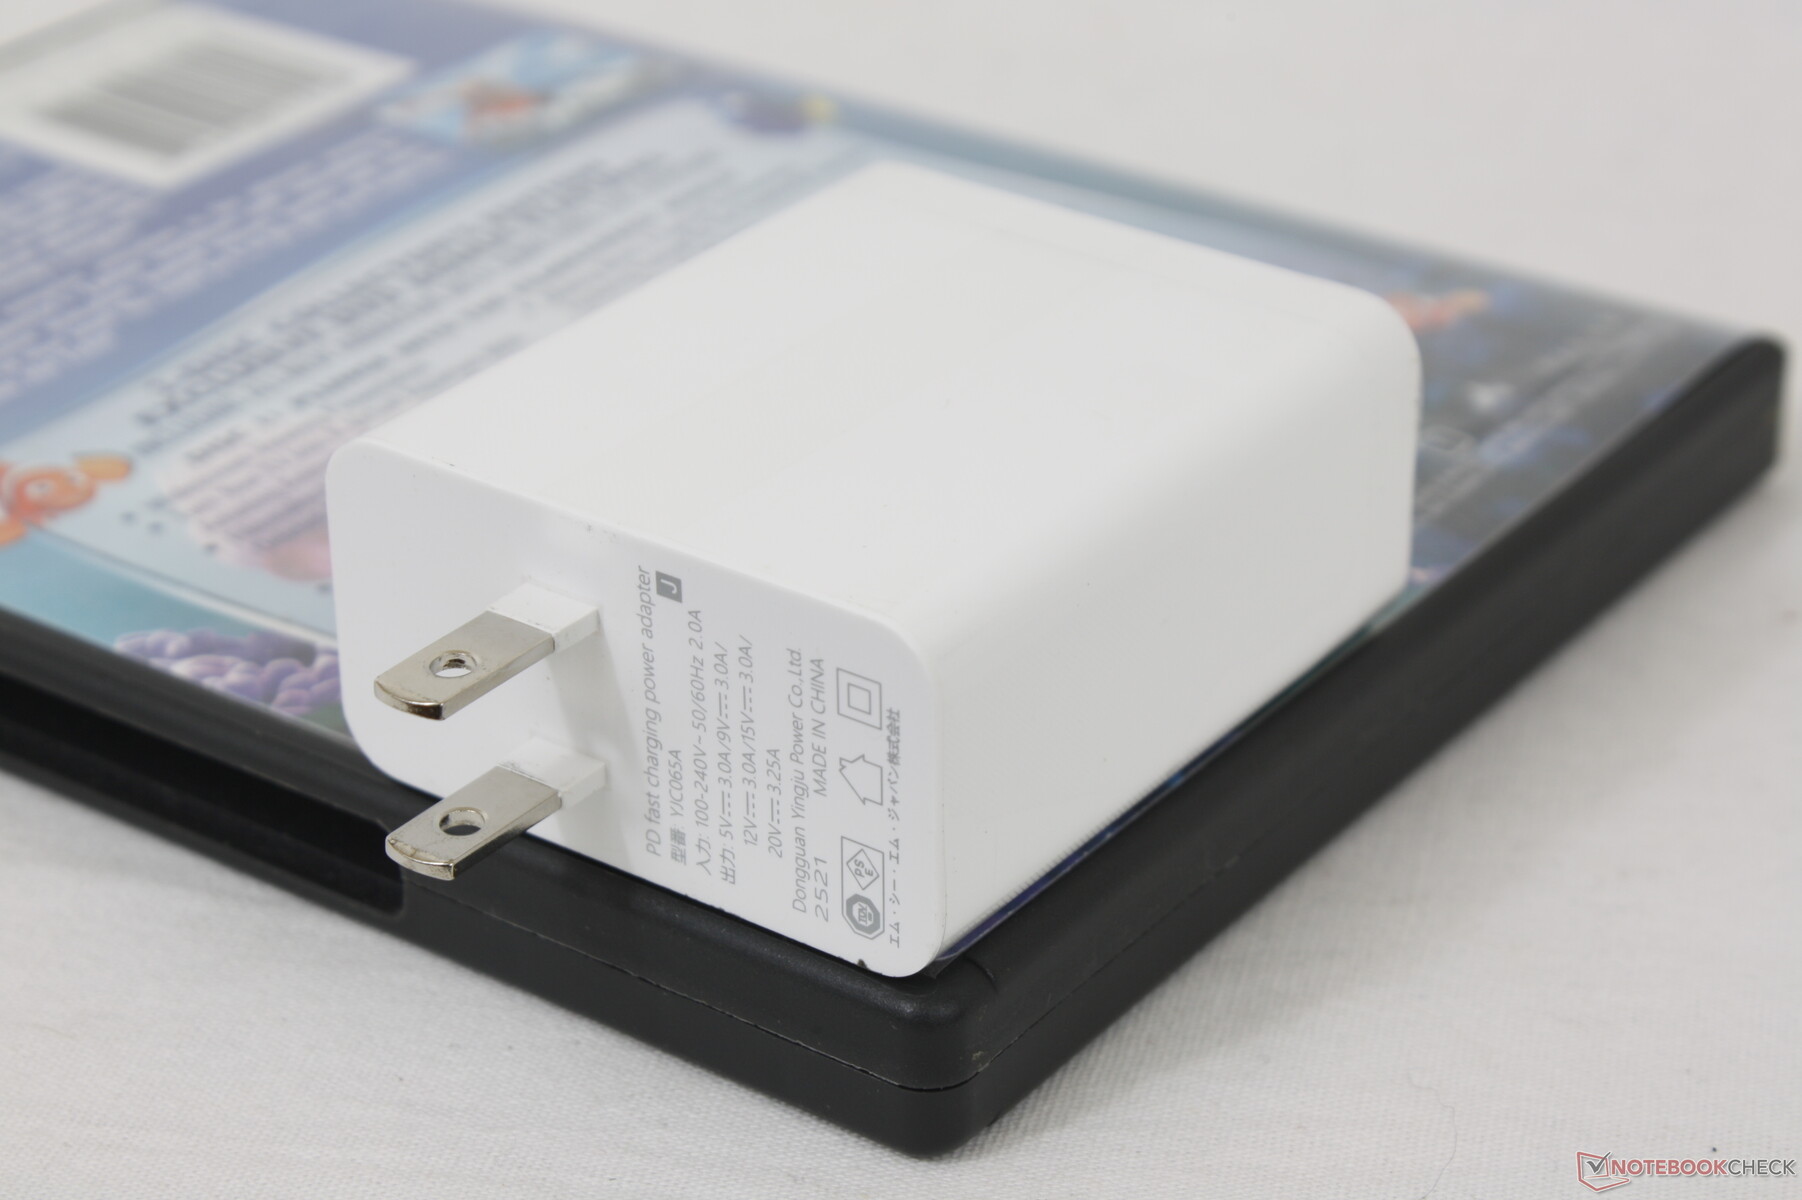
Our power consumption readings below were performed on the higher BIOS power level setting. Overall consumption when idling on desktop is higher than expected at 9 W to 12 W. Otherwise, consumption remains steady in the 36 W to 42 W when running higher loads like games.
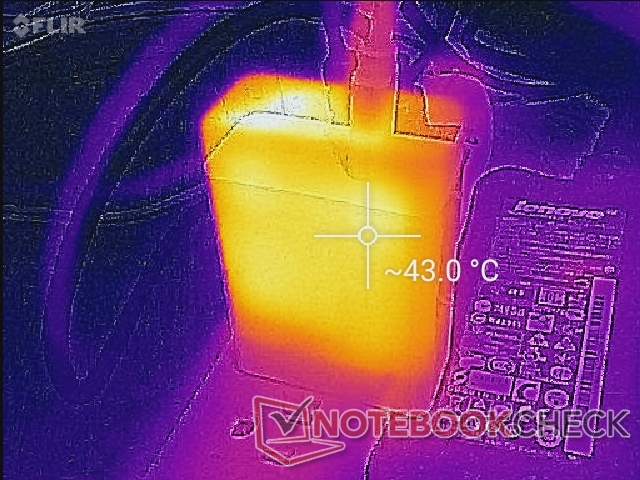
The small USB-C AC adapter (~6.5 x 5.5 x 2.8 cm) is rated for an output of up to 65 W to be more than enough for the Pocket 3.

| Off / Standby | |
| Idle | |
| Load |
|
Key:
min: | |
| GPD Pocket 3 i7-1195G7, Iris Xe G7 96EUs, BiWin NQ200 1TB CNF82GS1D00-1TB, IPS, 1920x1200, 8" | GPD Win Max 2021 R7 4800U, Vega 8, BIWIN NS200 512GB CNF82GS1G00-512, IPS, 1280x800, 8" | GPD Win 3 i5-1135G7, Iris Xe G7 80EUs, BIWIN NS200 1TB CNF82GS1G02-1TB, IPS, 1280x720, 5.5" | Lenovo ThinkPad X12 20UVS03G00 i7-1160G7, Iris Xe G7 96EUs, Toshiba BG4 KBG40ZNT512G, a-Si IPS LED, 1920x1280, 12.3" | Dell XPS 13 9310 2-in-1 i7-1165G7, Iris Xe G7 96EUs, Toshiba BG4 KBG40ZPZ512G, IPS, 1920x1200, 13.4" | HP Spectre x360 14t-ea000 i7-1165G7, Iris Xe G7 96EUs, Samsung SSD PM981a MZVLB512HBJQ, IPS, 1920x1280, 13.5" | |
|---|---|---|---|---|---|---|
| Power Consumption | 22% | 36% | 22% | 29% | 21% | |
| Idle Minimum * (Watt) | 9.6 | 5.2 46% | 2.9 70% | 4 58% | 2.6 73% | 3 69% |
| Idle Average * (Watt) | 11 | 6.5 41% | 4.5 59% | 5.9 46% | 6.4 42% | 5.1 54% |
| Idle Maximum * (Watt) | 11.8 | 7.4 37% | 4.5 62% | 8.3 30% | 7.7 35% | 6.4 46% |
| Load Average * (Watt) | 39 | 37.2 5% | 38.5 1% | 30.1 23% | 29.9 23% | 39.6 -2% |
| Witcher 3 ultra * (Watt) | 36.4 | 38.1 -5% | 28.9 21% | 30.8 15% | 32.2 12% | 39.6 -9% |
| Load Maximum * (Watt) | 42 | 39 7% | 41.4 1% | 59 -40% | 47.5 -13% | 56.2 -34% |
* ... smaller is better
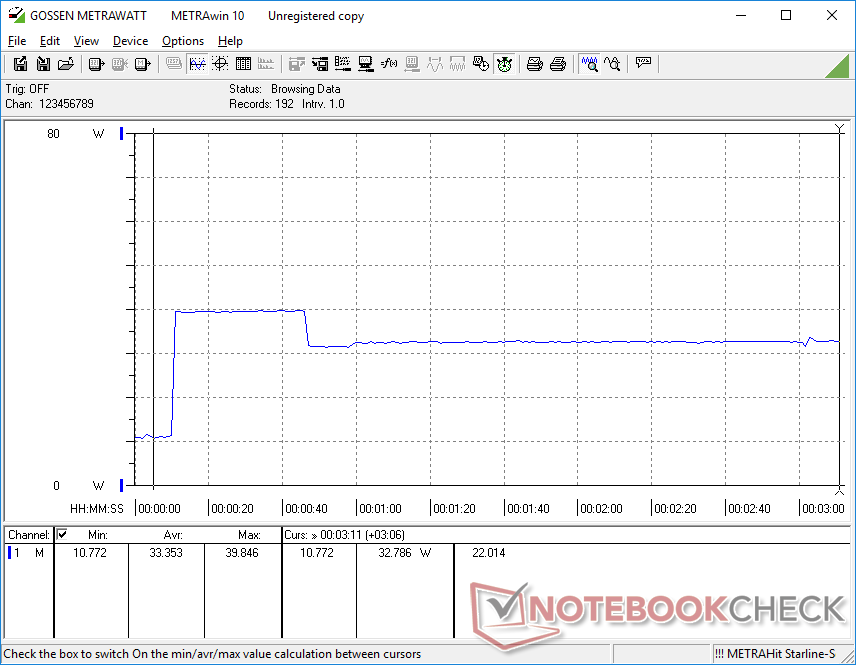
Power Consumption Witcher 3 / Stresstest
Battery Life — Good for the Size and Performance
Battery capacity is understandably small at just 38 Wh given the small form factor. Runtimes are subsequently shorter than on many laptops at only six hours of real-world WLAN use compared to 10 hours or more on models like the XPS 13 or Spectre 13 all equipped with similar Tiger Lake-U CPUs.
Charging from empty to full capacity with the included adapter is very slow at about 2.5 hours compared to 1.5 hours on most laptops.
| GPD Pocket 3 i7-1195G7, Iris Xe G7 96EUs, 39 Wh | GPD Win Max 2021 R7 4800U, Vega 8, 57 Wh | GPD Win 3 i5-1135G7, Iris Xe G7 80EUs, 44 Wh | Lenovo ThinkPad X12 20UVS03G00 i7-1160G7, Iris Xe G7 96EUs, 42 Wh | Dell XPS 13 9310 2-in-1 i7-1165G7, Iris Xe G7 96EUs, 51 Wh | HP Spectre x360 14t-ea000 i7-1165G7, Iris Xe G7 96EUs, 66 Wh | |
|---|---|---|---|---|---|---|
| Battery runtime | 55% | 88% | 37% | 78% | 97% | |
| WiFi v1.3 (h) | 6 | 9.3 55% | 11.3 88% | 8.2 37% | 10.7 78% | 11.8 97% |
| Load (h) | 1.3 | 2 | 3.4 | 2.4 | ||
| H.264 (h) | 10 | |||||
| Reader / Idle (h) | 25.4 | 36.4 |
Pros
Cons
Verdict — Much Better than Expected
GPD offers relatively niche products like the AMD-powered PC gaming Win Max handheld or even smaller 5.5-inch Intel-powered Win 3 UMPC with slide-out keyboard. The Pocket 3 is the company's most versatile product yet with enough performance and features to complement or even replace an everyday Ultrabook. Almost everything about the ultraportable system works surprisingly well from its clicky keyboard to its wide port variety and bright display for an overall excellent impression.
If you're after performance, then be sure to enable the higher power limit via BIOS to fully unlock the Tiger Lake-U CPU. Otherwise, the processor will perform much slower especially in terms of graphics.
The Pocket 3 is GPD's best product thus far in terms of productivity, ergonomics, and usability. It offers roughly the same performance and features as many Ultrabooks twice its size.
A few characteristics could be improved. The rotating hinge in particular could be stronger and more rigid for better longevity. Meanwhile, the asymmetric webcam positioning feels like an afterthought while the tinny speakers are unsatisfying for multimedia purposes. PCIe4 SSD performance throttles quickly due to its poor heat dissipation and the slow system recharge rate is unexpected considering the small battery capacity. A second USB-C port would have made the system more versatile especially for docking purposes.
Price and Availability
See the official Indiegogo page for more information on price tiers and launch dates.
GPD Pocket 3
- 11/16/2021 v7 (old)
Allen Ngo
More articles related to this device
GPD Pocket 3 (Pocket Series)Related Articles


Price comparison
