Dell XPS 13 9350 2016 (FHD, i7-6560U) Notebook Review
For the original German review, see here.
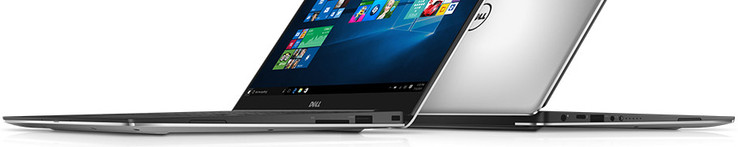
Currently, the Dell XPS 13 belongs to the most popular premium subnotebooks. This is primarily due to the good design called "Infinity Edge", which Dell implemented two generations ago. As the display frame is only a few millimeters thick, the case size of the 13.3-inch device is especially compact and hardly bigger than the next smaller devices with 12.5-inch displays.
Not only consumers appreciate this. The XPS 13 is an attractive alternative to classical 12-inch business laptops, too. Dell takes this into account by offering a number of usual business features and services including up to 4 years ProSupport Plus with on-site service on the next business day and Windows 10 Pro.
Note: We have tested this model with all updates that were available at the time of testing (Windows, Dell). The used BIOS version was 1.3.3.
In this test, we will primarily focus on aspects which have been less extensively covered in the previous tests. Among others, we have upgraded from a 256 GB SSD to a faster PCIe NVMe model with a capacity of 512 GB, since the FHD variant of the XPS 13 is only offered with up to 256 GB SSD storage by Dell and this could be a too low capacity for some users (a separate article will follow soon). List of all our Dell XPS 13 (9350) reviews:
- XPS 13 (9350) with i5-6200U, 8 GB RAM, 256 GB SSD, FHD
- XPS 13 (9350) with i7-6560U, 16 GB RAM, 512 GB SSD, QHD+
- XPS 13 (9350) with i7-6500U, 8 GB RAM, 256 GB SSD, QHD+
- XPS 13 (9350) with i7-6560U, 8 GB RAM, 256 GB SSD, FHD (this test model)
Case
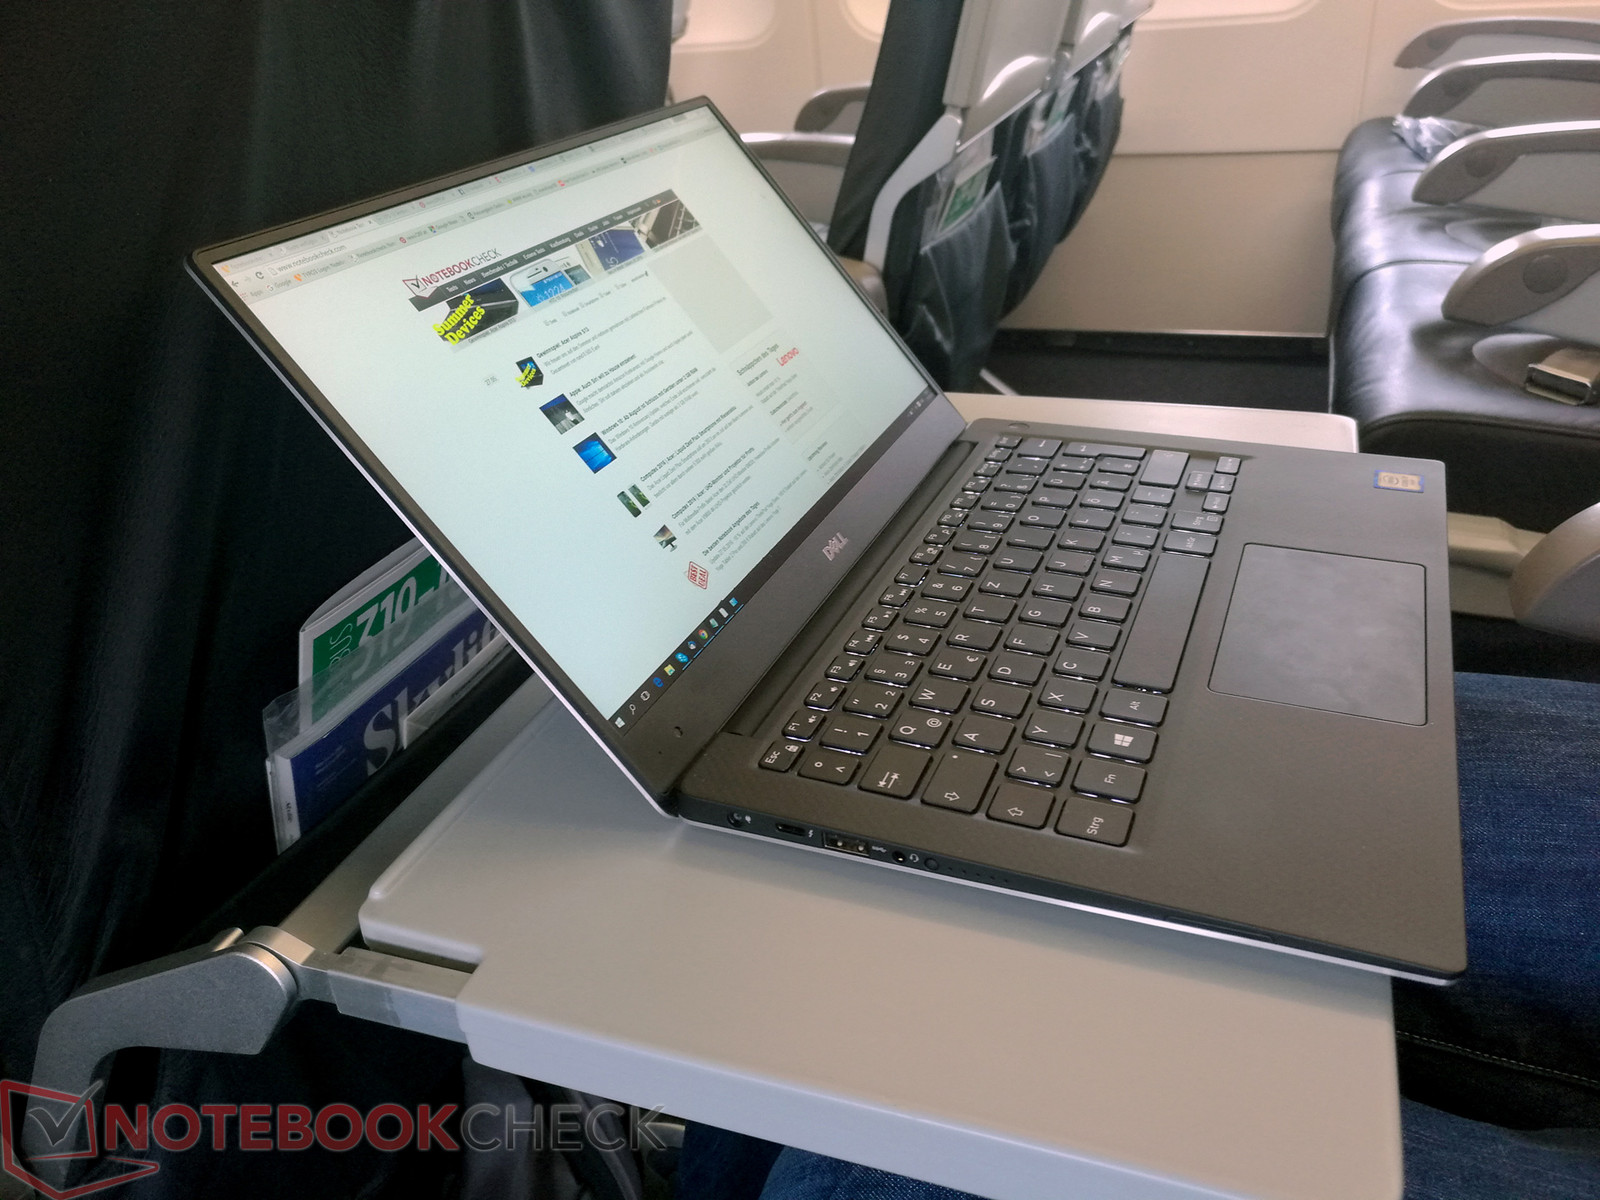
We now face the current edition of the Dell XPS 13 (9350) for the fourth time. We have reviewed devices for the press from the USA and Germany as well as samples bought in the market. All of them are solid, optically and haptically appealing devices with good build quality. The "sandwich" design consisting of two stable aluminum parts and components from carbon-fiber composite in between not only makes for an excellent rigidity but also gives the XPS 13 its unique appearance.
The wide display hinge keeps the display well in position and allows a maximum opening angle of 140 degrees. Two hands are required for opening, but adjusting the angle can be done with one hand. A small flaw caused by the hinge design: Dust and smudges quickly accumulate between the display and hinge. The touchpad as well as surrounding case are prone to fingerprints, while the surfaces on the outside made from aluminum are insensitive to these. In the FHD variant, dust also accumulates between the display bezel and display. The QHD+ edition is different, since it comes with an edge-to-edge glass panel.
In addition, we have to mention a small flaw in our test sample: The touchpad did not sit absolutely tightly in the case. A minimal yielding of the pad was notable when clicking (before the mechanical click). However, this issue disappeared after we had used the device for a few days and the touchpad got firmly connected.
Connectivity
Dell offers the XPS 13 for consumers as well as for business customers. The variants available in the two shops are more or less identical. Differences first become apparent in the realms of service and support and software. For example, the business models use Windows 10 Pro (64-bit). Dell mentions that business devices only include important tools for system management, while systems for private customers might include additional software.
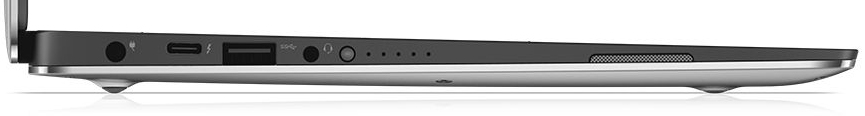
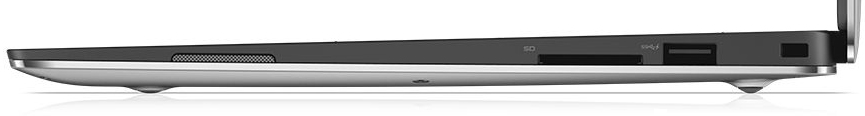
All offered XPS 13 models bring the same interfaces. As already described in our previous tests, the device comes with two USB 3.0 Type A ports, one on the left side and one on the right side, as well as a USB Type C port with Thunderbolt 3 support (left). The latter allows adding a digital video-out (DisplayPort with 4K support) via an adapter or a set of interfaces via a dock.
We have tested the transfer rate of the USB 3.0 Type A ports with a Samsung 840 EVO SSD. The left port achieves an average of 230 MB/s when copying big video files. AS SSD reports maximum write rates of 227 MB/s and read rates of up to 244 MB/s. It is interesting that the right port only achieves 130 and 124 MB/s in the same test.
SD-card reader
The SDXC-card reader on the right side achieves excellent test results: In a test with our Toshiba Exceria Pro SDXC 64 GB UHS-II reference memory card, the reader delivers an excellent average transfer rate of 135 MB/s when copying many image files (.jpg; about 5 MB per image). The reader scores points by achieving a great transfer rate of 230 MB/s when moving big video files (200 to 1000 MB). The AS SSD Seq. Read benchmark test reported 210 MB/s for reading and 125 MB/s for writing data. It might be disadvantageous that the inserted SD card sticks out of the case by about 10 mm. Therefore, it should not be permanently kept in the case in order to prevent damaging the card.
| SD Card Reader | |
| average JPG Copy Test (av. of 3 runs) | |
| Dell XPS 13 2016 9350 (FHD, i7-6560U) | |
| Lenovo ThinkPad Yoga 460-20EM000QGE | |
| Acer Aspire S 13 S5-371-71QZ | |
| Asus ASUSPRO Advanced B8430UA-FA0084E | |
| Lenovo IdeaPad 710S-13ISK | |
| Lenovo ThinkPad X260-20F6007RGE | |
| Tuxedo InfinityBook 13 v2 | |
| Lenovo ThinkPad 13-20GKS01100 | |
| Acer Aspire V3-372-57CW | |
| maximum AS SSD Seq Read Test (1GB) | |
| Dell XPS 13 2016 9350 (FHD, i7-6560U) | |
| Lenovo ThinkPad Yoga 460-20EM000QGE | |
| Acer Aspire S 13 S5-371-71QZ | |
| Lenovo ThinkPad X260-20F6007RGE | |
| Lenovo IdeaPad 710S-13ISK | |
| Tuxedo InfinityBook 13 v2 | |
| Lenovo ThinkPad 13-20GKS01100 | |
| Acer Aspire V3-372-57CW | |
Communication
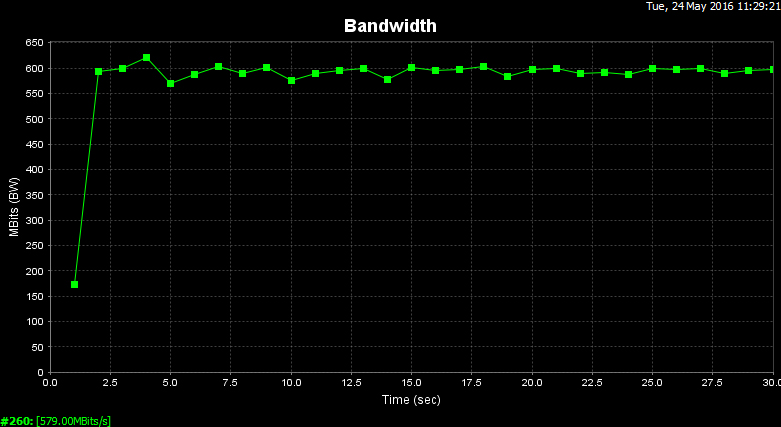
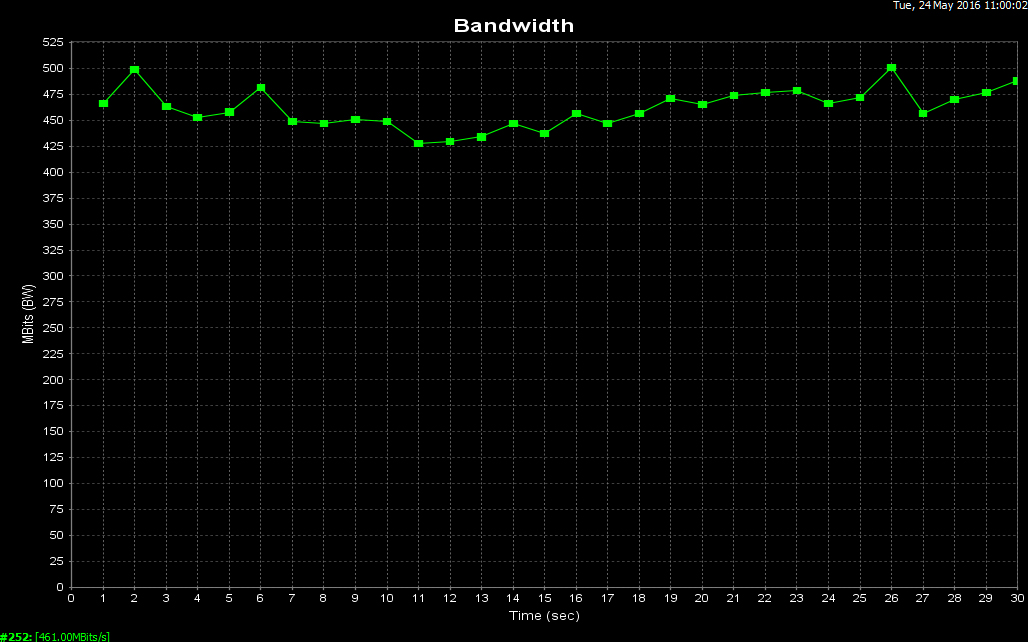
Likewise we appreciate the maximum transfer rates of the used Wi-Fi module. In our standardized test with our Linksys EA8500 router, we record an average of 570 MBit/s (receiving) and 461 MBit/s (sending). This means, the XPS 13 ranks in near the top of our list in our comparison group. The used Dell Wireless 1820A 802.11 ac Wi-Fi module is dual-band capable and sends data in the 2.4 GHz and the 5 GHz frequency ranges. Its 2x2 antenna configuration allows a maximum data throughput of 866 MBit/s in the 802.11 ac network in theory. The module also integrates Bluetooth 4.1 (Dell 1820A Bluetooth 4.1 LE).
| Networking | |
| iperf Server (receive) TCP 1 m | |
| Dell XPS 13 2016 9350 (FHD, i7-6560U) | |
| Acer Aspire S 13 S5-371-71QZ | |
| iperf Client (transmit) TCP 1 m | |
| Dell XPS 13 2016 9350 (FHD, i7-6560U) | |
| Acer Aspire S 13 S5-371-71QZ | |
Security
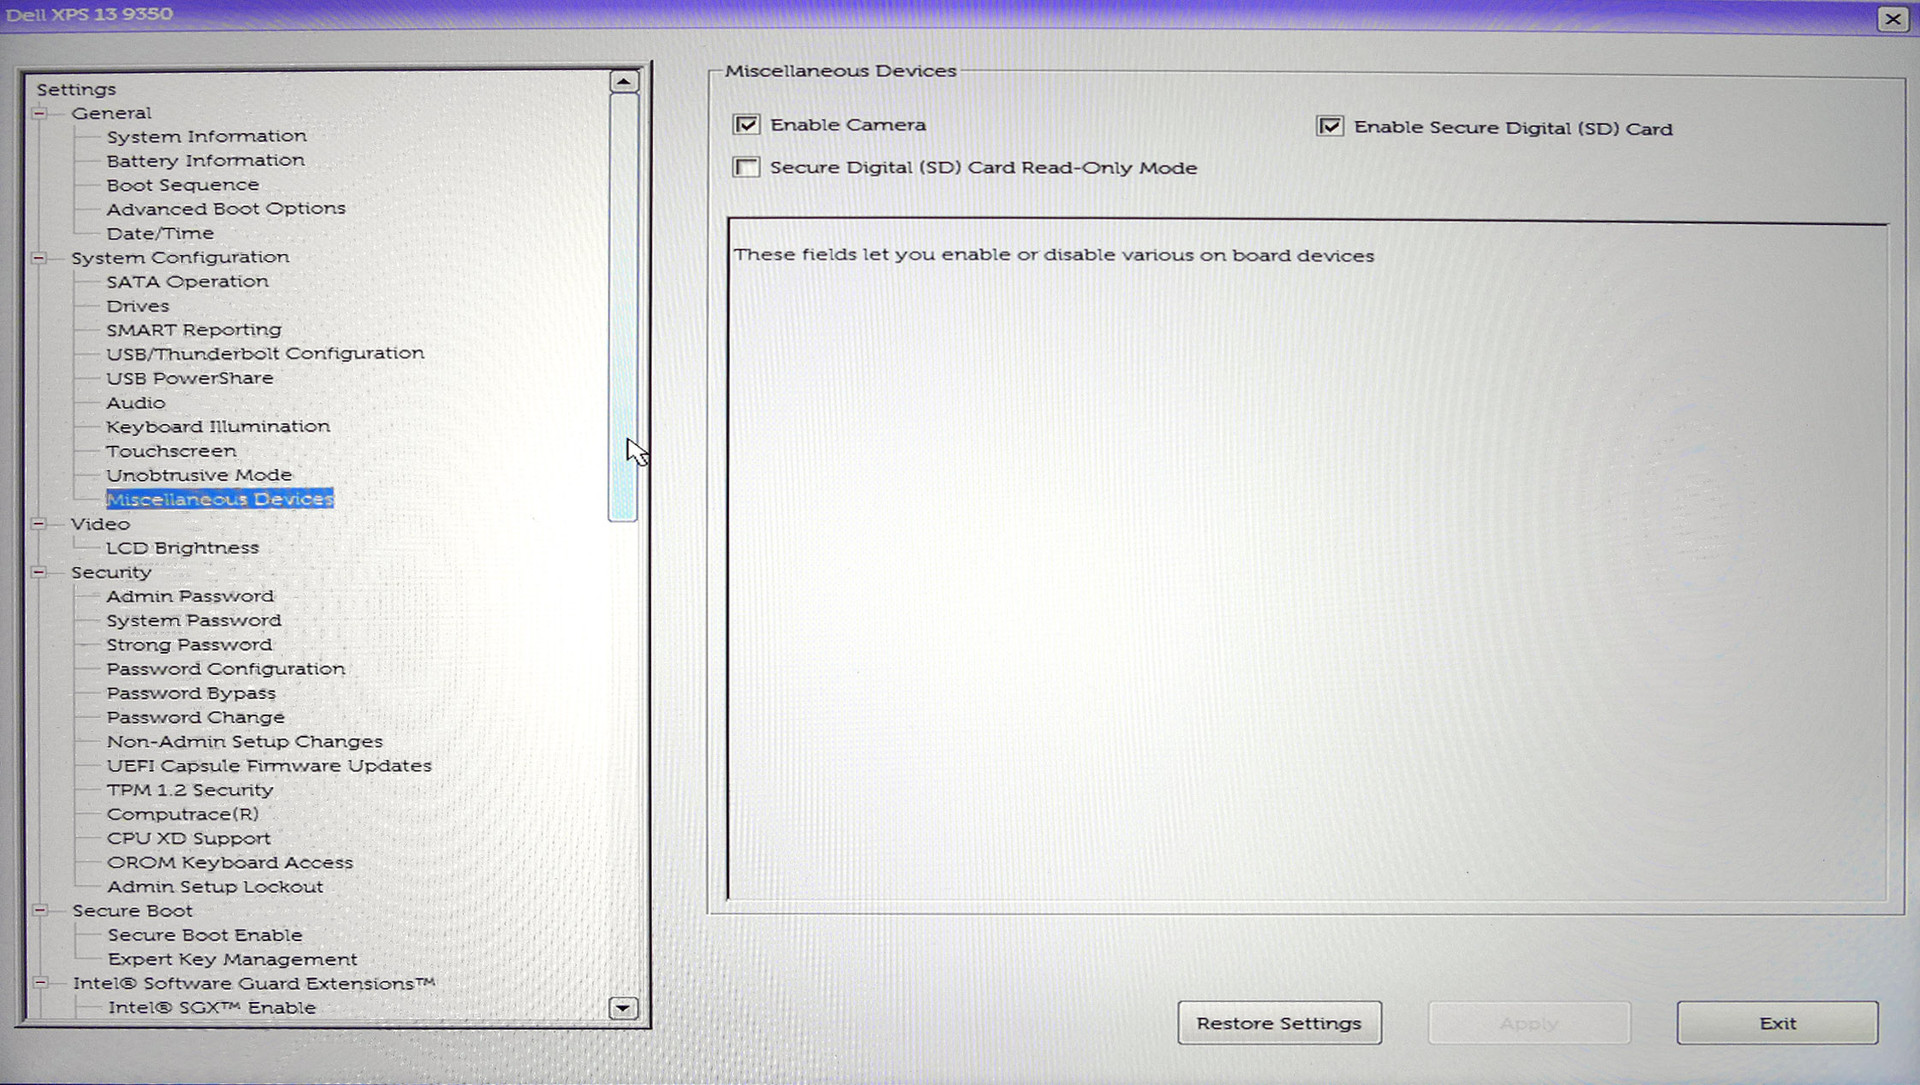
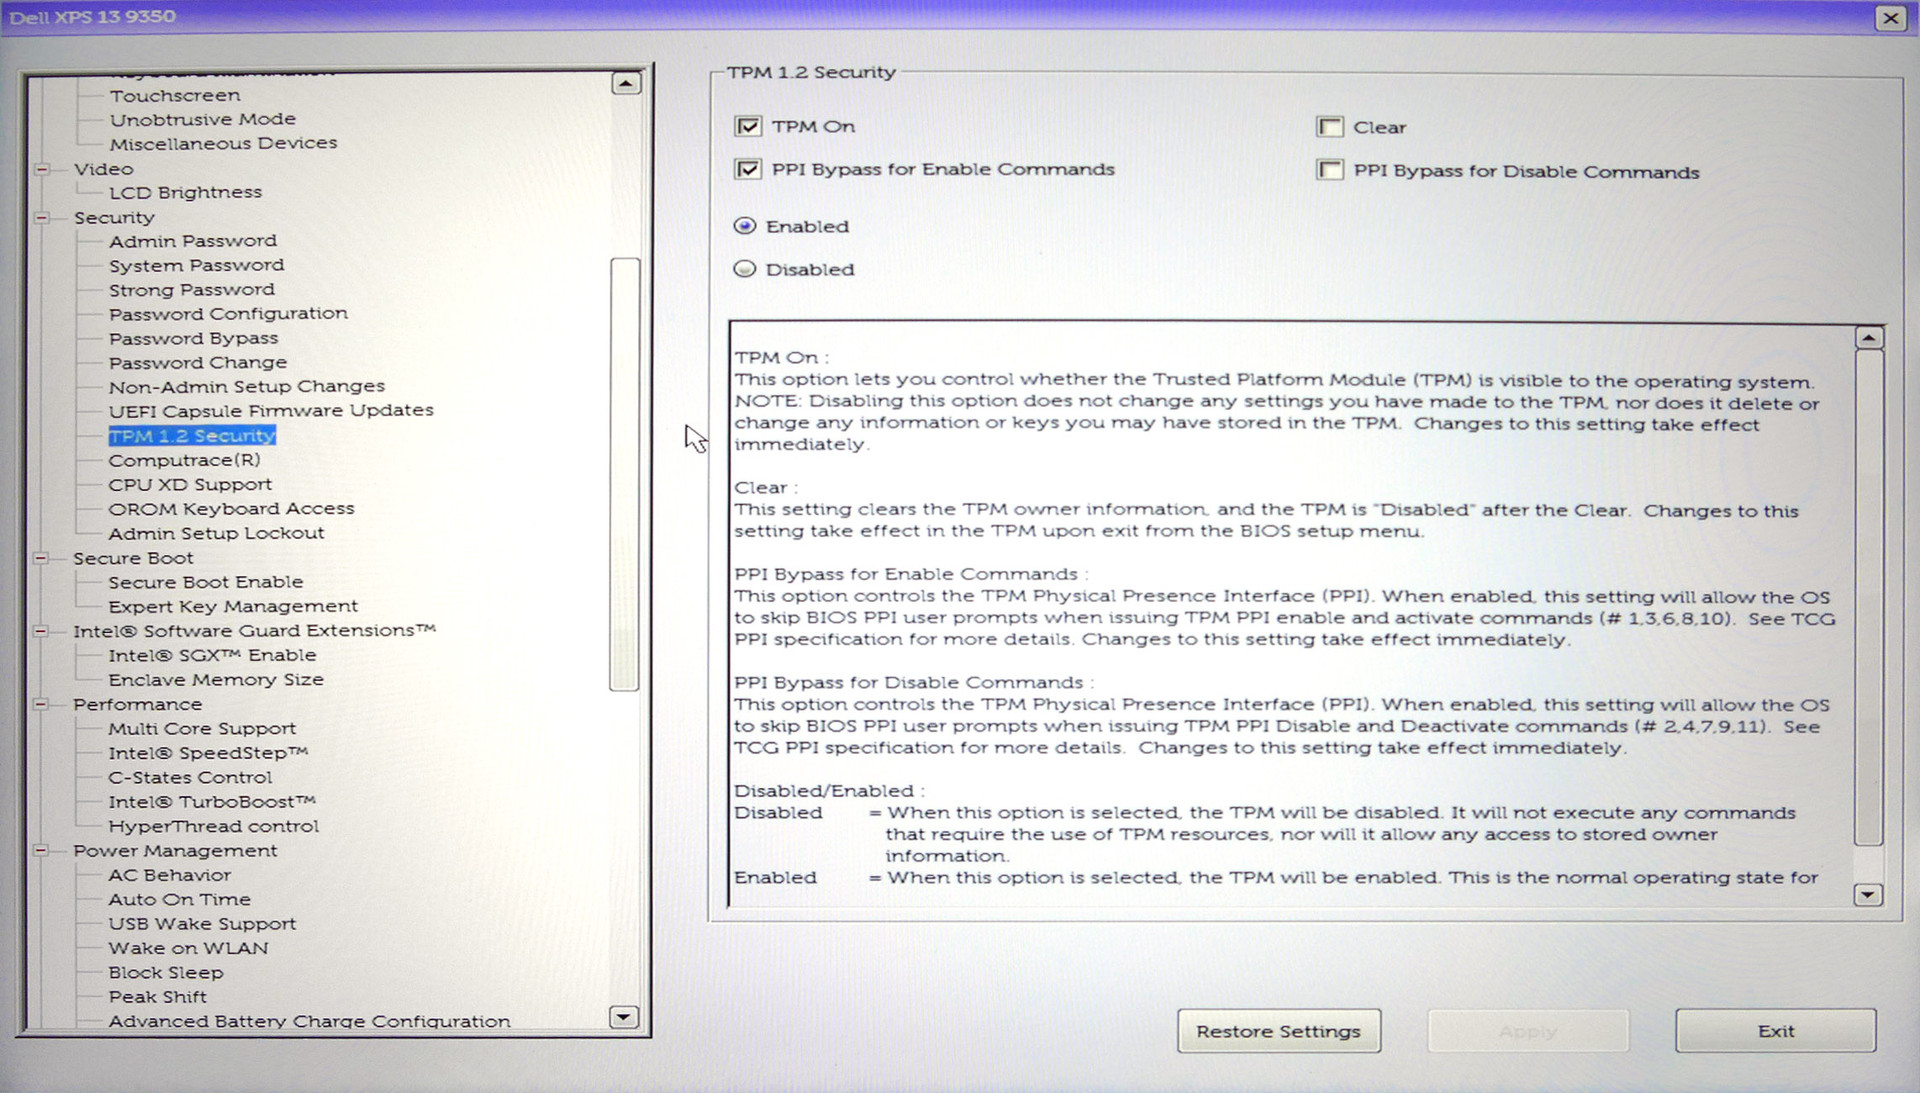
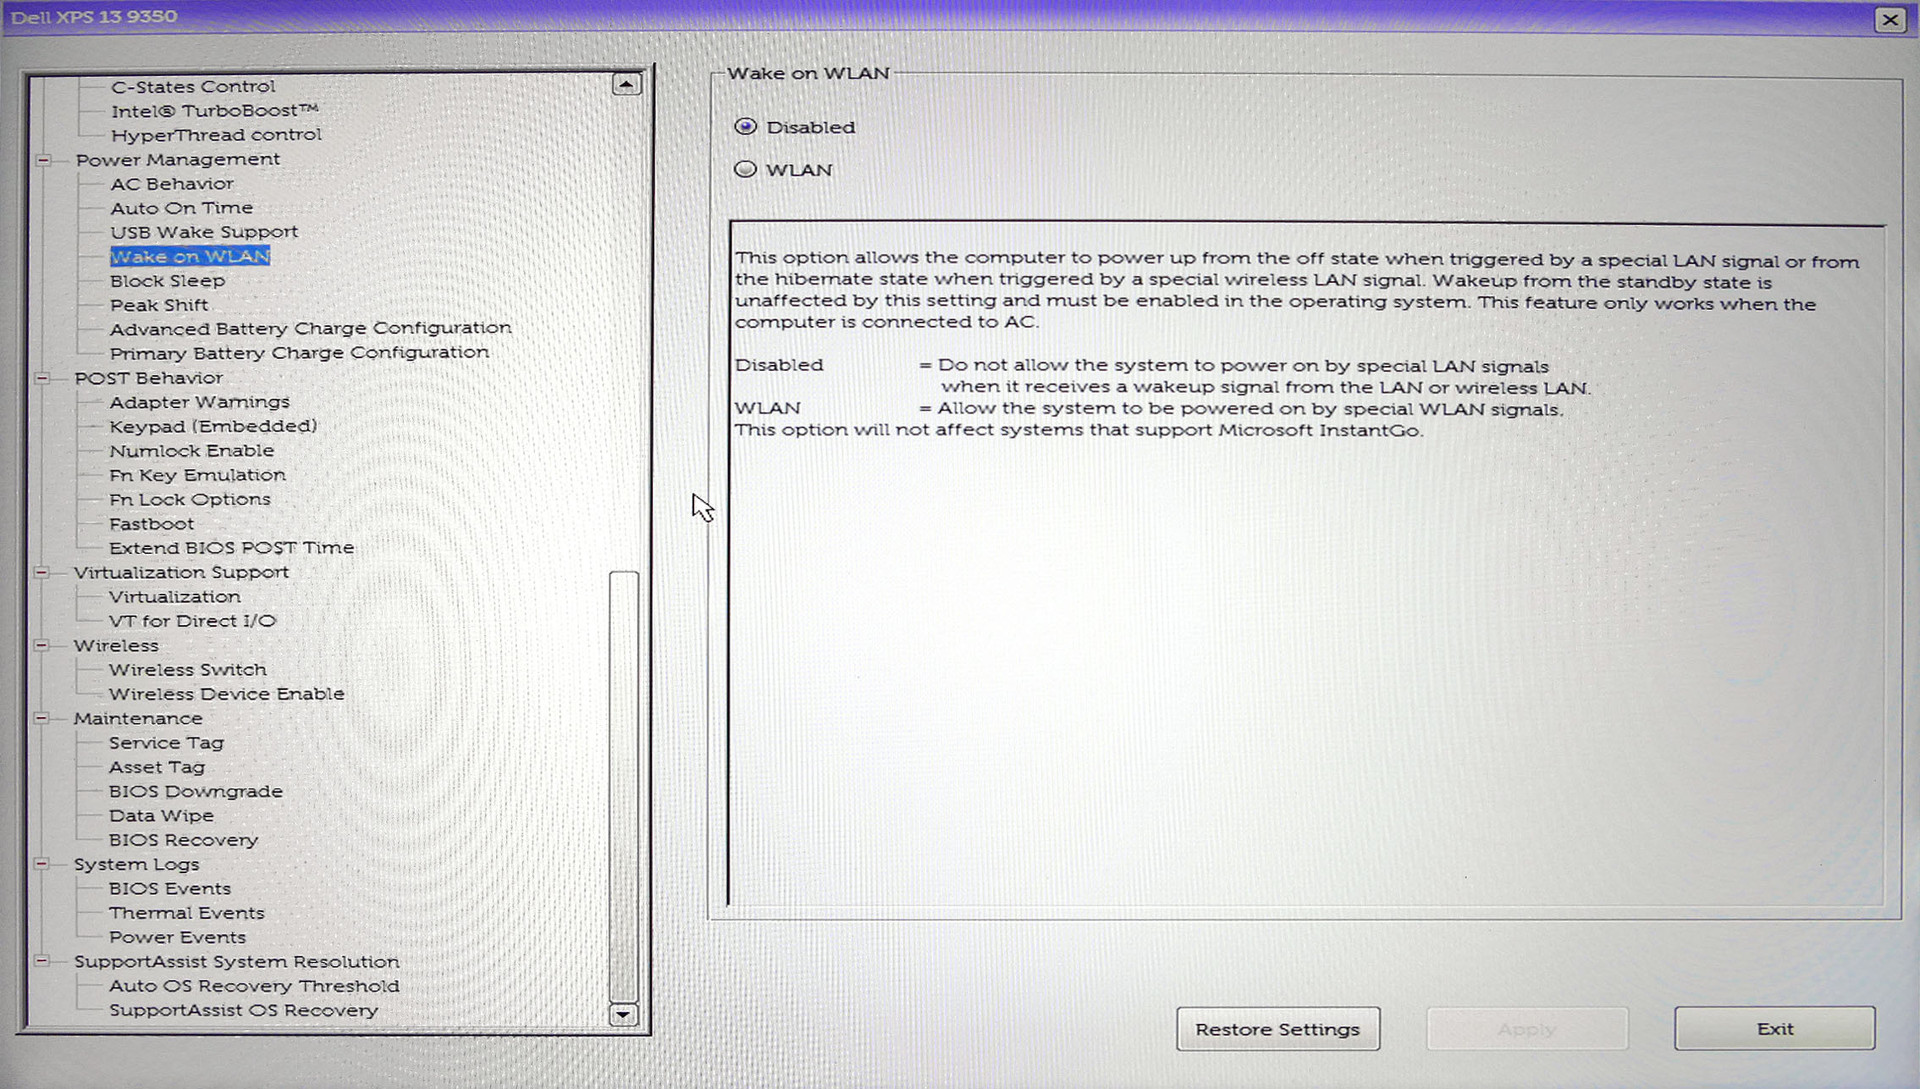
While the Dell XPS 13 lacks hardware security features such as a fingerprint sensor or a smart-card reader, Dell integrates a TPM chip (Trusted Platform Module) as well as software which protects against unauthorized access to device and data. Noteworthy are for example the BIOS, which can be extensively configured in Dell's business notebooks, single ports and features that can be disabled (USB, camera, etc.) and that you can set system and BIOS passwords. In addition, remote maintenance and Computrace are supported. Windows 10 Pro enhances the functionality of the operating system for example with support of the BitLocker drive encryption. Further information about Windows 10 Home vs. Pro is available here.
Accessories
The XPS 13 does not come with noteworthy accessories out of the box. The small box contains a quick-start guide and security information. However, Dell offers a number of products and compatible peripherals for the XPS 13. Among these, the optional adapter for the USB Type C port and docks are most interesting. A Type C to HDMI 2.0 adapter is available for 40 Euros (~$44). In addition, a Gigabit Ethernet adapter and a kind of mini-dock with Ethernet, USB Type A and HDMI (91 Euros, ~$100) are offered.
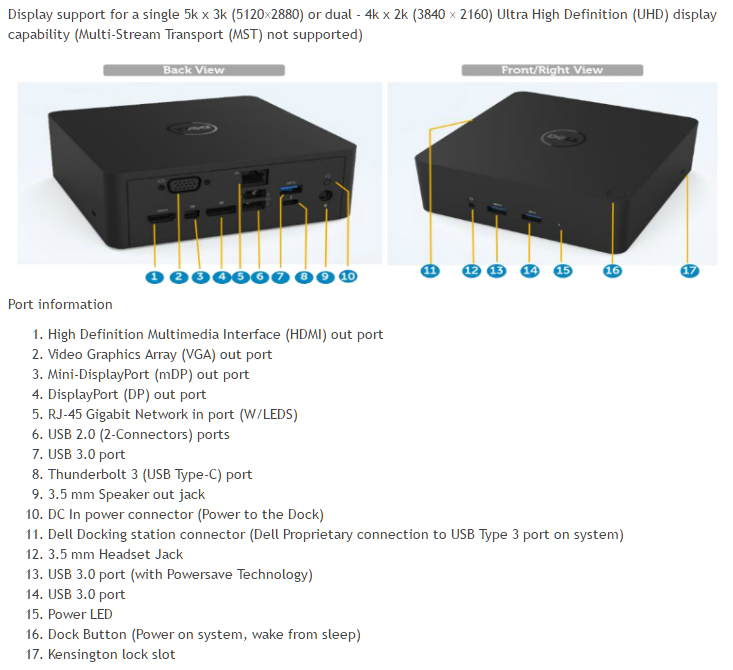
The feature rich docks are really expensive. The WD15 adds two USB 2.0 ports and three USB 3.0 Type A ports, an audio out and an audio combo port, an RJ45 Gigabit LAN port and two DisplayPorts (2x FHD or 1x 4K@30Hz) to the XPS 13. It costs 290 Euros (~$320, incl. VAT).
The Thunderbolt Dock TB15 is an alternative, which should finally use the full potential of the compatible port on the device. Price: about 349 Euros (~$385).
In addition, the device comes with several Dell software tools. The Dell Command Update searches for the latest drivers and BIOS versions, downloads them from the web and installs them. The Dell Support Assist informs about the warranty status, helps recognizing problems and helps contacting Dell Support.
Maintenance
In general, end user maintenance is not top priority in the XPS 13. Nevertheless, it is possible to open the case with a suitable screw driver (Torx T5). Our colleagues from iFixit have created a detailed guide on basis of the XPS 13 predecessor generation with identical design (you can look it up here). Upon our request, Dell told us that you should clarify impacts of user upgrade on warranty before doing so, since guidelines differ depending on series and model. The service agreement of our test model from the business shop does not limit replacing components - provided they are correctly installed. However, new components, for example a new SSD, are excluded from the Dell Service - unless bought from Dell.
Update 24th of June 2016: According to Dell, also consumers may replace SSDs. However, the warranty does not apply to the new SSD, but only to the original SSD of the system. Dell provides a guide to replacing components here.
We have upgraded the built-in Samsung PM951 SSD with a capacity of 256 GB. We decided to replace it with a fast Samsung SM951 SSD with a gross capacity of 512 GB. According to our benchmark list of hard drives and SSDs, this storage device should bring significantly faster write and read rates. Detailed information with many images and screenshots for SSD replacements in the Dell XPS 13 are available in this article (will follow soon).
Service and Support
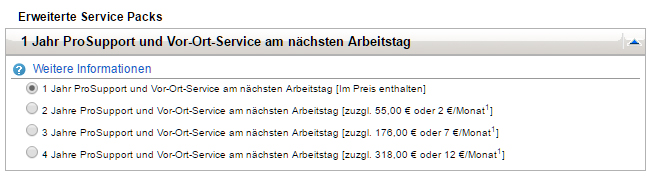
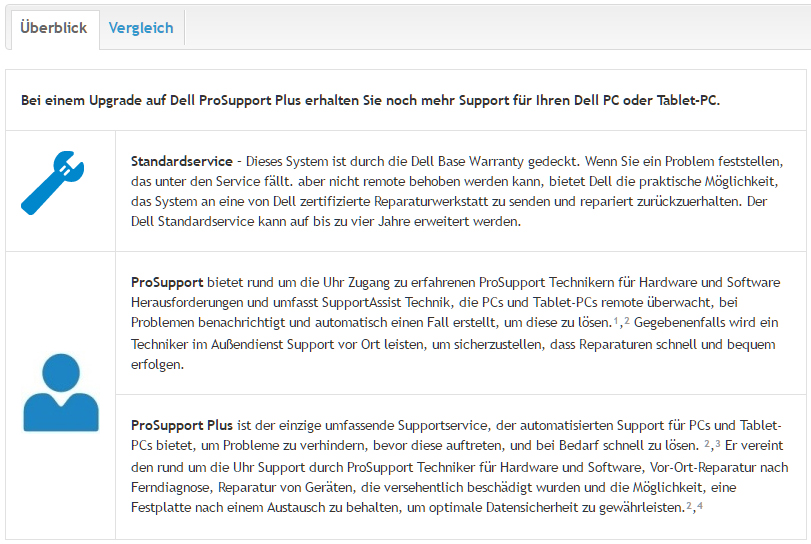
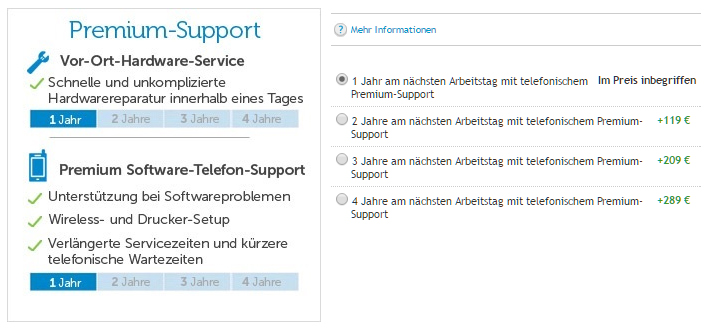
The prices for the different XPS configurations in the online shop might be very appealing at a first glance. However, you should consider that the business shop always lists net prices (excl. VAT). In addition, the base configuration only includes one-year manufacturer support. Currently, three years (ProSupport and on-site service on the next business day) costs an extra 176 Euros (~$194). We would highly recommend an appropriate service contract for the planned usage period, when the device is used professionally every day. By the way, the maximum warranty period is 4 years.
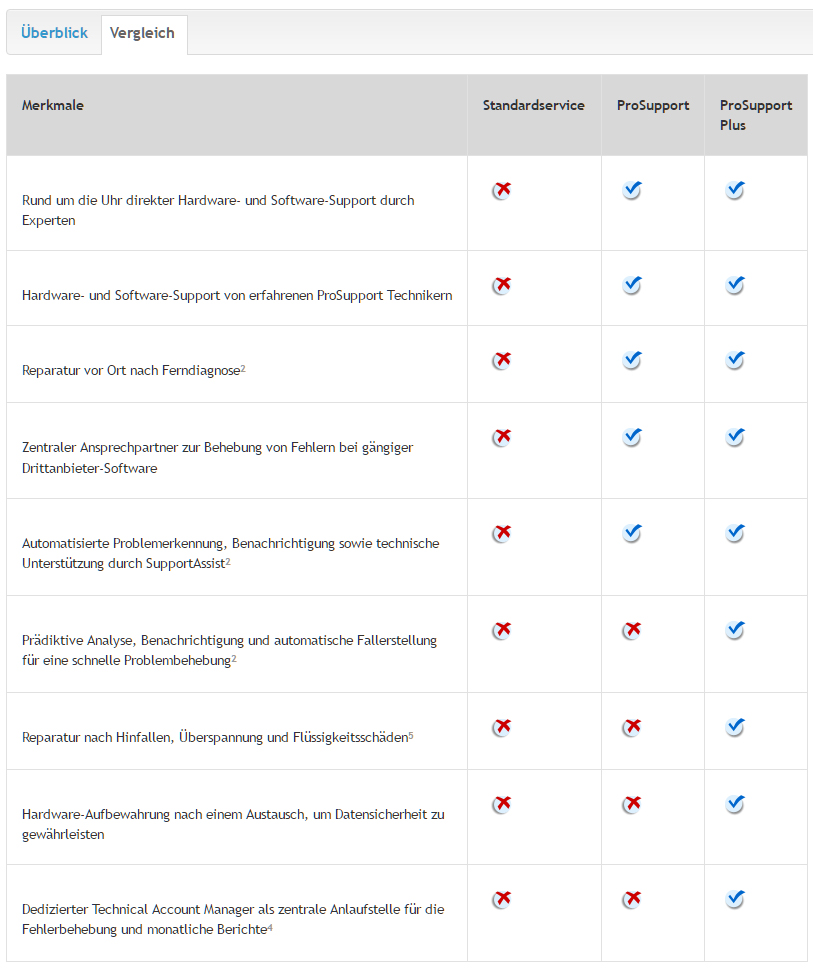
How do Dell XPS 13 configurations from the consumer shop differ from the business user shop? While consumers are offered "Premium support" with on-site hardware service on the next business day, the business shop uses the term "ProSupport" with on-site support on the next business day. According to Dell premium support and ProSupport are basically identical; however, software support is limited in the first.
Input Devices
Keyboard
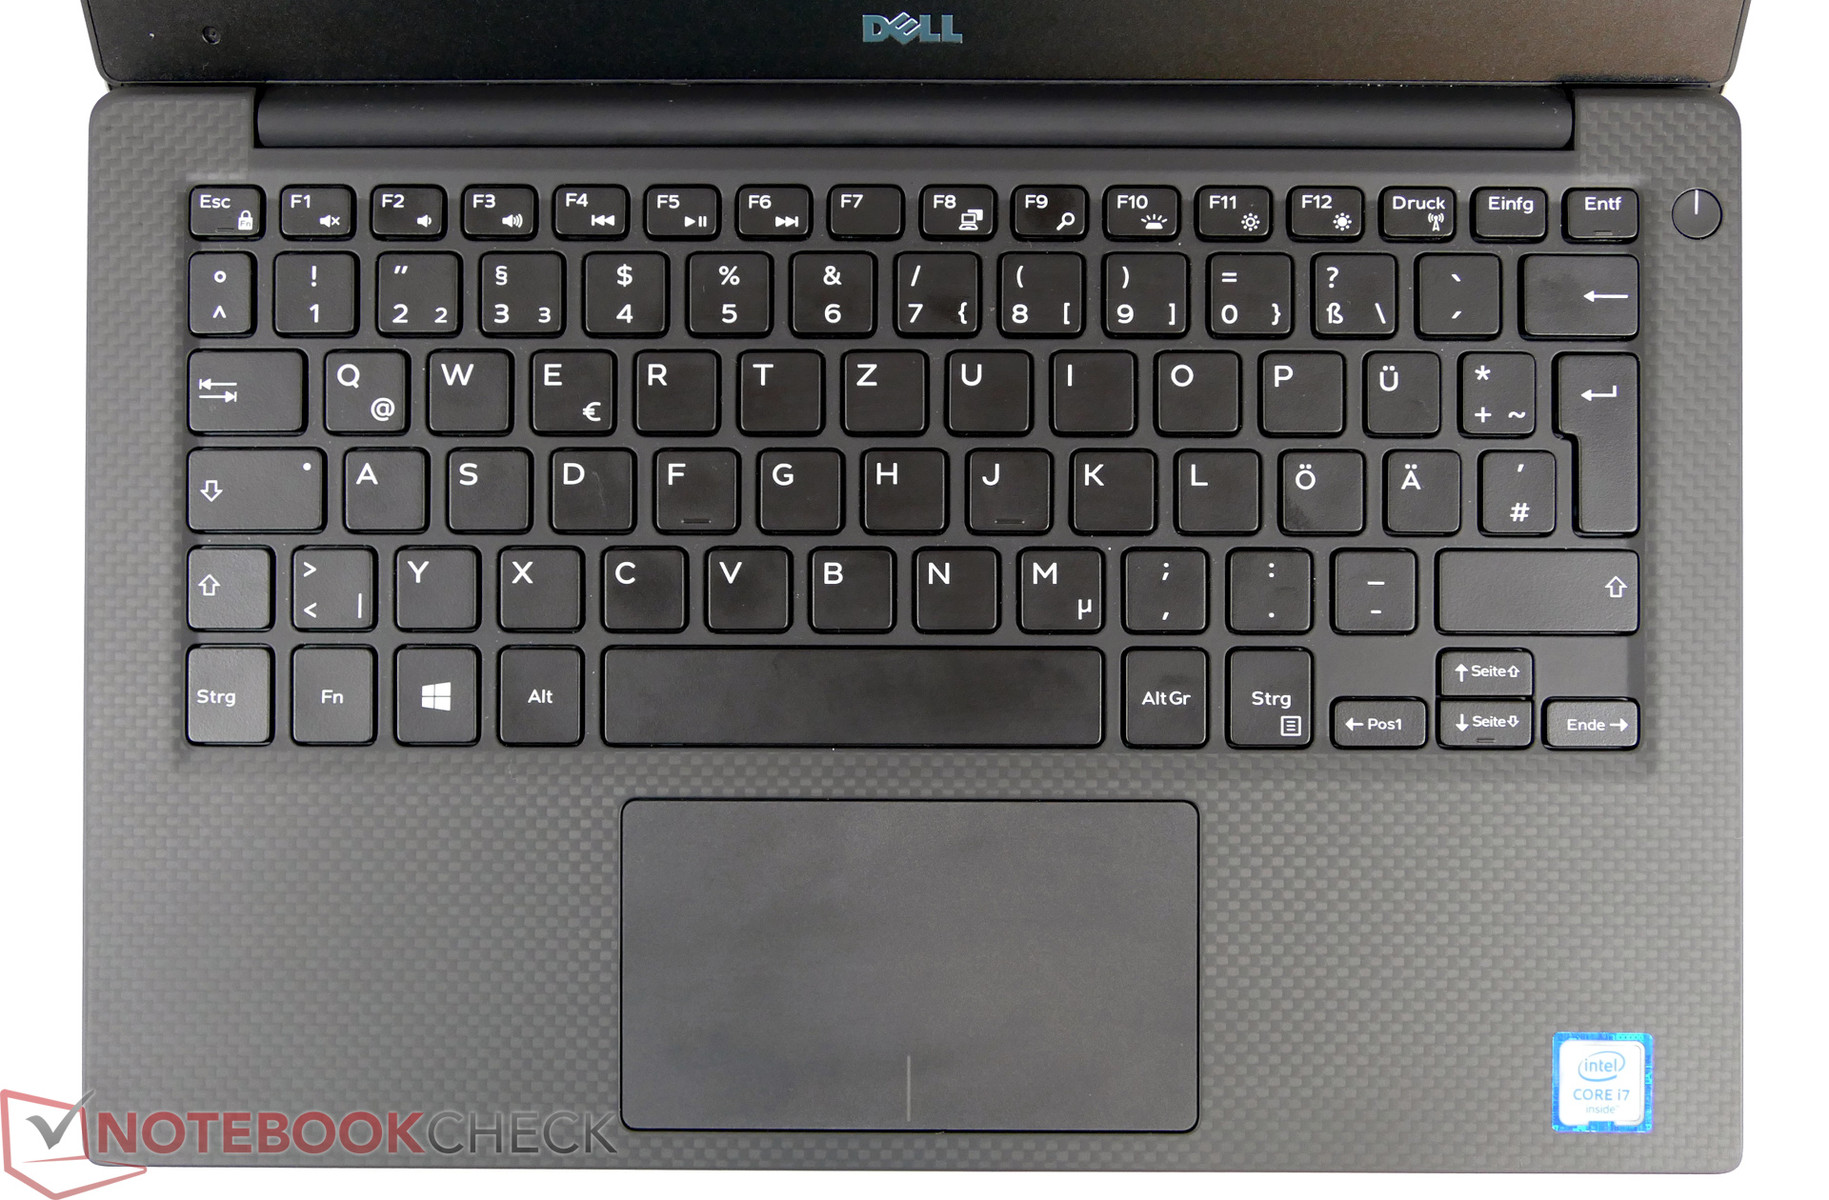
We have already described the keyboard of the XPS 13 in previous tests and given it a good rating. Depending on the device or predecessor used for comparison, the key travel might appear slightly short. For example, it appeared like that to the test author who switched from the ThinkPad X220 to the XPS 13. However, the key travel is indeed ordinary compared to other current ultrabooks (1.3 mm). The pressure point is clearly noticeable and the case only gives in slightly when very strong force is applied. In general, the keyboard is even very well suitable for typing long texts on-the-move.
Unfortunately, the keyboard and the touchpad are very prone to fingerprints. The device quickly looks disgusting but can be very easily cleaned with a wet cloth.
Touchpad
The touchpad also belongs to the better input devices in the Windows world - not least due to its glass surface. However, the author had to finally disable two-finger zoom after several weeks of use and make several adjustments to the driver settings. The touchpad often mistakes two-finger scrolling for zooming in the web browser and so unintentionally changed the zoom factor of a page. Nevertheless, our verdict of the touchpad is positive. The touchpad can replace an external mouse - provided it is appropriately configured to your needs. However, it cannot keep up with the almost perfect input device of the current MacBook.
Display
One of the main reasons why users might select the XPS 13 is its display. Dell uses a panel with an especially thin frame and so can incorporate a display with a diagonal of 13.3-inches in a compact device which usually houses a 12-inch display. Dell offers two options: the FHD display (1920x1080 pixels) with matte surface of our test model or a QHD+ panel with glossy surface and touch support. The first one is favored in the offered entry-level configurations (max. 256 GB SSD, 8 GB RAM), while QHD+ editions are available with 512 GB SSDs and 16 GB RAM in addition. Apart from these aspects, there is another criterion, which is not apparent for the user at the first glance. It is called CABC (Content Adaptive Brightness/Backlight Control). Both display variants include this energy-saving solution out-of-the-box. However, it can be disabled in the QHD+ edition (link).
CABC (Content Adaptive Brightness Control)


What is CABC? In contrast to adaptive brightness (setting in the Windows energy options; did not bring measurable differences in our test model), which is used in many notebooks and increases or decreases the brightness of the LCD backlight depending on the ambient light, CABC adapts backlight and pixel filters depending on the display content. When, for example dark content is displayed, the filter can either only let a very small amount of the maximum brightness through (normal) or CABC dynamically reduces the backlight and adapts the filter accordingly in order to let the image appear the same at low brightness. This method can significantly contribute to energy saving but might cause visual problems. In our review of the XPS 13 QHD+ variant, we could observe that the battery life increased by about one hour (CABC off vs. CABC on) in our realistic Wi-Fi test.
What is the impact of CABC on the user in everyday use? When using the laptop as an office device with a lot of text processing, tables and forms, you will subjectively hardly notice it. However, when you quickly switch between windows with different content and watch carefully, you might recognize a slow brightness adjustment. In extreme scenarios (entirely black content, white measurement spot in the center), the brightness falls to about 210 cd/m2, while the brightness is increased to up to 385 cd/m2 when a white background is displayed. The measured minimum brightness is 17.7 cd/m² with manual selected minimum brightness and white display content. This allows eye-friendly use of the device even in completely dark environments.
The following measurements of the display brightness were done with full-screen white or black (black value) background and so are the maximum or best possible values. In practice, the display brightness is dynamically lower due to automatic adjustment by CABC and levels off between the two extreme values of 210 and 385 cd/m² (white) mentioned above.
Although you can sometimes read in forums that CABC can also be disabled in the FHD edition, we cannot confirm this so far. However, we are constantly in contact with Dell regarding this issue and will inform you as soon as there is new information available.
| |||||||||||||||||||||||||
Brightness Distribution: 86 %
Center on Battery: 385 cd/m²
Contrast: 2265:1 (Black: 0.17 cd/m²)
ΔE ColorChecker Calman: 4.17 | ∀{0.5-29.43 Ø4.75}
ΔE Greyscale Calman: 5.39 | ∀{0.09-98 Ø5}
99.8% sRGB (Argyll 1.6.3 3D)
62.7% AdobeRGB 1998 (Argyll 1.6.3 3D)
56.6% AdobeRGB 1998 (Argyll 3D)
82.3% sRGB (Argyll 3D)
54.8% Display P3 (Argyll 3D)
Gamma: 2.12
CCT: 7404 K
| Dell XPS 13 2016 9350 (FHD, i7-6560U) Iris Graphics 540, 6560U, Samsung PM951 NVMe MZ-VLV256D | Dell XPS 13 2016 i7 256GB QHD HD Graphics 520, 6500U, Samsung PM951 NVMe MZ-VLV256D | Asus Zenbook UX303UA-R4051T HD Graphics 520, 6500U, SK hynix SSD Canvas SC300 HFS256G32MND | Asus Zenbook UX303UB-DH74T GeForce 940M, 6500U, CUK Cyclone SSD 1TB | HP Spectre 13 HD Graphics 520, 6500U, Samsung PM951 NVMe MZVLV256 | Acer Aspire S 13 S5-371-71QZ HD Graphics 520, 6500U, LiteOn CV1-8B512 | Toshiba Portege Z30-C-138 HD Graphics 520, 6500U, Toshiba HG6 THNSNJ512G8NY | |
|---|---|---|---|---|---|---|---|
| Display | 15% | 18% | 8% | 18% | 22% | ||
| Display P3 Coverage (%) | 54.8 | 63.6 16% | 67.5 23% | 60.9 11% | 65.6 20% | 67.9 24% | |
| sRGB Coverage (%) | 82.3 | 93.6 14% | 92.5 12% | 85.4 4% | 94.7 15% | 98 19% | |
| AdobeRGB 1998 Coverage (%) | 56.6 | 65.5 16% | 67.7 20% | 62.5 10% | 67.5 19% | 69.8 23% | |
| Response Times | -7% | 20% | -25% | -27% | -18% | -6% | |
| Response Time Grey 50% / Grey 80% * (ms) | 42.8 ? | 40 ? 7% | 31 ? 28% | 44.4 ? -4% | 50.8 ? -19% | 50 ? -17% | 42 ? 2% |
| Response Time Black / White * (ms) | 24.8 ? | 30 ? -21% | 22 ? 11% | 36 ? -45% | 33.2 ? -34% | 29.6 ? -19% | 28 ? -13% |
| PWM Frequency (Hz) | 4900 ? | 198 ? | 1389 | 217 ? | |||
| Screen | -11% | -24% | -71% | 3% | -21% | -24% | |
| Brightness middle (cd/m²) | 385 | 285 -26% | 357 -7% | 291.4 -24% | 300.5 -22% | 375 -3% | 300 -22% |
| Brightness (cd/m²) | 350 | 281 -20% | 351 0% | 270 -23% | 305 -13% | 358 2% | 280 -20% |
| Brightness Distribution (%) | 86 | 90 5% | 90 5% | 84 -2% | 76 -12% | 87 1% | 87 1% |
| Black Level * (cd/m²) | 0.17 | 0.18 -6% | 0.58 -241% | 0.954 -461% | 0.184 -8% | 0.39 -129% | 0.31 -82% |
| Contrast (:1) | 2265 | 1583 -30% | 616 -73% | 305 -87% | 1633 -28% | 962 -58% | 968 -57% |
| Colorchecker dE 2000 * | 4.17 | 4.89 -17% | 3.39 19% | 4.63 -11% | 2.64 37% | 4.6 -10% | 4.9 -18% |
| Colorchecker dE 2000 max. * | 7.61 | 6.76 11% | 5.06 34% | 8.8 -16% | 8.91 -17% | ||
| Greyscale dE 2000 * | 5.39 | 5.16 4% | 2.36 56% | 5.65 -5% | 2.8 48% | 4 26% | 6.69 -24% |
| Gamma | 2.12 104% | 2.15 102% | 2.2 100% | 2.16 102% | 2.16 102% | 2.34 94% | 2.33 94% |
| CCT | 7404 88% | 7106 91% | 6653 98% | 6320 103% | 6999 93% | 7304 89% | 6487 100% |
| Color Space (Percent of AdobeRGB 1998) (%) | 62.7 | 59 -6% | 60 -4% | 55.2 -12% | 60.9 -3% | 57.9 -8% | 63 0% |
| Color Space (Percent of sRGB) (%) | 99.8 | 93 -7% | 93 -7% | 85.2 -15% | 94.3 -6% | 88.7 -11% | 98 -2% |
| Total Average (Program / Settings) | -1% /
-5% | 5% /
-10% | -29% /
-47% | -2% /
2% | -20% /
-20% | -3% /
-12% |
* ... smaller is better
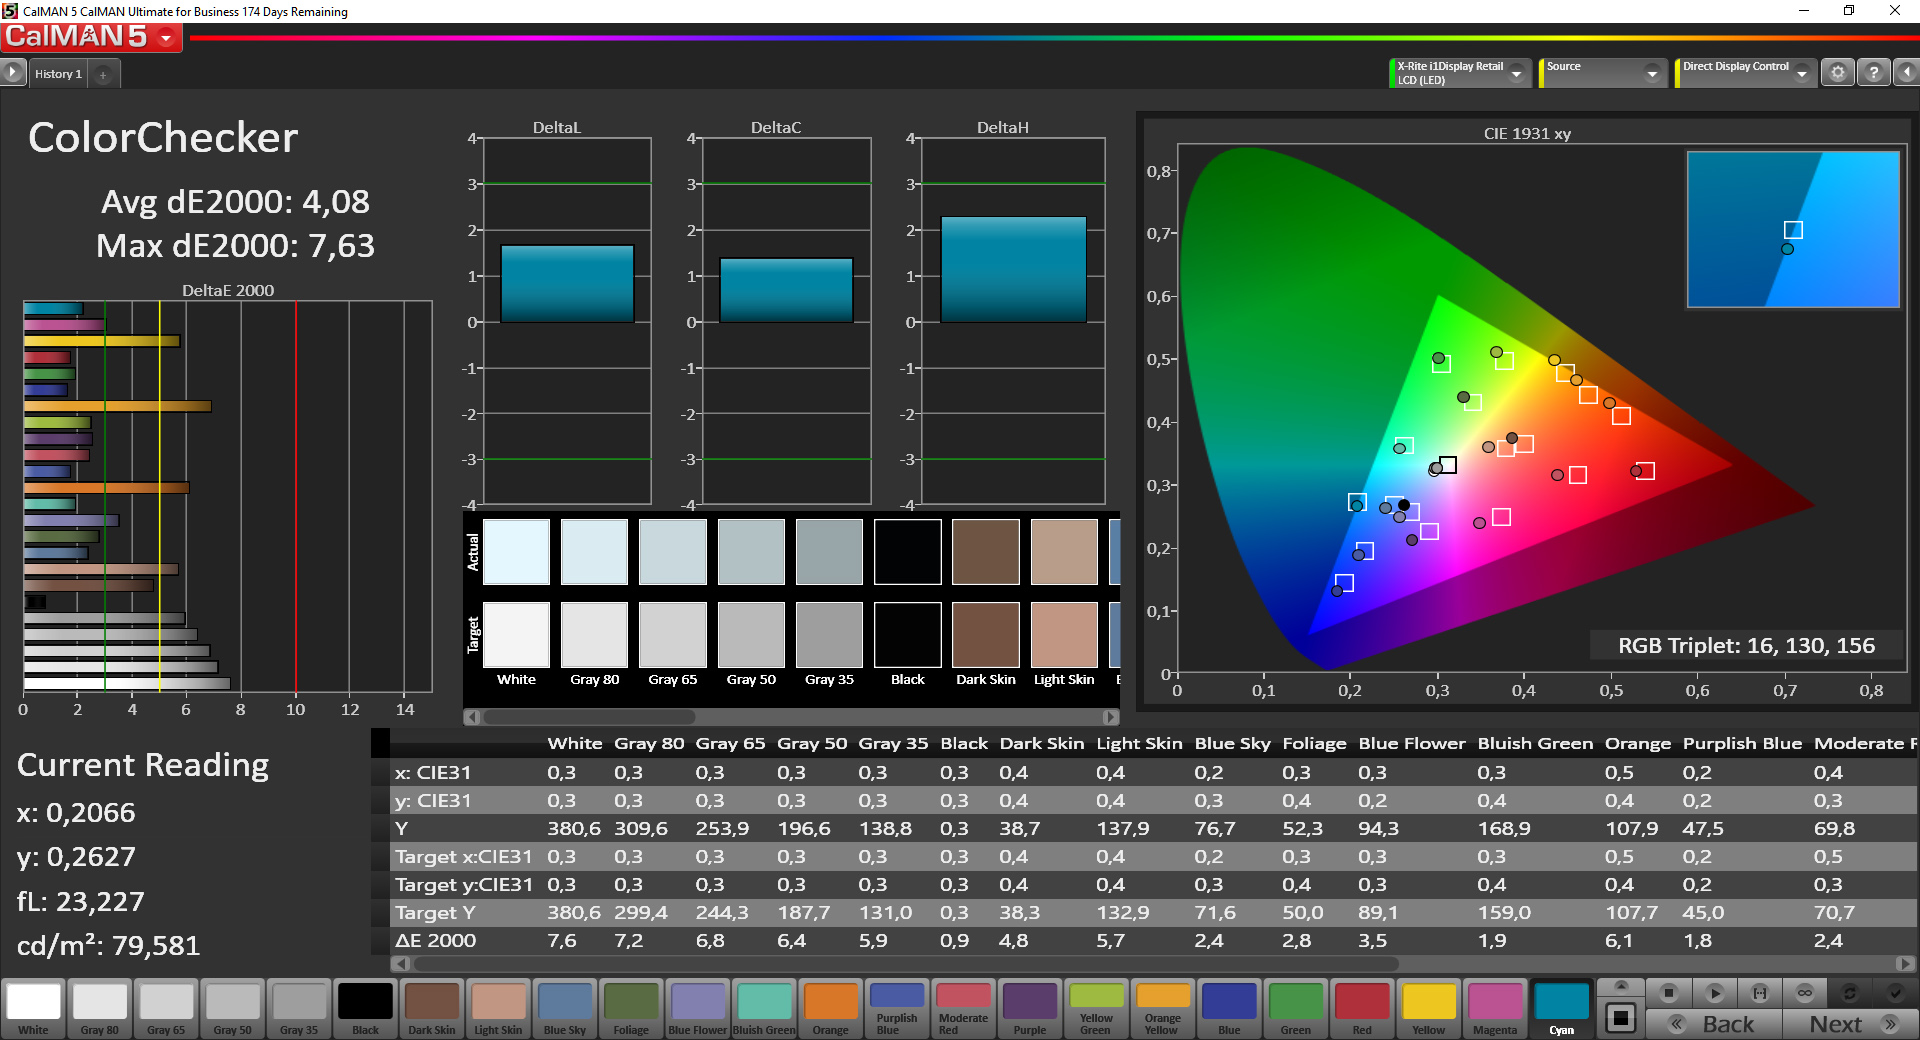
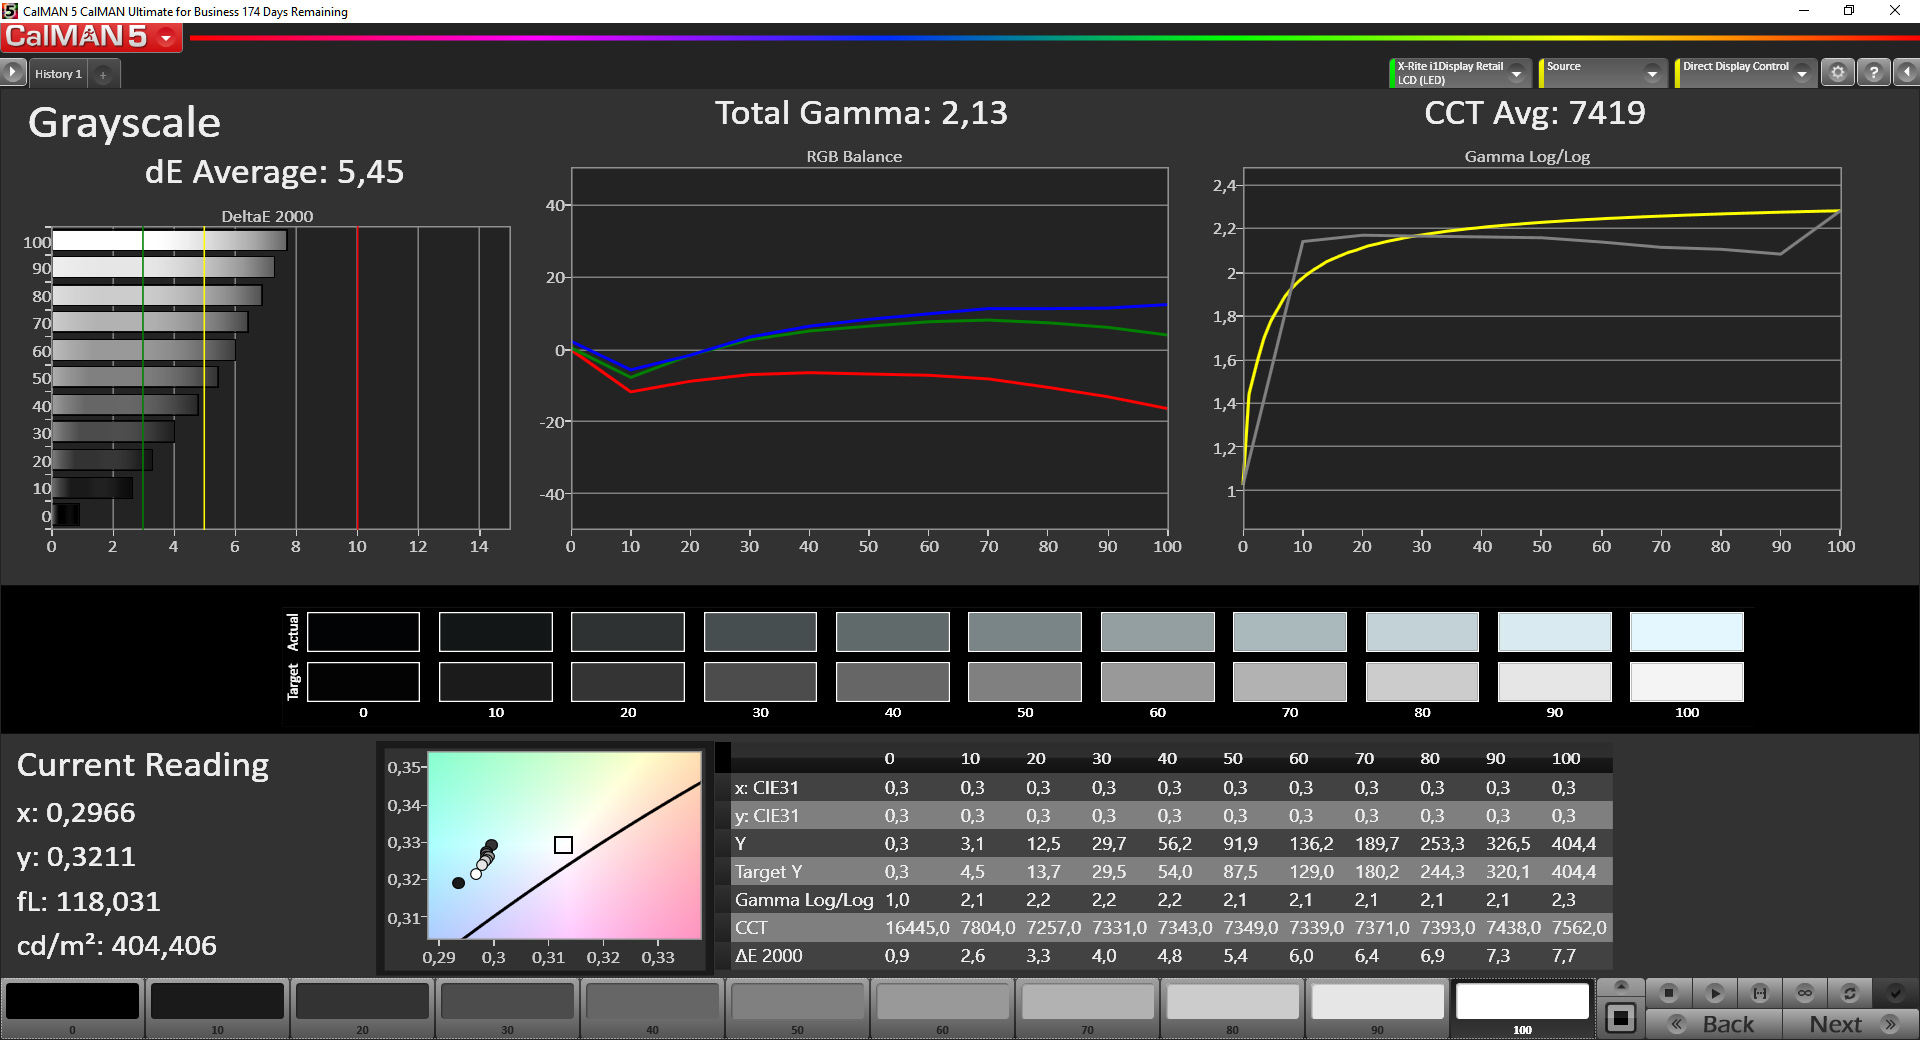
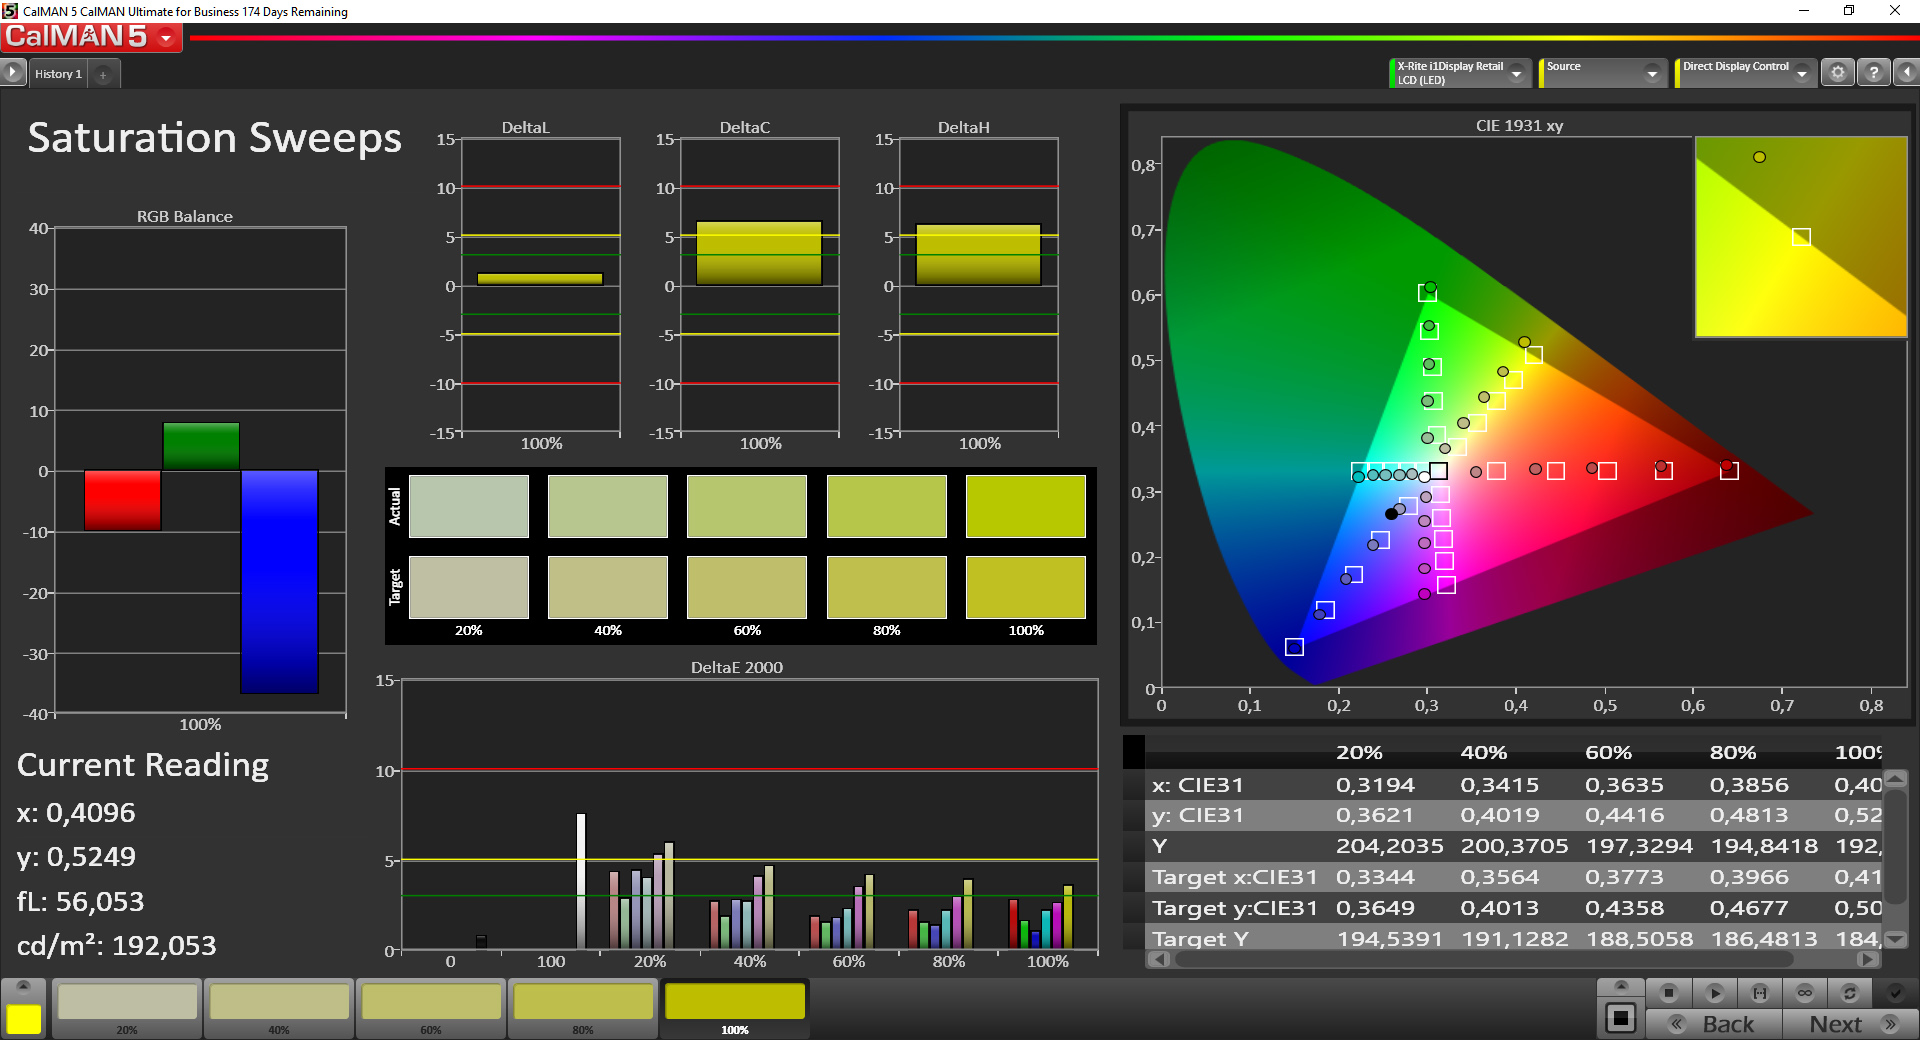
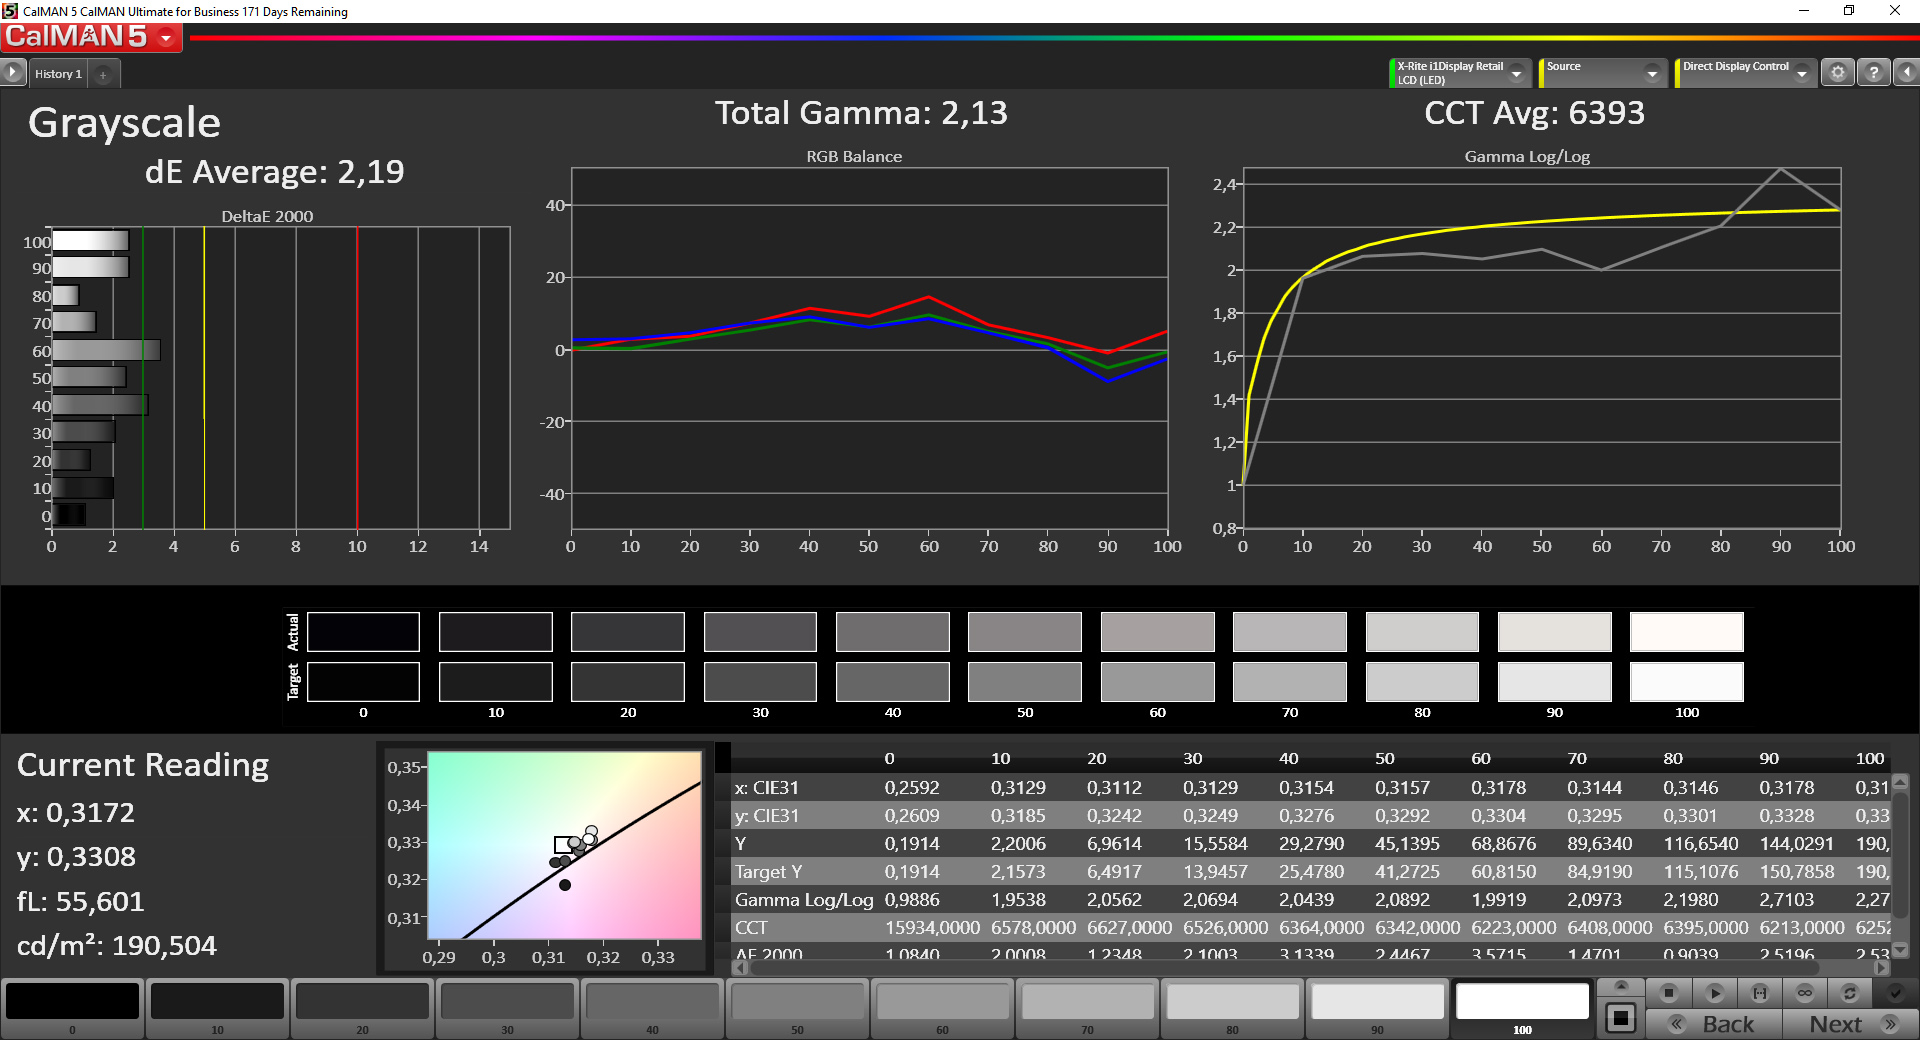
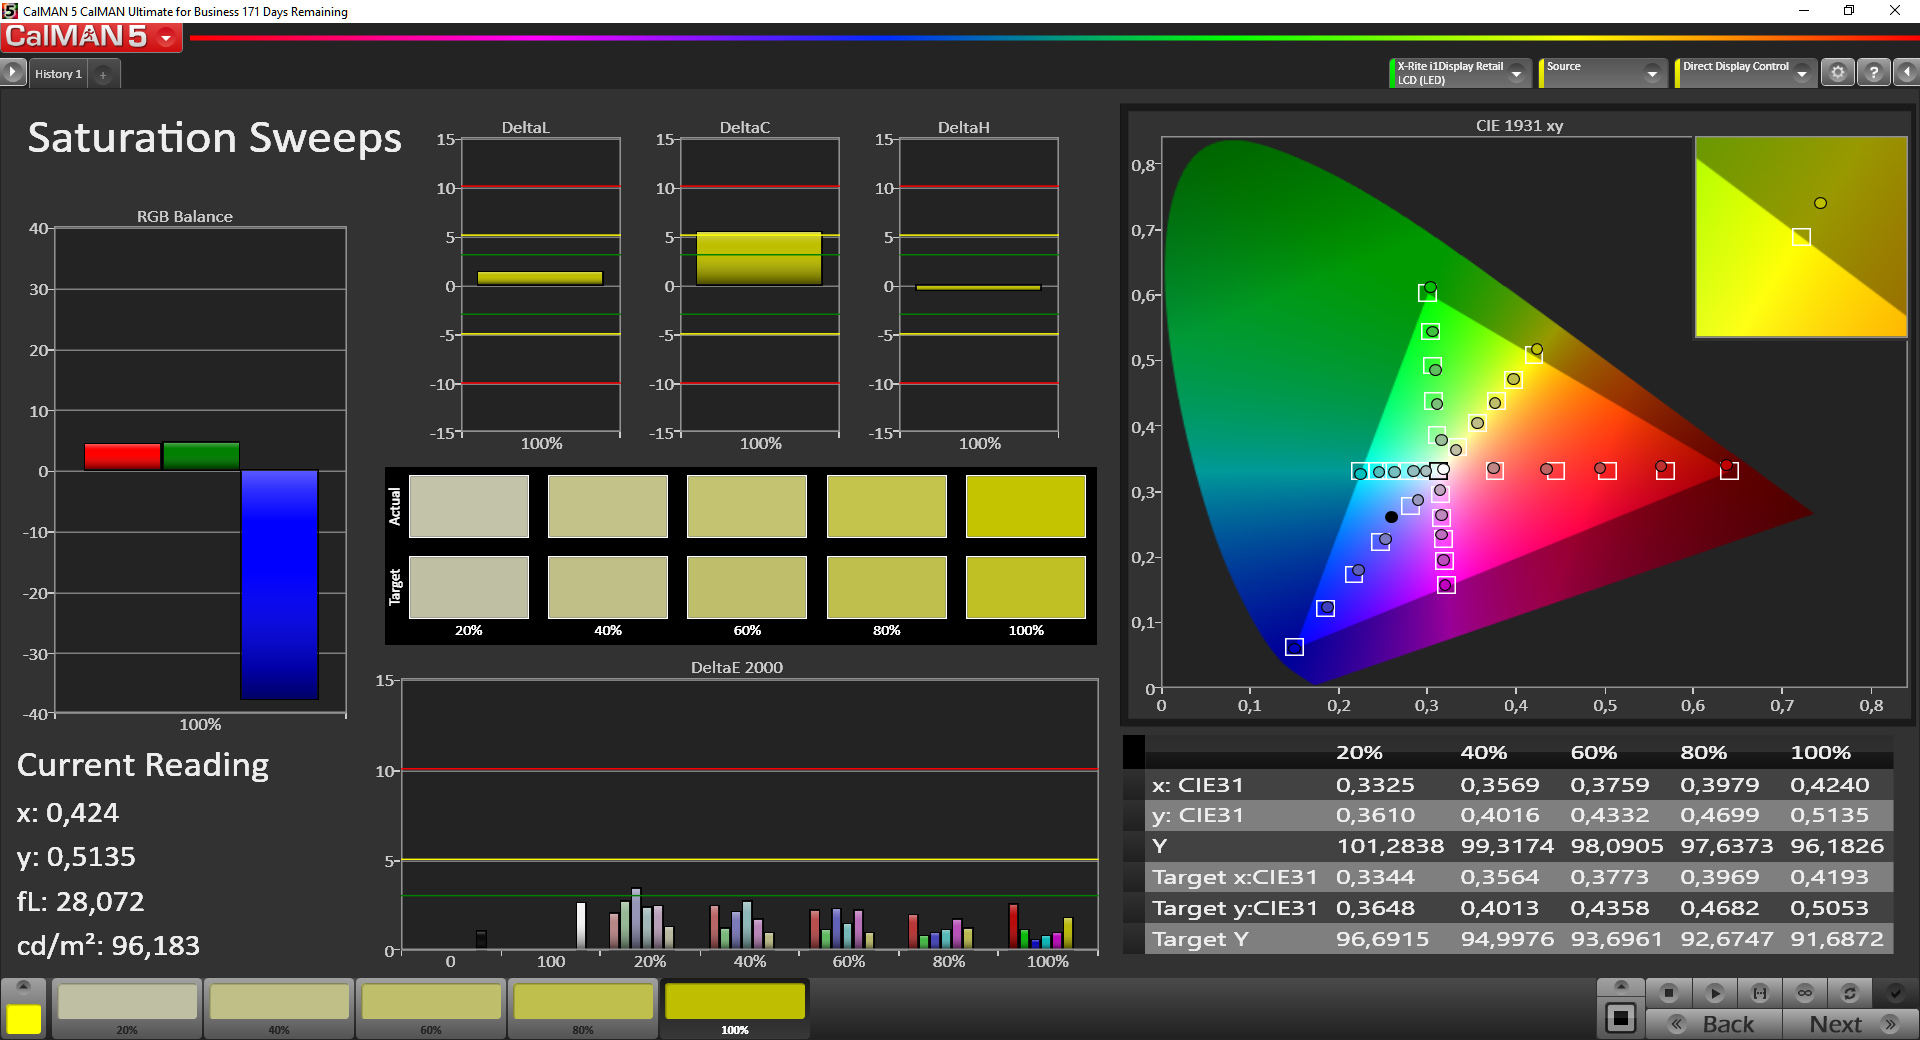
Because of the active CABC, it is difficult to exactly determine the contrast. According to our measurements, it is between 2265:1 (best case) and 636:1 (worst case). Likewise this is true for measuring color output and effects of calibration. We again use an entirely white or black background with a measurement spot in its center in order to fool CABC and determine minimum and maximum deviation. The results of 4.2 in ColorChecker and 5.4 in the Grayscale test are similar to the QHD+ display's with disabled CABC out of the box. It is interesting that the color precision is only minimally different in the provoked best and worst case scenarios, although the brightness of 226 and 404 cd/m² in the grayscale measurements (white) is extremely different. Thus, it can be said that CABC will not cause heavy color shifts, which exceed our measurement results. In our test model's display (Sharp SHP1449 LQ133M1), the white spot gets more bluish (CCT Avg.: 7.404). We could not even detect clouding with an entirely black image in a dark room.

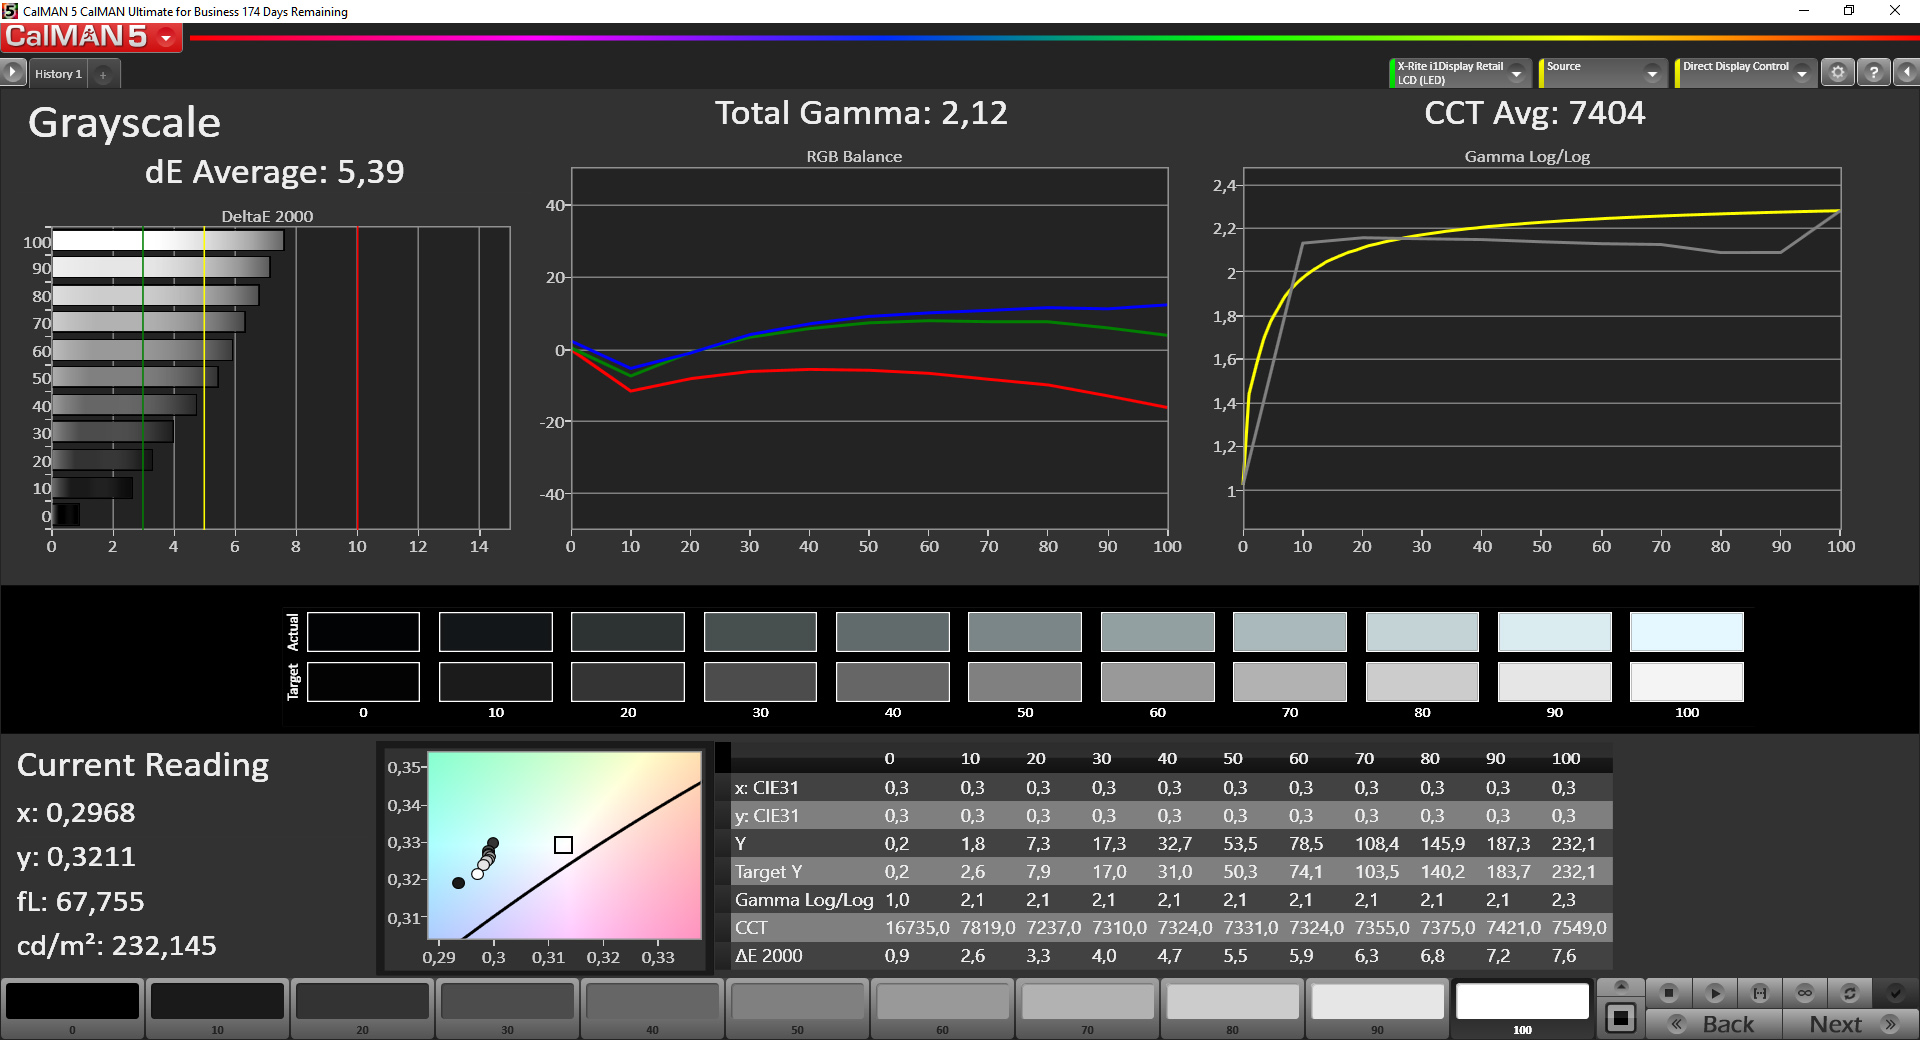

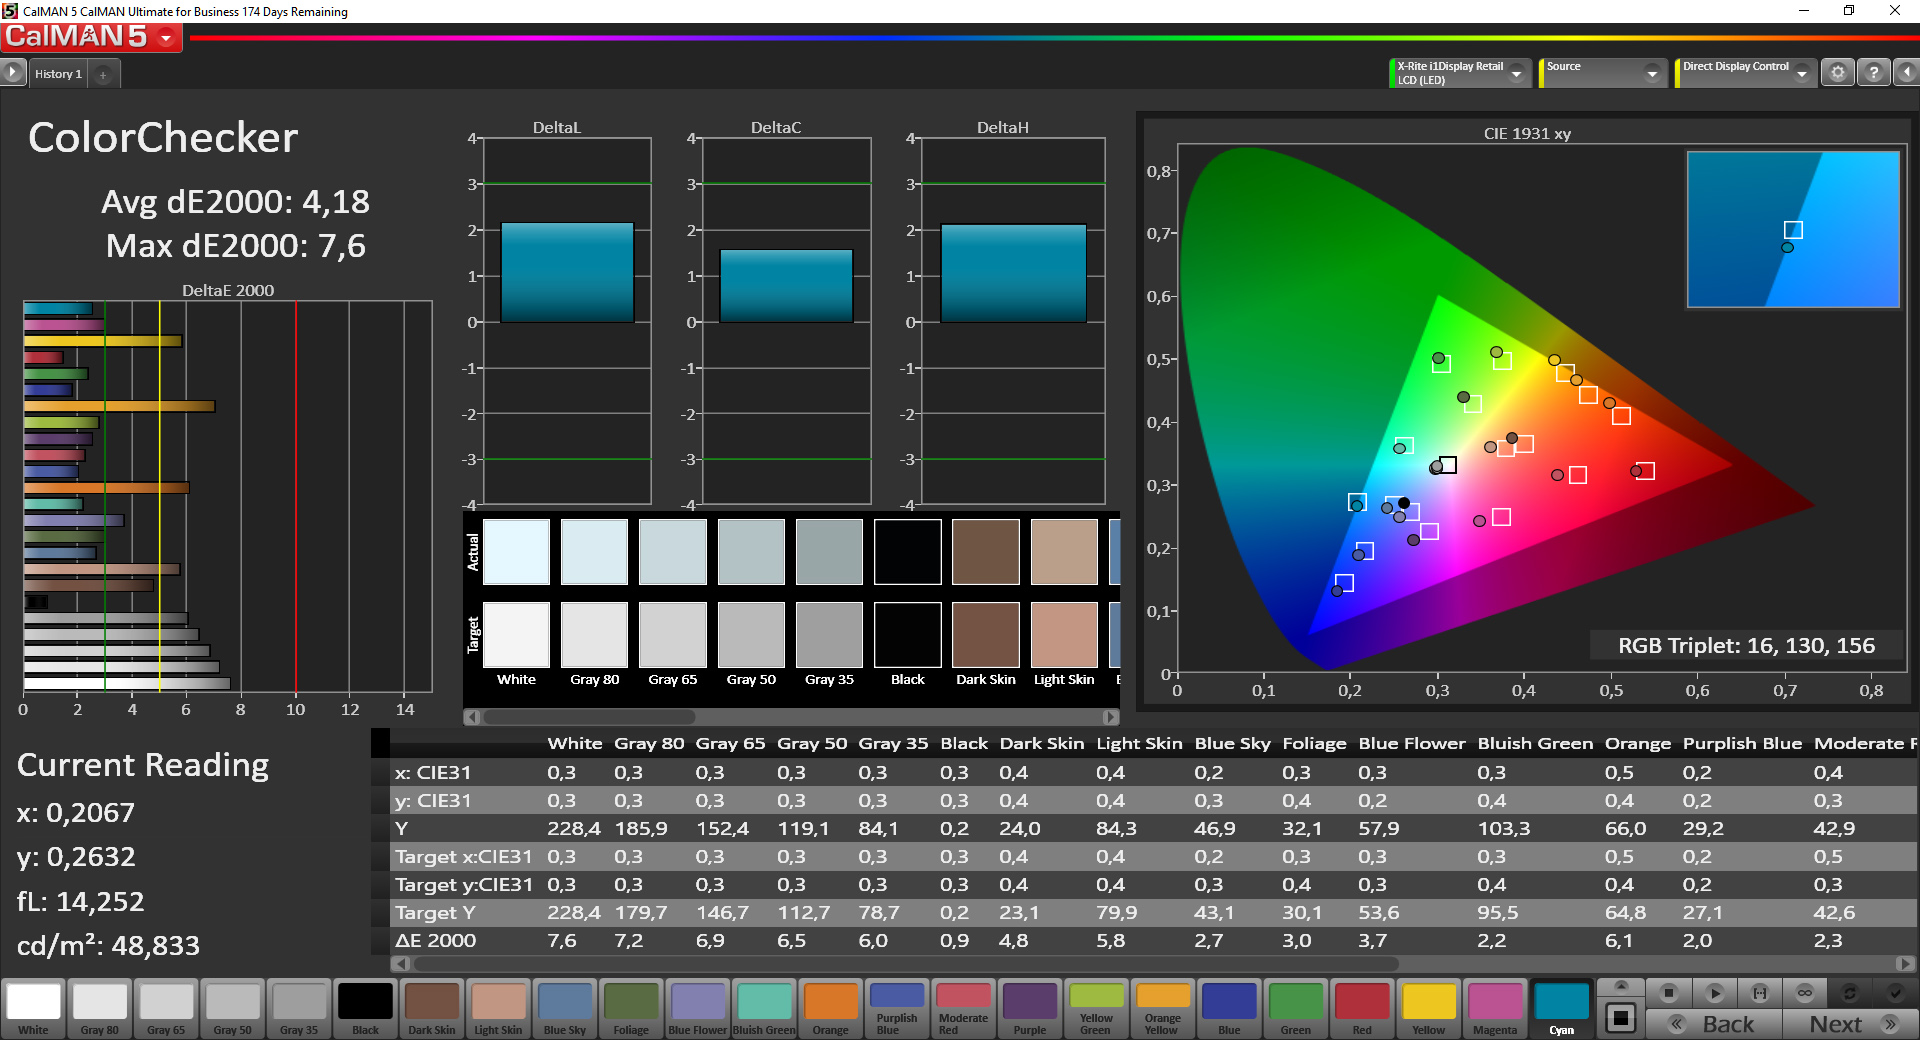


We could decrease the average DeltaE shift below three by calibrating the display with our i1 display colorimeter. Thus, it is almost impossible to distinguish the color output from the reference with the naked eye after calibration. We repeated our color and grayscale measurements with manipulated backgrounds (black, white) after calibration. As in the previous measurement, CABC only causes an insignificant difference. However, we faced some problems with the Windows color management, which again and again used the original profile for no apparent reason.

We measured response times of 24.8 ms in black-to-white and 42.8 ms in gray-to-gray. This means the display performs slightly better than the QHD+ variant of the XPS 13. As in the QHD+ alternative, we could not even detect PWM at the lowest brightness levels.
Display Response Times
| ↔ Response Time Black to White | ||
|---|---|---|
| 24.8 ms ... rise ↗ and fall ↘ combined | ↗ 5.2 ms rise | 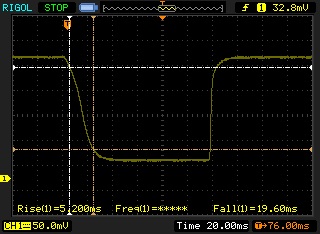 |
| ↘ 19.6 ms fall | ||
| The screen shows good response rates in our tests, but may be too slow for competitive gamers. In comparison, all tested devices range from 0.1 (minimum) to 240 (maximum) ms. » 57 % of all devices are better. This means that the measured response time is worse than the average of all tested devices (20.1 ms). | ||
| ↔ Response Time 50% Grey to 80% Grey | ||
| 42.8 ms ... rise ↗ and fall ↘ combined | ↗ 16 ms rise | 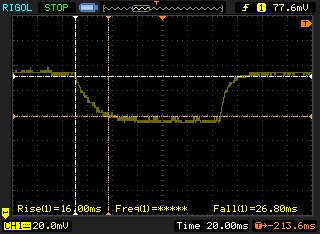 |
| ↘ 26.8 ms fall | ||
| The screen shows slow response rates in our tests and will be unsatisfactory for gamers. In comparison, all tested devices range from 0.165 (minimum) to 636 (maximum) ms. » 70 % of all devices are better. This means that the measured response time is worse than the average of all tested devices (31.4 ms). | ||
Screen Flickering / PWM (Pulse-Width Modulation)
| Screen flickering / PWM not detected | 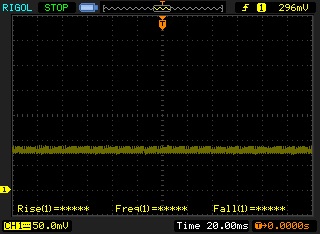 | ||
In comparison: 53 % of all tested devices do not use PWM to dim the display. If PWM was detected, an average of 7996 (minimum: 5 - maximum: 343500) Hz was measured. | |||
Performance
With processor options from i5-6200U up to i7-6500U and the i7-6560U in our test model, you can select between a number of powerful solutions. While for example the ZenBook UX3xx series also includes models with passively cooled Intel Core-m processors, Dell only offers premium mobile notebook performance in its XPS series. Depending on the selected CPU, the XPS 13 either comes with an integrated Intel HD Graphics 520 or a fast Intel Iris Graphics 540 (test model).
Whether you choose an i5 or an i7 with Intel Iris GPU depends on your performance requirements. The i7-6560U clocks at 3.2 GHz, while the i5 "only" allows a maximum clock of 2.8 GHz. As so often, it depends on the planned usage scenario whether such an investment is useful. Currently, you can save about 90 Euros (~$99, excl. VAT) when selecting the Intel i5 in Dell's online shop.
Processor
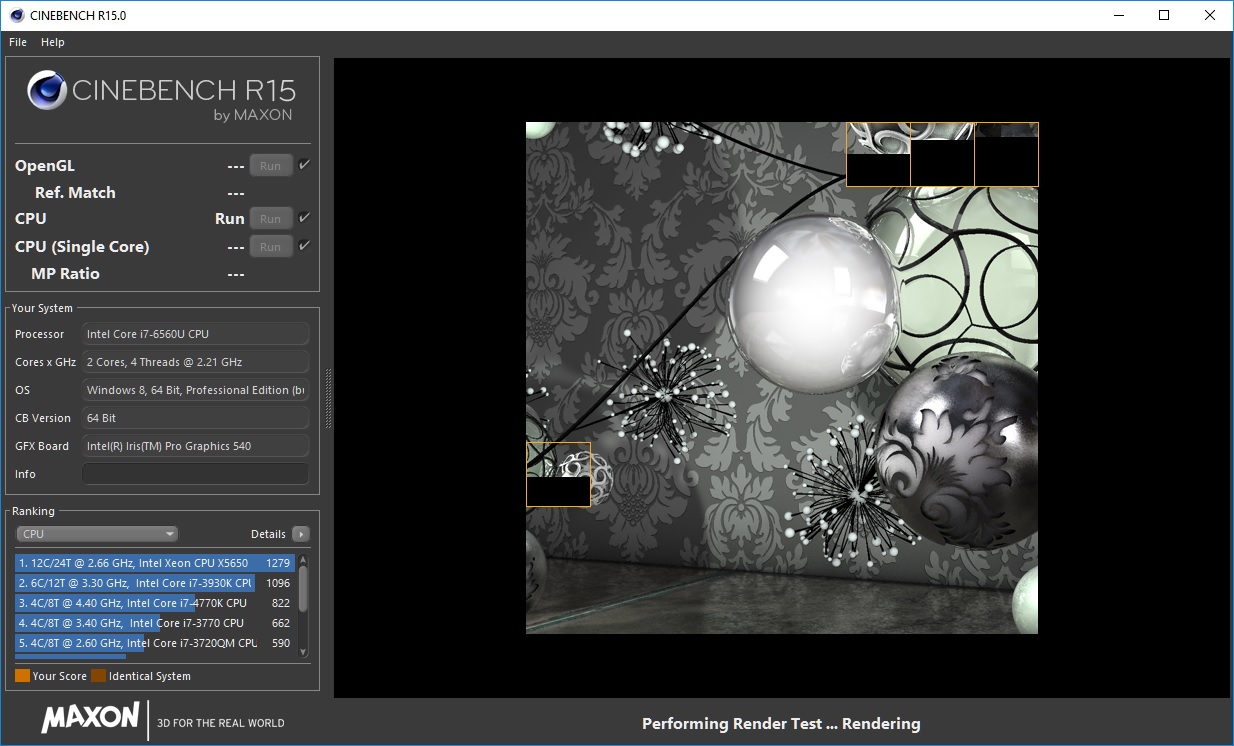
If you compare the processors offered for the XPS 13 to each other, the CPU performance of the i7 is about 10 to 15% better than the i5's. There is not really a difference between the i7-6500U and the i7-6560U here. It is positive that the CPU performance remained roughly constant, when running benchmarks in a loop for a long period of time (about 60 minutes). During plain CPU load, the i7-6560U in our test model repeatedly clocks at 3.2 GHz and the clock rate even remains constantly above 3 GHz during permanent load in this scenario. The core temperatures reached just above 90 °C for brief periods but leveled off between 80 and 90 °C thereafter.
Thus, you can be sure that you have got the full performance available during prolonged CPU-intensive work when you select the faster i7 CPU for your XPS 13.
System Performance
In the PCMark benchmark results, the XPS 13 test sample achieves an excellent performance in the Home v2 test. The same is true for the work score.
| PCMark 8 Home Score Accelerated v2 | 3479 points | |
| PCMark 8 Work Score Accelerated v2 | 4213 points | |
Help | ||
Storage Device
The Samsung PM951 with a capacity of 256 GB in our test model delivers good results in reading but cannot convince compared to other PCIe solutions in writing. In addition, the gross capacity of 256 GB as top option for the FHD model, might be slightly too low for some users. In a separate article, we describe an upgrade to a PCIe-SSD in the Dell XPS 13 including detailed instructions for SSD replacement, system backup and performance analysis. The article will be available soon.
| Dell XPS 13 2016 9350 (FHD, i7-6560U) Samsung PM951 NVMe MZ-VLV256D | Dell XPS 13 9350 WQXGA Samsung PM951 NVMe 512 GB | Acer Aspire S 13 S5-371-71QZ LiteOn CV1-8B512 | Asus Zenbook UX305UA-FC040T SK Hynix Canvas SC300 512GB M.2 (HFS512G39MND) | Asus Zenbook UX303UB-R4100T Micron M600 MTFDDAK512MBF | Apple MacBook 12 (Early 2016) 1.1 GHz Apple SSD AP0256 | Gigabyte P34W v5 Samsung SSD 950 Pro 512GB m.2 NVMe | |
|---|---|---|---|---|---|---|---|
| CrystalDiskMark 3.0 | 44% | -16% | -20% | -13% | 13% | 144% | |
| Read Seq (MB/s) | 1131 | 1236 9% | 502 -56% | 469.1 -59% | 484.2 -57% | 754 -33% | 2269 101% |
| Write Seq (MB/s) | 311.4 | 590 89% | 418.9 35% | 412.1 32% | 444.9 43% | 638 105% | 1524 389% |
| Read 512 (MB/s) | 685 | 615 -10% | 341.3 -50% | 301.6 -56% | 387.8 -43% | 616 -10% | 937 37% |
| Write 512 (MB/s) | 276.3 | 592 114% | 389.7 41% | 327.1 18% | 386.3 40% | 678 145% | 1483 437% |
| Read 4k (MB/s) | 39.63 | 42.36 7% | 29.69 -25% | 28.08 -29% | 28.74 -27% | 14.6 -63% | 53.8 36% |
| Write 4k (MB/s) | 133.9 | 142.2 6% | 86.8 -35% | 71.9 -46% | 90.5 -32% | 20.5 -85% | 167.3 25% |
| Read 4k QD32 (MB/s) | 399.7 | 572 43% | 301.3 -25% | 262 -34% | 300.5 -25% | 464 16% | 622 56% |
| Write 4k QD32 (MB/s) | 245.6 | 482.4 96% | 211.2 -14% | 274.7 12% | 243.3 -1% | 315 28% | 418.9 71% |

Graphics Card
In the 3DMark benchmarks, the integrated Intel Iris Graphics shows a performance gain of 20 to 35% compared to the HD 520. Nevertheless, the GeForce 940M in the Asus UX303UB performs about 30% better in the Fire Strike test. The difference to powerful dedicated graphics cards such as the GeForce GTX 960M in the Alienware 13, which can be called an entry-level GPU for mobile gaming, is apparent, too.
By the way, 3DMark 2011, including all subscores, reported identical results on battery as in mains operation. Thus, you can assume that the XPS 13 can also deliver its full performance when unplugged.
| 3DMark 11 Performance | 2087 points | |
| 3DMark Ice Storm Standard Score | 72283 points | |
| 3DMark Cloud Gate Standard Score | 6859 points | |
| 3DMark Fire Strike Score | 1106 points | |
Help | ||
Gaming Performance
Without doubt, the Dell XPS 13 has not been designed for gaming. Nevertheless, our configuration brings an interesting graphics solution in the Intel Iris Graphics, which we also want to test in real-world gaming. Alike the Intel HD Graphics 520, which is used in most current subnotebooks with Intel Core i U processors, this solution is primarily suitable for older games or current titles with lower hardware requirements. However, it is hardly possible to enjoy the latest blockbusters such as the new Battlefield edition. The Iris Graphics performs about 10 to 15% better than the HD 520 in games. Nvidia's dedicated GeForce 920M is about on par with the used Intel Iris Graphics 540 depending on the game.
| World of Warships | |
| 1366x768 Low Preset AF:Trilinear | |
| Lenovo ThinkPad T560-20FH002RGE | |
| MSI CX61 2QC 2970M MS-16GD | |
| Dell XPS 13 2016 9350 (FHD, i7-6560U) | |
| Acer Aspire S 13 S5-371-71QZ | |
| Apple MacBook 12 (Early 2016) 1.1 GHz | |
| 1366x768 Medium Preset AF:Trilinear | |
| Lenovo ThinkPad T560-20FH002RGE | |
| MSI CX61 2QC 2970M MS-16GD | |
| Dell XPS 13 2016 9350 (FHD, i7-6560U) | |
| Acer Aspire S 13 S5-371-71QZ | |
| Apple MacBook 12 (Early 2016) 1.1 GHz | |
| 1920x1080 High Preset AF:8x | |
| MSI CX61 2QC 2970M MS-16GD | |
| Lenovo ThinkPad T560-20FH002RGE | |
| Dell XPS 13 2016 9350 (FHD, i7-6560U) | |
| Acer Aspire S 13 S5-371-71QZ | |
| Apple MacBook 12 (Early 2016) 1.1 GHz | |
| Overwatch | |
| 1280x720 Low (Render Scale 100 %) AA:FX AF:1x | |
| Dell XPS 13 2016 9350 (FHD, i7-6560U) | |
| MSI CX61 2QC 2970M MS-16GD | |
| 1366x768 Medium (Render Scale 100 %) AA:FX AF:2x | |
| Dell XPS 13 2016 9350 (FHD, i7-6560U) | |
| MSI CX61 2QC 2970M MS-16GD | |
| 1920x1080 High (Render Scale 100 %) AA:SM AF:4x | |
| Dell XPS 13 2016 9350 (FHD, i7-6560U) | |
| MSI CX61 2QC 2970M MS-16GD | |
| The Witcher 3 | |
| 1024x768 Low Graphics & Postprocessing | |
| Lenovo ThinkPad T560-20FH002RGE | |
| MSI CX61 2QC 2970M MS-16GD | |
| Dell XPS 13 2016 9350 (FHD, i7-6560U) | |
| Acer Aspire S 13 S5-371-71QZ | |
| Apple MacBook 12 (Early 2016) 1.1 GHz | |
| 1366x768 Medium Graphics & Postprocessing | |
| Lenovo ThinkPad T560-20FH002RGE | |
| MSI CX61 2QC 2970M MS-16GD | |
| Dell XPS 13 2016 9350 (FHD, i7-6560U) | |
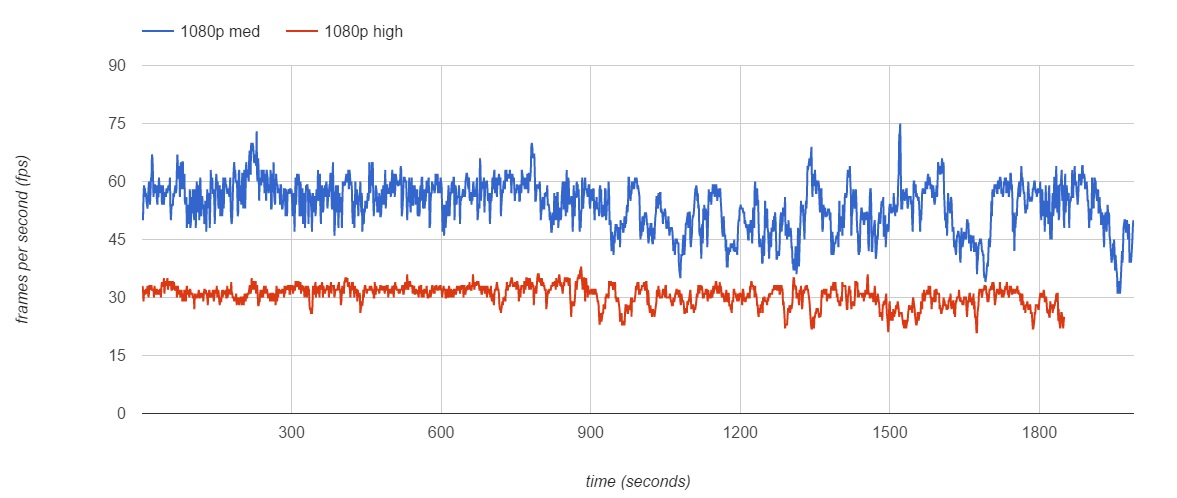
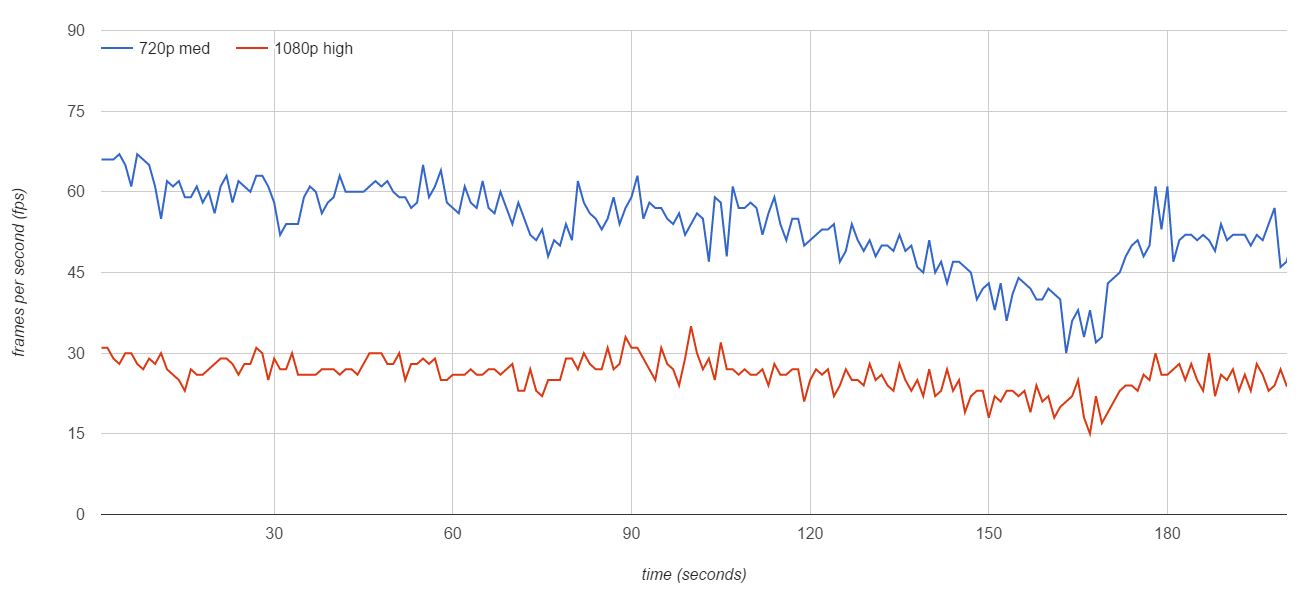
Dota 2

We took a closer look at the popular multi-player game Dota 2. We played a classical match against the AI and recorded the frame rates at a resolution of 1080p and medium presets as well as 1080p and high presets. As you can easily see in the charts, the frame rate remains constantly at about 50 to 60 fps with medium details, while it is about 30 fps with high details at the beginning of the game. Later in the game, when more frequently meeting heroes and optical effects put more stress on the graphics card, the frame rate falls to 30 fps or 20 fps for brief periods with medium or high details, respectively. The ideal configuration might be somewhere in between these two presets, although, subjectively, we did not even experience stuttering or delays at high settings.
World of Warships

Although the highest frame rates are not required in World of Warships for reasonably playing it, a constantly smooth image sequence is desirable anyway. At 1920x1280 pixels and high graphics details, the frame rate even falls below 30 fps without special animations. During fights with explosion effects, visible stuttering is to be expected. You'd better select 1366x768 pixels and medium graphics details for constantly smooth image sequences.
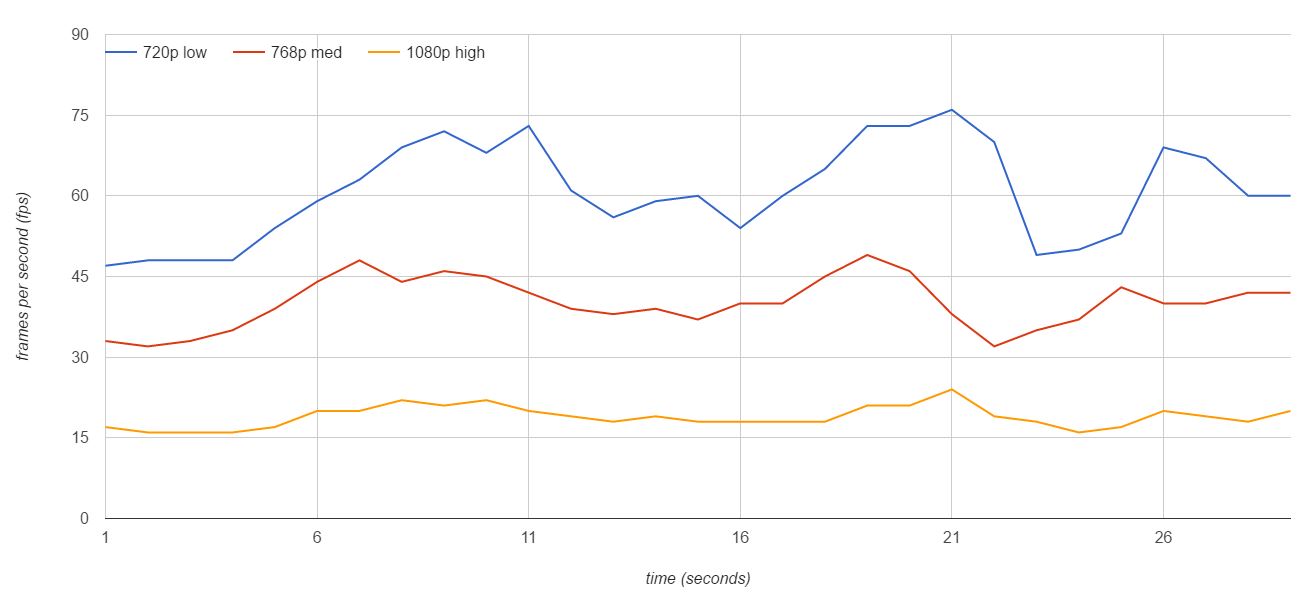
Overwatch

In contrast to World of Warships, a very active gamer is required in Overwatch. Consequently, a similarly fast frame rate is required. Although the frame rate remains above 30 fps at 1366x768 pixels and medium graphics details, a frame rate of 40 fps and higher is recommended for this game, which requires reducing resolution and graphics details.
| low | med. | high | ultra | |
|---|---|---|---|---|
| The Witcher 3 (2015) | 16.5 | 11.5 | ||
| Dota 2 Reborn (2015) | 65.2 | 40 | 21.5 | 19.1 |
| World of Warships (2015) | 78.7 | 53.5 | 25.6 | 18.7 |
| Need for Speed 2016 (2016) | 17.3 | |||
| Overwatch (2016) | 58.2 | 40 | 18.9 | |
| X-Plane 11.11 (2018) | 23.6 | 16.9 | 13.6 | |
| World of Tanks enCore (2018) | 174 | 24.4 | 9.5 | |
| League of Legends (2019) | 114 | 94 | 74 | 71 |
Emissions
System Noise
Apparently, Dell constantly works on the fan control of the XPS 13. The test model's noise level and rotation speed differs from the previous XPS 13 variants.
The notebook usually remains silent when running idle. However, the fan might turn on during office use with throughout low load. It runs at 32.8 dB(A) and about 3600 RPM. This means the device is audible, yet not really disturbing in quiet environments.
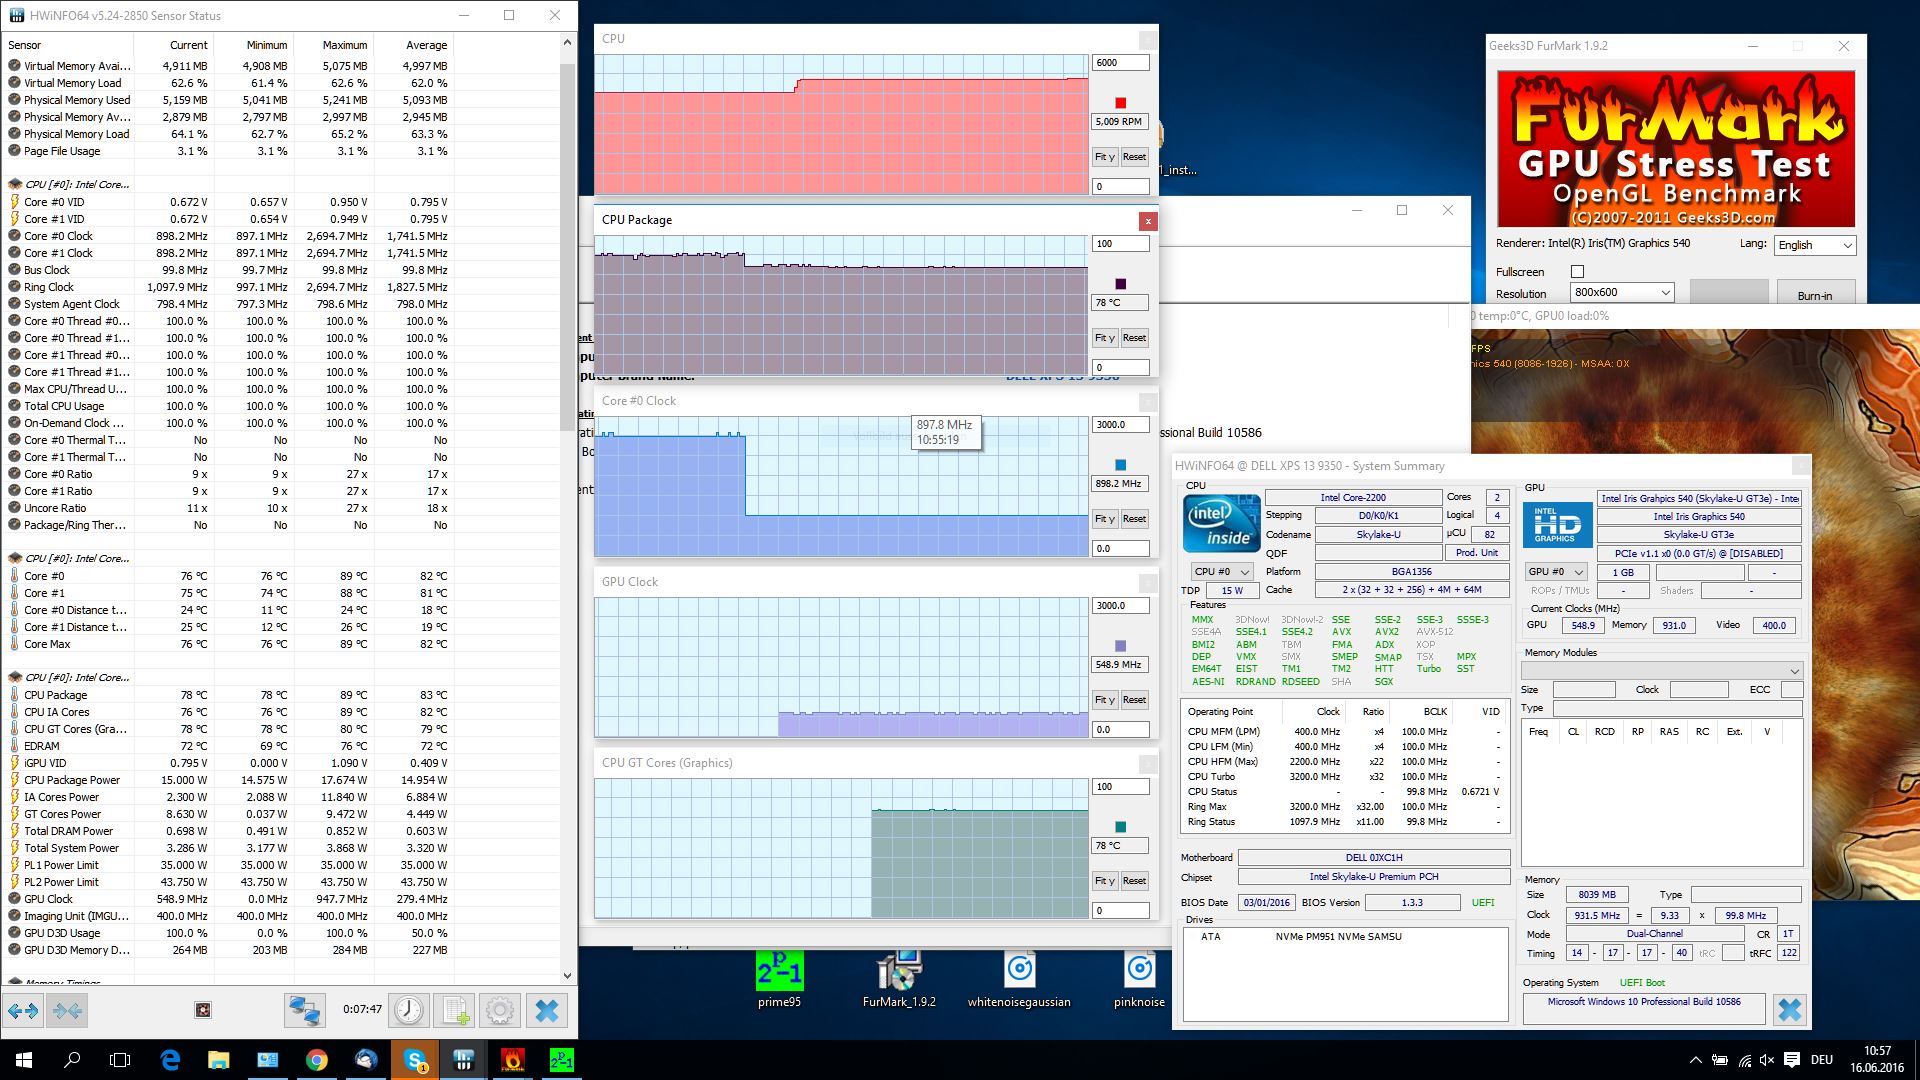
Under load (3DMark06), the XPS levels off at 36.5 dB (4400 RPM). During the Prime 95 CPU stress test, we measured the maximum of 38.3 dB (5000 RPM). As soon as Furmark starts running simultaneously in our classical stress test setup, the CPU throttles to 0.9 GHz, the chip temperature falls below 80 °C, and the fan reduces its speed.
During CPU stress, the CPU levels off at just under 90 °C and the clock rates remain constantly at 2.6 to 2.7 GHz.
Rarely, you can hear electronic noise (coil whining) in entirely quiet environments. However, it does not really attract negative attention in everyday office use.
Noise level
| Idle |
| 30 / 30 / 30 dB(A) |
| Load |
| 36.5 / 38.3 dB(A) |
 | ||
30 dB silent 40 dB(A) audible 50 dB(A) loud |
||
min: | ||
Temperature
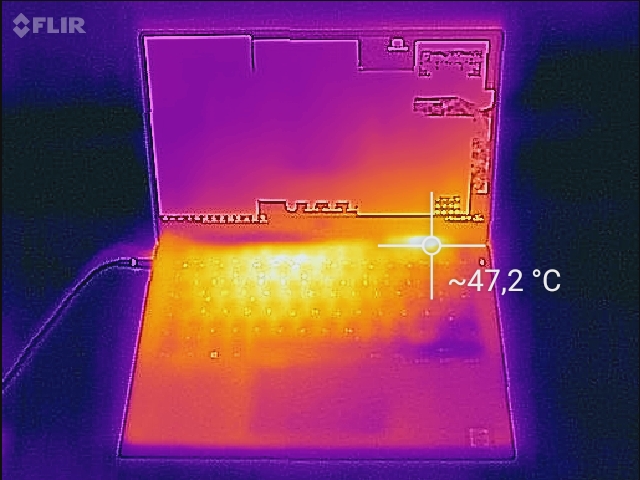
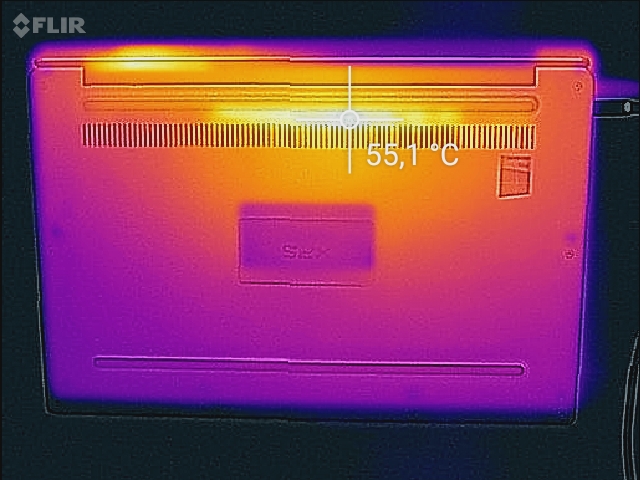
We experienced notable, yet uncritical heating even during everyday office use. The device gets hot under load: During the stress test, i.e. in the worst case, we measured maximum values of above 45 °C on the top side right above the keyboard and above 50 °C on the underside of the notebook.
The thermal images show that the device gets primarily warmer in the central rear segment. The palm rests and the lateral parts of the underside even keep an acceptable temperature under extreme load.
(±) The maximum temperature on the upper side is 45 °C / 113 F, compared to the average of 35.9 °C / 97 F, ranging from 21.4 to 59 °C for the class Subnotebook.
(-) The bottom heats up to a maximum of 50 °C / 122 F, compared to the average of 39.2 °C / 103 F
(+) The palmrests and touchpad are reaching skin temperature as a maximum (32 °C / 89.6 F) and are therefore not hot.
(-) The average temperature of the palmrest area of similar devices was 28.2 °C / 82.8 F (-3.8 °C / -6.8 F).
Speakers
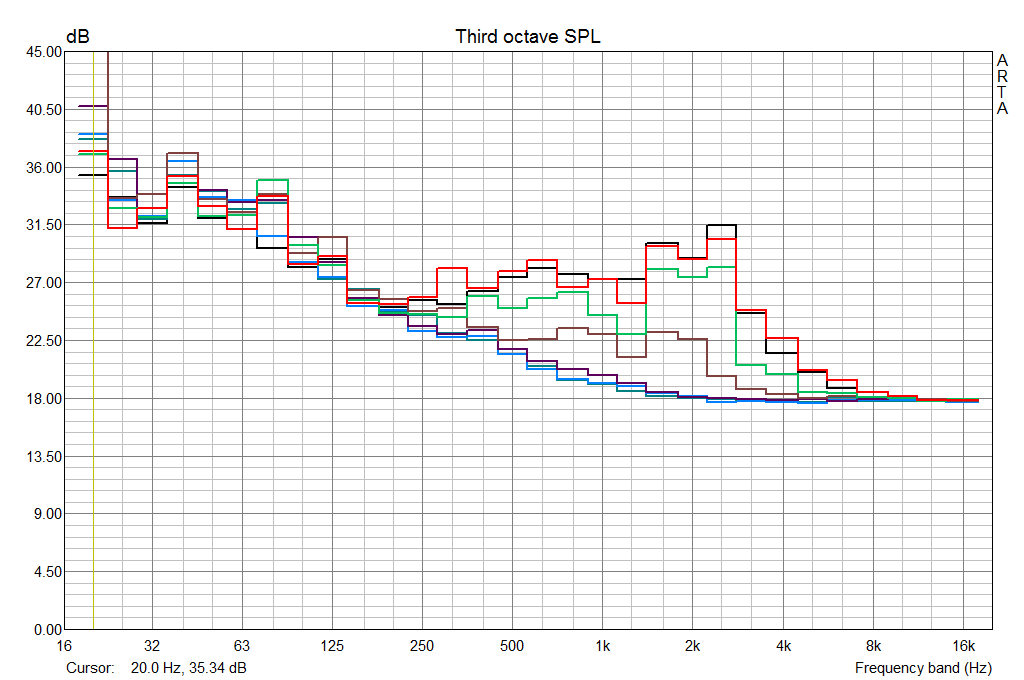
With a high maximum of 83.8 dB, the "speakers" of the Dell XPS 13 are definitely loud. Their sound is also adequate. As so often, the MacBook 12 from Apple performs significantly better in this aspect. The frequency diagram shows that high tones as well as bass can be louder and the characteristic can be linear.
Frequency diagram in comparison (checkboxes at the top can be (un)checked!)
Value 1: Pink Noise 100% Vol.; Value 2: Audio off
Energy Management
Power Consumption
While the system runs idle, we measured a power consumption of 5.8 to 8.5 Watt. Our test model performs slightly better than the reviewed QHD+ edition of the XPS 13 but falls behind several competitors from other brands. However, there are hardly any differences in load scenarios. We measured a maximum of 32.5 Watt (CPU load; Prime95 only). The power consumption is about 4 Watt lower in the stress test due to throttling. The power adapter rated at 45 Watt is sufficient in any case. We measured 0.25 Watt when the device is off and 0.45 Watt in stand-by.
According to our measurements, a maximum of about 1 Watt can be saved through CABC. This heavily depends on the scenario and might be even lower in practice.
| Dell XPS 13 2016 9350 (FHD, i7-6560U) 6560U, Iris Graphics 540, 56 Wh | Dell XPS 13 9350 WQXGA 6560U, Iris Graphics 540, 56 Wh | Dell XPS 13 2016 i7 256GB QHD 6500U, HD Graphics 520, 56 Wh | Acer Aspire S 13 S5-371-71QZ 6500U, HD Graphics 520, 45 Wh | Asus Zenbook UX360CA-FC060T 6Y30, HD Graphics 515, 54 Wh | Asus Zenbook UX305UA-FC040T 6500U, HD Graphics 520, 56 Wh | |
|---|---|---|---|---|---|---|
| Power Consumption | -17% | -16% | 9% | 26% | 16% | |
| Idle Minimum * (Watt) | 5.8 | 7.2 -24% | 6.8 -17% | 4.1 29% | 3.4 41% | 3.2 45% |
| Idle Average * (Watt) | 7.3 | 9.3 -27% | 10 -37% | 6.7 8% | 7 4% | 6.5 11% |
| Idle Maximum * (Watt) | 8.5 | 11.6 -36% | 10.5 -24% | 7.4 13% | 7.6 11% | 6.7 21% |
| Load Average * (Watt) | 30.6 | 31.9 -4% | 30.2 1% | 32.4 -6% | 19 38% | 30.6 -0% |
| Load Maximum * (Watt) | 32.5 | 29.9 8% | 33.6 -3% | 32.4 -0% | 20.1 38% | 31 5% |
* ... smaller is better
| Off / Standby | |
| Idle | |
| Load |
|
Key:
min: | |
Battery Life
With above 7 hours in our Wi-Fi test (about 150 cd/m²), pages are opened automatically in the browser), the XPS 13 delivers a good result, which is suitable for everyday use. Apart from the idle runtime, the measured battery runtimes are slightly below the results of the XPS 13 with i5 and HD 520 and a very early BIOS version. XPS 13 models with QHD+ display perform about 15 to 25% worse. In comparison, the Asus ZenBook UX305UA performs extraordinarily well. It even lasts two hours longer in the Wi-Fi test.
| Dell XPS 13 2016 9350 (FHD, i7-6560U) 6560U, Iris Graphics 540, 56 Wh | Dell XPS 13 9350 WQXGA 6560U, Iris Graphics 540, 56 Wh | Dell XPS 13 2016 i7 256GB QHD 6500U, HD Graphics 520, 56 Wh | Dell XPS 13-9350 6200U, HD Graphics 520, 56 Wh | Acer Aspire S 13 S5-371-71QZ 6500U, HD Graphics 520, 45 Wh | Asus Zenbook UX360CA-FC060T 6Y30, HD Graphics 515, 54 Wh | Asus Zenbook UX305UA-FC040T 6500U, HD Graphics 520, 56 Wh | Asus Zenbook UX303UB-DH74T 6500U, GeForce 940M, 50 Wh | |
|---|---|---|---|---|---|---|---|---|
| Battery runtime | -26% | -16% | -3% | -4% | 21% | 21% | -28% | |
| Reader / Idle (h) | 15.7 | 10.1 -36% | 13.1 -17% | 13 -17% | 17.1 9% | 17.1 9% | 23.8 52% | 10.3 -34% |
| WiFi v1.3 (h) | 7.3 | 5.2 -29% | 7.2 -1% | 7.5 3% | 7.9 8% | 6.4 -12% | 9.4 29% | 5.7 -22% |
| Load (h) | 2.4 | 2.1 -12% | 1.7 -29% | 2.5 4% | 1.7 -29% | 4 67% | 2 -17% | 1.7 -29% |
| H.264 (h) | 9.1 |
Pros
Cons
Verdict
As we have already done four reviews on the Dell XPS 13 9350 with different configurations, it is not easy to add new discoveries in the verdict. Our test model with i7-6560U (Intel Iris Graphics) and matte FHD display from Dell's business shop primarily confirms already observed advantages and disadvantages of the current XPS 13 series.
A brief summary once again: high-end, stable cases with discreet looks, good connectivity with fast SD-card reader, fast Wi-Fi module and Thunderbolt 3 as highlight, good input devices, a very good system performance thanks to fast CPU, GPU and PCIe SSD; even if there are already significantly faster SSDs currently on the market. Good for power users: Dell's XPS 13 even provides full performance on battery, however, only for about two hours. During office use, you can expect a battery life between 7 and 8 hours depending on the scenario.
Is the Dell XPS 13 the best business notebook?
The XPS is an interesting alternative to classical subnotebooks such as the ThinkPad X260, the EliteBook 820 G3, and certainly the Latitude E7270 for business users. The XPS is smaller and partly even lighter, while providing a bigger display and at least equal performance if not even higher performance (GPU) than these. With Windows 10 Pro, many BIOS options and included Dell ProSupport (next business day), the XPS 13, which is successful in the consumer market, has been enhanced by indispensable professional features.
What are the disadvantages of the XPS 13? It's probably easiest to get over the fact that the touchpad is a fingerprint magnet. The active CABC (Content Adaptive Brightness Control), which automatically adjusts the display brightness depending on the display content without user control, is more critical. Although it hardly has an impact on colors and grayscales, it causes a big contrast range (636:1 to 2265:1). The advantages in energy saving might be more important for office users, however mobile image editors and graphics users are urged to select a QHD+ display, which allows disabling the CABC feature.
The price for the always high performance is that the top model of the XPS can get quite warm under load. In addition, you have to accept that the fan sometimes even gets active during low office load.
Dell XPS 13 2016 9350 (FHD, i7-6560U)
- 06/22/2016 v5.1 (old)
J. Simon Leitner
Price comparison
