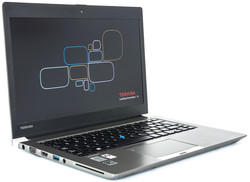
Toshiba Portégé Z30-C-138 Subnotebook Review

For the original German review, see here.
The Portégé Z30-C succeeds the Z30-B model that was still furnished with a Broadwell processor. We did not have the B version in review, but we tested Toshiba's Satellite Z30-B-100 that is based on a very similar chassis. Toshiba has started using the same barebone with minor modifications for both the high-end consumer and the high-end business members this year. We will take a quick look at the Portégé Z30-C in this short test since it is largely known from the almost identically built Satellite Z30-B, apart from the technical Skylake upgrade.
Case & Connectivity
The matte casing is not really a guarantee for highest stiffness; the look and feel resembles plastic (thin, hollow sounding surfaces, pliable display), although it is a magnesium alloy. The low weight of 1218 grams is impressive. The rivals are much heavier.
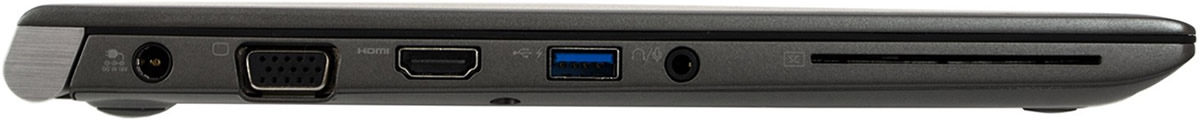
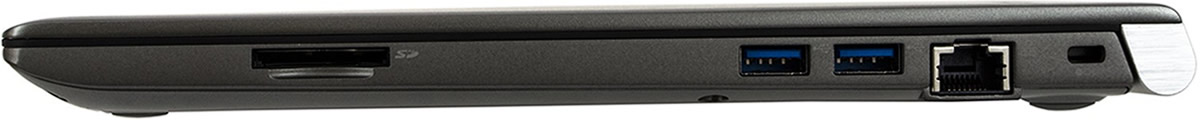
Everything typical for business is installed, including an LTE modem and fingerprint scanner. Even the old VGA dSub still exists here. The port for Toshiba's Hi-Speed Port Replicator III is on the underside. Maintenance is possible; the underside can be removed.
Input Devices
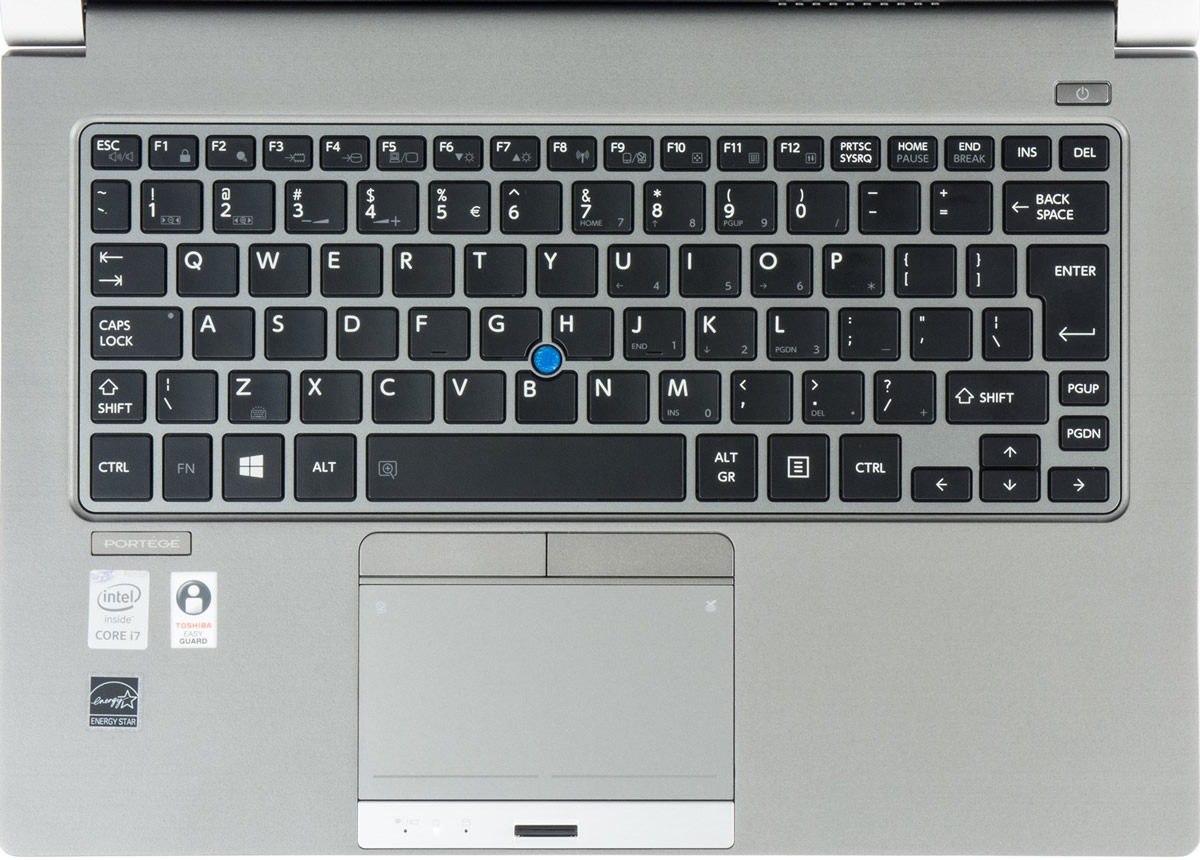
The keys offer a clear drop and a soft stroke. However, the key surface does not yield but every single letter rebounds a bit in its place. The pressure point could be a bit more defined. The tester finds the feedback for a 2000-Euro (~$2252) device overall too spongy. The input device is not at all bad particularly since it features a TrackPoint and ClickPad. Unfortunately, the latter has a short drop and no dedicated mouse keys. The functionality of the two keys above it belongs to the mini-joystick. However, they also have an unsatisfactorily short key drop although they are easy to use thanks to their smooth-running pressure point. The ThinkPad T460s and Latitude E7470 do a better job in total here.
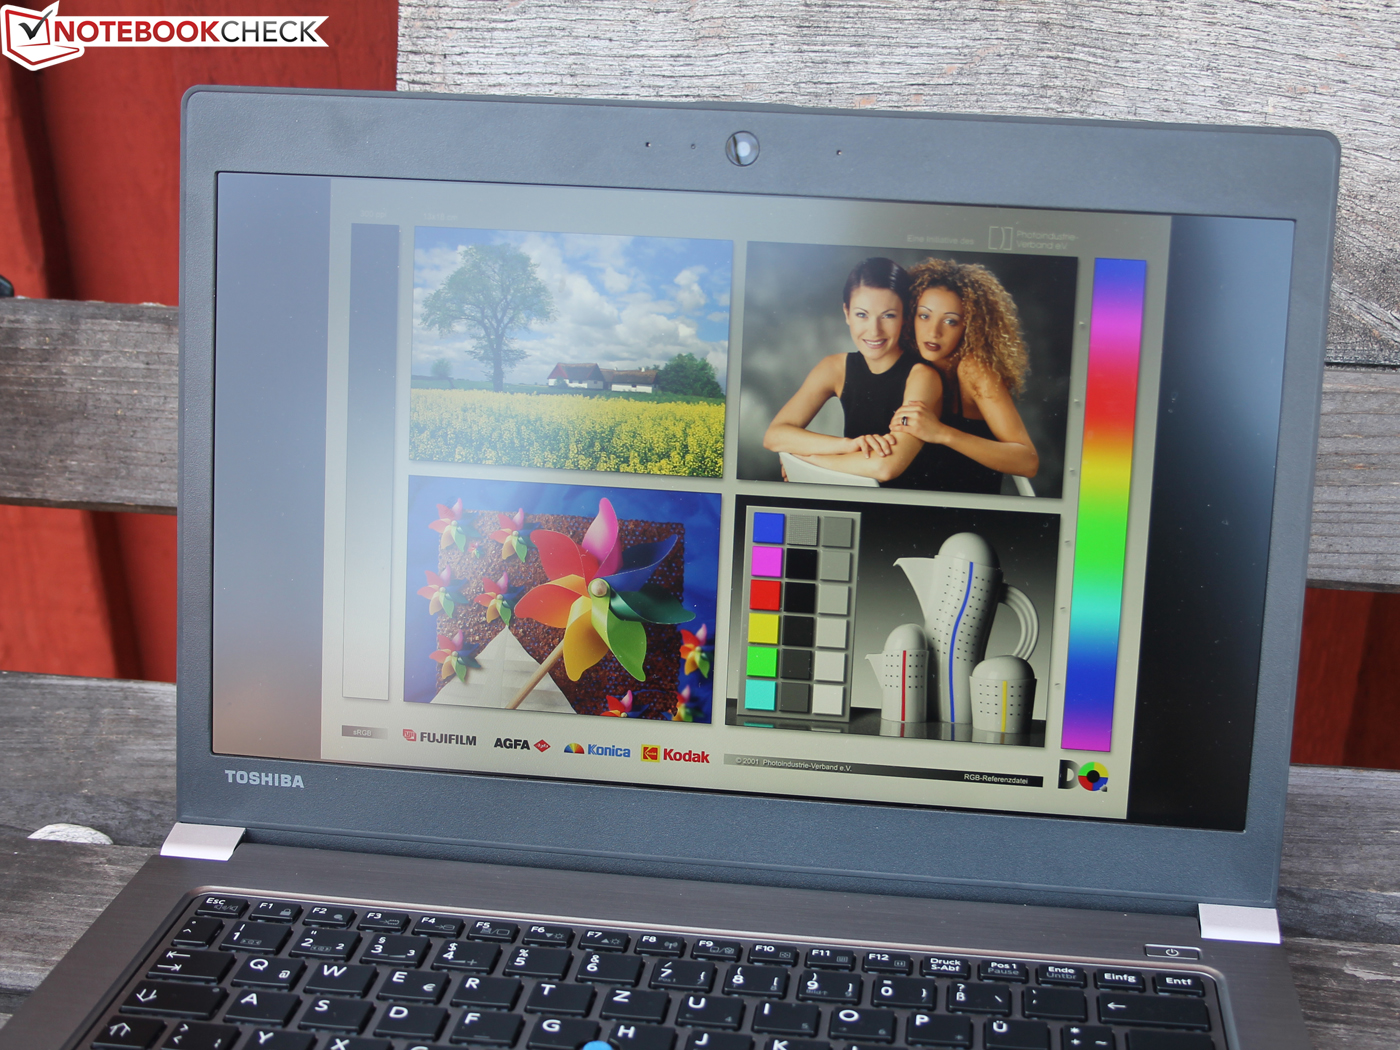
Display
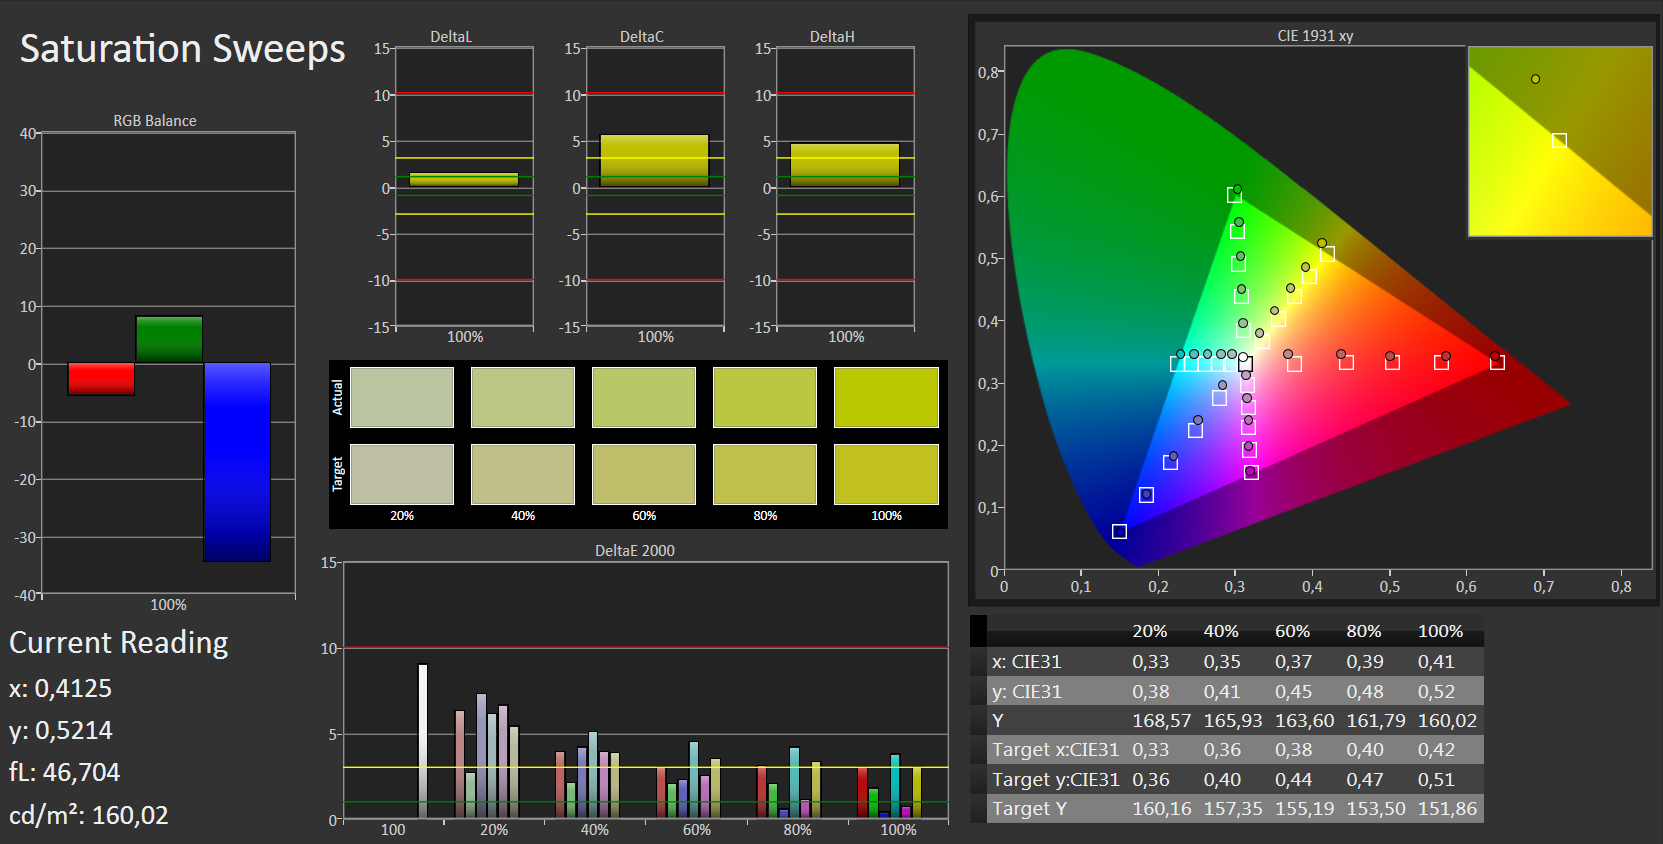
The Full HD IPS screen is relatively bright and, of course, matte. Fortunately, Toshiba does not install a brightness sensor. Both contrast and DeltaE are in the upper midfield, but the grayscale level reproduction is fairly poor.
| |||||||||||||||||||||||||
Brightness Distribution: 87 %
Center on Battery: 300 cd/m²
Contrast: 968:1 (Black: 0.31 cd/m²)
ΔE ColorChecker Calman: 4.9 | ∀{0.5-29.43 Ø4.76}
ΔE Greyscale Calman: 6.69 | ∀{0.09-98 Ø5}
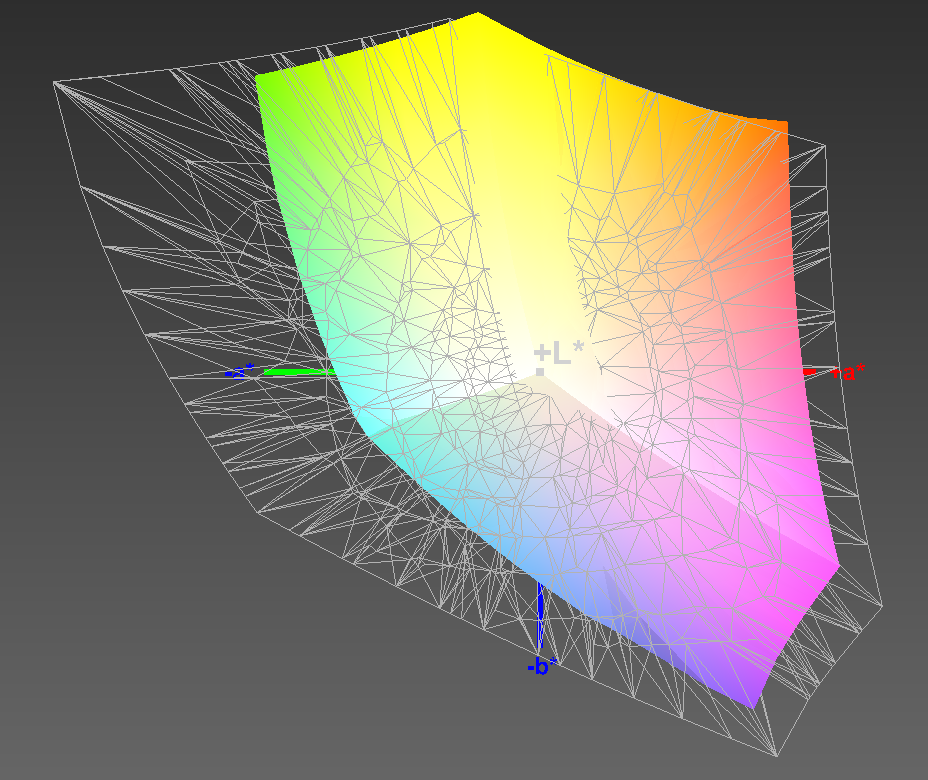
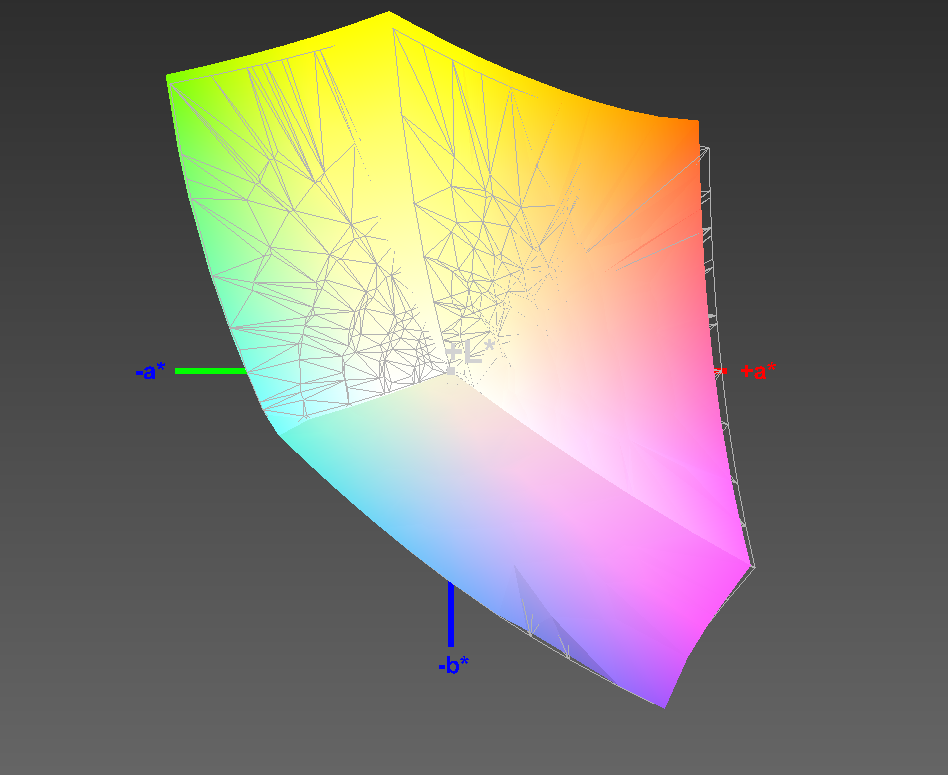
98% sRGB (Argyll 1.6.3 3D)
63% AdobeRGB 1998 (Argyll 1.6.3 3D)
69.8% AdobeRGB 1998 (Argyll 3D)
98% sRGB (Argyll 3D)
67.9% Display P3 (Argyll 3D)
Gamma: 2.33
CCT: 6487 K
| Toshiba Portege Z30-C-138 FHD 1920x1080 IPS | HP EliteBook 840 G3 T9X59ET#ABD FHD 1920x1080 TN | Dell Latitude 14 7000 Series E7470 WQHD 2560x1440 IPS Touch | Lenovo ThinkPad T460s-20F9003SGE FHD 1920x1080 IPS | Lenovo ThinkPad T460s-20FA003GGE WQHD 2560x1440 IPS | HP EliteBook Folio 1040 G3 WQHD 2560x1440 IPS | Acer TravelMate P645-S-58HK FHD 1920x1080 IPS | |
|---|---|---|---|---|---|---|---|
| Display | -27% | -1% | -38% | 1% | -0% | -5% | |
| Display P3 Coverage (%) | 67.9 | 48.93 -28% | 67.2 -1% | 41.65 -39% | 68.7 1% | 67.9 0% | 66.7 -2% |
| sRGB Coverage (%) | 98 | 73.7 -25% | 95.9 -2% | 61.6 -37% | 98.1 0% | 96.8 -1% | 90.8 -7% |
| AdobeRGB 1998 Coverage (%) | 69.8 | 50.5 -28% | 69.3 -1% | 43.14 -38% | 70.4 1% | 70 0% | 66.5 -5% |
| Response Times | 5% | -5% | -2% | 6% | -2% | ||
| Response Time Grey 50% / Grey 80% * (ms) | 42 ? | 43 ? -2% | 48 ? -14% | 42 ? -0% | 35.6 ? 15% | 46.4 ? -10% | |
| Response Time Black / White * (ms) | 28 ? | 25 ? 11% | 27 ? 4% | 29.2 ? -4% | 29.2 ? -4% | 26.4 ? 6% | |
| PWM Frequency (Hz) | 217 ? | 204 ? | 220 ? | ||||
| Screen | -38% | 21% | -20% | 1% | 6% | 0% | |
| Brightness middle (cd/m²) | 300 | 366 22% | 380 27% | 226 -25% | 257 -14% | 327 9% | 331 10% |
| Brightness (cd/m²) | 280 | 336 20% | 354 26% | 211 -25% | 248 -11% | 316 13% | 309 10% |
| Brightness Distribution (%) | 87 | 87 0% | 81 -7% | 89 2% | 94 8% | 87 0% | 82 -6% |
| Black Level * (cd/m²) | 0.31 | 0.65 -110% | 0.26 16% | 0.22 29% | 0.26 16% | 0.35 -13% | 0.4 -29% |
| Contrast (:1) | 968 | 563 -42% | 1462 51% | 1027 6% | 988 2% | 934 -4% | 828 -14% |
| Colorchecker dE 2000 * | 4.9 | 10.26 -109% | 3.11 37% | 6.44 -31% | 4.59 6% | 4.39 10% | 4.07 17% |
| Colorchecker dE 2000 max. * | 8.91 | 6.73 24% | 17.18 -93% | 9.72 -9% | 7.27 18% | ||
| Greyscale dE 2000 * | 6.69 | 11.51 -72% | 4.35 35% | 5.87 12% | 6.38 5% | 4.69 30% | 4.86 27% |
| Gamma | 2.33 94% | 2.4 92% | 2.37 93% | 2.37 93% | 2.51 88% | 2.15 102% | 2.49 88% |
| CCT | 6487 100% | 12725 51% | 6771 96% | 6856 95% | 6238 104% | 7101 92% | 6109 106% |
| Color Space (Percent of AdobeRGB 1998) (%) | 63 | 47 -25% | 62 -2% | 39.58 -37% | 65 3% | 62.52 -1% | 59 -6% |
| Color Space (Percent of sRGB) (%) | 98 | 74 -24% | 96 -2% | 61.15 -38% | 98 0% | 96.71 -1% | 90.6 -8% |
| Total Average (Program / Settings) | -20% /
-29% | 5% /
13% | -20% /
-21% | 3% /
1% | 1% /
4% | -3% /
-1% |
* ... smaller is better
Display Response Times
| ↔ Response Time Black to White | ||
|---|---|---|
| 28 ms ... rise ↗ and fall ↘ combined | ↗ 7 ms rise | 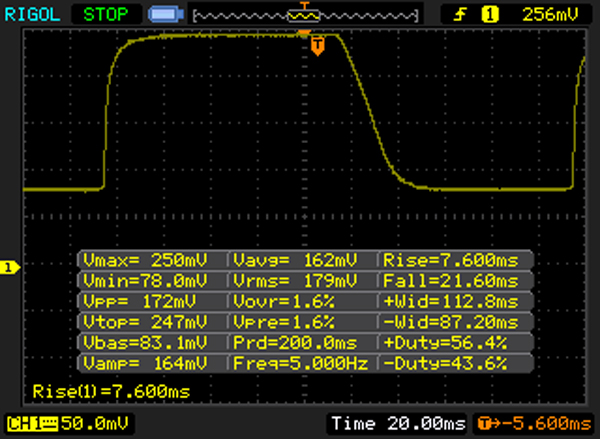 |
| ↘ 21 ms fall | ||
| The screen shows relatively slow response rates in our tests and may be too slow for gamers. In comparison, all tested devices range from 0.1 (minimum) to 240 (maximum) ms. » 70 % of all devices are better. This means that the measured response time is worse than the average of all tested devices (20.1 ms). | ||
| ↔ Response Time 50% Grey to 80% Grey | ||
| 42 ms ... rise ↗ and fall ↘ combined | ↗ 18 ms rise | 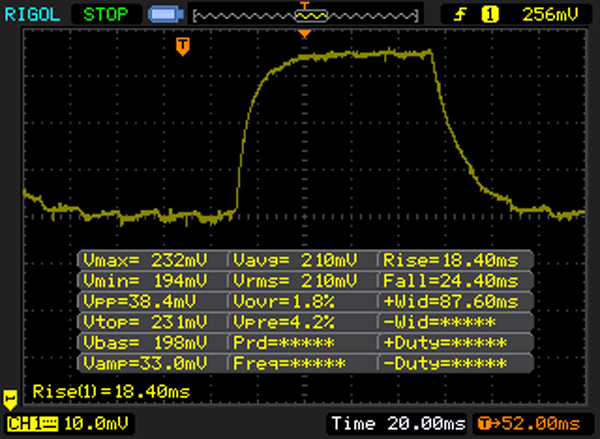 |
| ↘ 24 ms fall | ||
| The screen shows slow response rates in our tests and will be unsatisfactory for gamers. In comparison, all tested devices range from 0.165 (minimum) to 636 (maximum) ms. » 67 % of all devices are better. This means that the measured response time is worse than the average of all tested devices (31.5 ms). | ||
Screen Flickering / PWM (Pulse-Width Modulation)
| Screen flickering / PWM detected | 217 Hz | ≤ 40 % brightness setting | 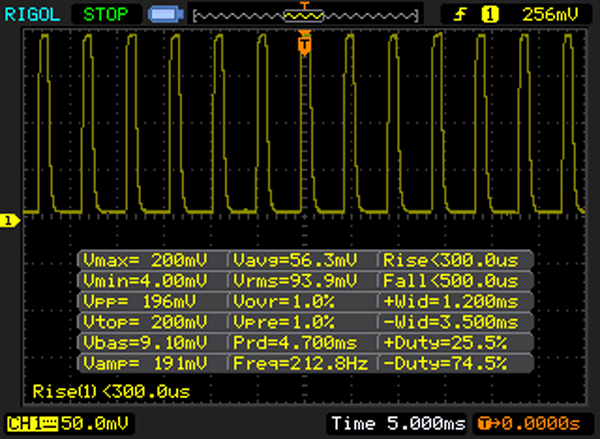 |
The display backlight flickers at 217 Hz (worst case, e.g., utilizing PWM) Flickering detected at a brightness setting of 40 % and below. There should be no flickering or PWM above this brightness setting. The frequency of 217 Hz is relatively low, so sensitive users will likely notice flickering and experience eyestrain at the stated brightness setting and below. In comparison: 53 % of all tested devices do not use PWM to dim the display. If PWM was detected, an average of 8039 (minimum: 5 - maximum: 343500) Hz was measured. | |||
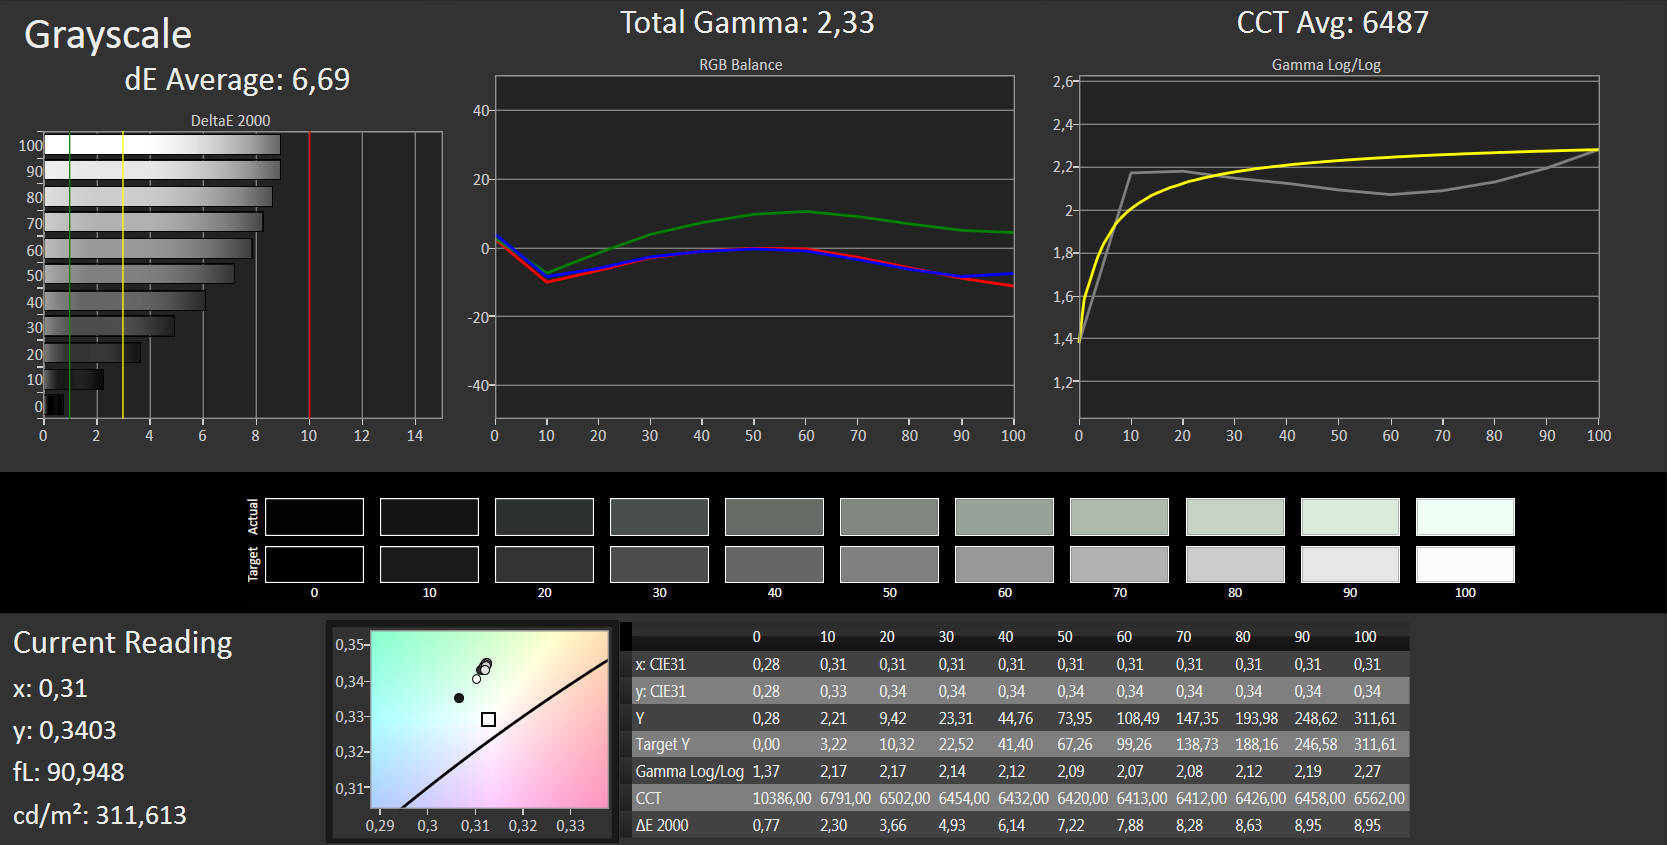
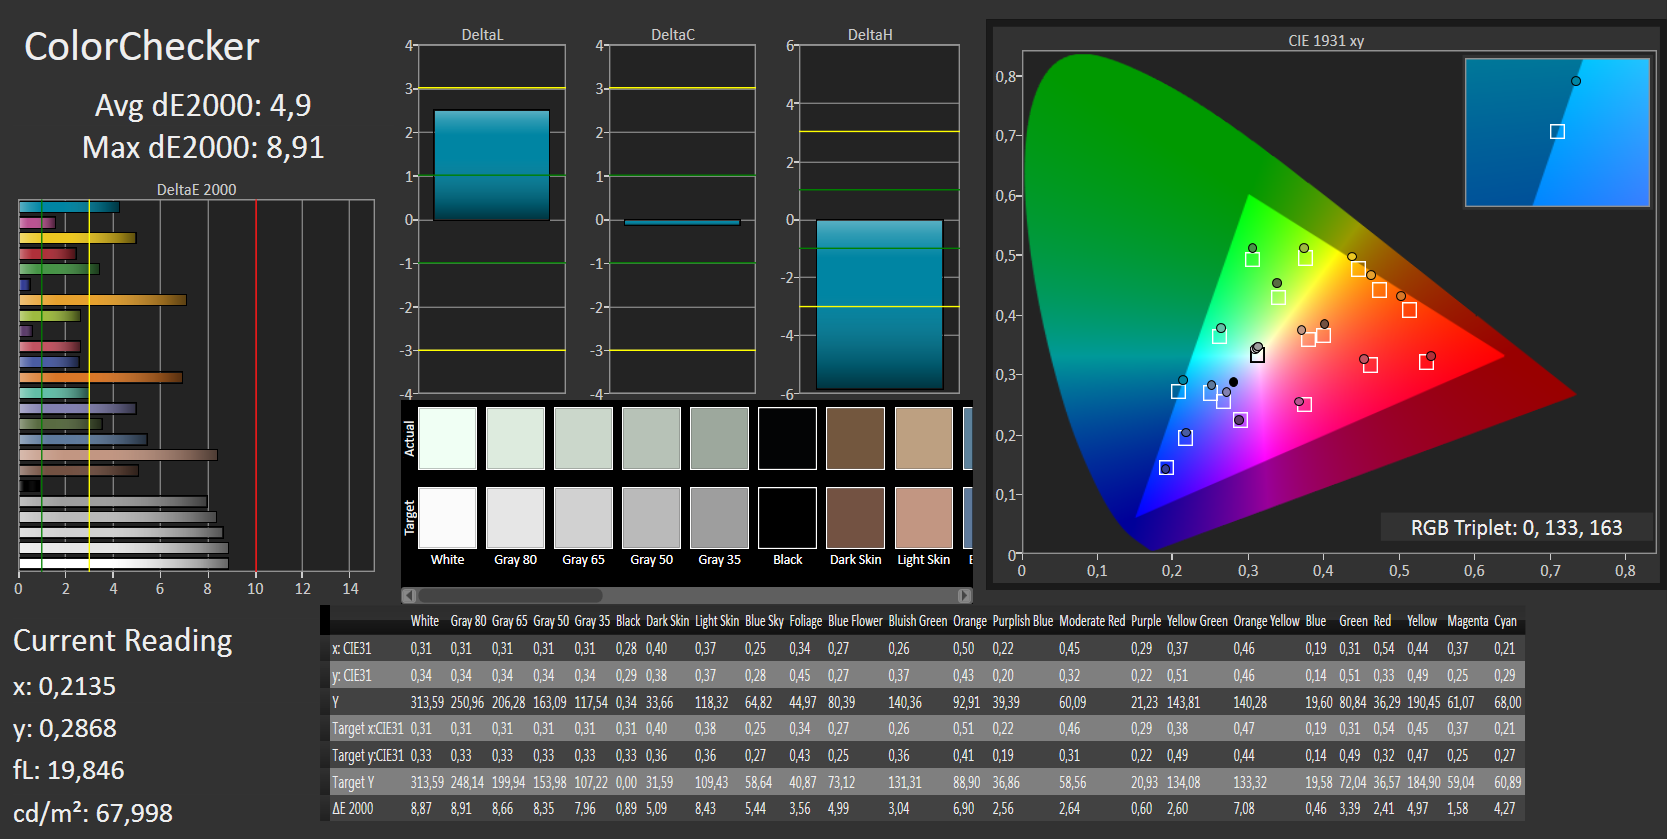
We did not observe a bluish tint in this panel although Toshiba does not deliver a color profile. The grayscale level's slight tendency to shift into yellow could be lessened via the color profile linked in the box above, which we created with our photospectrometer. The grayscale screenshot Target versus Actual shows a light yellowish tint.
Performance
We tested the pricey 2000-Euro (~$2252) maximum configuration based on a Core i7-6500U (2.50 GHz), 16 GB of DDR3 RAM (2x 8 GB) and a 512 GB SSD. The price for the entry-level model with a Core i5-6200U and 256 GB SSD starts at 1700 Euros (~$1914). It also sports the LTE modem.
When looking at price comparisons, Toshiba's Portégé Z30-C with i5-6200U and a 256 GB SSD is listed at a starting price of just 900 Euros (~$1013). Its disadvantage is the HD panel (1366x768 pixels). The more expensive Portégé Z30-C-10H is the first to have a matte FHD panel. We cannot say whether it is the same as in the review sample. Toshiba speaks of an "anti-glare Full HD TFT High Brightness eDP display with 16:9 aspect ratio and LED backlighting." The screen in the present Portégé Z30-C is described in exactly the same way.
Processor
The Turbo clocks stably at 3.0 GHz for the first few minutes. The clock then drops to 2.7 - 2.8 when a core temperature of 78 °C is reached, so after around 3 minutes, and it remains there permanently even over longer periods. That is less than the same SoC in the EliteBook 840 G3 achieves. Cinebench calculates stably at 3.0 GHz here. We can observe the impact of this in the single-core test where the Z30-C lags behind the 840 G3 by 42% and 12% in the multi-core test. The upper-range i7 cannot really unfold its potential and is sooner on par with the older i5-5200U.
System Performance
Of course, the Z30-C is fast thanks to its SSD, but the T460s takes first place with Samsung's SM951a. PCMark 8 Home sees a plus of 8% here. This marginal difference is insignificant for real-world use; all listed devices sport an SSD and offer a very smooth utilization alongside short waiting times.
| PCMark 8 Home Score Accelerated v2 | 3271 points | |
Help | ||
Storage Device
Toshiba's THNSNJ512G8NY SSD is apparently somewhat weaker than Samsung's SM951 (T460s and Folio 1040). That is primarily due to the tremendously fast read rates no matter whether small, random or large, sequential blocks are read.
| Toshiba Portege Z30-C-138 HD Graphics 520, 6500U, Toshiba HG6 THNSNJ512G8NY | HP EliteBook 840 G3 T9X59ET#ABD HD Graphics 520, 6500U, Samsung SSD PM851 256 GB MZNTE256HMHP | Dell Latitude 14 7000 Series E7470 HD Graphics 520, 6600U, Samsung SSD PM851 M.2 2280 256GB | Lenovo ThinkPad T460s-20FA003GGE HD Graphics 520, 6600U, Samsung SSD SM951a 512GB M.2 PCIe 3.0 x4 NVMe (MZVKV512) | HP EliteBook Folio 1040 G3 HD Graphics 520, 6300U, Samsung SM951 MZVPV256HDGL m.2 PCI-e | Acer TravelMate P645-S-58HK HD Graphics 5500, 5200U, Kingston RBU-SNS8100S3256GD | |
|---|---|---|---|---|---|---|
| CrystalDiskMark 3.0 | 15% | 26% | 152% | 153% | -19% | |
| Read 4k (MB/s) | 21.17 | 27.02 28% | 36.32 72% | 51.3 142% | 53.3 152% | 28.73 36% |
| Write 4k (MB/s) | 86.3 | 82.6 -4% | 110.9 29% | 139.3 61% | 159.9 85% | 66.4 -23% |
| Read 4k QD32 (MB/s) | 227.3 | 388.5 71% | 400.9 76% | 561 147% | 559 146% | 91.6 -60% |
| Write 4k QD32 (MB/s) | 174.7 | 242.8 39% | 191.7 10% | 277 59% | 376.7 116% | 95.7 -45% |
| Read Seq (MB/s) | 518 | 497.8 -4% | 518 0% | 1778 243% | 1649 218% | 506 -2% |
| Write Seq (MB/s) | 423.3 | 241.4 -43% | 300.7 -29% | 1530 261% | 1265 199% | 343.2 -19% |
| AS SSD | 18% | 25% | 212% | 268% | 9% | |
| Seq Read (MB/s) | 494.9 | 505 2% | 495.5 0% | 2039 312% | 1839 272% | 502 1% |
| Seq Write (MB/s) | 431.9 | 231.6 -46% | 283.7 -34% | 1407 226% | 1190 176% | 324.6 -25% |
| 4K Read (MB/s) | 16.97 | 25.24 49% | 30.91 82% | 45.41 168% | 47.72 181% | 31.82 88% |
| 4K Write (MB/s) | 65.6 | 72.4 10% | 85.1 30% | 114.4 74% | 126.6 93% | 58 -12% |
| 4K-64 Read (MB/s) | 217.9 | 362 66% | 336.1 54% | 968 344% | 1858 753% | 194.7 -11% |
| 4K-64 Write (MB/s) | 147.9 | 190.6 29% | 170 15% | 366 147% | 344.3 133% | 169.2 14% |
| Total Average (Program / Settings) | 17% /
16% | 26% /
25% | 182% /
182% | 211% /
210% | -5% /
-5% |

Graphics Card
The HD 520 is furnished with dual-channel here, which leads to very good results - of course on the overall low level of this integrated graphics card. Games also benefit from that, but they will unlikely be on the schedule of a typical business user.
| 3DMark 11 Performance | 1559 points | |
Help | ||
| low | med. | high | ultra | |
|---|---|---|---|---|
| BioShock Infinite (2013) | 48 | 29 |
Emissions & Energy Management
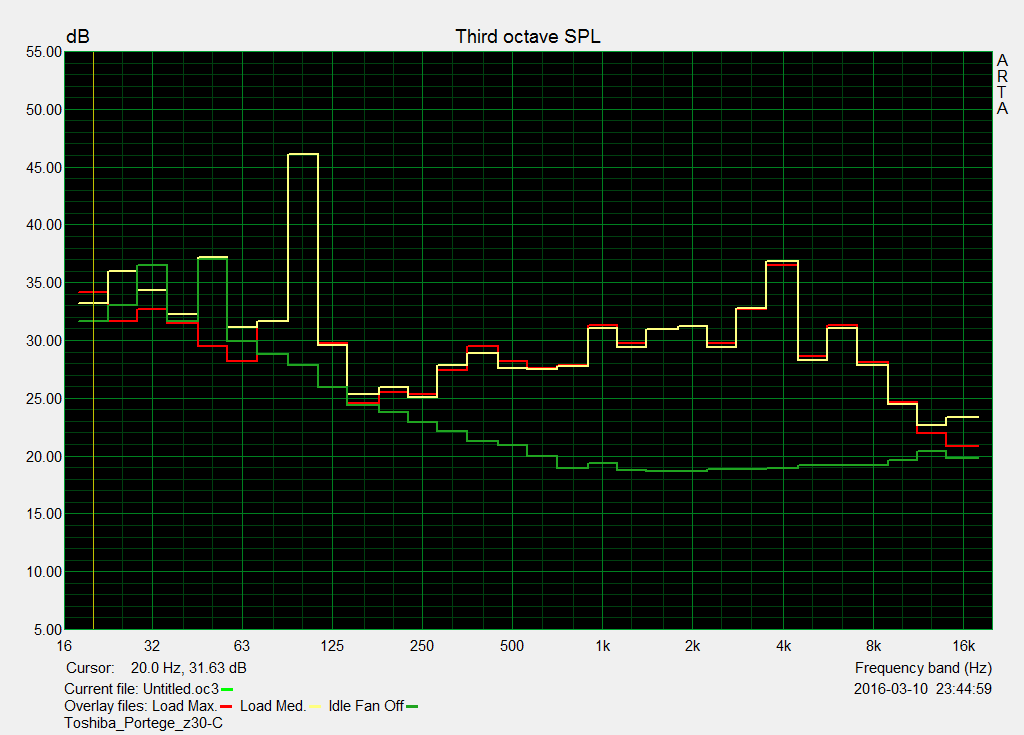
System Noise
The Z30-C basically only knows two fan states: Loud and roaring or just quiet. The fan is disabled in the latter case, and the device runs silently. The cooling speeds up very audibly to 43.3 dB(A) during simple and full load. The slim Portégé cannot be overheard then. The opponents do a better job; they are throughout quieter during load.
| Toshiba Portege Z30-C-138 HD Graphics 520, 6500U, Toshiba HG6 THNSNJ512G8NY | HP EliteBook 840 G3 T9X59ET#ABD HD Graphics 520, 6500U, Samsung SSD PM851 256 GB MZNTE256HMHP | Dell Latitude 14 7000 Series E7470 HD Graphics 520, 6600U, Samsung SSD PM851 M.2 2280 256GB | Lenovo ThinkPad T460s-20FA003GGE HD Graphics 520, 6600U, Samsung SSD SM951a 512GB M.2 PCIe 3.0 x4 NVMe (MZVKV512) | HP EliteBook Folio 1040 G3 HD Graphics 520, 6300U, Samsung SM951 MZVPV256HDGL m.2 PCI-e | Acer TravelMate P645-S-58HK HD Graphics 5500, 5200U, Kingston RBU-SNS8100S3256GD | |
|---|---|---|---|---|---|---|
| Noise | 3% | 9% | 10% | 11% | 10% | |
| off / environment * (dB) | 31.2 | 31.2 -0% | 31.2 -0% | 29.2 6% | 29.1 7% | |
| Idle Minimum * (dB) | 31.2 | 31.2 -0% | 31.2 -0% | 29.2 6% | 29.1 7% | 29.6 5% |
| Idle Average * (dB) | 31.2 | 32.1 -3% | 31.2 -0% | 29.2 6% | 29.1 7% | 29.6 5% |
| Idle Maximum * (dB) | 31.2 | 33.1 -6% | 31.2 -0% | 29.2 6% | 29.1 7% | 30.2 3% |
| Load Average * (dB) | 43.3 | 36.2 16% | 31.9 26% | 33.7 22% | 32.6 25% | 35.6 18% |
| Load Maximum * (dB) | 43.3 | 37.8 13% | 31.9 26% | 38.5 11% | 37.8 13% | 35.9 17% |
* ... smaller is better
Noise level
| Idle |
| 31.2 / 31.2 / 31.2 dB(A) |
| Load |
| 43.3 / 43.3 dB(A) |
 | ||
30 dB silent 40 dB(A) audible 50 dB(A) loud |
||
min: | ||
Temperature
The Turbo clock rate does not remain as unaffected during the stress test as during simple processor load. The processor's clock is throttled to 1.6 GHz within one minute, and the HD 520 continues to clock at 950 MHz. Thus, the processor's performance is reduced in favor of the graphics. The core temperature climbs to 72 °C and remains just below this rate with throttling. The clock is still at 1.6 GHz at the end of the stress test, i.e. one hour of simultaneous Prime95 for the processor and Furmark for the graphics. The clock climbs to 2.6 GHz within seconds when stopping Furmark. That is not a good Turbo stability since the clock remains behind the potential of this SoC during simple load (realistic scenario) like seen under Performance.
| Toshiba Portege Z30-C-138 HD Graphics 520, 6500U, Toshiba HG6 THNSNJ512G8NY | HP EliteBook 840 G3 T9X59ET#ABD HD Graphics 520, 6500U, Samsung SSD PM851 256 GB MZNTE256HMHP | Dell Latitude 14 7000 Series E7470 HD Graphics 520, 6600U, Samsung SSD PM851 M.2 2280 256GB | Lenovo ThinkPad T460s-20FA003GGE HD Graphics 520, 6600U, Samsung SSD SM951a 512GB M.2 PCIe 3.0 x4 NVMe (MZVKV512) | HP EliteBook Folio 1040 G3 HD Graphics 520, 6300U, Samsung SM951 MZVPV256HDGL m.2 PCI-e | Acer TravelMate P645-S-58HK HD Graphics 5500, 5200U, Kingston RBU-SNS8100S3256GD | |
|---|---|---|---|---|---|---|
| Heat | -0% | 0% | -9% | -21% | -13% | |
| Maximum Upper Side * (°C) | 40.6 | 37 9% | 38.2 6% | 40.8 -0% | 43.2 -6% | 41.6 -2% |
| Maximum Bottom * (°C) | 37 | 37.1 -0% | 36.5 1% | 40.3 -9% | 47.1 -27% | 41.7 -13% |
| Idle Upper Side * (°C) | 24.5 | 25.3 -3% | 25.1 -2% | 27.6 -13% | 30.5 -24% | 30.6 -25% |
| Idle Bottom * (°C) | 24.9 | 26.6 -7% | 25.8 -4% | 28.7 -15% | 31.5 -27% | 27.5 -10% |
* ... smaller is better
(±) The maximum temperature on the upper side is 40.6 °C / 105 F, compared to the average of 35.9 °C / 97 F, ranging from 21.4 to 72.4 °C for the class Subnotebook.
(+) The bottom heats up to a maximum of 37 °C / 99 F, compared to the average of 39.3 °C / 103 F
(+) In idle usage, the average temperature for the upper side is 23.7 °C / 75 F, compared to the device average of 30.8 °C / 87 F.
(+) The palmrests and touchpad are cooler than skin temperature with a maximum of 27 °C / 80.6 F and are therefore cool to the touch.
(±) The average temperature of the palmrest area of similar devices was 28.2 °C / 82.8 F (+1.2 °C / 2.2 F).
Speakers

The speakers produce a thin sound that neither contains low tones nor clearly differentiated trebles. Thus, listening to music or web-radio is everything but enjoyable. That is completely different with the dual-array microphone - it records voices crystal clear and the speaker can even change their position. Plus points are awarded for that.
Power Consumption
The power consumption is average in the category comparison. The high consumption during medium load is striking - measured with 3DMark06 here - and the low requirement during full load. The reason for this is CPU throttling in the stress test.
| Toshiba Portege Z30-C-138 HD Graphics 520, 6500U, Toshiba HG6 THNSNJ512G8NY | HP EliteBook 840 G3 T9X59ET#ABD HD Graphics 520, 6500U, Samsung SSD PM851 256 GB MZNTE256HMHP | Dell Latitude 14 7000 Series E7470 HD Graphics 520, 6600U, Samsung SSD PM851 M.2 2280 256GB | Lenovo ThinkPad T460s-20FA003GGE HD Graphics 520, 6600U, Samsung SSD SM951a 512GB M.2 PCIe 3.0 x4 NVMe (MZVKV512) | HP EliteBook Folio 1040 G3 HD Graphics 520, 6300U, Samsung SM951 MZVPV256HDGL m.2 PCI-e | Acer TravelMate P645-S-58HK HD Graphics 5500, 5200U, Kingston RBU-SNS8100S3256GD | |
|---|---|---|---|---|---|---|
| Power Consumption | 12% | -11% | -3% | -30% | 13% | |
| Idle Minimum * (Watt) | 3.2 | 3.8 -19% | 5.1 -59% | 3.8 -19% | 6.3 -97% | 3.2 -0% |
| Idle Average * (Watt) | 7.8 | 6.3 19% | 8.5 -9% | 7.1 9% | 9.4 -21% | 6.3 19% |
| Idle Maximum * (Watt) | 8.7 | 6.8 22% | 10.1 -16% | 7.8 10% | 10.1 -16% | 8.6 1% |
| Load Average * (Watt) | 42.2 | 34.4 18% | 35.2 17% | 36.3 14% | 33.3 21% | 30.3 28% |
| Load Maximum * (Watt) | 35.7 | 28.3 21% | 31 13% | 46 -29% | 49.5 -39% | 30.4 15% |
* ... smaller is better
| Off / Standby | |
| Idle | |
| Load |
|
Key:
min: | |
Battery Runtime
The battery life of the Portégé Z30-C-138 of 5:45 hours is in the lower field among the rivals. An EliteBook 840 G3 lasts 30% longer and the TravelMate P645-S even 55%. Too bad: the 52 Wh is far from reaching the manufacturer's specified 11 hours.
Pros
Cons
Verdict
Toshiba's Portégé Z30-C-138 is an extremely lightweight premium-range subnotebook for the business world. Buyers who put 2000 Euros (~$2252) on the counter will get business-suitable connectivity (LTE, docking) and the best security features including TPM and fingerprint scanner. It might seem that Toshiba doesn't miss out on anything when looking at the Core i7-6500U and the 512 GB SSD. Unfortunately, the SoC's Turbo utilization is comparatively low, and thus the processor cannot provide the promised performance already during simple load (not stress test). The input devices' weak feedback also disappoints us; the Latitude, EliteBook and ThinkPad do a better job here. The Portégé Z30-C-138 is sooner a device for those with sensitive natures who hit the keys very carefully.
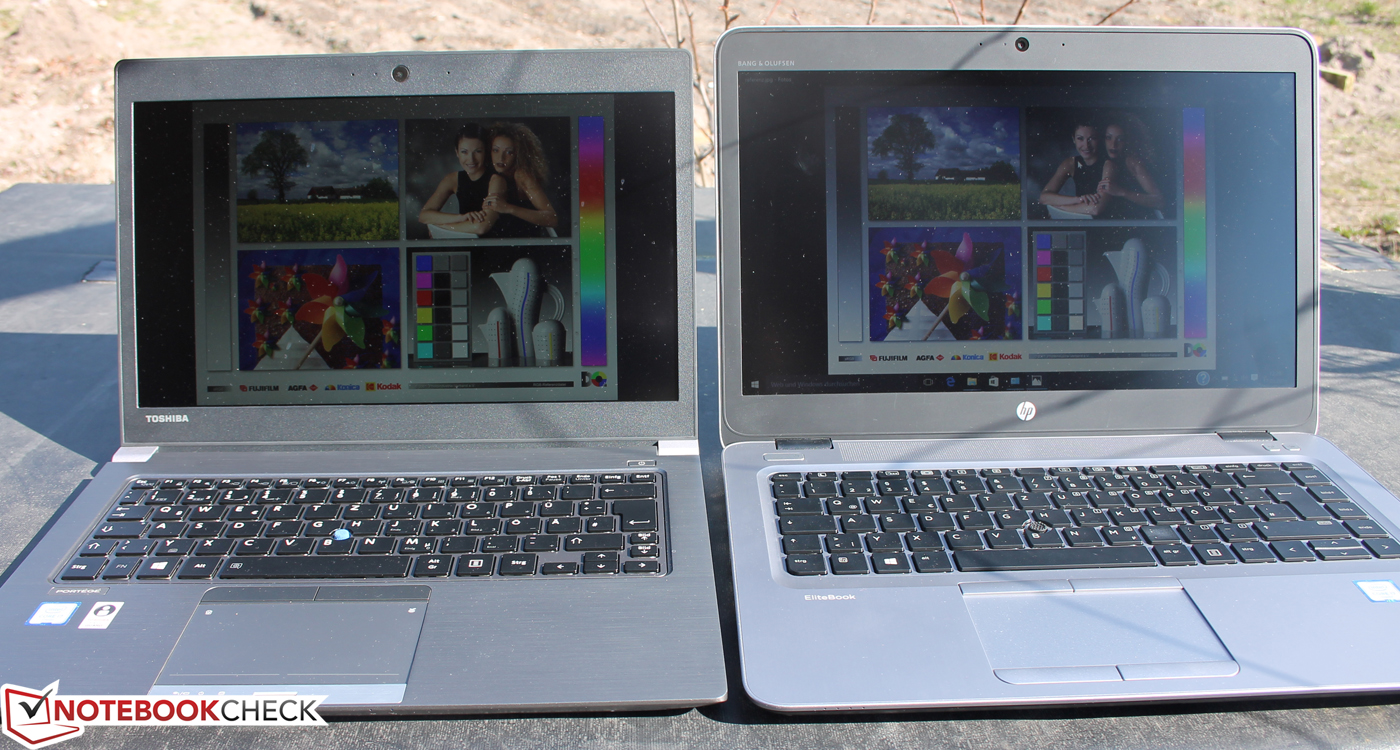
The hottest rivals of Toshiba's Portégé Z30-C-138 are doubtlessly Lenovo's ThinkPad T460s, Dell's Latitude 14 E7470 and HP's EliteBook 840 G3. The latter slightly steps out of line due to its TN panel. However, HP also offers an IPS model with WQHD and not FHD.
Toshiba Portege Z30-C-138
- 04/18/2016 v5.1 (old)
Sebastian Jentsch
Price comparison
