

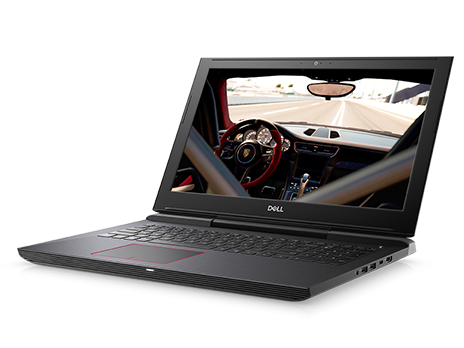
Dell Inspiron 15 7000 7577 (i7-7700HQ, GTX 1060 Max-Q, 4K UHD) Laptop Review
Take a step outside of Dell's Alienware series and gamers will start to venture into the budget-mainstream category of notebooks like the Inspiron 15 7577. The system promises a lot for under $1000 USD including GTX 1060 Max-Q graphics and Thunderbolt 3 while higher-end SKUs throw in 4K UHD with more RAM and storage for an additional $500 USD. Our test unit today is the latter with its Core i7-7700HQ CPU and 4K UHD panel instead of the i5-7300HQ CPU and FHD panel, respectively. Is the hefty investment in 4K worth the steep price of entry?
We recommend checking out our existing reviews on the Inspiron 15 7577 as more details on the chassis and its features can be found on these pages. For this particular review update, we will analyze the advantages and disadvantages of the 4K UHD panel and what games pair best with the GTX 1060 Max-Q at this demanding resolution. The Inspiron 15 gaming series competes directly against mainstream gaming notebooks like the Gigabyte Sabre 15, Acer Aspire Nitro, MSI GP62, and the Asus FX553.
Case
The base continues to be relatively strong for the price with light flexing and creaking when attempting to twist or bend it. The lid could have been more rigid and the inner bezel of the screen is not completely flat yet again for a second time in a row, so this is definitely an area where the manufacturer can improve upon for future revisions of the model.
The Dell unit is still quite the heavyweight even for a gaming notebook due in part to its thick skeleton. Other 15-inch notebooks with similar-performing GPU options like the Lenovo Legion Y520 or MSI GF62VR are several hundred grams lighter and slightly smaller in footprint.
Connectivity
The Thunderbolt 3 port is the highlight of the system's connectivity options. Such a feature is typically reserved for higher-end gaming systems that can easily cost hundreds more whereas the Inspiron 15 7577 can start for under $1000 USD.
SD Card Reader
The card reader is where Dell had to cut some corners. A fully inserted SD card protrudes about half its length and transfer rates are just a fraction of most Ultrabooks and other gaming notebooks.
| SD Card Reader | |
| average JPG Copy Test (av. of 3 runs) | |
| Average of class Gaming (20 - 210, n=66, last 2 years) | |
| Asus Zenbook Pro UX550VE-DB71T (Toshiba Exceria Pro SDXC 64 GB UHS-II) | |
| Dell Inspiron 15 7000 7577 4K (Toshiba Exceria Pro SDXC 64 GB UHS-II) | |
| MSI GF62VR 7RF-877 (Toshiba Exceria Pro SDXC 64 GB UHS-II) | |
| maximum AS SSD Seq Read Test (1GB) | |
| Average of class Gaming (25.8 - 261, n=63, last 2 years) | |
| Asus Zenbook Pro UX550VE-DB71T (Toshiba Exceria Pro SDXC 64 GB UHS-II) | |
| Dell Inspiron 15 7000 7577 4K (Toshiba Exceria Pro SDXC 64 GB UHS-II) | |
| MSI GF62VR 7RF-877 (Toshiba Exceria Pro SDXC 64 GB UHS-II) | |
Communication
We can record no recurring WiFi issues when connected to our Linksys EA8500 test router.
| Networking | |
| iperf3 transmit AX12 | |
| MSI GF62VR 7RF-877 | |
| Dell Inspiron 15 7000 7577 4K | |
| Asus Zenbook Pro UX550VE-DB71T | |
| iperf3 receive AX12 | |
| MSI GF62VR 7RF-877 | |
| Dell Inspiron 15 7000 7577 4K | |
| Asus Zenbook Pro UX550VE-DB71T | |
Input Devices
Keyboard and Touchpad
The Chiclet keyboard come standard with a red backlight of two intensity levels. The dark red letters contrast poorly with the black key caps and so the backlight is recommended even if under well-lit conditions. Key feedback is both softer and lighter than the same keys found on the MSI GS or GF series or the XPS 15 series.
The trackpad is slightly textured with reliable cursor control and multi-point inputs. Its integrated mouse keys are shallow in travel, spongy in feedback, and generally less impressive than the trackpads on MSI systems.
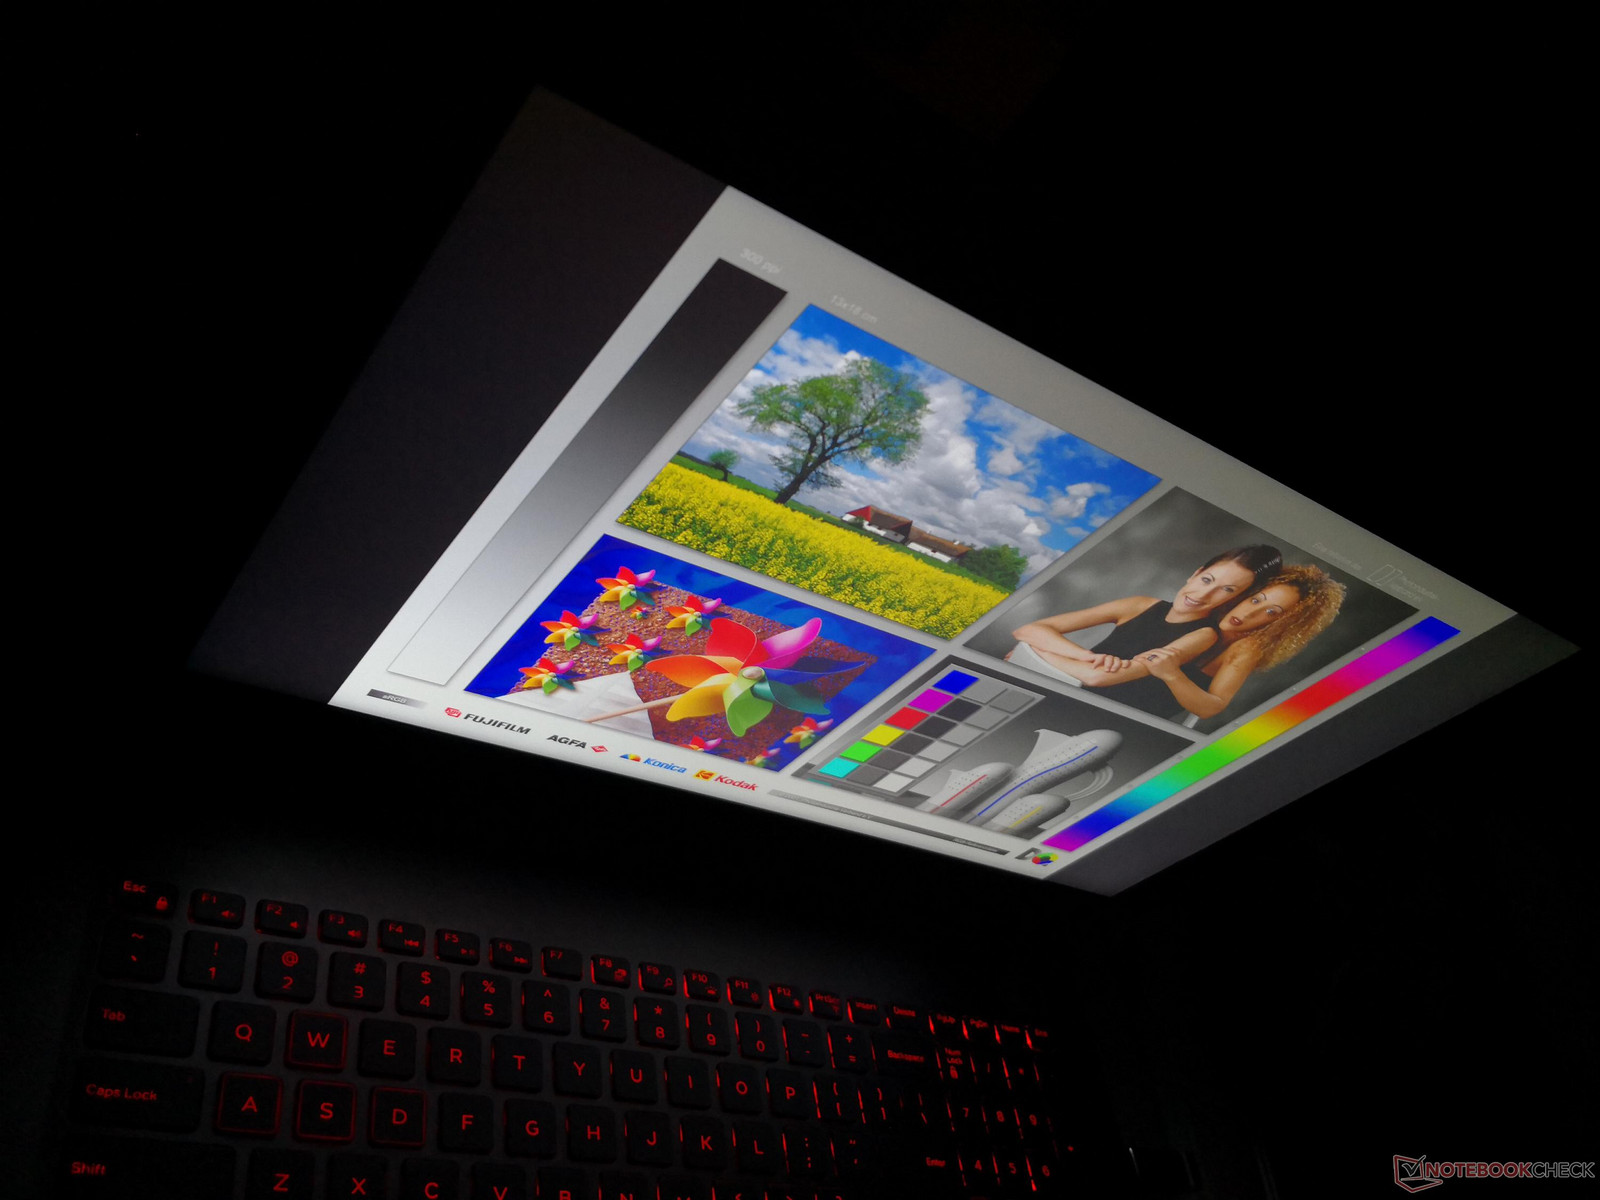
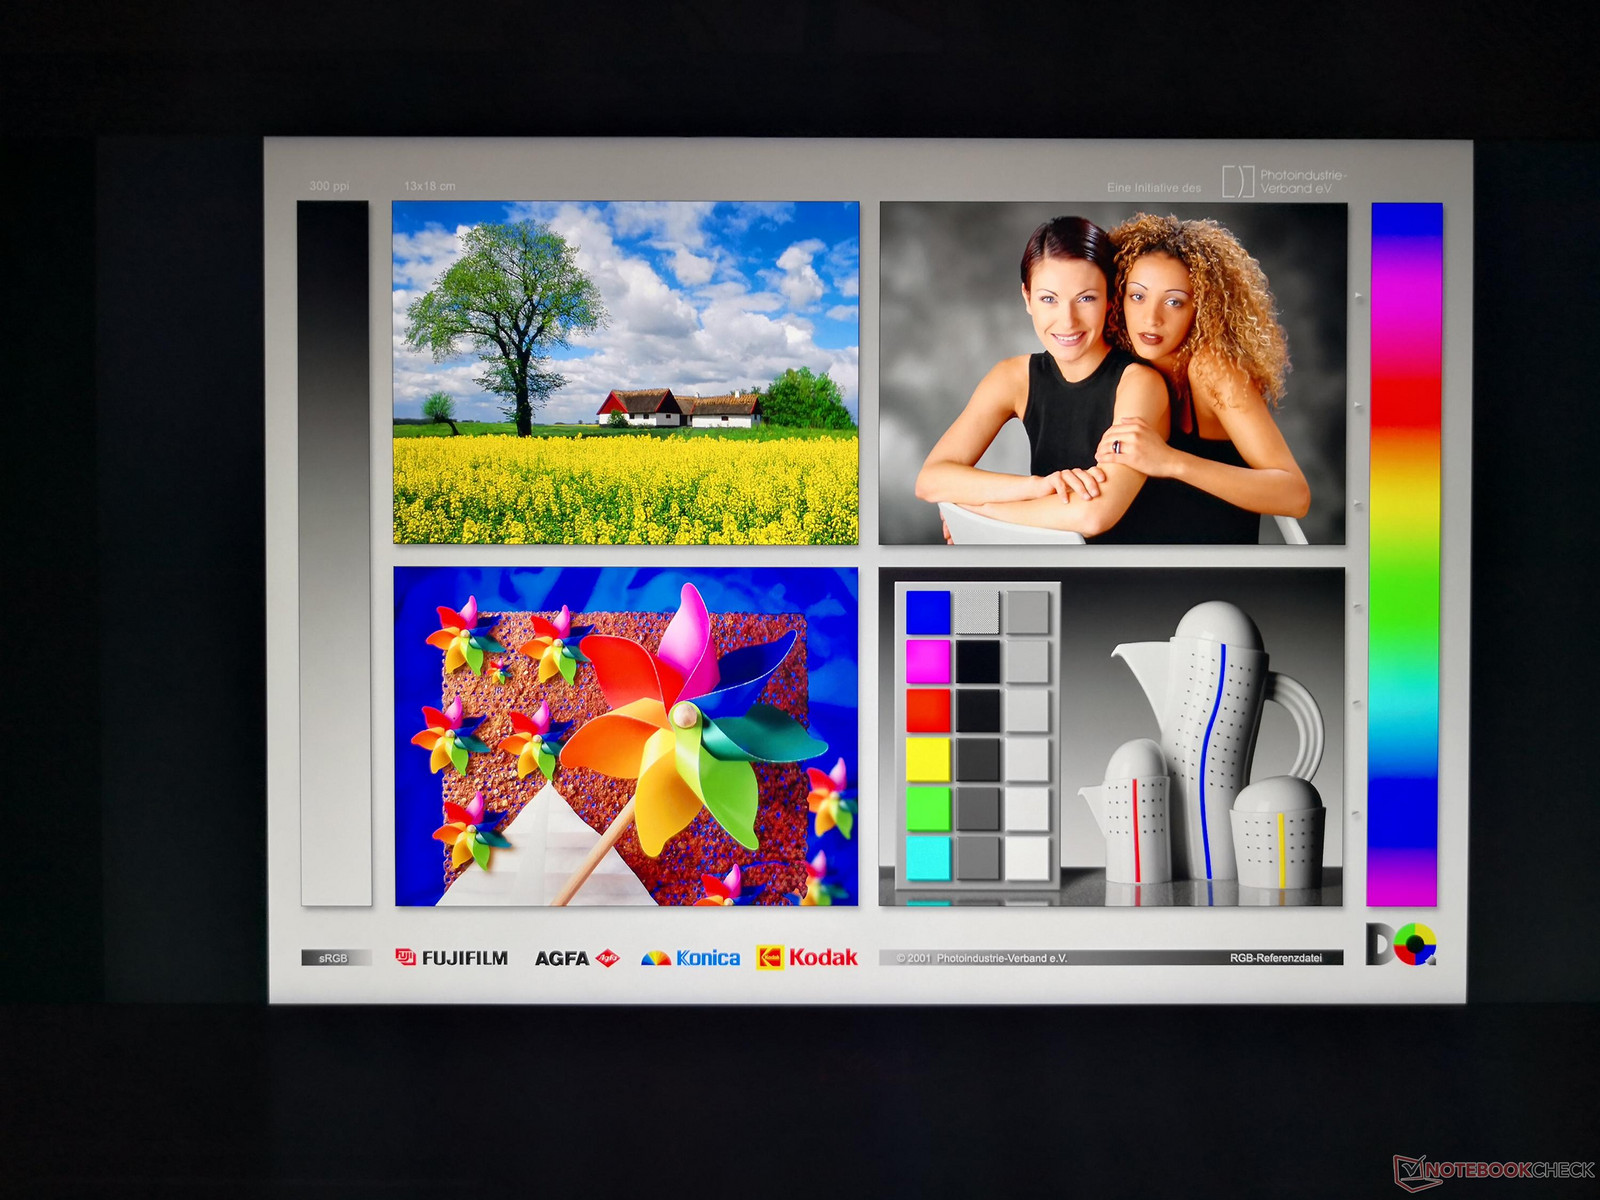
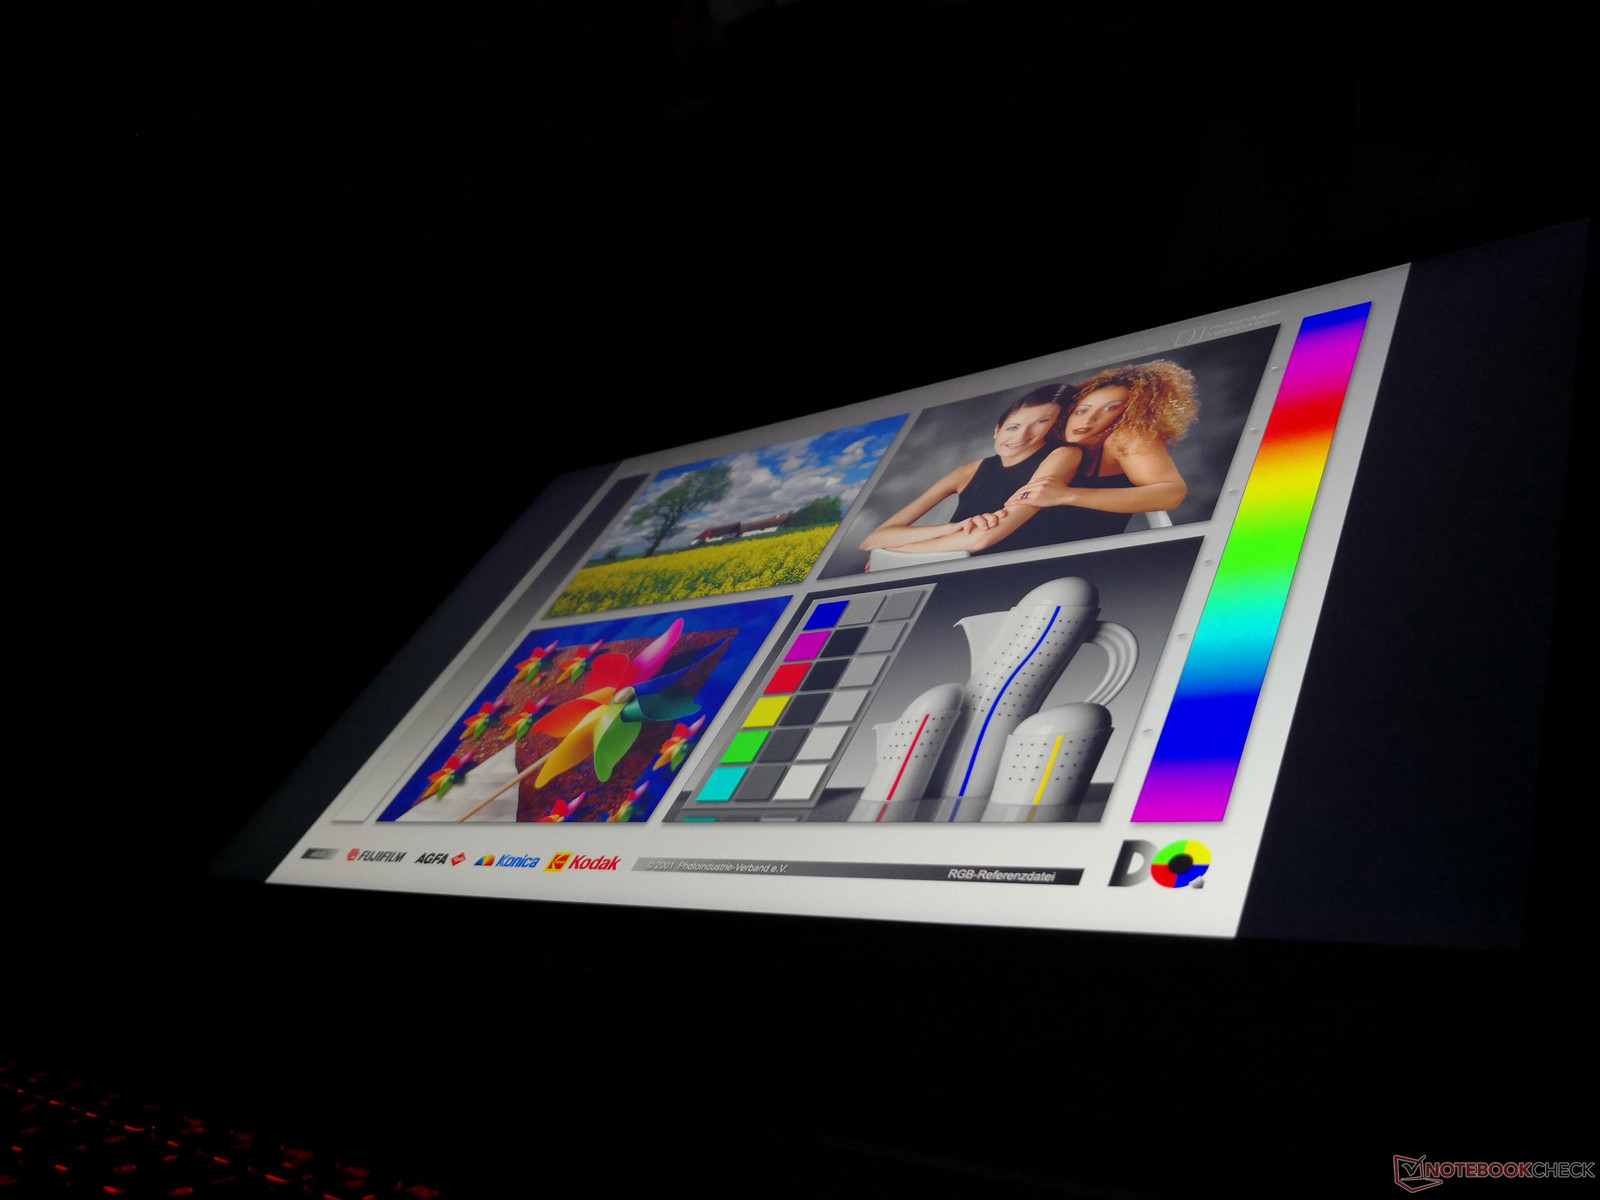
Display
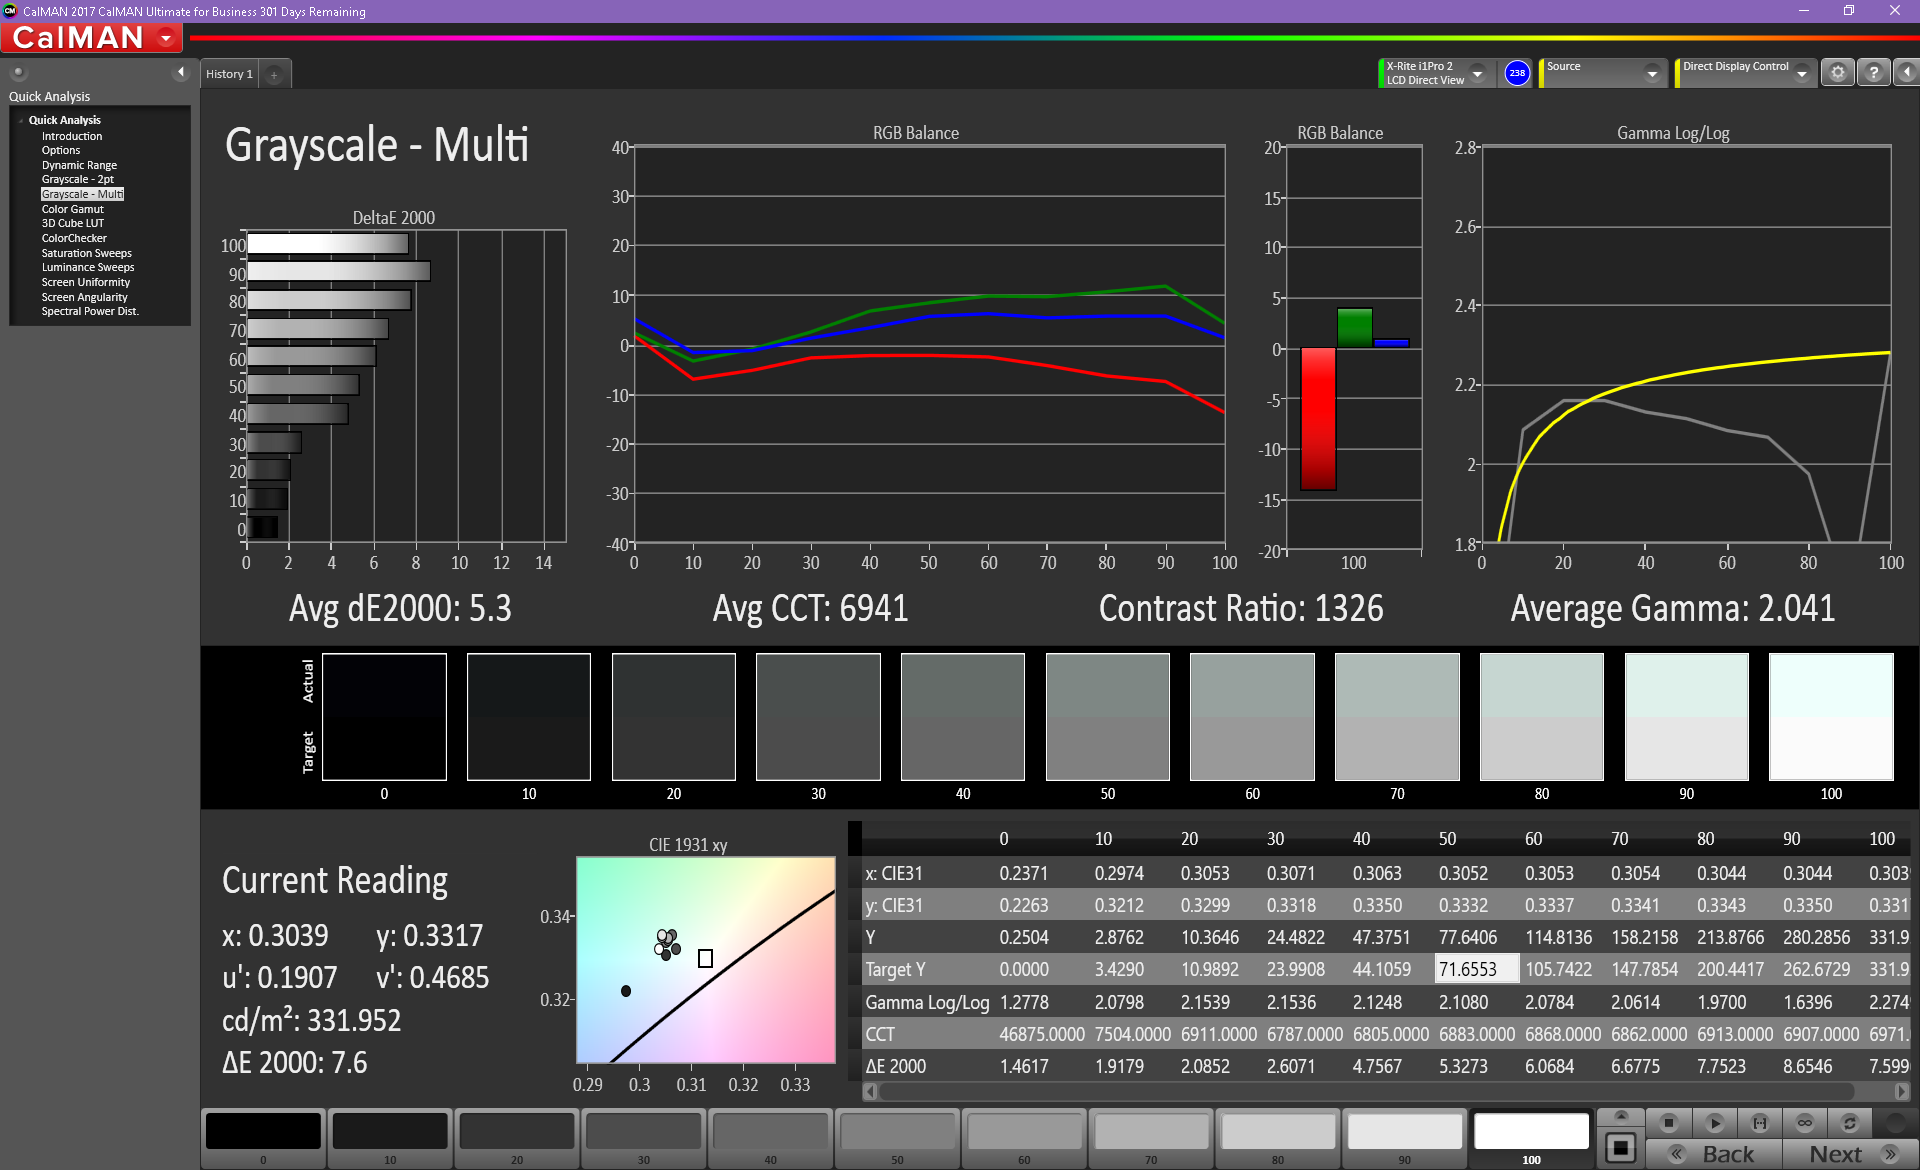
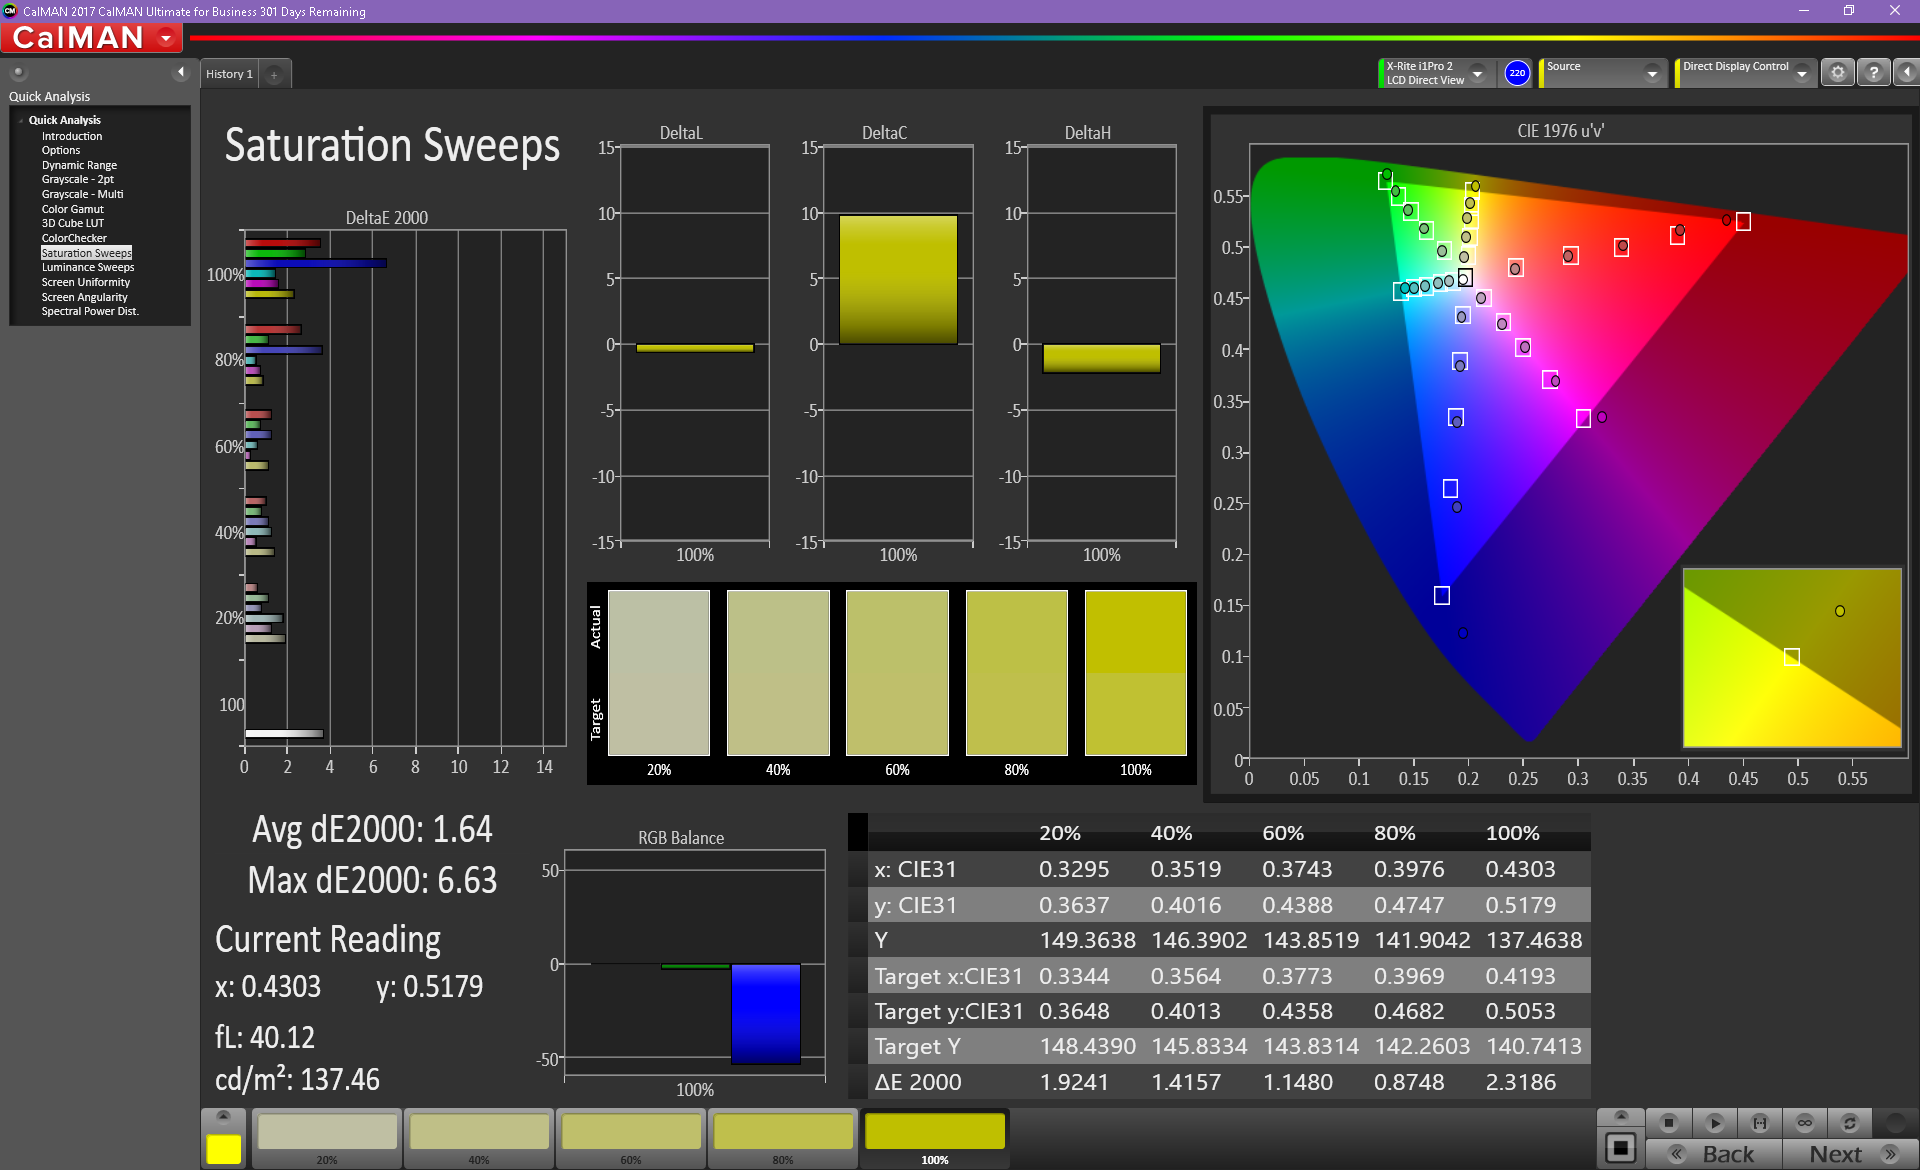
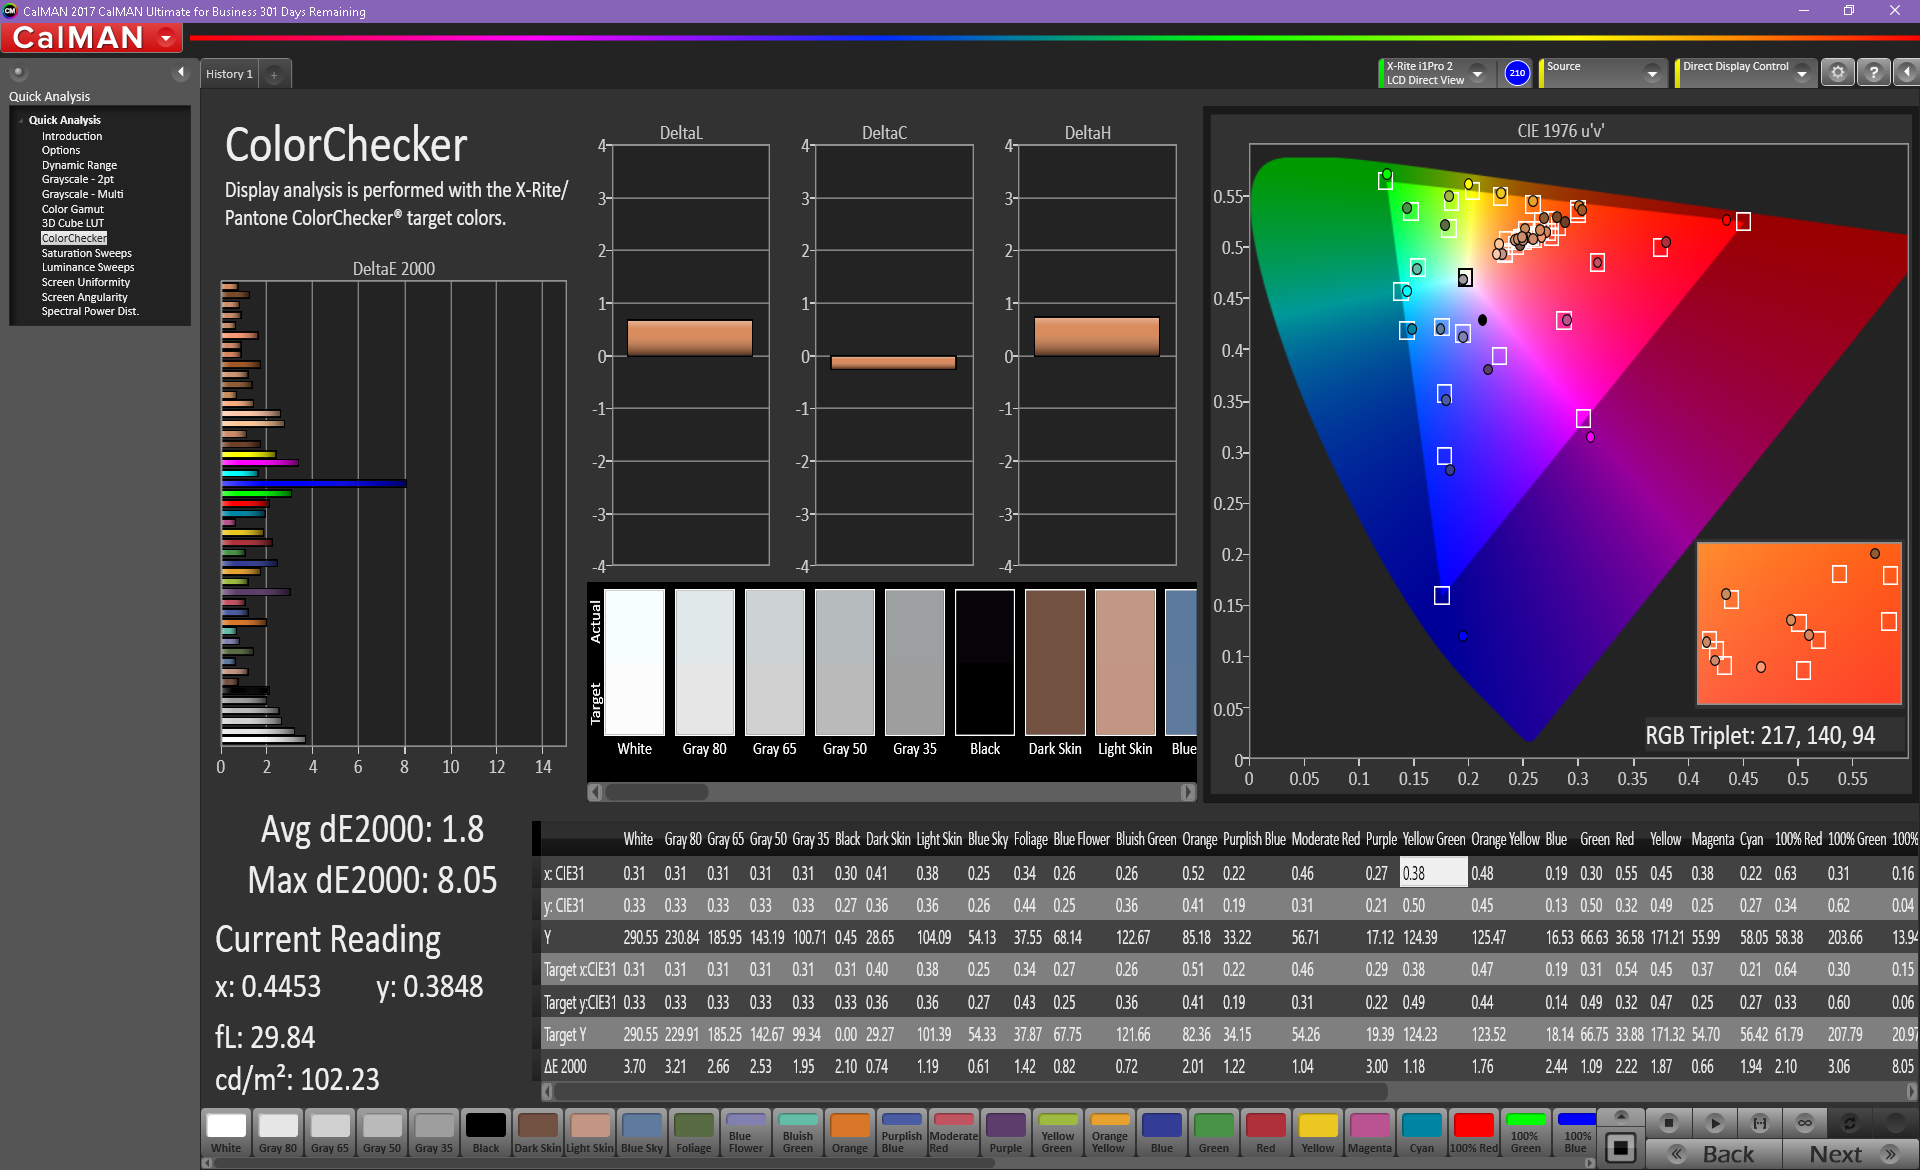
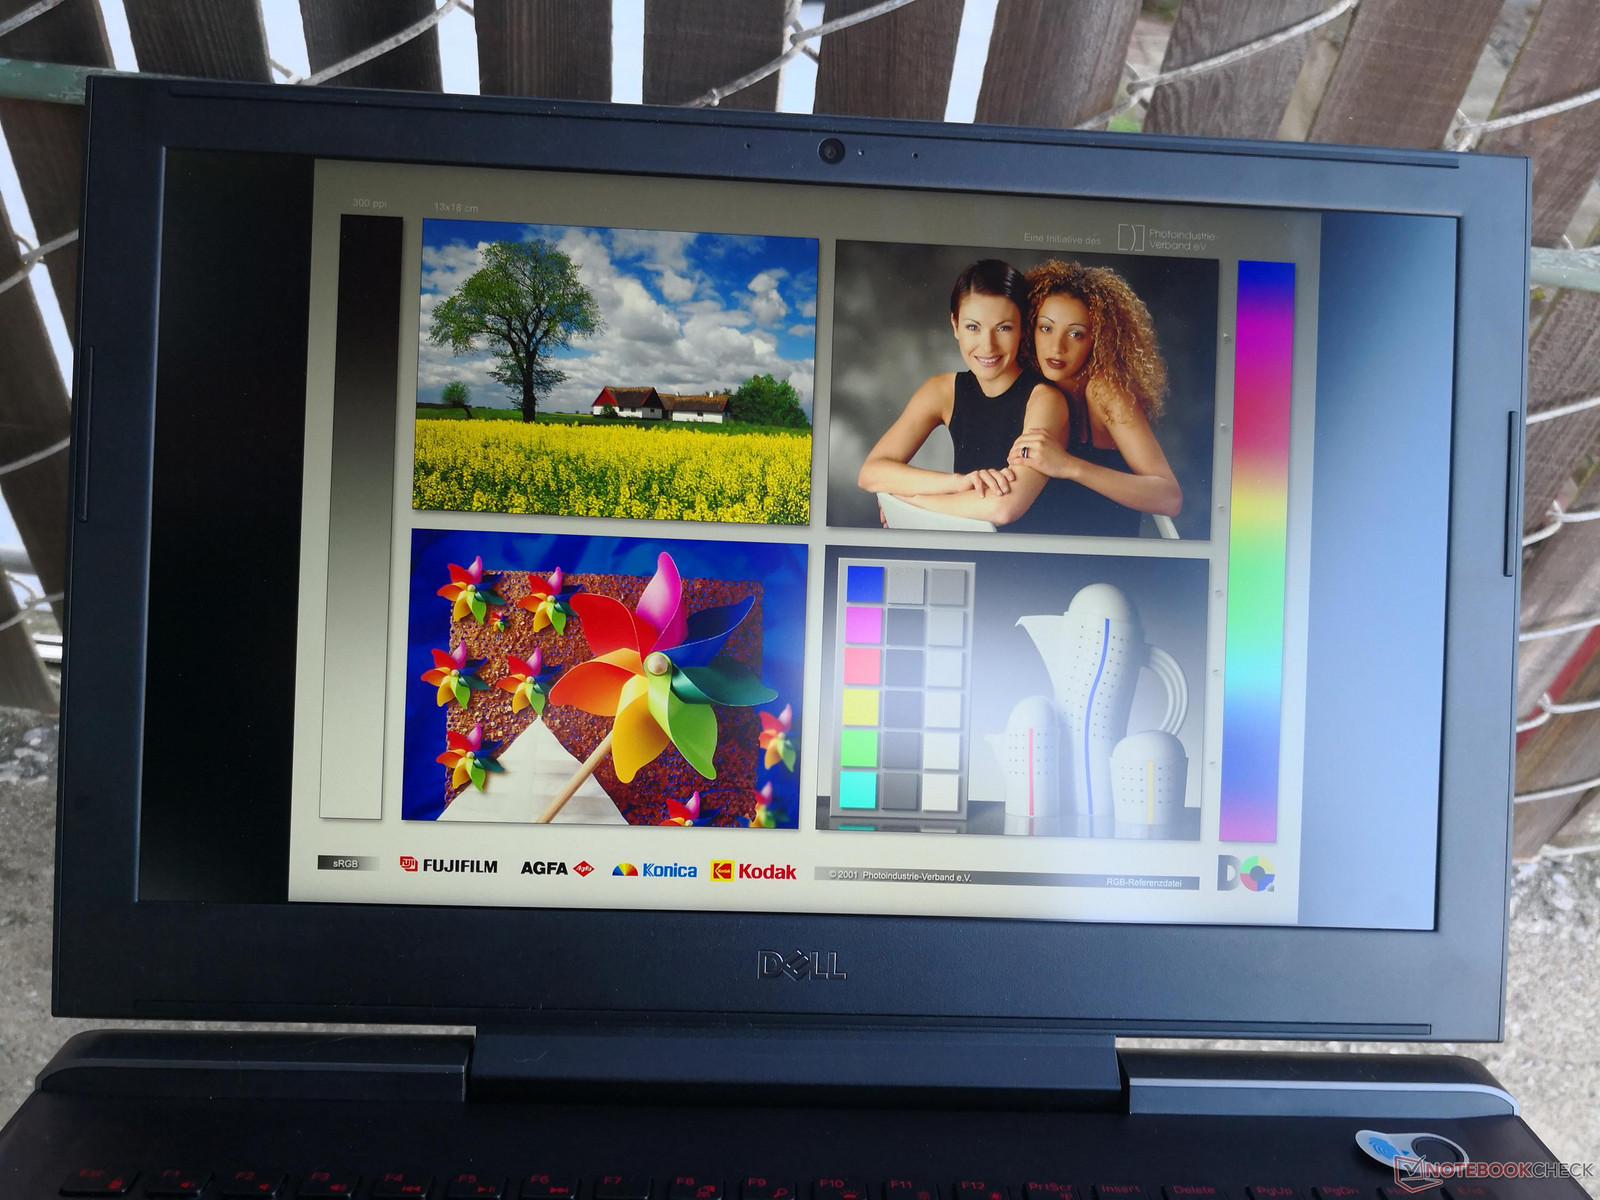
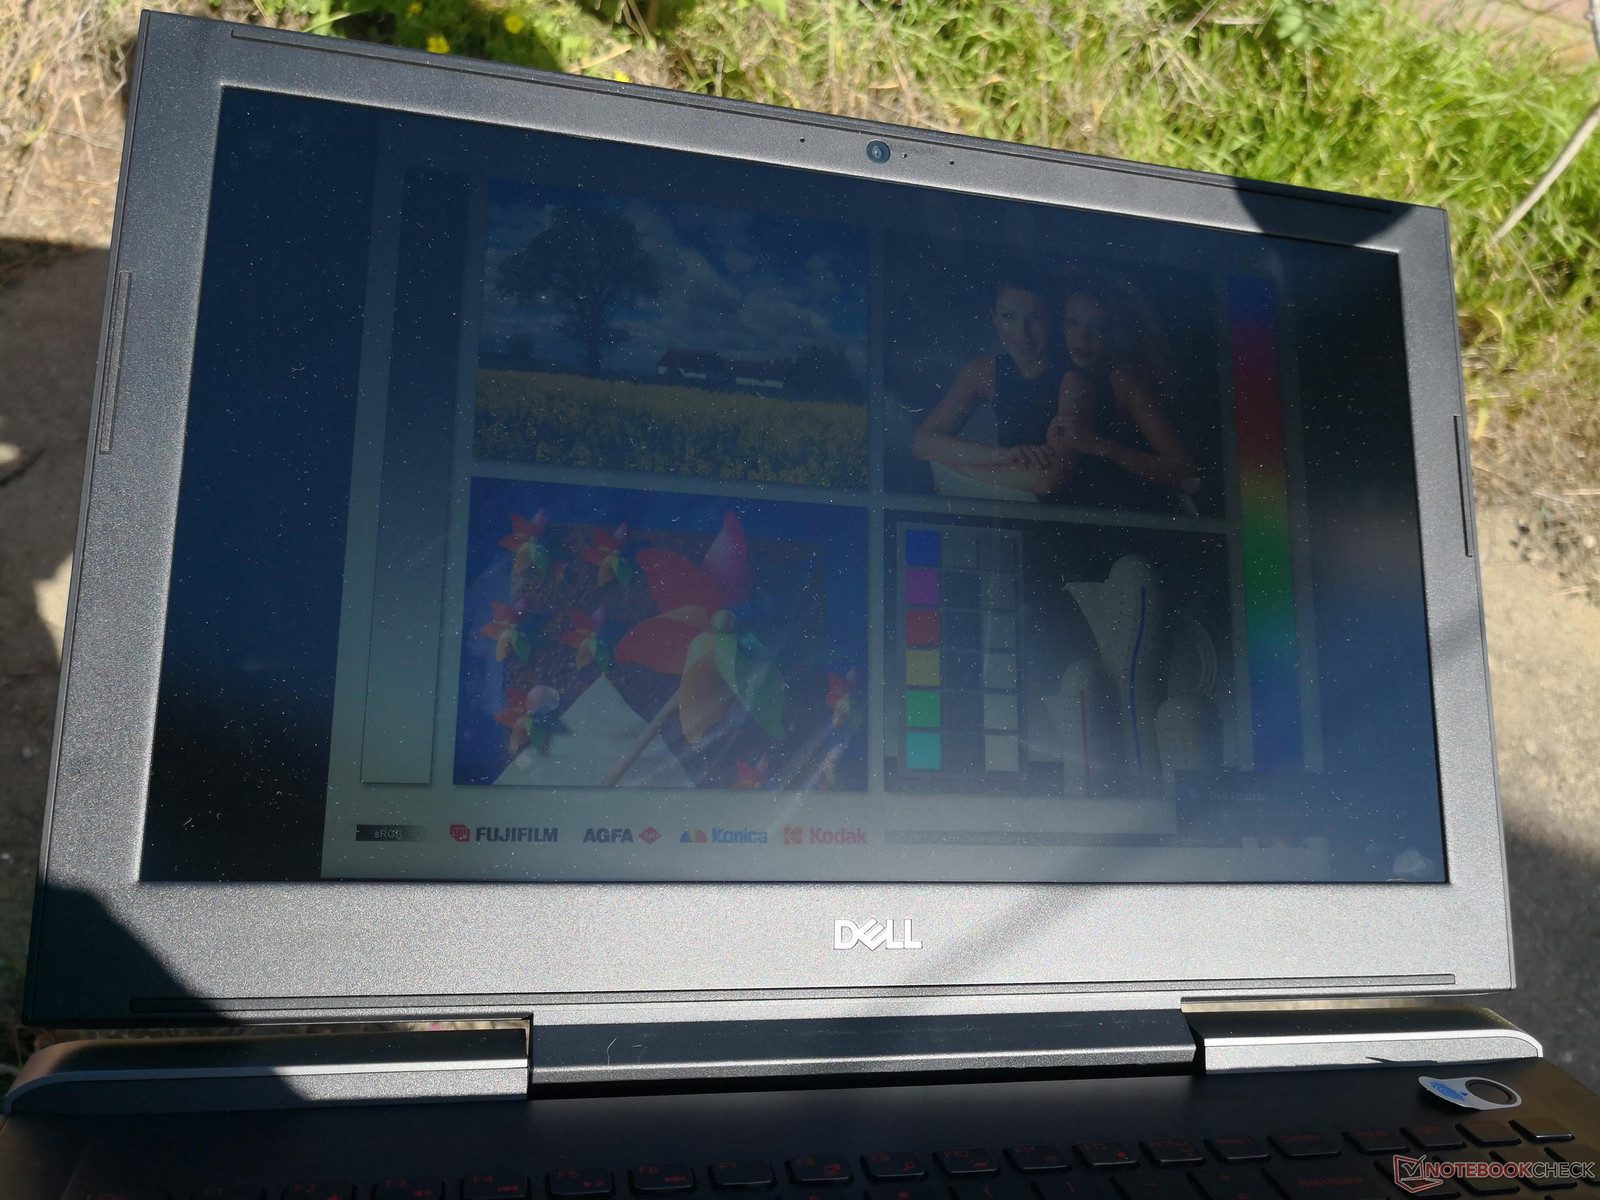
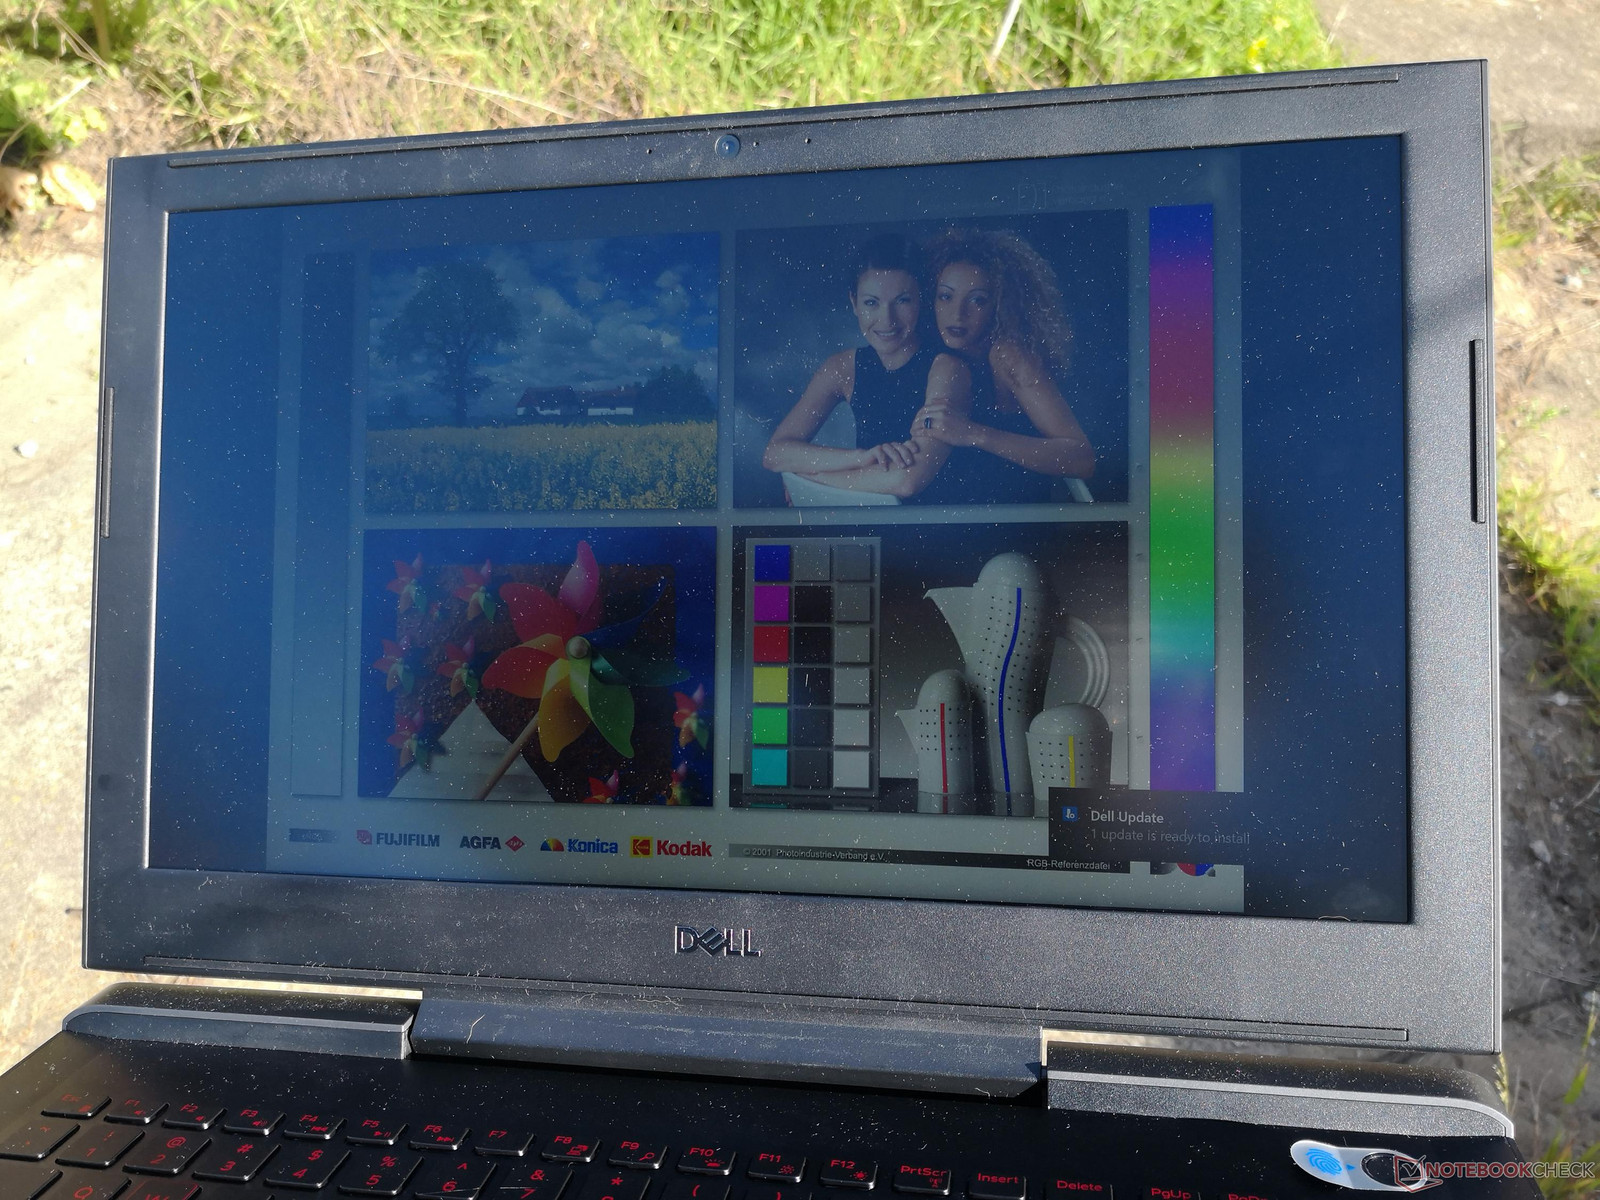
Right off the bat, our measurements show that the 4K UHD panel is brighter and with a wider color gamut than the lower-end FHD SKU while retaining relatively equal black-to-white response times in the process. In short, videos are texts are not only crisper, but also brighter and more vivid for a superior video playback experience. The screen is slightly grainy as is common on most matte panels, but it is thankfully not significant enough to be distracting during use. Likewise, uneven backlight bleeding is present and only noticeable if on high brightness settings and with black borders.
This particular 4K UHD AU Optronics B156ZAN panel is found on no other notebook in our database.


| |||||||||||||||||||||||||
Brightness Distribution: 90 %
Center on Battery: 322.9 cd/m²
Contrast: 897:1 (Black: 0.36 cd/m²)
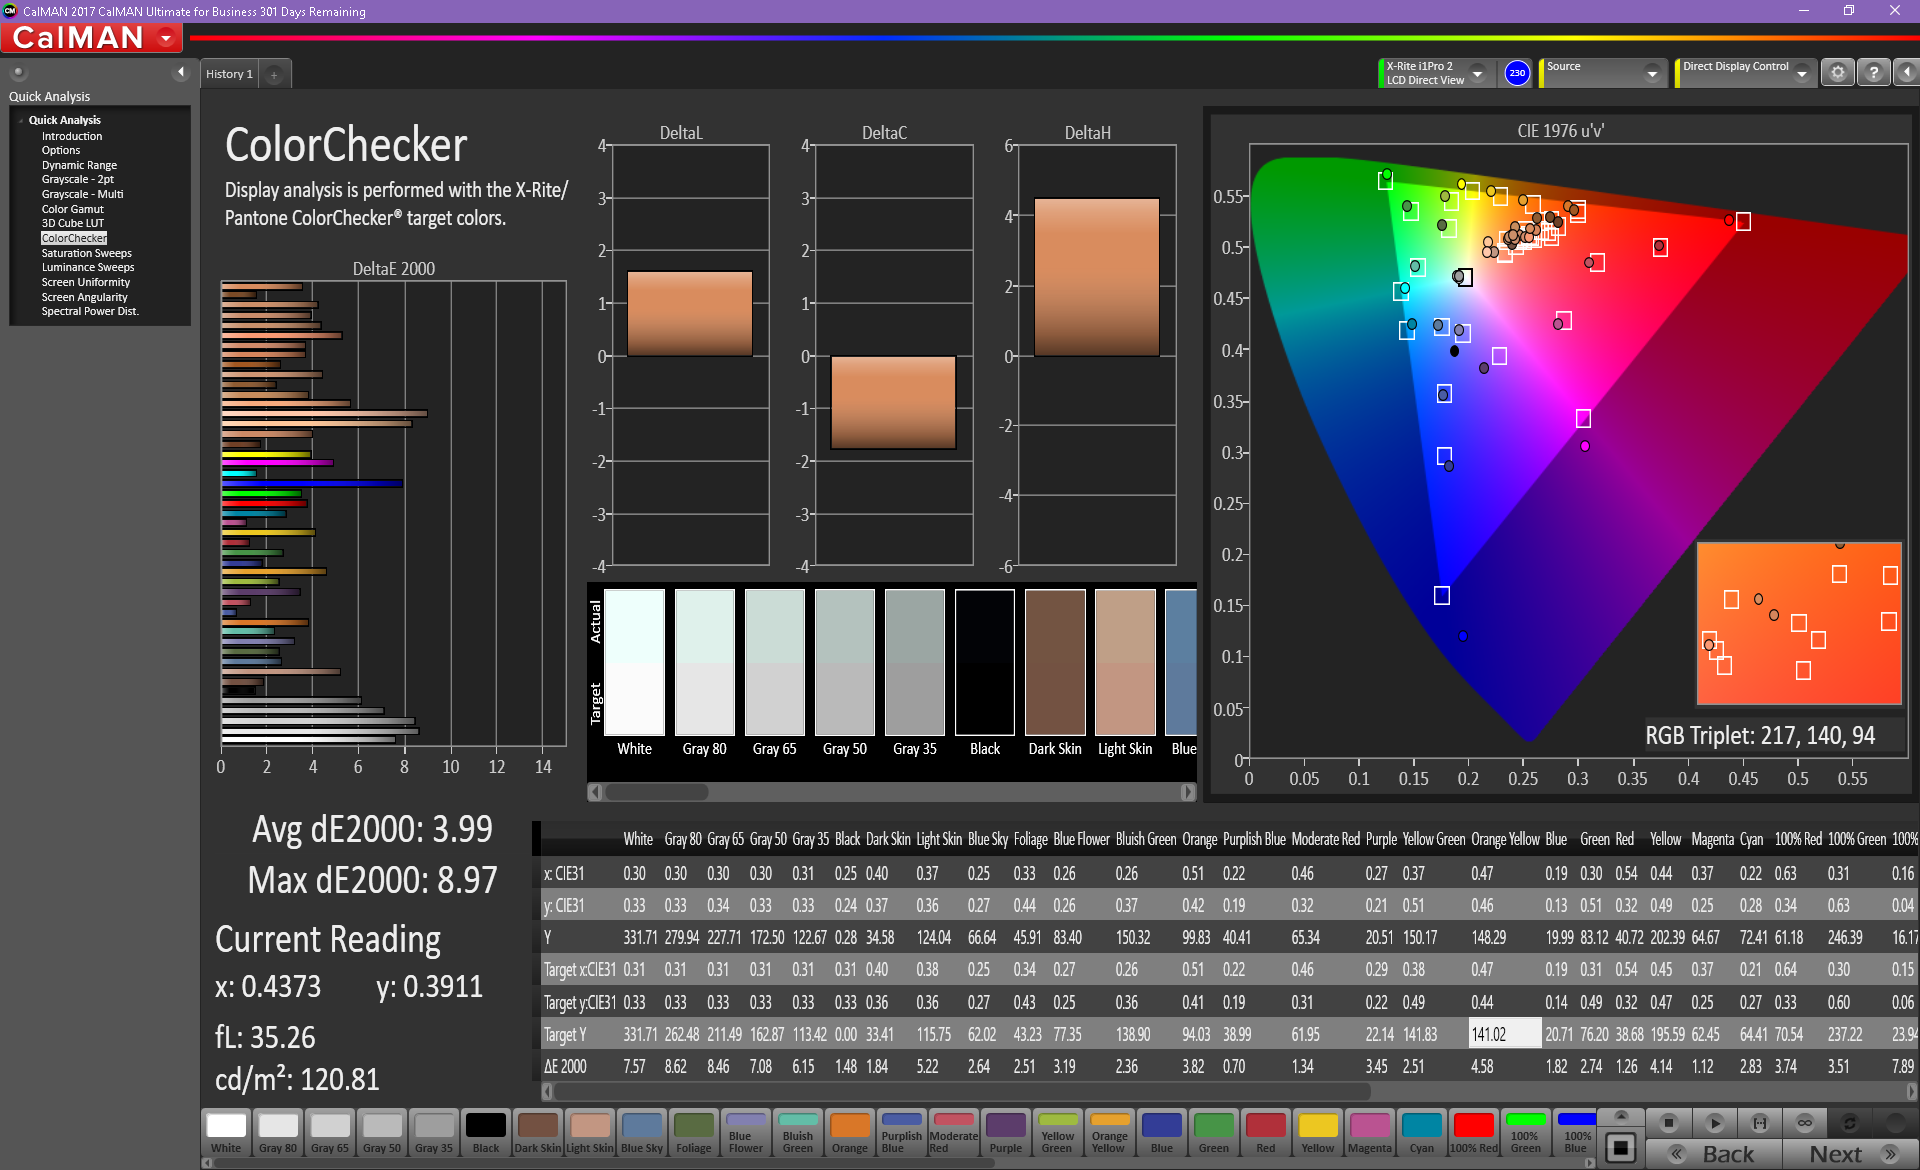
ΔE ColorChecker Calman: 3.99 | ∀{0.5-29.43 Ø4.78}
ΔE Greyscale Calman: 5.3 | ∀{0.09-98 Ø5}
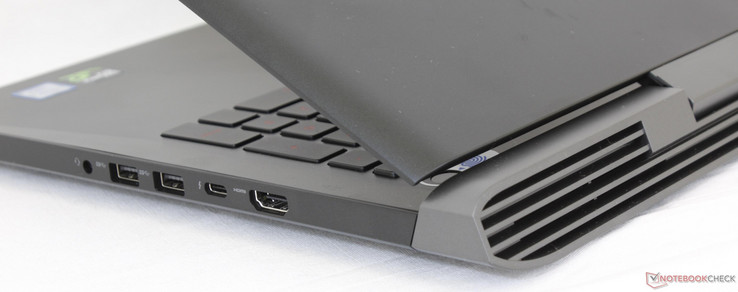
96.8% sRGB (Argyll 1.6.3 3D)
62.9% AdobeRGB 1998 (Argyll 1.6.3 3D)
69.6% AdobeRGB 1998 (Argyll 3D)
97.1% sRGB (Argyll 3D)
68.4% Display P3 (Argyll 3D)
Gamma: 2.041
CCT: 6941 K
| Dell Inspiron 15 7000 7577 4K Name: AU Optronics B156ZAN, IPS, 15.6", 3840x2160 | Asus Zenbook Pro UX550VE-DB71T N156HCE-EN1 (CMN15E8), IPS, 15.6", 1920x1080 | MSI GF62VR 7RF-877 Chi Mei N156HGA-EAL, TN LED, 15.6", 1920x1080 | Asus GL503VD-DB74 LG Philips LP156WF6, IPS, 15.6", 1920x1080 | Apple MacBook Pro 15 2017 (2.8 GHz, 555) APPA031, IPS, 15.4", 2880x1800 | Dell Inspiron 15 7000 7577 ID: LG Philips LGD053F, Name: 156WF6, Dell P/N: 4XK13, IPS, 15.6", 1920x1080 | |
|---|---|---|---|---|---|---|
| Display | -6% | 16% | -10% | 23% | -40% | |
| Display P3 Coverage (%) | 68.4 | 64.3 -6% | 85.6 25% | 64.3 -6% | 97.9 43% | 40.4 -41% |
| sRGB Coverage (%) | 97.1 | 90.4 -7% | 99.9 3% | 84.4 -13% | 99.9 3% | 60.5 -38% |
| AdobeRGB 1998 Coverage (%) | 69.6 | 65.3 -6% | 83.9 21% | 61.7 -11% | 85.9 23% | 41.77 -40% |
| Response Times | -19% | -14% | 3% | -28% | -8% | |
| Response Time Grey 50% / Grey 80% * (ms) | 35.2 ? | 43.2 ? -23% | 49.6 ? -41% | 36.4 ? -3% | 48 ? -36% | 41 ? -16% |
| Response Time Black / White * (ms) | 28.4 ? | 32.8 ? -15% | 24.4 ? 14% | 26.2 ? 8% | 33.8 ? -19% | 28 ? 1% |
| PWM Frequency (Hz) | 25510 ? | 25510 ? | 21010 ? | 119000 ? | ||
| Screen | -15% | -56% | -4% | 42% | -5% | |
| Brightness middle (cd/m²) | 322.9 | 288.2 -11% | 223.9 -31% | 315.9 -2% | 545 69% | 257 -20% |
| Brightness (cd/m²) | 309 | 266 -14% | 208 -33% | 304 -2% | 523 69% | 229 -26% |
| Brightness Distribution (%) | 90 | 75 -17% | 88 -2% | 88 -2% | 86 -4% | 84 -7% |
| Black Level * (cd/m²) | 0.36 | 0.3 17% | 0.56 -56% | 0.37 -3% | 0.44 -22% | 0.17 53% |
| Contrast (:1) | 897 | 961 7% | 400 -55% | 854 -5% | 1239 38% | 1512 69% |
| Colorchecker dE 2000 * | 3.99 | 5.5 -38% | 9.7 -143% | 4.9 -23% | 1.6 60% | 5.34 -34% |
| Colorchecker dE 2000 max. * | 8.97 | 11.3 -26% | 19.7 -120% | 9.7 -8% | 3.8 58% | 9.99 -11% |
| Greyscale dE 2000 * | 5.3 | 7.9 -49% | 12.9 -143% | 3.8 28% | 1.9 64% | 4.82 9% |
| Gamma | 2.041 108% | 2.09 105% | 2.18 101% | 2.24 98% | 2.26 97% | 2.46 89% |
| CCT | 6941 94% | 6559 99% | 15225 43% | 6847 95% | 6834 95% | 6587 99% |
| Color Space (Percent of AdobeRGB 1998) (%) | 62.9 | 58.5 -7% | 75 19% | 55 -13% | 38 -40% | |
| Color Space (Percent of sRGB) (%) | 96.8 | 90 -7% | 100 3% | 84 -13% | 60 -38% | |
| Total Average (Program / Settings) | -13% /
-13% | -18% /
-36% | -4% /
-5% | 12% /
27% | -18% /
-12% |
* ... smaller is better
Color space covers nearly the entire sRGB spectrum and approximately 63 percent of the AdobeRGB standard. Graphics artists are more likely to appreciate the wider range of colors offered by the 4K UHD option over the FHD option. Other notebooks with 4K UHD panels like the XPS 15 or Razer Blade Pro tend to cover sRGB in its entirety.
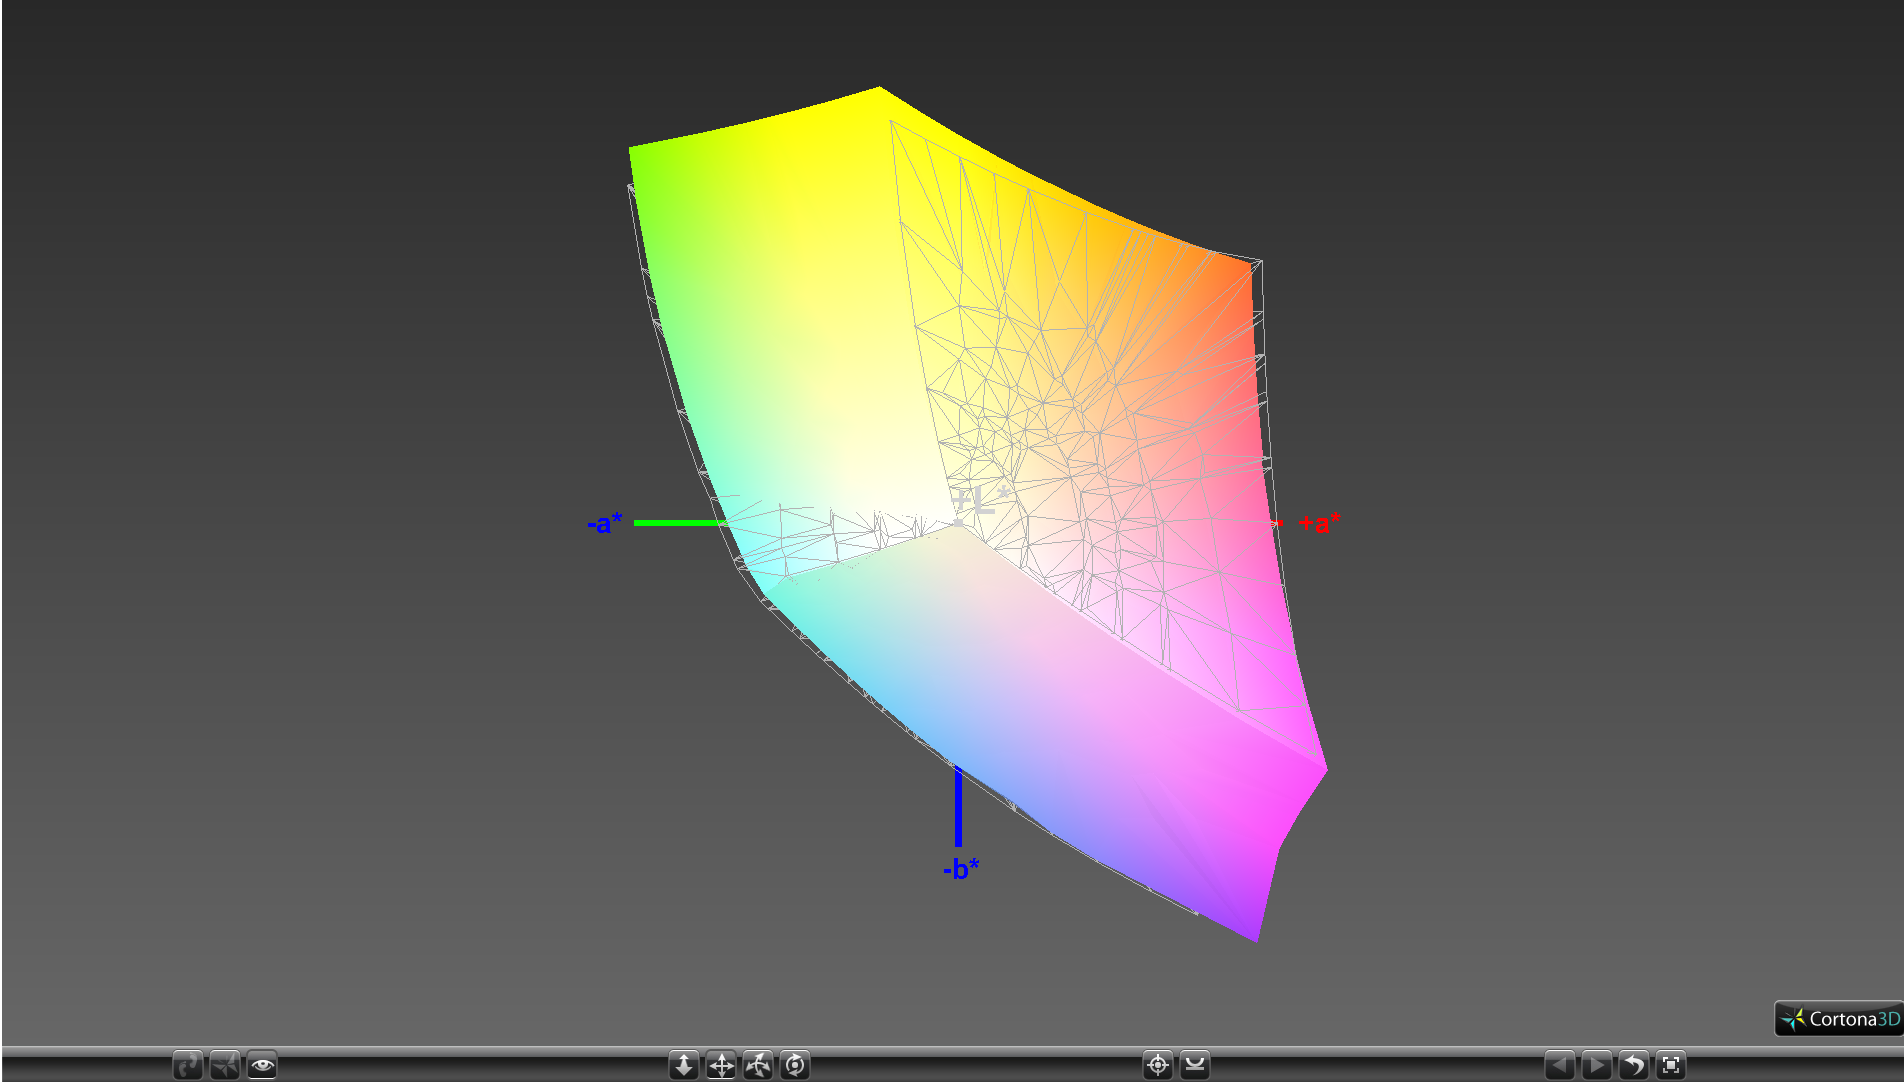
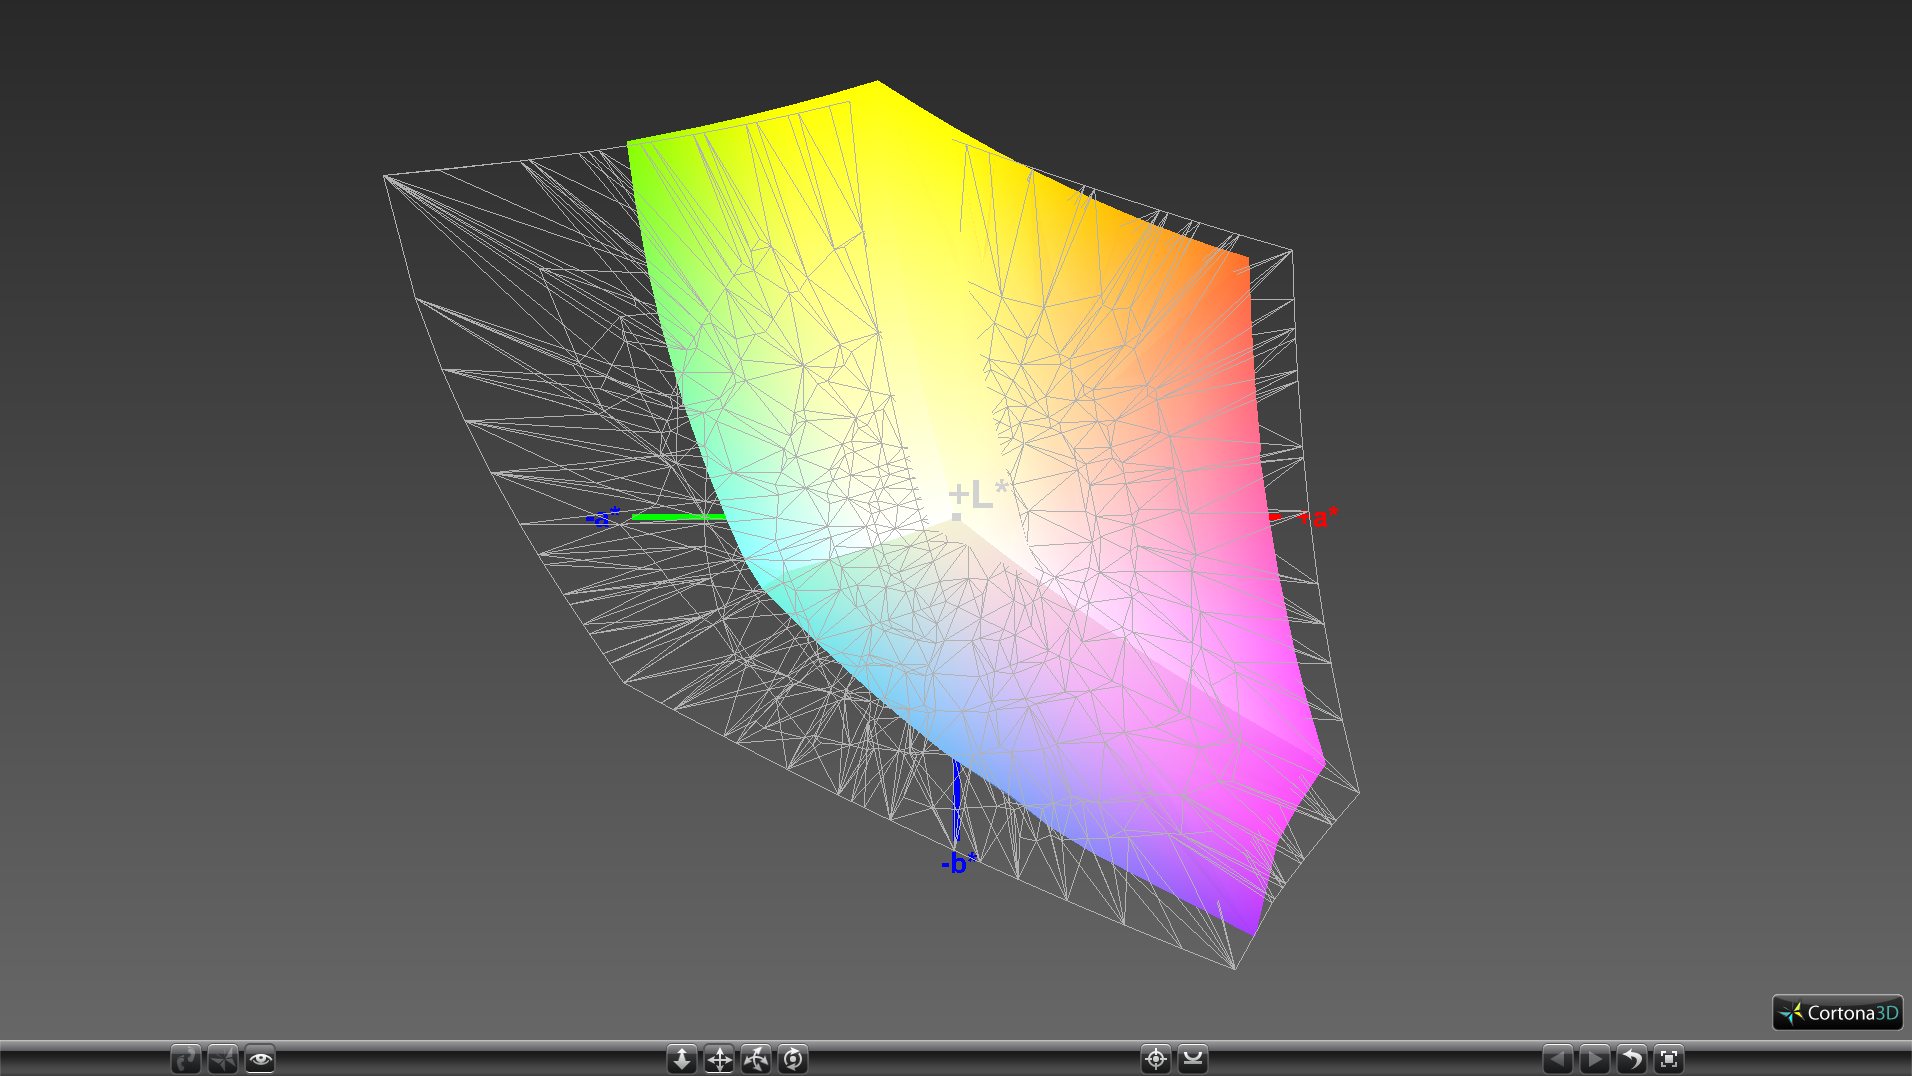
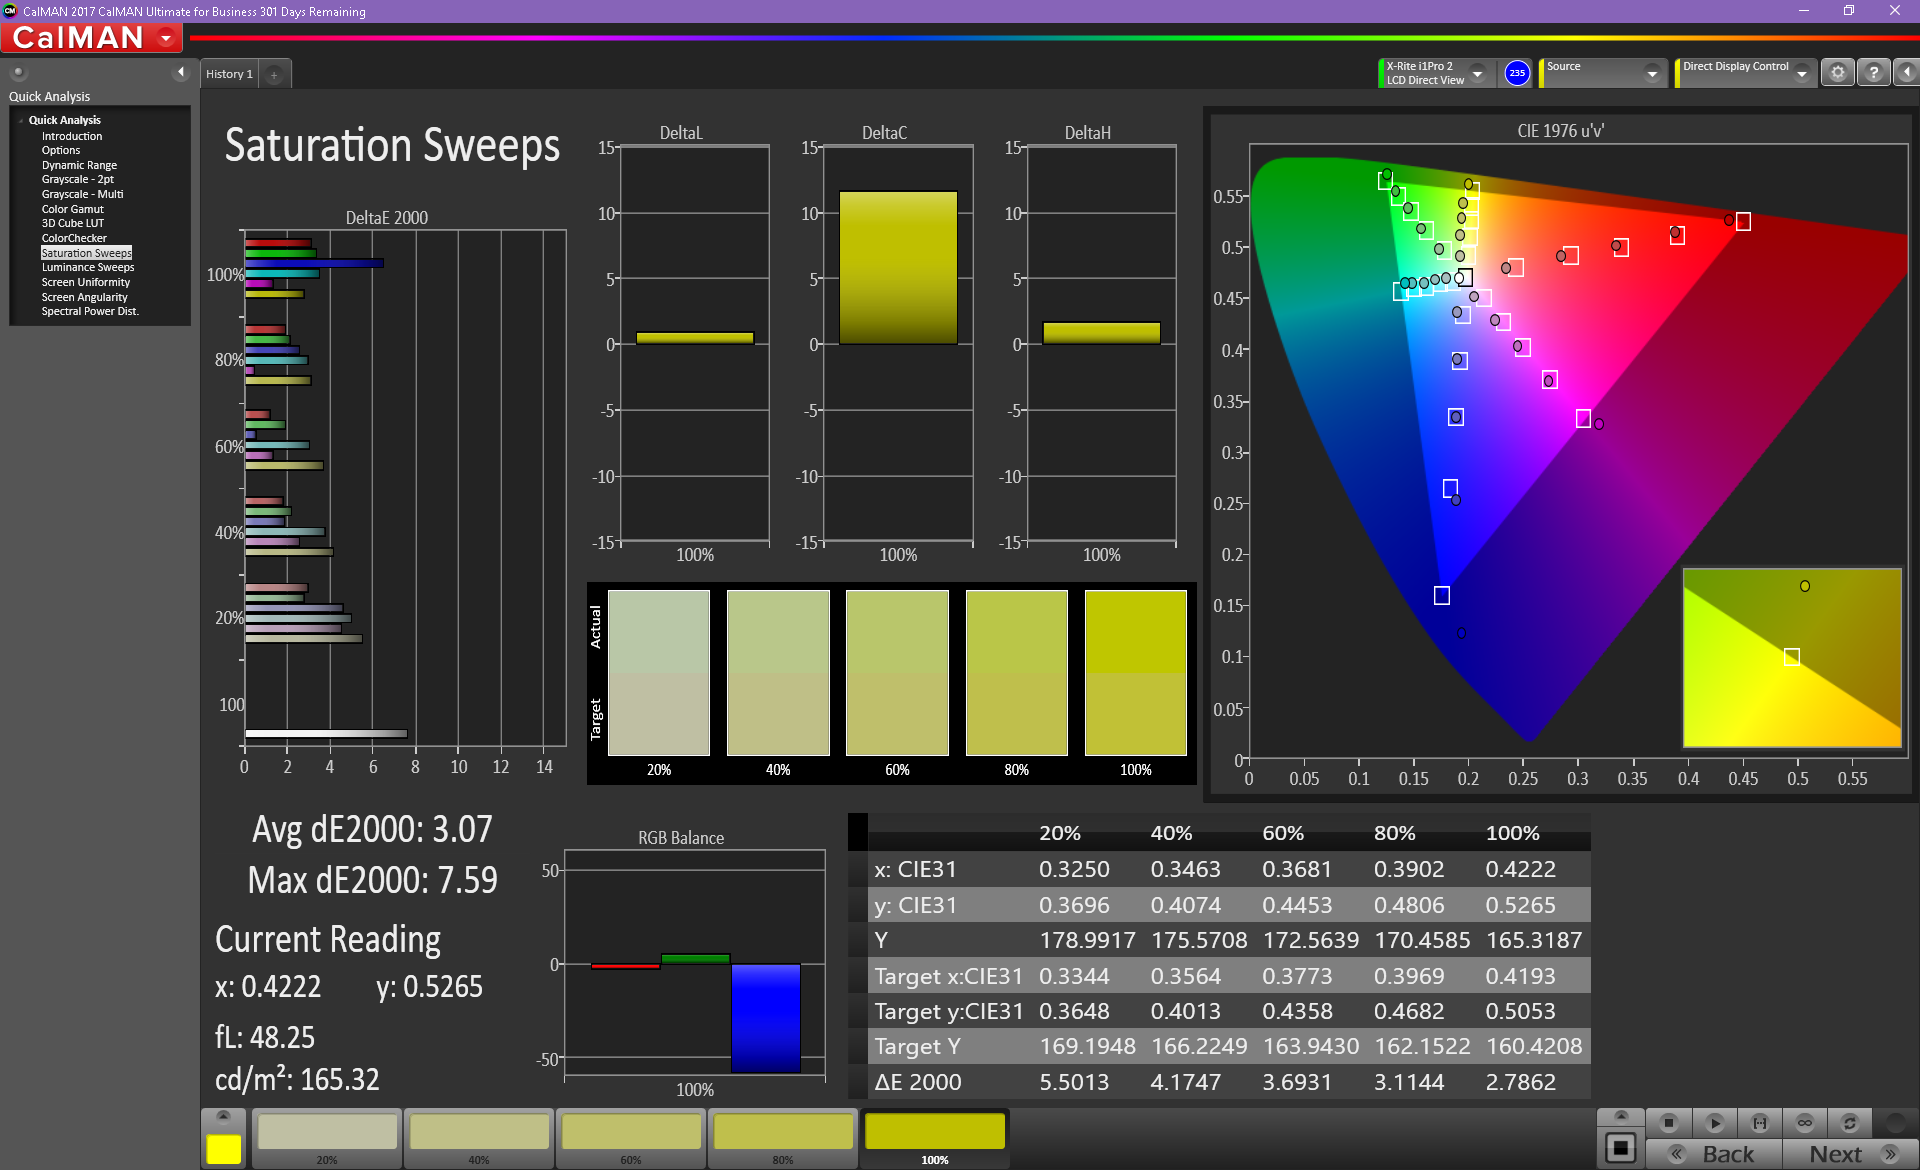
Calman measurements reveal a generally inaccurate grayscale out of the box. Our calibration attempts noticeably improve both grayscale and colors on all tested saturation levels and we recommend applying our ICM color profile above to get the most out of the 4K UHD panel. Blue, unfortunately, is represented more inaccurately than other colors even after calibration.
Display Response Times
| ↔ Response Time Black to White | ||
|---|---|---|
| 28.4 ms ... rise ↗ and fall ↘ combined | ↗ 16 ms rise | 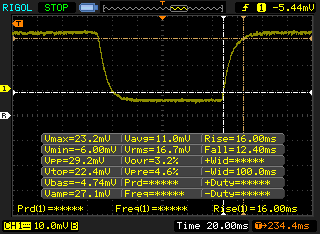 |
| ↘ 12.4 ms fall | ||
| The screen shows relatively slow response rates in our tests and may be too slow for gamers. In comparison, all tested devices range from 0.1 (minimum) to 240 (maximum) ms. » 74 % of all devices are better. This means that the measured response time is worse than the average of all tested devices (20.2 ms). | ||
| ↔ Response Time 50% Grey to 80% Grey | ||
| 35.2 ms ... rise ↗ and fall ↘ combined | ↗ 17.2 ms rise | 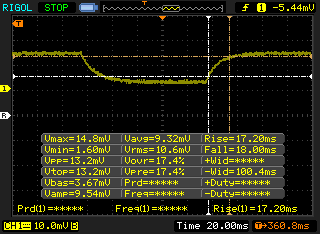 |
| ↘ 18 ms fall | ||
| The screen shows slow response rates in our tests and will be unsatisfactory for gamers. In comparison, all tested devices range from 0.165 (minimum) to 636 (maximum) ms. » 48 % of all devices are better. This means that the measured response time is worse than the average of all tested devices (31.6 ms). | ||
Screen Flickering / PWM (Pulse-Width Modulation)
| Screen flickering / PWM not detected | 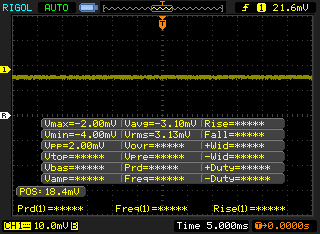 | ||
In comparison: 53 % of all tested devices do not use PWM to dim the display. If PWM was detected, an average of 8108 (minimum: 5 - maximum: 343500) Hz was measured. | |||
Outdoor visibility is better than the FHD model since the 4K UHD panel is brighter and able to reproduce deeper colors. However, text scaling should be enabled or else the denser PPI will prove disadvantageous in terms of readability. Viewing angles are still wide and with no major color shifting even if at extreme angles.
Performance
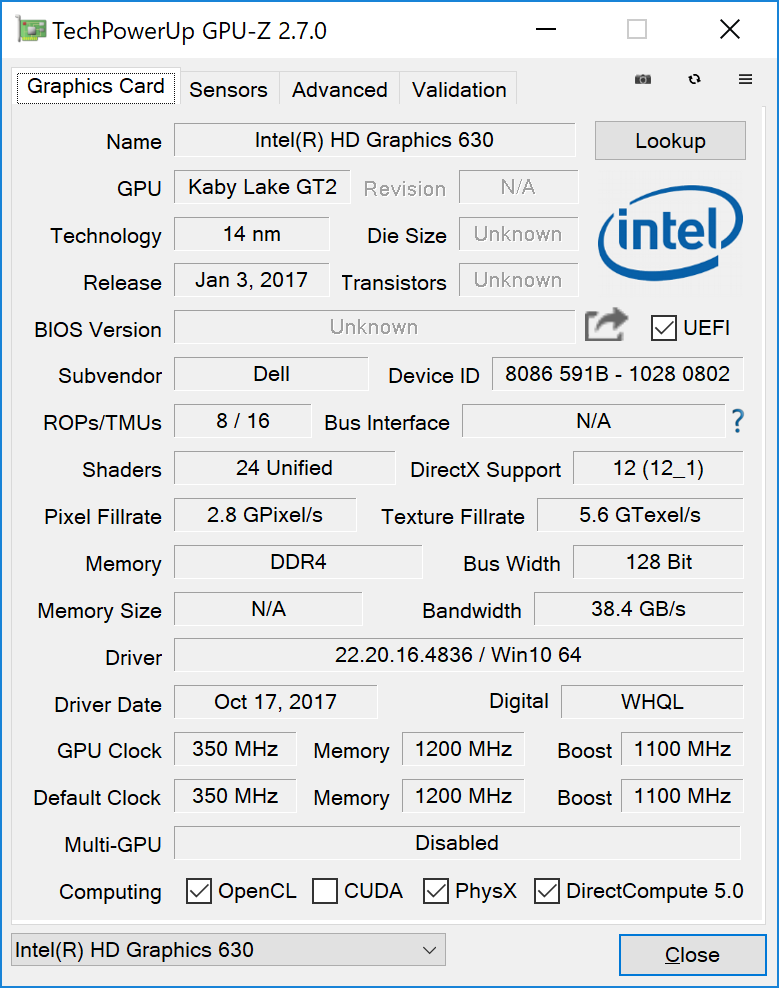
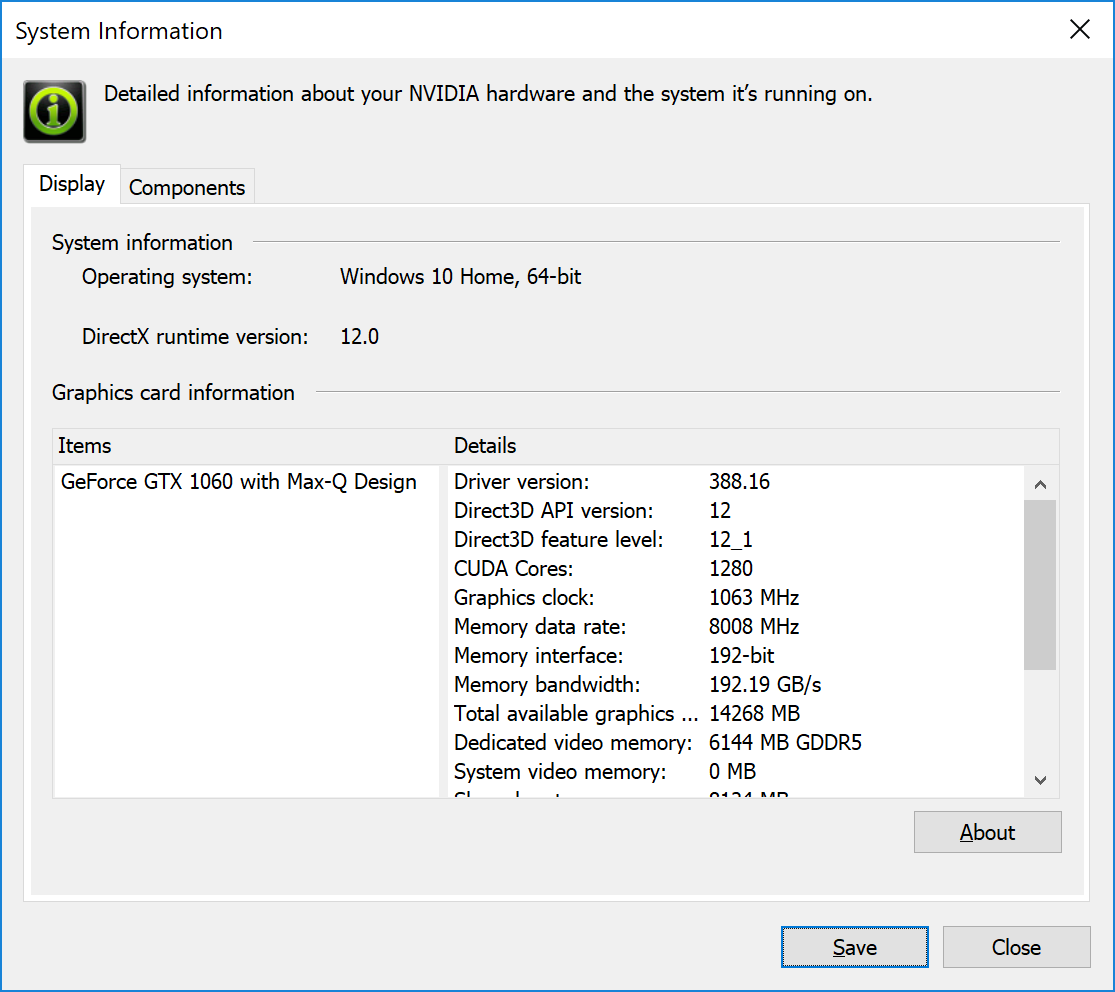
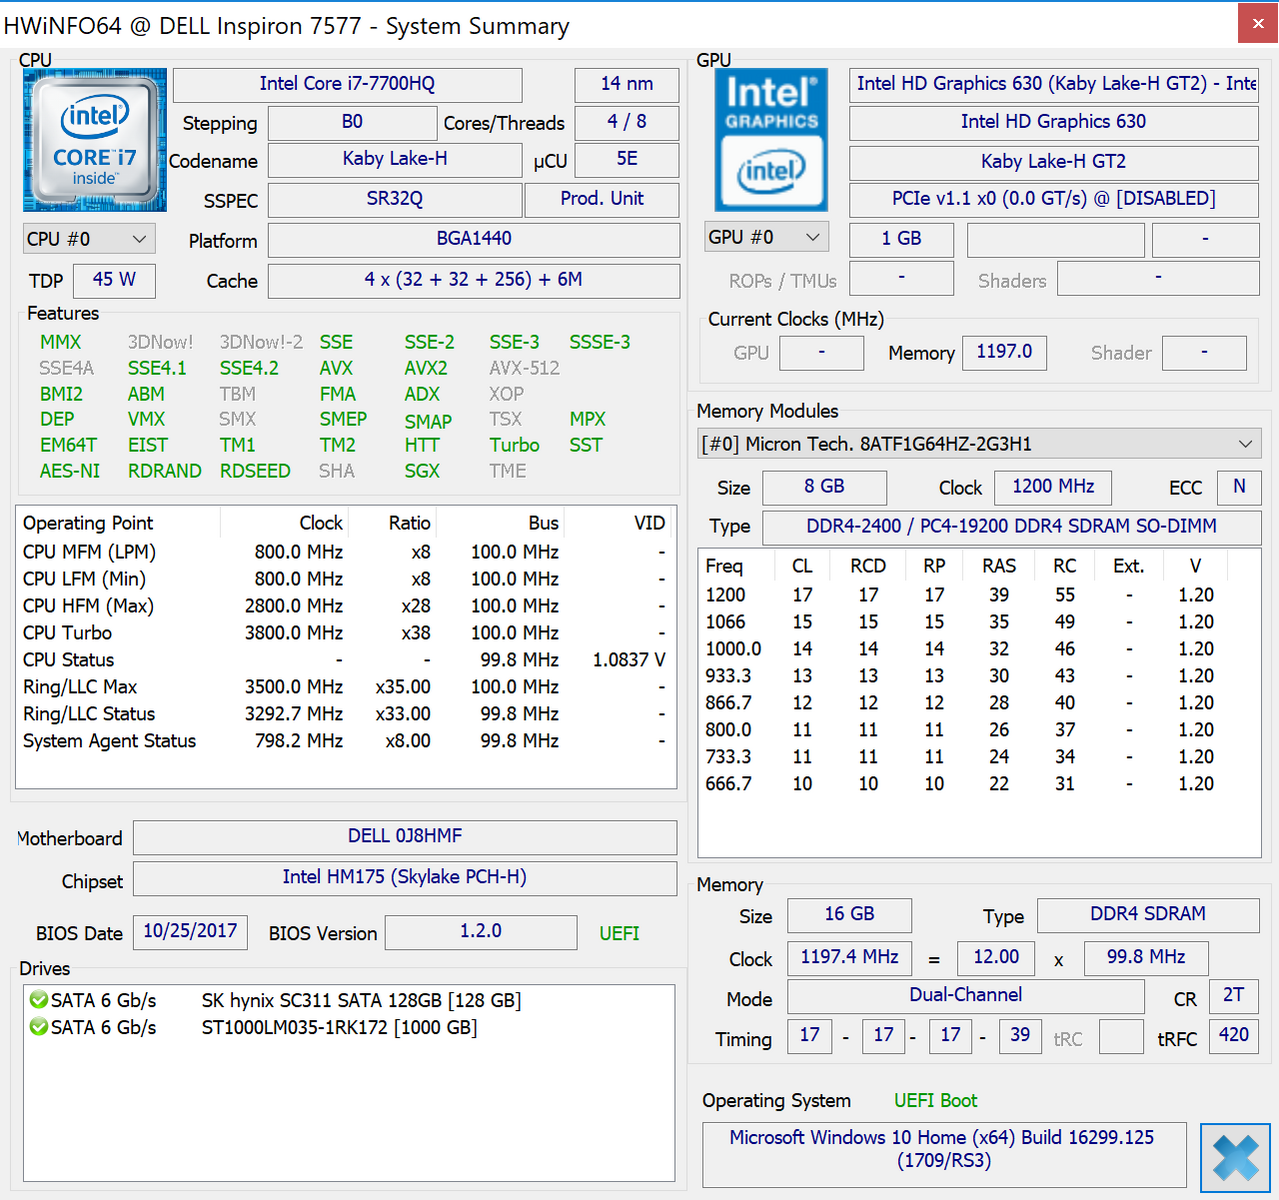
The Core i7-7700HQ is common across most newer gaming notebooks from models as small as the Razer Blade up to the large MSI GT75VR. The GTX 1060 Max-Q GPU is much rarer and is currently the highest option for the Inspiron 15 7577. Older Inspiron 15 7567 SKUs were limited to the GTX 1050 and GTX 1050 Ti only.
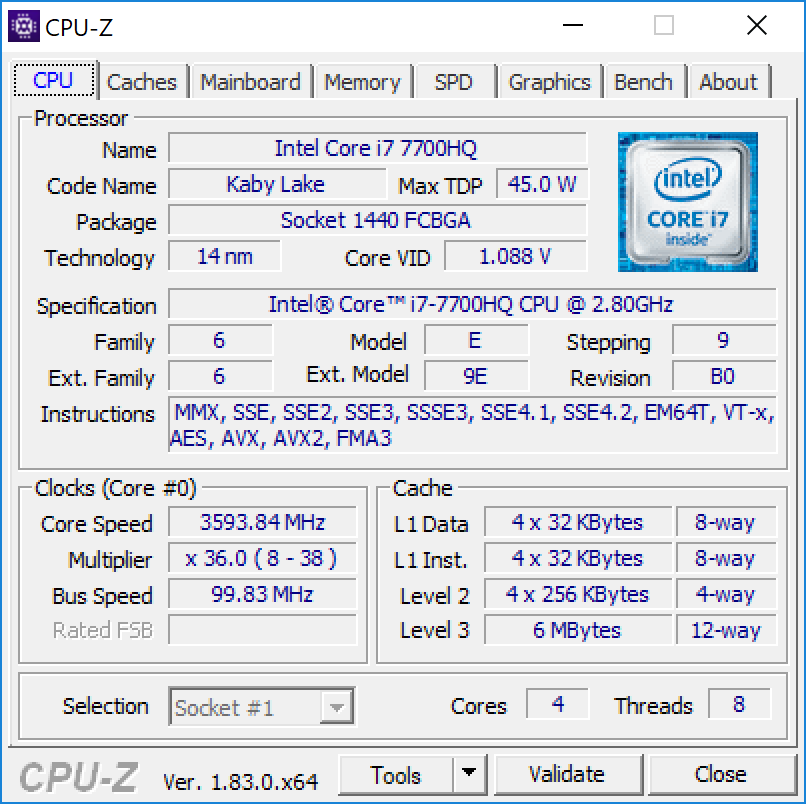
Processor
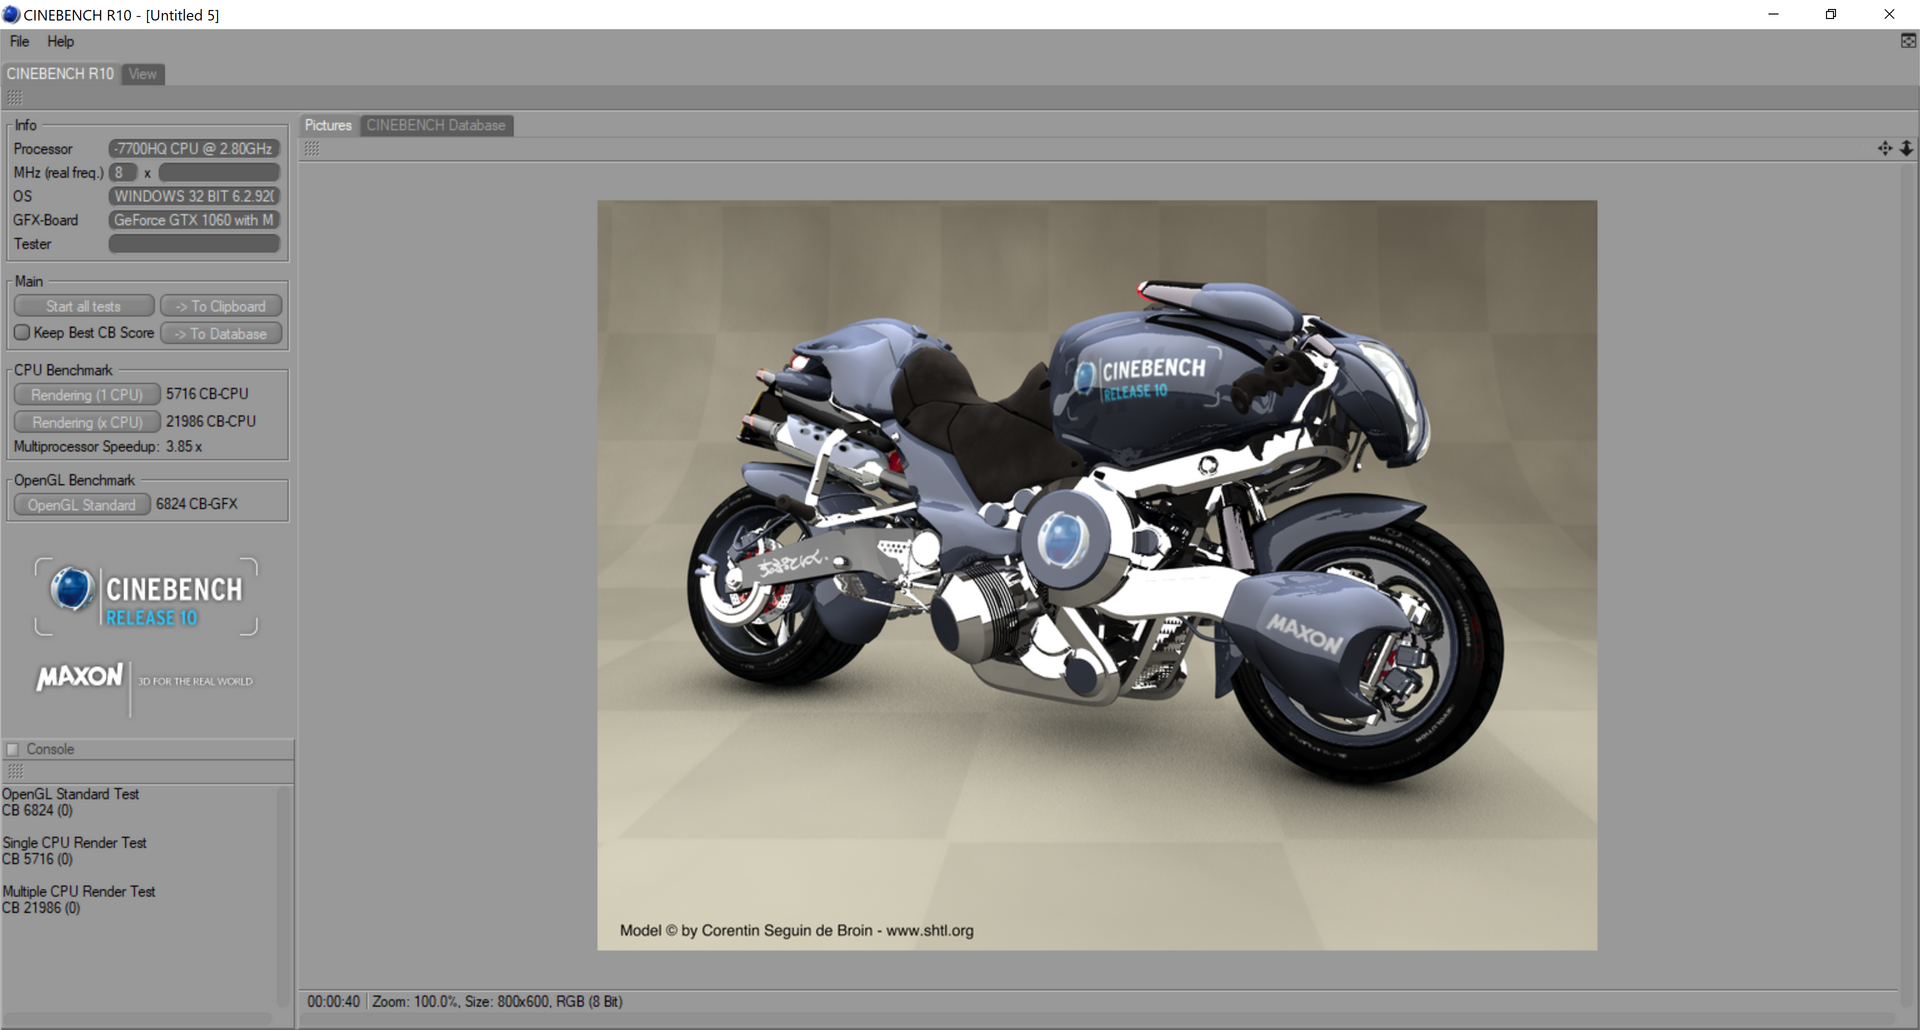
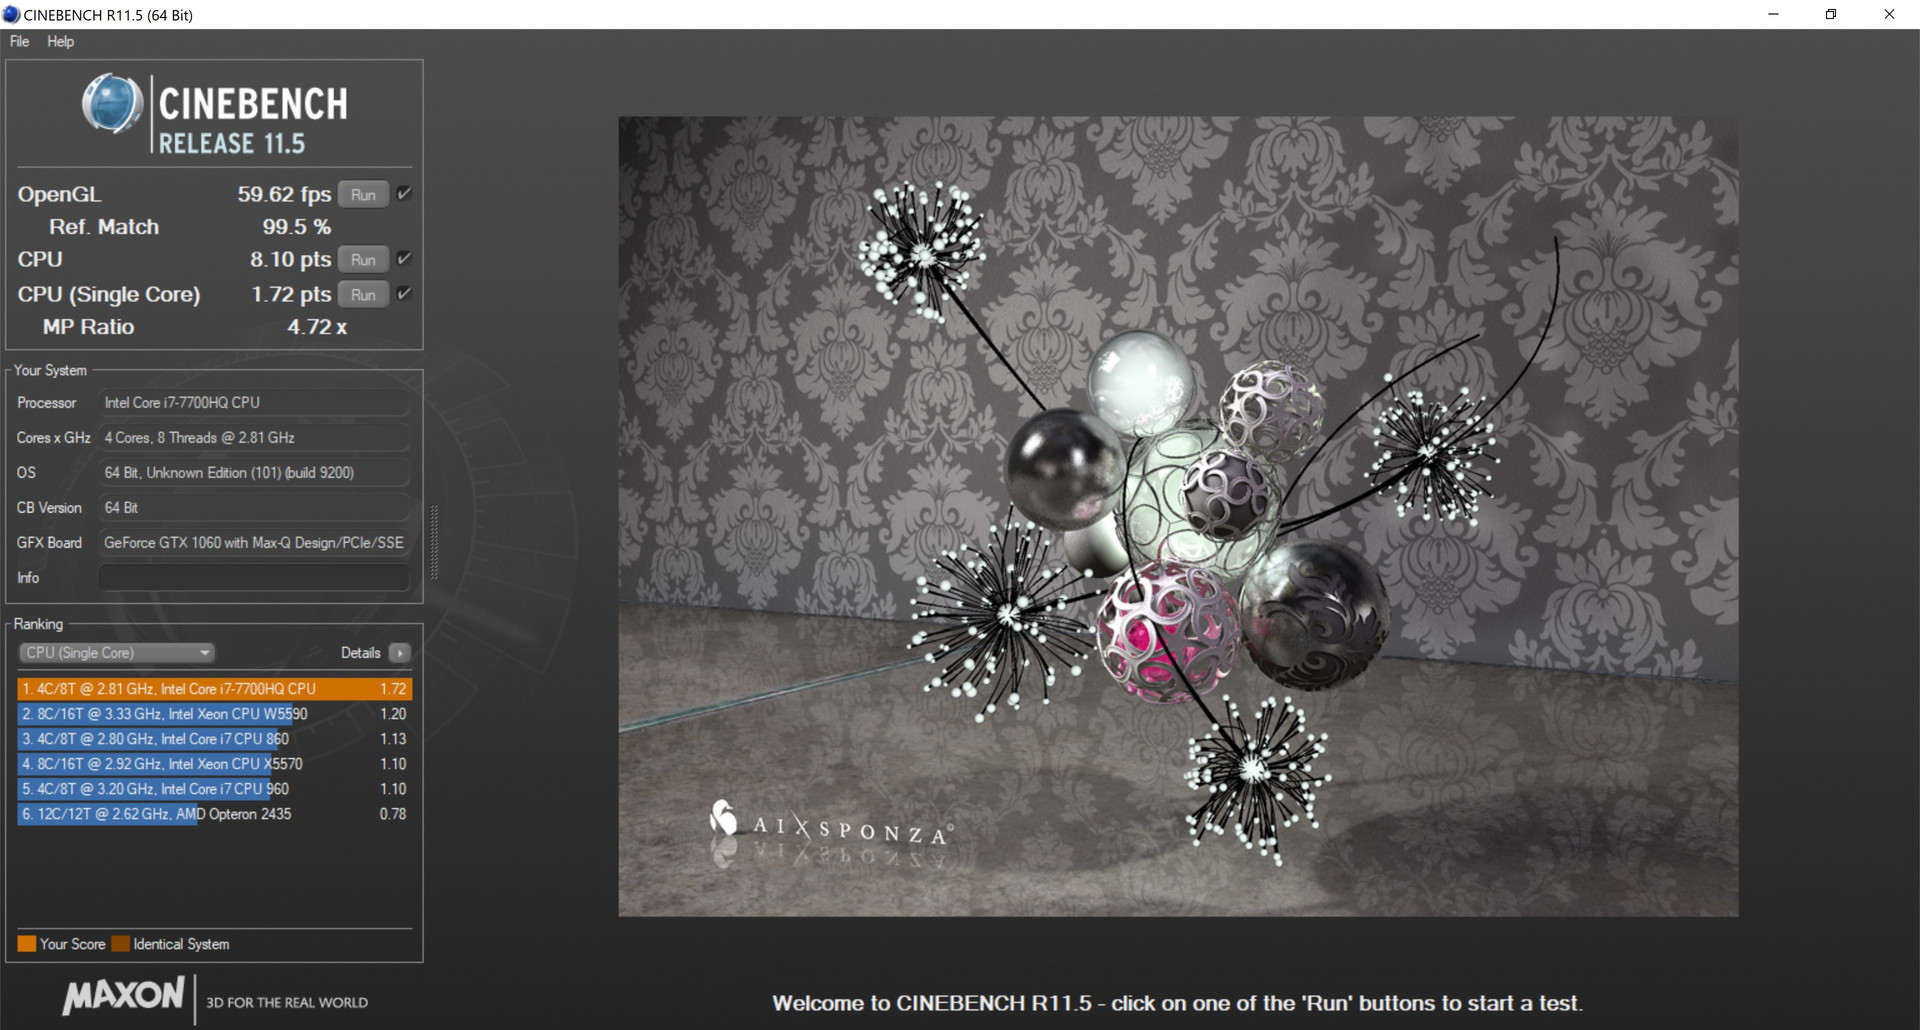
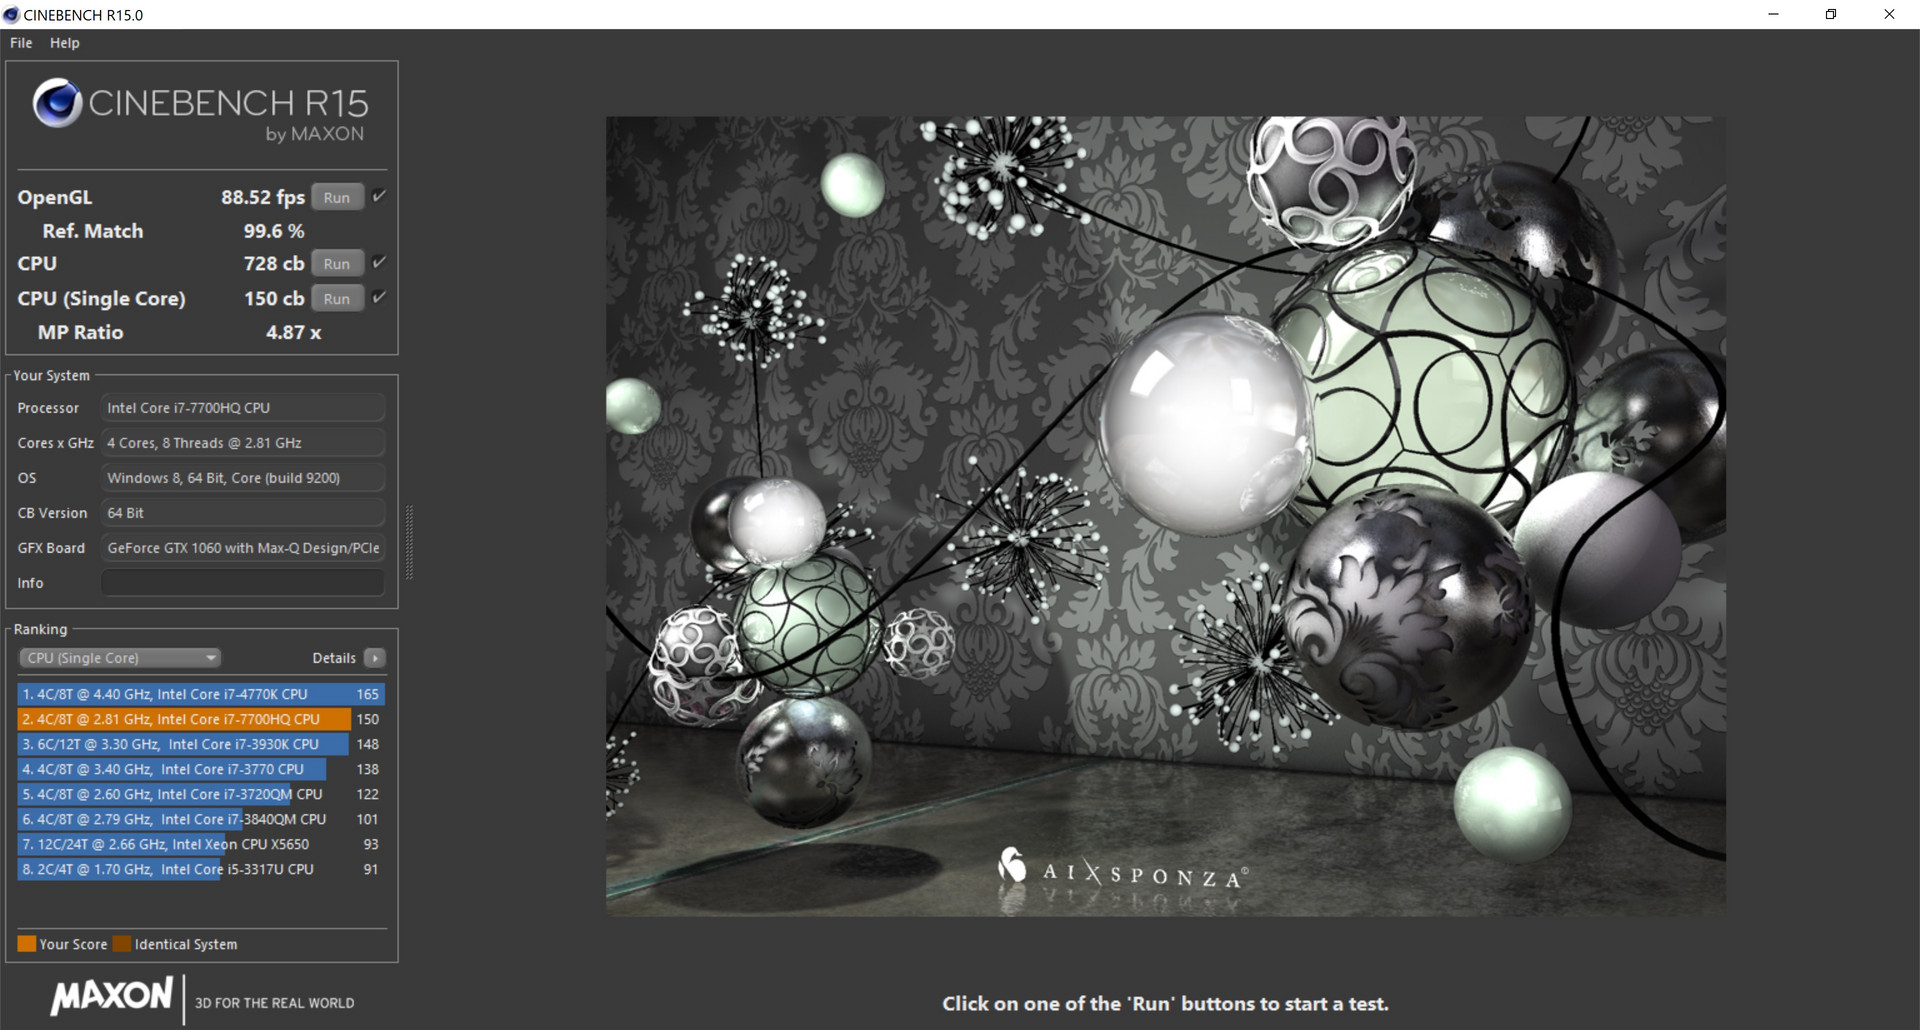
Multi-thread CPU performance is approximately 44 percent faster than the i5-7300HQ in the lower-end Inspiron 15 7577 SKU. Running CineBench R15 in a loop results in steady scores over time to suggest no processor throttling over long periods.
See our Core i7-7700HQ CPU page for more technical information and benchmark comparisons.
* ... smaller is better
System Performance
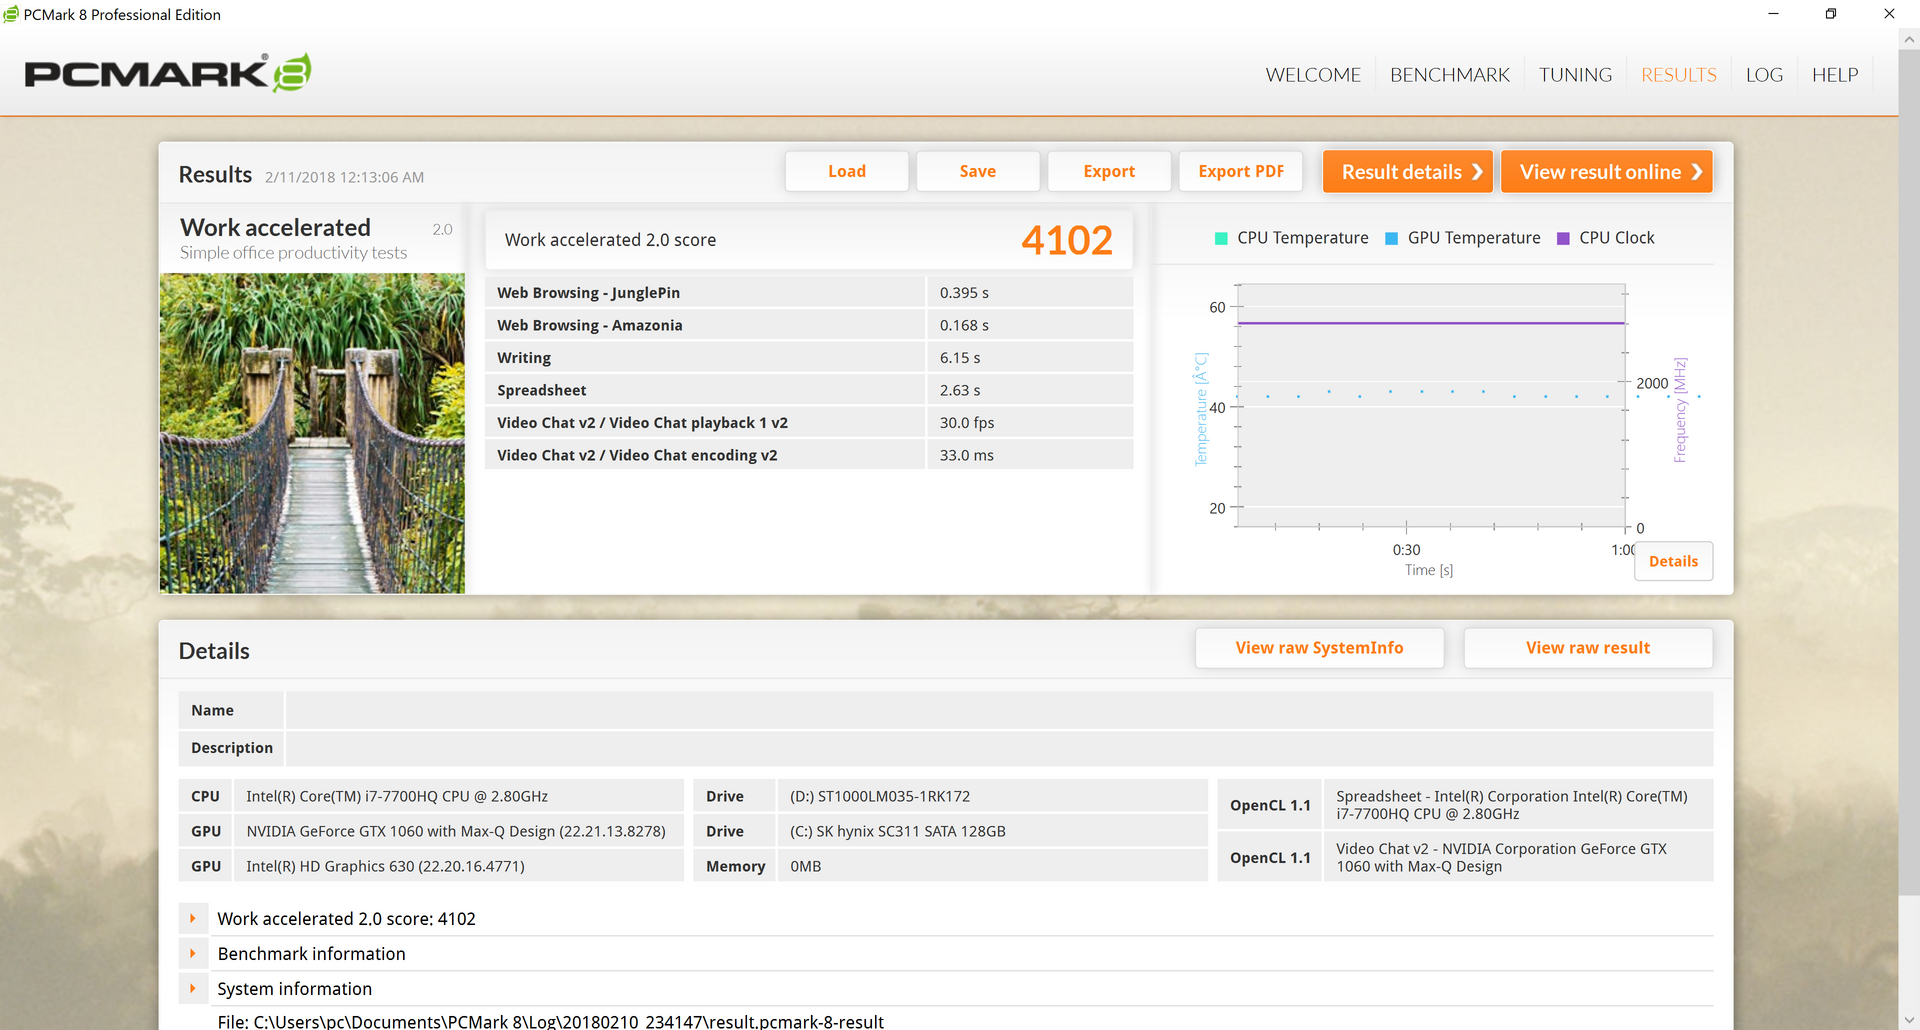
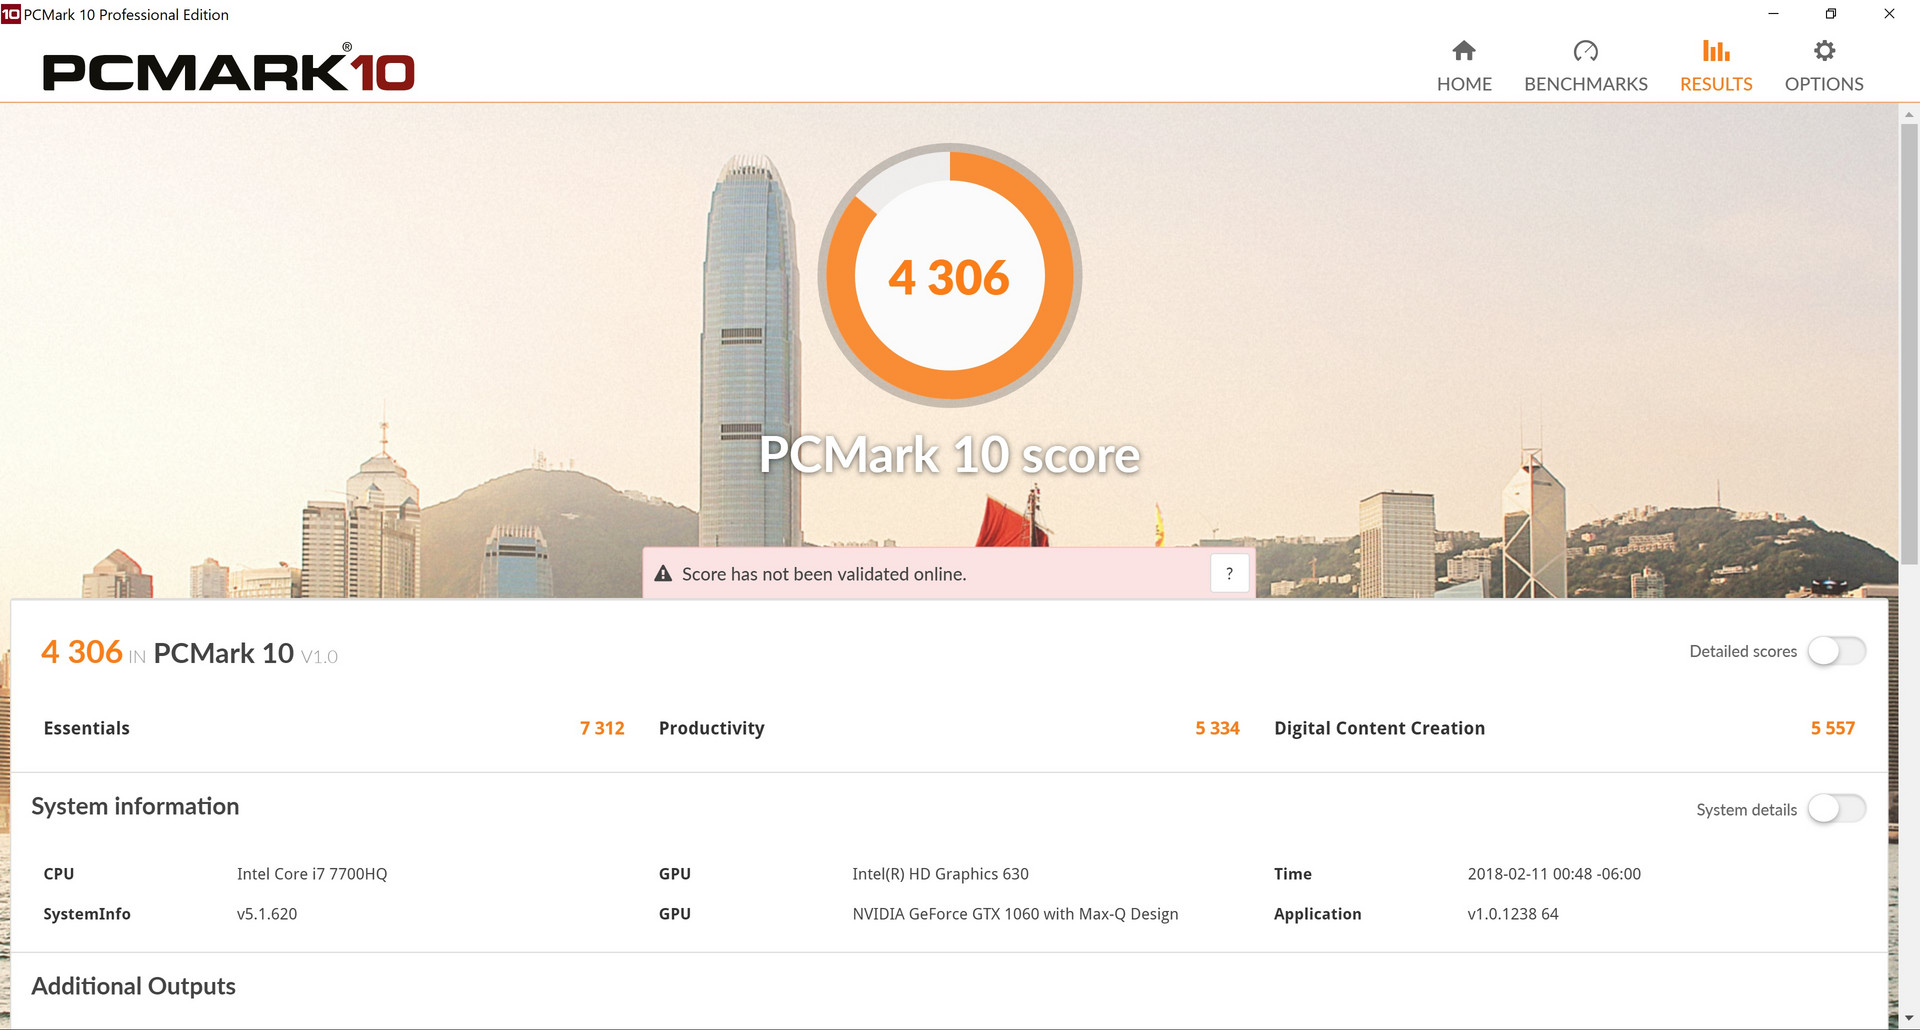
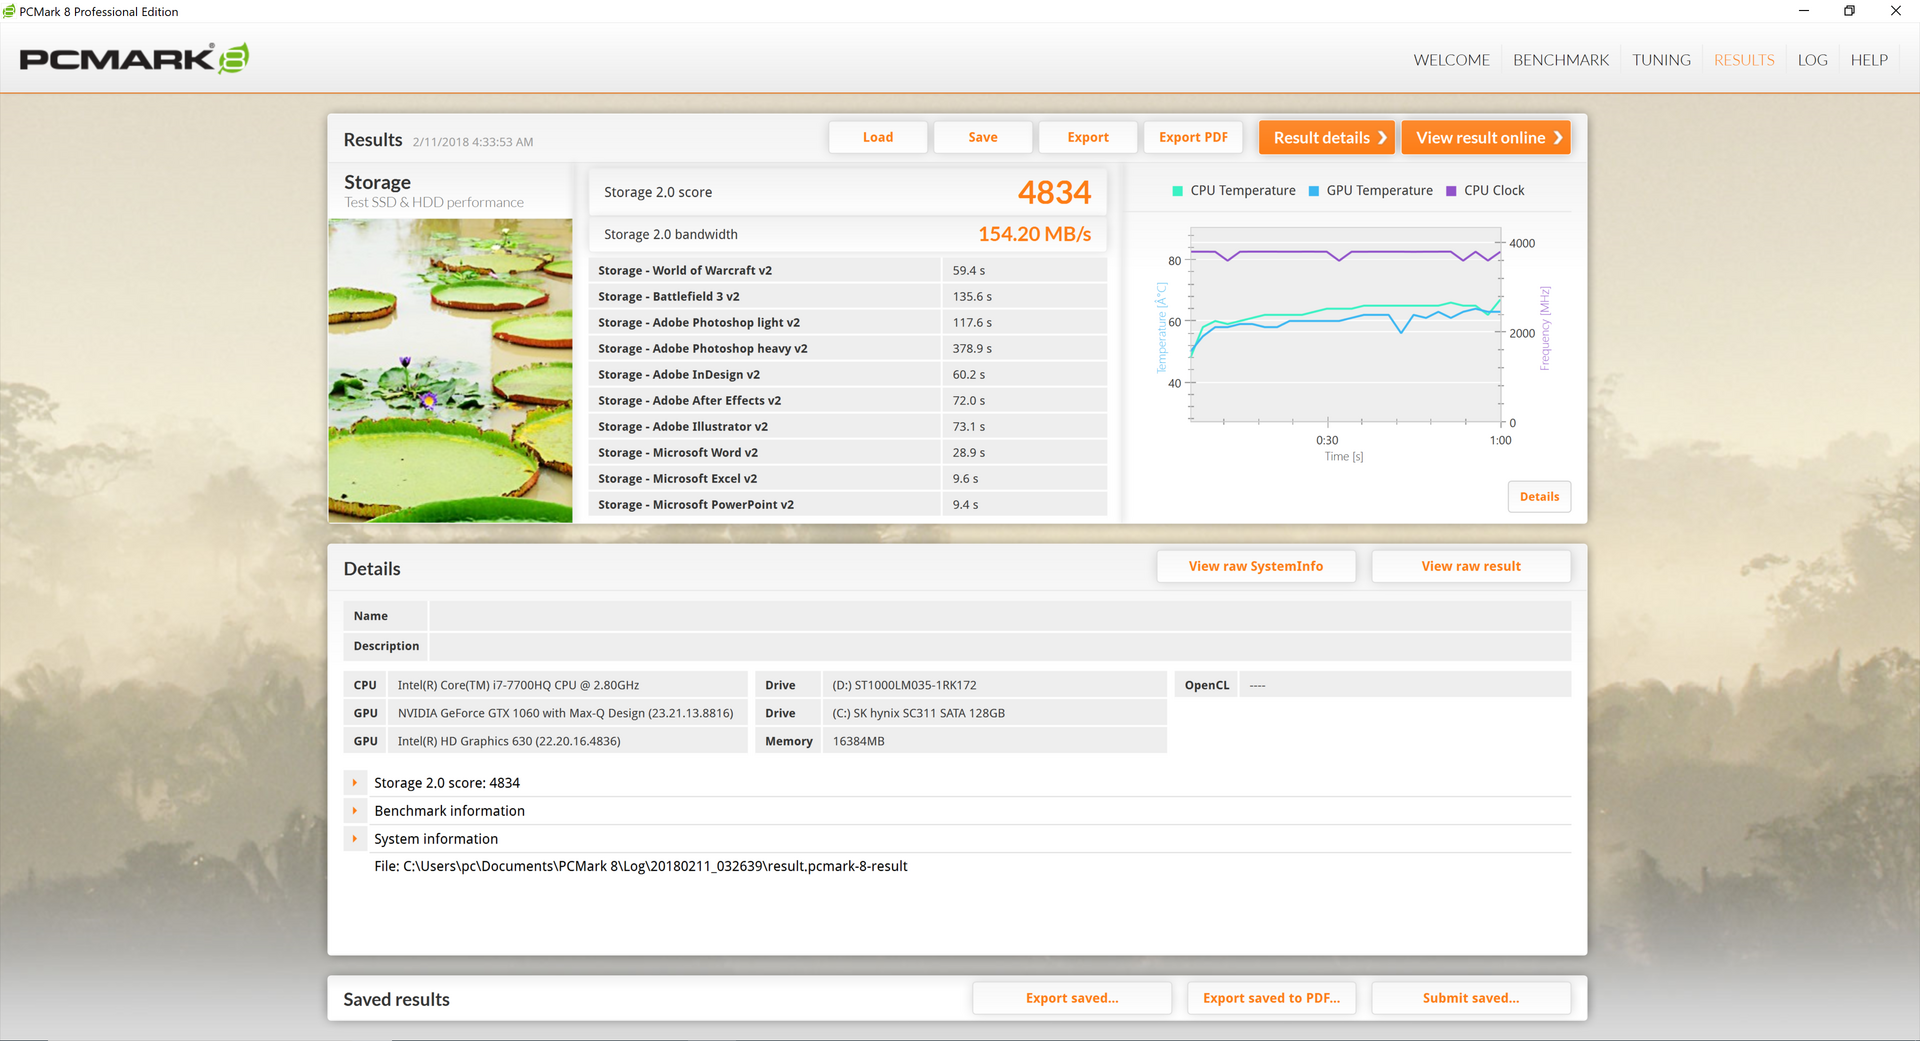
PCMark 10 benchmarks rank the Dell within single-digit percentage points from the average gaming notebook and even the lower-end Inspiron 15 7577 SKU with the slower Core i5-7300HQ. As long as the system is equipped with a primary SSD, the Inspiron will feel snappy for everyday loads regardless of the CPU or GPU option.
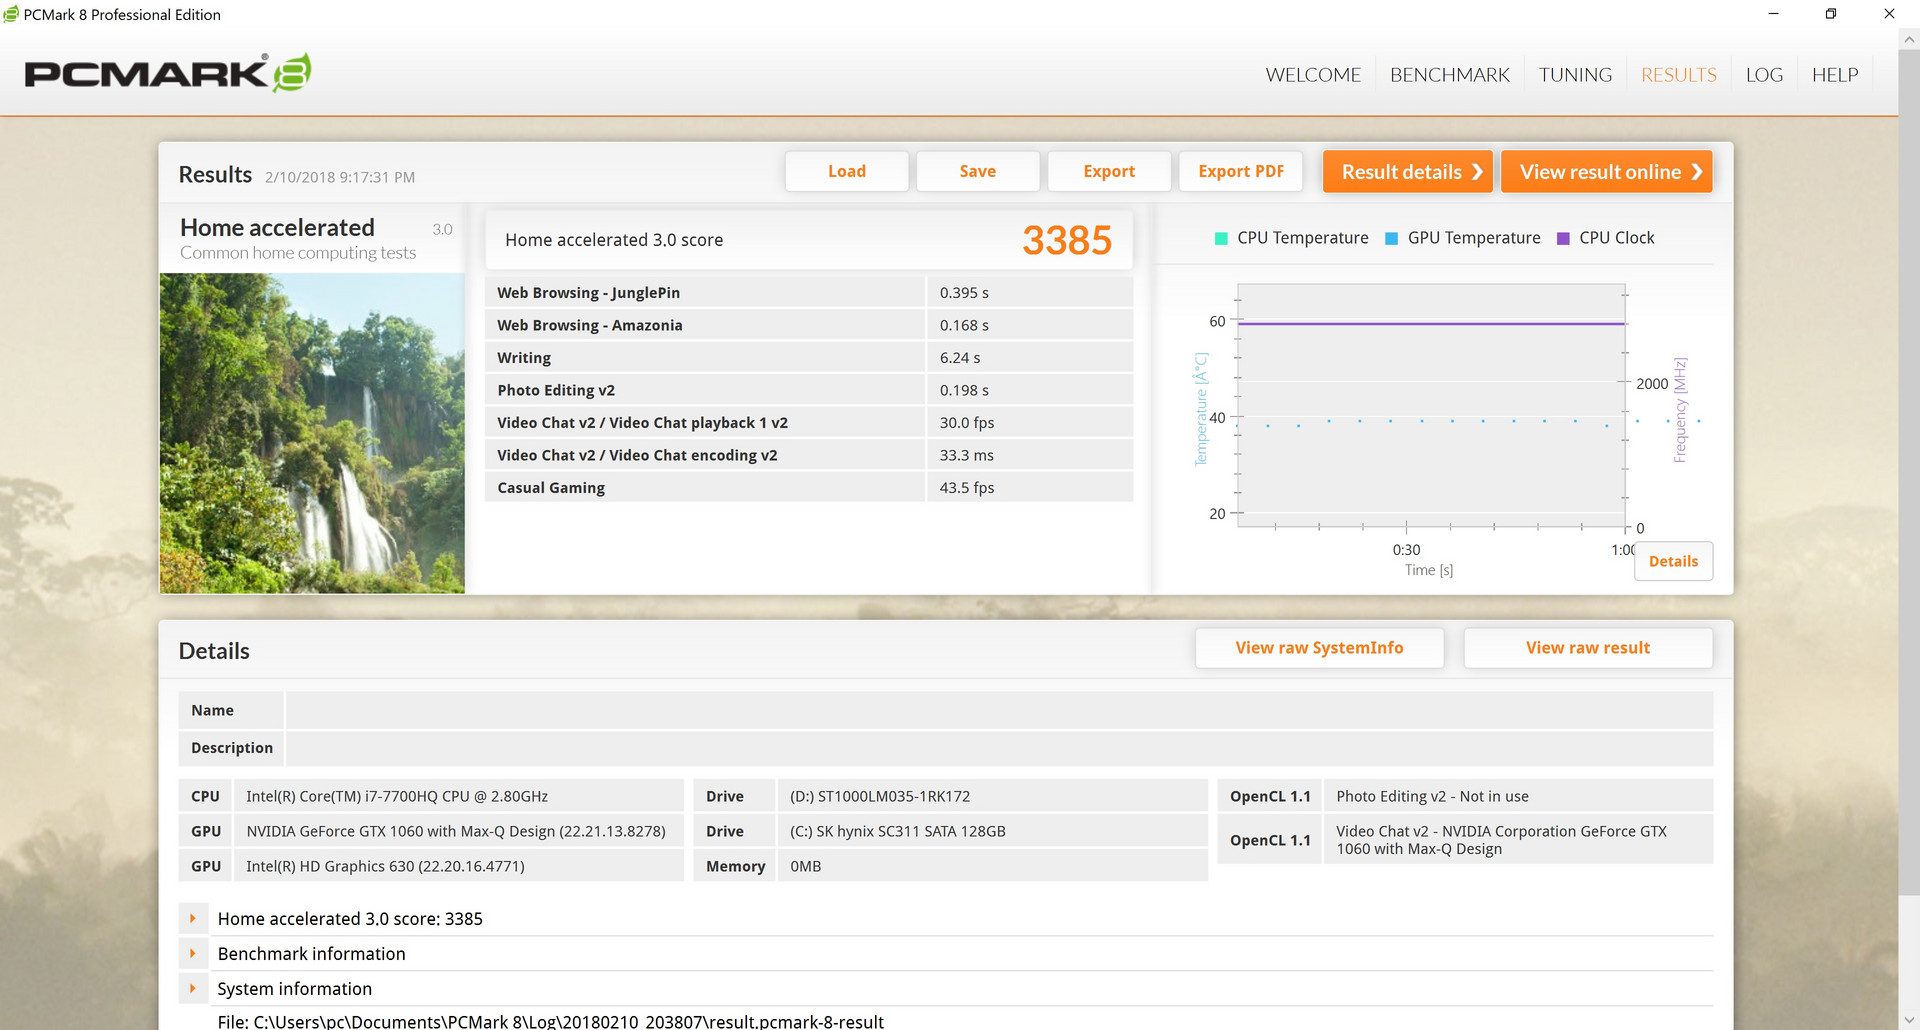
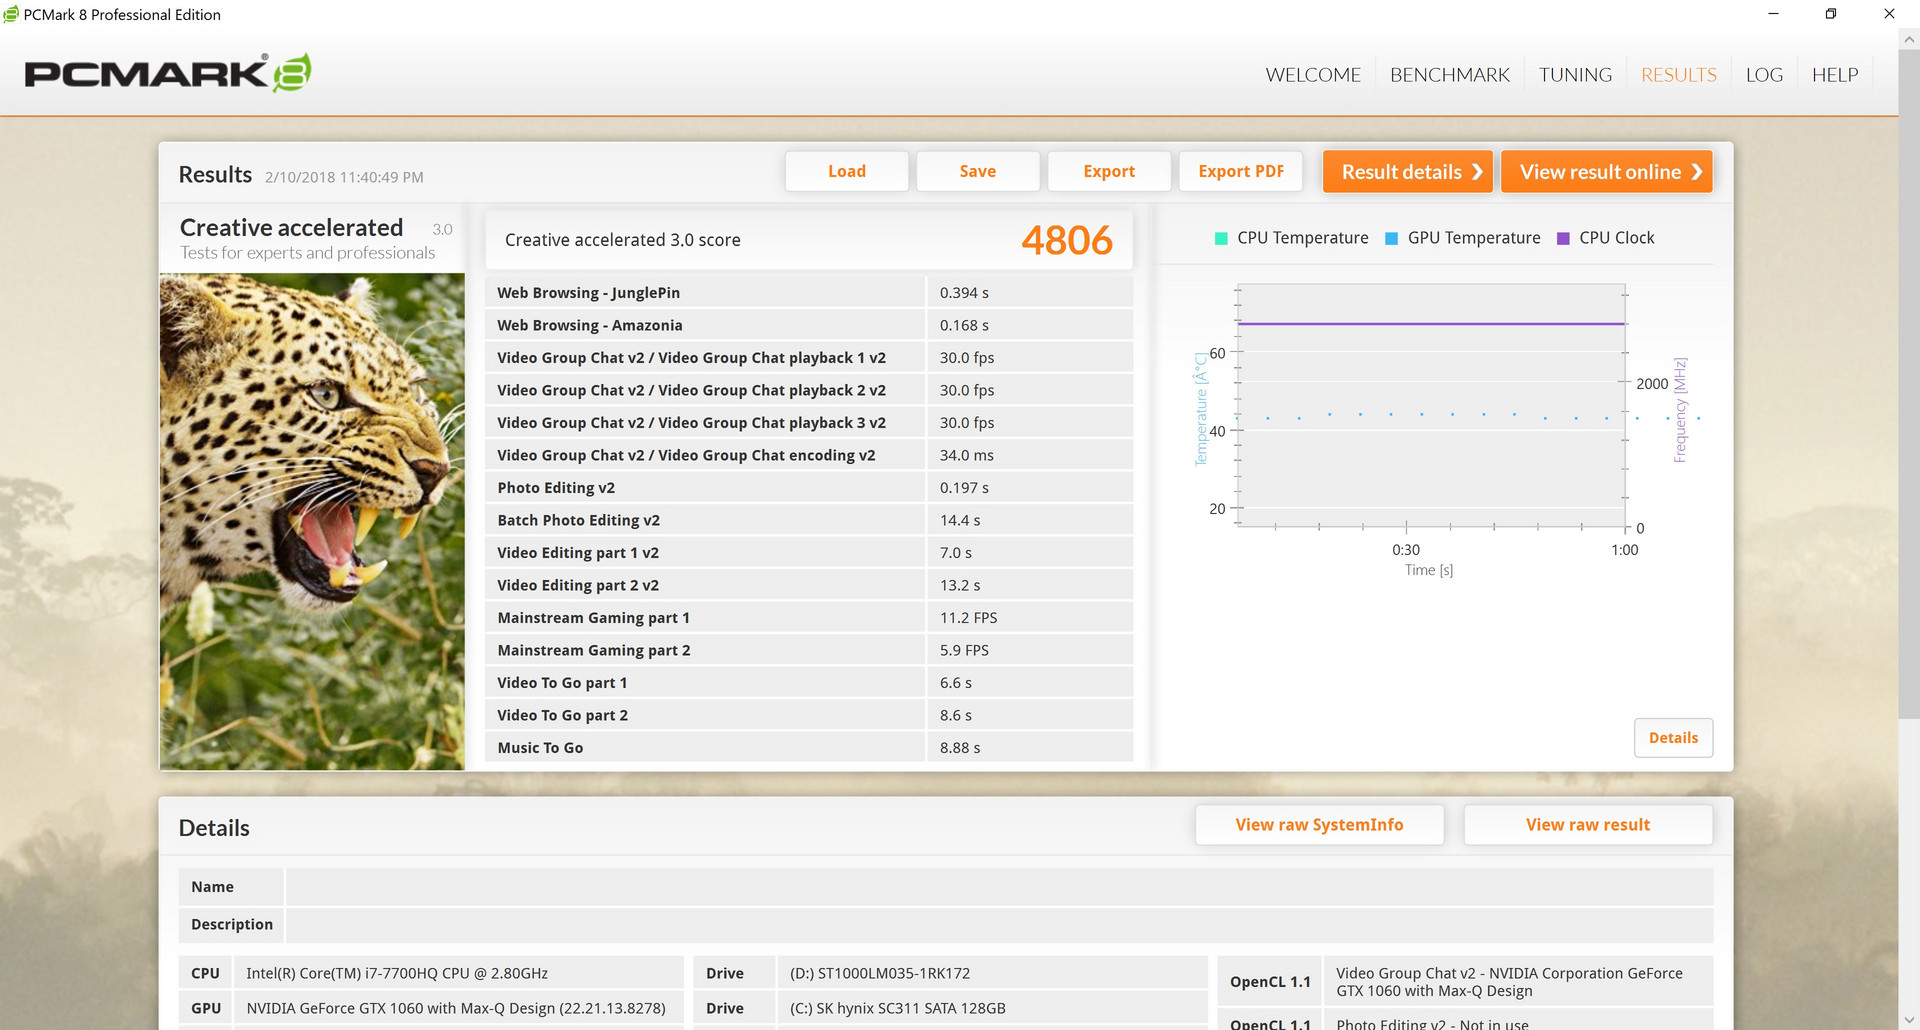
| PCMark 8 Home Score Accelerated v2 | 3385 points | |
| PCMark 8 Creative Score Accelerated v2 | 4806 points | |
| PCMark 8 Work Score Accelerated v2 | 4102 points | |
| PCMark 10 Score | 4306 points | |
Help | ||
Storage Devices
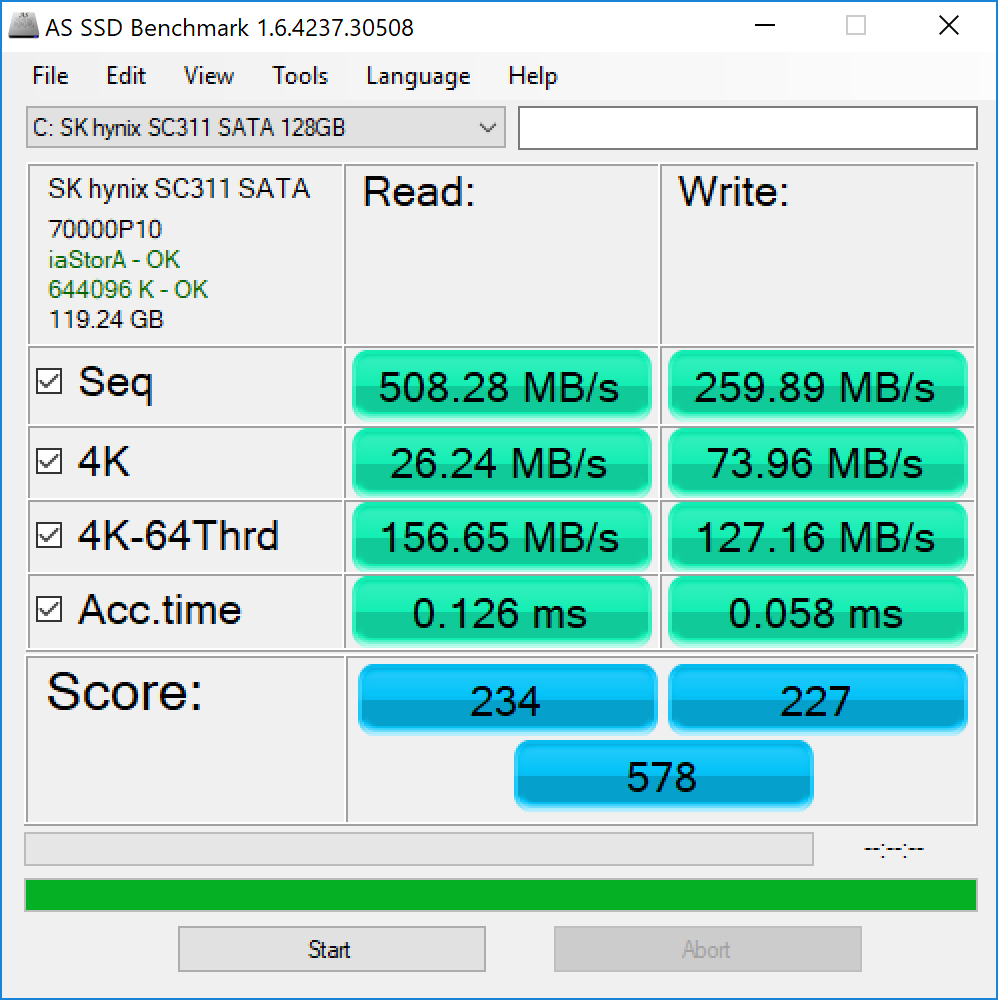
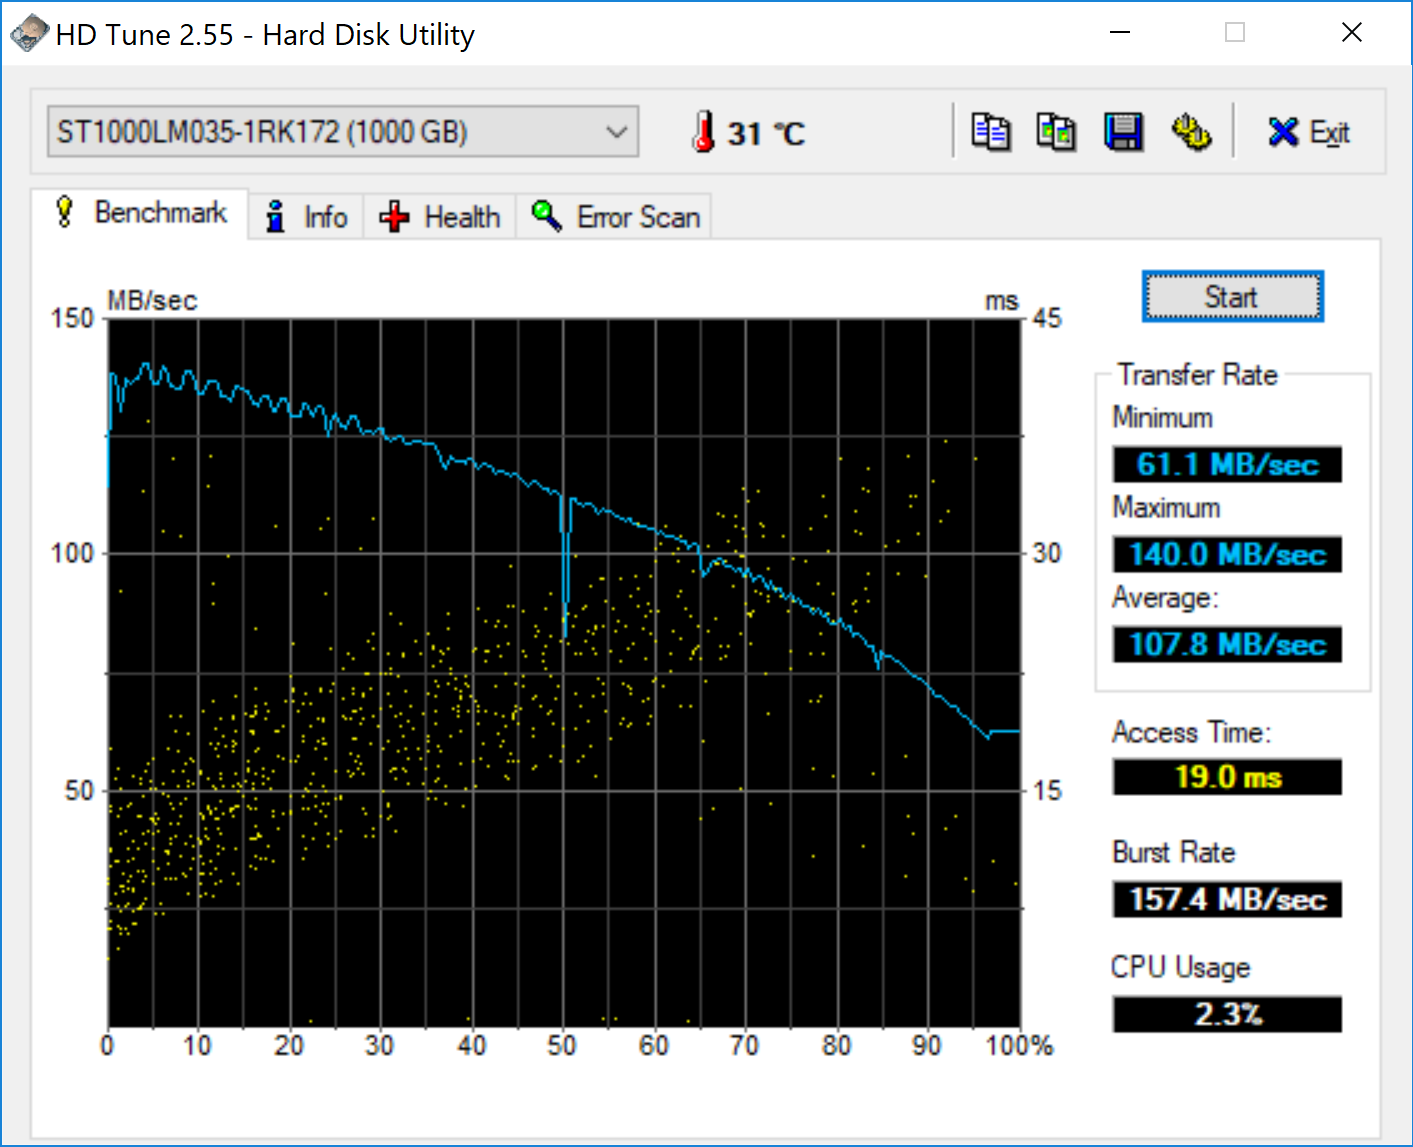
Our configuration utilizes a primary SK Hynix 128 GB M.2 SSD and a secondary Seagate 1 TB HDD. This particular SSD is limited to SATA III speeds unlike the NVMe SSDs on higher-end configurations of the Dell. Transfer rates from the SK Hynix drive are below average for a SATA III HDD as sequential write rates are about half of what some competing SATA III SSDs have to offer.
See our table of HDDs and SSDs for more benchmark comparisons.
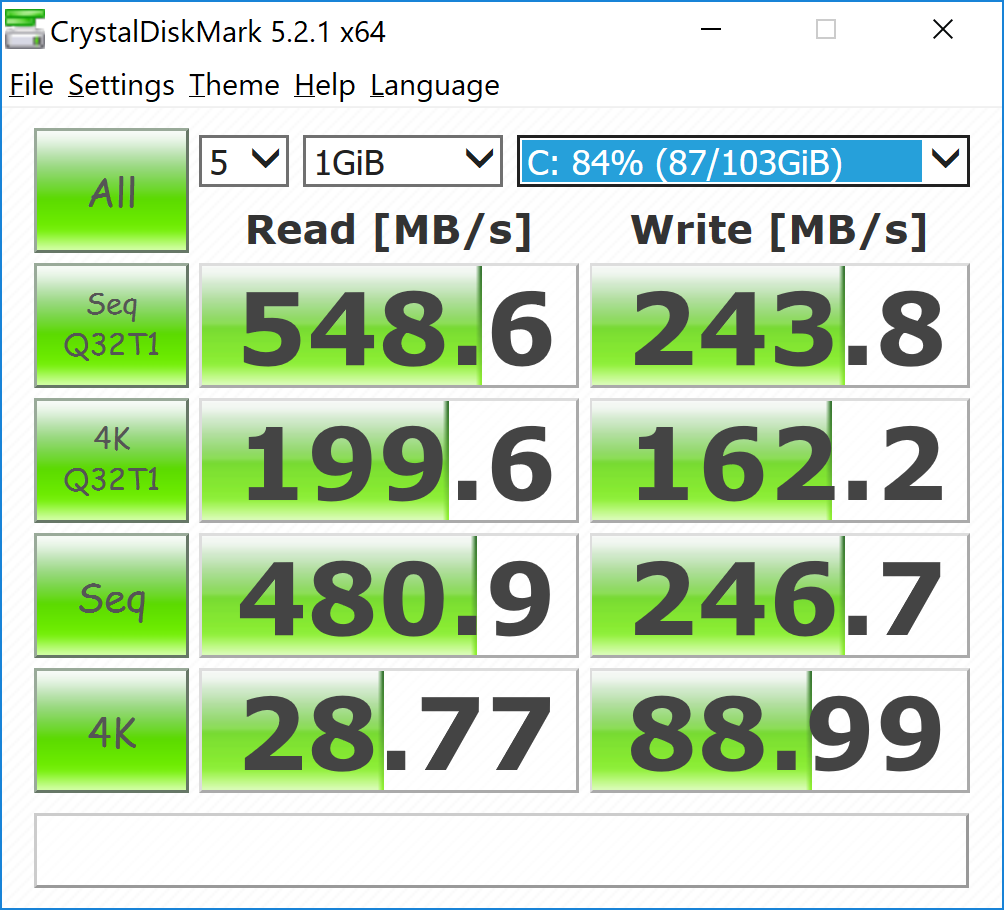
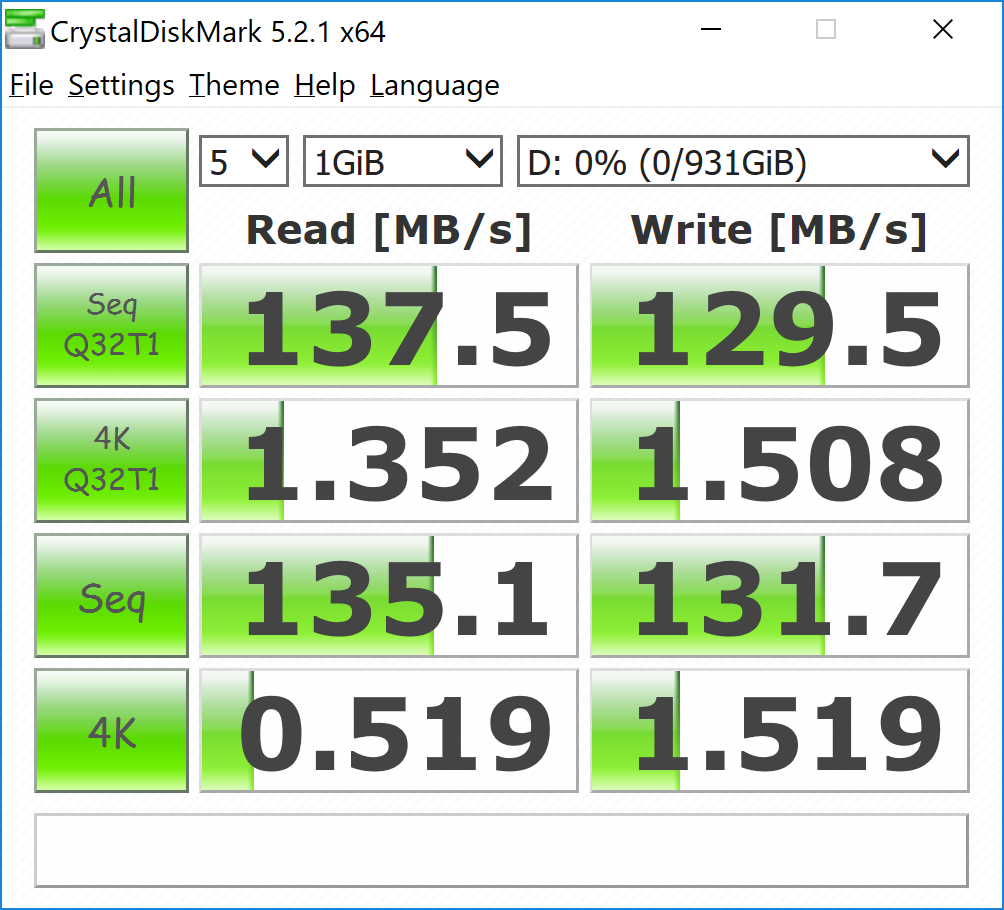
| Dell Inspiron 15 7000 7577 4K SK hynix SC311 M.2 | Asus Zenbook Pro UX550VE-DB71T Samsung PM961 NVMe MZVLW512HMJP | MSI GF62VR 7RF-877 Intel SSD 600p SSDPEKKW256G7 | Dell Inspiron 15 7000 7577 Samsung PM961 MZVLW256HEHP | Average SK hynix SC311 M.2 | |
|---|---|---|---|---|---|
| AS SSD | 337% | 114% | 207% | 1% | |
| Copy Game MB/s (MB/s) | 185.4 | 477.1 157% | 471.7 154% | 382.5 106% | 164.3 ? -11% |
| Copy Program MB/s (MB/s) | 142.2 | 294.6 107% | 286.5 101% | 274.8 93% | 138.6 ? -3% |
| Copy ISO MB/s (MB/s) | 363.6 | 1269 249% | 1069 194% | 814 124% | 246 ? -32% |
| Score Total (Points) | 578 | 3721 544% | 1324 129% | 2405 316% | 639 ? 11% |
| Score Write (Points) | 227 | 1421 526% | 693 205% | 594 162% | 228 ? 0% |
| Score Read (Points) | 234 | 1541 559% | 448 91% | 1241 430% | 273 ? 17% |
| Access Time Write * (ms) | 0.058 | 0.034 41% | 0.03 48% | 0.037 36% | 0.058 ? -0% |
| Access Time Read * (ms) | 0.126 | 0.054 57% | 0.09 29% | 0.058 54% | 0.1233 ? 2% |
| 4K-64 Write (MB/s) | 127.2 | 1160 812% | 551 333% | 375.8 195% | 131.4 ? 3% |
| 4K-64 Read (MB/s) | 156.6 | 1269 710% | 280.1 79% | 929 493% | 196.5 ? 25% |
| 4K Write (MB/s) | 74 | 112.8 52% | 118.3 60% | 100.2 35% | 69.6 ? -6% |
| 4K Read (MB/s) | 26.24 | 51 94% | 31.27 19% | 46.95 79% | 26.3 ? 0% |
| Seq Write (MB/s) | 259.9 | 1475 468% | 234.9 -10% | 1181 354% | 270 ? 4% |
| Seq Read (MB/s) | 508 | 2208 335% | 1371 170% | 2652 422% | 504 ? -1% |
* ... smaller is better

GPU Performance
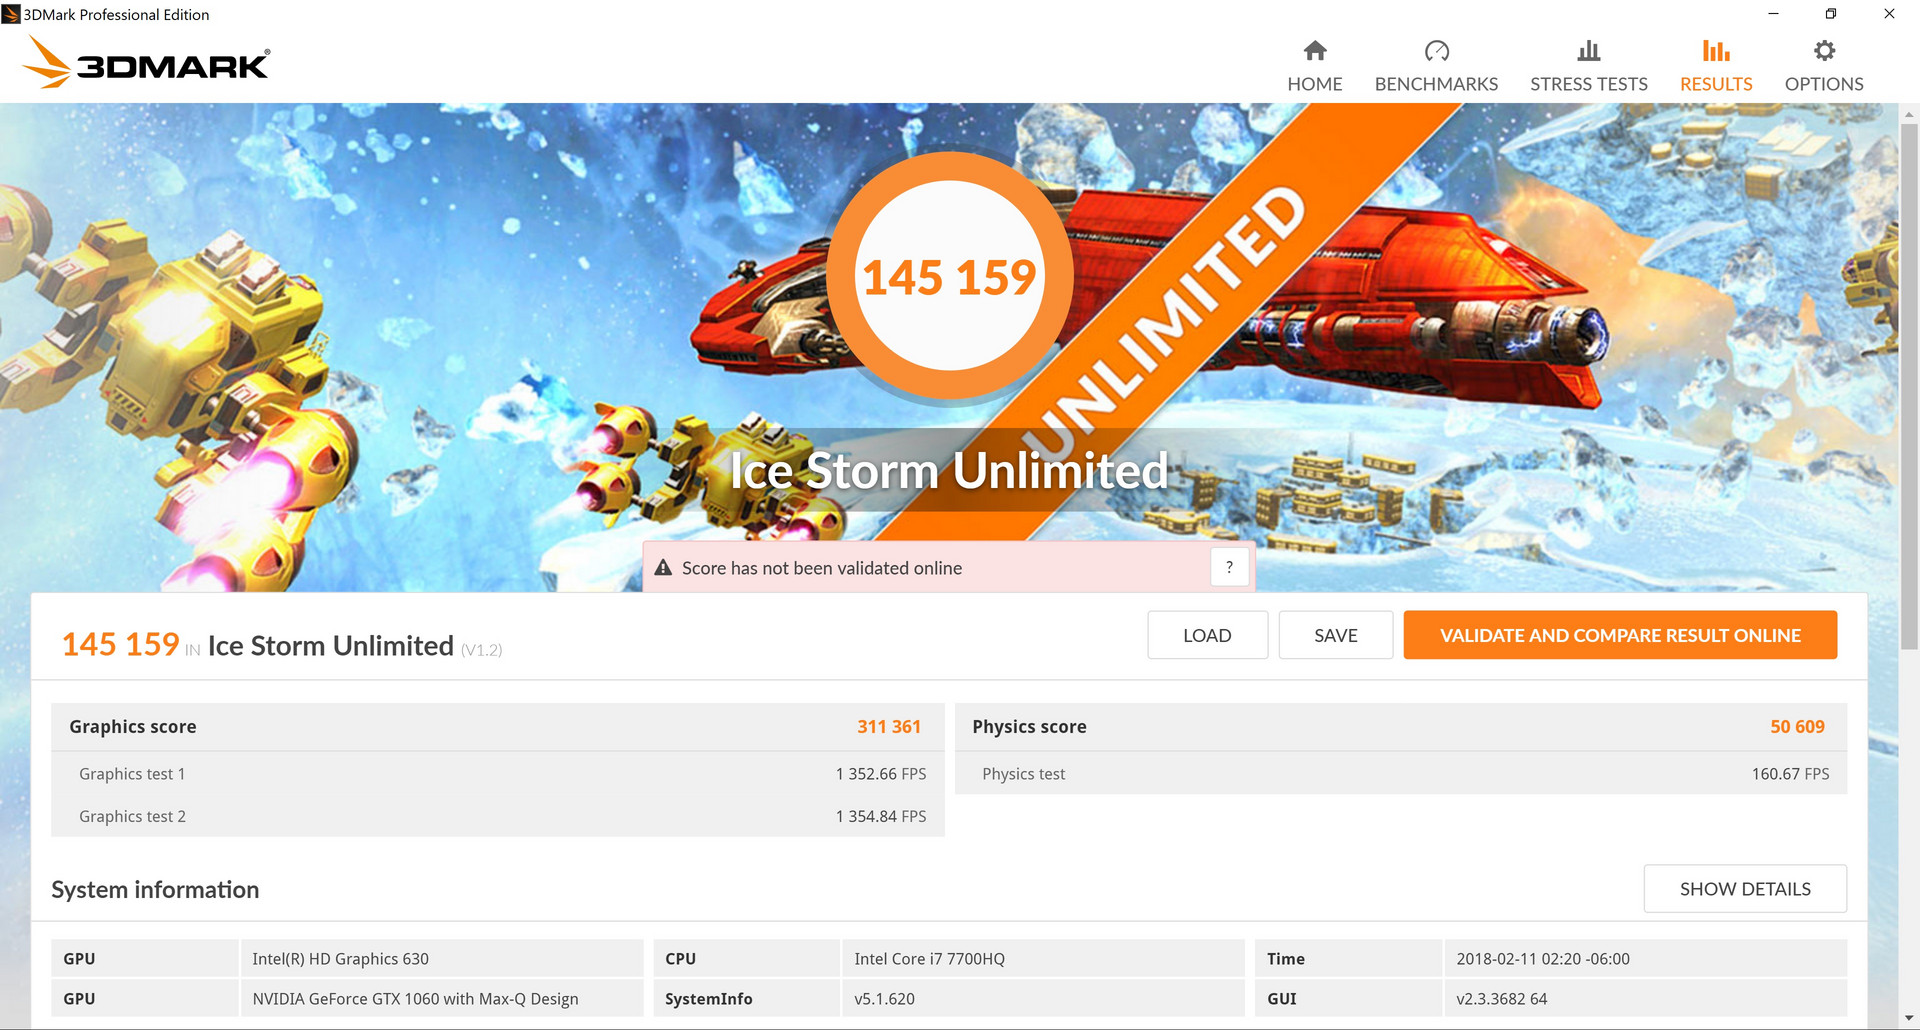
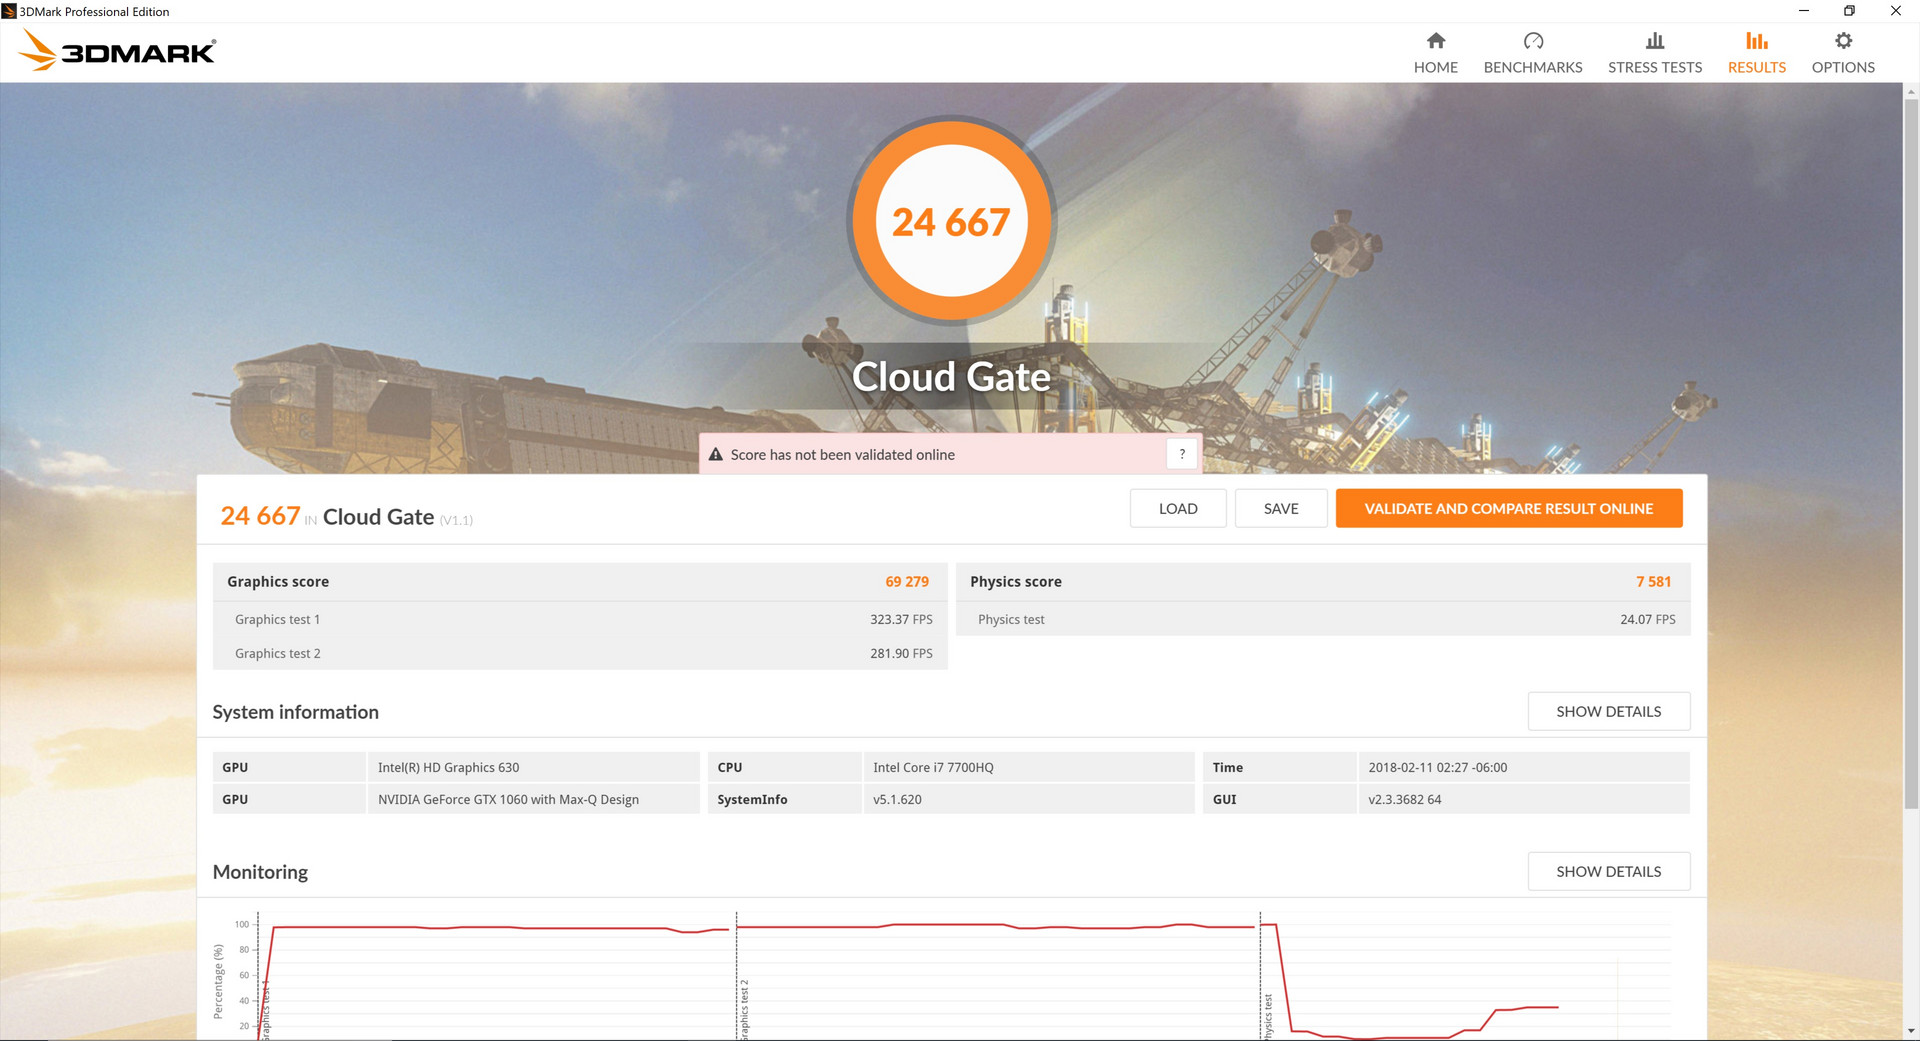
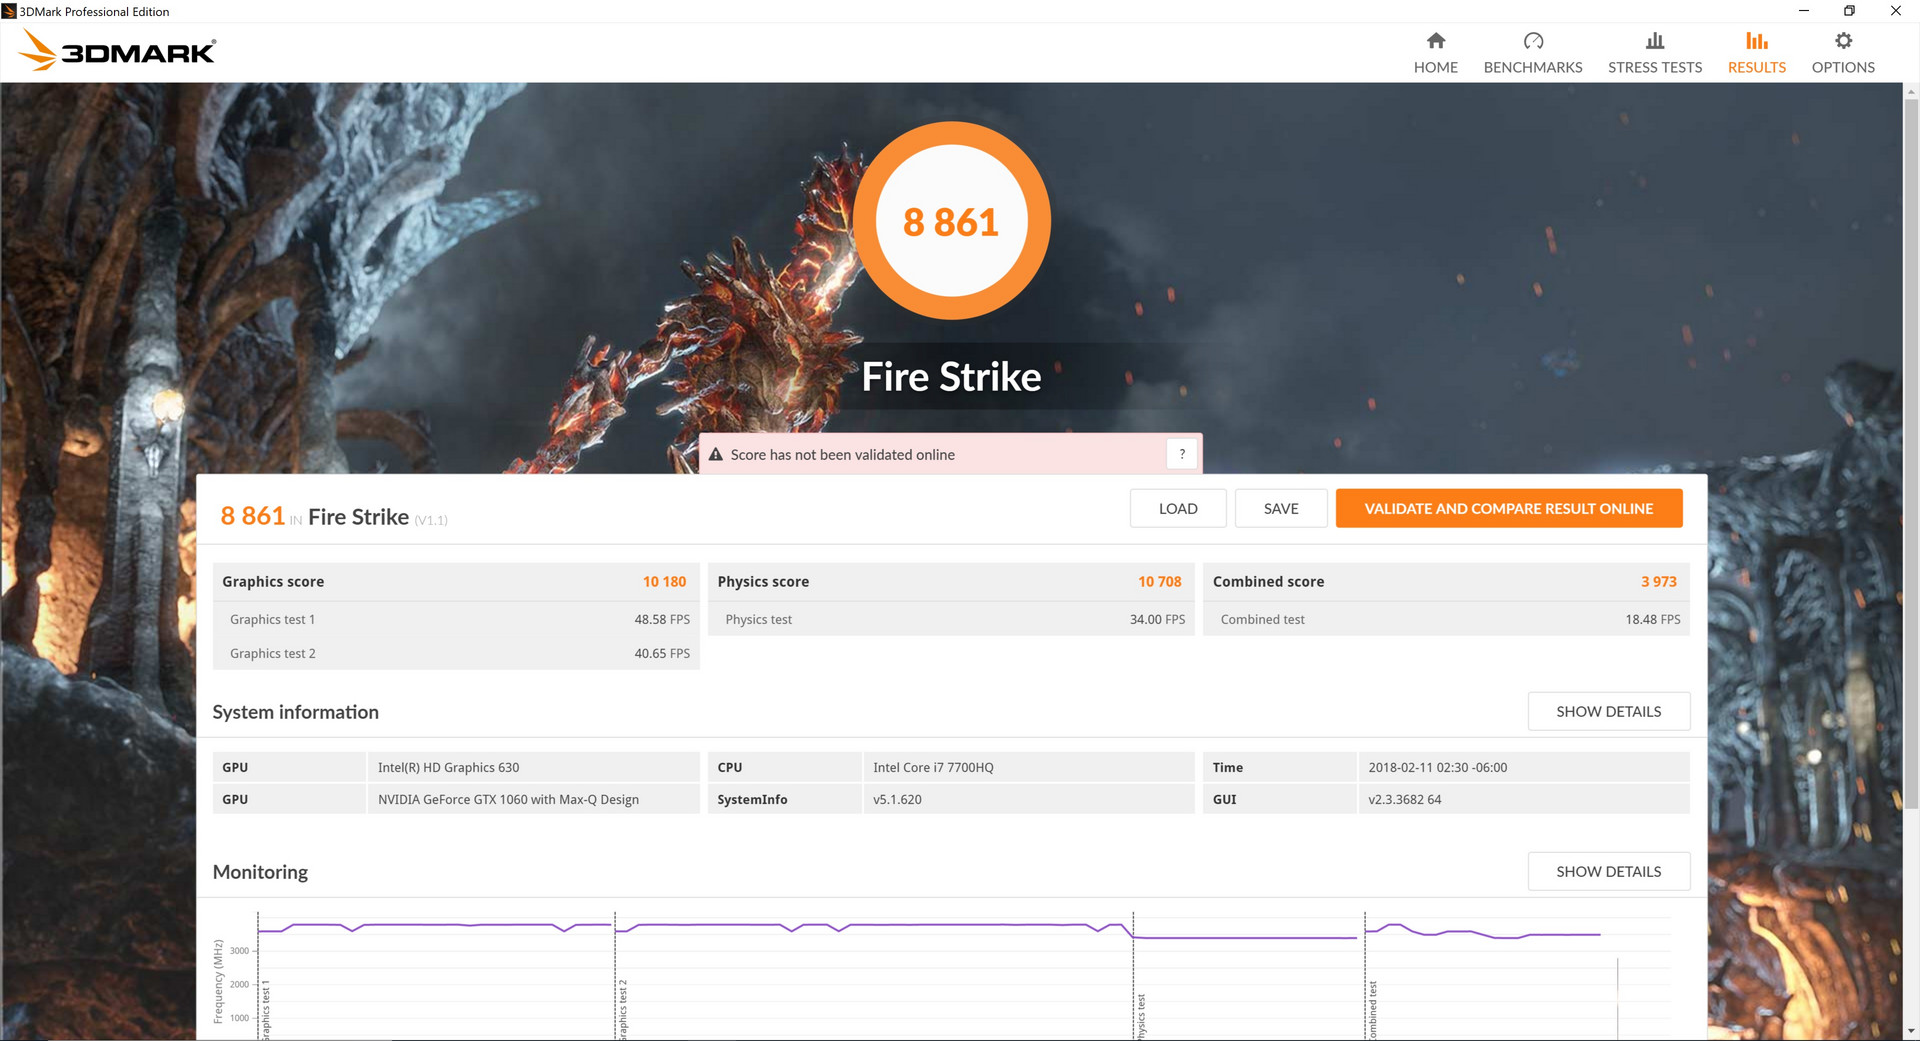
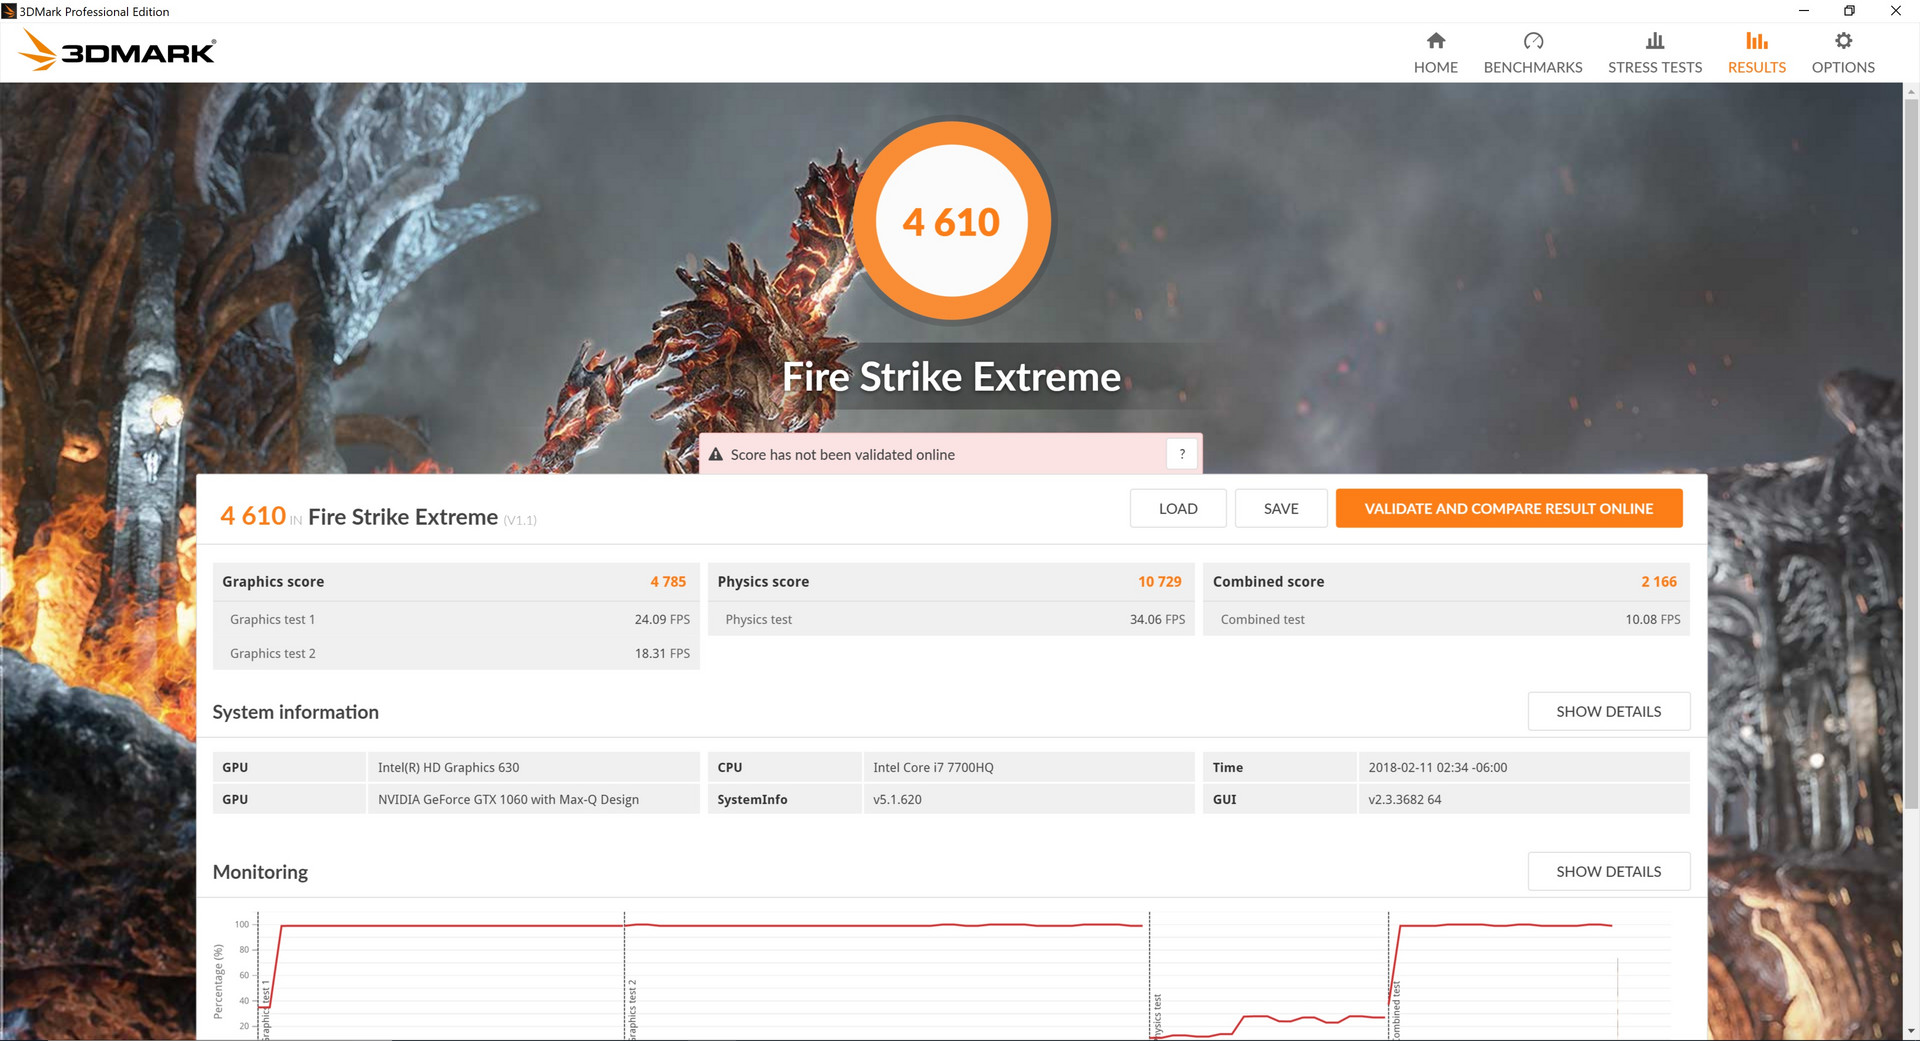
The GTX 1060 Max-Q is about 10 percent slower than the standard GTX 1060 for laptops according to 3DMark benchmarks. Choosing the Max-Q option over the GTX 1050 Ti configuration will net users a rough 25 to 30 percent boost in GPU power while the jump from the GTX 1050 would be even larger at 70 to 115 percent depending on the resolution.
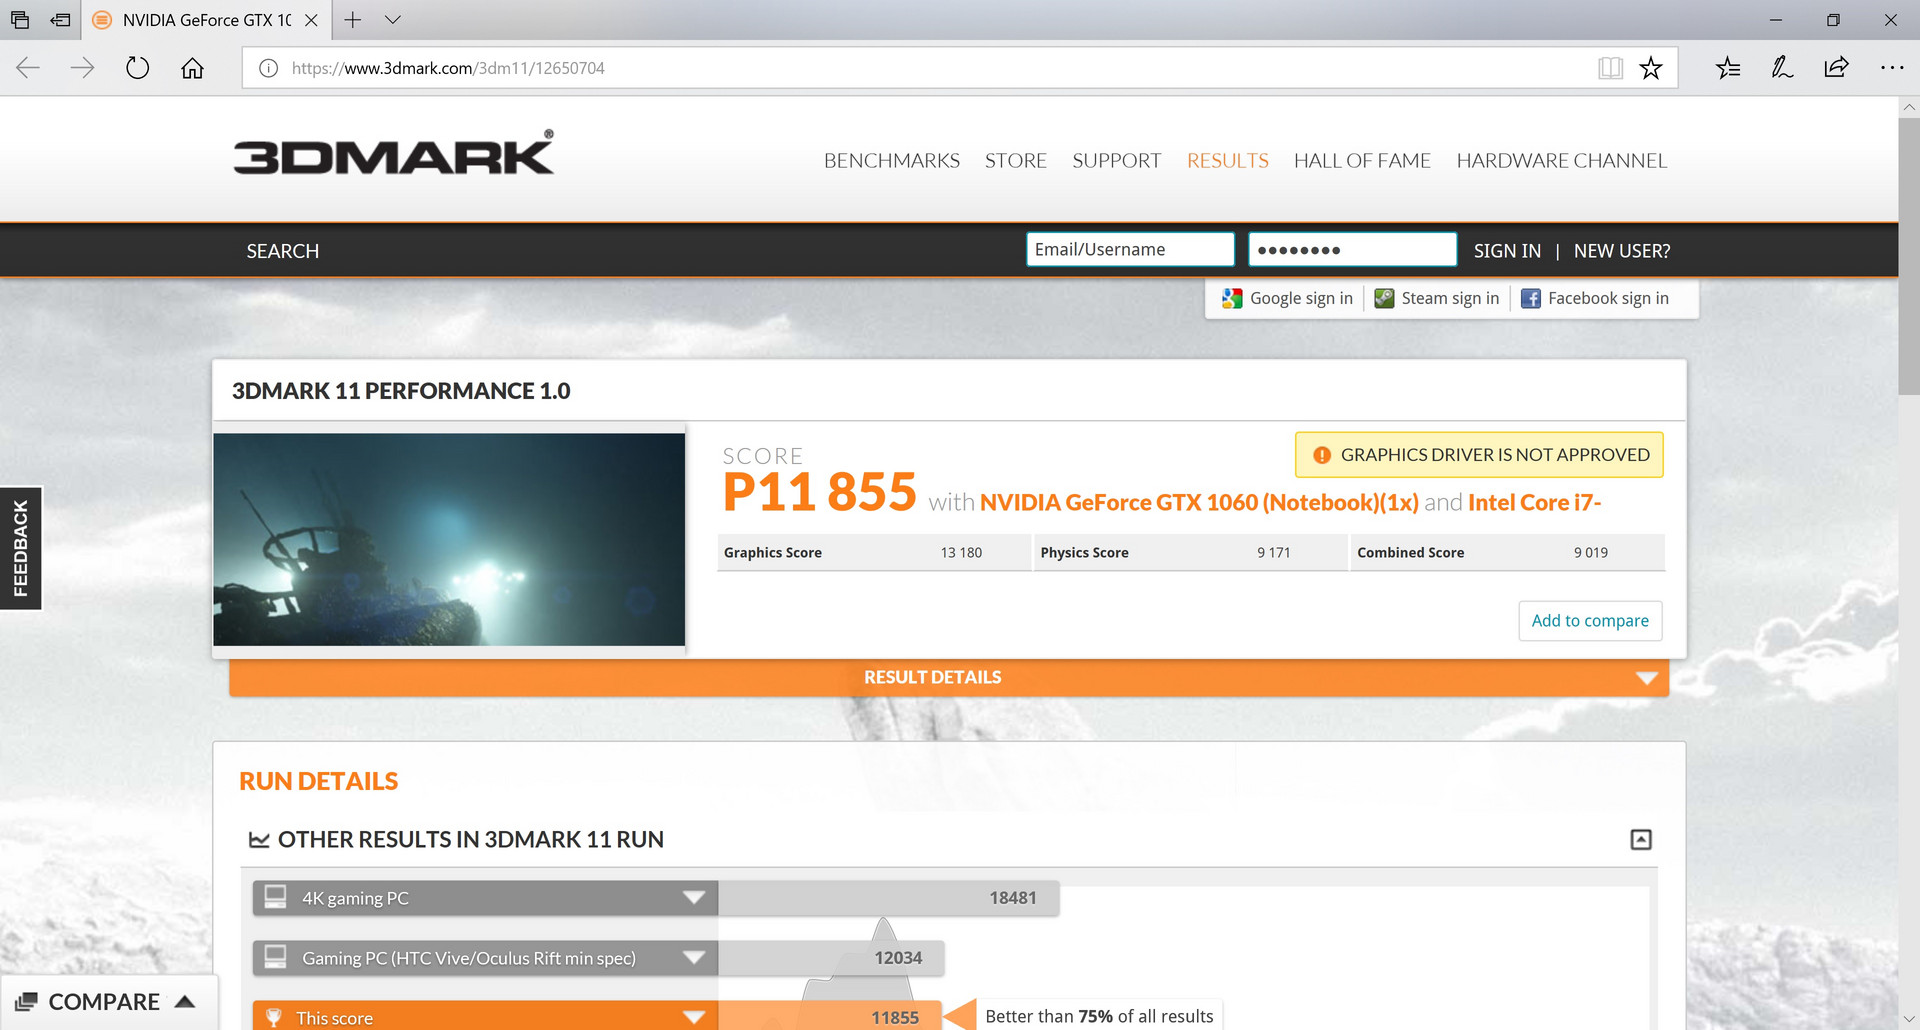
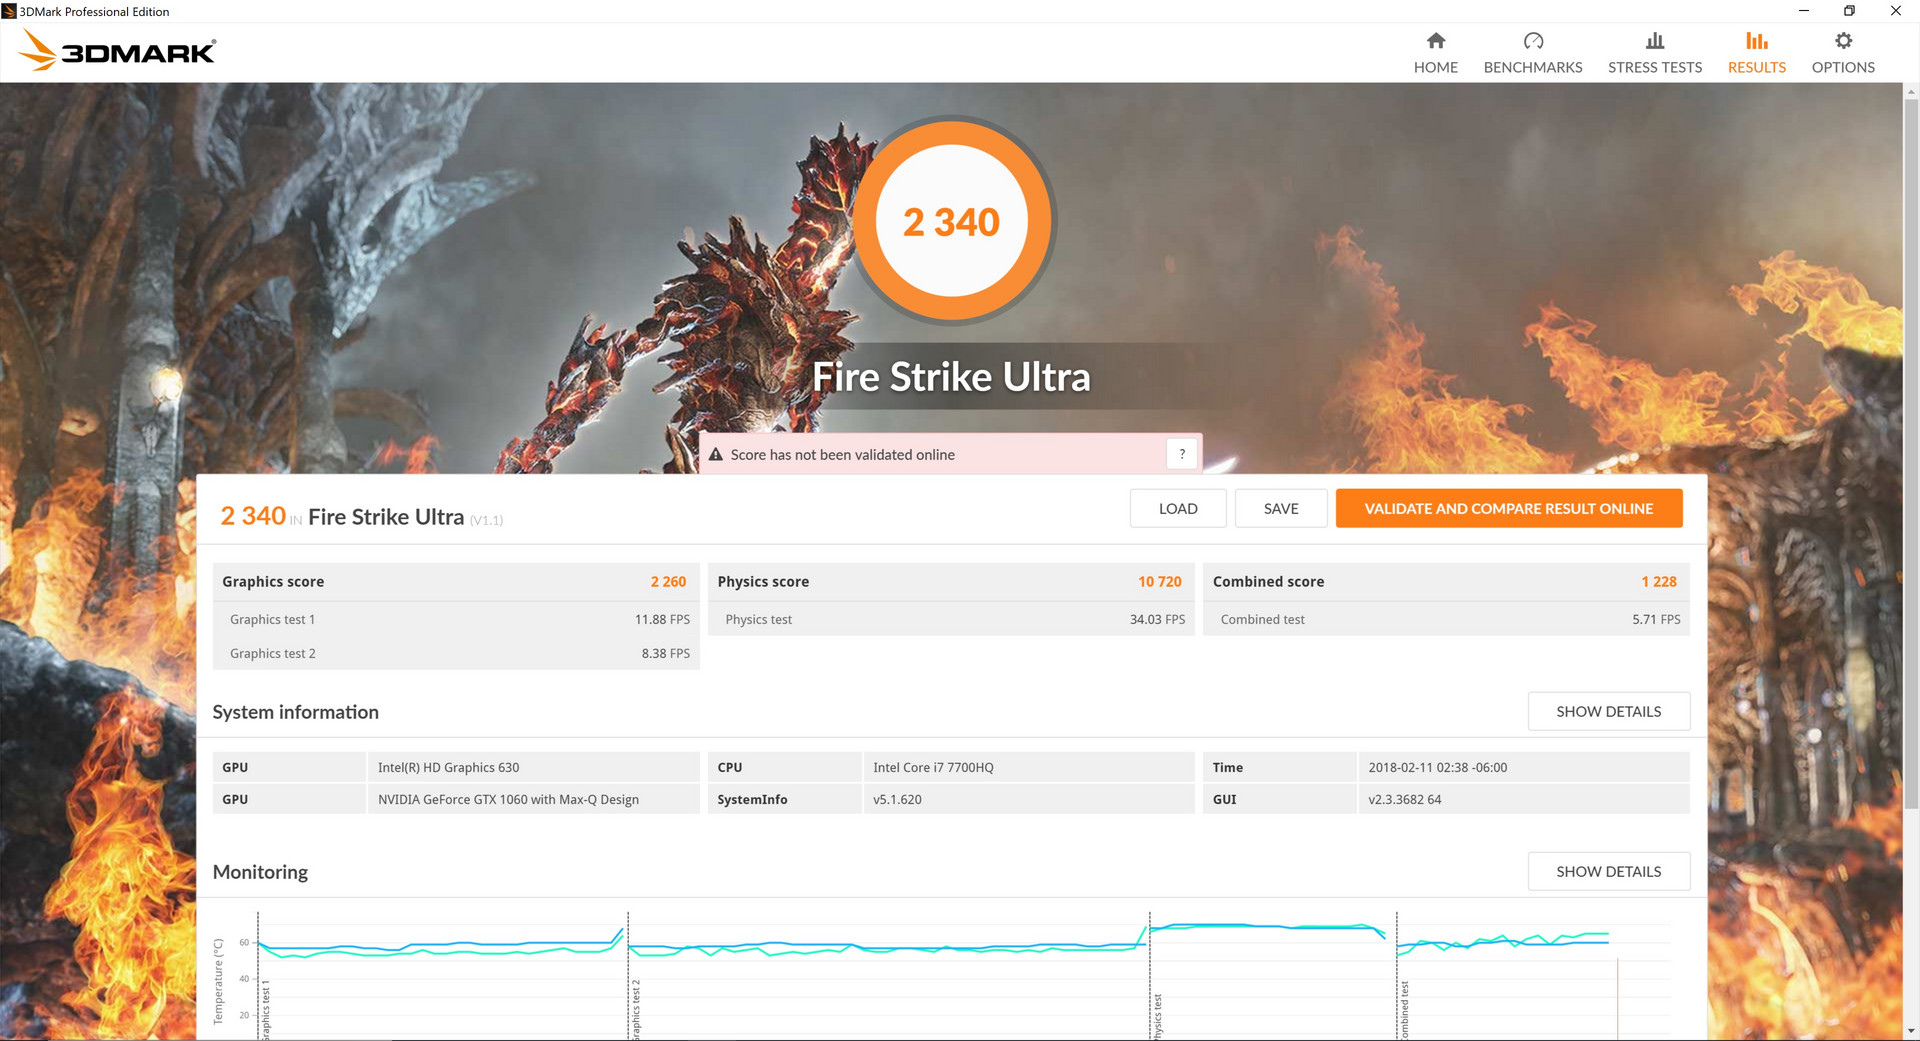
| 3DMark 11 Performance | 11855 points | |
| 3DMark Ice Storm Standard Score | 84441 points | |
| 3DMark Cloud Gate Standard Score | 24667 points | |
| 3DMark Fire Strike Score | 8861 points | |
| 3DMark Fire Strike Extreme Score | 4610 points | |
Help | ||
Gaming Performance
The additional horsepower provided by the GTX 1060 Max-Q over the GTX 1050 or 1050 Ti allows users to play modern titles at 1080p60 at Medium to High settings. Less intensive titles like Overwatch or DOTA 2 will perform even better and have more impressive results at the native 4K UHD resolution. Unfortunately, most titles perform poorly at native 4K UHD including Rise of the Tomb Raider and Destiny 2. The GTX 1060 Max-Q pairs best with FHD panels much like on the original GTX 1060.
See our dedicated page on the GeForce GTX 1060 Max-Q for more technical information and benchmark comparisons.
| low | med. | high | ultra | 4K | |
|---|---|---|---|---|---|
| BioShock Infinite (2013) | 100.4 | ||||
| Metro: Last Light (2013) | 74 | ||||
| Thief (2014) | 70.4 | ||||
| The Witcher 3 (2015) | 70.1 | 36.8 | 24.4 | ||
| Batman: Arkham Knight (2015) | 129 | 81 | 53 | 26 | |
| Metal Gear Solid V (2015) | 60 | 60 | 42 | ||
| Fallout 4 (2015) | 78.4 | 64.6 | 25.8 | ||
| Rise of the Tomb Raider (2016) | 45.3 | 22.8 | |||
| Ashes of the Singularity (2016) | 59.8 | 52.9 | 21 | ||
| Overwatch (2016) | 165.8 | 102 | 50.3 | ||
| Prey (2017) | 120 | 101 | 34.6 | ||
| Dirt 4 (2017) | 119.5 | 84.9 | 48.3 | 28.8 | |
| F1 2017 (2017) | 98 | 60 | 26 | ||
| Middle-earth: Shadow of War (2017) | 82 | 60 | 46 | 17 | |
| Destiny 2 (2017) | 94.7 | 85.4 | 71.4 | 17.6 | |
| Final Fantasy XV Benchmark (2018) | 73 | 47.2 | 33.9 | 14.6 |
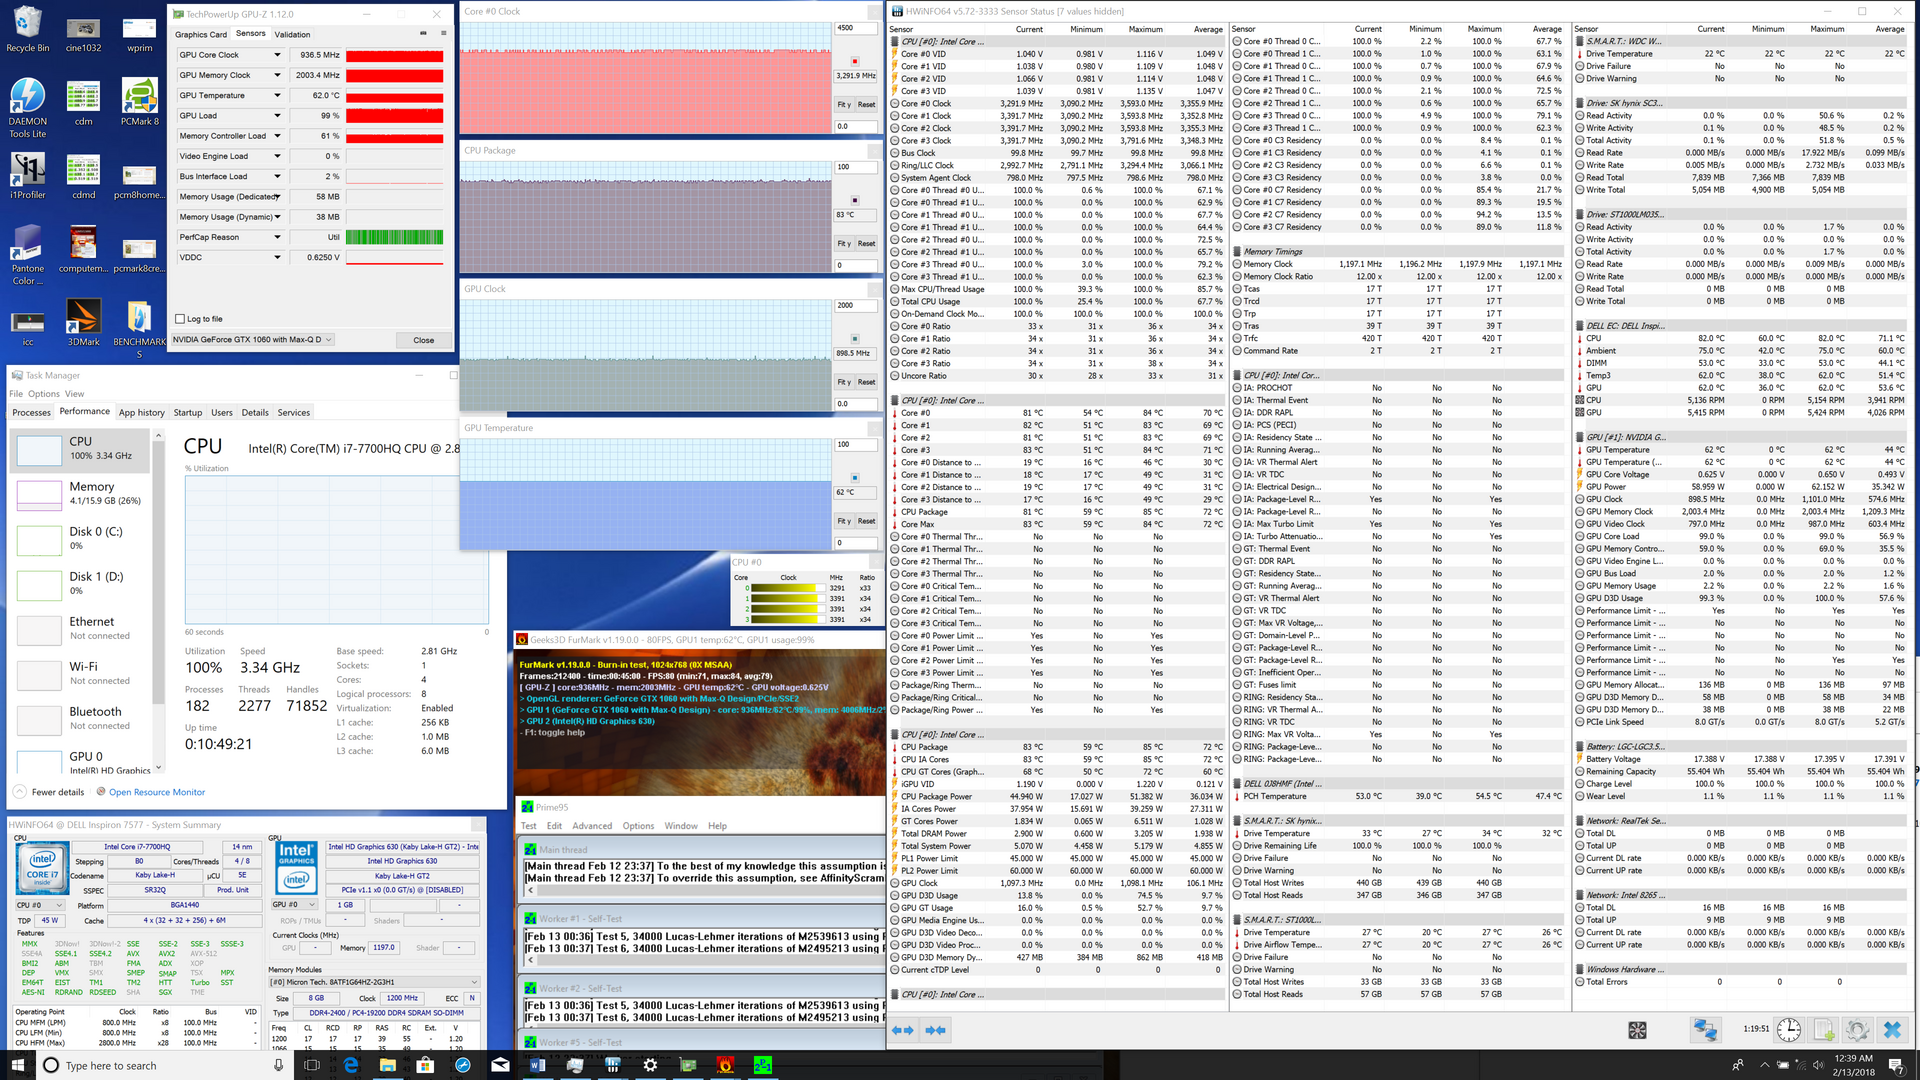
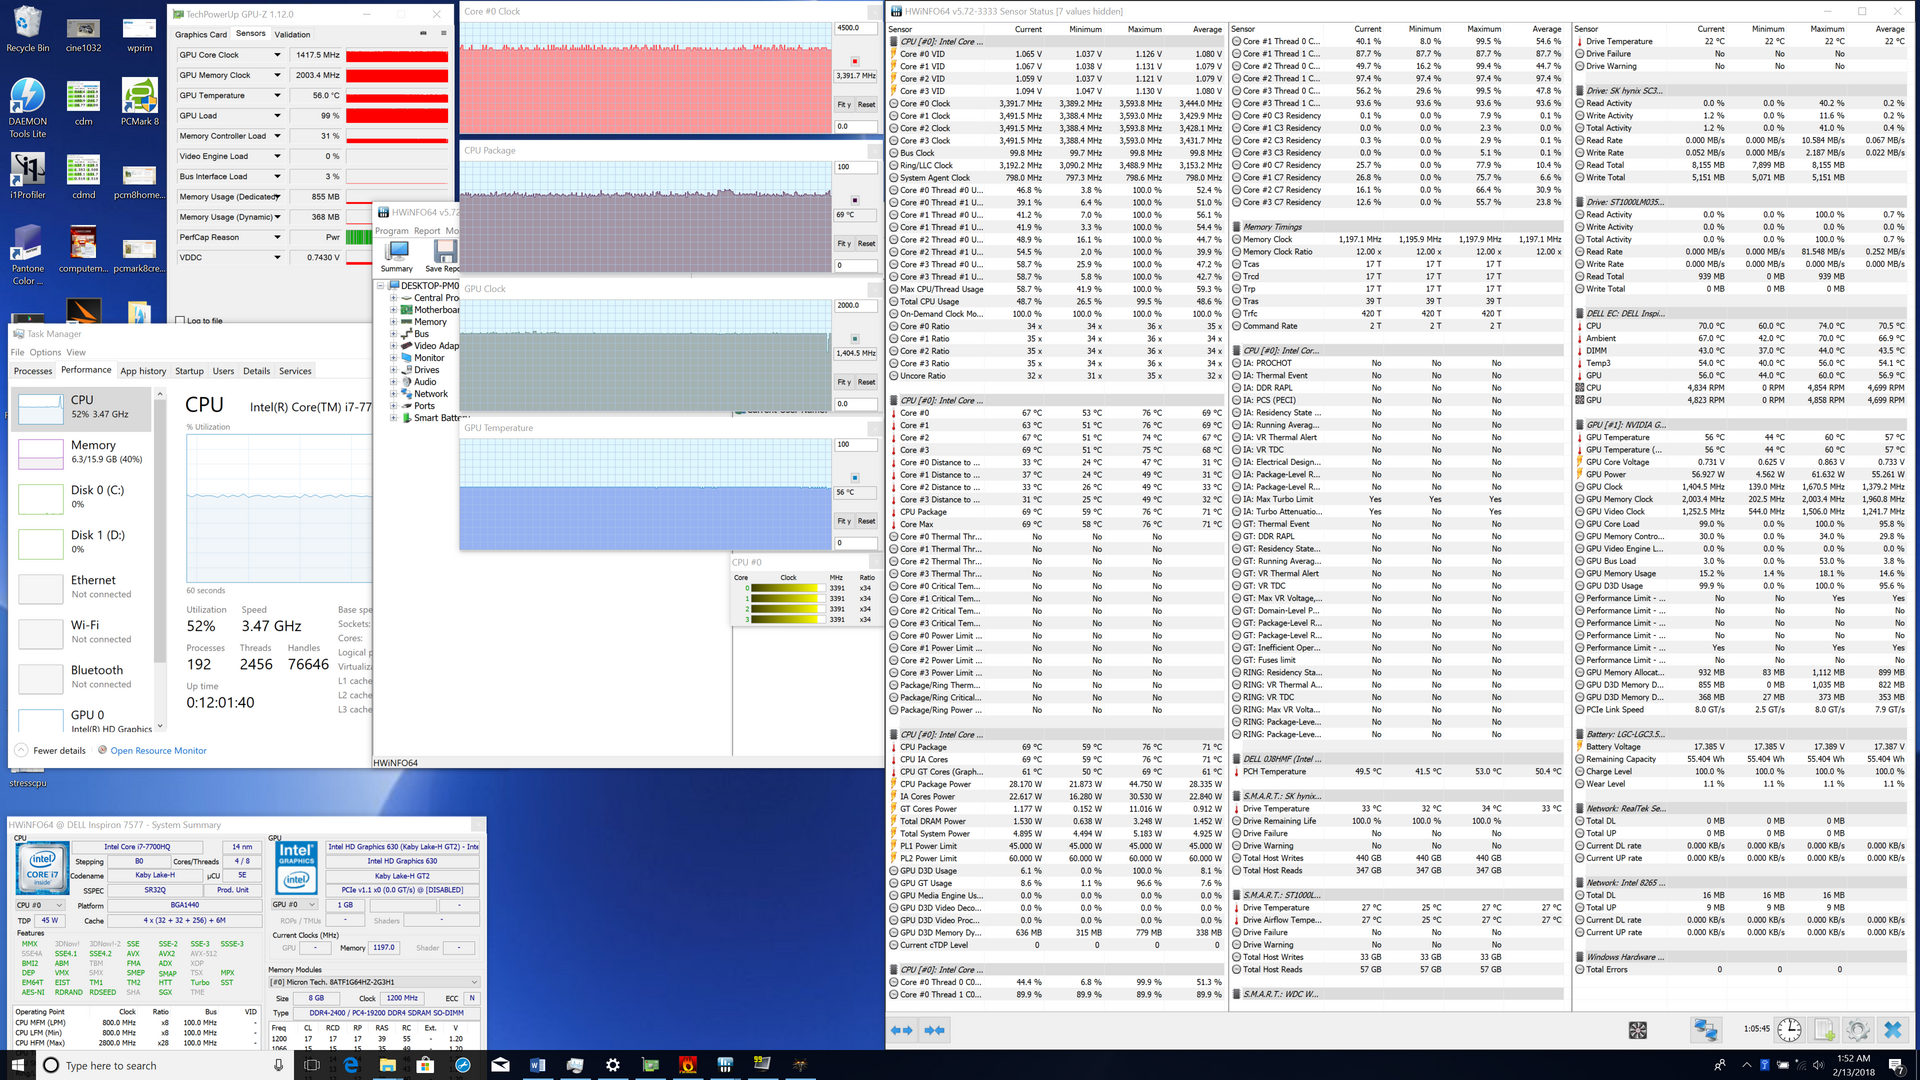
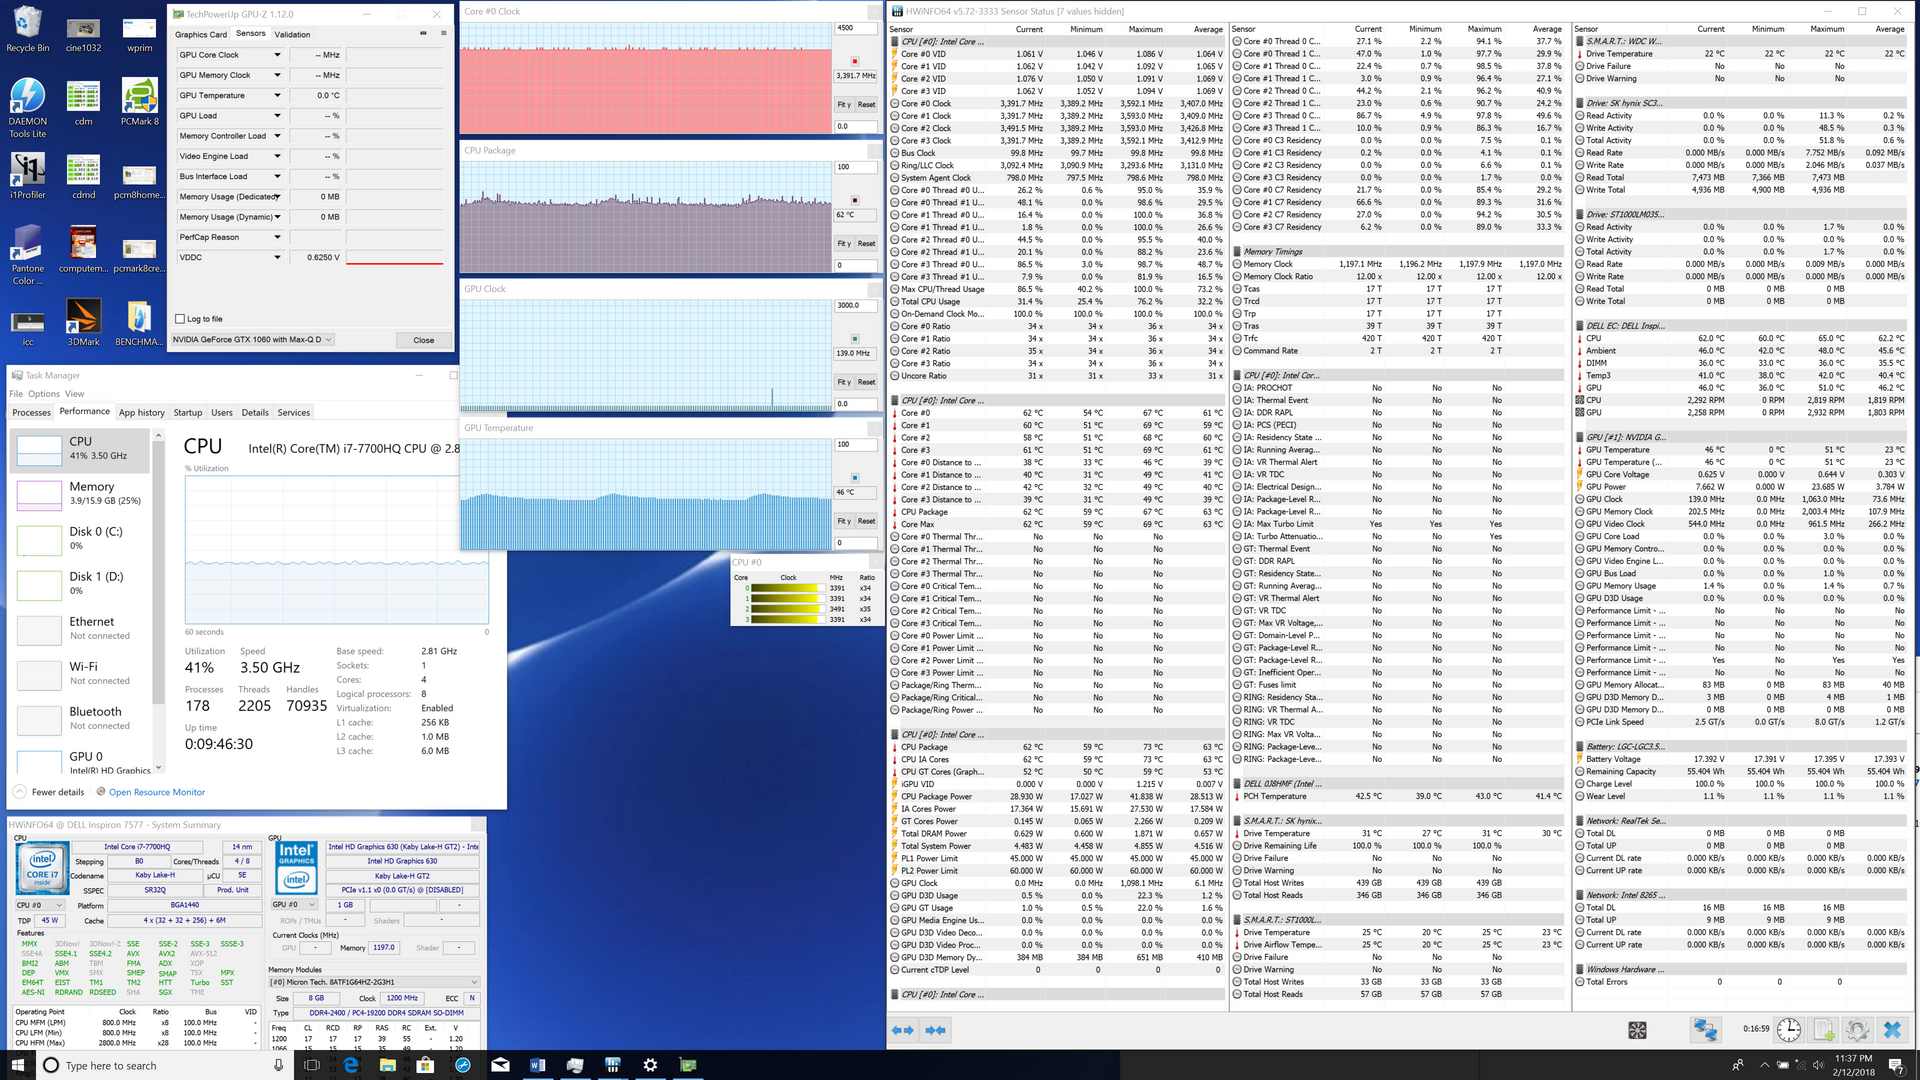
Stress Test
We stress the notebook with synthetic benchmarks to identify for any throttling or stability issues. When subjected to Prime95 loads, we can observe a steady CPU clock rate and temperature of 3.2 GHz and 67 C, respectively. Running both Prime95 and FurMark will impressively result in a steady CPU temperature of 83 C without affecting clock rate. Core CPU and GPU temperatures are quite low at under 70 C when gaming for extended periods.
Much like our other Inspiron 15 7577 configurations, running on battery power will limit CPU and GPU performance and so AC power is recommended when gaming.

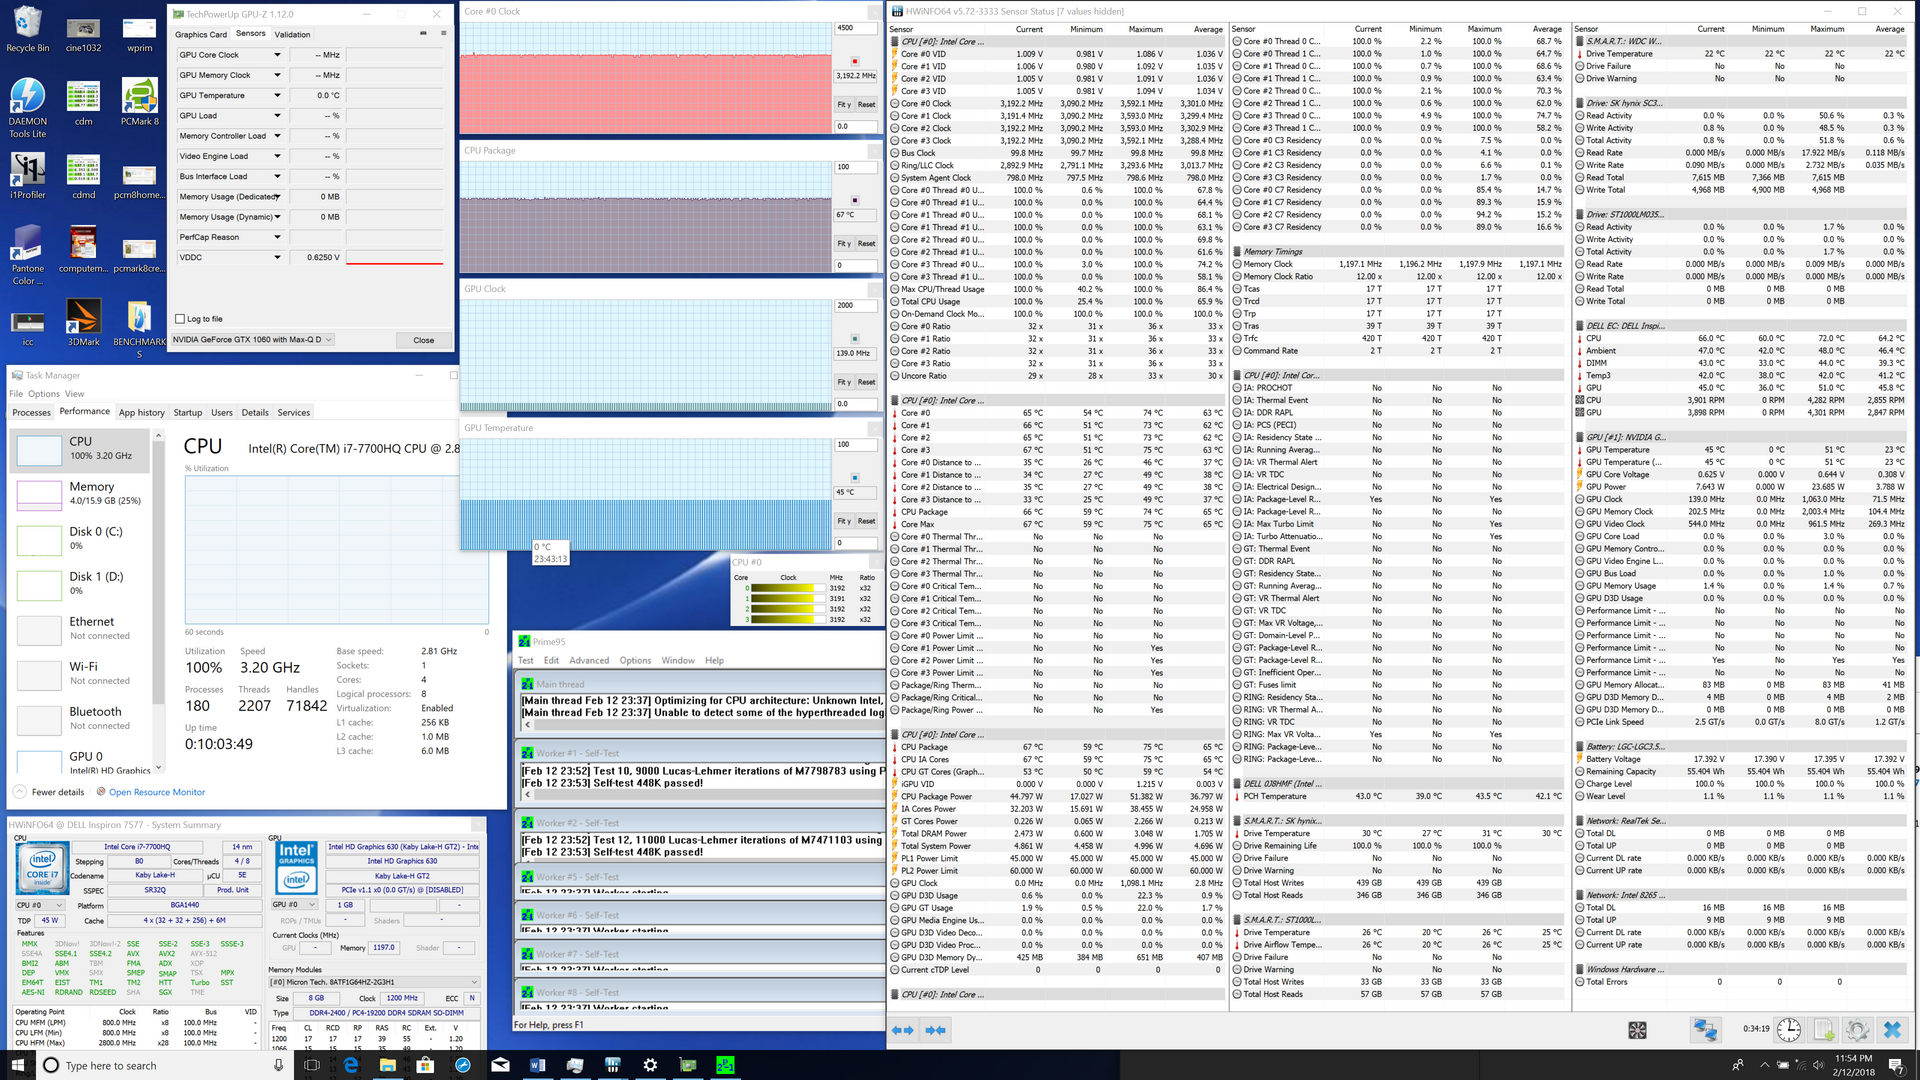
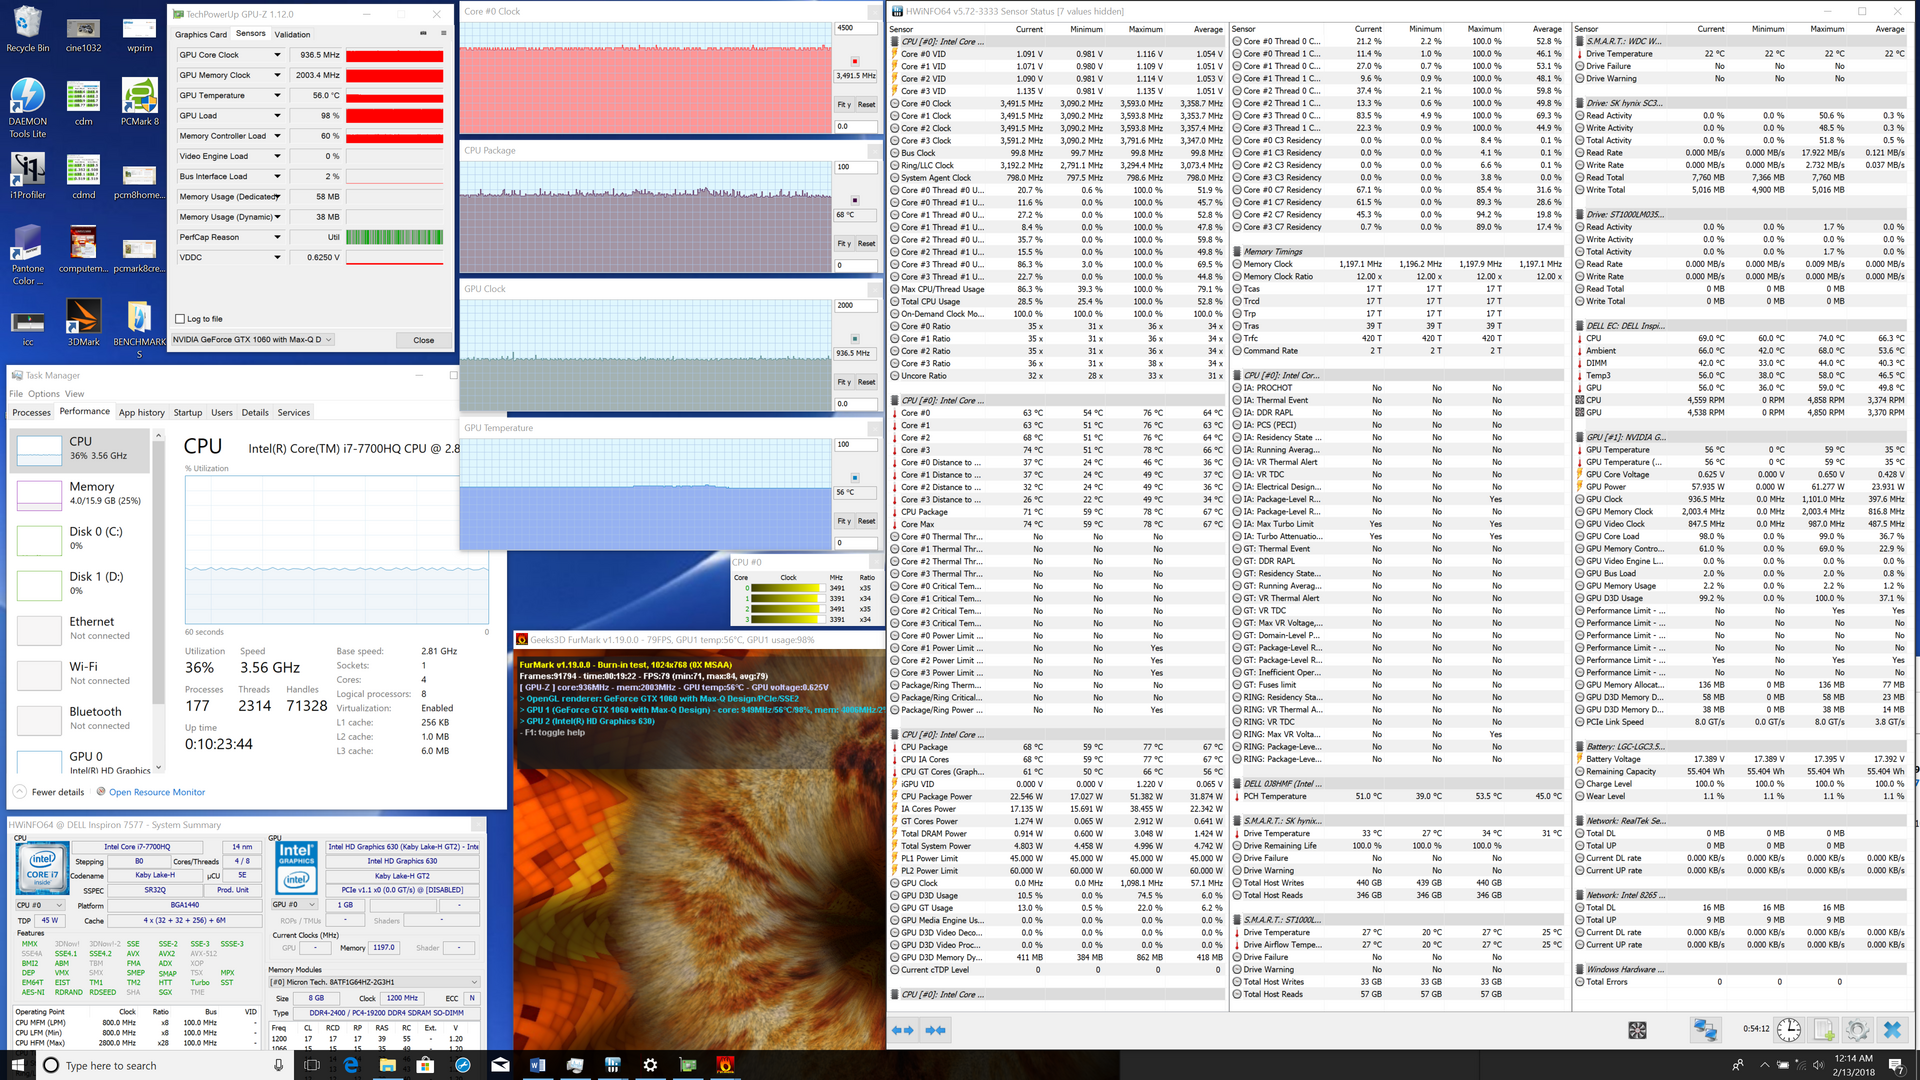
| CPU Clock (GHz) | GPU Clock (MHz) | Average CPU Temperature (°C) | Average GPU Temperature (°C) | |
| Prime95 Stress | 3.2 | -- | 67 | 45 |
| FurMark Stress | -- | 937 | 68 | 56 |
| Prime95 + FurMark Stress | 3.3 | 899 | 83 | 62 |
| Witcher 3 Stress | 3.4 | 1405 | 69 | 56 |
Emissions
System Noise
Fan behavior is not dissimilar to the lower-end Inspiron 15 7577 SKUs despite our system carrying a faster GTX 1060 Max-Q GPU. Both system fans remain idle during low processing loads for near-silent operation save for the barely audible HDD. Gaming loads will bump fan noise up to 40 dB(A) as defined by Nvidia's stringent Max-Q specifications. Gaming for longer periods, however, may induce faster RPMs. For example, running Witcher 3 for just 10 to 15 minutes resulted in a noticeably louder fan noise of 44 dB(A). Although not as loud as most thin-and-light gaming notebooks where 50 dB(A) is attainable, we would've preferred an option for slightly warmer core temperatures if it had meant quieter fan noise since the processors have some thermal headroom as our Stress Test section shows.
Our specific unit suffers from no coil whine or electronic noise.
Noise level
| Idle |
| 28.8 / 29.2 / 29.2 dB(A) |
| Load |
| 34.6 / 49.3 dB(A) |
 | ||
30 dB silent 40 dB(A) audible 50 dB(A) loud |
||
min: | ||
| Dell Inspiron 15 7000 7577 4K GeForce GTX 1060 Max-Q, i7-7700HQ, SK hynix SC311 M.2 | Asus Zenbook Pro UX550VE-DB71T GeForce GTX 1050 Ti Mobile, i7-7700HQ, Samsung PM961 NVMe MZVLW512HMJP | Acer Swift 3 SF315-41-R4W1 Vega 8, R5 2500U, Intel SSD 600p SSDPEKKW256G7 | Dell Inspiron 15 7000 7577 GeForce GTX 1050 Mobile, i5-7300HQ, Seagate Mobile HDD 1TB ST1000LX015-1U7172 | Asus Zephyrus GX501 GeForce GTX 1080 Max-Q, i7-7700HQ, Samsung SSD SM961 1TB M.2 MZVKW1T0HMLH | MSI GE63VR 7RF Raider GeForce GTX 1070 Mobile, i7-7700HQ, Toshiba HG6 THNSNJ256G8NY | |
|---|---|---|---|---|---|---|
| Noise | -6% | -1% | -5% | -7% | -20% | |
| off / environment * (dB) | 28.5 | 28.3 1% | 31.8 -12% | 31 -9% | 31 -9% | 30 -5% |
| Idle Minimum * (dB) | 28.8 | 30.4 -6% | 31.8 -10% | 32.7 -14% | 32 -11% | 33 -15% |
| Idle Average * (dB) | 29.2 | 31 -6% | 32.1 -10% | 32.7 -12% | 33 -13% | 35 -20% |
| Idle Maximum * (dB) | 29.2 | 31.2 -7% | 32.1 -10% | 32.7 -12% | 34 -16% | 40 -37% |
| Load Average * (dB) | 34.6 | 43.3 -25% | 33 5% | 38.7 -12% | 39 -13% | 48 -39% |
| Witcher 3 ultra * (dB) | 44.1 | 46.2 -5% | 39 12% | 42 5% | 50 -13% | |
| Load Maximum * (dB) | 49.3 | 46.2 6% | 34.8 29% | 44.6 10% | 46 7% | 55 -12% |
* ... smaller is better
Temperature
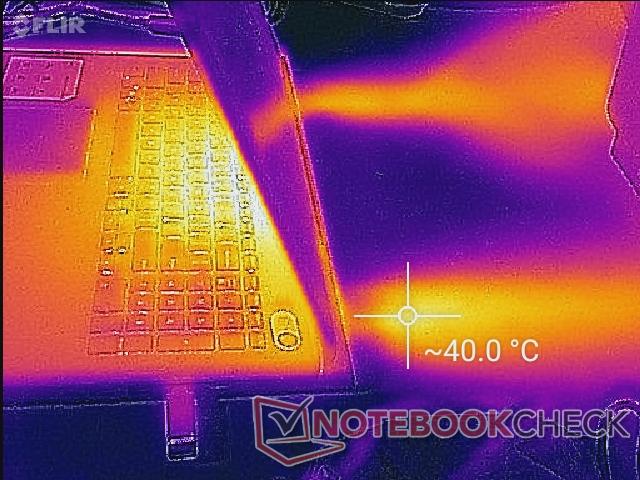
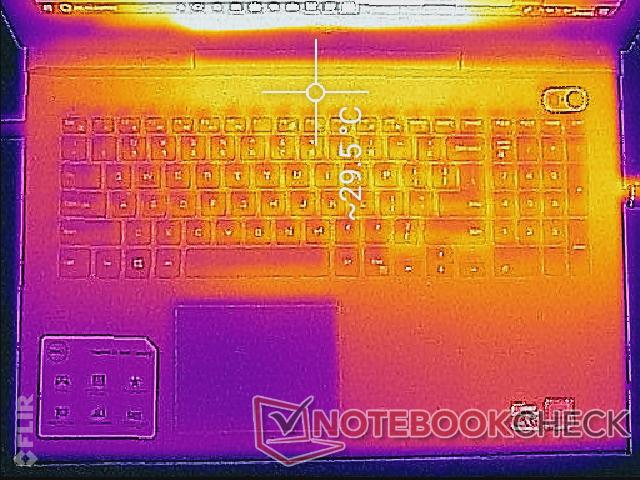
Surface temperatures around the palm rests, NumPad, and WASD keys remain relatively cool no matter the onscreen load due to the positioning of the cooling solution underneath. The hot spots are generally away from where users are more likely to touch.
Surfaces never become uncomfortably warm when gaming so long as the rear third of the notebook is properly set on a table and not one's lap. Be sure to leave ample space behind the notebook for ventilation.

(±) The maximum temperature on the upper side is 42.6 °C / 109 F, compared to the average of 40.4 °C / 105 F, ranging from 21.2 to 68.8 °C for the class Gaming.
(-) The bottom heats up to a maximum of 46.2 °C / 115 F, compared to the average of 43.3 °C / 110 F
(+) In idle usage, the average temperature for the upper side is 27.1 °C / 81 F, compared to the device average of 33.9 °C / 93 F.
(+) Playing The Witcher 3, the average temperature for the upper side is 28.9 °C / 84 F, compared to the device average of 33.9 °C / 93 F.
(+) The palmrests and touchpad are cooler than skin temperature with a maximum of 27.2 °C / 81 F and are therefore cool to the touch.
(±) The average temperature of the palmrest area of similar devices was 28.9 °C / 84 F (+1.7 °C / 3 F).
Energy Management
Power Consumption
When gaming, the Dell consumes just a few percentage Watts more than the GTX 1050 version of the same model and even competing systems with the GTX 1050 Ti like the Asus Zenbook Pro UX550VE. Considering that the GTX 1060 Max-Q offers a significantly larger boost in graphics performance than either of these GPUs, the very slight increase in power consumption seems to be a very fair trade off.
Running extreme loads at 100 percent CPU and GPU utilization will demand 130 W from a medium-sized AC adapter (~15 x 8 x 3 cm) rated for up to 180 W. This maximum sits comfortably between the GTX 1050 and GTX 1060 when all are subjected to similarly extreme loads.
| Off / Standby | |
| Idle | |
| Load |
|
Key:
min: | |
| Dell Inspiron 15 7000 7577 4K i7-7700HQ, GeForce GTX 1060 Max-Q, SK hynix SC311 M.2, IPS, 3840x2160, 15.6" | Asus Zenbook Pro UX550VE-DB71T i7-7700HQ, GeForce GTX 1050 Ti Mobile, Samsung PM961 NVMe MZVLW512HMJP, IPS, 1920x1080, 15.6" | Acer Swift 3 SF315-41-R4W1 R5 2500U, Vega 8, Intel SSD 600p SSDPEKKW256G7, IPS, 1920x1080, 15.6" | MSI GF62VR 7RF-877 i7-7700HQ, GeForce GTX 1060 Mobile, Intel SSD 600p SSDPEKKW256G7, TN LED, 1920x1080, 15.6" | Dell Inspiron 15 7000 7577 i5-7300HQ, GeForce GTX 1050 Mobile, Seagate Mobile HDD 1TB ST1000LX015-1U7172, IPS, 1920x1080, 15.6" | Asus Zephyrus GX501 i7-7700HQ, GeForce GTX 1080 Max-Q, Samsung SSD SM961 1TB M.2 MZVKW1T0HMLH, IPS, 1920x1080, 15.6" | |
|---|---|---|---|---|---|---|
| Power Consumption | 7% | 14% | -68% | 3% | -107% | |
| Idle Minimum * (Watt) | 5.5 | 6.3 -15% | 7.3 -33% | 16.2 -195% | 5.3 4% | 18 -227% |
| Idle Average * (Watt) | 10.5 | 7.9 25% | 9.7 8% | 18.2 -73% | 8.8 16% | 23 -119% |
| Idle Maximum * (Watt) | 10.9 | 8.1 26% | 13 -19% | 18.9 -73% | 9.7 11% | 31 -184% |
| Load Average * (Watt) | 72 | 84.9 -18% | 40.4 44% | 82.7 -15% | 100 -39% | 79 -10% |
| Witcher 3 ultra * (Watt) | 97.4 | 96.3 1% | 125.7 -29% | 87 11% | 148 -52% | |
| Load Maximum * (Watt) | 130.4 | 102.4 21% | 42.2 68% | 162.3 -24% | 109 16% | 196 -50% |
* ... smaller is better
Battery Life
Runtimes are shorter on the higher-end 4K UHD GTX 1060 Max-Q SKU compared to the lower-end FHD GTX 1050 SKU by about an hour when subjected to similar WLAN conditions. Users can expect about 5.5 hours of real-world WLAN use out of this configuration to be respectable for a gaming notebook.
| Dell Inspiron 15 7000 7577 4K i7-7700HQ, GeForce GTX 1060 Max-Q, 56 Wh | Asus Zenbook Pro UX550VE-DB71T i7-7700HQ, GeForce GTX 1050 Ti Mobile, 73 Wh | Acer Swift 3 SF315-41-R4W1 R5 2500U, Vega 8, 48 Wh | MSI GF62VR 7RF-877 i7-7700HQ, GeForce GTX 1060 Mobile, 41 Wh | Asus GL503VD-DB74 i7-7700HQ, GeForce GTX 1050 Mobile, 64 Wh | Dell Inspiron 15 7000 7577 i5-7300HQ, GeForce GTX 1050 Mobile, 56 Wh | |
|---|---|---|---|---|---|---|
| Battery runtime | 39% | 4% | -63% | -2% | 19% | |
| Reader / Idle (h) | 10 | 17.1 71% | 12.2 22% | 2.8 -72% | 10.8 8% | 11.1 11% |
| WiFi v1.3 (h) | 5.4 | 8.9 65% | 5.2 -4% | 1.9 -65% | 5.8 7% | 6.8 26% |
| Load (h) | 1.5 | 1.2 -20% | 1.4 -7% | 0.7 -53% | 1.2 -20% | 1.8 20% |
Pros
Cons
Verdict
For gaming purposes, a native 4K UHD panel is not the perfect fit for a system powered by the GTX 1060 Max-Q GPU. Unless if the notebook will be used exclusively for large spreadsheet work or undemanding games like Rocket League, LoL, Overwatch, or DOTA 2, then it becomes difficult to justify the exorbitant price premium of the 4K UHD panel over the standard FHD model. Users will need a much more powerful GPU to better exploit what 4K UHD has to offer.
If the above is not concerning, then potential buyers will be pleased to find that the 4K UHD panel is indeed brighter than the FHD model and with more accurate colors to boot. The same advantages and disadvantages of our existing Inspiron 15 7577 pages continue to apply here including the strong but heavy base, soft but quiet keyboard keys, and accessible internals.
The 4K UHD version of the Inspiron 15 7577 is superior to the FHD SKUs on paper, but gamers will be better off playing most titles at 1080p for which the GTX 1060 Max-Q was designed for.
Dell Inspiron 15 7000 7577 4K
- 02/19/2018 v6 (old)
Allen Ngo
Price comparison
