 Deutsch
 English
 Español
 Français
 Italiano
 Nederlands
 Polski
 Português
 Русский
 Türkçe
 Svenska
 Chinese
 Magyar
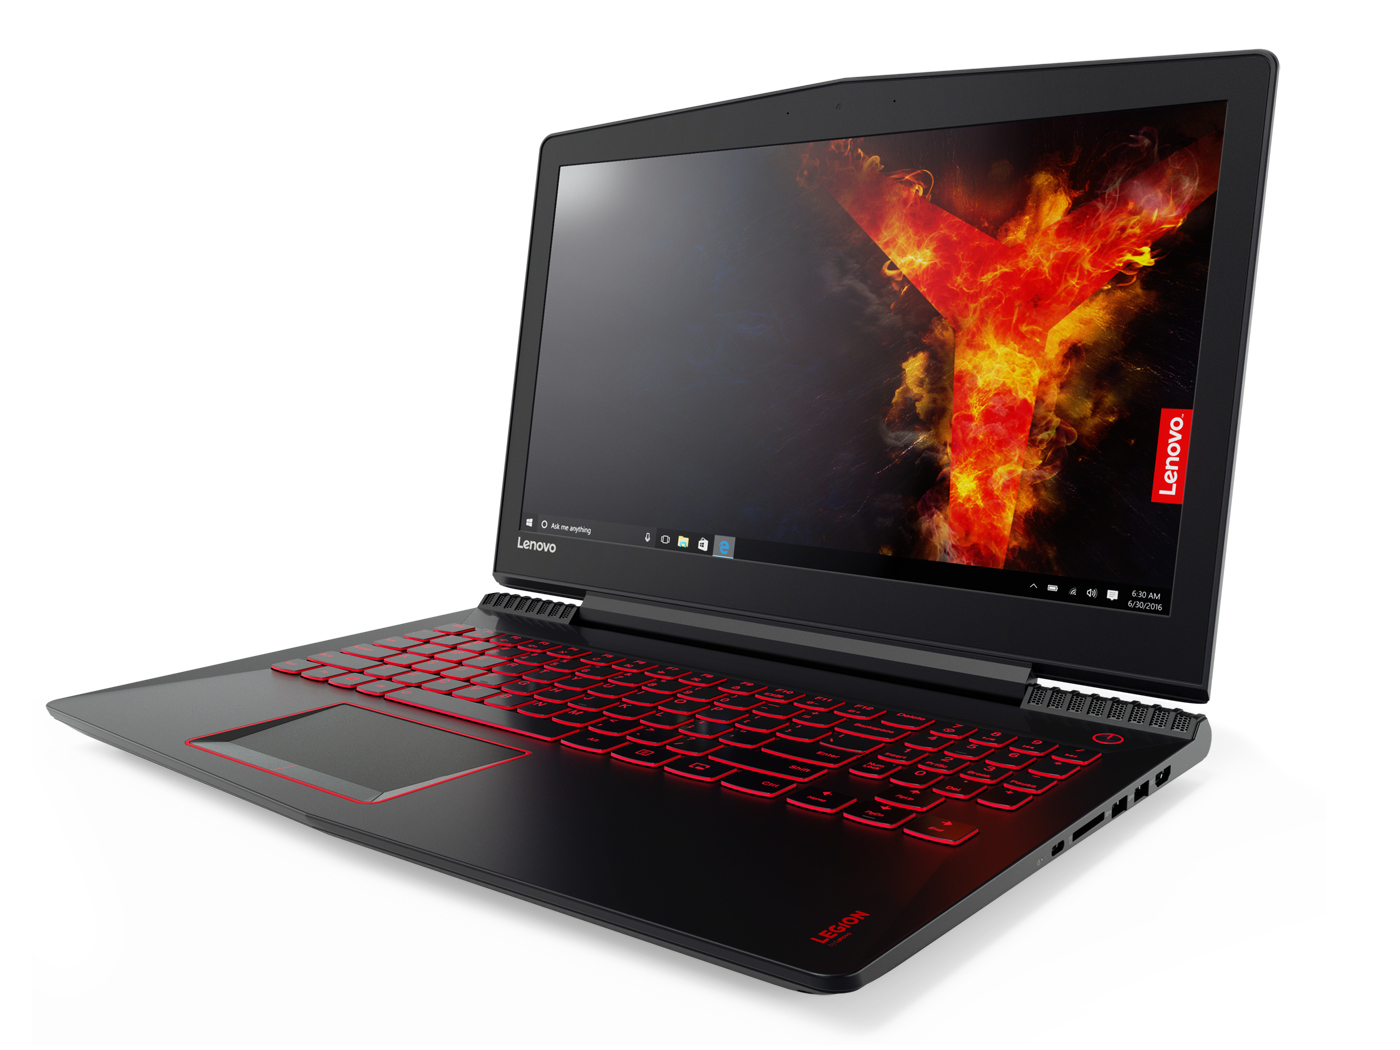
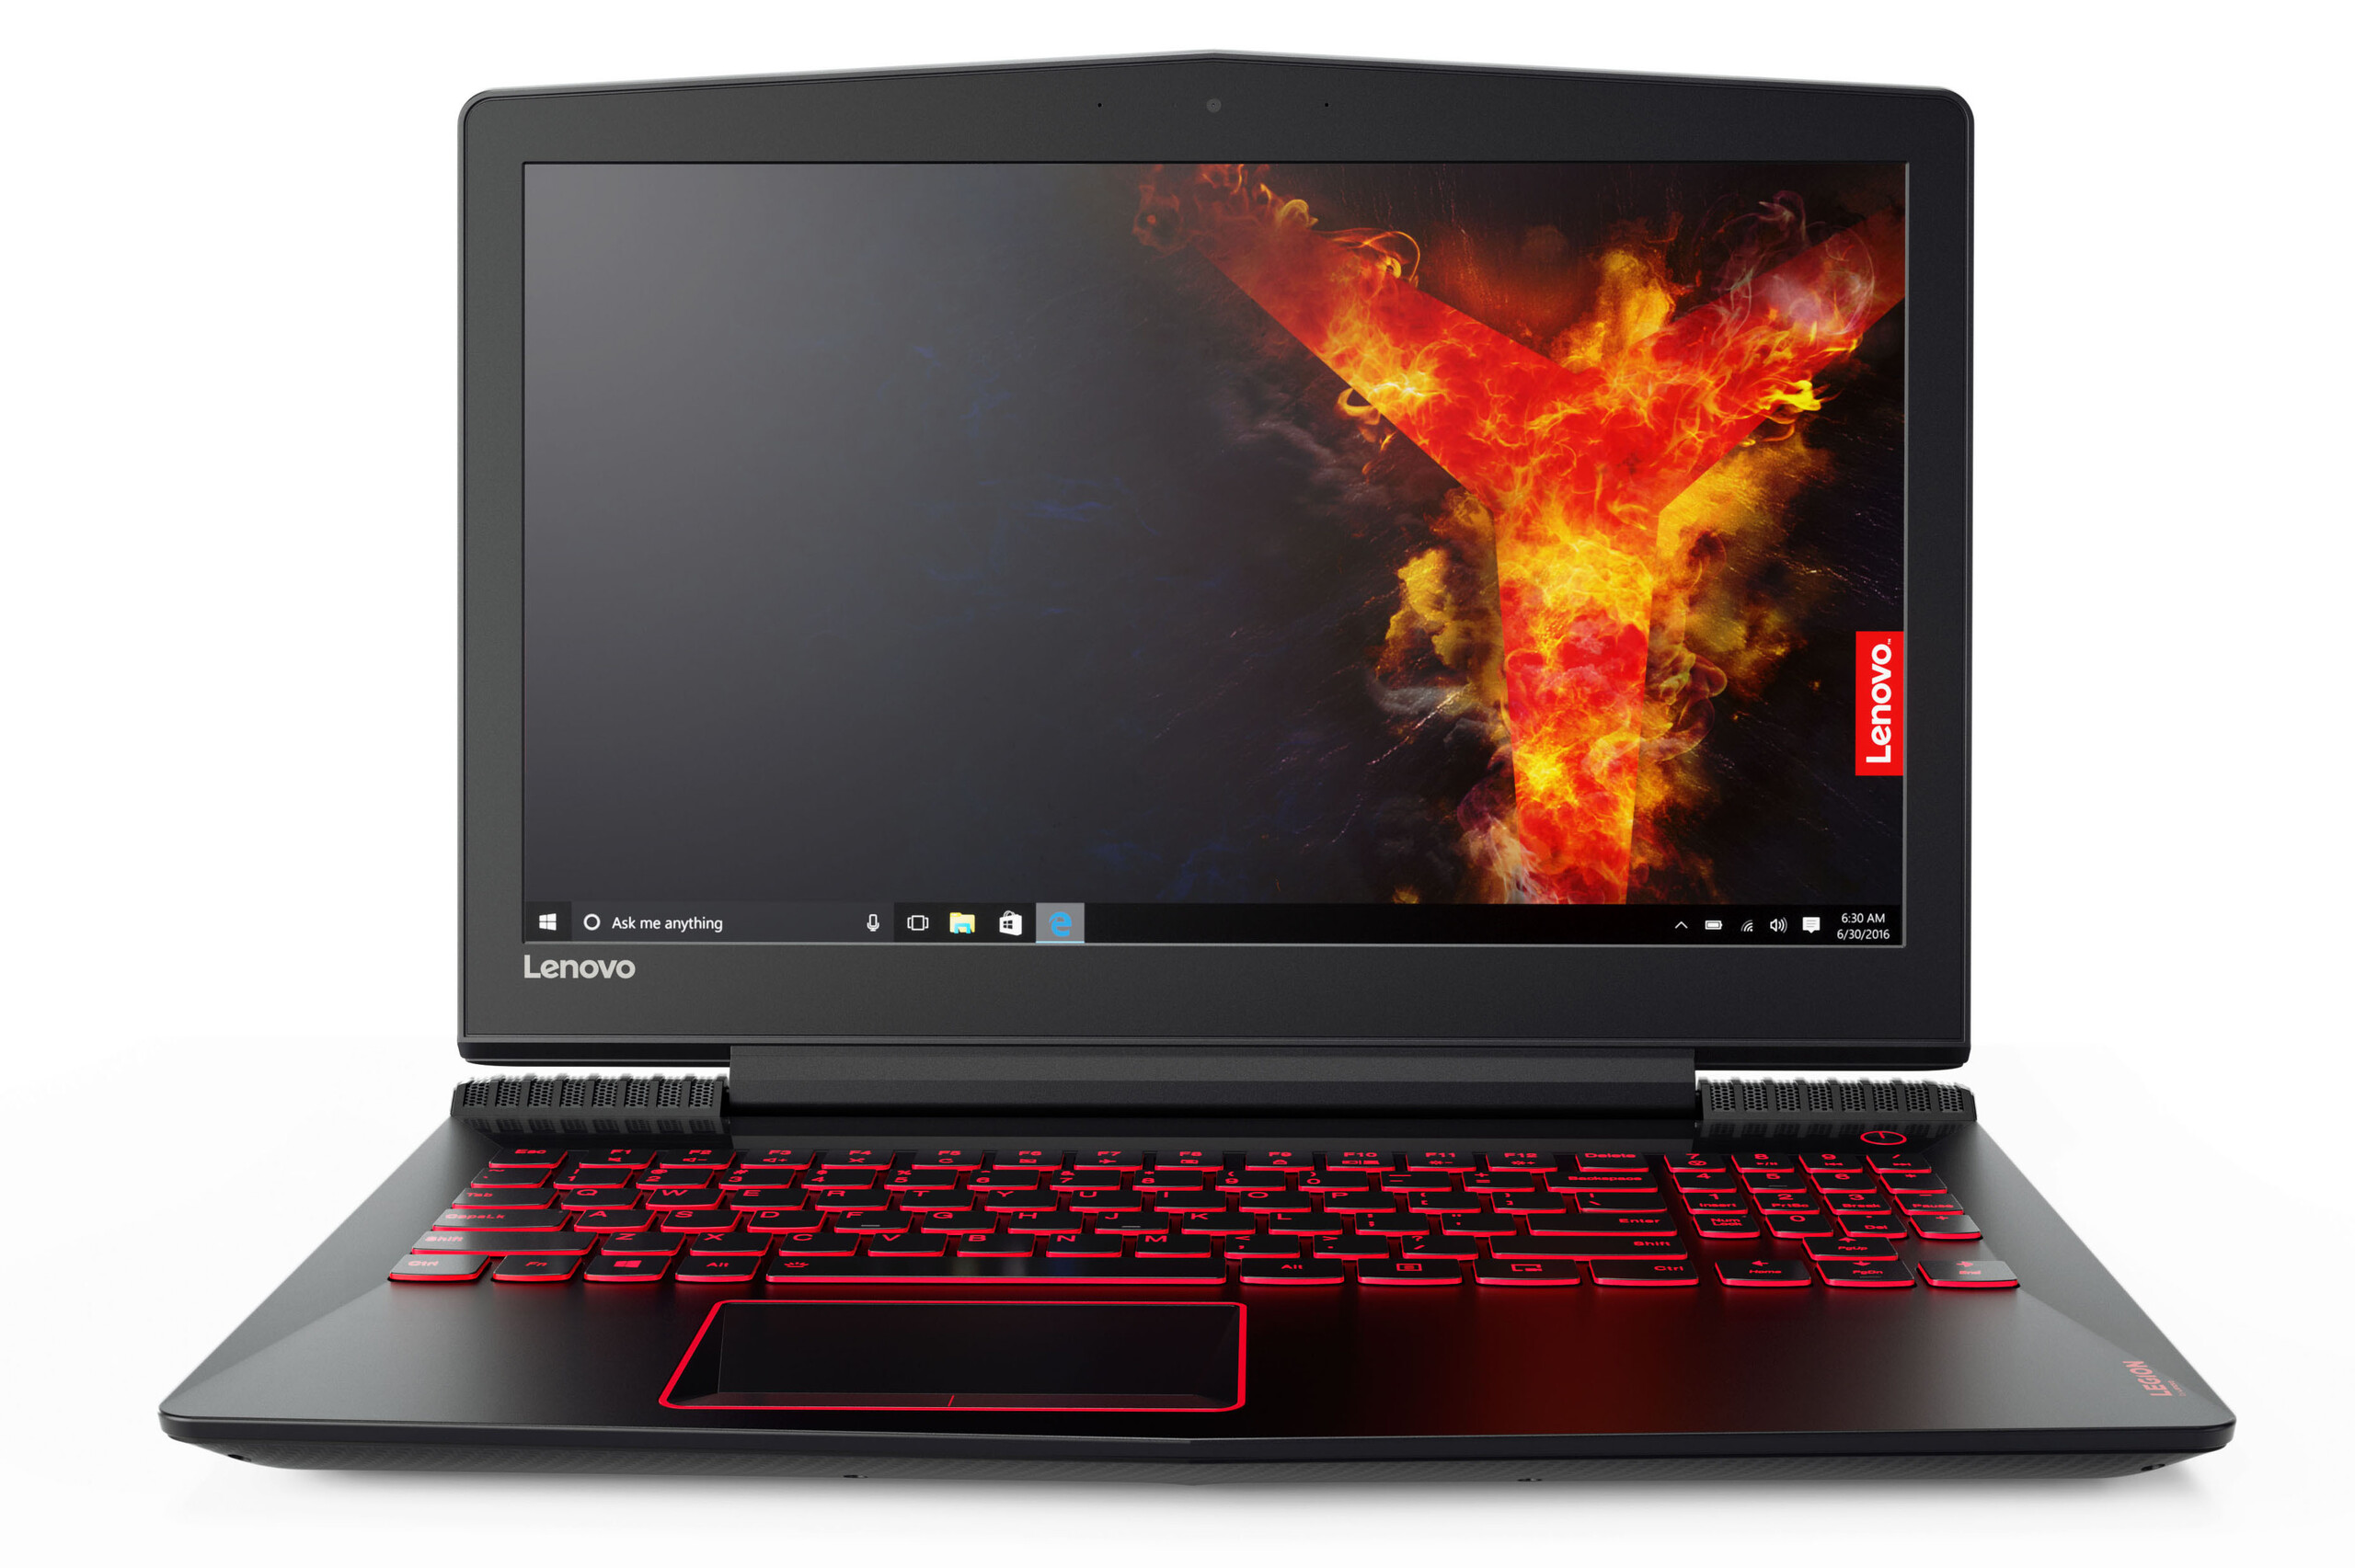
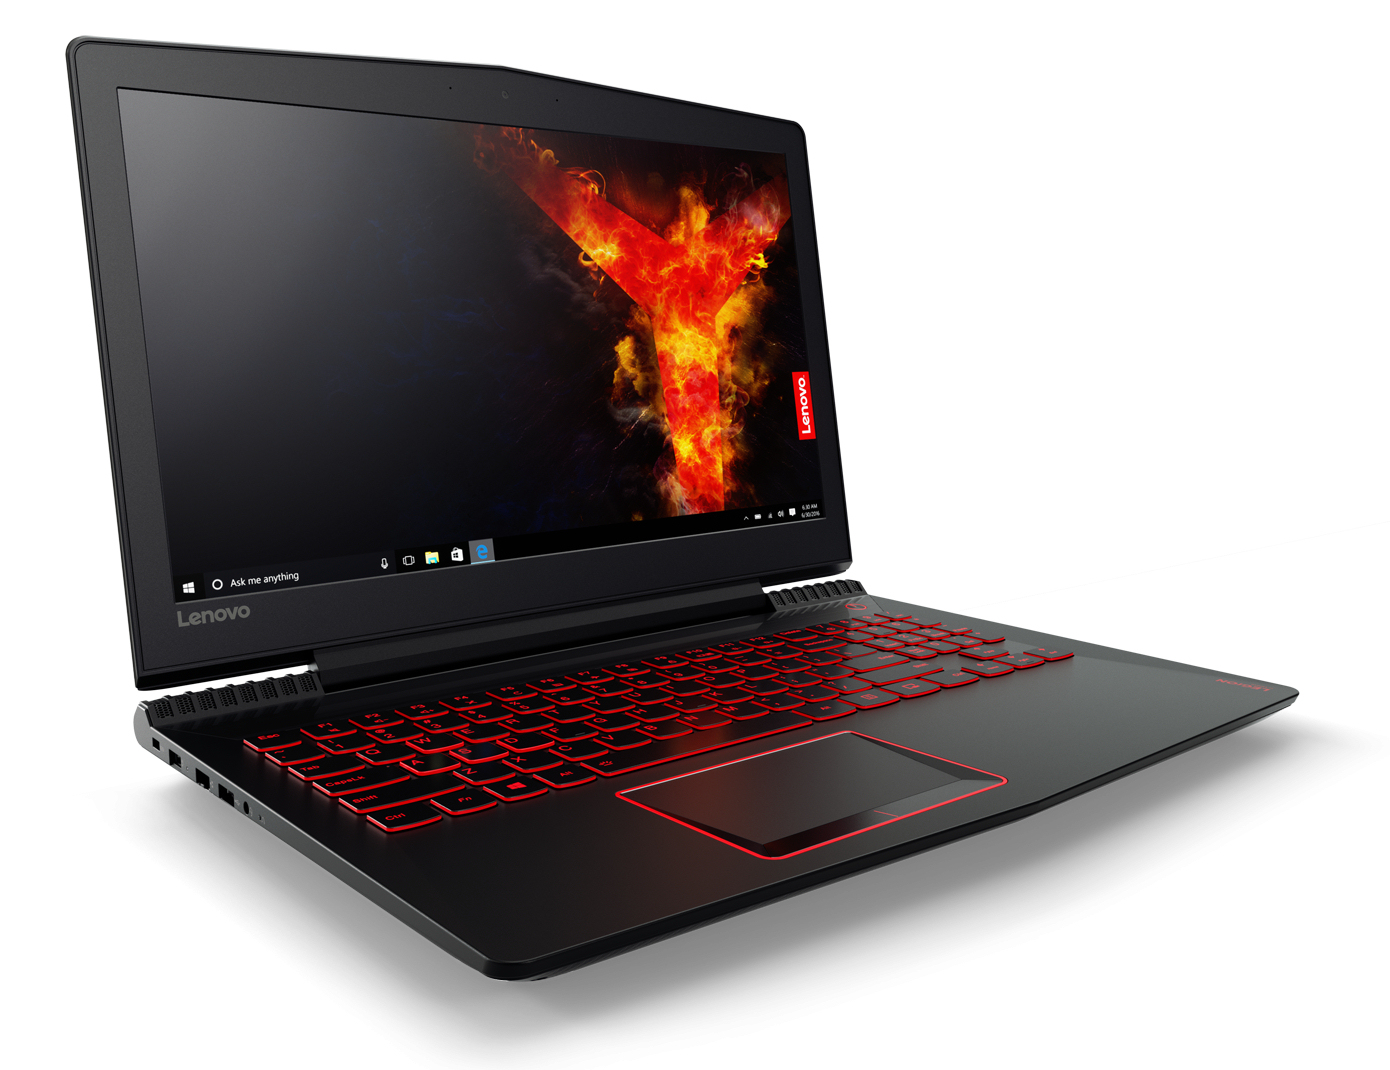
Lenovo Legion Y520-15IKBN (7300HQ, GTX 1050 Ti, FHD) Laptop Review
For the original German review, see here.
A few months ago, we tested a Core-i7 model of the Legion Y520, and now we are having the Core-i5 variant in front of us. Both devices have a GeForce GTX 1050 Ti graphics core on board. The competitors include notebooks such as the Acer Nitro 5 AN515-51, the HP Omen 15-ax213ng, the Dell Inspiron 15 7567, the Asus FX502VM, and the Acer Aspire VX5-591G.
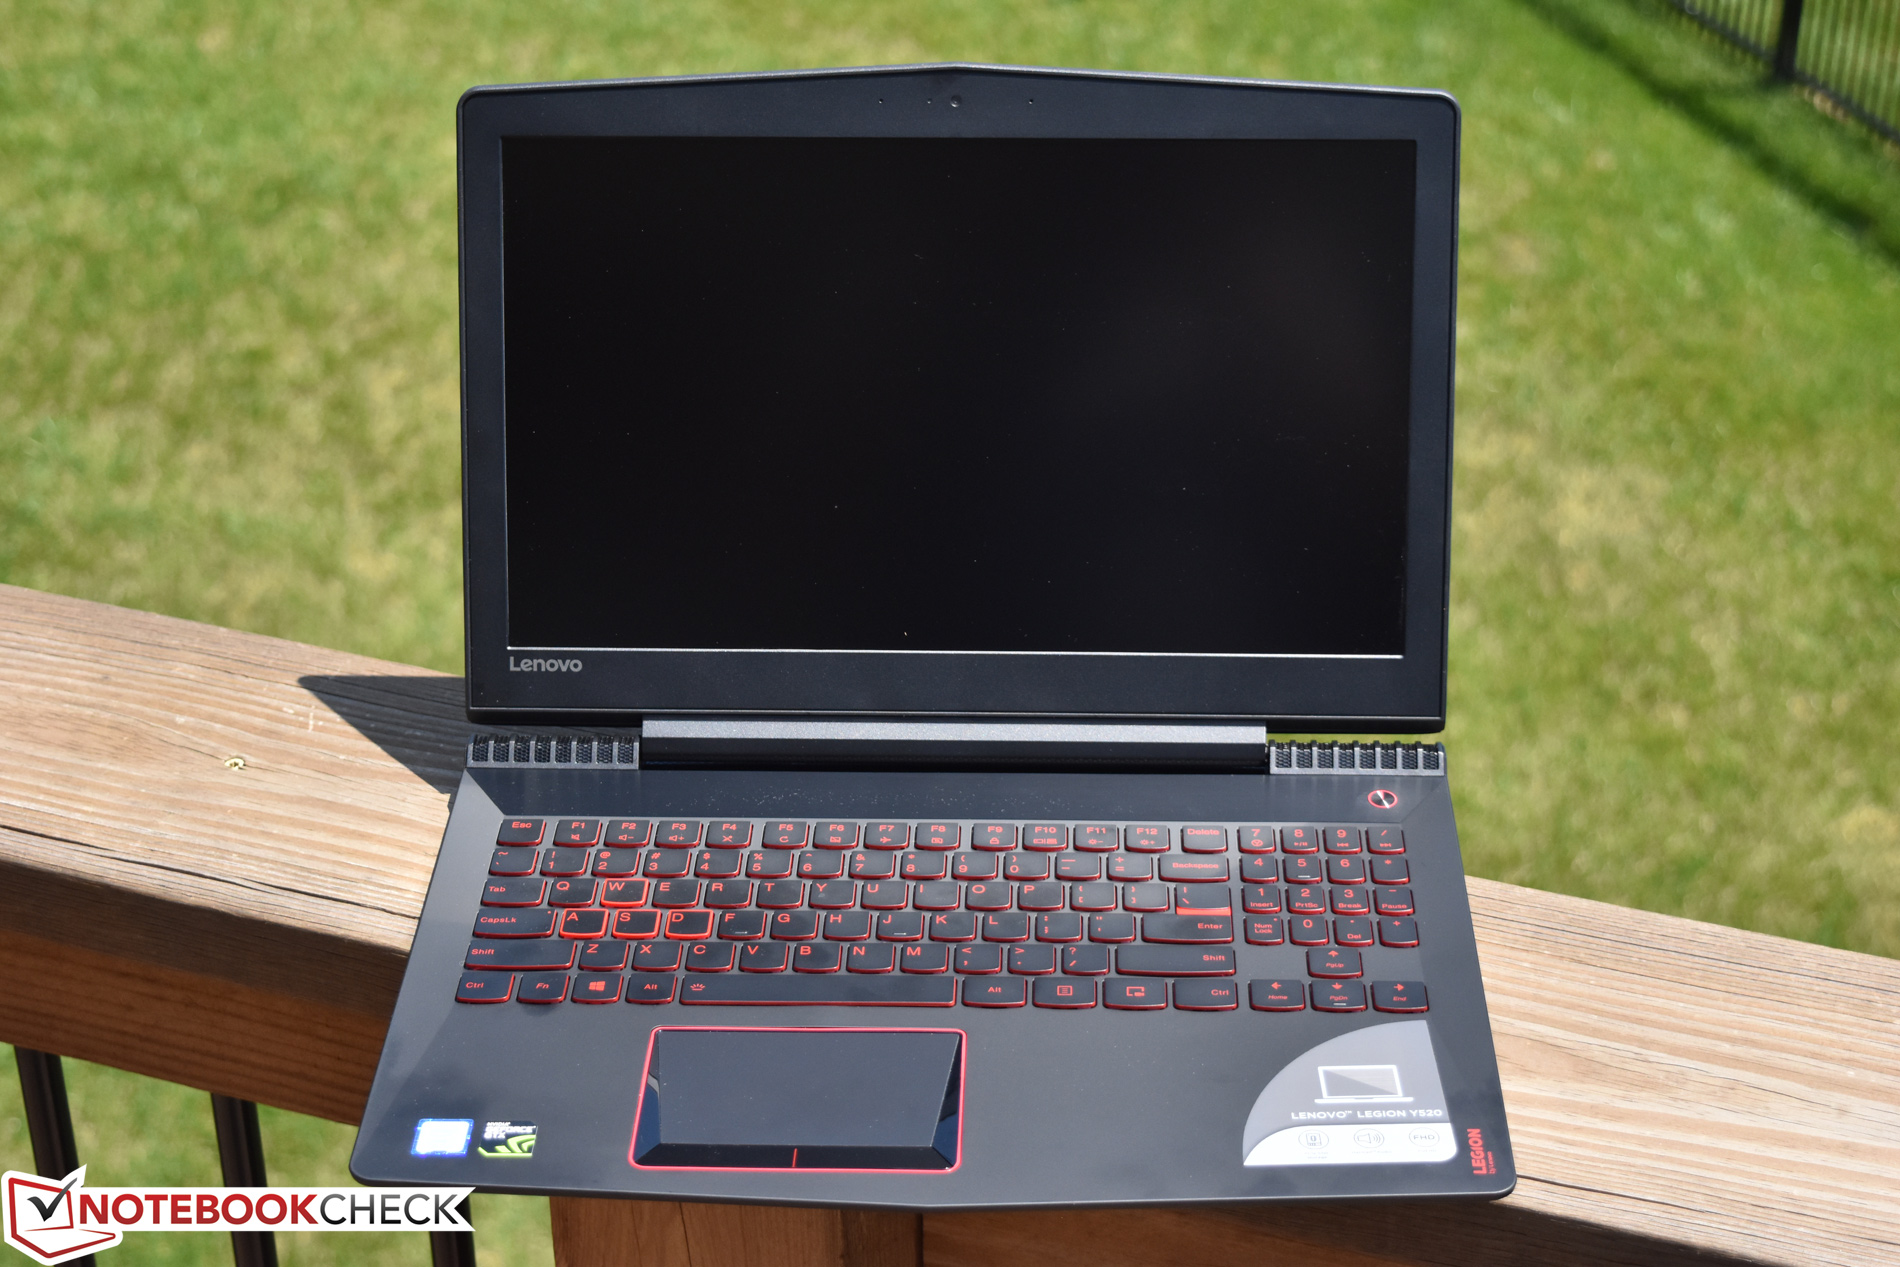
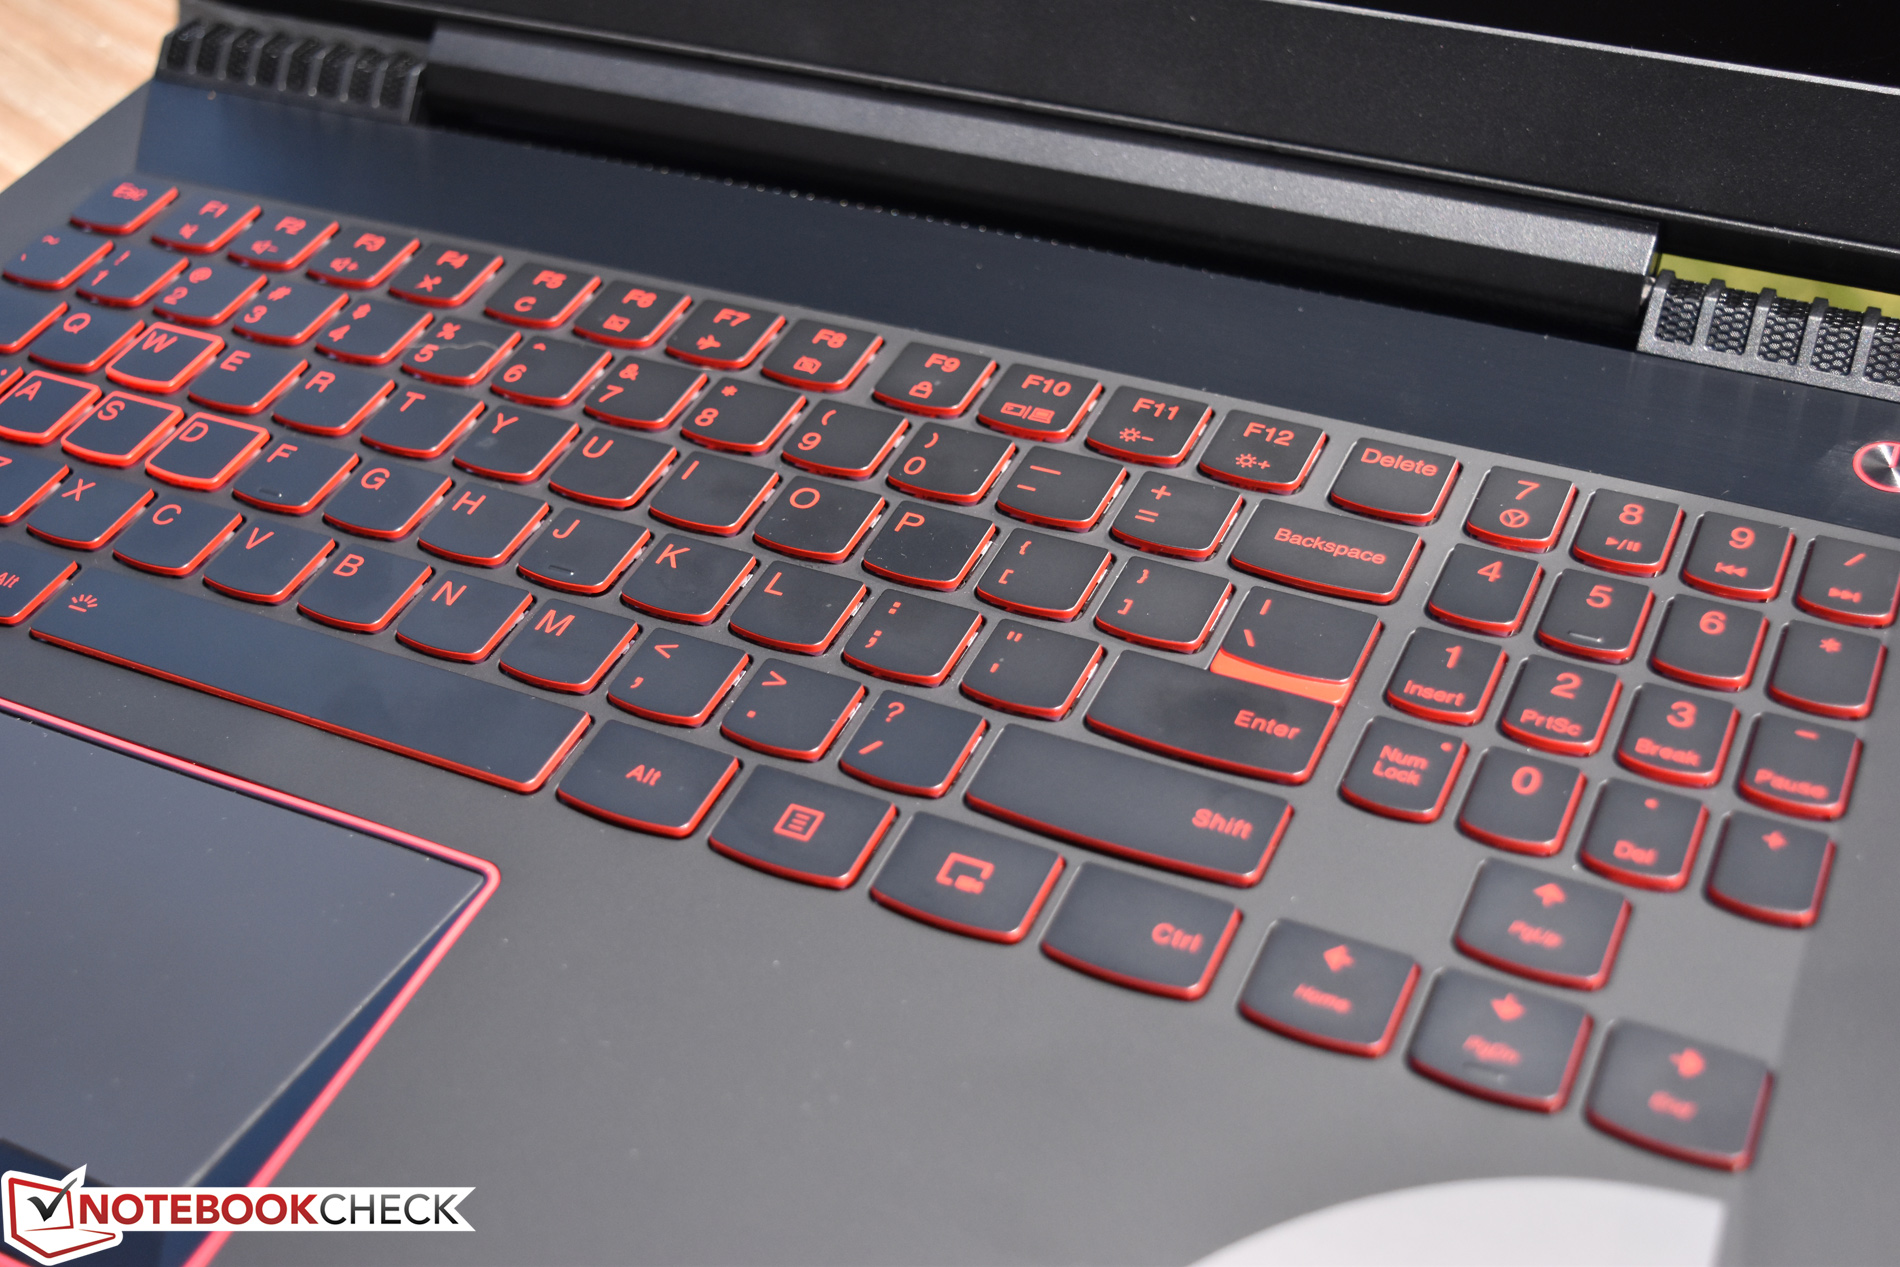
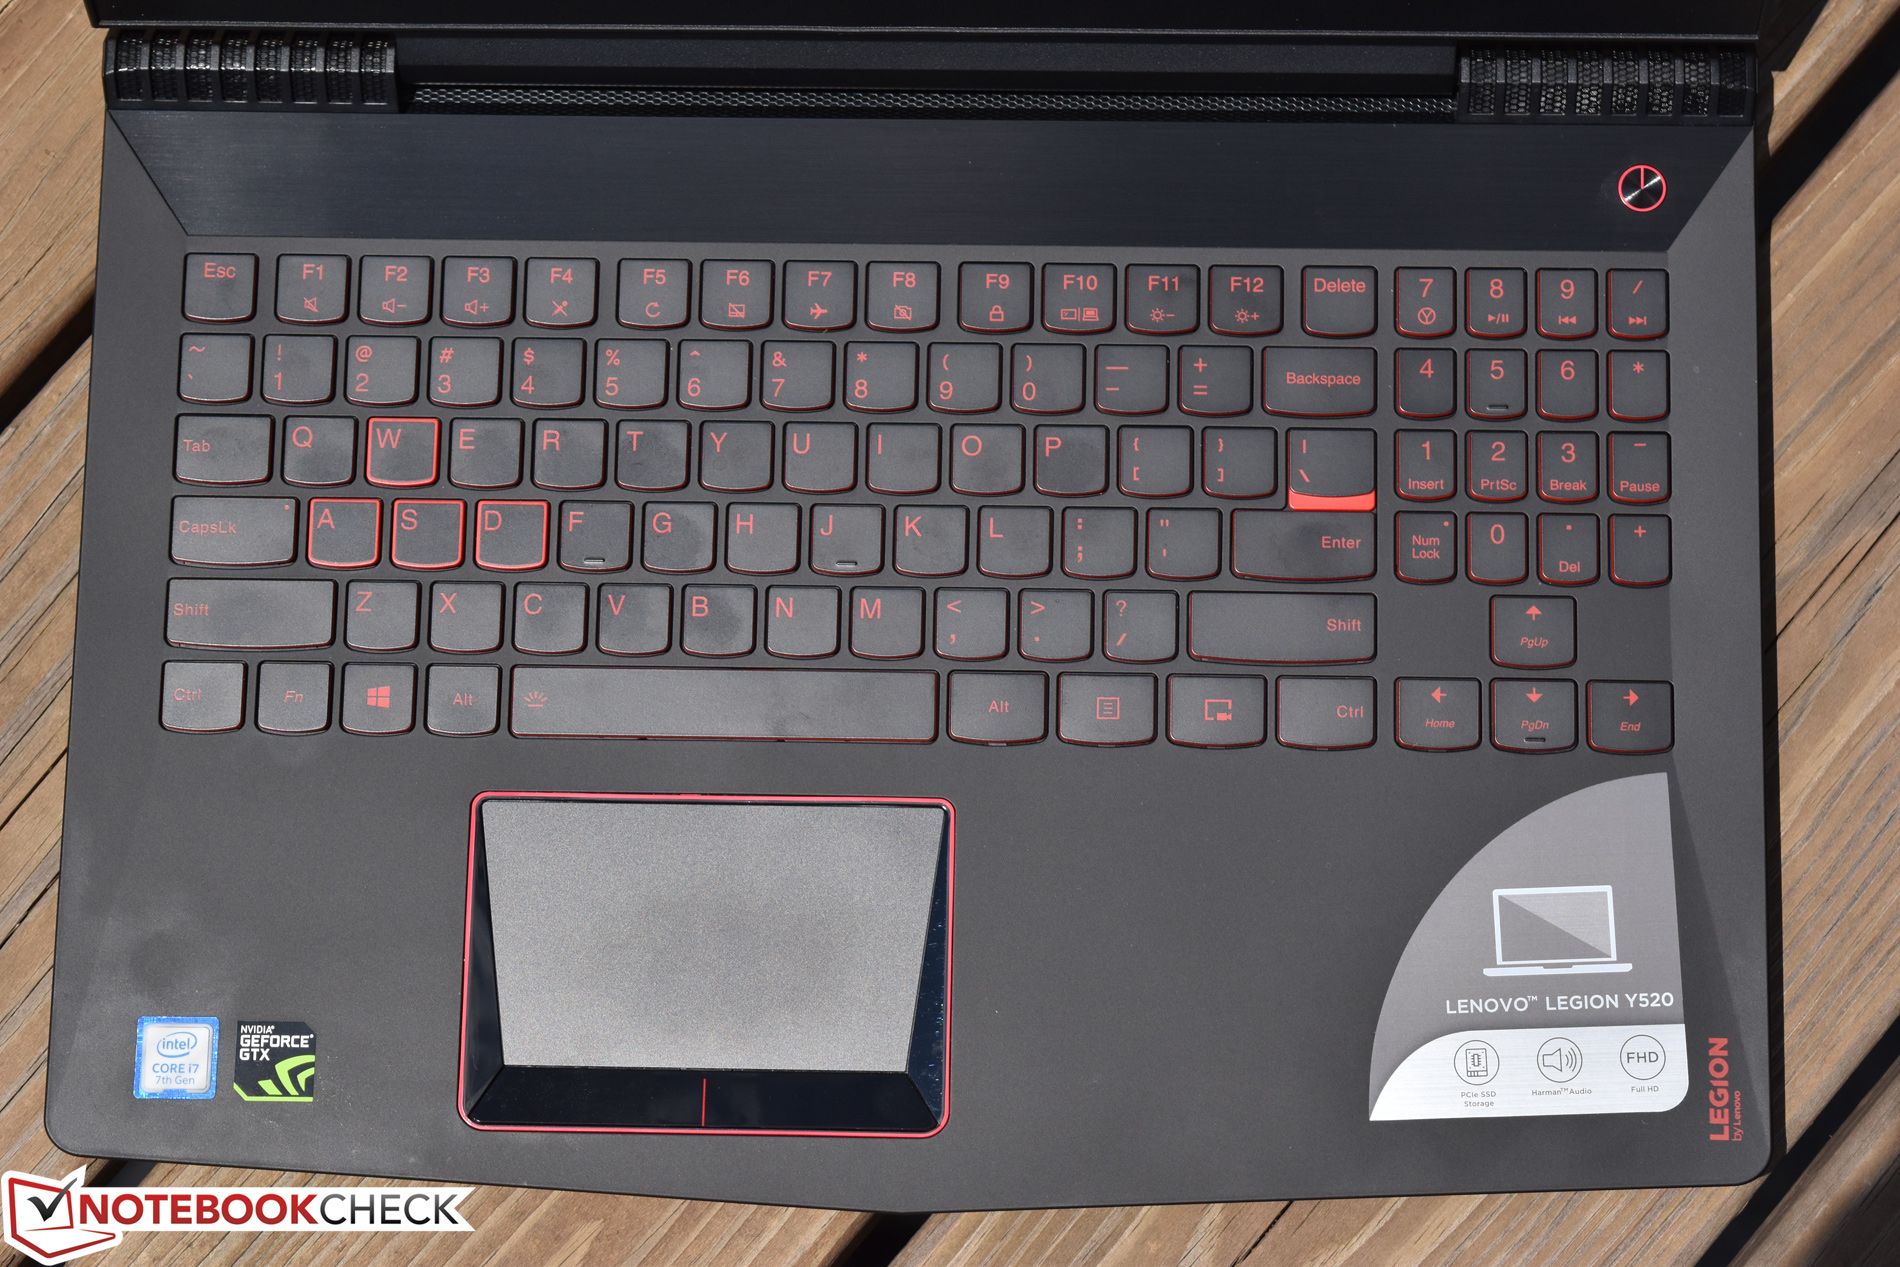
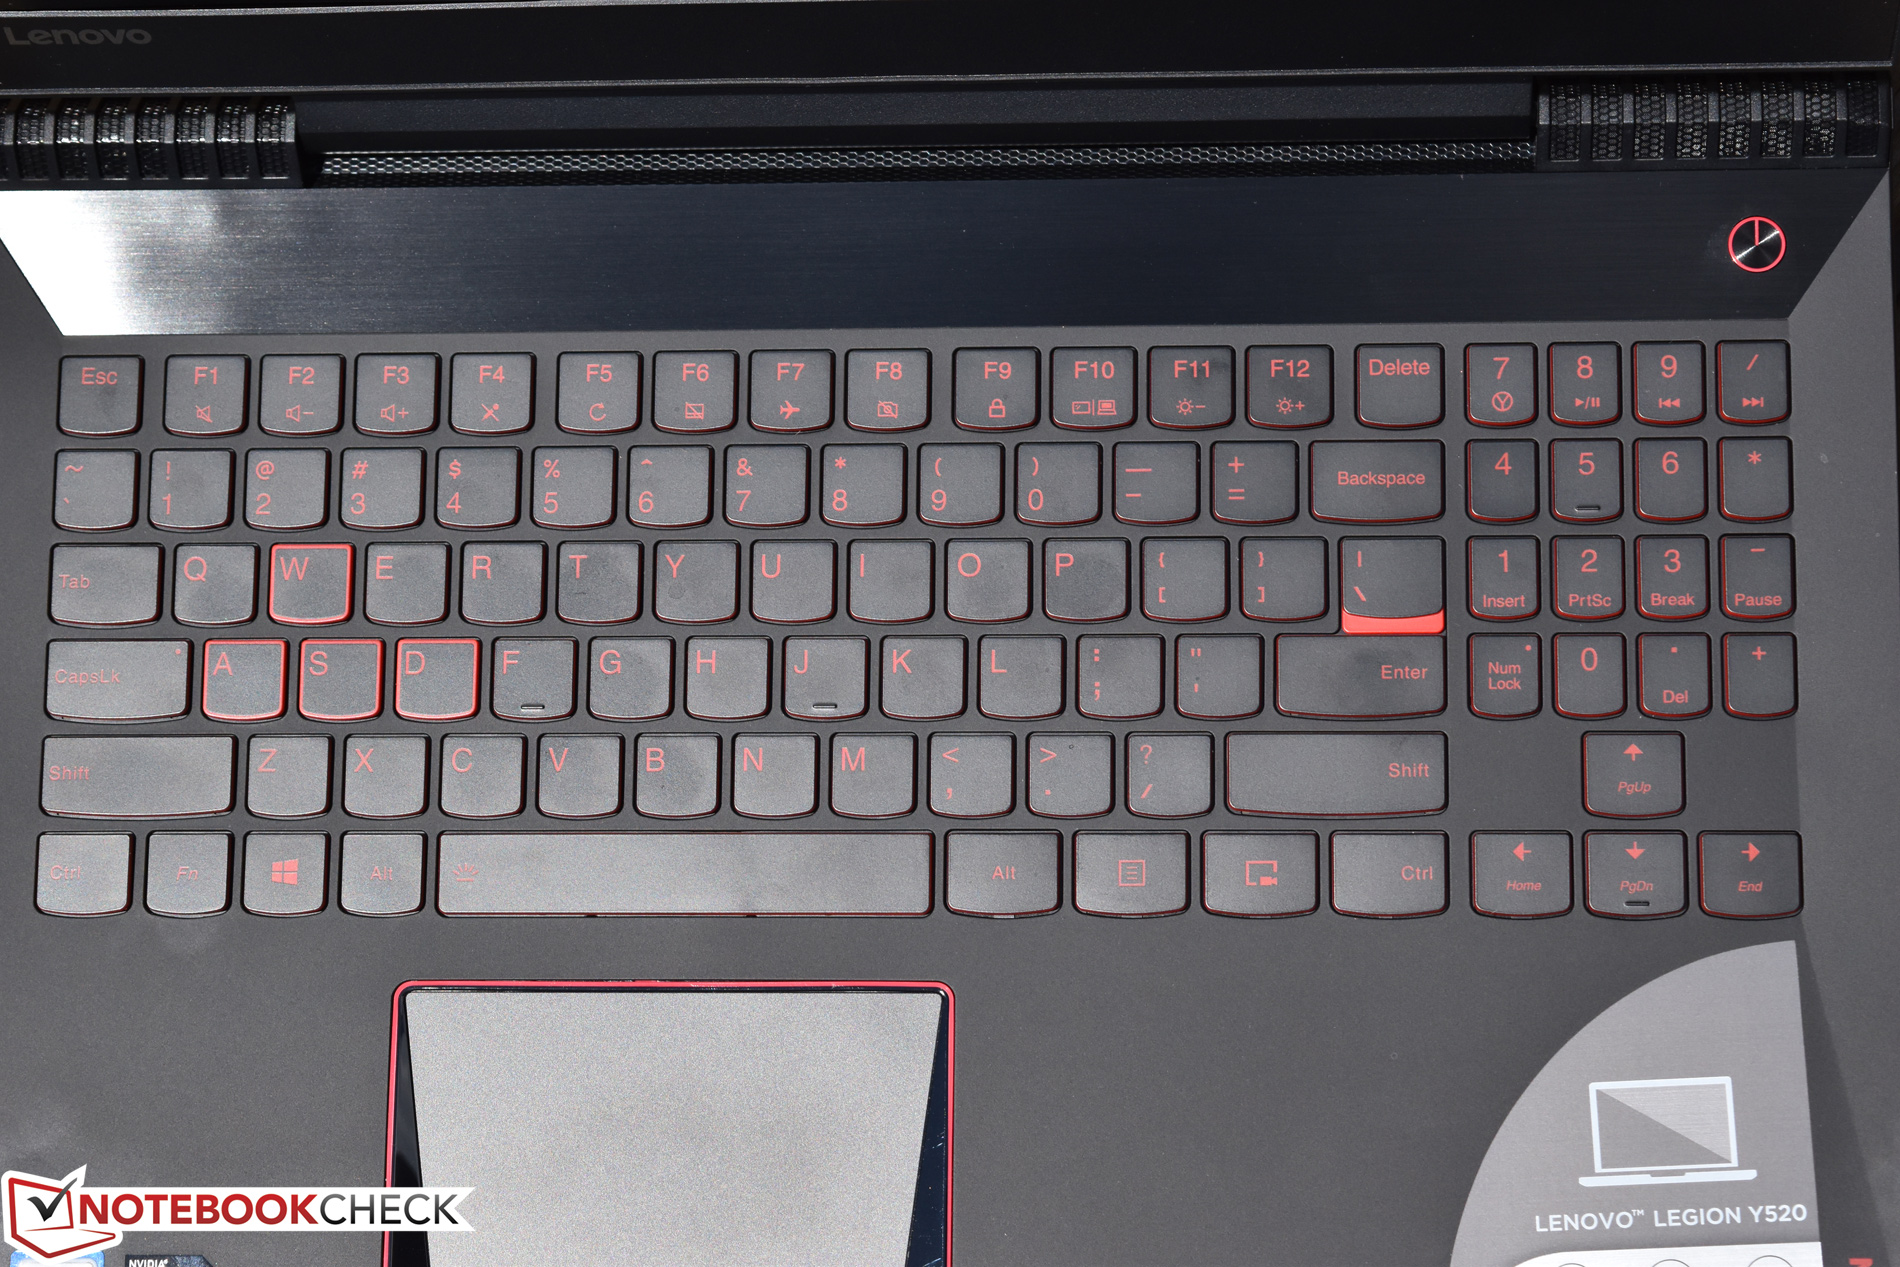
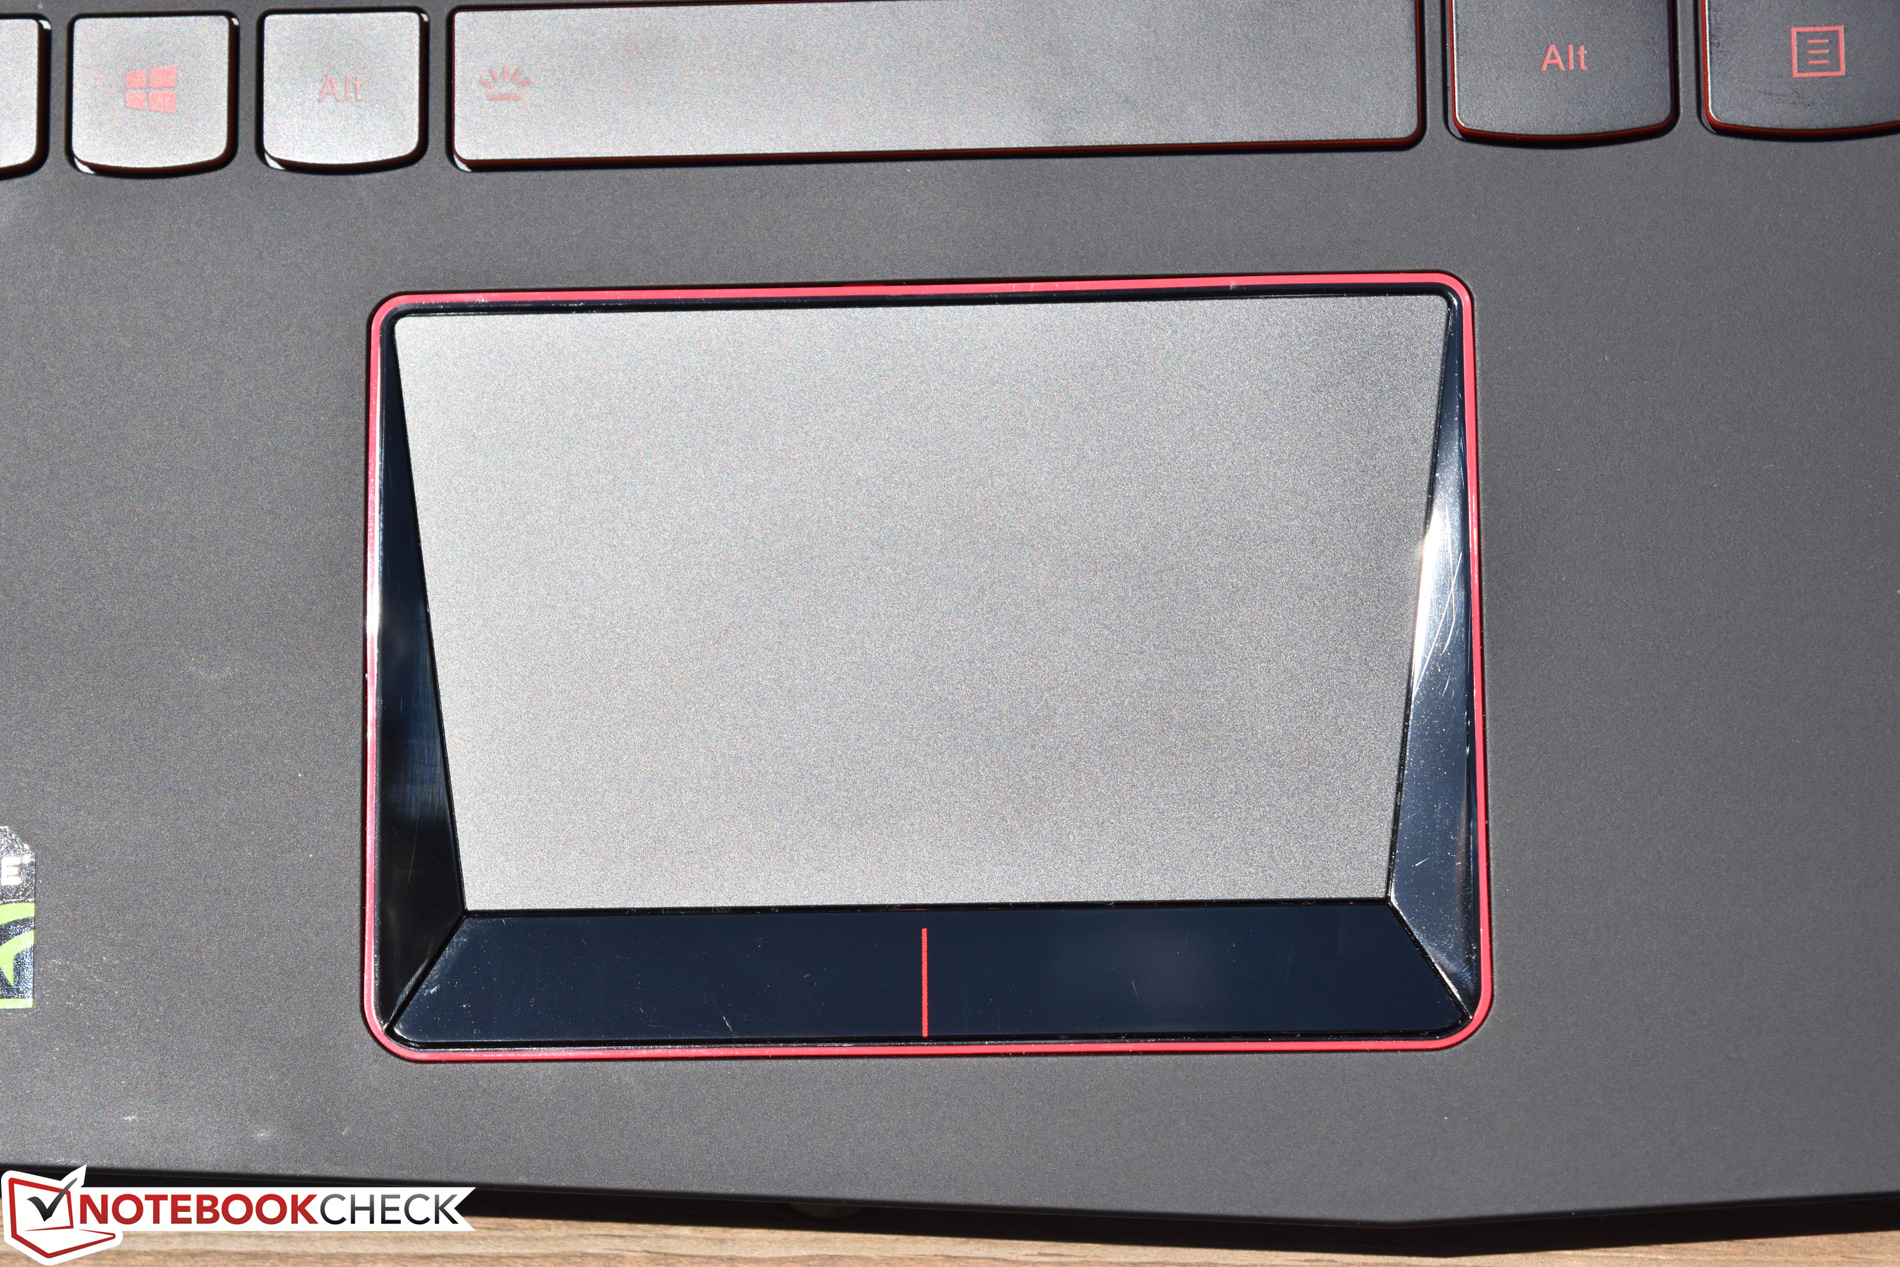
Since the build of the two Legion-Y520 models is identical, we will not discuss the case, features, input devices, display, and speakers again. You can find that information in the Legion Y520-15IKBN 80WK001KUS Review.
Warranty
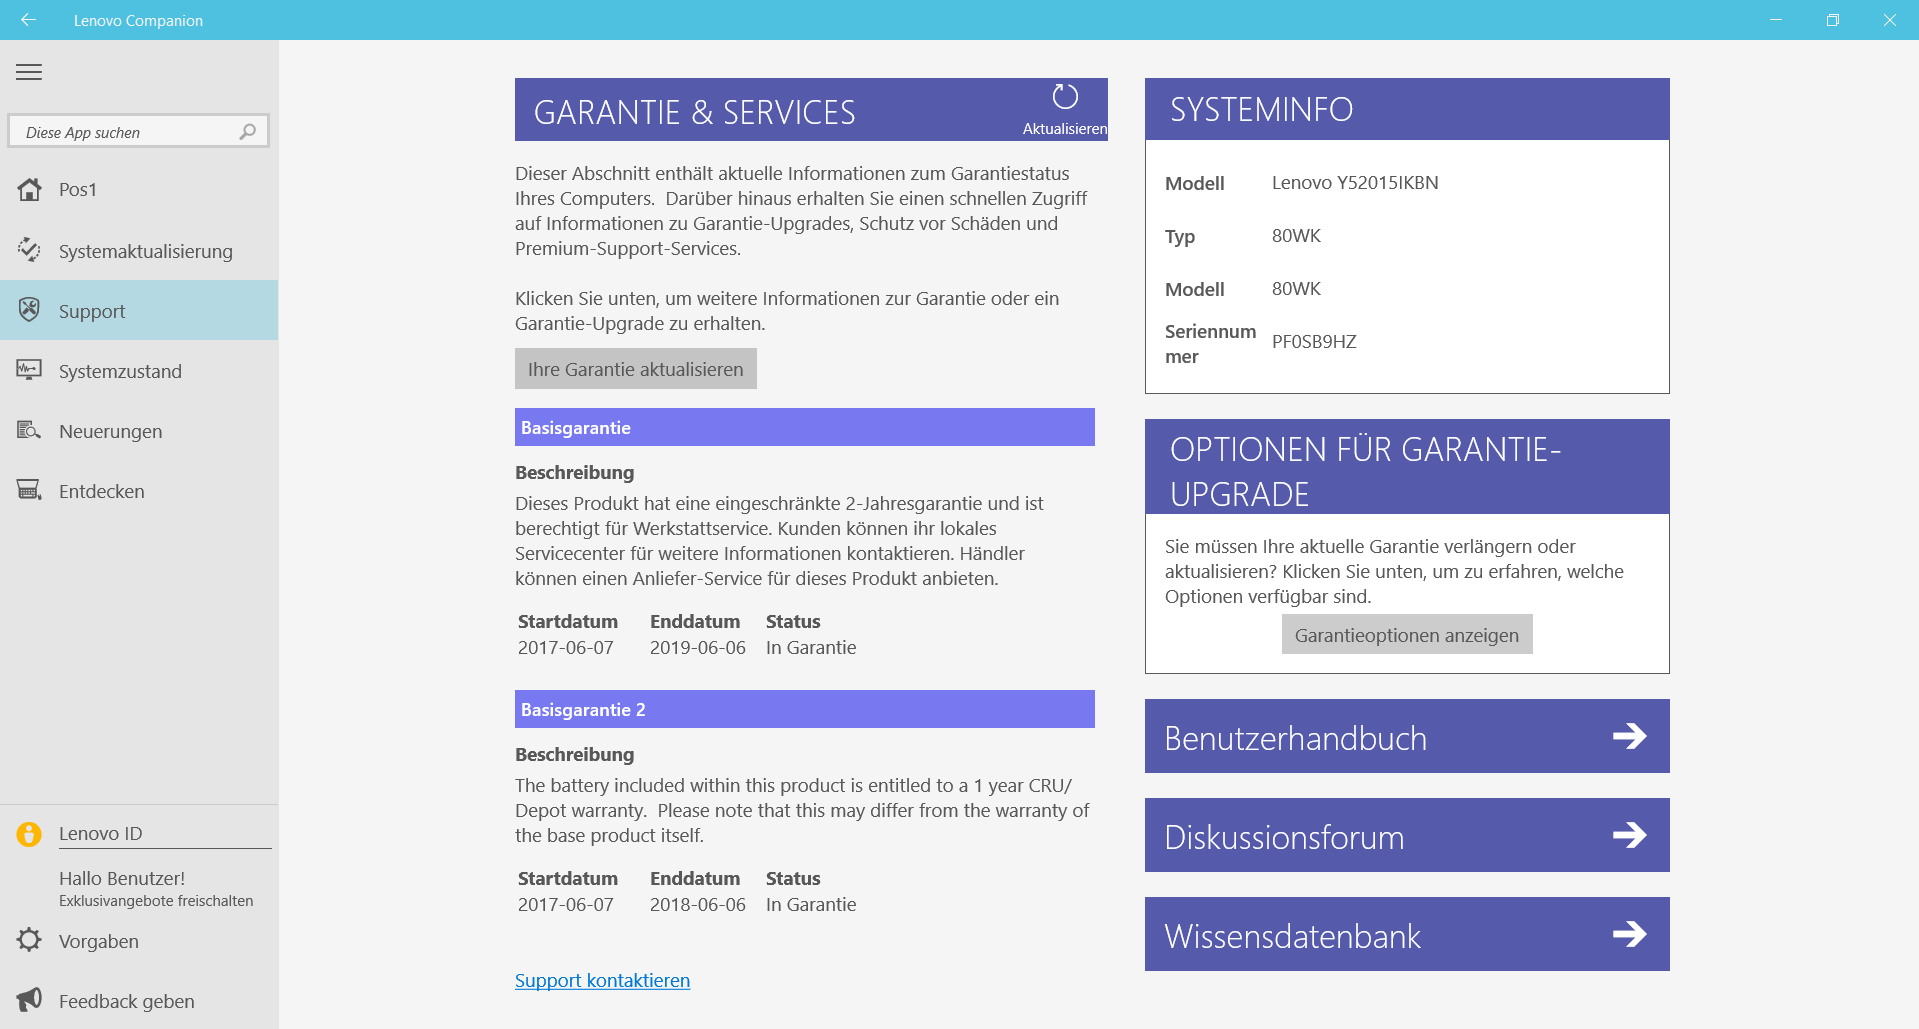
The Legion Y520 is available in many German online shops with a one-year warranty. But actually, the device has a two-year warranty, as the preinstalled Lenovo Companion app reports. Lenovo only gives a one-year warranty on the battery. Please see our Guarantees, Return Policies & Warranties FAQ for country-specific information.
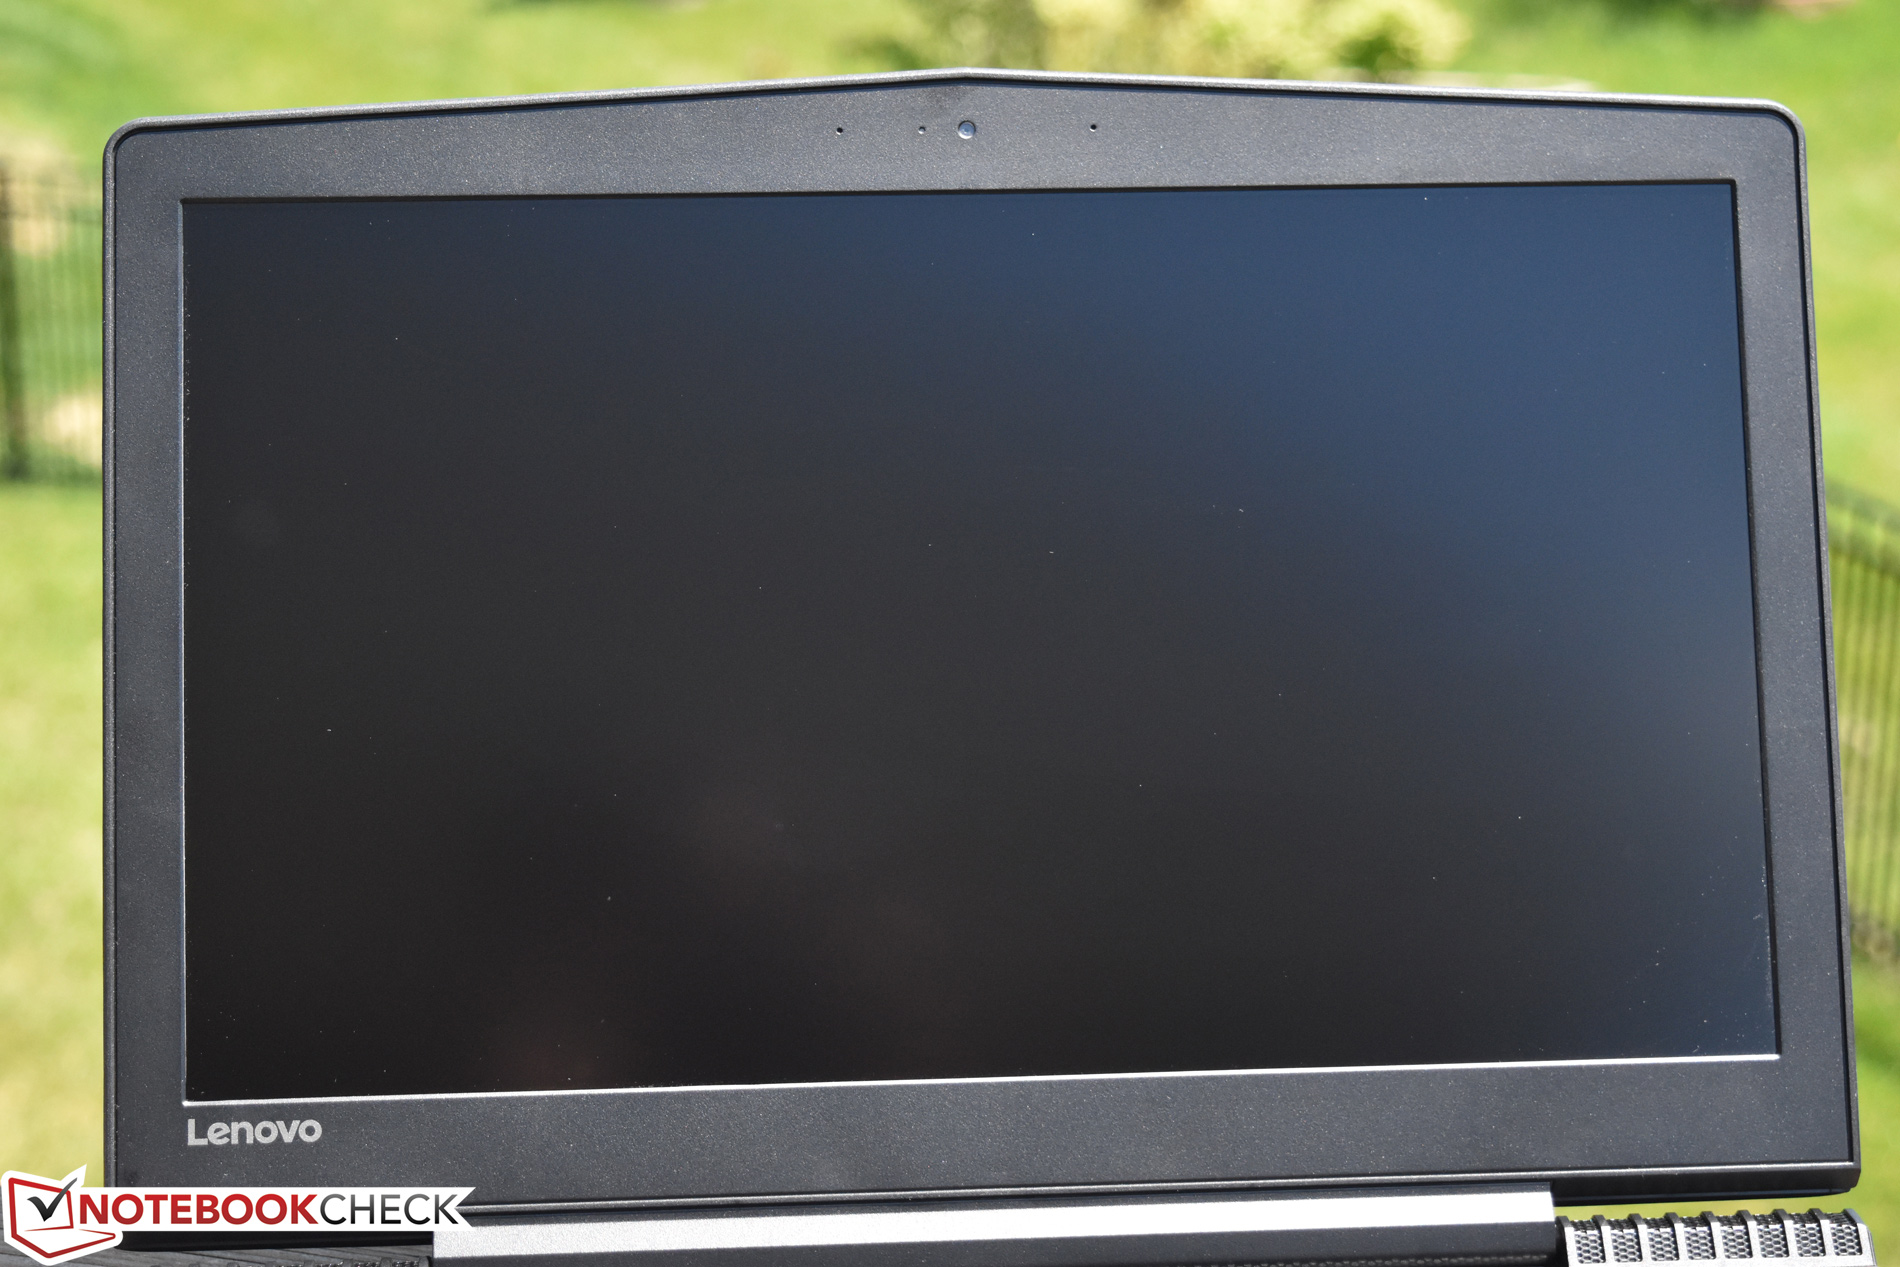
Display

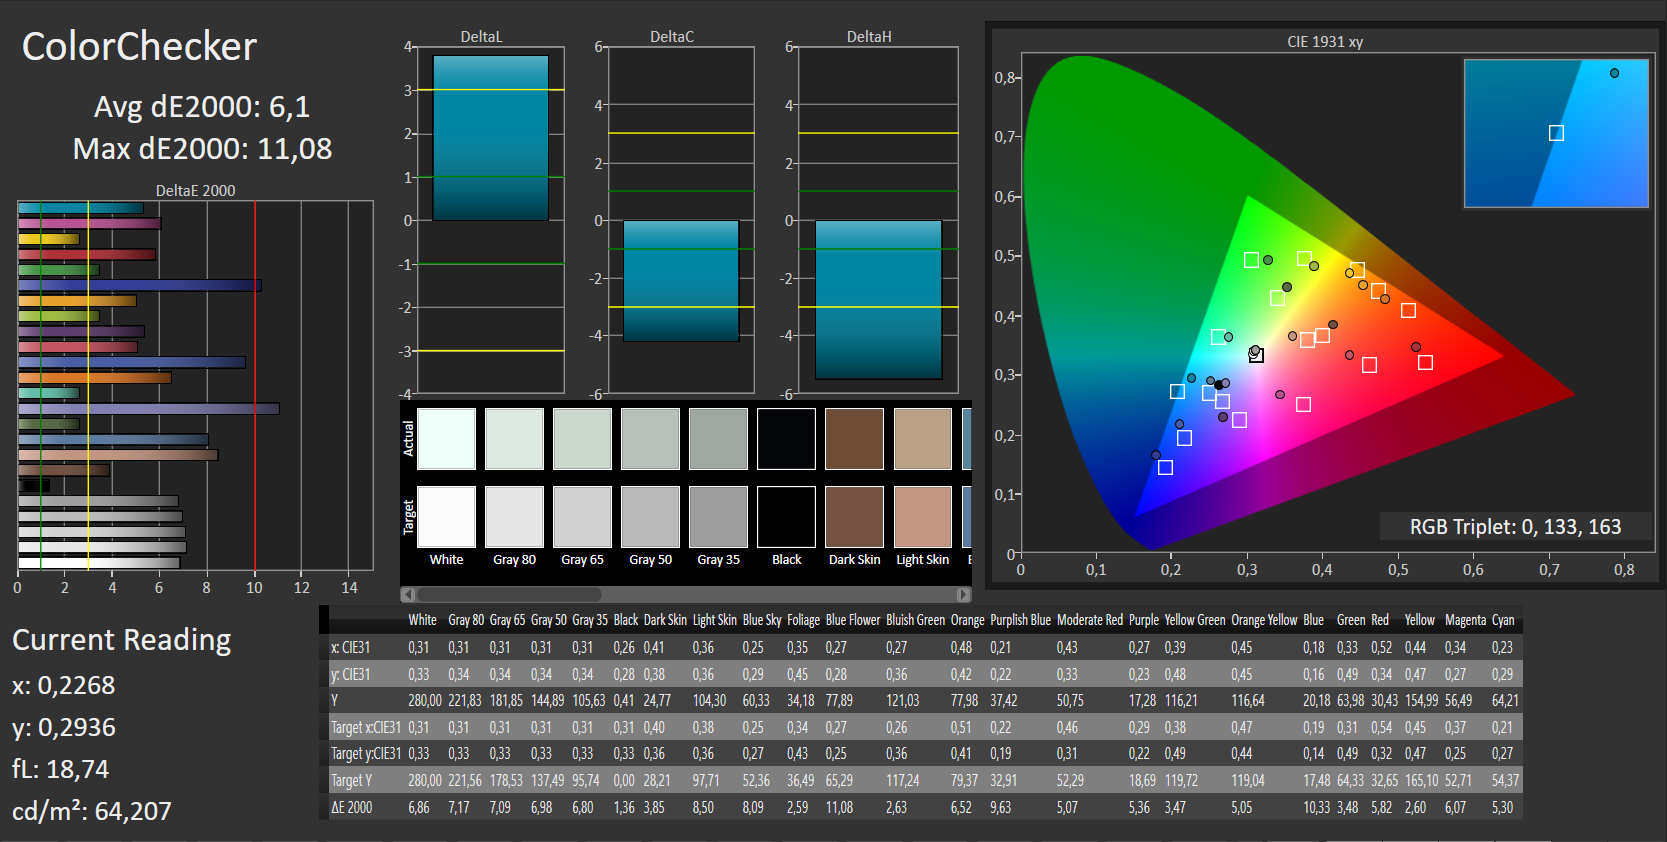
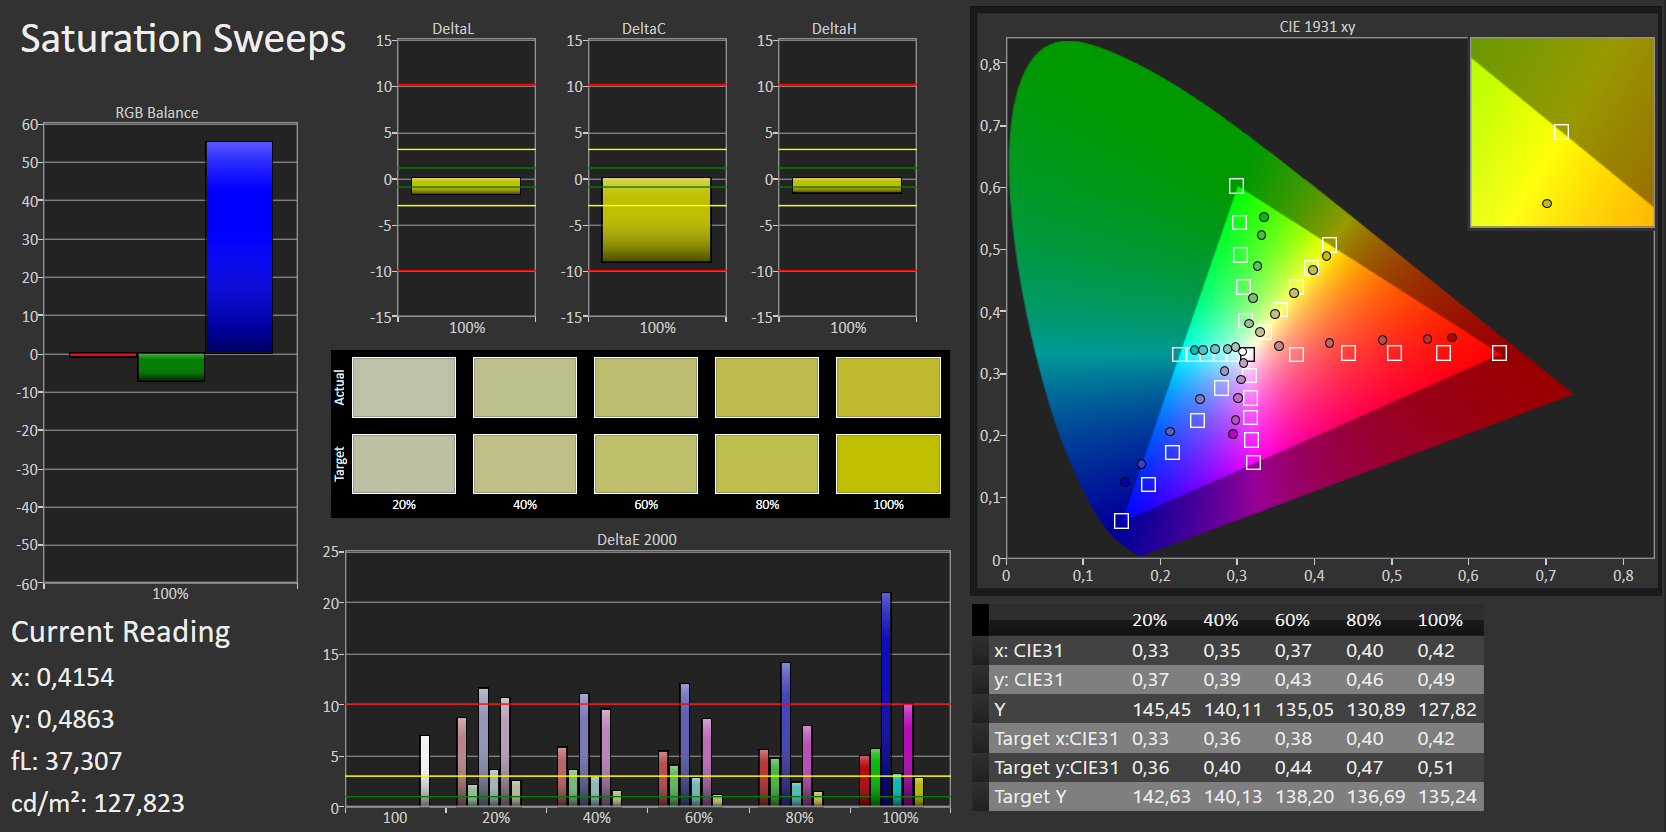
Lenovo uses the same matte IPS Full HD display as in the Legion-Y520 model we tested previously. The measurements are slightly different, which is normal though, since two identically built panels are never 100% identical. The brightness (281.3 cd/m2) and contrast (726:1) are decent, but could have been higher considering the price of the computer.
Unfortunately, the display shows PWM flickering at a frequency of 21,000 Hz in brightness settings of 90% and below. However, thanks to the high frequency, even very sensitive people should not develop any eye problems or headaches from this.
| |||||||||||||||||||||||||
Brightness Distribution: 91 %
Center on Battery: 281 cd/m²
Contrast: 726:1 (Black: 0.39 cd/m²)
ΔE Color 6.1 | 0.5-29.43 Ø5
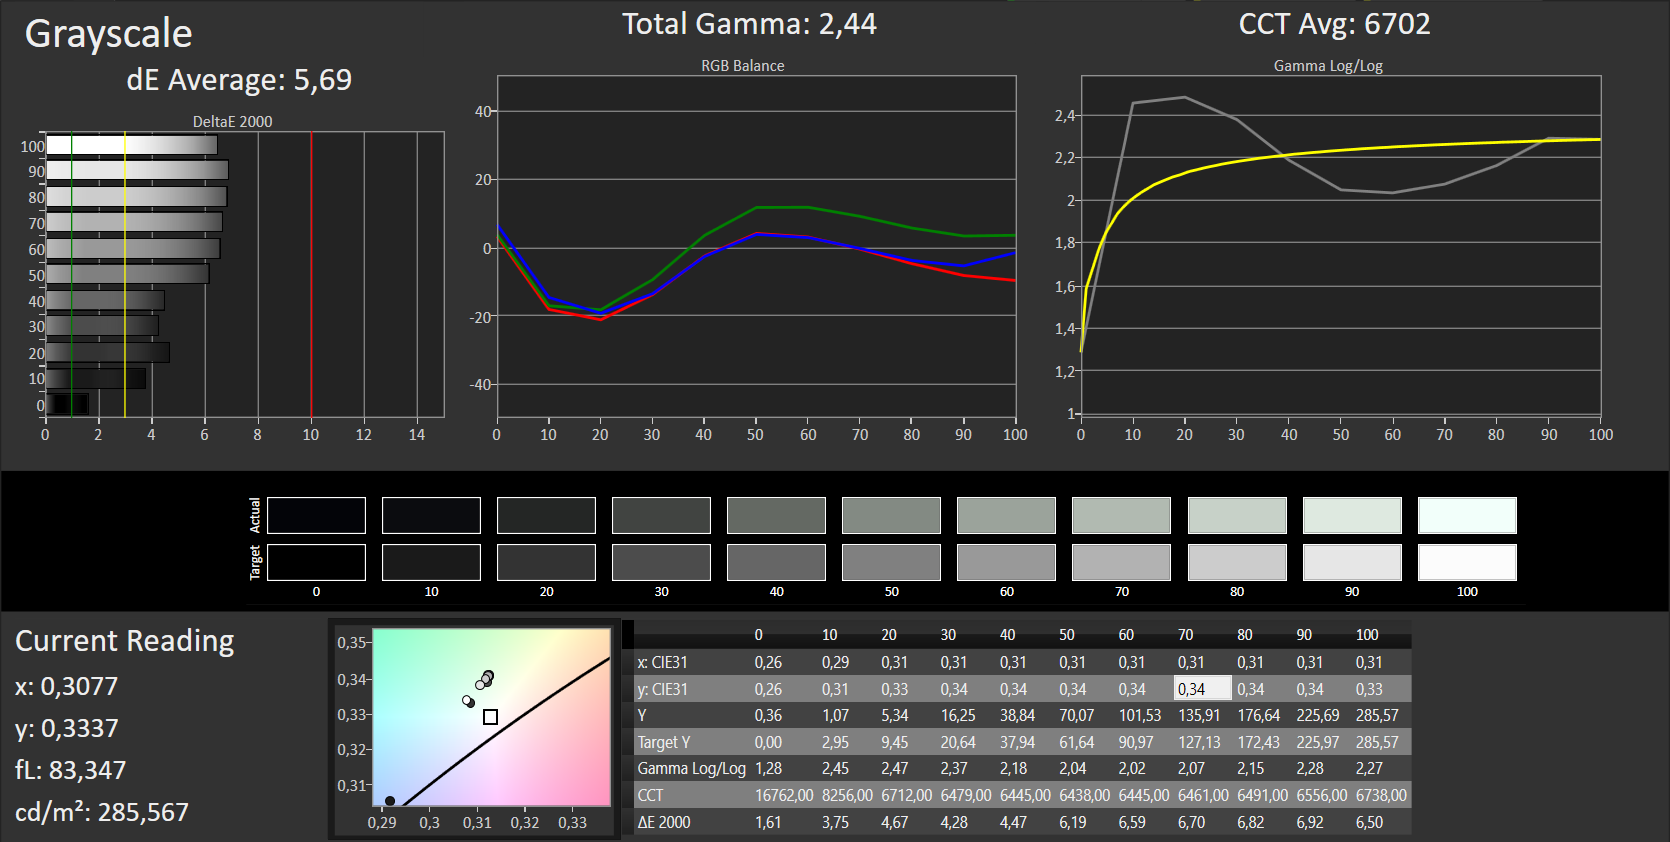
ΔE Greyscale 5.69 | 0.57-98 Ø5.3
58% sRGB (Argyll 1.6.3 3D)
37% AdobeRGB 1998 (Argyll 1.6.3 3D)
40.34% AdobeRGB 1998 (Argyll 2.2.0 3D)
58.4% sRGB (Argyll 2.2.0 3D)
39.01% Display P3 (Argyll 2.2.0 3D)
Gamma: 2.44
| Lenovo Legion Y520-15IKBN 80WK0042GE IPS, 1920x1080, 15.60 | Lenovo Legion Y520-15IKBN-80WK001KUS IPS, 1920x1080, 15.60 | HP Omen 15-ax213ng IPS, 1920x1080, 15.60 | Acer Aspire VX5-591G-75C4 VX15 IPS, 1920x1080, 15.60 | Dell Inspiron 15 7000 7567 Gaming (Core i5-7300HQ, GTX 1050) TN, 1920x1080, 15.60 | Asus FX502VM-AS73 TN LED, 1920x1080, 15.60 | Acer Nitro 5 AN515-51-788E IPS, 1920x1080, 15.60 | |
|---|---|---|---|---|---|---|---|
| Display | -1% | 0% | -2% | -2% | 7% | ||
| Display P3 Coverage | 39.01 | 38.59 -1% | 38.88 0% | 38.2 -2% | 38.28 -2% | 41.7 7% | |
| sRGB Coverage | 58.4 | 58 -1% | 58.2 0% | 57.5 -2% | 56.9 -3% | 62.2 7% | |
| AdobeRGB 1998 Coverage | 40.34 | 39.87 -1% | 40.2 0% | 39.47 -2% | 39.47 -2% | 43.17 7% | |
| Response Times | -24% | -3% | 33% | 6% | 25% | 17% | |
| Response Time Grey 50% / Grey 80% * | 39 ? | 58.8 ? -51% | 42 ? -8% | 22 ? 44% | 36.8 ? 6% | 28.4 ? 27% | 35 ? 10% |
| Response Time Black / White * | 29 ? | 36 ? -24% | 28 ? 3% | 23 ? 21% | 27.6 ? 5% | 22.4 ? 23% | 22 ? 24% |
| PWM Frequency | 21000 ? | 21550 ? 3% | |||||
| Screen | -17% | 17% | 8% | -50% | -18% | 11% | |
| Brightness middle | 283 | 239 -16% | 230 -19% | 281 -1% | 242.2 -14% | 209.5 -26% | 276 -2% |
| Brightness | 281 | 244 -13% | 228 -19% | 257 -9% | 235 -16% | 205 -27% | 265 -6% |
| Brightness Distribution | 91 | 88 -3% | 88 -3% | 85 -7% | 88 -3% | 92 1% | 91 0% |
| Black Level * | 0.39 | 0.35 10% | 0.21 46% | 0.32 18% | 0.69 -77% | 0.69 -77% | 0.25 36% |
| Contrast | 726 | 683 -6% | 1095 51% | 878 21% | 351 -52% | 304 -58% | 1104 52% |
| Colorchecker dE 2000 * | 6.1 | 7.3 -20% | 4.01 34% | 5.16 15% | 11.6 -90% | 4.7 23% | 5.06 17% |
| Colorchecker dE 2000 max. * | 11.08 | 24.7 -123% | 7.26 34% | 9.09 18% | 19.4 -75% | 19.7 -78% | 10.13 9% |
| Greyscale dE 2000 * | 5.69 | 4.9 14% | 3.18 44% | 4.57 20% | 15.7 -176% | 1.8 68% | 6.25 -10% |
| Gamma | 2.44 90% | 2.19 100% | 2.52 87% | 2.59 85% | 1.57 140% | 2.23 99% | 1.76 125% |
| CCT | 6702 97% | 7332 89% | 6814 95% | 6931 94% | 11662 56% | 6975 93% | 6873 95% |
| Color Space (Percent of AdobeRGB 1998) | 37 | 35 -5% | 37 0% | 37 0% | 39.47 7% | 36.2 -2% | 40 8% |
| Color Space (Percent of sRGB) | 58 | 55 -5% | 58 0% | 58 0% | 57.55 -1% | 56.6 -2% | 62 7% |
| Total Average (Program / Settings) | -21% /
-18% | 4% /
11% | 14% /
9% | -15% /
-33% | 2% /
-9% | 12% /
11% |
* ... smaller is better
Screen Flickering / PWM (Pulse-Width Modulation)
| Screen flickering / PWM detected | 21000 Hz | ≤ 90 % brightness setting | 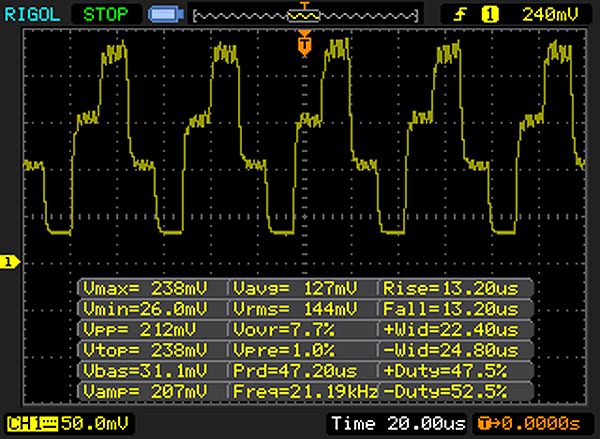 |
The display backlight flickers at 21000 Hz (worst case, e.g., utilizing PWM) Flickering detected at a brightness setting of 90 % and below. There should be no flickering or PWM above this brightness setting. The frequency of 21000 Hz is quite high, so most users sensitive to PWM should not notice any flickering. In comparison: 53 % of all tested devices do not use PWM to dim the display. If PWM was detected, an average of 17900 (minimum: 5 - maximum: 3846000) Hz was measured. | |||
Display Response Times
| ↔ Response Time Black to White | ||
|---|---|---|
| 29 ms ... rise ↗ and fall ↘ combined | ↗ 16 ms rise | 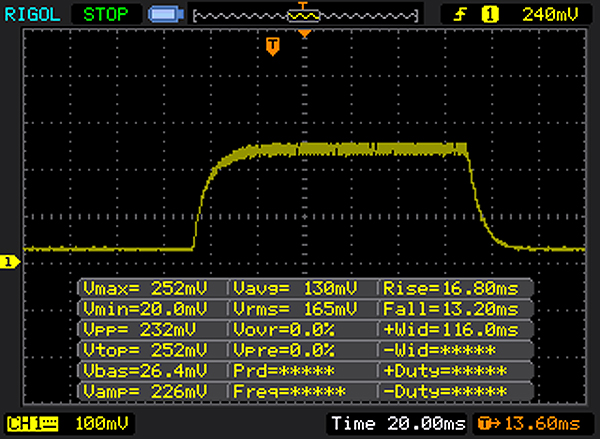 |
| ↘ 13 ms fall | ||
| The screen shows relatively slow response rates in our tests and may be too slow for gamers. In comparison, all tested devices range from 0.1 (minimum) to 240 (maximum) ms. » 74 % of all devices are better. This means that the measured response time is worse than the average of all tested devices (21.5 ms). | ||
| ↔ Response Time 50% Grey to 80% Grey | ||
| 39 ms ... rise ↗ and fall ↘ combined | ↗ 21 ms rise | 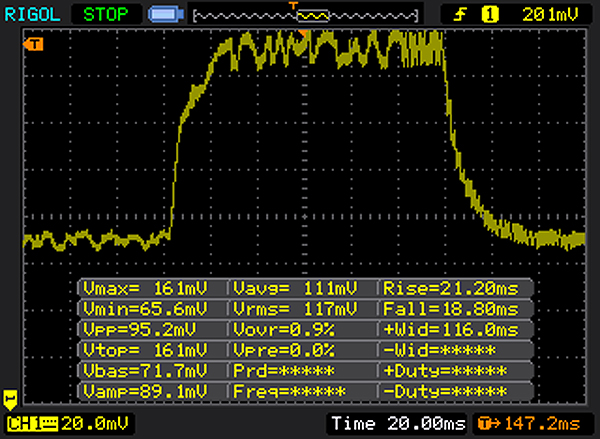 |
| ↘ 18 ms fall | ||
| The screen shows slow response rates in our tests and will be unsatisfactory for gamers. In comparison, all tested devices range from 0.2 (minimum) to 636 (maximum) ms. » 53 % of all devices are better. This means that the measured response time is worse than the average of all tested devices (33.7 ms). | ||
Performance
With the Legion Y520-15IKBN, Lenovo has an entry-model into the world of gaming notebooks in its offerings. It brings all the current computer games to the screen smoothly. Our test unit can be purchased for about 1000 Euros (~$1190; ~$930 in the US). Options with different features are available. Prices begin at about 800 Euros (~$952).
Extreme Cooling
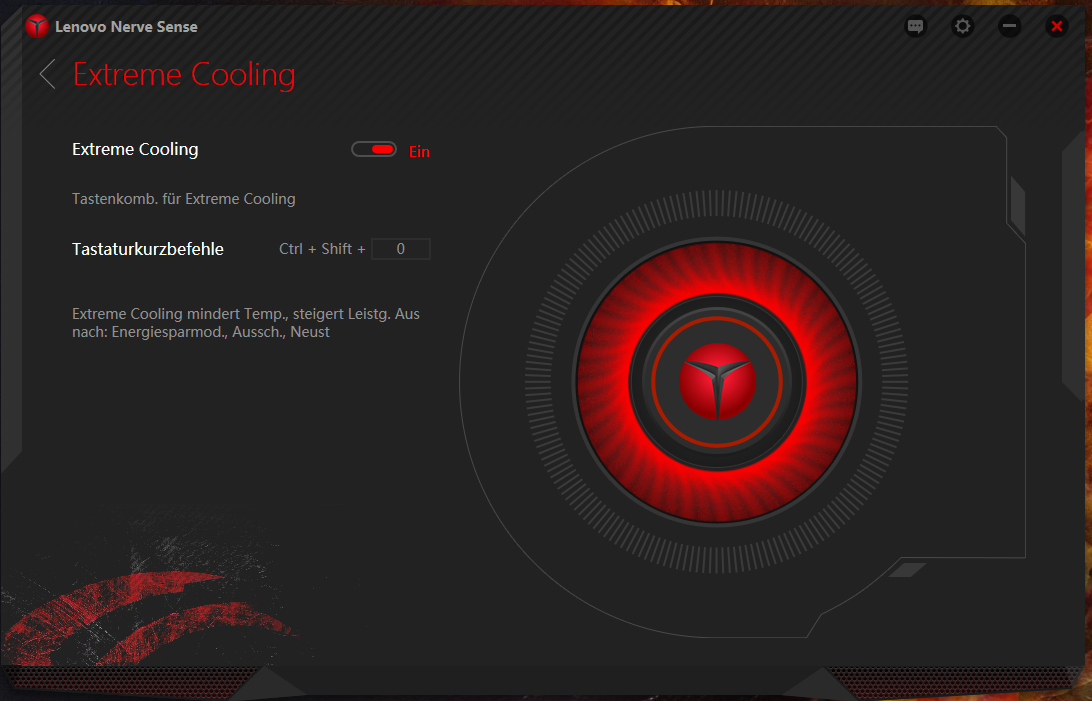
The Legion Y520 is equipped with a so-called Extreme-Cooling function, which means that the fans run constantly at full speed, even when idle. We were unable to detect any performance improvement with the Extreme-Cooling function activated - neither in the CPU, nor in the GPU.
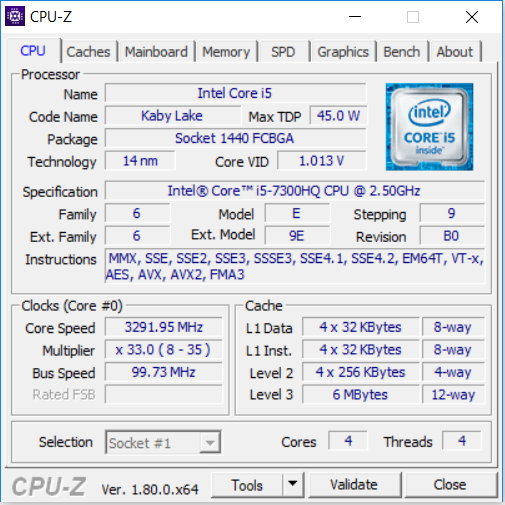
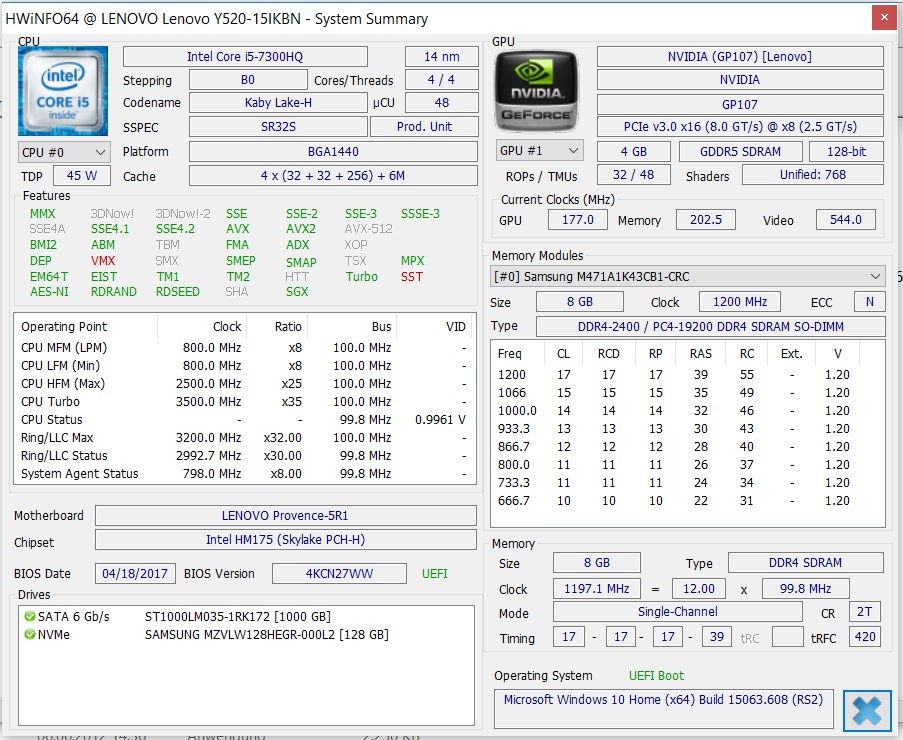
Processor
The Legion Y520 is driven by a Core i5-7300HQ (Kaby Lake) quad-core processor. This is a standard mobile processor (not ULV) that has a TDP of 45 watts. In contrast to Core-i7 quad-core processors such as the 7700HQ, the 7300HQ does not support Intel's Hyperthreading (allowing running of two threads per core simultaneously). Thus, each core of the 7300HQ can only run a single thread.
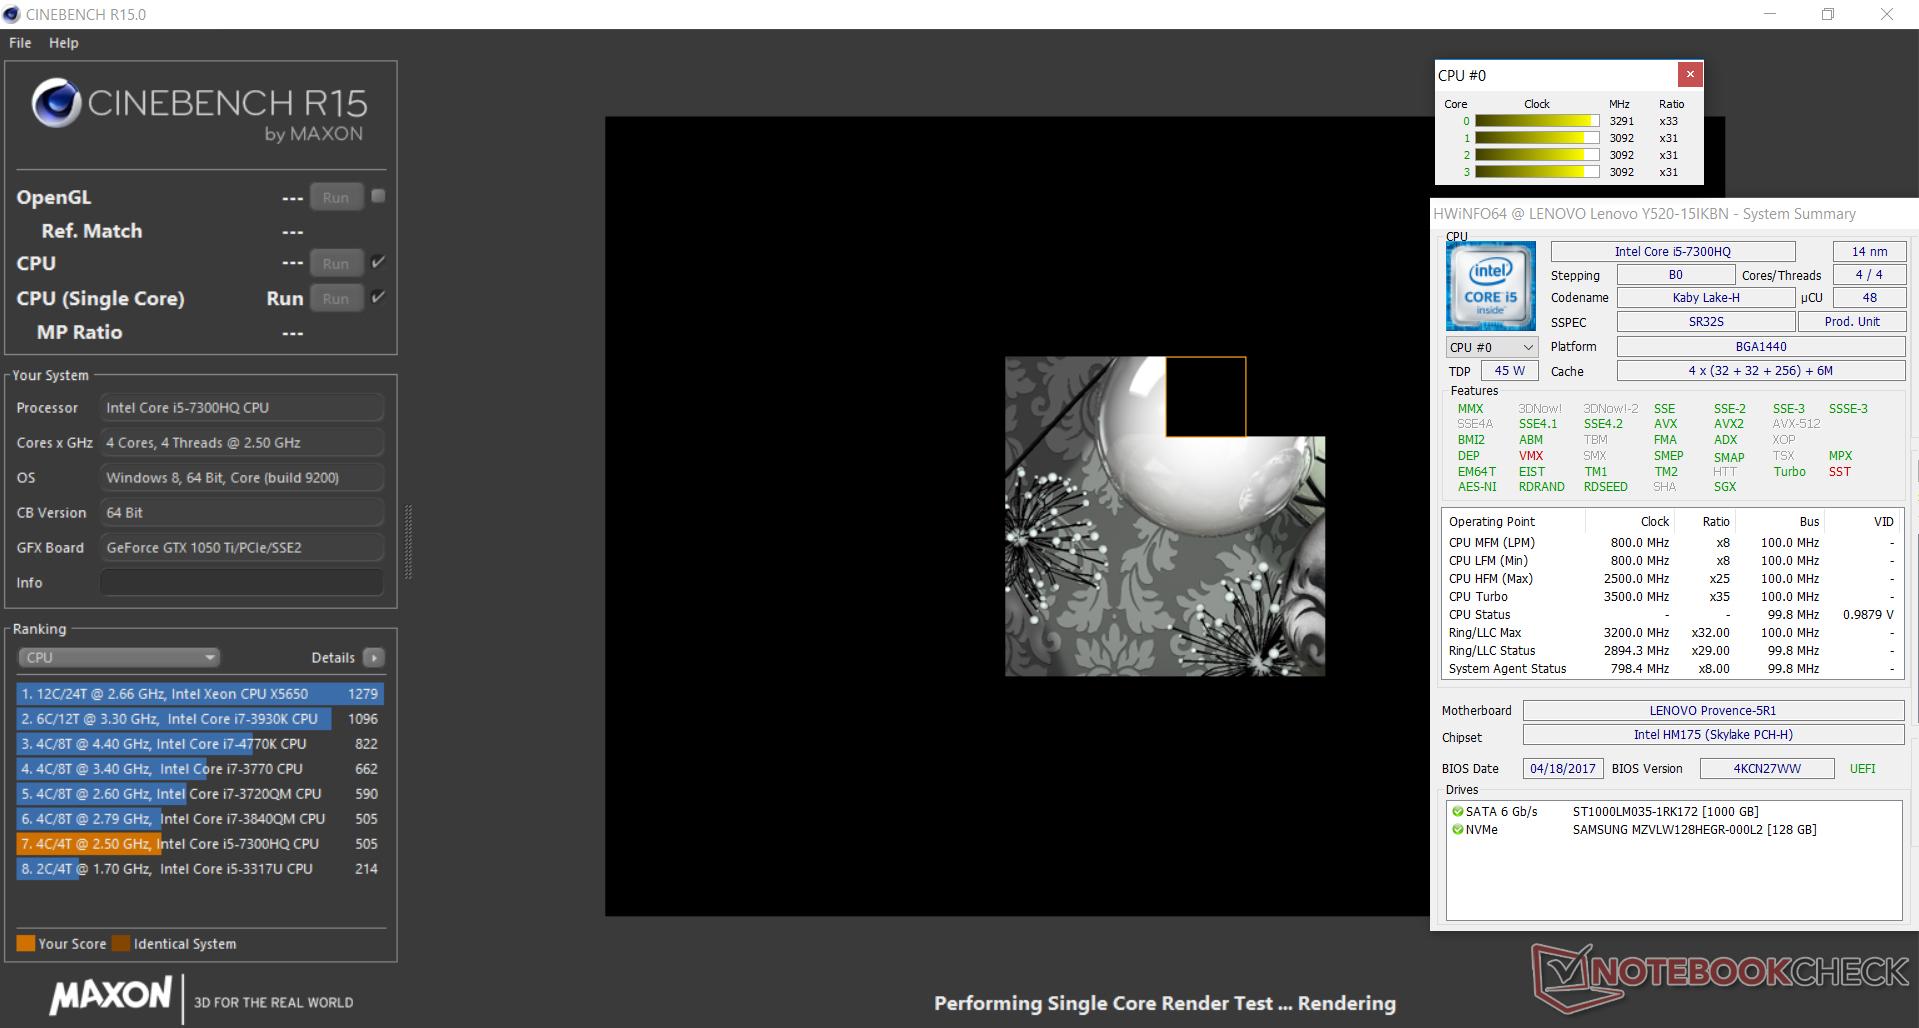
The quad-core processor operates at a basic clock speed of 2.5 GHz. via Turbo, the speed can be increased to 3.1 GHz (four cores), 3.3 GHz (two cores), or 3.5 GHz (single core). The CPU runs at 3.1 GHz (multithread) and 3.1 to 3.3 GHz (single thread) in our CPU test, behaving identically in mains and battery operation.
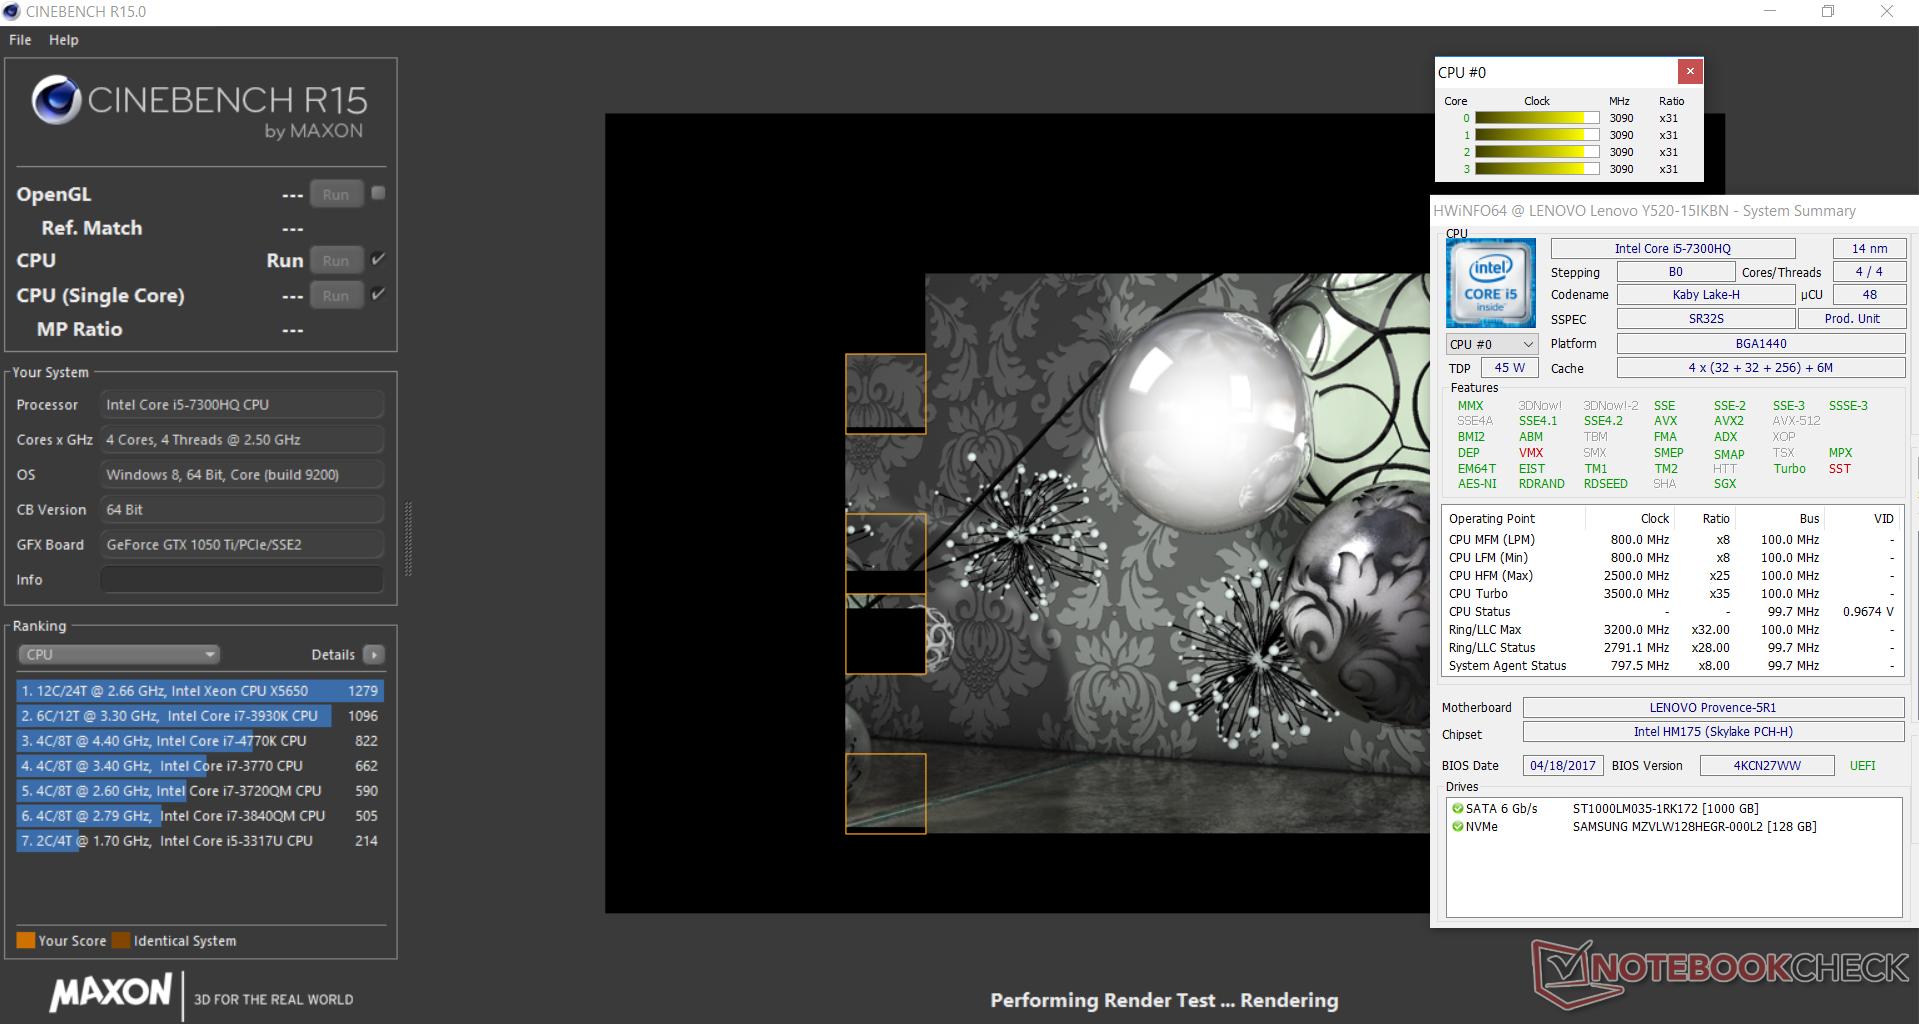
We test whether the Turbo is used continuously, by letting the Cinebench R15 multithread test run for about 30 minutes in a continuous loop. The results of the Y520 remain on the same level consistently, and there is no performance drop.
The single thread performance of the CPU remains a tad behind its capabilities, since the processor cannot run in full Turbo. Activating the Extreme-Cooling function does not make any difference. We saw the same behavior in the Y520 model we already tested, but there the multithread performance of the 7700HQ remains behind its capabilities.
| Geekbench 3 | |
| 32 Bit Multi-Core Score | |
| Acer Nitro 5 AN515-51-788E | |
| Lenovo Legion Y520-15IKBN 80WK0042GE | |
| Acer Aspire VX15 VX5-591G-589S | |
| 32 Bit Single-Core Score | |
| Acer Nitro 5 AN515-51-788E | |
| Acer Aspire VX15 VX5-591G-589S | |
| Lenovo Legion Y520-15IKBN 80WK0042GE | |
| Geekbench 4.0 | |
| 64 Bit Multi-Core Score | |
| Acer Nitro 5 AN515-51-788E | |
| Lenovo Legion Y520-15IKBN 80WK0042GE | |
| Acer Aspire VX15 VX5-591G-589S | |
| 64 Bit Single-Core Score | |
| Acer Nitro 5 AN515-51-788E | |
| Lenovo Legion Y520-15IKBN 80WK0042GE | |
| Acer Aspire VX15 VX5-591G-589S | |
| Geekbench 4.4 | |
| 64 Bit Multi-Core Score | |
| Acer Nitro 5 AN515-51-788E | |
| Lenovo Legion Y520-15IKBN 80WK0042GE | |
| Acer Aspire VX15 VX5-591G-589S | |
| 64 Bit Single-Core Score | |
| Acer Nitro 5 AN515-51-788E | |
| Lenovo Legion Y520-15IKBN 80WK0042GE | |
| Acer Aspire VX15 VX5-591G-589S | |
| JetStream 1.1 - Total Score | |
| Medion Erazer X6603 (Edge 38.14393.1066.0) | |
| HP Omen 15-ax213ng (Edge 40.15063.0.0) | |
| Lenovo Legion Y520-15IKBN-80WK001KUS | |
| Acer Nitro 5 AN515-51-788E (Edge 40) | |
| Acer Aspire VX15 VX5-591G-589S (Edge 38) | |
| Lenovo Legion Y520-15IKBN 80WK0042GE (Edge 40) | |
| Asus FX502VM-AS73 (Edge 38.14393.0.0) | |
System Performance
A look at the excellent results in the PC Mark benchmarks tells us that the computer has more than enough computing power for all the usual application areas. Besides gaming, this also includes image and video processing. There is nothing to complain in the subjective operating speeds. The computer runs fast and smoothly. The overall performance could still be increased slightly by inserting a second working memory module (= active dual-channel mode).
| PCMark 7 Score | 5555 points | |
| PCMark 8 Home Score Accelerated v2 | 3651 points | |
| PCMark 8 Creative Score Accelerated v2 | 4608 points | |
| PCMark 8 Work Score Accelerated v2 | 4746 points | |
| PCMark 10 Score | 3995 points | |
Help | ||
Storage Solution
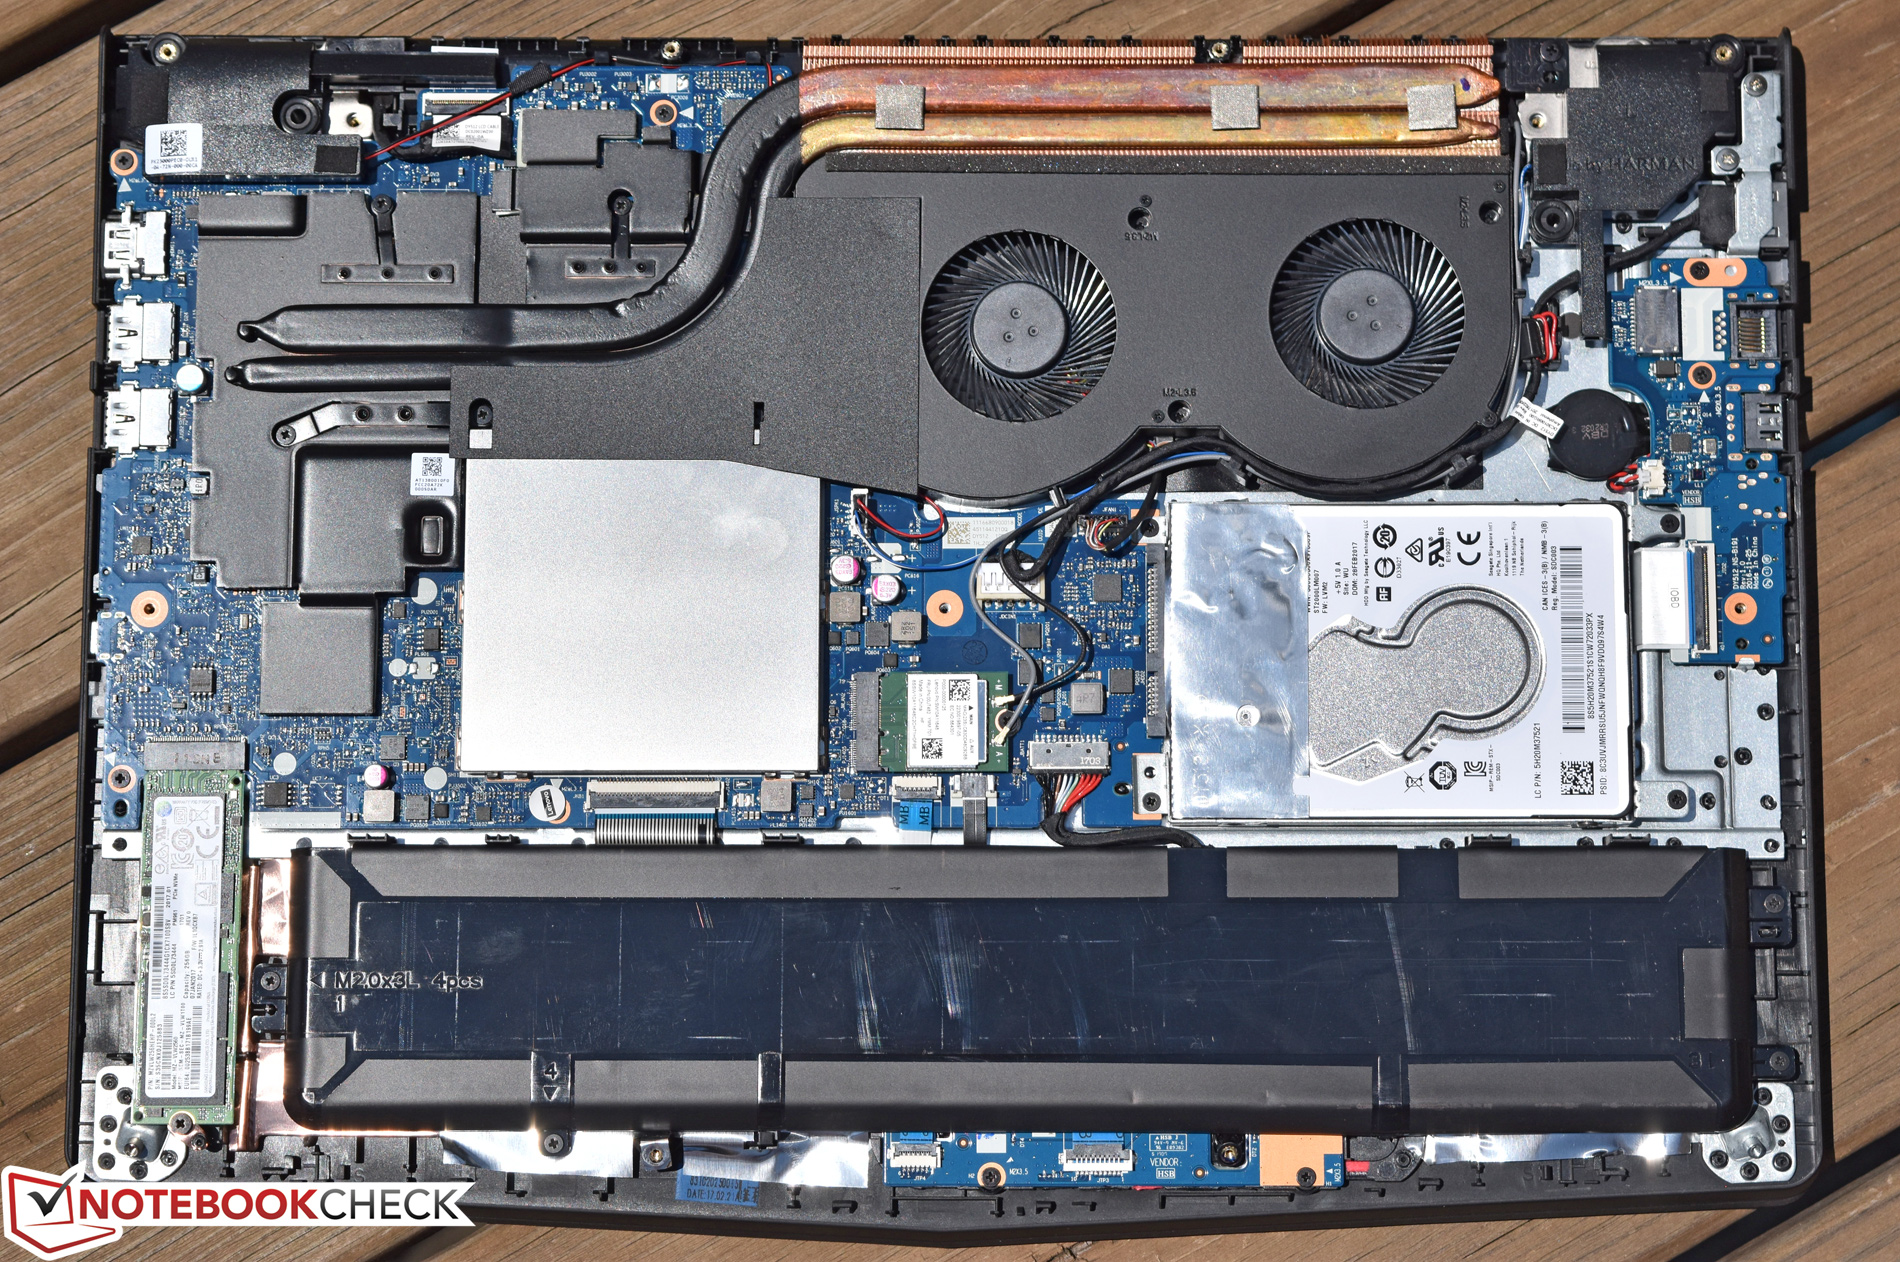
Lenovo has equipped the Legion Y520 with a Samsung NVMe SSD, which is connected via PCI Express x4. This enables considerably higher transfer speeds than with SATA III. Accordingly, the transfer rates are excellent. The SSD has a storage capacity of 128 GB of which about 90 GB are still usable in the delivery state. However, the laptop does not lack any storage space, since in addition to the SSD, there is also a conventional 2.5-inch hard drive in the case, which comes from Seagate and offers 1 TB of storage.

| Lenovo Legion Y520-15IKBN 80WK0042GE Samsung PM961 NVMe MZVLW128HEGR | Lenovo Legion Y520-15IKBN-80WK001KUS Samsung PM961 MZVLW256HEHP | HP Omen 15-ax213ng Samsung PM961 MZVLW256HEHP | Dell Inspiron 15 7000 7567 Gaming (Core i5-7300HQ, GTX 1050) Toshiba MQ02ABD100H | Asus FX502VM-AS73 SK Hynix HFS256G39TND-N210A | Acer Aspire VX15 VX5-591G-589S Hynix HFS128G39TND | Acer Nitro 5 AN515-51-788E Intel SSD 600p SSDPEKKW256G7 | |
|---|---|---|---|---|---|---|---|
| CrystalDiskMark 3.0 | 74% | 91% | -96% | -46% | -38% | 28% | |
| Read Seq | 2127 | 2170 2% | 1657 -22% | 84.7 -96% | 503 -76% | 510 -76% | 945 -56% |
| Write Seq | 796 | 1202 51% | 1208 52% | 65.4 -92% | 138.2 -83% | 137.6 -83% | 559 -30% |
| Read 512 | 455.6 | 786 73% | 806 77% | 19.86 -96% | 343.5 -25% | 362.1 -21% | 639 40% |
| Write 512 | 196.7 | 822 318% | 807 310% | 28.43 -86% | 137.8 -30% | 137.2 -30% | 561 185% |
| Read 4k | 46.07 | 58.9 28% | 62.6 36% | 0.531 -99% | 29.36 -36% | 35.18 -24% | 24.24 -47% |
| Write 4k | 154.8 | 146.4 -5% | 176.9 14% | 0.481 -100% | 70.9 -54% | 104.8 -32% | 122.7 -21% |
| Read 4k QD32 | 480.9 | 457.7 -5% | 650 35% | 1.105 -100% | 369.9 -23% | 375.8 -22% | 288.5 -40% |
| Write 4k QD32 | 170.6 | 392.9 130% | 557 226% | 0.505 -100% | 99.7 -42% | 138.1 -19% | 504 195% |
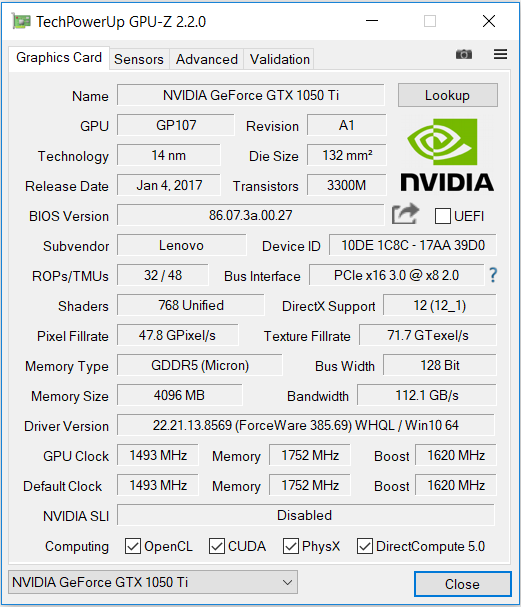
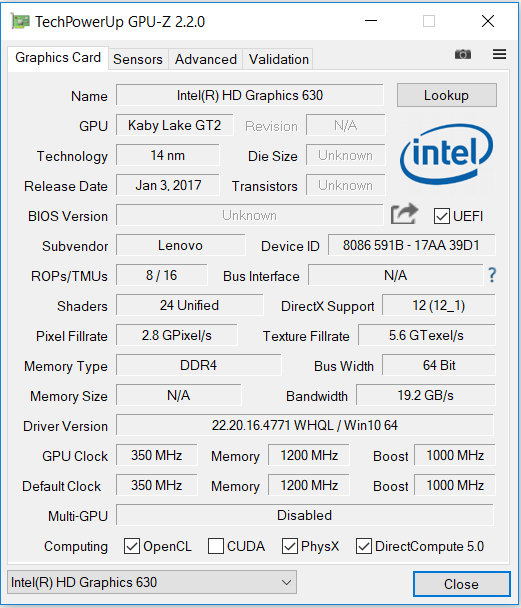
Graphics Card
The Legion Y520 uses Nvidia's GeForce GTX 1050 Ti graphics core, which represents the upper mid-range. The GPU supports DirectX 12 and reaches speeds of up to 1772 MHz. It is accompanied by 4096 MB of GDDR5 graphics storage. The results in the 3D Mark benchmark show no abnormalities and remain within the normal range of this graphics core. The Intel HD Graphics 630 GPU that comes with the CPU is active, so the switching graphics solution (Optimus) is operating here.
| 3DMark 06 Standard Score | 23891 points | |
| 3DMark 11 Performance | 8596 points | |
| 3DMark Ice Storm Standard Score | 108099 points | |
| 3DMark Cloud Gate Standard Score | 16084 points | |
| 3DMark Fire Strike Score | 6447 points | |
| 3DMark Fire Strike Extreme Score | 3450 points | |
| 3DMark Time Spy Score | 2427 points | |
Help | ||
Gaming Performance
Not surprisingly, the notebook gives no problems on the gaming front and brings all the current games to the screen smoothly. In most cases, the resolution of the screen (Full HD) can be fully used. You sometimes have to make compromises in the quality level and, depending on the game, a medium to high level has to be used. Games with lesser performance demands also allow the maximum quality settings.
With the game "The Witcher 3," we test whether the frame rates remain largely constant over a longer period of time, letting the game run for about 60 minutes in Full HD resolution and maximum quality settings. During the whole time, the character of the gamer is not moved. We did not notice any drop in the frame rates.
| low | med. | high | ultra | |
| Tomb Raider (2013) | 309.9 | 288.7 | 198.4 | 93.1 |
| BioShock Infinite (2013) | 222.2 | 188.5 | 165.2 | 70 |
| The Witcher 3 (2015) | 116.7 | 86.1 | 47.8 | 25.6 |
| The Witcher 3 - 1920x1080 High Graphics & Postprocessing (Nvidia HairWorks Off) | |
| HP Omen 15-ax213ng | |
| Lenovo Legion Y520-15IKBN 80WK0042GE | |
| Acer Nitro 5 AN515-51-788E | |
| Acer Aspire VX5-591G-75C4 VX15 | |
| Dell Inspiron 15 7000 7567 Gaming (Core i5-7300HQ, GTX 1050) | |
Emissions
Noise Emissions
When idle, the fan ran constantly at a low speed, which can be heard as a low, constant whirring. Under load, the fans speed up. During the stress test, we measure a noise level of 41.7 dB(A), which is quite a good value for a gaming notebook. If you activate the Extreme-Cooling function, the fans run constantly at full speed.
Noise Level
| Idle |
| 31.9 / 31.9 / 31.9 dB(A) |
| Load |
| 34.6 / 41.7 dB(A) |
 | ||
30 dB silent 40 dB(A) audible 50 dB(A) loud |
||
min: | ||
| Lenovo Legion Y520-15IKBN 80WK0042GE i5-7300HQ, GeForce GTX 1050 Ti Mobile | Lenovo Legion Y520-15IKBN-80WK001KUS i7-7700HQ, GeForce GTX 1050 Ti Mobile | HP Omen 15-ax213ng i7-7700HQ, GeForce GTX 1050 Ti Mobile | Dell Inspiron 15 7000 7567 Gaming (Core i5-7300HQ, GTX 1050) i5-7300HQ, GeForce GTX 1050 Mobile | Asus FX502VM-AS73 i7-7700HQ, GeForce GTX 1060 Mobile | Acer Aspire VX15 VX5-591G-589S i5-7300HQ, GeForce GTX 1050 Mobile | Acer Nitro 5 AN515-51-788E i7-7700HQ, GeForce GTX 1050 Ti Mobile | |
|---|---|---|---|---|---|---|---|
| Noise | 0% | -15% | -5% | -7% | 6% | -3% | |
| off / environment * | 30.6 | 27.7 9% | 30 2% | 28 8% | 28.7 6% | 30 2% | 30.6 -0% |
| Idle Minimum * | 31.9 | 30.5 4% | 32 -0% | 31.6 1% | 30.6 4% | 30 6% | 30.6 4% |
| Idle Average * | 31.9 | 30.5 4% | 34 -7% | 31.8 -0% | 30.6 4% | 30 6% | 30.7 4% |
| Idle Maximum * | 31.9 | 30.6 4% | 36 -13% | 31.8 -0% | 31 3% | 31.1 3% | 30.7 4% |
| Load Average * | 34.6 | 40 -16% | 48 -39% | 36.3 -5% | 46.2 -34% | 31.3 10% | 43 -24% |
| Witcher 3 ultra * | 39.3 | 40 -2% | 49 -25% | 46.3 -18% | 39.7 -1% | ||
| Load Maximum * | 41.7 | 42.6 -2% | 51 -22% | 49 -18% | 52.3 -25% | 38.9 7% | 45.8 -10% |
* ... smaller is better
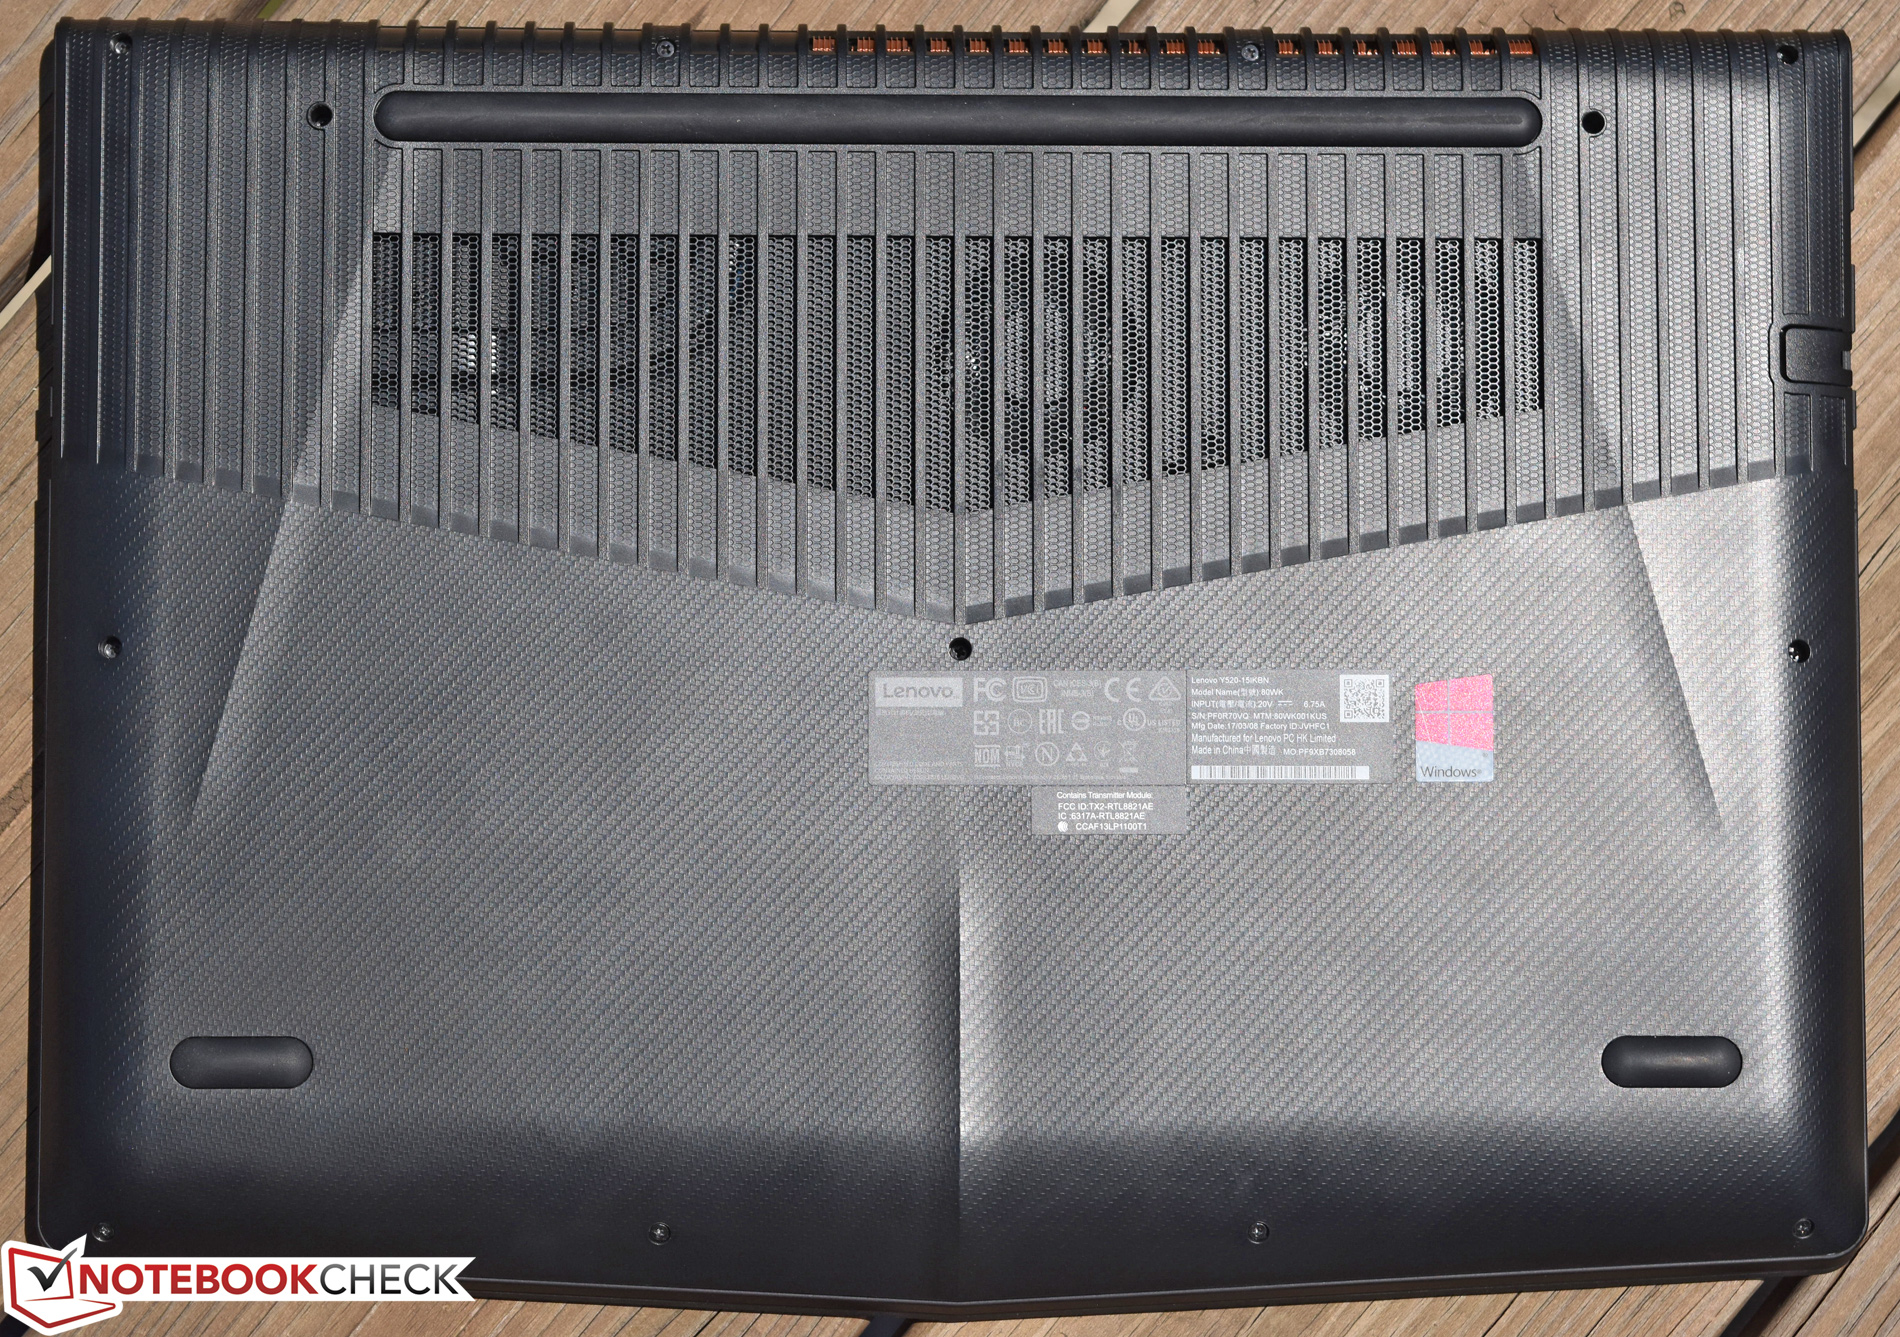
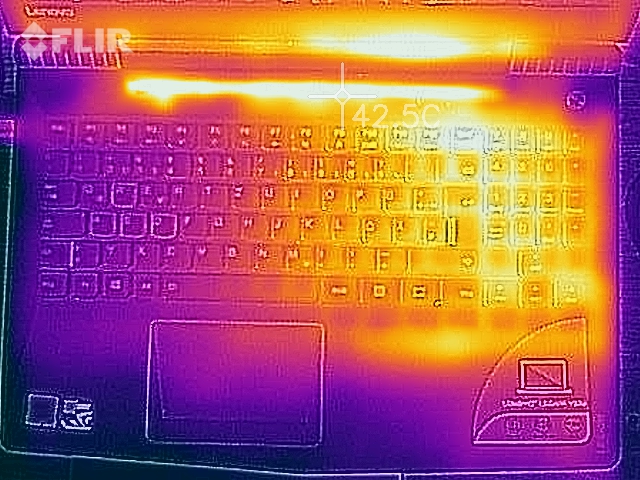
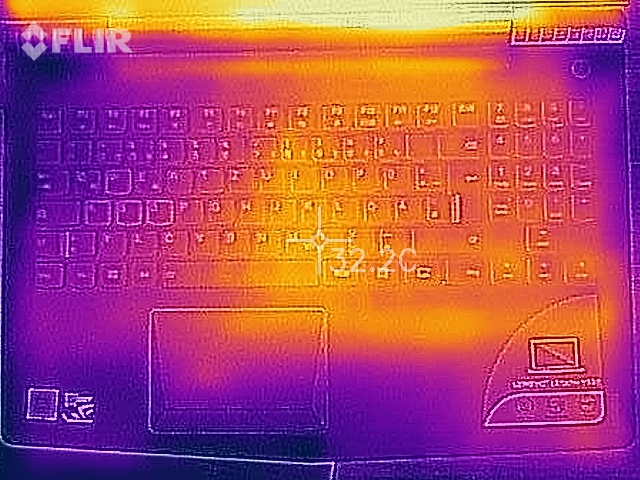
Temperature
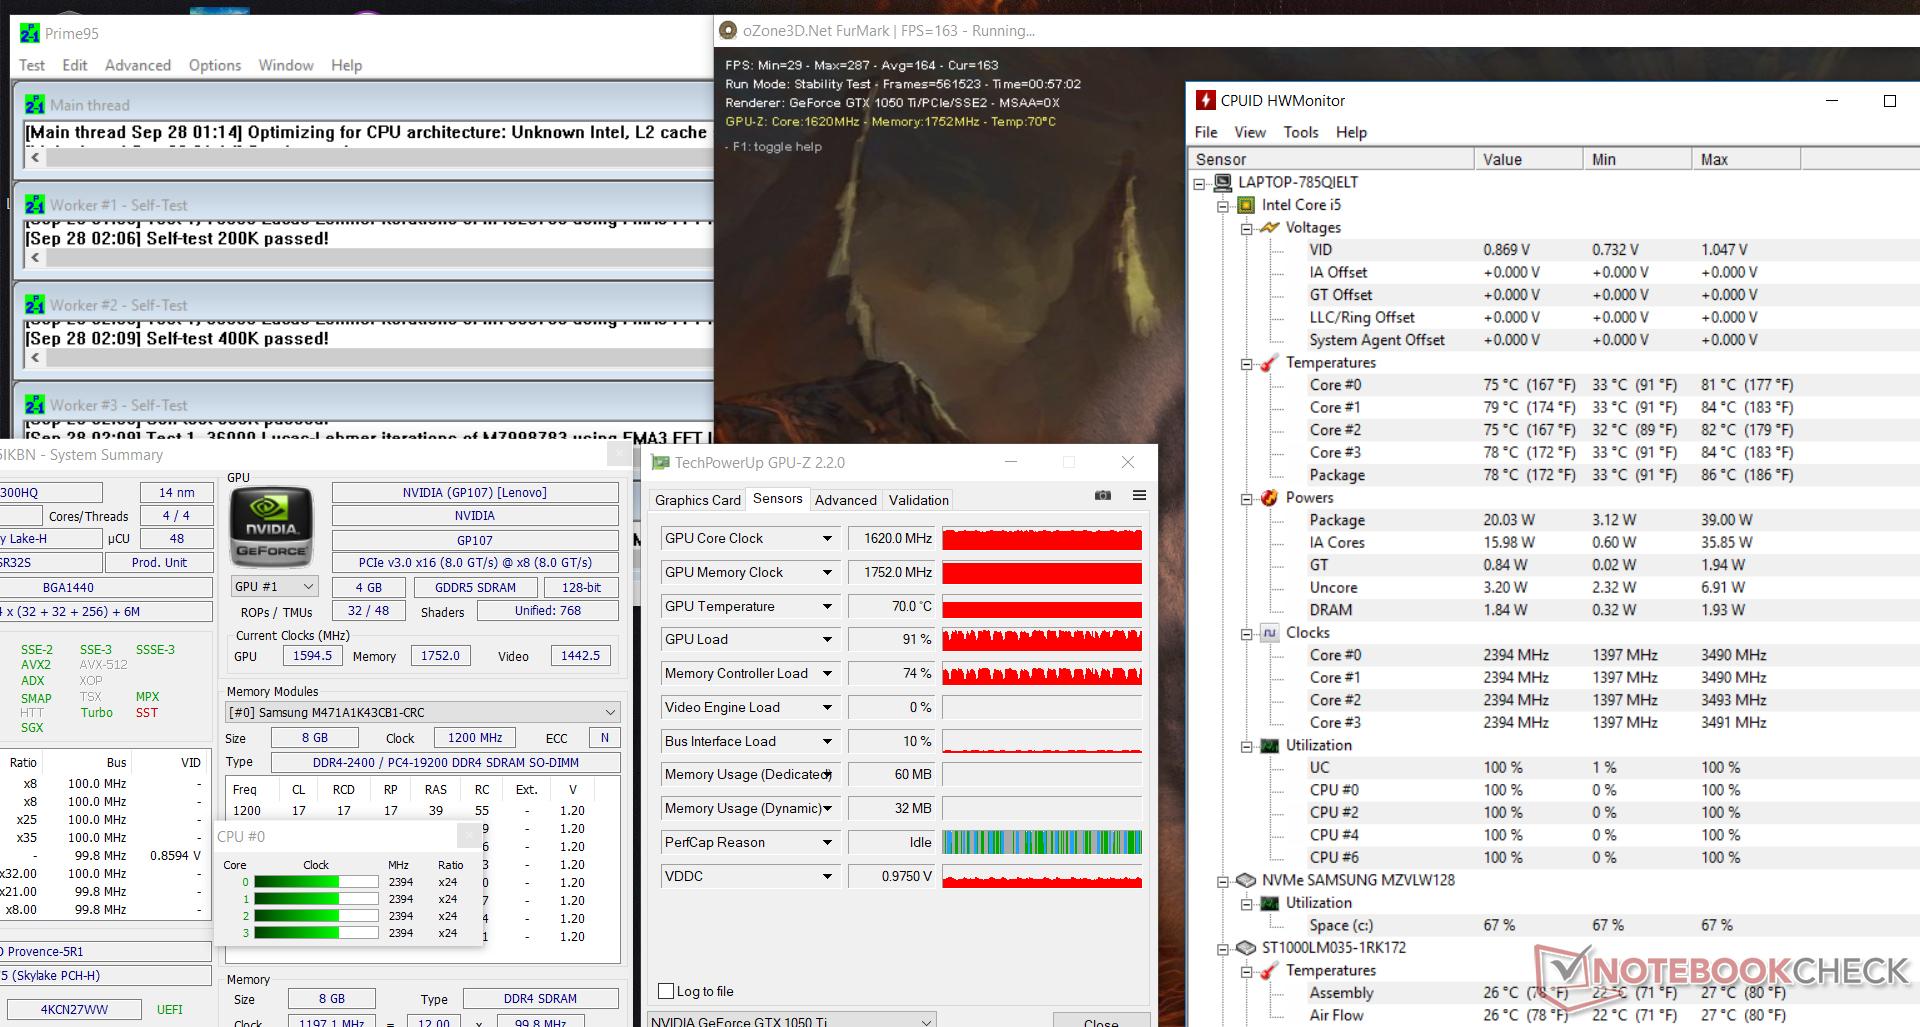
The Legion Y520 runs through our stress test (Prime95 and FurMark running continuously for at least one hour) in slightly different ways in mains and battery operation. The processor runs at 3.1 GHz for 3 to 4 minutes, is then throttled to 2.4 GHz, and remains on this level in mains and battery operation. The clock speed of the graphics core is at 1700 MHz (mains operation) and 700 to 1700 MHz (battery operation).
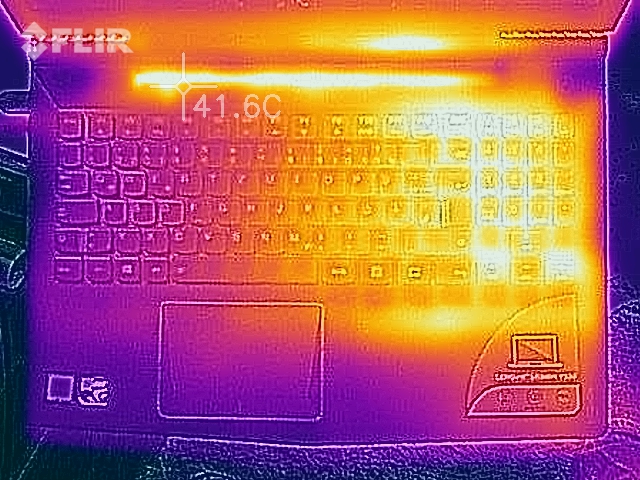
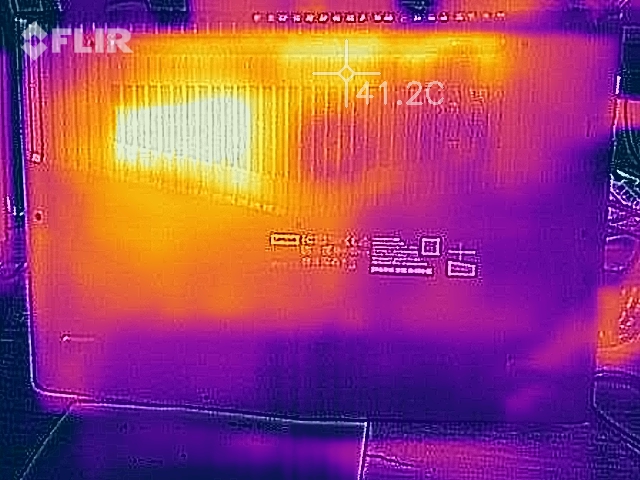
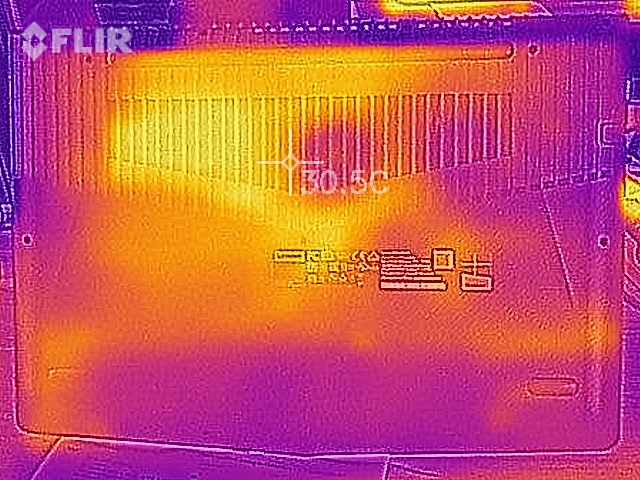
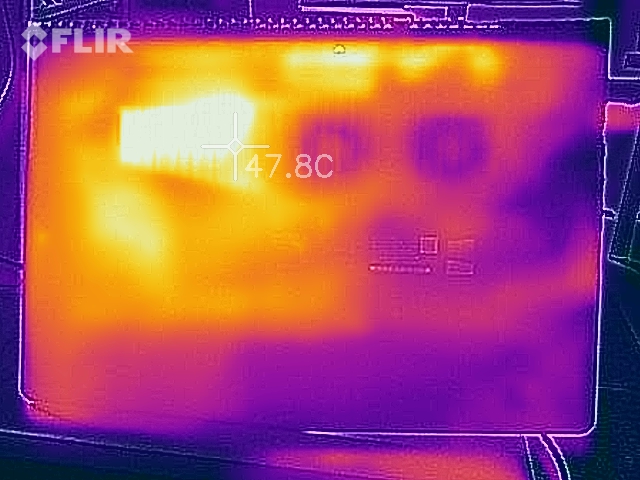
At no time does the computer warm up too much. During the stress tests, the temperatures remain below 40 °C (104 °F) at all measurement points. While running the Witcher 3 test (the game runs for 1 hour in Full HD resolution and maximum quality settings), the warming is slightly higher.
(+) The maximum temperature on the upper side is 39.6 °C / 103 F, compared to the average of 40.4 °C / 105 F, ranging from 21.2 to 68.8 °C for the class Gaming.
(+) The bottom heats up to a maximum of 38.4 °C / 101 F, compared to the average of 43.2 °C / 110 F
(+) In idle usage, the average temperature for the upper side is 21.1 °C / 70 F, compared to the device average of 33.8 °C / 93 F.
(±) Playing The Witcher 3, the average temperature for the upper side is 33.5 °C / 92 F, compared to the device average of 33.8 °C / 93 F.
(+) The palmrests and touchpad are reaching skin temperature as a maximum (32.9 °C / 91.2 F) and are therefore not hot.
(-) The average temperature of the palmrest area of similar devices was 28.9 °C / 84 F (-4 °C / -7.2 F).
| Lenovo Legion Y520-15IKBN 80WK0042GE i5-7300HQ, GeForce GTX 1050 Ti Mobile | Lenovo Legion Y520-15IKBN-80WK001KUS i7-7700HQ, GeForce GTX 1050 Ti Mobile | HP Omen 15-ax213ng i7-7700HQ, GeForce GTX 1050 Ti Mobile | Dell Inspiron 15 7000 7567 Gaming (Core i5-7300HQ, GTX 1050) i5-7300HQ, GeForce GTX 1050 Mobile | Asus FX502VM-AS73 i7-7700HQ, GeForce GTX 1060 Mobile | Acer Aspire VX15 VX5-591G-589S i5-7300HQ, GeForce GTX 1050 Mobile | Acer Nitro 5 AN515-51-788E i7-7700HQ, GeForce GTX 1050 Ti Mobile | |
|---|---|---|---|---|---|---|---|
| Heat | -28% | -34% | -22% | -38% | -25% | -13% | |
| Maximum Upper Side * | 39.6 | 46.8 -18% | 52.4 -32% | 47.2 -19% | 53.2 -34% | 47.2 -19% | 41.1 -4% |
| Maximum Bottom * | 38.4 | 55.8 -45% | 54.2 -41% | 43.2 -13% | 56.8 -48% | 42.2 -10% | 38.8 -1% |
| Idle Upper Side * | 22.8 | 27.6 -21% | 30.5 -34% | 28.6 -25% | 28.8 -26% | 31.8 -39% | 28.7 -26% |
| Idle Bottom * | 22.1 | 28.4 -29% | 28.2 -28% | 29 -31% | 31.4 -42% | 29.5 -33% | 26.9 -22% |
* ... smaller is better
Speakers
Lenovo Legion Y520-15IKBN 80WK0042GE audio analysis
(-) | not very loud speakers (65.8 dB)
Bass 100 - 315 Hz
(-) | nearly no bass - on average 16.9% lower than median
(±) | linearity of bass is average (13.9% delta to prev. frequency)
Mids 400 - 2000 Hz
(+) | balanced mids - only 4.6% away from median
(±) | linearity of mids is average (8.8% delta to prev. frequency)
Highs 2 - 16 kHz
(+) | balanced highs - only 3.6% away from median
(±) | linearity of highs is average (12.7% delta to prev. frequency)
Overall 100 - 16.000 Hz
(±) | linearity of overall sound is average (22.6% difference to median)
Compared to same class
» 79% of all tested devices in this class were better, 5% similar, 16% worse
» The best had a delta of 6%, average was 18%, worst was 132%
Compared to all devices tested
» 62% of all tested devices were better, 6% similar, 32% worse
» The best had a delta of 4%, average was 25%, worst was 134%
Apple MacBook 12 (Early 2016) 1.1 GHz audio analysis
(+) | speakers can play relatively loud (83.6 dB)
Bass 100 - 315 Hz
(±) | reduced bass - on average 11.3% lower than median
(±) | linearity of bass is average (14.2% delta to prev. frequency)
Mids 400 - 2000 Hz
(+) | balanced mids - only 2.4% away from median
(+) | mids are linear (5.5% delta to prev. frequency)
Highs 2 - 16 kHz
(+) | balanced highs - only 2% away from median
(+) | highs are linear (4.5% delta to prev. frequency)
Overall 100 - 16.000 Hz
(+) | overall sound is linear (10.2% difference to median)
Compared to same class
» 5% of all tested devices in this class were better, 2% similar, 93% worse
» The best had a delta of 5%, average was 19%, worst was 53%
Compared to all devices tested
» 3% of all tested devices were better, 1% similar, 96% worse
» The best had a delta of 4%, average was 25%, worst was 134%
Frequency comparison (Checkboxes selectable!)
Power Management
Power Consumption
Across the whole range of loads, the power requirements of the Legion Y520 are on a normal level for a notebook of this performance class. When idle, we measure a maximum power consumption of up to 10.1 watts. During the stress test, the value rises up to 100 watts. The Y520 model we tested before uses 21.5 watts more, since it is equipped with a stronger Core-i7 processor. While running our Witcher 3 test, the power consumption of both models is the same. The power supply is rated at 135 watts.
| Off / Standby | |
| Idle | |
| Load |
|
| Lenovo Legion Y520-15IKBN 80WK0042GE i5-7300HQ, GeForce GTX 1050 Ti Mobile | Lenovo Legion Y520-15IKBN-80WK001KUS i7-7700HQ, GeForce GTX 1050 Ti Mobile | HP Omen 15-ax213ng i7-7700HQ, GeForce GTX 1050 Ti Mobile | Dell Inspiron 15 7000 7567 Gaming (Core i5-7300HQ, GTX 1050) i5-7300HQ, GeForce GTX 1050 Mobile | Asus FX502VM-AS73 i7-7700HQ, GeForce GTX 1060 Mobile | Acer Aspire VX15 VX5-591G-589S i5-7300HQ, GeForce GTX 1050 Mobile | Acer Nitro 5 AN515-51-788E i7-7700HQ, GeForce GTX 1050 Ti Mobile | |
|---|---|---|---|---|---|---|---|
| Power Consumption | -20% | -33% | -26% | -87% | -30% | -5% | |
| Idle Minimum * | 5.2 | 8.5 -63% | 6 -15% | 9.1 -75% | 14.9 -187% | 8.4 -62% | 4.1 21% |
| Idle Average * | 8.3 | 9.1 -10% | 11 -33% | 10.3 -24% | 15.1 -82% | 13.1 -58% | 6.9 17% |
| Idle Maximum * | 10.1 | 9.7 4% | 18 -78% | 13 -29% | 15.2 -50% | 14.2 -41% | 9.5 6% |
| Load Average * | 62.7 | 79.9 -27% | 81 -29% | 75.6 -21% | 105.8 -69% | 50 20% | 83 -32% |
| Witcher 3 ultra * | 94 | 97.7 -4% | 90 4% | 83.8 11% | 108 -15% | ||
| Load Maximum * | 100 | 121.5 -22% | 146 -46% | 115.2 -15% | 148.8 -49% | 111 -11% | 126 -26% |
* ... smaller is better
Battery Life
In our practically relevant WLAN test, we simulate the load when opening web sites via a script. The "Balanced" profile is active, the power-saving functions are deactivated, and the display brightness is adjusted to about 150 cd/m². The Legion Y520 achieves a runtime of 5:10 hours, and it lasts for 4:32 hours in the video test, where we run the short film Big Buck Bunny (H.264 coded, 1920x1080 pixels) in a continuous loop. The communication modules and power-saving functions are deactivated and the display brightness is lowered to 150 cd/m². Overall, the Y520 does slightly better than the Core-i7 sibling model.
| Lenovo Legion Y520-15IKBN 80WK0042GE i5-7300HQ, GeForce GTX 1050 Ti Mobile, 45 Wh | Lenovo Legion Y520-15IKBN-80WK001KUS i7-7700HQ, GeForce GTX 1050 Ti Mobile, 45 Wh | HP Omen 15-ax213ng i7-7700HQ, GeForce GTX 1050 Ti Mobile, 63.3 Wh | Acer Aspire VX5-591G-75C4 VX15 i7-7700HQ, GeForce GTX 1050 Ti Mobile, 52.5 Wh | Dell Inspiron 15 7000 7567 Gaming (Core i5-7300HQ, GTX 1050) i5-7300HQ, GeForce GTX 1050 Mobile, 74 Wh | Asus FX502VM-AS73 i7-7700HQ, GeForce GTX 1060 Mobile, 64 Wh | Medion Erazer X6603 i7-7700HQ, GeForce GTX 1050 Ti Mobile, 45 Wh | Acer Aspire VX15 VX5-591G-589S i5-7300HQ, GeForce GTX 1050 Mobile, 52.5 Wh | Acer Nitro 5 AN515-51-788E i7-7700HQ, GeForce GTX 1050 Ti Mobile, 48 Wh | |
|---|---|---|---|---|---|---|---|---|---|
| Battery Runtime | -29% | 13% | -17% | 69% | -25% | -31% | 6% | 16% | |
| Reader / Idle | 634 | 509 -20% | 765 21% | 322 -49% | 1091 72% | 363 -43% | 340 -46% | 893 41% | |
| H.264 | 272 | 196 -28% | 227 -17% | 309 14% | |||||
| WiFi v1.3 | 310 | 240 -23% | 428 38% | 302 -3% | 569 84% | 277 -11% | 257 -17% | 330 6% | 400 29% |
| Load | 81 | 46 -43% | 97 20% | 81 0% | 122 51% | 64 -21% | 46 -43% | 63 -22% |
Verdict
Pros
Cons
With the Lenovo Legion Y520 80WK0042GE, you get a 15.6-inch notebook that has a Kaby Lake quad-core processor and a GeForce GTX 1050 Ti graphics core on board. The hardware brings most of the games to the display smoothly in high resolutions and at medium to high quality settings. Very power-hungry games require a reduction of the resolution and/or the quality settings. Over the whole range of loads, the computer does not heat up too much and runs mostly quietly, at least while idling.
With the Legion Y520-15IKBN, Lenovo delivers a well equipped entry-level gamer.
Thanks to a good keyboard and quiet operation when idle and low loads, the computer is also usable in the office. A very fast NVMe SSD assures a fast running system. The storage necessary for a gaming notebook is provided by a 2.5-inch hard drive that is also installed. Both drives can be removed. For this, the case would have to be opened. Brightness and contrast of the matte IPS Full HD display are okay, but could have been a tad better in general.
Lenovo Legion Y520-15IKBN 80WK0042GE
-
10/02/2017 v6(old)
Sascha Mölck
More articles related to this device
Lenovo Legion Y520-15IKBN 80WK0042GE (Legion Y520 Series)Related Articles

Pricecompare
