Notebookcheck Logo

Intel Core i5-8500 vs Intel Core i3-9100F vs Intel Core i9-9900KS

Intel Core i5-8500

► remove from comparison Intel i5-8500

The Intel Core i5-8500 is a mid-range 6-core CPU. The processor belongs to the Coffee Lake generation and was presented in April 2018. It does not support Hyper-Threading, which means it can run six threads simultaneously. The base clock rate is 3 GHz and the CPU can speed up to 4.1 GHz under high load. Despite belonging to the new generation of CPUs, the Core i5-8500 is manufactured in an improved 14nm process.

Performance

The processor offers a strong performance increase compared to the Core i5-7500 due to its two additional cores. Single-core performance has not improved significantly compared to its Kaby Lake predecessor. As a mid-range model, the Core i5-8500 should be suitable for demanding games and programs.

Graphics

The integrated Intel UHD Graphics 630 iGPU is supposed to offer higher performance as its clock rate has been increased by 50-100 MHz. The build is identical to that of the Intel HD Graphics 630. We do expect a performance improvement, but as a low-end solution it will probably only display current games smoothly at reduced details - if at all.

Power Consumption

Intel specifies the TDP with 65 watts. Therefore, well-dimensioned cooling systems should easily manage to deal with the created heat. We expect increased efficiency due to the higher performance.

Intel Core i3-9100F

► remove from comparison Intel i3-9100F

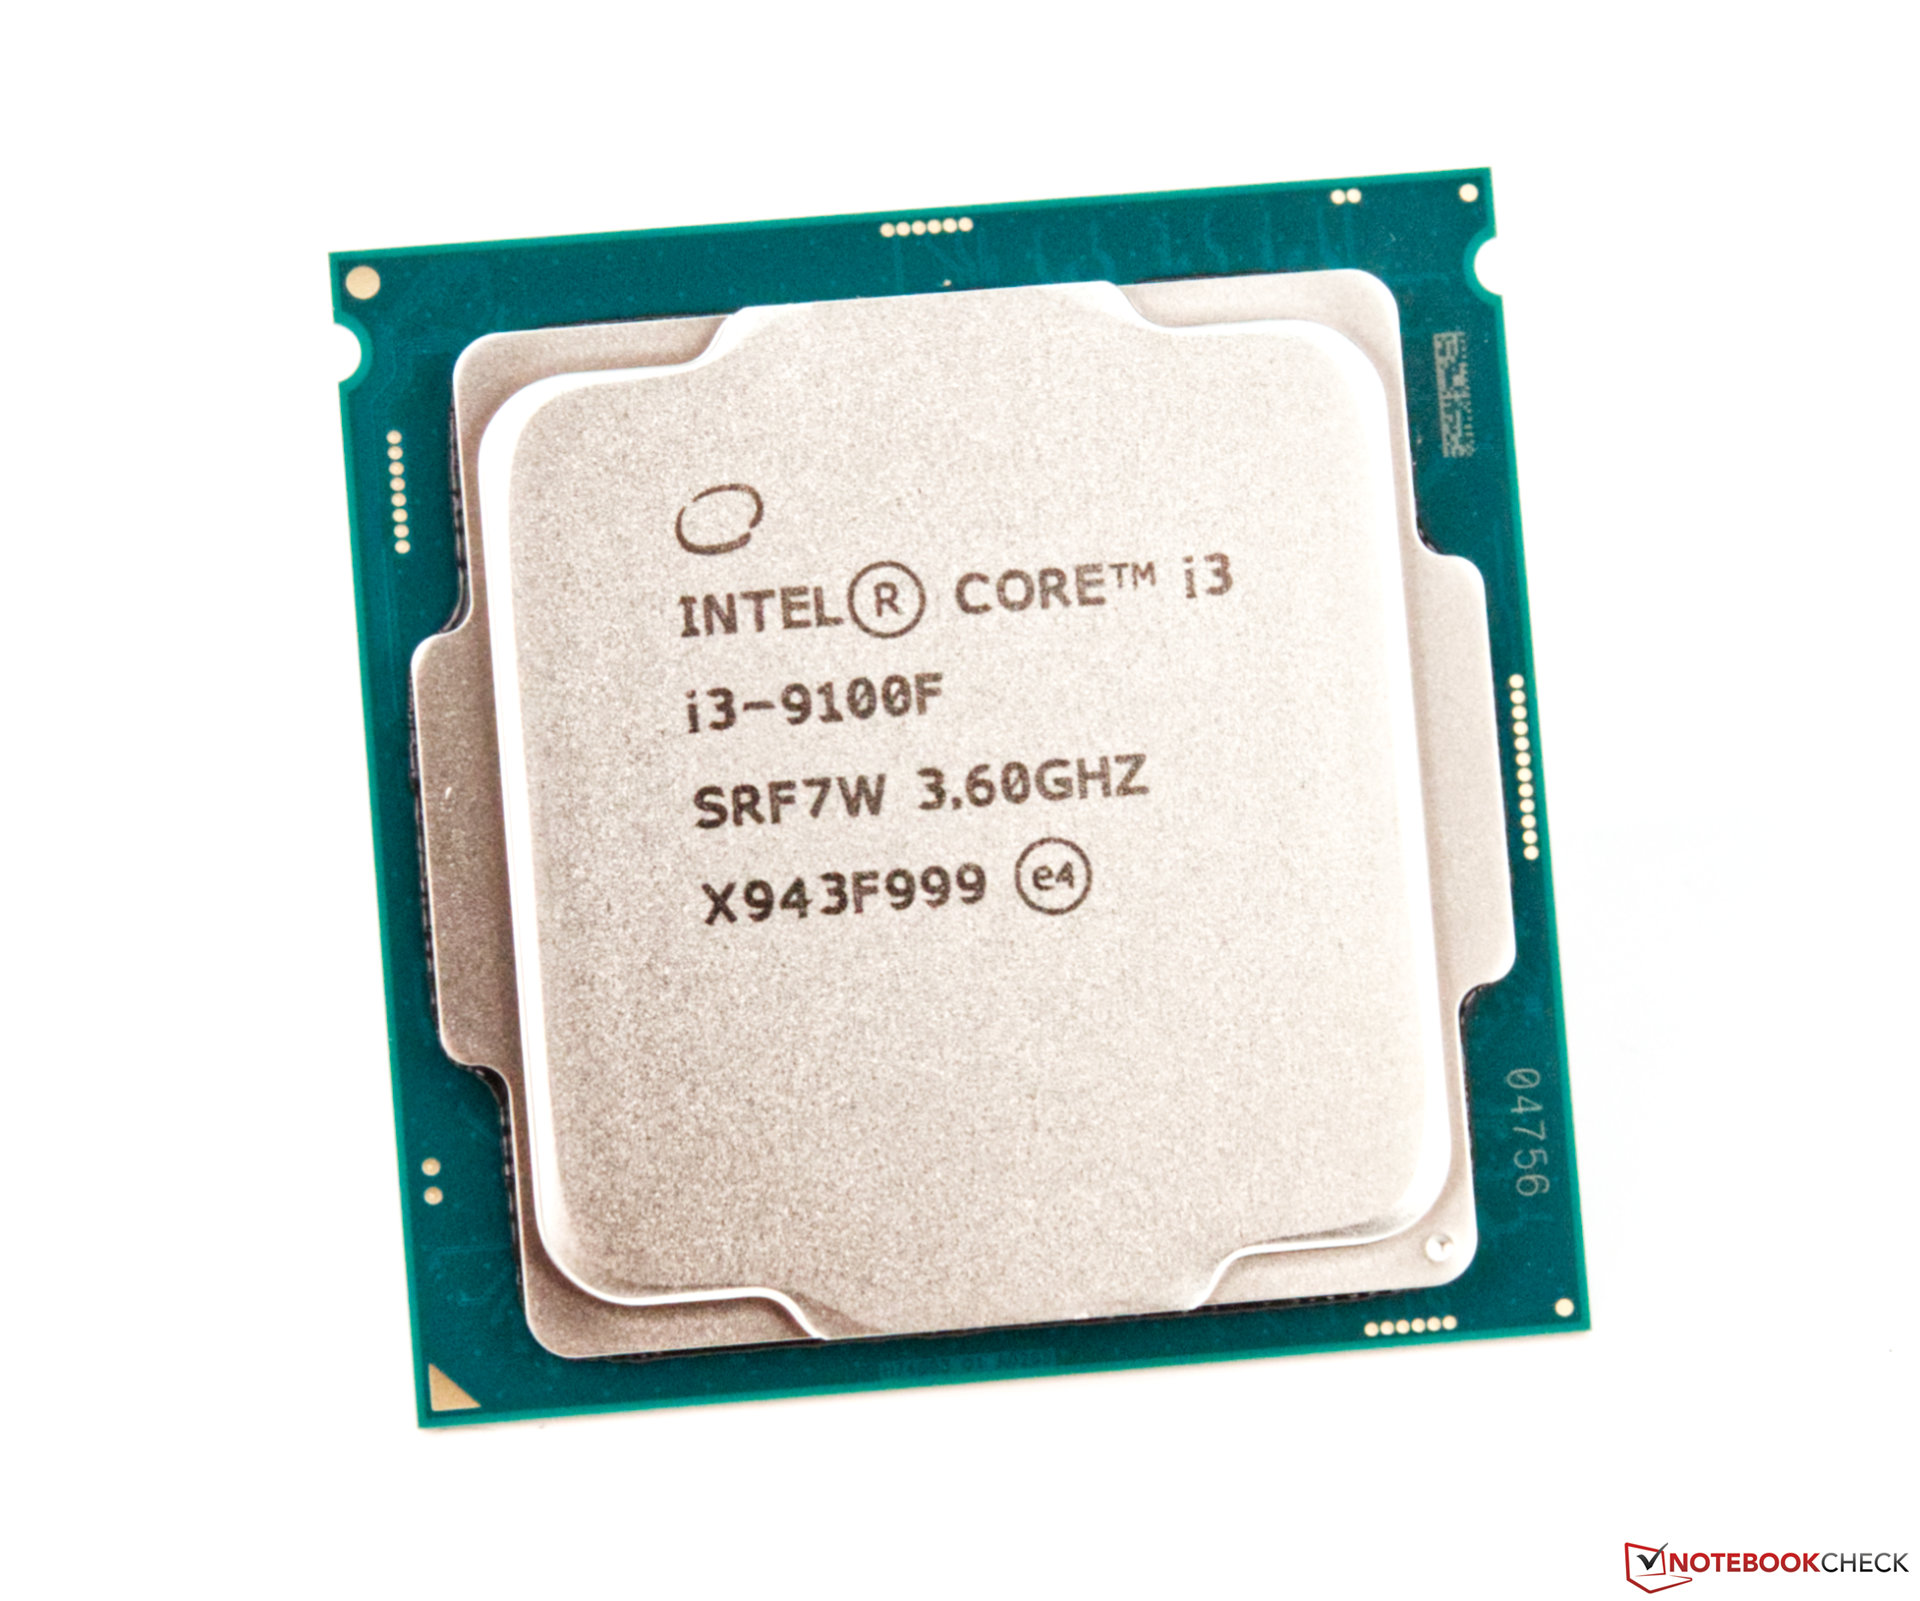
The Intel Core i3-9100F is an entry level Quad-Core processor for desktop PCs based on the Coffee Lake architecture. It offers four cores clocked at 3.6 - 4.2 GHz without HyperThreading / SMT support (4 threads only). The CPU is still manufactured in 14nm++ and does not feature an integrated graphics card. 

Compared to the older Core i3-8100, the i3-9100F offers around 10 to 15 percent higher performance. Therefore, the CPU is well suited for simple office tasks but less for high end gaming or demanding applications.

Intel specifies the CPU with a TDP of 65 Watt. For desktops that means that the processor wont need big cooling solutions and can be used in small cases.

Intel Core i9-9900KS

► remove from comparison Intel i9-9900KS

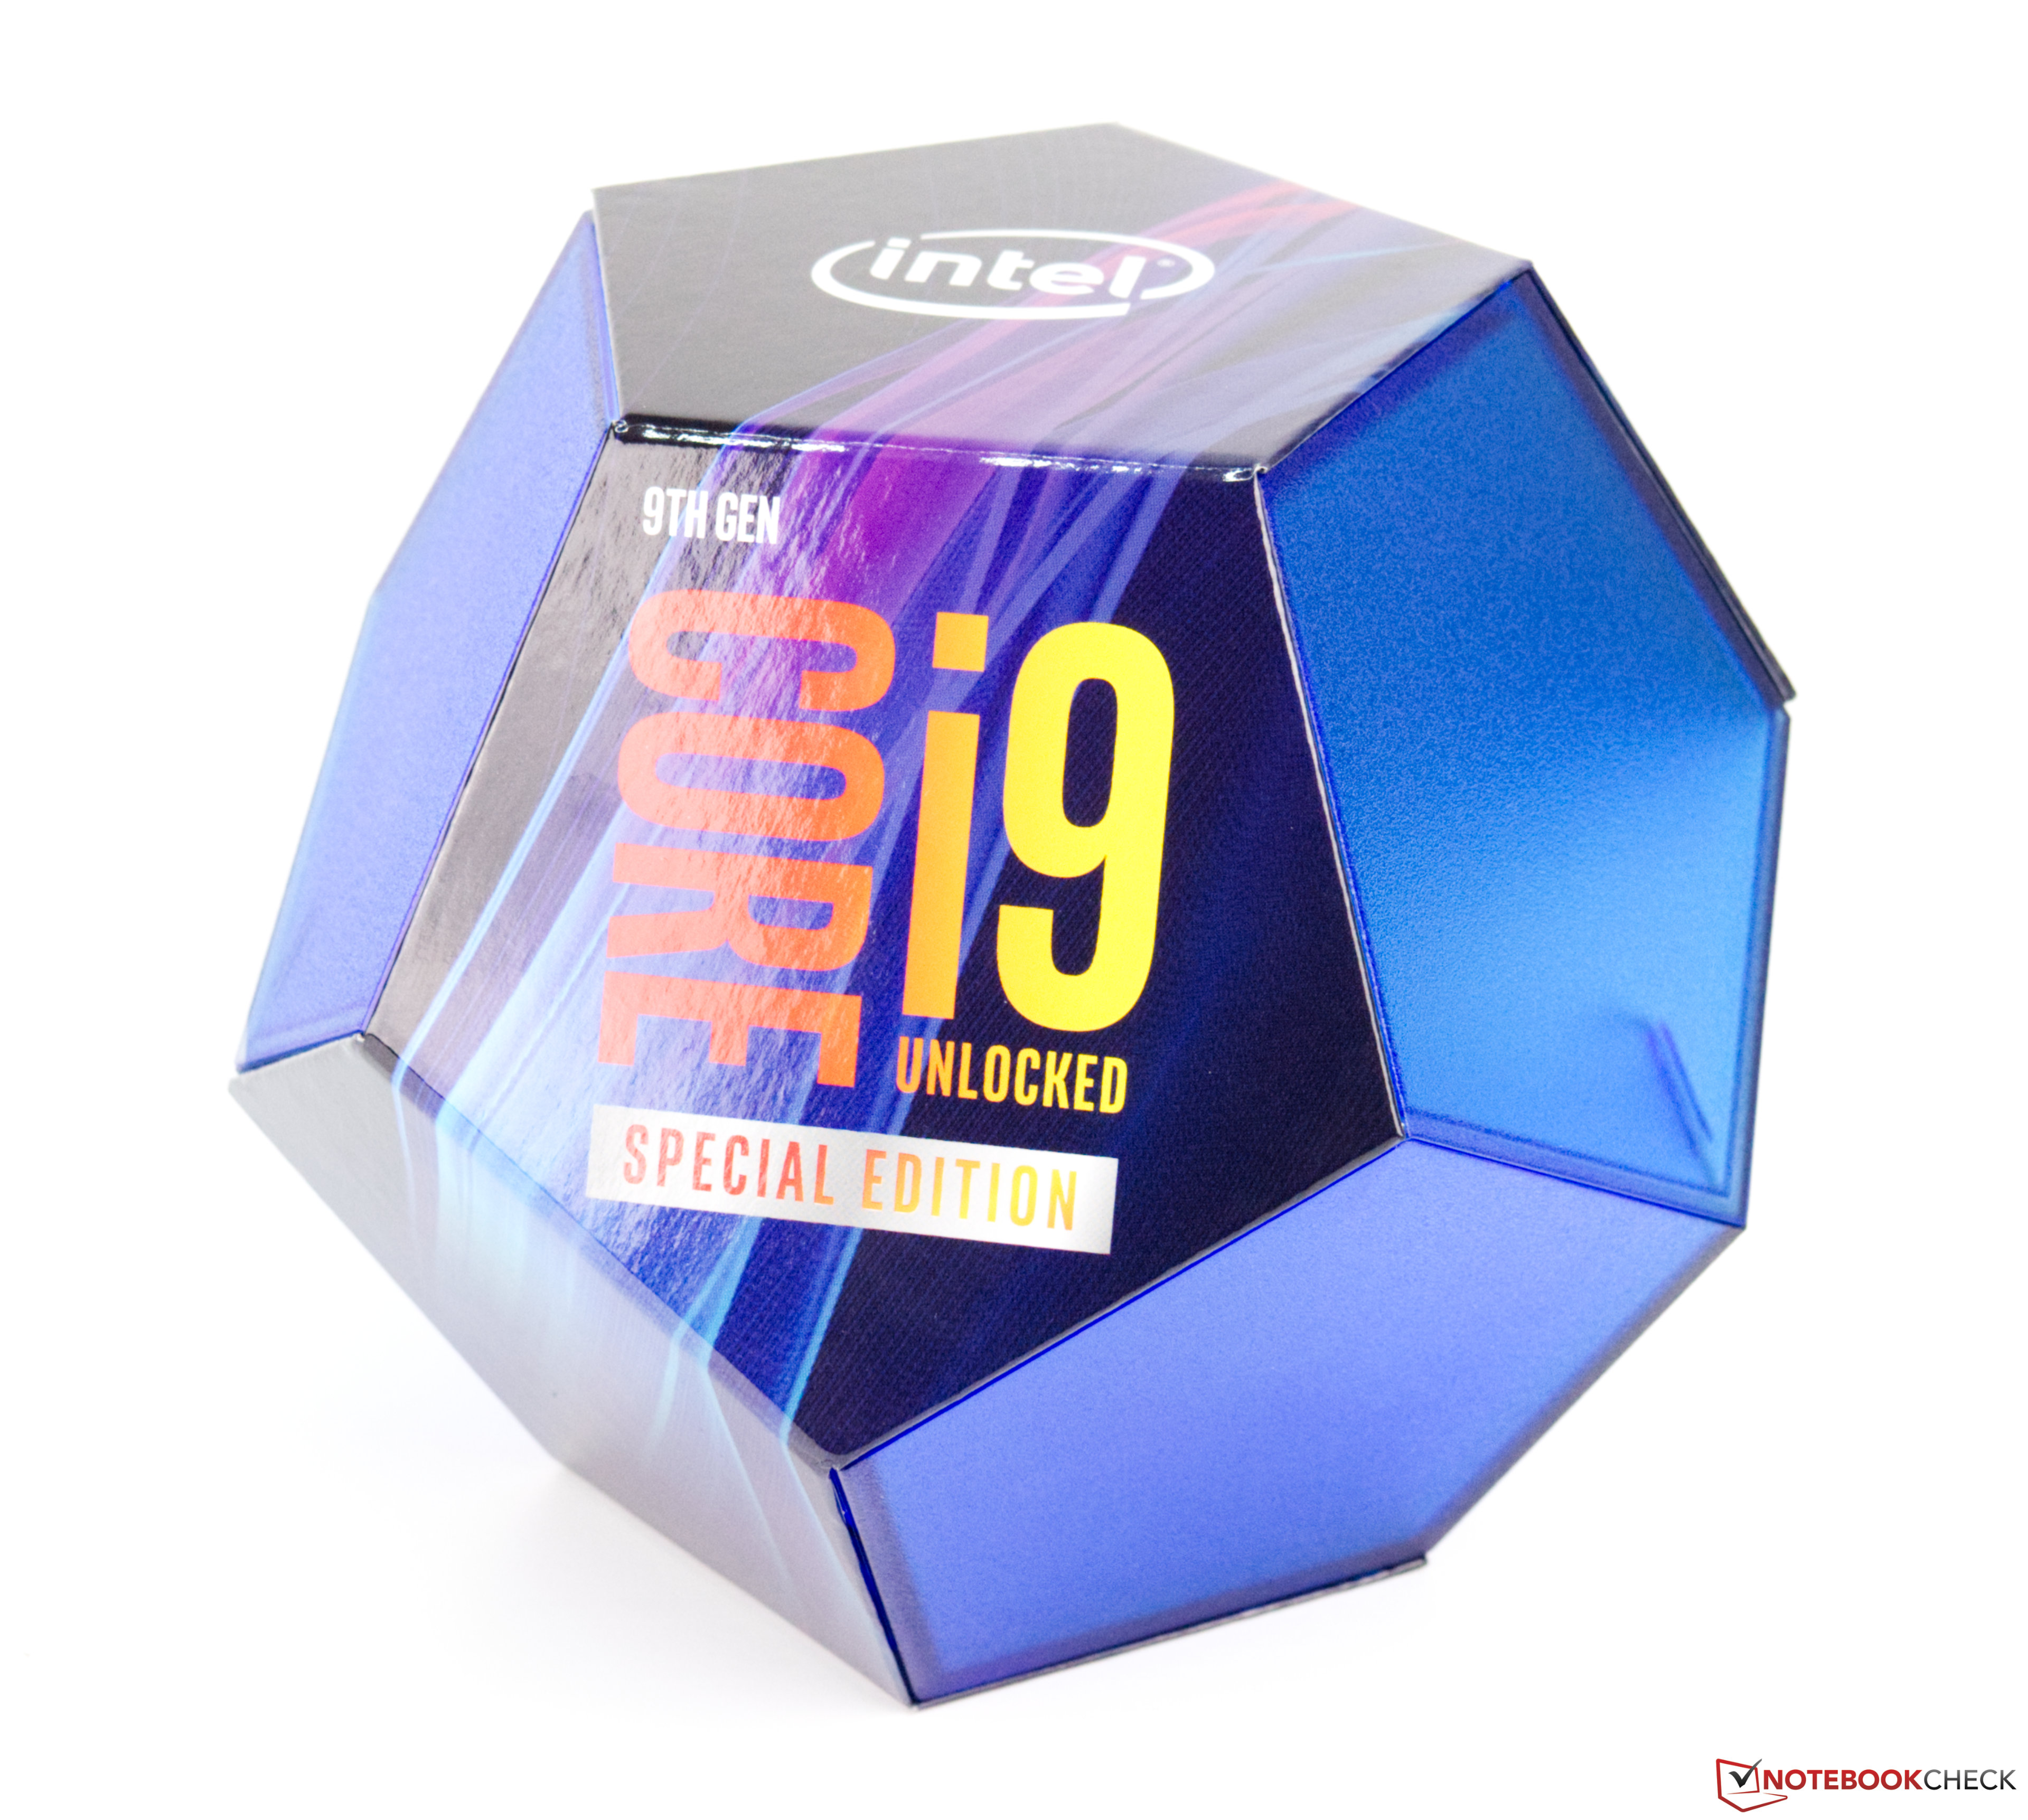
The Intel Core i9-9900KS is a high end desktop processor that includes 8 cores based on the Coffee Lake architecture. It is the fastest Coffee Lake CPU in 2019 and compared to the similar named i9-9900K, the KS offers an all core Turbo of 5 GHz. All cores can clock between 4 GHz and 5 GHz and thanks to Hyperthreading / SMT 16 threads can be executed in parallel. The CPU is still manufactured in the mature 14 nm process (14nm++). Thanks to the open multiplicator, the CPU is rather easy to overclock (if a Z390 based mainboard is used).

With good cooling, the i9-9900KS can be around 10% faster than the older Intel Core i9-9900K (thanks to the 5 GHz all core Turbo). Compare to the old Core i7-8700K, the 9900KS is even 45% faster. Especially for gaming, the 9900KS is currently the fastest option available. The fast Ryzen and Threadripper CPUs from AMD however offer a better multithreaded performance.

The integrated GPU is called Intel UHD Graphics 630 and clocks with up to 1.2 GHz. It is not suited for demanding 3D games and located in the low end.

The TDP is raised to 127 Watt for the additional performance, therefore a good CPU cooler is needed. When overclocking the CPU, more than 200 Watt can be reached unter load.

ModelIntel Core i5-8500Intel Core i3-9100FIntel Core i9-9900KS
SeriesIntel Coffee LakeIntel Coffee LakeIntel Coffee Lake
CodenameCoffee Lake-SCoffee Lake-RCoffee Lake-R
Series: Coffee Lake Coffee Lake-R
Intel Core i7-8086K3.7 - 5 GHz6 / 12 cores12 MB L3
Intel Core i7-8700K3.7 - 4.7 GHz6 / 12 cores12 MB L3
Intel Core i7-87003.2 - 4.6 GHz6 / 12 cores12 MB L3
Intel Core i5-8600K3.6 - 4.3 GHz6 / 6 cores9 MB L3
Intel Core i5-8500 « 3 - 4.1 GHz6 / 6 cores9 MB L3
Intel Core i5-84002.8 - 4 GHz6 / 6 cores9 MB L3
Intel Core i5-8500T2.1 - 3.5 GHz6 / 6 cores9 MB L3
Intel Core i9-9900KS4 - 5 GHz8 / 16 cores16 MB L3
Intel Core i9-9900K3.6 - 5 GHz8 / 16 cores16 MB L3
Intel Core i7-9700K3.6 - 4.9 GHz8 / 8 cores12 MB L3
Intel Core i7-97003 - 4.7 GHz8 / 8 cores12 MB L3
Intel Core i5-9600K3.7 - 4.6 GHz6 / 6 cores9 MB L3
Intel Core i9-9900T2.1 - 4.4 GHz8 / 16 cores16 MB L3
Intel Core i5-9400F2.9 - 4.1 GHz6 / 6 cores9 MB L3
Intel Core i3-9100F « 3.6 - 4.2 GHz4 / 4 cores6 MB L3
Intel Core i9-9900KS « 4 - 5 GHz8 / 16 cores16 MB L3
Intel Core i9-9900K3.6 - 5 GHz8 / 16 cores16 MB L3
Intel Core i7-9700K3.6 - 4.9 GHz8 / 8 cores12 MB L3
Intel Core i7-97003 - 4.7 GHz8 / 8 cores12 MB L3
Intel Core i5-9600K3.7 - 4.6 GHz6 / 6 cores9 MB L3
Intel Core i9-9900T2.1 - 4.4 GHz8 / 16 cores16 MB L3
Intel Core i5-9400F2.9 - 4.1 GHz6 / 6 cores9 MB L3
Intel Core i3-9100F3.6 - 4.2 GHz4 / 4 cores6 MB L3
Clock3000 - 4100 MHz3600 - 4200 MHz4000 - 5000 MHz
L1 Cache384 KB256 KB512 KB
L2 Cache1.5 MB1 MB2 MB
L3 Cache9 MB6 MB16 MB
Cores / Threads6 / 64 / 48 / 16
TDP65 Watt65 Watt127 Watt
Technology14 nm14 nm14 nm
max. Temp.100 °C100 °C100 °C
SocketFCLGA1151LGA 1151-2FCLGA1151
FeaturesDual-Channel DDR3(L)-1600/DDR4-2666 Memory Controller, HyperThreading, AVX, AVX2, AES-NI, TSX-NI, Quick Sync, Virtualization, vProDual-Channel DDR4-2400 Memory Controller, AVX, AVX2, AES-NI, TSX, Quick Sync, VirtualizationDual-Channel DDR4-2666 Memory Controller, HyperThreading, AVX, AVX2, AES-NI, TSX-NI, Quick Sync, Virtualization, vPro
iGPUIntel UHD Graphics 630 (350 - 1100 MHz)Intel UHD Graphics 630 (350 - 1200 MHz)
Architecturex86x86x86
$202 U.S.$122 U.S.$513 U.S.
Announced
Manufacturerark.intel.comwww.intel.de
Die Size126 mm2178 mm2

Benchmarks

Performance Rating - CB R15 + R20 + 7-Zip + X265 + Blender + 3DM11 CPU - i3-9100F
29.5 pt (41%)
Performance Rating - CB R15 + R20 + 7-Zip + X265 + Blender + 3DM11 CPU - i9-9900KS
38.4 pt (53%)
Cinebench R20 - Cinebench R20 CPU (Single Core)
414 Points (46%)
min: 509     avg: 512     median: 511.5 (57%)     max: 514 Points
Cinebench R20 - Cinebench R20 CPU (Multi Core)
1175 Points (3%)
min: 4463     avg: 4820     median: 4819.5 (12%)     max: 5176 Points
Cinebench R15 - Cinebench R15 CPU Multi 64 Bit
950 Points (6%)
634 Points (4%)
min: 1962     avg: 2058     median: 2058 (13%)     max: 2154 Points
Cinebench R15 - Cinebench R15 CPU Single 64 Bit
172 Points (52%)
171 Points (52%)
min: 215     avg: 216     median: 216 (65%)     max: 217 Points
Cinebench R11.5 - Cinebench R11.5 CPU Multi 64 Bit
10.2 Points (13%)
5.4 Points (7%)
min: 22.31     avg: 23.2     median: 23.1 (30%)     max: 23.98 Points
Cinebench R11.5 - Cinebench R11.5 CPU Single 64 Bit
2 Points (49%)
2 Points (49%)
min: 2.43     avg: 2.4     median: 2.4 (61%)     max: 2.46 Points
Cinebench R10 - Cinebench R10 Rend. Single (32bit)
8606 Points (52%)
6509 Points (39%)
min: 8143     avg: 8183     median: 8183 (49%)     max: 8223 Points
Cinebench R10 - Cinebench R10 Rend. Multi (32bit)
40829 Points (30%)
18118 Points (13%)
min: 50462     avg: 51779     median: 51778.5 (38%)     max: 53095 Points
Cinebench R10 - Cinebench R10 Rend. Multi (64bit)
39357 Points (27%)
21908 Points (15%)
69169 Points (48%)
Cinebench R10 - Cinebench R10 Rend. Single (64bit)
8515 Points (10%)
8472 Points (10%)
10759 Points (13%)
wPrime 2.10 - wPrime 2.0 1024m *
848 s (10%)
345.9 s (4%)
min: 82     avg: 87.9     median: 87.9 (1%)     max: 93.8 s
wPrime 2.10 - wPrime 2.0 32m *
26.5 s (5%)
11.8 s (2%)
min: 3.232     avg: 3.6     median: 3.6 (1%)     max: 3.969 s
WinRAR - WinRAR 4.0
4219 Points (7%)
4052 Points (6%)
min: 8156     avg: 8353     median: 8353 (13%)     max: 8550 Points
7-Zip 18.03 - 7-Zip 18.03 Multli Thread 4 runs
23200 MIPS (13%)
17150 MIPS (10%)
min: 55064     avg: 55735     median: 55735 (32%)     max: 56406 MIPS
7-Zip 18.03 - 7-Zip 18.03 Single Thread 4 runs
4513 MIPS (54%)
4682 MIPS (56%)
min: 5674     avg: 5734     median: 5734 (69%)     max: 5794 MIPS
X264 HD Benchmark 4.0 - x264 Pass 1
206.5 fps (48%)
218 fps (50%)
min: 276.2     avg: 278.9     median: 278.9 (64%)     max: 281.5 fps
X264 HD Benchmark 4.0 - x264 Pass 2
44.4 fps (15%)
min: 116     avg: 122.5     median: 122.5 (43%)     max: 129 fps
HWBOT x265 Benchmark v2.2 - HWBOT x265 4k Preset
7.9 fps (14%)
6.1 fps (11%)
min: 15.31     avg: 16.3     median: 16.3 (29%)     max: 17.2 fps
TrueCrypt - TrueCrypt Serpent
0.5 GB/s (0%)
0.3 GB/s (0%)
1.2 GB/s (0%)
TrueCrypt - TrueCrypt Twofish
0.9 GB/s (15%)
0.5 GB/s (9%)
2.1 GB/s (36%)
TrueCrypt - TrueCrypt AES
5 GB/s (13%)
3 GB/s (8%)
min: 12.1     avg: 12.2     median: 12.2 (32%)     max: 12.2 GB/s
Blender - Blender 2.79 BMW27 CPU *
494.8 Seconds (3%)
687 Seconds (5%)
min: 205.1     avg: 224.6     median: 224.6 (2%)     max: 244 Seconds
R Benchmark 2.5 - R Benchmark 2.5 *
0.7 sec (14%)
3DMark 06 - CPU - 3DMark 06 - CPU
100%
1 i5-8500 +
9903 Points (21%)
min: 14825     avg: 14884     median: 14883.5 (32%)     max: 14942 Points
Super Pi mod 1.5 XS 1M - Super Pi mod 1.5 XS 1M *
9.2 s (2%)
9.3 s (2%)
min: 7.405     avg: 7.4     median: 7.4 (2%)     max: 7.436 s
Super Pi mod 1.5 XS 2M - Super Pi mod 1.5 XS 2M *
20.8 s (1%)
21 s (1%)
min: 16.45     avg: 16.5     median: 16.5 (1%)     max: 16.59 s
Super Pi Mod 1.5 XS 32M - Super Pi mod 1.5 XS 32M *
541 s (2%)
495.5 s (2%)
min: 412.2     avg: 414.2     median: 414.2 (2%)     max: 416.1 s
3DMark 11 - 3DM11 Performance Physics
7942 Points (21%)
8742 Points (24%)
min: 18531     avg: 18914     median: 18694 (51%)     max: 19517 Points
3DMark - 3DMark Ice Storm Physics
68492 Points (56%)
min: 75473     avg: 75482     median: 75482 (61%)     max: 75491 Points
3DMark - 3DMark Ice Storm Extreme Physics
68473 Points (56%)
min: 75946     avg: 76061     median: 76060.5 (62%)     max: 76175 Points
3DMark - 3DMark Ice Storm Unlimited Physics
68727 Points (58%)
min: 74085     avg: 75802     median: 75508 (64%)     max: 77813 Points
3DMark - 3DMark Cloud Gate Physics
7782 Points (20%)
6295 Points (16%)
min: 19068     avg: 19770     median: 20049 (51%)     max: 20193 Points
3DMark - 3DMark Fire Strike Standard Physics
11691 Points (21%)
8958 Points (16%)
min: 24327     avg: 25511     median: 26016 (46%)     max: 26191 Points
3DMark - 3DMark Time Spy CPU
4218 Points (18%)
min: 11017     avg: 11358     median: 11375 (48%)     max: 11683 Points
Geekbench 5.5 - Geekbench 5.1 - 5.4 64 Bit Single-Core
1152 Points (49%)
1372 Points (58%)
Geekbench 5.5 - Geekbench 5.1 - 5.4 64 Bit Multi-Core
4074 Points (7%)
9100 Points (16%)
Geekbench 5.0 - Geekbench 5.0 64 Bit Single-Core
1146 Points (5%)
Geekbench 5.0 - Geekbench 5.0 64 Bit Multi-Core
4060 Points (13%)
Geekbench 4.4 - Geekbench 4.1 - 4.4 64 Bit Single-Core
5301 Points (53%)
6308 Points (63%)
Geekbench 4.4 - Geekbench 4.1 - 4.4 64 Bit Multi-Core
15937 Points (17%)
35586 Points (39%)
Geekbench 4.0 - Geekbench 4.0 64 Bit Single-Core
100%
1 i5-8500 +
4782 Points (65%)
6313 Points (86%)
Geekbench 4.0 - Geekbench 4.0 64 Bit Multi-Core
100%
1 i5-8500 +
18025 Points (44%)
35932 Points (88%)
Mozilla Kraken 1.1 - Kraken 1.1 Total Score *
866 ms (1%)
883 ms (1%)
Octane V2 - Octane V2 Total Score
44538 Points (40%)
WebXPRT 3 - WebXPRT 3 Score
204 Points (43%)
Power Consumption - Prime95 Power Consumption - external Monitor *
139 Watt (24%)
259.6 Watt (45%)
Power Consumption - Cinebench R15 Multi Power Consumption - external Monitor *
101.5 Watt (19%)
min: 219.3     avg: 269.1     median: 292.7 (53%)     max: 295.4 Watt
Power Consumption - Cinebench R15 Multi Power Efficiency - external Monitor
6.3 Points per Watt (5%)
min: 7.29     avg: 8.1     median: 8.1 (6%)     max: 8.95 Points per Watt

Average Benchmarks Intel Core i5-8500 → 100% n=25

Average Benchmarks Intel Core i3-9100F → 84% n=25

Average Benchmarks Intel Core i9-9900KS → 167% n=25

- Range of benchmark values for this graphics card
- Average benchmark values for this graphics card
* Smaller numbers mean a higher performance
1 This benchmark is not used for the average calculation

v1.26
log 01. 16:04:19

#0 checking url part for id 11246 +0s ... 0s

#1 checking url part for id 12190 +0s ... 0s

#2 checking url part for id 11553 +0s ... 0s

#3 not redirecting to Ajax server +0s ... 0s

#4 did not recreate cache, as it is less than 5 days old! Created at Sat, 01 Jun 2024 05:37:57 +0200 +0.001s ... 0.001s

#5 composed specs +0.031s ... 0.032s

#6 did output specs +0s ... 0.032s

#7 getting avg benchmarks for device 11246 +0.003s ... 0.036s

#8 got single benchmarks 11246 +0.01s ... 0.046s

#9 getting avg benchmarks for device 12190 +0.021s ... 0.067s

#10 got single benchmarks 12190 +0.01s ... 0.077s

#11 getting avg benchmarks for device 11553 +0.019s ... 0.096s

#12 got single benchmarks 11553 +0.012s ... 0.108s

#13 got avg benchmarks for devices +0s ... 0.108s

#14 min, max, avg, median took s +0.455s ... 0.563s

#15 return log +0s ... 0.563s

Please share our article, every link counts!
> Expert Reviews and News on Laptops, Smartphones and Tech Innovations > Benchmarks / Tech > Processor Comparison - Head 2 Head
Redaktion, 2017-09- 8 (Update: 2023-07- 1)