 Deutsch
 English
 Español
 Français
 Italiano
 Nederlands
 Polski
 Português
 Русский
 Türkçe
 Svenska
 Chinese
 Magyar
Intel Core i5-11400T vs Intel Core i5-11400F vs Intel Core i7-11700K
Intel Core i5-11400T
► remove from comparison
The Intel Core i5-11400T is a power-efficient six-core desktop processor based on the new Rocket Lake architecture, which was introduced in March 2021. The processor clocks with a base clock of only 1.3 GHz and reaches an all-core boost of 3.7 GHz under load. Intel also gives the Rocket Lake processors the Hyperthreading feature, which allows the i5-11400T to process up to 12 threads simultaneously. As known, the Intel Core i5-11400F is manufactured in the 14 nm process. Nevertheless, many changes have been made with the Rocket Lake architecture, which is also reflected in the performance compared to the Comet Lake.
Performance
Compared to the Intel Core i5-10400T, the Core i5-11400T offers a significantly better IPC. This can be seen clearly in the single-core benchmarks. The multi-core performance also benefits from the better IPC compared to Comet-Lake. A performance increase of up to 20 percent can be expected.
Graphics
The processors integrates a Intel UHD Graphics 730 iGPU that features 24 EUs clocked at 350 - 1200 MHz.
Power consumption
The TDP turns out relatively low with 35 watts. This is the PL1 value. For Turbo, the Intel Core i5-11400T offers a higher TDP of up to 84 watts with PL2. However, this may only be applied for a maximum of 28 seconds (dew).
Intel Core i5-11400F
► remove from comparisonThe Intel Core i5-11400F is a fast six-core desktop processor based on the new Rocket Lake architecture, which was introduced in March 2021. The processor clocks with a base clock of 2.6 GHz and reaches an all-core boost of 4.2 GHz under load. In single-thread applications, the Intel Core i5-11400F even reaches up to 4.4 GHz. Intel also gives the Rocket Lake processors the Hyperthreading feature, which allows the i5-11400F to process up to 12 threads simultaneously. As known, the Intel Core i5-11400F is manufactured in the 14 nm process. Nevertheless, many changes have been made with the Rocket Lake architecture, which is also reflected in the performance compared to the Comet Lake. The Intel Core i5-11400F is a non-K CPU, which means that there is no freely selectable multiplier. Thus, the scope for overclocking is relatively small.
Performance
Compared to the Intel Core i5-10400F, the Core i5-11400F offers a significantly better IPC. This can be seen clearly in the single-core benchmarks. But the multi-core performance also benefits from the better IPC compared to Comet-Lake. A performance increase of up to 20 percent can be expected. The Core i5 has to do without the TVB (Thermal Velocity Boost). However, 4.2 GHz is still possible when all cores are loaded. Due to the very high single-thread performance, the Intel Core i5-11400F is best suited for video games.
Graphics
The processors marked with "F" in the nomenclature don't offer an integrated graphics unit. All other non-F processors can fall back on the Intel UHD Graphics 750 and also allow operation without a dedicated graphics card.
Power consumption
The TDP turns out relatively low with 65 watts. This is the PL1 value. For Turbo, the Intel Core i5-11400F offers a higher TDP of up to 154 watts with PL2. However, this may only be applied for a maximum of 28 seconds (dew). A good air cooler should be able to handle the resulting waste heat, so no AiO is necessary for this processor.
Intel Core i7-11700K
► remove from comparison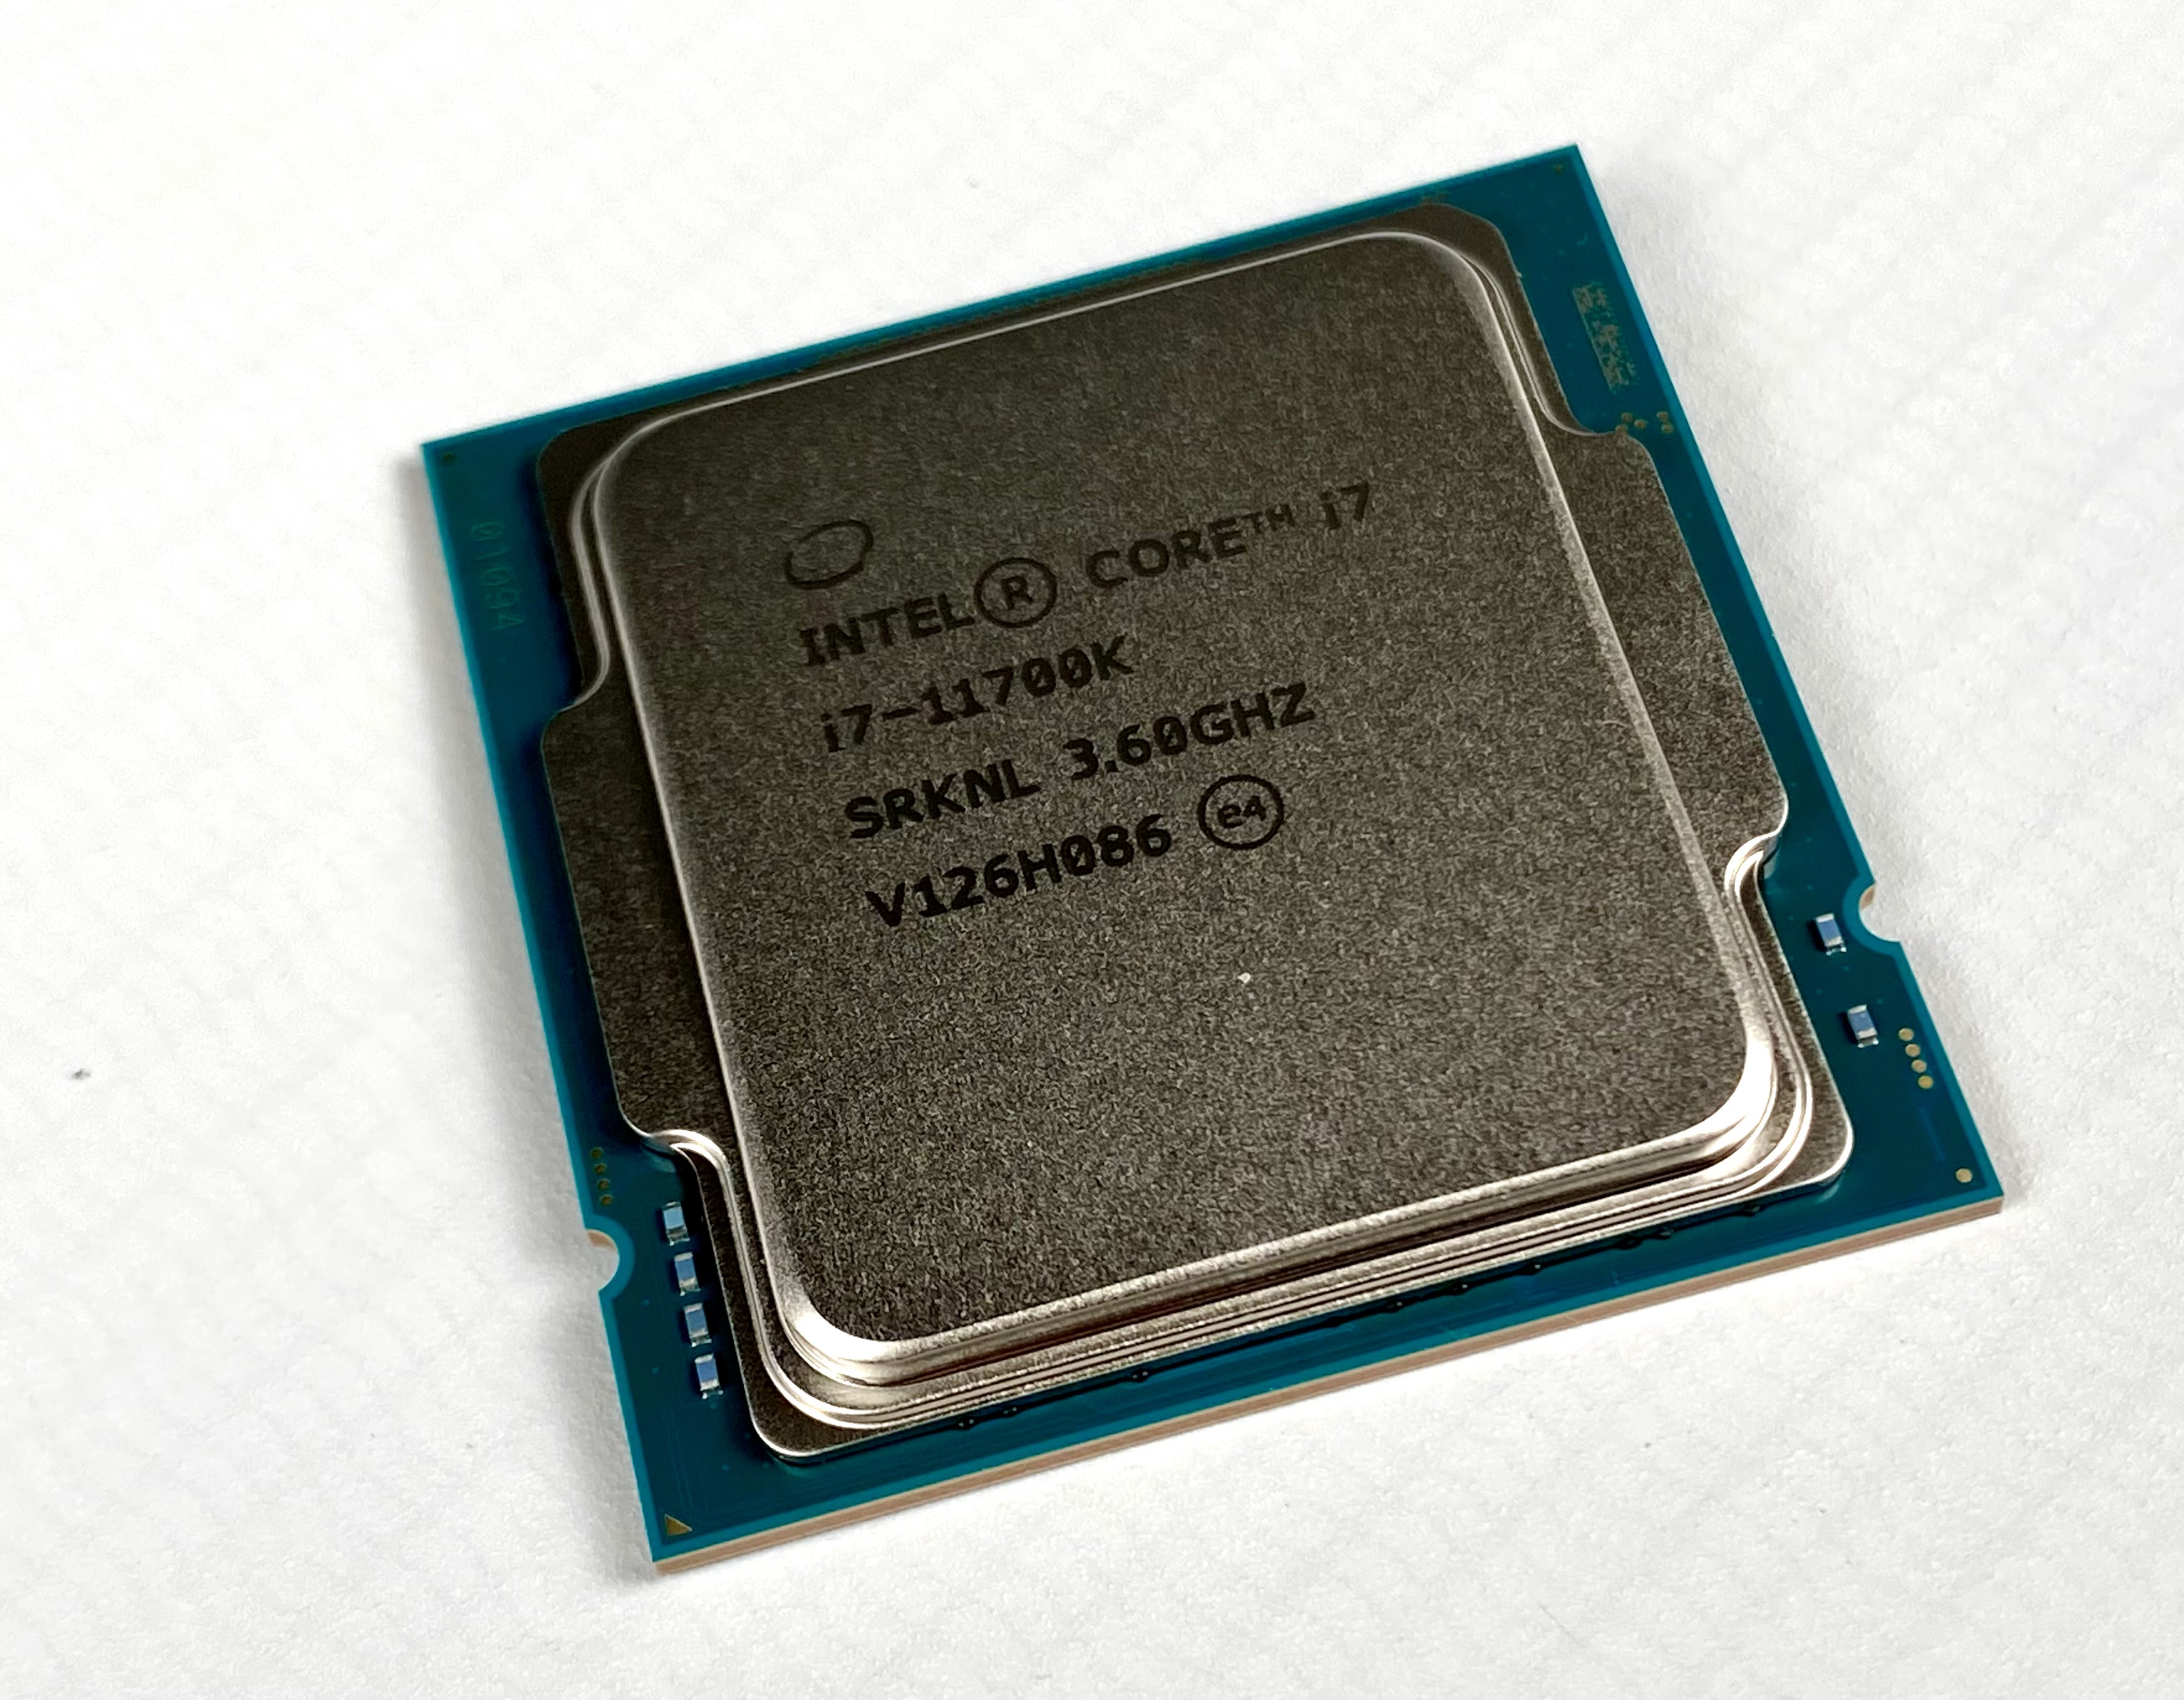
The Intel Core i7-11700K is a high-end desktop CPU based on the Rocket Lake architecture. The CPU offers 8 cores and 16 threads clocked at 3.6 - 4.9 GHz. The TDP is rated at 125 Watt (PL1, power limit sustained load) but the PL2 is set to around 250 Watt for short term boosts (up to 56 seconds).
The Sunny Cove processor cores (known from the Ice Lake mobile CPUs) offer larger caches and an improved IPC (up to 19%). Furthermore, the chip also includes (partly) integrated WiFi 6E and Thunderbolt 4. The platform supports PCIe 4.0 and Intel DL Boost for AI acceleration.
The faster Rocket Lake-S CPUs also integrate a new Intel UHD Graphics 750 that is based on the current Intel Xe architecture (e.g. mobile Tiger Lake).
The CPU is manufactured on an old 14 nm process like the Comet Lake predecessors.
| Model | Intel Core i5-11400T | Intel Core i5-11400F | Intel Core i7-11700K | ||||||||||||||||||||||||||||||||||||||||||||||||||||||||||||||||||||||||
| Series | Intel Rocket Lake | Intel Rocket Lake | Intel Rocket Lake | ||||||||||||||||||||||||||||||||||||||||||||||||||||||||||||||||||||||||
| Codename | Rocket Lake | Rocket Lake | Rocket Lake | ||||||||||||||||||||||||||||||||||||||||||||||||||||||||||||||||||||||||
| Series: Rocket Lake Rocket Lake |
|
|
| ||||||||||||||||||||||||||||||||||||||||||||||||||||||||||||||||||||||||
| Clock | 1300 - 3700 MHz | 2600 - 4400 MHz | 3600 - 5000 MHz | ||||||||||||||||||||||||||||||||||||||||||||||||||||||||||||||||||||||||
| L1 Cache | 480 KB | 480 KB | 640 KB | ||||||||||||||||||||||||||||||||||||||||||||||||||||||||||||||||||||||||
| L2 Cache | 3 MB | 3 MB | 4 MB | ||||||||||||||||||||||||||||||||||||||||||||||||||||||||||||||||||||||||
| L3 Cache | 12 MB | 12 MB | 16 MB | ||||||||||||||||||||||||||||||||||||||||||||||||||||||||||||||||||||||||
| Cores / Threads | 6 / 12 | 6 / 12 | 8 / 16 | ||||||||||||||||||||||||||||||||||||||||||||||||||||||||||||||||||||||||
| TDP | 35 Watt | 65 Watt | 125 Watt | ||||||||||||||||||||||||||||||||||||||||||||||||||||||||||||||||||||||||
| Technology | 14 nm | 14 nm | 14 nm | ||||||||||||||||||||||||||||||||||||||||||||||||||||||||||||||||||||||||
| Die Size | 276 mm2 | 276 mm2 | |||||||||||||||||||||||||||||||||||||||||||||||||||||||||||||||||||||||||
| max. Temp. | 100 °C | 100 °C | 100 °C | ||||||||||||||||||||||||||||||||||||||||||||||||||||||||||||||||||||||||
| Socket | LGA1200 | LGA1200 | LGA1200 | ||||||||||||||||||||||||||||||||||||||||||||||||||||||||||||||||||||||||
| Features | DDR4-3200 RAM, PCIe 4, 8 GT/s bus, DL Boost, GNA, MMX, SSE, SSE2, SSE3, SSSE3, SSE4.1, SSE4.2, AES, AVX, AVX2, AVX512F, FMA3, SHA | DDR4-3200 RAM, PCIe 4, 8 GT/s bus, DL Boost, GNA, MMX, SSE, SSE2, SSE3, SSSE3, SSE4.1, SSE4.2, AVX, AVX2, AVX-512, BMI2, ABM, FMA, ADX, VMX, SMEP, SMAP, MPX, EIST, TM1, TM2, HT, Turbo, SST, AES-NI, RDRAND, RDSEED, SHA | DDR4-3200 RAM, PCIe 4, 8 GT/s bus, DL Boost, GNA, vPro, MMX, SSE, SSE2, SSE3, SSSE3, SSE4.1, SSE4.2, AVX, AVX2, AVX-512, BMI2, ABM, FMA, ADX, VMX, SMX, SMEP, SMAP, MPX, EIST, TM1, TM2, HT, Turbo, SST, AES-NI, RDRAND, RDSEED, SHA | ||||||||||||||||||||||||||||||||||||||||||||||||||||||||||||||||||||||||
| iGPU | Intel UHD Graphics 730 (Rocket Lake) (350 - 1200 MHz) | Intel UHD Graphics Xe 750 32EUs (Rocket Lake) (350 - 1300 MHz) | |||||||||||||||||||||||||||||||||||||||||||||||||||||||||||||||||||||||||
| Architecture | x86 | x86 | x86 | ||||||||||||||||||||||||||||||||||||||||||||||||||||||||||||||||||||||||
| $182 U.S. | $157 U.S. | ||||||||||||||||||||||||||||||||||||||||||||||||||||||||||||||||||||||||||
| Announced | |||||||||||||||||||||||||||||||||||||||||||||||||||||||||||||||||||||||||||
| Manufacturer | ark.intel.com | ark.intel.com | ark.intel.com |

