The Intel Core Ultra 5 125H is a mid-range Meteor Lake family chip that debuted in December 2023. This 1st Gen Core Ultra processor has come to replace 13th generation Core chips; it has 14 cores (4 + 8 + 2) and 18 threads at its disposal. Its Performance cores, of which there are 4, are HT-enabled and run at up to 4.5 GHz while its Efficient cores, of which there are 10 (8 main cores plus 2 extra ones found in the Low Power Island), run at up to 3.6 GHz. The 7-core Arc GPU, just out of the oven, serves as the integrated graphics adapter - this runs at up to 2.20 GHz - and there is a bevy of other brand-new technologies on offer as well, including the integrated AI Boost NPU with two Gen 3 engines for hardware AI workload acceleration.
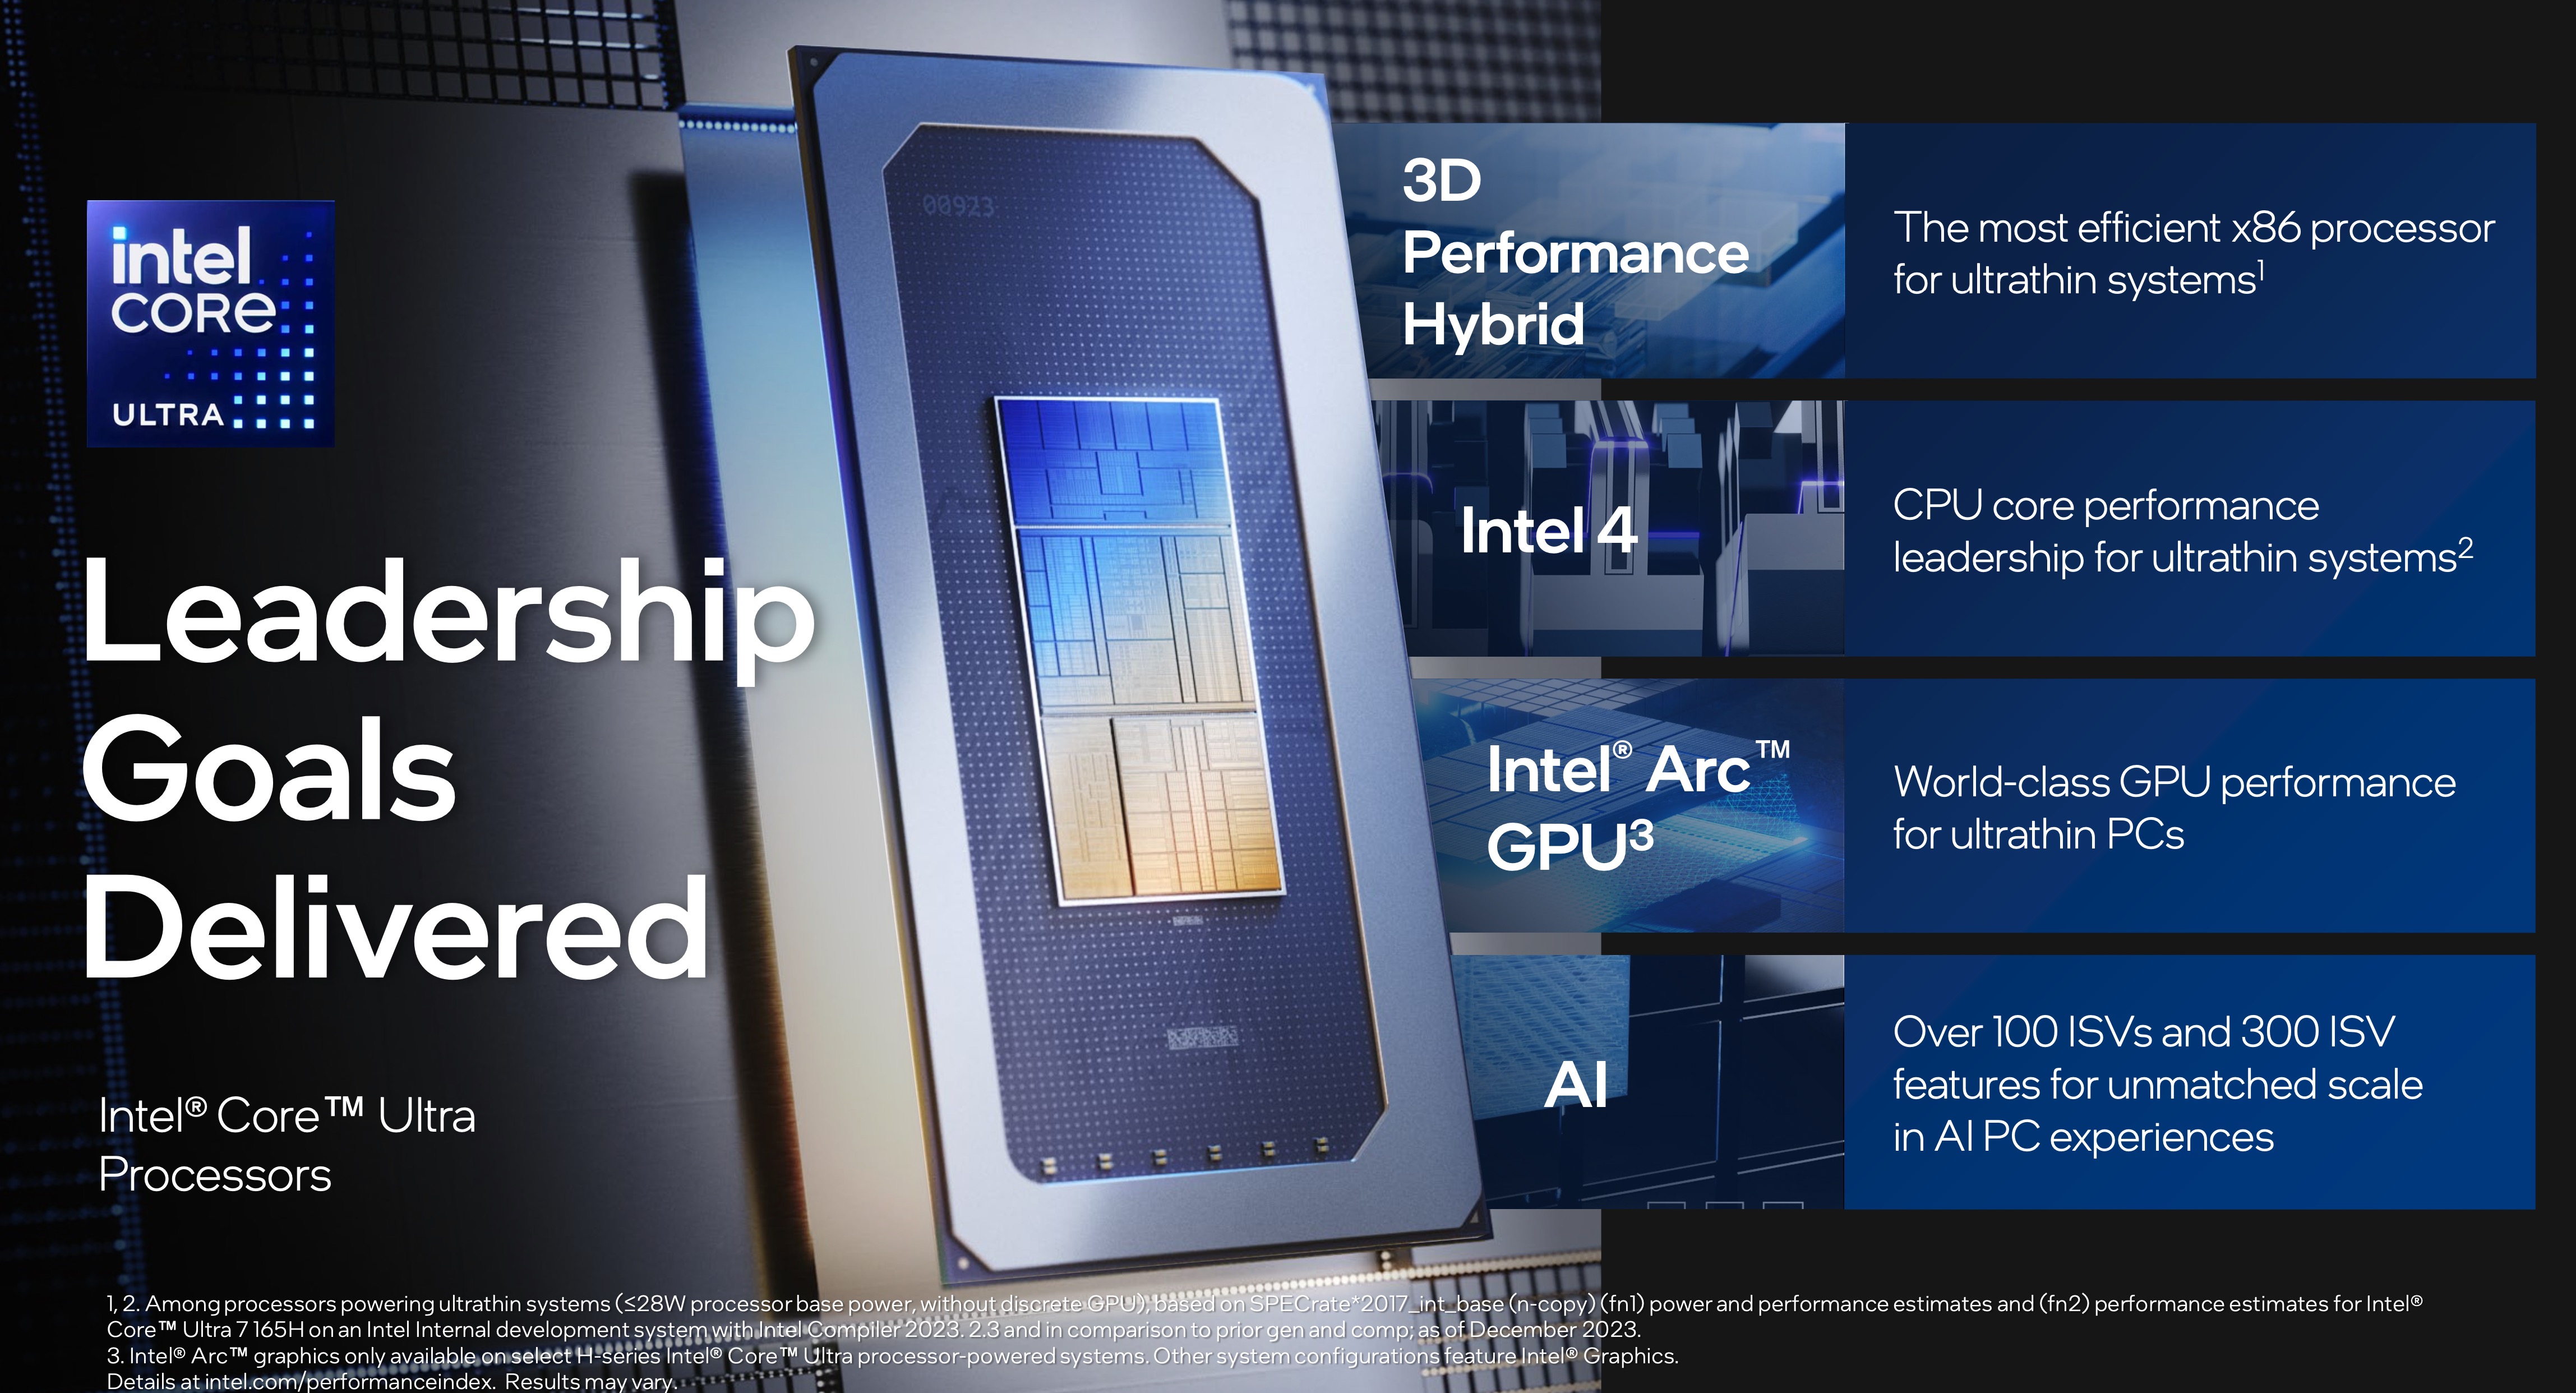
Architecture and Features
With Meteor Lake, Intel intends to deliver higher CPU performance, higher GPU performance and at the same time, longer battery life than what Raptor Lake chips were capable of. The company also wants a large piece of the AI cake and is working with Microsoft and other partners to make that happen. As a result, Windows Defender is now AI-enabled, meaning it can use the Intel NPU to take some of the load off the main CPU cores. We also get this new Intel Device Discovery technology that is designed to give us a better hardware-based remote laptop management than ever before; and, to make things even better, Intel now offers a dedicated Arc Pro graphics driver for workstations.
This generation of Intel Core processors features Redwood architecture P-cores and Crestmont architecture E-cores. Both come with slight architectural improvements over Raptor Cove and Gracemont respectively for slightly higher performance-per-clock figures; the interesting thing is that of the 10 E-cores, two are actually a separate cluster located on what Intel calls a "Low Power Island". Essentially, the latter is an SoC within an SoC that can stay active while most other parts of the chip are temporarily switched off to save power. The low-power E-cores run at up to 2.5 GHz. Intel hopes this approach will let it deliver unprecedentedly low power consumption figures when under low load, boosting battery life of laptops and tablets powered by Meteor Lake.
To build its Meteor Lake processors, Intel uses the Foveros technology (stacking several chips on top of each other). This is a cost-cutting measure more than anything else, as manufacturing several small dies on several different processes is so much cheaper than making a huge single die and hoping that there are no defects in it that will require disabling some parts of it.
Elsewhere, the Core Ultra 5 125H comes with 18 MB of L3 cache which is a significant reduction compared to the 24 MB that the 155H, the 165H and the 185H have. The processor has a very healthy number of PCIe 5 and PCIe 4 lanes for NVMe SSD speeds up to 15.7 GB/s; it supports RAM running at up to 7467 MHz (DDR5-5600, LPDDR5-7467, LPDDR5x-7467, to be specific - which is about as good as what 8040 series Ryzen chips have). Naturally, the 125H features built-in Thunderbolt 4 support and Intel CNVi Wi-Fi support. It is also worth mentioning that Intel chose to keep native SATA III support that AMD had removed from its Ryzen processors quite a while ago.
The 125H is compatible with 64-bit Windows 10, 64-bit Windows 11 and with many Linux distros.
Performance
While we have no way of knowing what the 125H will be like, as of December 2023, it's safe to expect the chip to be slightly slower than the Ryzen 7 7735HS (Zen 3 Plus, 8 cores, 16 threads, up to 4.75 GHz), as far as multi-thread performance is concerned.
Either way, real-world performance of the chip may vary significantly depending on how high the CPU power limits are and how competent the cooling solution of the system is.
Graphics
The 7-core Arc GPU running at up to 2.20 GHz is set to overshadow the Radeon 760M; just like the 8-core Arc GPU, this graphics adapter is set to be miles ahead of the aging Xe-series integrated GPUs. As long as one chooses to take Intel's word for it, that is.
A proper DX12 Ultimate graphics adapter, the Arc is no stranger to ray tracing and other modern technologies including AI frame generation (XeSS). It will let you connect up to four SUHD 4320p monitors and it will both HW-encode and HW-encode the most widely used video codecs including AVC, HEVC and AV1 in a fast and efficient manner.
Your mileage may vary depending on how high the CPU power limits are, how competent the cooling solution of your system is, how fast the RAM of your system is. The latter is really important; Intel stresses that for the Arc to deliver the best results possible, multi-channel RAM configuration is a must.
Power consumption
The Base power consumption, in the case of the 125H, is 28 W while its maximum Turbo power consumption is supposed to be within 115 W. A powerful cooling solution is a must for any system powered by this chip.
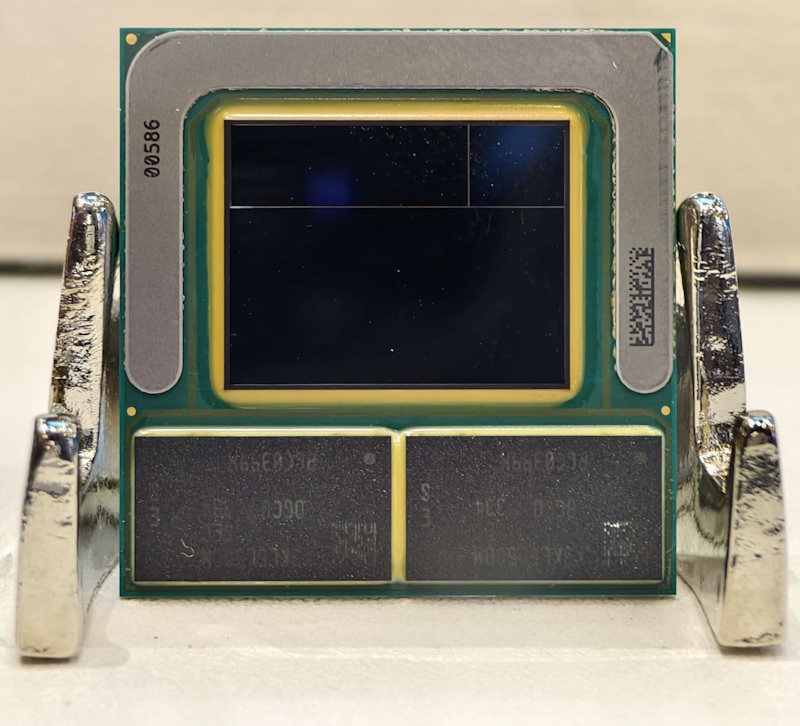
This Core Ultra 5 series processor is comprised of five small chips ("tiles") that are connected using Intel's Foveros technology. The tile containing main CPU cores is produced on the fairly modern 7 nm Intel process marketed as Intel 4 while most other tiles (the iGPU, the I/O die, ...) are built with TSMC's N5 and N6 processes. The base tile is built with the old Intel 22FFL process.
The Intel Core Ultra 5 226V is one of the 2 slowest Lunar Lake family processors as of Nov 2024. This is an SoC for use in tablets and laptops of the slimmer kind that was unveiled in Autumn 2024. It features 4 new Skymont E-cores and 4 new Lion Cove P-cores running at up to 3.5 GHz and 4.5 GHz respectively, along with the new Arc 130V iGPU and 16 GB of on-package LPDDR5x-8533 RAM. A new 40 TOPS neural engine, Thunderbolt 4 and PCIe 5 SSD support are included as well.
The only difference between this chip and the Ultra 5 228V is the amount of on-package, non-replaceable RAM: 16 GB vs 32 GB respectively.
Architecture and Features
Lunar Lake is built using the Foveros technology (stacking several dies on top of each other and next to each other), just like Meteor Lake was. The new chips make use of the enormous BGA2833 socket interface. Of the 8 cores, not a single one is Hyper-Threading-enabled which is the opposite of what AMD currently does with its Zen 5/5c chips.
Intel claims Lion Cove cores bring a 14% IPC improvement over Redwood Cove. For Skymont and Crestmont, the difference is a staggering 68%. Several tweaks and improvements are present here, such as the Low Latency Fabric that is supposed to make small data transfers between cores/caches a lot faster. The 226V's level 3 cache is pretty small as compared to more expensive Ultra 7 2xxV and Ultra 9 2xxV chips at 8 MB vs 12 MB. Elsewhere, the 226V has 4 PCIe 5 and 4 PCIe 4 lanes for connecting various kinds of devices, including NVMe SSDs at up to 15.75 GB/s. Thunderbolt 4 support is onboard by default, as is support for CNVi WiFi 7 + BT 5.4 cards from Intel. The 40 TOPS "AI Boost" neural engine is present along with technologies such as Threat Detection to make AI-enabled applications such as the Windows Defender more powerful.
Intel is predicted to get short of on-package RAM in subsequent CPU generations.
Performance
Our in-house testing of an Acer laptop powered by the Ultra 5 chip revealed the latter to be about as fast as the Ryzen 7 7730U and the Ryzen 7 7735U in multi-threaded tasks which is OK but not mind-blowing for late 2024. It is worth noting that the laptop in question does not use the Intel-recommended 17 W long-term power target; instead, the processor gets 30 W to eat which affects its benchmark scores significantly.
Generally speaking, the 226V, 228V, 236V and 238V are slower than the 256V, 258V, 266V, 268V, 288V due to the difference in their last-level cache size as well as clock speeds. However, the difference in performance between the slowest Lunar Lake chip, the 226V, and the fastest chip, the 288V is fairly small at around 10% to 15%. Exact figures depend on the TDP values of the laptops being pitted against each other more than on anything else.
Graphics
The Arc Graphics 130V has 7 Xe² architecture "cores" running at up to 1,850 MHz, as well as 7 ray tracing units at its disposal. This is a direct successor to the Arc 7 iGPU; it is DirectX 12 Ultimate-enabled and able to HW-decode a long list of video codecs such as h.266 VVC, h.265 HEVC, h.264 AVC, AV1 and VP9. Three SUHD 4320p monitors can be used simultaneously with this iGPU.
Its performance can be vastly different depending on which benchmarks and games one runs. Oftentimes, it isn't much faster than its direct predecessor, the Arc 7. It is clear the 130V isn't fast enough to run most triple-A 2024 games at 1080p. However, it's still more than good enough for an occasional gaming session.
While this 2nd generation Core Ultra processor is supposed to consume 17 W when under long-term workloads, the only laptop powered by this chip that we have tested as of early Nov 2024 has a much higher value than that at 30 W.
The Intel-recommended short-term power limit for the chip sits at 37 W.
Average Benchmarks Intel Core Ultra 5 125H → 100%n=44
Average Benchmarks Intel Core Ultra 5 226V → 92%n=44
- Range of benchmark values for this graphics card - Average benchmark values for this graphics card * Smaller numbers mean a higher performance 1 This benchmark is not used for the average calculation
v1.35
log 14. 21:12:51
#0 ran 0s before starting gpusingle class +0s ... 0s
#1 checking url part for id 16911 +0s ... 0s
#2 checking url part for id 18000 +0s ... 0s
#3 redirected to Ajax server, took 1768421570s time from redirect:0 +0s ... 0s
#4 did not recreate cache, as it is less than 5 days old! Created at Wed, 14 Jan 2026 11:44:35 +0100 +0s ... 0s
#5 composed specs +0.008s ... 0.009s
#6 did output specs +0s ... 0.009s
#7 getting avg benchmarks for device 16911 +0.004s ... 0.013s
#8 got single benchmarks 16911 +0.016s ... 0.029s
#9 getting avg benchmarks for device 18000 +0.004s ... 0.032s