Notebookcheck Logo

AMD Ryzen 9 7950X3D vs Intel Core i7-12650H

AMD Ryzen 9 7950X3D

► remove from comparison AMD R9 7950X3D

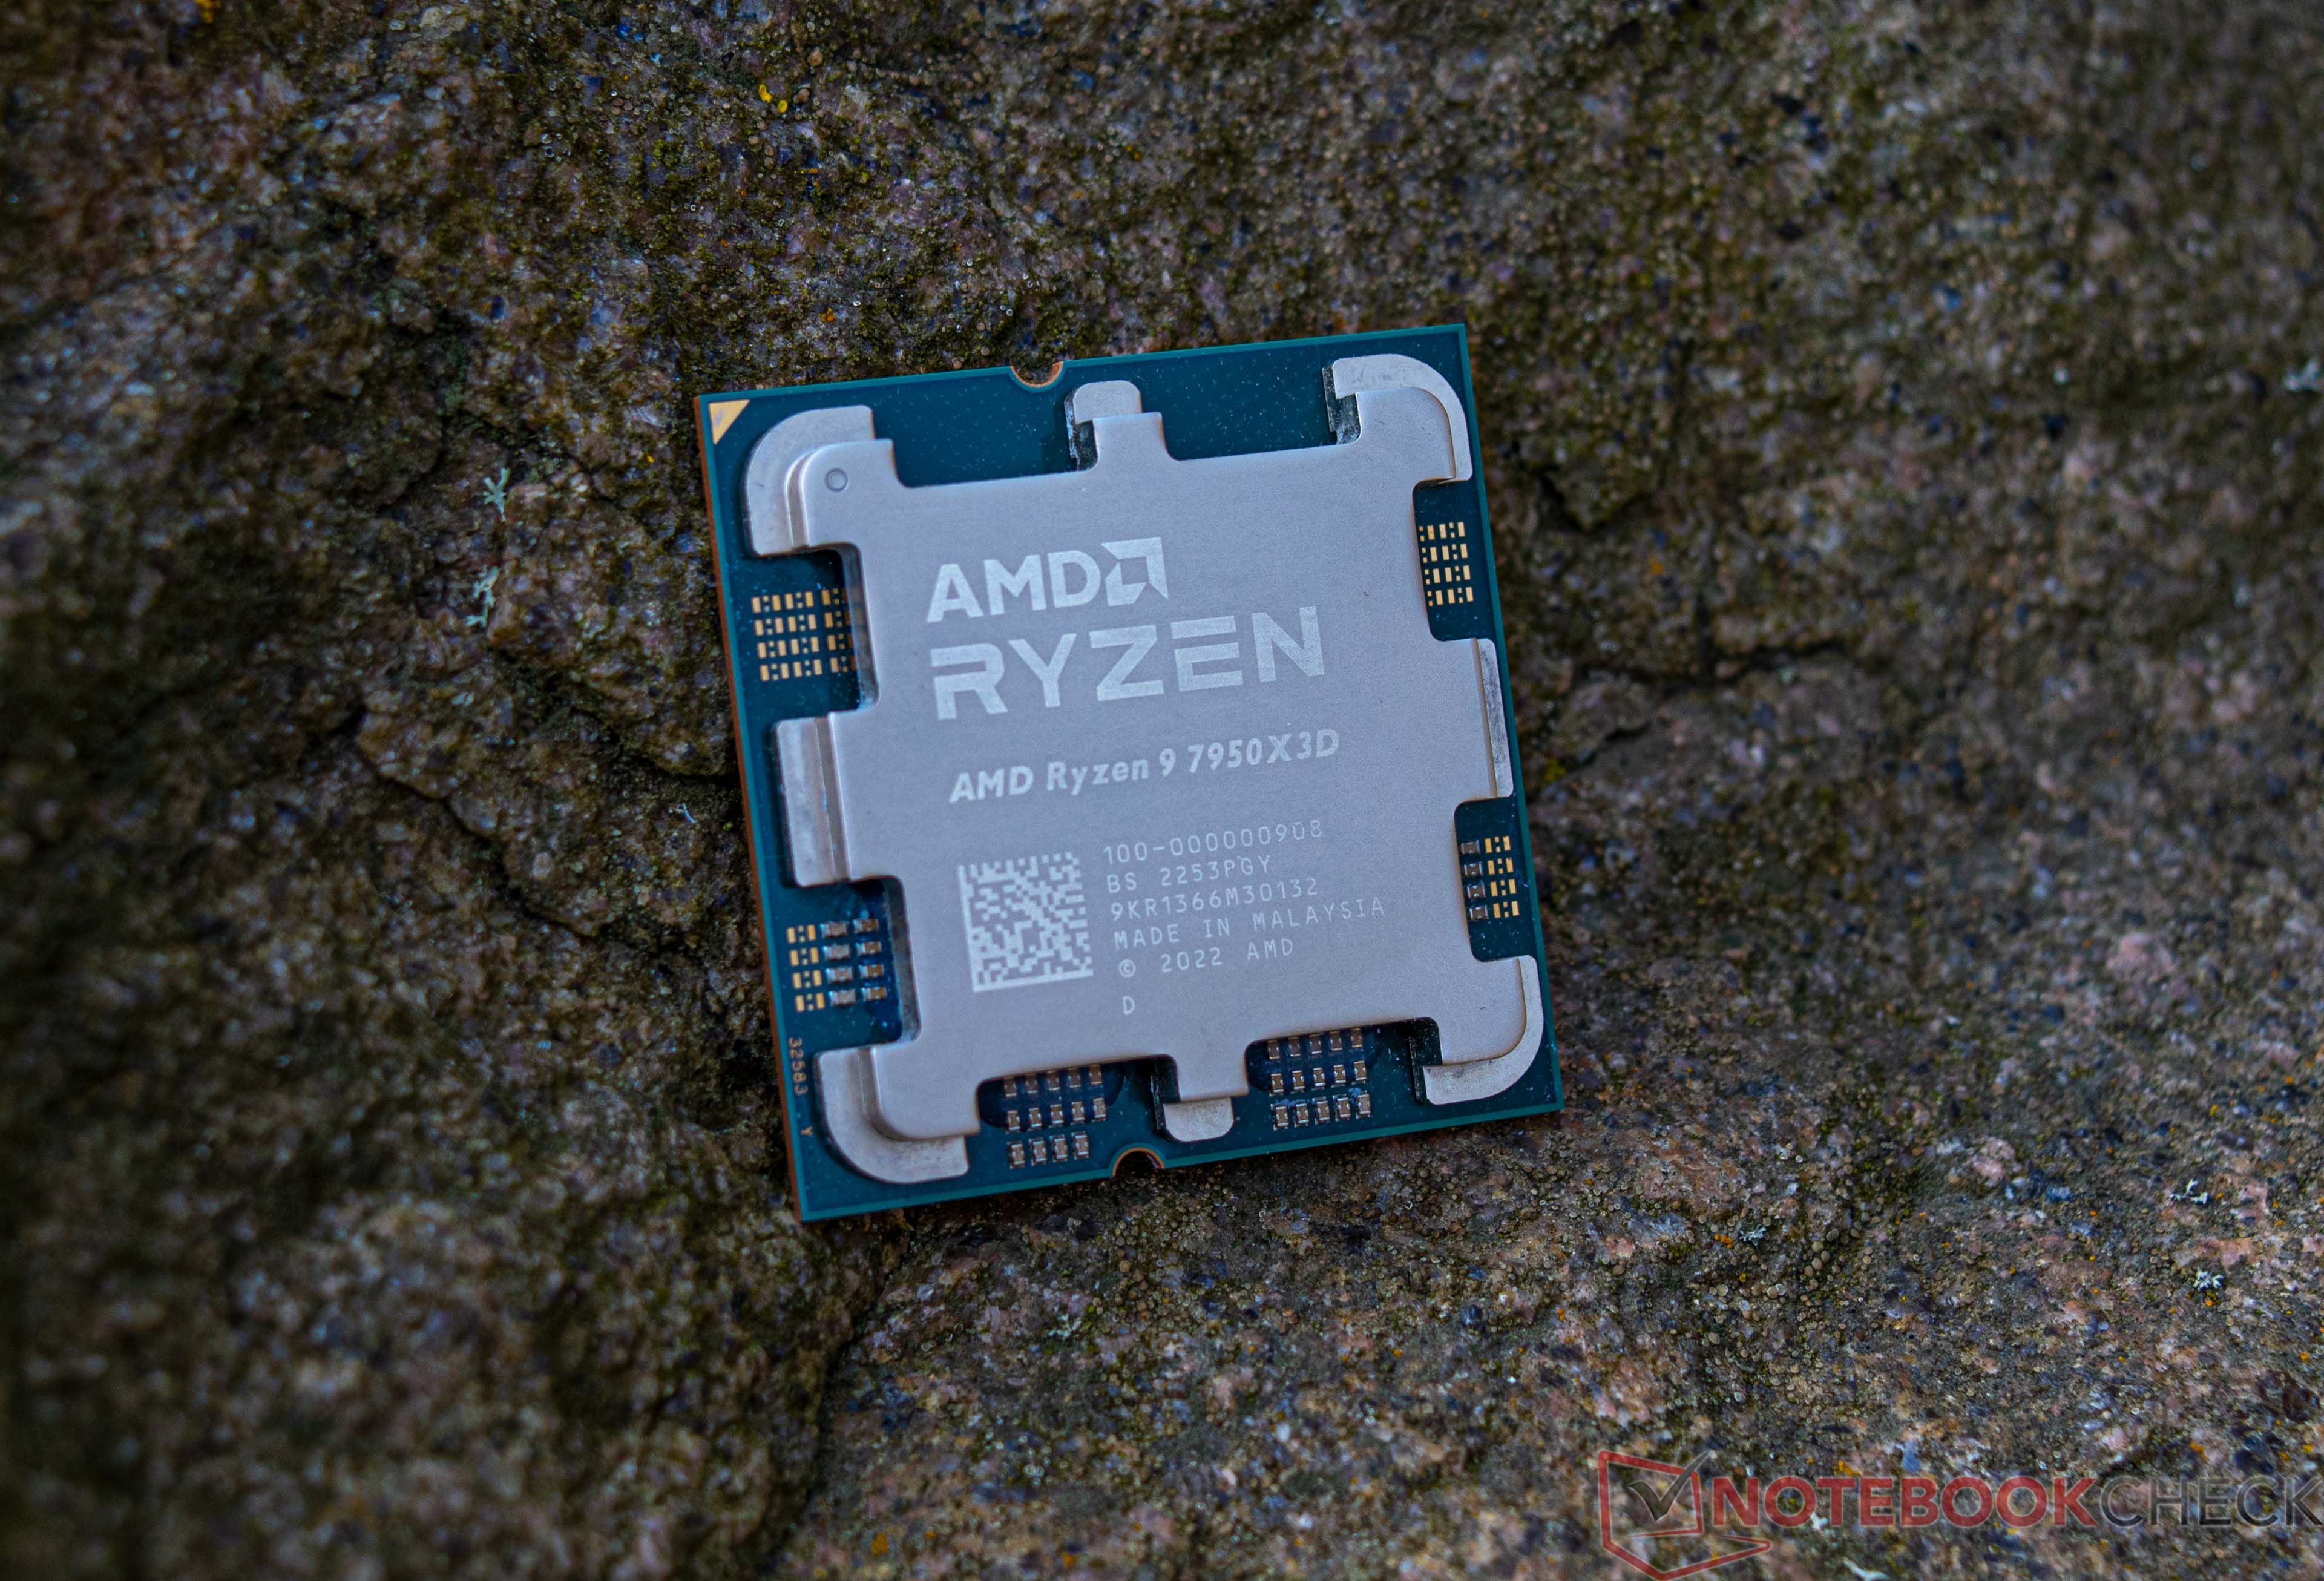
The AMD Ryzen 9 7950X3D is a high-end desktop processor of the Raphael series with 16 cores and SMT (Simultaneous Multithreading), which means it can process up to 32 threads simultaneously. With the release in February 2023, the Ryzen 9 7950X3D is AMD's fastest consumer processor and the new top model of the 7000 series. The CPU cores clock from 4.2 GHz (base clock) up to 5.7 GHz (single core Turbo). In addition, the AMD Ryzen 9 7950X3D has a CCD with 8 cores that can access the fast 3D V-cache, which offers considerably more gaming performance.

The performance of the AMD Ryzen 9 7950X3D is consistently excellent in all applications tested. In addition, AMD was again able to increase the single-thread performance compared to the non-X3D models. Nevertheless, the lower base clock compared to the AMD Ryzen 9 7950X means that a small drop in multi-thread performance has to be accepted.

The internal structure of the processor is comparable to the previous AMD Ryzen 9 7950X. The AMD Ryzen 9 7950X3D is also still based on the chiplet design consisting of two CCD clusters with 8 cores each. However, the two CCDs differ significantly from each other because one offers the fast 3D V-Cache, which primarily improves gaming performance. In testing, the AMD Ryzen 9 7950X3D was able to put the Intel Core i9-13900K in second place and is the fastest gaming CPU on the market at the time of testing. 

The AMD Ryzen 9 7950X3D is an extremely energy-efficient CPU with up to 162 watts (PPT) and is significantly more frugal under load than an AMD Ryzen 9 7950X (max. 230 watts).

Intel Core i7-12650H

► remove from comparison Intel i7-12650H

The Intel Core i7-12650H is a high-end mobile CPU for laptops based on the Alder Lake architecture. It was announced in early 2022 and offers 6 performance cores (P-cores, Golden Cove architecture) and 4 of the 8 efficient cores (E-cores, Gracemont architecture). The P-cores support Hyper-Threading leading to 16 supported threads when combined with the E-cores. The clock rate ranges from 2.3 to 4.7 GHz on the performance cluster and 1.7 to 3.5 GHz on the efficient cluster. The performance of the E-cores should be similar to old Skylake cores (compare to the Core i7-6700HQ). All cores can use up to 24 MB L3 cache. Compared to the 12700H, the 12650H offers only 4 instead of 8 E-cores, a slower iGPU and no vPro features (for remote management).

Performance

The average 12650H in our database is in the same league as the Core i9-11950H, Ryzen 5 7640HS, Ryzen 9 5900HS, as far as multi-thread benchmark scores are concerned. This is a very good result, as of early 2023.

Thanks to its decent cooling solution and a long-term CPU power limit of 80 W, the TUF Dash F15 FX517ZR is among the fastest laptops built around the 12650H that we know of. It can be more than 25% faster in CPU-bound workloads than the slowest system featuring the same chip in our database, as of August 2023.

Features

The integrated memory controller supports various memory types up to DDR5-4800, DDR4-3200, LPDDR5-5200, and LPDDR4x-4267. The Thread Director (in hardware) can support the operating system to decide which thread to use on the performance or efficient cores for the best performance. For AI tasks, the CPU also integrates GNA 3.0 and DL Boost (via AVX2). Quick Sync in version 8 is the same as in the Rocket Lake CPUs and supports MPEG-2, AVC, VC-1 decode, JPEG, VP8 decode, VP9, HEVC, and AV1 decode in hardware. The CPU only supports PCIe 4.0 (x8 for a GPU and two x4 for SSDs).

The integrated graphics card is based on the Xe-architecture and offers 64 of the 96 EUs (Execution Units) operating at up to 1.4 GHz.

Power consumption

This Core i7 has a "minimum assured" power consumption of 35 W, with 45 W being its Base power consumption. The processor's maximum Intel-recommended Turbo power consumption sits at 115 W. It would take at least two fans to cool such a beast.

Last but not the least, Intel Core i7-12650H is built with Intel's fourth-generation 10 nm process marketed as Intel 7 for OK, as of early 2023, energy efficiency.

ModelAMD Ryzen 9 7950X3DIntel Core i7-12650H
CodenameRaphael (Zen4)Alder Lake-H
SeriesAMD Raphael (Zen 4, Ryzen 7000)Intel Alder Lake-P
Series: Alder Lake-P Alder Lake-H
AMD Ryzen 9 7950X3D « 4.2 - 5.7 GHz16 / 32 cores128 MB L3
AMD Ryzen 9 7900X compare4.7 - 5.6 GHz12 / 24 cores64 MB L3
AMD Ryzen 9 7900 compare3.7 - 5.4 GHz12 / 24 cores64 MB L3
AMD Ryzen 7 7700X compare4.5 - 5.4 GHz8 / 16 cores32 MB L3
AMD Ryzen 7 7700 compare3.8 - 5.3 GHz8 / 16 cores32 MB L3
AMD Ryzen 7 7800X3D compare4.2 - 5 GHz8 / 16 cores96 MB L3
AMD Ryzen 5 7600X compare4.7 - 5.3 GHz6 / 12 cores32 MB L3
AMD Ryzen 5 7600 compare3.8 - 5.1 GHz6 / 12 cores32 MB L3
Intel Core i9-12900HK compare1.8 - 5 GHz14 / 20 cores24 MB L3
Intel Core i9-12900H compare1.8 - 5 GHz14 / 20 cores24 MB L3
Intel Core i7-12800H compare1.8 - 4.8 GHz14 / 20 cores24 MB L3
Intel Core i7-12650H « 1.7 - 4.7 GHz10 / 16 cores24 MB L3
Intel Core i5-12600H compare2 - 4.5 GHz12 / 16 cores18 MB L3
Intel Core i5-12500H compare1.8 - 4.5 GHz12 / 16 cores18 MB L3
Intel Core i5-12450H compare1.5 - 4.4 GHz8 / 12 cores12 MB L3
Clock4200 - 5700 MHz1700 - 4700 MHz
L1 Cache1 MB864 KB
L2 Cache16 MB9.5 MB
L3 Cache128 MB24 MB
Cores / Threads16 / 32
16 x 5.7 GHz AMD Zen 4
10 / 16
TDP120 Watt45 Watt
Transistors13140 Million
Technology5 nm10 nm
Die Size263 mm2
max. Temp.89 °C100 °C
SocketAM5 (LGA 1718)BGA1744
FeaturesMMX(+), SSE, SSE2, SSE3, SSSE3, SSE4.1, SSE4.2, SSE4A, x86-64, AMD-V, AES, AVX, AVX2, AVX512F, FMA3, SHA, XFR2, Precision Boost 2DDR4-3200/LPDDR4x-4266/DDR5-4800/LPDDR5-5200 RAM, PCIe 4, Thr. Dir., DL Boost, GNA, MMX, SSE, SSE2, SSE3, SSSE3, SSE4.1, SSE4.2, AVX, AVX2, BMI2, ABM, FMA, ADX, SMEP, SMAP, EIST, TM1, TM2, HT, Turbo, SST, AES-NI, RDRAND, RDSEED, SHA
iGPUAMD Radeon Graphics (Ryzen 7000) (400 - 2200 MHz)Intel UHD Graphics 64EUs (Alder Lake 12th Gen) ( - 1400 MHz)
Architecturex86x86
$699 U.S.
Announced
Manufacturerwww.amd.comark.intel.com

Benchmarks

Performance Rating - CB R15 + R20 + 7-Zip + X265 + Blender + 3DM11 CPU - R9 7950X3D
49.9 pt (83%)
Restrict / Search: Model: Max. age: years
Performance Rating - CB R15 + R20 + 7-Zip + X265 + Blender + 3DM11 CPU - i7-12650H
37.1 pt (62%)
Restrict / Search: Model: Max. age: years
Cinebench 2024 - Cinebench 2024 CPU Single Core
min: 85     avg: 98     median: 99 (56%)     max: 107 Points
Cinebench 2024 - Cinebench 2024 CPU Multi Core
min: 294     avg: 515     median: 530 (10%)     max: 673 Points
Cinebench R23 - Cinebench R23 Multi Core
36291 Points (34%)
min: 5362     avg: 11525     median: 12074 (11%)     max: 15537 Points
Cinebench R23 - Cinebench R23 Single Core
2053 Points (86%)
min: 1428     avg: 1722     median: 1763 (74%)     max: 1808 Points
Cinebench R20 - Cinebench R20 CPU (Single Core)
795 Points (87%)
min: 552     avg: 664     median: 679 (74%)     max: 696 Points
Cinebench R20 - Cinebench R20 CPU (Multi Core)
14188 Points (35%)
min: 2106     avg: 4459     median: 4691 (11%)     max: 6009 Points
Cinebench R15 - Cinebench R15 CPU Multi 64 Bit
5974 Points (38%)
min: 753     avg: 1770     median: 1851.5 (12%)     max: 2253 Points
Cinebench R15 - Cinebench R15 CPU Single 64 Bit
326 Points (90%)
min: 206     avg: 245.1     median: 250 (69%)     max: 261 Points
Cinebench R11.5 - Cinebench R11.5 CPU Multi 64 Bit
64.6 Points (84%)
min: 9.35     avg: 17.9     median: 18.2 (24%)     max: 25.04 Points
Cinebench R11.5 - Cinebench R11.5 CPU Single 64 Bit
3.9 Points (92%)
min: 2.52     avg: 2.9     median: 3 (70%)     max: 3.15 Points
Cinebench R10 - Cinebench R10 Rend. Single (32bit)
16551 Points (100%)
min: 7466     avg: 8300     median: 8301 (50%)     max: 8903 Points
Cinebench R10 - Cinebench R10 Rend. Multi (32bit)
138015 Points (100%)
min: 20693     avg: 35422     median: 34901.5 (25%)     max: 49328 Points
Cinebench R10 - Cinebench R10 Rend. Multi (64bit)
72361 Points (46%)
min: 29444     avg: 52500     median: 52008 (33%)     max: 68516 Points
Cinebench R10 - Cinebench R10 Rend. Single (64bit)
8853 Points (11%)
min: 11960     avg: 13177     median: 13397 (16%)     max: 14533 Points
wPrime 2.10 - wPrime 2.0 1024m *
33.9 s (0%)
min: 266.983     avg: 410.5     median: 426 (5%)     max: 483.853 s
wPrime 2.10 - wPrime 2.0 32m *
2 s (0%)
min: 3.705     avg: 6.5     median: 6.9 (1%)     max: 8.743 s
WinRAR - WinRAR 4.0
15779 Points (25%)
min: 6896     avg: 7773     median: 7731.5 (12%)     max: 9090 Points
7-Zip 18.03 - 7-Zip 18.03 Multi Thread 4 runs
159341 MIPS (91%)
min: 27053     avg: 46612     median: 47972 (28%)     max: 59034 MIPS
7-Zip 18.03 - 7-Zip 18.03 Single Thread 4 runs
8321 MIPS (98%)
min: 5265     avg: 5635     median: 5702.5 (67%)     max: 6116 MIPS
X264 HD Benchmark 4.0 - x264 Pass 2
265.5 fps (7%)
min: 53.8     avg: 91.5     median: 88.9 (2%)     max: 127.5 fps
X264 HD Benchmark 4.0 - x264 Pass 1
392.5 fps (10%)
min: 197.2     avg: 255.4     median: 262.5 (7%)     max: 311.5 fps
HWBOT x265 Benchmark v2.2 - HWBOT x265 4k Preset
42.4 fps (75%)
min: 6.62     avg: 13.8     median: 14.3 (25%)     max: 17.4 fps
TrueCrypt - TrueCrypt Serpent
2.8 GB/s (82%)
min: 0.674     avg: 0.9     median: 0.9 (26%)     max: 1.2 GB/s
TrueCrypt - TrueCrypt Twofish
4.2 GB/s (72%)
min: 1.1     avg: 1.5     median: 1.5 (26%)     max: 2.1 GB/s
TrueCrypt - TrueCrypt AES
26.9 GB/s (70%)
min: 6.7     avg: 9     median: 8.9 (23%)     max: 11.8 GB/s
Blender - Blender 3.3 Classroom CPU *
133 Seconds (2%)
min: 396     avg: 538     median: 479 (6%)     max: 1029 Seconds
Blender - Blender 2.79 BMW27 CPU *
86 Seconds (1%)
min: 222     avg: 299.8     median: 277 (2%)     max: 553 Seconds
R Benchmark 2.5 - R Benchmark 2.5 *
0.4 sec (8%)
min: 0.4584     avg: 0.5     median: 0.5 (10%)     max: 0.515 sec
3DMark 06 - CPU - 3DMark 06 - CPU
20279 Points (43%)
min: 8344     avg: 12678     median: 12716 (27%)     max: 18599 Points
Super Pi mod 1.5 XS 1M - Super Pi mod 1.5 XS 1M *
6.1 s (1%)
min: 7.703     avg: 8     median: 7.9 (2%)     max: 8.891 s
Super Pi mod 1.5 XS 2M - Super Pi mod 1.5 XS 2M *
13.2 s (1%)
min: 17.392     avg: 18     median: 17.6 (1%)     max: 19.733 s
Super Pi Mod 1.5 XS 32M - Super Pi mod 1.5 XS 32M *
305.1 s (1%)
min: 413.002     avg: 436.2     median: 433.5 (2%)     max: 463.857 s
3DMark Vantage - 3DM Vant. Perf. CPU no Physx
99321 Points (76%)
min: 30717     avg: 53165     median: 53162 (41%)     max: 75129 Points
3DMark 11 - 3DM11 Performance Physics
36991 Points (91%)
min: 9219     avg: 18466     median: 18363 (45%)     max: 22811 Points
3DMark - 3DMark Ice Storm Physics
86389 Points (70%)
min: 57680     avg: 80244     median: 83501.5 (68%)     max: 88686 Points
3DMark - 3DMark Ice Storm Extreme Physics
86306 Points (70%)
min: 57559     avg: 81506     median: 85075.5 (69%)     max: 89577 Points
3DMark - 3DMark Ice Storm Unlimited Physics
87725 Points (70%)
min: 80654     avg: 88077     median: 87546.5 (70%)     max: 96373 Points
3DMark - 3DMark Cloud Gate Physics
26168 Points (66%)
min: 8608     avg: 15722     median: 16486.5 (42%)     max: 19297 Points
3DMark - 3DMark Fire Strike Standard Physics
44787 Points (80%)
min: 12668     avg: 22820     median: 22920 (41%)     max: 27558 Points
3DMark - 3DMark Time Spy CPU
17206 Points (73%)
min: 4231     avg: 9365     median: 9953 (42%)     max: 11800 Points
Geekbench 6.5 - Geekbench 6.5 Single-Core
2990 Points (72%)
min: 2131     avg: 2357     median: 2384 (58%)     max: 2481 Points
Geekbench 6.5 - Geekbench 6.5 Multi-Core
19960 Points (77%)
min: 7608     avg: 9408     median: 9656 (37%)     max: 11014 Points
Geekbench 6.0 - Geekbench 6.0 Single-Core
min: 2008     avg: 2222     median: 2254 (72%)     max: 2345 Points
Geekbench 6.0 - Geekbench 6.0 Multi-Core
min: 7273     avg: 9147     median: 9329 (38%)     max: 11255 Points
Geekbench 5.5 - Geekbench 5.1 - 5.5 64 Bit Single-Core
2311 Points (88%)
min: 1590     avg: 1743     median: 1758 (67%)     max: 1797 Points
Geekbench 5.5 - Geekbench 5.1 - 5.5 64 Bit Multi-Core
24343 Points (44%)
min: 6478     avg: 9797     median: 9784 (18%)     max: 11284 Points
Geekbench 5.0 - Geekbench 5.0 64 Bit Single-Core
2183 Points (9%)
min: 1486     avg: 1677     median: 1705 (7%)     max: 1766 Points
Geekbench 5.0 - Geekbench 5.0 64 Bit Multi-Core
23720 Points (75%)
min: 6287     avg: 9019     median: 9099 (29%)     max: 11153 Points
Geekbench 4.4 - Geekbench 4.1 - 4.4 64 Bit Single-Core
9240 Points (92%)
min: 6711     avg: 7411     median: 7483 (75%)     max: 7705 Points
Geekbench 4.4 - Geekbench 4.1 - 4.4 64 Bit Multi-Core
87922 Points (86%)
min: 24621     avg: 34058     median: 34216 (34%)     max: 41477 Points
Mozilla Kraken 1.1 - Kraken 1.1 Total Score *
437 ms (1%)
min: 519     avg: 552     median: 542 (1%)     max: 652 ms
Sunspider - Sunspider 1.0 Total Score *
86 ms (1%)
Octane V2 - Octane V2 Total Score
min: 85840     avg: 87864     median: 87864 (64%)     max: 89888 Points
WebXPRT 4 - WebXPRT 4 Score
313 Points (86%)
min: 234     avg: 249.5     median: 250.5 (69%)     max: 268 Points
WebXPRT 3 - WebXPRT 3 Score
383 Points (69%)
min: 265     avg: 291.3     median: 295.5 (53%)     max: 309 Points
CrossMark - CrossMark Overall
2193 Points (82%)
min: 1532     avg: 1694     median: 1715 (64%)     max: 1875 Points
Power Consumption - Prime95 Power Consumption - external Monitor *
276 Watt (48%)
min: 45.2     avg: 81.3     median: 78.3 (14%)     max: 112.7 Watt
Power Consumption - Cinebench R15 Multi Power Consumption - external Monitor *
273 Watt (50%)
min: 52.8     avg: 95.3     median: 91.4 (17%)     max: 147 Watt
Power Consumption - Idle Power Consumption - external Monitor *
118.4 Watt (78%)
min: 5.22     avg: 20.2     median: 20.1 (13%)     max: 47.5 Watt
Power Consumption - Idle Power Consumption 150cd 1min *
min: 7.04     avg: 8.4     median: 8.4 (10%)     max: 9.8 Watt
Power Consumption - Power Efficiency - Cinebench R15 Multi external Monitor
21.9 Points per Watt (16%)
min: 15.3     avg: 18.9     median: 16.7 (12%)     max: 24.2 Points per Watt

Average Benchmarks AMD Ryzen 9 7950X3D → 100% n=50

Average Benchmarks Intel Core i7-12650H → 59% n=50

- Range of benchmark values for this graphics card
red legend - Average benchmark values for this graphics card
* Smaller numbers mean a higher performance
1 This benchmark is not used for the average calculation

Add one or more devices and compare

In the following list you can select (and also search for) devices that should be added to the comparison. You can select more than one device.

restrict list:
v1.34
log 07. 13:37:34

#0 ran 0s before starting gpusingle class +0s ... 0s

#1 checking url part for id 15000 +0s ... 0s

#2 checking url part for id 14051 +0s ... 0s

#3 redirected to Ajax server, took 1759837054s time from redirect:0 +0s ... 0s

#4 did not recreate cache, as it is less than 5 days old! Created at Tue, 07 Oct 2025 05:18:31 +0200 +0s ... 0s

#5 composed specs +0.007s ... 0.007s

#6 did output specs +0s ... 0.007s

#7 getting avg benchmarks for device 15000 +0.004s ... 0.01s

#8 got single benchmarks 15000 +0.005s ... 0.016s

#9 getting avg benchmarks for device 14051 +0.004s ... 0.02s

#10 got single benchmarks 14051 +0.023s ... 0.043s

#11 got avg benchmarks for devices +0s ... 0.043s

#12 min, max, avg, median took s +0.065s ... 0.108s

#13 return log +0.001s ... 0.11s

Please share our article, every link counts!
Mail Logo
> Expert Reviews and News on Laptops, Smartphones and Tech Innovations > Benchmarks / Tech > Processor Comparison - Head 2 Head
Redaktion, 2017-09- 8 (Update: 2023-07- 1)