 Deutsch
 English
 Español
 Français
 Italiano
 Nederlands
 Polski
 Português
 Русский
 Türkçe
 Svenska
 Chinese
 Magyar
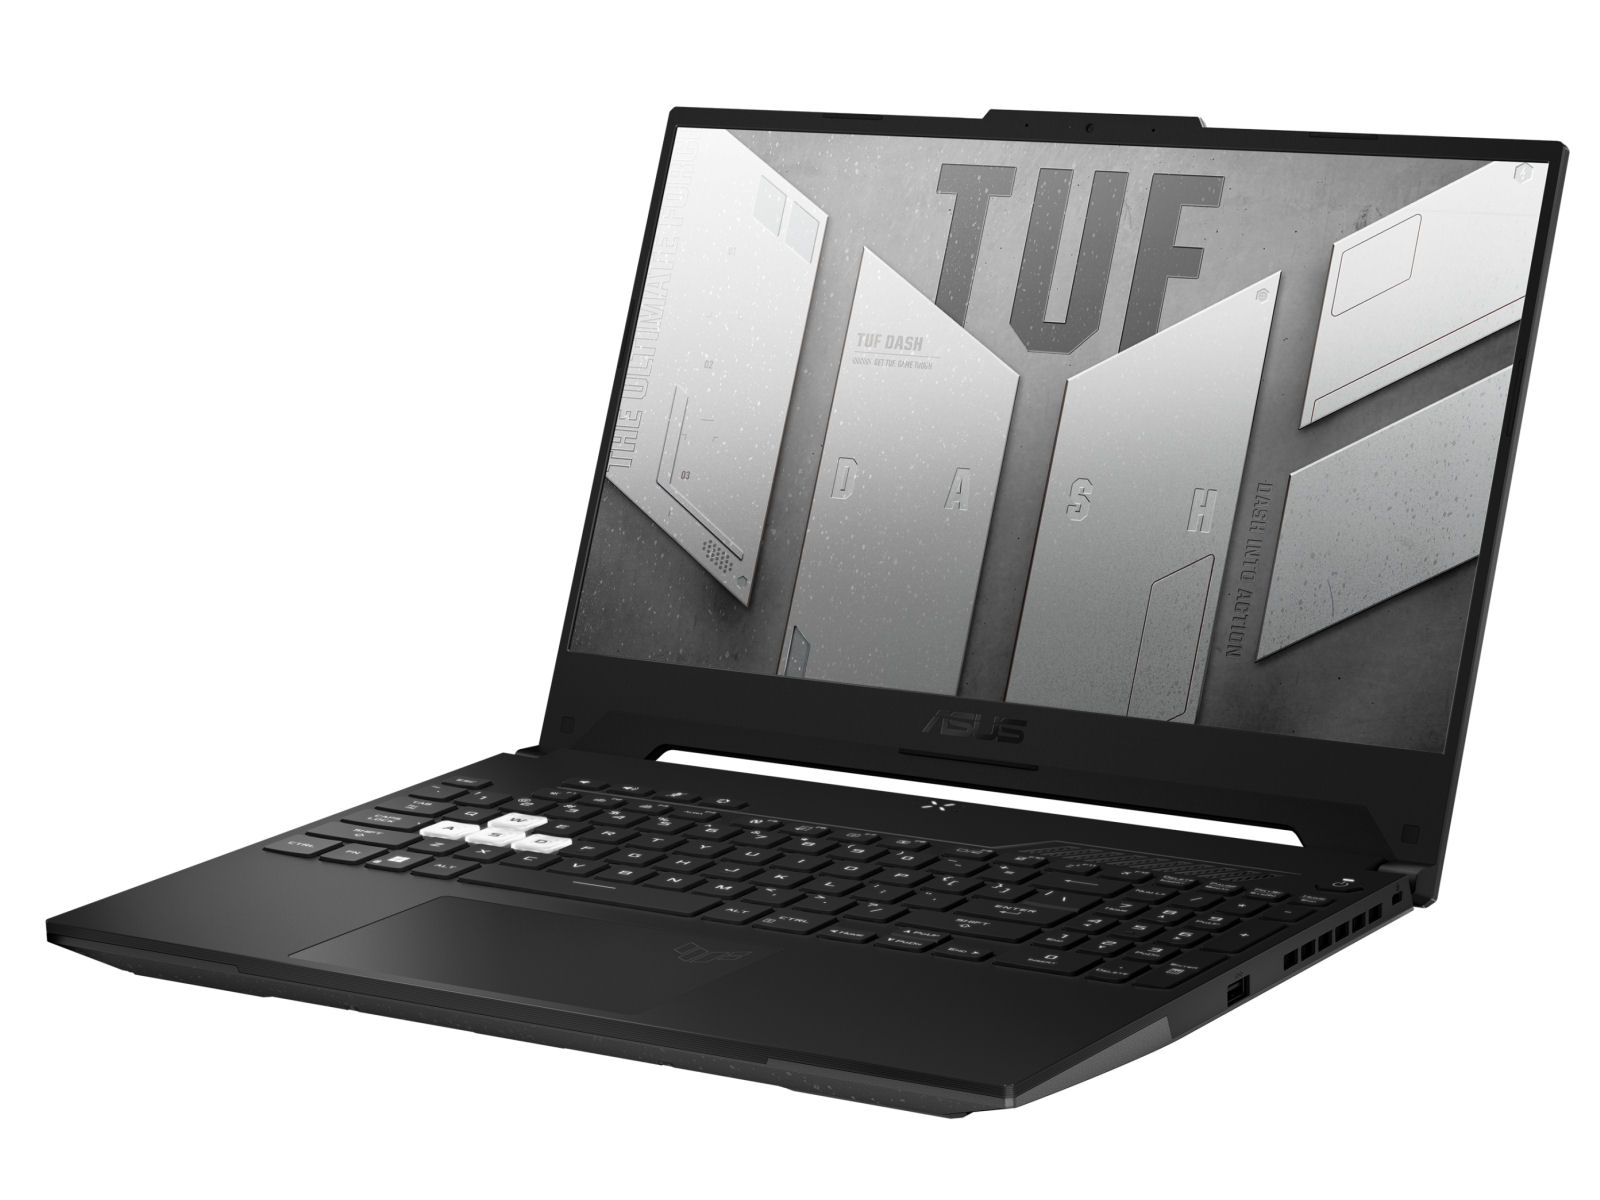
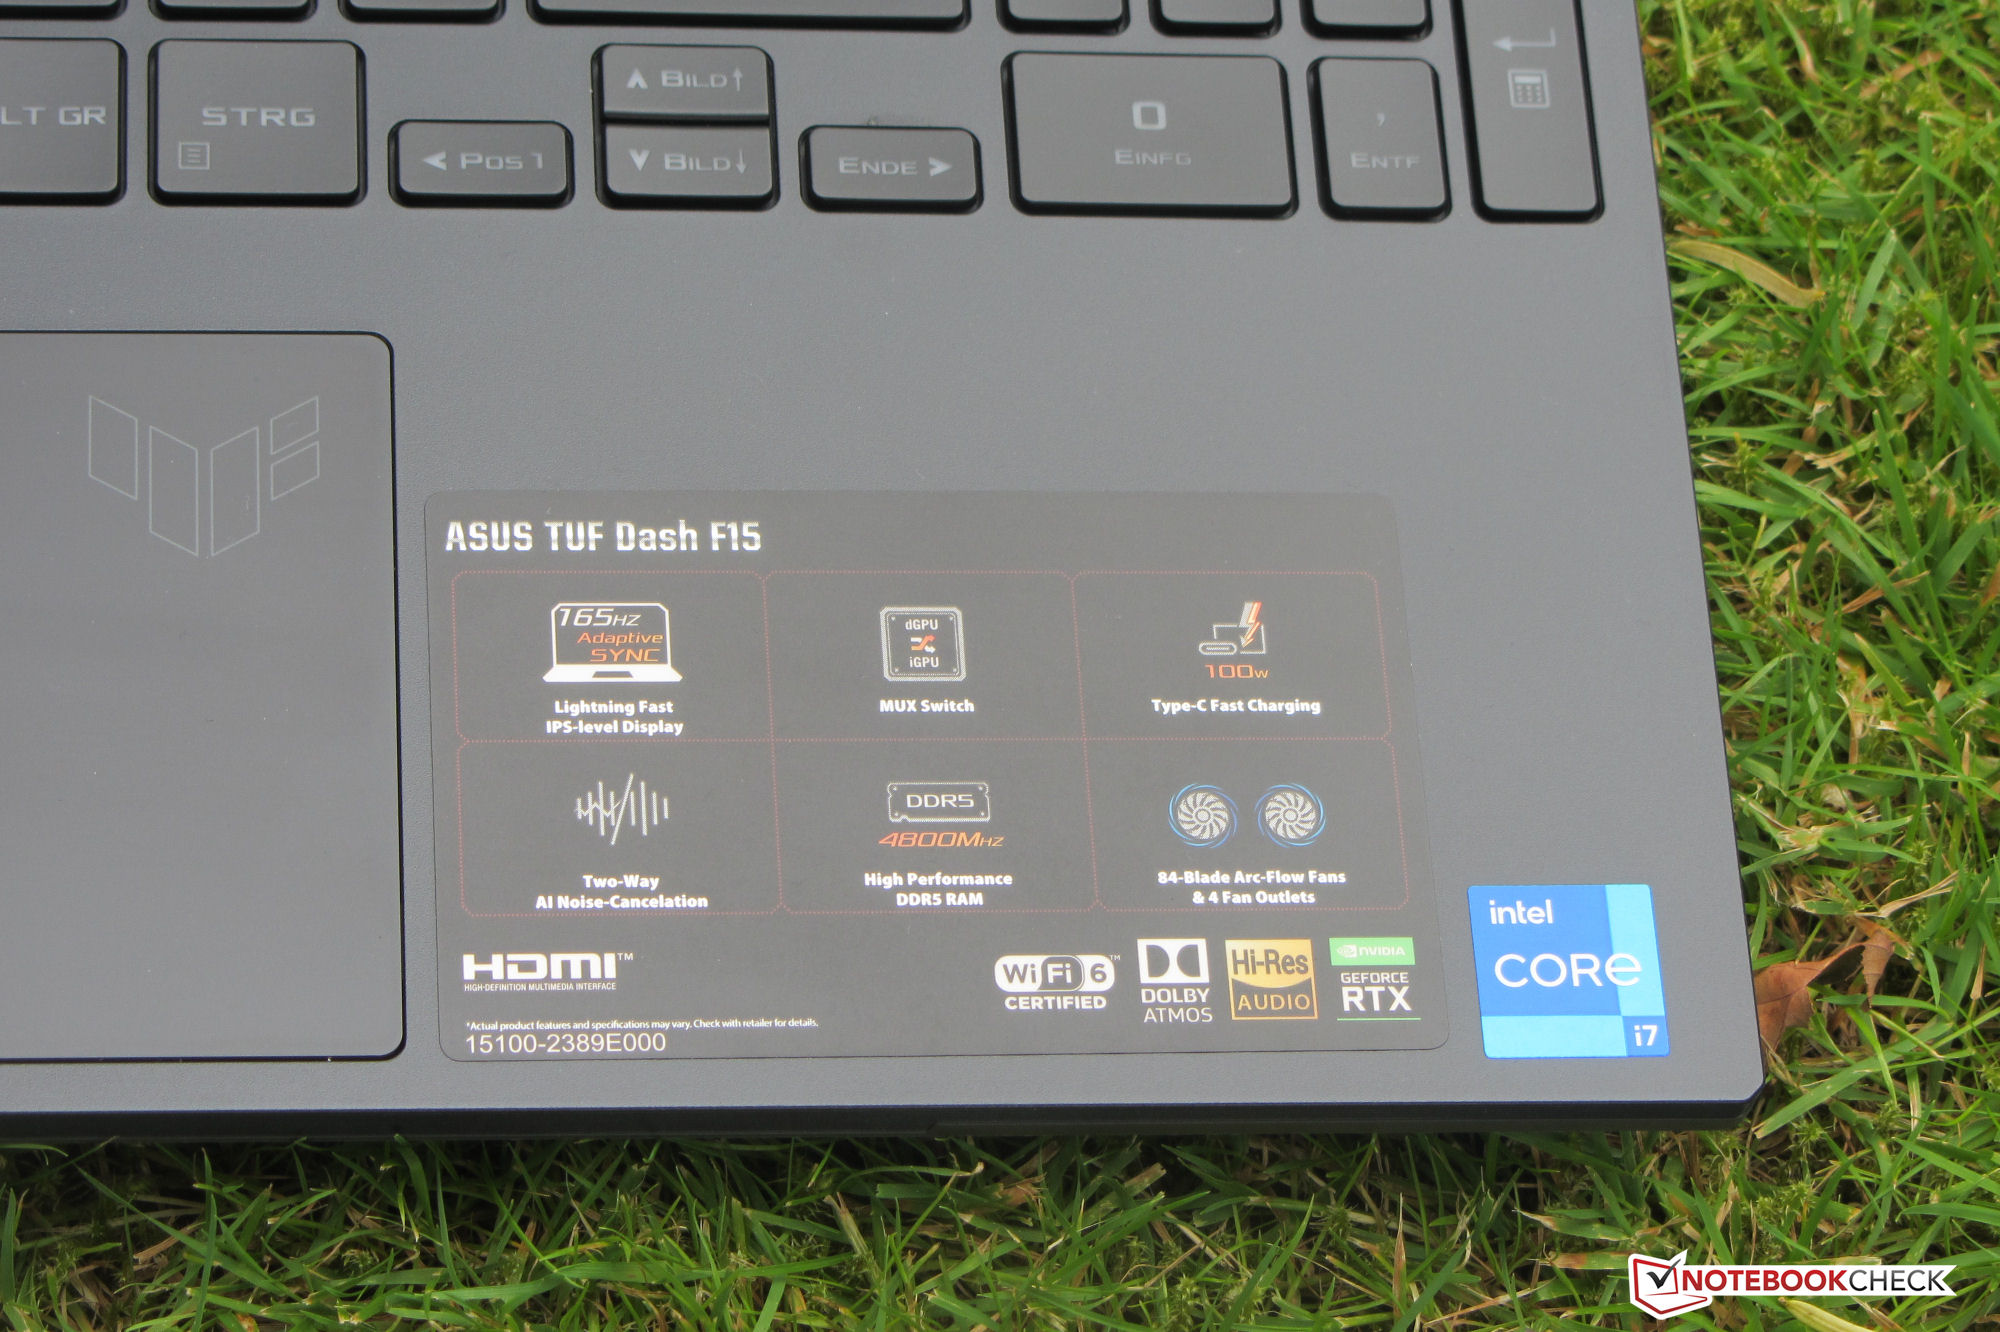
Asus TUF Dash F15 FX517ZR in review: Laptop with Mobile RTX 3070 and acceptable battery life

Asus doesn't aim for maximum performance in the FX517ZR; instead, it focuses on compact dimensions and low weight. This requires a suitable configuration: The Core-i7-12650H processor and the GeForce RTX 3070 Laptop GPU (TGP: 105 watts) are solid hardware belonging to the upper mid-range, but they aren't among the top performers. The 2 kg laptop competes with conceptually comparable laptops like the Razer Blade 15 Base Model, and the MSI Delta 15. The broader group of competitors includes laptops like the Acer Nitro 5 AN515-58, and the HP Omen 16.
Possible contenders in comparison
Rating | Date | Model | Weight | Height | Size | Resolution | Best Price |
|---|---|---|---|---|---|---|---|
| 85.8 % | 07/2022 | Asus TUF Dash F15 FX517ZR i7-12650H, GeForce RTX 3070 Laptop GPU | 2 kg | 20.7 mm | 15.60" | 2560x1440 | |
| 84 % | 06/2022 | Acer Nitro 5 AN515-58-72QR i7-12700H, GeForce RTX 3070 Ti Laptop GPU | 2.5 kg | 26.8 mm | 15.60" | 2560x1440 | |
| 85.5 % | 05/2022 | HP Omen 16-b1090ng i7-12700H, GeForce RTX 3070 Ti Laptop GPU | 2.3 kg | 23 mm | 16.10" | 2560x1440 | |
| 82.9 % | 10/2021 | MSI Delta 15 A5EFK R9 5900HX, Radeon RX 6700M | 2 kg | 19 mm | 15.60" | 1920x1080 | |
| 85.5 % | 03/2021 | Razer Blade 15 Base Edition 2021, i7-10750H RTX 3060 i7-10750H, GeForce RTX 3060 Laptop GPU | 2.1 kg | 19.9 mm | 15.60" | 1920x1080 |
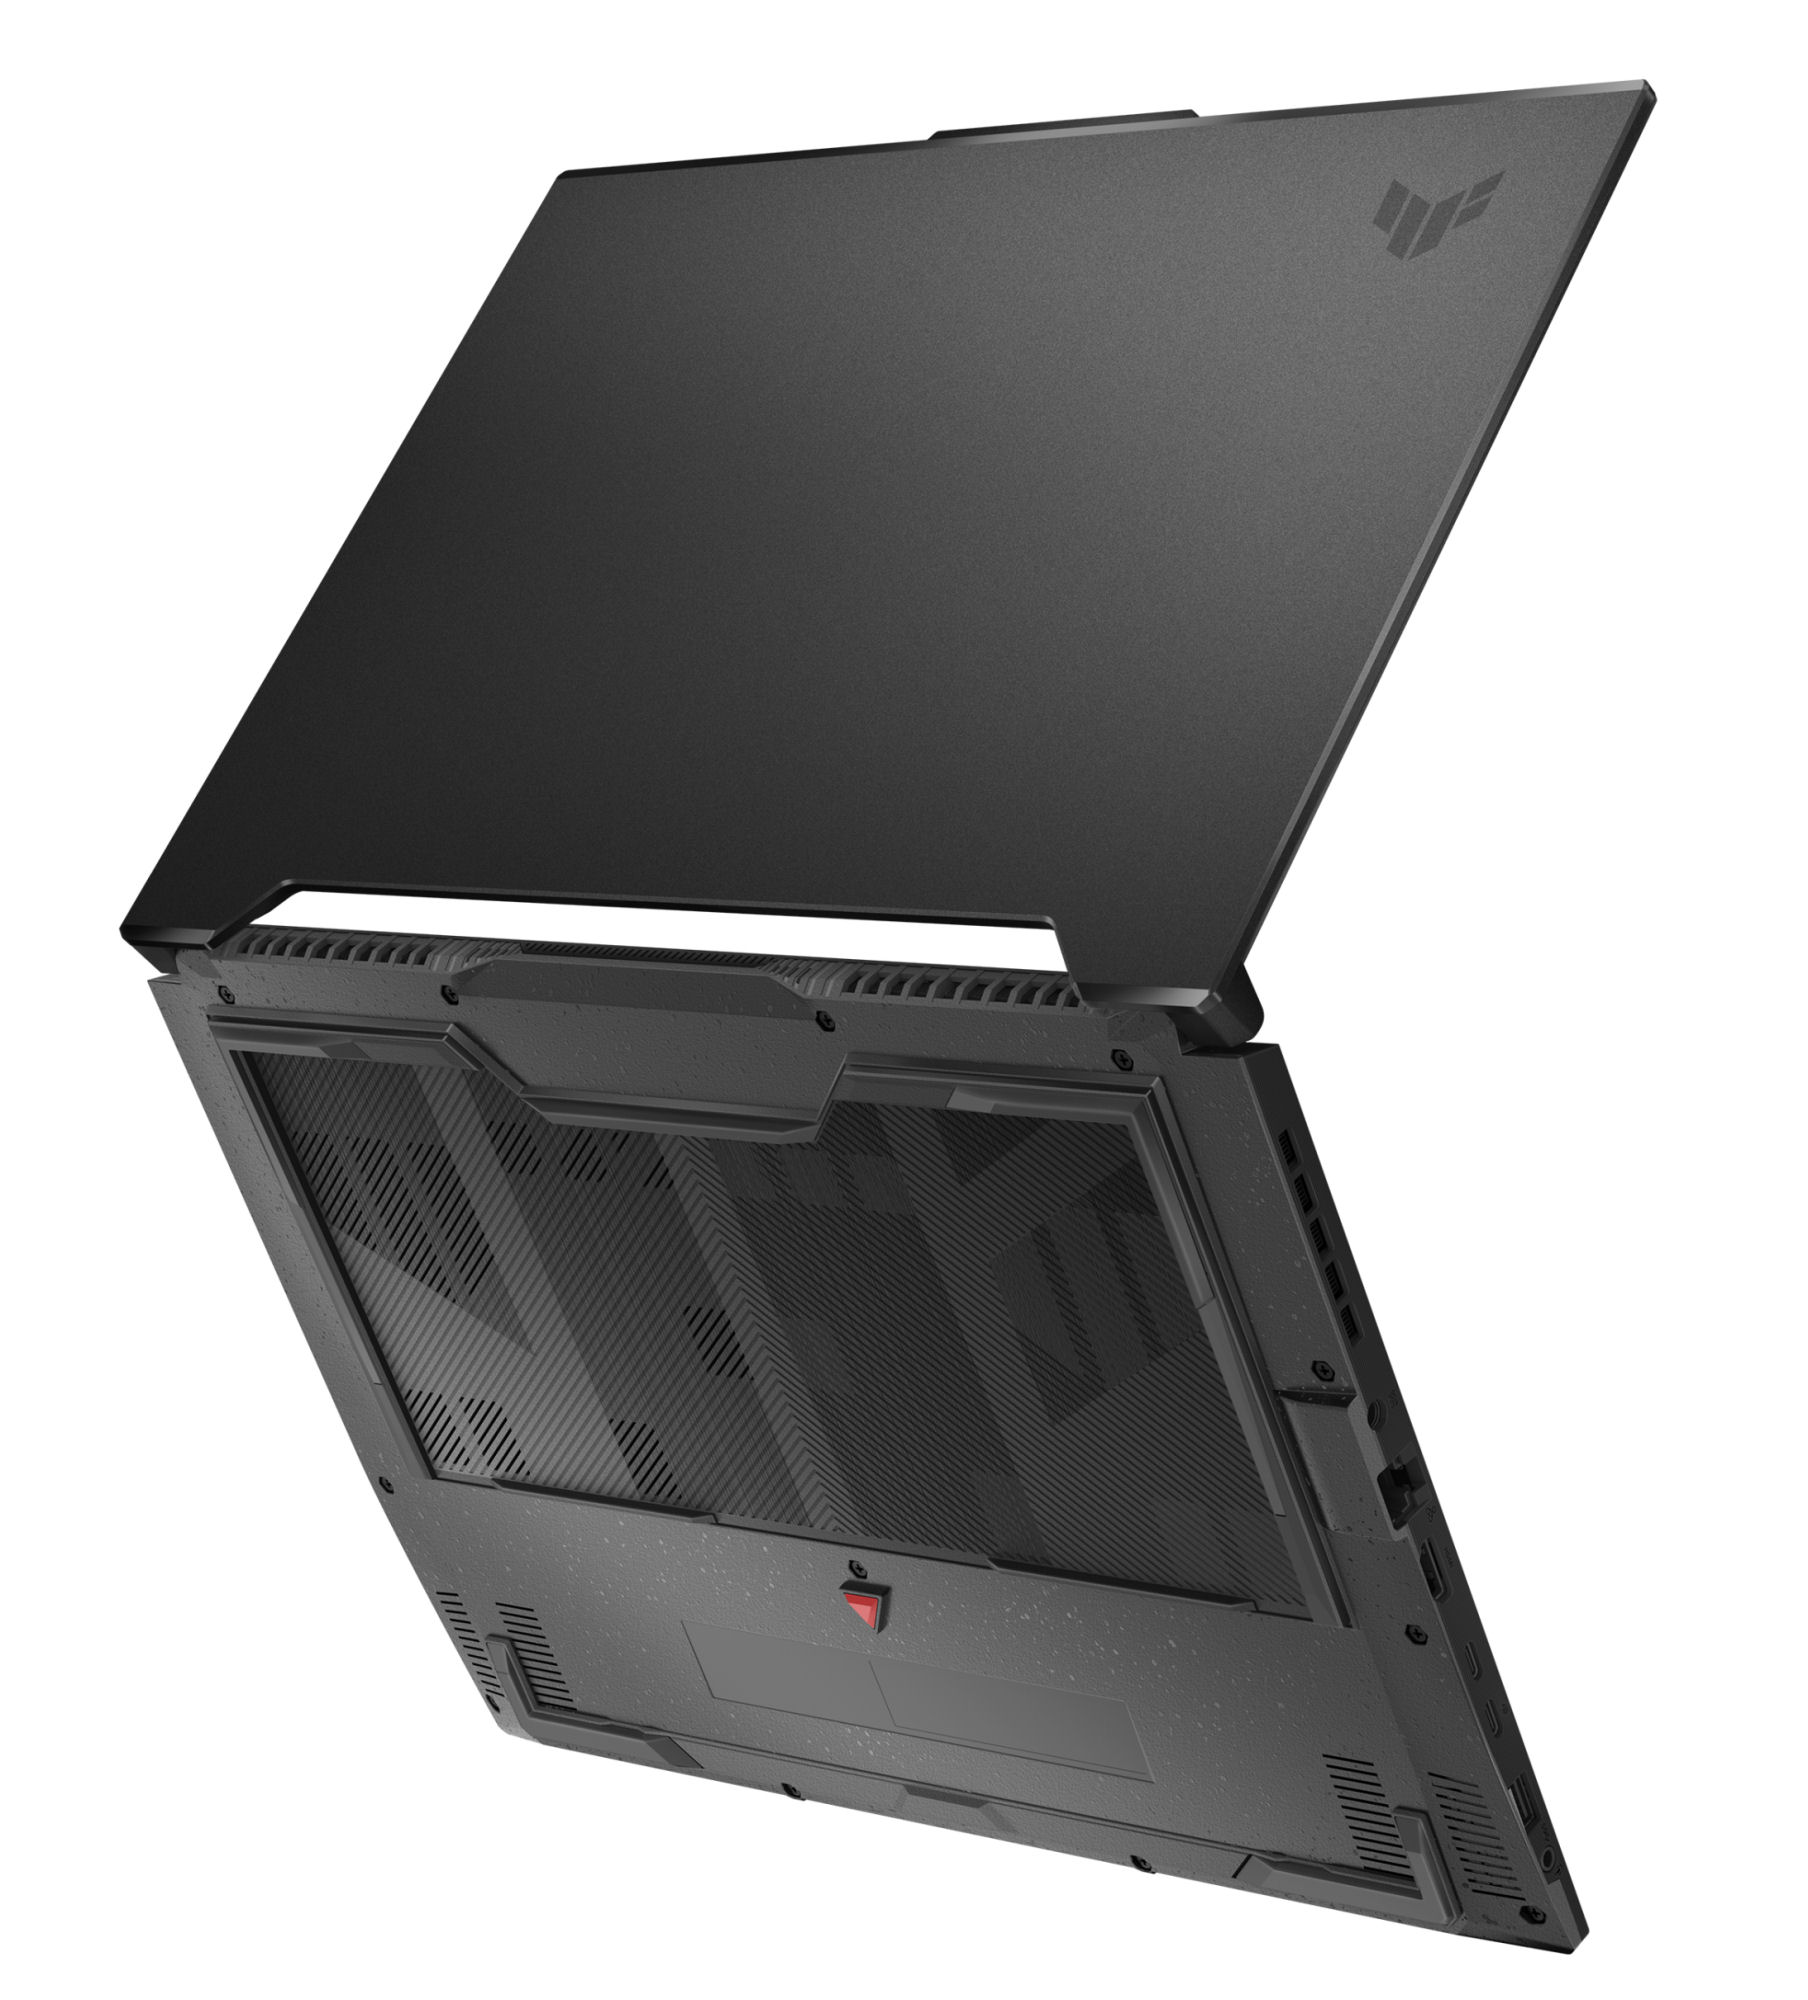
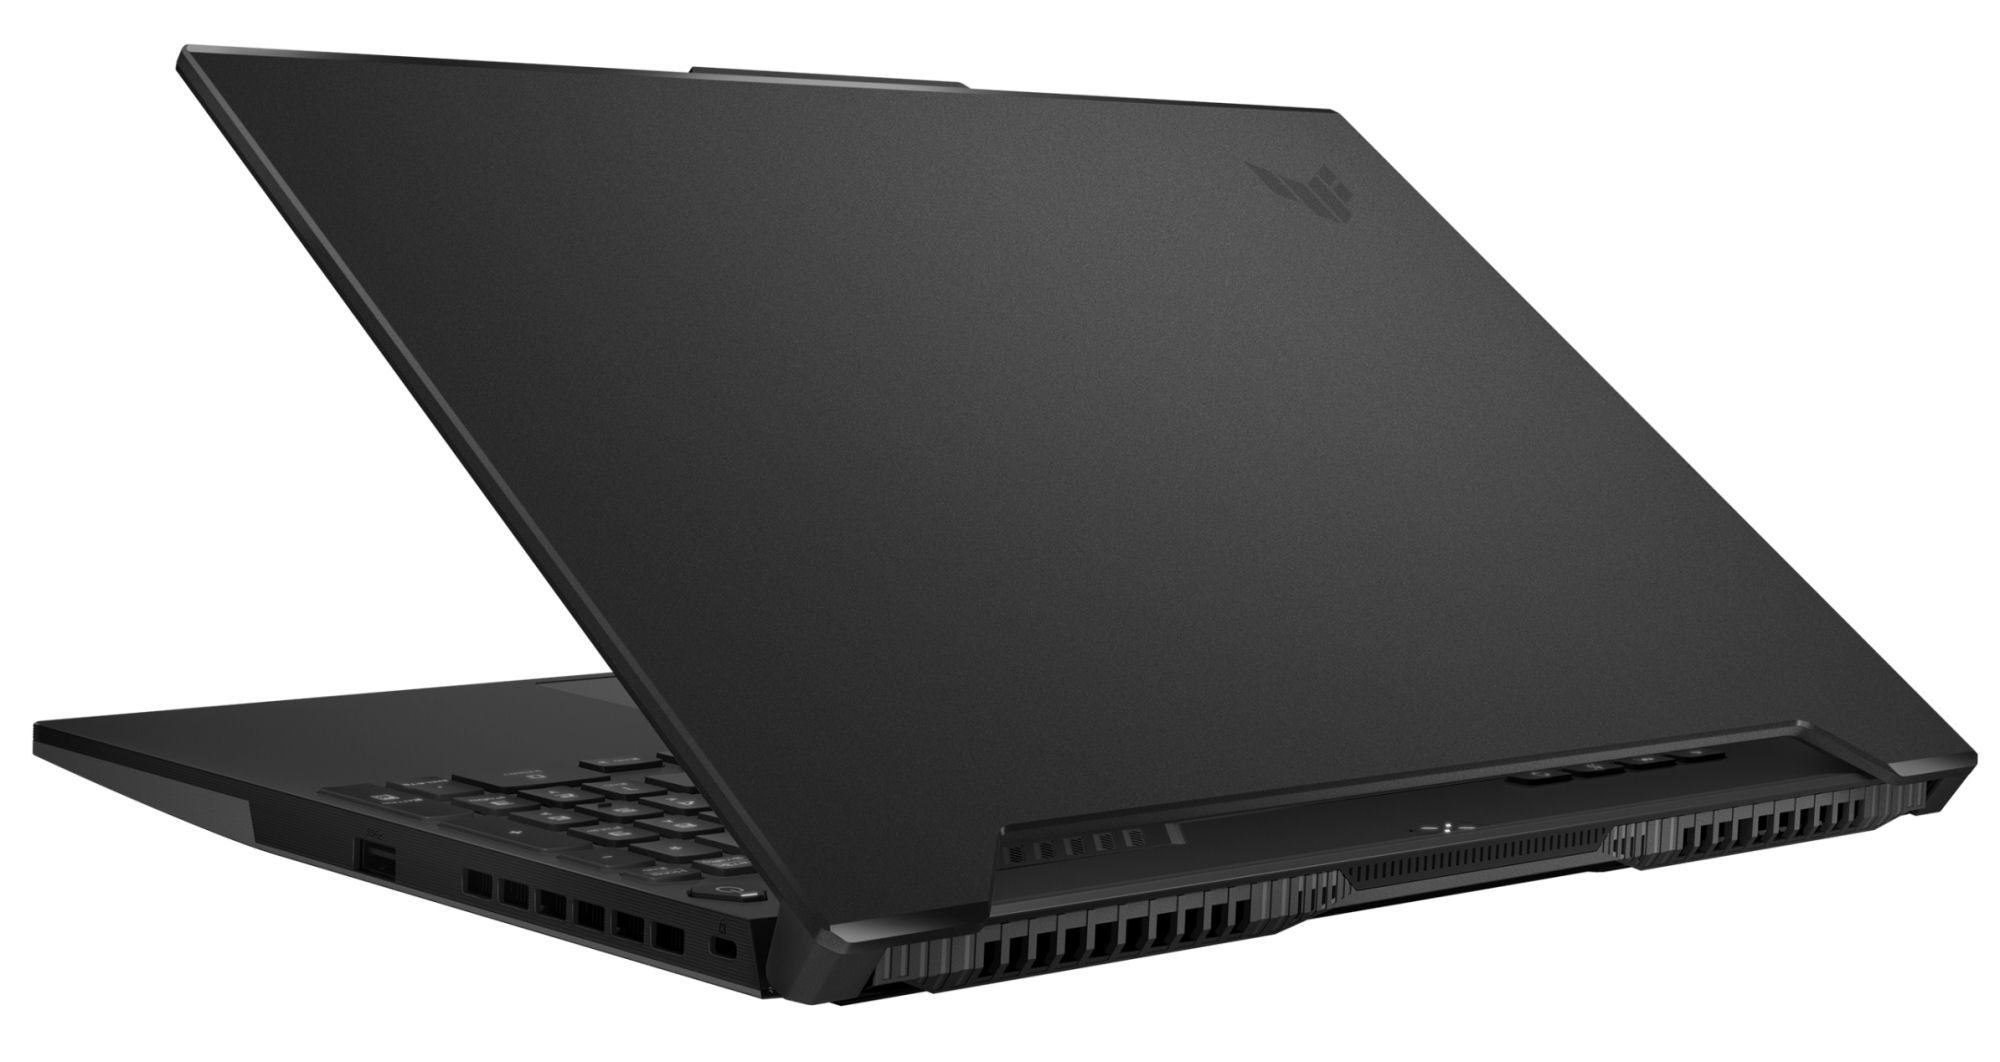
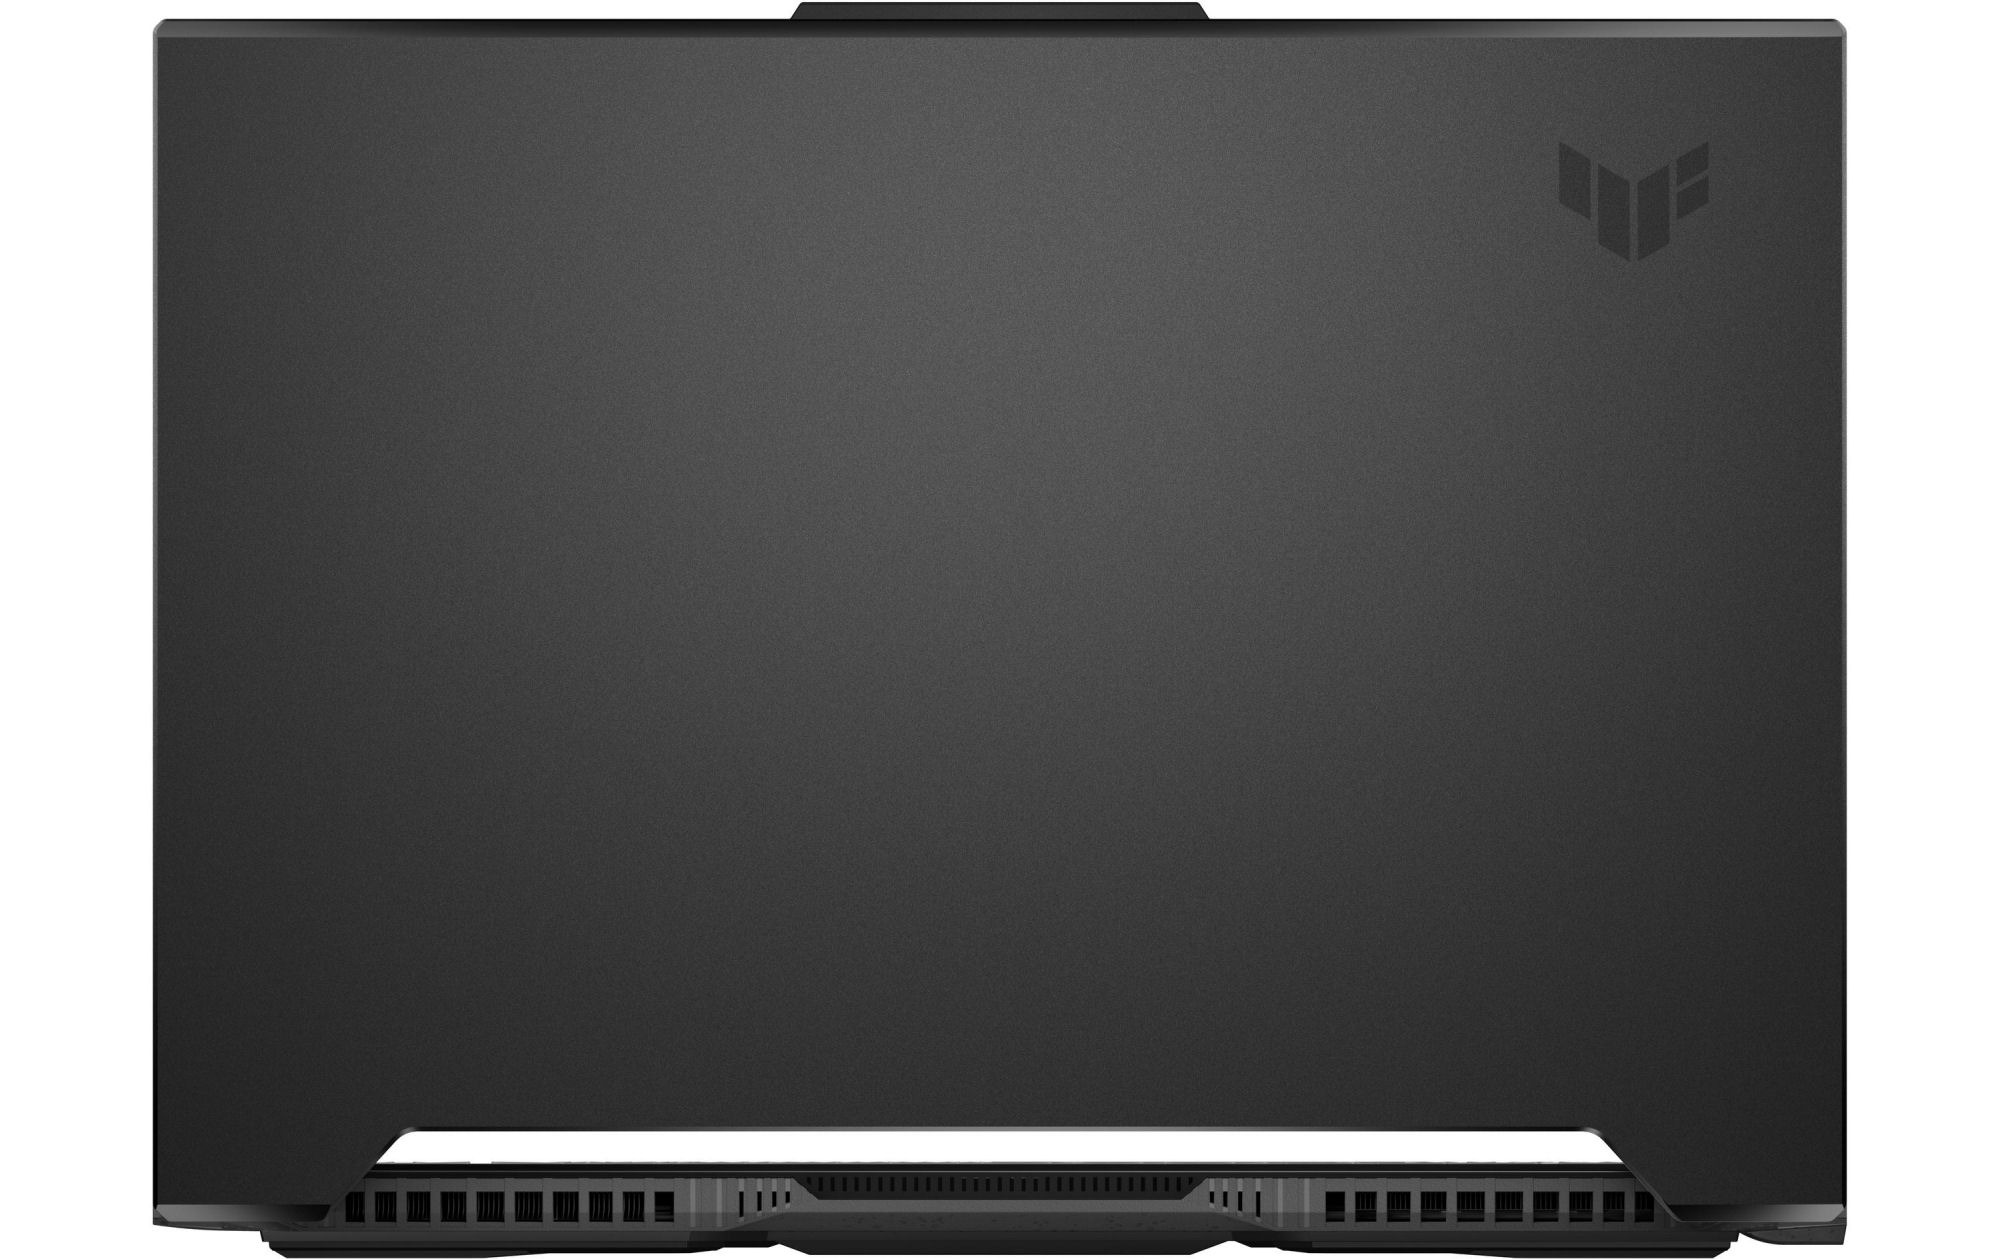
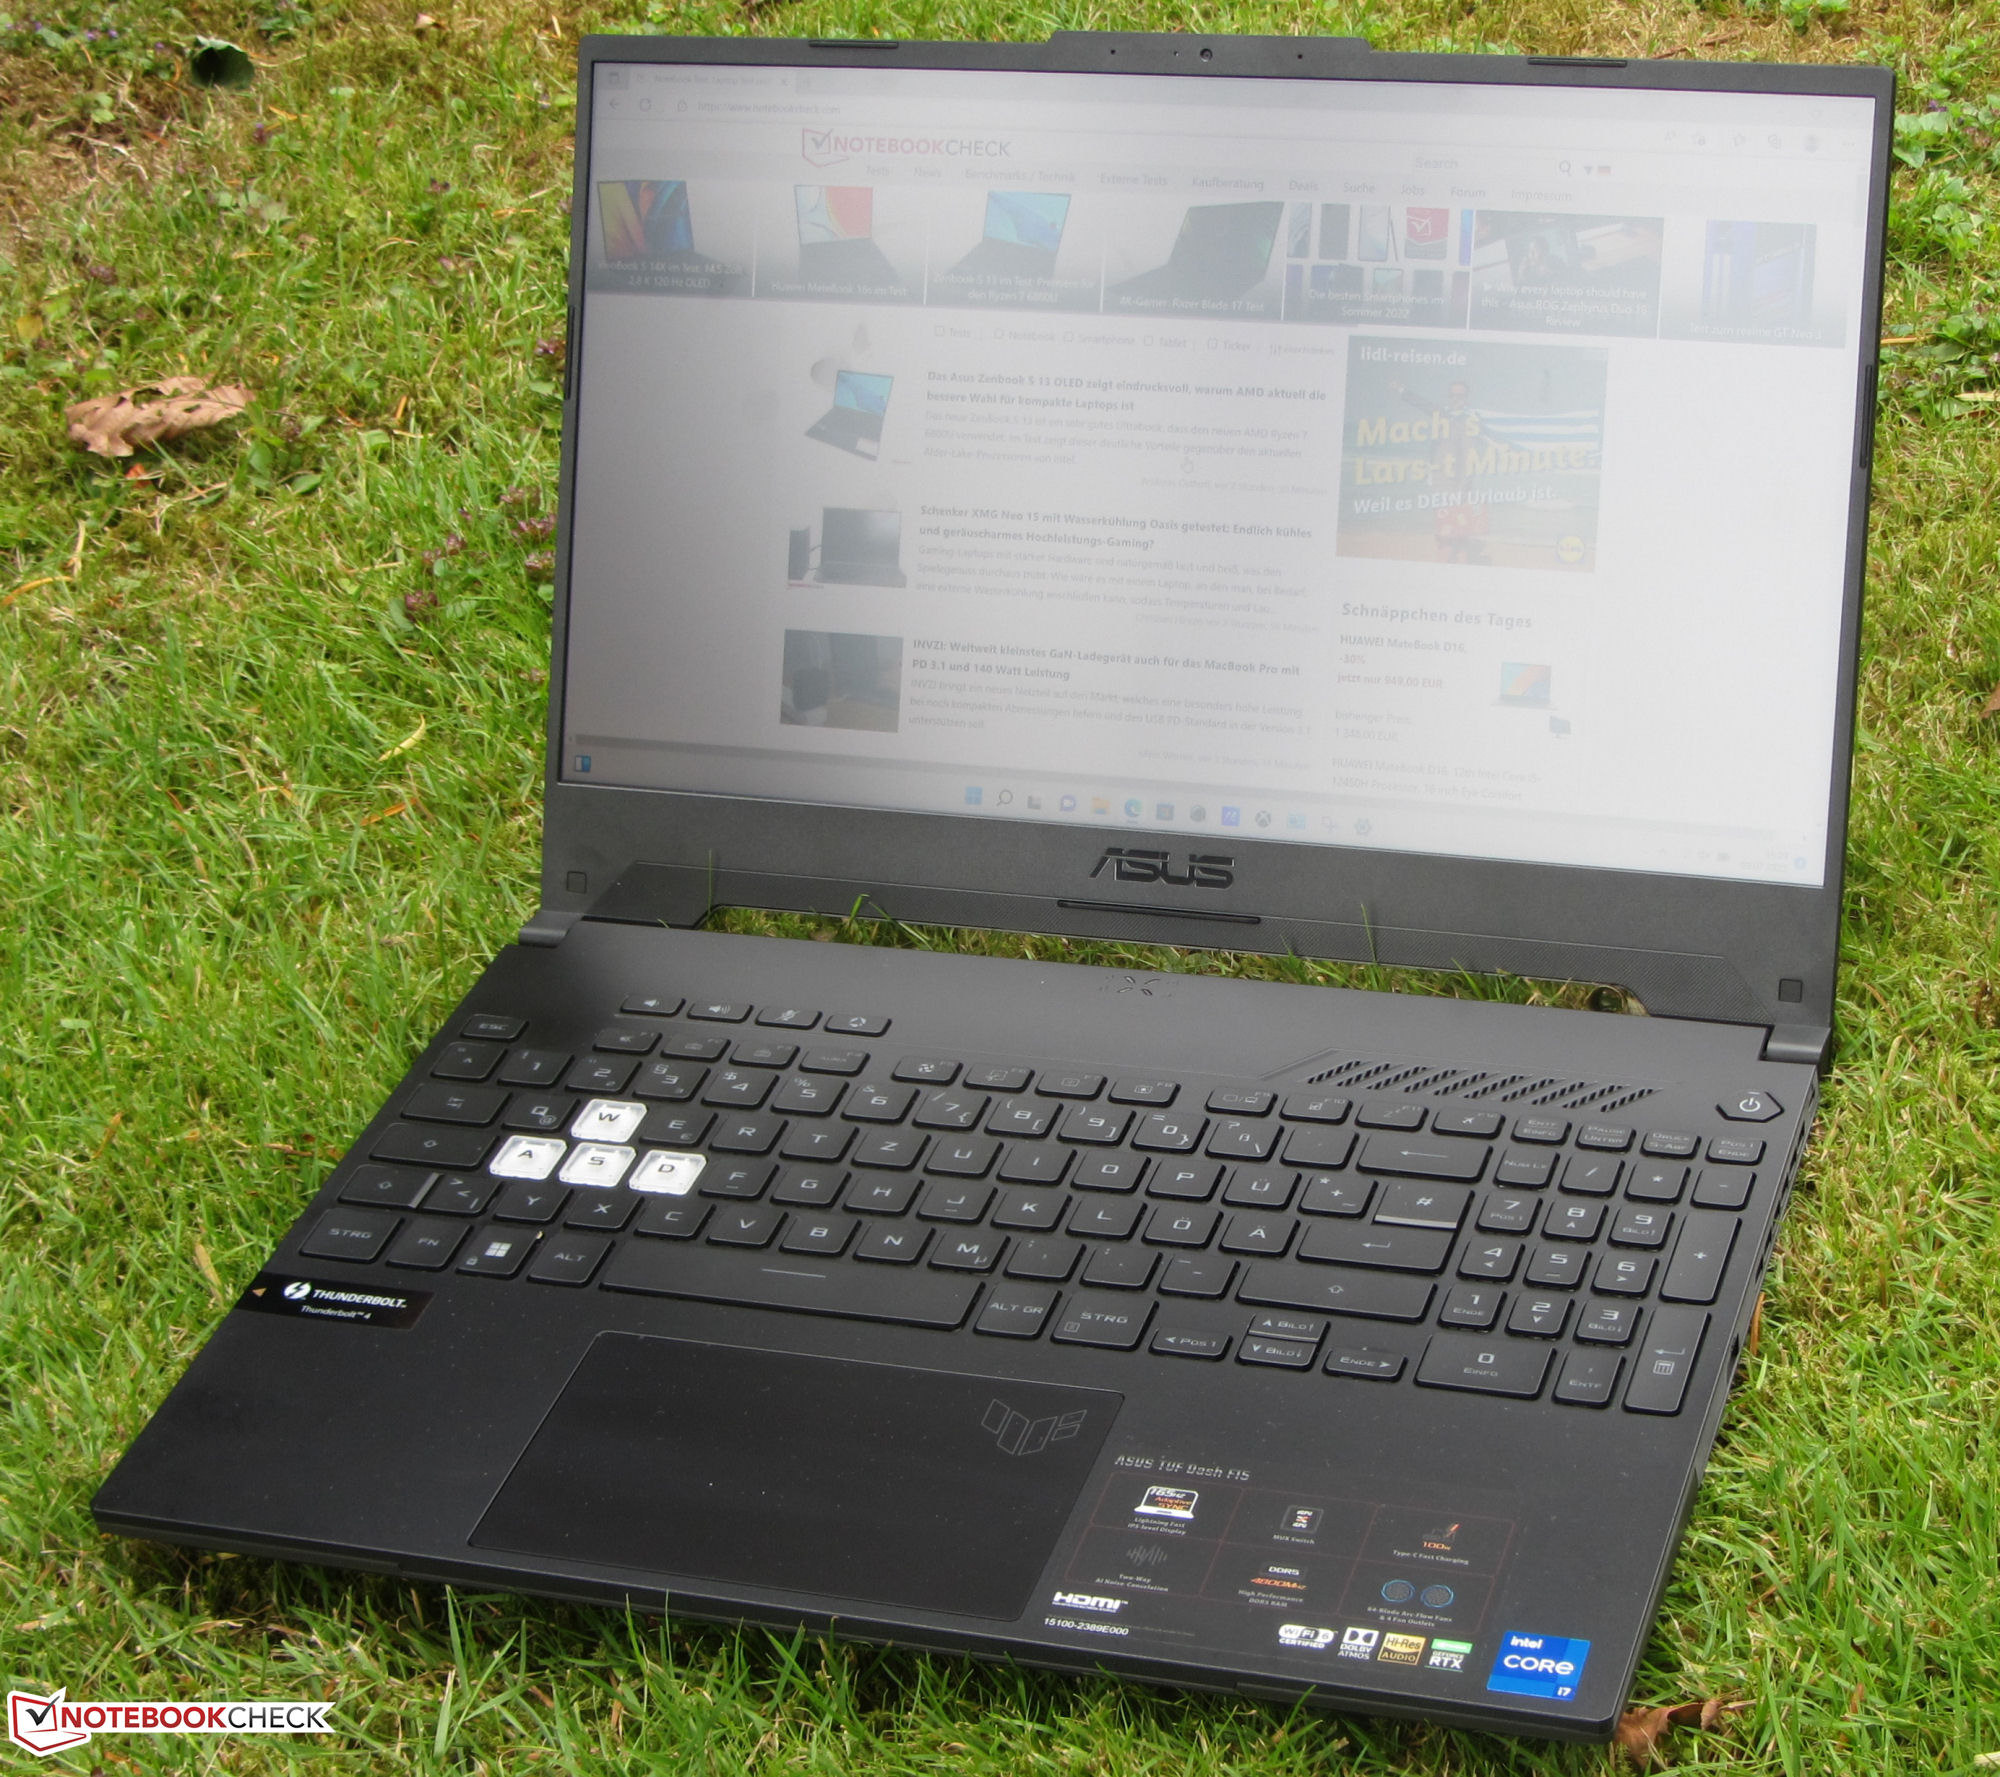
Case - The gaming laptop only weighs 2 kg
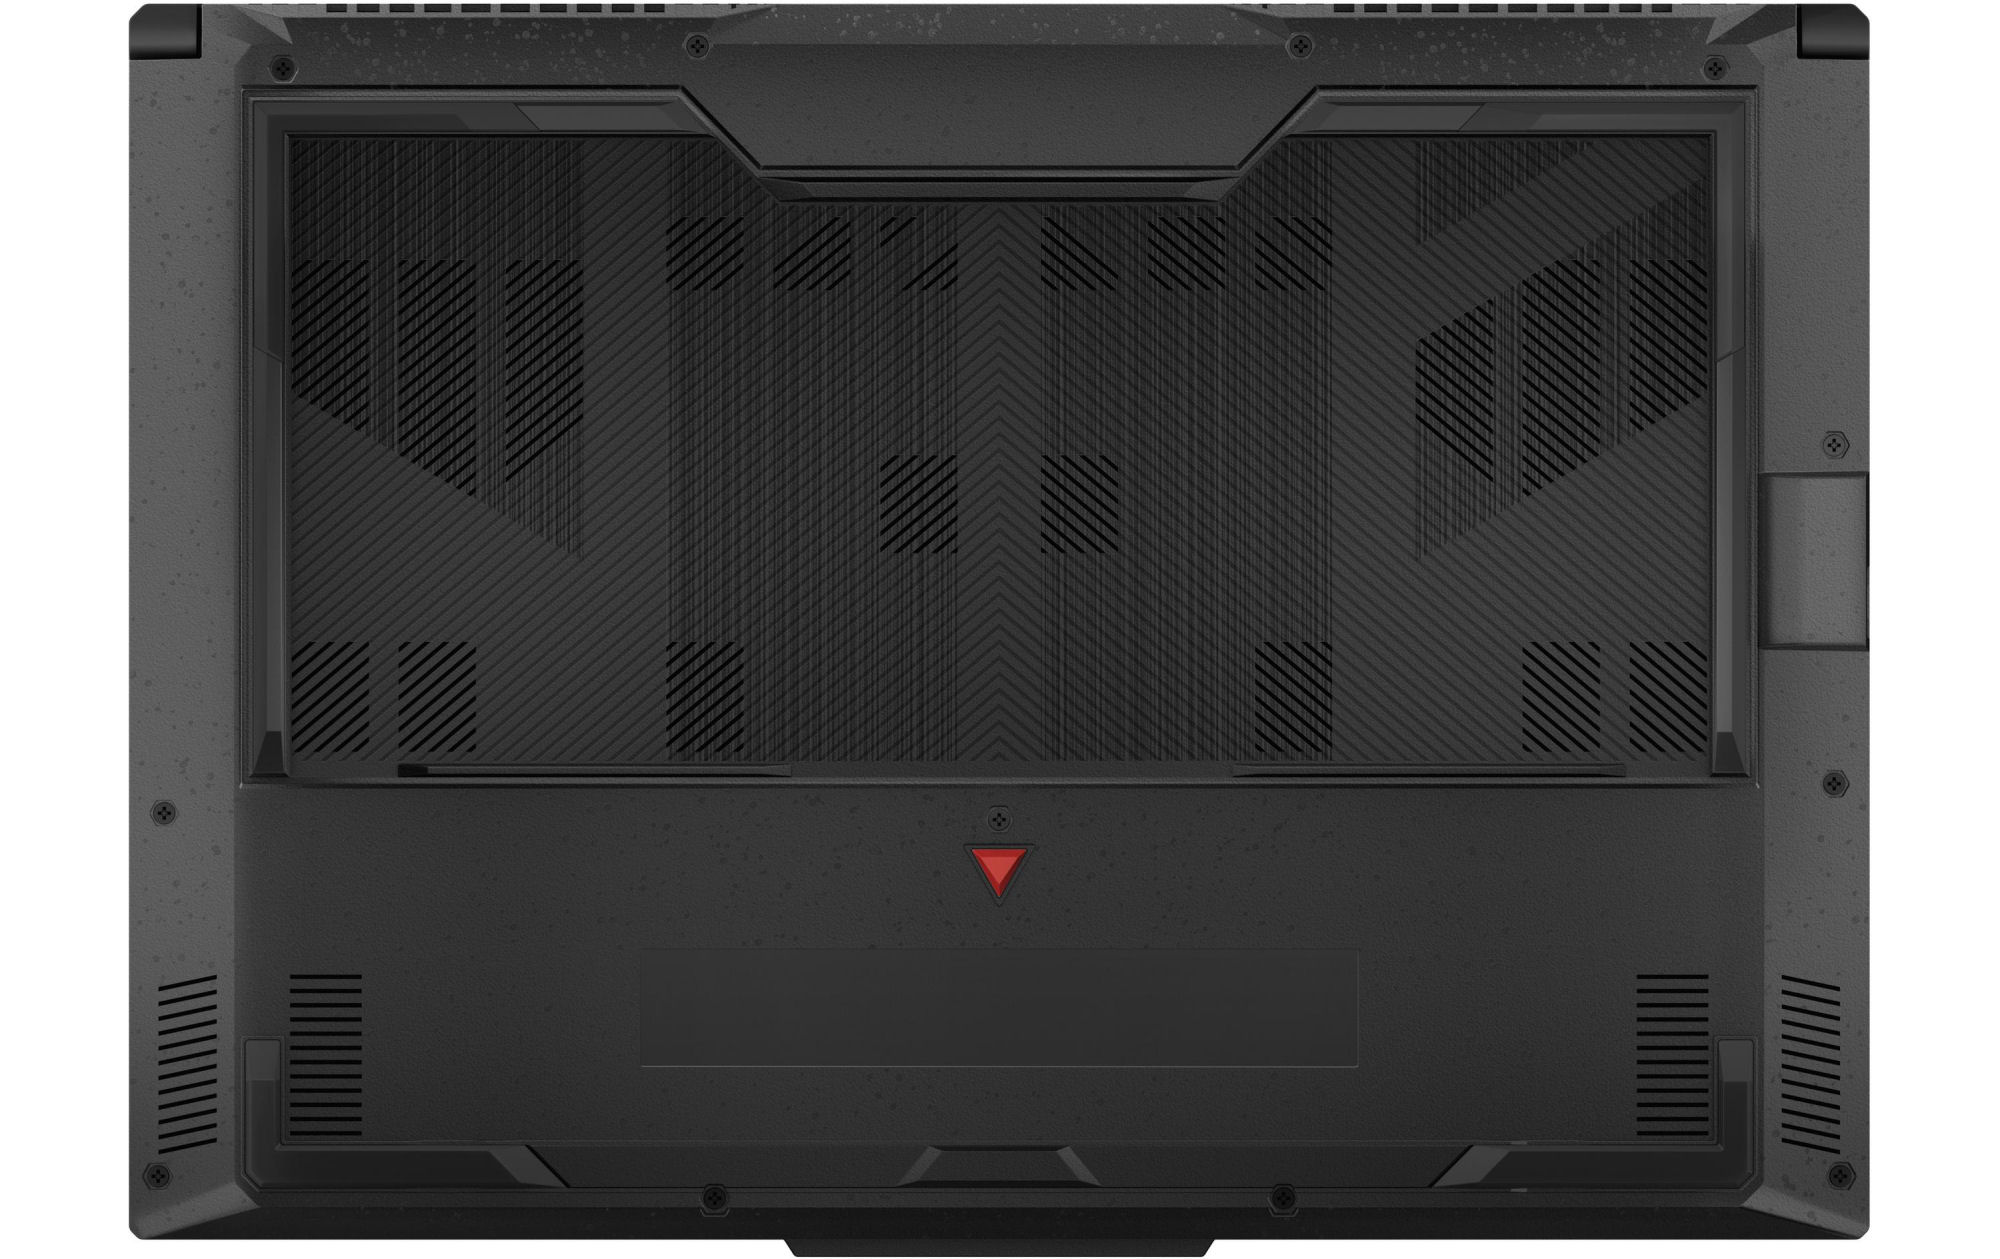
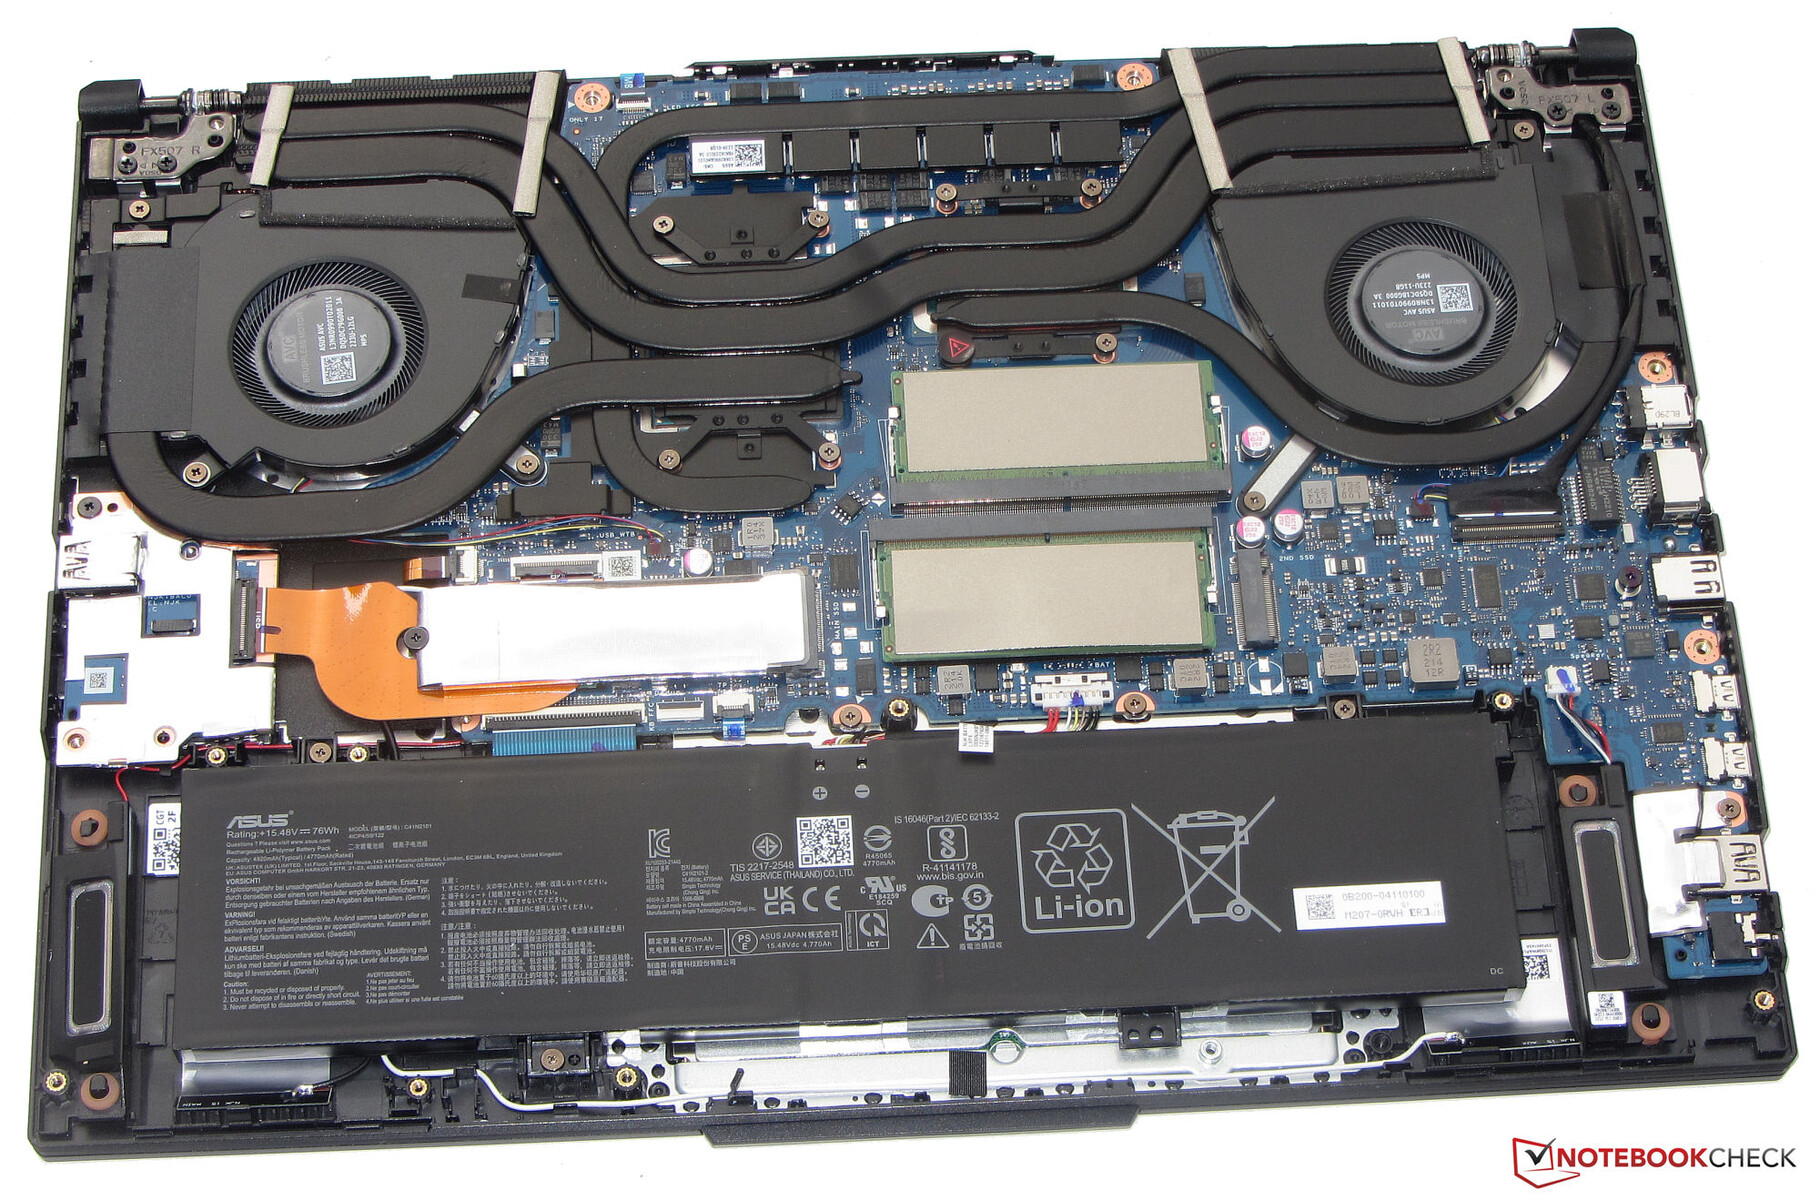
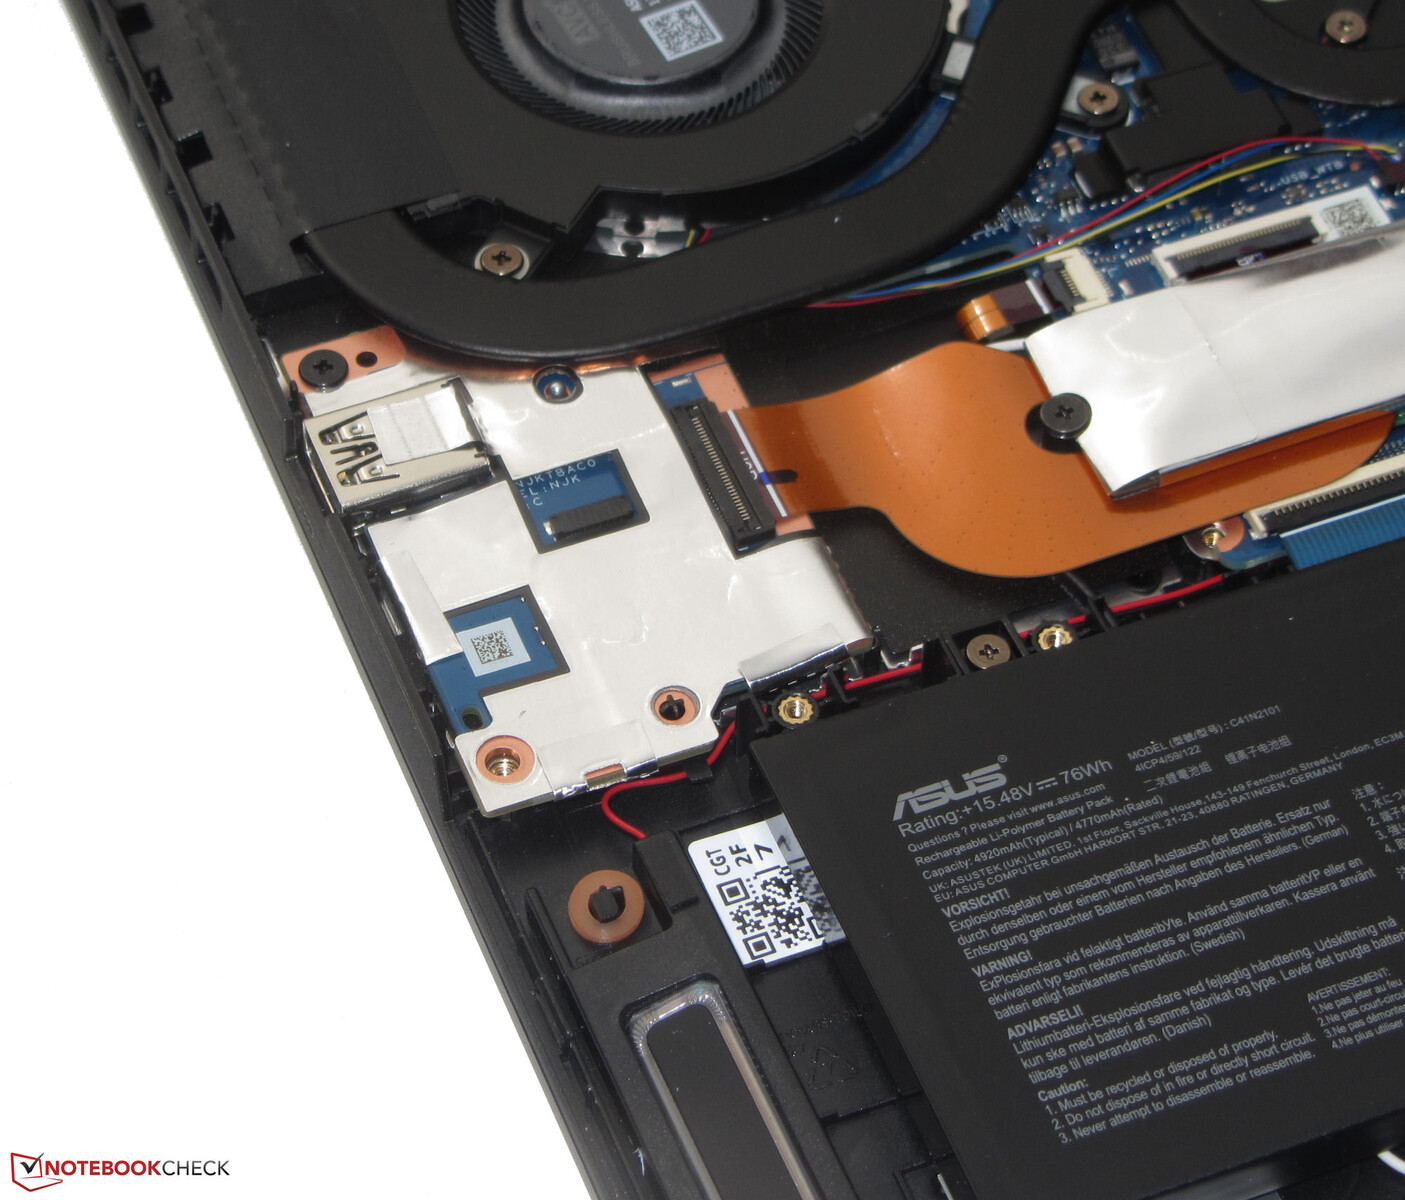
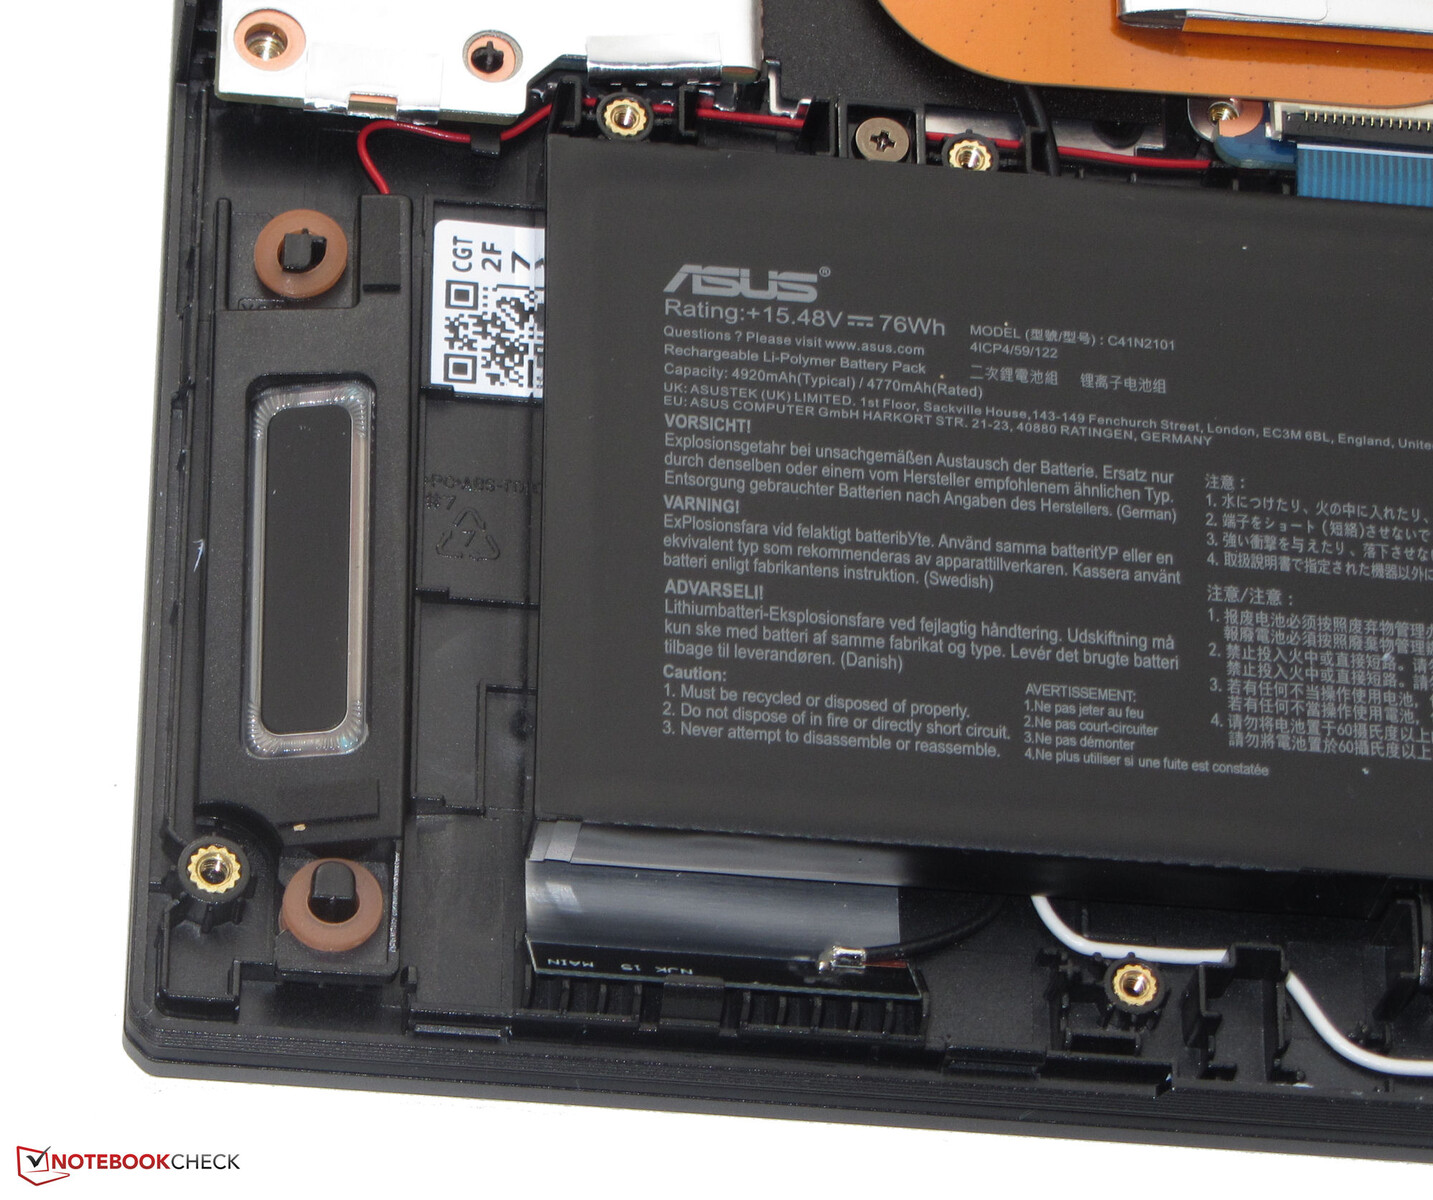
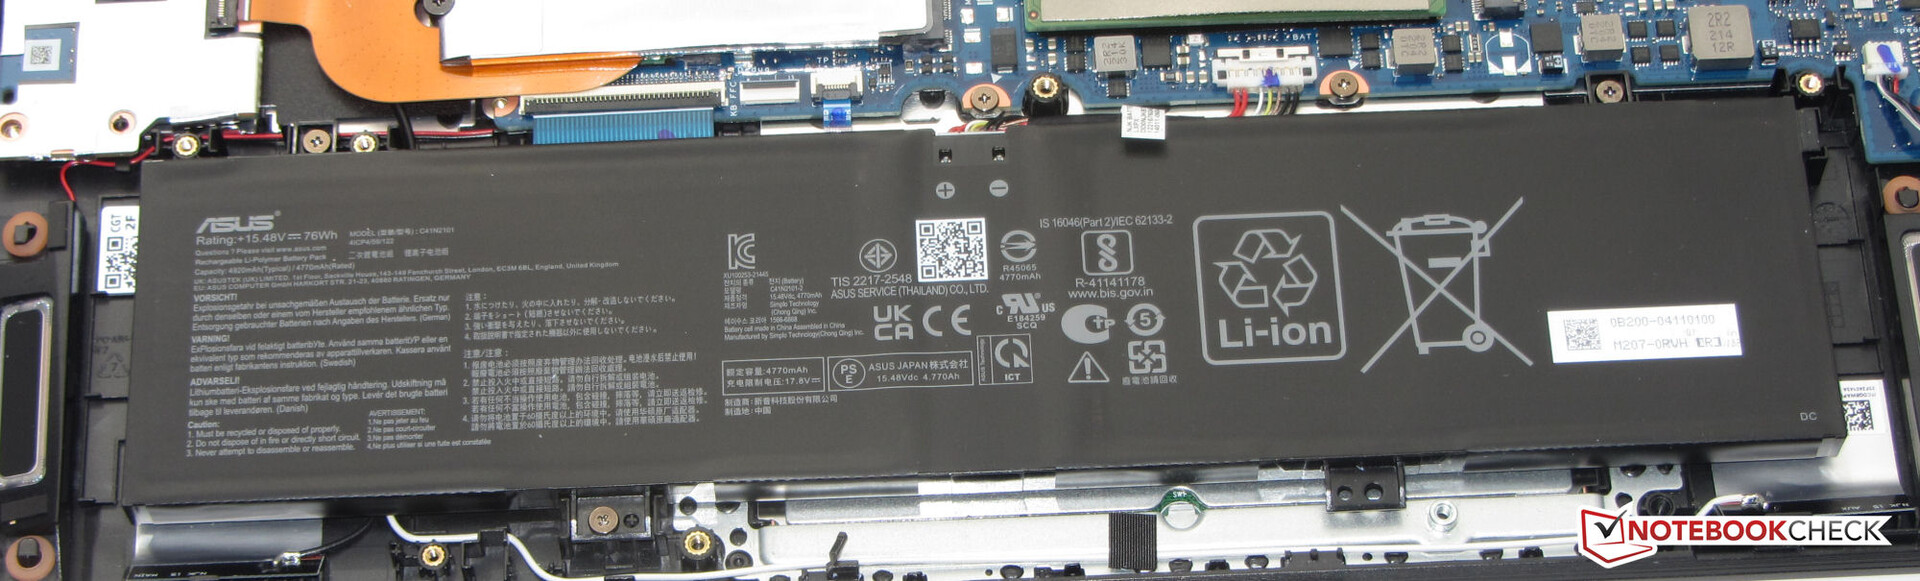
The F15 chassis doesn't feature any eye-catching colors, with the exception of the small red foot on the underside of the device. Otherwise, matte black (lid, top cover), and matte gray (bottom cover) dominate. For the case, Asus uses a material mix of plastic (base unit), and aluminum (back of the lid). The battery is firmly built into the device (screwed, not glued). You can access the internals after removing the bottom cover.
The laptop doesn't reveal any workmanship flaws. The gap dimensions are correct, and no material protrusions can be found. The base unit and the lid can be twisted a bit - but the whole still remains within limits. The hinges keep the lid firmly in position, while the maximum opening angle is about 130 degrees. Opening the lid with one hand is possible.


The MSI Delta 15, and the Asus laptop are the lightest devices in the comparison field. The Razer Blade 15 is ahead in terms of dimensions: It's the most compact laptop.
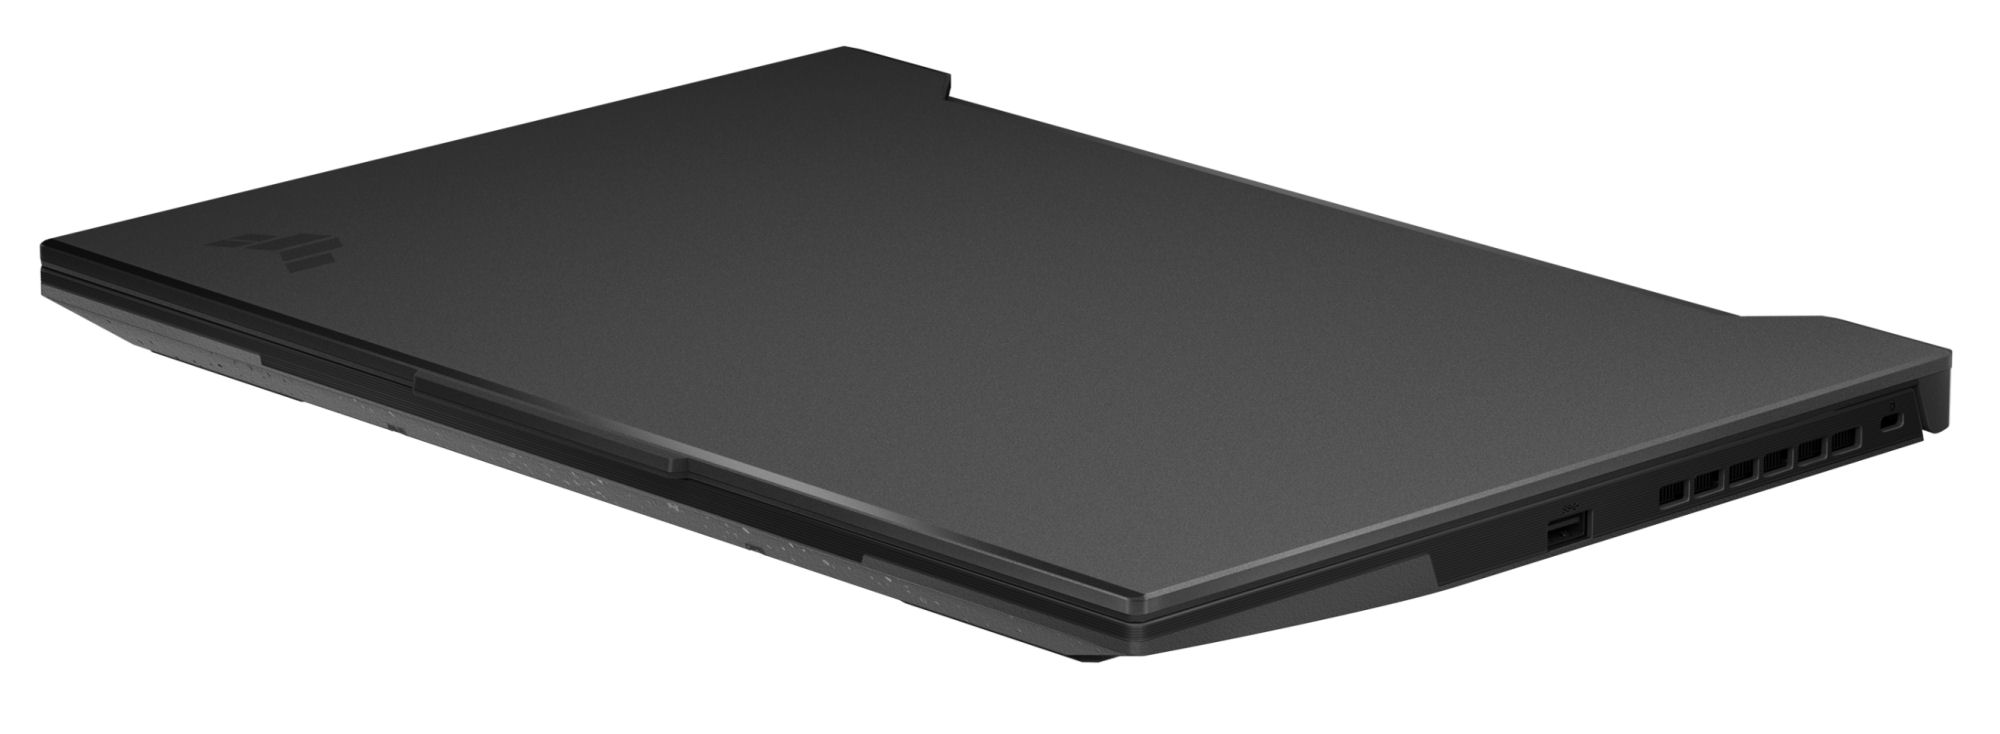
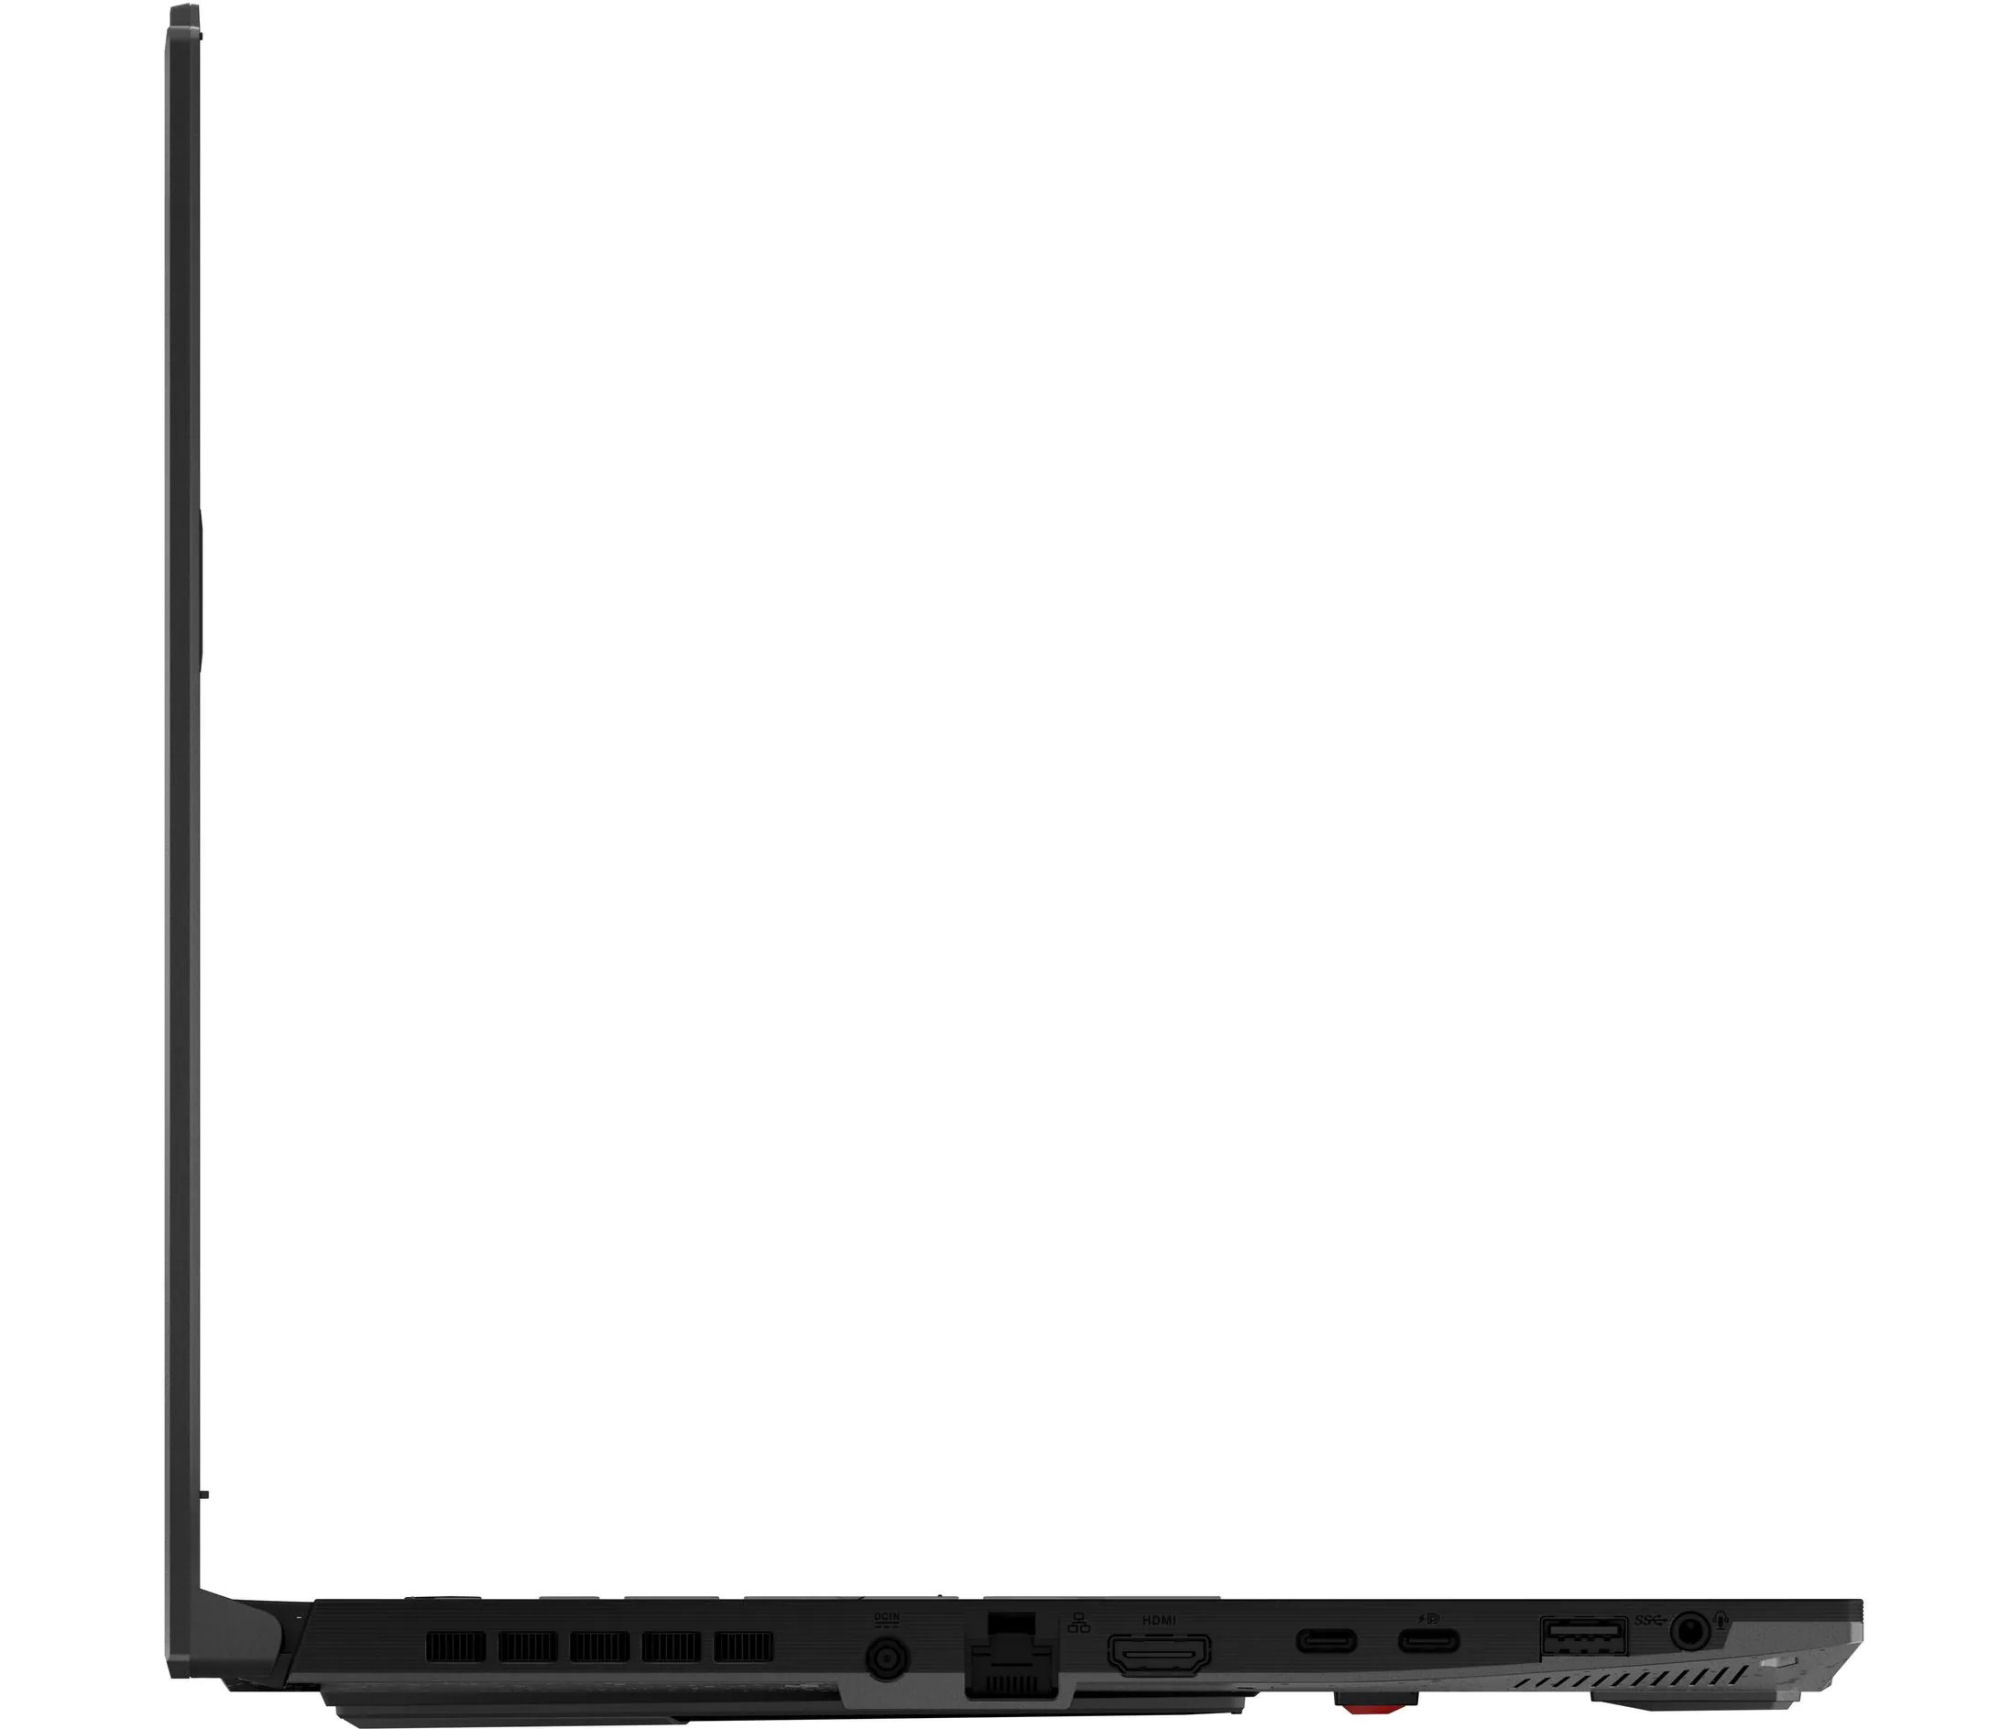
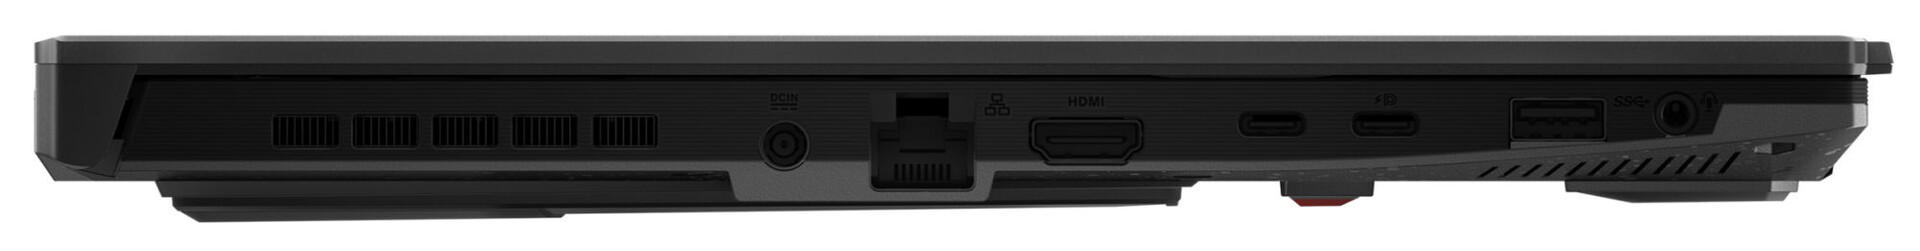
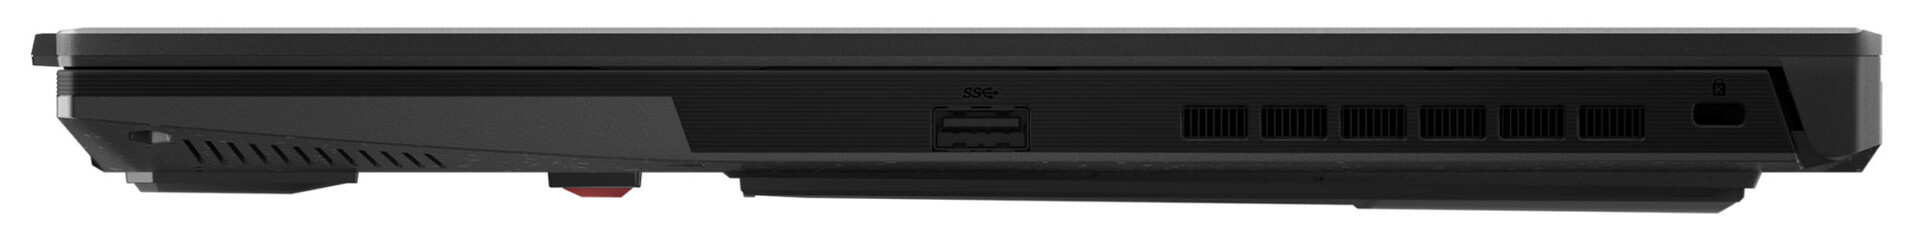
Connectivity - The FX517 comes with Thunderbolt 4
The TUF has two USB-A ports (USB 3.2 Gen 1), and two USB-C ports (1x Thunderbolt 4, 1x USB 3.2 Gen 2). The latter support DisplayPort via USB-C, while only the USB 3.2 Gen 2 port offers Power Delivery. The laptop has a total of three video outputs (2x DP, 1x HDMI). In addition, there's a combined audio jack, a Gigabit Ethernet port, and a slot for a cable lock. The Asus computer doesn't have a memory card reader.
The positioning of the ports isn't optimal. Asus crams almost all the ports into the front area of the case's left side. One or two ports should have been placed on the right side of the case here.
Communication
The Wi-Fi transfer rates determined under optimal conditions (no other Wi-Fi devices nearby, short distance between the laptop and the server PC) are excellent and correspond to the Wi-Fi chip's capabilities (Intel AX201; 802.11ax). Wired network connections are handled by a Gigabit Ethernet chip (Intel I219-LM).
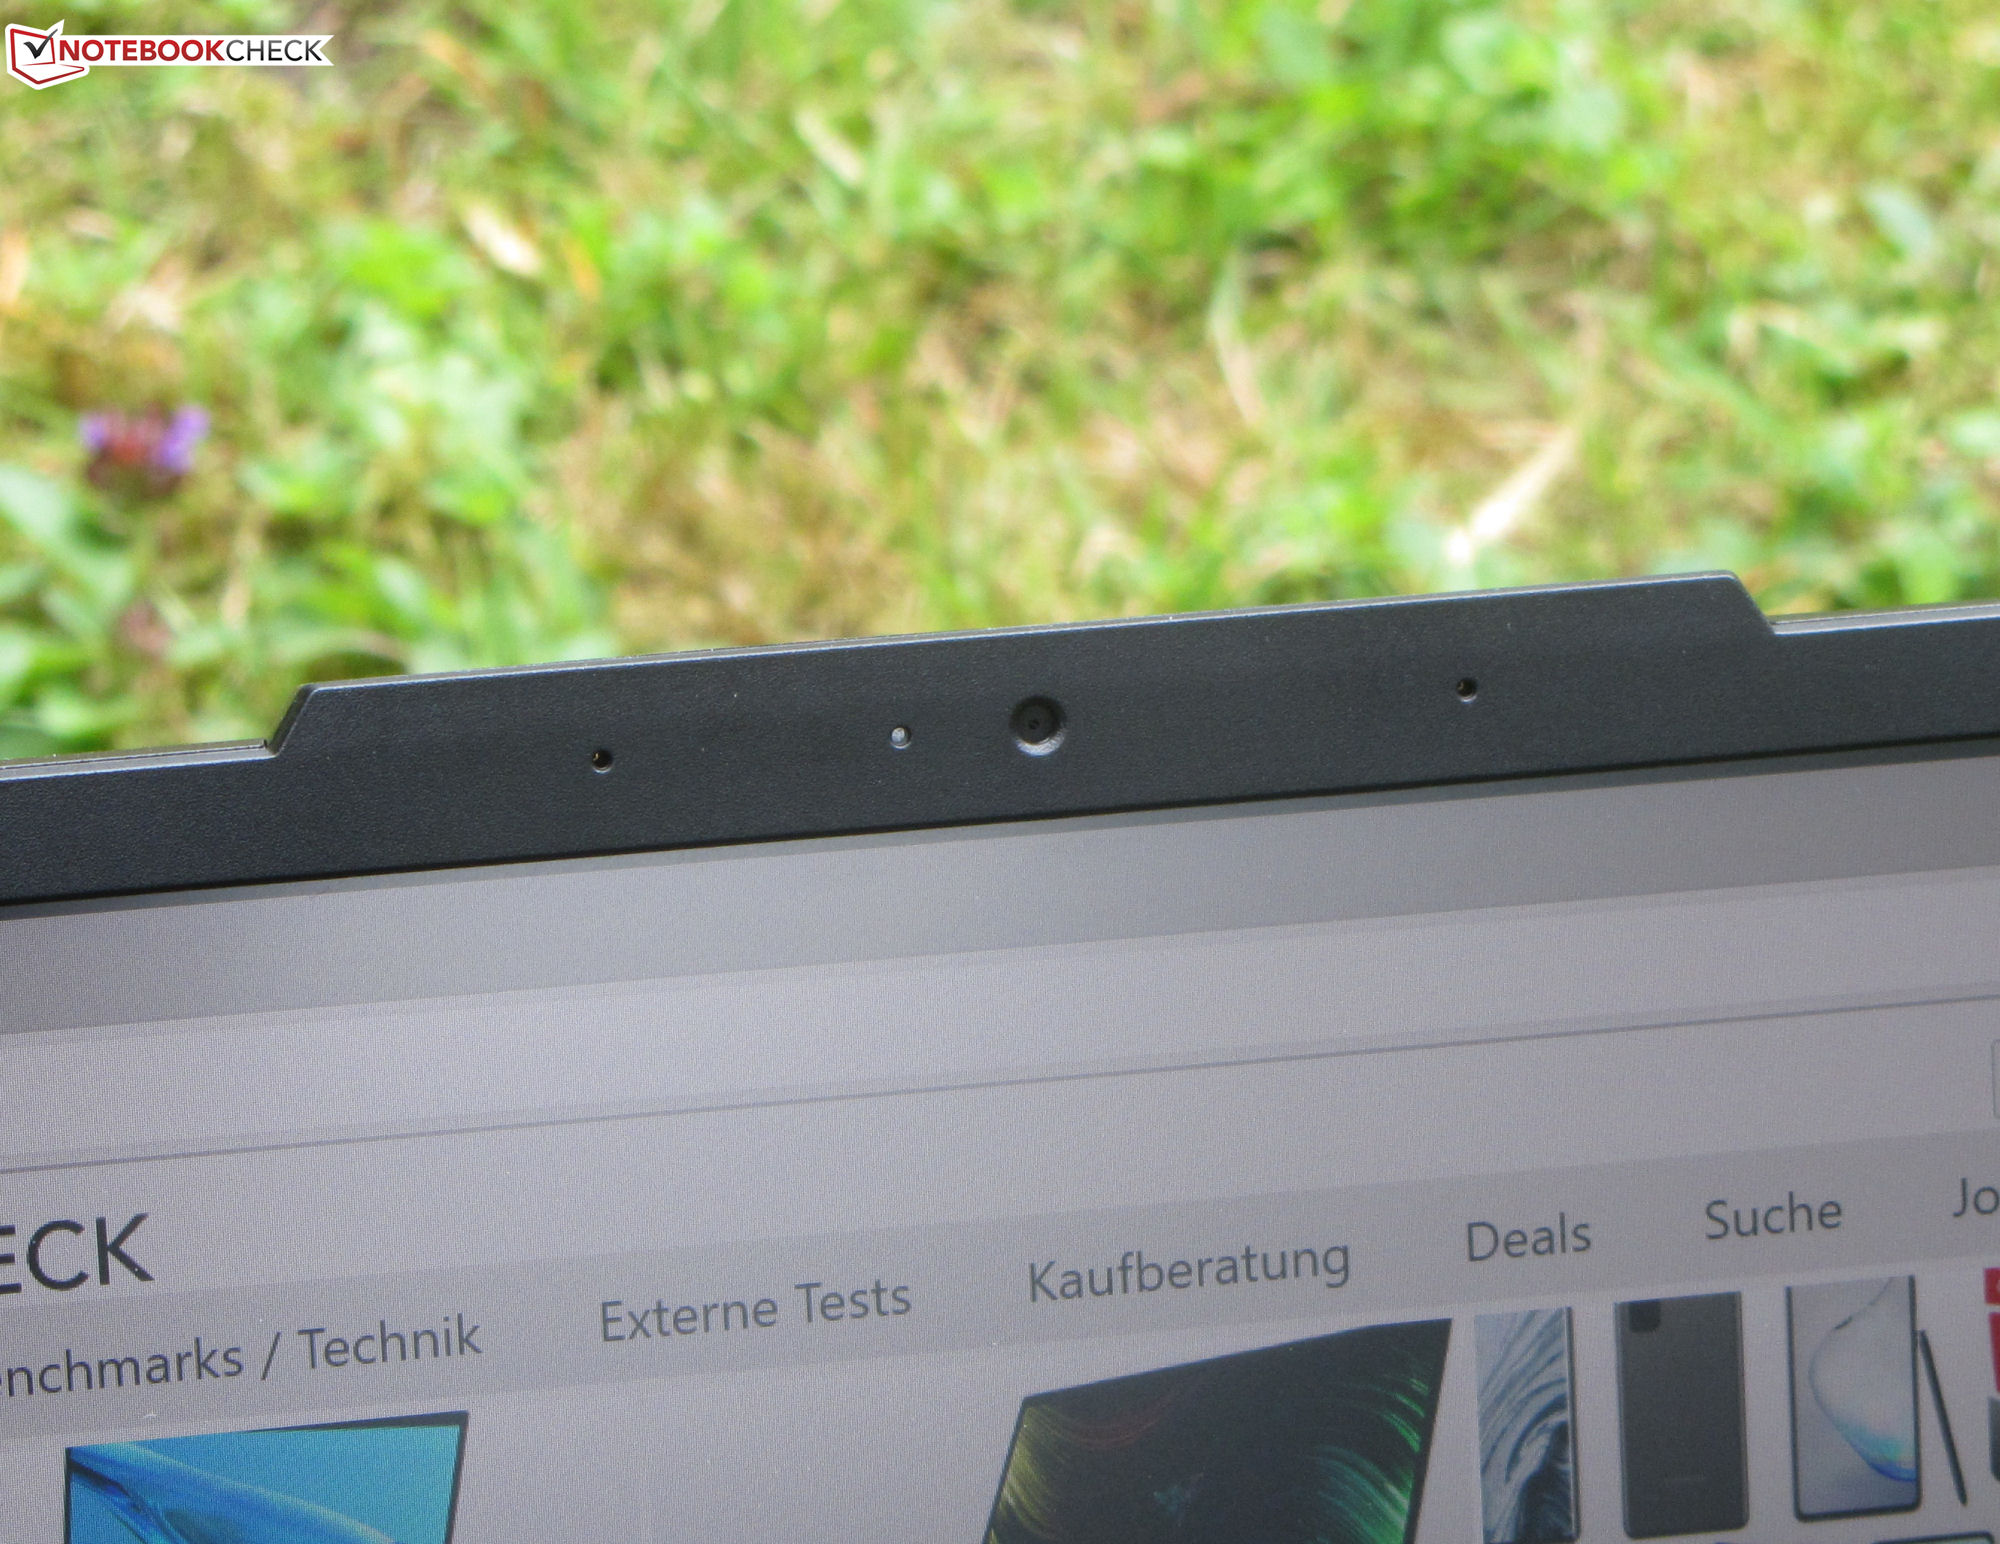
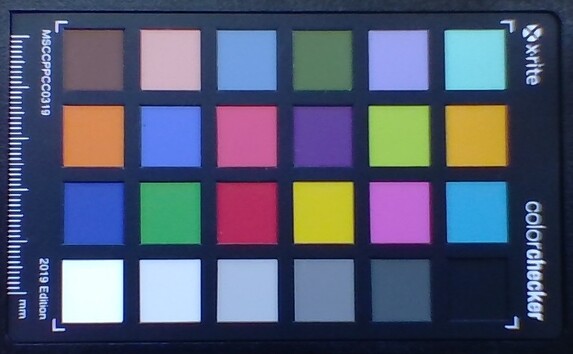
Webcam
The webcam (0.9 MP) generates images in a maximum resolution of 1,280x720 pixels. Color accuracy isn't the best: The colors deviate from the target. The camera doesn't offer a mechanical shutter.


Accessories
Aside from the usual documents (quick-start guide, warranty information), no other accessories are included with the laptop.
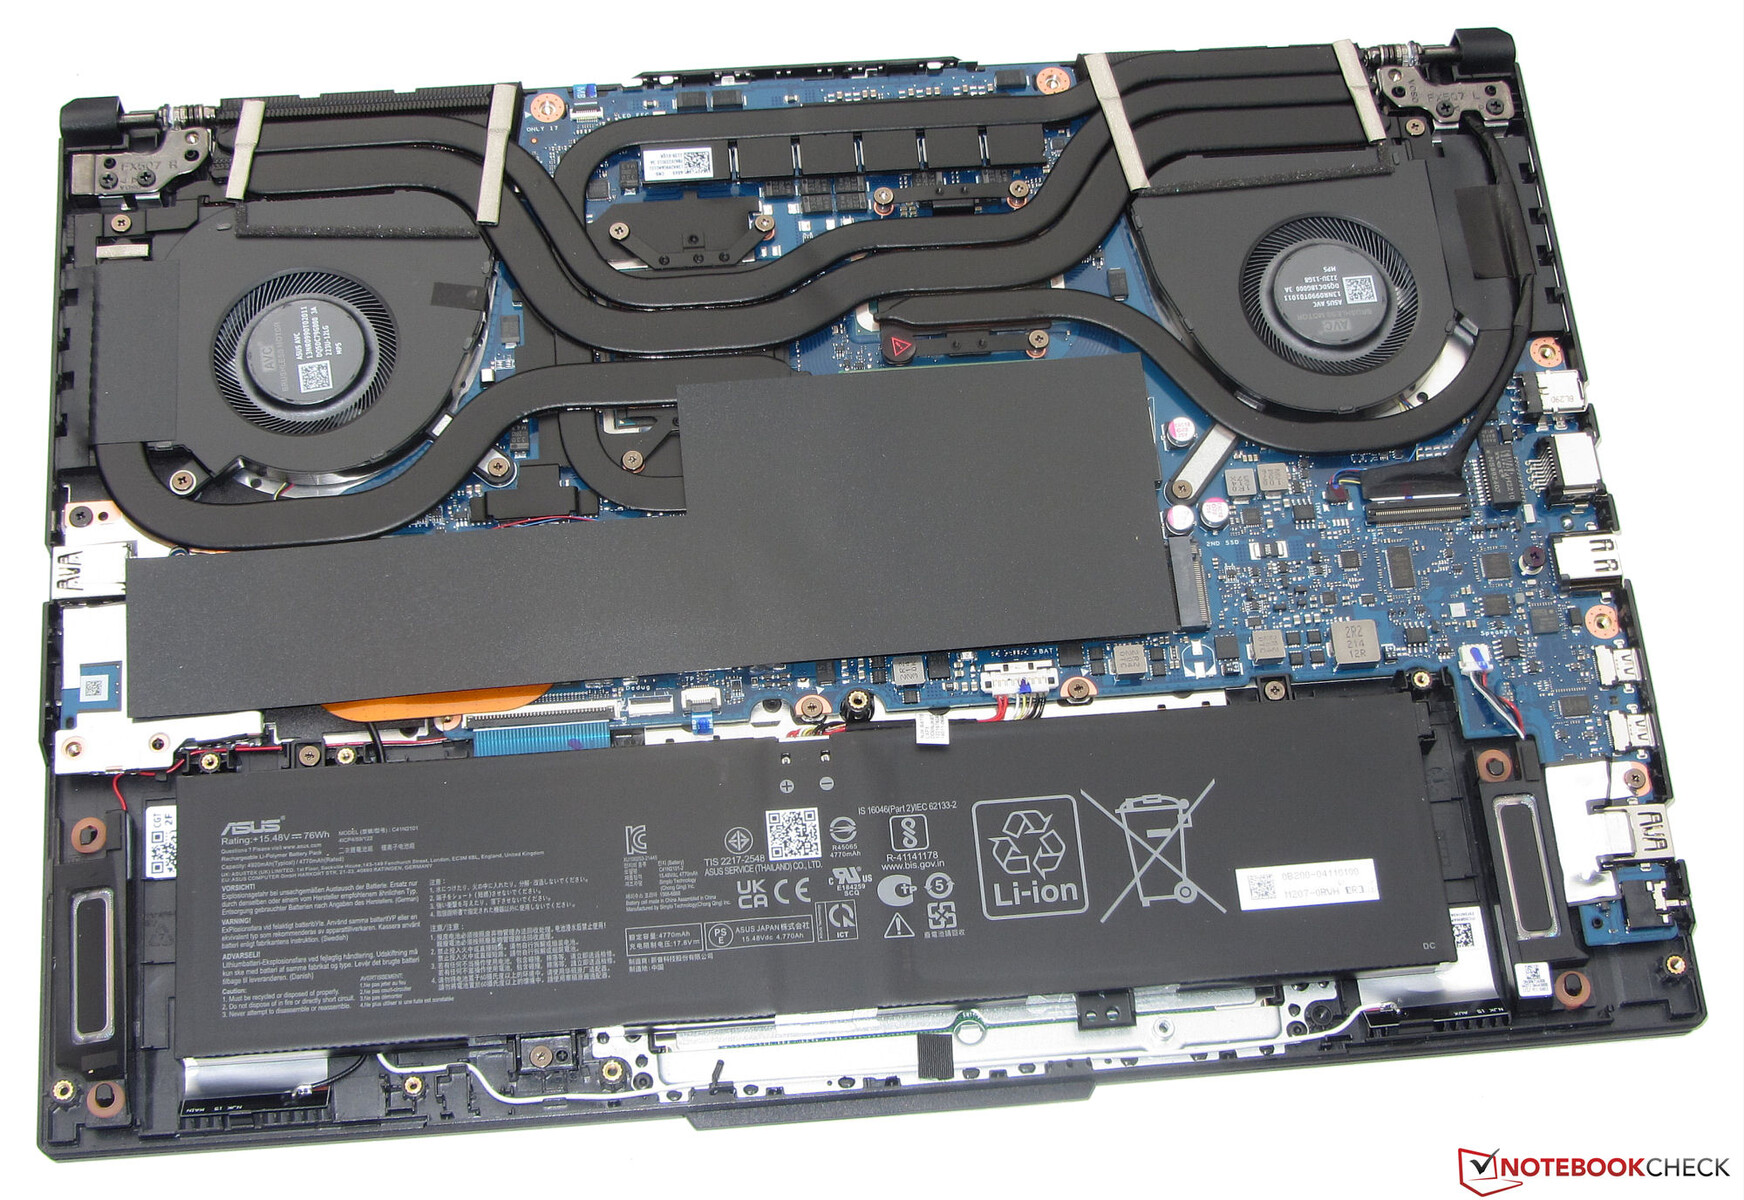
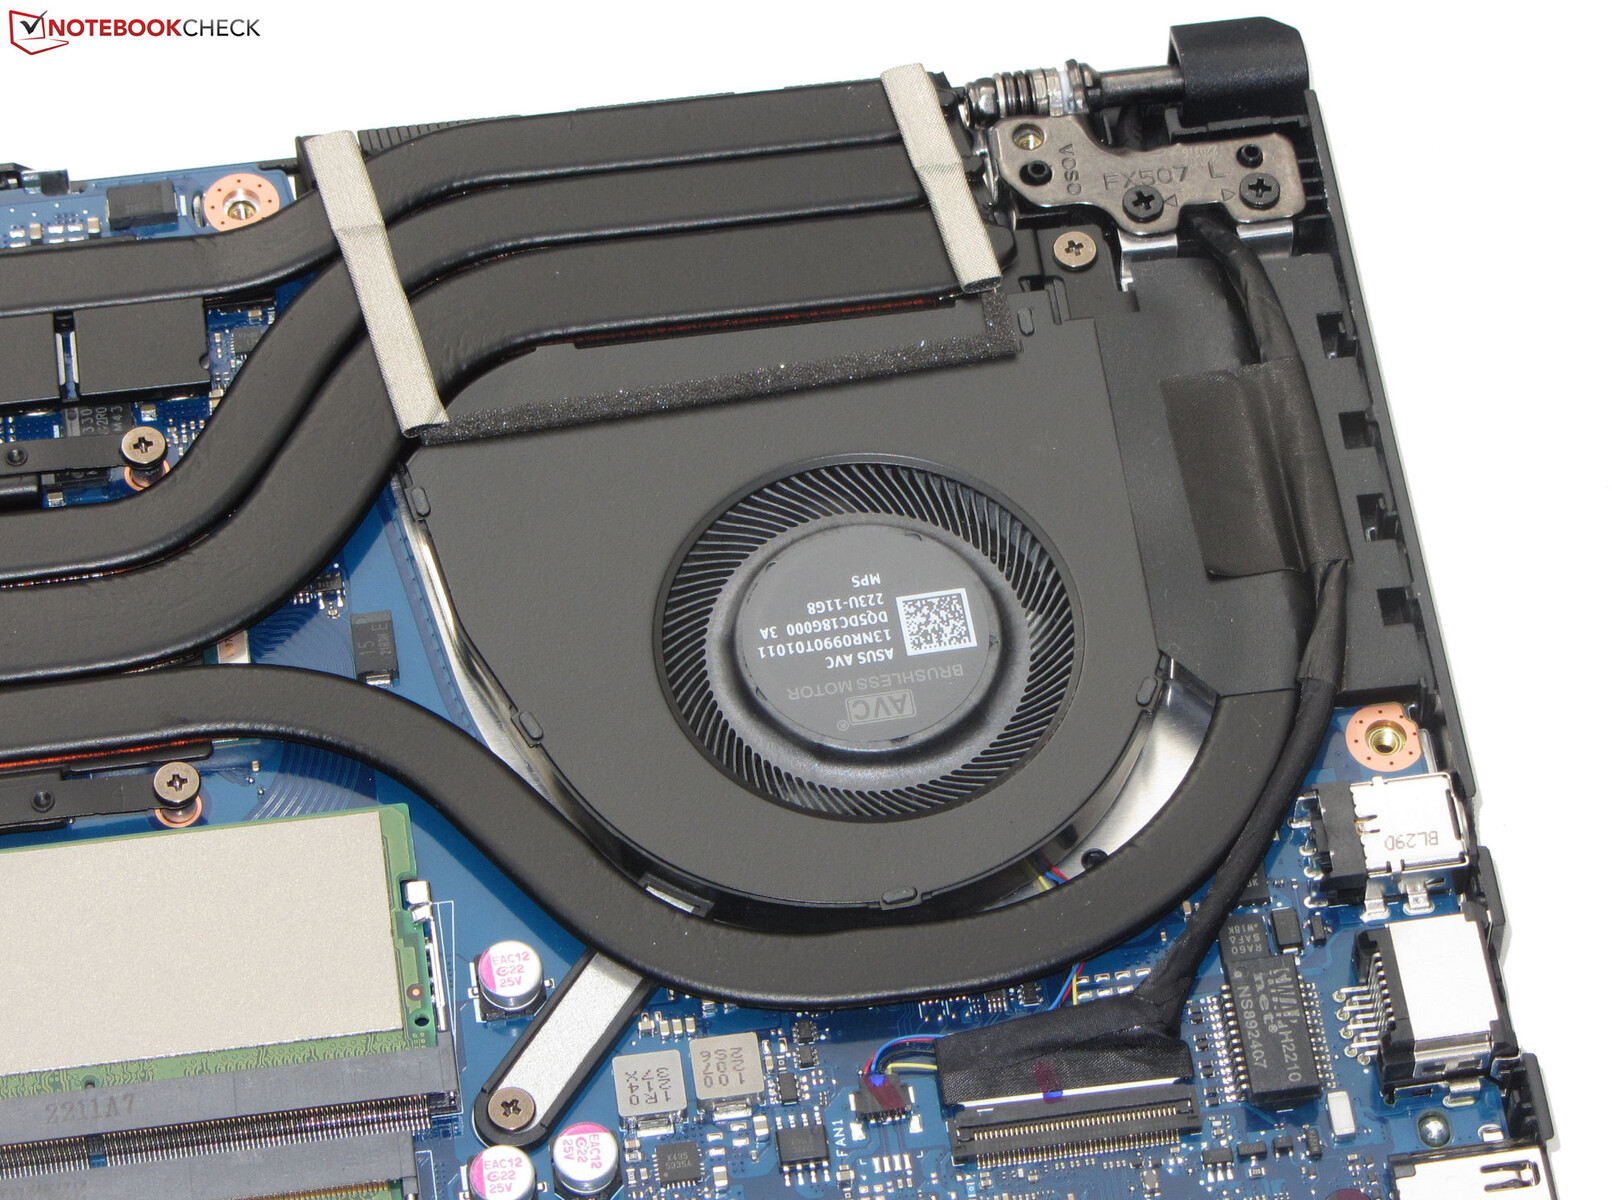
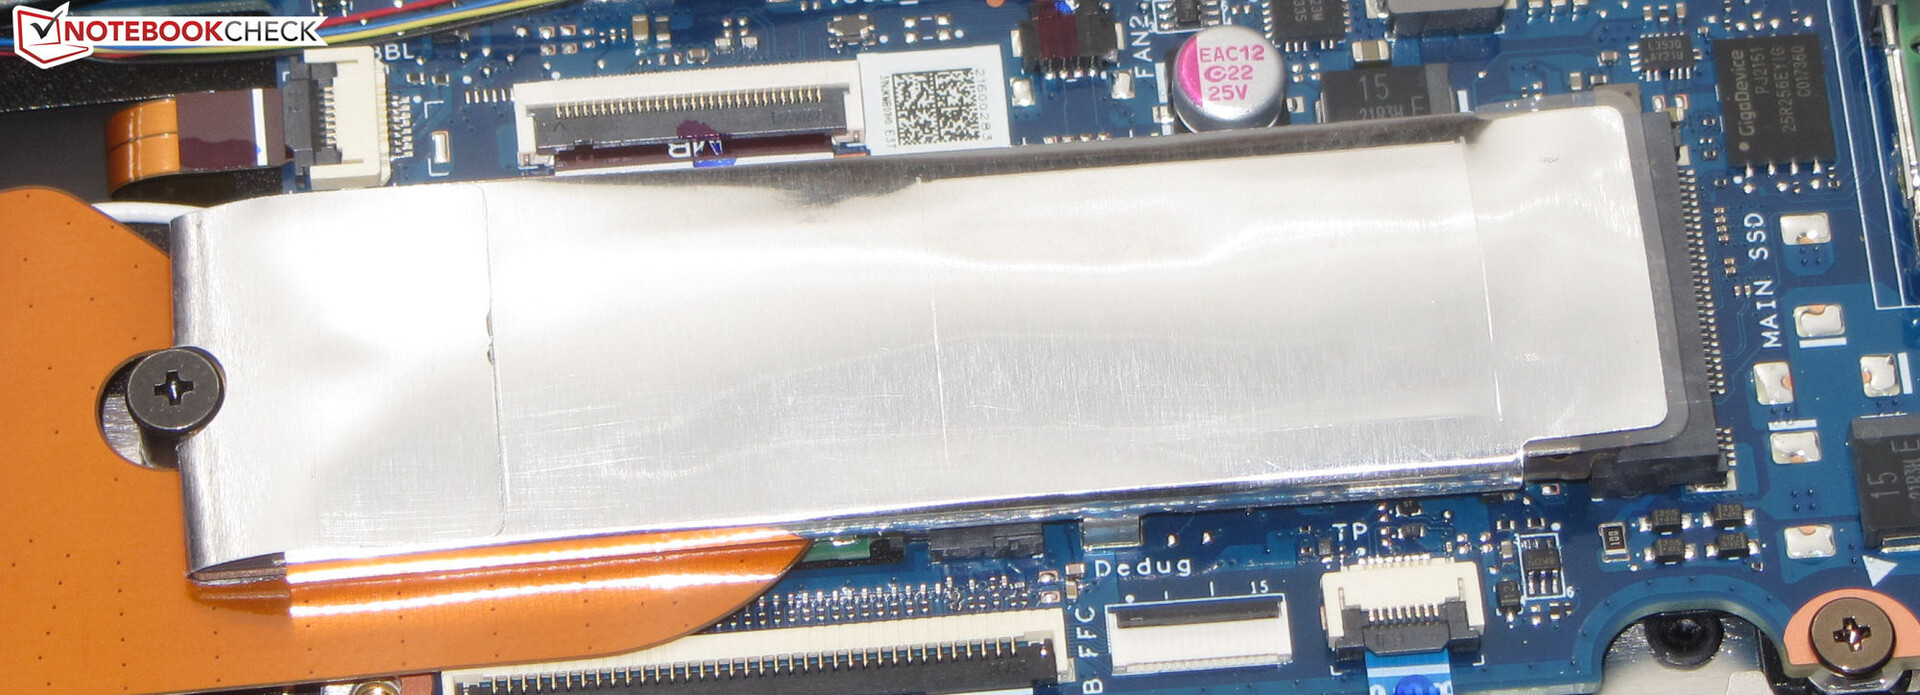
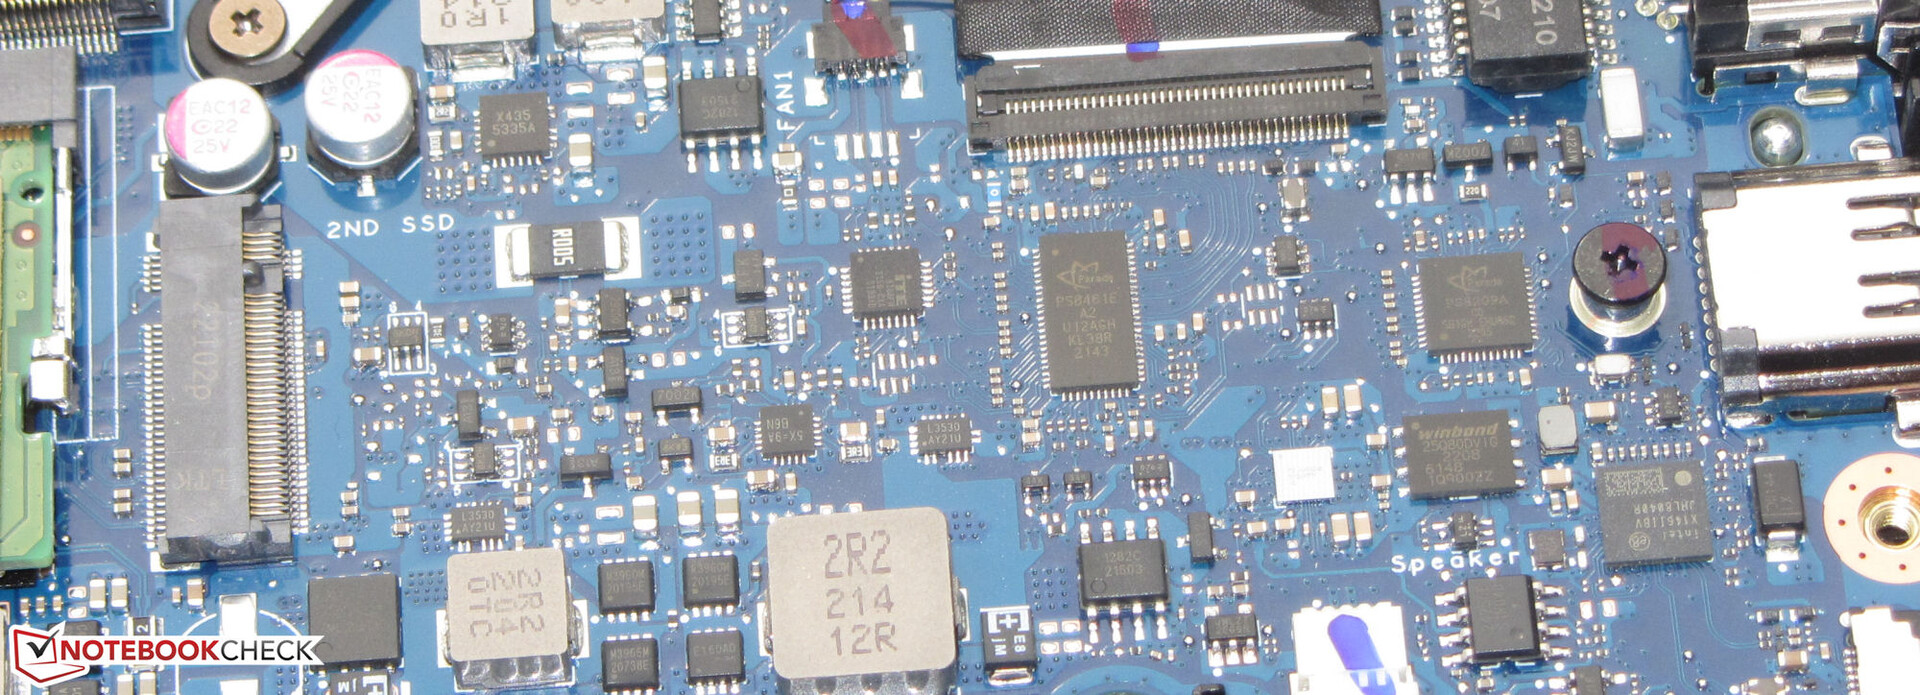
Maintenance
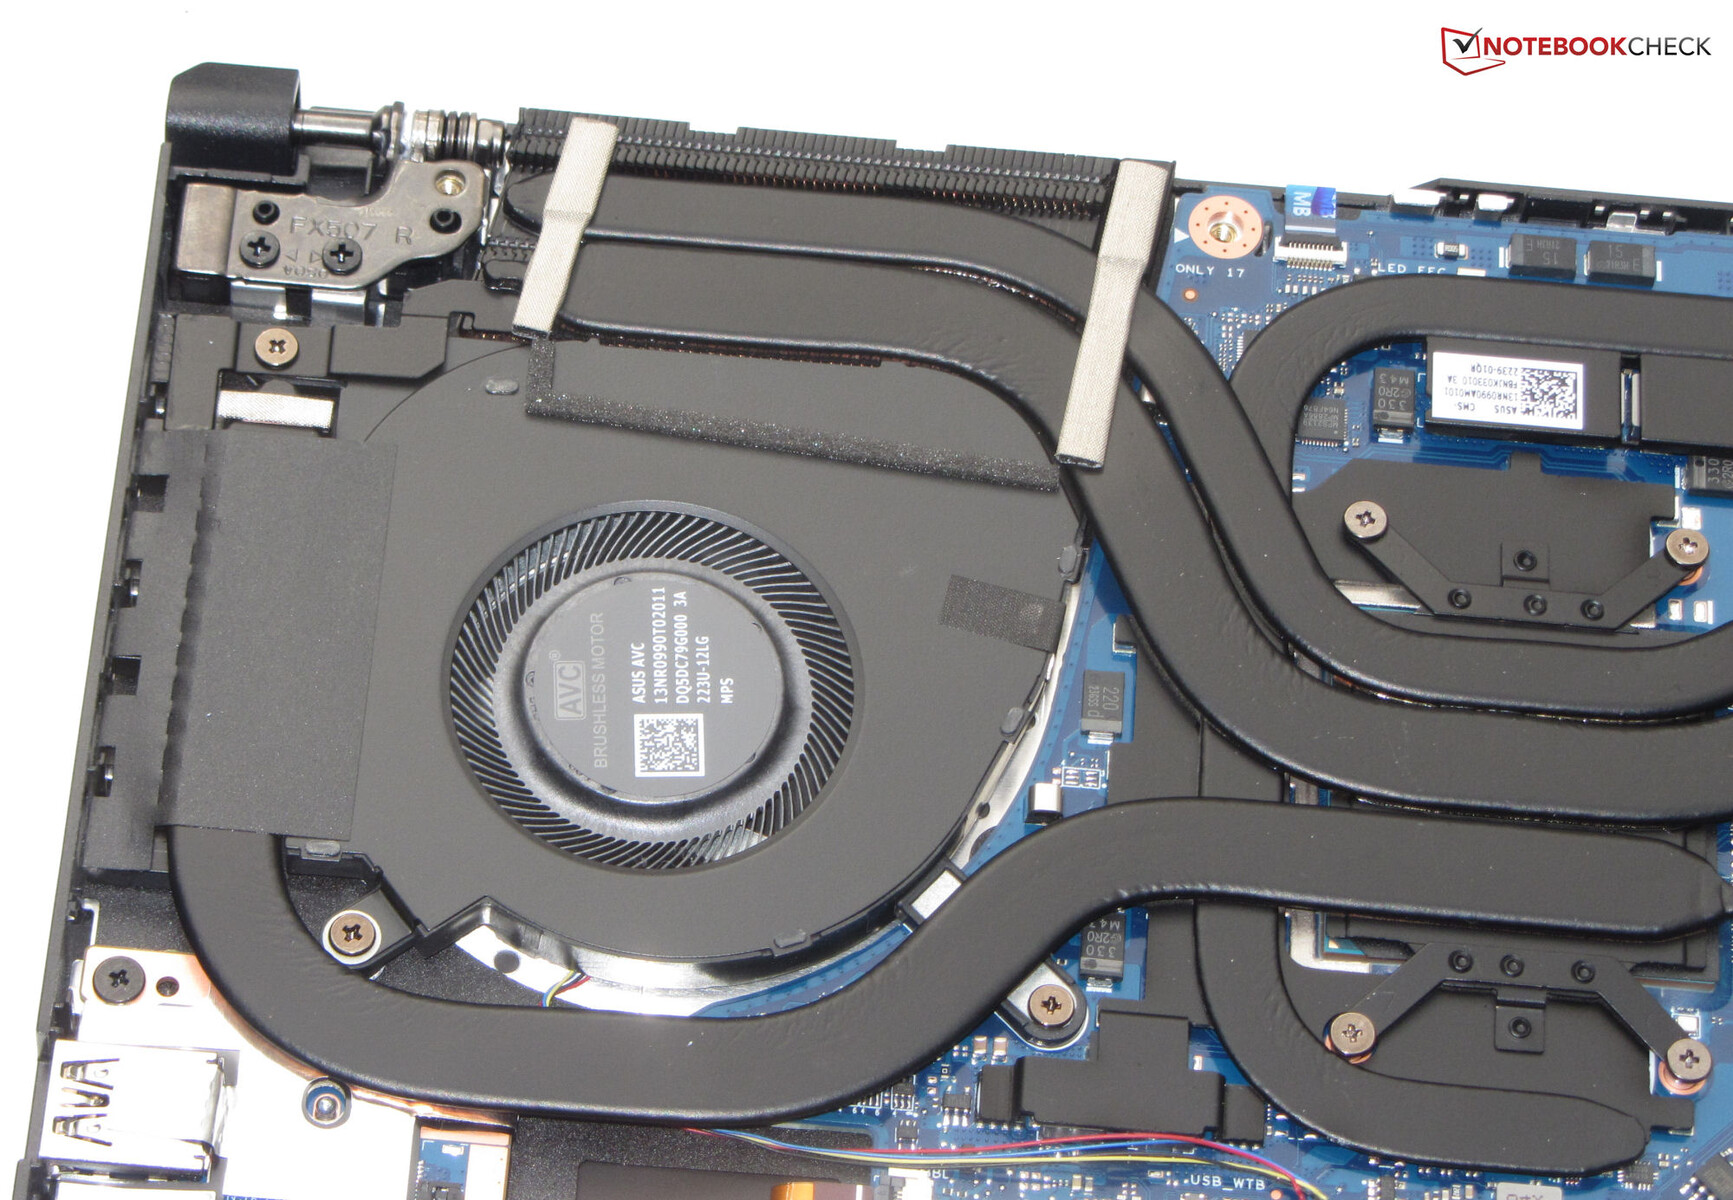
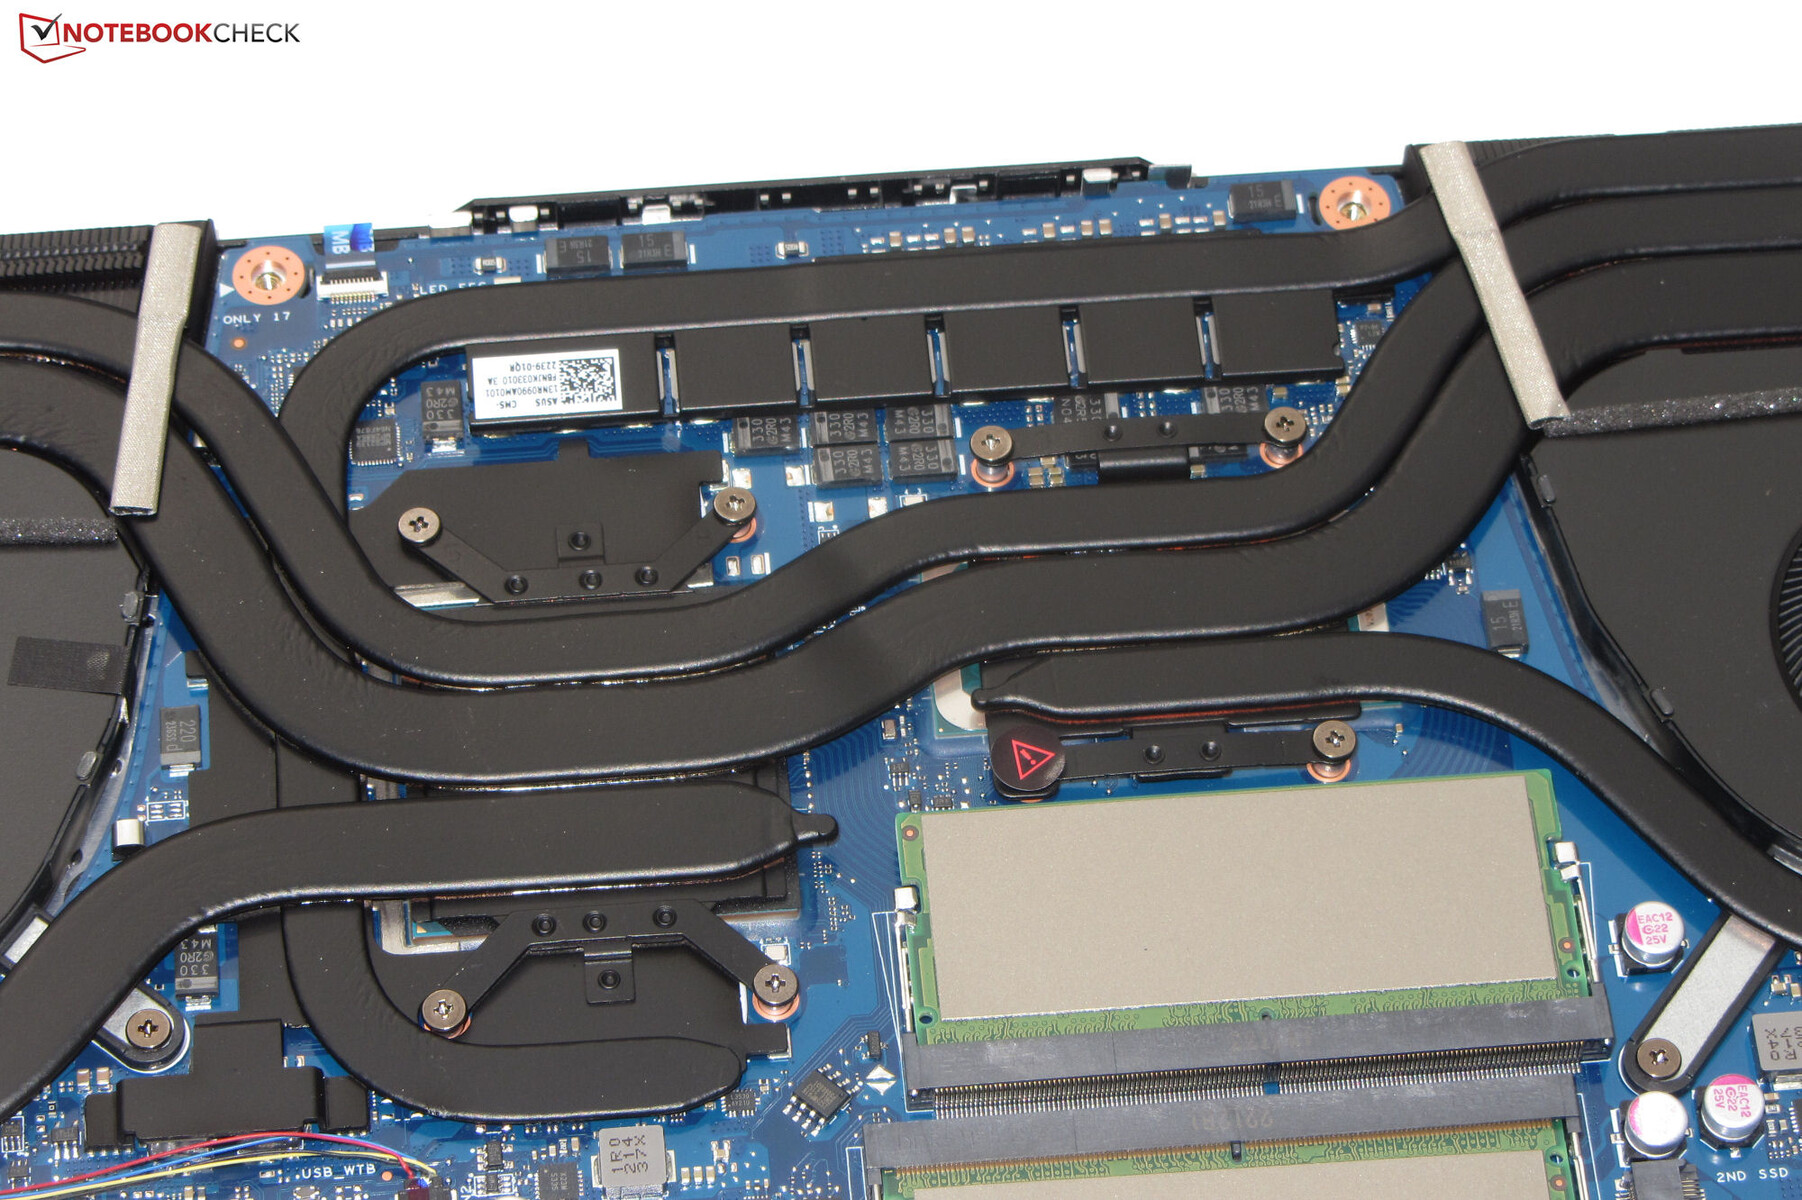
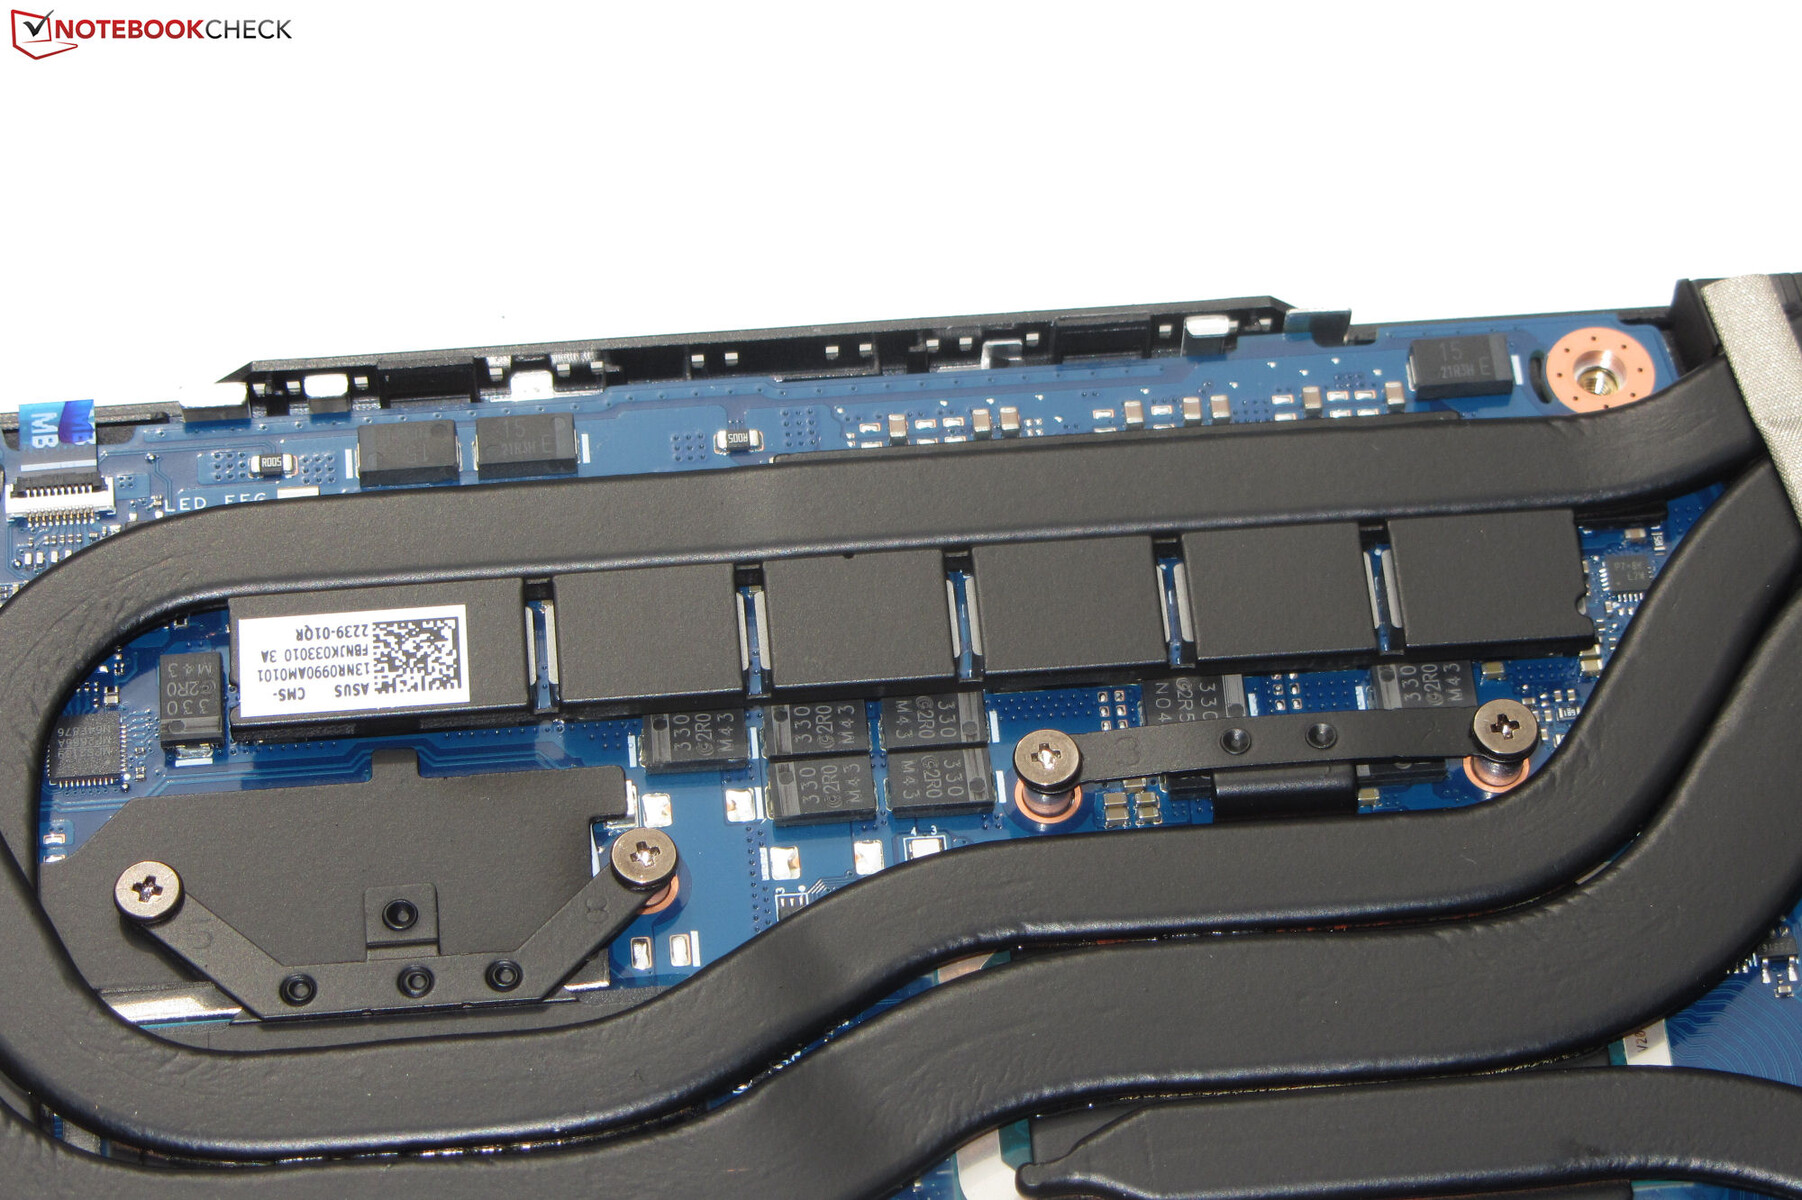
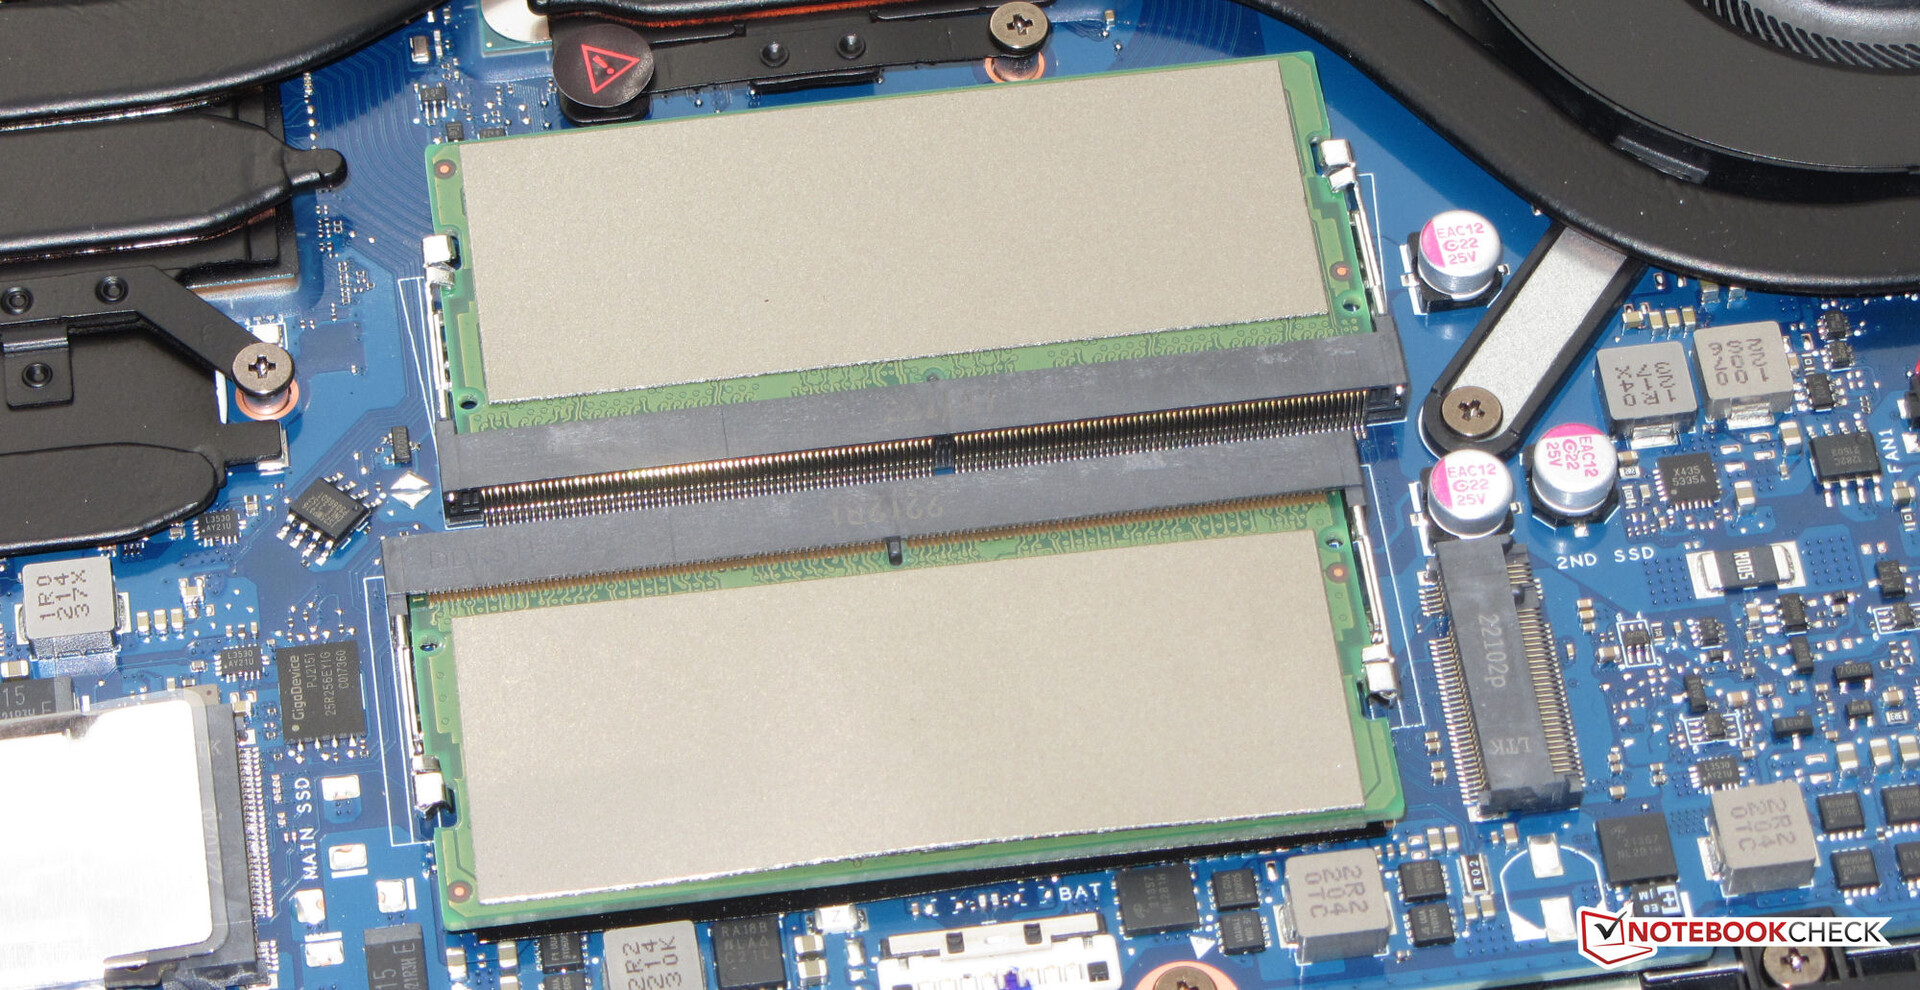
The interior of the laptop is accessible after removing the bottom cover. Once all the screws on the device's bottom side have been loosened, the bottom cover's retaining brackets can be removed with the help of a flat spatula. But be careful: The brackets sit quite tightly. You can then access the SSD (PCIe 3, M.2 2280), the second SSD slot (M.2 2280), the Wi-Fi module, the battery, the RAM, the speakers, and the fans.
Warranty
Asus provides the F15 with a two-year warranty. A three-year extension costs about 129 Euros (~$132).
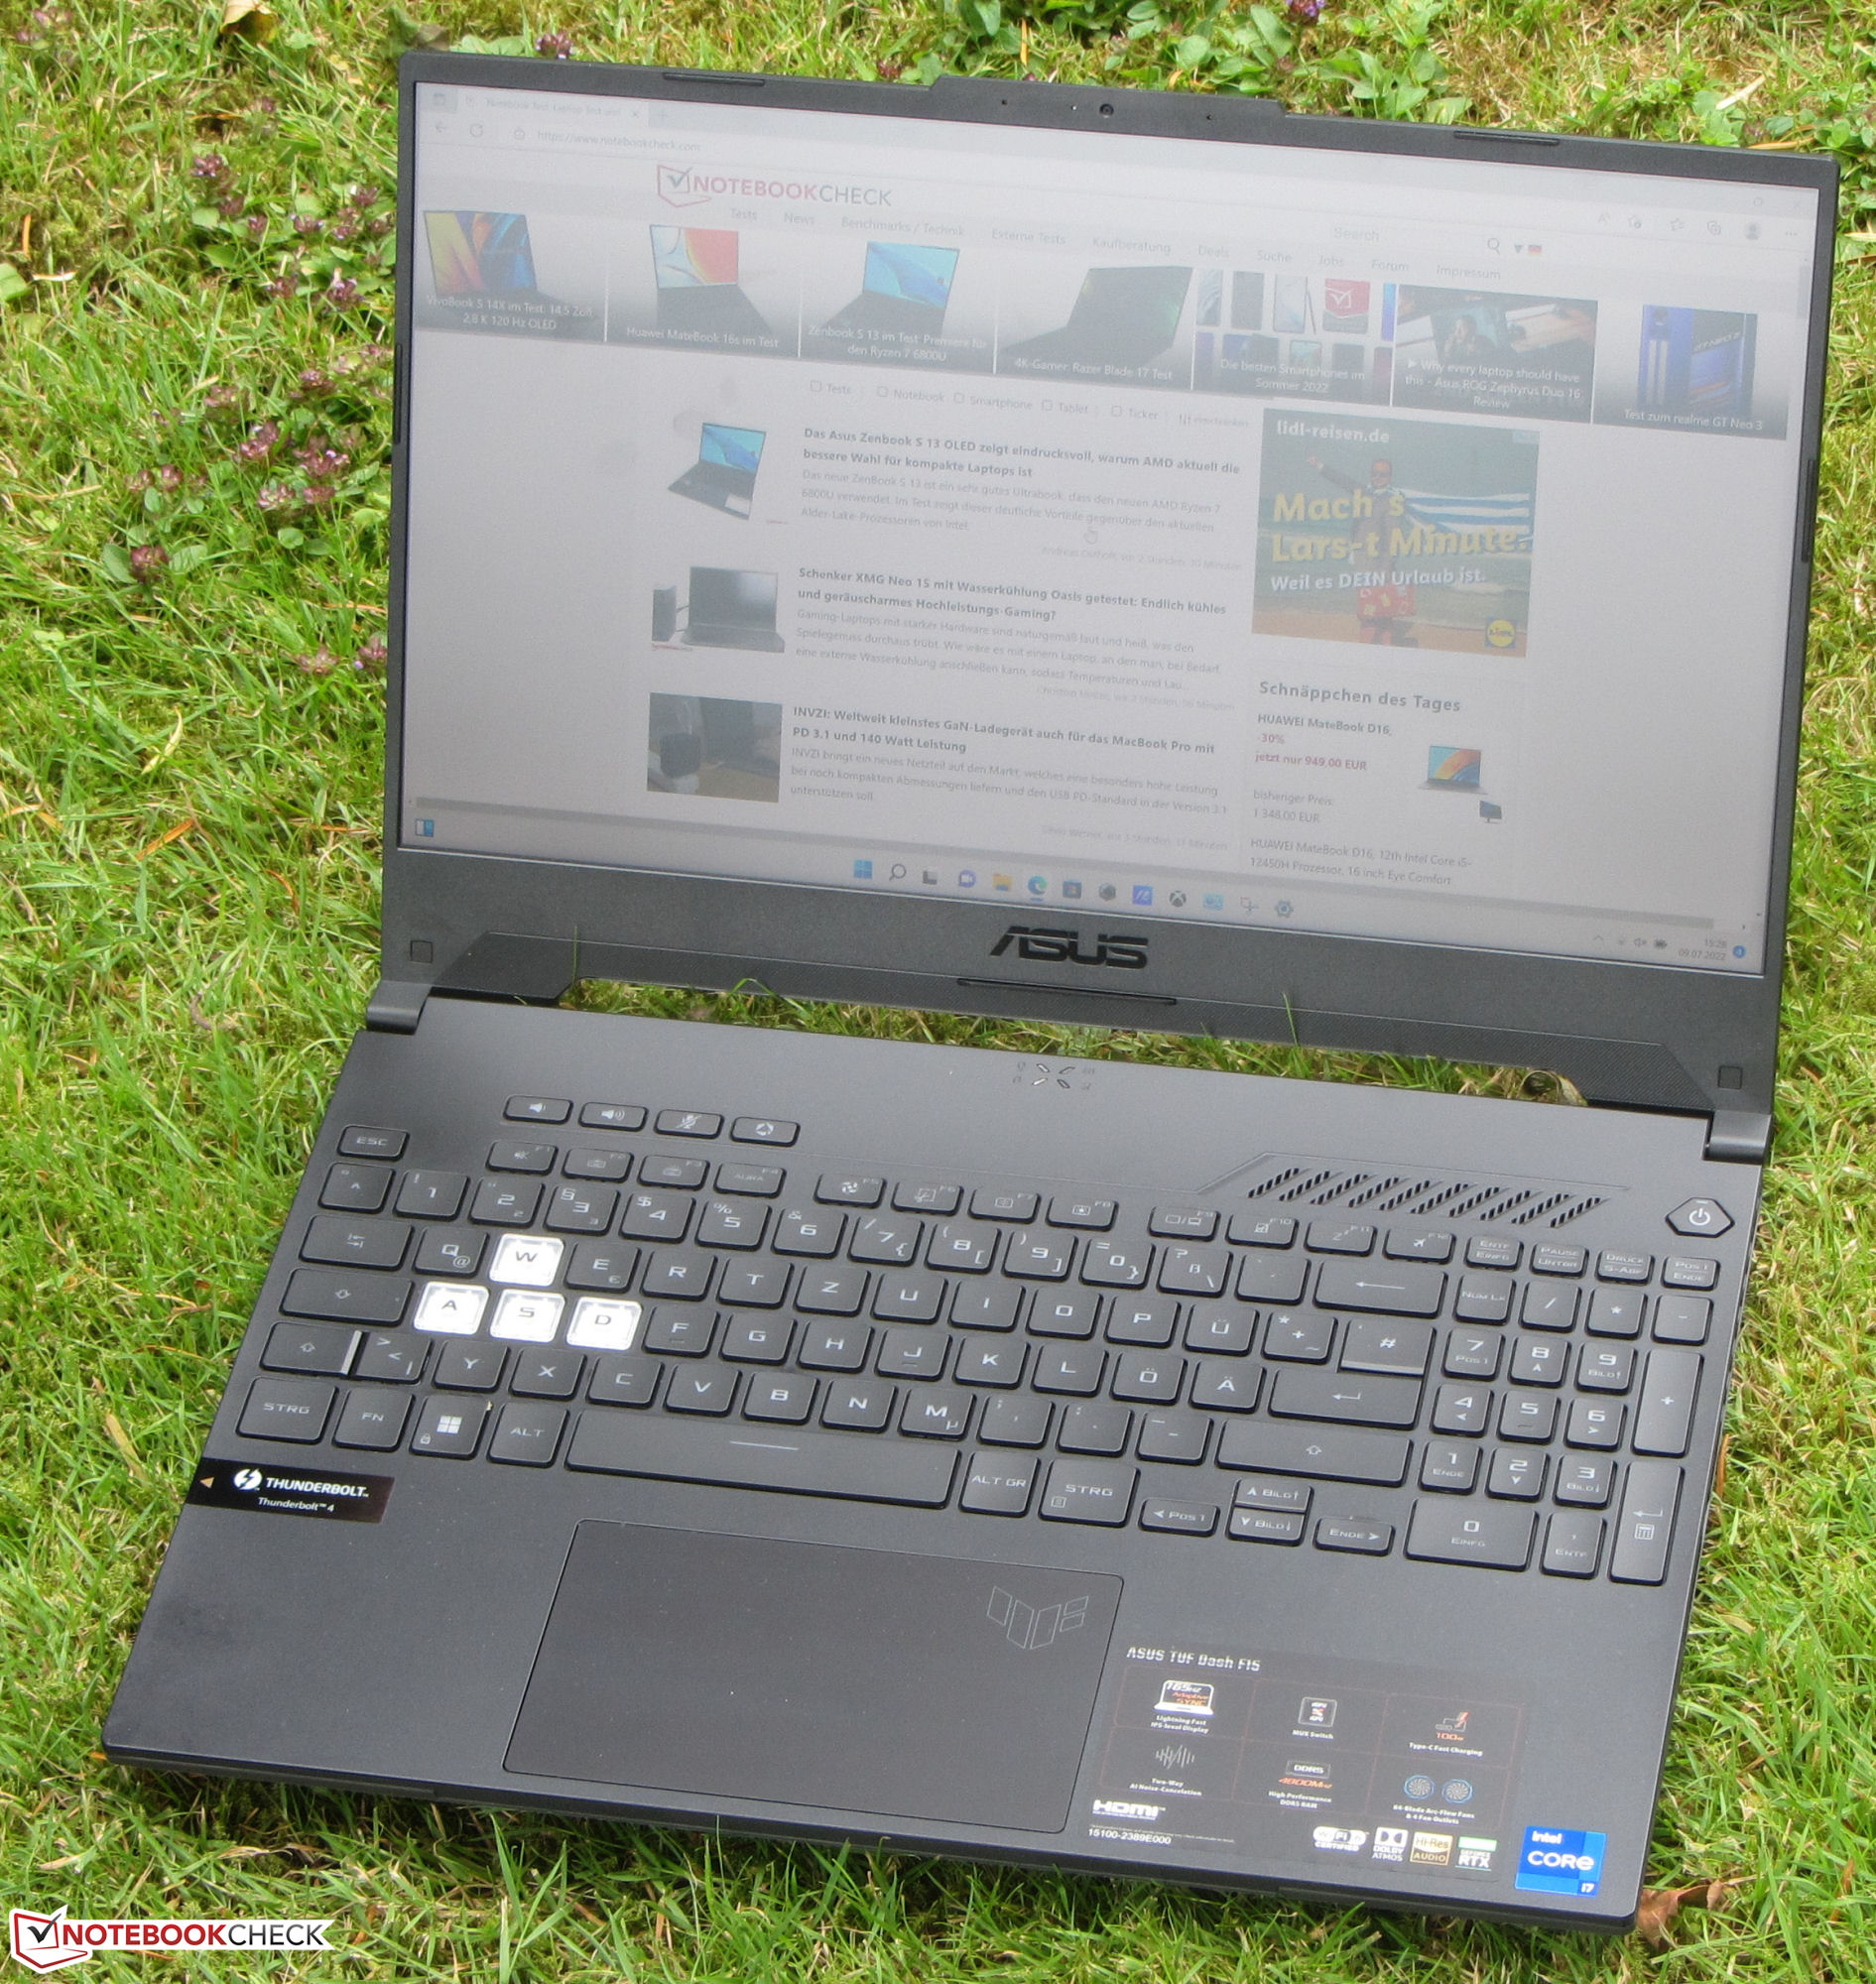
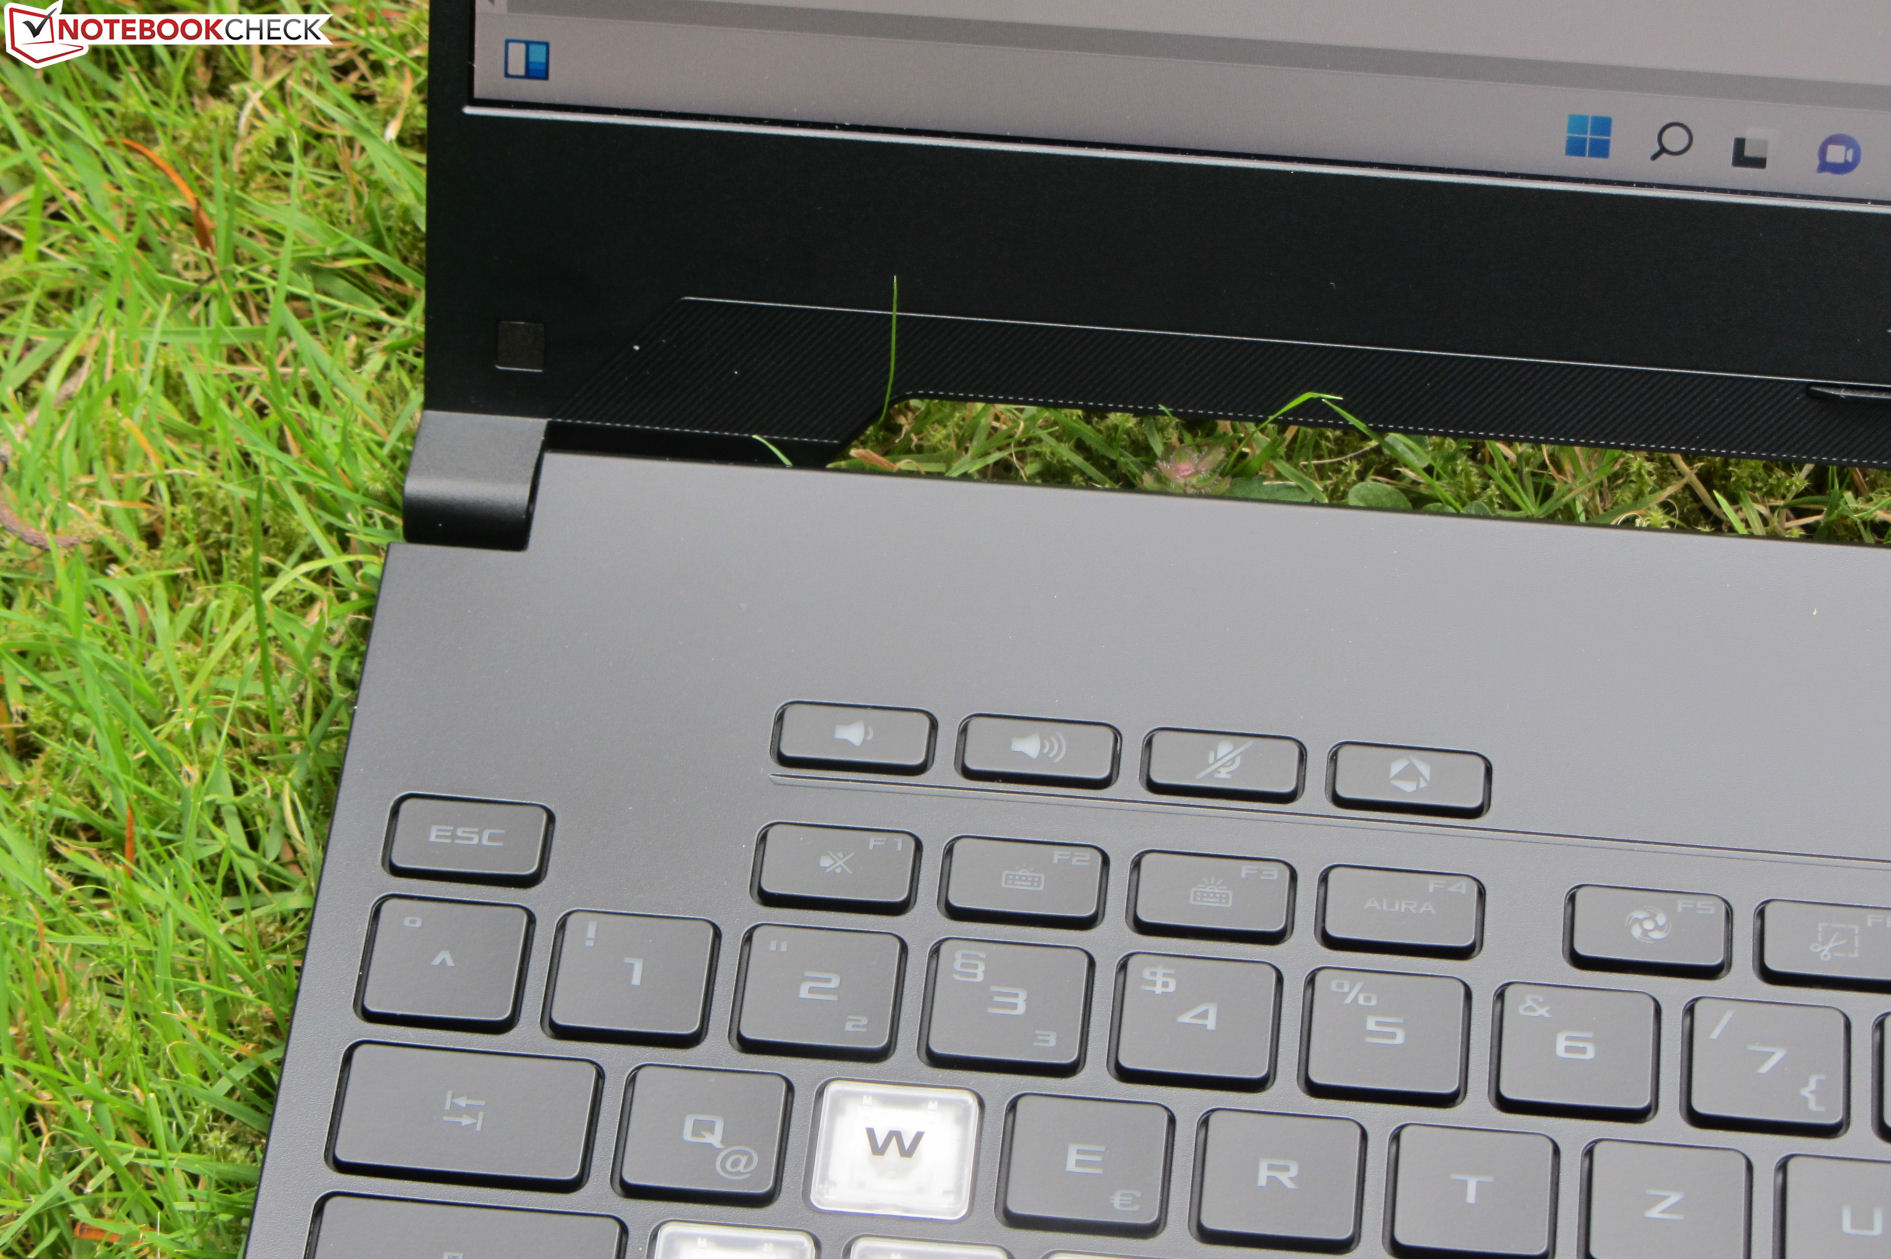
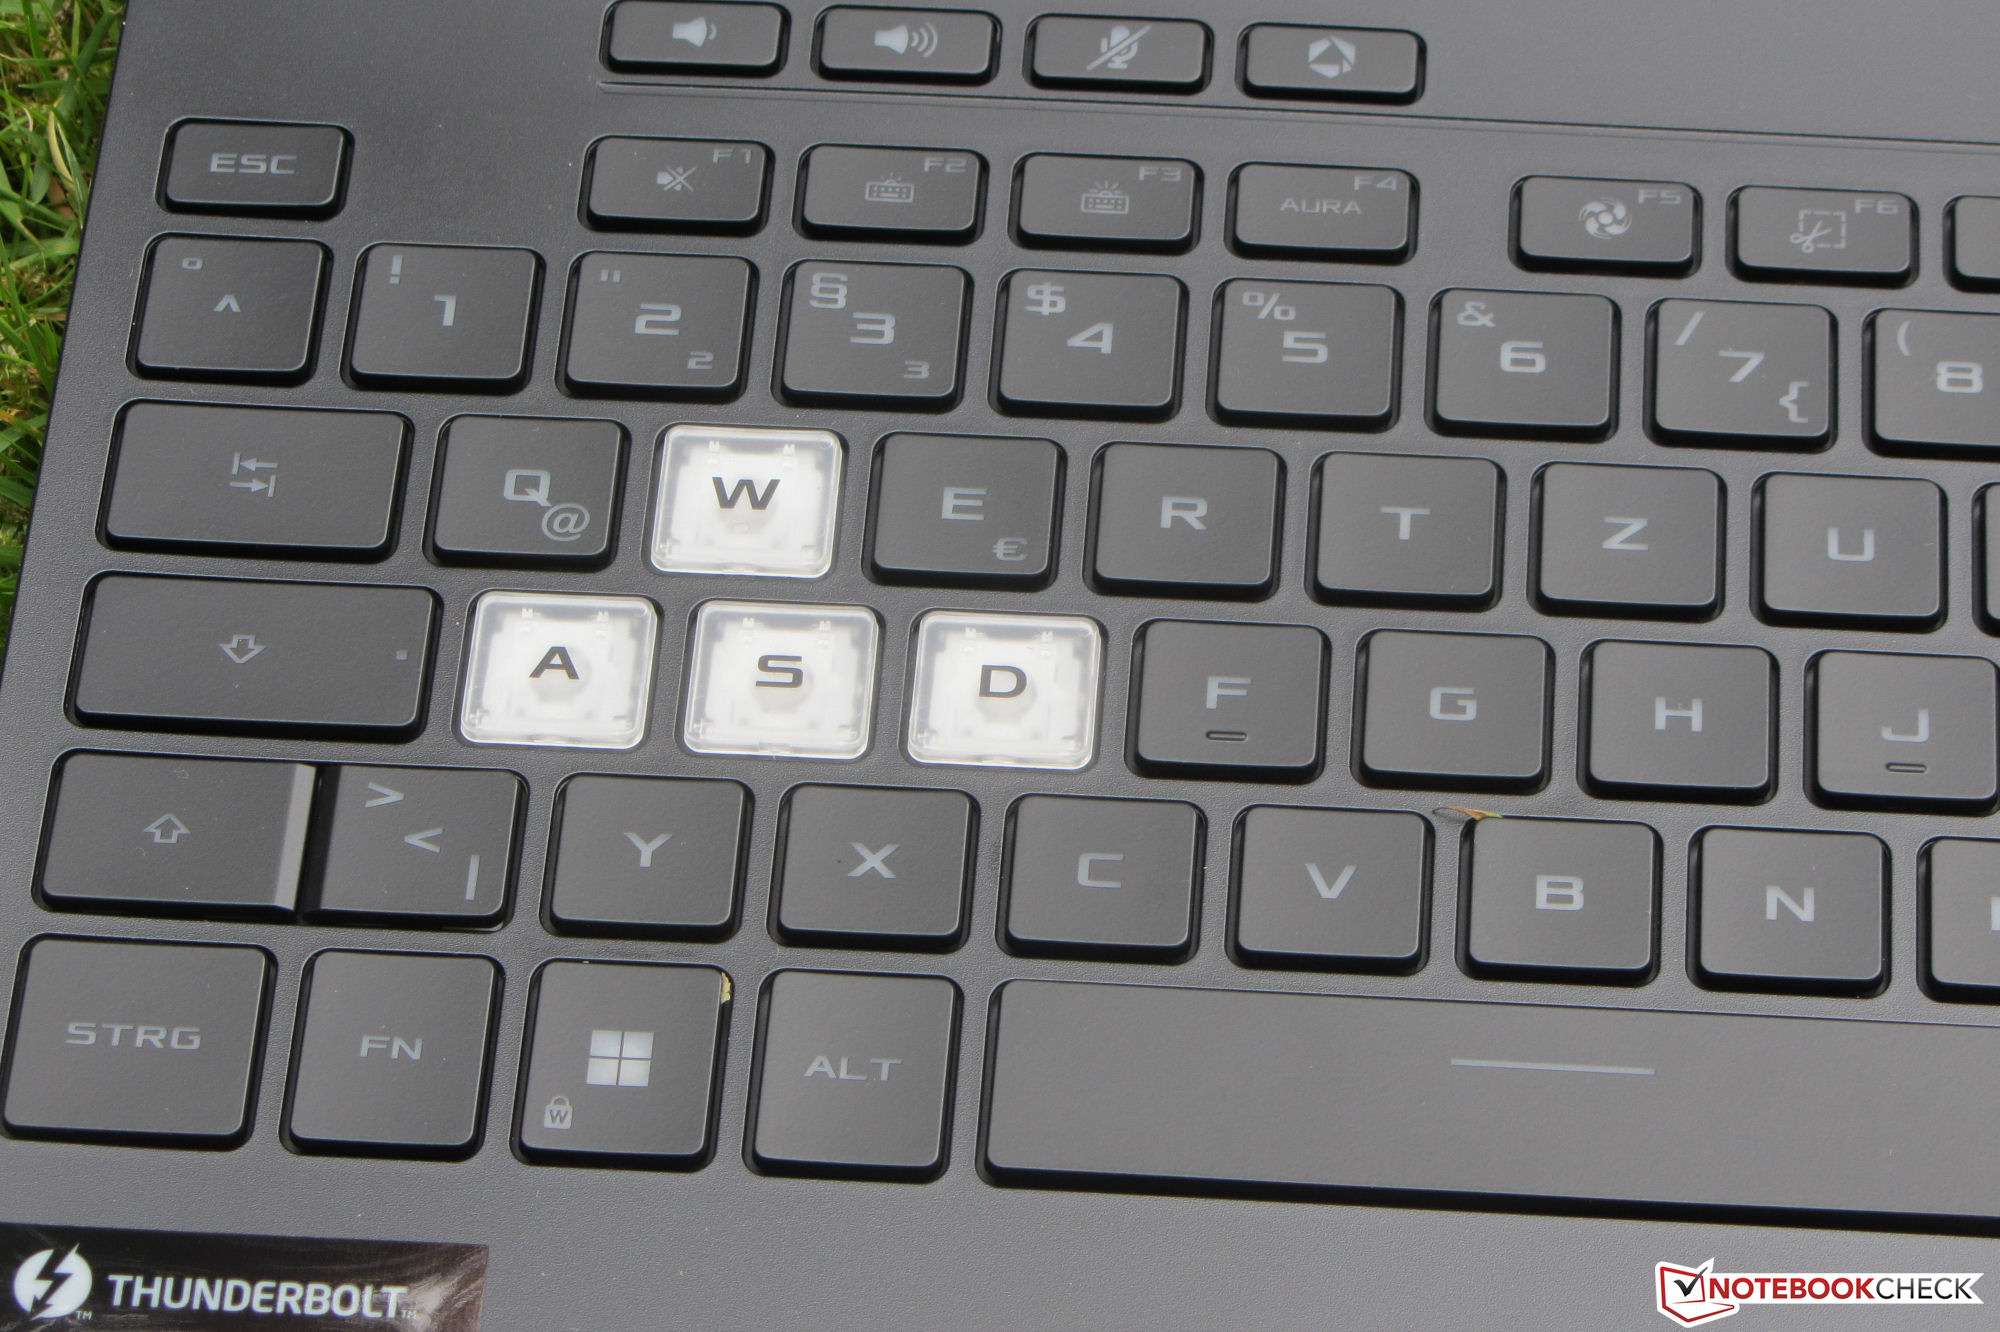
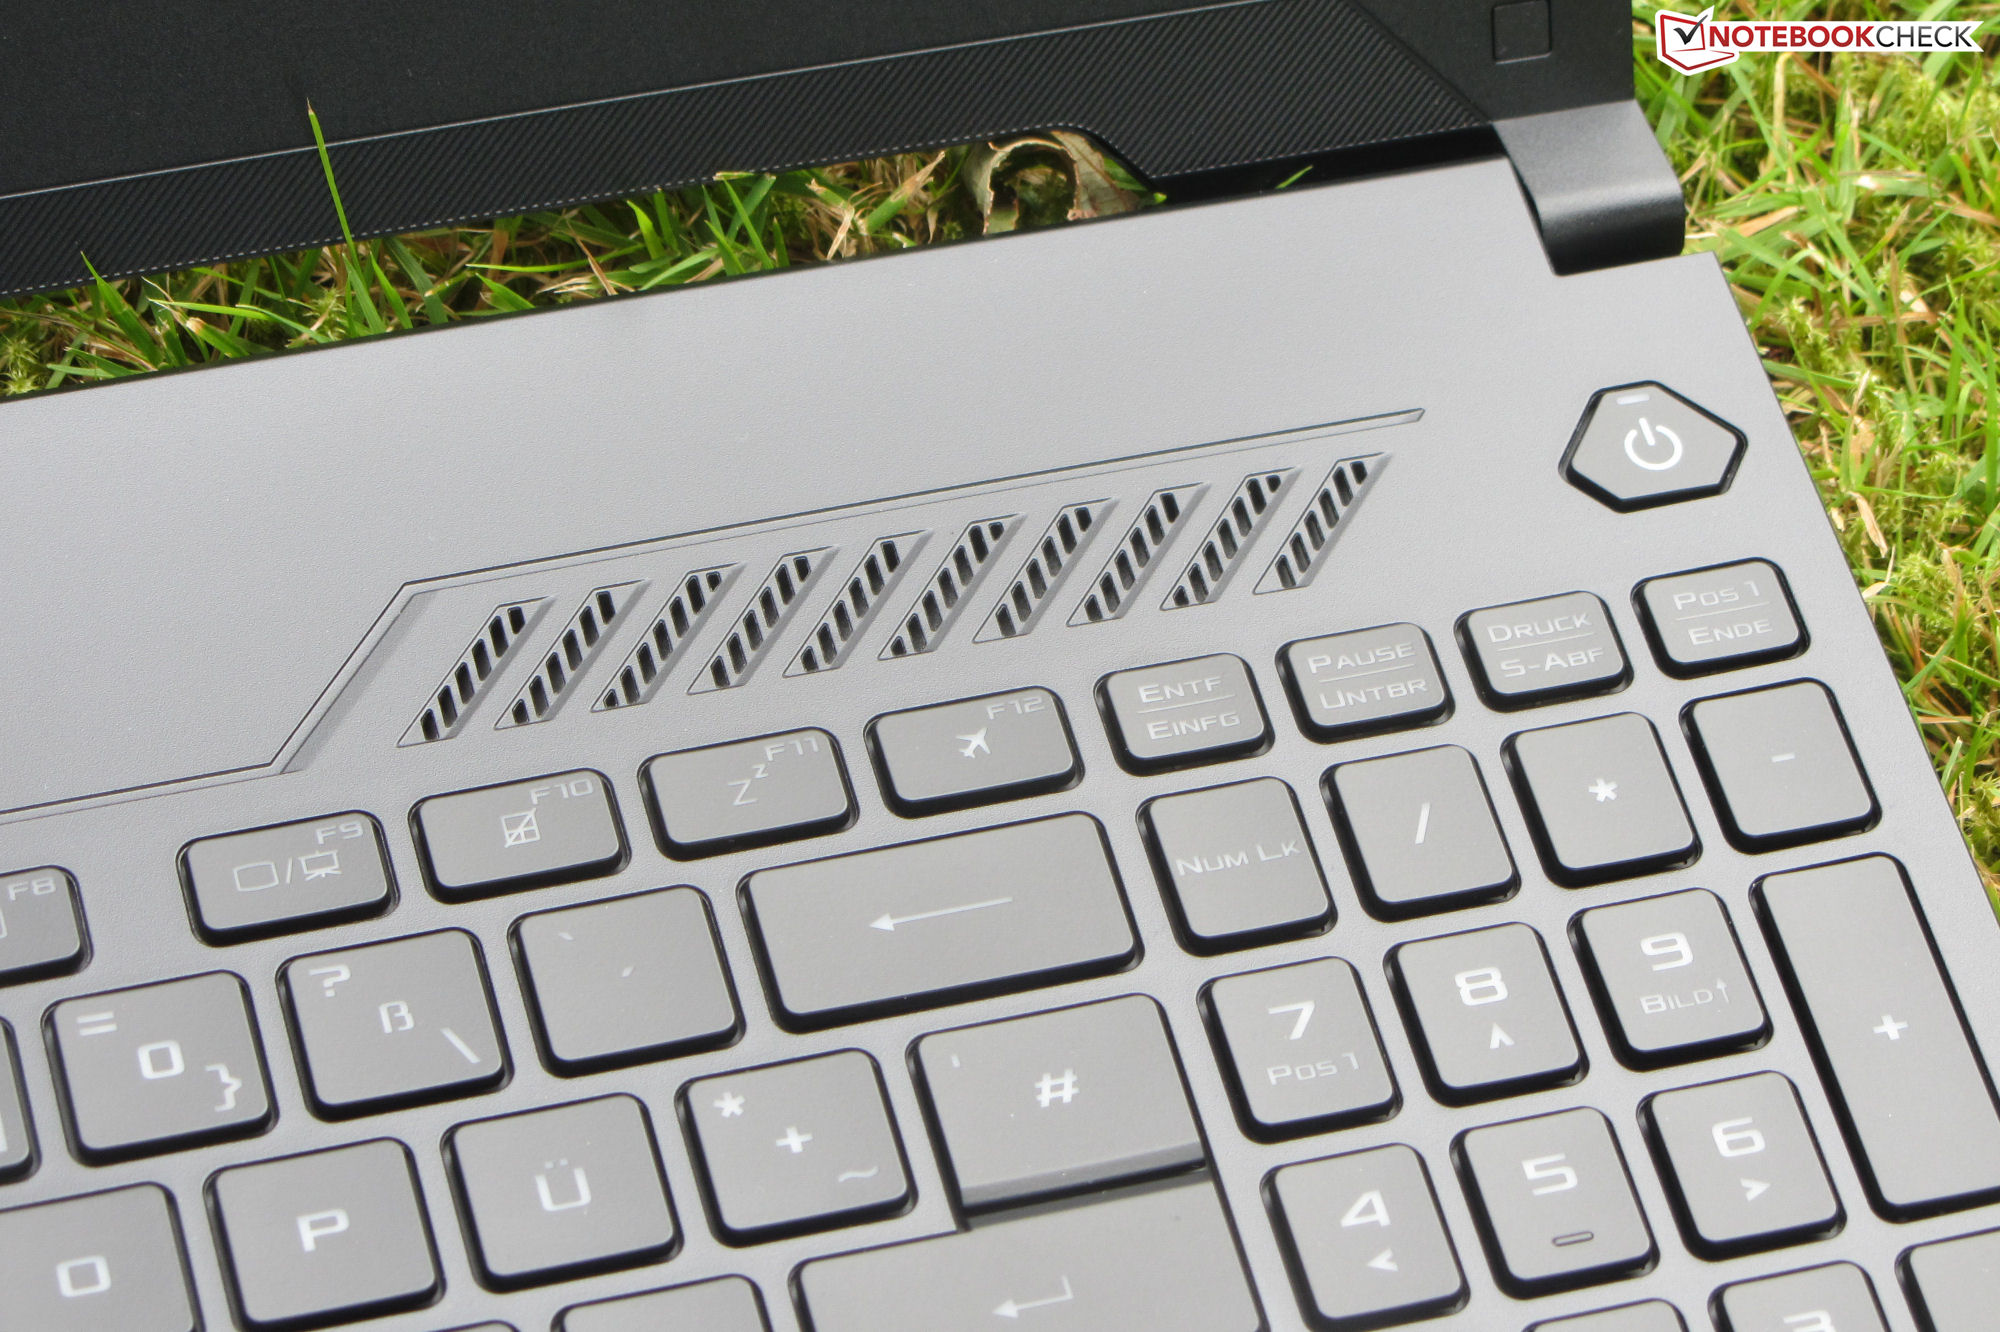
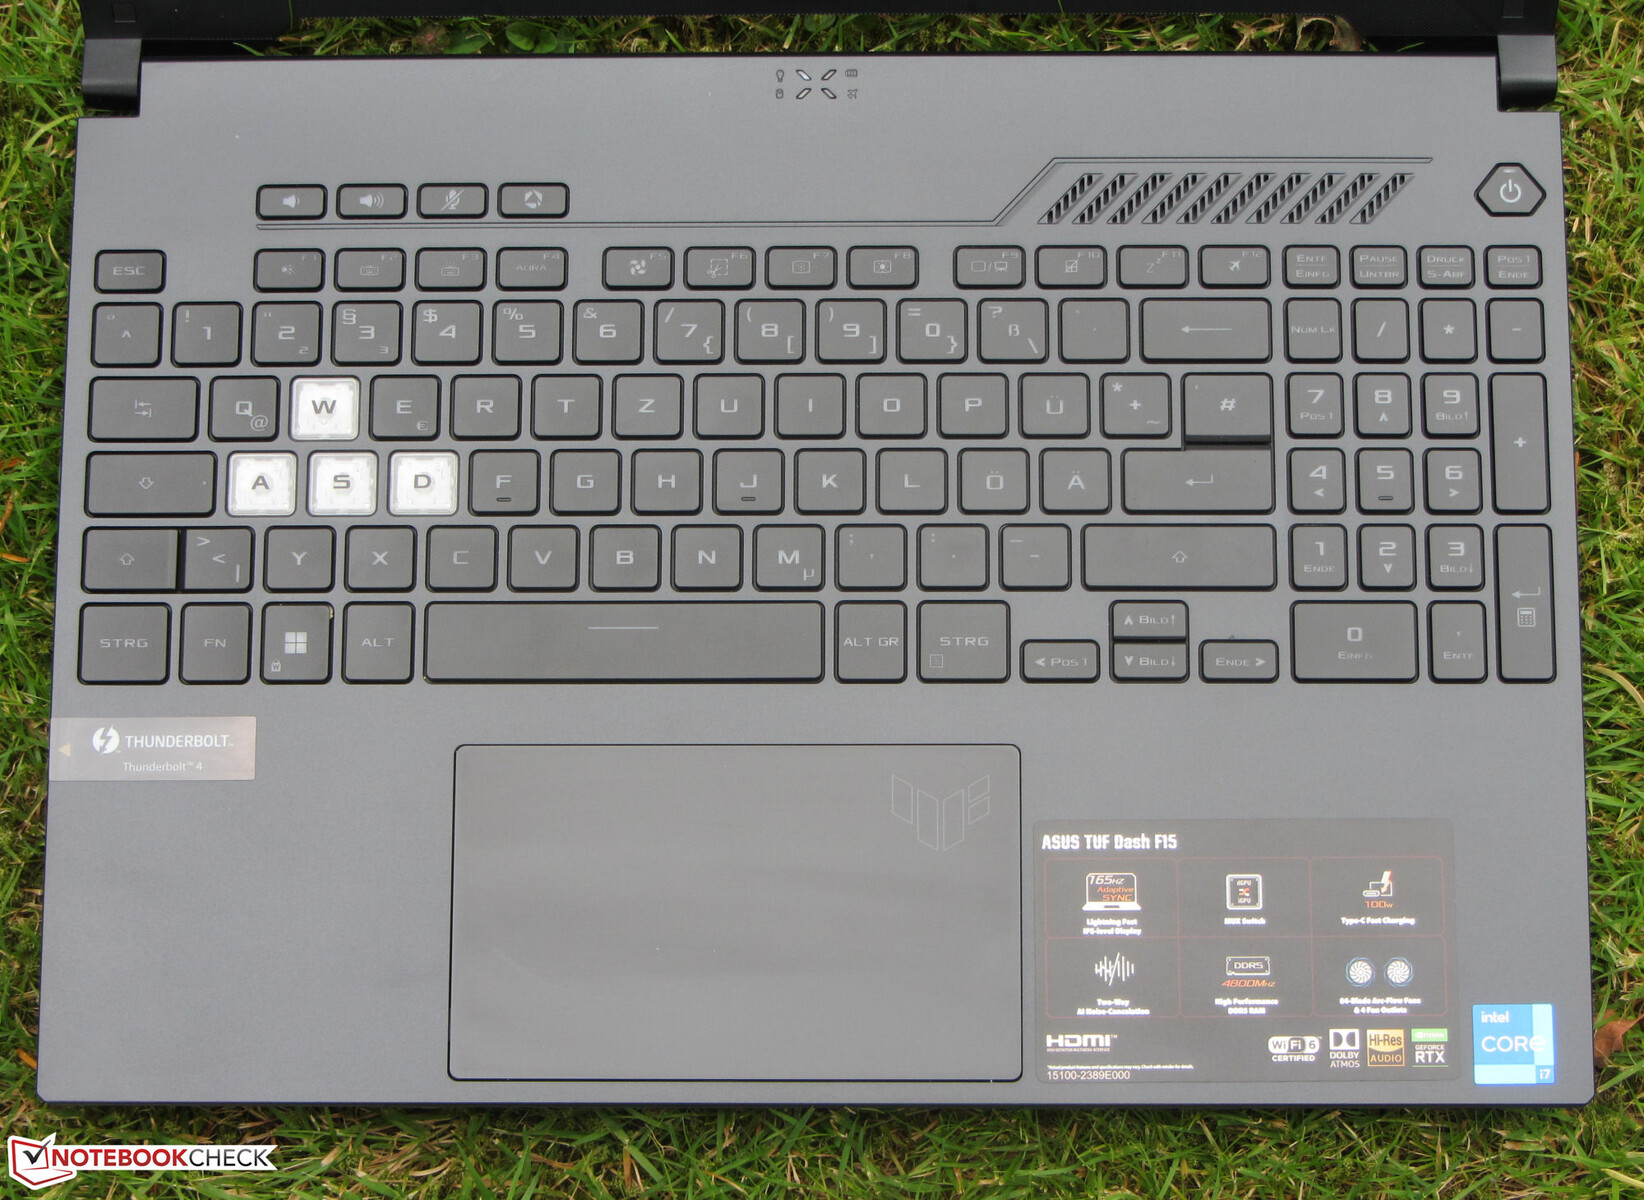
Input devices - TUF Dash with monochrome backlighting
Keyboard
The F15's keyboard consists of concave keys for the most part. A few keys (e.g. Enter, Shift) are flat. They all offer a medium stroke and a clear pressure point. As for the key layout, it can't necessarily be described as optimal: The small arrow keys and the single-line "Enter" key are worth mentioning. The resistance provided by the keys is acceptable. The keyboard wobbles a bit during typing. This didn't prove to be annoying, though. The three-stage backlight (monochrome, white) is controlled via two function keys. All in all, Asus delivers a keyboard that is suitable for everyday use here.
Touchpad
A multitouch-capable ClickPad (about 13 x 7.7 cm) serves as mouse replacement. Its smooth surface makes it easy for fingers to glide on it. It also responds to inputs in the corners. The pad has a short travel and a clear pressure point.
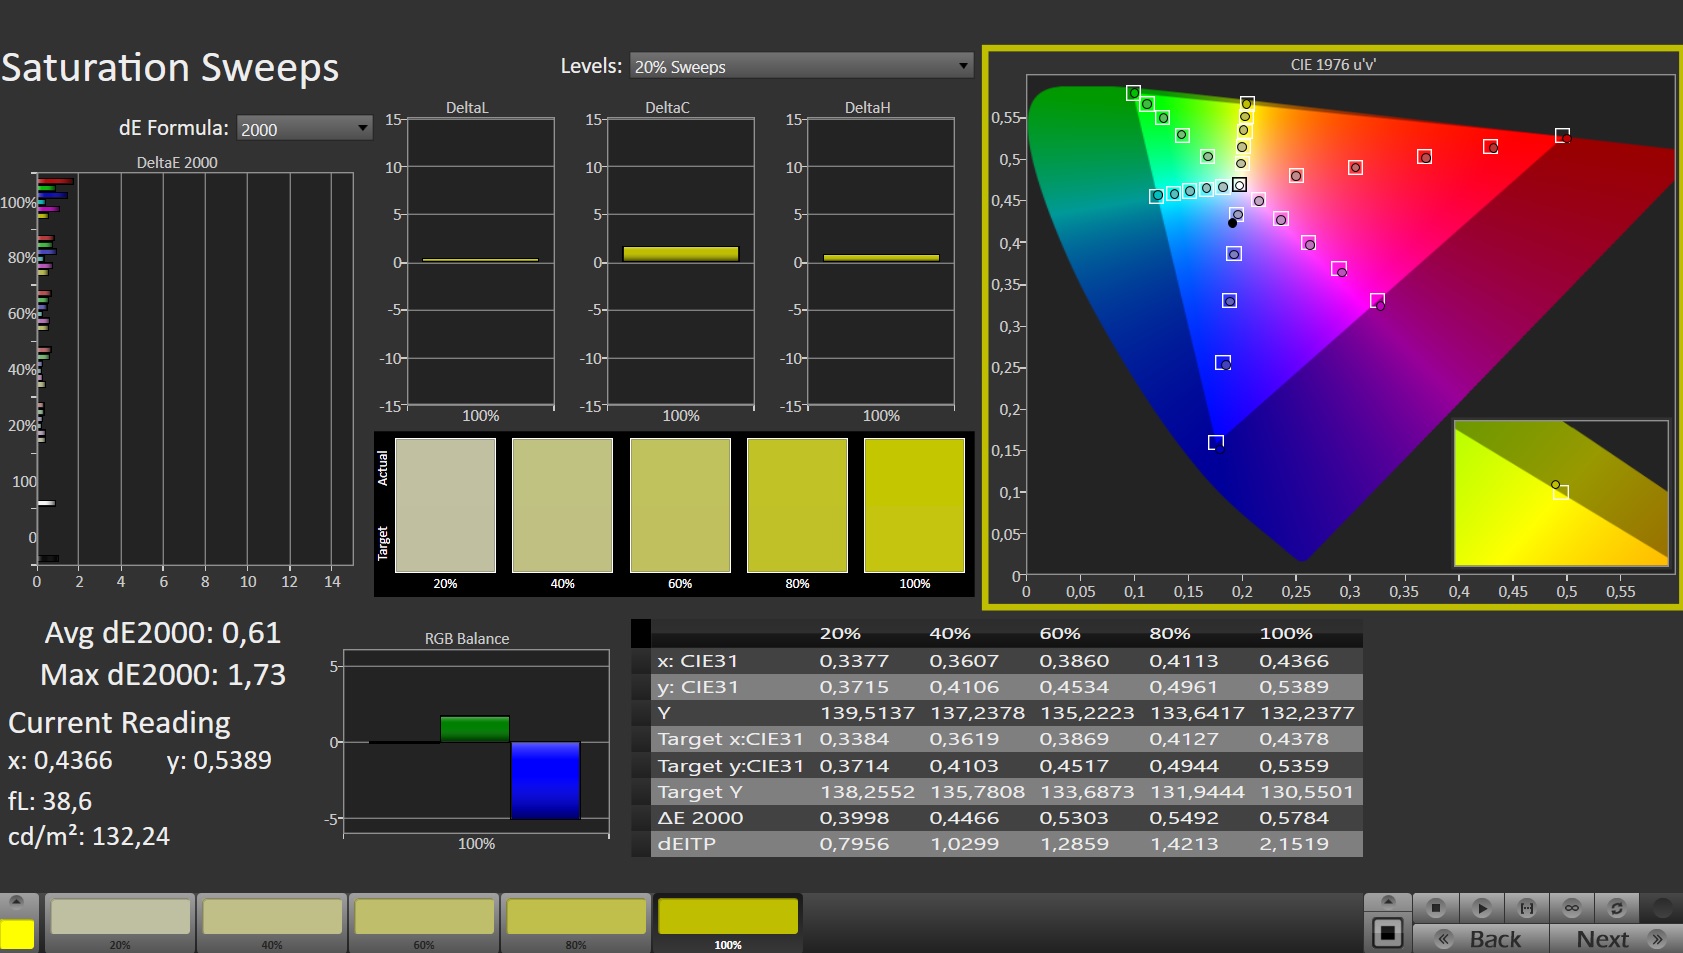
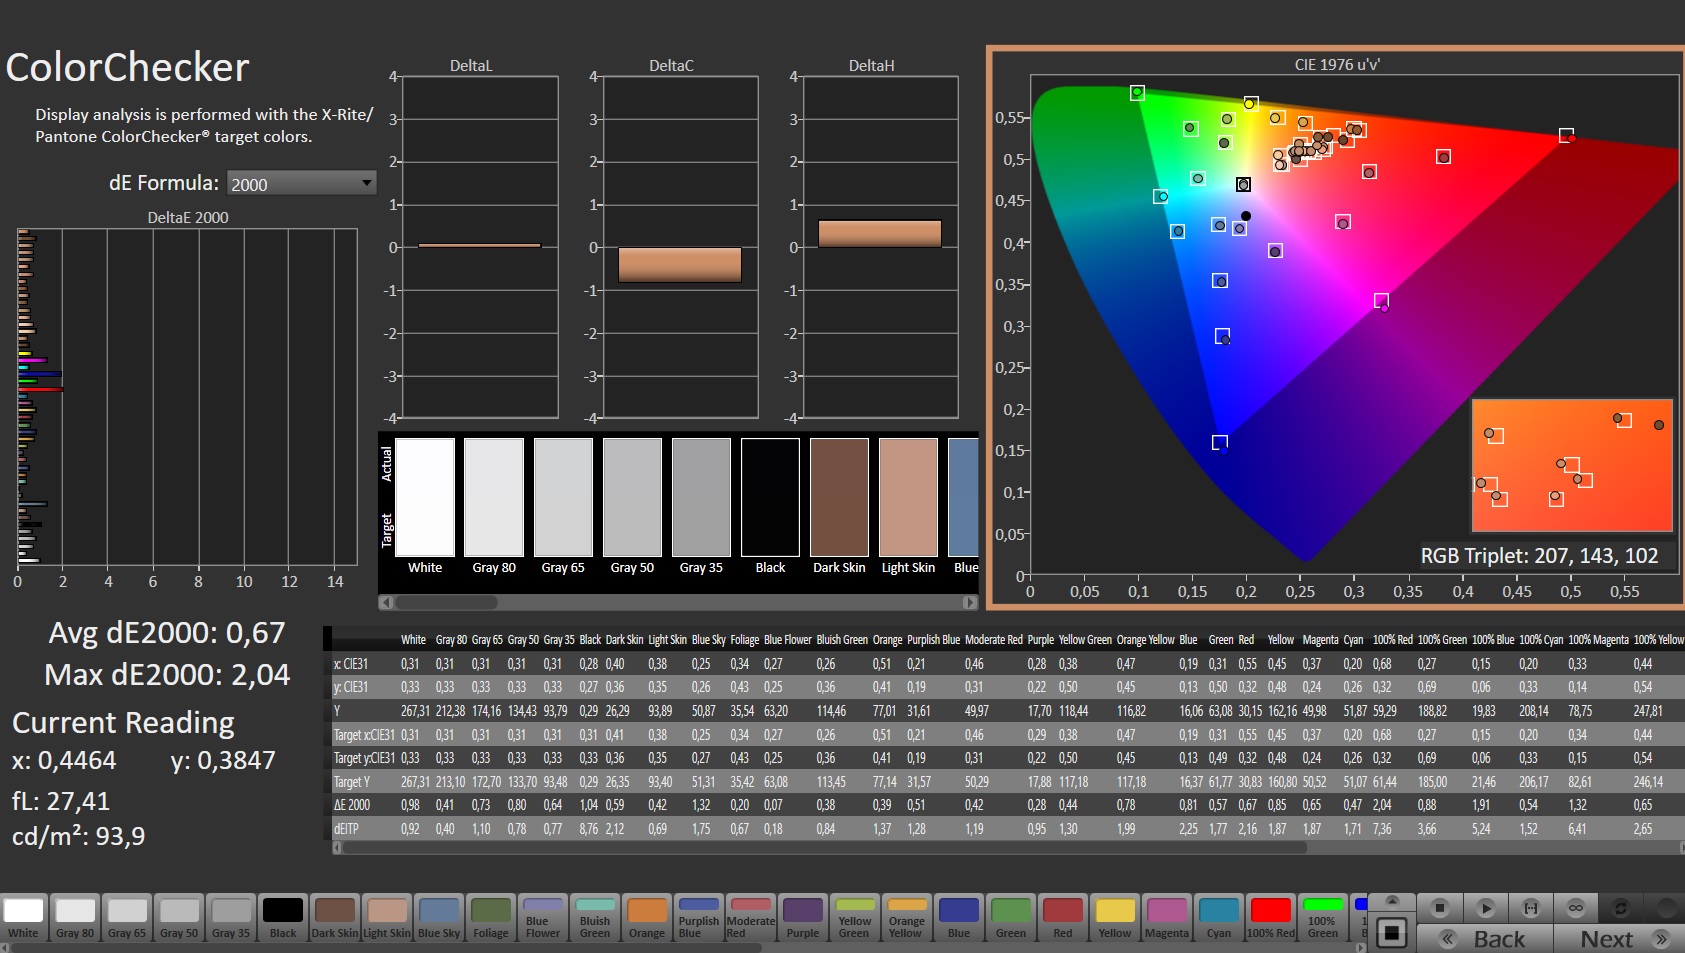
Display - Responsive, but too dim
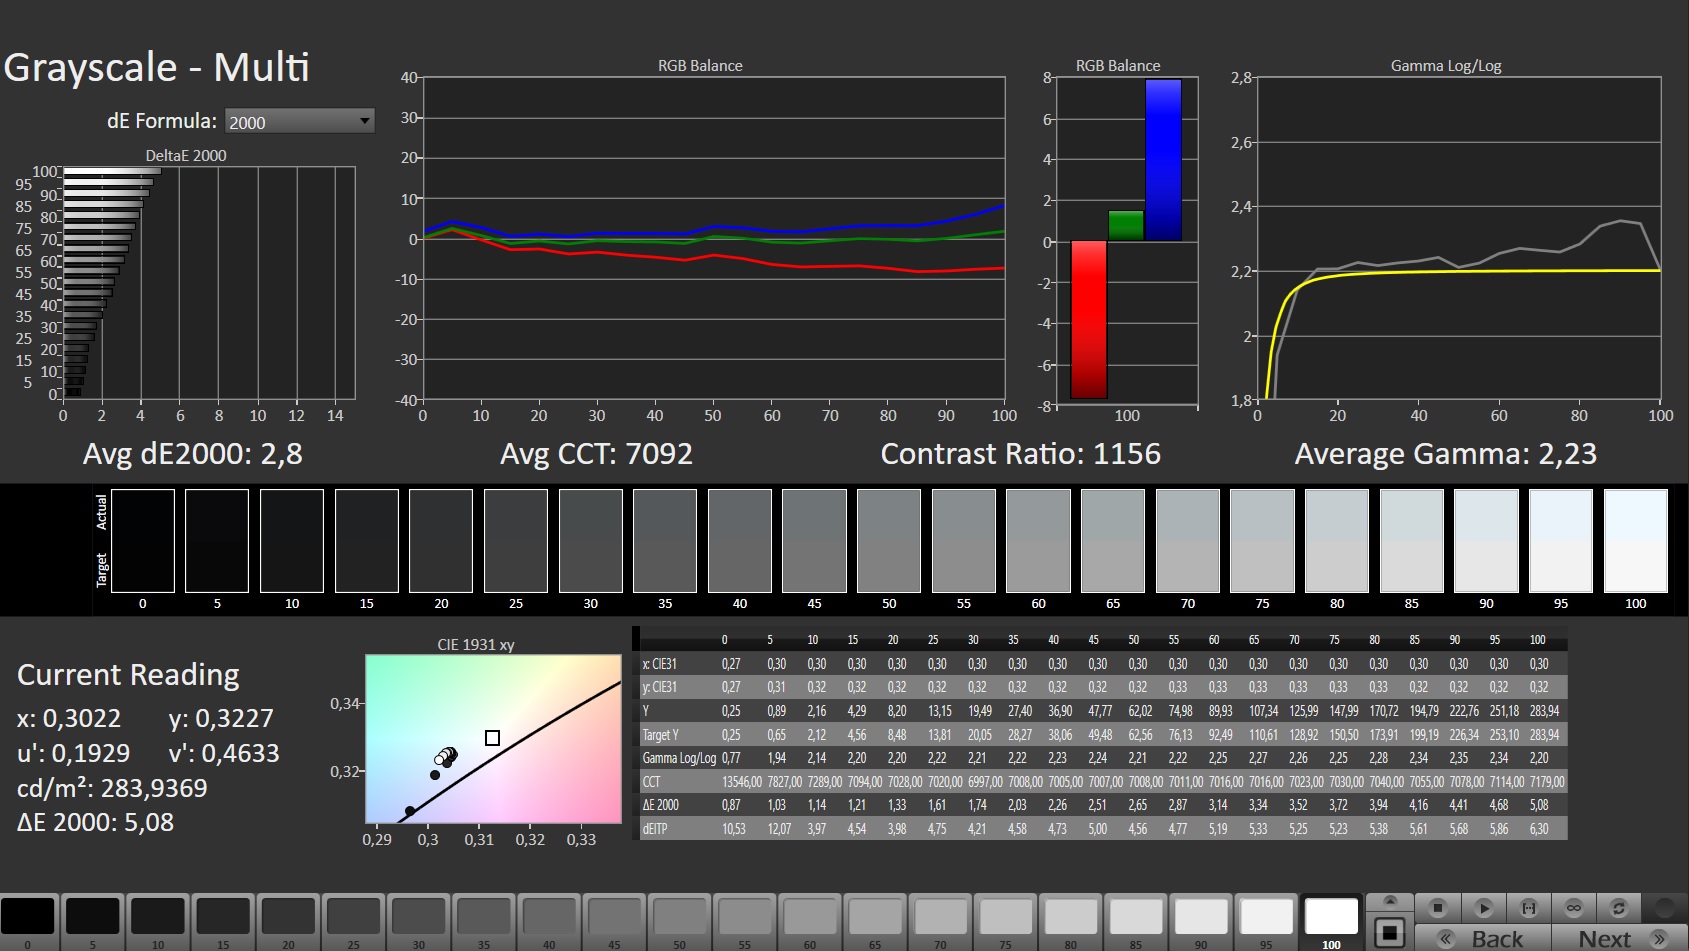
While the 15.6-inch matte display's (2,560x1,440 pixels) contrast (1,144:1) meets the target (> 1,000:1), its maximum brightness (266.2 cd/m²) is too low. We consider values beyond 300 cd/m² to be good. The 165 Hz panel offers fast response times. PWM flickering couldn't be detected.
The display supports the AdaptiveSync technology. This means that the refresh rates of the display and the GPU are dynamically adjusted in relation to each other. This is intended to create the smoothest possible image - especially in computer games.

| |||||||||||||||||||||||||
Brightness Distribution: 87 %
Center on Battery: 286 cd/m²
Contrast: 1144:1 (Black: 0.25 cd/m²)
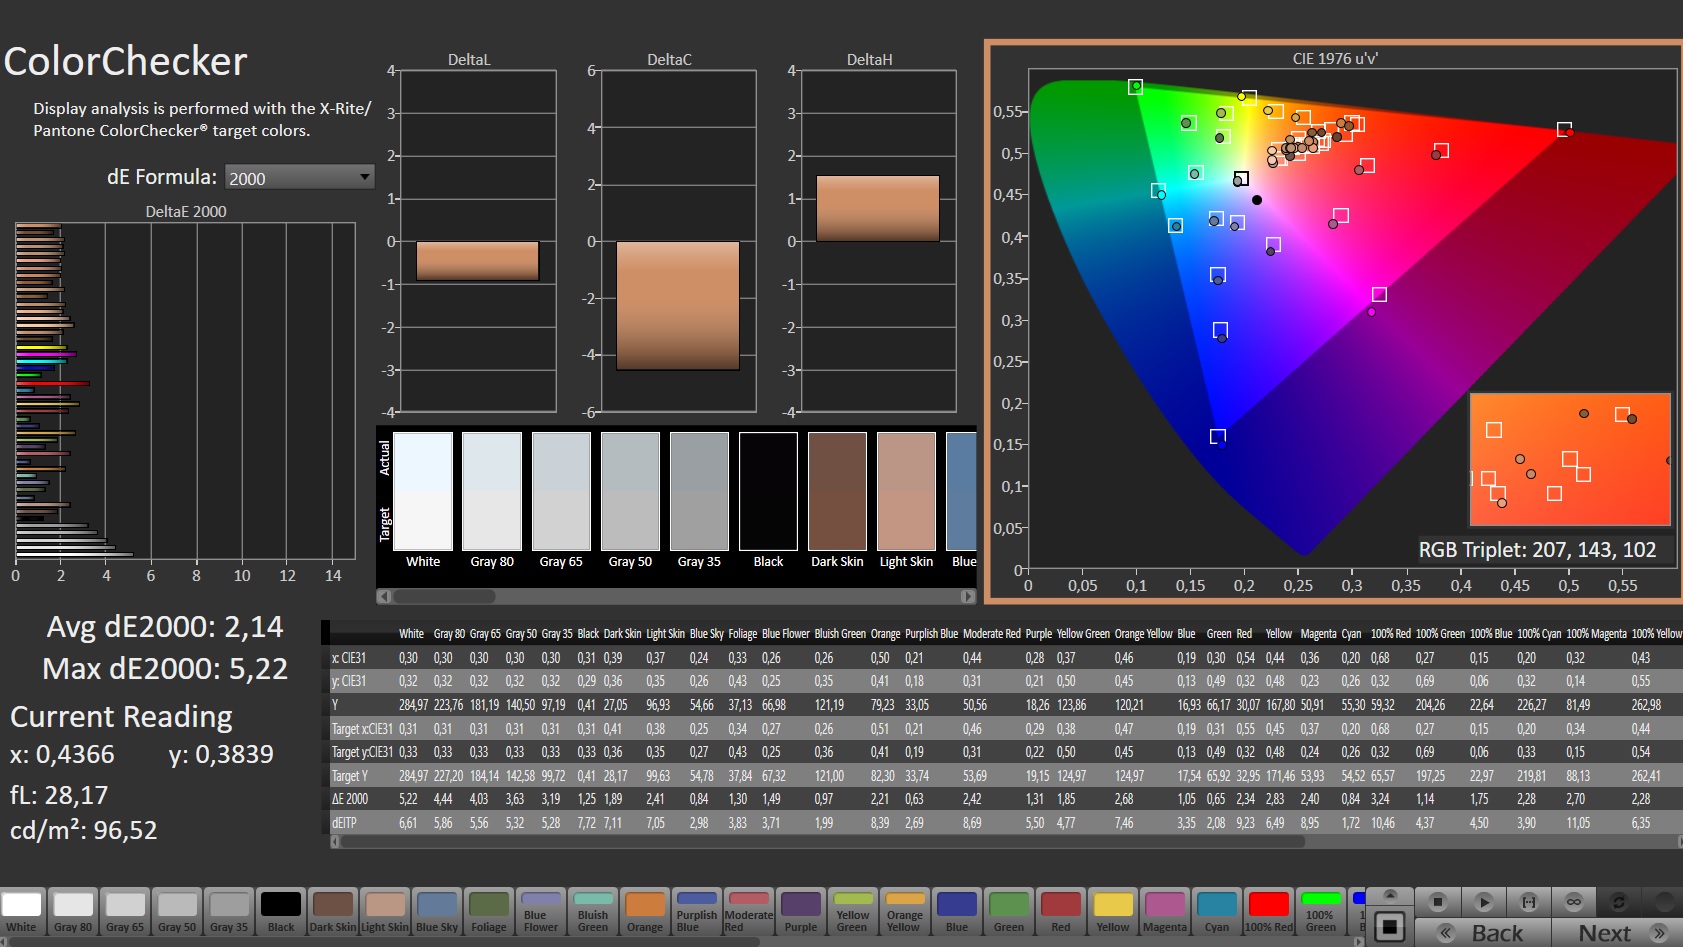
ΔE Color 2.14 | 0.5-29.43 Ø5, calibrated: 0.67
ΔE Greyscale 2.8 | 0.57-98 Ø5.3
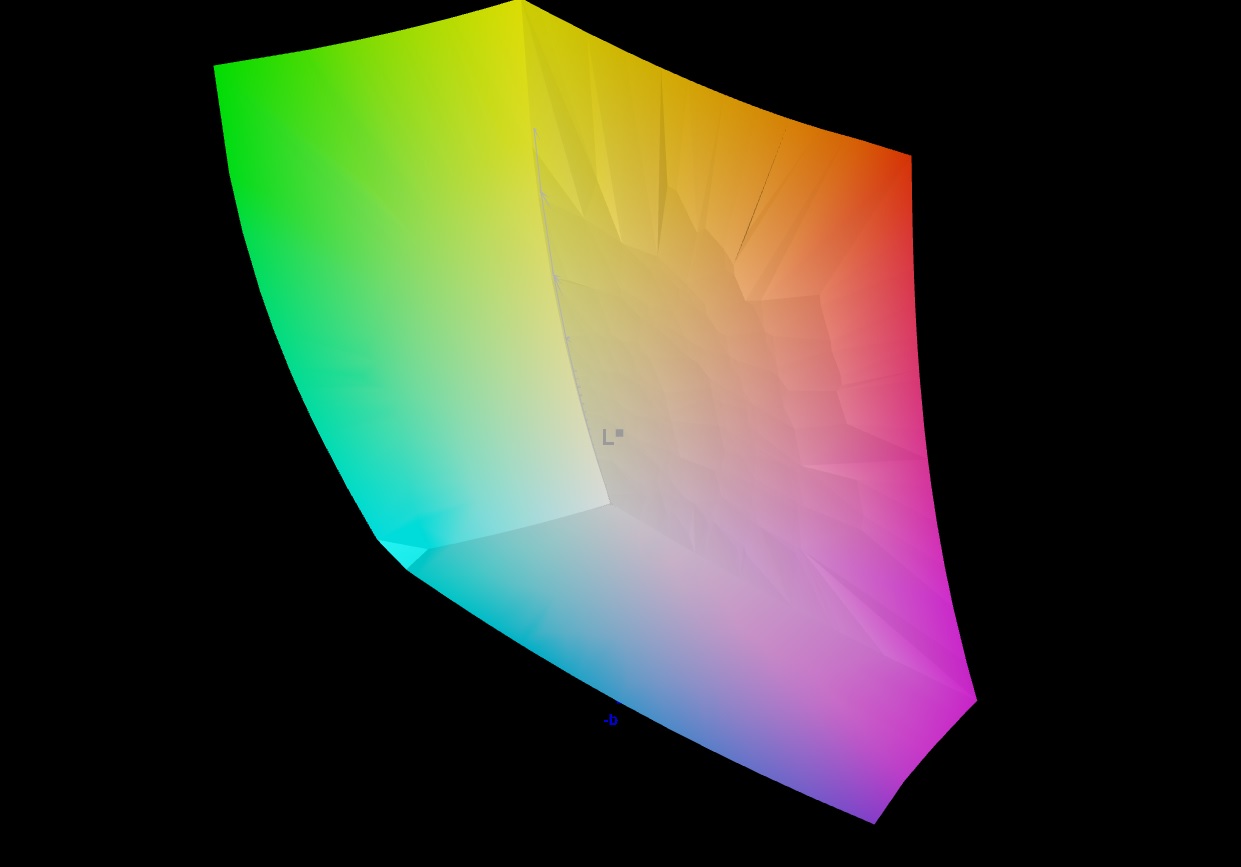
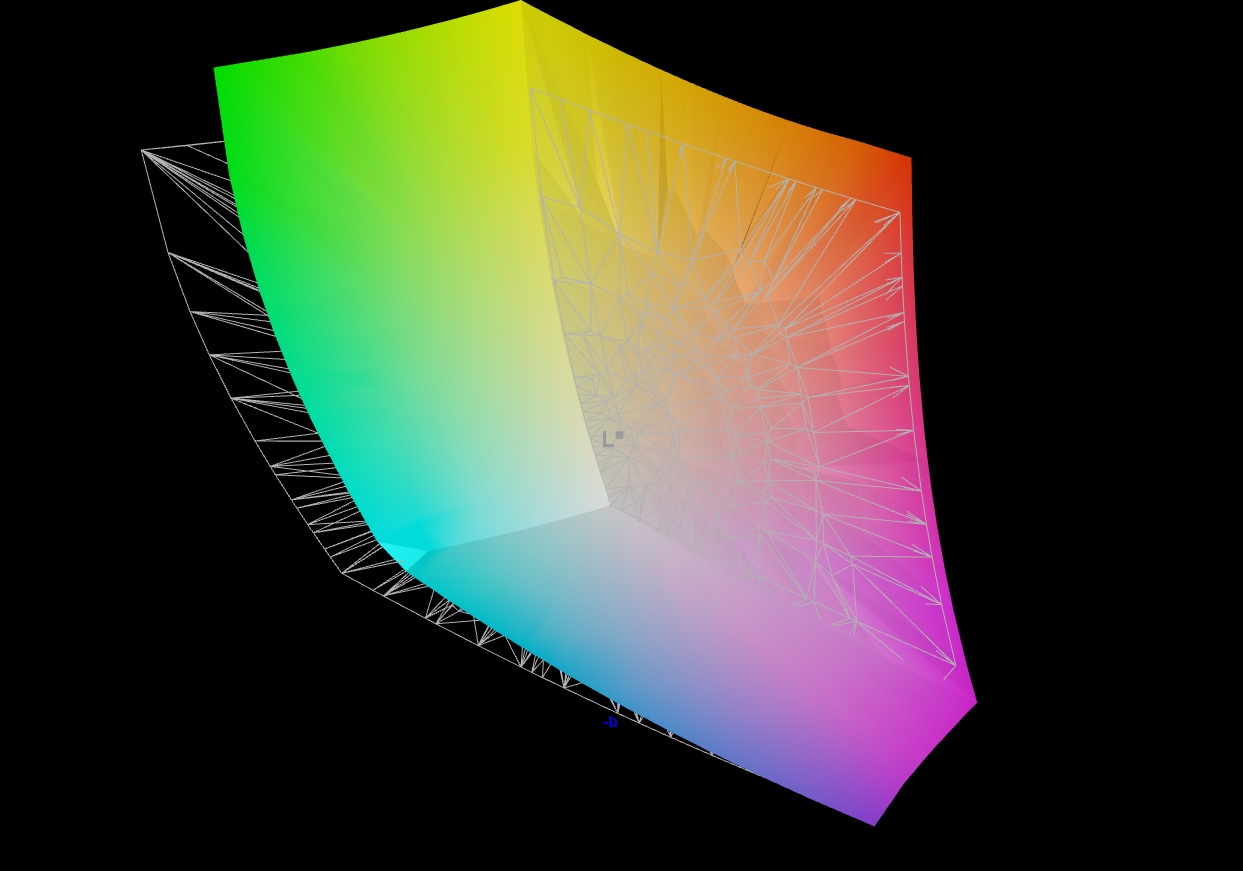
85.9% AdobeRGB 1998 (Argyll 2.2.0 3D)
99.9% sRGB (Argyll 2.2.0 3D)
98.4% Display P3 (Argyll 2.2.0 3D)
Gamma: 2.23
| Asus TUF Dash F15 FX517ZR BOE CQ NE156QHM-NY1, IPS, 2560x1440, 15.60 | Acer Nitro 5 AN515-58-72QR Chi Mei N156KME-GNA, IPS, 2560x1440, 15.60 | HP Omen 16-b1090ng BOE09E5, IPS, 2560x1440, 16.10 | MSI Delta 15 A5EFK LQ156M1JW03 (SHP155D), IPS-Level, 1920x1080, 15.60 | Razer Blade 15 Base Edition 2021, i7-10750H RTX 3060 BOE NV156FHM-N4K, IPS, 1920x1080, 15.60 | |
|---|---|---|---|---|---|
| Display | -1% | -15% | -18% | -22% | |
| Display P3 Coverage | 98.4 | 95.6 -3% | 71 -28% | 66.5 -32% | 64.3 -35% |
| sRGB Coverage | 99.9 | 99.8 0% | 97.9 -2% | 97.8 -2% | 91.8 -8% |
| AdobeRGB 1998 Coverage | 85.9 | 85.2 -1% | 73.3 -15% | 67.6 -21% | 65.5 -24% |
| Response Times | -95% | -80% | -70% | -32% | |
| Response Time Grey 50% / Grey 80% * | 5.6 ? | 15.7 ? -180% | 14.5 ? -159% | 12.8 ? -129% | 8.8 ? -57% |
| Response Time Black / White * | 9.4 ? | 10.2 ? -9% | 9.4 ? -0% | 10.4 ? -11% | 10 ? -6% |
| PWM Frequency | 23580 ? | 1000 ? | |||
| Screen | -20% | -45% | -27% | -55% | |
| Brightness middle | 286 | 332 16% | 335 17% | 291 2% | 317.2 11% |
| Brightness | 266 | 303 14% | 319 20% | 266 0% | 306 15% |
| Brightness Distribution | 87 | 86 -1% | 90 3% | 88 1% | 89 2% |
| Black Level * | 0.25 | 0.29 -16% | 0.28 -12% | 0.36 -44% | 0.31 -24% |
| Contrast | 1144 | 1145 0% | 1196 5% | 808 -29% | 1023 -11% |
| Colorchecker dE 2000 * | 2.14 | 3.61 -69% | 4.38 -105% | 2.98 -39% | 4.37 -104% |
| Colorchecker dE 2000 max. * | 5.22 | 7.71 -48% | 9.48 -82% | 7.59 -45% | 6.62 -27% |
| Colorchecker dE 2000 calibrated * | 0.67 | 0.59 12% | 1.33 -99% | 0.91 -36% | 2.67 -299% |
| Greyscale dE 2000 * | 2.8 | 5.2 -86% | 7 -150% | 4.2 -50% | 4.5 -61% |
| Gamma | 2.23 99% | 2.155 102% | 2.103 105% | 2.293 96% | 2.4 92% |
| CCT | 7092 92% | 6724 97% | 6244 104% | 7624 85% | 7418 88% |
| Color Space (Percent of AdobeRGB 1998) | 59.2 | ||||
| Color Space (Percent of sRGB) | 91.4 | ||||
| Total Average (Program / Settings) | -39% /
-27% | -47% /
-43% | -38% /
-31% | -36% /
-45% |
* ... smaller is better
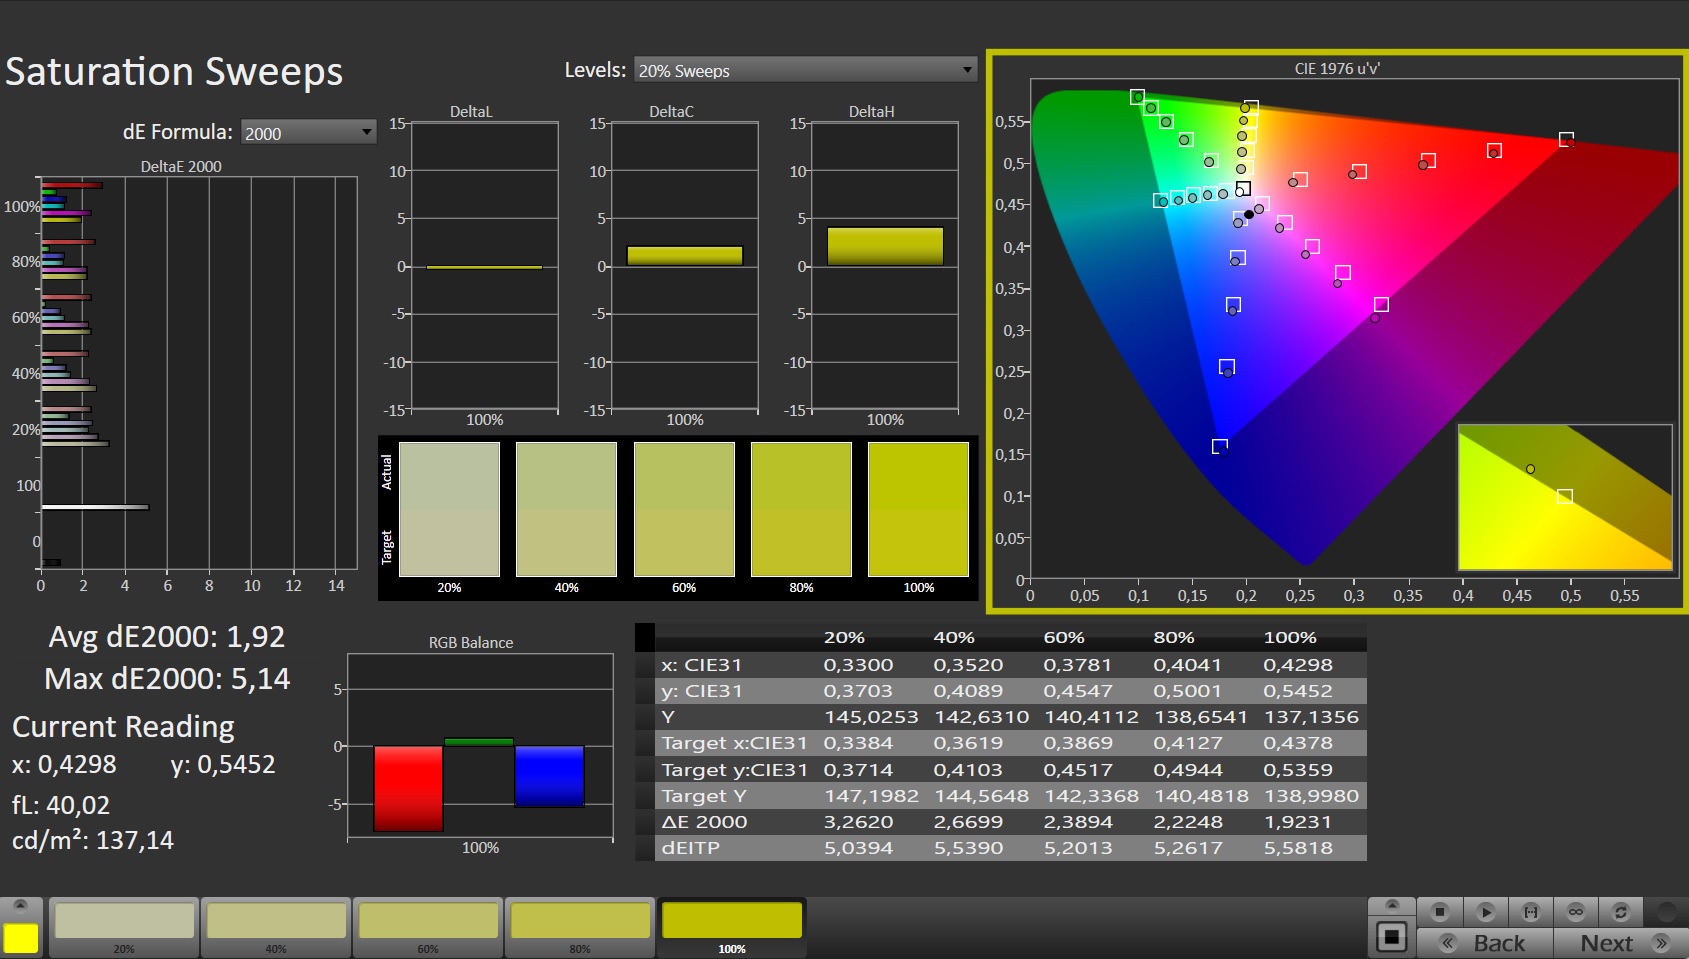
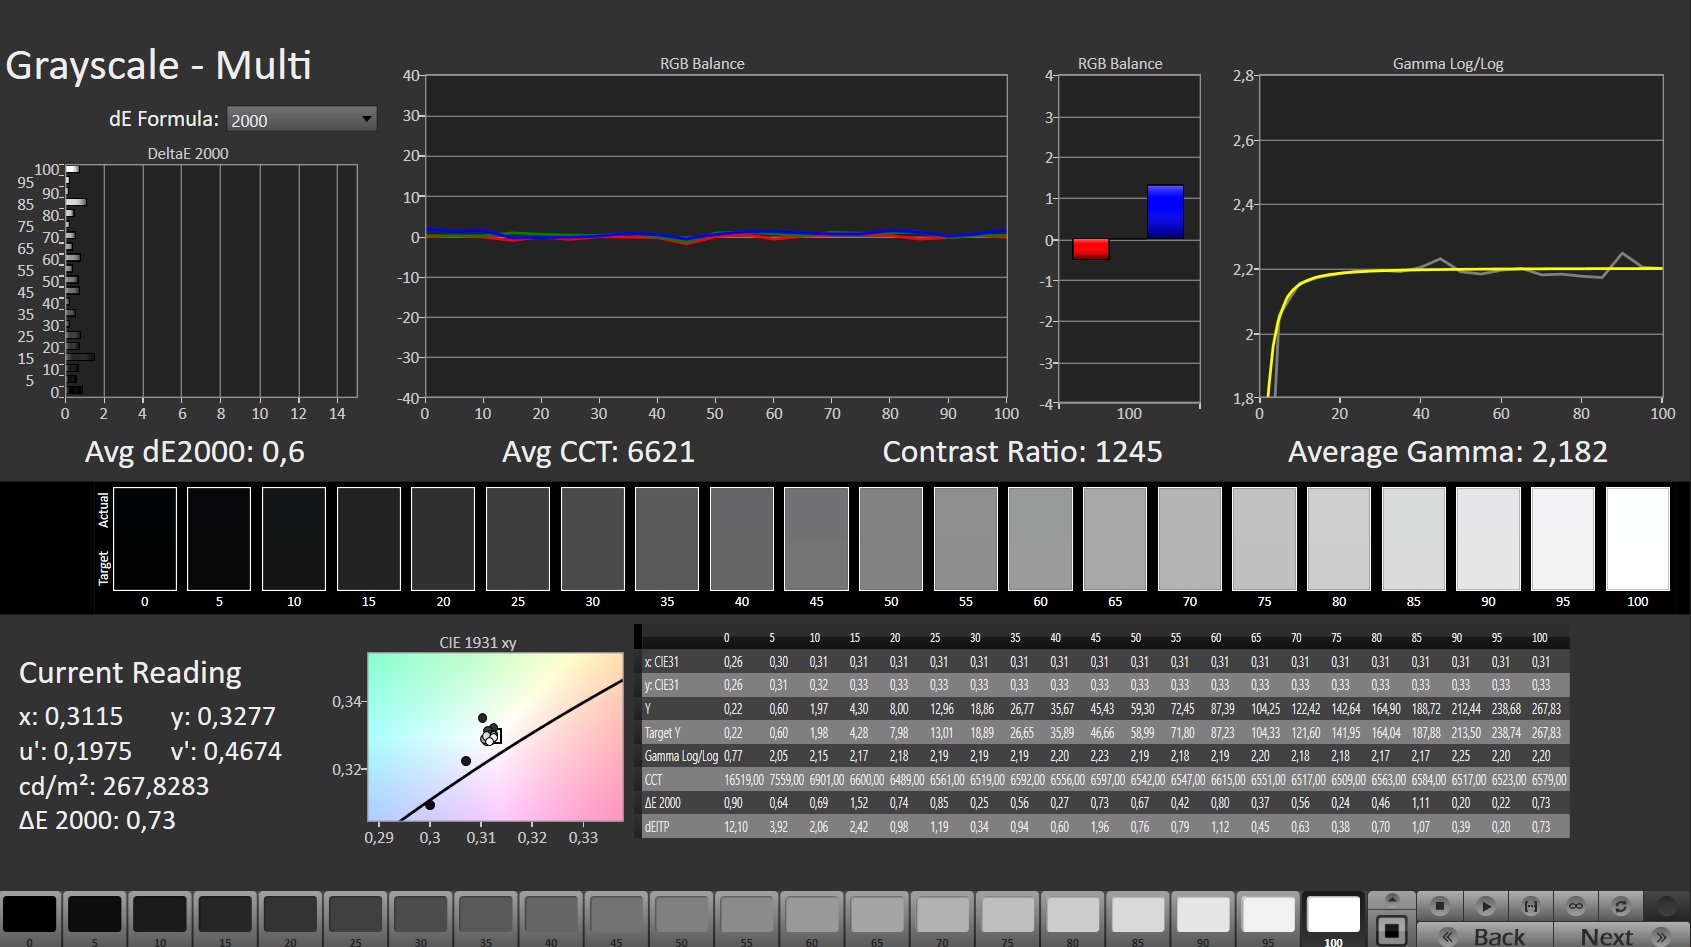
The display shows good color reproduction out of the box. The target (DeltaE < 3) is met with a value of 2.14. This minor color deviation isn't perceptible for viewers. Calibration brings about significant improvements: The grayscale is displayed in a more balanced way, and the color deviation drops to 0.67. The display can reproduce the sRGB (99.9%) and DCI-P3 (98%) color spaces almost completely, while the AdobeRGB color space is reproduced to 86%.
Note: The color profile provided changes the color reproduction to match our calibration.

Display Response Times
| ↔ Response Time Black to White | ||
|---|---|---|
| 9.4 ms ... rise ↗ and fall ↘ combined | ↗ 5 ms rise | 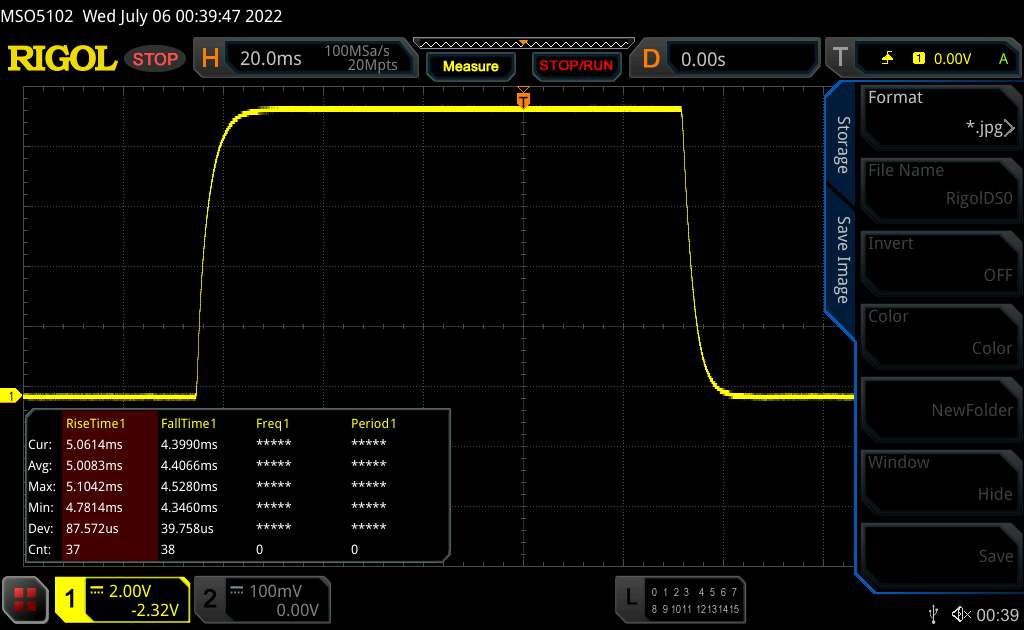 |
| ↘ 4.4 ms fall | ||
| The screen shows fast response rates in our tests and should be suited for gaming. In comparison, all tested devices range from 0.1 (minimum) to 240 (maximum) ms. » 21 % of all devices are better. This means that the measured response time is better than the average of all tested devices (21.5 ms). | ||
| ↔ Response Time 50% Grey to 80% Grey | ||
| 5.6 ms ... rise ↗ and fall ↘ combined | ↗ 2.4 ms rise | 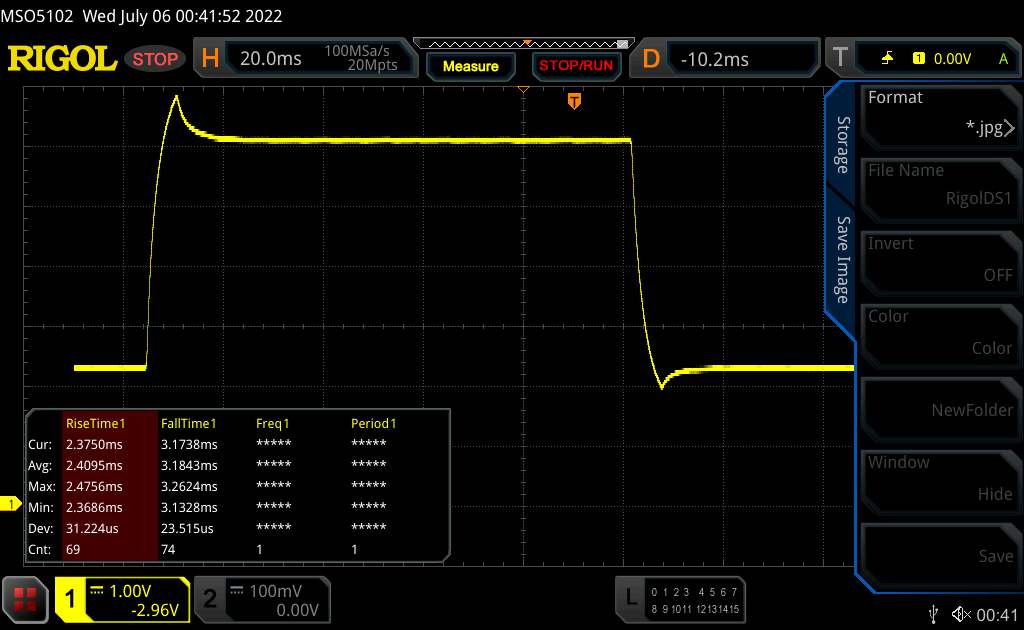 |
| ↘ 3.2 ms fall | ||
| The screen shows very fast response rates in our tests and should be very well suited for fast-paced gaming. In comparison, all tested devices range from 0.2 (minimum) to 636 (maximum) ms. » 12 % of all devices are better. This means that the measured response time is better than the average of all tested devices (33.7 ms). | ||
Screen Flickering / PWM (Pulse-Width Modulation)
| Screen flickering / PWM not detected | 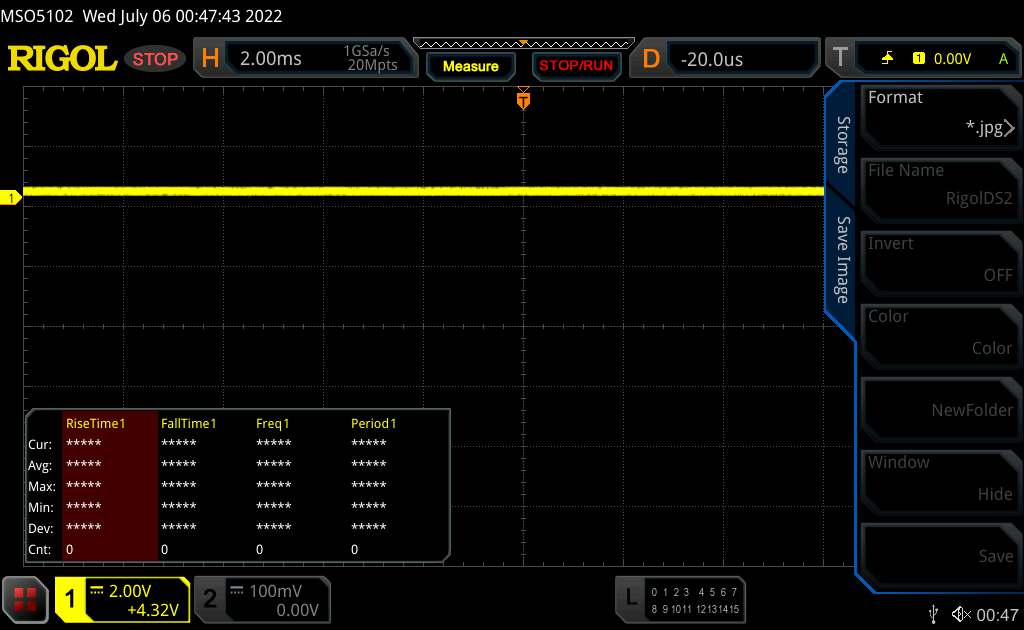 | ||
In comparison: 53 % of all tested devices do not use PWM to dim the display. If PWM was detected, an average of 17924 (minimum: 5 - maximum: 3846000) Hz was measured. | |||
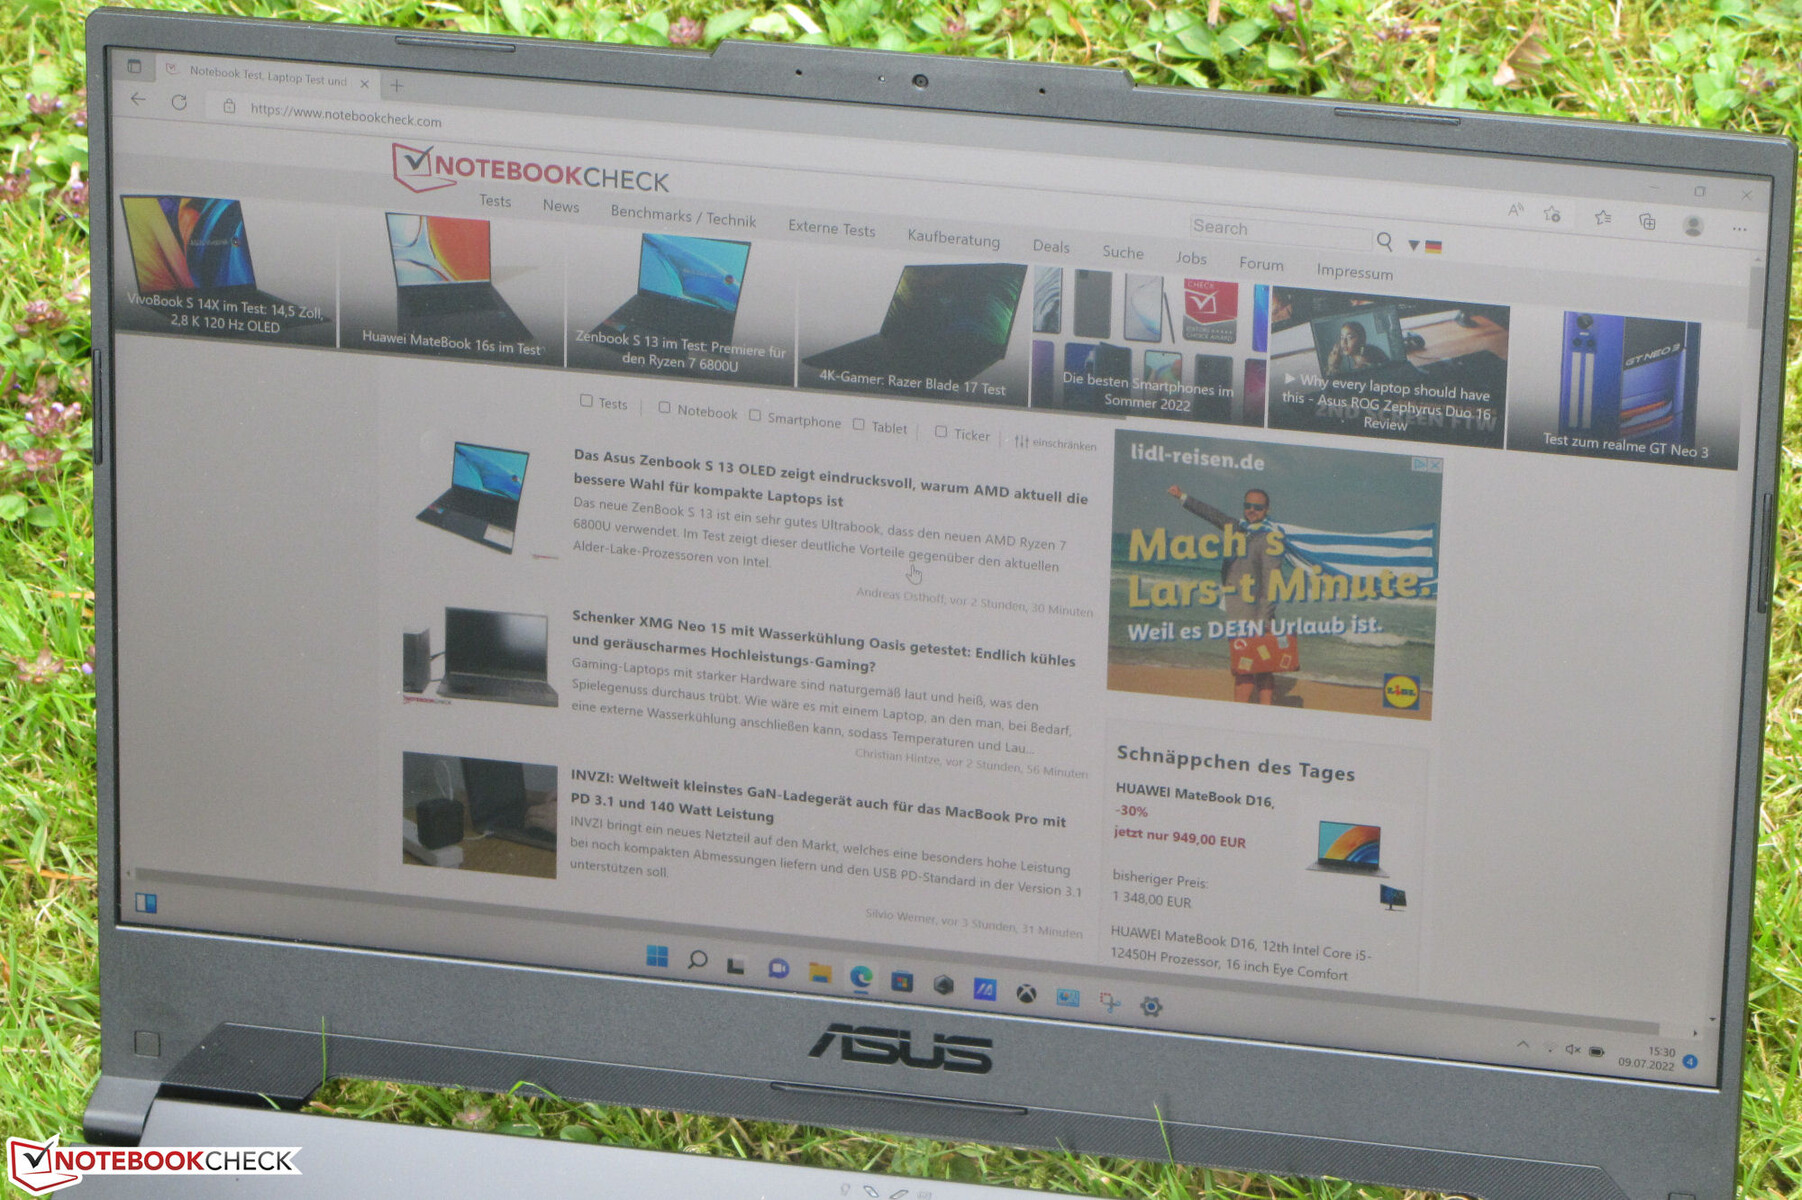
The viewing-angle stable IPS panel is legible from any position. Reading the display content outdoors is possible when the sun isn't shining too brightly.

Performance - The Asus F15 has solid mid-range hardware on board
With the TUF Dash F15, Asus has a 15.6-inch gaming laptop in its lineup that brings every modern game smoothly onto the screen.
Test conditions
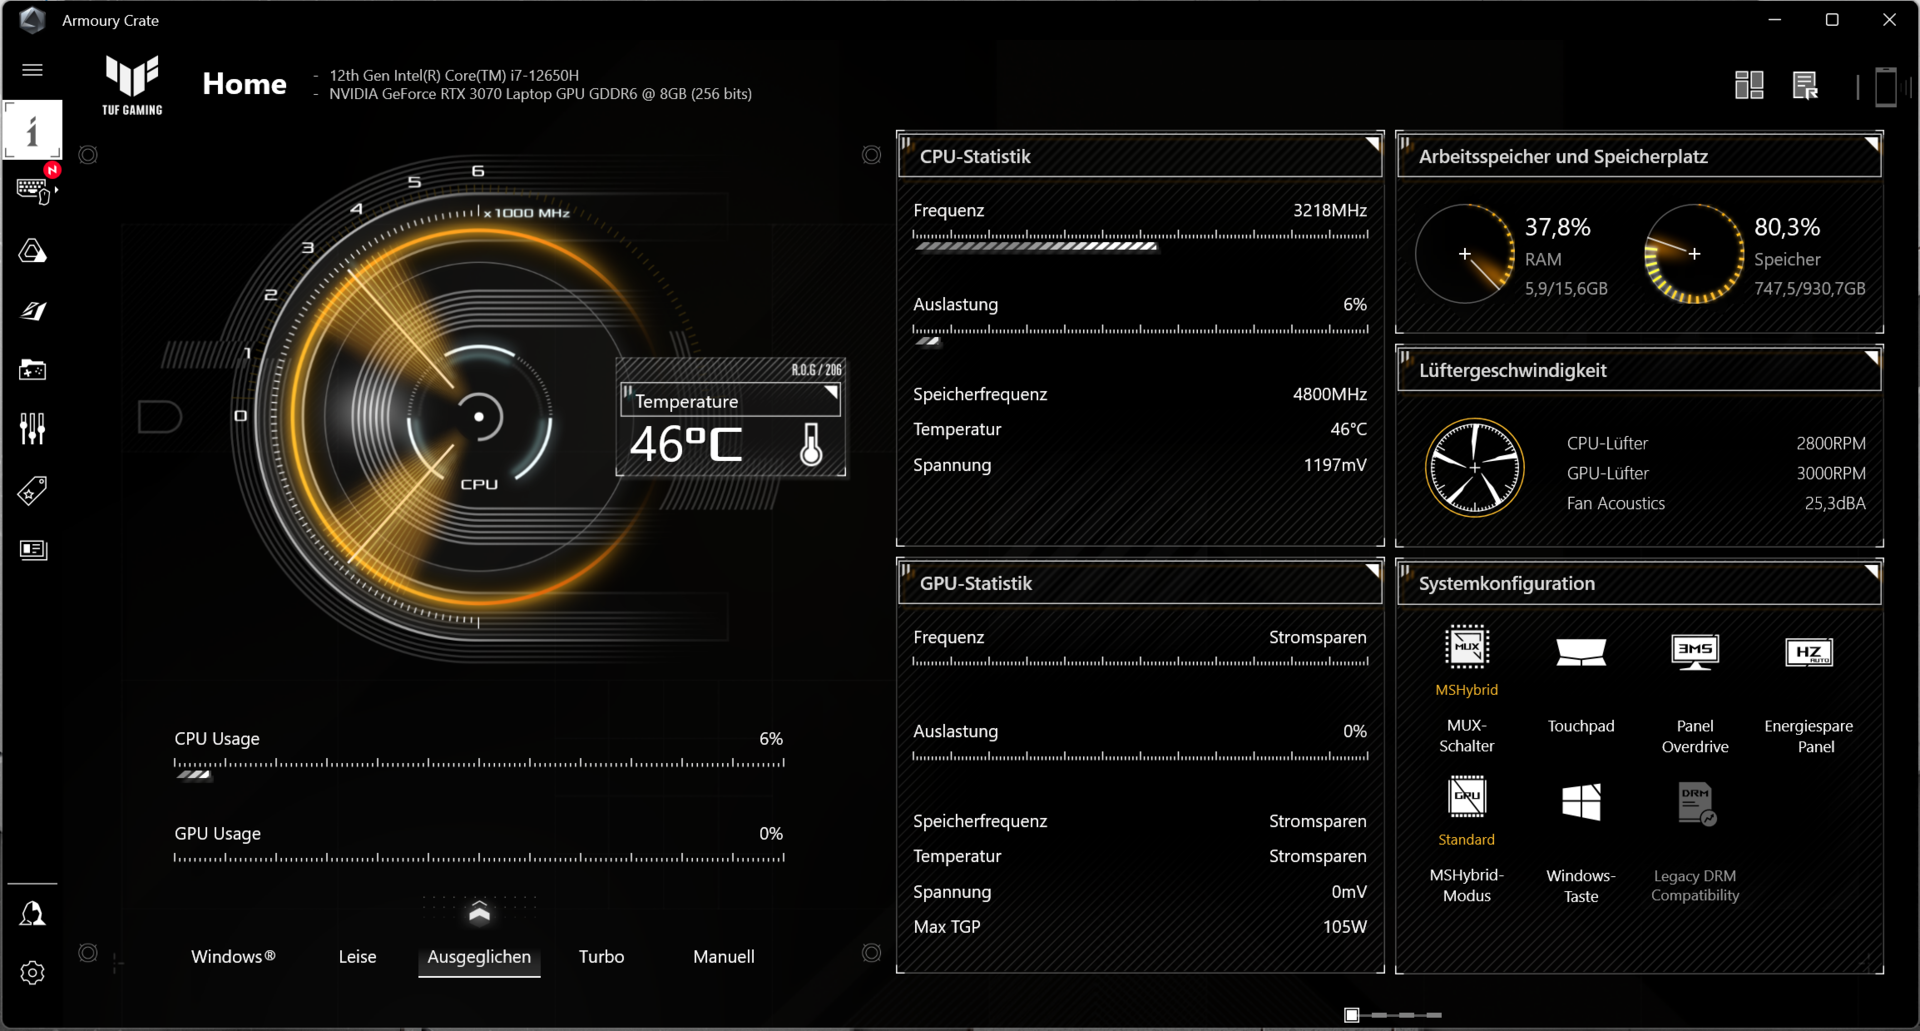
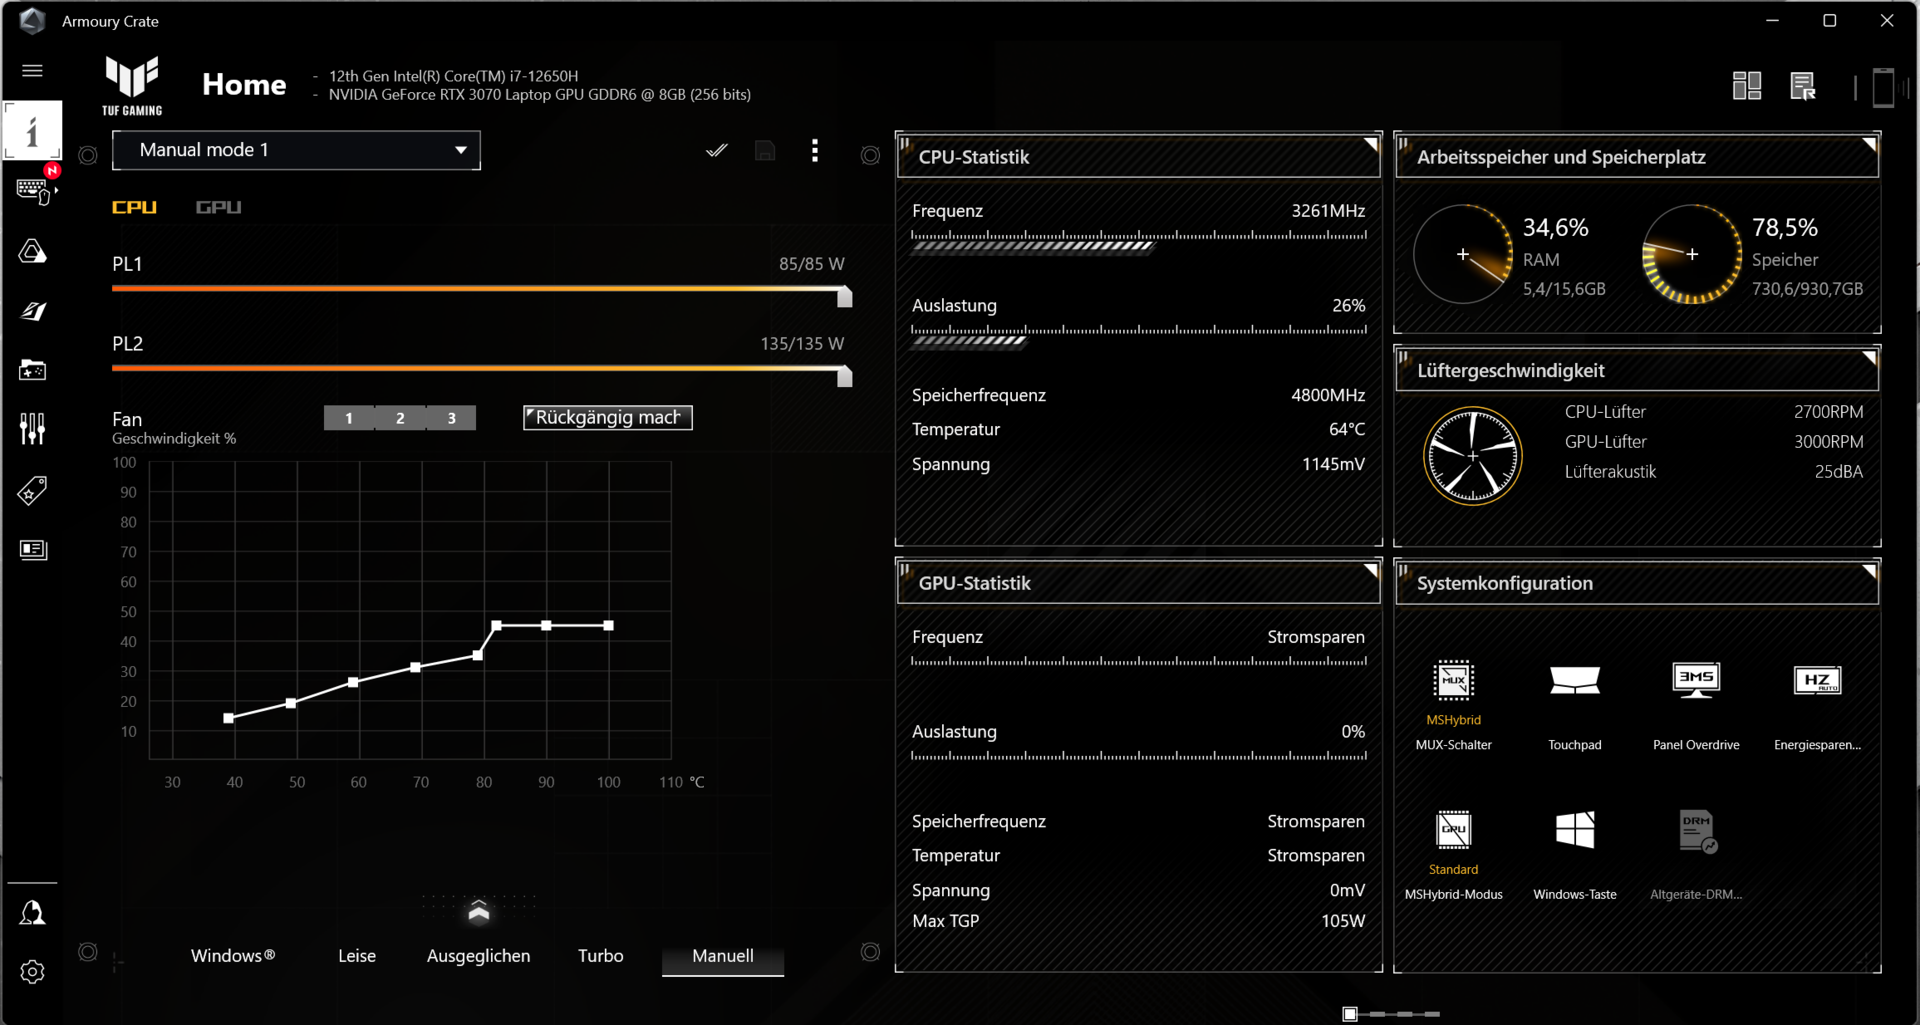
The laptop has three manufacturer-specific performance profiles ("Quiet", "Balanced", "Turbo"), between which you can toggle via the "Fn" + "F5" key combination. The "Turbo" profile can only be used when the device is plugged in. The battery tests were performed using the "Quiet" profile, and the benchmarks were run using the "Balanced" profile (often also called "Performance" depending on the version or update status).
| Turbo | Balanced | Quiet | |
|---|---|---|---|
| Power Limit 1 | 90 watts | 80 watts | 45 watts |
| Power Limit 2 | 115 watts | 100 watts | 60 watts |
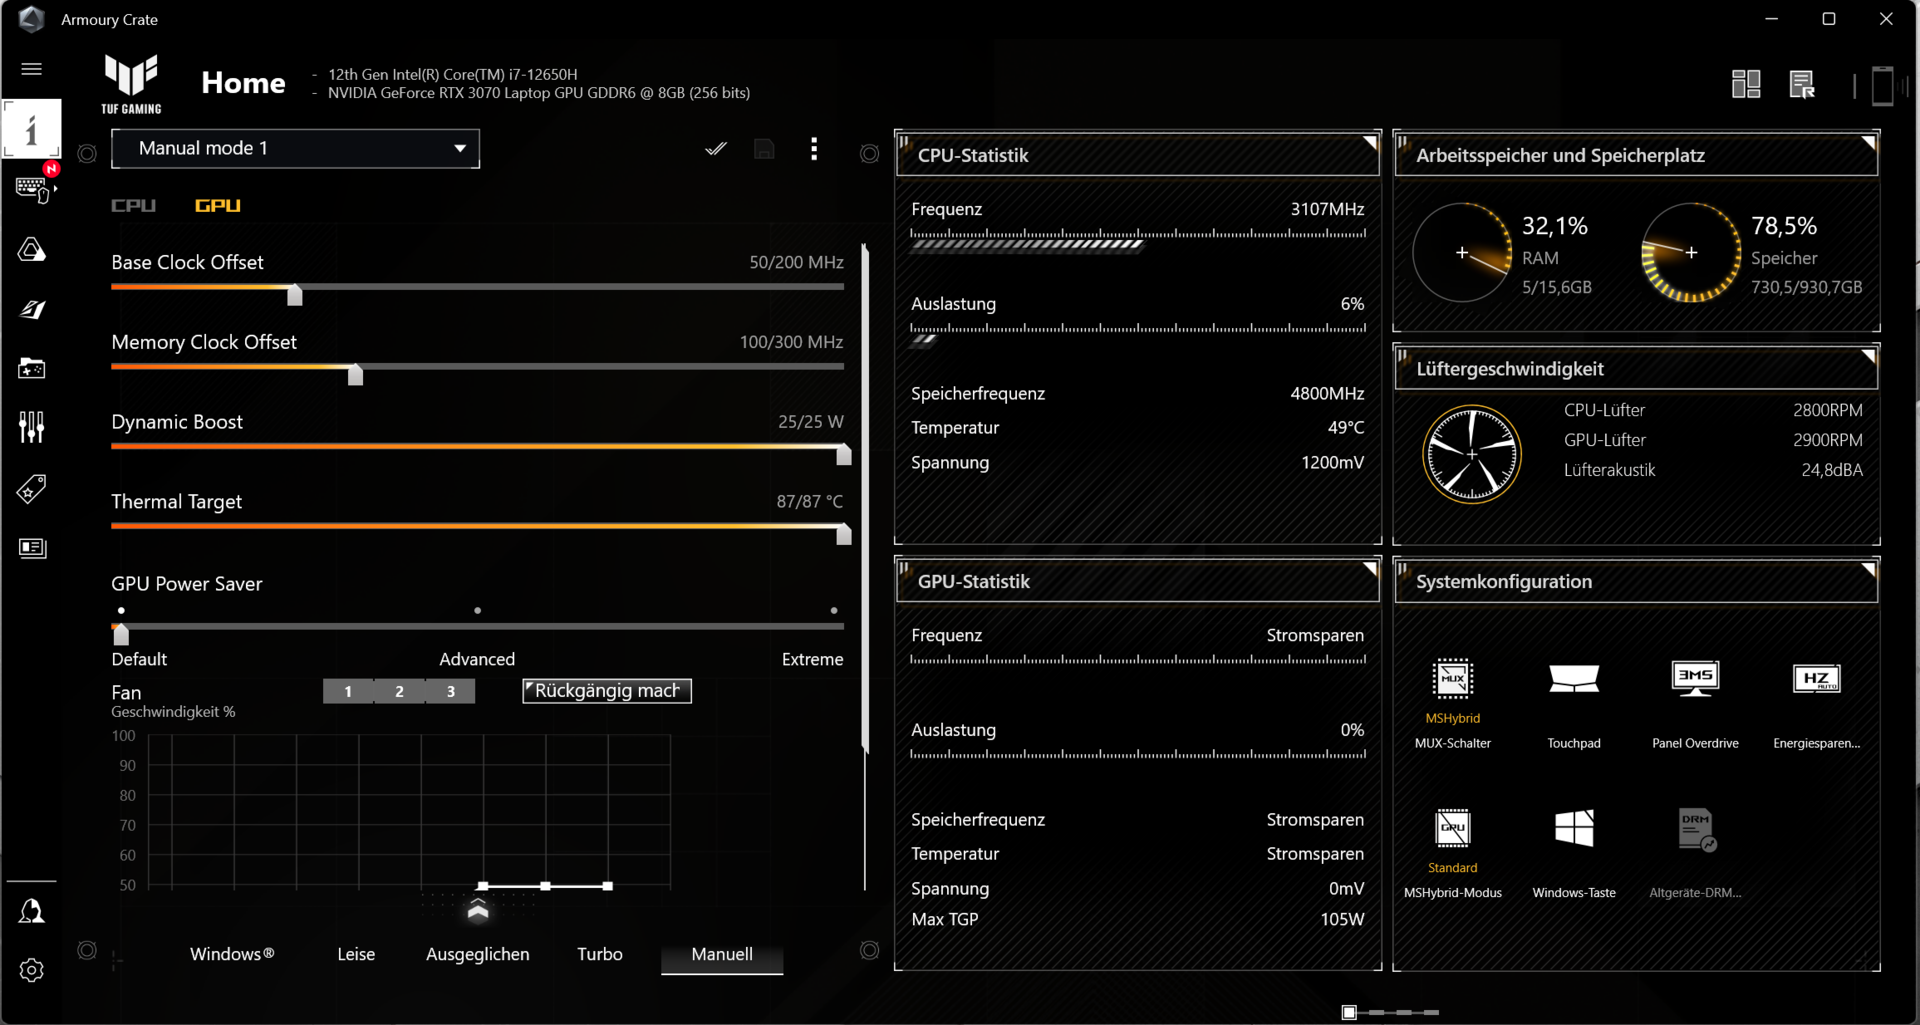
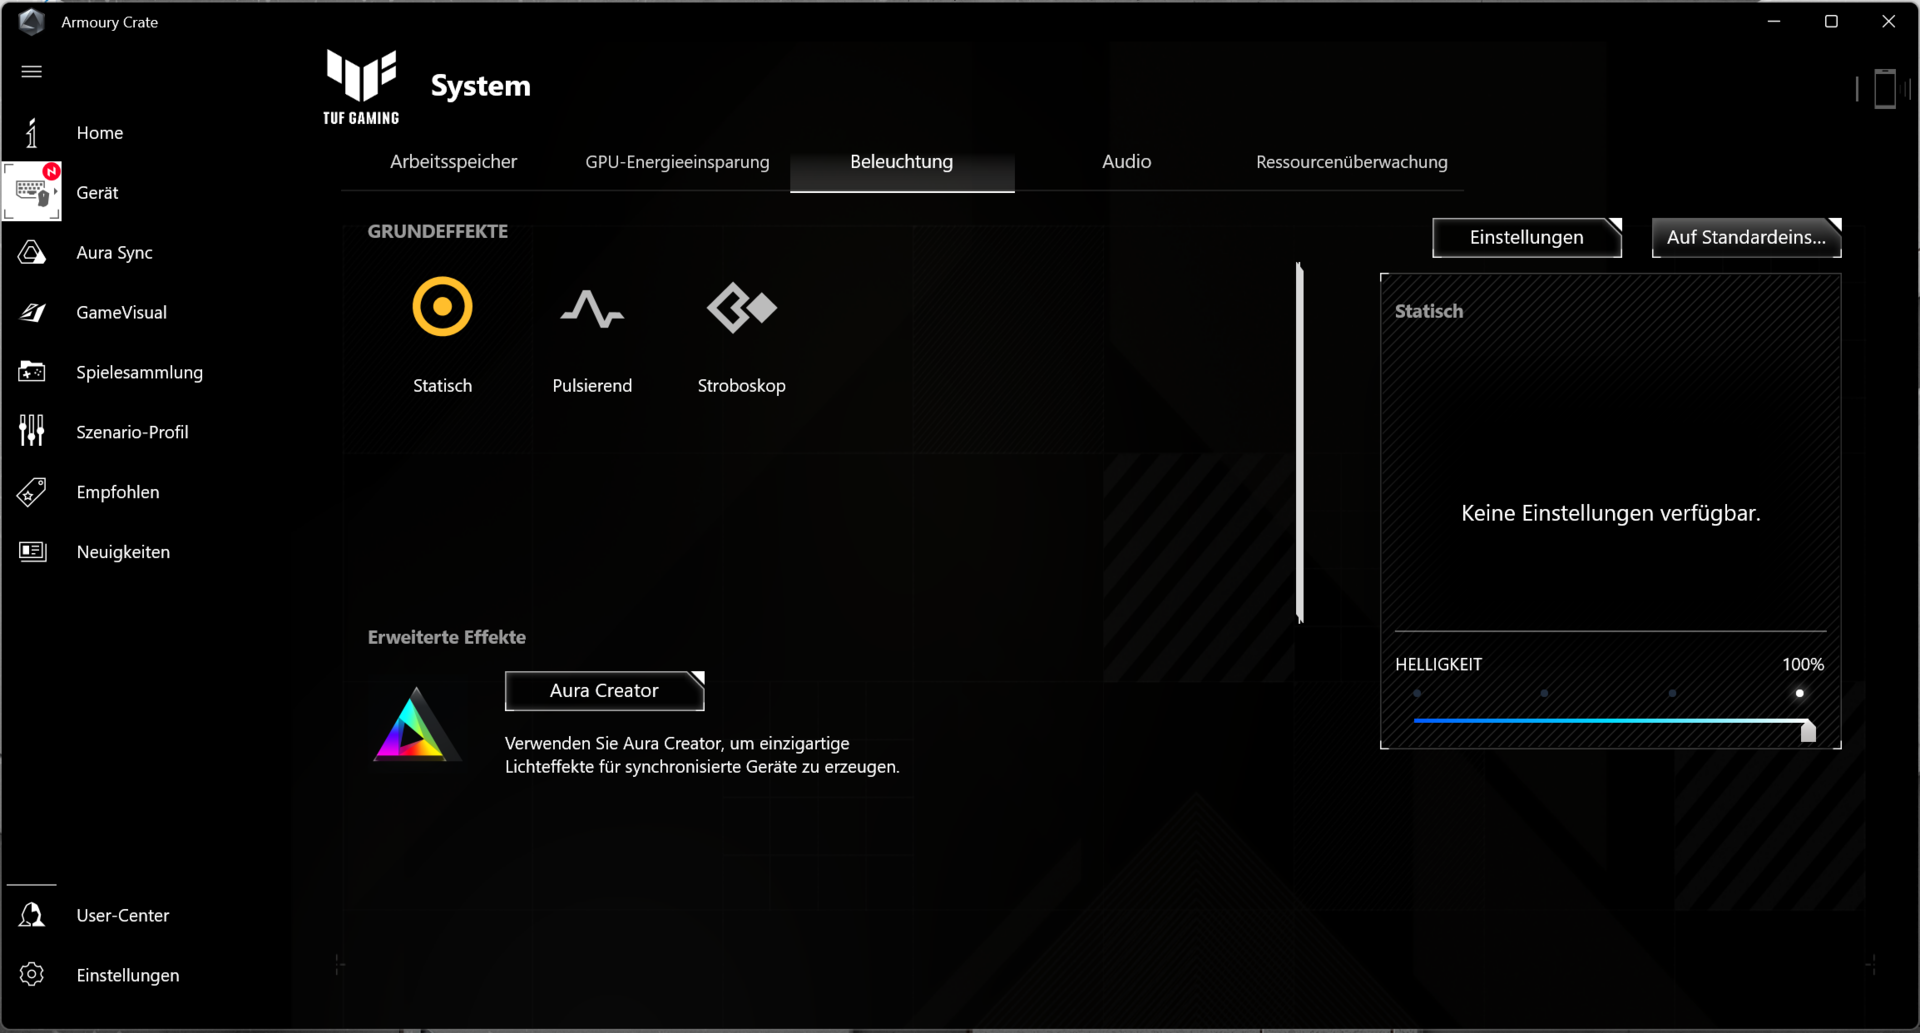
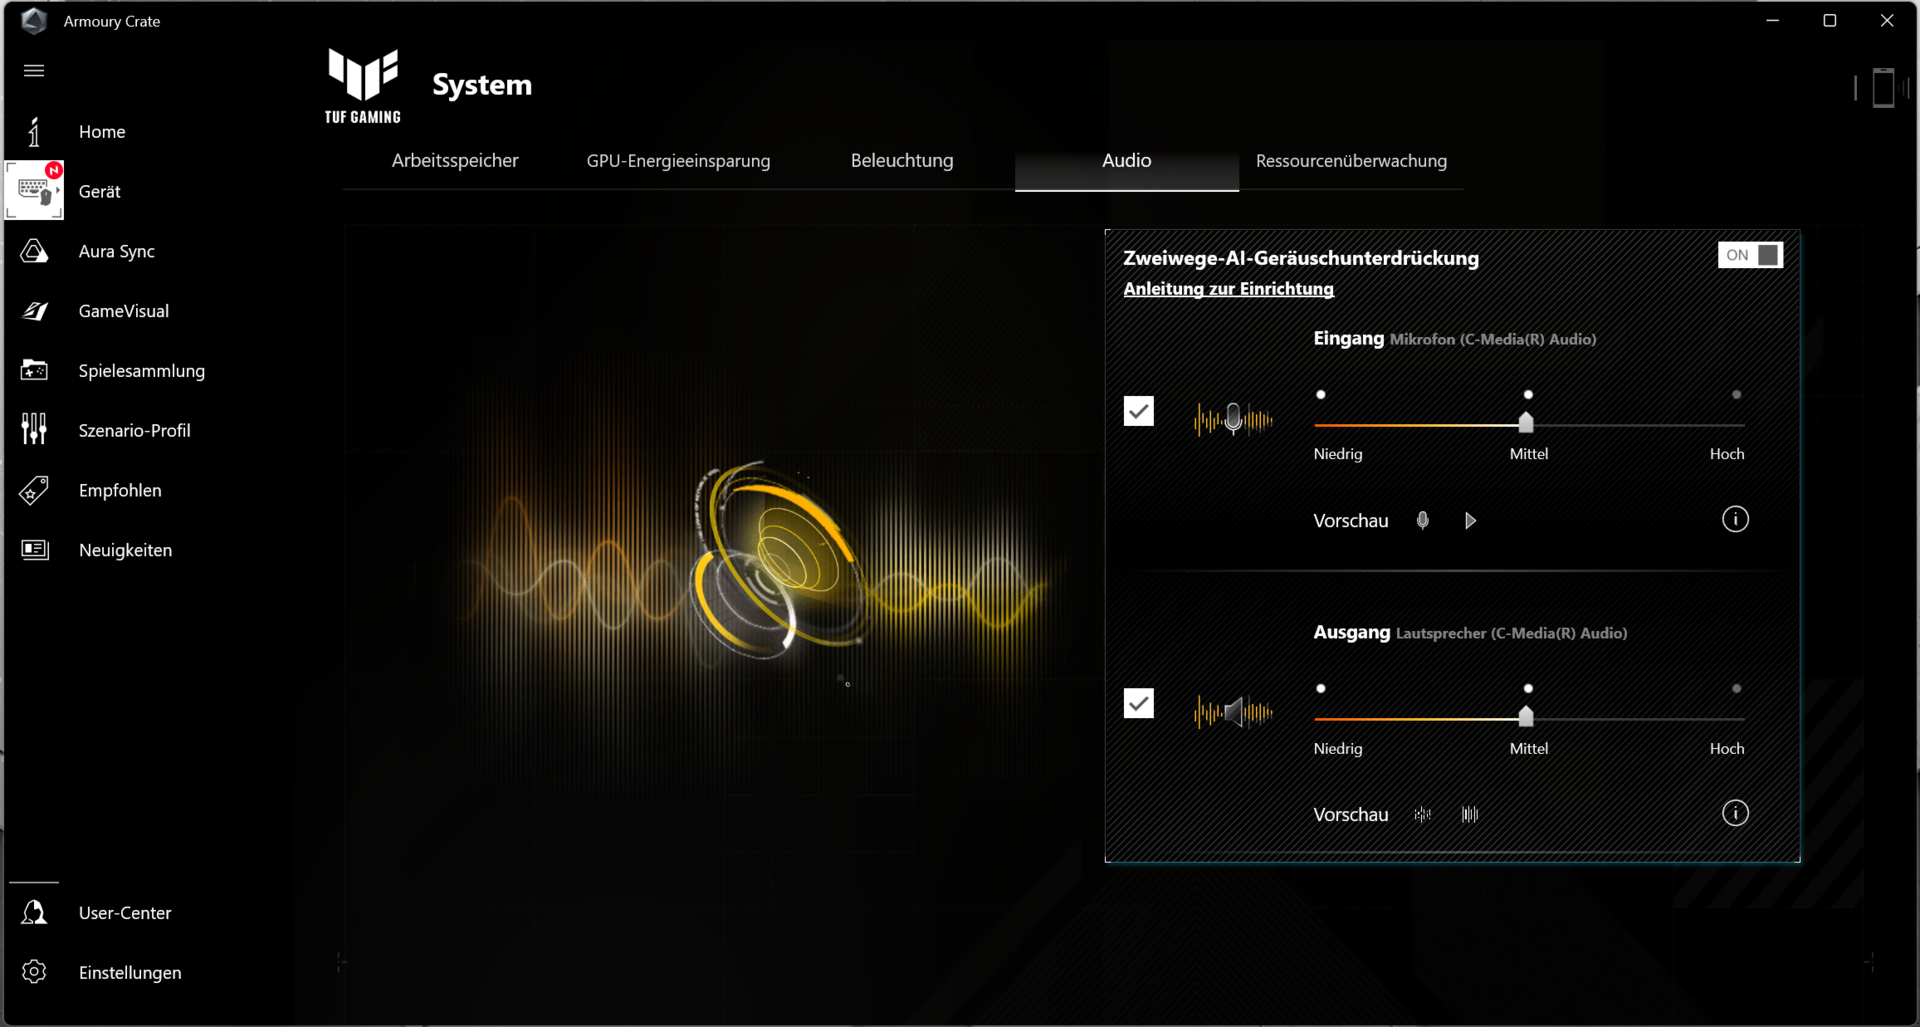
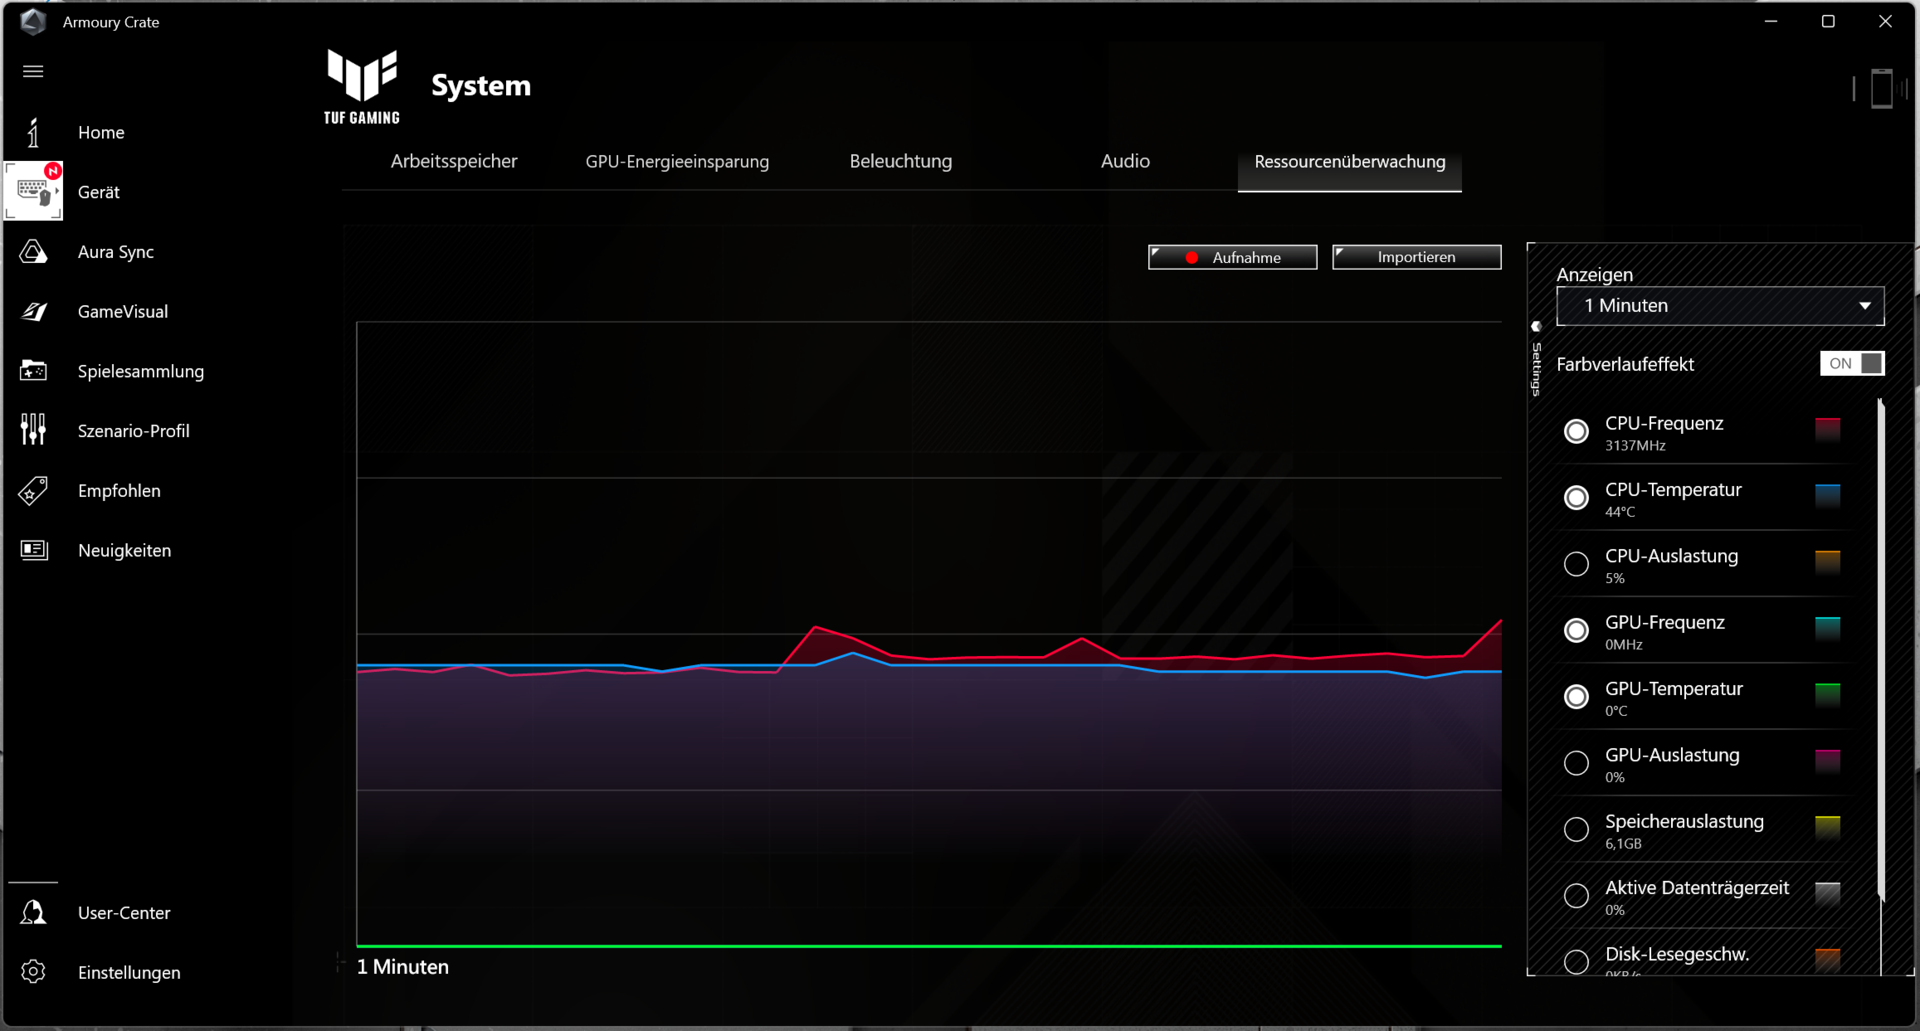
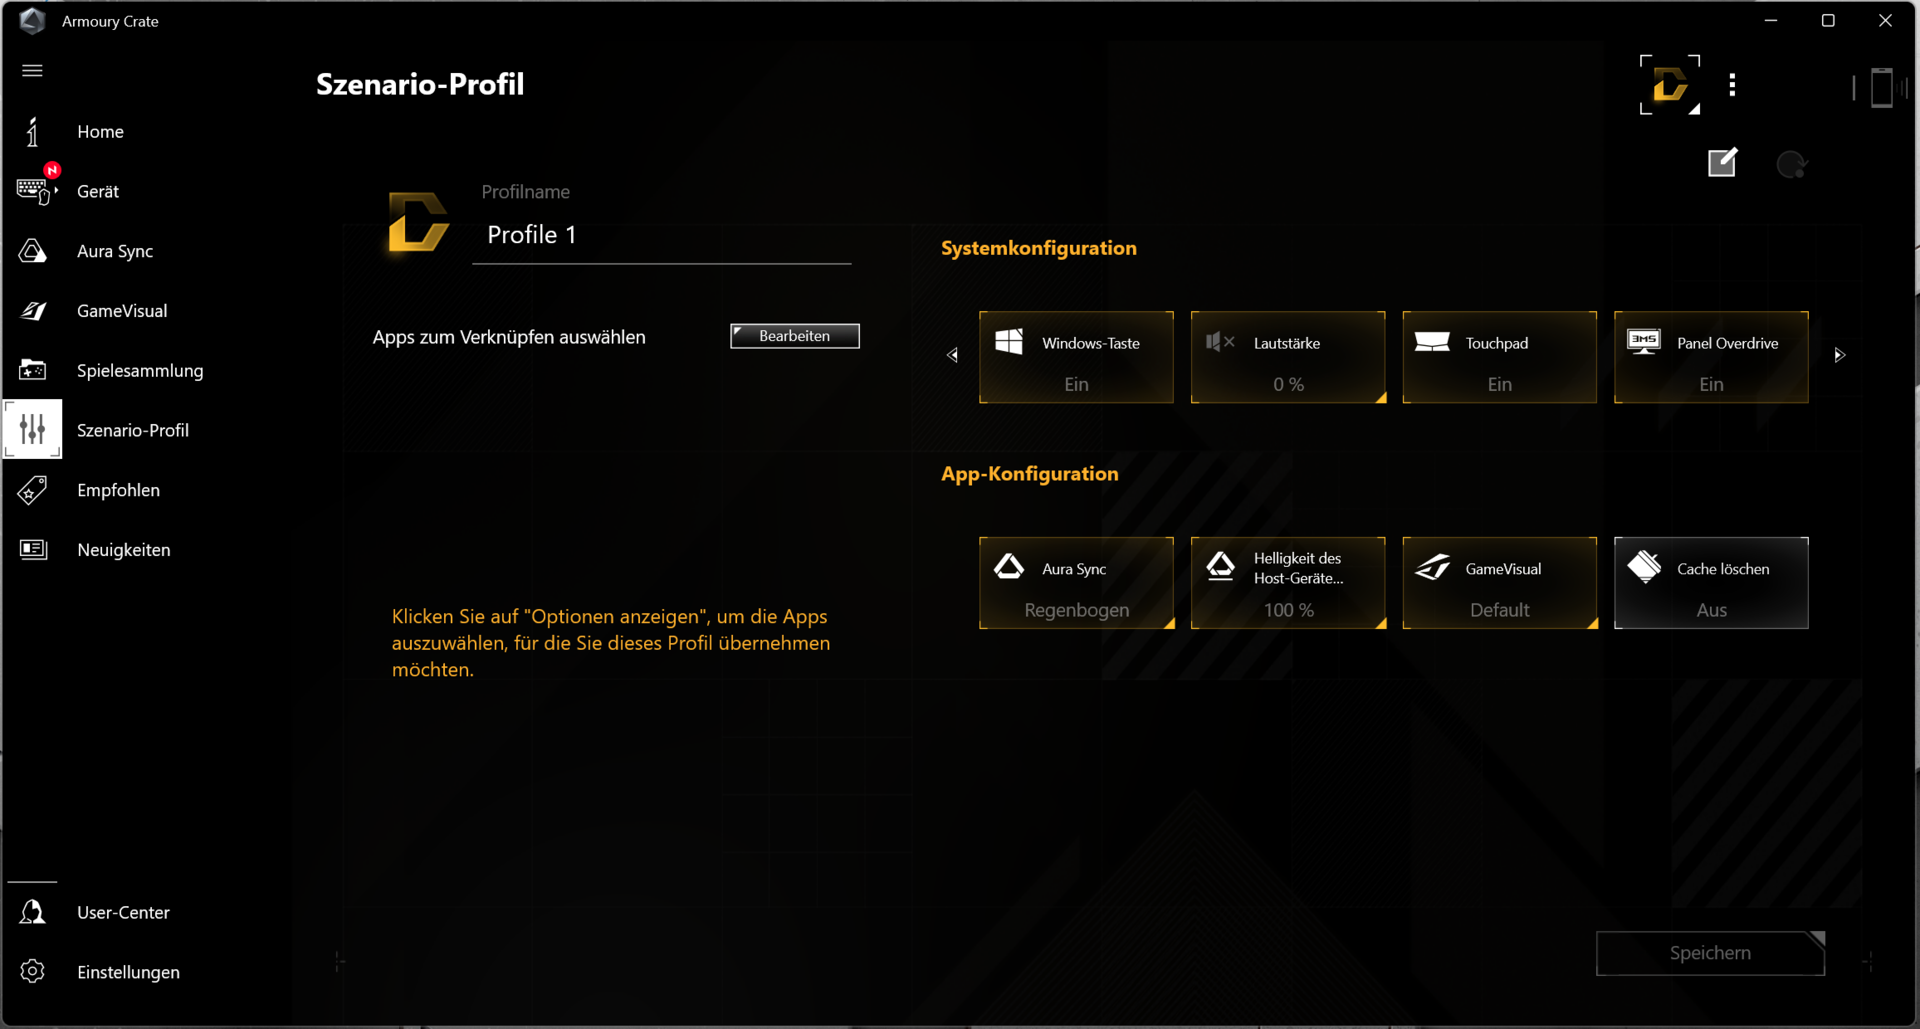
The laptop's preinstalled main control center ("Armoury Crate") allows users to create their own profiles ("Manual"). This would allow the CPU's Power Limits and the GPU's Dynamic Boost to be set individually. Overclocking the GPU and the graphics memory would also be possible.

Processor
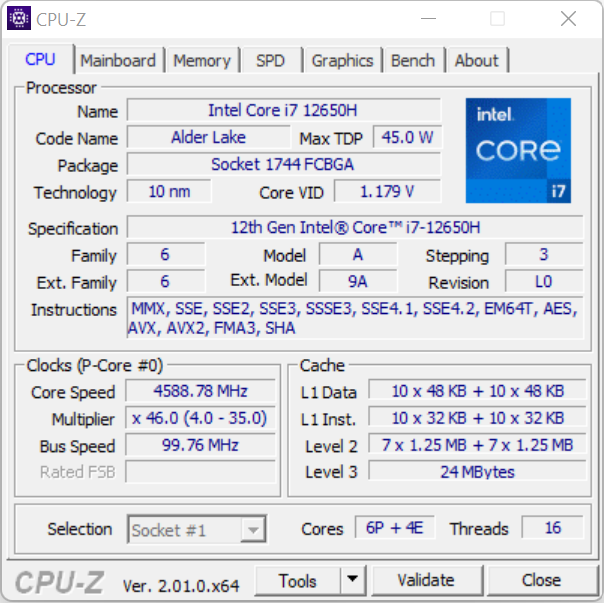
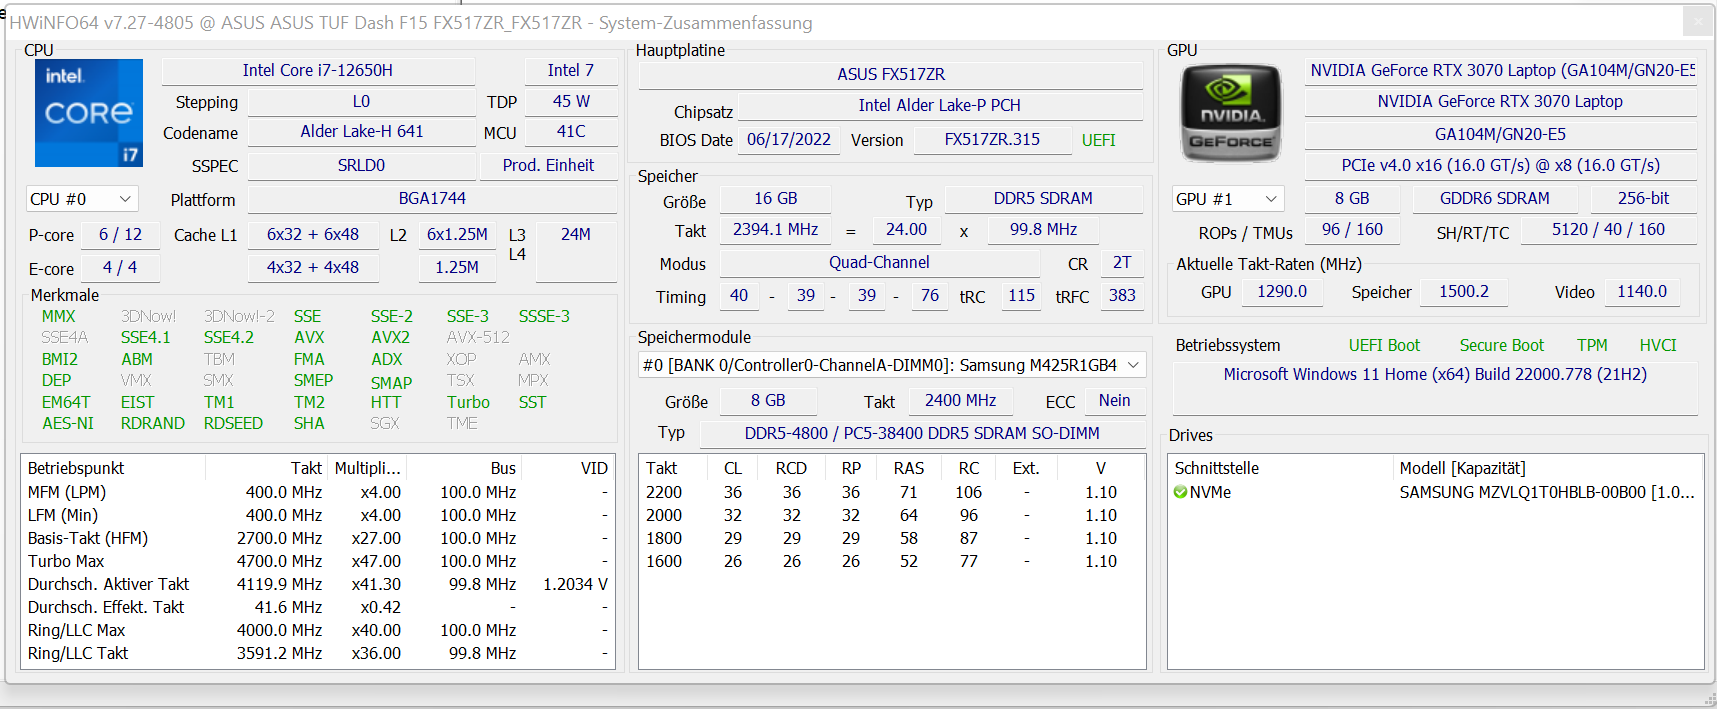
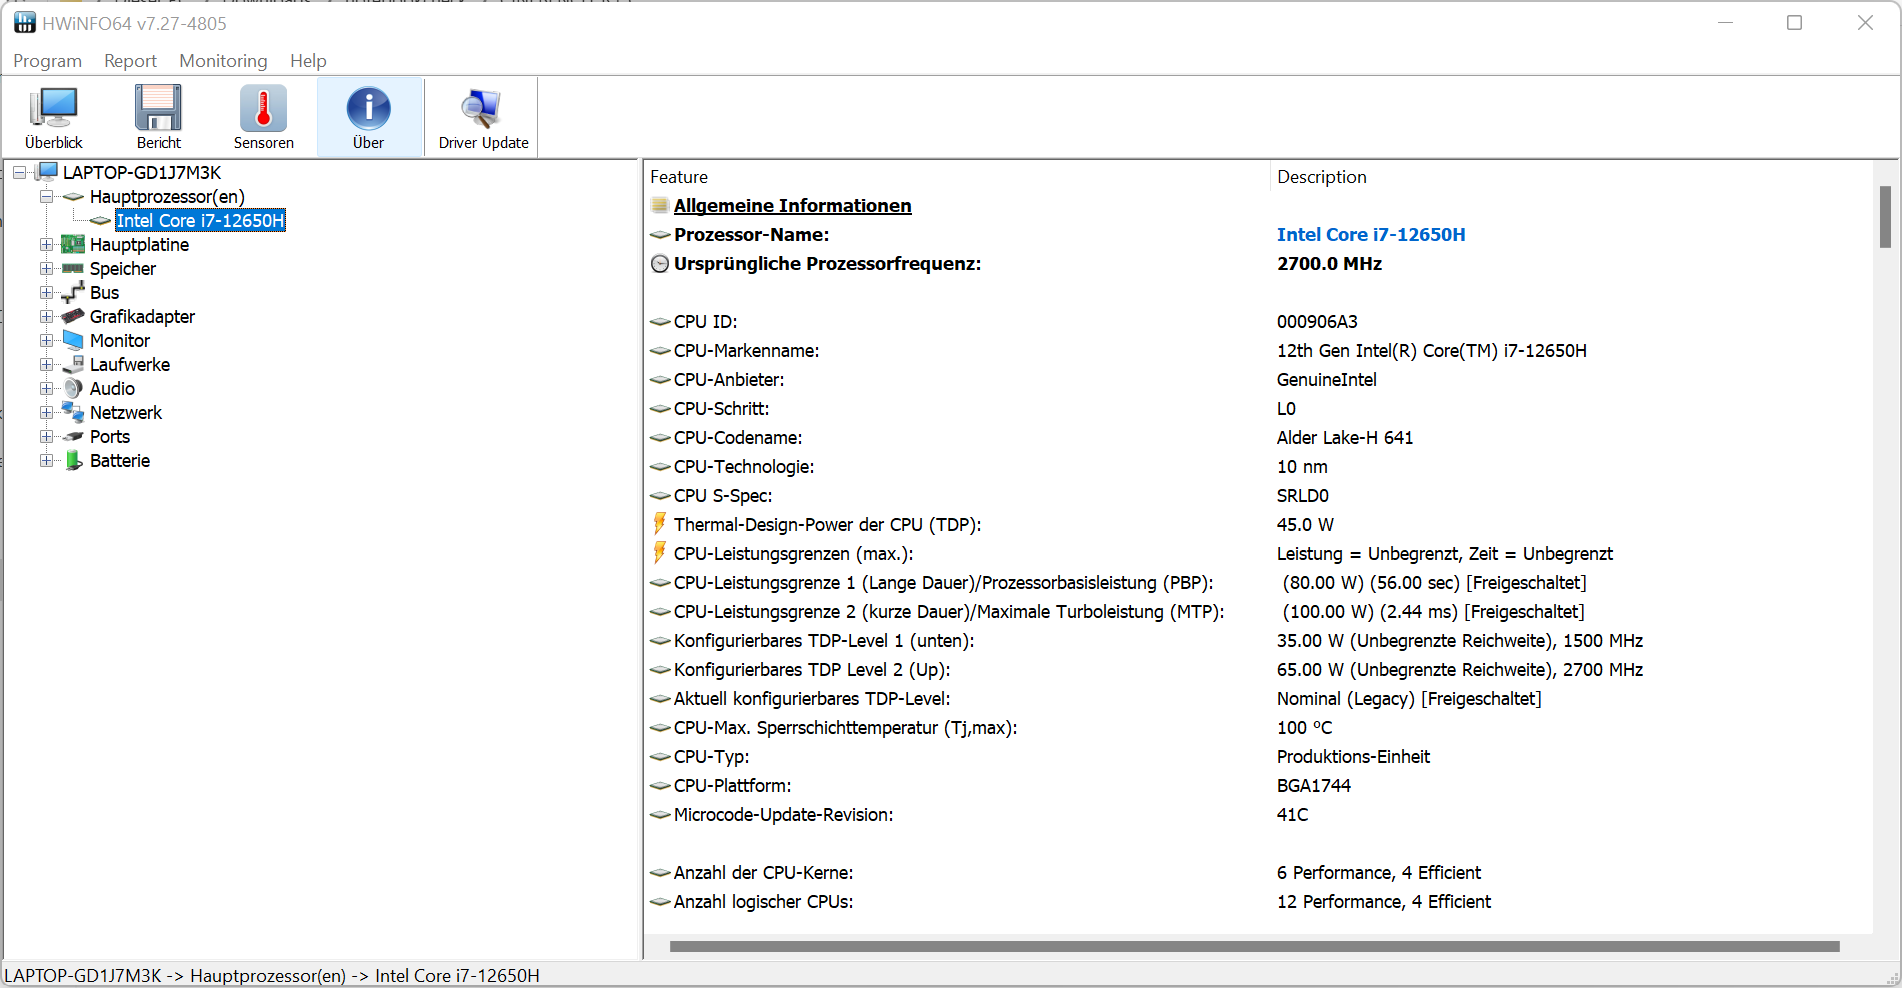
The Core-i7-12650H processor (Alder Lake) is made up of six performance cores (Hyper-Treading, 2.3 to 4.7 GHz), and four efficiency cores (no Hyper-Threading, 1.7 to 3.5 GHz). This results in a total of 16 logical CPU cores.
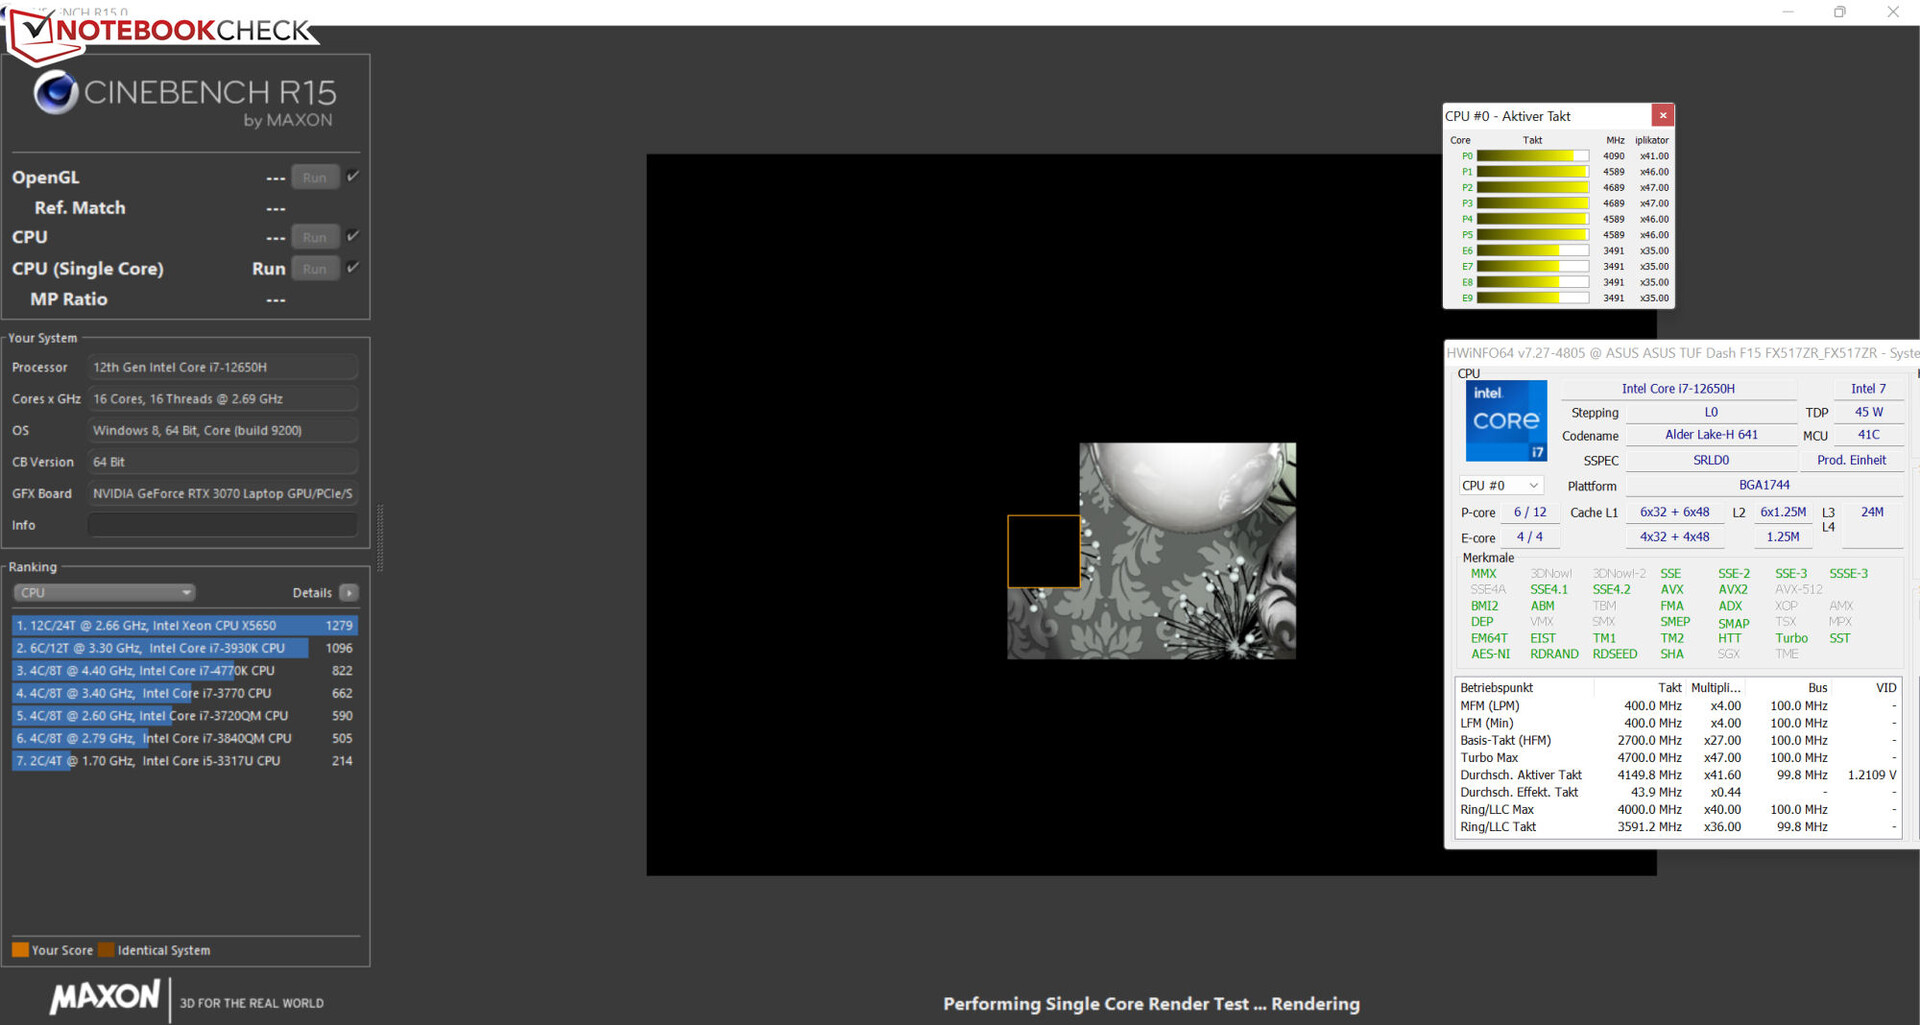
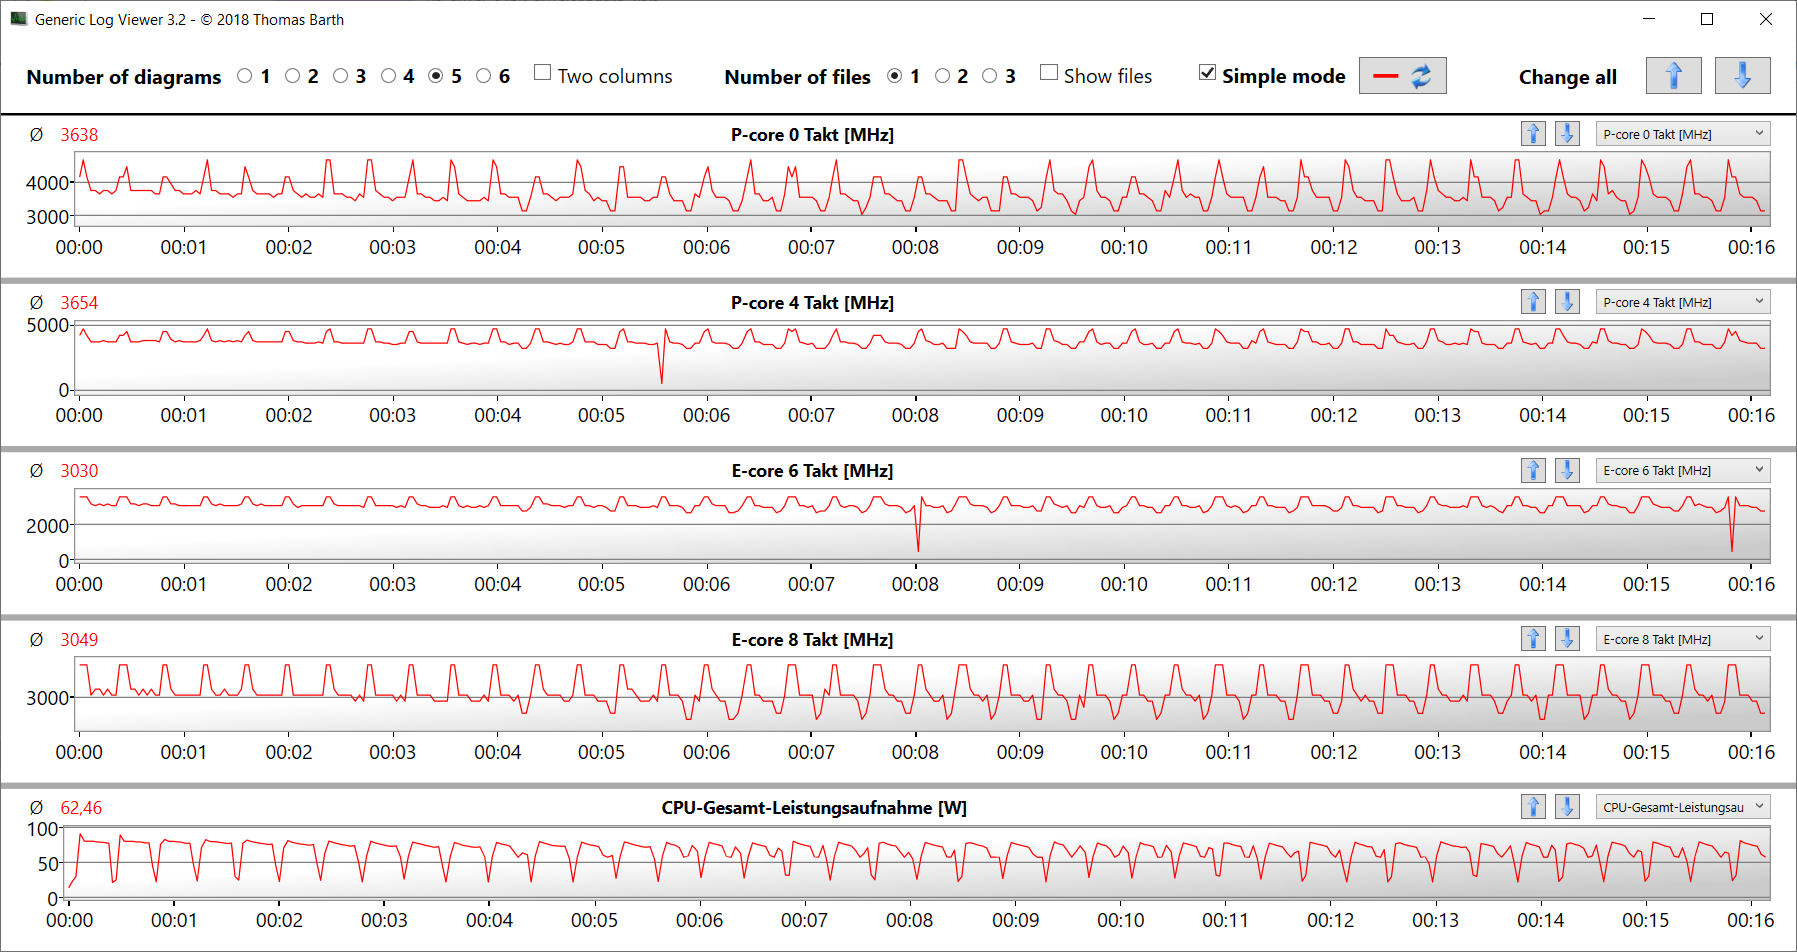
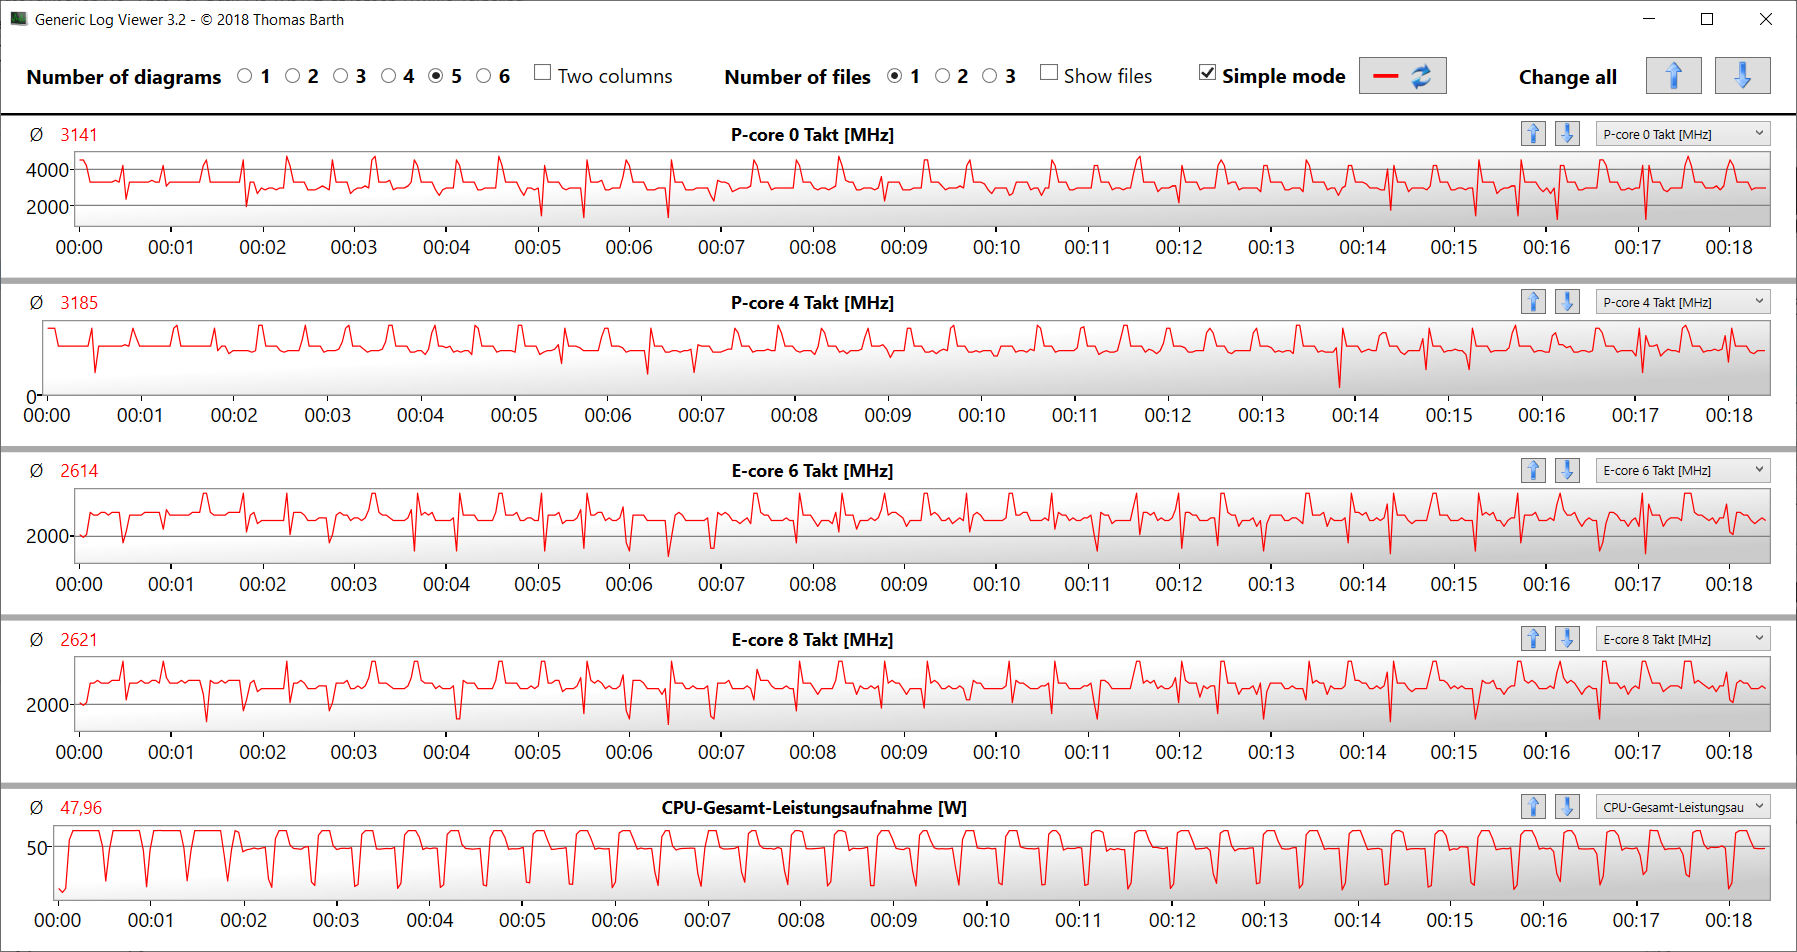
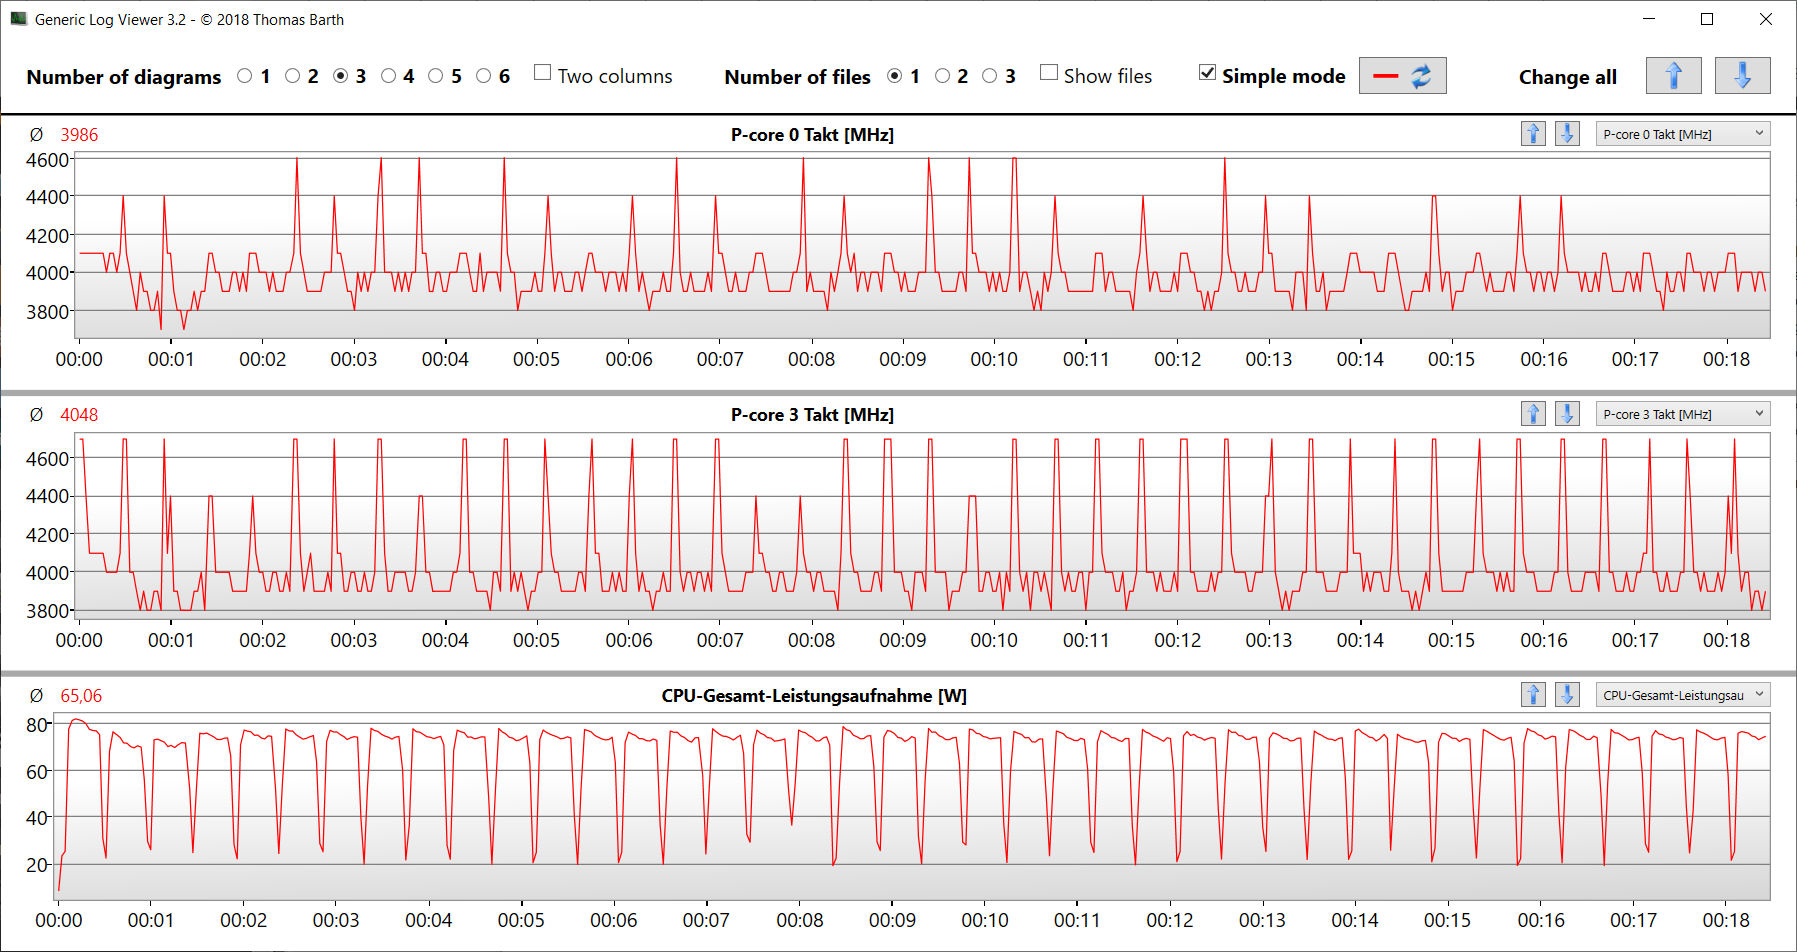
The "Balanced" performance profile provides speeds that are at the front of the Turbo range during the CB15 multithread test (P-cores: 3.6 to 3.7 GHz, E-cores: 3 to 3.1 GHz). The single-thread test is processed at high clock rates (P-cores: 4.1 to 4.6 GHz, E-cores: 3.5 GHz). On battery power, the single-thread clock rates (P-cores: 3.2 to 4.5 GHz, E-cores: 3 to 3.5 GHz) are at a similar level, while the multithread clock rates (P-cores: 2.7 GHz, E-cores: 2.4) are lower.
The laptop allows the complete deactivation of E-cores (more on that later). For this reason, we also ran some benchmarks in this state. The results can be found in the comparison tables.
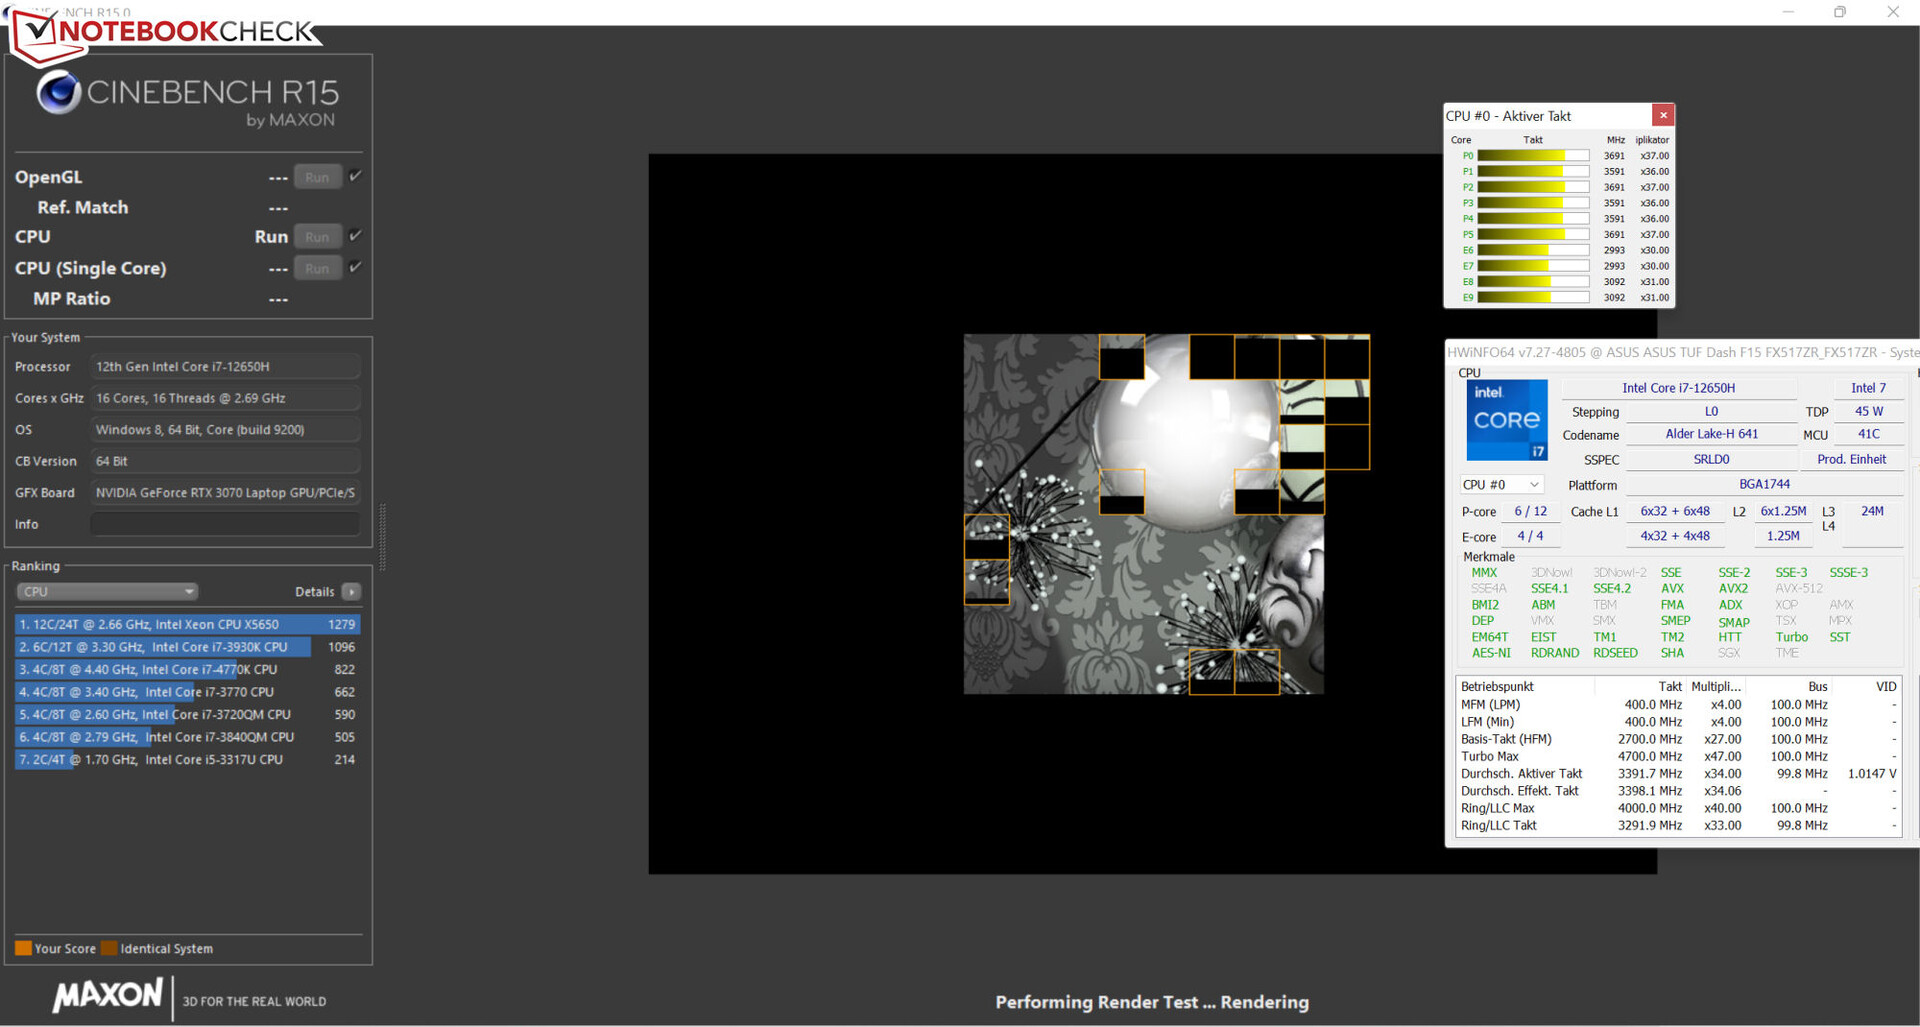
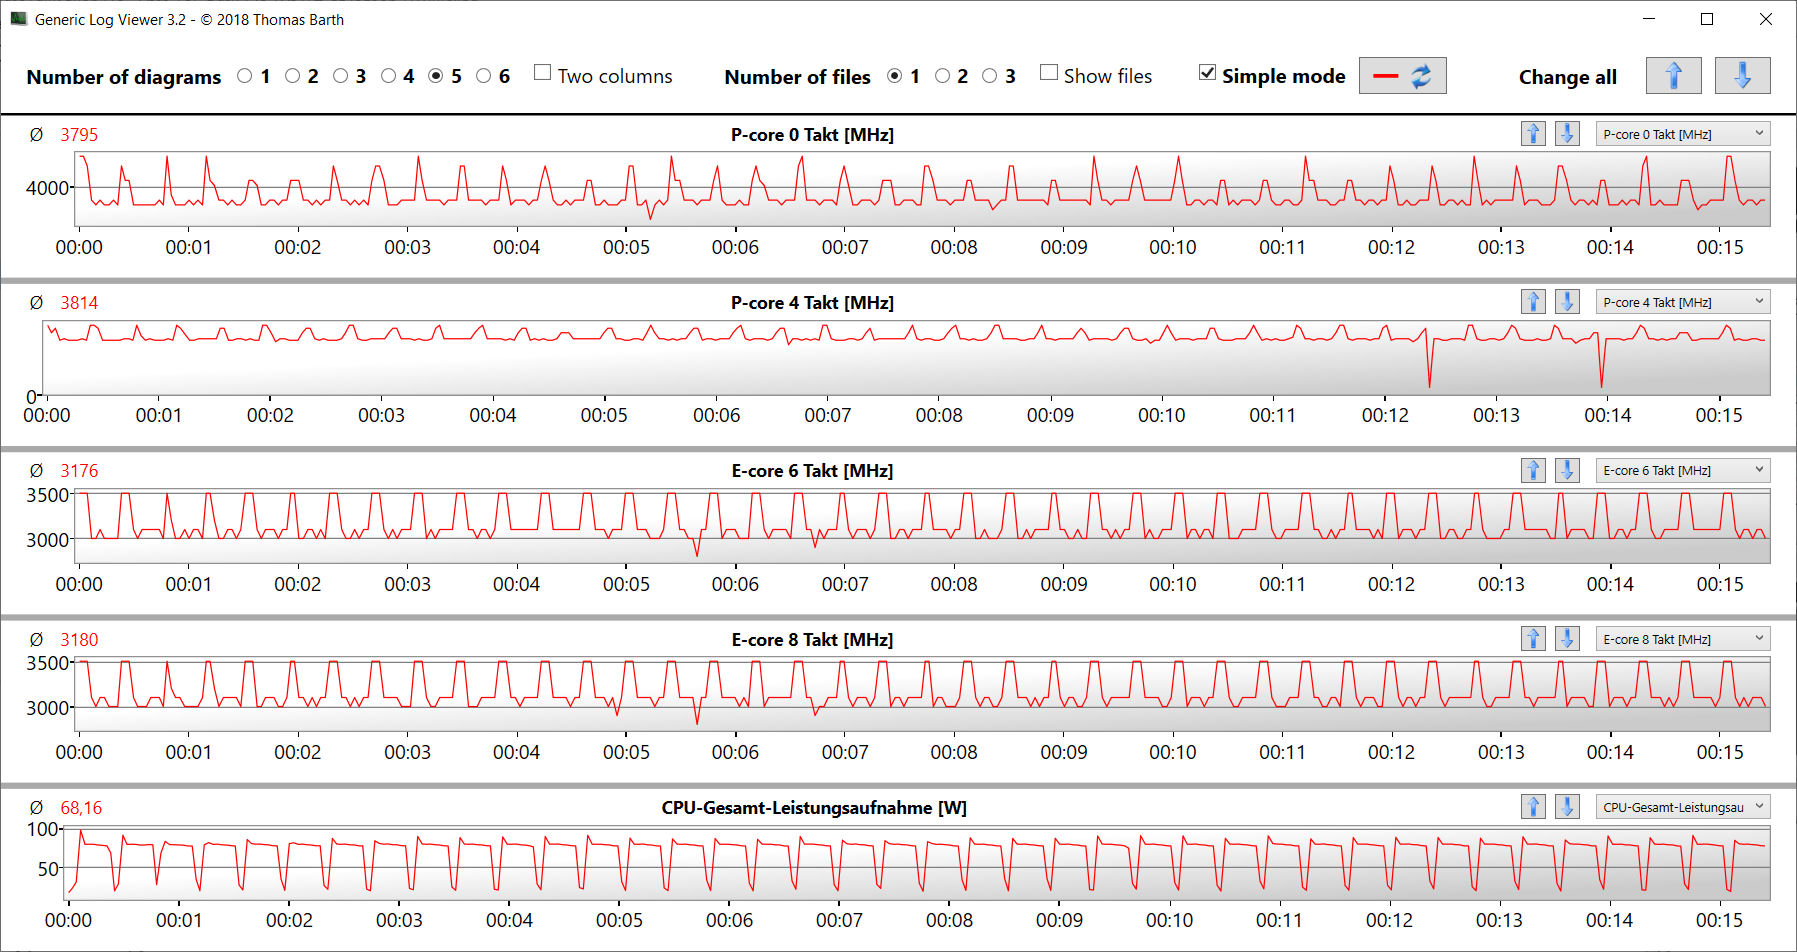
We verify if the CPU Turbo is consistently used when plugged in by running the Cinebench R15 benchmark's multithread test in a loop. High clock rates can be maintained over longer periods of time. The "Turbo" profile ensures a smoother performance development at a slightly higher level.
Cinebench R15 Multi endurance test
| CPU Performance Rating - Percent | |
| Average of class Gaming | |
| HP Omen 16-b1090ng | |
| Acer Nitro 5 AN515-58-72QR | |
| Asus TUF Dash F15 FX517ZR | |
| Asus TUF Dash F15 FX517ZR | |
| Asus TUF Dash F15 FX517ZR | |
| Asus TUF Dash F15 FX517ZR | |
| Average Intel Core i7-12650H | |
| MSI Delta 15 A5EFK | |
| Razer Blade 15 Base Edition 2021, i7-10750H RTX 3060 | |
| Cinebench R23 | |
| Multi Core | |
| Average of class Gaming (2435 - 34613, n=229, last 2 years) | |
| Acer Nitro 5 AN515-58-72QR | |
| HP Omen 16-b1090ng | |
| Asus TUF Dash F15 FX517ZR (Turbo) | |
| Asus TUF Dash F15 FX517ZR | |
| Asus TUF Dash F15 FX517ZR (Leise) | |
| MSI Delta 15 A5EFK | |
| Asus TUF Dash F15 FX517ZR (P-Cores only, Turbo) | |
| Average Intel Core i7-12650H (5362 - 15537, n=14) | |
| Razer Blade 15 Base Edition 2021, i7-10750H RTX 3060 | |
| Single Core | |
| Acer Nitro 5 AN515-58-72QR | |
| Average of class Gaming (527 - 2235, n=227, last 2 years) | |
| Asus TUF Dash F15 FX517ZR | |
| HP Omen 16-b1090ng | |
| Asus TUF Dash F15 FX517ZR (Turbo) | |
| Asus TUF Dash F15 FX517ZR (Leise) | |
| Asus TUF Dash F15 FX517ZR (P-Cores only, Turbo) | |
| Average Intel Core i7-12650H (1428 - 1808, n=14) | |
| MSI Delta 15 A5EFK | |
| Razer Blade 15 Base Edition 2021, i7-10750H RTX 3060 | |
| Cinebench R20 | |
| CPU (Multi Core) | |
| Average of class Gaming (930 - 13769, n=227, last 2 years) | |
| Acer Nitro 5 AN515-58-72QR | |
| HP Omen 16-b1090ng | |
| Asus TUF Dash F15 FX517ZR (Turbo) | |
| Asus TUF Dash F15 FX517ZR | |
| Asus TUF Dash F15 FX517ZR (Leise) | |
| MSI Delta 15 A5EFK | |
| Asus TUF Dash F15 FX517ZR (P-Cores only, Turbo) | |
| Average Intel Core i7-12650H (2106 - 6009, n=14) | |
| Razer Blade 15 Base Edition 2021, i7-10750H RTX 3060 | |
| CPU (Single Core) | |
| Average of class Gaming (169 - 855, n=227, last 2 years) | |
| Asus TUF Dash F15 FX517ZR | |
| HP Omen 16-b1090ng | |
| Acer Nitro 5 AN515-58-72QR | |
| Asus TUF Dash F15 FX517ZR (Turbo) | |
| Asus TUF Dash F15 FX517ZR (Leise) | |
| Asus TUF Dash F15 FX517ZR (P-Cores only, Turbo) | |
| Average Intel Core i7-12650H (552 - 696, n=14) | |
| MSI Delta 15 A5EFK | |
| Razer Blade 15 Base Edition 2021, i7-10750H RTX 3060 | |
| Cinebench R15 | |
| CPU Multi 64Bit | |
| Average of class Gaming (400 - 5663, n=231, last 2 years) | |
| HP Omen 16-b1090ng | |
| Acer Nitro 5 AN515-58-72QR | |
| Asus TUF Dash F15 FX517ZR (Turbo) | |
| Asus TUF Dash F15 FX517ZR | |
| MSI Delta 15 A5EFK | |
| Asus TUF Dash F15 FX517ZR (Leise) | |
| Asus TUF Dash F15 FX517ZR (P-Cores only, Turbo) | |
| Average Intel Core i7-12650H (753 - 2253, n=14) | |
| Razer Blade 15 Base Edition 2021, i7-10750H RTX 3060 | |
| CPU Single 64Bit | |
| Average of class Gaming (79.2 - 318, n=230, last 2 years) | |
| Acer Nitro 5 AN515-58-72QR | |
| HP Omen 16-b1090ng | |
| Asus TUF Dash F15 FX517ZR | |
| Asus TUF Dash F15 FX517ZR (Turbo) | |
| Asus TUF Dash F15 FX517ZR (Leise) | |
| Asus TUF Dash F15 FX517ZR (P-Cores only, Turbo) | |
| Average Intel Core i7-12650H (206 - 261, n=14) | |
| MSI Delta 15 A5EFK | |
| Razer Blade 15 Base Edition 2021, i7-10750H RTX 3060 | |
| Blender - v2.79 BMW27 CPU | |
| Razer Blade 15 Base Edition 2021, i7-10750H RTX 3060 | |
| Average Intel Core i7-12650H (222 - 553, n=15) | |
| Asus TUF Dash F15 FX517ZR (P-Cores only, Turbo) | |
| Asus TUF Dash F15 FX517ZR (Leise) | |
| MSI Delta 15 A5EFK | |
| Asus TUF Dash F15 FX517ZR | |
| Asus TUF Dash F15 FX517ZR (Turbo) | |
| Average of class Gaming (87 - 1259, n=225, last 2 years) | |
| Acer Nitro 5 AN515-58-72QR | |
| HP Omen 16-b1090ng | |
| 7-Zip 18.03 | |
| 7z b 4 | |
| Average of class Gaming (11386 - 140932, n=226, last 2 years) | |
| HP Omen 16-b1090ng | |
| Asus TUF Dash F15 FX517ZR (Turbo) | |
| MSI Delta 15 A5EFK | |
| Asus TUF Dash F15 FX517ZR | |
| Acer Nitro 5 AN515-58-72QR | |
| Asus TUF Dash F15 FX517ZR (Leise) | |
| Average Intel Core i7-12650H (27053 - 59034, n=14) | |
| Asus TUF Dash F15 FX517ZR (P-Cores only, Turbo) | |
| Razer Blade 15 Base Edition 2021, i7-10750H RTX 3060 | |
| 7z b 4 -mmt1 | |
| Average of class Gaming (2685 - 7581, n=226, last 2 years) | |
| HP Omen 16-b1090ng | |
| Acer Nitro 5 AN515-58-72QR | |
| Asus TUF Dash F15 FX517ZR | |
| Asus TUF Dash F15 FX517ZR (Turbo) | |
| MSI Delta 15 A5EFK | |
| Average Intel Core i7-12650H (5265 - 6116, n=14) | |
| Asus TUF Dash F15 FX517ZR (Leise) | |
| Asus TUF Dash F15 FX517ZR (P-Cores only, Turbo) | |
| Razer Blade 15 Base Edition 2021, i7-10750H RTX 3060 | |
| Geekbench 5.5 | |
| Multi-Core | |
| Average of class Gaming (1946 - 22200, n=231, last 2 years) | |
| HP Omen 16-b1090ng | |
| Asus TUF Dash F15 FX517ZR (Turbo) | |
| Asus TUF Dash F15 FX517ZR | |
| Acer Nitro 5 AN515-58-72QR | |
| Average Intel Core i7-12650H (6478 - 11284, n=16) | |
| Asus TUF Dash F15 FX517ZR (Leise) | |
| Asus TUF Dash F15 FX517ZR (P-Cores only, Turbo) | |
| MSI Delta 15 A5EFK | |
| Razer Blade 15 Base Edition 2021, i7-10750H RTX 3060 | |
| Single-Core | |
| HP Omen 16-b1090ng | |
| Average of class Gaming (158 - 2193, n=231, last 2 years) | |
| Asus TUF Dash F15 FX517ZR (Turbo) | |
| Asus TUF Dash F15 FX517ZR (Leise) | |
| Asus TUF Dash F15 FX517ZR | |
| Acer Nitro 5 AN515-58-72QR | |
| Average Intel Core i7-12650H (1590 - 1797, n=16) | |
| Asus TUF Dash F15 FX517ZR (P-Cores only, Turbo) | |
| MSI Delta 15 A5EFK | |
| Razer Blade 15 Base Edition 2021, i7-10750H RTX 3060 | |
| HWBOT x265 Benchmark v2.2 - 4k Preset | |
| Average of class Gaming (3 - 37.6, n=229, last 2 years) | |
| HP Omen 16-b1090ng | |
| Acer Nitro 5 AN515-58-72QR | |
| Asus TUF Dash F15 FX517ZR (Turbo) | |
| Asus TUF Dash F15 FX517ZR | |
| MSI Delta 15 A5EFK | |
| Asus TUF Dash F15 FX517ZR (Leise) | |
| Asus TUF Dash F15 FX517ZR (P-Cores only, Turbo) | |
| Average Intel Core i7-12650H (6.62 - 17.4, n=16) | |
| Razer Blade 15 Base Edition 2021, i7-10750H RTX 3060 | |
| LibreOffice - 20 Documents To PDF | |
| MSI Delta 15 A5EFK | |
| Average of class Gaming (32.8 - 332, n=223, last 2 years) | |
| Razer Blade 15 Base Edition 2021, i7-10750H RTX 3060 | |
| Average Intel Core i7-12650H (35.1 - 58.5, n=14) | |
| Asus TUF Dash F15 FX517ZR (P-Cores only, Turbo) | |
| Asus TUF Dash F15 FX517ZR (Leise) | |
| Acer Nitro 5 AN515-58-72QR | |
| HP Omen 16-b1090ng | |
| Asus TUF Dash F15 FX517ZR (Turbo) | |
| Asus TUF Dash F15 FX517ZR | |
| R Benchmark 2.5 - Overall mean | |
| Razer Blade 15 Base Edition 2021, i7-10750H RTX 3060 | |
| MSI Delta 15 A5EFK | |
| Asus TUF Dash F15 FX517ZR (P-Cores only, Turbo) | |
| Average Intel Core i7-12650H (0.4584 - 0.515, n=14) | |
| Average of class Gaming (0.3609 - 4.47, n=226, last 2 years) | |
| Asus TUF Dash F15 FX517ZR (Leise) | |
| Asus TUF Dash F15 FX517ZR | |
| Asus TUF Dash F15 FX517ZR (Turbo) | |
| Acer Nitro 5 AN515-58-72QR | |
| HP Omen 16-b1090ng | |
* ... smaller is better
AIDA64: FP32 Ray-Trace | FPU Julia | CPU SHA3 | CPU Queen | FPU SinJulia | FPU Mandel | CPU AES | CPU ZLib | FP64 Ray-Trace | CPU PhotoWorxx
| Performance Rating | |
| Average of class Gaming | |
| MSI Delta 15 A5EFK | |
| Asus TUF Dash F15 FX517ZR | |
| Asus TUF Dash F15 FX517ZR | |
| Asus TUF Dash F15 FX517ZR | |
| HP Omen 16-b1090ng | |
| Acer Nitro 5 AN515-58-72QR | |
| Asus TUF Dash F15 FX517ZR | |
| Average Intel Core i7-12650H | |
| AIDA64 / FP32 Ray-Trace | |
| Average of class Gaming (3069 - 60169, n=222, last 2 years) | |
| MSI Delta 15 A5EFK (v6.33.5700) | |
| Asus TUF Dash F15 FX517ZR (v6.70.6000) | |
| Asus TUF Dash F15 FX517ZR (v6.70.6000, Turbo) | |
| Asus TUF Dash F15 FX517ZR (v6.70.6000, P-Cores only, Turbo) | |
| Asus TUF Dash F15 FX517ZR (v6.70.6000, Leise) | |
| Average Intel Core i7-12650H (5422 - 15620, n=14) | |
| Acer Nitro 5 AN515-58-72QR (v6.50.5800) | |
| HP Omen 16-b1090ng (v6.50.5800) | |
| AIDA64 / FPU Julia | |
| MSI Delta 15 A5EFK (v6.33.5700) | |
| Average of class Gaming (18567 - 252486, n=222, last 2 years) | |
| Asus TUF Dash F15 FX517ZR (v6.70.6000, Turbo) | |
| Asus TUF Dash F15 FX517ZR (v6.70.6000) | |
| Asus TUF Dash F15 FX517ZR (v6.70.6000, Leise) | |
| Asus TUF Dash F15 FX517ZR (v6.70.6000, P-Cores only, Turbo) | |
| Average Intel Core i7-12650H (26386 - 76434, n=14) | |
| Acer Nitro 5 AN515-58-72QR (v6.50.5800) | |
| HP Omen 16-b1090ng (v6.50.5800) | |
| AIDA64 / CPU SHA3 | |
| Average of class Gaming (629 - 10389, n=222, last 2 years) | |
| MSI Delta 15 A5EFK (v6.33.5700) | |
| Acer Nitro 5 AN515-58-72QR (v6.50.5800) | |
| Asus TUF Dash F15 FX517ZR (v6.70.6000) | |
| Asus TUF Dash F15 FX517ZR (v6.70.6000, Turbo) | |
| HP Omen 16-b1090ng (v6.50.5800) | |
| Asus TUF Dash F15 FX517ZR (v6.70.6000, Leise) | |
| Average Intel Core i7-12650H (1479 - 3244, n=14) | |
| Asus TUF Dash F15 FX517ZR (v6.70.6000, P-Cores only, Turbo) | |
| AIDA64 / CPU Queen | |
| Average of class Gaming (15371 - 200651, n=222, last 2 years) | |
| MSI Delta 15 A5EFK (v6.33.5700) | |
| HP Omen 16-b1090ng (v6.50.5800) | |
| Acer Nitro 5 AN515-58-72QR (v6.50.5800) | |
| Asus TUF Dash F15 FX517ZR (v6.70.6000) | |
| Asus TUF Dash F15 FX517ZR (v6.70.6000, Turbo) | |
| Asus TUF Dash F15 FX517ZR (v6.70.6000, Leise) | |
| Average Intel Core i7-12650H (59278 - 89537, n=14) | |
| Asus TUF Dash F15 FX517ZR (v6.70.6000, P-Cores only, Turbo) | |
| AIDA64 / FPU SinJulia | |
| MSI Delta 15 A5EFK (v6.33.5700) | |
| Average of class Gaming (2137 - 32988, n=222, last 2 years) | |
| Acer Nitro 5 AN515-58-72QR (v6.50.5800) | |
| HP Omen 16-b1090ng (v6.50.5800) | |
| Asus TUF Dash F15 FX517ZR (v6.70.6000) | |
| Asus TUF Dash F15 FX517ZR (v6.70.6000, Turbo) | |
| Asus TUF Dash F15 FX517ZR (v6.70.6000, Leise) | |
| Asus TUF Dash F15 FX517ZR (v6.70.6000, P-Cores only, Turbo) | |
| Average Intel Core i7-12650H (4690 - 8726, n=14) | |
| AIDA64 / FPU Mandel | |
| MSI Delta 15 A5EFK (v6.33.5700) | |
| Average of class Gaming (10291 - 134044, n=222, last 2 years) | |
| Asus TUF Dash F15 FX517ZR (v6.70.6000, Turbo) | |
| Asus TUF Dash F15 FX517ZR (v6.70.6000) | |
| Asus TUF Dash F15 FX517ZR (v6.70.6000, Leise) | |
| Asus TUF Dash F15 FX517ZR (v6.70.6000, P-Cores only, Turbo) | |
| Average Intel Core i7-12650H (15001 - 37738, n=14) | |
| Acer Nitro 5 AN515-58-72QR | |
| HP Omen 16-b1090ng (v6.50.5800) | |
| AIDA64 / CPU AES | |
| MSI Delta 15 A5EFK (v6.33.5700) | |
| Average of class Gaming (19065 - 328679, n=222, last 2 years) | |
| HP Omen 16-b1090ng (v6.50.5800) | |
| Asus TUF Dash F15 FX517ZR (v6.70.6000, Turbo) | |
| Asus TUF Dash F15 FX517ZR (v6.70.6000) | |
| Acer Nitro 5 AN515-58-72QR (v6.50.5800) | |
| Average Intel Core i7-12650H (32702 - 92530, n=14) | |
| Asus TUF Dash F15 FX517ZR (v6.70.6000, Leise) | |
| Asus TUF Dash F15 FX517ZR (v6.70.6000, P-Cores only, Turbo) | |
| AIDA64 / CPU ZLib | |
| Average of class Gaming (150.9 - 2409, n=222, last 2 years) | |
| Acer Nitro 5 AN515-58-72QR (v6.50.5800) | |
| HP Omen 16-b1090ng (v6.50.5800) | |
| Asus TUF Dash F15 FX517ZR (v6.70.6000) | |
| Asus TUF Dash F15 FX517ZR (v6.70.6000, Turbo) | |
| MSI Delta 15 A5EFK (v6.33.5700) | |
| Asus TUF Dash F15 FX517ZR (v6.70.6000, Leise) | |
| Average Intel Core i7-12650H (443 - 891, n=14) | |
| Asus TUF Dash F15 FX517ZR (v6.70.6000, P-Cores only, Turbo) | |
| AIDA64 / FP64 Ray-Trace | |
| Average of class Gaming (1518 - 31796, n=222, last 2 years) | |
| MSI Delta 15 A5EFK (v6.33.5700) | |
| Asus TUF Dash F15 FX517ZR (v6.70.6000, Turbo) | |
| Asus TUF Dash F15 FX517ZR (v6.70.6000) | |
| Asus TUF Dash F15 FX517ZR (v6.70.6000, P-Cores only, Turbo) | |
| Asus TUF Dash F15 FX517ZR (v6.70.6000, Leise) | |
| Average Intel Core i7-12650H (3096 - 8448, n=14) | |
| Acer Nitro 5 AN515-58-72QR (v6.50.5800) | |
| HP Omen 16-b1090ng (v6.50.5800) | |
| AIDA64 / CPU PhotoWorxx | |
| HP Omen 16-b1090ng (v6.50.5800) | |
| Average of class Gaming (10805 - 60161, n=223, last 2 years) | |
| Asus TUF Dash F15 FX517ZR (v6.70.6000) | |
| Asus TUF Dash F15 FX517ZR (v6.70.6000, Turbo) | |
| Asus TUF Dash F15 FX517ZR (v6.70.6000, Leise) | |
| Asus TUF Dash F15 FX517ZR (v6.70.6000, P-Cores only, Turbo) | |
| Average Intel Core i7-12650H (22046 - 44164, n=14) | |
| Acer Nitro 5 AN515-58-72QR (v6.50.5800) | |
| MSI Delta 15 A5EFK (v6.33.5700) | |
System performance
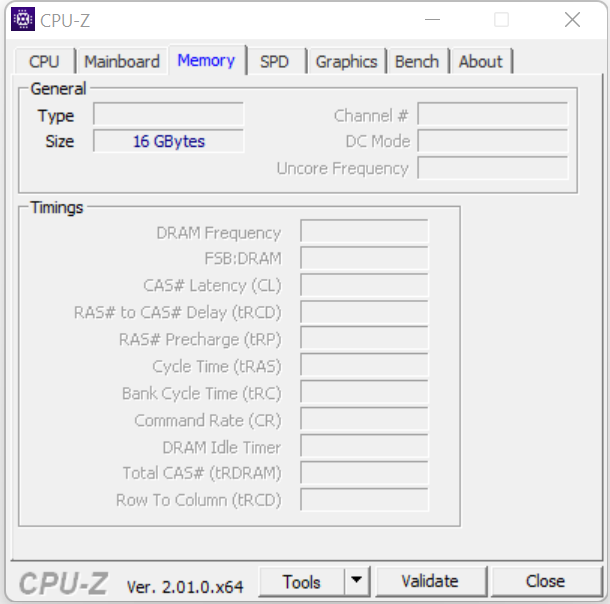
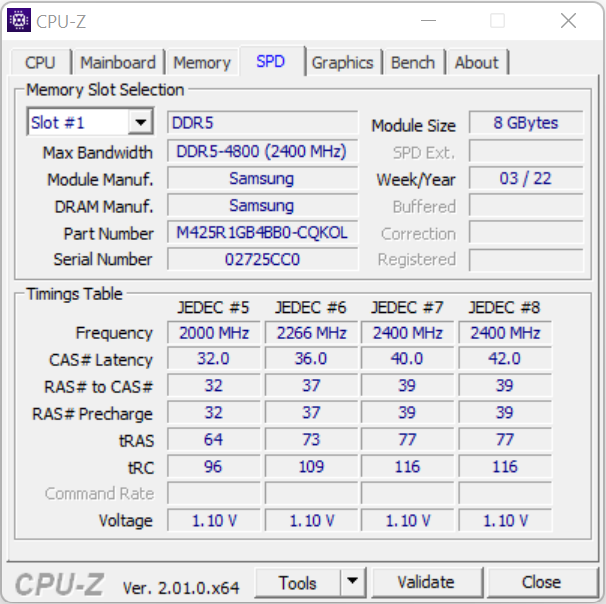
The system works well and smoothly. The built-in hardware provides enough computing power for demanding applications like rendering, video editing, and gaming. This is accompanied by good PCMark results. The RAM's transfer rates are normal for DDR5-4800 memory.
CrossMark: Overall | Productivity | Creativity | Responsiveness
| PCMark 10 / Score | |
| Asus TUF Dash F15 FX517ZR (dGPU, Turbo) | |
| Average of class Gaming (5235 - 9852, n=197, last 2 years) | |
| HP Omen 16-b1090ng | |
| MSI Delta 15 A5EFK | |
| Average Intel Core i7-12650H, NVIDIA GeForce RTX 3070 Laptop GPU (6854 - 7772, n=2) | |
| Acer Nitro 5 AN515-58-72QR | |
| Asus TUF Dash F15 FX517ZR | |
| Razer Blade 15 Base Edition 2021, i7-10750H RTX 3060 | |
| PCMark 10 / Essentials | |
| Average of class Gaming (8300 - 12334, n=196, last 2 years) | |
| Asus TUF Dash F15 FX517ZR (dGPU, Turbo) | |
| MSI Delta 15 A5EFK | |
| Average Intel Core i7-12650H, NVIDIA GeForce RTX 3070 Laptop GPU (10028 - 10707, n=2) | |
| HP Omen 16-b1090ng | |
| Razer Blade 15 Base Edition 2021, i7-10750H RTX 3060 | |
| Asus TUF Dash F15 FX517ZR | |
| Acer Nitro 5 AN515-58-72QR | |
| PCMark 10 / Productivity | |
| Asus TUF Dash F15 FX517ZR (dGPU, Turbo) | |
| Average Intel Core i7-12650H, NVIDIA GeForce RTX 3070 Laptop GPU (9505 - 10187, n=2) | |
| Average of class Gaming (7244 - 11833, n=196, last 2 years) | |
| HP Omen 16-b1090ng | |
| Asus TUF Dash F15 FX517ZR | |
| MSI Delta 15 A5EFK | |
| Acer Nitro 5 AN515-58-72QR | |
| Razer Blade 15 Base Edition 2021, i7-10750H RTX 3060 | |
| PCMark 10 / Digital Content Creation | |
| Asus TUF Dash F15 FX517ZR (dGPU, Turbo) | |
| Average of class Gaming (6462 - 18475, n=196, last 2 years) | |
| HP Omen 16-b1090ng | |
| MSI Delta 15 A5EFK | |
| Average Intel Core i7-12650H, NVIDIA GeForce RTX 3070 Laptop GPU (9169 - 11679, n=2) | |
| Acer Nitro 5 AN515-58-72QR | |
| Asus TUF Dash F15 FX517ZR | |
| Razer Blade 15 Base Edition 2021, i7-10750H RTX 3060 | |
| CrossMark / Overall | |
| Average of class Gaming (1247 - 2334, n=167, last 2 years) | |
| Asus TUF Dash F15 FX517ZR | |
| Acer Nitro 5 AN515-58-72QR | |
| Average Intel Core i7-12650H, NVIDIA GeForce RTX 3070 Laptop GPU (1715 - 1811, n=2) | |
| CrossMark / Productivity | |
| Average of class Gaming (1299 - 2204, n=167, last 2 years) | |
| Acer Nitro 5 AN515-58-72QR | |
| Asus TUF Dash F15 FX517ZR | |
| Average Intel Core i7-12650H, NVIDIA GeForce RTX 3070 Laptop GPU (1645 - 1720, n=2) | |
| CrossMark / Creativity | |
| Average of class Gaming (1275 - 2514, n=167, last 2 years) | |
| Asus TUF Dash F15 FX517ZR | |
| Average Intel Core i7-12650H, NVIDIA GeForce RTX 3070 Laptop GPU (1854 - 1987, n=2) | |
| Acer Nitro 5 AN515-58-72QR | |
| CrossMark / Responsiveness | |
| Average of class Gaming (1030 - 2330, n=167, last 2 years) | |
| Acer Nitro 5 AN515-58-72QR | |
| Asus TUF Dash F15 FX517ZR | |
| Average Intel Core i7-12650H, NVIDIA GeForce RTX 3070 Laptop GPU (1538 - 1598, n=2) | |
| PCMark 8 Home Score Accelerated v2 | 5109 points | |
| PCMark 8 Creative Score Accelerated v2 | 6882 points | |
| PCMark 8 Work Score Accelerated v2 | 6110 points | |
| PCMark 10 Score | 6854 points | |
Help | ||
| AIDA64 / Memory Copy | |
| HP Omen 16-b1090ng (v6.50.5800) | |
| Average of class Gaming (21842 - 92565, n=222, last 2 years) | |
| Asus TUF Dash F15 FX517ZR (v6.70.6000, Turbo) | |
| Asus TUF Dash F15 FX517ZR (v6.70.6000) | |
| Average Intel Core i7-12650H (43261 - 69735, n=14) | |
| Asus TUF Dash F15 FX517ZR (v6.70.6000, Leise) | |
| Acer Nitro 5 AN515-58-72QR (v6.50.5800) | |
| MSI Delta 15 A5EFK (v6.33.5700) | |
| AIDA64 / Memory Read | |
| HP Omen 16-b1090ng (v6.50.5800) | |
| Average of class Gaming (24879 - 90647, n=222, last 2 years) | |
| Asus TUF Dash F15 FX517ZR (v6.70.6000) | |
| Asus TUF Dash F15 FX517ZR (v6.70.6000, Turbo) | |
| Asus TUF Dash F15 FX517ZR (v6.70.6000, Leise) | |
| Average Intel Core i7-12650H (47313 - 67412, n=14) | |
| MSI Delta 15 A5EFK (v6.33.5700) | |
| Acer Nitro 5 AN515-58-72QR (v6.50.5800) | |
| AIDA64 / Memory Write | |
| HP Omen 16-b1090ng (v6.50.5800) | |
| Average of class Gaming (21619 - 103259, n=222, last 2 years) | |
| Asus TUF Dash F15 FX517ZR (v6.70.6000, Turbo) | |
| Asus TUF Dash F15 FX517ZR (v6.70.6000, Leise) | |
| Asus TUF Dash F15 FX517ZR (v6.70.6000) | |
| Average Intel Core i7-12650H (45617 - 59361, n=14) | |
| Acer Nitro 5 AN515-58-72QR (v6.50.5800) | |
| MSI Delta 15 A5EFK (v6.33.5700) | |
| AIDA64 / Memory Latency | |
| Asus TUF Dash F15 FX517ZR (v6.70.6000, Leise) | |
| Asus TUF Dash F15 FX517ZR (v6.70.6000) | |
| Asus TUF Dash F15 FX517ZR (v6.70.6000, Turbo) | |
| HP Omen 16-b1090ng (v6.50.5800) | |
| Average of class Gaming (59.5 - 152.5, n=219, last 2 years) | |
| Average Intel Core i7-12650H (71.6 - 103.9, n=14) | |
| MSI Delta 15 A5EFK (v6.33.5700) | |
| Acer Nitro 5 AN515-58-72QR (v6.50.5800) | |
| Acer Nitro 5 AN515-58-72QR (v6.50.5800) | |
* ... smaller is better
DPC latencies
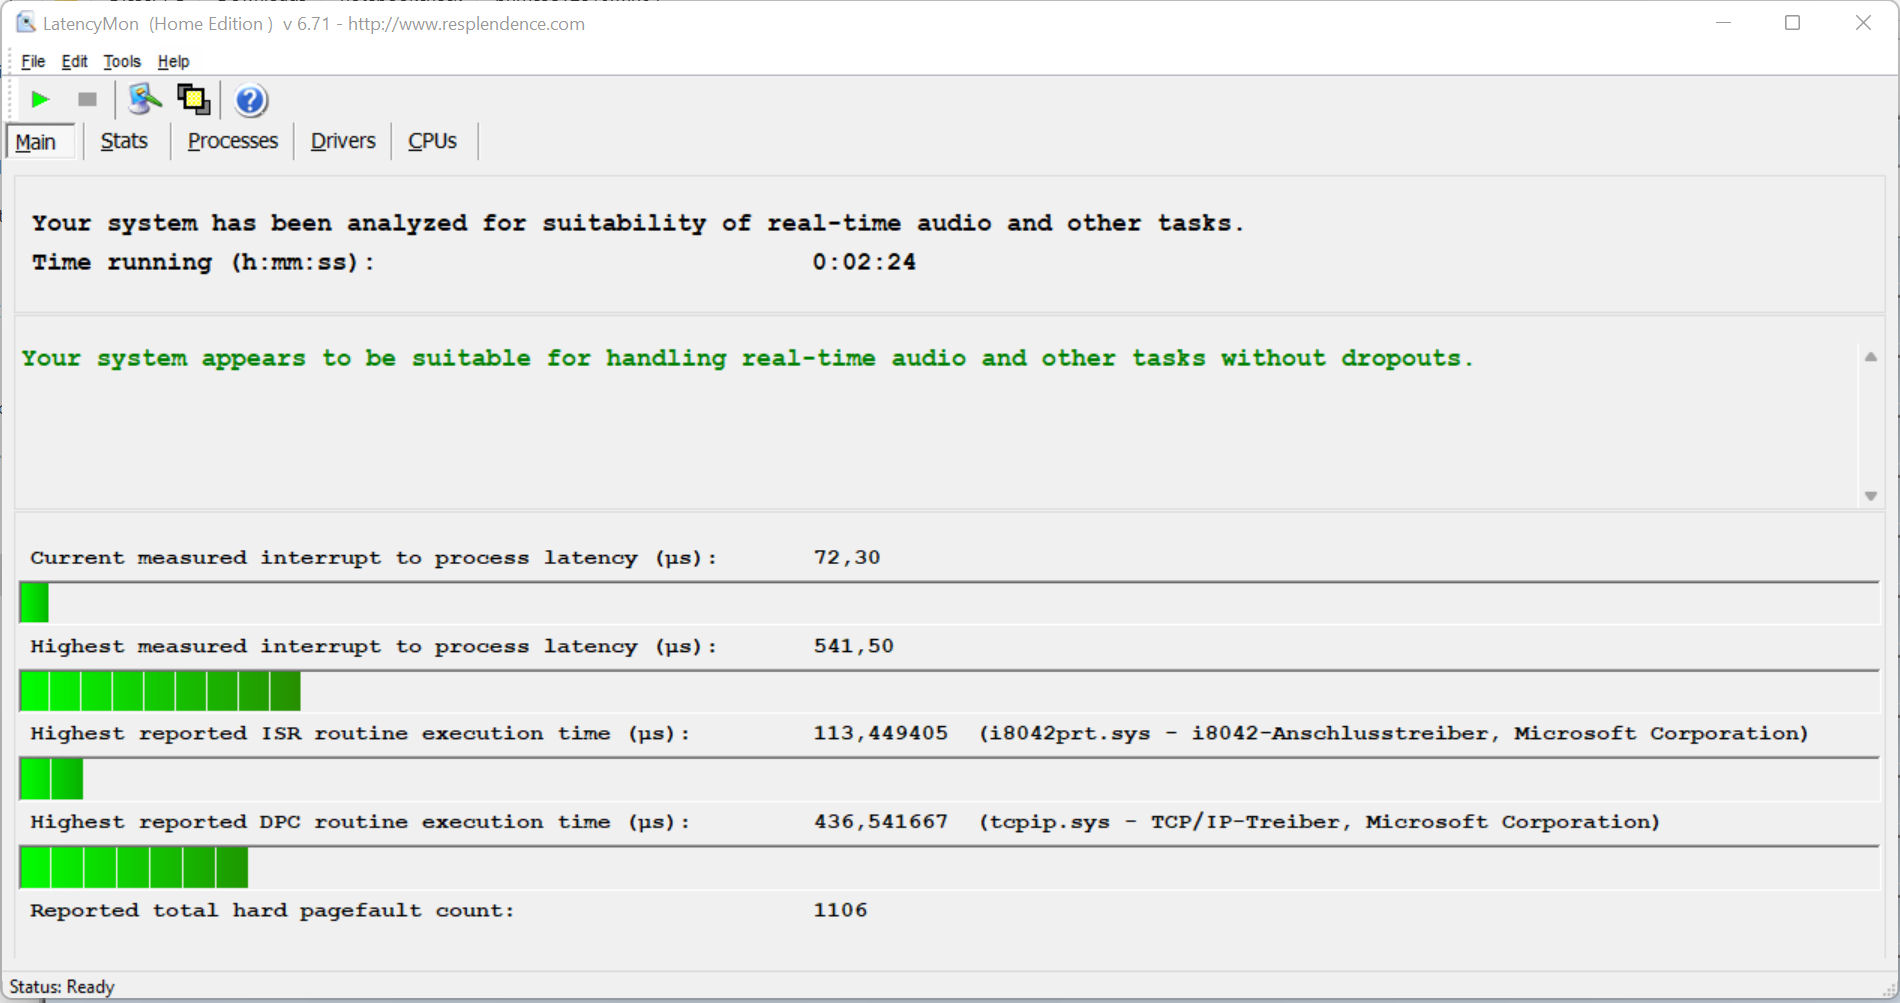
Our standardized latency monitor test (web browsing, 4K video playback, high-load Prime95) didn't reveal any irregularities in terms of DPC latencies. The system seems to be suitable for real-time video and audio editing. Future software updates could lead to improvements or to worse performance, though.
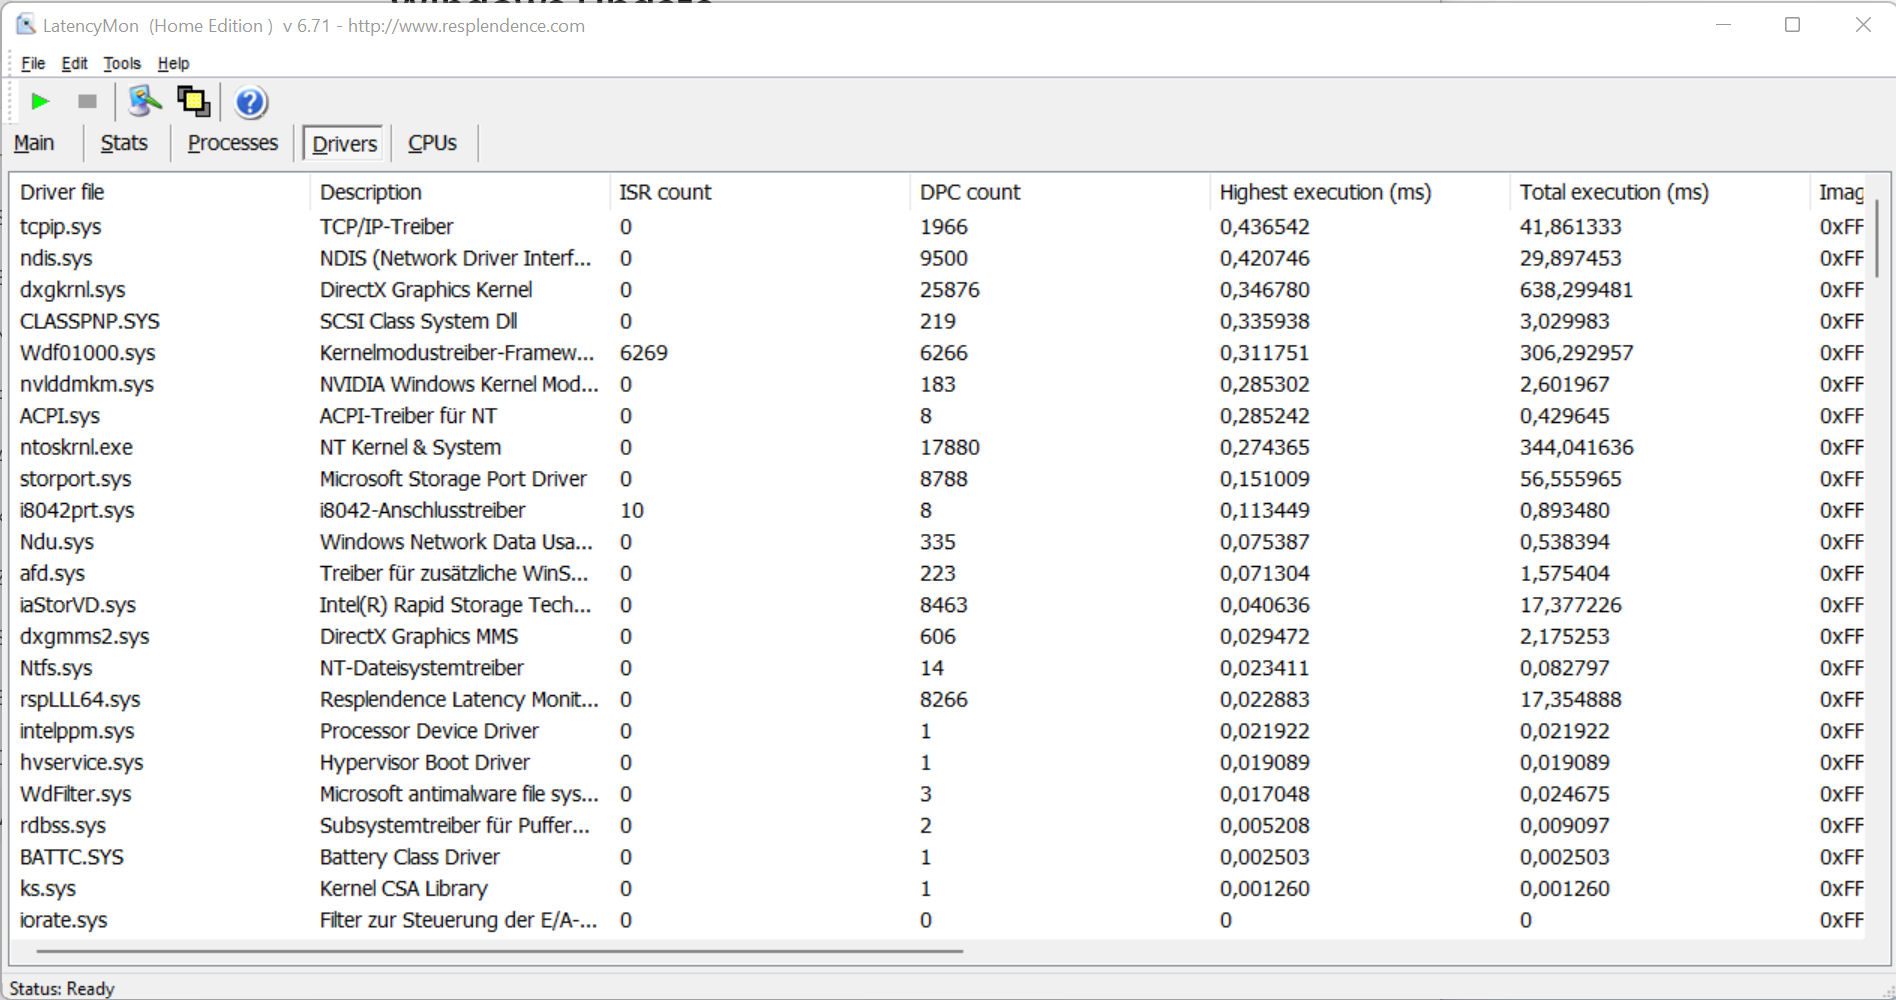
| DPC Latencies / LatencyMon - interrupt to process latency (max), Web, Youtube, Prime95 | |
| MSI Vector GP66 12UGS | |
| Acer Nitro 5 AN515-58-72QR | |
| Lenovo Legion 5 Pro 16 G7 i7 RTX 3070Ti | |
| HP Omen 16-b1090ng | |
| Asus TUF Dash F15 FX517ZR | |
* ... smaller is better
Storage
Asus has equipped the F15 with a 1 TB SSD (PCIe 3, M.2 2280) from Samsung that delivers good transfer rates. However, it's not among the top SSDs. The laptop offers space for a second SSD.

* ... smaller is better
Continuous load read: DiskSpd Read Loop, Queue Depth 8
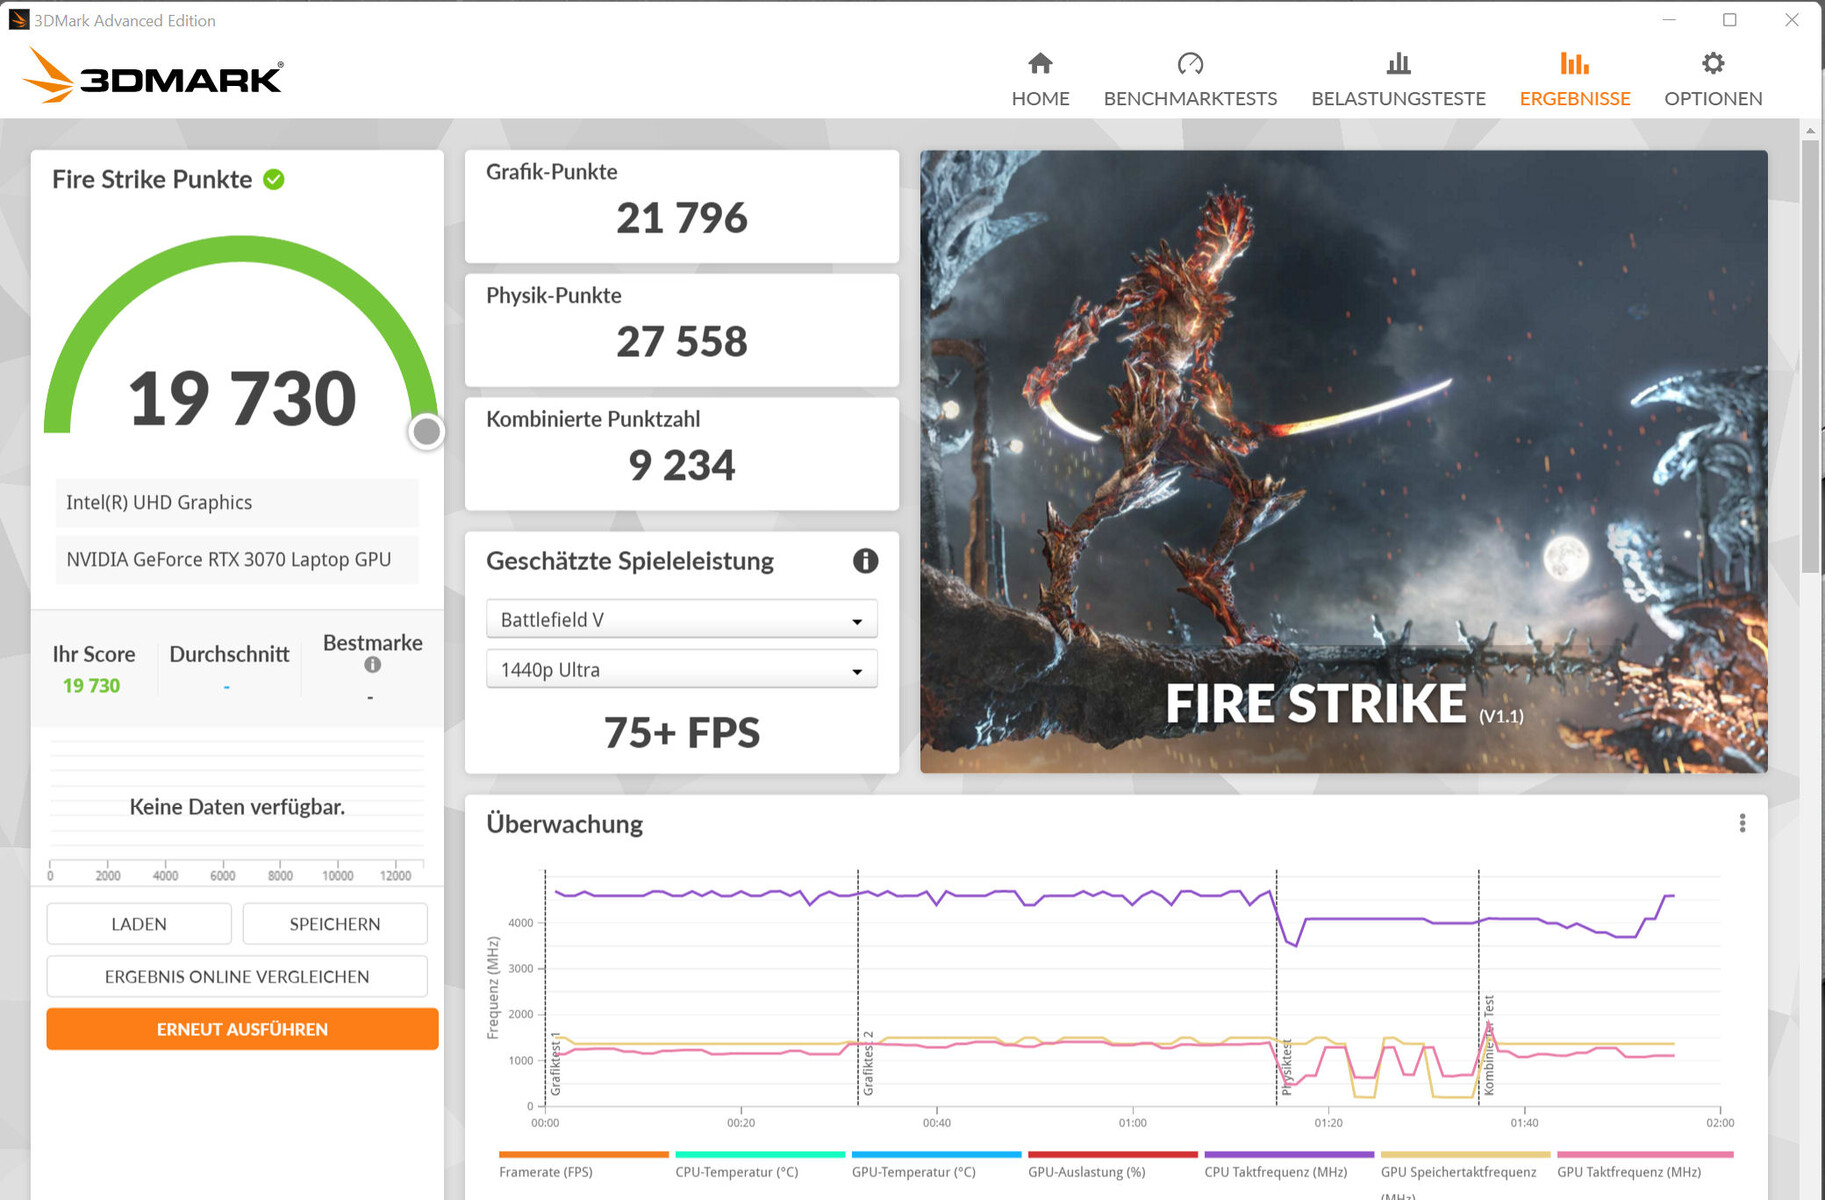
Graphics card
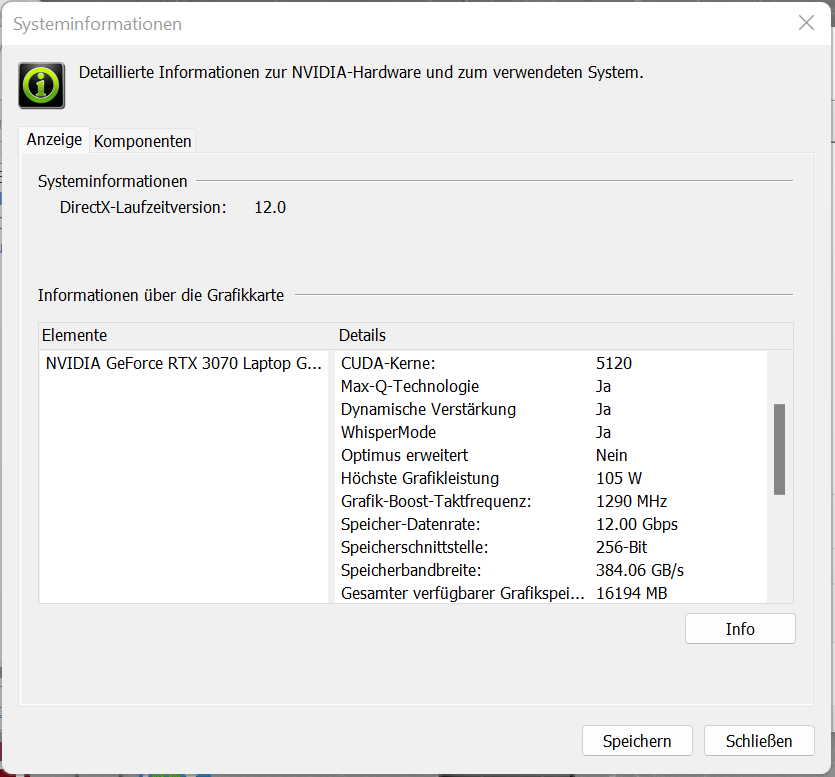
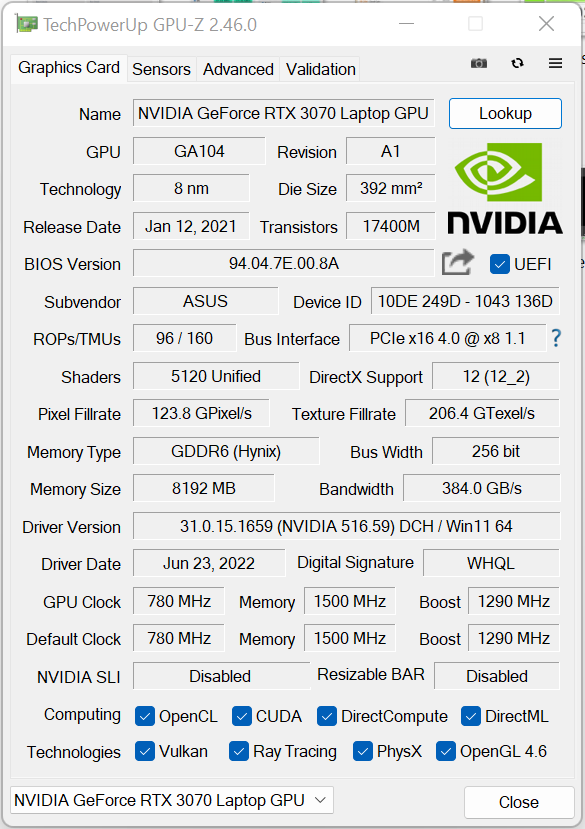
The actual performance of an RTX 3000 GPU will depend on a few factors: Cooling, memory configuration, and the maximum TGP that a laptop manufacturer has chosen within the limits defined by Nvidia. Asus has granted the built-in GeForce RTX 3070 Laptop GPU a maximum TGP of 105 watts (80 watts + 25 watts of Dynamic Boost). The GPU has access to fast GDDR6 graphics memory (8,192 MB).
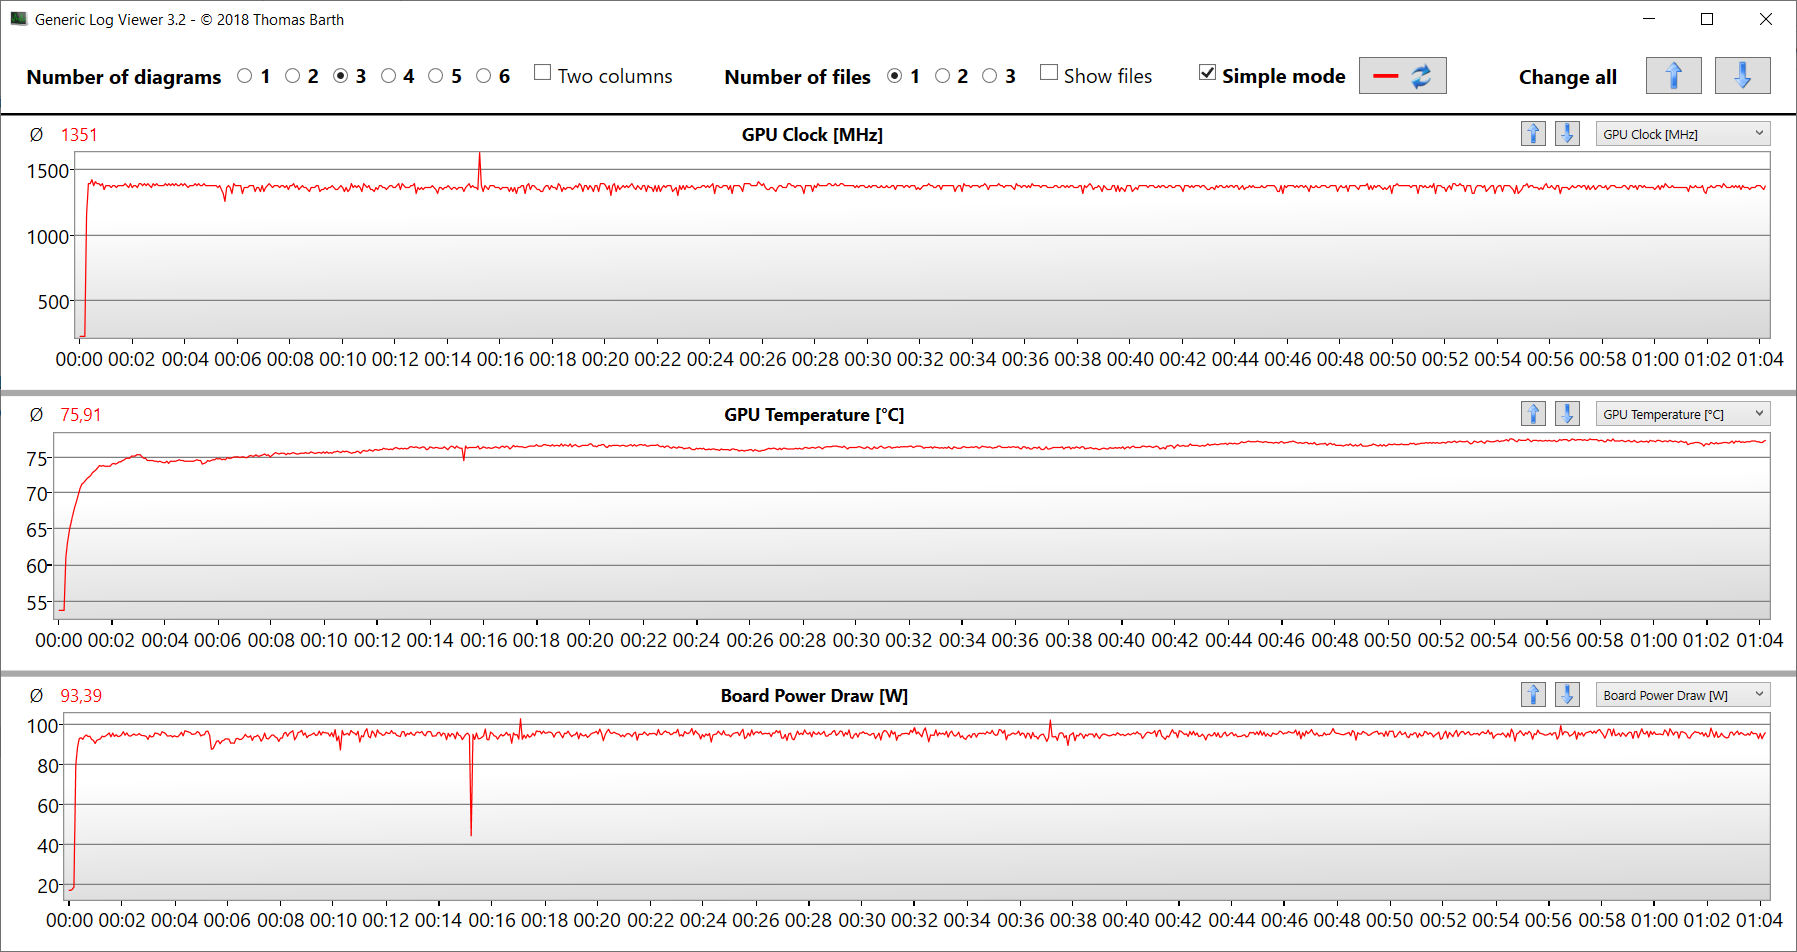
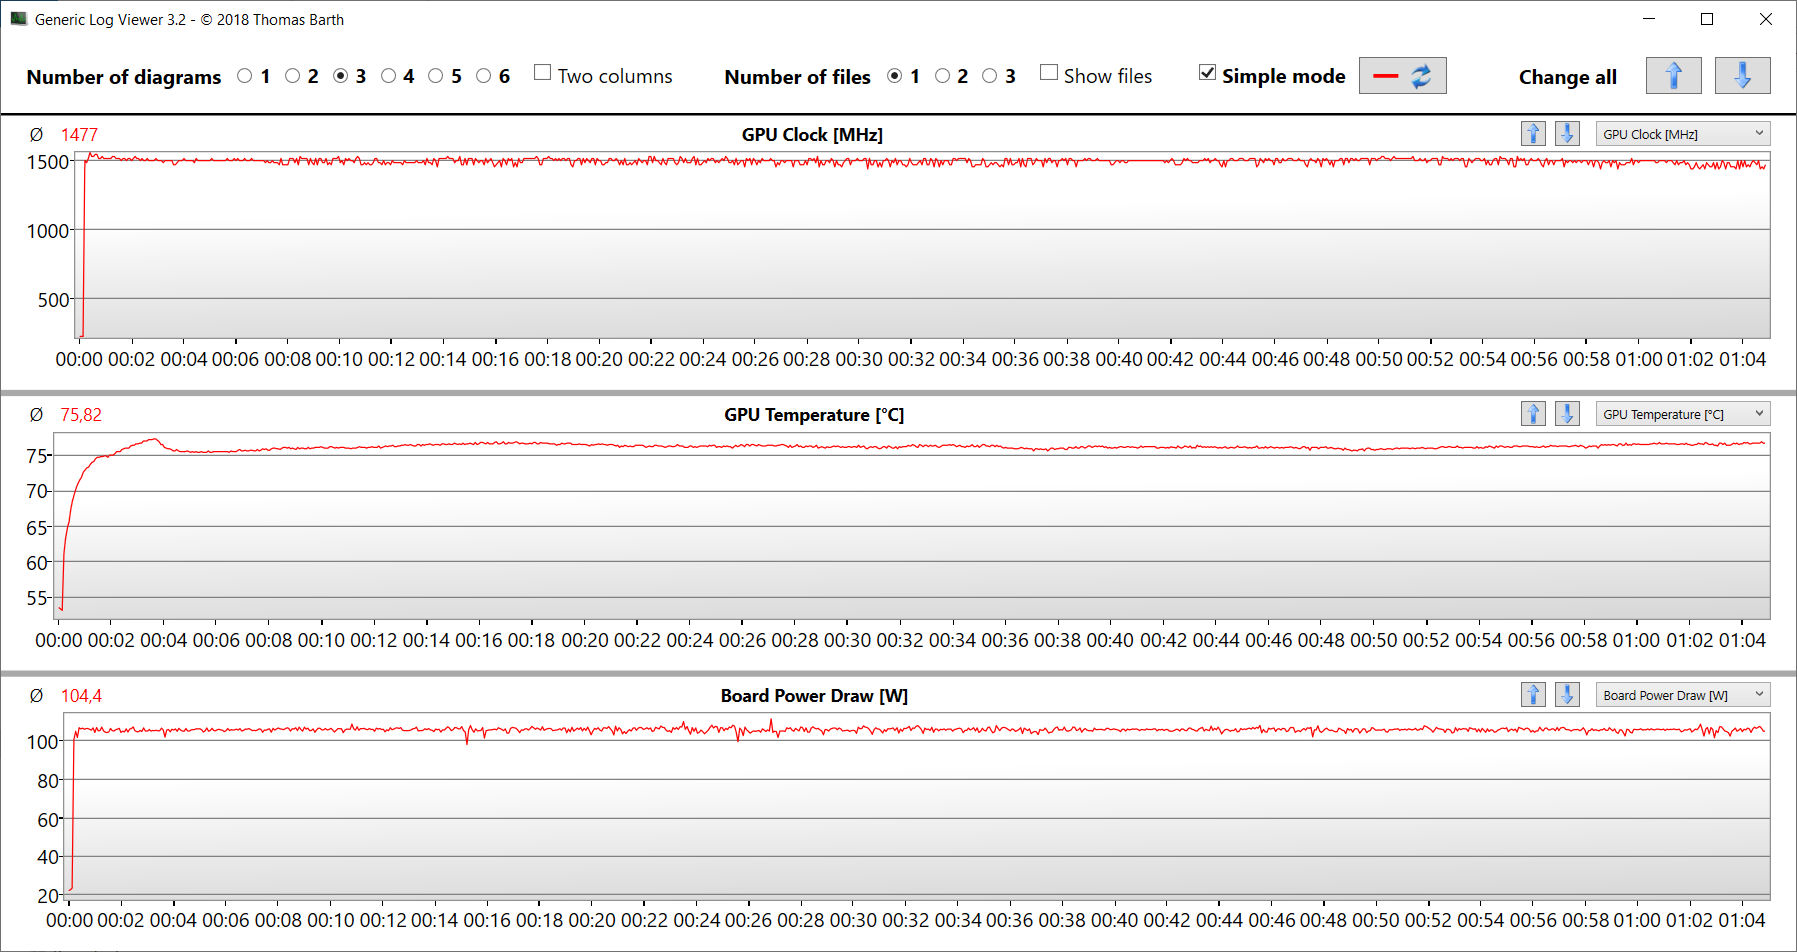
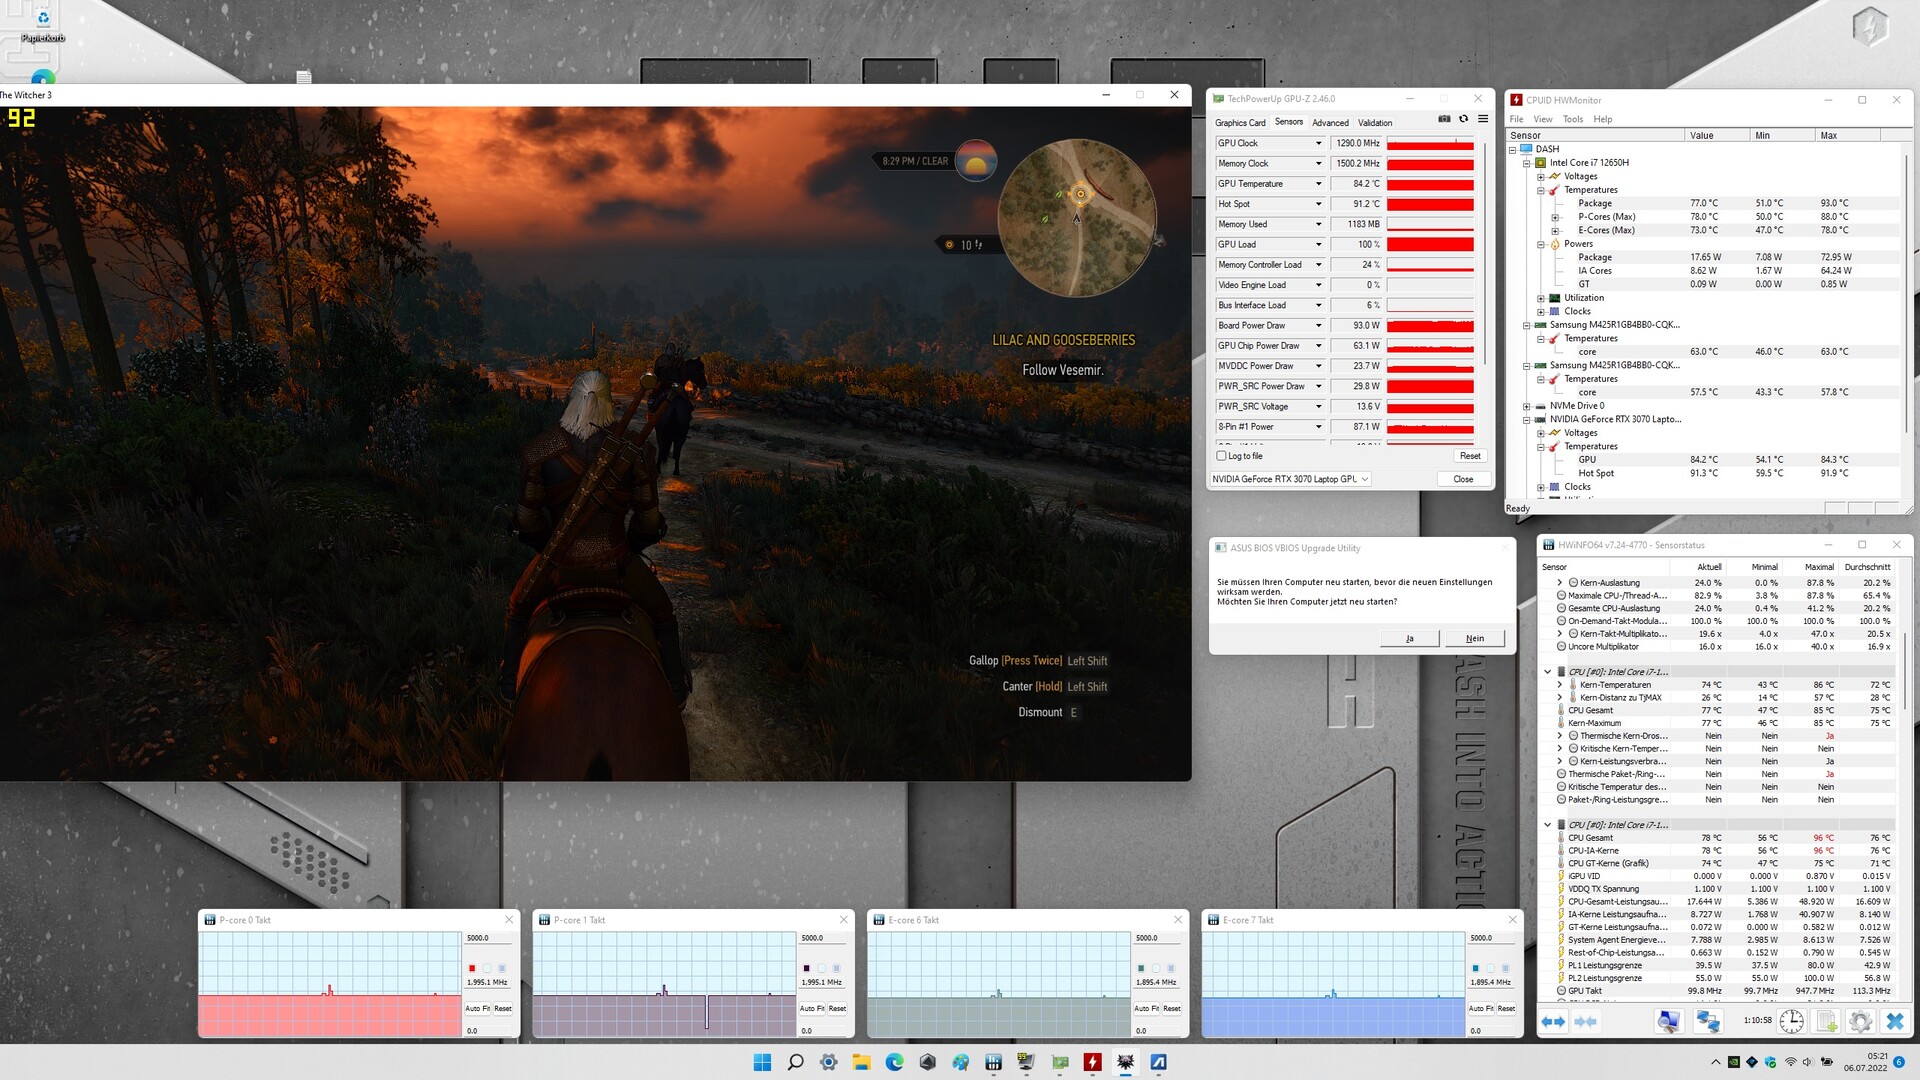
A TGP at the lower end of the limits doesn't allow for maximum performance: The benchmark results are below (Optimus mode) the RTX 3070 average determined so far, or just above it (dGPU mode). The TGP is fully exploited during a direct image output via the GeForce GPU - this can be seen in our The Witcher 3 test.
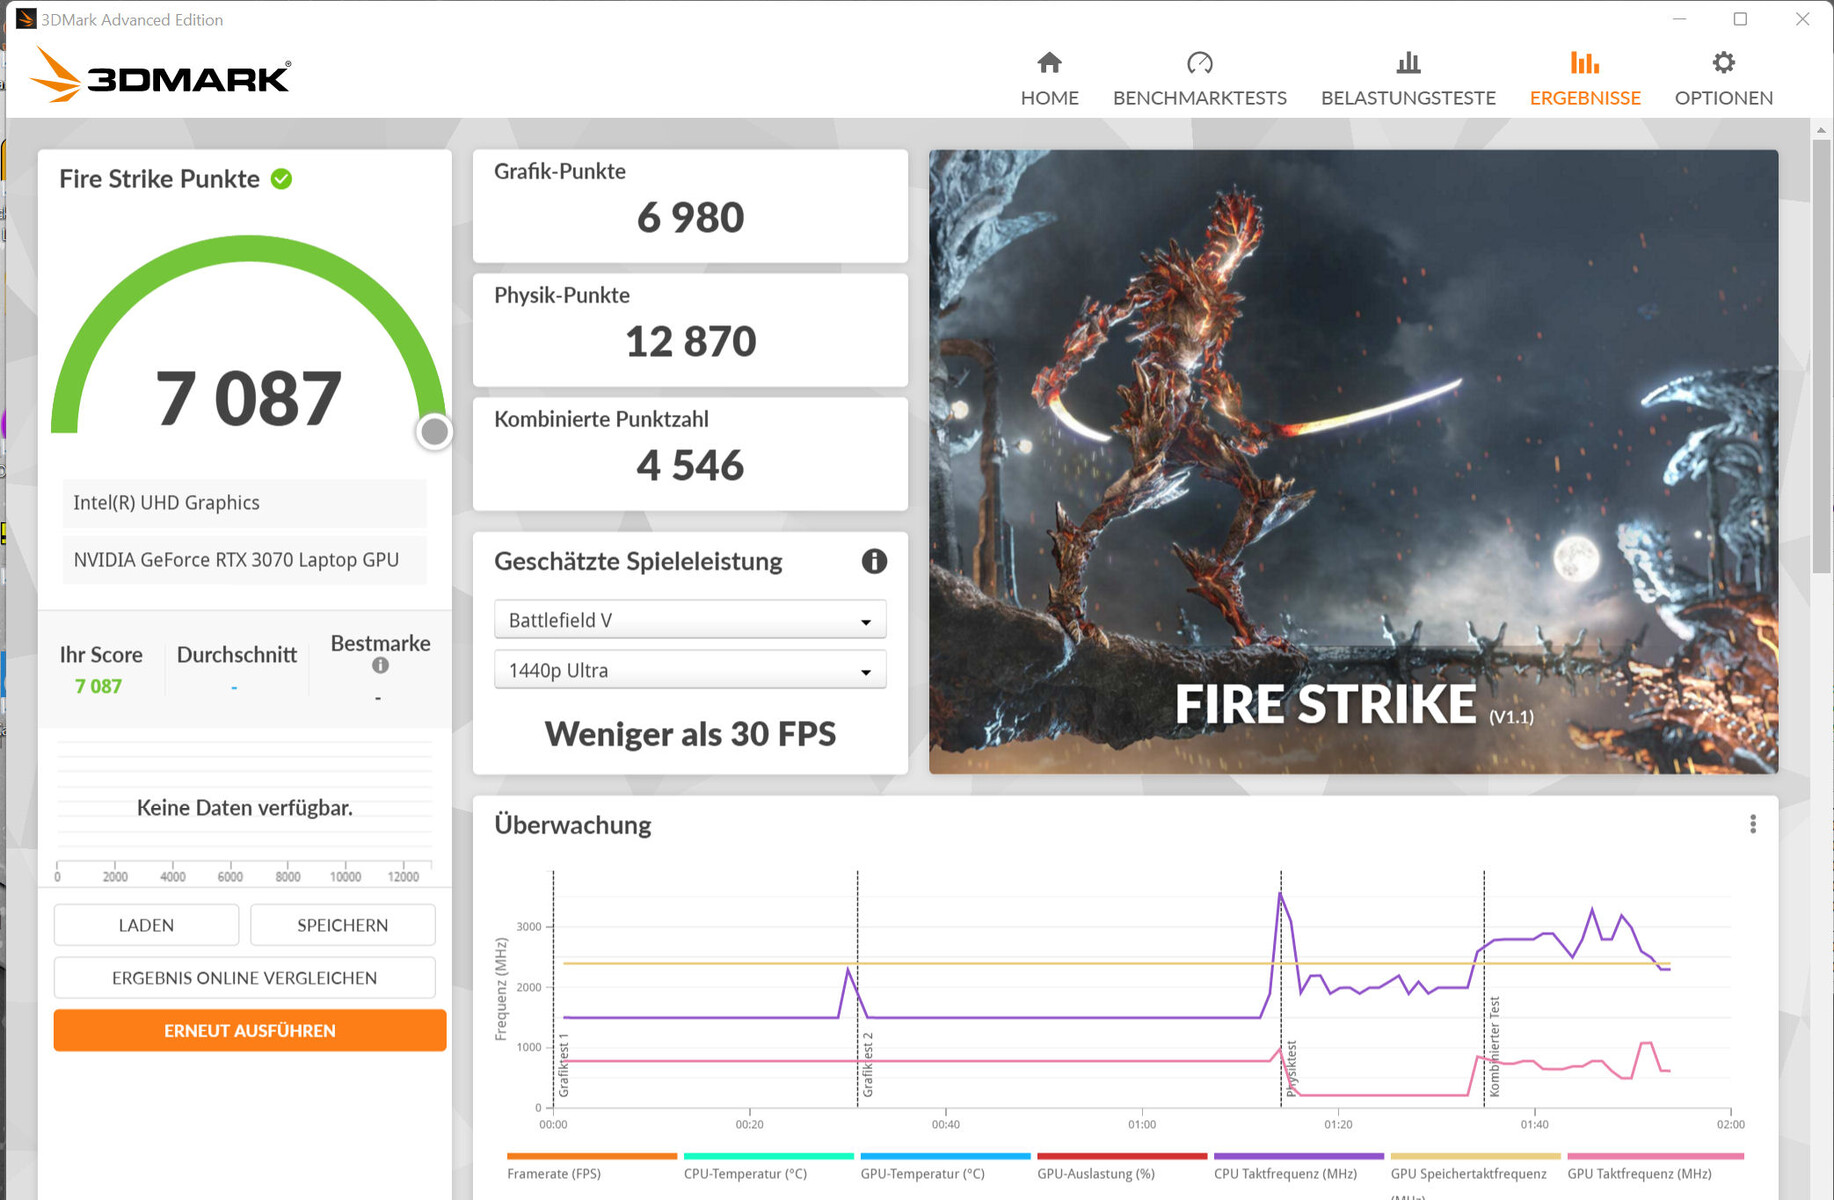
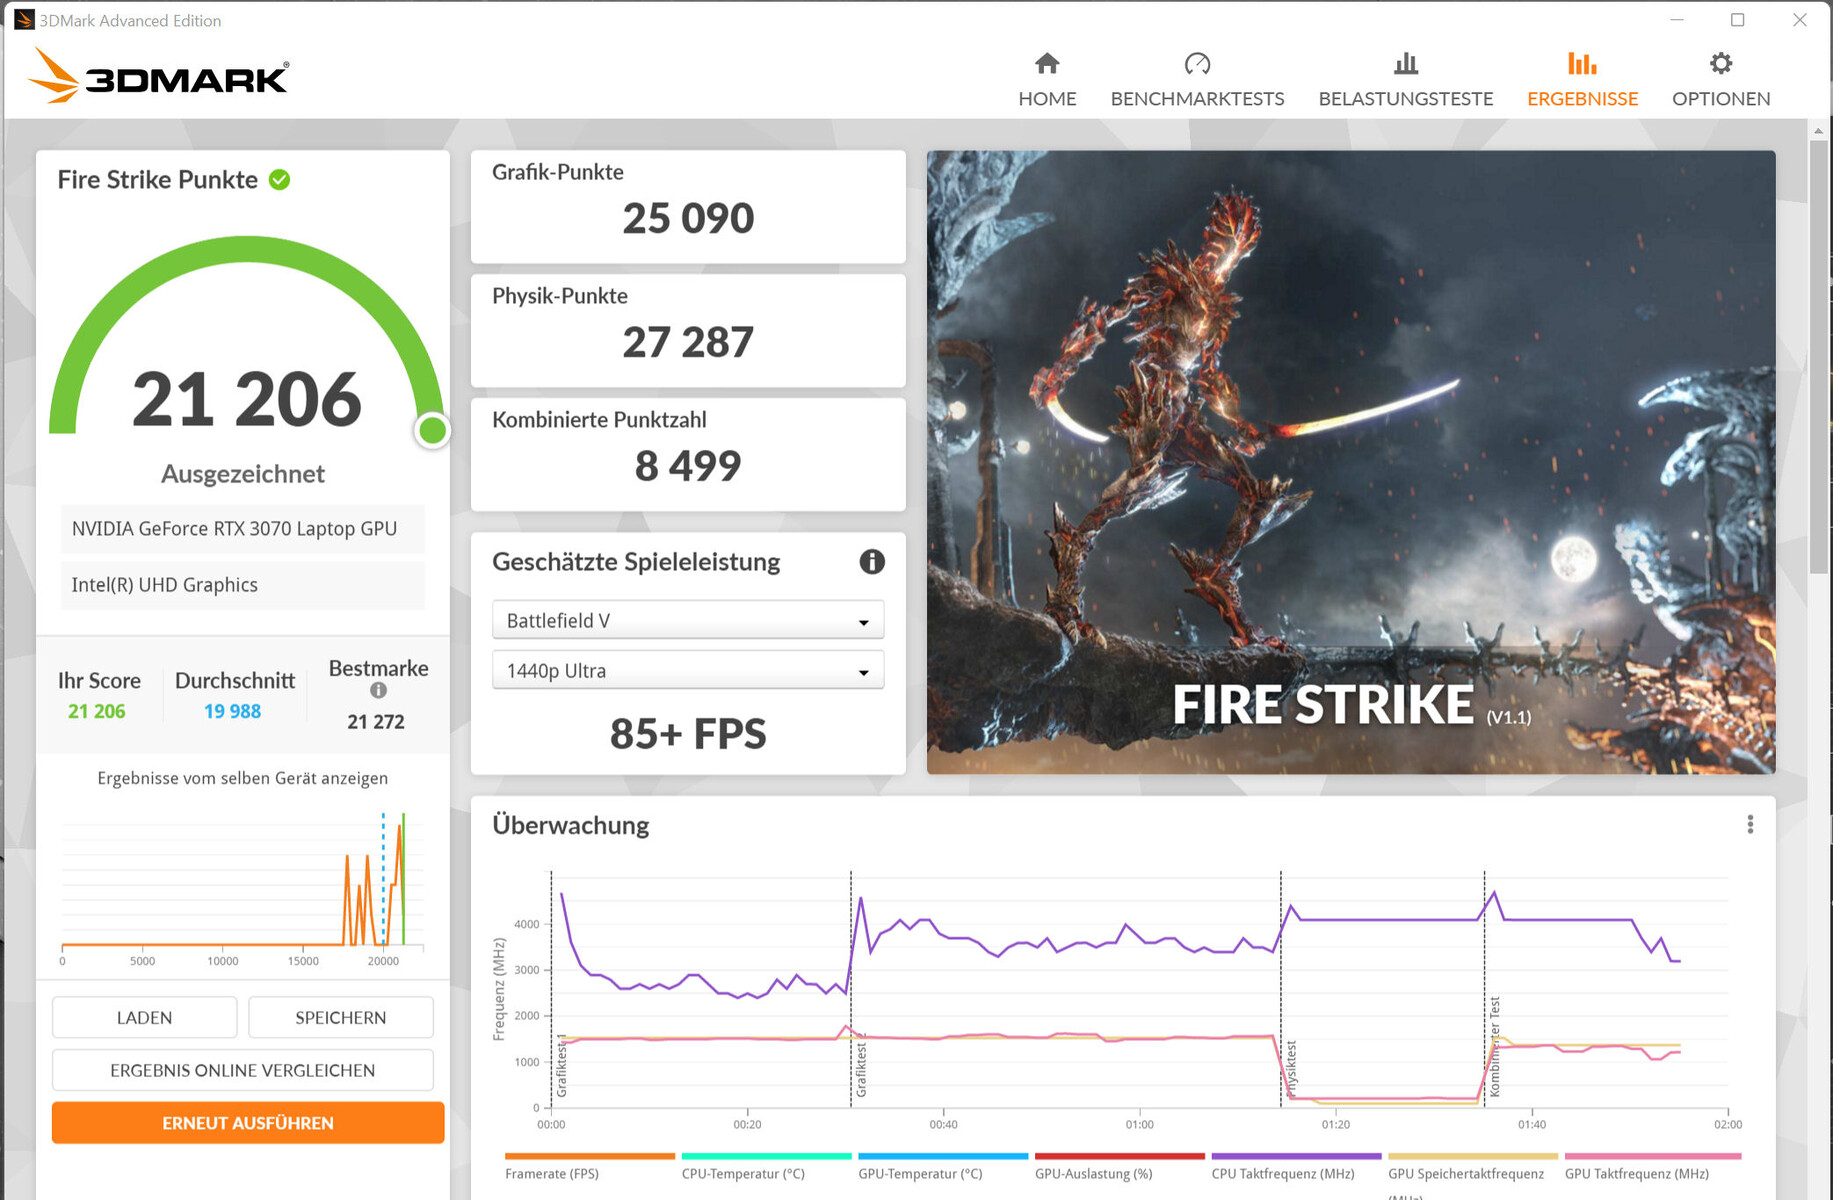
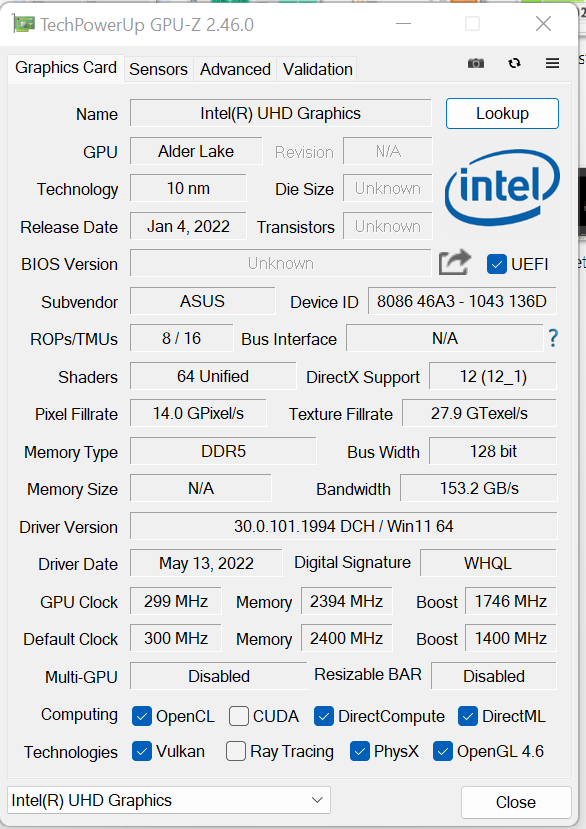
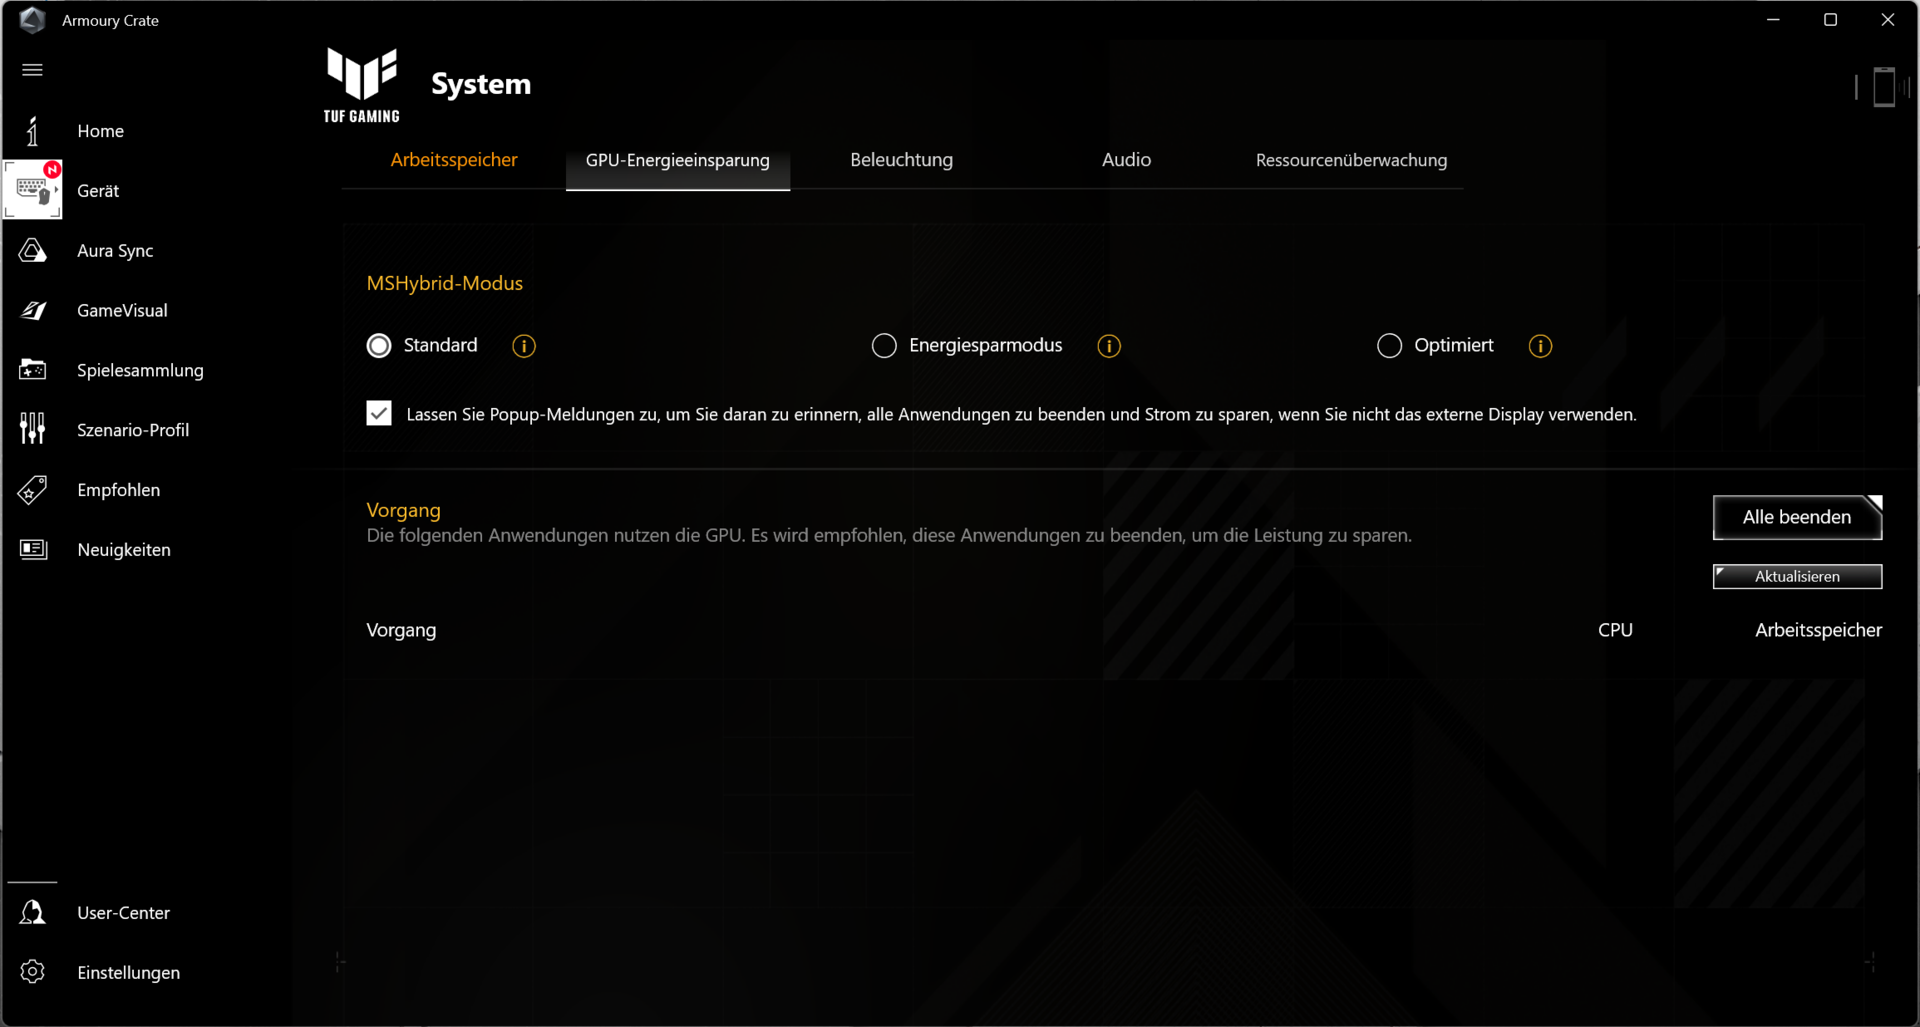
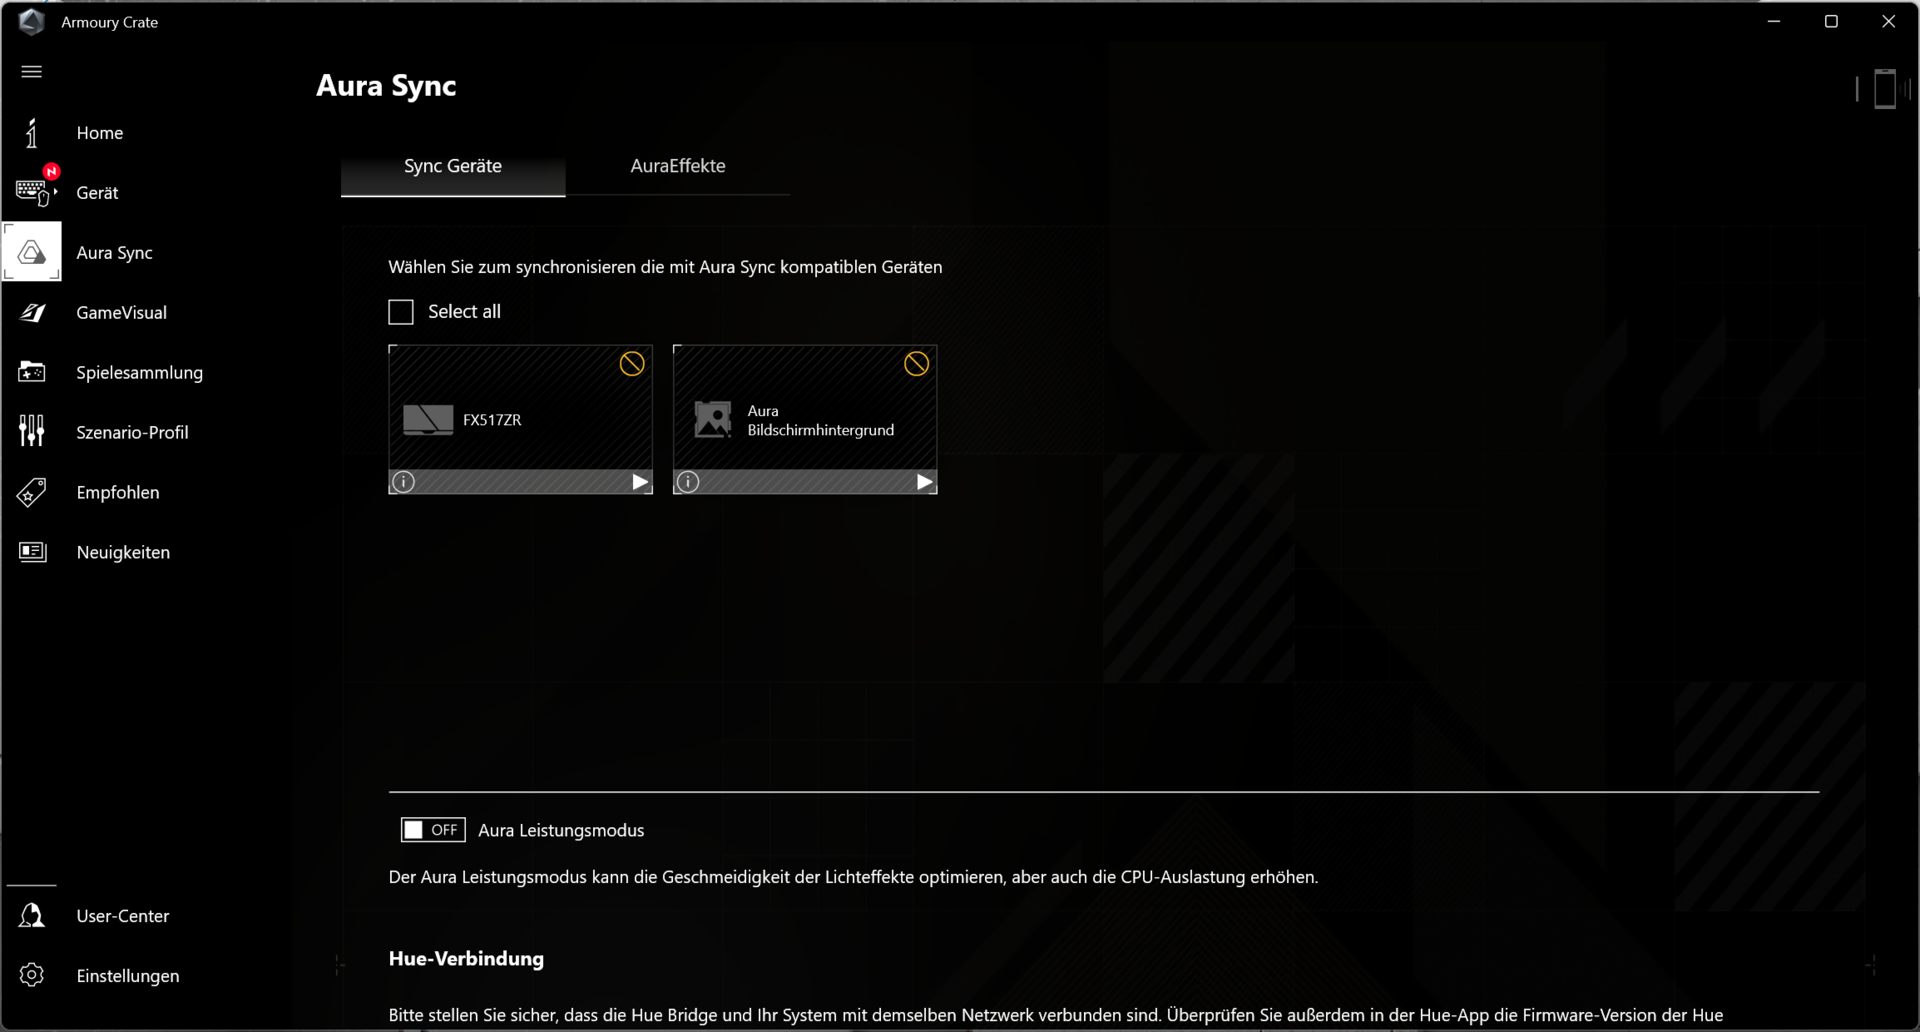
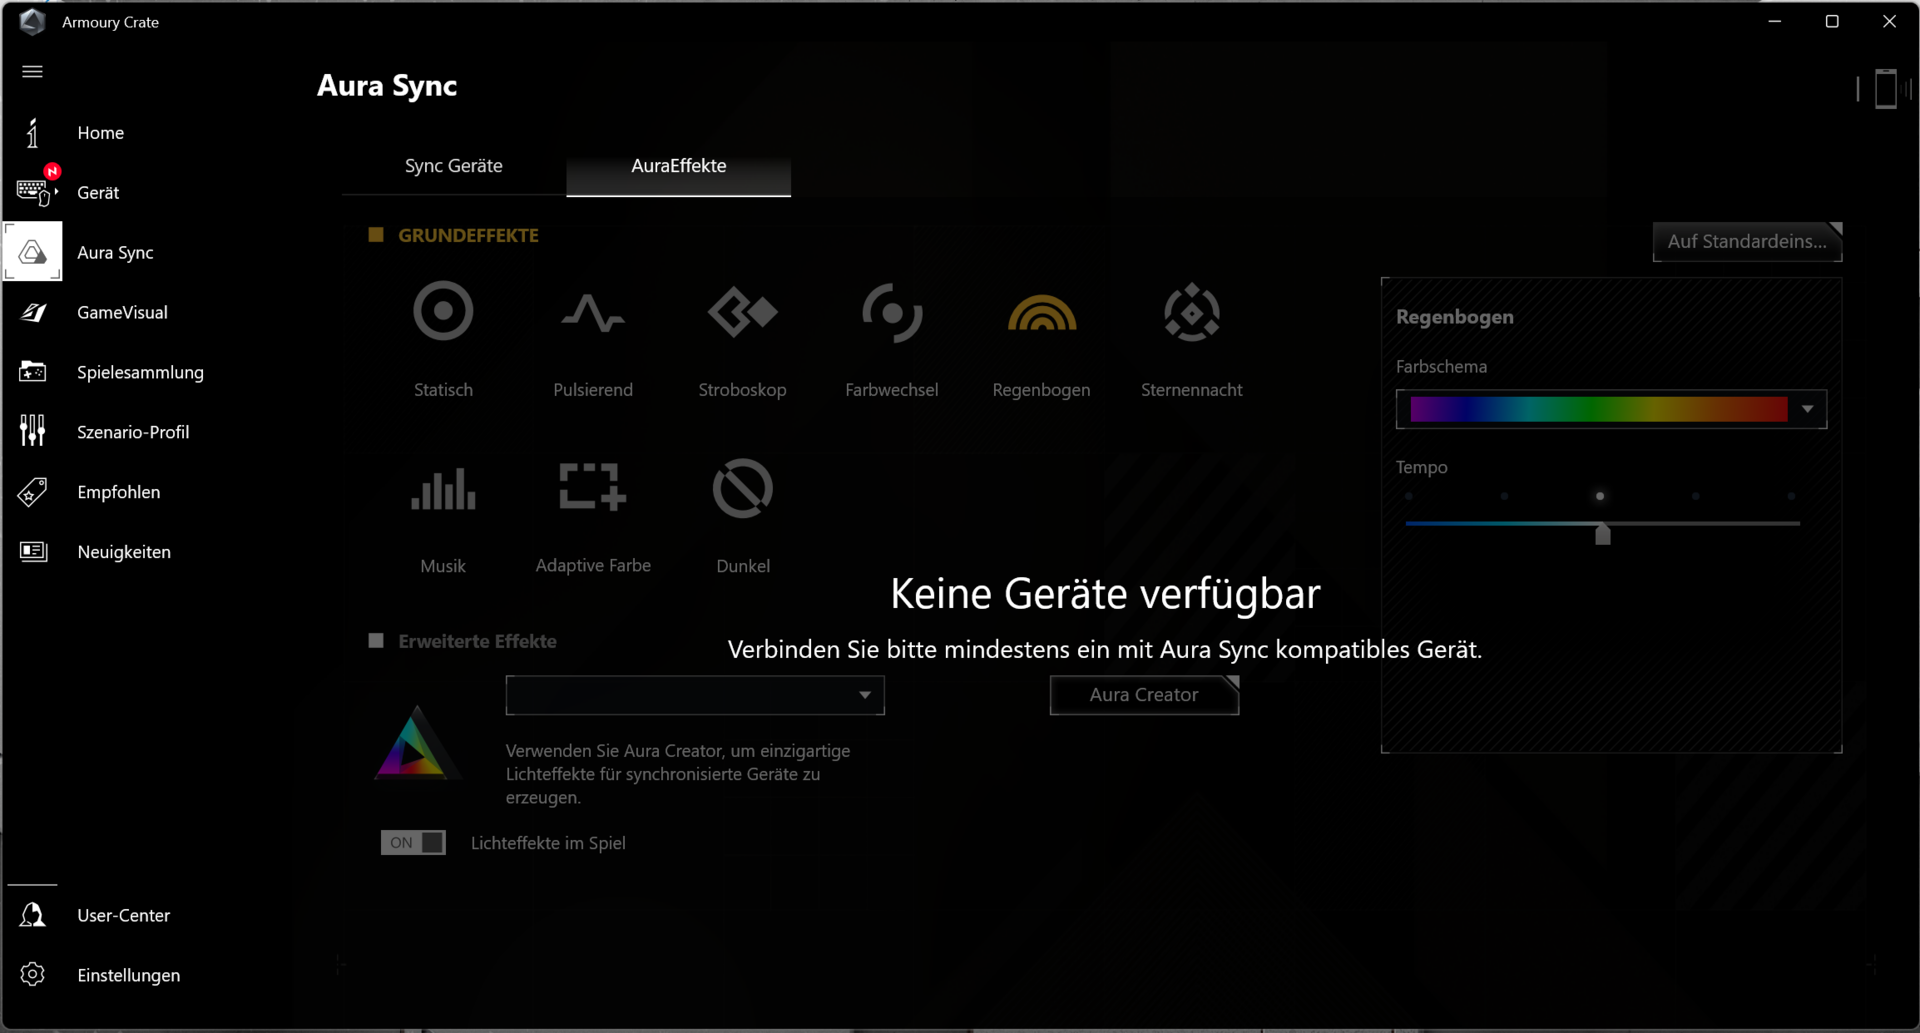
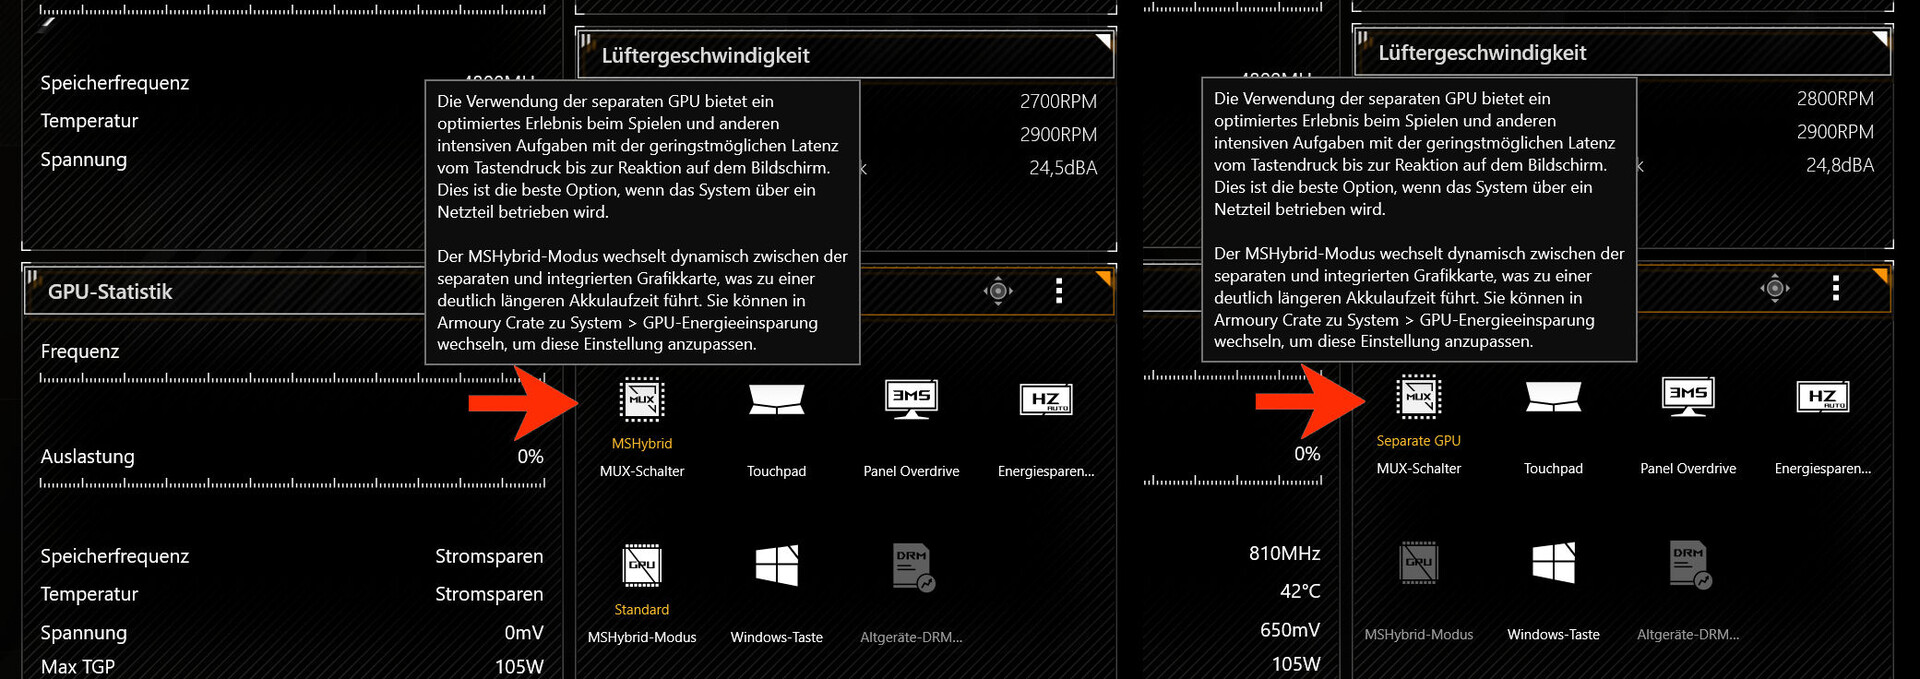
Switching between Optimus mode ("MSHybrid") and dGPU mode ("Separate GPU") can be done with a mouse click in the Armoury Crate software (home page, system configuration section). The laptop always needs to be restarted. Asus makes use of a MUX switch - Advanced Optimus isn't supported. To avoid confusion: Unlike other dGPU solutions, the iGPU isn't disabled in dGPU mode, and it's still listed in the Device Manager.
| 3DMark Performance Rating - Percent | |
| Average of class Gaming | |
| Acer Nitro 5 AN515-58-72QR | |
| MSI Delta 15 A5EFK -1! | |
| HP Omen 16-b1090ng | |
| Asus TUF Dash F15 FX517ZR | |
| Average NVIDIA GeForce RTX 3070 Laptop GPU | |
| Asus TUF Dash F15 FX517ZR | |
| Asus TUF Dash F15 FX517ZR | |
| Razer Blade 15 Base Edition 2021, i7-10750H RTX 3060 | |
| 3DMark 11 - 1280x720 Performance GPU | |
| Average of class Gaming (1029 - 72070, n=229, last 2 years) | |
| Acer Nitro 5 AN515-58-72QR | |
| HP Omen 16-b1090ng | |
| MSI Delta 15 A5EFK | |
| Asus TUF Dash F15 FX517ZR (dGPU, Turbo) | |
| Average NVIDIA GeForce RTX 3070 Laptop GPU (12535 - 38275, n=54) | |
| Asus TUF Dash F15 FX517ZR (Leise) | |
| Asus TUF Dash F15 FX517ZR | |
| Razer Blade 15 Base Edition 2021, i7-10750H RTX 3060 | |
V-Ray Benchmark Next 4.10: GPU | CPU
Geekbench 5.5: OpenCL Score
| V-Ray 5 Benchmark / GPU RTX | |
| Average of class Gaming (171 - 3824, n=125, last 2 years) | |
| Acer Nitro 5 AN515-58-72QR (5.0.1) | |
| Asus TUF Dash F15 FX517ZR (5.0.1, Turbo) | |
| Asus TUF Dash F15 FX517ZR (5.0.1, dGPU, Turbo) | |
| Average NVIDIA GeForce RTX 3070 Laptop GPU (180 - 1764, n=24) | |
| Asus TUF Dash F15 FX517ZR (5.0.1) | |
| Asus TUF Dash F15 FX517ZR (5.0.1, Leise) | |
| V-Ray 5 Benchmark / GPU CUDA | |
| Average of class Gaming (120 - 2797, n=128, last 2 years) | |
| Acer Nitro 5 AN515-58-72QR (5.0.1) | |
| Asus TUF Dash F15 FX517ZR (5.0.1, Turbo) | |
| Asus TUF Dash F15 FX517ZR (5.0.1, dGPU, Turbo) | |
| Asus TUF Dash F15 FX517ZR (5.0.1) | |
| Asus TUF Dash F15 FX517ZR (5.0.1, Leise) | |
| Average NVIDIA GeForce RTX 3070 Laptop GPU (164 - 1283, n=22) | |
| V-Ray 5 Benchmark / CPU | |
| Average of class Gaming (1690 - 26944, n=140, last 2 years) | |
| Acer Nitro 5 AN515-58-72QR (5.0.1) | |
| Asus TUF Dash F15 FX517ZR (5.0.1, Turbo) | |
| Asus TUF Dash F15 FX517ZR (5.0.1, dGPU, Turbo) | |
| Asus TUF Dash F15 FX517ZR (5.0.1) | |
| Asus TUF Dash F15 FX517ZR (5.0.1, Leise) | |
| Average NVIDIA GeForce RTX 3070 Laptop GPU (1690 - 12106, n=31) | |
| Razer Blade 15 Base Edition 2021, i7-10750H RTX 3060 (5.0.1) | |
| V-Ray Benchmark Next 4.10 / GPU | |
| Average of class Gaming (54 - 1334, n=184, last 2 years) | |
| Average NVIDIA GeForce RTX 3070 Laptop GPU (55 - 533, n=47) | |
| Asus TUF Dash F15 FX517ZR (v4.10.07, Turbo) | |
| Asus TUF Dash F15 FX517ZR (v4.10.07, dGPU, Turbo) | |
| Asus TUF Dash F15 FX517ZR (v4.10.07 ) | |
| Acer Nitro 5 AN515-58-72QR (v4.10.07 ) | |
| HP Omen 16-b1090ng (v4.10.07 ) | |
| Asus TUF Dash F15 FX517ZR (v4.10.07, Leise) | |
| Razer Blade 15 Base Edition 2021, i7-10750H RTX 3060 (v4.10.07 ) | |
| MSI Delta 15 A5EFK (v4.10.07 ) | |
| V-Ray Benchmark Next 4.10 / CPU | |
| Average of class Gaming (2741 - 37629, n=184, last 2 years) | |
| HP Omen 16-b1090ng (v4.10.07 ) | |
| Acer Nitro 5 AN515-58-72QR (v4.10.07 ) | |
| Asus TUF Dash F15 FX517ZR (v4.10.07, Turbo) | |
| Asus TUF Dash F15 FX517ZR (v4.10.07, dGPU, Turbo) | |
| Asus TUF Dash F15 FX517ZR (v4.10.07 ) | |
| MSI Delta 15 A5EFK (v4.10.07 ) | |
| Asus TUF Dash F15 FX517ZR (v4.10.07, Leise) | |
| Average NVIDIA GeForce RTX 3070 Laptop GPU (2741 - 18570, n=47) | |
| Razer Blade 15 Base Edition 2021, i7-10750H RTX 3060 (v4.10.07 ) | |
| Geekbench 5.5 / OpenCL Score | |
| Acer Nitro 5 AN515-58-72QR | |
| Average of class Gaming (5039 - 226512, n=230, last 2 years) | |
| Asus TUF Dash F15 FX517ZR (dGPU, Turbo) | |
| Asus TUF Dash F15 FX517ZR (Leise) | |
| Asus TUF Dash F15 FX517ZR (Turbo) | |
| HP Omen 16-b1090ng | |
| Asus TUF Dash F15 FX517ZR | |
| Average NVIDIA GeForce RTX 3070 Laptop GPU (5732 - 125874, n=52) | |
| Razer Blade 15 Base Edition 2021, i7-10750H RTX 3060 | |
| MSI Delta 15 A5EFK | |
| 3DMark 06 Standard Score | 47705 points | |
| 3DMark 11 Performance | 26776 points | |
| 3DMark Cloud Gate Standard Score | 58266 points | |
| 3DMark Fire Strike Score | 19730 points | |
| 3DMark Time Spy Score | 8210 points | |
Help | ||
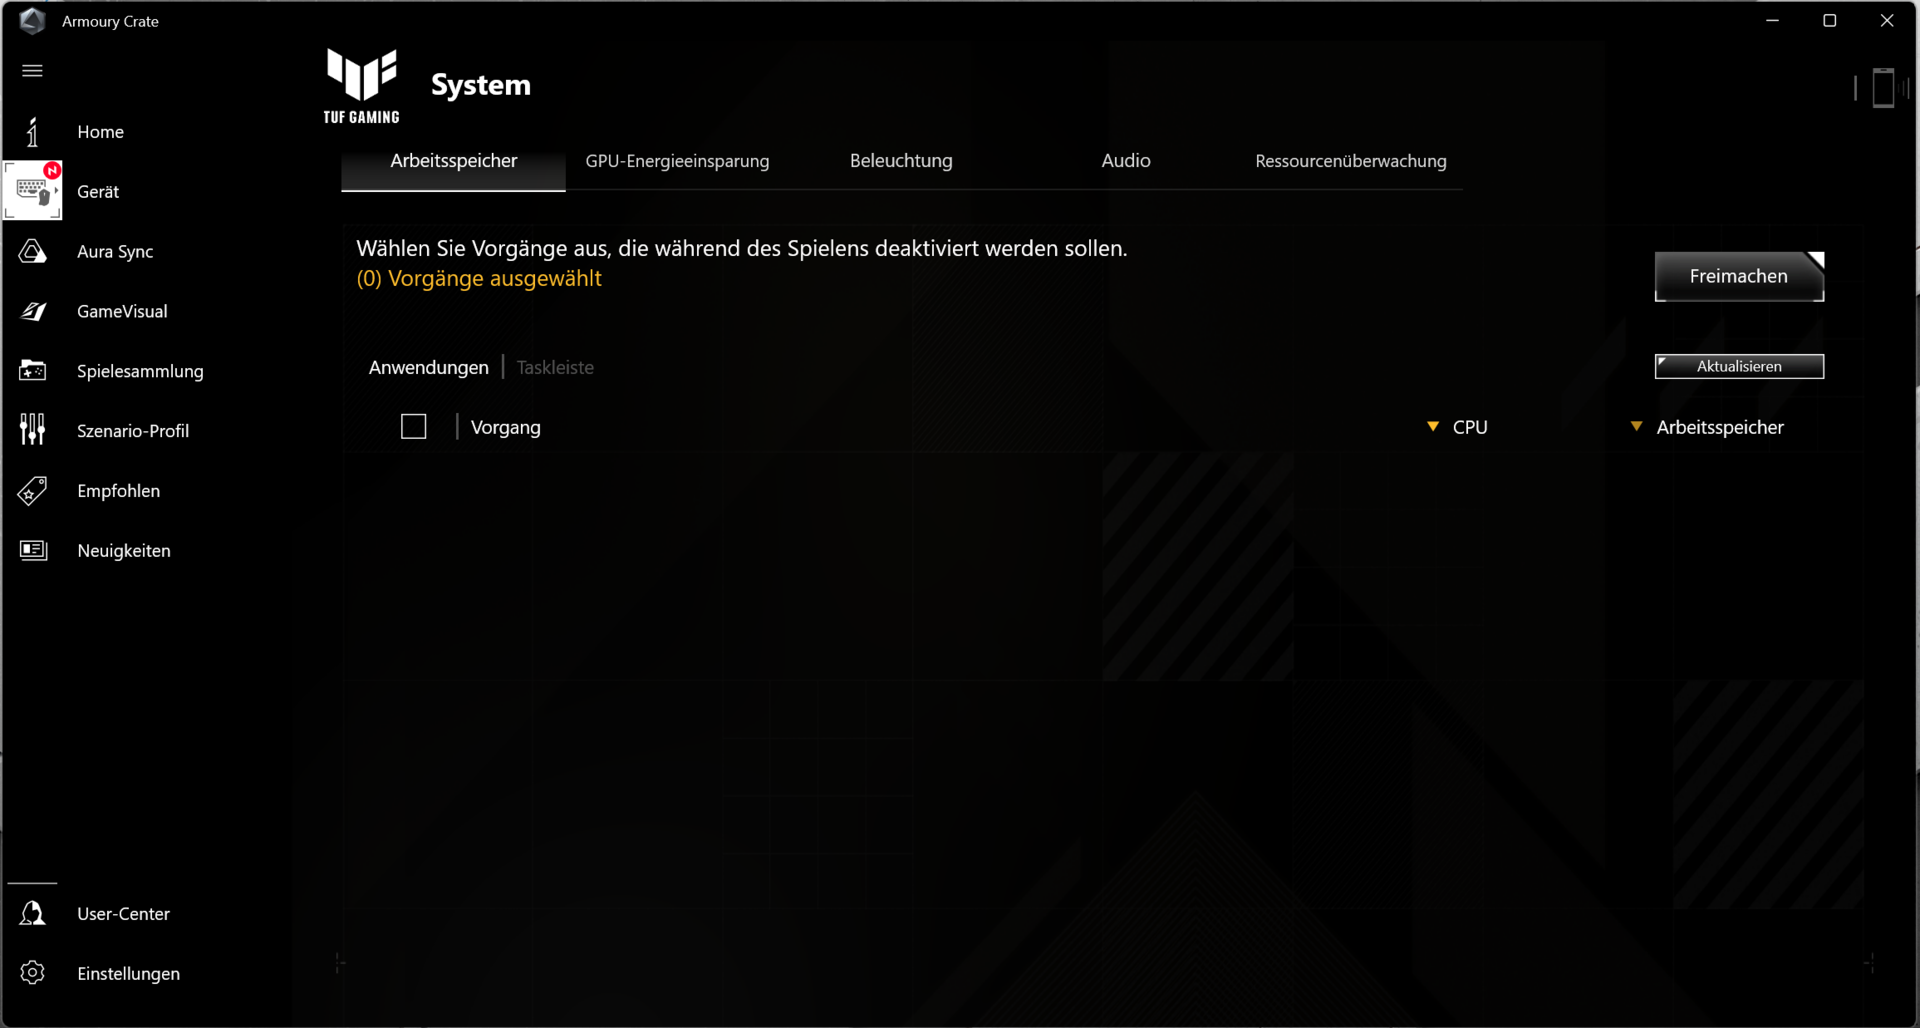
DRM problems when playing games? Disable the E-cores
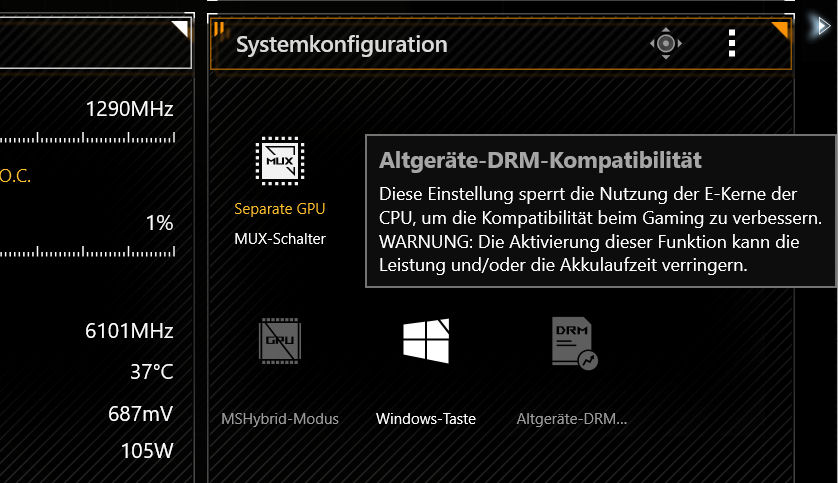
When the Alder Lake platform was launched, issues in connection with the DRM mechanisms of various games became known: The DRM software might recognize the E-cores of the CPU as another system and refuse to launch the game as a result. By now, these problems should have been fixed to a large extent by various updates.
If the latter is not the case for a certain game, the Asus laptop offers a solution: Not using the E-cores. This is achieved by clicking the "Legacy DRM Compatibility" button within Armoury Crate. The cores remain active, but they aren't used.
The device's BIOS offers another option: A complete deactivation of the E-cores. Everything between 0 and 4 cores can be chosen here. If all E-cores are disabled, the "Legacy Device DRM Compatibility" button disappears from the Armoury Crate software.

Gaming performance
The hardware can handle QHD gaming at high to maximum settings. The frame rates are below the RTX 3070 average. A direct image output via the GeForce GPU leads to higher rates.
| The Witcher 3 - 1920x1080 Ultra Graphics & Postprocessing (HBAO+) | |
| Average of class Gaming (8.61 - 216, n=225, last 2 years) | |
| Acer Nitro 5 AN515-58-72QR | |
| Asus TUF Dash F15 FX517ZR (dGPU, Turbo) | |
| HP Omen 16-b1090ng | |
| MSI Delta 15 A5EFK | |
| Average NVIDIA GeForce RTX 3070 Laptop GPU (34.9 - 109, n=52) | |
| Asus TUF Dash F15 FX517ZR | |
| Razer Blade 15 Base Edition 2021, i7-10750H RTX 3060 | |
| Asus TUF Dash F15 FX517ZR (Leise) | |
| Dota 2 Reborn - 1920x1080 ultra (3/3) best looking | |
| HP Omen 16-b1090ng | |
| Asus TUF Dash F15 FX517ZR (dGPU, Turbo) | |
| Average of class Gaming (26.9 - 220, n=235, last 2 years) | |
| Acer Nitro 5 AN515-58-72QR | |
| Razer Blade 15 Base Edition 2021, i7-10750H RTX 3060 | |
| Average NVIDIA GeForce RTX 3070 Laptop GPU (26.9 - 163.9, n=58) | |
| Asus TUF Dash F15 FX517ZR (Leise) | |
| MSI Delta 15 A5EFK | |
| Asus TUF Dash F15 FX517ZR | |
| X-Plane 11.11 - 1920x1080 high (fps_test=3) | |
| HP Omen 16-b1090ng | |
| Asus TUF Dash F15 FX517ZR (dGPU, Turbo) | |
| Average of class Gaming (12.4 - 166.2, n=240, last 2 years) | |
| Asus TUF Dash F15 FX517ZR | |
| Asus TUF Dash F15 FX517ZR (Leise) | |
| Acer Nitro 5 AN515-58-72QR | |
| Average NVIDIA GeForce RTX 3070 Laptop GPU (12.4 - 118.8, n=61) | |
| Razer Blade 15 Base Edition 2021, i7-10750H RTX 3060 | |
| Final Fantasy XV Benchmark | |
| 1920x1080 High Quality | |
| Average of class Gaming (9.13 - 194.9, n=225, last 2 years) | |
| HP Omen 16-b1090ng | |
| Asus TUF Dash F15 FX517ZR (1.3, dGPU, Turbo) | |
| Acer Nitro 5 AN515-58-72QR (1.3) | |
| Average NVIDIA GeForce RTX 3070 Laptop GPU (27.9 - 107, n=49) | |
| Asus TUF Dash F15 FX517ZR (1.3) | |
| MSI Delta 15 A5EFK | |
| Razer Blade 15 Base Edition 2021, i7-10750H RTX 3060 (1.3) | |
| Asus TUF Dash F15 FX517ZR (1.3, Leise) | |
| 2560x1440 High Quality | |
| Average of class Gaming (19.8 - 162.9, n=159, last 2 years) | |
| Asus TUF Dash F15 FX517ZR (1.3, dGPU, Turbo) | |
| Acer Nitro 5 AN515-58-72QR (1.3) | |
| Average NVIDIA GeForce RTX 3070 Laptop GPU (19.8 - 79.9, n=25) | |
| Asus TUF Dash F15 FX517ZR (1.3) | |
| Asus TUF Dash F15 FX517ZR (1.3, Leise) | |
| GTA V | |
| 2560x1440 Highest Settings possible AA:4xMSAA + FX AF:16x | |
| Average of class Gaming (5.61 - 160.6, n=135, last 2 years) | |
| Asus TUF Dash F15 FX517ZR (dGPU, Turbo) | |
| Average NVIDIA GeForce RTX 3070 Laptop GPU (70.8 - 97.1, n=19) | |
| Acer Nitro 5 AN515-58-72QR | |
| Asus TUF Dash F15 FX517ZR | |
| Asus TUF Dash F15 FX517ZR (Leise) | |
| 1920x1080 Highest Settings possible AA:4xMSAA + FX AF:16x | |
| HP Omen 16-b1090ng | |
| Average of class Gaming (6.38 - 167.7, n=215, last 2 years) | |
| Asus TUF Dash F15 FX517ZR (dGPU, Turbo) | |
| Asus TUF Dash F15 FX517ZR | |
| Acer Nitro 5 AN515-58-72QR | |
| Average NVIDIA GeForce RTX 3070 Laptop GPU (21.7 - 125.8, n=50) | |
| Asus TUF Dash F15 FX517ZR (Leise) | |
| MSI Delta 15 A5EFK | |
| Razer Blade 15 Base Edition 2021, i7-10750H RTX 3060 | |
| Strange Brigade | |
| 2560x1440 ultra AA:ultra AF:16 | |
| Average of class Gaming (79.8 - 322, n=135, last 2 years) | |
| Acer Nitro 5 AN515-58-72QR (1.47.22.14 D3D12) | |
| Asus TUF Dash F15 FX517ZR (1.47.22.14 D3D12, dGPU, Turbo) | |
| Average NVIDIA GeForce RTX 3070 Laptop GPU (82.3 - 140.5, n=18) | |
| Asus TUF Dash F15 FX517ZR (1.47.22.14 D3D12) | |
| Asus TUF Dash F15 FX517ZR (1.47.22.14 D3D12, Leise) | |
| 1920x1080 ultra AA:ultra AF:16 | |
| Average of class Gaming (14.6 - 421, n=223, last 2 years) | |
| Acer Nitro 5 AN515-58-72QR (1.47.22.14 D3D12) | |
| Asus TUF Dash F15 FX517ZR (1.47.22.14 D3D12, dGPU, Turbo) | |
| MSI Delta 15 A5EFK (1.47.22.14 D3D12) | |
| Average NVIDIA GeForce RTX 3070 Laptop GPU (36.2 - 194, n=46) | |
| Asus TUF Dash F15 FX517ZR (1.47.22.14 D3D12) | |
| Asus TUF Dash F15 FX517ZR (1.47.22.14 D3D12, Leise) | |
| HP Omen 16-b1090ng (1.47.22.14 D3D12) | |
| Razer Blade 15 Base Edition 2021, i7-10750H RTX 3060 (1.47.22.14 D3D12) | |
| F1 2021 | |
| 2560x1440 Ultra High Preset + Raytracing AA:T AF:16x | |
| Average of class Gaming (47.5 - 204, n=39, last 2 years) | |
| Asus TUF Dash F15 FX517ZR (874931, dGPU, Turbo) | |
| Average NVIDIA GeForce RTX 3070 Laptop GPU (67.1 - 90.2, n=11) | |
| Acer Nitro 5 AN515-58-72QR (874931) | |
| Asus TUF Dash F15 FX517ZR (874931) | |
| Asus TUF Dash F15 FX517ZR (874931, Leise) | |
| 1920x1080 Ultra High Preset + Raytracing AA:T AF:16x | |
| Average of class Gaming (13.5 - 271, n=63, last 2 years) | |
| Acer Nitro 5 AN515-58-72QR (874931) | |
| Asus TUF Dash F15 FX517ZR (874931, dGPU, Turbo) | |
| MSI Delta 15 A5EFK | |
| Average NVIDIA GeForce RTX 3070 Laptop GPU (33.1 - 123.1, n=23) | |
| Asus TUF Dash F15 FX517ZR (874931) | |
| Asus TUF Dash F15 FX517ZR (874931, Leise) | |
| Far Cry 5 | |
| 2560x1440 Ultra Preset AA:T | |
| Average of class Gaming (14 - 194, n=91, last 2 years) | |
| Average NVIDIA GeForce RTX 3070 Laptop GPU (81 - 101, n=18) | |
| Asus TUF Dash F15 FX517ZR (dGPU, Turbo) | |
| Asus TUF Dash F15 FX517ZR | |
| Acer Nitro 5 AN515-58-72QR | |
| 1920x1080 Ultra Preset AA:T | |
| Average of class Gaming (14 - 218, n=123, last 2 years) | |
| Asus TUF Dash F15 FX517ZR (dGPU, Turbo) | |
| Average NVIDIA GeForce RTX 3070 Laptop GPU (89 - 140, n=36) | |
| Asus TUF Dash F15 FX517ZR | |
| MSI Delta 15 A5EFK | |
| Acer Nitro 5 AN515-58-72QR | |
| Tiny Tina's Wonderlands | |
| 1920x1080 Badass Preset (DX12) | |
| Average of class Gaming (9.7 - 189.4, n=60, last 2 years) | |
| HP Omen 16-b1090ng | |
| Average NVIDIA GeForce RTX 3070 Laptop GPU (81.5 - 96, n=4) | |
| Asus TUF Dash F15 FX517ZR | |
| 2560x1440 Badass Preset (DX12) | |
| Average of class Gaming (13.6 - 137.8, n=47, last 2 years) | |
| HP Omen 16-b1090ng | |
| Average NVIDIA GeForce RTX 3070 Laptop GPU (57.2 - 66.1, n=3) | |
| Asus TUF Dash F15 FX517ZR | |
| Cyberpunk 2077 1.6 | |
| 1920x1080 Ultra Preset | |
| Average of class Gaming (16.7 - 159.7, n=103, last 2 years) | |
| Average NVIDIA GeForce RTX 3070 Laptop GPU (61.5 - 93, n=8) | |
| Asus TUF Dash F15 FX517ZR | |
| 2560x1440 Ultra Preset | |
| Average of class Gaming (10.7 - 116, n=81, last 2 years) | |
| Average NVIDIA GeForce RTX 3070 Laptop GPU (43.5 - 49.5, n=7) | |
| Asus TUF Dash F15 FX517ZR | |
| 1920x1080 Ray Tracing Ultra Preset (DLSS off) | |
| Average of class Gaming (12.6 - 74, n=38, last 2 years) | |
| Average NVIDIA GeForce RTX 3070 Laptop GPU (28.6 - 35.4, n=5) | |
| Asus TUF Dash F15 FX517ZR | |
In order to verify whether the frame rates remain largely constant over a prolonged period of time, we let the game The Witcher 3 run for about 60 minutes at Full HD resolution and maximum quality settings. The character is not moved. A drop in frame rates wasn't found.
The Witcher 3 FPS diagram
| low | med. | high | ultra | QHD | |
| GTA V (2015) | 186.9 | 182.8 | 165.3 | 104 | 79.7 |
| The Witcher 3 (2015) | 289 | 169.6 | 148 | 86.7 | |
| Dota 2 Reborn (2015) | 164.1 | 152.8 | 142.7 | 110.3 | |
| Final Fantasy XV Benchmark (2018) | 158.6 | 110.5 | 85.7 | 65.1 | |
| X-Plane 11.11 (2018) | 141.2 | 125.2 | 100.2 | ||
| Far Cry 5 (2018) | 133 | 116 | 111 | 104 | 81 |
| Strange Brigade (2018) | 373 | 203 | 171.5 | 151.5 | 112.9 |
| F1 2021 (2021) | 298 | 210 | 178.7 | 98.1 | 74.1 |
| Cyberpunk 2077 1.6 (2022) | 117.5 | 100.1 | 81.3 | 68.6 | 43.8 |
| Tiny Tina's Wonderlands (2022) | 174.7 | 142.9 | 103.4 | 81.5 | 57.2 |
Emissions - The FX517Z doesn't generate excessive noise
Noise emissions
The two fans only emit little noise in everyday use (office, Internet). They even stand still occasionally. However, things gets quite loud under full load with maximum sound pressure levels of 49 dB(A) (stress test) and 47 dB(A) (our The Witcher 3 test), respectively. That said, the FX517 remains below the values of most rivals. All in all, the noise generated is bearable. Noise development under load can be reduced by using the "Quiet" profile - at the expense of performance.
Noise Level
| Idle |
| 26 / 32 / 33 dB(A) |
| Load |
| 48 / 49 dB(A) |
 | ||
30 dB silent 40 dB(A) audible 50 dB(A) loud |
||
min: | ||
| Asus TUF Dash F15 FX517ZR GeForce RTX 3070 Laptop GPU, i7-12650H, Samsung PM991a MZVLQ1T0HBLB | Acer Nitro 5 AN515-58-72QR GeForce RTX 3070 Ti Laptop GPU, i7-12700H, Samsung PM9A1 MZVL21T0HCLR | HP Omen 16-b1090ng GeForce RTX 3070 Ti Laptop GPU, i7-12700H, WDC PC SN810 1TB | MSI Delta 15 A5EFK Radeon RX 6700M, R9 5900HX, Micron 2210 MTFDHBA1T0QFD | Razer Blade 15 Base Edition 2021, i7-10750H RTX 3060 GeForce RTX 3060 Laptop GPU, i7-10750H, Samsung SSD PM981a MZVLB512HBJQ | |
|---|---|---|---|---|---|
| Noise | -1% | -6% | -2% | 9% | |
| off / environment * | 26 | 26 -0% | 26 -0% | 25 4% | 25.3 3% |
| Idle Minimum * | 26 | 26 -0% | 30 -15% | 25 4% | 25.4 2% |
| Idle Average * | 32 | 29 9% | 31 3% | 30 6% | 25.4 21% |
| Idle Maximum * | 33 | 33 -0% | 33 -0% | 40 -21% | 25.4 23% |
| Load Average * | 48 | 47 2% | 49 -2% | 47 2% | 42.5 11% |
| Witcher 3 ultra * | 47 | 53 -13% | 53 -13% | 48 -2% | 42 11% |
| Load Maximum * | 49 | 53 -8% | 57 -16% | 51 -4% | 52.2 -7% |
* ... smaller is better
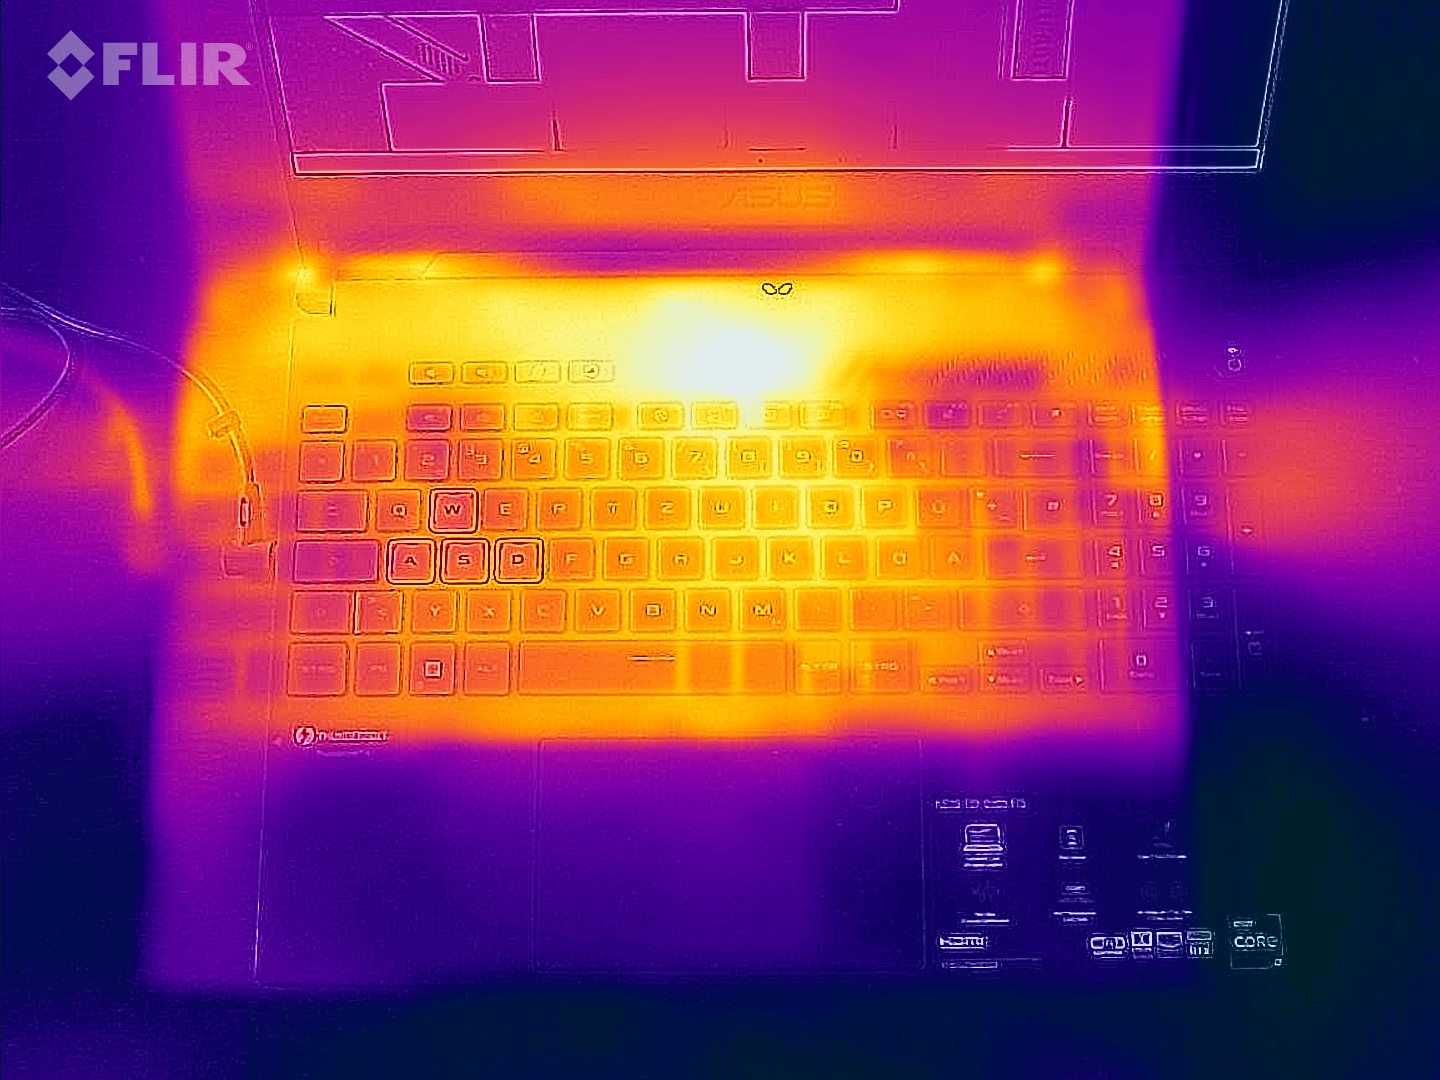
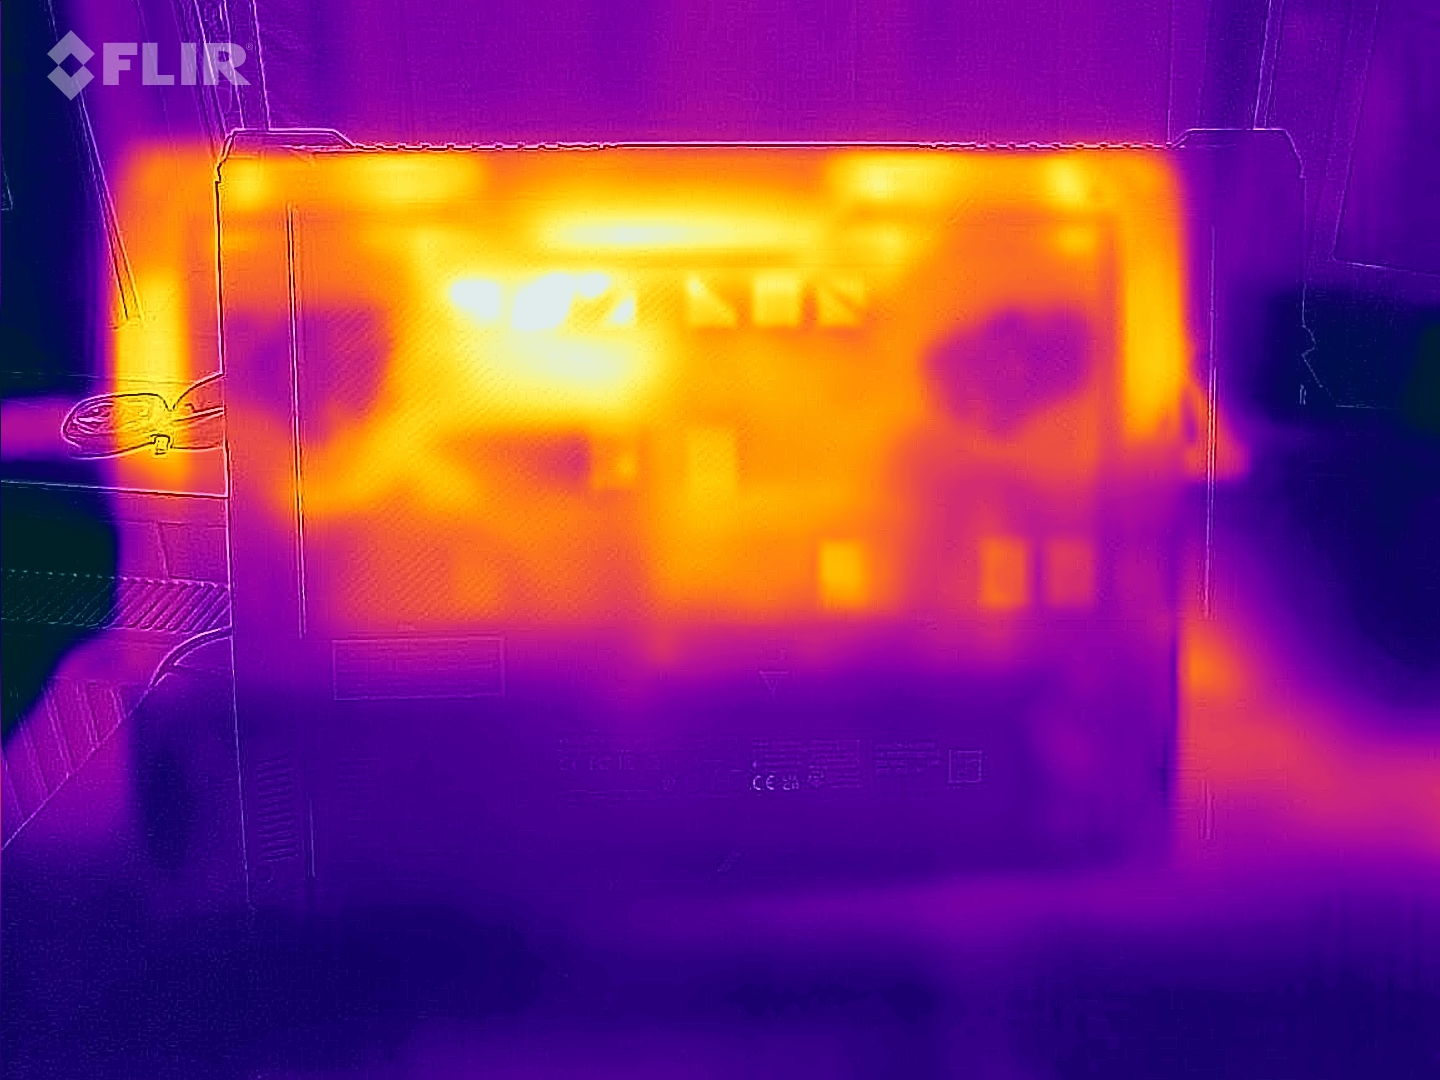
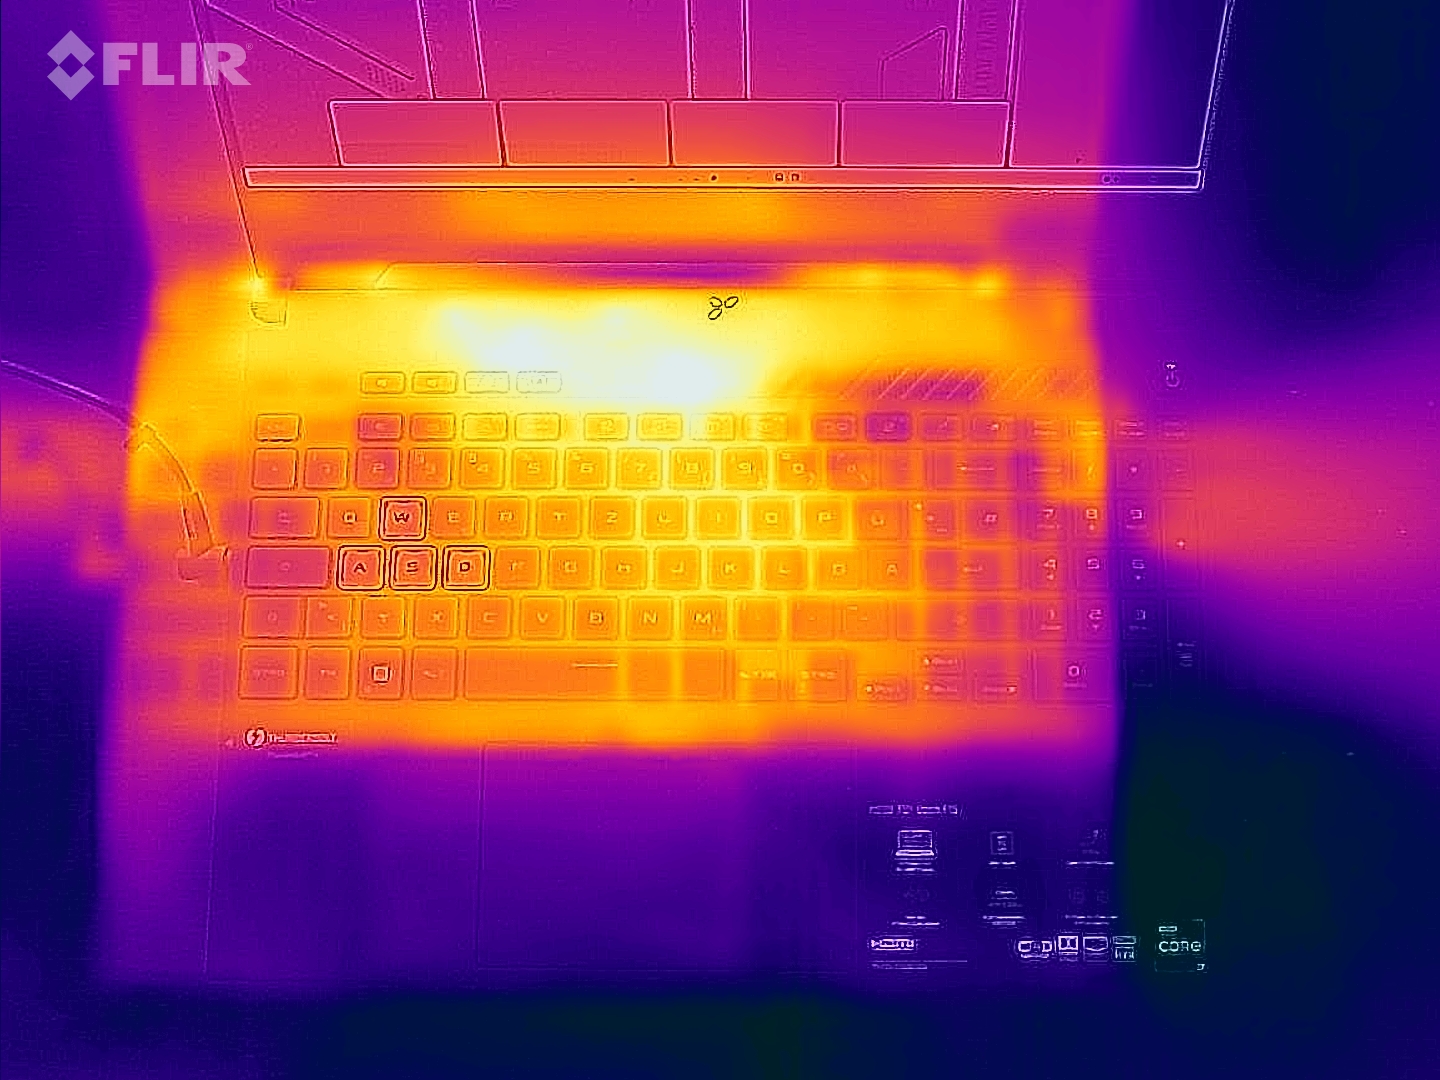
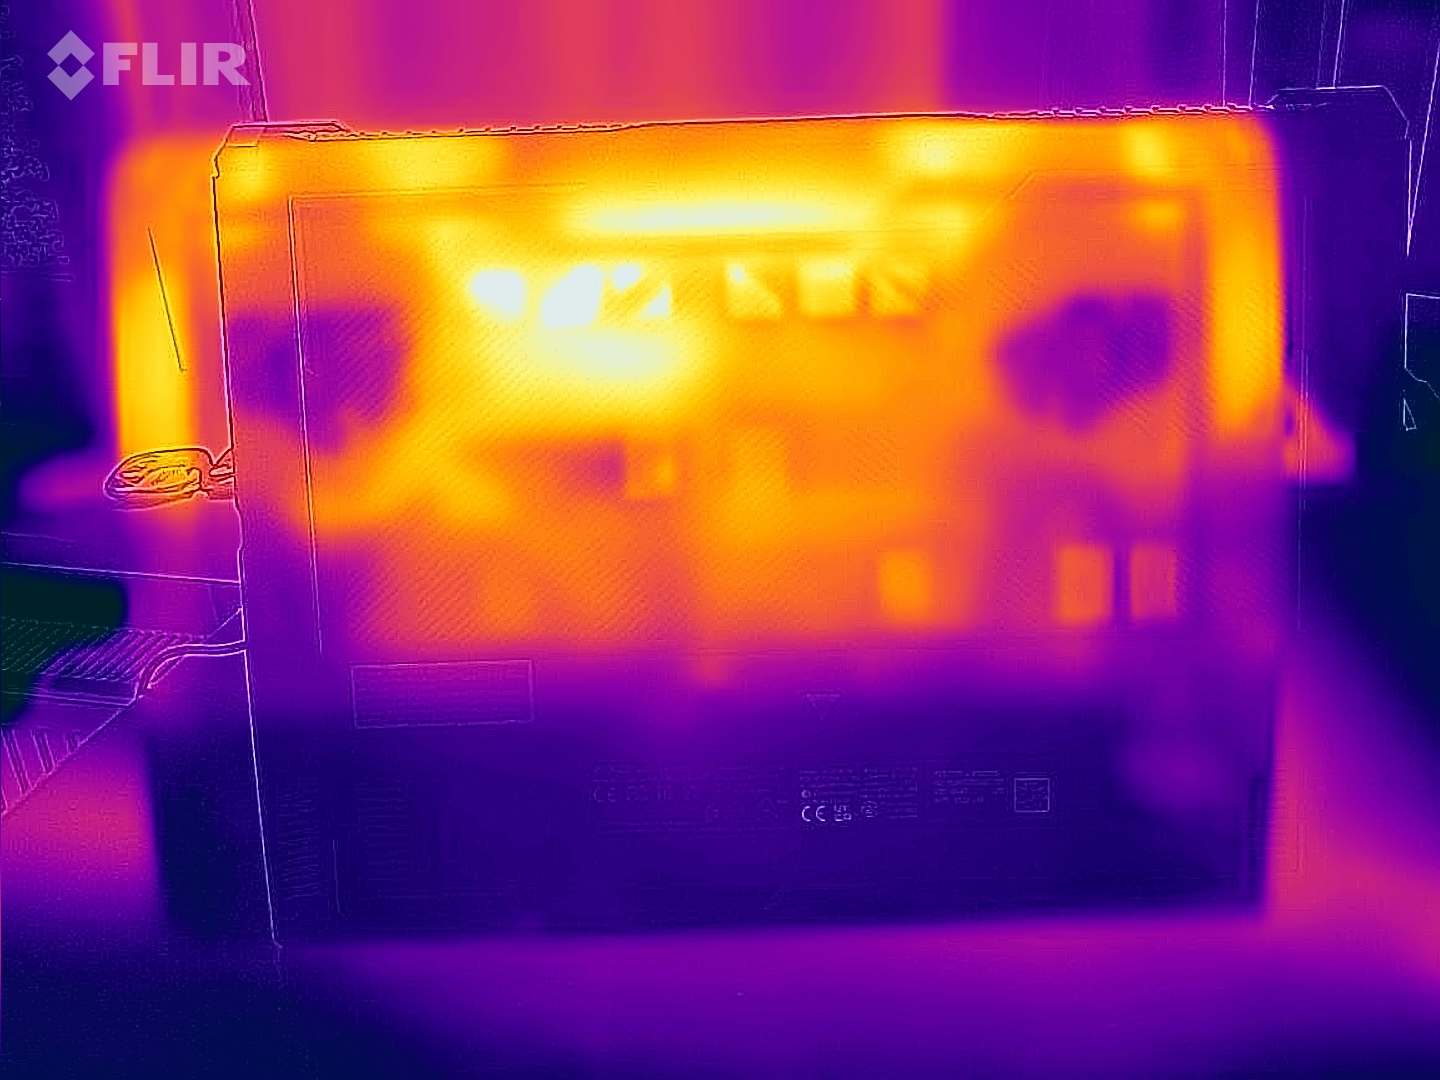
Temperature
The case temperatures remain within an acceptable range in everyday use (office, Internet). The laptop heats up noticeably under load (stress test, The Witcher 3), but not excessively. The CPU temperatures are no cause for concern.
(-) The maximum temperature on the upper side is 52 °C / 126 F, compared to the average of 40.4 °C / 105 F, ranging from 21.2 to 68.8 °C for the class Gaming.
(-) The bottom heats up to a maximum of 52 °C / 126 F, compared to the average of 43.2 °C / 110 F
(±) In idle usage, the average temperature for the upper side is 32.1 °C / 90 F, compared to the device average of 33.8 °C / 93 F.
(-) Playing The Witcher 3, the average temperature for the upper side is 45.3 °C / 114 F, compared to the device average of 33.8 °C / 93 F.
(±) The palmrests and touchpad can get very hot to the touch with a maximum of 39 °C / 102.2 F.
(-) The average temperature of the palmrest area of similar devices was 28.9 °C / 84 F (-10.1 °C / -18.2 F).
| Asus TUF Dash F15 FX517ZR Intel Core i7-12650H, NVIDIA GeForce RTX 3070 Laptop GPU | Acer Nitro 5 AN515-58-72QR Intel Core i7-12700H, NVIDIA GeForce RTX 3070 Ti Laptop GPU | HP Omen 16-b1090ng Intel Core i7-12700H, NVIDIA GeForce RTX 3070 Ti Laptop GPU | MSI Delta 15 A5EFK AMD Ryzen 9 5900HX, AMD Radeon RX 6700M | Razer Blade 15 Base Edition 2021, i7-10750H RTX 3060 Intel Core i7-10750H, NVIDIA GeForce RTX 3060 Laptop GPU | |
|---|---|---|---|---|---|
| Heat | 4% | 14% | 5% | 4% | |
| Maximum Upper Side * | 52 | 48 8% | 41 21% | 50 4% | 45.2 13% |
| Maximum Bottom * | 52 | 51 2% | 62 -19% | 55 -6% | 48 8% |
| Idle Upper Side * | 33 | 34 -3% | 25 24% | 31 6% | 34.4 -4% |
| Idle Bottom * | 36 | 33 8% | 26 28% | 30 17% | 37.2 -3% |
* ... smaller is better
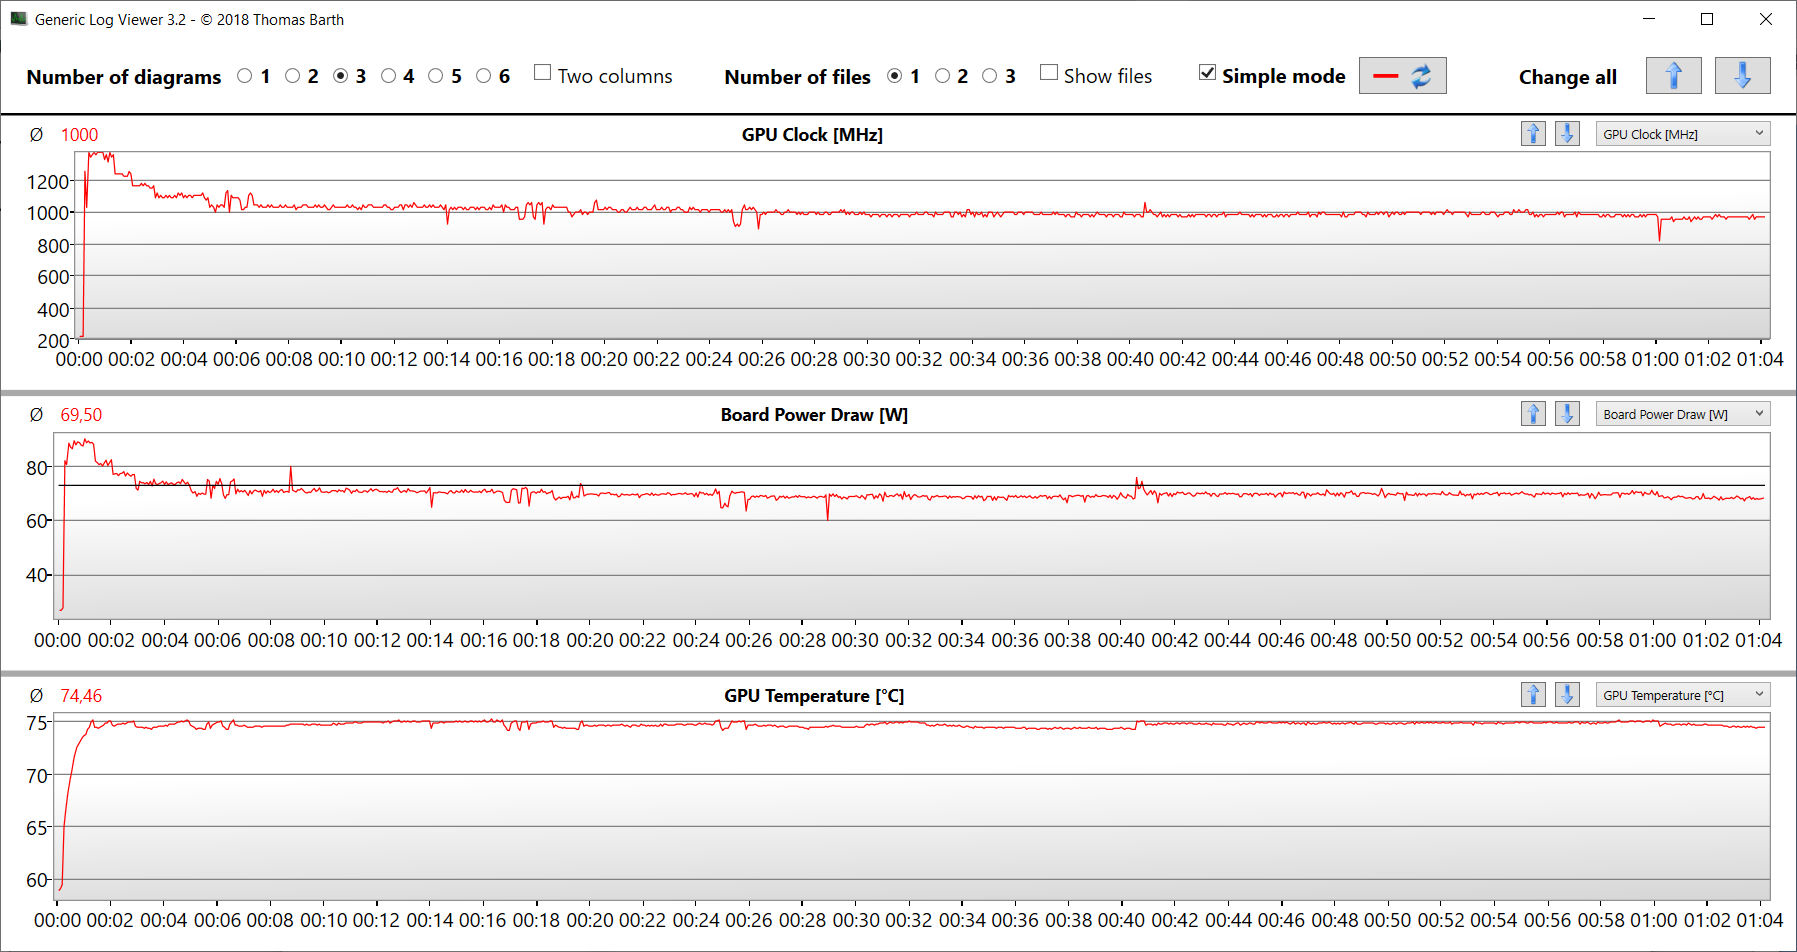
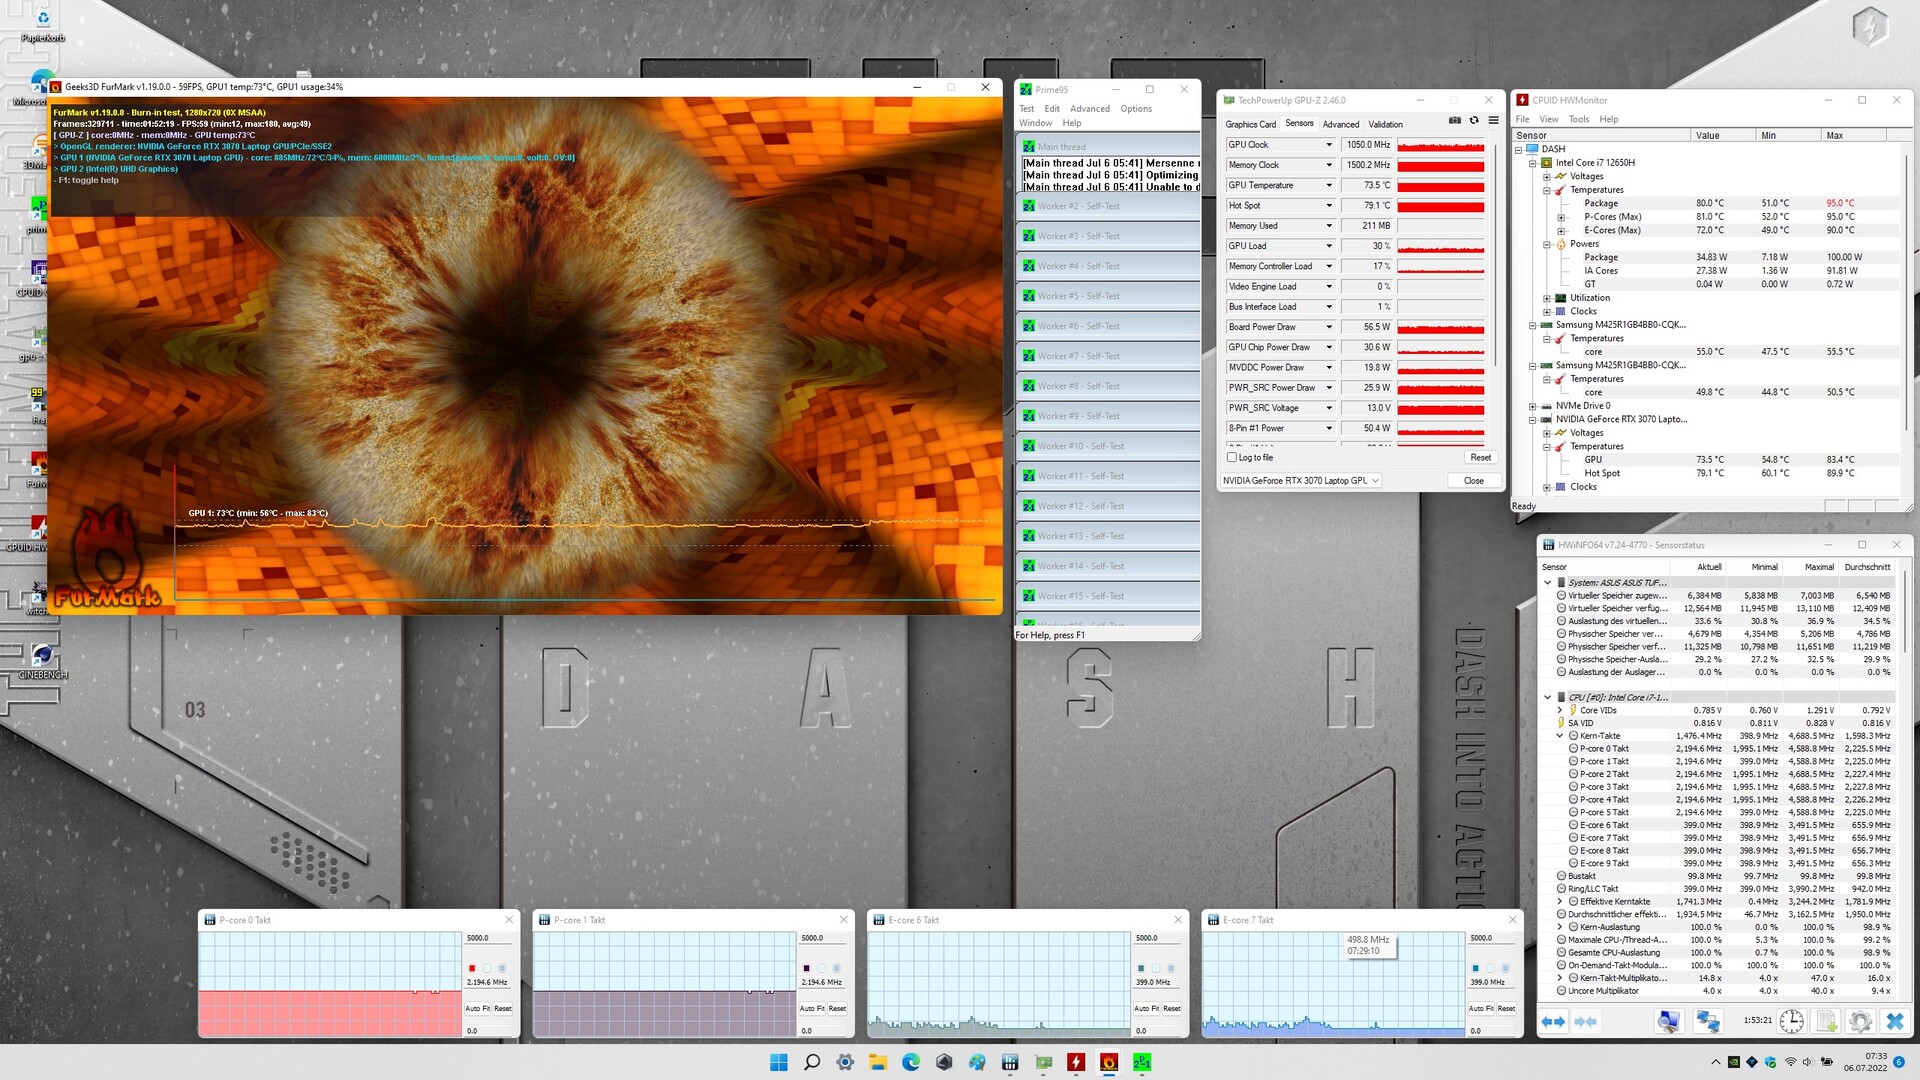
Stress test
The CPU processes the stress test (Prime95 and FurMark run for at least an hour) at low clock rates (P-cores: Approx. 2.2 GHz; E-cores: Approx. 0.4 GHz). The GPU runs at speeds around 1,050 MHz. The stress test represents an extreme scenario. We use this test to verify that the system remains stable under full load.
Speakers
The stereo speakers produce a decent sound that can barely present any bass. The use of headphones or external speakers is recommended for a better sound experience.
Asus TUF Dash F15 FX517ZR audio analysis
(±) | speaker loudness is average but good (79 dB)
Bass 100 - 315 Hz
(-) | nearly no bass - on average 19.2% lower than median
(±) | linearity of bass is average (9.6% delta to prev. frequency)
Mids 400 - 2000 Hz
(+) | balanced mids - only 2.7% away from median
(+) | mids are linear (5% delta to prev. frequency)
Highs 2 - 16 kHz
(+) | balanced highs - only 2.2% away from median
(±) | linearity of highs is average (7.7% delta to prev. frequency)
Overall 100 - 16.000 Hz
(±) | linearity of overall sound is average (15.3% difference to median)
Compared to same class
» 31% of all tested devices in this class were better, 6% similar, 63% worse
» The best had a delta of 6%, average was 18%, worst was 132%
Compared to all devices tested
» 18% of all tested devices were better, 3% similar, 79% worse
» The best had a delta of 4%, average was 25%, worst was 134%
Acer Nitro 5 AN515-58-72QR audio analysis
(±) | speaker loudness is average but good (77 dB)
Bass 100 - 315 Hz
(±) | reduced bass - on average 14.4% lower than median
(±) | linearity of bass is average (12.8% delta to prev. frequency)
Mids 400 - 2000 Hz
(+) | balanced mids - only 1.2% away from median
(+) | mids are linear (3.2% delta to prev. frequency)
Highs 2 - 16 kHz
(±) | higher highs - on average 5.4% higher than median
(±) | linearity of highs is average (10.4% delta to prev. frequency)
Overall 100 - 16.000 Hz
(±) | linearity of overall sound is average (15.8% difference to median)
Compared to same class
» 34% of all tested devices in this class were better, 7% similar, 59% worse
» The best had a delta of 6%, average was 18%, worst was 132%
Compared to all devices tested
» 20% of all tested devices were better, 5% similar, 76% worse
» The best had a delta of 4%, average was 25%, worst was 134%
Energy management - Asus laptop offers passable battery life
Energy consumption
The overall power consumption is normal for the hardware installed here. Our The Witcher 3 test and the stress test cause power consumption to rise to an average of 138.6 watts and up to 189 watts, respectively. While our The Witcher 3 test is run with a constant power consumption, it fluctuates over the course of the stress test. The included power adapter is sufficiently powerful thanks to its nominal output of 200 watts.
| Off / Standby | |
| Idle | |
| Load |
|
| Asus TUF Dash F15 FX517ZR i7-12650H, GeForce RTX 3070 Laptop GPU, Samsung PM991a MZVLQ1T0HBLB, IPS, 2560x1440, 15.60 | Acer Nitro 5 AN515-58-72QR i7-12700H, GeForce RTX 3070 Ti Laptop GPU, Samsung PM9A1 MZVL21T0HCLR, IPS, 2560x1440, 15.60 | HP Omen 16-b1090ng i7-12700H, GeForce RTX 3070 Ti Laptop GPU, WDC PC SN810 1TB, IPS, 2560x1440, 16.10 | MSI Delta 15 A5EFK R9 5900HX, Radeon RX 6700M, Micron 2210 MTFDHBA1T0QFD, IPS-Level, 1920x1080, 15.60 | Razer Blade 15 Base Edition 2021, i7-10750H RTX 3060 i7-10750H, GeForce RTX 3060 Laptop GPU, Samsung SSD PM981a MZVLB512HBJQ, IPS, 1920x1080, 15.60 | Average NVIDIA GeForce RTX 3070 Laptop GPU | Average of class Gaming | |
|---|---|---|---|---|---|---|---|
| Power Consumption | -9% | 9% | -15% | -10% | -30% | -26% | |
| Idle Minimum * | 10 | 7 30% | 4 60% | 10 -0% | 11.7 -17% | 15.6 ? -56% | 13.7 ? -37% |
| Idle Average * | 14 | 15 -7% | 10 29% | 18 -29% | 16 -14% | 20.1 ? -44% | 19.1 ? -36% |
| Idle Maximum * | 20 | 24 -20% | 19 5% | 25 -25% | 29.3 -47% | 29.4 ? -47% | 26.8 ? -34% |
| Load Average * | 122 | 124 -2% | 114 7% | 101 17% | 95.6 22% | 110.8 ? 9% | 110.9 ? 9% |
| Witcher 3 ultra * | 138.6 | 195.1 -41% | 183.2 -32% | 187 -35% | 141.3 -2% | ||
| Load Maximum * | 189 | 220 -16% | 221 -17% | 217 -15% | 197 -4% | 214 ? -13% | 250 ? -32% |
* ... smaller is better
Energy consumption during The Witcher 3 / stress test
Energy consumption with an external monitor
Battery life
The 15.6-incher achieves runtimes of 6:57 hours and 5:46 hours, respectively, in the Wi-Fi test (accessing websites via a script) and video test (short film Big Buck Bunny (H.264 encoding, Full HD) running in a loop). The laptop's power-saving features are disabled during both tests, and the display brightness is set to about 150 cd/m². In addition, the wireless modules are disabled for the video test.
All in all, the laptop delivers acceptable runtimes, but it lags behind the very good rates of the predecessor, which has the same battery capacity. The reasons for this can be quickly identified: The FX517 has an Alder Lake processor that is generally power-hungry due to its six additional CPU cores, as well as the QHD display.
| Asus TUF Dash F15 FX517ZR i7-12650H, GeForce RTX 3070 Laptop GPU, 76 Wh | Acer Nitro 5 AN515-58-72QR i7-12700H, GeForce RTX 3070 Ti Laptop GPU, 57.5 Wh | HP Omen 16-b1090ng i7-12700H, GeForce RTX 3070 Ti Laptop GPU, 83 Wh | MSI Delta 15 A5EFK R9 5900HX, Radeon RX 6700M, 82 Wh | Razer Blade 15 Base Edition 2021, i7-10750H RTX 3060 i7-10750H, GeForce RTX 3060 Laptop GPU, 65 Wh | Average of class Gaming | |
|---|---|---|---|---|---|---|
| Battery Runtime | -39% | -14% | -5% | -31% | -13% | |
| Reader / Idle | 650 | 340 -48% | 603 -7% | 664 2% | 466 -28% | 544 ? -16% |
| H.264 | 346 | 283 -18% | 399 ? 15% | |||
| WiFi v1.3 | 417 | 234 -44% | 336 -19% | 474 14% | 289 -31% | 368 ? -12% |
| Load | 137 | 72 -47% | 114 -17% | 96 -30% | 91 -34% | 84.2 ? -39% |
Pros
Cons
Verdict - Portable gaming laptop

The Asus TUF Dash F15 was made for high-performance applications like video editing, rendering, and gaming. The laptop can manage the latter in QHD resolution and at high to maximum settings. However, the focus isn't on maximum performance, but instead, it's about a compromise between performance and portability.
The Asus TUF Dash F15 FX517ZR is a light, portable gaming laptop. The device isn't designed for maximum performance.
The Core i7-12650H and the GeForce RTX 3070 are solid upper mid-range hardware components, and they can operate at consistently high clock rates. The GPU performance rates are at the average of all the RTX 3070 laptops tested so far at best (dGPU mode) - this is due to the relatively low TGP of 105 watts.
The laptop weighs about 2 kg; it gets real-world runtimes of 6 to 7 hours out of its 76 Wh battery - very respectable, but not terrific rates. Good: The battery can be charged using a universal USB-C power adapter (min. 45 watts, 20 volts). This means that the 200-watt power adapter doesn't necessarily have to be carried around.
The matte QHD display (15.6-inch, IPS, 165 Hz) made a good impression for the most part. Only the brightness is too low. A Thunderbolt 4 port opens up expansion options in the form of a docking solution or an external GPU.
An alternative to the F15 would be the MSI Delta 15. Its weight, compactness, and performance level are roughly on par with those of the Asus laptop, but the MSI model offers slightly better battery life. The weaknesses: There's no Thunderbolt port, and the maintenance options aren't compelling.
Price and availability
At the time of writing, the predominant configuration of the Asus TUF Dash F15 in the United States that is equipped with the Core i7-12650H and the GeForce RTX 3070, is supported by 16 GB of DDR5 RAM, 512 GB of SSD storage, and a 15.6" Full HD 144 Hz display. You can find this model on Best Buy's online store for $1,499. At the time of publishing our review, Best Buy has it at $1,299 ($200 off deal).
You can also look for other possible configurations on Amazon.
Asus TUF Dash F15 FX517ZR
-
07/26/2022 v7
Sascha Mölck
More articles related to this device
Asus TUF Dash F15 FX517ZR (TUF Dash F15 Series)Related Articles

Pricecompare

