Notebookcheck Logo

Intel HD Graphics (Skylake) vs Intel HD Graphics (Ivy Bridge)

Intel HD Graphics (Skylake)

► remove from comparison Intel HD Graphics (Skylake)

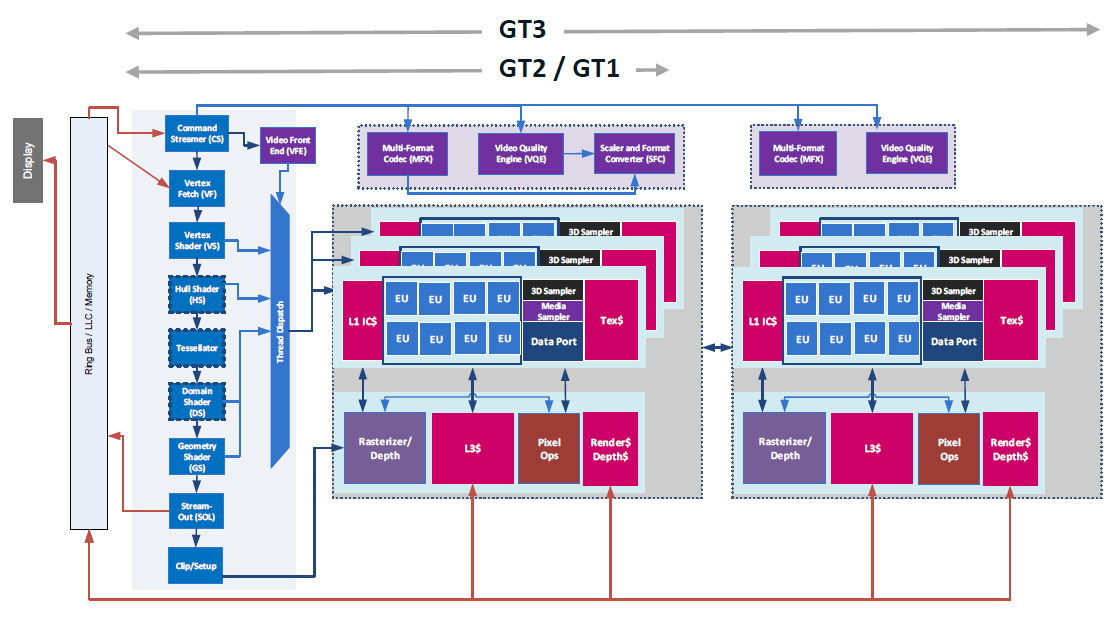
The Intel HD Graphics (Skylake) (GT1) is an integrated graphics unit, which can be found in low-end ULV (Ultra Low Voltage) processors of the Skylake generation. In most CPUs, this GPU was named Intel HD Graphics 510 or Intel HD Graphics 515 (see both pages for benchmarks and information).

This "GT1" version of the Skylake GPU offers 12 Execution Units (EUs) clocked at up to 800 MHz (depending on the CPU model). Due to its lack of dedicated graphics memory or eDRAM cache, the HD Graphics has to access the main memory (2x 64bit DDR3L-1600 / DDR4-2133).

Performance

Depending on various factors like memory configuration, the HD Graphics should perform similar to the older HD Graphics 4200 and will handle only some older and less demanding games in lowest settings.

Features

The revised video engine now decodes H.265/HEVC completely in hardware and thereby much more efficiently than before. Displays can be connected via DP 1.2 / eDP 1.3 (max. 3840 x 2160 @ 60 Hz), whereas HDMI is limited to the older version 1.4a (max. 3840 x 2160 @ 30 Hz). However, HDMI 2.0 can be added using a DisplayPort converter. Up to three displays can be controlled simultaneously.

Power Consumption

The HD Graphics (Skylake) can be found in mobile processors specified at 6 W TDP and is therefore suited for passively cooled 2-in-1 laptops and tablets.

Intel HD Graphics (Ivy Bridge)

► remove from comparison Intel HD Graphics (Ivy Bridge)

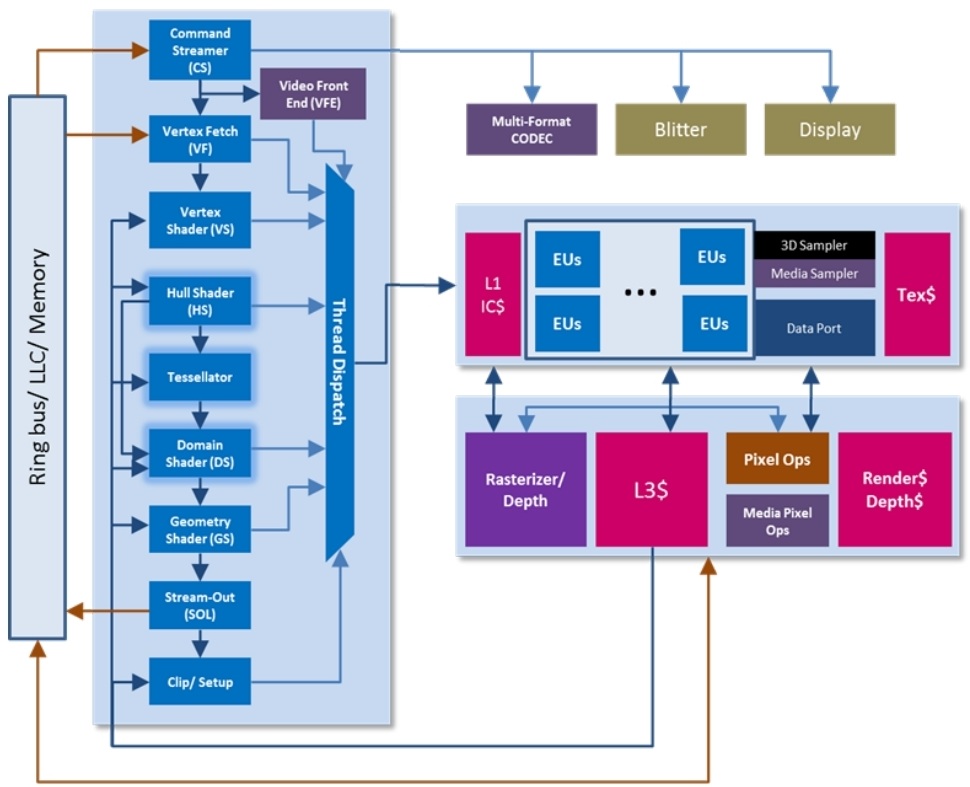
The Intel HD Graphics (Ivy Bridge) is an integrated graphics card in the mobile Ivy Bridge codenamed processors (Celeron and Pentium). It is the successor the the Intel HD Graphics 2000 in the Sandy Bridge CPUs and performs between the old HD 2000 and 3000 GPU

Compared to the faster HD Graphics 4000, the HD Graphics features less Execution Units (6 versus 16) and only one texture sampler. Therefore, the performance is clearly worse and only suited for low demanding gaming. Intel states a 10 to 15% higher performance compared to the old Sandy Bridge based HD Graphics 2000 (see our benchmarks below), which is similar to AMDs low-end GPUs like the integrated Radeon HD 8210. Therefore, only casual games with low requirements are playable.

A speciality of the Ivy Bridge GPUs is that 4x MSAA is supported in hardware now. However, 2x is only supported through software.  The algorithm to support 2x is going through the 4x pipeline with a software algorithm, so performance is similar to 4x MSAA.

The integrated video decoder called Multi Format Codec Engine (MFX) was also improved and should allow even simultaneus 4K video decoding. DXVAChecker lists MPEG2, VC1, WMV9, and H264 as supported codecs. QuickSync for fast transcoding of videos was also optimized for higher performance and better image quality.

Another new feature is the support for up to 3 independent displays (maybe only with a DisplayPort) as AMD offers with theirs Eyefinity support (up to 6 displays).

Due to the 22nm 3D Tri-Gate production process, the power consumption should be relatively low (the development was focused on performance per Watt).

Intel HD Graphics (Skylake)Intel HD Graphics (Ivy Bridge)
HD Graphics Series
HD Graphics P530 compare 24 @ 0.35 - 1.05 GHz64/128 Bit
HD Graphics 5600 compare 24 @ 0.3 - 1.05 GHz64/128 Bit
HD Graphics 6000 compare 48 @ 0.3 - 1 GHz64/128 Bit
HD Graphics 4600 compare 20 @ 0.2 - 1.35 GHz64/128 Bit
HD Graphics 5500 compare 24 @ 0.3 - 0.95 GHz64/128 Bit
HD Graphics 5000 compare 40 @ 0.2 - 1.1 GHz64/128 Bit
HD Graphics 4400 compare 20 @ 0.2 - 1.1 GHz64/128 Bit
HD Graphics 5300 compare 24 @ 0.1 - 0.9 GHz64/128 Bit
HD Graphics 4000 compare 16 @ 0.35 - 1.35 GHz64/128 Bit
HD Graphics (Broadwell) compare 12 @ 0.1 - 0.85 GHz64/128 Bit
HD Graphics 4200 compare 20 @ 0.2 - 0.85 GHz64/128 Bit
HD Graphics (Skylake) 12 @ 0.3 - 0.8 GHz64/128 Bit
HD Graphics 405 (Braswell) compare 16 @ 0.32 - 0.7 GHz64/128 Bit
HD Graphics (Braswell) compare 16 @ 0.32 - 0.7 GHz64/128 Bit
HD Graphics 400 (Braswell) compare 12 @ 0.32 - 0.64 GHz64/128 Bit
HD Graphics (Haswell) compare 10 @ 0.2 - 1 GHz64/128 Bit
HD Graphics (Cherry Trail) compare 16 @ 0.2 - 0.6 GHz64/128 Bit
HD Graphics 3000 compare 12 @ 0.35 - 1.35 GHz64/128 Bit
HD Graphics 2500 compare 6 @ 0.65 - 1.15 GHz64/128 Bit
HD Graphics (Ivy Bridge) 6 @ 0.35 - 1.1 GHz64/128 Bit
HD Graphics 2000 compare 6 @ 0.85 - 1.35 GHz64/128 Bit
HD Graphics (Sandy Bridge) compare 6 @ 0.35 - 1.1 GHz64/128 Bit
HD Graphics (Bay Trail) compare 4 @ 0.31 - 0.9 GHz32/64/128 Bit
CodenameSkylake GT1Ivy Bridge GT1
ArchitectureGen. 9 SkylakeGen. 7 Ivy Bridge
Pipelines12 - unified6 - unified
Core Speed300 - 800 (Boost) MHz350 - 1100 (Boost) MHz
Memory Bus Width64/128 Bit64/128 Bit
Memory TypeDDR3L/LPDDR3
Shared Memoryyesyes
APIDirectX 12_1, OpenGL 4.4DirectX 11.0, Shader 5.0
technology14 nm22 nm
FeaturesQuickSync
Date of Announcement01.09.2015 01.10.2012
CPU in HD Graphics (Ivy Bridge)GPU Base SpeedGPU Boost / Turbo
Intel Pentium 2030M2 x 2500 MHz, 35 W650 MHz1100 MHz
Intel Pentium 2020M2 x 2400 MHz, 35 W650 MHz1100 MHz
Intel Celeron 1020E2 x 2200 MHz, 35 W650 MHz1000 MHz
min. - max.350 - 650 MHz800 - 1100 MHz

Benchmarks

Performance Rating - 3DMark 11 + Fire Strike + Time Spy - HD Graphics (Ivy Bridge)
0.1 pt (0%)
3DMark - 3DMark Cloud Gate Score
min: 1478     avg: 1898     median: 1906.5 (2%)     max: 2207 Points
3DMark - 3DMark Cloud Gate Graphics
min: 2116     avg: 2283     median: 2286 (1%)     max: 2470 Points
3DMark - 3DMark Fire Strike Standard Score
min: 208     avg: 253.6     median: 254.5 (0%)     max: 275 Points
3DMark - 3DMark Fire Strike Standard Graphics
min: 248     avg: 286.2     median: 285.5 (0%)     max: 305 Points
3DMark - 3DMark Ice Storm Graphics
min: 22834     avg: 24734     median: 24209.5 (3%)     max: 29149 Points
3DMark 11 - 3DM11 Performance Score
min: 258     avg: 363.3     median: 370.5 (1%)     max: 413 Points
3DMark 11 - 3DM11 Performance GPU
min: 218     avg: 310.6     median: 315 (0%)     max: 352 Points
3DMark Vantage
3DM Vant. Perf. total + Intel HD Graphics (Ivy Bridge)
3DMark Vantage - 3DM Vant. Perf. total
min: 930     avg: 1465     median: 1491 (0%)     max: 1691 Points
3DM Vant. Perf. GPU no PhysX + Intel HD Graphics (Ivy Bridge)
3DMark Vantage - 3DM Vant. Perf. GPU no PhysX
min: 728     avg: 1186     median: 1213 (1%)     max: 1360 Points
3DMark 2001SE - 3DMark 2001 - Standard
min: 8075     avg: 9212     median: 9212 (10%)     max: 10349 Points
3DMark 03 - 3DMark 03 - Standard
min: 5909     avg: 7584     median: 7434 (4%)     max: 10124 Points
3DMark 05 - 3DMark 05 - Standard
min: 3839     avg: 5085     median: 5186 (6%)     max: 6252 Points
3DMark 06 3DMark 06 - Standard 1280x1024 + Intel HD Graphics (Ivy Bridge)
3DMark 06
min: 2186     avg: 2949     median: 2930 (4%)     max: 3573 Points
SPECviewperf 11
specvp11 snx-01 + Intel HD Graphics (Ivy Bridge)
SPECviewperf 11 - specvp11 snx-01
min: 0.75     avg: 0.8     median: 0.8 (0%)     max: 0.87 fps
specvp11 tcvis-02 + Intel HD Graphics (Ivy Bridge)
SPECviewperf 11 - specvp11 tcvis-02
min: 1.31     avg: 1.5     median: 1.5 (1%)     max: 1.66 fps
specvp11 sw-02 + Intel HD Graphics (Ivy Bridge)
SPECviewperf 11 - specvp11 sw-02
min: 4.68     avg: 5.3     median: 5.3 (4%)     max: 5.88 fps
specvp11 proe-05 + Intel HD Graphics (Ivy Bridge)
SPECviewperf 11 - specvp11 proe-05
min: 0.91     avg: 1.1     median: 1.1 (1%)     max: 1.19 fps
specvp11 maya-03 + Intel HD Graphics (Ivy Bridge)
SPECviewperf 11 - specvp11 maya-03
min: 8.71     avg: 8.8     median: 8.8 (7%)     max: 8.93 fps
specvp11 lightwave-01 + Intel HD Graphics (Ivy Bridge)
SPECviewperf 11 - specvp11 lightwave-01
min: 7.83     avg: 8.9     median: 8.9 (10%)     max: 10.03 fps
specvp11 ensight-04 + Intel HD Graphics (Ivy Bridge)
SPECviewperf 11 - specvp11 ensight-04
min: 1.27     avg: 1.4     median: 1.4 (1%)     max: 1.51 fps
specvp11 catia-03 + Intel HD Graphics (Ivy Bridge)
SPECviewperf 11 - specvp11 catia-03
0 fps (0%)
Windows 7 Experience Index - Win7 Gaming graphics
6.2 Points (78%)
Windows 7 Experience Index - Win7 Graphics
min: 4.6     avg: 4.7     median: 4.7 (59%)     max: 4.7 Points
Cinebench R10 Cinebench R10 Shading (32bit) + Intel HD Graphics (Ivy Bridge)
Cinebench R10 - Cinebench R10 Shading (32bit)
min: 2410     avg: 3337     median: 3382 (2%)     max: 4037 Points
Cinebench R11.5 Cinebench R11.5 OpenGL 64 Bit + Intel HD Graphics (Ivy Bridge)
Cinebench R11.5 - Cinebench R11.5 OpenGL 64 Bit
min: 6.62     avg: 9.1     median: 9.2 (3%)     max: 11.32 fps
GFXBench (DX / GLBenchmark) 2.7
GFXBench T-Rex HD Offscreen C24Z16 + Intel HD Graphics (Ivy Bridge)
GFXBench (DX / GLBenchmark) 2.7 - GFXBench T-Rex HD Offscreen C24Z16
27 fps (0%)
LuxMark v2.0 64Bit - LuxMark v2.0 Room GPU
min: 27     avg: 38.3     median: 44 (0%)     max: 44 Samples/s
LuxMark v2.0 64Bit - LuxMark v2.0 Sala GPU
44 Samples/s (0%)
ComputeMark v2.1 - ComputeMark v2.1 Result
min: 190     avg: 266.4     median: 275 (0%)     max: 290 Points

Average Benchmarks Intel HD Graphics (Ivy Bridge) → 0% n=

- Range of benchmark values for this graphics card
- Average benchmark values for this graphics card
* Smaller numbers mean a higher performance
1 This benchmark is not used for the average calculation

Game Benchmarks

The following benchmarks stem from our benchmarks of review laptops. The performance depends on the used graphics memory, clock rate, processor, system settings, drivers, and operating systems. So the results don't have to be representative for all laptops with this GPU. For detailed information on the benchmark results, click on the fps number.

low 1024x768
HD Graphics (Ivy Bridge):
34.5  fps
med. 1366x768
HD Graphics (Ivy Bridge):
14.3  fps
high 1366x768
HD Graphics (Ivy Bridge):
8.6  fps
Thief

Thief

2014
low 1024x768
HD Graphics (Ivy Bridge):
5.9  fps
med. 1366x768
HD Graphics (Ivy Bridge):
3.6  fps
low 1024x768
HD Graphics (Ivy Bridge):
15  fps
med. 1366x768
HD Graphics (Ivy Bridge):
7.6  fps
F1 2013

F1 2013

2013
low 1024x768
HD Graphics (Ivy Bridge):
20  fps
med. 1366x768
HD Graphics (Ivy Bridge):
14  fps
Fifa 14

Fifa 14

2013
med. 1366x768
HD Graphics (Ivy Bridge):
54.4  fps
high 1366x768
HD Graphics (Ivy Bridge):
32  fps
Dota 2

Dota 2

2013
low 1024x768
HD Graphics (Ivy Bridge):
18.4 30.5 ~ 24 fps
med. 1366x768
HD Graphics (Ivy Bridge):
8.2 24.5 ~ 16 fps
GRID 2

GRID 2

2013
low 1024x768
HD Graphics (Ivy Bridge):
27.5  fps
med. 1366x768
HD Graphics (Ivy Bridge):
12.8  fps
high 1366x768
HD Graphics (Ivy Bridge):
12.5  fps
low 1024x768
HD Graphics (Ivy Bridge):
10.5  fps
med. 1366x768
HD Graphics (Ivy Bridge):
8.1  fps
high 1366x768
HD Graphics (Ivy Bridge):
4.4  fps
low 1280x720
HD Graphics (Ivy Bridge):
16 16.4 19.1 ~ 17 fps
med. 1366x768
HD Graphics (Ivy Bridge):
8.6 8.9 9 ~ 9 fps
high 1366x768
HD Graphics (Ivy Bridge):
7.7  fps
low 1024x768
HD Graphics (Ivy Bridge):
80.8 112 ~ 96 fps
med. 1366x768
HD Graphics (Ivy Bridge):
19.3 24 ~ 22 fps
high 1366x768
HD Graphics (Ivy Bridge):
10.8 15 ~ 13 fps
ultra 1920x1080
HD Graphics (Ivy Bridge):
4  fps
low 1024x768
HD Graphics (Ivy Bridge):
8.8 16.1 18.6 20.1 21.5 21.5 22.5 22.7 23.1 23.6 24 ~ 20 fps
med. 1366x768
HD Graphics (Ivy Bridge):
7.7 9.4 10.5 10.8 11 11 11.1 11.4 11.7 ~ 11 fps
high 1366x768
HD Graphics (Ivy Bridge):
5.1 7.4 7.6 8 ~ 7 fps
low 1024x768
HD Graphics (Ivy Bridge):
42  fps
med. 1366x768
HD Graphics (Ivy Bridge):
17  fps
high 1366x768
HD Graphics (Ivy Bridge):
12  fps
ultra 1920x1080
HD Graphics (Ivy Bridge):
6  fps
low 1024x768
HD Graphics (Ivy Bridge):
13  fps
med. 1366x768
HD Graphics (Ivy Bridge):
11  fps
high 1366x768
HD Graphics (Ivy Bridge):
4  fps
low 1024x768
HD Graphics (Ivy Bridge):
18 19 ~ 19 fps
med. 1366x768
HD Graphics (Ivy Bridge):
14 15.2 ~ 15 fps
Fifa 13

Fifa 13

2012
low 1024x768
HD Graphics (Ivy Bridge):
18.3 52 69.7 90 ~ 58 fps
med. 1366x768
HD Graphics (Ivy Bridge):
13.2 32.8 42.7 54 ~ 36 fps
high 1366x768
HD Graphics (Ivy Bridge):
8.6 20.9 23 29 ~ 20 fps
ultra 1920x1080
HD Graphics (Ivy Bridge):
13  fps
F1 2012

F1 2012

2012
low 1024x768
HD Graphics (Ivy Bridge):
20 25 ~ 23 fps
med. 1366x768
HD Graphics (Ivy Bridge):
18 20 ~ 19 fps
high 1366x768
HD Graphics (Ivy Bridge):
16 16 ~ 16 fps
ultra 1920x1080
HD Graphics (Ivy Bridge):
12  fps
low 1024x768
HD Graphics (Ivy Bridge):
30  fps
high 1366x768
HD Graphics (Ivy Bridge):
8  fps
ultra 1920x1080
HD Graphics (Ivy Bridge):
5  fps
med. 1366x768
HD Graphics (Ivy Bridge):
37  fps
high 1366x768
HD Graphics (Ivy Bridge):
20  fps
ultra 1920x1080
HD Graphics (Ivy Bridge):
11  fps
low 1024x768
HD Graphics (Ivy Bridge):
33.3 38 ~ 36 fps
med. 1366x768
HD Graphics (Ivy Bridge):
13.2 13.5 ~ 13 fps
low 1024x768
HD Graphics (Ivy Bridge):
29.2  fps
med. 1366x768
HD Graphics (Ivy Bridge):
17.5  fps
high 1366x768
HD Graphics (Ivy Bridge):
14.6  fps
Anno 2070

Anno 2070

2011
low 1024x768
HD Graphics (Ivy Bridge):
11.1 23.1 26 26.5 27.6 27.8 28.4 28.5 37.1 ~ 26 fps
med. 1366x768
HD Graphics (Ivy Bridge):
5.5 11.2 11.4 11.5 11.7 11.9 13 15.4 16.8 ~ 12 fps
high 1366x768
HD Graphics (Ivy Bridge):
7.1 7.1 7.5 9.2 ~ 8 fps
low 1280x720
HD Graphics (Ivy Bridge):
12.7 16.9 17.4 18.3 ~ 16 fps
med. 1366x768
HD Graphics (Ivy Bridge):
7.3 9.4 9.6 ~ 9 fps
high 1366x768
HD Graphics (Ivy Bridge):
4.6  fps
Fifa 12

Fifa 12

2011
med. 1024x768
HD Graphics (Ivy Bridge):
55.8  fps
high 1360x768
HD Graphics (Ivy Bridge):
21.2  fps
low 1024x768
HD Graphics (Ivy Bridge):
25.4  fps
high 1366x768
HD Graphics (Ivy Bridge):
11.4  fps
Dirt 3

Dirt 3

2011
low 800x600
HD Graphics (Ivy Bridge):
41.4  fps
med. 1024x768
HD Graphics (Ivy Bridge):
16.5  fps
Trackmania Nations Forever

Trackmania Nations Forever

2008
low 640x480
HD Graphics (Ivy Bridge):
90  fps
high 1024x768
HD Graphics (Ivy Bridge):
20.7  fps
World of Warcraft

World of Warcraft

2005
low 800x600
HD Graphics (Ivy Bridge):
78.3  fps
med. 1024x768
HD Graphics (Ivy Bridge):
28.3  fps
Intel HD Graphics (Ivy Bridge)lowmed.highultraQHD4K
The Elder Scrolls Online34.514.38.6
Thief5.93.6
X-Plane 10.25157.6
F1 20132014
Fifa 1454.432
Dota 22416
GRID 227.5412.8412.5
Metro: Last Light10.528.094.35
BioShock Infinite1797.72
StarCraft II: Heart of the Swarm9622134
Tomb Raider20117
Dead Space 34217126
Hitman: Absolution13114
Dishonored1915
Fifa 1358362013
F1 201223191612
Guild Wars 23085
Counter-Strike: GO372011
Dirt Showdown3613
Diablo III29.217.514.6
Anno 207026128
The Elder Scrolls V: Skyrim1694.55
Fifa 1255.821.2
Deus Ex Human Revolution25.411.4
Dirt 341.416.5
Trackmania Nations Forever9020.7
World of Warcraft78.328.3
< 30 fps
< 60 fps
< 120 fps
≥ 120 fps
15
6
3
20
4

18
1

6


For more games that might be playable and a list of all games and graphics cards visit our Gaming List

Add one or more devices and compare

In the following list you can select (and also search for) devices that should be added to the comparison. You can select more than one device.

restrict list:

show all (including archived), 2024, 2023
v1.26
log 28. 13:52:57

#0 checking url part for id 6474 +0s ... 0s

#1 checking url part for id 3563 +0s ... 0s

#2 not redirecting to Ajax server +0s ... 0s

#3 did not recreate cache, as it is less than 5 days old! Created at Thu, 28 Mar 2024 05:37:00 +0100 +0.001s ... 0.001s

#4 composed specs +0.087s ... 0.088s

#5 did output specs +0s ... 0.088s

#6 start showIntegratedCPUs +0s ... 0.088s

#7 getting avg benchmarks for device 6474 +0.031s ... 0.12s

#8 got single benchmarks 6474 +0s ... 0.12s

#9 getting avg benchmarks for device 3563 +0.016s ... 0.135s

#10 got single benchmarks 3563 +0.041s ... 0.177s

#11 got avg benchmarks for devices +0s ... 0.177s

#12 No cached benchmark found, getting uncached values +0.106s ... 0.283s

#13 min, max, avg, median took s +0.018s ... 0.301s

#14 before gaming benchmark output +0s ... 0.301s

#15 Got 143 rows for game benchmarks. +0.018s ... 0.319s

#16 composed SQL query for gamebenchmarks +0s ... 0.319s

#17 got data and put it in $dataArray +0.018s ... 0.337s

#18 benchmarks composed for output. +0.062s ... 0.399s

#19 calculated avg scores. +0s ... 0.399s

#20 return log +0.041s ... 0.439s

Please share our article, every link counts!
> Expert Reviews and News on Laptops, Smartphones and Tech Innovations > Benchmarks / Tech > Graphics Card Comparison - Head 2 Head
Redaktion, 2017-09- 8 (Update: 2023-07- 1)