GeForce RTX 5090 drops below RTX 4090 in high-end graphics card benchmark chart
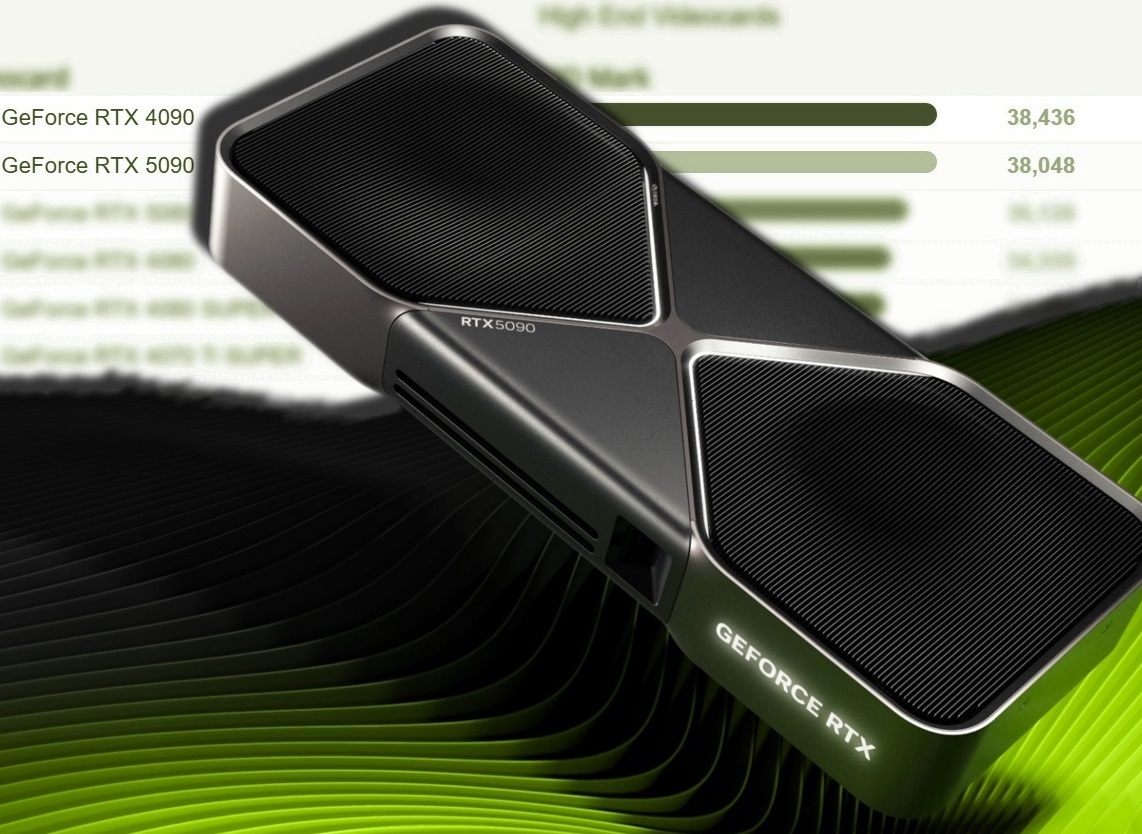
As gamers wait to see how the upcoming Nvidia GeForce RTX 5070 performs, it seems the top-end RTX 5090 is still suffering from some niggles. After peaking at the top of PassMark’s G3D Mark benchmark chart earlier this month, the RTX 5090 has now slipped into second place behind the RTX 4090. Originally, the newer Blackwell card enjoyed a small advantage of +2.85% over the Ada Lovelace board, but now, after more samples of both units have been tested, that slim advantage has been erased.
Since our last report, hundreds more RTX 4090 graphics cards have been tested on the site, and its average score has risen from 38,422 to 38,436 (based on 14,422 samples). In the meantime, the sample size for the GeForce RTX 5090 has grown from 13 samples to 50 at the time of writing, with the average result dropping from 39,516 to 38,048 – a loss of -3.71%. Such a swing shows that there is still opportunity for the RTX 5090 to reclaim its top spot in this particular benchmark in the future when more samples have stopped by. The test suite used covers DirectX 9 to 12 along with a GPU compute run.
There are numerous potential reasons for this somewhat unexpected situation: Driver issues have already been in the news, with some RTX 5090 cards reportedly failing to work after software updates. The sample size for the Blackwell card is obviously still small, especially in comparison with the RTX 4090. In addition, it was recently revealed that some GeForce RTX 5090 boards were missing Raster Output Pipelines (ROPs), hardware components that are essential for rendering images. Low unit availability will also affect the number of graphics cards that can actually be benchmarked.
It's also worth pointing out that the RTX 5090 does overwhelm the RTX 4090 in the DirectX 12 run, gaining a healthy +39.3% advantage in terms of average frames per second (209 vs. 150), and it certainly impressed in our thorough review. But as we reported before, the GeForce RTX 5090 is way behind in the GPU compute benchmark here (-17.5%), despite having +32.8% more CUDA cores than the RTX 4090, with the cores being required for carrying out parallel processing tasks. It’s still a bit early to accuse Nvidia of sleeping at the wheel here, but these kinds of results may make gamers think twice about purchasing such an expensive piece of computer equipment.


