RTX 5090 and RTX 5080 generational benchmark performance gains comparatively eclipsed by GeForce 40 series in PassMark
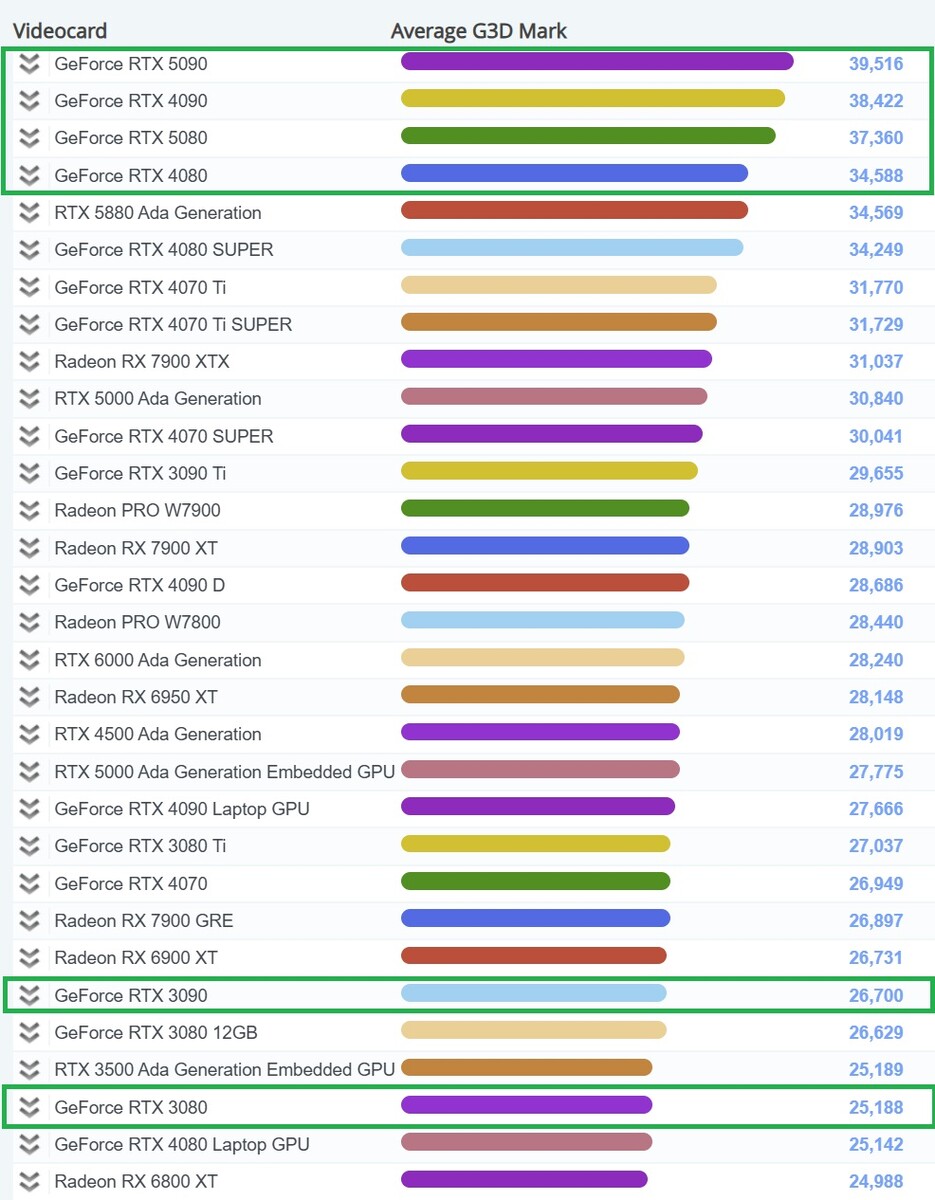
It must be pointed out from the start that these results are taken from a single benchmark and do not necessarily represent the overall performance of the GeForce RTX 5090 and RTX 5080. As is to be expected, the Nvidia GeForce RTX 5090 has now occupied the top spot in PassMark’s video card benchmark chart (G3D Mark).
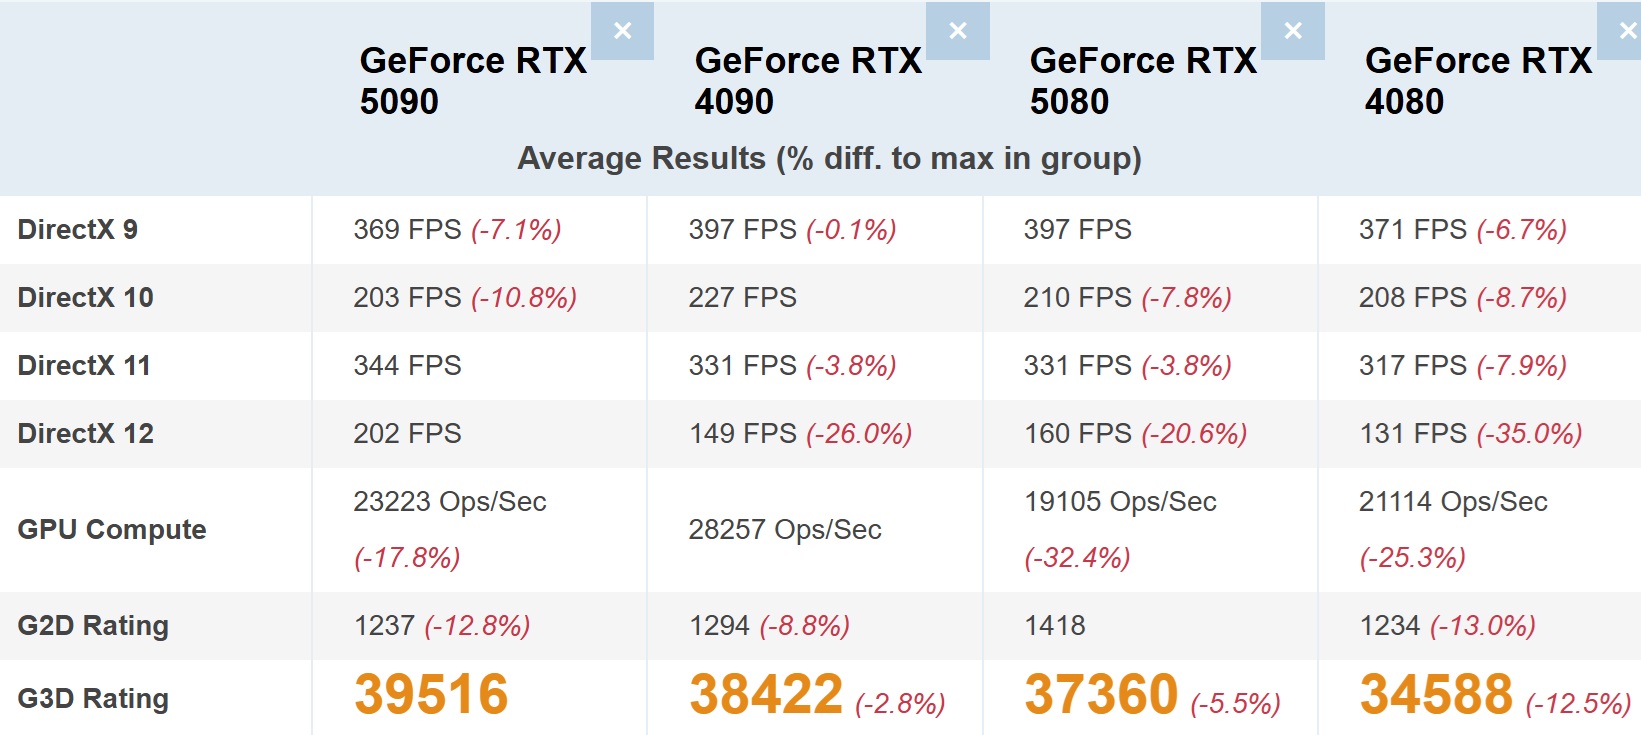
The hardware is thoroughly tested, with measurements being taken for FPS performances in DirectX 9, DirectX 10, DirectX 11, and DirectX 12, while there is also a GPU Compute benchmark included in the test suite. The RTX 5090 ended up with a G3D rating of 39,516, leaving it at the top of the table followed by the RTX 4090, RTX 5080, and RTX 4080. On the surface, that all looks well and good.
But closer scrutiny shows that the performance gains from one generation to another are far from balanced in terms of the G3D Rating:
RTX 4090 (38,422) – RTX 5090 (39,516): +2.85%
RTX 3090 (26,700) – RTX 4090 (38,422): +43.9%
RTX 4080 (34,588) – RTX 5080 (37,360): +8.01%
RTX 3080 (25,188) – RTX 4080 (34,588): +37.3%
It can be argued that this data is taken out of context, that it is just a single benchmark, and that the Blackwell cards are stuffed with new and improved technology anyway, such as fourth-generation RT cores, fifth-generation Tensor cores, DLSS 4.0 Multi Frame Generation, and GDDR7 memory. But the latter argument can be applied to the difference between the Ada Lovelace cards (GeForce 40 series) and the Ampere boards (GeForce 30 series). For instance, the former also came with the next generations of RT cores and Tensor cores.
Importantly, the RTX 4080 and RTX 4090 had chips based on TSMC’s 4N process (part of the 5 nm node family) whereas the RTX 3080 and RTX 3090 processors were manufactured on an 8 nm production process from Samsung (developed from 10 nm technology). The brand-new RTX 5090 and RTX 5080 are powered by GPUs that use an optimized 4N process variant, known as 4NP, that was custom-built for Nvidia by TSMC. Refinement rather than raw performance seems to be the order of the day here.