GeForce RTX 5090 fails to topple RTX 4090 in GPU compute benchmark while RTX 5080 struggles against RTX 4070 Ti
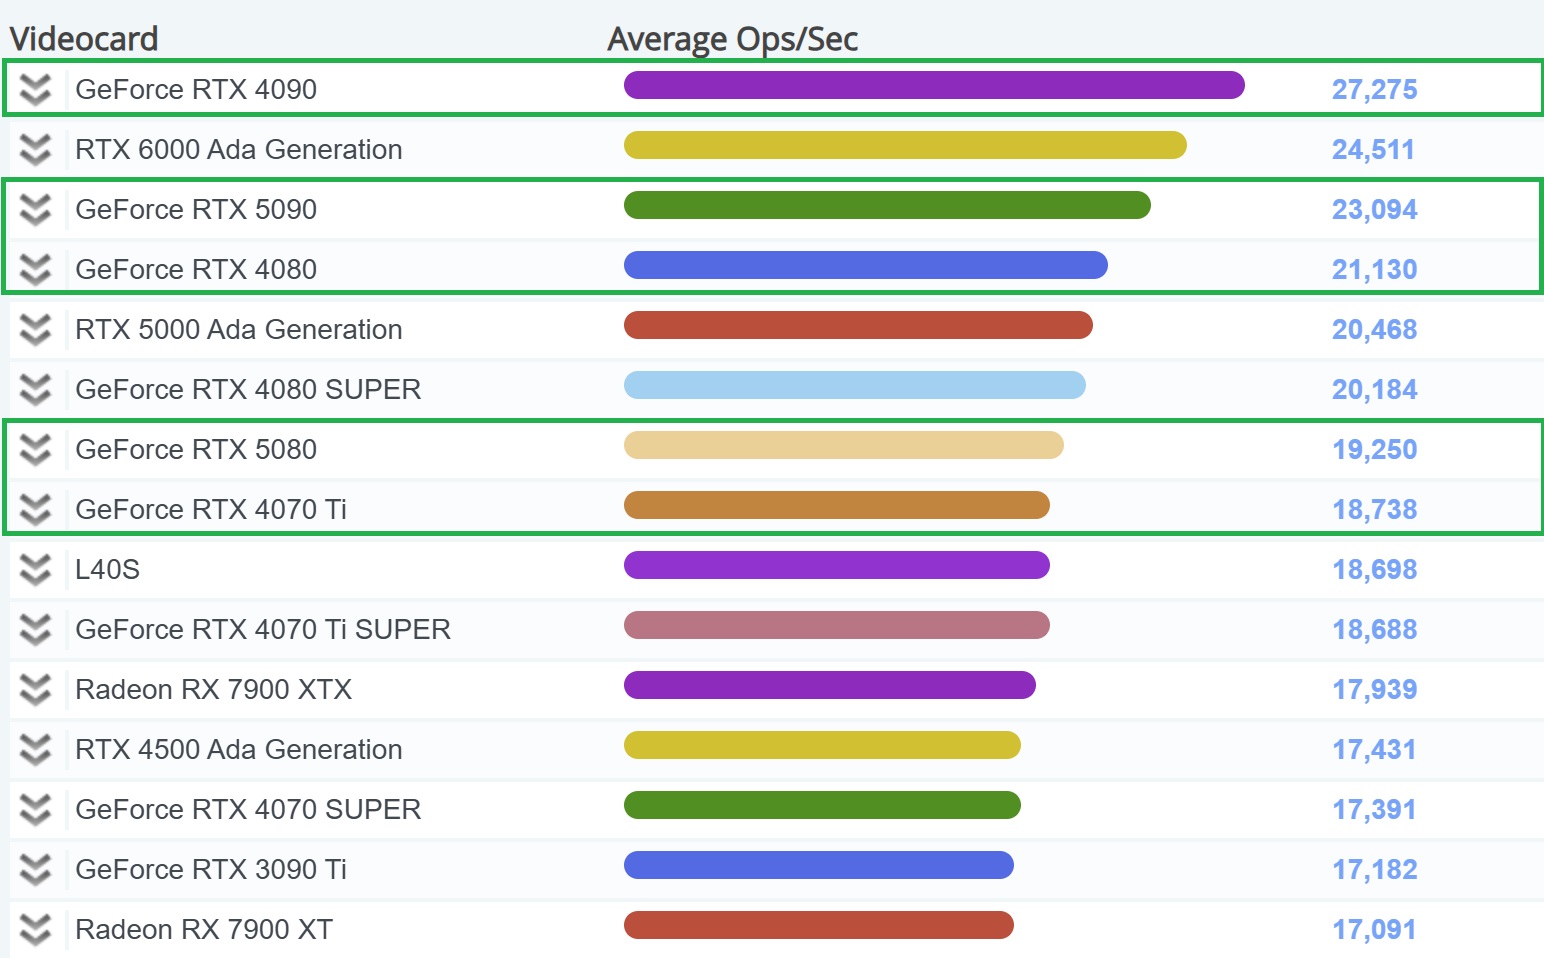
The new Nvidia GeForce RTX 5090 has not managed to top the table in PassMark’s GPU compute benchmark. GPU compute is an essential process in modern computing, allowing enhanced cooperation with the CPU and even affecting gaming. The roost, in this case, is still ruled by the GeForce RTX 4090, which leads with a score of 27,275 operations per second (OPS). The sample size is vastly different, with 13 GeForce RTX 5090 cards being tested so far in comparison to 13,965 samples of the predecessor, but it seems likely that the Blackwell card’s average score will only swing slightly. The RTX 4090’s score represents a +18.1% advantage over the RTX 5090, which can only scrape together a +9.3% lead over the RTX 4080.
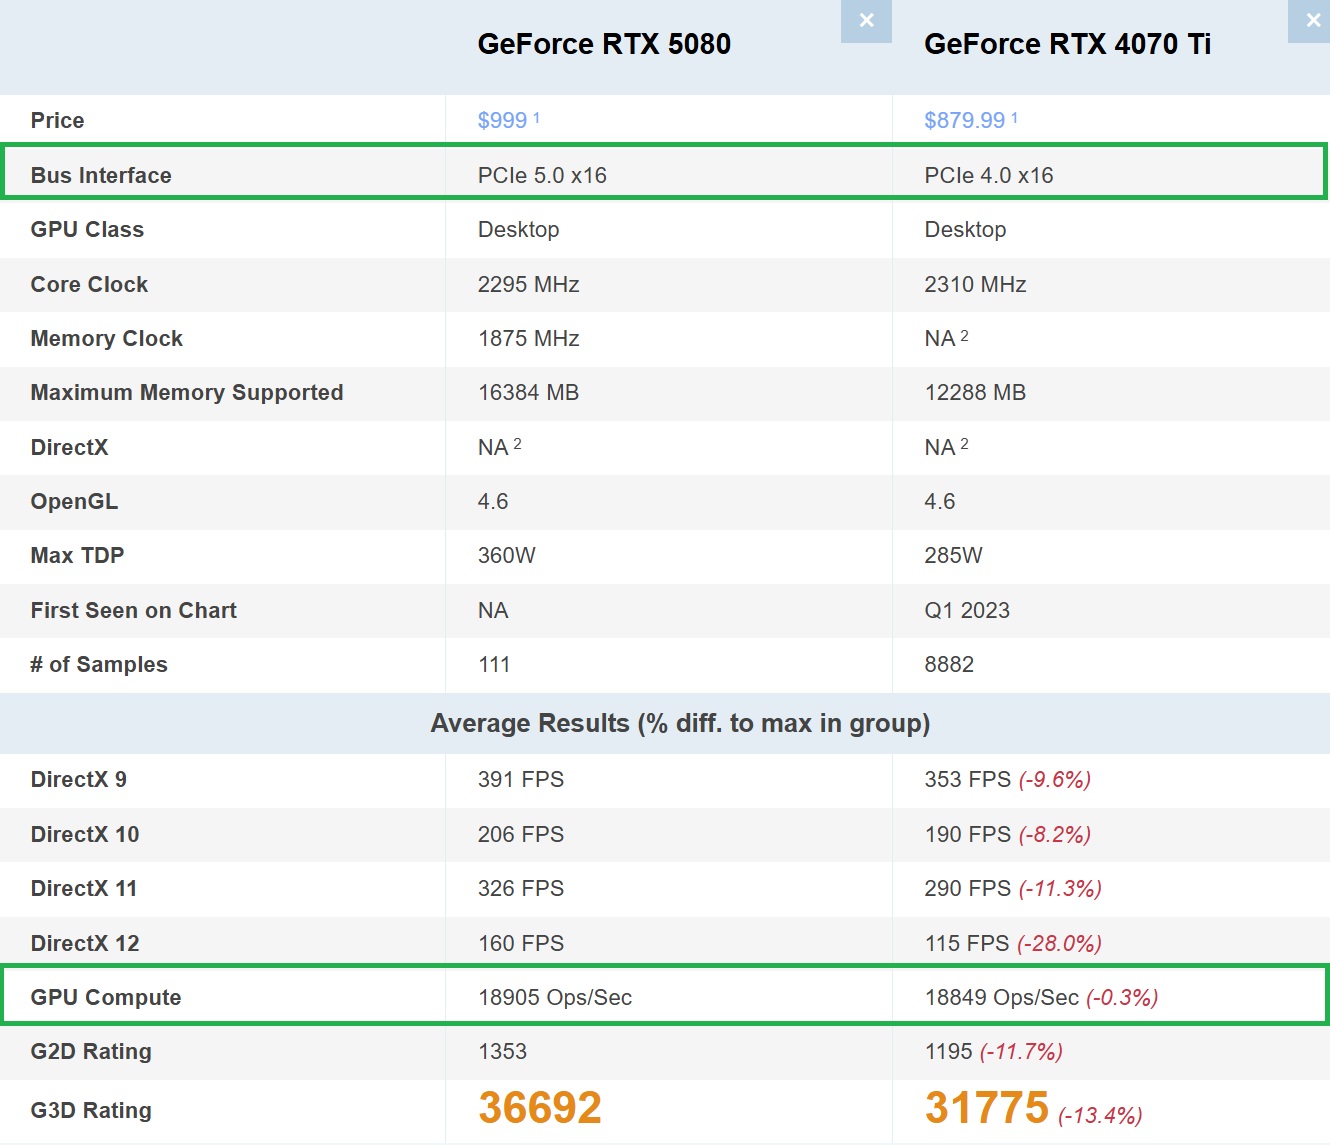
It's a similar case scenario for the GeForce RTX 5080, which has an average result of 19,250 OPS based on 111 samples. The older RTX 4080 squeezes past that average with a +9.8% lead, leaving the new Blackwell card to basically slug it out with the RTX 4070 Ti, which is only -2.7% difference behind the RTX 5080. The results are especially surprising as the GeForce 50 series GPUs have PCIe 5.0 x16 interfaces for speedy data exchange with a system’s CPU whereas the GeForce 40 series processors are listed as using PCIe 4.0 x16; PCIe 5.0 supports a bandwidth of 32 GT/s compared to 16 GT/s for PCIe 4.0 (GT/s = gigatransfers per second).
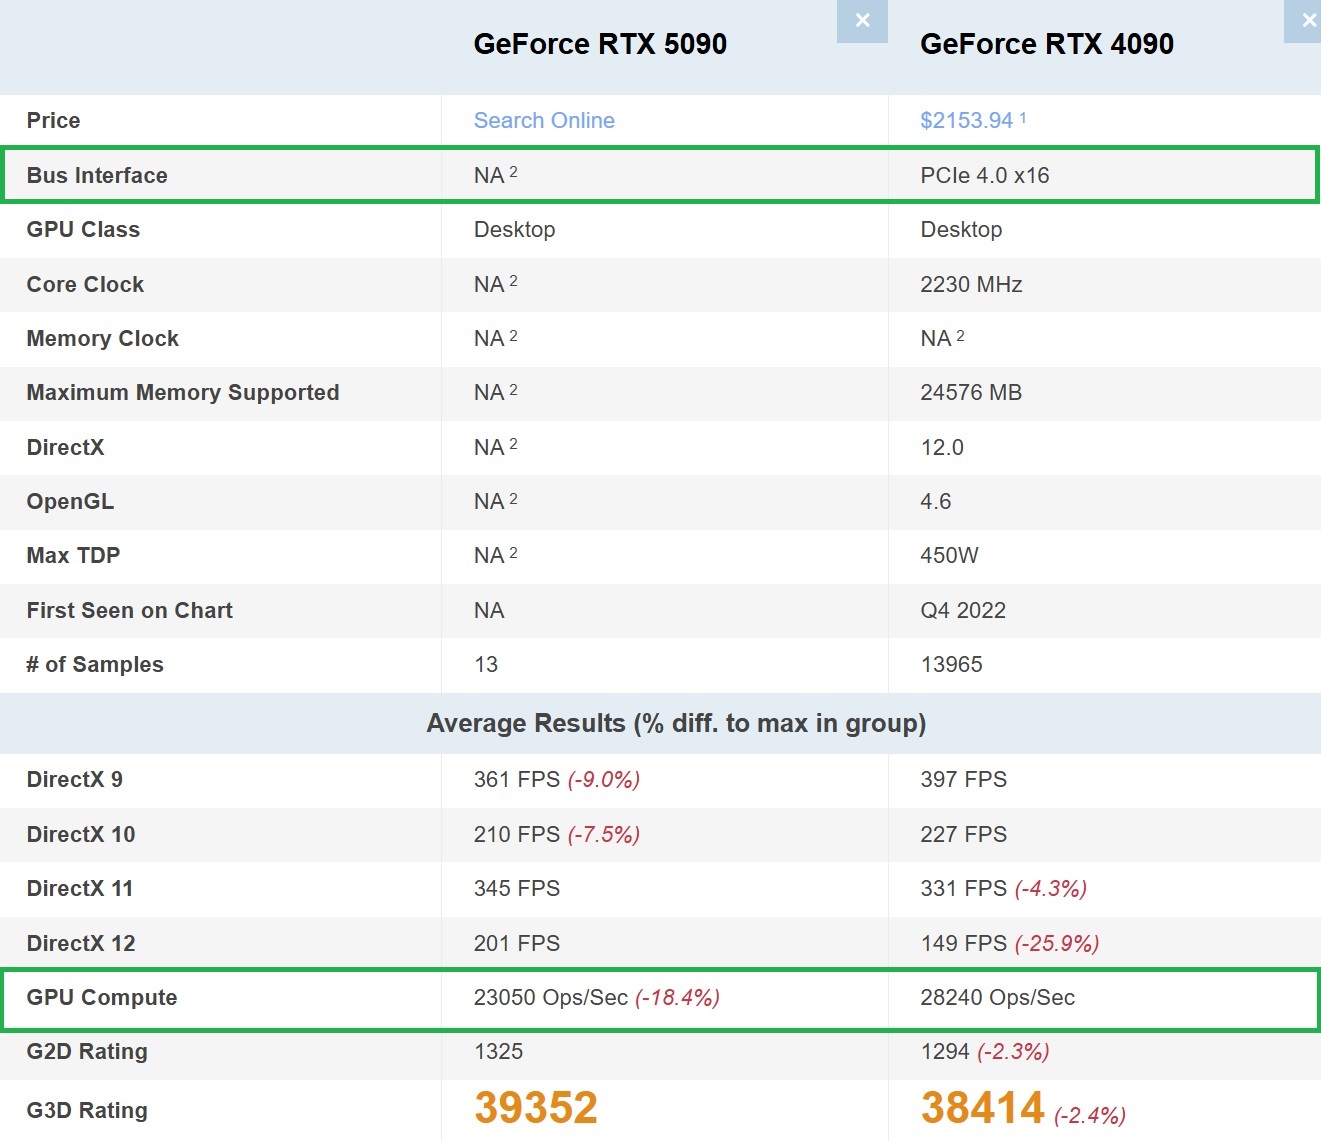
The scores in the RTX 5090 vs RTX 4090 / RTX 5080 vs RTX 4080 / RTX 5080 vs RTX 4070 Ti comparison images below show even lower averages for the Blackwell cards and higher ones for some of the Ada Lovelace SKUs, with PassMark possibly not having updated the chart at this point. Using these even more extreme scores obviously creates a worse-looking scenario for the GeForce 50 series cards, with the RTX 4090 moving to a noteworthy +22.5% lead over the RTX 5090 and the RTX 4080 rising from +9.8% to +11.6% over the RTX 5080. Crucially, these particular scores leave the RTX 5080 vs RTX 4070 Ti face-off with a tiny 57 OPS difference, or just a +0.3% lead for the newer card.